FEDERAL HOME LOAN BANK OF NEW YORK
20182019 Annual Report on Form 10-K
Table of Contents
2
| Item 1. | Business. |
General
The Federal Home Loan Bank of New York (“we,” “us,” “our,” “the Bank” or the “FHLBNY”) is a federally chartered corporation exempt from federal, state and local taxes except local real property taxes. It is one of eleven district Federal Home Loan Banks (FHLBanks). The FHLBanks are U.S. government-sponsored enterprises (GSEs), organized under the authority of the Federal Home Loan Bank Act of 1932, as amended (FHLBank Act). Each FHLBank is a cooperative owned by member institutions located within a defined geographic district. The members purchase capital stock in the FHLBank and generally receive dividends on their capital stock investment. Our defined geographic district is New Jersey, New York, Puerto Rico, and the U.S. Virgin Islands. We provide a readily available, low-cost source of funds for our member institutions.
The FHLBNY is managed to deliver balanced value to members, rather than to maximize profitability or advance volume through low pricing. Our members must purchase FHLBNY stock according to regulatory requirements as a condition of membership. For more information, see financial statements, Note 14. Capital Stock, Mandatorily Redeemable Capital Stock and Restricted Retained Earnings. The business of the cooperative is to provide liquidity for our members (primarily in the form of loans referred to as “advances”) and to provide a return on members’ investment in FHLBNY stock in the form of a dividend. Since members are both stockholders and customers, our management operates the Bank such that there is a trade-off between providing value to them via low pricing for advances with a relatively lower dividend versus higher advances pricing with a relatively higher dividend.
All federally insured depository institutions, federally insured credit unions and insurance companies engaged in residential housing finance can apply for membership in the FHLBank in their district. Community development financial institutions (CDFIs) that have been certified by the CDFI Fund of the U.S. Treasury Department, including community development loan funds, community development venture capital funds, and state-chartered credit unions without federal insurance, are also eligible to become members of a FHLBank. FourFive CDFIs were members of the FHLBNY at December 31, 2018.2019.
A member of another FHLBank or a financial institution that is not a member of any FHLBank may also hold FHLBNY stock as a result of having acquired one of our members. Because we operate as a cooperative, we conduct business with related parties in the normal course of business and consider all members and non-member stockholders as related parties in addition to the other FHLBanks. For more information, see financial statements, Note 20. Related Party Transactions, and also Item 13. Certain Relationships and Related Transactions, and Director Independence in this Form 10-K.
Our primary business is making collateralized loans or advances to members and is also the principal factor that impacts our financial condition. We also serve the public through our mortgage programs, which enable our members to liquefy certain mortgage loans by selling them to the Bank. We also provide members with such correspondent services as safekeeping, wire transfers, depository and settlement services. Non-members that have acquired members have access to these services up to the time that their advances outstanding prepay or mature.
We obtain our funds from several sources. A primary source is the issuance of FHLBank debt instruments, called Consolidated obligations, to the public. The issuance and servicing of Consolidated obligations are performed by the Office of Finance, the fiscal agent for the issuance and servicing of Consolidated obligations on behalf of the 11 FHLBanks. These debt instruments represent the joint and several obligations of all the FHLBanks. Because the FHLBanks’ Consolidated obligations are rated Aaa/P-1 with a stable outlook by Moody’s Investors Service (Moody’s) and AA+/A-1+ with a stable outlook by Standard & Poor’s Rating Services (S&P or Standard & Poor’s) and because of the FHLBanks’ GSE status, the FHLBanks are generally able to raise funds at rates that are typically at a small to moderate spread above U.S. Treasury security yields. Additional sources of funding are member deposits, other borrowings, and the issuance of capital stock. Deposits may be accepted from member financial institutions and federal instrumentalities.
We combine private capital and public sponsorship as a GSE to provide our member financial institutions with a reliable flow of credit and other services for housing and community development, and our cooperative ownership structure allows us to pass along the benefit of these low funding rates to our members. By supplying additional liquidity to our members, we enhance the availability of residential mortgages and community investment credit. Members also benefit from our affordable housing and economic development programs, which provide grants and below-market-rate loans that support members’ involvement in creating affordable housing and revitalizing communities.
We do not have any wholly or partially owned subsidiaries, nor do we have an equity position in any partnerships, corporations, or off-balance sheet special purpose entities. We haveown a grantor trust related to fund certain non-qualified employee benefitsretirement programs, more fully described in financial statements Note 16. Employee Retirement Plans.Plans and Note 6. Equity Investments.
A Joint Capital Enhancement Agreement (Capital Agreement) among the 11 FHLBanks requires each FHLBank to enhance its capital position, and each FHLBank will contribute 20% of its Net income each quarter to its own restricted retained earnings account at the FHLBank until the balance of that account equals at least one percent of that FHLBank’s average balance of outstanding Consolidated obligations for the previous quarter. These restricted retained earnings will not be available to pay dividends.
The FHLBNY is supervised by the Federal Housing Finance Agency (FHFA or the Finance Agency), the independent Federal regulator of the FHLBanks, the Federal Home Loan Mortgage Corporation (Freddie Mac) and the Federal National Mortgage Association (Fannie Mae). The FHFA’s stated mission with respect to the FHLBanks is to provide effective supervision, regulation and housing mission oversight of the FHLBanks to promote their safety and soundness, support housing finance and affordable housing, and support a stable and liquid mortgage market.
Each FHLBank carries out its statutory mission only through activities that are authorized under and consistent with the Safety and Soundness Act and the FHLBank Act; and the activities of each FHLBank and the manner in which they are operated is consistent with the public interest. The Finance Agency also ensures that the FHLBNY carries out its housing and community development mission, remains adequately capitalized and able to raise funds in the capital markets. However, while the Finance Agency establishes regulations governing the operations of the FHLBanks, the Bank functions as a separate entity with its own management, employees and board of directors.
Our website is www.fhlbny.com. We have adopted, and posted on our website, a Code of Business Conduct and Ethics applicable to all employees and directors.
Market Area
Our market area is the same as the membership district — New Jersey, New York, Puerto Rico, and the U.S. Virgin Islands. Institutions that are members of the FHLBNY must have their charter or principal places of business within this market area but may also operate elsewhere. We had 328 members at December 31, 20182019 and 330 members at December 31, 2017.2018.
Due to the penetrated market, there are few opportunities to gain members. However, we continue to engage the member prospects who are eligible to join. In addition, foreign banks with charters based in our membership district are another potential pool of prospects. This is not a new trend as we currently have members who have parent companies outside the United States.
An appropriate candidate for membership is an institution that is likely to transact advance business with us within a reasonable period of time, so that the capital stock of the potential member will likely be required to purchase under membership provisions will not dilute the dividend on the existing members’ capital stock. Characteristics that identify attractive candidates include institutions with assets “of size”, an established practice of wholesale funding, a high loan-to-deposit ratio, strong asset growth, sufficient eligible collateral, and management that might have had experience with the FHLBanks during previous employment.
We actively market membership through a series of targeted, on-going sales and marketing initiatives. We compete for business by offering competitively priced products, services and programs that provide financial flexibility to the membership. The dominant reason institutions join the FHLBNY is access to a reliable source of liquidity. While
liquidity is provided in a variety of ways, advances are one of the most attractive sources of liquidity because they permit members to pledge relatively illiquid assets, such as 1-4 family, multifamily, home equity, and commercial real estate mortgages held in portfolio, to create liquidity. Advances are attractively priced because of our access to capital markets as a GSE and our strategy of providing balanced value to members.
The following table summarizes our members by type of institution:
|
|
|
|
|
|
|
|
|
| Community |
|
|
| Community | |||||||||||||||||||||||
|
|
|
|
|
|
|
|
|
| Development |
|
|
| Development | |||||||||||||||||||||||
|
| Commercial |
| Thrift |
| Credit |
| Insurance |
| Financial |
|
|
| Commercial | Thrift | Credit | Insurance | Financial | |||||||||||||||||||
|
| Banks |
| Institutions |
| Unions |
| Companies |
| Institution |
| Total |
| Banks | Institutions | Unions | Companies | Institution | Total | ||||||||||||||||||
| December 31, 2019 | 121 | 71 | 100 | 31 | 5 | 328 | |||||||||||||||||||||||||||||||
|
|
|
|
|
|
|
|
|
|
|
|
|
| ||||||||||||||||||||||||
December 31, 2018 |
| 129 |
| 74 |
| 95 |
| 26 |
| 4 |
| 328 |
| 129 | 74 | 95 | 26 | 4 | 328 | ||||||||||||||||||
|
|
|
|
|
|
|
|
|
|
|
|
|
| ||||||||||||||||||||||||
December 31, 2017 |
| 134 |
| 81 |
| 93 |
| 19 |
| 3 |
| 330 |
| ||||||||||||||||||||||||
Business Segments
We manage our operations as a single business segment. Management and our Board of Directors review enterprise-wide financial information in order to make operating decisions and assess performance.
Our cooperative structure permits us to expand and contract with demand for advances and changes in membership. When advances are paid down, because the member no longer needs the funds or because the member has been acquired by a non-member and the former member decides to prepay advances, the stock associated with the advances is immediately redeemed. When advances are paid before maturity, we collect fees that make us financially indifferent to the prepayment. Our operating expenses are low. Dividend capacity, which is a function of net income and the amount of stock outstanding, is largely unaffected by the prepayment since future stock and future income are reduced more or less proportionately. We believe that we will be able to meet our financial obligations and continue to deliver balanced value to members, even if advance demand drops significantlycontracts or if membership declines.
Products and Services
Introduction—Advances to members are the primary focus of our operations, and are also the principal factor that impacts our financial condition. Revenues from advances to members are the largest and the most significant element in our operating results. Providing advances to members, supporting the products and associated collateral and credit operations, and funding and swapping the funds are the focus of our operations.
We offer our members several correspondent banking services as well as safekeeping services. The fee income that is generated from these services is not significant. We also issue standby letters of credit on behalf of members for a fee. The total income derived from all such sources, and other incidental income and expenses were not material in the periods in this report.
We provide our members with an alternative to originating and selling long-term, fixed-rate mortgages in the secondary market. We accomplish this by purchasing eligible conforming fixed-rate mortgages originated or purchased by our members. Purchases are at negotiated market rates. For more information, see Acquired Member Assets Programs below and in the financial statements, Note 10. Mortgage Loans Held-for-Portfolio. However, weWe do not expect the program to become a significant factor in our operations. The interest revenues derived from this program were $101.2 million in 2019, $97.5 million in 2018 and $94.3 million in 2017 and $86.8 million in 2016. The2017. Relative to interest income from advances, revenues werefrom mortgage loans have not been a significant source of interest income.
5
Advances
We offer a wide range of credit products to help members meet local credit needs, manage interest rate and liquidity risk and serve their communities. Our primary business is making secured loans, called advances, to members. These advances are available as short- and long-term loans with adjustable, variable and fixed-rate features (including option-embedded and amortizing advances).
Advances to members, including former members, constituted 72.8%62.1% and 77.1%72.8% of our total assets of $144.4$162.1 billion and $158.9$144.4 billion at December 31, 20182019 and 2017.2018. In terms of revenues, interest income derived from advances were $2.5 billion, $2.5 billion and $1.6 billion, and $0.9 billion, representing 66.8%, 70.3%, 69.7%, and 67.6%69.7% of total interest income in 2019, 2018 2017 and 2016.2017. Most of our critical functions are directed at supporting the borrowing needs of our members and monitoring the members’ associated collateral positions. For more information about advances, including our underwriting standards, see financial statements, Note 9. Advances; also see Tables 3.1 to 3.93.8 and the accompanying discussions in this MD&A.
Members use advances as a source of funding to supplement their deposit gathering activities. Advances borrowed by members have been substantial ingenerally increased over the last 10 yearsdecade because many members have not been able to increase their deposits in their local markets as quickly as they have increased their assets. To close this funding gap, members have preferred to obtain reasonably priced advances rather than increasing their deposits by offering higher rates or foregoing asset growth. Because of the wide range of advance types, terms, and structures available to them, members have also used advances to enhance their asset/liability management. As a cooperative, we price advances at minimal net spreads above the cost of our funding in order to deliver more value to members.
Letters of Credit
We may issue standby financial letters of credit on behalf of members to facilitate members’ residential and community lending, provide members with liquidity, or assist members with asset/liability management. Where permitted by law, members may utilize FHLBNY letters of credit to collateralize deposits made by units of state and local governments. Our underwriting and collateral requirements for securing letters of credit are the same as our requirements for securing advances.
Derivatives
To assist members in managing their interest rate and basis risks in both rising and falling interest-rate environments, we will act as an intermediary between the member and derivatives counterparty. We do not act as a dealer and view this as an additional service to our members. Participating members must comply with our documentation requirements and meet our underwriting and collateral requirements. Volume of such requests has been insignificant.
Acquired Member Assets Programs
Utilizing a risk-sharing structure, the FHLBanks are permitted to acquire certain assets from or through their members. These initiatives are referred to as Acquired Member Assets (AMA) programs. At the FHLBNY, the Acquired Member Assets initiative is the Mortgage Partnership Finance (MPF®) Program, which provides members with an alternative to originating and selling long-term, fixed-rate mortgages in the secondary market. In the MPF Program, we purchase conforming fixed-rate mortgages originated or purchased by our members. Members are then paid a fee for assuming a portion of the credit risk of the mortgages that we acquired. Members assume credit risk by providing a credit enhancement to us or providing and paying for a supplemental mortgage insurance policy insuring us for some portion of the credit risk involved. This providesPrior to June 1, 2017, the mortgage loans acquired were credit enhanced to a double-A equivalent level of creditworthiness oncreditworthiness.For loans acquired after June 1, 2017, the mortgages.credit enhancement is computed to a “Single A” credit risk. The amount of this credit enhancement is fully collateralized by the member. We assume the remainder of the credit risk along with the interest rate risk of holding the mortgages in the MPF loan portfolio.
The Acquired Member Assets Regulation does not specifically address the disposition of Acquired Member Assets. The main intent of that regulation is the purchase of assets for investment rather than for trading purposes. However, the FHLBanks have the legal authority to sell Mortgage Partnership Finance loans pursuant to the granting of incidental powers in Section 12 of the FHLBank Act. Section 12(a) of the FHLBank Act specifically provides that each FHLBank shall have all such incidental powers, not inconsistent with the provisions of this chapter, as are customary and usual in corporations generally. General corporate law principles permit the sale of investments.
For additional discussion on our mortgage loans and their related credit risk, see financial statements, Note 10. Mortgage Loans Held-for-Portfolio. Also see Tables 5.1 to 5.3 and accompanying discussions in this MD&A.
Correspondent Banking Services
We offer our members an array of correspondent banking services, including depository services, wire transfers, settlement services, and safekeeping services. Depository services include processing of customer transactions in “Overnight Investment Accounts,” the interest-bearing demand deposit account each customer has with us. All customer-related transactions (e.g. deposits, Federal Reserve Bank settlements, advances, securities transactions, and wires) are posted to these accounts each business day. Wire transfers include processing of incoming and outgoing domestic wire transfers, including third-party transfers. Settlement services include automated clearinghouse and other transactions received through our accounts at the Federal Reserve Bank as correspondent for members and passed through to our customers’ Overnight Investment Accounts with us. Through a third party, we offer customers a range of securities custodial services, such as settlement of book entry (electronically held) and physical securities. We encourage members to access these products through 1Linksm, an Internet-based delivery system we developed as a proprietary service. Members access the 1Link system to obtain account activity information or process wire transfers, book transfers, security safekeeping and advance transactions.
Affordable Housing Program and Other Mission Related Programs
Federal Housing Finance Agency regulation 12 CFR Part 1292.5 (Community Investment Cash Advance Programs) states in general that each FHLBank shall establish an Affordable Housing Program (AHP) in accordance with Part 1291, and a Community Investment Program. The 11 FHLBanks together must annually allocate for the AHP the greater of $100 million or 10 percent of regulatory defined net earnings. The FHLBank may also offer a Rural Development Advance program, an Urban Development Advance program, and other Community Investment Cash Advance programs.
·Affordable Housing Program (AHP). We meet this requirement by allocating 10 percent of regulatory defined net income to our AHP to support the creation and preservation of housing for lower income families and individuals through the Affordable Housing Program (AHP). The program is offered primarily in two forms: a competitive program and a homeownership program. In the competitive program, AHP funds are awarded through a competitive process to members who submit applications on behalf of project sponsors who are planning to purchase, rehabilitate, or construct affordable homes or apartments. Within each year’s AHP allocation, we have established a program for first time homebuyers called the First Home Clubsm (FHC). The FHLBNY may set aside annually, in aggregate, up to the greater of $4.5 million or 35% of the Bank’s annual required AHP contributions. To be eligible for the first time buyer incentive, households must have incomes at or below 80% of the area median income. Qualifying households can receive matched funds at a 4:1 ratio, up to $7,500 to help with closing costs and/or down payment assistance; households are also required to attend counseling provided by a nonprofit housing agency, and we may provide up to $500 to defray the cost.
| · | Affordable Housing Program (AHP). We meet this requirement by allocating 10 percent of regulatory defined net income to our AHP to support the creation and preservation of housing for lower income families and individuals through the Affordable Housing Program (AHP). The program is offered primarily in two forms. A competitive program and a homeownership program. In the competitive program, AHP funds are awarded through a competitive process to members who submit applications on behalf of project sponsors who are planning to purchase, rehabilitate, or construct affordable homes or apartments. In the homeownership program, we require households to have income at or below 80% of the area median income, and we may set aside annually, in aggregate, up to the greater of $4.5 million or 35% of the Bank’s annual required AHP contributions. The Homebuyer Dream Program® (HDP) was established in 2019 to replace the First Home Clubsm (FHC), which is expected to sunset in 2021. The homeownership programs are to assist first time homebuyers with closing costs and/or down payment assistance. The HDP provides grant assistance up to $14,500 to eligible households through an annual round on a first come, first served basis. New homebuyers are eligible under the program to receive up to $500 to defray the cost of counseling provided by a nonprofit housing agency. |
See financial statements, Note 13. Affordable Housing Program for assessments allocated from earnings for the periods in this report.
| · | Other Mission — Related Activities. The Bank offers three distinct Community Lending Programs (CLP) that support our member’s community-oriented mortgage lending, which was established under the Community Investment Cash Advance Programs. The Bank provides reduced interest rate advances to members for lending activity that meet the CLP requirements, under the following individual programs: Community Investment Program (CIP), Rural Development Advance (RDA), and Urban Development Advance (UDA). The CLP provides additional support to members in their affordable housing and economic development lending activities within low- and moderate-income neighborhoods as well as other activities that benefit low- and moderate-income households. The Bank also provides letters of credit in support of projects that meet the CLP program requirements and are offered at reduced fees. Providing CLP Advances and Letters of Credit at advantaged pricing that is discounted from our market interest rates and fees represents an additional allocation of our income in support of the Bank’s affordable housing and community economic development mission. In addition, overhead costs and administrative expenses associated with the implementation of our Affordable Housing and CLP are absorbed as general operating expenses and are not charged back to the AHP allocation set aside. The foregone interest and fee income, as well as the administrative and operating costs, are above and beyond the annual income contribution to the AHP Loans offered under these programs. |
·Other Mission—Related Activities. The Bank offers three distinct Community Lending Programs (CLP) that support our member’s community-oriented mortgage lending, which was established under the Community Investment Cash Advance Programs. The Bank provides reduced interest rate advances to members for lending activity that meet the CLP requirements, under the following individual programs: Community Investment Program (CIP), Rural Development Advance (RDA), and Urban Development Advance (UDA). The CLP provides additional support to members in their affordable housing and economic development lending activities within low- and moderate-income neighborhoods as well as other activities that benefit low- and moderate-income households. The Bank also provides letters of credit in support of projects that meet the CLP program requirements and are offered at reduced fees. Providing CLP Advances and Letters of Credit at advantaged pricing that is discounted from our market interest rates and fees represents an additional allocation of our income in support of the Bank’s affordable housing and community economic development mission. In addition, overhead costs and administrative expenses associated with the implementation of our Affordable Housing and CLP are absorbed as general operating expenses and are not charged back to the AHP allocation set aside. The foregone interest and fee income, as well as the administrative and operating costs, are above and beyond the annual income contribution to the AHP Loans offered under these programs.
Investments
We maintain portfolios of investments to provide additional earnings and for liquidity purposes. Investment income also bolsters our capacity to fund Affordable Housing Program projects, and to cover operating expenditures. To help ensure the availability of funds to meet member credit needs, we maintain a portfolio of short-term investments issued by highly-rated, high credit quality financial institutions. The investments may include overnight Federal funds, term Federal funds, securities purchased under agreements to resell, and we are a major lender in this market, particularly in the overnight market. We further enhance our interest income by holding long-term investments classified as either held-to-maturity or as available-for-sale. These portfolios primarily consist of mortgage-backed securities issued by government-sponsored mortgage enterprises. Our long-term investments also include a small portfolio of privately issued mortgage-backed and residential asset-backed securities that were primarily acquired prior to 2006, bonds issued by housing finance agencies, and Grantor TrustsTrust owned by the FHLBNY that investinvests in mutual funds. We have a liquidity trading portfolio invested primarily in highly-liquid U.S. Treasury securities to enhance our short-term liquidity positions. The trading portfolio is not for speculative purposes.
For more information, see financial statements, Note 4. Federal Funds Sold and Securities Purchased Under Agreements to Resell, Note 5. Trading Securities, Note 6. Equity Investments, Note 7. Available-for-Sale Securities, and Note 8. Held-To-Maturity Securities. Also see Tables 4.1 through 4.74.9 and accompanying discussions in this MD&A.
Debt Financing — Consolidated Obligations
Our primary source of funds is the sale of debt securities, known as Consolidated obligations, in the U.S. and global capital markets. Consolidated obligations are the joint and several obligations of the FHLBanks, backed only by the financial resources of the 11 FHLBanks. Consolidated obligations are not obligations of the United States, and the United States does not guarantee them. The issuance and servicing of Consolidated obligations debt are performed by the Office of Finance, a joint office of the FHLBanks established by the Finance Agency. The Office of Finance (or the “OF”) has authority to issue joint and several debt on behalf of the FHLBanks. At December 31, 20182019 and 2017,2018, the par amounts of Consolidated obligations outstanding, bonds and discount notes for all 11 FHLBanks was $1.0 trillion, including $134.6$152.2 billion and $148.5$134.6 billion issued for the FHLBNY and outstanding at those dates.
For more information, see financial statements, Note 12. Consolidated Obligations. Also see Tables 6.1 to 6.10 and accompanying discussions in this MD&A.
Finance Agency regulations state that the FHLBanks must maintain, free from any lien or pledge, qualifying assets at least equal to the face amount of Consolidated obligations outstanding. Qualifying assets are defined as cash; secured advances; assets with an assessment or rating at least equivalent to the current assessment or rating of the Consolidated obligations; obligations of or fully guaranteed by the United States, obligations, participations, or other instruments of or issued by Federal National Mortgage Association (Fannie Mae) or the Government National Mortgage Association (Ginnie Mae); mortgages, obligations, or other securities which are or ever have been sold by
the Federal Home Loan Mortgage Corporation (Freddie Mac) under the FHLBank Act; and such securities as fiduciary and trust funds may invest in under the laws of the state in which the FHLBank is located. Any assets subject to a lien or pledge for the benefit of holders of any issue of Consolidated obligations are treated as if they were free from lien or pledge for purposes of compliance with these regulations.
Consolidated obligations are distributed through dealers selected by the Office of Finance using various methods including competitive auction and negotiations with individual or syndicates of underwriters. Some debt issuance is in response to specific inquiries from underwriters. Many Consolidated obligations are issued with the FHLBank concurrently entering into derivatives agreements, such as interest rate swaps. To facilitate issuance, the Office of Finance may coordinate communication between underwriters, individual FHLBanks, and financial institutions executing derivative agreements with the FHLBanks. Issuance volume is not concentrated with any particular underwriter.
The Office of Finance is mandated by the Finance Agency to ensure that Consolidated obligations are issued efficiently and at the lowest all-in cost of funds over time. If the Office of Finance determines that its action is consistent with its Finance Agency’s mandated policies, it may reject our issuance request, and the requests of other FHLBanks, to raise funds through the issuance of Consolidated obligations on particular terms and conditions. We have never been denied access under this policy for all periods reported. The Office of Finance serves as a source of information for the FHLBanks on capital market developments, and manages the FHLBanks’ relationship with the rating agencies with respect to the Consolidated obligations.
Consolidated Obligation Liabilities
Each FHLBank independently determines its participation in each issuance of Consolidated obligations based on (among other factors) its own funding and operating requirements, maturities, interest rates, and other terms available for Consolidated obligations in the market place. The FHLBanks have emphasized diversification of funding sources and channels as the need for funding from the capital markets has grown.
Consolidated Obligations Bonds. Consolidated bonds are issued primarily to raise intermediate- and long-term funds for the FHLBanks. They can be issued and distributed through negotiated or competitive bidding transactions with approved underwriters or bidding group members. Consolidated bonds (COs or CO bonds) generally carry fixed- or variable-rate payment terms and have maturities ranging from one month to 30 years.
·
| · | The Global Debt Program — The FHLBanks issue global bullet Consolidated bonds. The FHLBanks and the Office of Finance maintain a debt issuance process for scheduled issuance of global bullet Consolidated bonds. As part of this process, management from each FHLBank will determine and communicate a firm commitment to the Office of Finance for an amount of scheduled global bullet debt to be issued on its behalf. If the FHLBanks’ orders do not meet the minimum debt issue size, each FHLBank receives an allocation of proceeds equal to either the larger of the FHLBank’s commitment or the ratio of the individual FHLBank’s regulatory capital to total regulatory capital of all of the FHLBanks. If the FHLBanks’ commitments exceed the minimum debt issue size, then the proceeds are allocated based on relative regulatory capital of the FHLBanks, with the allocation limited to either the lesser of the allocation amount or the actual commitment amount. The FHLBanks can, however, pass on any scheduled calendar slot and decline to issue any global bullet Consolidated bonds upon agreement of at least eight of the FHLBanks. |
| · | TAP Issue Program — The FHLBanks use the TAP Issue Program to issue fixed-rate, non-callable (bullet) bonds. This program uses specific maturities that may be reopened daily through competitive auctions. The goal of the TAP Issue Program is to aggregate frequent smaller fixed-rate funding needs into a larger bond issue that may have greater market liquidity. |
Consolidated Obligation Discount Notes. Discount notes may be offered into the market though the “discount note window”, or through regularly scheduled competitive auctions. These CO discount notes have a maturity range of one day to one year, are generally issued at or below par, and mature at par.
| · |
|
Deposits
The FHLBank Act allows us to accept deposits from its members, other FHLBanks and government instrumentalities. For us, member deposits are also a source of funding, but we do not rely on member deposits to meet our funding requirements. For members, deposits are a low-risk earning asset that may satisfy their regulatory liquidity requirements. We offer several types of deposit programs to our members, including demand and term deposits.
Capital
From its enactment in 1932, the FHLBank Act provided for a subscription-based capital structure for the FHLBanks. The amount of capital stock that each FHLBank issued was determined by a statutory formula establishing how much FHLBank capital stock each member was required to purchase. With the enactment of the Gramm-Leach-Bliley Act of 1999, Congress replaced the statutory subscription-based member capital stock purchase formula with requirements for total capital, leverage capital, and risk-based capital for the FHLBanks and required the FHLBanks to develop new capital plans to replace the previous statutory structure.
The FHLBNY’s capital plan bases the stock purchase requirement on the level of activity a member has with the Bank, subject to a minimum membership requirement that is intended to reflect the value to the member of having access to the Bank as a funding source. With the approval of the Board of Directors, we may adjust these requirements from time to time within the ranges established in the capital plan. Any changes to our capital plan must be approved by our Board of Directors and the Finance Agency.
Bank capital stock cannot be publicly traded, and under the capital plan, may be issued, transferred, redeemed, and repurchased only at its par value of $100 per share, subject to certain regulatory and statutory limits. Under the capital plan, a member’s capital stock will be redeemed by the Bank upon five years notice from the member, subject to certain conditions. In addition, we have the discretion to repurchase excess capital stock from members. Our current practice is to acquire excess activity based capital stock daily.
For more information, see Table 7.1 Stockholders’ Capital in this MD&A, and Note 14. Capital Stock, Mandatorily Redeemable Capital Stock and Restricted Retained Earnings in the notes to the audited financial statements.
Retained Earnings and Dividends
The Bank’s Retained Earnings and Dividends policy (the “Policy”) is a Board approved policy, the objectives of which are to preserve the value of our members’ investment with us, and to provide members with a reasonable dividend. The Policy also states that we want to provide returns on the investment in the Bank’s stock that are sufficient to attract and retain members, and that do not discourage member borrowing. The Bank’s minimum level of retained earning provides management with a high degree of confidence that estimable losses under simulated
stressful conditions and scenarios will not impair paid-in capital, thereby preserving the par value of the stock. Additionally, Unrestricted Retained Earnings should be available to supplement dividends when earnings are low or losses occur. Our ability to pay dividends and any other distributions may be affected by standards under the Policy.
The Policy establishes (1) a minimum level of Retained Earnings equal to the Bank’s “Retained Earnings Sufficiency”, which is the FHLBNY’s measure of estimating the Bank’s risk exposures; it is estimated under simulated stressful conditions and scenarios, within a defined confidence interval, on market, credit and operational risks, as well as GAAP accounting exposures related to the fair values of certain financial instruments; (2) the priority of contributions to retained earnings relative to other distributions of income; (3) the target level of Retained Earnings, based on the Retained Earnings Sufficiency level, and (4) a timeline to achieve the targets and to ensure maintenance of appropriate levels of Retained Earnings.
The Bank may pay dividends from Unrestricted Retained Earnings and current net income. Per Finance Agency regulations, our Board of Directors may declare and pay dividends in either cash or capital stock; our practice has been to pay dividends in cash. Our dividends and our dividend policy are subject to Federal Housing Finance Agency regulations and policies. Any dividend payments declared by our Board are a function of these policies, and our financial condition and performance.
To achieve the Bank’s strategic plans and business objectives within the Bank’s risk appetite, the Board-approved Retained Earnings target was $1,760 million for 2019 (including $656 million of Restricted retained earnings (RRE) allocated to Risk Bearing Capacity) and $1,505 million for 2018. For more information about Restricted retained earnings, see Table 7.1 Stockholder’s Capital in this MD&A.
Unrestricted Retained Earnings was $1,115.2 million and $1,102.8 million at December 31, 2019 and 2018. Restricted Retained Earnings was $685.8 million and $591.3 million at the two dates. The balance in Accumulated Other Comprehensive Income (AOCI), a component of stockholder’s equity, were losses of $47.8 million and $13.3 million at December 31, 2019 and 2018. At December 31, 2019 and 2018, our actual retained earning balances exceeded the required Bank’s Retained Earnings Sufficiency level and was in compliance with the Retained Earnings and Dividend Policy.
The following table summarizes the impact of dividends on our retained earnings for the years ended December 31, 2019, 2018 and 2017 (in thousands):
| December 31, | ||||||||||||
| 2019 | 2018 | 2017 | ||||||||||
| Retained earnings, beginning of year | $ | 1,694,082 | $ | 1,546,282 | $ | 1,411,965 | ||||||
| Adjustments to opening balance(a) | - | 4,924 | - | |||||||||
| Net Income for the year | 472,588 | 560,478 | 479,469 | |||||||||
| 2,166,670 | 2,111,684 | 1,891,434 | ||||||||||
| Dividends paid in the year(b) | (365,636 | ) | (417,602 | ) | (345,152 | ) | ||||||
| Retained earnings, end of year | $ | 1,801,034 | $ | 1,694,082 | $ | 1,546,282 | ||||||
(b) Dividends are paid quarterly in arrears in the second month after quarter-end. Dividends are not accrued at quarter-end.
Competition
Demand for advances is affected by the availability and cost to members of alternate sources of liquidity, including retail deposits and wholesale funding options such as brokered deposits, repurchase agreements, Federal Funds lines of credit, wholesale CD programs, and deposits thru listing service. Historically, members have grown their assets at a faster pace than retail deposits and capital resulting in the creation of a funding gap. We compete with both secured and unsecured suppliers of wholesale funding to fill these potential funding gaps. Such other suppliers of funding may include Wall Street dealers, commercial banks, regional broker-dealers and firms capitalizing on
wholesale funding platforms. Of these wholesale funding sources, the brokered CD market is our main threat as members continue to increase their usage and counterparties extend available maturities.
An emerging competitor is Deposits thru Listing Services, which are financial institutions that charge a subscription fee to help banks gather deposits. We have seen a gradual uptick in the use of these wholesale deposits using this vehicle. Repo and Federal Funds usage has been stable, though demand for certain members has both increased and decreased as a result of the various changes in the regulatory liquidity requirements and we expect this trend to extend as advances and brokered CDs continue to take market share. Our larger members may also have access to the national and global credit markets. The availability of alternative funding sources can vary as a result of market conditions, member creditworthiness, availability of collateral and suppliers’ appetite for the business, as well as other factors. However, we believe the competitive landscape will continue and will be reflected in the balances and market share.
In the debt markets, we compete for funds in the national and global debt markets. Competitors include corporations, sovereigns, the U.S. Treasury, supranational entities and Government Sponsored Enterprises including Fannie Mae, Freddie Mac and the Federal Farm Credit Banks (FFCB). Increases in the supply of competing debt products could, in the absence of increases in demand, result in higher debt costs or lesser amounts of debt issued at the same cost than would otherwise be the case. In addition, the availability and cost of funds can be adversely affected by regulatory initiatives that could reduce demand for Federal Home Loan Bank System debt. Although the available supply of funds has historically kept pace with the liquidity needs of our members, there can be no assurance this will continue to be the case.
In certain market conditions, there is considerable competition among high credit quality issuers in the markets for callable debt. The issuance of callable debt and the simultaneous execution of callable derivatives that mirror the debt have been, when available, a valuable source of competitively priced funding for the FHLBNY. However, since Money Market Fund Reform, the dominant System issuance has been in simple floating-rate debt as money market funds migrated assets from Prime to Government Funds; thereby creating demand for eligible assets such as FHLB debt. Floaters have been one of the main determinants of our relative cost of funds. There can be no assurance that the current breadth and depth of these markets will be sustained as it is heavily influenced by investor sentiment concerning rates and yields, LIBOR cessation and availability of alternative investments, particularly in the Repo sector.
Since November 2018, the FHLB System has been a major participant in the issuance of floaters using the proposed LIBOR replacement index, the Secured Overnight Financing Rate (SOFR). SOFR-floaters are potentially a major source of funding for the System as issuance grows and a broader derivative market develops in anticipation of a cessation of LIBOR. See LIBOR replacement discussions in Item 1A. Risk Factors.
We compete for the purchase of mortgage loans held-for-sale. For single-family products, competition is primarily with Fannie Mae and Freddie Mac, principally on the basis of price, products, structures, and services offered.
Competition for certain aspects of the FHLBank business model among the 11 FHLBanks is limited, although a bank holding company with multiple banking charters may operate in more than one FHLBank’s district. If the member has a centralized treasury function, it is possible that there could be competition for advances. A limited number of our member institutions are subsidiaries of financial holding companies with multiple charters and FHLBank memberships. The amount of advances borrowed by these entities and the amount of capital stock held, could be material to the business. Certain large member financial institutions operating in our district may borrow unsecured Federal funds or source deposits from other FHLBanks. We are permitted by regulation to purchase short-term investments from our members, though we choose to not permit members to borrow unsecured funds from us.
12
Oversight, Audits, and Examinations
The Federal Housing Finance Agency (Finance Agency or FHFA), an independent agency in the executive branch of the U.S. government, supervises and regulates the FHLBanks. The Housing Act created the FHFA with regulatory authority over FHLBank matters such as: board of director composition, executive compensation, risk-based capital standards and prompt corrective action enforcement provisions, membership eligibility, and low-income housing goals. The FHFA’s mission, with respect to the FHLBanks, is to ensure that the FHLBanks operate in a safe and sound manner so that the FHLBanks serve as a reliable source of liquidity and funding for housing finance and community investment.
We carry out our statutory mission only through activities that comply with the rules, regulations, guidelines, and orders issued under the Federal Housing Enterprises Financial Safety and Soundness Act, the Housing Act and the FHLBank Act.
Our shares of Class B stock are registered with the SEC under the Exchange Act, and we are subject to the information, disclosure, insider trading restrictions and other requirements under the Exchange Act. We are not subject to the provisions of the Securities Act.
The Government Corporation Control Act provides that, before a government corporation may issue and offer obligations to the public, the Secretary of the Treasury shall prescribe the form, denomination, maturity, interest rate and conditions of the obligations; the way and time issued; and the selling price. The U.S. Department of the Treasury receives the Finance Agency’s annual report to Congress, monthly reports reflecting securities transactions of the FHLBanks, and other reports reflecting the operations of the FHLBanks. The FHLBNY has an internal audit department, and our Board of Directors has an Audit Committee. An independent registered public accounting firm audits our annual financial statements. The independent registered public accounting firm conducts these audits following auditing standards established by the Public Company Accounting Oversight Board (PCAOB). The FHLBanks, the Finance Agency, and Congress all receive the audit reports. We must also submit annual management reports to Congress, the President, the Office of Management and Budget, and the Comptroller General. These reports include: Statements of financial condition, operations, and cash flows; a Statement of internal accounting and administrative control systems; and the Report of the independent registered public accounting firm on the financial statements and internal controls over financial reporting.
The Comptroller General has authority under the FHLBank Act to audit or examine the Finance Agency and the FHLBanks, including the FHLBNY, and to decide the extent to which they fairly and effectively fulfill the purpose of the FHLBank Act. Furthermore, the Government Corporation Control Act provides that the Comptroller General may review any audit of our financial statements conducted by a registered independent public accounting firm. If the Comptroller General conducts such a review, then he or she must report the results and provide his or her recommendations to Congress, the Office of Management and Budget and the Bank. The Comptroller General may also conduct his or her own audit of any of our financial statements.
Personnel
As of December 31, 2019, we had 342 full-time and no part-time employees. As of December 31, 2018, we had 314 full-time and no part-time employees. The employees are not represented by a collective bargaining unit, and we consider our relationship with employees to be good.
Tax Status
The FHLBanks, including the FHLBNY, are exempt from ordinary federal, state, and local taxation except for real property taxes.
13
Assessments
Affordable Housing Program (AHP) Assessments. — Section 10(j) of the FHLBank Act requires each FHLBank to establish an Affordable Housing Program. Each FHLBank provides subsidies in the form of direct grants and below-market interest rate advances to members who use the funds to assist in the purchase, construction, or rehabilitation of housing for very low-, low-, and moderate-income households. Annually, the FHLBanks must allocate for the AHP the greater of $100 million or 10% of regulatory net income. Regulatory net income is defined as GAAP net income before interest expense related to mandatorily redeemable capital stock and the assessment for Affordable Housing Program. The exclusion of interest expense related to mandatorily redeemable capital stock is a regulatory interpretation of the Finance Agency. We accrue the AHP expense monthly.
We charge the amount allocated for the Affordable Housing Program to income and recognize the amounts allocated as a liability. We relieve the AHP liability as members use subsidies. In periods where our regulatory income before Affordable Housing Program is zero or less, the amount of AHP liability is equal to zero. If the result of the aggregate 10% calculation described above is less than $100 million for all 11 FHLBanks, then the Act requires the shortfall to be allocated among the FHLBanks based on the ratio of each FHLBank’s income before Affordable Housing Program to the sum of the income before Affordable Housing Program of the 11 FHLBanks. There were no shortfalls in 2019, 2018 and 2017.
Available Information
The Federal Home Loan Bank of New York maintains a website located at www.fhlbny.com where we make available our annual report on Form 10-K and quarterly reports on Form 10-Q as filed with the Securities and Exchange Commission (the SEC), and other information regarding us and our products free of charge. We are required to file with the SEC an annual report on Form 10-K, quarterly reports on Form 10-Q, and current reports on Form 8-K. The SEC maintains a website that contains these reports and other information regarding our electronic filings located at www.sec.gov. Information on these websites, or that can be accessed through these websites, does not constitute a part of this annual report.
| Risk Factors. |
The following discussion sets forth the material risk factors that could affect the FHLBNY’s financial condition and results of operations. Readers should not consider any descriptions of such factors to be a complete set of all potential risks that could affect the FHLBNY.
Market and Economic Risks
Changes to and replacement of the London Interbank Offered Rate (LIBOR) benchmark interest rate could adversely affect FHLBNY’s business, financial condition, and results of operations. In July 2017, the United Kingdom's Financial Conduct Authority, which regulates LIBOR, announced that after 2021 it will no longer persuade or compel banks to submit rates for the calculation of LIBOR. The announcement indicates that the continuation of LIBOR on the current basis cannot and will not be guaranteed after 2021. It is impossible to predict whether and to what extent banks will continue to provide LIBOR submissions to the administrator of LIBOR, whether LIBOR rates will cease to be published or supported before or after 2021, or whether any additional reforms to LIBOR may be enacted in the United Kingdom or elsewhere. There is no assurance that LIBOR will continue to be accepted or used by the markets generally or by any issuers, investors, or counterparties at any time, even if LIBOR continues to be available.
In September 2019, the FHFA issued a supervisory letter (the Supervisory Letter) to the FHLBank and the Office of Finance relating to their planning for the LIBOR phase-out. Under the Supervisory Letter, with limited exceptions, FHLBanks, including the FHLBNY, should, by December 31, 2019, stop purchasing investments that reference LIBOR and mature after December 31, 2021, and should, by March 31, 2020, no longer enter into any other new financial assets, liabilities, and derivatives that reference LIBOR and mature after December 31, 2021 (The March 31, 2020 date has now been extended to June 30, 2020). As we align our business strategies to the Supervisory Letter, we may experience less flexibility in our access to funding, higher funding costs, or lower overall demand or increased costs for our advances, which may, in turn, negatively affect the future composition of our balance sheet, capital stock levels, core mission asset ratios, and net income. In addition, the availability and cost of funds can be adversely affected by regulatory initiatives that could reduce demand for Federal Home Loan Bank System debt. Although the available supply of funds has historically kept pace with the liquidity needs of our members, there can be no assurance this will continue to be the case indefinitely.
There is considerable competition among high credit quality issuers in the markets for callable debt. The issuance of callable debt and the simultaneous execution of callable derivatives that mirror the debt have been, when available, a valuable source of competitively priced funding for the FHLBNY. However, since Money Market Fund Reform, the dominant System issuance has been in simple LIBOR-floaters as we are generally not permitted to continue to use instruments that reference LIBOR for hedging and risk-mitigating purposes, we will have to alter our hedging and interest-rate risk management strategies, which may have a negative effect on our financial condition and results of operations.
In the United States, the Federal Reserve Board and the Federal Reserve Bank of New York convened the Alternative Reference Rates Committee to identify a set of alternative reference interest rates for possible use as market benchmarks. This committee has proposed the Secured Overnight Financing Rate (SOFR) as its recommended alternative to U.S. dollar LIBOR, and the Federal Reserve Bank of New York began publishing SOFR rates in the second quarter of 2018. SOFR is based on a broad segment of the overnight Treasury repurchase market and is intended to be a measure of the cost of borrowing cash overnight collateralized by Treasury securities. Since 2018, market activity in SOFR-linked financial instruments has continued to develop. The FHLBanks, including the FHLBNY, have offered SOFR-linked consolidated obligations on an ongoing basis and have started offering SOFR-linked advances.
As many of our assets, liabilities, and derivatives are indexed to LIBOR, the FHLBanks, including the FHLBNY and the Office of Finance have developed a LIBOR transition plan, which addresses considerations such as LIBOR exposure, fallback language, operational preparedness, and balance sheet management. However, the market transition away from LIBOR and towards SOFR or another alternate reference rate is expected to be complicated, including the development of term and credit adjustments to accommodate differences between LIBOR and SOFR or any other alternate reference rate. During the market transition away from LIBOR, LIBOR may experience increased volatility or become less representative. In addition, the overnight Treasury repurchase market underlying SOFR has experienced and may experience disruptions from time to time, which has resulted and may result in unexpected fluctuations in SOFR. Introduction of an alternate reference rate also may create challenges in hedging and asset liability management and introduce additional basis risk and increased volatility for the FHLBNY and other market participants. While market activity in SOFR-linked financial instruments has continued to develop, there can be no guarantee that SOFR will become widely accepted and used across market segments and financial products in a timely manner and any other alternative reference rate may or may not be developed. Any disruption in the market transition away from LIBOR and towards SOFR or another alternate reference rate could result in increased financial, operational, legal, reputational, or compliance risks for the FHLBNY. We are not able to
predict the effect of a possible transition to SOFR or another alternate reference rate will have on our business, financial condition, and results of operations.
Changes in interest rates could significantly affect the FHLBNY’s financial condition and results of operations. The level of interest rates and the impact on our balance sheet spreads are important factors affecting the Bank’s interest rate risk management, profitability, and returns. We earn income from capital, and the level of market interest rates as impacted by the Federal Reserve and the capital markets, directly affects these earnings.
We earn income from the spread between interest earned on our outstanding advances, investments and shareholders’ capital, and interest paid on our Consolidated obligations and other interest-bearing liabilities. Although we use various methods and procedures to monitor and manage our exposure to changes in interest rates, we may experience instances when either our interest-bearing liabilities will be more sensitive to changes in interest rates than our interest-earning assets, or vice versa. In either case, interest rate movements contrary to our position could negatively affect our financial condition and results of operations. Moreover, the effect of changes in interest rates can be exacerbated by prepayment and extension risk, a risk that mortgage related assets will be refinanced by the mortgagor in low interest rate environments or will remain outstanding longer than expected at below market yields when interest rates increase.
The possibility of negative interest rates on U.S. Treasury or other market instruments could adversely affect our results of operations by, for example, reducing asset yields or spreads, creating operating and operating system issues, or having other adverse impacts on our business.
The FHLBNY’s funding depends on its ability to access the capital markets. Our primary source of funds is the sale of Consolidated obligations in the capital markets. Our ability to obtain funds through the sale of Consolidated obligations depends in part on prevailing conditions in the capital markets, which are, for the most part, beyond our control. Accordingly, we may not be able to obtain funding on acceptable terms, if at all. If we cannot access funding when needed on acceptable terms, our ability to support and continue operations could be adversely affected, which could negatively affect our financial condition and results of operations. If additional reforms are legislated over money market funds, migrated assets from Prime to Government Funds; thereby creating intense demand for qualifying assets such as FHLB debt. Floaters have been one of the main determinants of our relative cost of funds. There can be no assurance that the current breadth and depth of these markets will be sustained as it is heavily influenced by investor sentiment concerning rising rates and yields and availability of alternative investments, particularly in the Repo sector. The advent of the proposed LIBOR replacement index, the Secured Overnight Financing Rate (SOFR) will also be a potential major source of funding for the System as issuance grows and a derivative market develops in anticipation of a cessation of LIBOR.
We compete for the purchase of mortgage loans held-for-sale. For single-family products, competition is primarily with Fannie Mae and Freddie Mac, principally on the basis of price, products, structures, and services offered.
Competition for certain aspects of the FHLBank business model among the 11 member banks of the FHLBanks is limited, although a bank holding company with multiple banking charters may operate in more than one FHLBank’s district. If the member has a centralized treasury function, it is possible that there could be competition for advances. A limited number of our member institutions are subsidiaries of financial holding companies with multiple charters and FHLBank memberships. The amount of advances borrowed by these entities and the amount of capital stock held, could be material to the business. Certain large member financial institutions operating in our district may borrow unsecured Federal funds or source deposits from other FHLBanks. We are permitted by regulation to purchase short-term investments from our members, though we choose to not permit members to borrow unsecured funds from us.
Oversight, Audits, and Examinations
The Federal Housing Finance Agency (Finance Agency or FHFA), an independent agency in the executive branch of the U.S. government, supervises and regulates the FHLBanks. The Housing Act created the FHFA with regulatory authority over FHLBank matters such as: board of director composition, executive compensation, risk-based capital standards and prompt corrective action enforcement provisions, membership eligibility, and low-income housing goals. The FHFA’s mission, with respect to the FHLBanks, is to ensure that the FHLBanks operate in a safe and sound manner so that the FHLBanks serve as a reliable source of liquidity and funding for housing finance and community investment.
We carry out our statutory mission only through activities that comply with the rules, regulations, guidelines, and orders issued under the Federal Housing Enterprises Financial Safety and Soundness Act, the Housing Act and the FHLBank Act.
Our shares of Class B stock are registered with the SEC under the Exchange Act, and we are subject to the information, disclosure, insider trading restrictions and other requirements under the Exchange Act. We are not subject to the provisions of the Securities Act as amended.
The Government Corporation Control Act provides that, before a government corporation may issue and offer obligations to the public, the Secretary of the Treasury shall prescribe the form, denomination, maturity, interest rate and conditions of the obligations; the way and time issued; and the selling price. The U.S. Department of the Treasury receives the Finance Agency’s annual report to Congress, monthly reports reflecting securities transactions of the FHLBanks, and other reports reflecting the operations of the FHLBanks. The FHLBNY has an internal audit department, and our Board of Directors has an Audit Committee. An independent registered public accounting firm audits our annual financial statements. The independent registered public accounting firm conducts these audits
following auditing standards established by the Public Company Accounting Oversight Board (United States). The FHLBanks, the Finance Agency, and Congress all receive the audit reports. We must also submit annual management reports to Congress, the President, the Office of Management and Budget, and the Comptroller General. These reports include: Statements of financial condition, operations, and cash flows; a Statement of internal accounting and administrative control systems; and the Report of the independent registered public accounting firm on the financial statements and internal controls over financial reporting.
The Comptroller General has authority under the FHLBank Act to audit or examine the Finance Agency and the FHLBanks, including the FHLBNY, and to decide the extent to which they fairly and effectively fulfill the purpose of the FHLBank Act. Furthermore, the Government Corporation Control Act provides that the Comptroller General may review any audit of our financial statements conducted by a registered independent public accounting firm. If the Comptroller General conducts such a review, then he or she must report the results and provide his or her recommendations to Congress, the Office of Management and Budget and the Bank. The Comptroller General may also conduct his or her own audit of any of our financial statements.
Personnel
As of December 31, 2018, we had 314 full-time and no part-time employees. As of December 31, 2017, we had 308 full-time and no part-time employees. The employees are not represented by a collective bargaining unit, and we consider our relationship with employees to be good.
Tax Status
The FHLBanks, including the FHLBNY, are exempt from ordinary federal, state, and local taxation except for real property taxes.
Assessments
Affordable Housing Program (AHP) Assessments. — Section 10(j) of the FHLBank Act requires each FHLBank to establish an Affordable Housing Program. Each FHLBank provides subsidies in the form of direct grants and below-market interest rate advances to members who use the funds to assist in the purchase, construction, or rehabilitation of housing for very low-, low-, and moderate-income households. Annually, the FHLBanks must allocate for the AHP the greater of $100 million or 10% of regulatory net income. Regulatory net income is defined as GAAP net income before interest expense related to mandatorily redeemable capital stock and the assessment for Affordable Housing Program. The exclusion of interest expense related to mandatorily redeemable capital stock is a regulatory interpretation of the Finance Agency. We accrue the AHP expense monthly.
We charge the amount allocated for the Affordable Housing Program to income and recognize the amounts allocated as a liability. We relieve the AHP liability as members use subsidies. In periods where our regulatory income before Affordable Housing Program is zero or less, the amount of AHP liability is equal to zero. If the result of the aggregate 10% calculation described above is less than $100 million for all 11 FHLBanks, then the Act requires the shortfall to be allocated among the FHLBanks based on the ratio of each FHLBank’s income before Affordable Housing Program to the sum of the income before Affordable Housing Program of the 11 FHLBanks. There were no shortfalls in 2018, 2017 and 2016.
Available Information
Our website, www.fhlbny.com, provides copies of the Bank’s recent Form 10-K and Form 10-Q reports and a link to the section of the Electronic Data Gathering and Reporting (EDGAR) website, as maintained by the Securities and Exchange Commission (the SEC), containing all reports electronically filed, or furnished, including our annual report on Form 10-K, our quarterly reports on Form 10-Q, and our current reports on Form 8-K as well as any amendments to such reports. These reports are made available free of charge through our website as soon as reasonably practicable after electronically filing or being furnished to the SEC. In addition, the SEC maintains a website that contains reports and other information regarding our electronic filings (located at http://www.sec.gov). The Bank’s and the SEC’s website addresses have been included as inactive textual references only. Information on those websites is not part of this report.
The following discussion sets forth the material risk factors that could affect the FHLBNY’s financial condition and results of operations. Readers should not consider any descriptions of such factors to be a complete set of all potential risks that could affect the FHLBNY.
Regulatory Risks
The FHLBanks are governed by federal laws and regulations, which could change or be applied in a manner detrimental to FHLBNY’s operations. The FHLBanks are government-sponsored enterprises (GSEs), organized under the authority of the FHLBank Act, and, as such, are governed by federal laws and regulations of the Finance Agency, an independent agency in the executive branch of the federal government. From time to time, Congress has amended the FHLBank Act in ways that significantly affected the FHLBanks and the manner in which the FHLBanks carry out their housing finance mission and business operations. New or modified legislation enacted by Congress or regulations adopted by the Finance Agency could have a negative effect on our ability to conduct business or our cost of doing business. Due to recent changes in the U.S. government administration and recent executive actions, there are additional uncertainties in the legislative and regulatory environment.
Changes in regulatory or statutory requirements, or in their application, could result in, among other things, changes in: our cost of funds; retained earnings requirements; liquidity requirements, debt issuance; dividend payments; capital redemption and repurchases; permissible business activities; the size, scope, or nature of our lending, investment, or mortgage purchase programs; or our compliance costs. Changes that restrict dividend payments, the growth of our current business, or the creation of new products or services could negatively affect our results of operations and financial condition. Further, the regulatory environment affecting members could be changed in a manner that would negatively affect their ability to acquire or own our capital stock or take advantage of our products and services.
As a result of these factors, the FHLBank System may have to pay a higher rate of interest on Consolidated obligations. The resulting increase in the cost of issuing Consolidated obligations could cause our advances to be less profitable and reduce our net interest margins (the difference between the interest rate received on advances and the interest rate paid on Consolidated obligations). If we change the pricing of our advances, they may no longer be attractive to members and outstanding advances may decrease. In any case, the increased cost of issuing Consolidated obligations could negatively affect our financial condition and results of operations.
Negative information about us, the FHLBanks or housing GSEs, in general, could adversely impact our cost and availability of financing. Negative information impacting us or any other FHLBank, such as material losses or increased risk of losses, could also adversely impact our cost of funds. More broadly, negative information about housing GSEs, in general, could adversely impact us. The housing GSEs — Fannie Mae, Freddie Mac, and the FHLBanks — issue highly rated agency debt to fund their operations. From time to time, negative announcements by any of the housing GSEs concerning accounting problems, risk-management issues, and regulatory enforcement actions have created pressure on debt pricing for all GSEs, as investors have perceived such instruments as bearing increased risk. Similar announcements by the FHLBanks may contribute to this pressure on debt pricing. One possible source of information that impacts us could come from plans for housing GSE reform. Such plans, including those introduced by the U.S. Treasury and HUD proposed certain recommendations for the reform of the housing GSEs. Although the focus of those recommendations is on Fannie Mae and Freddie Mac, the proposal includes certain recommendations for the FHLBanks. The proposed reforms could affect the FHLBanks’ current business activities with their members, particularly large financial institutions. These recommendations include reducing and altering the composition of FHLBanks investment portfolios, limiting the level of advances outstanding to individual members and restricting membership to allow each financial institution, inclusive of its affiliates, to be an active member in only a single FHLBank. Other recommendations or other plans could result in market uncertainty regarding the status of U.S. federal government support of housing GSEs, in general, including the FHLBanks, and our cost of financing could be adversely impacted as a result.
Any such negative information or other factors could result in the FHLBanks having to pay a higher rate of interest on COs to make them attractive to investors. If we maintain our existing pricing on our advances products and other services notwithstanding increases in CO interest rates, the spreads we earn would fall and our results of operations
would be adversely impacted. If, in response to this decrease in spreads, we change the pricing of our advances, the advances may be less attractive to members and the amount of new advances and our outstanding advance balances may decrease. In either case, the increased cost of issuing COs could adversely impact our financial condition and results of operations.
Loan modification programs could adversely impact the value of the FHLBNY’s mortgage-backed securities or our investment values in the MPF loans. Federal and state government authorities, as well as private entities such as financial institutions and the servicers of residential mortgage loans, have proposed, commenced, or promoted implementation of programs designed to provide homeowners with assistance in avoiding residential mortgage loan foreclosures. Loan modification programs, as well as future legislative, regulatory or other actions, including amendments to the bankruptcy laws, that result in the modification of outstanding mortgage loans may adversely affect the value of and the returns on our mortgage-backed securities or MPF loans under our Acquired Member Assets Programs.
Business Risks
A loss or change of business activities with large members could adversely affect the FHLBNY’s results of operations and financial condition. We have a high concentration of advances with three member institutions, and a loss or change of business activities with any of these institutions could adversely affect our results of operations and financial condition. Concentration risk for the FHLBNY is defined as the exposure to loss arising from a disproportionately large number of financial transactions with a limited number of individual customers, with a particular focus on members that have outstanding advances that account for more than 10% of advances by par value to the total par value of all advances outstanding as of a given date. For more information about concentration, see Note 21. Segment Information and Concentration to Financial Statements.
Future changes in the regulatory environment for larger members that fall into the category of a Global Systemically Important Bank, may impact our business. As an example, in November 2014, the Financial Stability Board (FSB) has defined a global standard for minimum amounts of Total Loss Absorbency Capacity (TLAC) to be held by Global Systemically Important Banks (G-SIBs), with the objective of ensuring that G-SIBs have the loss absorbing and recapitalization capacity so that critical functions continue without requiring taxpayer support or threatening financial stability. TLAC standards will begin to be phased in starting January 1, 2019 to meet certain leverage and other thresholds, which for certain G-SIBs may require changes in balance sheet management, including issuances of additional senior and Tier 2 debt. Depending on how soon the balance sheet adjustments are made, they could have an impact on our business.
Withdrawal of one or more large members from our membership could result in a reduction of our total assets, capital, and net income. If one or more of our large members were to prepay their advances or repay the advances as they came due and no other advances were made to replace them, it could also result in a reduction of our total assets, capital, and net income. In prior years, we experienced significant prepayments of advances by large members, and prepayments due to the acquisition of a member by another bank.
While our analysis of the impact of the prepayments do not indicate a material adverse impact on the FHLBank discount note pricing, given that the funds are significant sponsors of short-term FHLBank debt. Ongoing changes to the regulatory environment that affect bank counterparties and debt underwriters could adversely affect our ability to access the debt markets or the cost of that funding.
Economic downturns, macro-economic events, and changes in federal monetary policy, including those related to widespread health emergencies or similar events, could have an adverse effect on the FHLBNY’s business and its results of operations. Our businesses and results of operations are sensitive to general business and economic conditions. These conditions include short- and long-term interest rates, inflation, money supply, fluctuations in both debt and equity capital markets, and the strength of the United States economy and the local economies in which we conduct our business. If any of these conditions deteriorate, our businesses and results of operations could be adversely affected. For example, a prolonged economic downturn could result in members needing fewer advances. In addition, our business and results of operations are significantly affected by the fiscal and monetary policies of the federal government and its agencies, including the Federal Reserve Board, which regulates the supply of money and credit in the United States. The Federal Reserve Board’s policies directly and indirectly influence the yield on interest-earning assets and the cost of interest-bearing liabilities, and can have far reaching impacts on the U.S. economy as a whole.
We note here that the Federal Open Market Committee (FOMC) recently approved emergency reductions to the target range for the Federal Funds rate and implemented other initiatives in response to the COVID-19 coronavirus outbreak and the potential negative impact on the U.S. economy. Further or similar action in response to this or any widespread health emergency or similar event, or impacts on the economy as a result of such event, could adversely affect our financial condition and results of operations.
16
Regulatory Risks
The FHLBanks are governed by federal laws and regulations, which could change or be applied in a manner detrimental to FHLBNY’s operations. The FHLBanks are government-sponsored enterprises (GSEs), organized under the authority of the FHLBank Act, and, as such, are governed by federal laws and regulations of the Finance Agency, an independent agency in the executive branch of the federal government. From time to time, Congress has amended the FHLBank Act in ways that significantly affected the FHLBanks and the manner in which the FHLBanks carry out their housing finance mission and business operations. New or modified legislation enacted by Congress or regulations adopted by the Finance Agency could have a negative effect on our ability to conduct business or our cost of doing business. Due to recent changes in the U.S. government administration and recent executive actions, there are additional uncertainties in the legislative and regulatory environment.
Changes in regulatory or statutory requirements, or in their application, could result in, among other things, changes in: our cost of funds; retained earnings requirements; liquidity requirements, debt issuance; dividend payments; capital redemption and repurchases; permissible business activities; the size, scope, or nature of our lending, investment, or mortgage purchase programs; our ability to appropriately compensate, recruit and retain our employees; or our compliance costs. Changes that restrict dividend payments, the growth of our current business, or the creation of new products or services could negatively affect our results of operations and financial condition. Further, the regulatory environment affecting members could be changed in a manner that would negatively affect their ability to acquire or own our capital stock or take advantage of our products and services.
As a result of these factors, the FHLBank System may have to pay a higher rate of interest on Consolidated obligations. The resulting increase in the cost of issuing Consolidated obligations could cause our advances to be less profitable and reduce our net interest margins (the difference between the interest rate received on advances and the interest rate paid on Consolidated obligations). If we change the pricing of our advances, they may no longer be attractive to members and outstanding advances may decrease. In any case, the increased cost of issuing Consolidated obligations could negatively affect our financial condition and results of operations.
Negative information about us, the FHLBanks or housing GSEs, in general, could adversely impact our cost and availability of financing. Negative information impacting us or any other FHLBank, such as material losses or increased risk of losses, could also adversely impact our cost of funds. More broadly, negative information about housing GSEs, in general, could adversely impact us. The housing GSEs — Fannie Mae, Freddie Mac, and the FHLBanks — issue highly rated agency debt to fund their operations. From time to time, negative announcements by any of the housing GSEs concerning accounting problems, risk-management issues, and regulatory enforcement actions have created pressure on debt pricing for all GSEs, as investors have perceived such instruments as bearing increased risk. Similar announcements by the FHLBanks may contribute to this pressure on debt pricing. One possible source of information that impacts us could come from plans for housing GSE reform. Such plans, including those introduced by the U.S. Treasury and HUD proposed certain recommendations for the reform of the housing GSEs. Although the focus of those recommendations is on Fannie Mae and Freddie Mac, the proposal includes certain recommendations for the FHLBanks. The proposed reforms could affect the FHLBNY’s current business activities with its members, particularly large financial institutions. These recommendations include reducing and altering the composition of FHLBanks investment portfolios, limiting the level of advances outstanding to individual members and restricting membership to allow each financial institution, inclusive of its affiliates, to be an active member in only a single FHLBank. Other recommendations or other plans could result in market uncertainty regarding the status of U.S. federal government support of housing GSEs, in general, including the FHLBanks, and our cost of financing could be adversely impacted as a result.
Any such negative information or other factors could result in the FHLBanks having to pay a higher rate of interest on COs to make them attractive to investors. If we maintain our existing pricing on our advances products and other services notwithstanding increases in CO interest rates, the spreads we earn would fall and our results of operations would be adversely impacted. If, in response to this decrease in spreads, we change the pricing of our advances, the advances may be less attractive to members and the amount of new advances and our outstanding advance balances may decrease. In either case, the increased cost of issuing COs could adversely impact our financial condition and results of operations.
17
Business Risks
A loss or change of business activities with large members could adversely affect the FHLBNY’s results of operations and financial condition. We have a high concentration of advances with three member institutions, and a loss or change of business activities with any of these institutions could adversely affect our results of operations and financial condition. Concentration risk for the FHLBNY is defined as the exposure to loss arising from a disproportionately large number of financial transactions with a limited number of individual customers, with a particular focus on members that have outstanding advances that account for more than 10% of advances by par value to the total par value of all advances outstanding as of a given date. For more information about concentration, see Note 21. Segment Information and Concentration to Financial Statements.
Withdrawal of one or more large members from our membership could result in a reduction of our total assets, capital, and net income. If one or more of our large members were to prepay their advances or repay the advances as they came due and no other advances were made to replace them, it could also result in a reduction of our total assets, capital, and net income. In prior years, we experienced significant prepayments of advances by large members, and prepayments due to the acquisition of a member by another bank.
While our analysis of the impact of the prepayments do not indicate a material adverse impact on our business and results of operations; however, these are the types of events that we consider to be potential negative factors that may arise from a high concentration of advances. The timing and magnitude of the effect of a reduction in the amount of advances would depend on a number of factors, including:
At December 31, 2019, advances borrowed by insurance companies accounted for 24.9% of total advances (21.1% at December 31, 2018). Lending to insurance companies poses a number of unique risks not present in lending to federally insured depository institutions. For example, there is no single federal regulator for insurance companies. They are supervised by state regulators and subject to state insurance codes and regulations. There is uncertainty about whether a state insurance commissioner would try to void FHLBNY’s claims on collateral in the event of an insurance company failure. Even if ultimately unsuccessful, such a legal challenge could result in a delay in the liquidation of collateral and a loss of market value. For more information, see Financial Statements Note 9. Advances. The FHLBNY has geographic concentrations that may adversely impact its business operations and/or financial condition. By nature of our regulatory charter and our business operations, we are exposed to credit risk as the result of limited geographic diversity. Our advance lending is limited by charter to operations to the four areas — New Jersey, New York, Puerto Rico and the U.S. Virgin Islands. We employ conservative credit rating and collateral policies to limit exposure, but a decline in regional economic conditions could create an exposure to us in excess of collateral held. We have concentrations of mortgage loans in some geographic areas based on our investments in MPF loans and private-label MBS and on the receipt of collateral pledged for advances. To the extent that any of these geographic areas experiences significant declines in the local housing markets, declining economic conditions, or a natural disaster, we could experience increased losses on our investments in the MPF loans or the related MBS or be exposed to a greater risk that the pledged collateral securing related advances would be inadequate in the event of default on such an advance. The FHLBNY relies upon derivative instruments to reduce its interest-rate risk, and changes in our credit ratings may adversely affect our ability to enter into derivative instruments on acceptable terms. Our financial strategies are highly dependent on our ability to enter into derivative instruments on acceptable terms to reduce our interest-rate risk. Rating agencies may from time to time change a rating or issue negative reports, which may adversely affect our ability to enter into derivative instruments with acceptable parties on satisfactory terms in the quantities necessary to manage our interest-rate risk on Consolidated obligations or other financial instruments. This could negatively affect our financial condition and results of operations. Changes in regulatory requirements related to derivative instruments may adversely affect our ability to enter into derivative instruments on acceptable terms. The ongoing implementation of derivatives and clearinghouse regulations could adversely impact the FHLBNY’s ability to execute derivatives to hedge interest rate risk, and increase our compliance costs and negatively impact our results of operations. Such regulations have impacted, and will continue to substantially impact, the derivatives markets by, among other things: (i) requiring extensive regulatory and public reporting of derivatives transactions; (ii) requiring a wide range of over-the-counter derivatives to be cleared through recognized clearing facilities and traded on exchanges or exchange-like facilities; (iii) requiring the collection and segregation of collateral for most uncleared derivatives; and (iv) significantly broadening limits on the size of positions that may be maintained in specified derivatives. These market structure reforms could make many derivatives products more costly to execute, may significantly reduce the liquidity of certain derivatives markets and could diminish customer demand for covered derivatives. Those changes could negatively impact the FHLBNY’s ability to execute derivatives in a cost efficient manner, which could have an adverse impact on its results of operations. The FHLBNY faces competition for advances, loan purchases, and access to funding, which could adversely affect its businesses and the FHLBNY’s efforts to make advance pricing attractive to its members as well as it may adversely affect earnings. Our primary business is making advances to our members, and we compete with other suppliers of wholesale funding, both secured and unsecured, including investment banks, commercial banks and, in certain circumstances, other FHLBanks. Our members have access to alternative funding sources, which may offer more favorable terms than the ones we offer on our advances, including more flexible credit or collateral standards. We may make changes in policies, programs, and agreements affecting members from time to time, including, affecting the availability of and conditions for access to advances and other credit products, the MPF Program, the AHP, and other programs, products, and services, which could cause members to obtain financing from alternative sources. In addition, many of our competitors are not subject to the same regulations, which may enable those competitors to offer products and terms that we are not able to offer. The availability of alternative funding sources that are more attractive to our members may significantly decrease the demand for our advances. Lowering the price of the advances to compete with these alternative funding sources may decrease the profitability of advances. A decrease in the demand for our advances or a decrease in our profitability on advances could adversely affect our financial condition and results of operations. In addition, changes to regulations governing our members’ businesses that reduce liquidity or capital requirements could serve to reduce demand for advances from the FHLBNY. Certain FHLBanks, including the FHLBNY, also compete (primarily with Fannie Mae and Freddie Mac) for the purchase of mortgage loans from members. Some FHLBanks may also compete with other FHLBanks with which their members have a relationship through affiliates. We offer the MPF Program to our members. Competition among FHLBanks for MPF program business may be affected by the requirement that a member and its affiliates can sell loans into the MPF Program through only one FHLBank relationship at a time. Increased competition can result in a reduction in the amount of mortgage loans we are able to purchase and adversely impact income from this part of its business. The FHLBanks, including the FHLBNY, also compete with the U.S. Department of the Treasury, Fannie Mae, Freddie Mac, and other GSEs, as well as corporate, sovereign, and supranational entities, for funds raised through the issuance of debt in the national and global debt markets. Increases in the supply of competing debt products may, in the absence of increases in demand, result in higher debt costs or lower amounts of debt issued at the same cost than otherwise would be the case. Increased competition could adversely affect our ability to have access to funding, reduce the amount of funding available to us, or increase the cost of funding available to us. Any of these effects could adversely affect our financial condition and results of operations. 19 Credit Risks Changes in the credit ratings on FHLBank System Consolidated obligations may adversely affect the cost of Consolidated obligations, which could adversely affect FHLBNY’s financial condition and results of operations. FHLBank System Consolidated obligations have been assigned Aaa/P-1 and AA+/A-1+ ratings by Moody’s and S&P. The outlook for the FHLBank debt by both S&P and Moody’s is stable. Rating agencies may from time to time change a rating or issue negative reports, which may adversely affect the cost of funds of one or more FHLBanks, including the FHLBNY, and the ability to issue Consolidated obligations on acceptable terms. A higher cost of funds or the impairment of the ability to issue Consolidated obligations on acceptable terms could also adversely affect our financial condition and results of operations. Rating agency downgrades of the debt of the United States could also cause a downgrade in the rating of the FHLBanks. The FHLBNY’s financial condition and results of operations could be adversely affected by FHLBNY’s exposure to credit risk. We have exposure to credit risk in that the market value of an obligation may decline as a result of deterioration in the creditworthiness of the obligor or the credit quality of a security instrument. In addition, we assume secured and unsecured credit risk exposure associated with the risk that a borrower or counterparty or a derivative clearing organization could default and we could suffer a loss if we could not fully recover amounts owed to us on a timely basis. A credit loss, if material, will have an adverse effect on the FHLBNY’s financial condition and results of operations. We are subject to credit-risk exposures related to the loans that back our investments. Increased delinquency rates and credit losses beyond those currently expected could adversely impact the yield on or value of those investments. We have invested in securities issued by Housing Finance Agencies (HFA) as held-to-maturity investments. The cash flows on these securities are based on the performance of the underlying loans, although these securities generally do include additional credit enhancements. At the time of purchase, the HFA securities were rated double-A (or its equivalent rating), some have since been downgraded. The portfolio of HFA securities (carrying value was $1.1 billion at December 31, 2019 and $1.2 billion at December 31, 2018) reported gross unrealized losses of $23.2 million at December 31, 2019 and $24.2 million at December 31, 2018. Although we have determined that none of the securities is other-than-temporarily impaired, we could realize credit losses from these securities should the underlying loans underperform our projections. A rise in delinquency rates on our investments in MPF loans or related adverse trends could adversely impact our results of operation and financial condition.As discussed in Item 7. Management’s Discussion and Analysis of Financial Condition and Results of Operations — Financial Condition, our methodology for determining our allowance for loan losses is determined based on our investments in MPF loans and considers factors relevant to those investments. Important factors in determining this allowance are the collateral values supporting our investments in conventional mortgage loans. The credit loss allowance may prove insufficient if macroeconomic factors worsen, housing prices fall and collateral values decline. While we have recorded reserves for credit exposures, such reserves are subject to judgments and estimates that could be incorrect or differ from actual future events. Under the new CECL accounting standard, which became effective January 1, 2020, the allowance for credit losses would reflect expected losses, rather than incurred losses, which could lead to more volatility in the allowance and the provision for credit losses as forecasts of economic conditions change. Insufficient collateral protection could adversely affect the FHLBNY’s financial condition and results of operations. We require that all outstanding advances be fully collateralized. In addition, for mortgage loans that we purchased under the MPF Program, we require that members fully collateralize the outstanding credit enhancement obligations not covered through the purchase of supplemental mortgage insurance. We evaluate the types of collateral pledged by our members and assign borrowing capacities to the collateral based on the risks associated with that type of collateral. If we have insufficient collateral before or after an event of payment default by the member, or we are unable to liquidate the collateral for the value assigned to it in the event of a payment default by a member, we could experience a credit loss on advances, which could adversely affect our financial condition and results of operations. The FHLBNY may become liable for all or a portion of the Consolidated obligations of the FHLBanks, which could negatively impact the FHLBNY’s financial condition and results of operations. We are jointly and severally liable along with the other FHLBanks for the Consolidated obligations issued through the Office of Finance. Dividends on, redemption of, or repurchase of shares of our capital stock are not permitted unless the principal and interest due on all Consolidated obligations have been paid in full. If another Federal Home Loan Bank were to default on its obligation to pay principal or interest on any Consolidated obligations, the Finance Agency may allocate the outstanding liability among one or more of the remaining FHLBanks on a pro rata basis or on any other basis the Finance Agency may determine. As a result, our ability to pay dividends on, to redeem, or to repurchase shares of capital stock could be affected by the financial condition of one or more of the other FHLBanks. However, no FHLBank has ever defaulted on its debt and no FHLBank has ever been asked to assume the debt payments of another FHLBank since the FHLB System was established in 1932. Liquidity Risks The FHLBNY may not be able to meet its obligations as they come due or meet the credit and liquidity needs of its members in a timely and cost-effective manner. We seek to be in a position to meet our members’ credit and liquidity needs and pay our obligations without maintaining excessive holdings of low-yielding liquid investments or being forced to incur unnecessarily high borrowing costs. In addition, we maintain a contingent liquidity plan designed to enable us to meet our obligations and the liquidity needs of members in the event of operational disruptions or short-term disruptions in the capital markets. Liquidity Regulations addressing liquidity requirements are in place for the Federal Home Loan Banks, and compliance with these regulations are closely monitored by our management and Board of Directors. However, our ability to manage our liquidity position or our contingent liquidity plan may not enable us to meet our obligations and the credit and liquidity needs of our members, which could have an adverse effect on our financial condition and results of operations. Operational Risks The FHLBNY relies heavily on information systems and other technology. We rely heavily on information systems and other technology to conduct and manage our business. We have implemented a business continuity plan that includes the maintenance of alternate sites for data processing and office functions. All critical systems are tested annually for recovery readiness and all business units update and test their respective disaster recovery plans annually. If we were to experience a failure or interruption in any of these systems or other technology and our disaster recovery capabilities were also impacted, it would affect our ability to conduct and manage our business effectively, including advance and hedging activities. This may adversely affect member relations, risk management, and negatively affect our financial condition and results of operations. Continually evolving cybersecurity or other technological risks could result in the disclosure of confidential client or customer information, damage to the FHLBNY’s reputation, additional costs to the FHLBNY, regulatory penalties and financial losses. A significant portion of FHLBNY’s operations relies heavily on the secure processing, storage and transmission of financial and other information. The FHLBNY’s computer systems, software and networks are subject to similar vulnerabilities as other companies highly reliant on technology for operational processing. These risks include unauthorized access, loss or destruction of data, unavailability of service, computer viruses or other malicious code, cyber-attacks and other events. These threats may derive from human error, fraud or malice on the part of employees or third parties, or may result from accidental technological failure. If one or more of these events occurs, it could result in the disclosure of confidential information, damage to FHLBNY’s reputation with its customers, additional costs to the FHLBNY (such as repairing systems or adding new personnel or protection technologies), regulatory penalties and financial losses to the FHLBNY. Such events could also cause interruptions or malfunctions in the operations of the FHLBNY data systems (such as the lack of availability of FHLBNY’s online advance transaction system with members). 21 Deteriorating market conditions increase the risk that the FHLBNY’s models may produce unreliable results. We use market-based information as inputs to our financial models, which are used in making operational decisions and to derive estimates for use in our financial reporting processes. The downturn in the housing and mortgage markets created additional risk regarding the reliability of the models, particularly since the models are regularly adjusted in response to rapid changes in the actions of consumers and mortgagees to changes in economic conditions. This may increase the risk that our models could produce unreliable results or estimates that vary widely or prove to be inaccurate. The departure of key personnel could adversely impact the Bank’s operations. We rely on key personnel for many of our functions. Our success in retaining such personnel is important to our ability to conduct our operations and measure and maintain risk and financial controls. The ability to retain key personnel could be challenged as the U.S. employment market improves. We maintain a succession planning program in which we attempt to identify and develop employees who can potentially replace key personnel in the event of their departure, whether due to resignation or normal retirement. A natural disaster or similar event in the Bank’s region, or with widespread impacts, could adversely affect the Bank’s profitability and financial condition. A severe natural disaster could damage the Bank’s physical infrastructure and have an adverse effect on the FHLBNY’s business. Furthermore, portions of the Bank’s region are subject to risks from hurricanes, tornadoes, floods or other natural disasters. These natural disasters could damage or dislocate the facilities of the Bank’s members, may damage or destroy collateral that members have pledged to secure advances, may adversely affect the viability of the Bank’s mortgage purchase programs or the livelihood of borrowers of the Bank’s members, or otherwise could cause significant economic dislocation in the affected areas of the Bank’s region. Additionally, the impact of widespread health emergencies, such as the recent outbreak of the COVID-19 coronavirus, which has now spread to many countries around the world, including the United States, could adversely impact the FHLBNY’s financial condition and results of operations. If a widespread health emergency leads to a situation that impacts the FHLBNY’s employees or vendors, the FHLBNY’s members, the borrowers of the FHLBNY’s members, and/or economic growth generally, the Bank’s financial condition and results of operations could be adversely affected. The Bank notes here in particular that, as of the date of the filing of this Annual Report on Form 10-K, the full effects of the COVID-19 coronavirus are evolving and unknowable. The rapid and diffuse spread of COVID-19 has had severe negative impacts on, among other things, financial markets, liquidity, economic conditions and trade and could continue to do so or could worsen for an unknown period of time, which could in turn have a material adverse impact on our results of operations or financial condition. The timeliness and effectiveness of actions taken or not taken to contain and mitigate the effects of COVID-19 both in the U.S. and internationally by governments, central banks, healthcare providers, health system participants, other businesses and individuals could greatly affect outcomes. There are many current and potential issues, and we cannot predict them all or the extent to which they will affect the Bank and its business. By March 16, 2020, the majority of our employees were working remotely, with only operationally critical employees working on site at our offices. Failures of critical vendors and other third parties could disrupt the Banks’ ability to conduct and manage its businesses. We rely on vendors and other third parties to perform certain critical services. A failure in, or an interruption to, one of more of those services could adversely affect the business operations of the Bank. The use of vendors and other third parties also exposes the Bank to the risk of loss of confidential information or other harm. To the extent that vendors do not conduct their activities under appropriate standards, the Bank could also be exposed to reputational risk. 22 Item 1B Not applicable. At December 31, 2019, we occupied approximately 73,294 square feet of leased office space at 101 Park Avenue, New York, New York as the Bank’s headquarters, 52,041 square feet of leased office space in Jersey City, New Jersey, principally as an operations center, and 2,521 square feet of leased office space in Washington, D.C. From time to time, the FHLBNY is involved in disputes or regulatory inquiries that arise in the ordinary course of business. At the present time, there are no pending claims against the FHLBNY that, if established, are reasonably likely to have a material effect on the FHLBNY’s financial condition, results of operations or cash flows or that are otherwise reasonably likely to be material to the FHLBNY. Item 4. Not applicable. Item 5. All of the capital stock of the FHLBNY, which is issued only at a par value of $100 per share, is owned by our members. Stock may also be held by former members as a result of having been acquired by a non-member institution. We conduct our business in advances and mortgages exclusively with stockholder members and housing associates (1). There is no established marketplace for FHLBNY stock as FHLBNY stock is not publicly traded. It may be redeemed at par value upon request, subject to regulatory limits. These shares of stock in the FHLBNY are registered under the Securities Exchange Act of 1934, as amended. At December 31, 2019, we had 328 members who held 57,786,659 shares of capital stock between them. At December 31, 2019, former members held 51,295 shares. At December 31, 2018, we had 328 members who held 60,657,989 shares of capital stock between them. At December 31, 2018, former members held 58,450 shares. Capital stock held by former members is classified as a liability, and deemed to be mandatorily redeemable under the accounting guidance for certain financial instruments with characteristics of both liabilities and equity. Our recent quarterly cash dividends are outlined in the table below. No dividends were paid in the form of stock. Dividend payments and earnings retention are subject to be determined by our Board of Directors, at its discretion, and within the regulatory framework promulgated by the Finance Agency. Our Retained Earnings and Dividends Policy outlined in the section titled Retained Earnings and Dividends under Part I, Item 1 of this Annual Report on Form 10-K provides additional information. Dividends from a calendar quarter’s earnings are paid(a) subsequent to the end of that calendar quarter as summarized below. Dividend payments reported below are on Class B Stock, which includes payments to non-members on capital stock reported as mandatorily redeemable capital stock in the Statements of Condition (dollars in thousands): Issuer Purchases of Equity Securities We are exempt from disclosures of unregistered sales of common equity securities or securities issued through the Office of Finance that otherwise would have been required under Item 701 of the SEC’s Regulation S-K. By the same no-action letter, we are also exempt from disclosure of securities repurchases by the issuer that otherwise would have been required under Item 703 of Regulation S-K. 24 2018 2017 2016 Month Paid Amount Dividend Rate Amount Dividend Rate Amount Dividend Rate November $ 107,373 6.90 % $ 97,005 6.00 % $ 71,991 5.00 % August 103,573 6.75 85,449 5.50 65,437 4.75 May 105,329 6.50 76,646 5.00 61,535 4.50 February 102,484 6.50 87,638 5.65 61,572 4.65 $ 418,759 (b) $ 346,738 (b) $ 260,535 (b) Item 6. Note — Average balance calculation. For most components of the average balances, a daily weighted average balance is calculated for the period. When daily weighted average balance information is not available, a simple monthly average balance is calculated. Statements of Condition Years ended December 31, (dollars in millions) 2018 2017 2016 2015 2014 Investments (a) $ 35,741 $ 33,069 $ 30,939 $ 26,167 $ 25,201 Advances 105,179 122,448 109,257 93,874 98,797 Mortgage loans held-for-portfolio, net of allowance for credit losses (b) 2,927 2,897 2,747 2,524 2,129 Total assets 144,381 158,918 143,606 123,239 132,825 Deposits and borrowings 1,063 1,196 1,241 1,350 1,999 Consolidated obligations, net Bonds 84,154 99,288 84,785 67,716 73,536 Discount notes 50,640 49,614 49,358 46,850 50,044 Total consolidated obligations 134,794 148,902 134,143 114,566 123,580 Mandatorily redeemable capital stock 6 20 31 19 19 AHP liability 162 132 125 113 114 Capital Capital stock 6,066 6,750 6,308 5,585 5,580 Retained earnings Unrestricted 1,103 1,067 1,029 967 863 Restricted 591 479 383 303 220 Total retained earnings 1,694 1,546 1,412 1,270 1,083 Accumulated other comprehensive loss (13 ) (55 ) (96 ) (136 ) (137 ) Total capital 7,747 8,241 7,624 6,719 6,526 Equity to asset ratio (c) 5.37 % 5.19 % 5.31 % 5.45 % 4.91 % Statements of Condition Years ended December 31, Averages (See note below; dollars in millions) 2018 2017 2016 2015 2014 Investments (a) $ 43,370 $ 36,835 $ 29,337 $ 26,944 $ 28,233 Advances 107,971 109,188 96,201 91,401 93,550 Mortgage loans held-for-portfolio, net of allowance for credit losses 2,899 2,838 2,631 2,362 1,989 Total assets 154,795 149,581 129,260 122,155 125,632 Interest-bearing deposits and other borrowings 1,032 1,768 1,431 1,213 1,705 Consolidated obligations, net Bonds 93,529 93,352 73,174 69,177 76,580 Discount notes 51,657 45,895 46,508 43,628 38,713 Total consolidated obligations 145,186 139,247 119,682 112,805 115,293 Mandatorily redeemable capital stock 14 22 24 19 22 AHP liability 147 123 114 107 117 Capital Capital stock 6,166 6,259 5,712 5,299 5,530 Retained earnings Unrestricted 1,076 1,019 977 875 840 Restricted 532 423 337 252 186 Total retained earnings 1,608 1,442 1,314 1,127 1,026 Accumulated other comprehensive loss 16 (86 ) (181 ) (149 ) (108 ) Total capital 7,790 7,615 6,845 6,277 6,448 Operating Results and Other Data (dollars in millions) (except earnings and dividends per December 31, share, and headcount) 2018 2017 2016 2015 2014 Net income $ 560 $ 479 $ 401 $ 415 $ 315 Net interest income (d) 797 722 556 554 444 Dividends paid in cash (e) 417 345 259 228 231 AHP expense 62 53 45 46 35 Return on average equity (f)(i) 7.20 % 6.30 % 5.86 % 6.61 % 4.88 % Return on average assets (i) 0.36 % 0.32 % 0.31 % 0.34 % 0.25 % Other non-interest (loss) income (24 ) (58 ) 7 25 6 Operating expenses (g) 127 112 (j) 99 (j) 103 86 Finance Agency and Office of Finance expenses 16 15 13 14 14 Total other expenses (k) 151 131 115 117 100 Operating expenses ratio (h)(i)(j) 0.08 % 0.07 %(j) 0.08 % 0.08 % 0.07 % Earnings per share $ 9.09 $ 7.66 $ 7.02 $ 7.83 $ 5.69 Dividends per share $ 6.66 $ 5.54 $ 4.73 $ 4.22 $ 4.19 Headcount (Full/part time) 314 308 280 273 258 Supplementary financial data for each quarter for the years ended December 31, 2019 and 2018 Interim period— Infrequently occurring items recognized. 2019 Net income declined after the first quarter primarily due to lower net interest income, which was impacted by price reductions on advances effective January 1, 2019 and higher funding cost through most of 2019. 2018 4th Quarter (b) 3rd Quarter 2nd Quarter 1st Quarter (a) Interest income $ 962,673 $ 964,877 $ 888,289 $ 770,645 Interest expense 777,089 754,160 680,584 577,626 Net interest income 185,584 210,717 207,705 193,019 Provision (Reversal) for credit losses on mortgage loans 32 (95 ) 72 (380 ) Other income (loss) (5,108 ) 506 (676 ) (18,593 ) Other expenses and assessments 57,777 54,906 51,783 48,581 Net other expenses 62,917 54,305 52,531 66,794 Net income $ 122,667 $ 156,412 $ 155,174 $ 126,225 2017 4th Quarter 3rd Quarter 2nd Quarter 1st Quarter (c) Interest income $ 646,804 $ 616,115 $ 519,997 $ 459,387 Interest expense 455,382 435,576 343,883 285,938 Net interest income 191,422 180,539 176,114 173,449 Provision (Reversal) for credit losses on mortgage loans (3 ) (183 ) 200 (301 ) Other income (loss) 5,986 692 1,102 (65,783 ) Other expenses and assessments 52,162 47,672 46,103 38,402 Net other expenses 46,173 46,797 45,201 103,884 Net income $ 145,249 $ 133,742 $ 130,913 $ 69,565 Item 7. Forward-Looking Statements Statements contained in this Annual Report on Form 10-K, including statements describing the objectives, projections, estimates, or predictions of the Federal Home Loan Bank of New York (“we” “us,” “our,” “the Bank” or the “FHLBNY”) may be “forward-looking statements” within the meaning of Section 27A of the Securities Act of 1933 and Section 21E of the Securities Exchange Act of 1934. These statements may use forward-looking terminology, such as “anticipates,” “believes,” “could,” “estimates,” “may,” “should,” “will,” or other variations on these terms or their negatives. The Bank cautions that, by their nature, forward-looking statements are subject to a number of risks or uncertainties, including the Risk Factors set forth in Item 1A and the risks set forth below, and that actual results could differ materially from those expressed or implied in these forward-looking statements. As a result, you are cautioned not to place undue reliance on such statements. These forward-looking statements speak only as of the date they were made, and the Bank does not undertake to update any forward-looking statement herein. Forward-looking statements include, among others, the following: Actual results may differ from forward-looking statements for many reasons, including, but not limited to, the risk factors set forth in Item 1A - Risk Factors and the risks set forth below: Risks and other factors could cause actual results of the Bank to differ materially from those implied by any forward-looking statements. These risk factors are not exhaustive. The Bank operates in changing economic and regulatory environments, and new risk factors will emerge from time to time. Management cannot predict such new risk factors nor can it assess the impact, if any, of such new risk factors on the business of the Bank or the extent to which any factor, or combination of factors, may cause actual results to differ materially from those implied by any forward-looking statements. Organization of Management’s Discussion and Analysis (MD&A). This MD&A is designed to provide information that will assist the readers in better understanding our financial statements, the changes in key items in our financial statements from year to year, the primary factors driving those changes as well as how accounting principles affect our financial statements. The MD&A is organized as follows: Page Table(s) Description Page(s) Selected Financial Data 23 - 24 1.1 Market Interest Rates 33 2.1 Financial Condition 42 3.1 - 3.9 Advances 46 - 50 4.1 - 4.7 Investments 51 - 55 5.1 - 5.3 Mortgage Loans 56 - 57 6.1 - 6.9 Consolidated Obligations 59 - 63 6.10 FHLBNY Ratings 63 7.1 - 7.3 Capital 64 - 65 8.1 - 8.5 Derivatives 65 - 68 9.1 - 9.3 Liquidity 69 - 70 9.4 Short Term Debt 72 9.5 - 9.6 FHFA MBS Limits and Core Mission Achievement 72 - 73 10.1 - 10.14 Results of Operations 74 - 90 11.1 Assessments 91 Executive Overview Trends in the Financial Markets MD&A TABLE REFERENCE 30 This overview of management’s discussion and analysis highlights selected information and may not contain all of the information that is important to readers of this Form 10-K. For a more complete understanding of events, trends and uncertainties, as well as the liquidity, capital, credit and market risks, and critical accounting estimates, affecting the Federal Home Loan Bank of New York (FHLBNY or Bank), this Form 10-K should be read in its entirety. Cooperative business model. As a cooperative, we seek to maintain a balance between our public policy mission and our ability to provide adequate returns on the capital supplied by our members. We achieve this balance by delivering low-cost financing to members to help them meet the credit needs of their communities and also by paying a dividend on members’ capital stock. Our financial strategies are designed to enable us to expand and contract in response to member credit needs. By investing capital in high-quality, short- and medium-term financial instruments, we maintain sufficient liquidity to satisfy member demand for short- and long-term funds, repay maturing Consolidated obligations, and meet other obligations. The dividends we pay are largely the result of earnings on invested member capital, net earnings on advances to members, mortgage loans and investments, offset in part by operating expenses and assessments. Our Board of Directors and Management determine the pricing of member credit and dividend policies based on the needs of our members and the cooperative. Business segment. We manage our operations as a single business segment. Advances to members are our primary focus and the principal factor that impacts our operating results. Net income — Net income for 2019 was $472.6 million, a decrease of $87.9 million, or 15.7%, compared to 2018. Summarized below are the primary components of our Net income: Net interest income — 2019 Net interest income declined by $129.9 million, or 16.3% from the prior year. Our net interest income is impacted by the overall level of market interest rates and by the spread between costing yields on debt and the yields earned on advances, mortgage-backed securities, other investments, and other interest earning assets. The decline in net interest income and margin was due to three primary factors. Lower advances balances negatively impacted net interest income. The funding environment was generally less favorable, resulting in a higher cost of funding on a spread basis. Finally, management’s decision to lower advances pricing spreads for 2019 reduced yields and revenues. In 2019, we stopped acquiring LIBOR-indexed floating-rate MBS as a policy decision to restrain growth of LIBOR assets. Acquisition of fixed-rate MBS was constrained due to tight pricing and relatively lower yields. Typically, the revenue streams from MBS is a significant source of net income, second only to revenues from advances, and the constraints have also had a negative impact on margins, spreads and revenues. Increased investments in U.S. Treasury securities for liquidity management purposes and overnight repurchase agreements made a positive contribution to net interest income, although margins were quite low. In summary, volume-related declines in assets and funding mix made a negative impact of $32.4 million in 2019. Average interest-earning assets totaled $144.6 billion in 2019, compared to $154.1 billion last year. Yield related changes resulted in a decline of $97.5 million in 2019. Net interest spread, which is the yield from earning assets minus interest paid to fund earning assets, was 35 basis points in 2019, compared to 42 basis points in 2018. The impact of net interest settlements (interest accruals) on swaps hedging assets and liabilities under ASC 815 have remained favorable to net interest income. Swap interest settlements made a favorable contribution of $162.8 million to interest accruals in the current year, compared to $144.4 million in the prior year. Other income (loss) — In 2019, Other income (loss) reported a gain of $33.9 million, in contrast to a loss of $23.9 million last year. The more significant components are noted below. Liquidity “trading” securities — Portfolio of U.S. Treasury securities held for liquidity reported net gains of $51.3 million and $3.2 million in 2019 and 2018. Gains were primarily valuation gains, fixed-rate securities benefiting from higher volume (balance increased by $10.0 billion) and a declining interest rate environment. As an offset, fair values of swaps in economic hedges of fixed-rate U.S. Treasury securities reported losses of $33.2 million and $1.7 million in 2019 and 2018. Market value gains and losses on grantor trust — Equity and bond mutual funds held in grantor trust to fund certain payments to retirees participating in non-qualified retirement plans, reported net valuation gains of $9.8 million in 2019, compared to a net loss of $4.8 million in 2018. Other expenses were $176.0 million in 2019, compared to $150.7 million in 2018, a year-over-year increase of $25.3 million, or 16.8%. Other expenses are primarily Operating expenses, Compensation and benefits, and our share of expenses of the Office of Finance and the Federal Housing Finance Agency. Operating expenses were $62.8 million in 2019, up from $47.9 million in 2018; the increase was primarily due to professional and consulting expenses incurred as part of several multi-year technology initiatives. Compensation and benefits expenses were $88.2 million in 2019, up from $79.0 million in 2018; the increase was primarily due to increased hiring of technology-related staff. Affordable Housing Program Assessments (AHP)allocated from Net income were $52.6 million and $62.4 million in 2019 and 2018. Assessments are calculated as a percentage of Net income, and changes in allocations were in parallel with changes in Net income. Dividend payments — Four quarterly cash dividends were paid in 2019 for a total of $6.49 per share of capital, compared to $6.66 per share of capital paid in 2018. Financial Condition — December 31, 2019 compared to December 31, 2018 Total assets increased to $162.1 billion at December 31, 2019 from $144.4 billion at December 31, 2018, an increase of $17.7 billion, or 12.3%. Money market investments atDecember 31, 2019 were $8.6 billion in federal funds sold and $15.0 billion in overnight resale agreements. At December 31, 2018, money market investments were $7.6 billion in federal funds sold and $4.1 billion in overnight resale agreements. Advances— Par balances decreased at December 31, 2019 to $100.4 billion, compared to $105.4 billion at December 31, 2018. Short-term fixed-rate advances increased by 62.7% to $24.4 billion at December 31, 2019, up from $15.0 billion at December 31, 2018. ARC advances, which are adjustable-rate borrowings, decreased by 29.9% to $16.4 billion at December 31, 2019, compared to $23.3 billion at December 31, 2018. Overnight advances decreased by 55.9% to $3.4 billion at December 31, 2019, compared to $7.7 billion at December 31, 2018. Long-term investment debt securities— Long-term investment debt securities are designated as available-for-sale (AFS) or held-to-maturity (HTM). The heavy concentration of GSE and Agency issued (GSE-issued) securities, and a declining balance of private-label MBS, less than 1%, is our investment profile. In the AFS portfolio, long-term investments in floating-rate GSE-issued mortgage-backed securities were carried on the balance sheet at fair values of $344.0 million at December 31, 2019 and $422.2 million at December 31, 2018. Long-term investments in fixed-rate GSE-issued mortgage-backed securities were carried on the balance sheet at fair values of $2.3 billion at December 31, 2019. There were no fixed-rate MBS at December 31, 2018 in the AFS portfolio. In the HTM portfolio, long-term investments at December 31, 2019 were predominantly GSE-issued fixed- and floating-rate MBS and housing finance agency bonds. Securities in the HTM portfolio are recorded at amortized cost. Fixed- and floating-rate mortgage-backed securities in the HTM portfolio totaled $14.1 billion and $16.3 billion at December 31, 2019 and 2018. Investments in housing finance agency bonds, primarily New York and New Jersey, were $1.1 billion and $1.2 billion at December 31, 2019 and 2018. Investments in private-label MBS were less than 1% of the HTM portfolio. Trading securities (liquidity portfolio)— The objective of the trading portfolio is to meet short-term contingency liquidity needs. In 2019, we continued to invest in highly liquid U.S. Treasury securities. Trading investments are carried at fair value, with changes recorded through earnings. At December 31, 2019, trading investments were $15.3 billion in U.S. Treasury securities and $3.2 million in Ambac corporate notes. At December 31, 2018, trading investments were $5.3 billion in U.S. Treasury securities, $502.8 million in GSE securities and $3.3 million in Ambac corporate notes. We will periodically evaluate our liquidity needs and may add to or dispose these liquidity investments as deemed prudent based on liquidity and market conditions. The Finance Agency prohibits speculative trading practices but allows permitted securities to be deemed held for liquidity if invested in a trading portfolio. Equity Investments— We own a grantor trust that invests in highly-liquid registered mutual funds, which were reclassified as of January 1, 2018 from AFS to Equity Investments to conform to the adoption of a new accounting standard. These investments were carried on the balance sheet at fair values of $60.0 million at December 31, 2019 and $48.2 million at December 31, 2018. Mortgage loans held-for-portfolio — Mortgage loans were investments in Mortgage Partnership Finance loans (MPF or MPF Program). Unpaid principal balance of MPF loans stood at $3.1 billion at December 31, 2019, an increase of $244.3 million from the balance at December 31, 2018. Capital ratios — Our capital position remains strong. At December 31, 2019, actual risk-based capital was $7.6 billion, compared to required risk-based capital of $1.1 billion. To support $162.1 billion of total assets at December 31, 2019, the minimum required total capital was $6.5 billion or 4.0% of assets. Our actual regulatory risk-based capital was $7.6 billion, exceeding required total capital by $1.1 billion. These ratios have remained consistently above the required regulatory ratios through all periods in this report. For more information, see financial statements, Note 14. Capital Stock, Mandatorily Redeemable Capital Stock and Restricted Retained Earnings. Liquidity— Our liquidity position remains strong and in compliance with all regulatory requirements. We do not foresee any changes to that position. In addition to the liquidity trading portfolio discussed previously, liquid assets at December 31, 2019 included $597.6 million as demand cash balances at the Federal Reserve Bank of New York, $23.6 billion in short-term and overnight loans in the federal funds and the repo markets, and $2.7 billion of high credit quality GSE-issued available-for-sale securities that are investment quality, and readily marketable. The Finance Agency’s Liquidity Advisory Bulletin 2018-07 has communicated to the FHLBanks specific initial liquidity levels to be maintained within certain ranges in an accompanying supervisory letter.We also have other regulatory liquidity measures in place, deposit liquidity and operational liquidity, and other liquidity buffers. We remain in compliance with the Advisory Bulletin and all liquidity regulations. For more information about the Advisory Bulletin and our liquidity measures, see section Liquidity, Short-Term Borrowings and Short-Term Debt, and Tables 9.1 through Table 9.3 in this MD&A. Other Developments Replacement of London Interbank Offered Rates (LIBOR) — On September 27, 2019, the FHFA, our regulator issued a supervisory letter that directed the Federal Home Loan Banks to cease under certain time frames entering into new LIBOR referenced instruments with maturities beyond December 31, 2021. As noted throughout this report, much of the FHLBNY’s assets, liabilities and derivatives are indexed to LIBOR. We have created a program that focuses on achieving an orderly transition from LIBOR to SOFR as the alternative risk-free reference rate for us and to enable us to offer SOFR-linked advances to our members. For more information, see discussions on Market and Economic Risks in Item 1A. Risk Factor in this MD&A. Rating— The U.S. Government’s credit is rated by Moody’s as Aaa with the outlook as stable, and AA+ and stable by Standard & Poor’s (S&P). Consolidated obligations of FHLBanks are rated Aaa/P-1 by Moody’s, and AA+/A- 1+ by S& P. Any rating actions on the US Government would likely result in all individual FHLBanks’ long-term deposit ratings and the FHLBank System long-term bond rating moving in lock step with any US sovereign rating action. Trends in the Financial Markets Conditions in Financial Markets. The primary external factors that affect net interest income are market interest rates and the general state of the economy. The following table presents changes in key rates over the course of 2019 and 2018 (rates in percent): Table1.1: Market Interest Rates December 31, 2018 2017 2018 2017 Average Average Ending Rate Ending Rate Federal Funds Target Rate 1.91 % 1.10 % 2.50 % 1.50 % Federal Funds Effective Rate (a) 1.83 1.00 2.40 1.33 1-Month LIBOR 2.02 1.11 2.50 1.56 3-Month LIBOR 2.31 1.26 2.81 1.69 2-Year U.S.Treasury 2.52 1.40 2.49 1.89 5-Year U.S.Treasury 2.74 1.91 2.51 2.20 10-Year U.S.Treasury 2.91 2.33 2.68 2.40 15-Year Residential Mortgage Note Rate 3.82 3.10 3.76 3.20 30-Year Residential Mortgage Note Rate 4.44 3.88 4.51 3.85 Impact of general level of interest rates on the FHLBNY. The level of interest rates during a reporting period impacts our profitability, due primarily to the relatively shorter-term structure of earning assets and the impact of interest rates on invested capital. We invest in Federal funds sold and repurchase agreements that typically are overnight investments. We also use derivatives to effectively change the repricing characteristics of a significant proportion of our advances and Consolidated obligation debt to match shorter-term LIBOR rates or overnight indices (Federal funds effective rate and SOFR) that reprice at intervals of three month or as frequently as daily. Consequently, the current level of short-term interest rates, as represented by the overnight Federal funds target rate, the overnight SOFR, and the 3-month LIBOR rate, has an impact on profitability. The level of interest rates also directly affects our earnings on invested capital. Compared to other banking institutions, we operate at comparatively low net spreads between the yield we earn on assets and the cost of our liabilities. Therefore, we generate a relatively higher proportion of our income from the investment of member-supplied capital at the average asset yield. As a result, changes in asset yields tend to have a greater effect on our profitability than they do on the profitability of other banking institutions. In summary, our average asset yields and the returns on capital invested in these assets largely reflect the short-term interest rate environment because the maturities of our assets are generally short-term in nature, have rate resets that reference short-term rates, or have been hedged with derivatives in which a short-term or overnight rate is received. Changes in rates paid on Consolidated obligations and the spread of these rates relative to LIBOR, SOFR, and the Federal funds rate or to U.S. Treasury securities may also impact profitability. The rates and prices at which we are able to issue Consolidated obligations, and their relationship to other products such as Treasury securities, change frequently and are affected by a multitude of factors including: overall economic conditions; volatility of market prices, rates, and indices; the level of interest rates and shape of the Treasury curve; the level of asset swap rates and shape of the swap curve; supply from other issuers (including GSEs such as Fannie Mae and Freddie Mac, supra/sovereigns, and other highly-rated borrowers); the rate and price of other products in the market such as mortgage-backed securities, repurchase agreements, and commercial paper; investor preferences; the total volume, timing, and characteristics of issuance by the FHLBanks; the amount and type of advance demand from our members; political events, including legislation and regulatory action; press interpretations of market conditions and issuer news; the presence of inflation or deflation; and actions by the Federal Reserve. Recently Issued Accounting Standards and Interpretations and Significant Accounting Policies and Estimates. Recently issued Accounting Standards and Interpretations For a discussion of recently issued accounting standards and interpretations, see financial statements, Note 2. FASB Standards Issued But Not Yet Adopted. Significant Accounting Policies and Estimates We have identified certain accounting policies that we believe are significant because they require management to make subjective judgments about matters that are inherently uncertain and because of the likelihood that materially different amounts would be reported under different conditions or by using different assumptions. These policies include estimating fair values of certain assets and liabilities, evaluating the impairment of our securities portfolios, estimating the allowance for credit losses on the advance and mortgage loan portfolios, and accounting for derivatives and hedging activities. We have discussed each of these significant accounting policies, the related estimates and its judgment with the Audit Committee of the Board of Directors. For additional discussion regarding the application of these and other accounting policies, see financial statements, Note 1. Significant Accounting Policies and Estimates. Fair Value Measurements and Disclosures The accounting standards on fair value measurements and disclosures discuss how entities should measure fair value based on whether the inputs to those valuation techniques are observable or unobservable. Fair value is defined as the price that would be received to sell an asset or paid to transfer a liability in an orderly transaction in the principal or most advantageous market for the asset or liability between market participants at the measurement date. This definition is based on an exit price rather than transaction or entry price. The FHLBNY complied with the accounting guidance on fair value measurements and disclosures and has established a hierarchy for inputs used in measuring fair value that maximizes the use of observable inputs and minimizes the use of unobservable inputs by requiring that the most observable inputs be used when available. Observable inputs are inputs that market participants would use in pricing the asset or liability, and would be based on market data obtained from independent sources. Unobservable inputs are inputs that reflect our assumptions about the parameters market participants would use in pricing the asset or liability, and would be based on the best information available in the circumstances. Our pricing models are subject to periodic validations, and we periodically review and refine, as appropriate, our assumptions and valuation methodologies to reflect market indications as closely as possible. We have the appropriate personnel, technology, and policies and procedures in place to value our financial instruments in a reasonable and consistent manner and in accordance with established accounting policies. Valuation of Financial Instruments — The following assets and liabilities, including those for which the FHLBNY has elected the fair value option, were carried at fair value on the Statement of Condition as of December 31, 2019: government securities. We classify trading securities as Level 2 of the fair value hierarchy when we use quoted market prices in less active markets to determine the fair value of trading securities. Provision for Credit Losses The FASB issued ASU 2016-13,Financial Instruments—Credit Losses (Topic 326), which became effective for the Bank as of January 1, 2020. The adoption of this guidance established a single allowance framework for all financial assets carried at amortized cost, including advances, loans, held-to-maturity securities, other receivables and certain off-balance sheet credit exposures. For available-for-sale securities where fair value is less than cost, credit related impairment, if any, will be recognized in an allowance for credit losses and adjusted each period for changes in expected credit risk. This framework requires that management’s estimate reflects credit losses over the full remaining expected life and considers expected future changes in macroeconomic conditions. At January 1, 2020, we have concluded our assessment of the impact of CECL on all our business lines, including advances, investments and other financial assets. Adoption of the guidance will increase our allowances for credit losses by $3.8 million, which we consider to be an immaterial impact on our regulatory capital, financial condition, results of operations, and cash flows. The credit loss allowances were recorded directly to beginning retained earnings at January 1, 2020, conforming with the adoption rules of a new methodology, and did not impact 2019 earnings. We have established controls and validation processes over models pertaining to expected losses and have designed and implemented policies and control procedures. The discussion below references pre-CECL methodology. No provisions for credit losses on advances were necessary, and no provision has been necessary in the history of the program. On mortgage loans acquired under the Mortgage Partnership Finance Program (MPF), we have an established allowance for credit losses, and based on the prevailing methodologies, credit loss allowances on mortgage loans have been immaterial. Our assessments represents management’s estimate of the probable credit losses inherent in these two portfolios. Determining the amount of the provision for credit losses is considered a critical accounting estimate because management’s evaluation of the adequacy of the provision is subjective and requires significant estimates, including the amounts and timing of estimated future cash flows, estimated losses based on historical loss experience, and consideration of current economic trends, all of which are susceptible to change. These assumptions and judgments on our provision for credit losses are based on information available as of the date of the financial statements. Actual losses could differ from these estimates. Advances — No provisions for credit losses were necessary at December 31, 2019 and 2018. We have policies and procedures in place to manage our credit risk effectively. Outlined below are the underlying factors that we use for evaluating our exposure to credit loss. We are required by Finance Agency regulations to obtain sufficient collateral on advances to protect against losses, and to accept only certain kinds of collateral on our advances, such as U.S. government or government-agency securities, residential mortgage loans, deposits, and other real estate related assets. We have never experienced a credit loss on an advance. Based on the collateral held as security for advances, management’s credit analyses, and prior repayment history, no allowance for credit losses on advances was deemed necessary by management at December 31, 2019, 2018 and 2017. During the periods in this report, we had the rights to collateral, either loans or securities, on a member-by-member basis, with an estimated liquidation value in excess of outstanding advances. Significant changes to any of the factors described above could materially affect our provision for losses on advances. For example, our current assumptions about the financial strength of any member may change due to various circumstances, such as new information becoming available regarding the member’s financial strength or future changes in the national or regional economy. New information may require us to place a member on credit watch and require collateral to be delivered, adjust our current margin requirement, or provide for losses on advances. For additional discussion regarding underwriting standards, including collateral held to support advances, see Tables 3.3 and 3.4 and accompanying discussions in this MD&A. Mortgage Loans — MPF Program. We have policies and procedures in place (pre-existing to CECL at December 31, 2019 and 2018, including policies and procedures that comply with the new CECL standards effective January 1, 2020) to manage our credit risk effectively. The pre-existing, pre-CECL standards included: We assign a non-accrual status to a mortgage loan when the collection of the contractual principal or interest is 90 days or more past due. When a mortgage loan is placed on non-accrual status, accrued but uncollected interest is reversed against interest income. For additional discussion regarding underwriting standards, allowances for credit losses and credit quality metrics, see financial statements, Note 10. Mortgage Loans Held-for-portfolio. Also, see Tables 5.1 to 5.3 and accompanying discussions in this MD&A. Derivatives and Hedging Activities We enter into derivatives primarily to manage our exposure to changes in interest rates. Through the use of derivatives, we may adjust the effective maturity, repricing frequency, or option characteristics of financial instruments to achieve our risk management objectives. The accounting guidance related to derivatives and hedging activities is complex and contains prescriptive documentation requirements. At the inception of each hedge transaction, we formally document the hedge relationship, its risk management objective, and strategy for undertaking the hedge. In compliance with accounting standards, primarily ASC 815, the accounting for derivatives requires us to make the following assumptions and estimates: (i) assessing whether the hedging relationship qualifies for hedge accounting, (ii) assessing whether an embedded derivative should be bifurcated, (iii) calculating the effectiveness of the hedging relationship, (iv) evaluating exposure associated with counterparty credit risk, and (v) estimating the fair value of the derivatives. Our assumptions and judgments include subjective estimates based on information available as of the date of the financial statements and could be materially different based on different assumptions, calculations, and estimates. We record and report our hedging activities in accordance with ASC 815. All derivatives are recorded on the statements of condition at their fair values. Changes in the fair value of all derivatives, excluding those designated as cash flow hedges, are recorded in current period earnings, while changes in the fair value of derivatives that are designated and qualify as cash flow hedges are recorded in other comprehensive income (OCI) until earnings are affected by the variability of the cash flows of the hedged transaction. If our hedges do not qualify for hedge accounting, also known as economic hedges, then the changes in the fair value of the derivatives in the economic hedge would be recorded in earnings, without an offsetting change in the fair value of the hedged item. As a result, economic hedges has the potential to cause significant volatility on our results of operations. If hedges qualify under a qualifying ASC 815 hedge, we may use two approaches to hedge accounting: short-cut hedge accounting and long-haul hedge accounting. A short-cut hedging relationship assumes no ineffectiveness and implies that the hedge between an interest-rate swap and an interest-bearing financial instrument is perfectly correlated. Therefore, it is assumed that changes in the fair value of the interest-rate swap and the interest-bearing financial instrument will perfectly offset one another; therefore, no ineffectiveness is recorded in earnings or OCI. To qualify for short-cut accounting treatment, a number of restrictive conditions must be met. A long-haul hedging relationship requires us to assess, retrospectively and prospectively, on at least a quarterly basis, whether the derivative and hedged item have been and are expected to be highly effective in offsetting changes in fair value or cash flows attributable to the hedged risk. We perform a prospective analysis based on a quantitative method at the inception of the hedge, and subsequently each quarter, we also perform retrospective hedge effectiveness analysis using regression to support our assertion that a hedge was and will remain effective. If the hedge fails the effectiveness test any time during its life, the hedge relationship no longer qualifies for hedge accounting and the derivative is marked to fair value through current period earnings without any offsetting changes in fair value related to the hedged item. In August 2017, the FASB issued ASU 2017-12,Targeted Improvements to Accounting for Hedging Activities (Topic 815). On October 25, 2018, the FASB issued ASU 2018-16, Inclusion of the Secured Overnight Financing Rate (SOFR) Overnight Index Swap (OIS) Rate as a Benchmark Interest Rate for Hedge Accounting Purposes (Topic 815). ASU 2018-16 added the OIS rate based on SOFR as a U.S. benchmark rate to facilitate the LIBOR to SOFR transition, and the amendments became effective concurrently with the FHLBNY’s adoption of ASU 2017-12 effective January 1, 2019. In addition, the amendments in this ASU also made certain targeted improvements to simplify the application of the hedge accounting guidance in current GAAP. For more information about policies for our derivatives and hedging activities, see financial statements, Note 1. Significant Accounting Policies and Estimates, and Note 17. Derivatives and Hedging Activities. Legislative and Regulatory Developments Federal Home Loan Bank Membership Request for Input. As part of a holistic review of FHLBank membership, the Federal Housing Finance Agency (FHFA) indicated on January 24, 2020 that they are seeking public input on whether, in light of recent developments within the Federal Home Loan Bank System and changes in the nation’s housing finance markets, the FHFA’s existing regulation on FHLBank membership, located at 12 CFR Part 1263, remains adequate to ensure (i) the FHLBank System remains safe and sound and able to provide liquidity to members in a variety of conditions and (ii) the advancement of the FHLBanks’ housing finance and community development mission. FHFA is seeking input on several broad questions relating to FHLBank membership requirements, as well as on certain more specific questions related to the implementation of the current member regulation. Responses are due by no later than June 23, 2020. Any rulemaking actions taken by the FHFA to update the current membership regulation as a result of the foregoing could potentially impact FHLBank membership eligibility or requirements, and ultimately our business, business opportunities, and results of operation. Advisory Bulletin 2020-01 Federal Home Loan Bank Risk Management of Acquired Member Assets (AMA). On January 31, 2020, the FHFA released guidance on risk management of acquired member assets. The guidance communicates the FHFA’s expectations with respect to the FHLBank’s funding of its members through the purchase of eligible mortgage loans and includes expectations that the FHLBank will have board-established limits on AMA portfolios and management-established thresholds to serve as monitoring tools to manage AMA-related risk exposure. The guidance provides that the board of a FHLBank should ensure that the Bank serves as a liquidity source for members, and the FHLBank should ensure that its portfolio limits do not result in the FHLBank’s acquisition of mortgages from smaller members being “crowded out” by the acquisition of mortgages from larger members. The advisory bulletin contains the expectation that the board of a FHLBank should set limits on the size and growth of portfolios and on acquisitions from a single participating financial institution. In addition, the guidance provides that the board of a FHLBank should consider concentration risk in the areas of geographic area, high-balance loans, and in third-party loan originations. The Bank continues to evaluate the potential impact of this advisory bulletin but currently do not expect it to materially affect our financial condition or results of operations. FHFA Proposed Amendments to Stress Test Rule. On December 16, 2019, the FHFA published a proposed rule amending its stress testing rule, consistent with section 401 of the Economic Growth, Regulatory Relief, and Consumer Protection Act of 2018 (EGRRCPA), to (i) raise the minimum threshold to conduct periodic stress tests for entities regulated by the FHFA from those with consolidated assets of more than $10 billion to those with consolidated assets of more than $250 billion; (ii) remove the requirements for FHLBanks to conduct stress tests; and (iii) remove the adverse scenario from the list of required scenarios. The proposed rule maintains the FHFA’s discretion to require that a FHLBank with total consolidated assets below the $250 billion threshold conduct stress testing. The proposed amendments align the FHFA’s stress testing rules with rules adopted by other financial institution regulators that implement the Dodd-Frank Wall Street Reform and Consumer Protection Act stress testing requirements, as amended by the EGRRCPA. The results of our most recent annual severely adverse economic conditions stress test were published to our public website, www.fhlbny.com, on November 15, 2019. If the rule is adopted as proposed, it will eliminate these stress testing requirements for FHLBanks, unless the FHFA exercises its discretion to require stress testing in the future. The Bank does not expect this rule, if adopted as proposed, to have a material effect on our financial condition or results of operations. FDIC Brokered Deposits Restrictions. On December 12, 2019, the Federal Deposit Insurance Corporation (FDIC) issued a proposed rule to amend its brokered deposits restrictions that apply to less than well capitalized insured depository institutions. The FDIC states that the proposed amendments are intended to modernize its brokered deposit regulations and would establish a new framework for analyzing whether deposits placed through deposit placement arrangements qualify as brokered deposits. These deposit placement arrangements include those between insured depository institutions and third parties, such as financial technology companies, for a variety of business purposes, including access to deposits. By creating a new framework for analyzing certain provisions of the “deposit broker” definition, including shortening the list of activities considered “facilitating” and expanding the scope of the “primary purpose” exception, the proposed rule would narrow the definition of “deposit broker” and exclude more deposits from treatment as “brokered deposits.” The proposed rule would also establish an application and reporting process with respect to the primary purpose exception. If this rule is adopted as proposed, the Bank does not expect it to materially affect our financial condition or results of operations. However, if adopted as proposed, the rule could affect the demand for certain of our advance products, but the extent of the impact is uncertain. FHFA Supervisory Letter About LIBOR Phase-Out.On September 27, 2019, the FHFA issued a Supervisory Letter (the Supervisory Letter) to the FHLBs that the FHFA stated is designed to ensure the FHLBs will be able to identify and prudently manage the risks associated with the termination of LIBOR in a safe and sound manner. The Supervisory Letter provided that the FHLBs should, by March 31, 2020, cease entering into new LIBOR referenced financial assets, liabilities, and derivatives with maturities beyond December 31, 2021 for all product types except investments. With respect to investments, the Supervisory Letter required the FHLBs, by December 31, 2019, to stop purchasing investments that reference LIBOR and mature after December 31, 2021. These phase-out dates do not apply to collateral accepted by the FHLBs. The Supervisory Letter also directs the FHLBs to update their pledged collateral certification reporting requirements by March 31, 2020 in an effort to encourage members to distinguish LIBOR-linked collateral maturing after December 31, 2021. The FHLBanks are expected to cease entering into LIBOR-indexed financial instruments maturing after December 31, 2021 by the deadlines specified in the Supervisory Letter, subject to limited exceptions granted by the FHFA under the Supervisory Letter for LIBOR-linked products serving compelling mission, risk mitigating, and/or hedging purposes that do not currently have readily available alternatives. As a result of the recent market volatility triggered in part by the COVID-19 coronavirus, the FHLBanks’ authority to enter into LIBOR-based instruments that mature after December 31, 2021 has been extended from March 31, 2020 to June 30, 2020, except for investments and option embedded products. In addition, effective April 1, 2020, the Bank will only enter into interest rate derivatives indexed to LIBOR that terminate after December 31, 2021 for purposes of reducing existing LIBOR index exposure. The Bank may continue to enter into LIBOR-indexed derivatives on a pass-through basis for the benefit of its members. The Bank has already ceased purchasing investments that reference LIBOR and mature after December 31, 2021. (For more information, see Balance Sheet overview December 31, 2019 and December 31, 2018 in this MD&A — Replacement of London Interbank Offered Rates (LIBOR) and discussions thereto). The Bank continues to evaluate the impact of the Supervisory Letter and other LIBOR transition factors (including federal and international regulatory guidance, as well as financial market conditions) on its financial condition and results of operations. The Bank may experience lower overall demand or increased costs for its advances, which in turn may negatively impact the future composition of the Bank’s balance sheet, capital stock levels, primary mission assets ratio, and net income. FHFA Advisory Bulletin 2019-03—Capital Stock Management. On August 14, 2019, the FHFA issued an advisory bulletin (the AB) providing for each FHLBank to maintain a ratio of at least two percent of capital stock to total assets in order to help preserve the cooperative structure incentives that encourage members to remain fully engaged in the oversight of their investment in the Bank. The guidance also indicated that, beginning six months after the issuance of the AB, the FHFA would begin to consider the proportion of capital stock to assets, measured on a daily average basis at month end, when assessing each FHLBank’s capital management practices. The Bank does not expect the guidance to have a material impact on the Bank’s capital management practices, financial condition, and/or results of operations. SEC Final Rule on Auditor Independence with Respect to Certain Loans or Debtor-Creditor Relationships. On July 5, 2019, the United States Securities and Exchange Commission published a final rule, which became effective on October 3, 2019 (the SEC Final Rule), that adopts amendments to its auditor independence rules to modify the analysis that must be conducted to determine whether an auditor is independent when the auditor has a lending relationship with certain shareholders of an audit client at any time during an audit or professional engagement period. The SEC Final Rule, among other things, focuses the analysis on beneficial ownership rather than on both record and beneficial ownership; replaces the existing ten percent bright-line shareholder ownership test with a “significant influence” test; and adds a “known through reasonable inquiry” standard with respect to identifying beneficial owners of the audit client’s equity securities. Under the prior loan rule on debtor-creditor relationships, the independence of an accounting firm generally could be called into question if it or a covered person in the accounting firm received a loan from a lender that is a “record or beneficial owner of more than ten percent of the audit client’s equity securities.” A covered person in the firm includes personnel on the audit engagement team, personnel in the chain of command, partners and managers who provide ten or more hours of non-audit services to the audit client, and partners in the office where the lead engagement partner practices in connection with the client. The SEC Final Rule replaced the existing ten percent bright-line test with a significant influence test similar to that referenced in other SEC rules and based on concepts applied in the Financial Accounting Standards Board ASC Topic 323. Under the SEC Final Rule, which is now in effect, with certain exceptions, the receipt of loans from the beneficial owners of an audit client’s equity securities where such beneficial owner has significant influence over the audit client would impair the independence of the auditor. The analysis under the SEC Final Rule would be based on the facts and circumstances and would focus on whether the beneficial owners of an audit client’s equity securities have the ability to exercise significant influence over the operating and financial policies of an audit client. The Bank believes that the SEC Final Rule has resolved the matters previously discussed in Item 9B — Other Information in the 2018 Annual Report on Form 10-K. FHFA Advisory Bulletin 2019-01 Business Resiliency Management. On May 7, 2019, the FHFA issued an Advisory Bulletin on Business Resiliency Management for FHLBanks and other entities regulated by the FHFA (the Business Resiliency AB) that communicates the FHFA’s expectations with respect to minimizing the impact of disruptions in service from uncontrolled events and the maintenance of business operations at predefined levels. This guidance rescinds the FHFA’s 2002 disaster recovery guidance. The new guidance states that a business resiliency program should guide the regulated entity to respond appropriately to disruptions affecting business operations, personnel, equipment, facilities, IT systems, and information assets. The Bank does not expect the Business Resiliency AB to have a material effect on our financial condition or results of operations. Final Rule on FHLBank Capital Requirements. On February 20, 2019, the FHFA published a final rule, effective January 1, 2020, that adopted, with amendments, the regulations of the Federal Housing Finance Board (predecessor to the FHFA) (the Finance Board) pertaining to the capital requirements for the FHLBanks. The final rule carries over most of the prior Finance Board regulations without material change but substantively revises the credit risk component of the risk-based capital requirement, as well as the limitations on extensions of unsecured credit. The main revisions remove requirements that the Bank calculate credit risk capital charges and unsecured credit limits based on ratings issued by a Nationally Recognized Statistical Rating Organization (NRSRO), and instead require that the Bank establish and use its own internal rating methodology (which may include, but not solely rely on, NRSRO ratings). The rule imposes a new credit risk capital charge for cleared derivatives. The final rule also revises the percentages used in the regulation’s tables to calculate credit risk capital charges for advances and for non-mortgage assets. The final rule also rescinds certain contingency liquidity requirements that were part of the Finance Board regulations, as these requirements are now addressed in an Advisory Bulletin on FHLB Liquidity Guidance issued by the FHFA in 2018. The Bank does not expect this rule to materially affect our financial condition or results of operations. FDIC Final Rule on Reciprocal Deposits. On February 4, 2019, the FDIC published a final rule, effective March 6, 2019, related to the treatment of “reciprocal deposits,” which implements Section 202 of the EGRRCPA. The final rule exempts, for certain insured depository institutions (depositories), certain reciprocal deposits (deposits acquired by a depository from a network of participating depositories that enables depositors to receive FDIC insurance coverage for the entire amount of their deposits) from being subject to FDIC restrictions on brokered deposits. Under the rule, well-capitalized and well-rated depositories are not required to treat reciprocal deposits as brokered deposits up to the lesser of twenty percent of their total liabilities or $5 billion. Reciprocal deposits held by depositories that are not well-capitalized and well-rated may also be excluded from brokered deposit treatment in certain circumstances. The Bank does not expect the rule to materially affect our financial condition or results of operations. The rule could, however, enhance depositories’ liquidity by increasing the attractiveness of deposits that exceed FDIC insurance limits. This could affect the demand for certain advance products. Swap-Related Developments.In 2019 and 2020, certain developments applicable to swaps occurred: Uncertainty Regarding Brexit. In June 2016, the United Kingdom (the UK) voted in favor of leaving the European Union (the EU), and in March 2017, Article 50 of the Lisbon Treaty was invoked, commencing a period of negotiations between the UK and the European Council for the UK’s withdrawal from the EU, which was subsequently extended by the European Council members in agreement with the UK. On January 31, 2020, the UK withdrew from the EU under the European Union Withdrawal Agreement Act 2020, with a transition period to last until December 31, 2020, which period may be extended for an additional two years. During this transition period, the UK and the EU will negotiate the details of their future relationship, including what conditions will apply to EU-based entities that want to do business with the UK, and vice versa, after the transition period. From time to time the Bank may have exposure to UK-based and EU-based counterparties, and has exposure to UK-based derivatives clearing organization for our cleared derivatives. At this time it is not possible to predict the date on which the transition period will end or whether any agreement reached between the UK and the EU will have a material adverse effect on the financial instruments the Bank has with these counterparties or on our derivatives cleared in the UK. CFTC No-action Relief for LIBOR Amendments. On December 17, 2019, three divisions of the CFTC issued no-action letters to provide relief with respect to the transition away from LIBOR and other interbank offered rates (IBORs). Among other forms of relief, the letters, subject to certain limitations: (i) permit registered swap dealers, major swap participants, security-based swap participants, and major security-based swap participants (covered swap entities) to amend an uncleared swap entered into before the compliance date of the CFTC’s uncleared swap margin requirements (such swap, a legacy swap, and such requirements, the CFTC margin rules) to include LIBOR or other IBOR fallbacks without the legacy swap becoming subject to the CFTC margin rules; and (ii) provide time-limited relief, until December 31, 2021, for (a) swaps that are not subject to the central clearing requirement because they were executed prior to the relevant compliance date and (b) swaps that are subject to the trade execution requirement to be amended to include LIBOR or other IBOR fallbacks without becoming subject to such clearing or trade execution requirements. The Bank believes this relief may assist in the transition away from LIBOR. Margin and Capital Requirements for Covered Swap Entities. On November 7, 2019, the Office of the Comptroller of the Currency, the Federal Reserve Board, the Federal Deposit Insurance Corporation, the Farm Credit Administration and the FHFA (collectively, the Agencies) jointly published a proposed rule that would amend the Agencies’ regulations that established minimum margin and capital requirements for uncleared swaps (the prudential margin rules) for covered swap entities under the jurisdiction of one of the Agencies. In addition to other changes, the proposed amendments would permit those uncleared swaps entered into by a covered swap entity before the compliance date of the prudential margin rules to retain their legacy status and not become subject to the prudential margin rules in the event that such legacy swaps are amended to replace LIBOR or another rate that is reasonably expected to be discontinued or is reasonably determined to have lost its relevance as a reliable benchmark due to a significant impairment. Among other things, the proposed rule would also amend the prudential margin rules to (i) extend the phase-in compliance date of the covered swap entities for initial margin requirements from September 1, 2020 to September 1, 2021 for counterparties with an average daily aggregate notional amount (AANA) of non-cleared swaps from $8 billion to $50 billion, (ii) clarify that a covered swap entity does not have to execute initial margin trading documentation with a counterparty prior to the time that the counterparty is required to collect or post initial margin, and (iii) permit legacy swaps to retain their legacy status and not become subject to the prudential margin rules in the event that they are amended due to certain life-cycle activities, such as reductions of notional amounts or portfolio compression exercises. The Bank does not expect the proposed amendments, if adopted as proposed, to materially affect our financial condition or results of operations. On October 24, 2019, the CFTC proposed an amendment to its CFTC margin rules, which among other changes, would similarly extend the phase-in compliance date for initial margin requirements from September 1, 2020 to September 1, 2021 for counterparties with an AANA of non-cleared swaps from $8 billion to $50 billion. On March 18, 2020, the CFTC announced that it had finalized a one-year extension of the initial margin compliance deadline for market participants with the smallest uncleared swaps portfolios, with a new compliance date in September 2021. We do not expect this change to materially affect our financial condition or results of operations. CFTC Advisory on Initial Margin Documentation Requirements. On July 9, 2019, the CFTC issued an advisory (the CFTC Advisory) on the CFTC margin rules to clarify that documentation governing the posting, collection, and custody of initial margin is not required to be completed until such time as the aggregate unmargined exposure to a counterparty (and its margin affiliates) exceeds an initial margin threshold of $50 million imposed by the regulation. The CFTC Advisory instructs CFTC covered swap entities to closely monitor initial margin amounts if they are approaching the $50 million initial margin threshold with a counterparty and to take appropriate steps to ensure that the required documentation is in place at such time as the threshold is reached. The Bank is closely monitoring its initial margin thresholds on a counterparty-by-counterparty basis and is evaluating the impact of the CFTC Advisory on its documentation requirements. Table2.1: Statements of Condition — Period-Over-Period Comparison NM — Not meaningful. Balance Sheet overview December 31, 2019 and December 31, 2018 Total assets increased to $162.1 billion at December 31, 2019 from $144.4 billion at December 31, 2018, an increase of $17.7 billion, or 12.3%. Cash at banks was $603.2 million at December 31, 2019, compared to $85.4 million at December 31, 2018. Money market investments atDecember 31, 2019 were $8.6 billion in federal funds sold and $15.0 billion in overnight resale agreements. At December 31, 2018, money market investments were $7.6 billion in federal funds sold and $4.1 billion in overnight resale agreements. Advances— Par balances decreased at December 31, 2019 to $100.4 billion, compared to $105.4 billion at December 31, 2018. Short-term fixed-rate advances increased by 62.7% to $24.4 billion at December 31, 2019, up from $15.0 billion at December 31, 2018. ARC advances, which are adjustable-rate borrowings, decreased by 29.9% to $16.4 billion at December 31, 2019, compared to $23.3 billion at December 31, 2018. Overnight advances decreased by 55.9% to $3.4 billion at December 31, 2019 compared to $7.7 billion at December 31, 2018. Long-term investment debt securities— Long-term investment debt securities are designated as available-for-sale (AFS) or held-to-maturity (HTM). The heavy concentration of GSE and Agency issued (GSE-issued) securities, and a declining balance of private-label MBS, less than 1%, is our investment profile. In the AFS portfolio, long-term investments of floating-rate GSE-issued mortgage-backed securities were carried on the balance sheet at fair values of $344.0 million and $422.2 million at December 31, 2019 and 2018. Long-term investments of fixed-rate GSE-issued mortgage-backed securities were carried on the balance sheet at fair values of $2.3 billion at December 31, 2019. There were no fixed-rate MBS at December 31, 2018 in the AFS portfolio. As permitted under the new hedging guidance, effective January 1, 2019 we made a one-time transfer of $1.6 billion of fixed-rate MBS from HTM to AFS. The transfer enhanced balance sheet management. In the HTM portfolio, long-term investments at December 31, 2019 were predominantly GSE-issued fixed- and floating-rate mortgage-backed securities and a small portfolio of housing finance agency bonds. Securities in the HTM portfolio are recorded at amortized cost, adjusted for any OTTI. Fixed- and floating-rate mortgage-backed securities (MBS), including private-label mortgage-backed securities (PLMBS), in the HTM portfolio were $14.1 billion at December 31, 2019 and $16.3 billion at December 31, 2018. Investments in PLMBS were less than 1% of the HTM portfolio. We acquired $2.3 billion of fixed-rate GSE-issued MBS in 2019. Housing finance agency bonds, primarily New York and New Jersey, were carried at an amortized cost basis of $1.1 billion at December 31, 2019 compared to $1.2 billion at December 31, 2018. There were no new acquisitions in 2019 and paydowns were $46.0 million. In 2018, there was one acquisition for $100.0 million and paydowns were $79.2 million. Trading securities (liquidity portfolio)— The objective of the trading portfolio is to meet short-term contingency liquidity needs. During the current year period, we continued to invest in highly liquid U.S. Treasury securities. Trading investments are carried at fair value, with changes recorded through earnings. At December 31, 2019, trading investments were $15.3 billion in U.S. Treasury securities and $3.2 million in Ambac corporate notes. We acquired $13.3 billion of U.S. Treasury securities in 2019. At December 31, 2018, trading investments were $5.3 billion in U.S. Treasury securities, $502.8 million in GSE securities and $3.3 million in Ambac corporate notes. We will periodically evaluate our liquidity needs and may add to or dispose these liquidity investments as deemed prudent based on liquidity and market conditions. The Finance Agency prohibits speculative trading practices but allows permitted securities to be deemed held for liquidity if invested in a trading portfolio. Equity Investments— We own a grantor trust that invests in highly-liquid registered mutual funds, which were reclassified as of January 1, 2018 from AFS to Equity Investments. These investments were carried on the balance sheet at fair values of $60.0 million at December 31, 2019 and $48.2 million at December 31, 2018. Mortgage loans held-for-portfolio — Mortgage loans were investments in Mortgage Partnership Finance loans (MPF or MPF Program). Unpaid principal balance of MPF loans stood at $3.1 billion at December 31, 2019, an increase of $244.3 million from the balance at December 31, 2018. Loans are primarily fixed-rate, single-family mortgages acquired through the MPF Program. Paydowns in the twelve months of 2019 were $313.8 million, compared to $264.6 million in the prior year same period. Acquisitions in the twelve months of 2019 were $566.4 million, compared to $301.7 million in the prior year same period. Credit performance has been strong and delinquency low. Loan origination by members and acceptable pricing are key factors that drive acquisitions. Residential collateral values have remained stable in the New York and New Jersey sectors, the primary geographic concentration for our MPF portfolio, and historical loss experience remains very low. Capital ratios — Our capital position remains strong. At December 31, 2019, actual risk-based capital was $7.6 billion, compared to required risk-based capital of $1.1 billion. To support $162.1 billion of total assets at December 31, 2019, the minimum required total capital was $6.5 billion or 4.0% of assets. Our actual regulatory risk-based capital was $7.6 billion, exceeding required total capital by $1.1 billion. These ratios have remained consistently above the required regulatory ratios through all periods in this report. For more information, see financial statements, Note 14. Capital Stock, Mandatorily Redeemable Capital Stock and Restricted Retained Earnings. Leverage — At December 31, 2019, balance sheet leverage (based on U.S. GAAP) was 21.5 times shareholders’ equity. Balance sheet leverage has generally remained steady over the last several years, although from time to time we have maintained excess liquidity in highly liquid investments, or cash balances at the Federal Reserve Bank of New York (FRBNY) to meet unexpected member demand for funds. Increases or decreases in investments have a direct impact on leverage, but generally growth in or shrinkage of advances does not significantly impact balance sheet leverage under existing capital stock management practices. Members are required to purchase activity-based capital stock to support their borrowings from us, and when activity-based capital stock is in excess of the amount that is required to support advance borrowings, we redeem the excess capital stock immediately. Therefore, stockholders’ capital increases and decreases with members’ advance borrowings, and the capital to asset ratio remains relatively unchanged. Liquidity— Our liquidity position remains strong, and in compliance with all regulatory requirements, and we do not foresee any changes to that position. In addition to the liquidity trading portfolio discussed previously, liquid assets at December 31, 2019 included $597.6 million as demand cash balances at the Federal Reserve Bank of New York (FRBNY), $23.6 billion in short-term and overnight loans in the federal funds and the repo markets, and $2.7 billion of high credit quality GSE-issued available-for-sale securities that are investment quality, and readily marketable. The Finance Agency’s Liquidity Advisory Bulletin 2018-07 has specific initial liquidity levels to be maintained within certain ranges defined in an accompanying supervisory letter.We also have other regulatory liquidity measures in place, deposit liquidity and operational liquidity, and other liquidity buffers. We remain in compliance with the Advisory Bulletin and all liquidity regulations. Net change in Net change in (Dollars in thousands) December 31, 2018 December 31, 2017 dollar amount percentage Assets Cash and due from banks $ 85,406 $ 127,403 $ (41,997 ) (32.96 )% Securities purchased under agreements to resell 4,095,000 2,700,000 1,395,000 51.67 Federal funds sold 7,640,000 10,326,000 (2,686,000 ) (26.01 ) Trading securities 5,810,512 1,641,568 4,168,944 253.96 Equity Investments 48,179 — 48,179 NM Available-for-sale securities 422,216 577,269 (155,053 ) (26.86 ) Held-to-maturity securities 17,474,826 17,824,533 (349,707 ) (1.96 ) Advances 105,178,833 122,447,805 (17,268,972 ) (14.10 ) Mortgage loans held-for-portfolio 2,927,230 2,896,976 30,254 1.04 Accrued interest receivable 275,256 226,981 48,275 21.27 Premises, software, and equipment 51,572 29,697 21,875 73.66 Derivative assets 113,762 112,742 1,020 0.90 Other assets 8,602 7,398 1,204 16.27 Total assets $ 144,381,394 $ 158,918,372 $ (14,536,978 ) (9.15 )% Liabilities Deposits Interest-bearing demand $ 1,002,587 $ 1,142,056 $ (139,469 ) (12.21 )% Non-interest-bearing demand 20,050 17,999 2,051 11.40 Term 40,000 36,000 4,000 11.11 Total deposits 1,062,637 1,196,055 (133,418 ) (11.15 ) Consolidated obligations Bonds 84,153,776 99,288,048 (15,134,272 ) (15.24 ) Discount notes 50,640,238 49,613,671 1,026,567 2.07 Total consolidated obligations 134,794,014 148,901,719 (14,107,705 ) (9.47 ) Mandatorily redeemable capital stock 5,845 19,945 (14,100 ) (70.69 ) Accrued interest payable 223,570 162,176 61,394 37.86 Affordable Housing Program 161,718 131,654 30,064 22.84 Derivative liabilities 31,147 61,607 (30,460 ) (49.44 ) Other liabilities 355,841 204,178 151,663 74.28 Total liabilities 136,634,772 150,677,334 (14,042,562 ) (9.32 ) Capital 7,746,622 8,241,038 (494,416 ) (6.00 ) Total liabilities and capital $ 144,381,394 $ 158,918,372 $ (14,536,978 ) (9.15 )% Replacement of London Interbank Offered Rates (LIBOR) — Central banks and regulators in a number of major jurisdictions have convened working groups to find, and implement the transition to suitable replacements for LIBOR. The Alternative Reference Rates Committee (ARRC) in the U.S. has settled on the establishment of the Secured Overnight Financing Rate (SOFR) as its recommended alternative to U.S. dollar LIBOR. As noted throughout this report, much of the FHLBNY’s assets, liabilities and derivatives are indexed to LIBOR. More information is provided under Market and Economic Risks in Item 1A. Risk Factor in this Form 10-K. On March 12, 2020, the FASB issued Accounting Standards Update 2020-04,Reference Rate Reform (Topic 848), Facilitation of the Effects of Reference Rate Reform on Financial Reporting. The ASU provides temporary optional expedients and exceptions to the U.S. GAAP guidance on contract modifications and hedge accounting in light of the expected market transition from LIBOR and other reference interest rates to alternatives, such as SOFR. The relief in the amendments are effective as of March 12, 2020 through December 31, 2022. On September 27, 2019, the FHFA, our regulator issued a supervisory letter that directed the Federal Home Loan Banks to cease, by March 31, 2020 entering into new LIBOR – referenced instruments with maturities beyond December 31, 2021 (other than for investments and option embedded products, the date has now been extended to June 30, 2020). Legislative and Regulatory Developments in this MD&A includes more information. The following data provides an overview of LIBOR-indexed assets, liabilities and derivatives with remaining maturities beyond the expected LIBOR transition date: 47 48 Our primary business is making collateralized loans to members, referred to as advances. Generally, the growth or decline in advances is reflective of demand by members for both short-term liquidity and term funding. This demand is driven by economic factors such as availability of alternative funding sources that are more attractive, or by the interest rate environment and the outlook for the economy. Members may choose to prepay advances (which may generate prepayment penalty fees) based on their expectations of interest rate changes and demand for liquidity. Advance volume is also influenced by merger activity, where members are either acquired by non-members or acquired by members of another FHLBank. When our members are acquired by members of another FHLBank or by non-members, these former members no longer qualify for membership and we may not offer renewals or additional advances to the former members. If maturing advances are not replaced, it will have an impact on business volume. Interest rate hedging and basis adjustments — A significant percentage of fixed-rate, longer-term advances and all putable advances were designated under an ASC 815 fair value accounting hedge. Also, certain advances were hedged by interest rate swaps in economic hedges. From time to time, we have also elected the fair value option (FVO) on an instrument by instrument basis for certain advances. Carrying value of advances outstanding at December 31, 2019 was $100.7 billion, compared to $105.2 billion at December 31, 2018. Carrying values included unrealized net fair value hedging basis adjustments recorded on hedges eligible under ASC 815. The cumulative hedging basis adjustment were gains of $299.2 million at December 31, 2019, compared to losses of $255.0 million at December 31, 2018. For more information about basis adjustments, see Table 3.6 Advances by Maturity and Yield Type in this MD&A. Member demand for advance products Par amount of advances outstanding was $100.4 billion at December 31, 2019, compared to $105.4 billion at December 31, 2018. The decrease in amounts outstanding at December 31, 2019, relative to December 31, 2018 has been largely due to run-offs of borrowed amounts that were not renewed. Advances — Product Types The following table summarizes par values of advances by product type (dollars in thousands): December 31, 2018 December 31, 2017 Percentage Percentage Amounts of Total Amounts of Total Adjustable Rate Credit - ARCs $ 23,346,467 22.14 % $ 37,060,467 30.20 % Fixed Rate Advances 51,612,602 48.96 50,517,644 41.17 Short-Term Advances 14,995,172 14.22 23,818,181 19.41 Mortgage Matched Advances 320,027 0.30 352,859 0.29 Overnight & Line of Credit (OLOC) Advances 7,723,492 7.33 3,748,677 3.05 All other categories 7,436,097 7.05 7,209,613 5.88 Total par value 105,433,857 100.00 % 122,707,441 100.00 % Hedge valuation basis adjustments (255,024 ) (265,260 ) Fair value option valuation adjustments and accrued interest — 5,624 Total $ 105,178,833 $ 122,447,805 Collateral Security Our member borrowers are required to maintain an amount of eligible collateral that adequately secures their outstanding obligations with the FHLBNY. Eligible collateral includes: (1) one-to-four-family and multi-family mortgages; (2) Treasury and U.S. government agency securities; (3) mortgage-backed securities; and (4) certain other collateral that is real estate-related, provided that such collateral has a readily ascertainable value and the Bank can perfect a security interest in that collateral. We also have a statutory lien priority with respect to certain member assets under the FHLBank Act as well as a claim on FHLBNY capital stock held by our members. The FHLBNY’s loan and collateral agreements give us a security interest in assets held by borrowers that is sufficient to cover their obligations to the FHLBNY. We may supplement this security interest by imposing additional reporting, segregation or delivery requirements on the borrower. We assign specific collateral requirements to a borrower, based on a number of factors. These include, but are not limited to: (1) the borrower’s overall financial condition; (2) the degree of complexity involved in the pledging, verifying, and reporting of collateral between the borrower and the FHLBNY, especially when third-party pledges, custodians, outside service providers and pledges to other entities are involved; and (3) the type of collateral pledged. In order to ensure that the FHLBNY has sufficient collateral to cover credit extensions, the Bank has established a Collateral Lendable Value methodology. This methodology determines the lendable value or amount of borrowing capacity assigned to each specific type of collateral. Key components of the Lendable Value include measures of Market, Credit, Price Volatility and Operational Risk associated with the unique collateral types pledged to the FHLBNY. Lendable Values are periodically adjusted to reflect current market and business conditions. The following table summarizes pledged collateral at December 31, 2019 and 2018 Indebtedness Collateral (a) Advances (b) Other Total Mortgage Securities and Total (d) December 31, 2018 $ 105,433,857 $ 20,046,053 $ 125,479,910 $ 291,826,715 $ 43,582,710 $ 335,409,425 December 31, 2017 $ 122,707,441 $ 16,233,637 $ 138,941,078 $ 280,239,413 $ 38,217,577 $ 318,456,990 The following table shows the breakdown of collateral pledged by members between those in the physical possession of the FHLBNY or its safekeeping agent, and those that were specifically listed (in thousands): Estimated Market Values Collateral in Collateral Total December 31, 2018 $ 44,906,685 $ 290,502,740 $ 335,409,425 December 31, 2017 $ 40,091,157 $ 278,365,833 $ 318,456,990 Advances — Interest Rate Terms The following table summarizes interest-rate payment terms for advances (dollars in thousands): December 31, 2018 December 31, 2017 Percentage Percentage Amount of Total Amount of Total Fixed-rate (a) $ 82,034,884 77.81 % $ 85,587,792 69.75 % Variable-rate (b) 23,391,691 22.19 37,116,649 30.25 Variable-rate capped or floored (c) 3,000 — 3,000 — Overdrawn demand deposit accounts 4,282 — — — Total par value 105,433,857 100.00 % 122,707,441 100.00 % Hedge valuation basis adjustments (255,024 ) (265,260 ) Fair value option valuation adjustments and accrued interest — 5,624 Total $ 105,178,833 $ 122,447,805 The following table summarizes maturity and yield characteristics of advances (dollars in thousands): Fair value basis and valuation adjustments — Key determinants of valuation adjustments are factors such as advance run offs and new transactions designated in hedging relationships. December 31, 2018 December 31, 2017 Percentage Percentage Amount of Total Amount of Total Fixed-rate Due in one year or less $ 52,416,990 49.72 % $ 54,923,033 44.76 % Due after one year 29,617,894 28.09 30,664,759 24.99 Total Fixed-rate 82,034,884 77.81 85,587,792 69.75 Variable-rate Due in one year or less 15,892,506 15.07 30,368,458 24.75 Due after one year 7,506,467 7.12 6,751,191 5.50 Total Variable-rate 23,398,973 22.19 37,119,649 30.25 Total par value 105,433,857 100.00 % 122,707,441 100.00 % Hedge valuation basis adjustments (a) (255,024 ) (265,260 ) Fair value option valuation adjustments and accrued interest (b) — 5,624 Total $ 105,178,833 $ 122,447,805 losses and valuation gains were recorded at December 31, 2019. Generally, hedge valuation basis gains and losses are unrealized and will reverse to zero if the advance is held to maturity or is put or called on the early option exercise dates. Hedge volume — We hedge putable advances and certain “vanilla” fixed-rate advances under the hedge accounting provisions when they qualify under those standards and as economic hedges when the hedge accounting provisions are operationally difficult to establish or a high degree of hedge effectiveness cannot be asserted. The following table summarizes hedged advances by type of option feature (in thousands): Par Amount December 31, 2018 December 31, 2017 Qualifying Hedges Fixed-rate bullets (a) $ 41,122,372 $ 52,983,896 Fixed-rate putable (b) 4,734,750 567,000 Fixed-rate callable 16,575 16,575 Fixed-rate with embedded cap 30,000 30,000 Total Qualifying Hedges $ 45,903,697 $ 53,597,471 Aggregate par amount of advances hedged (c) $ 45,919,697 $ 53,674,759 Fair value basis (Qualifying hedging adjustments) $ (255,024 ) $ (265,260 ) Advances Par Amount December 31, 2018 December 31, 2017 Advances designated under FVO (a) $ — $ 2,200,000 52 The following table summarizes par amounts of advances that were still putable or callable, with one or more pre-determined option exercise dates remaining (in thousands): Advances Par Amount December 31, 2018 December 31, 2017 Putable/callable (a) $ 4,751,325 $ 597,825 No-longer putable/callable $ 640,000 $ 1,020,500 We maintain long-term investment portfolios of debt securities, which are principally mortgage-backed securities issued by GSEs and U.S. Agency (GSE-issued). Investments include a small portfolio of MBS issued by private enterprises, and bonds issued by state or local housing finance agencies. We also maintain short-term investments for our liquidity resources, for funding daily stock repurchases and redemptions, for ensuring the availability of funds to meet the credit needs of our members, and to provide additional earnings. We also invest in a liquidity trading portfolio, the purpose of which is to augment our liquidity needs. Investments in the trading portfolio were U.S Treasury securities and GSE-issued securities, all carried at their fair values. The Finance Agency prohibits speculative investments, but allows the designation of a trading portfolio for liquidity purposes. We may dispose such investments if liquidity needs are met and market conditions deem the sale as advantageous. We are subject to credit risk on our investments, generally transacted with GSEs and large financial institutions that are considered to be investment quality. The Finance Agency defines investment quality as a security with adequate financial backing so that full and timely payment of principal and interest on such security is expected and there is minimal risk that the timely payment of principal and interest would not occur because of adverse changes in economic and financial conditions during the projected life of the security. The following table summarizes changes in investments by categories: Money market investments, Trading securities, Equity investments in Grantor trust, Available-for-sale securities and Held-to-maturity securities (Carrying values, dollars in thousands): December 31, December 31, Dollar Percentage 2018 2017 Variance Variance State and local housing finance agency obligations (a) $ 1,168,350 $ 1,147,510 $ 20,840 1.82 % Trading securities (b) 5,810,512 1,641,568 4,168,944 253.96 Mortgage-backed securities Available-for-sale securities, at fair value (c) 422,216 528,627 (106,411 ) (20.13 ) Held-to-maturity securities, at carrying value (c) 16,306,476 16,677,023 (370,547 ) (2.22 ) Total securities 23,707,554 19,994,728 3,712,826 18.57 Equity investments in Grantor trusts (d) 48,179 48,642 (463 ) (0.95 ) Securities purchased under agreements to resell 4,095,000 2,700,000 1,395,000 51.67 Federal funds sold 7,640,000 10,326,000 (2,686,000 ) (26.01 ) Total Investments $ 35,490,733 $ 33,069,370 $ 2,421,363 7.32 % Mortgage-Backed Securities — By Issuer The following table summarizes our investment debt securities issuer concentration (dollars in thousands): December 31, 2018 December 31, 2017 Carrying value as a Carrying value as a Carrying (a) Percentage Carrying (a) Percentage Long Term Investment (c) Value Fair Value of Capital Value Fair Value of Capital MBS Fannie Mae $ 4,692,639 $ 4,658,771 60.58 % $ 5,009,067 $ 5,019,957 60.78 % Freddie Mac 11,870,521 11,867,028 153.23 11,986,984 12,055,501 145.45 Ginnie Mae 22,898 23,079 0.30 28,237 28,412 0.34 All Others - PLMBS 142,634 174,749 1.84 181,362 216,793 2.20 Non-MBS (b) 1,168,350 1,144,345 15.08 1,196,152 1,163,379 14.51 Total Investment Debt Securities $ 17,897,042 $ 17,867,972 231.03 % $ 18,401,802 $ 18,484,042 223.28 % Categorized as: Available-for-Sale Securities $ 422,216 $ 422,216 $ 577,269 $ 577,269 Held-to-Maturity Securities $ 17,474,826 $ 17,445,756 $ 17,824,533 $ 17,906,773 External rating information of the held-to-maturity portfolio was as follows (carrying values in thousands): See footnotes (a) and (b) under Table 4.4. December 31, 2018 AAA-rated (a) AA-rated (b) A-rated BBB-rated Below Total Mortgage-backed securities $ 2,543 $ 16,165,160 $ 95,760 $ 9,117 $ 33,896 $ 16,306,476 State and local housing finance agency obligations 25,000 1,122,060 5,575 15,715 — 1,168,350 Total Long-term securities $ 27,543 $ 17,287,220 $ 101,335 $ 24,832 $ 33,896 $ 17,474,826 December 31, 2017 AAA-rated (a) AA-rated (b) A-rated BBB-rated Below Total Mortgage-backed securities $ 989 $ 16,497,280 $ 114,833 $ 19,637 $ 44,284 $ 16,677,023 State and local housing finance agency obligations 36,400 1,085,220 25,890 — — 1,147,510 Total Long-term securities $ 37,389 $ 17,582,500 $ 140,723 $ 19,637 $ 44,284 $ 17,824,533 External rating information of the AFS portfolio was as follows (the carrying values of AFS investments are at fair values; in thousands): December 31, 2018 December 31, 2017 AA-rated (b) Unrated Total AA-rated (b) Unrated Total Available-for-sale securities Mortgage-backed securities $ 422,216 $ — $ 422,216 $ 528,627 $ — $ 528,627 Other - Grantor trust — — — — 48,642 48,642 Total Available-for-sale securities $ 422,216 $ — $ 422,216 $ 528,627 $ 48,642 $ 577,269 Footnotes to Table 4.3 and Table 4.4. External credit rating information has been provided in Table 4.3 and Table 4.4 as the information is used as another data point to supplement our credit quality indicators, and they serve as a useful indicator when analyzing the degree of credit risk to which we are exposed. Significant changes in credit ratings classifications of our investment debt securities portfolio could indicate increased credit risk for us that could be accompanied by a reduction in the fair values of our investment debt securities portfolio. 55 Fair Value Levels of Investment Debt Securities To compute fair values, multiple vendor prices were received for substantially all of our MBS holdings, and substantially all of those prices fell within specified thresholds. The relative proximity of the prices received from the multiple vendors supported our conclusion that the final computed prices were reasonable estimates of fair values. GSE securities priced under such a valuation technique using the market approach are typically classified within Level 2 of the valuation hierarchy. For a comparison of carrying values and fair values of investment debt securities, see financial statements, Note 5. Trading securities, Note 7. Available-for-Sale Securities and Note 8. Held-to-Maturity Securities. For more information about the corroboration and other analytical procedures performed, see Note 18. Fair Values of Financial Instruments. Also see Note 7. Available-for-sale securities for an explanation of amortized cost for securities hedged under ASC 815 fair value hedge. Weighted average rates — Mortgage-backed securities (HTM and AFS) — The following table summarizes weighted average rates (yields) and amortized cost by contractual maturities (dollars in thousands): Table4.5: Mortgage-Backed Securities Weighted Average Rates by Contractual Maturities A significant portion of the MBS portfolio consists of floating-rate securities and the weighted average rates will change in parallel with changes in the LIBOR rate. Fair Value Hedges of Fixed-rate Available-for-sale Mortgage-backed Securities The adoption of ASU 2017-12 provided an alternative guidance in the application of partial-term hedging. The ASU also provided a new approach that allows entities to hedge only the benchmark rate instead of the entire coupon of a fixed-rate instrument in a fair value hedge. We have adopted the guidance in the ASU to hedge designated available-for-sale CMBS. The following table summarizes key data (in thousands): Table4.6: Fair Value Hedges of Fixed-Rate Prepayable CMBS 56 Short-term investments We typically maintain substantial investments in high quality short- and intermediate-term financial instruments such as secured overnight transactions collateralized by securities, and unsecured overnight and term federal funds sold to highly-rated financial institutions who also satisfy other credit quality factors. These investments provide the liquidity necessary to meet members’ credit needs. Short-term investments also provide a flexible means of implementing the asset/liability management decisions to adjust liquidity. We also invest in a liquidity trading portfolio, consisting of US treasury securities, with the objective of satisfying our liquidity requirements and expanding our choice of investing for liquidity. Monitoring— We actively monitor our credit exposures and the credit quality of our counterparties, including an assessment of each counterparty’s financial performance, capital adequacy, and sovereign support as well as related market signals, and actively limit or suspend existing exposures, as appropriate. In addition, we are required to manage our unsecured portfolio subject to regulatory limits prescribed by our regulator, the Finance Agency. The Finance Agency regulations include limits on the amount of unsecured credit that may be extended to a counterparty or a group of affiliated counterparties, based upon a percentage of eligible regulatory capital and the counterparty’s overall credit rating. Under these regulations, the level of eligible regulatory capital is determined as the lesser of our regulatory capital or the eligible amount of regulatory capital of the counterparty determined in accordance with Finance Agency regulations. The Finance Agency regulations also permit us to extend additional unsecured credit, which could be comprised of overnight extensions and sales of federal funds subject to continuing contract. Our total unsecured overnight exposure to a single counterparty may not exceed twice the regulatory limit for term exposures. We are prohibited by Finance Agency regulation from investing in financial instruments issued by non-U.S. entities other than those issued by U.S. branches and agency offices of foreign commercial banks, and we did not own any financial instruments issued by foreign sovereign governments, including those countries that are members of the European Union in any periods in this report. Securities purchased under agreements to resell — As part of our banking activities with counterparties, we have entered into secured financing transactions that mature overnight, and can be extended only at our discretion. These transactions involve the lending of cash against securities, which are accepted as collateral. The balance outstanding under such agreements was $15.0 billion at December 31, 2019 and $4.1 billion at December 31, 2018. For more information, see financial statements, Note 4. Federal Funds Sold and Securities Purchased under Agreements to Resell. Federal funds sold— Federal funds sold was $8.6 billion at December 31, 2019 and $7.6 billion at December 31, 2018, representing unsecured lending to major banks and financial institutions. We are a major lender in this market, particularly in the overnight market. The amount of unsecured credit risk that may be extended to individual counterparties is commensurate with the counterparty’s credit quality as assessed by our management, and the assessment would include reviews of credit ratings of counterparty’s debt securities or deposits as reported by NRSROs. Overnight and short-term federal funds allow us to warehouse funds and provide balance sheet liquidity to meet unexpected member borrowing demands. The table below presents federal funds sold, the counterparty credit ratings, and the domicile of the counterparty or the domicile of the counterparty’s parent for U.S. branches and agency offices of foreign commercial banks in the U.S. (in thousands): Table 4.7: Federal Funds Sold by Domicile of the Counterparty(a) December 31, 2018 December 31, 2017 Amortized Weighted Amortized Weighted Cost Average Rate Cost Average Rate Mortgage-backed securities Due in one year or less $ 369,989 2.03 % $ 880,774 2.45 % Due after one year through five years 4,602,651 3.16 4,650,579 2.78 Due after five years through ten years 8,201,200 3.07 8,225,685 2.23 Due after ten years 3,561,879 3.11 3,458,160 2.57 Total mortgage-backed securities $ 16,735,719 3.08 % $ 17,215,198 2.46 % December 31, 2018 December 31, 2017 Year ended December 31, 2018 Year ended December 31, 2017 Foreign S&P Moody’s S&P Moody’s Daily Average Balance at Daily Average Balance at Australia AA- AA3 AA- AA3 $ 2,561,822 $ 1,635,000 $ 3,152,370 $ 3,380,000 Austria A A2 A A3 828,929 — 193,214 — Canada A to AA- A3 to AA2 A to AA- A1 to AA2 2,891,912 2,660,000 3,005,438 1,500,000 France A to A+ A1 to AA3 A A2 to AA3 744,753 500,000 684,745 100,000 Netherlands A+ AA3 A+ AA2 840,542 810,000 803,077 800,000 Norway A+ AA2 A+ AA2 742,452 — 929,258 920,000 Sweden A+ to AA- AA3 to AA2 A+ to AA- AA3 to AA2 4,497,885 — 5,462,159 1,790,000 Switzerland A A1 A A1 591,260 — 332,011 — UK A A2 A A1 285,611 — 151,129 — Subtotal 13,985,166 5,605,000 14,713,401 8,490,000 USA A- to AA- BAA1 to AA2 A- to AA- BAA1 to AA2 3,022,181 2,035,000 1,239,290 1,836,000 Total $ 17,007,347 $ 7,640,000 $ 15,952,691 $ 10,326,000 The following table summarizes par value, amortized cost and the carrying value (fair value) of the trading portfolio (in thousands): Table4.8: Trading Securities Trading Securities December 31, 2018 December 31, 2017 Par value $ 5,692,263 $ 1,648,377 Amortized cost $ 5,807,889 $ 1,642,637 Carrying/Fair value $ 5,810,512 $ 1,641,568 The Finance Agency prohibits speculative investments but allows permitted securities to be deemed held for liquidity if invested in a trading portfolio. We may dispose such investments if liquidity needs are met and market conditions deem the sale as advantageous. For more information about fair values of securities in the trading portfolio, see Note 5. Trading Securities in the Notes to the Financial Statements. The following table summarizes economic hedges of fixed-rate trading securities held for liquidity (in thousands): Table4.9: Economic Hedges of Fixed-rate Liquidity Trading Securities Mortgage Loans Held-for-Portfolio Mortgage loans are carried in the Statements of Condition at amortized cost, less allowance for credit losses. The outstanding unpaid principal balance was Mortgage Partnership Finance Program — We provide this product to members as another alternative for them to sell their mortgage production. Loan origination by members and acceptable pricing are key factors that drive growth. Mortgage loans — Conventional and Insured Loans —The following table classifies mortgage loans between conventional loans and loans insured by FHA/VA (in thousands): Table5.1:MPF by Conventional and Insured Loans December 31, 2018 December 31, 2017 Federal Housing Administration and Veteran Administration insured loans $ 227,268 $ 235,232 Conventional loans 2,656,149 2,615,140 Total par MPF loans $ 2,883,417 $ 2,850,372 Mortgage Loans — Loss Sharing and the Credit Enhancement Waterfall —For all loans acquired prior to June 1, 2017, the credit enhancement was computed as the amount that would bring an uninsured loan to “Double A” credit risk. For loans acquired after June 1, 2017, the credit enhancement is computed to a “Single A” credit risk. In the credit enhancement waterfall, we are responsible for the first loss layer. The second loss layer is the credit obligation of the PFI. We assume all residual risk. Also, see financial statements, Note 10. Mortgage Loans Held-for-Portfolio. Loan and PFI Concentration— Loan concentration was in New York State, which is to be expected since the largest PFIs are located in New York. The tables below summarize concentrations — Geographic and PFI: Table5.2:Geographic Concentration of MPF Loans December 31, 2018 December 31, 2017 Number of Amounts Number of Amounts New York State 68.8 % 60.4 % 69.1 % 59.5 % Table5.3:Top Five Participating Financial Institutions — Concentration (par value, dollars in thousands) December 31, 2018 Mortgage Percent of Total Loans Mortgage Loans Bethpage Federal Credit Union $ 260,593 9.04 % New York Community Bank (a) 256,992 8.91 Investors Bank 242,164 8.40 Sterling National Bank (b) 238,840 8.28 Teachers Federal Credit Union 183,052 6.35 All Others 1,701,776 59.02 Total $ 2,883,417 100.00 % December 31, 2017 Mortgage Percent of Total Loans Mortgage Loans New York Community Bank $ 273,060 9.58 % Sterling National Bank (b) 265,526 9.32 Bethpage Federal Credit Union 189,025 6.63 Investors Bank 186,397 6.54 Teachers Federal Credit Union 177,230 6.22 All Others 1,759,134 61.71 Total $ 2,850,372 100.00 % Accrued interest receivable was Other assets, Debt Financing Activity and Consolidated Obligations Our primary source of funds continues to be the issuance of Consolidated obligation bonds and discount notes. Consolidated obligation bonds— The carrying value of Consolidated obligation bonds (CO bonds or Consolidated obligation bonds) was $78.8 billion (par, $78.1 billion) at December 31, 2019, compared to $84.2 billion (par, $83.8 billion) at December 31, Interest rate hedging — From time to time, we hedge discount notes Debt Ratings —· the amount and the period over which the advances were prepaid or repaid; · the amount and timing of any corresponding decreases in activity-based capital; · the profitability of the advances; · the size and profitability of our short- and long-term investments; and · the extent to which Consolidated obligations (funding) matured as the advances were prepaid or repaid. At December 31, 2018, advances borrowed by insurance companies accounted for 21.1% of total advances (17.1% at December 31, 2017). Lending to insurance companies poses a number of unique risks not present in lending to federally insured depository institutions. For example, there is no single federal regulator for insurance companies. They are supervised by state regulators and subject to state insurance codes and regulations. There is uncertaintyabout whether a state insurance commissioner would try to void FHLBNY’s claims on collateral in the event of an insurance company failure. Even if ultimately unsuccessful, such a legal challenge could result in a delay in the liquidation of collateral and a loss of market value. Also see Note 9. Advances to Financial Statements for more information.The FHLBNY has geographic concentrations that may adversely impact its business operations and/or financial condition. By nature of our regulatory charter and our business operations, we are exposed to credit risk as the result of limited geographic diversity. Our advance lending is limited by charter to operations to the four areas — New Jersey, New York, Puerto Rico and the U.S. Virgin Islands. We employ conservative credit rating and collateral policies to limit exposure, but a decline in regional economic conditions could create an exposure to us in excess of collateral held.We have concentrations of mortgage loans in some geographic areas based on our investments in MPF loans and private-label MBS and on the receipt of collateral pledged for advances. To the extent that any of these geographic areas experiences significant declines in the local housing markets, declining economic conditions, or a natural disaster, we could experience increased losses on our investments in the MPF loans or the related MBS or be exposed to a greater risk that the pledged collateral securing related advances would be inadequate in the event of default on such an advance.The FHLBNY relies upon derivative instruments to reduce its interest-rate risk, and changes in our credit ratings may adversely affect our ability to enter into derivative instruments on acceptable terms. Our financial strategies are highly dependent on our ability to enter into derivative instruments on acceptable terms to reduce our interest-rate risk. Rating agencies may from time to time change a rating or issue negative reports, which may adversely affect our ability to enter into derivative instruments with acceptable parties on satisfactory terms in the quantities necessary to manage our interest-rate risk on Consolidated obligations or other financial instruments. This could negatively affect our financial condition and results of operations.Changes in regulatory requirements related to derivative instruments may adversely affect our ability to enter into derivative instruments on acceptable terms. The ongoing implementation of derivatives regulation under the Dodd-Frank Act could adversely impact the FHLBNY’s ability to execute derivatives to hedge interest rate risk, and would increase our compliance costs and negatively impact our results of operations. Derivatives regulations under the Dodd-Frank Act have impacted and will continue to substantially impact the derivatives markets by, among other things: (i) requiring extensive regulatory and public reporting of derivatives transactions; (ii) requiring a wide range of over-the-counter derivatives to be cleared through recognized clearing facilities and traded on exchanges or exchange-like facilities; (iii) requiring the collection and segregation of collateral for most uncleared derivatives; and (iv) significantly broadening limits on the size of positions that may be maintained in specified derivatives. These market structure reforms will make many derivatives products more costly to execute, may significantly reduce the liquidity of certain derivatives markets and could diminish customer demand for covered derivatives. Those changes could negatively impact the FHLBNY’s ability to execute derivatives in a cost efficient manner, which could have an adverse impact on its results of operations. Numerous aspects of the new derivatives regime require costly and extensive compliance systems to be put in place and maintained.The FHLBNY faces competition for advances, loan purchases, and access to funding, which could adversely affect its businesses and the FHLBNY’s efforts to make advance pricing attractive to its members as well as it may adversely affect earnings. Our primary business is making advances to our members, and we compete with other suppliers of wholesale funding, both secured and unsecured, including investment banks, commercial banks and, in certain circumstances, other FHLBanks. Our members have access to alternative funding sources, which may offer more favorable terms than the ones we offer on our advances, including more flexible credit or collateral standards. We may make changes in policies, programs, and agreements affecting members from time to time, including, affecting the availability of and conditions for access to advances and other credit products, the MPF Program, the AHP, and other programs, products, and services, which could cause members to obtain financing from alternative sources. In addition, many of our competitors are not subject to the same regulations, which may enable those competitors to offer products and terms that we are not able to offer.The availability of alternative funding sources that are more attractive to our members may significantly decrease the demand for our advances. Lowering the price of the advances to compete with these alternative funding sourcesmay decrease the profitability of advances. A decrease in the demand for our advances or a decrease in our profitability on advances could adversely affect our financial condition and results of operations.Certain FHLBanks, including the FHLBNY, also compete (primarily with Fannie Mae and Freddie Mac) for the purchase of mortgage loans from members. Some FHLBanks may also compete with other FHLBanks with which their members have a relationship through affiliates. We offer the MPF Program to our members. Competition among FHLBanks for MPF program business may be affected by the requirement that a member and its affiliates can sell loans into the MPF Program through only one FHLBank relationship at a time. Increased competition can result in a reduction in the amount of mortgage loans we are able to purchase and adversely impact income from this part of its business.The FHLBanks, including the FHLBNY, also compete with the U.S. Department of the Treasury, Fannie Mae, Freddie Mac, and other GSEs, as well as corporate, sovereign, and supranational entities, for funds raised through the issuance of debt in the national and global debt markets. Increases in the supply of competing debt products may, in the absence of increases in demand, result in higher debt costs or lower amounts of debt issued at the same cost than otherwise would be the case. Increased competition could adversely affect our ability to have access to funding, reduce the amount of funding available to us, or increase the cost of funding available to us. Any of these effects could adversely affect our financial condition and results of operations.Market and Economic RisksChanges to and replacement of the London Interbank Offered Rate (LIBOR) benchmark interest rate could adversely affect FHLBNY’s business, financial condition, and results of operations. In July 2017, the United Kingdom’s Financial Conduct Authority (FCA), a regulator of financial services firms and financial markets in the U.K., announced that it may no longer compel banks to submit LIBOR rates after 2021. Other financial services regulators and industry groups, including the International Swaps and Derivatives Association and the Alternative Reference Rates Committee (ARRC), have evaluated and are continuing to evaluate the phase-out of LIBOR. The ARRC has settled on the establishment of the Secured Overnight Financing Rate (SOFR) as its recommended alternative to U.S. dollar LIBOR. SOFR is based on a broad segment of the overnight Treasuries repurchase market and is intended to be a measure of the cost of borrowing cash overnight collateralized by Treasury securities. The Federal Reserve Bank of New York began publishing SOFR in April 2018. During the third quarter of 2018, several market participants began utilizing SOFR through the issuance of variable rate debt securities indexed to SOFR. In November 2018, the FHLBank System offered its first SOFR linked consolidated obligation and the Bank began offering SOFR linked advances. As noted throughout this report, many of the FHLBNY’s assets and liabilities are indexed to LIBOR. The market transition away from LIBOR is expected to be gradual and complicated, including the development of term and credit adjustments to accommodate differences between LIBOR and alternative reference rates such as SOFR. Introduction of an alternative rate also may introduce additional basis risk for market participants, including the FHLBNY, as an alternative index is utilized along with LIBOR. The FHLBNY is planning for the eventual replacement of its LIBOR-indexed instruments away from the LIBOR benchmark interest rate, including the possibility of SOFR as the dominant replacement. The FHLBNY is not currently able to predict whether LIBOR will remain as an available rate index, whether and when an alternative rate such as SOFR will become a widely accepted market benchmark rate, or what the impact of a possible transition to SOFR or an alternate replacement will have on our business, financial condition, and results of operations.The FHLBNY’s funding depends on its ability to access the capital markets. Our primary source of funds is the sale of Consolidated obligations in the capital markets. Our ability to obtain funds through the sale of Consolidated obligations depends in part on prevailing conditions in the capital markets, which are, for the most part, beyond our control. Accordingly, we may not be able to obtain funding on acceptable terms, if at all. If we cannot access funding when needed on acceptable terms, our ability to support and continue operations could be adversely affected, which could negatively affect our financial condition and results of operations. If additional reforms are legislated over money market funds, they may have an adverse impact on the FHLBank discount note pricing, given that the funds are significant sponsors of short-term FHLBank debt. Ongoing changes to the regulatory environment that affect bank counterparties and debt underwriters could adversely affect our ability to access the debt markets or the cost of that funding.Changes in interest rates could significantly affect the FHLBNY’s financial condition and results of operations. We earn income primarily from the spread between interest earned on our outstanding advances, investments and shareholders’ capital, and interest paid on our Consolidated obligations and other interest-bearing liabilities. Although we use various methods and procedures to monitor and manage our exposure to changes in interest rates, we may experience instances when either our interest-bearing liabilities will be more sensitive to changes in interest rates than our interest-earning assets, or vice versa. In either case, interest rate movements contrary to our position could negatively affect our financial condition and results of operations. Moreover, the effect of changes in interest rates can be exacerbated by prepayment and extension risk, a risk that mortgage related assets will be refinanced by the mortgagor in low interest rate environments or will remain outstanding longer than expected at below market yields when interest rates increase. The possibility of negative interest rates on U.S. Treasury or other market instruments could adversely affect our results of operations by, for example, reducing asset yields or spreads, creating operating and operating system issues, or having other adverse impacts on our business.Economic downturns and changes in federal monetary policy could have an adverse effect on the FHLBNY’s business and its results of operations. Our businesses and results of operations are sensitive to general business and economic conditions. These conditions include short- and long-term interest rates, inflation, money supply, fluctuations in both debt and equity capital markets, and the strength of the United States economy and the local economies in which we conduct our business. If any of these conditions deteriorate, our businesses and results of operations could be adversely affected. For example, a prolonged economic downturn could result in members needing fewer advances. In addition, our business and results of operations are significantly affected by the fiscal and monetary policies of the federal government and its agencies, including the Federal Reserve Board, which regulates the supply of money and credit in the United States. The Federal Reserve Board’s policies directly and indirectly influence the yield on interest-earning assets and the cost of interest-bearing liabilities.Credit RisksChanges in the credit ratings on FHLBank System Consolidated obligations may adversely affect the cost of Consolidated obligations, which could adversely affect FHLBNY’s financial condition and results of operations. FHLBank System Consolidated obligations have been assigned Aaa/P-1 and AA+/A-1+ ratings by Moody’s and S&P. The outlook for the FHLBank debt by both S&P and Moody’s is stable. Rating agencies may from time to time change a rating or issue negative reports, which may adversely affect the cost of funds of one or more FHLBanks, including the FHLBNY, and the ability to issue Consolidated obligations on acceptable terms. A higher cost of funds or the impairment of the ability to issue Consolidated obligations on acceptable terms could also adversely affect our financial condition and results of operations. Rating agency downgrades of the debt of the United States could also cause a downgrade in the rating of the FHLBanks.The FHLBNY’s financial condition and results of operations could be adversely affected by FHLBNY’s exposure to credit risk. We have exposure to credit risk in that the market value of an obligation may decline as a result of deterioration in the creditworthiness of the obligor or the credit quality of a security instrument. In addition, we assume secured and unsecured credit risk exposure associated with the risk that a borrower or counterparty or a derivative clearing organization could default and we could suffer a loss if we could not fully recover amounts owed to us on a timely basis. A credit loss, if material, will have an adverse effect on the FHLBNY’s financial condition and results of operations.We are subject to credit-risk exposures related to the loans that back our investments. Increased delinquency rates and credit losses beyond those currently expected could adversely impact the yield on or value of those investments. The carrying value of our portfolio of private-label MBS was $142.6 million at December 31, 2018. Since 2006, we have made no acquisitions of private-label MBS. Our investments in private-label MBS are primarily backed by prime and subprime mortgage loans, and many of these securities are projected to sustain credit losses under current assumptions, and have been downgraded by various Nationally Recognized Statistical Rating Organizations (NRSROs). See Item 7. Management’s Discussion and Analysis of Financial Condition and Results of Operations for a description of our portfolio of investments in these securities.Credit losses have been insignificant in all periods in this report, but if we were to experience high rates of delinquency and an increase in loss severity trends on the loans underlying the private-label MBS, and facechallenging macroeconomic factors, such as continuing high unemployment levels and higher than expected troubled residential mortgage loans, we may have to recognize additional credit losses.We have also invested in securities issued by Housing Finance Agencies (HFA) as held-to-maturity investments. The cash flows on these securities are based on the performance of the underlying loans, although these securities generally do include additional credit enhancements. At the time of purchase, the HFA securities were rated double-A (or its equivalent rating), some have since been downgraded. The portfolio of HFA securities (carrying value was $1.2 billion at December 31, 2018 and $1.1 billion at December 31, 2017) reported gross unrealized losses of $24.2 million at December 31, 2018 and $33.0 million at December 31, 2017. Although we have determined that none of the securities is other-than-temporarily impaired, we could realize credit losses from these securities should the underlying loans underperform our projectionsA rise in delinquency rates on our investments in MPF loans or related adverse trends could adversely impact our results of operation and financial condition. As discussed in Item 7. Management’s Discussion and Analysis of Financial Condition and Results of Operations — Financial Condition, our methodology for determining our allowance for loan losses is determined based on our investments in MPF loans and considers factors relevant to those investments. Important factors in determining this allowance are the collateral values supporting our investments in conventional mortgage loans. The allowance of $0.8 million at December 31, 2018 may prove insufficient if macroeconomic factors worsen, housing prices fall and collateral values decline. To the extent those risks are realized, we may determine to increase our allowance for loan losses, which would adversely impact our results of operations and financial condition.Insufficient collateral protection could adversely affect the FHLBNY’s financial condition and results of operations. We require that all outstanding advances be fully collateralized. In addition, for mortgage loans that we purchased under the MPF Program, we require that members fully collateralize the outstanding credit enhancement obligations not covered through the purchase of supplemental mortgage insurance. We evaluate the types of collateral pledged by our members and assign borrowing capacities to the collateral based on the risks associated with that type of collateral. If we have insufficient collateral before or after an event of payment default by the member, or we are unable to liquidate the collateral for the value assigned to it in the event of a payment default by a member, we could experience a credit loss on advances, which could adversely affect our financial condition and results of operations.The FHLBNY may become liable for all or a portion of the Consolidated obligations of the FHLBanks, which could negatively impact the FHLBNY’s financial condition and results of operations. We are jointly and severally liable along with the other FHLBanks for the Consolidated obligations issued through the Office of Finance. Dividends on, redemption of, or repurchase of shares of our capital stock are not permitted unless the principal and interest due on all Consolidated obligations have been paid in full. If another Federal Home Loan Bank were to default on its obligation to pay principal or interest on any Consolidated obligations, the Finance Agency may allocate the outstanding liability among one or more of the remaining FHLBanks on a pro rata basis or on any other basis the Finance Agency may determine. As a result, our ability to pay dividends on, to redeem, or to repurchase shares of capital stock could be affected by the financial condition of one or more of the other FHLBanks. However, no FHLBank has ever defaulted on its debt and no FHLBank has ever been asked to assume the debt payments of another FHLBank since the FHLB System was established in 1932.Liquidity RisksThe FHLBNY may not be able to meet its obligations as they come due or meet the credit and liquidity needs of its members in a timely and cost-effective manner. We seek to be in a position to meet our members’ credit and liquidity needs and pay our obligations without maintaining excessive holdings of low-yielding liquid investments or being forced to incur unnecessarily high borrowing costs. In addition, we maintain a contingent liquidity plan designed to enable us to meet our obligations and the liquidity needs of members in the event of operational disruptions or short-term disruptions in the capital markets. Our ability to manage our liquidity position or our contingent liquidity plan may not enable us to meet our obligations and the credit and liquidity needs of our members, which could have an adverse effect on our financial condition and results of operations.Operational RisksThe FHLBNY relies heavily on information systems and other technology. We rely heavily on information systems and other technology to conduct and manage our business. We have implemented a business continuity plan that includes the maintenance of alternate sites for data processing and office functions. All critical systems are tested annually for recovery readiness and all business units update and test their respective disaster recovery plans annually. If we were to experience a failure or interruption in any of these systems or other technology and our disaster recovery capabilities were also impacted, it would affect our ability to conduct and manage our business effectively, including advance and hedging activities. This may adversely affect member relations, risk management, and negatively affect our financial condition and results of operations.Continually evolving cybersecurity or other technological risks could result in the disclosure of confidential client or customer information, damage to the FHLBNY’s reputation, additional costs to the FHLBNY, regulatory penalties and financial losses. A significant portion of FHLBNY’s operations relies heavily on the secure processing, storage and transmission of financial and other information. The FHLBNY’s computer systems, software and networks are subject to similar vulnerabilities as other companies highly reliant on technology for operational processing. These risks include unauthorized access, loss or destruction of data, unavailability of service, computer viruses or other malicious code, cyber-attacks and other events. These threats may derive from human error, fraud or malice on the part of employees or third parties, or may result from accidental technological failure. If one or more of these events occurs, it could result in the disclosure of confidential information, damage to FHLBNY’s reputation with its customers, additional costs to the FHLBNY (such as repairing systems or adding new personnel or protection technologies), regulatory penalties and financial losses, to the FHLBNY. Such events could also cause interruptions or malfunctions in the operations of the FHLBNY data systems (such as the lack of availability of FHLBNY’s online advance transaction system with members).Deteriorating market conditions increase the risk that the FHLBNY’s models may produce unreliable results. We use market-based information as inputs to our financial models, which are used in making operational decisions and to derive estimates for use in our financial reporting processes. The downturn in the housing and mortgage markets created additional risk regarding the reliability of the models, particularly since the models are regularly adjusted in response to rapid changes in the actions of consumers and mortgagees to changes in economic conditions. This may increase the risk that our models could produce unreliable results or estimates that vary widely or prove to be inaccurate.The departure of key personnel could adversely impact the Bank’s operations. We rely on key personnel for many of our functions. Our success in retaining such personnel is important to our ability to conduct our operations and measure and maintain risk and financial controls. The ability to retain key personnel could be challenged as the U.S. employment market improves. We maintain a succession planning program in which we attempt to identify and develop employees who can potentially replace key personnel in the event of their departure, whether due to resignation or normal retirement.A natural disaster in the Bank’s region could adversely affect the Bank’s profitability and financial condition. A severe natural disaster could damage the Bank’s physical infrastructure and have an adverse effect on the FHLBNY’s business. Furthermore, portions of the Bank’s region are subject to risks from hurricanes, tornadoes, floods or other natural disasters. These natural disasters could damage or dislocate the facilities of the Bank’s members, may damage or destroy collateral that members have pledged to secure advances, may adversely affect the viability of the Bank’s mortgage purchase programs or the livelihood of borrowers of the Bank’s members, or otherwise could cause significant economic dislocation in the affected areas of the Bank’s region.Failures of critical vendors and other third parties could disrupt the Banks’ ability to conduct and manage its businesses. We rely on vendors and other third parties to perform certain critical services. A failure in, or an interruption to, one of more of those services could adversely affect the business operations of the Bank. The use of vendors and other third parties also exposes the Bank to the risk of loss of confidential information or other harm. To the extent that vendors do not conduct their activities under appropriate standards, the Bank could also be exposed to reputational risk.Unresolved Staff Comments. Item 2. Properties. At December 31, 2018, we occupied approximately 66,000 square feet of leased office space at 101 Park Avenue, New York, New York. We also maintain 52,000 square feet of leased office space at 70 Hudson Street, Jersey City, New Jersey, principally as an operations center.Item 3. Legal Proceedings. Item 3.Legal Proceedings.From time to time, the FHLBNY is involved in disputes or regulatory inquiries that arise in the ordinary course of business. At the present time, there are no pending claims against the FHLBNY that, if established, are reasonably likely to have a material effect on the FHLBNY’s financial condition, results of operations or cash flows or that are otherwise reasonably likely to be material to the FHLBNY.Mine Safety Disclosures. Not applicable.Market for Registrant’s Common Equity, Related Stockholder Matters and Issuer Purchases of Equity Securities. 2019 2018 2017 Month Paid Amount Dividend Rate Amount Dividend Rate Amount Dividend Rate November $ 84,900 6.35 % $ 107,373 6.90 % $ 97,005 6.00 % August 92,189 6.35 103,573 6.75 85,449 5.50 May 87,607 6.35 105,329 6.50 76,646 5.00 February 101,347 6.90 102,484 6.50 87,638 5.65 $ 366,043 (b) $ 418,759 (b) $ 346,738 (b) (a) The table above reports dividend on a paid basis and includes payments to former members as a result of having been acquired by a non-member institution. We conduct our business in advanceswell as members. Dividends paid to former members were $0.4 million, $1.2 million and mortgages exclusively with stockholder$1.6 million for the years ended December 31, 2019, 2018 and 2017.(b) Includes dividends paid to non-members; payments to non-members are classified as interest expense for accounting purposes. Dividends are accrued for former members, and housing associates (1). There is no established marketplace for FHLBNY stockrecorded as FHLBNY stock is not publicly traded. It may be redeemed at par value upon request, subject to regulatory limits. These shares of stock in the FHLBNY are registered under the Securities Exchange Act of 1934, as amended. At December 31, 2018, we had 328 members who held 60,657,989 shares ofinterest expense on mandatorily redeemable capital stock between them. At December 31, 2018, former members held 58,450 shares. At December 31, 2017, we had 330 members who held 67,500,045 shares of capital stock between them. At December 31, 2017, former members held 199,447 shares. Capital stock held by former members, and is classified as a liability, and deemedcharge to be mandatorily redeemable under the accounting guidance for certain financial instruments with characteristics of both liabilities and equity.Our recent quarterly cash dividendsNet income. Dividends on capital stock held by members are outlinednot accrued. Dividends are paid in arrears typically in the table below. No dividends were paidsecond month after the quarter end in which the form of stock. Dividend paymentsdividend is earned, and earnings retention are subjectis a direct charge to be determined by our Board of Directors, at its discretion, and within the regulatory framework promulgated by the Finance Agency. Our Retained Earnings and Dividends Policy outlined in the section titled Retained Earnings and Dividends under Part I, Item 1 of this Annual Report on Form 10-K provides additional information.retained earnings.(1) Housing associates are defined as non-stockholder entities that (i) are approved mortgagees under Title II of the National Housing Act, (ii) are chartered under law and have succession, (iii) are subject to inspection and supervision by a governmental agency, (iv) lend their own funds as their principal activity in the mortgage field, and (v) have a financial condition such that advances may be safely made to that entity. At December 31, 2018,2019, we had 9 housing associates as members.customers. Advances made to housing associates totaled $5.3$5.2 million, and the mortgage loans acquired from housing associates were immaterial in any periods in this report.Dividends from a calendar quarter’s earnings are paid (a) subsequent to the end of that calendar quarter as summarized below. Dividend payments reported below are on Class B Stock, which includes payments to non-members on capital stock reported as mandatorily redeemable capital stock in the Statements of Condition. (dollars in thousands):(a)The table above reports dividend on a paid basis and includes payments to former members as well as members. Dividends paid to former members were $1.2 million, $1.6 million and $1.2 million for the years ended December 31, 2018, 2017 and 2016.(b)Includes dividends paid to non-members; payments to non-members are classified as interest expense for accounting purposes. Dividends are accrued for former members, and recorded as interest expense on mandatorily redeemable capital stock held by former members, and is a charge to Net income. Dividends on capital stock held by members are not accrued. Dividends are paid in arrears typically in the second month after the quarter end in which the dividend is earned, and is a direct charge to Retained earnings.Issuer Purchases of Equity SecuritiesWe are exempt from disclosures of unregistered sales of common equity securities or securities issued through the Office of Finance that otherwise would have been required under Item 701 of the SEC’s Regulation S-K. By the same no-action letter, we are also exempt from disclosure of securities repurchases by the issuer that otherwise would have been required under Item 703 of Regulation S-K.Selected Financial Data. Statements of Condition Years ended December 31, (dollars in millions) 2019 2018 2017 2016 2015 Investments(a) $ 56,892 $ 35,741 $ 33,069 $ 30,939 $ 26,167 Advances 100,695 105,179 122,448 109,257 93,874 Mortgage loans held-for-portfolio, net of allowance for credit losses(b) 3,173 2,927 2,897 2,747 2,524 Total assets 162,062 144,381 158,918 143,606 123,239 Deposits and borrowings 1,194 1,063 1,196 1,241 1,350 Consolidated obligations, net Bonds 78,764 84,154 99,288 84,785 67,716 Discount notes 73,959 50,640 49,614 49,358 46,850 Total consolidated obligations 152,723 134,794 148,902 134,143 114,566 Mandatorily redeemable capital stock 5 6 20 31 19 AHP liability 154 162 132 125 113 Capital Capital stock 5,779 6,066 6,750 6,308 5,585 Retained earnings Unrestricted 1,116 1,103 1,067 1,029 967 Restricted 685 591 479 383 303 Total retained earnings 1,801 1,694 1,546 1,412 1,270 Accumulated other comprehensive income (loss) (48 ) (13 ) (55 ) (96 ) (136 ) Total capital 7,532 7,747 8,241 7,624 6,719 Equity to asset ratio(c) 4.65 % 5.37 % 5.19 % 5.31 % 5.45 % Statements of Condition Years ended December 31, Averages(See note below; dollars in millions) 2019 2018 2017 2016 2015 Investments(a) $ 45,725 $ 43,370 $ 36,835 $ 29,337 $ 26,944 Advances 95,838 107,971 109,188 96,201 91,401 Mortgage loans held-for-portfolio, net of allowance for credit losses 3,008 2,899 2,838 2,631 2,362 Total assets 145,506 154,795 149,581 129,260 122,155 Interest-bearing deposits and other borrowings 1,131 1,032 1,768 1,431 1,213 Consolidated obligations, net Bonds 77,671 93,529 93,352 73,174 69,177 Discount notes 58,318 51,657 45,895 46,508 43,628 Total consolidated obligations 135,989 145,186 139,247 119,682 112,805 Mandatorily redeemable capital stock 6 14 22 24 19 AHP liability 159 147 123 114 107 Capital Capital stock 5,545 6,166 6,259 5,712 5,299 Retained earnings Unrestricted 1,091 1,076 1,019 977 875 Restricted 636 532 423 337 252 Total retained earnings 1,727 1,608 1,442 1,314 1,127 Accumulated other comprehensive income (loss) (36 ) 16 (86 ) (181 ) (149 ) Total capital 7,236 7,790 7,615 6,845 6,277 Operating Results and Other Data (dollars in millions) (except earnings and dividends per Years ended December 31, share, and headcount) 2019 2018 2017 2016 2015 Net income $ 473 $ 560 $ 479 $ 401 $ 415 Net interest income(d) 667 797 722 556 554 Dividends paid in cash(e) 366 417 345 259 228 AHP expense 52 62 53 45 46 Return on average equity(f)(i) 6.53 % 7.20 % 6.30 % 5.86 % 6.61 % Return on average assets(i) 0.32 % 0.36 % 0.32 % 0.31 % 0.34 % Net OTTI impairment losses (1 ) - - - - Other non-interest income (loss) 35 (24 ) (58 ) 7 25 Total other income (loss) 34 (24 ) (58 ) 7 25 Operating expenses(g) 151 127 112 (j) 99 (j) 103 Finance Agency and Office of Finance expenses 17 16 15 13 14 Total other expenses(k) 176 151 131 115 117 Operating expenses ratio(h)(i) 0.10 % 0.08 % 0.07 %(j) 0.08 % 0.08 % Earnings per share $ 8.52 $ 9.09 $ 7.66 $ 7.02 $ 7.83 Dividends per share $ 6.49 $ 6.66 $ 5.54 $ 4.73 $ 4.22 Headcount (Full/part time) 342 314 308 280 273 Note — Average balance calculation. For most components of the average balances, a daily weighted average balance is calculated for the period. When daily weighted average balance information is not available, a simple monthly average balance is calculated.(a)Operating Results and Other Data(a)Investments include trading securities, available-for-sale securities, held-to-maturity securities, grantor truststrust owned by the FHLBNY, securities purchased under agreements to resell, federal funds, loans to other FHLBanks, and other interest-bearing deposits.(b) Allowances for credit losses were $0.7 million, $0.8 million, $1.0 million, $1.6 million $0.3 million and $4.5$0.3 million for the years ended December 31, 2019, 2018, 2017, 2016 2015 and 2014.2015.(c) Equity to asset ratio is Capital stock plus Retained earnings and Accumulated other comprehensive income (loss) as a percentage of Total assets. (d) Net interest income is net interest income before the provision for credit losses on mortgage loans. (e) Excludes dividends accrued to non-members classified as interest expense under the accounting standards for certain financial instruments with characteristics of both liabilities and equity. (f) Return on average equity is Net income as a percentage of average Capital Stock plus average retained earnings and average Accumulated other comprehensive income (loss). (g) Operating expenses include Compensation and Benefits. (h) Operating expenses as a percentage of Total average assets. (i) All percentage calculations are performed using amounts in thousands, and may not agree if calculations are performed using amounts in millions. (j) Previously reported comparative numbers have been reclassified to conform to the retrospective adoption of ASU 2017-07 Compensation — Retirement Benefits (Topic 715). The ASU requires only the service cost component of Net periodic benefit cost of pension expenses to be included in compensation costs. (k) Includes Operating expenses, Compensation and benefits, Finance Agency and Office of Finance expenses and Other expenses. and 2017 are presented below (in thousands): 2019 4th Quarter(a) 3rd Quarter 2nd Quarter 1st Quarter Interest income $ 828,929 $ 931,927 $ 1,022,556 $ 997,534 Interest expense (665,025 ) (769,533 ) (858,980 ) (820,318 ) Net interest income 163,904 162,394 163,576 177,216 Provision for credit losses on mortgage loans (16 ) (134 ) 275 17 Other income 26,186 (4,173 ) (1,303 ) 13,178 Other expenses and assessments (61,818 ) (56,675 ) (54,466 ) (55,573 ) Net other expenses (35,648 ) (60,982 ) (55,494 ) (42,378 ) Net income $ 128,256 $ 101,412 $ 108,082 $ 134,838 2018 4th Quarter(b) 3rd Quarter 2nd Quarter 1st Quarter(c) Interest income $ 962,673 $ 964,877 $ 888,289 $ 770,645 Interest expense (777,089 ) (754,160 ) (680,584 ) (577,626 ) Net interest income 185,584 210,717 207,705 193,019 Provision for credit losses on mortgage loans (32 ) 95 (72 ) 380 Other income (5,108 ) 506 (676 ) (18,593 ) Other expenses and assessments (57,777 ) (54,906 ) (51,783 ) (48,581 ) Net other expenses (62,917 ) (54,305 ) (52,531 ) (66,794 ) Net income $ 122,667 $ 156,412 $ 155,174 $ 126,225 (a) Interim period — Infrequently occurring items recognized.(a)FirstFourth quarter 20182019 —Net— Net income declined due to unrealized fair value lossesbenefited from valuation gains recorded in Other income (loss) on standalone derivatives and U.S. Treasury Securities. Operating expenses were higher primarily due to increase in economic hedges.head count and technology related expenses.(b) Fourth quarter 2018 — Net income declined due to lower Net interest income and fair value losses on standalone derivatives in economic hedges. (c) First quarter 20172018 — Net—Net income declined due to the Lehman litigation settlement charge of $70.0 million.unrealized fair value losses on standalone derivatives in economic hedges.Management’s Discussion and Analysis of Financial Condition and Results of Operations. ·• the Bank’s projections regarding income, retained earnings, dividend payouts, and the repurchase of excess capital stock; ·• the Bank’s statements related to gains and losses on derivatives, future other-than-temporarycredit and impairment charges, and future classification of securities;·• the Bank’s expectations relating to future balance sheet growth; ·• the LIBOR interest rate transition to other alternatives; ·• the Bank’s targets under the Bank’s retained earnings plan; and ·• the Bank’s expectations regarding the size of its mortgage loan portfolio, particularly as compared to prior periods; and ·• the Bank’s statements related to reform legislation. Actual results may differ from forward-looking statements for many reasons, including but not limited to:•·changes in economic and market conditions; ·• changes in demand for Bank advances and other products resulting from changes in members’ deposit flows and credit demands or otherwise; ·• an increase in advance prepayments as a result of changes in interest rates (including negative interest rates) or other factors; ·• the volatility of market prices, rates, and indices that could affect the value of collateral held by the Bank as security for obligations of Bank members and counterparties to interest rate exchange agreements and similar agreements; ·• political events, including legislative developments that affect the Bank, its members, counterparties, and/or investors in the Consolidated obligations (“COs”) of the FHLBanks; ·• competitive forces including, without limitation, other sources of funding available to Bank members, other entities borrowing funds in the capital markets, and the ability to attract and retain skilled employees; ·• the pace of technological change and the ability of the Bank to develop and support technology and information systems, including the internet, sufficient to manage the risks of the Bank’s business effectively; ·• changes in investor demand for COs and/or the terms of interest rate exchange agreements and similar agreements; ·• timing and volume of market activity; ·• ability to introduce new or adequately adapt current Bank products and services and successfully manage the risks associated with those products and services, including new types of collateral used to secure advances; ·• risk of loss arising from litigation filed against one or more of the FHLBanks; ·• realization of losses arising from the Bank’s joint and several liability on COs; ·• risk of loss due to fluctuations in the housing market; ·• inflation or deflation; ·• issues and events within the FHLBank System and in the political arena that may lead to regulatory, judicial, or other developments that may affect the marketability of the COs, the Bank’s financial obligations with respect to COs, and the Bank’s ability to access the capital markets; ·• the availability of derivative financial instruments of the types and in the quantities needed for risk management purposes from acceptable counterparties; ·• significant business disruptions resulting from natural or other disaster,disasters (including, but not limited to, health emergencies such as pandemics or epidemics), acts of war or terrorism;• ·the effect of new accounting standards, including the development of supporting systems; ·• membership changes, including changes resulting from mergers or changes in the principal place of business of Bank members; ·• the soundness of other financial institutions, including Bank members, nonmember borrowers, other counterparties, and the other FHLBanks; and ·• the willingness of the Bank’s members to do business with the Bank whether or not the Bank is paying dividends or repurchasing excess capital stock. Risks and other factors could cause actual results of the Bank to differ materially from those implied by any forward-looking statements. These risk factors are not exhaustive. The Bank operates in changing economic and regulatory environments, and new risk factors will emerge from time to time. Management cannot predict such new risk factors nor can it assess the impact, if any, of such new risk factors on the business of the Bank or the extent to which any factor, or combination of factors, may cause actual results to differ materially from those implied by any forward-looking statements.Organization of Management’s Discussion and Analysis (MD&A).This MD&A is designed to provide information that will assist the readers in better understanding our financial statements, the changes in key items in our financial statements from year to year, the primary factors driving those changes as well as how accounting principles affect our financial statements. The MD&A is organized as follows:2929323334384245515557636465Liquidity, Cash Flows, Short-Term Borrowings and Short-Term Debt69747476808387Operating Expenses, Compensation and Benefits, and Other Expenses909192MD&A TABLE REFERENCE31 This overview of management’s discussion and analysis highlights selected information and may not contain all of the information that is important to readers of this Form 10-K. For a more complete understanding of events, trends and uncertainties, as well as the liquidity, capital, credit and market risks, and critical accounting estimates, affecting the Federal Home Loan Bank of New York (FHLBNY or Bank), this Form 10-K should be read in its entirety.Cooperative business model. As a cooperative, we seek to maintain a balance between our public policy mission and our ability to provide adequate returns on the capital supplied by our members. We achieve this balance by delivering low-cost financing to members to help them meet the credit needs of their communities and also by paying a dividend on members’ capital stock. Our financial strategies are designed to enable us to expand and contract in response to member credit needs. By investing capital in high-quality, short- and medium-term financial instruments, we maintain sufficient liquidity to satisfy member demand for short- and long-term funds, repay maturing Consolidated obligations, and meet other obligations. The dividends we pay are largely the result of earnings on invested member capital, net earnings on advances to members, mortgage loans and investments, offset in part by operating expenses and assessments. Our Board of Directors and Management determine the pricing of member credit and dividend policies based on the needs of our members and the cooperative.Business segment. We manage our operations as a single business segment. Advances to members are our primary focus and the principal factor that impacts our operating results.2018 HighlightsNet income — For the FHLBNY, Net income is Net interest income, minus credit losses on mortgage loans, plus Other income (loss), less Other expenses and Assessments allocated for the FHLBNY’s Affordable Housing Program. 2018 Net income was $560.5 million, an increase of $81.0 million, or 16.9%, compared to 2017.Summarized below are the primary components of our Net income:Net interest income — 2018 Net interest income was $797.0 million, an increase of $75.5 million, or 10.5%, from 2017. Net interest income is our principal source of Net income. It represents the difference between income on interest-earning assets and expense on interest-bearing liabilities. Net interest income is typically driven by earning assets and the net interest spread earned in the period. Other significant drivers would be prepayment fees earned when advances are early terminated by our borrowing members, and the impact on interest income and expense accruals by the interest rate swaps that hedge our assets and liabilities.Volume related changes in assets and funding mix made a positive year-over-year contribution of $79.6 million. Yield related changes resulted in a year-over-year decline of $4.1 million. Average interest-earning assets totaled $154.1 billion in 2018, compared to $148.8 billion in 2017. Net interest spread was 42 basis points in 2018, compared to 43 basis points in 2017. Net interest margin, a measure of margin efficiency, which is calculated as Net interest income divided by average earning assets, was 52 basis points in 2018, compared to 48 basis points in 2017.Funding costs continued to benefit from the increased utilization of shorter-term LIBOR-indexed CO bond floaters. CO LIBOR floaters and CO discount notes, which have been in demand by money fund investors, have largely become the primary funding vehicle for the FHLBNY.Hedging under ASC 815 benefited Net interest income in 2018, contributing $150.2 million in interest accruals, in contrast to an expense of $161.3 million in 2017. The rising 3-month LIBOR has driven up the LIBOR-indexed cash flows we received, such that the net cash flows we received on swaps hedging advances made the significant positive contribution to 2018 Net interest income. While the rising LIBOR had an adverse impact on LIBOR-indexed cash flows paid on swaps hedging funding debt, the negative impact was not as significant.Other income (loss) — In 2018, Other income (loss) reported a loss of $23.9 million, compared to a loss of $58.0 million in 2017.·Service fees and other are primarily correspondent banking fees and fee revenues from financial letters of credit. Revenues were $18.4 million in the current year, compared to $15.8 million in 2017.·Financial instruments carried at fair values reported a net valuation gain of $0.2 million in the current year, compared to a net loss of $4.5 million in 2017. For more information, see financial statements, Fair Value Option Disclosures in Note 18. Fair Values of Financial Instruments. Also see Table 10.10 Other Income (Loss) and accompanying discussions in this MD&A.·Derivative and hedging activities reported a net loss of $40.8 million in the current year, compared to a net gain of $1.9 million in 2017. For more information, see financial statements, Earnings Impact of Derivatives and Hedging Activities disclosures in Note 17. Derivatives and Hedging Activities. Also see Table 10.12 Earnings Impact of Derivatives and Hedging Activities — By Financial Instrument Type and accompanying discussions in this MD&A.· In 2017, the Bank paid $70.0 million to settle the Lehman litigation and explains the decline in the reported loss in 2018. The charge was recorded in Other income (loss) as a provision for litigation settlement.Other expenses were $150.7 million in the current year, compared to $130.9 million in 2017. Other expenses are primarily Operating expenses, Compensation and benefits, and our share of expenses of the Office of Finance and the Federal Housing Finance Agency.· Operating expenses were $47.9 million in the current year, up from $40.7 million in 2017. Expense increases were primarily due to new long-term lease agreement executed in the second half of 2017.· Compensation and benefits expenses were $79.0 million in the current year, up from $71.1 million in 2017.· The expenses allocated for our share of the costs to operate the Office of Finance and the Federal Housing Finance Agency were $15.9 million in the current year, compared to $14.7 million in 2017.· Other expenses were $8.0 million in the current year, up from $4.5 million in 2017. Expense increase was primarily due to contributions towards disaster relief programs and non-service costs of employer sponsored pension programs.AHP assessments allocated from Net income were $62.4 million in the current year, compared to $53.4 million in 2017. Assessments are calculated as a percentage of Net income, and changes in allocations were in parallel with changes in Net income.Dividend payments — Four quarterly cash dividends were paid in 2018 for a total of $6.66 per share of capital, compared to $5.54 in 2017 and $4.73 in 2016.Financial Condition — December 31, 2018 compared to December 31, 2017Total assets decreased to $144.4 billion at December 31, 2018 from $158.9 billion at December 31, 2017, a decrease of $14.5 billion, or 9.1%.Cash at banks was $85.4 million at December 31, 2018, compared to $127.4 million at December 31, 2017. Money market investments at December 31, 2018 were $7.6 billion in federal funds sold and $4.1 billion in overnight resale agreements. At December 31, 2017, money market investments were $10.3 billion in federal funds sold and $2.7 billion in overnight resale agreements.Advances — Par balances decreased at December 31, 2018 to $105.4 billion, compared to $122.7 billion at December 31, 2017. Short-term fixed-rate advances decreased by 37.0% to $15.0 billion at December 31, 2018, compared to $23.8 billion at December 31, 2017. ARC advances, which are adjustable-rate borrowings, decreased by 37.0% to $23.3 billion at December 31, 2018, compared to $37.1 billion at December 31, 2017.Long-term investment debt securities — Long-term investment debt securities are designated as available-for-sale (AFS) or held-to-maturity (HTM). The heavy concentration of GSE and Agency issued (GSE-issued) securities, and a declining balance of private-label MBS, less than 1%, is our investment profile.In the AFS portfolio, long-term investments at December 31, 2018 were floating-rate GSE-issued mortgage-backed securities carried on the balance sheet at fair values of $422.2 million, compared to $528.6 million at December 31, 2017.In the HTM portfolio, long-term investments at December 31, 2018 were predominantly GSE-issued fixed- and floating-rate mortgage-backed securities and housing finance agency bonds. Securities in the HTM portfolio are recorded at amortized cost, adjusted for any OTTI. Fixed- and floating-rate mortgage-backed securities (MBS), including private-label mortgage-backed securities (PLMBS), in the HTM portfolio, were $16.3 billion at December 31, 2018 and $16.7 billion at December 31, 2017. Investments in PLMBS were less than 1% of the HTM portfolio.In the HTM portfolio, housing finance agency bonds, primarily New York and New Jersey, were carried at an amortized cost basis of $1.2 billion at December 31, 2018 and $1.1 billion at December 31, 2017.Trading securities (liquidity portfolio) — The objective of the trading portfolio is to meet short-term contingency liquidity needs. During the periods in this report, we have invested in highly liquid U.S. Treasury bills, U.S. Treasury notes and GSE-issued securities. Trading investments are carried at fair value, with changes recorded through earnings. At December 31, 2018, trading investments were $5.3 billion in U.S. Treasury notes, $502.8 million in GSE securities, and $3.3 million in Ambac corporate notes. At December 31, 2017, trading investments were $239.1 million in U.S. Treasury bills, $1.0 billion in U.S. Treasury notes and $356.9 million in GSE securities.We periodically evaluate our liquidity needs and may dispose these liquidity investments as deemed prudent based on liquidity and market conditions. The Finance Agency prohibits speculative trading practices but allows permitted securities to be deemed held for liquidity if invested in a trading portfolio.Equity Investments — We own grantor trusts that are invested in highly liquid registered mutual funds, which were reclassified as of January 1, 2018 from AFS to Equity Investments. These investments were carried on the balance sheet at fair values of $48.2 million at December 31, 2018. At December 31, 2017, the funds were classified as AFS and carried at fair values of $48.6 million.Mortgage loans held-for-portfolio — Mortgage loans were investments in Mortgage Partnership Finance loans (MPF or MPF Program). Unpaid principal balance of MPF loans stood at $2.9 billion at December 31, 2018, an increase of $33.0 million from the balance at December 31, 2017. Loans are primarily fixed-rate, single-family mortgages acquired through the MPF Program (operated by the Federal Home Loan bank of Chicago). Credit performance has been strong and delinquency low. Loan origination by members and acceptable pricing are key factors that drive acquisitions. Residential collateral values have remained stable in the New York and New Jersey sectors, the primary geographic concentration for our MPF portfolio, and historical loss experience remains very low.Capital ratios — Our capital position remains strong. At December 31, 2018, actual risk-based capital was $7.8 billion, compared to required risk-based capital of $797.8 million. To support $144.4 billion of total assets at December 31, 2018, we exceeded the minimum required total capital of $5.8 billion or 4.0% of assets. Our actual regulatory risk-based capital was $7.8 billion, exceeding required total capital by $2.0 billion. These ratios have remained consistently above the required regulatory ratios through all periods in this report. For more information, see financial statements, Note 14. Capital Stock, Mandatorily Redeemable Capital Stock and Restricted Retained Earnings.Liquidity and Debt — In addition to the trading portfolio maintained for liquidity, liquid assets at December 31, 2018 included $83.1 million as demand cash balances at the Federal Reserve Bank of New York (FRBNY), $11.7 billion in short-term and overnight loans in the federal funds and the repo markets, and $422.2 million of high credit quality GSE-issued available-for-sale securities that are investment quality, and readily marketable. In December 2016, we established a trading portfolio with the primary objective of increasing our liquidity. The trading portfolio is invested in highly-liquid U.S. Treasury bonds and GSE-issued securities. Our liquidity position remains strong, and in compliance with all regulatory requirements, and we do not foresee any changes to that position.The primary source of our funds is the issuance of Consolidated obligation bonds and discount notes to the public. Our GSE status enables the FHLBanks to raise funds at rates that are typically at a small to moderate spread above U.S. Treasury security yields. Our ability to access the capital markets, which has a direct impact on our cost of funds, is dependent to a degree on our credit ratings from the major ratings organizations. The FHLBank debt performance has withstood the impact of the controversy surrounding the debt ceiling, government shutdowns and the rising rate environment. However, we cannot say with certainty the long-term impact of such actions on our liquidity position, which could be adversely affected by many causes both internal and external to our business.During the periods in this report, we maintained continual access to funding and adapted our debt issuance to meet the liquidity needs of our members and our asset/liability risk management objectives. Our short-term funding was largely driven by member demand for short-term advances and funding was achieved through the issuance of CO discount notes and short-term CO floaters. Access to short-term debt markets has been reliable. Investor demand has been strong, partly due to the money market fund reform and partly due to investors’ preference for liquidity. Investors have sought the FHLBank’s short-term debt as an asset of choice, and that has led to advantageous funding opportunities and we have adapted our funding tactics to increase the utilization of shorter-term CO floaters.The following forward-looking statements are based upon the current beliefs and expectations of the FHLBNY’s management and are subject to risks and uncertainties, which could cause our actual results to differ materially from those set forth in such forward-looking statements.Advances — We expect our book of advance business to decline somewhat in 2019. The pace of balance sheet growth in the prior years was concentrated along short-term borrowing. The borrowing activities of a few large members have been the predominant driver of increase in our book of advance business. In our forecasts for 2019 short-term borrowings will continue to be a significant percentage of our book of advance business. However, we cannot predict if short-term advances will be rolled over, or if advances borrowed by our larger members will be rolled over at maturity or prepaid prior to maturity. At December Highlights31 2018, three members’ advance borrowings totaled 44.9% of total par advances — Citibank, N.A. 19.0 % (35.1% at December 31, 2017), Metropolitan Life Insurance Company 13.5% (11.8% at December 31, 2017), and New York Community Bank 12.4% (9.9% at December 31, 2017).Performance of the FHLBank issued consolidated obligation debt — Market demand for FHLBank COs, especially demand from money market funds, remained strong, with good market access in 2018 for its entire breadth of CO funding programs. Generally, funding was guided by the FHLBanks’ needs for refunding, asset/liability management, investor preferences, the interest rate environment and market liquidity. Demand for short-duration (less than 2 years to maturity) CO floaters was strong in 2018 as was in 2017.Floating-rate CO bonds have been attractive to investors for a number of reasons. In a rising interest rate environment, periodic resets remove much of the interest rate risk for investors, compared to fixed-rate bonds, as the floaters reset to higher yields as prevailing rates go up. The CO floater receives favorable liquidity treatment under the SEC’s Rule 2(a)-7 for money market funds, which deem the security’s weighted average maturity to be the next rate reset date.CO discount notes have also remained an attractive investment asset for investors who need high quality liquid securities with specific maturity dates. Strong money market fund participation demonstrated the robust support for CO discount notes within the money market fund industry, and the key driver still remains the impact of money market fund reforms implemented by the SEC in late 2016. The robust demand from the money market funds community for discount notes and short duration floaters has also kept CO discount note spreads to Treasuries tight and discount note spread volatility low, benefiting the FHLBNY from a funding perspective.The SOFR market has developed rapidly and successful issuance of FHLBank SOFR-linked floaters during the second half of 2018 was an important development for the FHLBank debt, and we expect the trend to accelerate as we position our debt to meet bond investor appetite for LIBOR alternative benchmark debt. We also expect the FHLBank debt system to continue to provide liquidity in the SOFR debt market.Rating — The U.S. Government’s credit is rated by Moody’s as Aaa with the outlook as stable, and AA+ and stable by Standard & Poor’s (S&P). Consolidated obligations of FHLBanks are rated Aaa/P-1 by Moody’s, and AA+/A- 1+ by S& P. Any rating actions on the US Government would likely result in all individual FHLBanks’ long-term deposit ratings and the FHLBank System long-term bond rating moving in lock step with any US sovereign rating action.34 Recently Issued Accounting Standards and Interpretations and Significant Accounting Policies and Estimates 35 Legislative and Regulatory Developments 39 Financial Condition 44 Advances 49 Investments 53 Mortgage Loans Held-for-Portfolio 59 Debt Financing Activity and Consolidated Obligations 60 Recent Rating Actions 66 Stockholders’ Capital 67 Derivative Instruments and Hedging Activities 69 Liquidity, Cash Flows, Short-Term Borrowings and Short-Term Debt 73 Results of Operations 78 Net Income 78 Net Interest Income, Margin and Interest Rate Spreads 80 Interest Income 85 Interest Expense 87 Analysis of Non-Interest Income (Loss) 91 Operating Expenses, Compensation and Benefits, and Other Expenses 94 Assessments 95 MD&A TABLE REFERENCE Table(s) Description Page(s) Selected Financial Data 25-26 Replacement of London Interbank Offered Rates (LIBOR) 47-48 1.1 Market Interest Rates 34 2.1 Financial Condition 44 3.1 - 3.8 Advances 49-53 4.1 - 4.9 Investments 54-58 5.1 - 5.3 Mortgage Loans 59-60 6.1 - 6.9 Consolidated Obligations 62-66 6.10 FHLBNY Ratings 66 7.1 - 7.4 Capital 67-68 8.1 - 8.8 Derivatives 69-72 9.1 - 9.3 Liquidity 74-75 9.4 Short Term Debt 76 9.5 - 9.6 FHFA MBS Limits and Core Mission Achievement 77 10.1 - 10.13 Results of Operations 78-94 11.1 Assessments 95 December 31, 2019 2018 2019 2018 Average Average Ending Rate Ending Rate Federal Funds Target Rate 2.28 % 1.91 % 1.75 % 2.50 % Federal Funds Effective Rate(a) 2.16 1.83 1.55 2.40 1-Month LIBOR 2.22 2.02 1.76 2.50 3-Month LIBOR 2.33 2.31 1.91 2.81 2-Year U.S.Treasury 1.97 2.52 1.57 2.49 5-Year U.S.Treasury 1.95 2.74 1.69 2.51 10-Year U.S.Treasury 2.14 2.91 1.92 2.68 15-Year Residential Mortgage Note Rate 3.35 3.82 3.41 3.76 30-Year Residential Mortgage Note Rate 3.98 4.44 3.86 4.51 Conditions in Financial Markets(a). The primary external factors that affect net interest income are market interest rates and the general state of the economy. The following table presents changes in key rates over the course of 2018 and 2017 (rates in percent):Table 1.1:Market Interest Rates(a)Source: Board of Governors Federal Reserve System, all others sources are Bloomberg L.L.P. Impact of general level of interest rates on the FHLBNY. The level of interest rates during a reporting period impacts our profitability, due primarily to the relatively shorter-term structure of earning assets and the impact of interest rates on invested capital. We invest in Federal funds sold and repurchase agreements that typically are overnight investments. We also used derivatives to effectively change the repricing characteristics of a significant proportion of our advances and Consolidated obligation debt to match shorter-term LIBOR rates that repriced at intervals of three month or less. Consequently, the current level of short-term interest rates, as represented by the overnight Federal funds target rate and the 3-month LIBOR rate, has an impact on profitability.The level of interest rates also directly affects our earnings on invested capital. Compared to other banking institutions, we operate at comparatively low net spreads between the yield we earn on assets and the cost of our liabilities. Therefore, we generate a relatively higher proportion of our income from the investment of member-supplied capital at the average asset yield. As a result, changes in asset yields tend to have a greater effect on our profitability than they do on the profitability of other banking institutions.In summary, our average asset yields and the returns on capital invested in these assets largely reflect the short-term interest rate environment because the maturities of our assets are generally short-term in nature, have rate resets that reference short-term rates, or have been hedged with derivatives in which a short-term rate is received. Changes in rates paid on Consolidated obligations and the spread of these rates relative to LIBOR and U.S. Treasury securities may also impact profitability. The rate and price at which we are able to issue Consolidated obligations, and their relationship to other products such as Treasury securities and LIBOR, change frequently and are affected by a multitude of factors including: overall economic conditions; volatility of market prices, rates, and indices; the level of interest rates and shape of the Treasury curve; the level of asset swap rates and shape of the swap curve; supply from other issuers (including GSEs such as Fannie Mae and Freddie Mac, supra/sovereigns, and other highly-rated borrowers); the rate and price of other products in the market such as mortgage-backed securities, repurchase agreements, and commercial paper; investor preferences; the total volume, timing, and characteristics of issuance by the FHLBanks; the amount and type of advance demand from our members; political events, including legislation and regulatory action; press interpretations of market conditions and issuer news; the presence of inflation or deflation; and actions by the Federal Reserve.Recently Issued Accounting Standards and Interpretations and Significant Accounting Policies and Estimates.Recently issued Accounting Standards and InterpretationsFor a discussion of recently issued accounting standards and interpretations, see financial statements, Note 2. Recently Issued Accounting Standards and Interpretations.Significant Accounting Policies and EstimatesWe have identified certain accounting policies that we believe are significant because they require management to make subjective judgments about matters that are inherently uncertain and because of the likelihood that materially different amounts would be reported under different conditions or by using different assumptions. These policies include estimating fair values of certain assets and liabilities, evaluating the impairment of our securities portfolios, estimating the allowance for credit losses on the advance and mortgage loan portfolios, and accounting for derivatives and hedging activities. We have discussed each of these significant accounting policies, the related estimates and its judgment with the Audit Committee of the Board of Directors. For additional discussion regarding the application of these and other accounting policies, see financial statements, Note 1. Significant Accounting Policies and Estimates.Fair Value Measurements and DisclosuresThe accounting standards on fair value measurements and disclosures discuss how entities should measure fair value based on whether the inputs to those valuation techniques are observable or unobservable. Fair value is defined as the price that would be received to sell an asset or paid to transfer a liability in an orderly transaction in the principal or most advantageous market for the asset or liability between market participants at the measurement date. This definition is based on an exit price rather than transaction or entry price.The FHLBNY complied with the accounting guidance on fair value measurements and disclosures and has established a hierarchy for inputs used in measuring fair value that maximizes the use of observable inputs and minimizes the use of unobservable inputs by requiring that the most observable inputs be used when available. Observable inputs are inputs that market participants would use in pricing the asset or liability, and would be based on market data obtained from independent sources. Unobservable inputs are inputs that reflect our assumptions about the parameters market participants would use in pricing the asset or liability, and would be based on the best information available in the circumstances. Our pricing models are subject to periodic validations, and we periodically review and refine, as appropriate, our assumptions and valuation methodologies to reflect market indications as closely as possible. We have the appropriate personnel, technology, and policies and procedures in place to value our financial instruments in a reasonable and consistent manner and in accordance with established accounting policies.Valuation of Financial Instruments — The following assets and liabilities, including those for which the FHLBNY has elected the fair value option, were carried at fair value on the Statements of Condition as of December 31, 2018:· Fair values of derivative instruments — Derivatives are valued using internal valuation techniques as no quoted market prices exist for such instruments, and we employ industry standard option adjusted valuation models that generate fair values of interest rate derivatives. We have classified derivatives as Level 2. · Fair values of instruments elected under the Fair Value Option— When the FHLBNY elects the FVO, the election is made on an instrument-by-instrument basis on certain Consolidated obligation debt and advances, which are fair valued using the Bank’s industry standard option adjusted models. We have classified instruments elected under the FVO as Level 2.· Fair values of available-for-sale mortgage-backed securities —We request prices for all mortgage-backed securities from third-party vendors. Typically, fair values are classified as Level 2. · Trading Securities — The FHLBNY classifies trading securities as Level 1 of the fair value hierarchy when we use quoted market prices in active markets to determine the fair value of trading securities, such as U.S. · Equity Investments —The FHLBNY has a grantor trusts,trust, which investinvests in money market, equity and fixed income and bond funds. Daily net asset values (NAVs) are readily available and investments are redeemable at short notice. Because of the highly liquid nature of the investments at their NAVs, they are categorized as Level 1 financial instruments under the valuation hierarchy.Other-Than-Temporary Impairment (OTTI)We evaluate our investments quarterly for impairment to determine if unrealized losses are temporary. Our evaluation is based in part on the creditworthiness of the issuers, and in part on the underlying collateral within the structure of the security and the cash flows expected to be collected on the security. An OTTI has occurred if cash flow analysis determines that a credit loss exists. To determine if a credit loss exists, management compares the present value of the cash flows expected to be collected to the amortized cost basis of the security. If the present value of the cash flows expected to be collected is less than the security’s amortized cost, an OTTI exists, irrespective of whether management will be required to sell such a security.For additional discussion regarding FHLBank impairment and pricing policies for mortgage-backed securities, see financial statements, Note 1. Significant Accounting Policies and Estimates. For more information about credit losses due to OTTI, also see Note 8. Held-to-Maturity Securities.Bond Insurer Analysis — Certain HTM private-label MBS owned by the FHLBNY are insured by third-party bond insurers (monoline insurers). For such investments, the monoline insurers guarantee the timely payments of principal and interest if these payments cannot be satisfied from the cash flows of the underlying mortgage pool. The FHLBNY performs cash flow credit impairment tests on all of its private-label insured securities, and the analysis of the MBS protected by such third-party insurance looks first to the performance of the underlying security, and considers its embedded credit enhancements in the form of excess spread, overcollateralization, and credit subordination, to determine the collectability of all amounts due. If the embedded credit enhancement protections are deemed insufficient to make timely payment of all amounts due, then the FHLBNY considers the capacity of the third-party bond insurer to cover any shortfalls.Certain monoline insurers have been subject to adverse ratings, rating downgrades, and weakening financial performance measures. In estimating the insurers’ capacity to provide credit protection in the future to cover any shortfall in cash flows expected to be collected for securities deemed to be OTTI, the FHLBNY has developed a methodology to assess the ability of the monoline insurers to meet future insurance obligations. Based on analysis, we have concluded that bond insurer Assured Guaranty Municipal Corp., can be relied upon for cash flow support for the life of the insured bond. For MBIA Insurance Corp (MBIA), financial guarantee is at risk. Based on financial resources and near term liquidity issues, no financial guarantees are assumed in 2018 and 2019. For Ambac Assurance Corp (Ambac or Ambac Assurance), the insurer’s financial position has improved and the reliance basis was expanded to include 100% of the shortfall through December 31, 2024.Provision for Credit LossesNo provision for credit losses on advances was necessary in the history of the program. We have an established allowance for credit losses on mortgage loans acquired under the Mortgage Partnership Finance Program (MPF). Our assessments represents management’s estimate of the probable credit losses inherent in these two portfolios. Determining the amount of the provision for credit losses is considered a critical accounting estimate because management’s evaluation of the adequacy of the provision is subjective and requires significant estimates, including the amounts and timing of estimated future cash flows, estimated losses based on historical loss experience, and consideration of current economic trends, all of which are susceptible to change. These assumptions and judgments on our provision for credit losses are based on information available as of the date of the financial statements. Actual losses could differ from these estimates.Advances — No provisions for credit losses were necessary.· Monitoring the creditworthiness and financial condition of the institutions to which we lend funds. · Reviewing the quality and value of collateral pledged by members. · Estimating borrowing capacity based on collateral value and type for each member, including assessment of margin requirements based on factors such as cost to liquidate and inherent risk exposure based on collateral type. · Evaluating historical loss experience. We are required by Finance Agency regulations to obtain sufficient collateral on advances to protect against losses, and to accept only certain kinds of collateral on our advances, such as U.S. government or government-agency securities, residential mortgage loans, deposits, and other real estate related assets. We have never experienced a credit loss on an advance. Based on the collateral held as security for advances, management’s credit analyses, and prior repayment history, no allowance for credit losses on advances was deemed necessary by management at December 31, 2018, 2017 and 2016. During the periods in this report, we had the rights to collateral, either loans or securities, on a member-by-member basis, with an estimated liquidation value in excess of outstanding advances.Significant changes to any of the factors described above could materially affect our provision for losses on advances. For example, our current assumptions about the financial strength of any member may change due to various circumstances, such as new information becoming available regarding the member’s financial strength or future changes in the national or regional economy. New information may require us to place a member on credit watch and require collateral to be delivered, adjust our current margin requirement, or provide for losses on advances.For additional discussion regarding underwriting standards, including collateral held to support advances, see Tables 3.3 and 3.4 and accompanying discussions in this MD&A.Mortgage Loans — MPF Program. We have policies and procedures in place to manage our credit risk effectively. These include:· Evaluation of members to ensure that they meet the eligibility standards for participation in the MPF Program. · Evaluation of the purchased and originated loans to ensure that they are qualifying conventional, conforming fixed-rate, first lien mortgage loans with fully amortizing loan terms of up to 30 years, secured by owner-occupied, single-family residential properties. · Estimation of loss exposure and historical loss experience to establish an adequate level of loss reserves. Net change in Net change in (Dollars in thousands) December 31, 2019 December 31, 2018 dollar amount percentage Assets Cash and due from banks $ 603,241 $ 85,406 $ 517,835 606.32 % Securities purchased under agreements to resell 14,985,000 4,095,000 10,890,000 265.93 Federal funds sold 8,640,000 7,640,000 1,000,000 13.09 Trading securities 15,318,809 5,810,512 9,508,297 163.64 Equity Investments 60,047 48,179 11,868 24.63 Available-for-sale securities 2,653,418 422,216 2,231,202 528.45 Held-to-maturity securities 15,234,482 17,474,826 (2,240,344 ) (12.82 ) Advances 100,695,241 105,178,833 (4,483,592 ) (4.26 ) Mortgage loans held-for-portfolio 3,173,352 2,927,230 246,122 8.41 Loans to other FHLBanks - 250,000 (a) (250,000 ) (100.00 ) Accrued interest receivable 312,559 275,256 37,303 13.55 Premises, software, and equipment 63,426 51,572 11,854 22.99 Operating lease right-of-use assets 75,464 - 75,464 NM Derivative assets 237,947 113,762 124,185 109.16 Other assets 9,036 8,602 434 5.05 Total assets $ 162,062,022 $ 144,381,394 $ 17,680,628 12.25 % Liabilities Deposits Interest-bearing demand $ 1,144,519 $ 1,002,587 $ 141,932 14.16 % Non-interest-bearing demand 34,890 20,050 14,840 74.01 Term 15,000 40,000 (25,000 ) (62.50 ) Total deposits 1,194,409 1,062,637 131,772 12.40 Consolidated obligations Bonds 78,763,309 84,153,776 (5,390,467 ) (6.41 ) Discount notes 73,959,205 50,640,238 23,318,967 46.05 Total consolidated obligations 152,722,514 134,794,014 17,928,500 13.30 Mandatorily redeemable capital stock 5,129 5,845 (716 ) (12.25 ) Accrued interest payable 156,889 223,570 (66,681 ) (29.83 ) Affordable Housing Program 153,894 161,718 (7,824 ) (4.84 ) Derivative liabilities 32,411 31,147 1,264 4.06 Other liabilities 175,516 355,841 (180,325 ) (50.68 ) Operating lease liabilities 89,365 - 89,365 NM Total liabilities 154,530,127 136,634,772 17,895,355 13.10 Capital 7,531,895 7,746,622 (214,727 ) (2.77 ) Total liabilities and capital $ 162,062,022 $ 144,381,394 $ 17,680,628 12.25 % We assign a non-accrual status(a) The category Loans to a mortgage loan when the collection of the contractual principal or interest is 90 days or more past due. When a mortgage loan is placed on non-accrual status, accrued but uncollected interest is reversed against interest income. For additional discussion regarding underwriting standards, allowances for credit losses and credit quality metrics, see financial statements, Note 10. Mortgage Loans Held-for-portfolio. Also, see Tables 5.1 to 5.3 and accompanying discussions in this MD&A.Accounting for DerivativesWe record and report our hedging activities in accordance with accounting standards for derivatives and hedging. In compliance with the standards, the accounting for derivatives requires us to make the following assumptions and estimates: (i) assessing whether the hedging relationship qualifies for hedge accounting, (ii) assessing whether an embedded derivative should be bifurcated, (iii) calculating the effectiveness of the hedging relationship, (iv) evaluating exposure associated with counterparty credit risk, and (v) estimating the fair value of the derivatives. Our assumptions and judgments include subjective estimates based on information available as of the date of the financial statements and could be materially different based on different assumptions, calculations, and estimates. We specifically identify the hedged asset or liability and the associated hedging strategy. Prior to execution of each transaction, we document the following items:· Hedging strategy· Identification of the item being hedged· Determination of the accounting designation· Determination of method used to assess the highly effective assumption in the hedge relationship· Assessment that the hedge is expected to be highly effective in the future if designated as a qualifying hedge under the accounting standards for derivatives and hedging.All derivatives are recorded on the Statements of Condition at their fair value and designated as either fair value or cash flow hedges for qualifying hedges or as non-qualifying hedges (economic hedges, or customer intermediations) under the accounting standards for derivatives and hedging. In an economic hedge, we execute derivative contracts, which are economically effective in reducing risk, but are not ASC 815 hedges, either because a qualifying hedge is not available or because the implementation of a qualifying hedge is operationally difficult.In August 2017, the FASB issued ASU 2017-12, Targeted Improvements to Accounting for Hedging Activities (Topic 815). On October 25, 2018, the FASB issued ASU 2018-16, Inclusion of the Secured Overnight Financing Rate (SOFR) Overnight Index Swap (OIS) Rate as a Benchmark Interest Rate for Hedge Accounting Purposes (Topic 815). ASU 2018-16 adds the OIS rate based on SOFR as a U.S. benchmark rate to facilitate the LIBOR to SOFR transition, and the amendments will be effective concurrently with the adoption of ASU 2017-12, which for the FHLBNY is January 1, 2019.Under legacy GAAP (prior to the adoption of ASU 2017-12), changes in the fair values of a derivative that qualifies as a fair value hedge are recorded in current period earnings or in AOCI if the derivative qualifies as a cash flow hedge. The new guidance requires that we report the entire hedging effects of the hedging instrumentsother FHLBanks was inadvertently omitted in the same income statement line item as the hedged item. While this is a change in presentation from the legacy standards, the impact for the FHLBNY will not be material. In addition, the amendments in this ASU makes certain targeted improvements to simplify the application of the hedge accounting guidance in current GAAP.For more information, see financial statements, Note 1. Significant Accounting Policies and Estimates, and Note 17. Derivatives and Hedging Activities.Legislative and Regulatory DevelopmentsFinal Rule on FHLBank Capital RequirementsOn February 20, 2019, the Finance Agency published a final rule, effective January 1, 2020, that adopts, with amendments, the regulations of the Federal Housing Finance Board (predecessor to the Finance Agency) (Finance Board) pertaining to the capital requirements for the FHLBanks. The final rule carries over most of the prior Finance Board regulations without material change but substantively revises the credit risk component of the risk-based capital requirement, as well as the limitations on extensions of unsecured credit. The main revisions remove requirements that we calculate credit risk capital charges and unsecured credit limits based on ratings issued by a Nationally Recognized Statistical Rating Organization (NRSRO), and instead require that we establish and use our own internal rating methodology. The rule imposes a new credit risk capital charge for cleared derivatives. The final rule also revises the percentages usedtable presented in the regulation’s tables to calculate credit risk capital charges for advances and for non-mortgage assets. The final rule also rescinds certain contingency liquidity requirements that were part of the Finance Board regulations, as these requirements are now addressed in an Advisory Bulletin on FHLBank Liquidity Guidance issued by the Finance Agency in 2018 (see “Advisory Bulletin 2018-07 Federal Home Loan Bank Liquidity Guidance” below).We do expect this rule to increase our required level of risk-based capital, but we expect to remain well in compliance with the new rules and adoption will not materially affect our financial condition or results of operations.FDIC Final Rule on Reciprocal DepositsOn February 4, 2019, the FDIC published a final rule, effective March 6, 2019, related to the treatment of “reciprocal deposits” that implements Section 202 of the Economic Growth, Regulatory Relief, and Consumer Protection Act. The final rule exempts, for certain insured depository institutions (depositories), certain reciprocal deposits — deposits acquired by a depository from a network of participating depositories that enables depositors to receive FDIC insurance coverage for the entire amount of their deposits — from being subject to FDIC restrictions on brokered deposits. Under the rule, well-capitalized and well-rated depositories are not required to treat reciprocal deposits as brokered deposits up to the lesser of twenty percent of their total liabilities or $5 billion. Reciprocal deposits held by depositories that are not well-capitalized and well-rated may also be excluded from brokered deposit treatment in certain circumstances.We continue to evaluate the potential impact of the final rule, but currently do not expect the rule to materially affect our financial condition or results of operations. The rule could, however, enhance depositories’ liquidity by increasing the attractiveness of deposits that exceed FDIC insurance limits. This could affect the demand for certain advance products.Final Rule on Golden Parachute and Indemnification PaymentsOn December 20, 2018, the Finance Agency published a final rule, effective January 22, 2019, on golden parachute and indemnification payments (Golden Parachute Rule) to better align the Golden Parachute Rule with areas of the Finance Agency’s supervisory concern and reduce administrative and compliance burdens. The Golden Parachute Rule sets forth the standards the Finance Agency would take into consideration when limiting or prohibiting golden parachute and indemnification payments by an FHLBank or the Office of Finance to an entity-affiliated party when such entity is in a troubled condition, in conservatorship or receivership, or insolvent. The final rule amendments:· focus the standards on payments to and agreements with executive officers, broad-based plans covering large numbers of employees (such as severance plans), and payments made to non-executive-officer employees who may have engaged in certain types of wrongdoing; and· revise and clarify definitions, exemptions and procedures to implement the Finance Agency’s supervisory approach.We do not expect this rule to materially impact our financial condition or results of operations.Final Rule Amending AHP RegulationsOn November 28, 2018, the Finance Agency published a final rule, effective December 28, 2018, that amends the operating requirements of the FHLBanks’ AHP. The final rule retains a scoring criteria method for awarding competitive AHP subsidies, but allows us to create multiple pools of competitive funds in order to target specific affordable housing needs in our district. The final rule amendments also:· revise the scoring criteria to create different and new scoring priorities;· remove the retention agreement requirement on owner-occupied units using the subsidy solely for rehabilitation;increase the per-household grant amount to $22,000 with an annual housing price inflation adjustment (up from the current fixed limit of $15,000);clarify the requirements for remediating AHP noncompliance;· prohibit our Board of Directors from delegating approval of AHP strategic policy decisions to a committee; and· further align AHP monitoring with certain federal government funding programs.The majority of the rule’s provisions take effect January 1, 2021, while the owner-occupied retention agreement requirements take effect January 1, 2020. We do not expect this rule to materially affect our financial condition or results of operations.Finance Agency Proposed Rule on Housing GoalsOn November 2, 2018, the Finance Agency published a proposed rule that would amend the existing Federal Home Loan Bank Housing Goals regulation. The proposed amendments are intended to replace existing FHLBank housing goals with a more streamlined set of goals. While the existing housing goals are established retrospectively, the proposed rule would establish the levels of annual housing goals in advance, thereby eliminating uncertainty about housing goals from year-to-year. If adopted as proposed, the proposed amendments would:· eliminate the $2.5 billion AMA mortgage purchase volume threshold that triggers the application of housing goals;· establish the target level for the new prospective AMA mortgage purchase housing goal at 20 percent of total AMA mortgage purchases that are for very low-income families, low-income families, or families in low-income areas, and require that at least 75 percent of all mortgage purchases that count toward the goal be for borrowers with incomes at or below 80 percent of the area median income ;· establish a goal that 50 percent of AMA program users meet the definition of “small members” whose assets do not exceed the “community financial institution” asset cap, which under Finance Agency regulations is currently $1.199 billion; and· allow the FHLBanks to request FHFA approval of alternative target percentages for mortgage purchase housing goals and small member participation goals.We submitted a joint comment letter with the other FHLBanks on the proposed rule on January 29, 2019. We continue to evaluate the proposed rule but do not expect this rule, if adopted as proposed, to materially affect our financial condition or results of operation.OCC, FRB, FDIC, Farm Credit Administration and Finance Agency Final Rule on Margin and Capital Requirements for Covered Swap EntitiesOn October 10, 2018, the OCC, FRB, FDIC, Farm Credit Administration, and the Finance Agency published a final rule, effective November 9, 2018, that amended each agency’s rule on Margin and Capital Requirements for Covered Swap Entities (Swap Margin Rules) to conform the definition of “eligible master netting agreement” in such rules to the FRB’s, OCC’s and FDIC’s final qualified financial contract (QFC) rules. The final rule also clarifies that a legacy swap would not be deemed to be a covered swap under the Swap Margin Rules if it is amended to conform to the QFC rules. The QFC rules previously published by the OCC, FRB and FDIC require their respective regulated entities to amend covered QFCs to limit a regulated entity’s counterparty’s immediate termination or exercise of default rightsMD&A in the event of bankruptcy or receivership of the regulated entity or its affiliate(s).We do not expect this rule to materially affect our financial condition or results of operations.Final Rule on Indemnification PaymentsOn October 4, 2018 the Finance Agency published a final rule, effective November 5, 2018, establishing standards for identifying when an indemnification payment by an FHLBank or the Office of Finance to an officer, director, employee, or other affiliated party in connection with an administrative proceeding or civil action instituted by the Finance Agency is prohibited or permissible. The rule generally prohibits these payments except in the following circumstances:·premiums for any commercial insurance or fidelity bonds for directors and officers, to the extent that the insurance or fidelity bond covers expenses and restitution, but not a judgment in favor of the Finance Agency or a civil money penalty imposed by the Finance Agency; and·expenses of defending an action, subject to a Board investigation and a good faith finding by the Board that the party acted in good faith and in a manner the party reasonably believed was in the best interest of the FHLBank, as well as an agreement to repay those expenses in certain instances.We do not expect the rule to materially impact our financial condition or results of operation.Advisory Bulletin 2018-07 Federal Home Loan Bank Liquidity GuidanceOn August 23, 2018, the Finance Agency issued an Advisory Bulletin on FHLBank liquidity (the “Liquidity Guidance AB”) that communicates the Finance Agency’s expectations with respect to the maintenance of sufficient liquidity to enable us to provide advances and letters of credit for members. The Liquidity Guidance AB rescinds the 2009 liquidity guidance previously issued by the Finance Agency. Contemporaneously with the issuance of the Liquidity Guidance AB, the Finance Agency issued a supervisory letter that identifies initial thresholds for measures of liquidity within the established ranges set forth in the Liquidity Guidance AB.The Liquidity Guidance AB provides guidance on the level of on-balance sheet liquid assets related to base case liquidity. As part of the base case liquidity measure, the guidance also includes a separate provision covering off-balance sheet commitments from standby letters of credit (SLOCs). In addition, the Liquidity Guidance AB provides guidance related to asset/liability maturity funding gap limits.With respect to base case liquidity, the Finance Agency revised previous guidance that required us to assume a 5-day period without access to capital markets due to a change in certain assumptions underlying that guidance. Under the Liquidity Guidance AB, we are required to hold positive cash flow assuming no access to capital markets and assuming renewal of all maturing advances for a period of between ten to thirty calendar days. The Liquidity Guidance AB also sets forth the initial cash flow assumptions and formula to calculate base case liquidity. With respect to SLOCs, the guidance states that we should maintain a liquidity reserve of between one percent and 20 percent of our outstanding SLOC commitments.With respect to funding gaps and possible asset and liability mismatches, the Liquidity Guidance AB provides guidance on maintaining appropriate funding gaps for three-month (-10 to -20 percent) and one-year (-25 to -35 percent) maturity horizons. The Liquidity Guidance AB provides for these limits to reduce the liquidity risks associated with a mismatch in asset and liability maturities, including an undue reliance on short-term debt funding.The Liquidity Guidance AB also addresses liquidity stress testing, contingency funding plans and an adjustment to our core mission achievement calculation. Portions of the Liquidity Guidance AB were implemented on December 31, 2018, with further implementation to take placeForm 10-K filed on March 31, 2019 and full implementation on December 31,21, 2019. We anticipate the Liquidity Guidance AB to require us to hold an additional amount of liquid assets to meet the new guidance, which could reduce our ability to invest in higher-yielding assets or could have an adverse impact on spreads earned on assets invested for liquidity. Further, our cost of funding may increase if we were required to achieve the appropriate funding gap with longer-term funding.Adoption of Single-Counterparty Credit Limits for Bank Holding Companies and Foreign Banking Organizations by Board of Governors of the Federal Reserve System.On August 6, 2018, the Board of Governors of the Federal Reserve System published a final rule, effective October 5, 2018, establishing single-counterparty credit limits applicable to bank holding companies and foreign banking organizations with total consolidated assets of $250 billion or more, including global systemically important bank holding companies (GSIBs) in the United States. These entities are considered to be covered companies under the rule. The FHLBanks are themselves exempt from the limits and reporting requirements contained in this rule. However, credit exposure to individual FHLBanks must be monitored, and reported on as required, by any entity that is a covered company under this rule.Under the final rule, a covered company and its subsidiaries may not have aggregate net credit exposure to an FHLBank and, if applicable, (in certain cases) economically interdependent entities in excess of 25 percent of the company’s tier 1 capital. Such credit exposure does not include advances from an FHLBank, but generally includes collateral pledged to an FHLBank in excess of a covered company’s outstanding advances. Also included towards a covered company’s net credit exposure is its investment in FHLBank capital stock and debt instruments, deposits with an FHLBank, FHLBank-issued letters of credit where a covered company is the named beneficiary, and other obligations to an FHLBank, including repurchase or reverse repurchase transactions net of collateral that create a credit exposure to an FHLBank. Intra-day exposures are exempt from the final rule.With respect to the FHLBanks’ consolidated obligations held by a covered company, the company must monitor, and report on as required, its credit exposure for such obligations. It is not clear if the Federal Reserve will require consolidated obligations to be aggregated with other exposures to an FHLBank or the FHLBank System.The final rule gives major covered companies (i.e., the GSIBs) until January 1, 2020 to comply, and all other covered companies will have until July 1, 2020 to comply. We are continuing to study this rulemaking, but we do not expect the rule to materially affect our financial condition or results of operations.Table 2.1:Statements of Condition — Period-Over-Period ComparisonNM — Not meaningful.Balance Sheet overview December 31, 2018 and December 31, 2017Total assets decreased to $144.4 billion at December 31, 2018 from $158.9 billion at December 31, 2017, a decrease of $14.5 billion, or 9.1%.Cash at banks was $85.4 million at December 31, 2018, compared to $127.4 million at December 31, 2017.Money market investments at December 31, 2018 were $7.6 billion in federal funds sold and $4.1 billion in overnight resale agreements. At December 31, 2017, money market investments were $10.3 billion in federal funds sold and $2.7 billion in overnight resale agreements.Advances — Par balances decreased at December 31, 2018 to $105.4 billion, compared to $122.7 billion at December 31, 2017. Short-term fixed-rate advances decreased by 37.0% to $15.0 billion at December 31, 2018, down from $23.8 billion at December 31, 2017. ARC advances, which are adjustable-rate borrowings, decreased by 37.0% to $23.3 billion at December 31, 2018, compared to $37.1 billion at December 31, 2017.Long-term investment debt securities — Long-term investment debt securities are designated as available-for-sale (AFS) or held-to-maturity (HTM). The heavy concentration of GSE and Agency issued (GSE-issued) securities, and a declining balance of private-label MBS, less than 1%, is our investment profile.In the AFS portfolio, long-term investments at December 31, 2018 were floating-rate GSE-issued mortgage-backed securities carried on the balance sheet at fair values of $422.2 million, compared to $528.6 million at December 31, 2017.In the HTM portfolio, long-term investments at December 31, 2018 were predominantly GSE-issued fixed- and floating-rate mortgage-backed securities and housing finance agency bonds. Securities in the HTM portfolio are recorded at amortized cost, adjusted for any OTTI. Fixed- and floating-rate mortgage-backed securities (MBS), including private-label mortgage-backed securities (PLMBS), in the HTM portfolio, were $16.3 billion at December 31, 2018 and $16.7 billion at December 31, 2017. Investments in PLMBS were less than 1% of the HTM portfolio. We acquired $2.2 billion of fixed-rate GSE-issued MBS and $1.2 billion of floating-rate GSE-issued MBS in the twelve months of 2018.In the HTM portfolio, housing finance agency bonds, primarily New York and New Jersey, were carried at an amortized cost basis of $1.2 billion at December 31, 2018 and $1.1 billion at December 31, 2017. We acquired par amounts of $100.0 million during 2018 and paydowns were $79.2 million. In 2017, we acquired par amounts of $101.3 million in housing finance bonds and paydowns were $17.3 million.Trading securities (liquidity portfolio) — The objective of the trading portfolio is to meet short-term contingency liquidity needs. During the periods in this report, we have invested in highly liquid U.S. Treasury bills, U.S. Treasury notes and GSE-issued securities. Trading investments are carried at fair value, with changes recorded through earnings. At December 31, 2018, trading investments were $5.3 billion in U.S. Treasury notes, $502.8 million in GSE securities, and $3.3 million in Ambac corporate notes. We acquired $5.3 billion of U.S. Treasury notes, and $421.7 million in GSE securities in 2018. Ambac corporate notes par $3.4 million were received from the Ambac Corporation as consideration for insurance claims on certain PLMBS. At December 31, 2017, trading investments were $239.1 million in U.S. Treasury bills, $1.0 billion in U.S. Treasury notes and $356.9 million in GSE securities.We will periodically evaluate our liquidity needs and may add to or dispose these liquidity investments as deemed prudent based on liquidity and market conditions. The Finance Agency prohibits speculative trading practices but allows permitted securities to be deemed held for liquidity if invested in a trading portfolio.Equity Investments — We own grantor trusts that invest in highly-liquid registered mutual funds, which were reclassified as of January 1, 2018 from AFS to Equity Investments. These investments were carried on the balance sheet at fair values of $48.2 million at December 31, 2018. At December 31, 2017, the funds were classified as AFS and carried at fair values of $48.6 million.Mortgage loans held-for-portfolio — Mortgage loans were investments in Mortgage Partnership Finance loans (MPF or MPF Program). Unpaid principal balance of MPF loans stood at $2.9 billion at December 31, 2018, an increase of $33.0 million from the balance at December 31, 2017. Loans are primarily fixed-rate, single-family mortgages acquired through the MPF Program. Paydowns in the twelve months of 2018 were $264.6 million, slightly lower than $268.4 million in the prior year. Acquisitions in the twelve months of 2018 were $301.7 million, compared to $425.1 million in the prior year. Credit performance has been strong and delinquency low. Loan origination by members and acceptable pricing are key factors that drive acquisitions. Residential collateral values have remained stable in the New York and New Jersey sectors, the primary geographic concentration for our MPF portfolio, and historical loss experience remains very low.Stress test results — Pursuant to the Dodd-Frank Act, the FHFA, regulator of the Federal Home Loan Banks (FHLBanks), has adopted supervisory stress tests for the FHLBanks. The FHFA requires the annual stress testing for the FHLBanks based on the FHFA’s scenarios, summary instructions and guidance. The tests are designed to determine whether the FHLBanks have the capital to absorb losses as a result of adverse economic conditions. The FHFA rules require that the FHLBanks consider the results of the annual stress test into account in making any changes, as appropriate, to its capital structure (including the level and composition of capital); its exposure, concentration, and risk positions; any plans for recovery and resolution; and to improve overall risk management. Consultation with FHFA supervisory staff is expected in making such improvements. In accordance with these rules, the FHLBNY executed its fourth annual stress test, and publicly disclosed the most recent stress test results on November 15, 2018 on our website (www.fhlbny.com).The stress test results in all scenarios, including the scenario run under the FHFA’s severely adverse economic scenario, demonstrated capital adequacy.Capital ratios — Our capital position remains strong. At December 31, 2018, actual risk-based capital was $7.8 billion, compared to required risk-based capital of $797.8 million. To support $144.4 billion of total assets at December 31, 2018, the minimum required total capital was $5.8 billion or 4.0% of assets. Our actual regulatory risk-based capital was $7.8 billion, exceeding required total capital by $2.0 billion. These ratios have remained consistently above the required regulatory ratios through all periods in this report. For more information, see financial statements, Note 14. Capital Stock, Mandatorily Redeemable Capital Stock and Restricted Retained Earnings.Leverage — At December 31, 2018, balance sheet leverage (based on U.S. GAAP) was 18.6 times shareholders’ equity. Balance sheet leverage has generally remained steady over the last several years, although from time to time we have maintained excess liquidity in highly liquid investments, or cash balances at the Federal Reserve Bank of New York (FRBNY) to meet unexpected member demand for funds. Increases or decreases in investments have a direct impact on leverage, but generally growth in or shrinkage of advances does not significantly impact balance sheet leverage under existing capital stock management practices. Members are required to purchase activity-based capital stock to support their borrowings from us, and when activity-based capital stock is in excess of the amount that is required to support advance borrowings, we redeem the excess capital stock immediately. Therefore, stockholders’ capital increases and decreases with members’ advance borrowings, and the capital to asset ratio remains relatively unchanged.Liquidity and Debt — In addition to the trading portfolio maintained for liquidity, liquid assets at December 31, 2018 included $83.1 million as demand cash balances at the Federal Reserve Bank of New York (FRBNY), $11.7 billion in short-term and overnight loans in the federal funds and the repo markets, and $422.2 million of high credit quality GSE-issued available-for-sale securities that are investment quality, and readily marketable. In December 2016, we established a trading portfolio with the primary objective of increasing our liquidity. The trading portfolio is invested in highly-liquid U.S. Treasury bonds and GSE-issued securities. Our liquidity position remains strong, and in compliance with all regulatory requirements, and we do not foresee any changes to that position.The primary source of our funds is the issuance of Consolidated obligation bonds and discount notes to the public. Our GSE status enables the FHLBanks to raise funds at rates that are typically at a small to moderate spread above U.S. Treasury security yields. Our ability to access the capital markets, which has a direct impact on our cost of funds, is dependent to a degree on our credit ratings from the major ratings organizations. The FHLBank debt performance has withstood the impact of the controversy surrounding the debt ceiling in the recent past. However, we cannot say with certainty the long-term impact of such actions on our liquidity position, which could be adversely affected by many causes both internal and external to our business.During the periods in this report, we maintained continual access to funding and adapted our debt issuance to meet the liquidity needs of our members and our asset/liability risk management objectives. Our short-term funding was largely driven by member demand for short-term advances and was achieved through the issuance of Consolidated discount notes and short-term Consolidated bonds. Access to short-term debt markets has been reliable. Investor demand has been strong, partly due to the money market fund reform and partly due to investors’ preference for liquidity. Investors have sought the FHLBank’s short-term debt as an asset of choice, and that has led to advantageous funding opportunities and increased utilization of shorter-term debt.There are inherent risks in utilizing short-term funding and we may be exposed to refinancing and investor concentration risks or market access risk. Market access risk includes the risk that we would be unable to issue Consolidated obligations in the event of disruptions in the capital markets. Refinancing risk includes the risk that we could have difficulty rolling over short-term obligations when market conditions become unfavorable for debt issuance.We measure and monitor interest rate-risk with commonly used methods, which include the calculations of market value of equity, duration of equity, and duration gap.Among other liquidity measures, the Finance Agency requires FHLBanks to maintain sufficient liquidity through short-term investments in an amount at least equal to our anticipated cash outflows under two different scenarios. The first scenario assumes that we cannot access capital markets for 15 days, and during that period members do not renew their maturing, or prepay or exercise their option to call advances that are callable. The second scenario assumes that we cannot access the capital markets for five days, and during that period, members renew maturing advances. We remain in compliance with regulations under both scenarios.We also hold contingency liquidity in an amount sufficient to meet our liquidity needs if we are unable to access the Consolidated obligation debt market for at least 5 days. The actual contingency liquidity under the 5-day scenario in the current year quarter was $32.5 billion, well in excess of the required $3.6 billion.We also have other liquidity measures in place, deposit liquidity and operational liquidity, and those liquidity buffers remain in excess of required reserves. For more information about the Advisory Bulletin and our liquidity measures, please see section Liquidity, Cash Flows, Short-Term Borrowings and Short-Term Debt, and Tables 9.1 through Table 9.3 in this MD&A. December 31, 2019 In thousands Variable-rate
LIBOR-indexed
Advances Total Par $ 15,918,467 Maturing in 2022 and thereafter $ 1,286,500 December 31, 2019 Variable-rate
LIBOR-indexed Debt In thousands CO Bonds Total Par $ 32,493,000 Maturing in 2022 and thereafter $ - December 31, 2019 Interest rate swaps In thousands LIBOR-indexed Total Par $ 73,861,968 Maturing in 2022 and thereafter $ 18,121,530 December 31, 2019 Variable-rate LIBOR-indexed Securities Liquidity trading portfolio In thousands Corporate bonds and HFA MBS/AFS MBS/HTM Total UPB $ 923,262 $ 343,189 $ 5,089,626 Maturing in 2022 and thereafter $ 923,262 $ 340,650 $ 4,943,252 Our primary business is making collateralized loans to members, referred to as advances. Generally, the growth or decline in advances is reflective of demand by members for both short-term liquidity and term funding. This demand is driven by economic factors such as availability of alternative funding sources that are more attractive, or by the interest rate environment and the outlook for the economy. Members may choose to prepay advances (which may generate prepayment penalty fees) based on their expectations of interest rate changes and demand for liquidity.Advance volume is also influenced by merger activity, where members are either acquired by non-members or acquired by members of another FHLBank. When our members are acquired by members of another FHLBank or by non-members, these former members no longer qualify for membership and we may not offer renewals or additional advances to the former members. If maturing advances are not replaced, it will have an impact on business volume.Interest rate hedging and basis adjustments — A significant percentage of fixed-rate, longer-term advances and all putable advances were designated under an ASC 815 fair value accounting hedge. Also, certain advances were hedged by interest rate swaps in economic hedges. From time to time, we have also elected the fair value option (FVO) on an instrument by instrument basis for certain advances.Carrying value of advances outstanding at December 31, 2018 was $105.2 billion, compared to $122.4 billion at December 31, 2017. Carrying values included unrealized net fair value hedging basis adjustments recorded on hedges eligible under ASC 815, and also included basis adjustments recorded on advances when elected under the fair value option (FVO). For advances hedged under the ASC 815 qualifying hedging rules, the basis adjustment resulted in fair value losses of $255.0 million and $265.3 million at December 31, 2018 and 2017. No advances elected under the FVO were outstanding at December 31, 2018. The basis adjustments reported valuation gains of $5.6 million on FVO advances at December 31, 2017. For more information about basis adjustments, see Table 3.6 Advances by Maturity and Yield Type in this MD&A.Table 3.1:Advance Trends 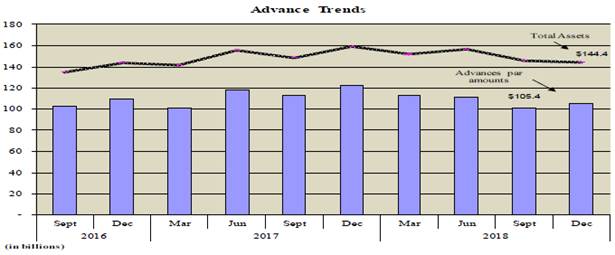
Member demand for advance productsPar amount of advances outstanding was $105.4 billion at December 31, 2018, compared to $122.7 billion at December 31, 2017. The decrease in amounts outstanding at December 31, 2018, relative to December 31, 2017 has been largely due to paydowns by our larger members.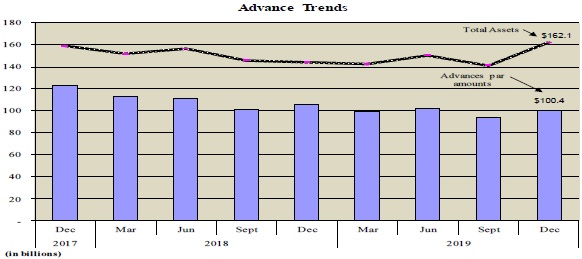
Table 3.2:Advances by Product Type Adjustable Rate Credit Advances (ARC Advances) — ARC Advances declined in the four quarters December 31, 2019 December 31, 2018 Percentage Percentage Amounts of Total Amounts of Total Adjustable Rate Credit - ARCs $ 16,364,967 16.30 % $ 23,346,467 22.14 % Fixed Rate Advances 49,548,877 49.35 51,612,602 48.96 Short-Term Advances 24,401,935 24.31 14,995,172 14.22 Mortgage Matched Advances 240,182 0.24 320,027 0.30 Overnight & Line of Credit (OLOC) Advances 3,407,551 3.39 7,723,492 7.33 All other categories 6,432,566 6.41 7,436,097 7.05 Total par value 100,396,078 100.00 % 105,433,857 100.00 % Hedge valuation basis adjustments 299,163 (255,024 ) Total $ 100,695,241 $ 105,178,833 when maturing advances were not renewed. Typically, the larger members are borrowers of the adjustable rate advances. ARC Advances are medium- and long-term loans that can be linked to a variety of indices, such as 1-month LIBOR, 3-month LIBOR, the federal funds rate, or Prime. The ARC interest rate is set and reset (depending upon the maturity of the advance and the type of index) at a spread to LIBOR. Principal is due at maturity and interest payments are due at each reset date, including the final payment date. Members use ARC Advances to manage interest rate and basis risks by efficiently matching the interest rate index and repricing characteristics of floating-rate assets. Some members may elect to use ARC Advances as part of a cash flow hedge strategy, where they will synthetically convert the floating-rate borrowing to fixed-rate with the use of interest rate swaps.Fixed-rate Advances — Member demand for fixed-rate advances has been steady through 2018 and slightly up at December 31, 2018 with maturing advances replaced by new borrowings. We believe that members still remain uncertain about locking into long-term advances, perhaps because of higher coupons on longer-term advances, an uncertain outlook on the direction and timing of interest rate changes, or lukewarm demand from members’ customer base for longer-term fixed-rate loans.Fixed-rate Advances are medium and long-term, comprising of putable and non-putable advances, and remain the largest category of advances. Fixed-rate advances are offered in maturities of one year or longer.Fixed-rate advances include advances with a “put” option feature (putable advance). Putable advances were $4.7 billion at December 31, 2018, compared to $0.6 billion at December 31, 2017. Demand has been isolated largely to one borrower. Historically, in years prior to periods in this report, fixed-rate putable advances had been more competitively priced relative to fixed-rate “bullet” advances (without put option) because the “put” feature (that we purchase from the member) reduces the coupon on the advance. The price advantage of a putable advance increases with the number of puts sold and the length of the term of a putable advance. With a putable advance, we have the right to exercise the put option and terminate the advance at predetermined exercise date(s). We would normally exercise this option when interest rates rise, and the borrower may then apply for a new advance at the then-prevailing coupon and terms. In the present interest rate environment, the price advantage has not been significant and member demand has remained weak.Short-term Advances — Member demand for short-term fixed-rate advances has declined through the quarters in 2018 to $15.0 billion at December 31, 2018, compared to $23.8 billion at December 31, 2017. Short-term advances are fixed-rate advances with original maturities of one year or less.Overnight Advances — Overnight advance balances were $7.7 billion at December 31, 2018, compared to $3.7 billion at December 31, 2017. Fluctuations in demand reflect the seasonal needs of certain member banks for their short-term liquidity requirements. Some large members also use overnight advances to adjust their balance sheet in line with their own leverage targets. The overnight advances program gives members a short-term, flexible, readily accessible revolving line of credit for immediate liquidity needs. Overnight advances mature on the next business day, at which time the advance is repaid.Collateral SecurityOur member borrowers are required to maintain an amount of eligible collateral that adequately secures their outstanding obligations with the FHLBNY. Eligible collateral includes: (1) one-to-four-family and multi-family mortgages; (2) Treasury and U.S. government agency securities; (3) mortgage-backed securities; and (4) certain other collateral that is real estate-related, provided that such collateral has a readily ascertainable value and the Bank can perfect a security interest in that collateral. We also have a statutory lien priority with respect to certain member assets under the FHLBank Act as well as a claim on FHLBNY capital stock held by our members.The FHLBNY’s loan and collateral agreements give us a security interest in assets held by borrowers that is sufficient to cover their obligations to the FHLBNY. We may supplement this security interest by imposing additional reporting, segregation or delivery requirements on the borrower. We assign specific collateral requirements to a borrower, based on a number of factors. These include, but are not limited to: (1) the borrower’s overall financial condition; (2) the degree of complexity involved in the pledging, verifying, and reporting of collateral between the borrower and the FHLBNY, especially when third-party pledges, custodians, outside service providers and pledges to other entities are involved; and (3) the type of collateral pledged.In order to ensure that the FHLBNY has sufficient collateral to cover credit extensions, the Bank has established a Collateral Lendable Value methodology. This methodology determines the lendable value or amount of borrowing capacity assigned to each specific type of collateral. Key components of the Lendable Value include measures of Market, Credit, Price Volatility and Operational Risk associated with the unique collateral types pledged to the FHLBNY. Lendable Values are periodically adjusted to reflect current market and business conditions.The following table summarizes pledged collateral at December 31, 2018 and 2017 (in thousands):Table3.3: Collateral Supporting Indebtedness to Members Indebtedness Collateral(a) Advances(b) Other
Obligations(c) Total
Indebtedness Mortgage
Loans(d) Securities and
Deposits(d) Total(d) December 31, 2019 $ 100,396,078 $ 22,108,414 $ 122,504,492 $ 308,663,555 $ 45,016,365 $ 353,679,920 December 31, 2018 $ 105,433,857 $ 20,046,053 $ 125,479,910 $ 291,826,715 $ 43,582,710 $ 335,409,425
Obligations (c)
Indebtedness
Loans (d)
Deposits (d)(a) The level of over-collateralization is on an aggregate basis and may not necessarily be indicative of a similar level of over-collateralization on an individual member basis. At a minimum, each member pledged sufficient collateral to adequately secure the member’s outstanding obligation with the FHLBNY. In addition, most members maintain an excess amount of pledged collateral with the FHLBNY to secure future liquidity needs. (b) Par value. (c) Standby financial letters of credit, derivatives and members’ credit enhancement guarantee amount (MPFCE). (d) Estimated market value. Table3.4: Location of Collateral Held Estimated Market Values Collateral in
Physical
Possession Collateral
Specifically Listed Total
Collateral
Received December 31, 2019 $ 45,876,619 $ 307,803,301 $ 353,679,920 December 31, 2018 $ 44,906,685 $ 290,502,740 $ 335,409,425
Physical
Possession
Specifically Listed
Collateral
ReceivedTable3.5: AdvancesAdvances by Interest-Rate Payment Terms December 31, 2019 December 31, 2018 Percentage Percentage Amount of Total Amount of Total Fixed-rate(a) $ 84,027,611 83.70 % $ 82,034,884 77.81 % Variable-rate(b) 16,368,467 16.30 23,391,691 22.19 Variable-rate capped or floored(c) - - 3,000 - Overdrawn demand deposit accounts - - 4,282 - Total par value 100,396,078 100.00 % 105,433,857 100.00 % Hedge valuation basis adjustments 299,163 (255,024 ) Total $ 100,695,241 $ 105,178,833 (a) Fixed-rate borrowings remained the largest category of advances borrowed by members. The presentation abovemembers, and includes long-term and short-term fixed-rate advances. Long-term advances remain a small segment of the portfolio at December 31, 2018,2019, with only 6.7%10.5% of advances in the remaining maturity bucket of greater than 5 years (2.5%(6.7% at December 31, 2017)2018). For more information, see financial statements Note 9. Advances.(b) Variable-rate advances are ARC advances, which are typically indexed to LIBOR. The FHLBNY’s larger members are generally borrowers of variable-rate advances. (c) Category represents ARCs with options that “cap” increase or “floor” decrease in the LIBOR index at predetermined strikes (We have also purchased cap/floor options that mirror the terms of the options embedded in the advances sold to members, offsetting our exposure on the advance). Table3.6: �� Advances by Maturity and Yield Type December 31, 2019 December 31, 2018 Percentage Percentage Amount of Total Amount of Total Fixed-rate Due in one year or less $ 54,411,782 54.20 % $ 52,416,990 49.72 % Due after one year 29,615,829 29.50 29,617,894 28.09 Total Fixed-rate 84,027,611 83.70 82,034,884 77.81 Variable-rate Due in one year or less 14,794,500 14.74 15,892,506 15.07 Due after one year 1,573,967 1.56 7,506,467 7.12 Total Variable-rate 16,368,467 16.30 23,398,973 22.19 Total par value 100,396,078 100.00 % 105,433,857 100.00 % Hedge valuation basis adjustments(a) 299,163 (255,024 ) Total $ 100,695,241 $ 105,178,833 Fair value basis and valuation adjustments(a) — Key determinants of valuation adjustments are factors such as advance run offs and new transactions designated in hedging relationships or when elected under the FVO, the forward swap curve, the volatility of the swap rates, the remaining duration to maturity. For FVO advances, change in interest receivable is also a factor as it is a component of the entire fair value of FVO advances.(a)Hedging valuation basis adjustments —The reported carrying values of hedged advances are adjusted for changes in their fair values (fair value basis adjustments or fair value) that are attributable to changes in the benchmark risk being hedged. LIBOR is our primary benchmark. In 2019, we adopted OIS-Fedfunds and OIS-SOFR as additional benchmarks. When an advance is hedged which is LIBOR forunder ASC 815, the FHLBNY, and ischosen benchmark becomes the discounting basis under ASC 815 for computing changes in the fair values forof the hedged advances. Theadvance. Table 3.7 Hedged Advances by Type discloses notional amountamounts of advances hedged under ASC 815 was $45.9 billion at December 31, 2018, compared to $53.6 billion at December 31, 2017.hedged. The application of ASC 815 accounting methodology resulted in the recognition of a net unrealized hedge valuation basis lossgains of $299.2 million at December 31, 2019 and valuation basis losses of $255.0 million at December 31, 2018, compared to net basis loss of $265.3 million2018. The forward benchmark yield curves, primarily LIBOR, declined at December 31, 2017. The forward LIBOR yield curve, which is the benchmark2019. As hedge valuation basis for hedged advances under ASC 815, was typically higher at the period-end valuation dates, relative to contractual yields on vintage fixed-rate hedged advances. As valuations of fixed-rate LIBOR benchmark hedge advances move inversely with the rise and fall of the forward LIBORinterest rates, the decline of the swap curve in the rising rate environment, the basis adjustmentsreversed previously reported net cumulative basis losses.For more information, see Table 10.12: Earnings Impact of Derivatives and Hedging Activities — By Financial Instrument Type.(b)FVO fair values — When elected under the FVO, valuation basis adjustments are recorded to recognize changes in the entire fair values of advances, including changes in accrued interest receivable. The discounting basis for computing fair values of FVO advances is the Advance pricing curve, which is primarily derived from the FHLBNY’s cost of funds (yields paid on Consolidated obligation debt). Fair value basis of a FVO advance reflect changes in the term structure and shape of the Advance pricing curve at the measurement dates.No advances elected under the FVO were outstanding at December 31, 2018, as run-offs were not replaced by new transactions. At December 31, 2017, valuation adjustments and interest accrued receivable, taken together reported a net basis gain of $5.6 million. Advances elected under the FVO were typically variable rate LIBOR indexed advances, which re-priced frequently to market indices, or were fixed-rate with short remaining durations. As a result, valuation basis at December 31, 2017 remained near to par. The notional amount of the FVO advance portfolio was $2.2 billion at December 31, 2017We elect the FVO on an instrument-by-instrument basis and consider credit risk at the instrument level. We have historically concluded that it was not necessary to estimate changes attributable to instrument-specific credit risk, as we consider our advances to remain fully collateralized through to maturity. For more information, see financial statements, Fair Value Option Disclosures in Note 18. Fair Values of Financial Instruments.Hedge volume — We hedge putable advances and certain “bullet”Table3.7: Hedged Advances by Type Par Amount December 31, 2019 December 31, 2018 Qualifying hedges Fixed-rate bullets(a) $ 32,335,675 $ 41,122,372 Fixed-rate putable(b) 8,365,750 4,734,750 Fixed-rate callable - 16,575 Fixed-rate with embedded cap 20,000 30,000 Total qualifying hedges $ 40,721,425 $ 45,903,697 Aggregate par amount of advances hedged(c) $ 40,721,425 $ 45,919,697 Fair value basis (hedging adjustments) $ 299,163 $ (255,024 ) (a) Generally, non-callable fixed-rate medium- and longer term advances are hedged to mitigate the risk in fixed-rate lending.(b) Putable and callable advances are hedged by cancellable swaps, and the paired long put and short call options mitigate the put/call option risks; additionally,in the hedge, fixed-rate iscash flows are also synthetically converted to LIBOR, mitigating the risk in fixed-rate lending for the FHLBNY.benchmark floating-rate. In a rising rateenvironment, swap dealers would likely exercise their call option, and the FHLBNY will exercise its put option with the member and both instruments terminate at par. Members may borrow new advances at the then prevailing rate.(c) Represents par values of advances in ASC 815 qualifying hedge relationships. Typically, the longer term fixed-rate advances and advances with optionality are hedged.Advances elected under the FVO — No advances elected under the FVO were outstanding at December 31, 2018. Advances elected under the FVO at December 31, 2017 were shorter-term adjustable-rate (ARCs). By electing the FVO for an asset instrument (the advance), the objective was to offset some of the volatility in earnings due to the designation of debt (liability) under the FVO. Changes in the fair values of the advance were recorded through earnings, and the offset was recorded as a fair value basis adjustment to the carrying values of the advances.The following table summarizes par amounts of advances elected under the FVO (in thousands):Table 3.8:Advances under the Fair Value Option (FVO)(a)No advance elected under the FVO was outstanding at December 31, 2018 as run offs were not replaced.Table 3.9:3.8: Putable and Callable Advances Advances Par Amount December 31, 2019 December 31, 2018 Putable/callable(a) $ 8,365,750 $ 4,751,325 No-longer putable/callable $ 5,000 $ 640,000 (a) Except for a few callable advances, balances represented putable advances. Putable advances were typically long-term advances with one or more put options exercisable by the FHLBNY. The increase primarily representsCallable advances are typically long-term advances with one member’s borrowing.We maintain long-term investment portfolios of debt securities, whichor more call options exercisable by the borrower. Putable and callable advances are principally mortgage-backed securities issued by GSEshedged in an ASC 815 qualifying fair value hedge with mirror image terms, including mirror image put and U.S. Agency (GSE-issued). Investments include a small portfolio of MBS issued by private enterprises, and bonds issued by state or local housing finance agencies. We also maintain short-term investments for our liquidity resources, for funding daily stock repurchases and redemptions, for ensuring the availability of funds to meet the credit needs of our members, and to provide additional earnings. We also maintain a trading portfolio, the purpose of which is to augment our liquidity needs. Investments in the trading portfolio were U.S Treasury securities and GSE-issued securities, all carried at their fair values. The Finance Agency prohibits speculative investments, but allows the designation of a trading portfolio for liquidity purposes. We may dispose such investments if liquidity needs are met and market conditions deem the sale as advantageous.We are subject to credit risk on our investments, generally transacted with GSEs and large financial institutions that are considered to be investment quality. The Finance Agency defines investment quality as a security with adequate financial backing so that full and timely payment of principal and interest on such security is expected and there is minimal risk that the timely payment of principal and interest would not occur because of adverse changes in economic and financial conditions during the projected life of the security.The following table summarizes changes in investments by categories: Money market investments, Trading securities, Equity investments in Grantor trusts,call option terms.Table4.1: Investments by Categories December 31, December 31, Dollar Percentage 2019 2018 Variance Variance State and local housing finance agency obligations(a) $ 1,122,315 $ 1,168,350 $ (46,035 ) (3.94 )% Trading securities(b) 15,318,809 5,810,512 9,508,297 163.64 Mortgage-backed securities Available-for-sale securities, at fair value(c) 2,653,418 422,216 2,231,202 528.45 Held-to-maturity securities, at carrying value(c) 14,112,167 16,306,476 (2,194,309 ) (13.46 ) Total securities 33,206,709 23,707,554 9,499,155 40.07 Equity investments in Grantor trusts(d) 60,047 48,179 11,868 24.63 Securities purchased under agreements to resell 14,985,000 4,095,000 10,890,000 265.93 Federal funds sold 8,640,000 7,640,000 1,000,000 13.09 Total Investments $ 56,891,756 $ 35,490,733 $ 21,401,023 60.30 % (a) State and local housing finance agency bonds were designated as HTM and were carried at amortized cost. We acquired par amounts of $100.0 millionThere were no acquisitions during 20182019 and paydowns were $79.2$46.0 million.(b) Trading securities werecomprised of U.S. Treasury securities GSE securities and corporate notes.notes at December 31, 2019. Trading portfolio is for liquidity and not for speculative purposes. We acquired par amounts of $5.3$13.3 billion of U.S. Treasury notes and $421.7 million of GSE securities in 2018. We received par amounts of $3.4 million of Ambac corporate notes from the insurer Ambac Corporation as consideration for insurance claims on certain insured private-label MBS.2019.(c) Mortgage-backed securities classified as AFS. No acquisitions were designated as AFS inincludes $1.6 billion of Fixed-rate CMBS transferred at January 1, 2019 from the twelve months of 2018.HTM category. AFS securities outstanding are all GSE and U.S. Agency issued floating-rate MBS and carried at fair value. Mortgage-backed securities classified as HTM — $3.4 billion of GSE-issued MBS were acquired in 2018 and designated as HTM. MBS in the HTM portfolio are predominantly GSE-issued, and less than 1% are PLMBS (private-label MBS).(d) Funds in the grantor truststrust were designated as equity investments at January 1, 2018. Prior to January 1, 2018, the funds were classified as AFS. In the twelve months of 2018, investments made were $3.8 million and payouts to retirees were $1.8 million. Trust fund balances represent investments in registered mutual funds and other fixed-income and equity funds. Funds are highly liquid and readily redeemable at their NAVs, which are the fair values of the investments. The funds are owned by the FHLBNY, and the intent is to utilize investments to fund current and potential future payment obligations of the non-qualified Benefit Equalization Pensionemployee retirement plans.Table4.2: Investment Debt Securities Issuer Concentration December 31, 2019 December 31, 2018 Carrying value as a Carrying value as a Carrying(a) Percentage Carrying(a) Percentage Long Term Investment(c) Value Fair Value of Capital Value Fair Value of Capital MBS Fannie Mae $ 4,008,977 $ 4,031,807 53.23 % $ 4,692,639 $ 4,658,771 60.58 % Freddie Mac 12,628,143 12,826,958 167.66 11,870,521 11,867,028 153.23 Ginnie Mae 18,459 18,572 0.25 22,898 23,079 0.30 All Others - PLMBS 110,006 133,182 1.46 142,634 174,749 1.84 Non-MBS(b) 1,122,315 1,099,505 14.90 1,168,350 1,144,345 15.08 Total Investment Debt Securities $ 17,887,900 $ 18,110,024 237.50 % $ 17,897,042 $ 17,867,972 231.03 % Categorized as: Available-for-Sale Securities $ 2,653,418 $ 2,653,418 $ 422,216 $ 422,216 Held-to-Maturity Securities $ 15,234,482 $ 15,456,606 $ 17,474,826 $ 17,445,756 (a) Carrying values include fair values for AFS securities. (b) Non-MBS—Includes Housing finance agency bonds. At December 31, 2017, also included grantor trusts, which was then classified as AFS. In 2018, grantor trusts were classified as Equity investments.(c) Excludes Trading portfolio. Table4.3: External Rating of the Held-to-Maturity Portfolio December 31, 2019 Below Investment AAA-rated(a) AA-rated(b) A-rated BBB-rated Grade Total Mortgage-backed securities $ 520 $ 14,003,384 $ 69,701 $ 9,049 $ 29,513 $ 14,112,167 State and local housing finance agency obligations 25,000 1,085,875 5,055 6,385 - 1,122,315 Total Long-term securities $ 25,520 $ 15,089,259 $ 74,756 $ 15,434 $ 29,513 $ 15,234,482 December 31, 2018 Below Investment AAA-rated(a) AA-rated(b) A-rated BBB-rated Grade Total Mortgage-backed securities $ 2,543 $ 16,165,160 $ 95,760 $ 9,117 $ 33,896 $ 16,306,476 State and local housing finance agency obligations 25,000 1,122,060 5,575 15,715 - 1,168,350 Total Long-term securities $ 27,543 $ 17,287,220 $ 101,335 $ 24,832 $ 33,896 $ 17,474,826
Investment
Grade
Investment
GradeSee footnotes (a) and (b) under Table 4.4.Table4.4: External Rating of the Available-for-Sale Portfolio December 31, 2019 December 31, 2018 AA-rated(b) Unrated Total AA-rated(b) Unrated Total Available-for-sale securities Mortgage-backed securities $ 2,653,418 $ - $ 2,653,418 $ 422,216 $ - $ 422,216 (a) Certain PLMBS and housing finance bonds have been assigned AAA, based on the ratings by S&P and Moody’s. (b) We have assigned GSE-issued MBS a rating of AA+ based on the credit rating assigned to long-term senior debt issued by Fannie Mae, Freddie Mac and U.S. Agency. The debt ratings are based on S&P’s rating of AA+ for the GSE Senior long-term debt and AA+ for the debt issued by the U.S. government; Moody’s debt rating is Aaa for the GSE Senior long-term debt and the U.S. government. December 31, 2019 December 31, 2018 Amortized
Cost Weighted
Average Rate Amortized
Cost Weighted
Average Rate Mortgage-backed securities Due in one year or less $ 616,402 3.93 % $ 369,989 2.03 % Due after one year through five years 4,102,650 2.79 4,602,651 3.16 Due after five years through ten years 8,838,096 2.97 8,201,200 3.07 Due after ten years 3,129,733 2.59 3,561,879 3.11 Total mortgage-backed securities $ 16,686,881 2.89 % $ 16,735,719 3.08 % Fair Value Hedges of Fixed-Rate Prepayable CMBS December 31, 2019 Current face value of hedged CMBS $ 602,000 Partial-term hedge face value of hedged CMBS $ 532,000 Cumulative basis adjustment Gains (losses) $ 11,593 Interest rate swap contracts (par) $ 532,000 December 31, 2019 December 31, 2018 Year ended December 31, 2019 Year ended December 31, 2018 Foreign Counterparties S&P
Rating Moody's
Rating S&P
Rating Moody's
Rating Daily Average
Balance Balance at
period end Daily Average
Balance Balance at
period end Australia AA- AA3 AA- AA3 $ 1,648,123 $ 1,870,000 $ 2,561,822 $ 1,635,000 Austria A A2 A A2 563,630 - 828,929 - Canada A to AA- A3 to AA2 A to AA- A3 to AA2 2,910,110 2,755,000 2,891,912 2,660,000 Finland AA- AA3 N/A N/A 225,959 1,000,000 - - France A to A+ A1 to AA3 A to A+ A1 to AA3 894,466 - 744,753 500,000 Netherlands A+ AA3 A+ AA3 798,608 500,000 840,542 810,000 Norway AA- AA2 A+ AA2 430,562 100,000 742,452 - Sweden A+ to AA- AA2 A+ to AA- AA3 to AA2 664,068 - 4,497,885 - Switzerland A+ A1 A A1 292,521 880,000 591,260 - UK A A2 A A2 15,644 - 285,611 - Subtotal 8,443,691 7,105,000 13,985,166 5,605,000 USA A- to AA- A3 to AA2 A- to AA- BAA1 to AA2 1,847,268 1,535,000 3,022,181 2,035,000 Total $ 10,290,959 $ 8,640,000 $ 17,007,347 $ 7,640,000 External credit rating information has been provided in Table 4.3 and Table 4.4 as the information is used as another data point to supplement our credit quality indicators, and they serve as a useful indicator when analyzing the degree of credit risk to which we are exposed. Significant changes in credit ratings classifications of our investment debt securities portfolio could indicate increased credit risk for us that could be accompanied by a reduction in the fair values of our investment debt securities portfolio.Fair Value Levels of Investment Debt Securities, and Unrecognized and Unrealized Holding Losses(a)To compute fair values, multiple vendor prices were received for substantially all of our MBS holdings, and substantially all of those prices fell within specified thresholds. The relative proximity of the prices received from the multiple vendors supported our conclusion that the final computed prices were reasonable estimates of fair values. GSE securities priced under such a valuation technique using the market approach are typically classified within Level 2 of the valuation hierarchy. For a comparison of carrying values and fair values of investment debt securities, see financial statements, Note 5. Trading securities, Note 7. Available-for-Sale Securities and Note 8. Held-to-Maturity Securities. For more information about the corroboration and other analytical procedures performed, see Note 18. Fair Values of Financial Instruments.Weighted average rates — Mortgage-backed securities (HTM and AFS) — The following table summarizes weighted average rates and amortized cost by contractual maturities (dollars in thousands):Table 4.5:Mortgage-Backed Securities Weighted Average Rates by Contractual MaturitiesA significant portion of the MBS portfolio consisted of floating-rate securities and the weighted average rates will change in parallel with changes in the LIBOR rate.OTTI — Base Case and Adverse Case ScenarioWe evaluated our PLMBS under a base case (or best estimate) scenario by performing a cash flow analysis for each security under assumptions that forecasted increased credit default rates or loss severities, or both. The stress test scenario and associated results do not represent our current expectations and therefore should not be construed as a prediction of future results, market conditions or the actual performance of these securities. Cash flow analysis in 2018 identified de minimis deterioration in the performance parameters of previously impaired private-label MBS. Credit OTTI charged to earnings was $141 thousand in 2018. No OTTI was recorded in 2017 and $231 thousand was recorded in 2016.Short-term investmentsWe typically maintain substantial investments in high quality short- and intermediate-term financial instruments such as secured overnight transactions collateralized by securities, and unsecured overnight and term federal funds sold to highly-rated financial institutions who also satisfy other credit quality factors. These investments provide the liquidity necessary to meet members’ credit needs. Short-term investments also provide a flexible means of implementing the asset/liability management decisions to adjust liquidity. In December 2016, a trading portfolio was established with the objective of expanding our choice of investing for liquidity.Monitoring — We actively monitor our credit exposures and the credit quality of our counterparties, including an assessment of each counterparty’s financial performance, capital adequacy, and sovereign support as well as related market signals, and actively limit or suspend existing exposures, as appropriate. In addition, we are required to manage our unsecured portfolio subject to regulatory limits, prescribed by the Finance Agency, our regulator. The Finance Agency regulations include limits on the amount of unsecured credit that may be extended to a counterparty or a group of affiliated counterparties, based upon a percentage of eligible regulatory capital and the counterparty’s overall credit rating. Under these regulations, the level of eligible regulatory capital is determined as the lesser of our regulatory capital or the eligible amount of regulatory capital of the counterparty determined in accordance with Finance Agency regulations.The Finance Agency regulations also permit us to extend additional unsecured credit, which could be comprised of overnight extensions and sales of federal funds subject to continuing contract. Our total unsecured overnight exposure to a single counterparty may not exceed twice the regulatory limit for term exposures. We are prohibited by Finance Agency regulation from investing in financial instruments issued by non-U.S. entities other than those issued by U.S. branches and agency offices of foreign commercial banks, and we did not own any financial instruments issued by foreign sovereign governments, including those countries that are members of the European Union in any periods in this report.Securities purchased under agreements to resell — As part of our banking activities with counterparties, we have entered into secured financing transactions that mature overnight, and can be extended only at our discretion. These transactions involve the lending of cash against securities, which are accepted as collateral. The balance outstanding under such agreements was $4.1 billion at December 31, 2018 and $2.7 billion at December 31, 2017. For more information, see financial statements, Note 4. Federal Funds Sold, and Securities Purchased under Agreements to Resell.Federal funds sold — Federal funds sold was $7.6 billion at December 31, 2018 and $10.3 billion at December 31, 2017, representing unsecured lending to major banks and financial institutions. We are a major lender in this market, particularly in the overnight market. The amount of unsecured credit risk that may be extended to individual counterparties is commensurate with the counterparty’s credit quality as assessed by our management, and the assessment would include reviews of credit ratings of counterparty’s debt securities or deposits as reported by NRSROs. Overnight and short-term federal funds allow us to warehouse funds and provide balance sheet liquidity to meet unexpected member borrowing demands.The table below presents federal funds sold, the counterparty credit ratings, and the domicile of the counterparty or the domicile of the counterparty’s parent for U.S. branches and agency offices of foreign commercial banks in the U.S. (in thousands):Table 4.6:Federal Funds Sold by Domicile of the Counterparty (a)
Counterparties
Rating
Rating
Rating
Rating
Balance
period end
Balance
period end(a)Average investment in federal funds sold has typically been greater than the period-end balance as counterparties appear to have less demand at quarter-end than during the quarter. The following table summarizes par value, amortized cost and the carrying value (fair value) of the trading portfolio (in thousands):Table 4.7: Trading Securities December 31, 2019 December 31, 2018 $ 15,232,900 $ 5,692,263 $ 15,265,745 $ 5,807,889 $ 15,318,809 $ 5,810,512 Economic Hedges of Fixed-Rate Trading Securities December 31, 2019 December 31, 2018 Par amount of Trading securities hedged $ 15,230,000 $ 5,839,130 Par amount of interest rate swaps $ 15,230,000 $ 5,839,130 $2.9$3.1 billion at December 31, 2018,2019, an increase of $33.0$244.3 million (net of acquisitions and paydowns) from the balance at December 31, 2017.2018. Mortgage loans were investments in Mortgage Partnership Finance loans (MPF or MPF Program).—- We invest in mortgage loans through the MPF Program, which is a secondary mortgage market structure under which eligible mortgage loans are purchased or funded from or through members who are Participating Financial Institutions (PFI). We may also acquire MPF loans through participations with other FHLBanks, although our current acquisition strategy is to limit acquisitions through our PFIs. MPF loans are conforming conventional and Government i.e., insured or guaranteed by the Federal Housing Administration (FHA), the Department of Veterans Affairs (VA) or the Rural Housing Service of the Department of Agriculture (RHS), fixed-rate mortgage loans secured primarily by single-family residential properties with maturities ranging from five to 30 years or participations in such mortgage loans. The FHLBank of Chicago (MPF Provider) developed the MPF Program in order to help fulfill the housing mission and to provide an additional source of liquidity to FHLBank members that choose to sell mortgage loans into the secondary market rather than holding them in their own portfolios. Finance Agency regulations define the acquisition of Acquired Member Assets (AMA) as a core mission activity of the FHLBanks. In order for MPF loans to meet the AMA requirements, the purchase and funding are structured so that the credit risk associated with MPF loans is shared with PFIs. December 31, 2019 December 31, 2018 $ 217,000 $ 227,268 2,910,744 2,656,149 $ 3,127,744 $ 2,883,417
loans %
outstanding %
loans %
outstanding % December 31, 2019 December 31, 2018 Number of
loans % Amounts
outstanding % Number of
loans % Amounts
outstanding % New York State 68.6 % 61.1 % 68.8 % 60.4 % December 31, 2019 Mortgage Percent of Total Loans Mortgage Loans $ 331,970 10.61 % 296,289 9.47 240,850 7.70 Sterling National Bank 219,814 7.03 New York Community Bank 219,729 7.03 1,819,092 58.16 $ 3,127,744 100.00 % December 31, 2018 Mortgage Percent of Total Loans Mortgage Loans Bethpage Federal Credit Union $ 260,593 9.04 % (a) 256,992 8.91 242,164 8.40 Sterling National Bank 238,840 8.28 183,052 6.35 1,701,776 59.02 $ 2,883,417 100.00 % (a)New York Community Bancorp, Inc., parent of New York Community Bank, sold its mortgage banking business in June 2017 to Freedom Mortgage Corporation, a non-member.(b)Sterling National Bank, a member of the FHLBNY, acquired Astoria Bank in October 2017.Accrued interest receivableAccrued interest receivableOther assetsOther assets$275.3 million at December 31, 2018 and $227.0$312.6 million at December 31, 2017,2019 and $275.3 million at December 31, 2018, and represented interest receivable primarily from advances and investments. Changes in balances would represent the timing of coupons receivable from advances and investments at the balance sheet dates.including prepaymentsincluded prepaid assets and miscellaneous receivables, were $9.0 million and $8.6 million and $7.4 million atDecember 31, 20182019 and December 31, 2017.2018.2018, compared to $99.3 billion (par, $98.9 billion) at December 31, 2017.2018. The carrying value of Consolidated obligation discount notes outstanding was $74.0 billion at December 31, 2019 and $50.6 billion at December 31, 2018 and $49.6 billion at December 31, 2017.Performance of the FHLBank issued consolidated obligation debt in 2018 — Market demand for FHLBank COs, especially from money market funds, remained strong, with good market access in 2018 for its entire breadth of CO funding programs.The current rising rate environment has not caused any disruptions in FHLBank access to funding, especially access to short-term funding. The benefits of the 2016 money market fund reform (MMF reform) has extended further than just the increased interest in FHLBank discount notes. Demand for short-duration (less than 2 years to maturity) CO floaters was significant in 2018 as was in 2017. The rise in investor demand for floaters has largely been a function of the anticipated rate hikes. As interest rates continued to rise and the effects of MMF reform continued to favor the vast majority ofmoney funds to remain invested in government money market mutual funds, strong demand for floaters persisted. The robust demand from the money market funds community for discount notes and short duration floaters has also kept CO discount note spreads to Treasuries tight and discount note spread volatility low.Floating-rate CO bonds have been attractive for a number of reasons. In a rising interest rate environment, periodic resets remove much of the interest rate risk for investors, compared to fixed-rate bonds, as the floaters reset to higher yields as prevailing rates go up. Money market funds continued to be attracted to floaters as the debt receives favorable liquidity treatment under the SEC’s Rule 2(a)-7 which deems the security’s weighted average maturity to be the next rate reset date. Money fund investors also like that coupons reset with rising rates and the fact that at each reset the price of the floaters generally resets to par, an important feature for a money market fund trying to maintain a constant net asset value (NAV). Moreover, with CO discount notes yields tightening to U.S. treasuries, floaters offered yield pickup to discount notes or other money fund eligible investments. The attractive pricing and the favorable WAM treatment for floaters continued to drive up money fund demand and drive down costing yields from the perspective of the FHLBNY.The demand for CO discount notes has also remained strong. The CO discount note issuance has continued to attract investors who need high quality liquid securities with specific maturity dates. Strong money market fund participation demonstrated the robust support for CO discount notes within the money market fund industry, and the key driver still remains the impact of money market fund reforms implemented by the SEC in late 2016. CO discount note spreads to treasuries have remained tight, benefiting FHLBNY funding costs.Funding mix — The attractiveness of floaters and discount notes has been a factor in the FHLBNY’s asset-liability management tactics. The FHLBNY’s funding mix has shifted over the last few years to greater utilization of floaters and discount notes. The average volume of floaters funded 24.7% and 41.0% of average interest-yielding assets in 2016 and 2017. The floater utilization was 43.4% in 2018. The average volume of discount notes funded 36.2% and 30.8% of average interest-yielding assets in 2016 and 2017. The discount note utilization was 33.5% in 2018.A significant percentageSignificant amounts of CO bonds hashave been designated under an ASC 815 fair value accounting hedge. Also, certain CO bonds were hedged by interest rate swaps in economic hedges. We mayFrom time to time, we have also hedgehedged the anticipatory issuance of fixed-rate CO bonds in a cash flow hedge under ASC 815. Certain CO bonds were elected under the FVO. CarryingAs a result of hedging elections under ASC 815 and the elections under the FVO, carrying values of CO bonds included valuation basis adjustments on bonds hedged under ASC 815, and on CO bonds elected under the FVO.adjustments. For more information about valuation basis adjustments on CO bonds, see Table 6.1. No had been hedged under an ASC 815 fair value accounting hedge at December 31, 2018 and 2017, although from time to time we have designated the instruments in economic hedges during the periods in this report. Certainaccounting; additionally, certain discount notes wereare also hedged under an ASC 815 cash flow accounting hedge, and are discussed inhedge. For more information, see financial statements, Note 17. Derivatives and Hedging Activities. Certain discount notes were elected under the FVO. CarryingAs a result of accounting elections, carrying values includedof discount notes may include valuation basis adjustments on discount notes elected under the FVO.adjustments. For more information about valuation basis adjustments on discount notes, see Table 6.7 Discount Notes Outstanding.
Issuance and Servicing — The issuance and servicing of Consolidated obligation debt is performed by the Office of Finance, a joint office of the FHLBanks established by the Finance Agency. Each FHLBank independently determines its participation in each issuance of Consolidated obligations based on, among other factors, its own funding and operating requirements, maturities, interest rates and other terms available for Consolidated obligations in the market place. The two major debt programs offered by the Office of Finance are the Global Debt Program and the TAP issue programs. We participate in both programs.
Joint and Several Liability — Although we are primarily liable for our portion of Consolidated obligations (i.e. those issued on our behalf), we are also jointly and severally liable with the other FHLBanks for the payment of principal and interest on the Consolidated obligations of all the FHLBanks. For more information, see financial statements, Note 19. Commitments and Contingencies.
SOFR CO Bonds — Total outstanding FHLBank System SOFR-linked bonds was $121.5 billion at December 31, 2019, compared to $124.3 billion at September 30, 2019, $61.5 billion at June 30, 2019 and $11.6 billion at December 31, 2018. The SOFR market has developed rapidly during 2019, and successful issuances of FHLBank System SOFR-linked floaters (Floating-rate notes or FRNs) have been an important development for the FHLBank debt and its support for SOFR.
The FHLBNY’s share of SOFR-linked CO bonds has increased; outstanding balances were $8.2 billion at December 31, 2019, $11.3 billion at September 30, 2019, $6.0 billion at June 30, 2019 and $950.0 million at December 31, 2018.
61
Consolidated obligation bonds
The following table summarizes types of Consolidated obligation bonds (CO Bonds) issued and outstanding (dollars in thousands):
Table 6.1:Consolidated ObligationTable 6.1: CO Bonds by Type
| December 31, 2019 | December 31, 2018 | |||||||||||||||
| Amount | Percentage of Total | Amount | Percentage of Total | |||||||||||||
| Fixed-rate, non-callable | $ | 32,588,805 | 41.72 | % | $ | 22,745,980 | 27.16 | % | ||||||||
| Fixed-rate, callable | 4,803,000 | 6.15 | 4,966,000 | 5.93 | ||||||||||||
| Step Up, callable | 15,000 | 0.02 | 880,000 | 1.05 | ||||||||||||
| Single-index floating rate | 40,702,000 | 52.11 | 55,166,000 | 65.86 | ||||||||||||
| Total par value | 78,108,805 | 100.00 | % | 83,757,980 | 100.00 | % | ||||||||||
| Bond premiums | 95,560 | 42,647 | ||||||||||||||
| Bond discounts | (24,704 | ) | (36,290 | ) | ||||||||||||
| Hedge valuation basis adjustments(a) | 377,000 | 238,150 | ||||||||||||||
| Hedge basis adjustments on de-designated hedges(b) | 139,605 | 131,497 | ||||||||||||||
| FVO(c) - valuation adjustments and accrued interest | 67,043 | 19,792 | ||||||||||||||
| Total Consolidated obligation-bonds | $ | 78,763,309 | $ | 84,153,776 | ||||||||||||
|
| December 31, 2018 |
| December 31, 2017 |
| ||||||
|
| Amount |
| Percentage |
| Amount |
| Percentage |
| ||
|
|
|
|
|
|
|
|
|
| ||
Fixed-rate, non-callable |
| $ | 22,745,980 |
| 27.16 | % | $ | 24,080,150 |
| 24.36 | % |
Fixed-rate, callable |
| 4,966,000 |
| 5.93 |
| 3,658,000 |
| 3.70 |
| ||
Step Up, callable |
| 880,000 |
| 1.05 |
| 253,000 |
| 0.26 |
| ||
Single-index floating rate |
| 55,166,000 |
| 65.86 |
| 70,860,000 |
| 71.68 |
| ||
|
|
|
|
|
|
|
|
|
| ||
Total par value |
| 83,757,980 |
| 100.00 | % | 98,851,150 |
| 100.00 | % | ||
|
|
|
|
|
|
|
|
|
| ||
Bond premiums |
| 42,647 |
|
|
| 54,654 |
|
|
| ||
Bond discounts |
| (36,290 | ) |
|
| (27,335 | ) |
|
| ||
Hedge valuation basis adjustments (a) |
| 238,150 |
|
|
| 273,585 |
|
|
| ||
Hedge basis adjustments on terminated hedges (b) |
| 131,497 |
|
|
| 134,920 |
|
|
| ||
FVO (c) - valuation adjustments and accrued interest |
| 19,792 |
|
|
| 1,074 |
|
|
| ||
|
|
|
|
|
|
|
|
|
| ||
Total Consolidated obligation-bonds |
| $ | 84,153,776 |
|
|
| $ | 99,288,048 |
|
|
|
|
|
|
|
|
|
|
|
|
| ||
Fair value basis and valuation adjustments — Key determinants are factors such as run offs and new transactions designated under an ASC 815 hedge or elected under the FVO, the forward swap curve, the volatility of the swap rates, the remaining duration to maturity, and for bonds elected under the FVO, the changes in the spread between the swap rate and the Consolidated obligation debt yields, and changes in interest payable, which is a component of the entire fair value of FVO bonds.
| (a) | Hedging valuation basis adjustments —The reported carrying values of hedged CO bonds are adjusted for changes in their fair values (fair value basis adjustments or fair value) that are attributable to changes in the benchmark risk being hedged. LIBOR is our primary benchmark. In 2019 we adopted OIS/FF and OIS/SOFR as two other benchmarks. In the hedging relationships, the benchmark is elected on an instrument-by-instrument basis and becomes the discounting basis under ASC 815 for computing changes in fair values for hedged CO bonds. Table 6.2 CO Bonds Hedged under Qualifying Fair Value Hedges discloses notional amounts of CO bonds hedged. The application of ASC 815 accounting methodology resulted in the recognition of net unrealized hedge valuation basis losses of $377.0 million and $238.2 million at December 31, 2019 and December 31, 2018. The benchmark curves, specifically the forward LIBOR yield curve, declined at December 31, 2019. As hedge valuation basis of fixed-rate CO liabilities move with the rise and fall of the forward benchmark curves, the decline forward curves caused valuation losses to increase. Generally, hedge valuation basis gains and losses are unrealized and will reverse to zero if the CO bonds are held to maturity or are called on the early option exercise dates. |
(a)Hedge valuation
| (b) | Valuation basis of terminated hedges —Represents unamortized cumulative valuation basis of certain CO bonds that were no longer in fair value hedge relationships. When hedging relationships for the debt were de-designated, the net unrealized cumulative losses at the hedge termination dates were no longer adjusted for changes in the benchmark rate. Instead, the valuation basis are being amortized on a level yield method, and the net amortization is recorded as a reduction of Interest expense. If the CO bonds are held to maturity, the basis losses will be fully amortized as interest expense. |
The reported carrying values of hedged Consolidated bonds are adjusted for changes to their fair values (fair value basis adjustments or fair value) that are attributable to the benchmark risk being hedged, which is LIBOR for the FHLBNY, and is the discounting basis for computing changes in fair values basis for hedged fixed-rate debt. The notional amount of CO bonds hedged under the fair value hedging standards under ASC 815 was $11.7 billion at December 31, 2018 and $15.8 billion at December 31, 2017.
| (c) | FVO valuation adjustments—Valuation basis adjustments and accrued interest payable are recorded to recognize changes in the entire fair value (the full fair value) of CO bonds elected under the FVO. Table 6.3 CO Bonds Elected under the Fair Value Option (FVO) discloses par amounts of CO bonds elected under the FVO. Valuation adjustments at December 31, 2019 and 2018 were largely the accumulation of semi-annual accrued unpaid interest included in the full fair value of the debt. Cumulative unpaid interest has increased in line with the increase in the volume of CO bonds elected under FVO. |
The application of the valuation and accounting methodology resulted in the recognition of net unrealized hedge valuation basis losses at the two balance sheet dates, primarily due to high-coupon vintage long-term bonds, which had been issued in the then prevailing higher interest rate environment. The remaining hedged bonds — short and medium-term fixed-rate debt, which had been issued in recent years at coupons lower than the prevailing yields, generated valuation basis gains, partly offsetting the valuation basis losses on the vintage hedged debt. The small period-over-period decline in unrealized valuation losses was also due to the decline in the volume of hedged debt. Generally, hedge valuation basis are unrealized and will reverse to zero if hedged debt are held to their maturity or to their call dates. Also, see Table 6.2 Bonds Hedged under Qualifying Fair Value Hedges.
(b)Valuation basis of terminated hedges — Represents unamortized cumulative valuation basis of certain CO bonds that were no longer in fair value hedge relationships. When hedging relationships for the debt were de-designated, the net unrealized cumulative losses at the hedge termination dates were no longer adjusted for changes in the benchmark rate. Instead, the valuation basis are being amortized on a level yield method, and the net amortization is recorded as a reduction of Interest expense. If the CO bonds are held to maturity, the basis losses will be fully amortized as an interest expense.
(c)FVO valuation adjustments — Valuation basis adjustments and accrued interest payable are recorded to recognize changes in the entire fair value (the full fair value) of CO bonds elected under the FVO. The notional amounts of CO bonds elected under the FVO were $5.1
billion at December 31, 2018 and $1.1 billion at December 31, 2017. Valuation adjustments at December 31, 2018 were largely the accumulation of semi-annual accrued unpaid interest included in the full fair value of the debt. The higher volume of FVO debt and the outstanding accumulated interest explains the increase in the valuation basis.
The discounting basis for computing the change in fair value basis of bonds elected under the FVO is the observable (FHLBank) CO bond yield curve. All FVO bonds were short- and medium-term,intermediate-term, and fluctuations in their “clean prices” (without accumulated unpaid interest) valuations were not significant as the bonds re-priced relatively frequently to market indices, keeping valuations near to par, although inter-period valuation volatility is likely.
We have elected the FVO on an instrument-by-instrument basis. For bonds elected under the FVO, it was not necessary to estimate changes attributable to instrument-specific credit risk, as we consider the credit worthiness of the FHLBanks to be secure and credit related adjustments unnecessary. More information about debt elected under the FVO is provided in financial statements, Note 18. Fair Values of Financial Instruments (See Fair Value Option Disclosures).
62
Hedge volume — Tables 6.2 —- 6.4 provide information with respect to par amounts of CO bonds based on accounting designation: (1) under hedge qualifying rules, (2) under the FVO, and (3) as an economic hedge (in thousands):
Table 6.2:Bonds Hedged under Qualifying Fair Value Hedges
| Table 6.2: | CO Bonds Hedged under Qualifying Fair Value Hedges |
Qualifying hedges— Generally, fixed-rate (bullet and callable) medium and long-term Consolidated obligation bonds are hedged in a Fair value ASC 815 qualifying hedge. Decline in ASC 815 fair value hedges of fixed-rate debt reflects an asset-liability management decision to replace maturing fixed-rate CO bonds with floating-rate CO bonds. Floating-rate bonds are typically hedged to eliminate basis risk and the hedge is designated as standalone (economic) hedges.
|
| Consolidated Obligation Bonds |
| ||||
Par Amount |
| December 31, 2018 |
| December 31, 2017 |
| ||
Qualifying Hedges |
|
|
|
|
| ||
Fixed-rate bullet bonds |
| $ | 8,300,080 |
| $ | 14,326,105 |
|
Fixed-rate callable bonds |
| 3,373,000 |
| 1,453,000 |
| ||
|
| $ | 11,673,080 |
| $ | 15,779,105 |
|
Table 6.3:Bonds Elected under the Fair Value Option (FVO)
| Consolidated Obligation Bonds | ||||||||
| Par Amount | December 31, 2019 | December 31, 2018 | ||||||
| Qualifying hedges | ||||||||
| Fixed-rate bullet bonds | $ | 11,802,950 | $ | 8,300,080 | ||||
| Fixed-rate callable bonds | 70,000 | 3,373,000 | ||||||
| $ | 11,872,950 | $ | 11,673,080 | |||||
| Table6.3: | CO Bonds Elected under the Fair Value Option (FVO) |
CO bonds elected under the FVO— If at inception of a hedge we do not believe that a hedge would be highly effective in offsetting fair value changes between the derivative and the debt (hedged item), we may designate the debt under the FVO if operationally practical. We would record fair value changes of the FVO debt through earnings, and to the extent the debt is economically hedged, record changes ofin the fair values of the interest rate swap through earnings. The recorded balance sheet value of debt under the FVO would include the fair value basis adjustments, so that the debt’s balance sheet carrying values would be its full fair value.
|
| Consolidated Obligation Bonds |
| ||||
Par Amount |
| December 31, 2018 |
| December 31, 2017 |
| ||
Bonds designated under FVO |
| $ | 5,140,000 |
| $ | 1,130,000 |
|
| Consolidated Obligation Bonds | ||||||||
| Par Amount | December 31, 2019 | December 31, 2018 | ||||||
| Bonds designated under FVO | $ | 12,067,000 | $ | 5,140,000 | ||||
CO bonds elected under the FVO were generally in economic hedges by the execution of interest rate swaps that converted the fixed-rate bonds to a variable-rate instrument. We elected to account for the bonds under the FVO when we were generally unable to assert with confidence that the short- and intermediate-term bonds, or callable bonds, with short lock-out periods to the exercise of call options, would remain effective hedges as required under hedge accounting rules. Designation of CO bonds under the FVO is an asset-liability management decision.
For more information, see financial statements, Fair Value Option Disclosures in Note 18. Fair Values of Financial Instruments.
Table 6.4:Economic Hedged
63
| Table 6.4: | Economic Hedges of CO Bonds (Excludes CO Bonds Elected under the FVO and Designated in Economic Hedges) |
Economic hedges of CO bonds elected under the FVO and designated in an economic hedge)
Economically hedged bonds— We also issue variable-ratefloating-rate debt with coupons that are not indexed to the 3-month LIBOR, our preferred funding base. During the periods in this report, we issued variable-rate bonds indexed to the 1-month LIBOR. To mitigate the economic risk of a change in the variable-rate basis between the 3-month LIBORbenchmark rate (LIBOR, OIS/FF and the 1-month LIBOR, we have executed basisOIS/SOFR) and may then execute interest rate swaps that havewould synthetically created 3-month LIBOR debt.convert the cash flows to the desired floating-rate funding indexed to another benchmark to meet our asset/liability funding strategies. The operational cost of designating the debt instruments in an ASC 815 qualifying hedge outweighed the accounting benefits of marking the debt and the swap to fair values. We opted instead to designate the hedging basis swaps as standalone derivatives, and recorded changes in their fair values through earnings. The carrying value of the debt would not include fair value basis since the debt is recorded at amortized cost.
|
| Consolidated Obligation Bonds |
| ||||
Par Amount |
| December 31, 2018 |
| December 31, 2017 |
| ||
Bonds designated as economically hedged |
|
|
|
|
| ||
Floating-rate bonds (a) |
| $ | 29,735,000 |
| $ | 35,390,000 |
|
Fixed-rate bonds (b) |
| 15,000 |
| 15,000 |
| ||
|
| $ | 29,750,000 |
| $ | 35,405,000 |
|
| Consolidated Obligation Bonds | ||||||||
| Par Amount | December 31, 2019 | December 31, 2018 | ||||||
| Bonds designated as economically hedged | ||||||||
| Floating-rate bonds(a) | $ | 17,875,000 | $ | 29,735,000 | ||||
| Fixed-rate bonds(b) | 50,000 | 15,000 | ||||||
| $ | 17,925,000 | $ | 29,750,000 | |||||
(a)Floating-rate debt — Floating-rate bonds were typically indexed to 1-month LIBOR. With the execution of basis hedges, certain floating-rate bonds were swapped in economic hedges to 3-month LIBOR, mitigating the basis risk between the 1-month LIBOR and the 3-monthLIBOR, which is our benchmark rate. The decline in floating-rate bonds was in line with the decline in variable-rate advances in the 4th quarter of 2018.
(b)Fixed-rate debt — Bonds that were previously hedged and have fallen out of effectiveness.
| (a) | Floating-rate debt—Floating-rate bonds were typically indexed to 1-month LIBOR. With the execution of basis hedges, certain floating-rate bonds were swapped in economic hedges to 3-month LIBOR, mitigating the basis risk between the 1-month LIBOR and the 3-month LIBOR, which is our primary benchmark rate. |
| (b) | Fixed-rate debt—Bonds that were previously hedged and have fallen out of effectiveness. |
Consolidated obligation bondsCO Bonds — maturityMaturity or next call date Next Call Date(a)
Callable bonds contain an exercise date or a series of exercise dates that may result in a shorter redemption period. The following table summarizes par amounts of Consolidated bonds outstanding by years to maturity or next call date (dollars in thousands):
Table 6.5:Consolidated ObligationTable 6.5: CO Bonds — Maturity or Next Call Date
| December 31, 2019 | December 31, 2018 | |||||||||||||||
| Amount | Percentage of Total | Amount | Percentage of Total | |||||||||||||
| Year of maturity or next call date | ||||||||||||||||
| Due or callable in one year or less | $ | 63,261,595 | 80.99 | % | $ | 69,699,475 | 83.22 | % | ||||||||
| Due or callable after one year through two years | 4,266,125 | 5.46 | 5,700,545 | 6.81 | ||||||||||||
| Due or callable after two years through three years | 2,970,715 | 3.80 | 1,661,325 | 1.98 | ||||||||||||
| Due or callable after three years through four years | 1,388,835 | 1.78 | 1,383,750 | 1.65 | ||||||||||||
| Due or callable after four years through five years | 1,001,735 | 1.28 | 955,235 | 1.14 | ||||||||||||
| Thereafter | 5,219,800 | 6.69 | 4,357,650 | 5.20 | ||||||||||||
| Total par value | $ | 78,108,805 | 100.00 | % | $ | 83,757,980 | 100.00 | % | ||||||||
|
| December 31, 2018 |
| December 31, 2017 |
| ||||||
|
| Amount |
| Percentage |
| Amount |
| Percentage |
| ||
Year of maturity or next call date |
|
|
|
|
|
|
|
|
| ||
Due or callable in one year or less |
| $ | 69,699,475 |
| 83.22 | % | $ | 84,436,565 |
| 85.42 | % |
Due or callable after one year through two years |
| 5,700,545 |
| 6.81 |
| 7,266,255 |
| 7.35 |
| ||
Due or callable after two years through three years |
| 1,661,325 |
| 1.98 |
| 1,917,400 |
| 1.94 |
| ||
Due or callable after three years through four years |
| 1,383,750 |
| 1.65 |
| 973,595 |
| 0.98 |
| ||
Due or callable after four years through five years |
| 955,235 |
| 1.14 |
| 947,835 |
| 0.96 |
| ||
Thereafter |
| 4,357,650 |
| 5.20 |
| 3,309,500 |
| 3.35 |
| ||
|
|
|
|
|
|
|
|
|
| ||
Total par value |
| 83,757,980 |
| 100.00 | % | 98,851,150 |
| 100.00 | % | ||
|
|
|
|
|
|
|
|
|
| ||
Bond premiums |
| 42,647 |
|
|
| 54,654 |
|
|
| ||
Bond discounts |
| (36,290 | ) |
|
| (27,335 | ) |
|
| ||
Hedge valuation basis adjustments |
| 238,150 |
|
|
| 273,585 |
|
|
| ||
Hedge basis adjustments on terminated hedges |
| 131,497 |
|
|
| 134,920 |
|
|
| ||
FVO - valuation adjustments and accrued interest |
| 19,792 |
|
|
| 1,074 |
|
|
| ||
|
|
|
|
|
|
|
|
|
| ||
Total bonds |
| $ | 84,153,776 |
|
|
| $ | 99,288,048 |
|
|
|
| (a) | Contrasting Consolidated obligation bonds by contractual maturity dates (see financial statements, Note 12. Consolidated Obligations — Redemption Terms of Consolidated Obligation Bonds) with potential call dates (as reported in table above) illustrates the impact of hedging on the effective duration of the bond. With a callable bond, we have purchased the option to terminate debt at agreed upon dates from investors. The call options are exercisable as either a one-time option or quarterly. Our current practice is to exercise our option to call a bond when the swap counterparty exercises its option to call the cancellable swap hedging the callable bond. Thus, issuance of a callable bond with an associated callable swap significantly alters the contractual maturity characteristics of the original bond and introduces the possibility of an exercise call date that is significantly shorter than the contractual maturity. |
(a)Contrasting Consolidated obligation bonds by contractual maturity dates (see financial statements, Note 12. Consolidated Obligations — Redemption Terms of Consolidated Obligation Bonds) with potential call dates (as reported in table above) illustrates the impact of hedging on the effective duration of the bond. With a callable bond, we have purchased the option to terminate debt at agreed upon datesfrom investors. The call options are exercisable as either a one-time option or quarterly. Our current practice is to exercise our option to call a bond when the swap counterparty exercises its option to call the cancellable swap hedging the callable bond. Thus, issuance of a callable bond with an associated callable swap significantly alters the contractual maturity characteristics of the original bond and introduces the possibility of an exercise call date that is significantly shorter than the contractual maturity.
The following table summarizes callable bonds versus non-callable CO bonds outstanding (par amounts, in thousands):
Table 6.6:
| Table 6.6: | Outstanding Callable CO Bonds versus Non-callable CO bonds |
| December 31, 2019 | December 31, 2018 | |||||||
| Callable | $ | 4,818,000 | $ | 5,846,000 | ||||
| Non-Callable | $ | 73,290,805 | $ | 77,911,980 | ||||
|
| December 31, 2018 |
| December 31, 2017 |
| ||
Callable |
| $ | 5,846,000 |
| $ | 3,911,000 |
|
Non-Callable |
| $ | 77,911,980 |
| $ | 94,940,150 |
|
CO Discount Notes
The following table summarizes discount notes issued and outstanding (dollars in thousands):
Table 6.7:Discount Notes Outstanding
| Table 6.7: | Discount Notes Outstanding |
|
| December 31, 2018 |
| December 31, 2017 |
| ||
|
|
|
|
|
| ||
Par value |
| $ | 50,805,481 |
| $ | 49,685,334 |
|
Amortized cost |
| $ | 50,631,066 |
| $ | 49,610,668 |
|
FVO (a) - valuation adjustments and remaining accretion |
| 9,172 |
| 3,003 |
| ||
Total discount notes |
| $ | 50,640,238 |
| $ | 49,613,671 |
|
|
|
|
|
|
| ||
Weighted average interest rate |
| 2.34 | % | 1.23 | % | ||
| December 31, 2019 | December 31, 2018 | |||||||
| Par value | $ | 74,094,586 | $ | 50,805,481 | ||||
| Amortized cost | $ | 73,955,552 | $ | 50,631,066 | ||||
| Hedge value basis adjustments | (105 | ) | - | |||||
| FVO(a) - valuation adjustments and remaining accretion | 3,758 | 9,172 | ||||||
| Total discount notes | $ | 73,959,205 | $ | 50,640,238 | ||||
| Weighted average interest rate | 1.60 | % | 2.34 | % | ||||
(a)Valuation basis adjustment losses, including unaccreted discounts, were recorded to recognize changes in the entire or full fair values of CO discount notes elected under the FVO. The full fair values include unaccreted discounts. The discounting basis for computing changes in fair values of discount notes elected under the FVO is the observable FHLBank discount note yield curve. Changes in fair value basis reflect changes in the term structure of interest rates, the shape of the yield curve at the measurement dates, and the growth or decline in volume. When held to maturity, unaccreted discounts will be fully accreted to par, and unrealized fair value gains and losses will sum to zero over the term to maturity.
| (a) | Valuation basis adjustment losses are recorded to recognize changes in the entire or full fair values (including unaccreted discounts on CO discount notes elected under the FVO. The discounting basis for computing changes in fair values of discount notes elected under the FVO is the observable FHLBank discount note yield curve. Valuation losses were largely liability balances representing unaccreted discounts. Other than unaccreted discount, changes in the valuation adjustments (clean prices) were not material. Clean prices represent fair value changes due to changes in the term structure of interest rates, the shape of the yield curve at the measurement dates, and the growth or decline in volume of hedged discount notes. When held to maturity, unaccreted discounts will be fully accreted to par, and unrealized fair value gains and losses will sum to zero over the term to maturity. |
The following table summarizes discount notes elected under the FVO and outstanding (in thousands):
Table 6.8:Discount Notes under the Fair Value Option (FVO)
| Table 6.8: | Discount Notes under the Fair Value Option (FVO) |
|
| Consolidated Obligation Discount Notes |
| ||||
Par Amount |
| December 31, 2018 |
| December 31, 2017 |
| ||
Discount notes designated under FVO (a) |
| $ | 3,170,915 |
| $ | 2,309,618 |
|
| Consolidated Obligation Discount Notes | ||||||||
Par Amount | December 31, 2019 | December 31, 2018 | ||||||
| Discount notes designated under FVO(a) | $ | 2,182,845 | $ | 3,170,915 | ||||
| (a) | When we have elected discount notes under the FVO, it has not been necessary to estimate changes attributable to instrument-specific credit risk, as we consider the credit worthiness of the FHLBanks to be secured and credit related adjustments unnecessary. |
CO Discount notes elected under the FVO were generally in economic hedges with the execution of interest rate swaps that converted the fixed-rate notes to a variable-rate instrument. We elected to account for the discount notes under the FVO when we were generally unable to assert with confidence that the discount notes would remain effective hedges as required under hedge accounting rules. See financial statements, Fair Value Option Disclosures in Note 18. Fair Values of Financial Instruments.
(a)When we have elected discount notes under the FVO, it has not been necessary to estimate changes attributable to instrument-specific credit risk, as we consider the credit worthiness of the FHLBanks to be secured and credit related adjustments unnecessary.
The following table summarizes Cash flow hedges of discount notes (in thousands):
Table 6.9:
| Table6.9: | Cash Flow Hedges of Discount Notes |
| Consolidated Obligation Discount Notes | ||||||||
| Principal Amount | December 31, 2019 | December 31, 2018 | ||||||
| Discount notes hedged under qualifying hedge(a) | $ | 2,664,000 | $ | 2,664,000 | ||||
|
| Consolidated Obligation Discount Notes |
| ||||
Principal Amount |
| December 31, 2018 |
| December 31, 2017 |
| ||
Discount notes hedged under qualifying hedge (a) |
| $ | 2,664,000 |
| $ | 2,349,000 |
|
| (a) |
Table 6.10 below presents FHLBank’s long-term credit rating, short-term credit rating and outlook at February 29, 2020.
Table 6.10 below presents FHLBank’s long-term credit rating, short-term credit rating and outlook at February 28, 2019.
Accrued interest payable Accrued interest payable— Amounts outstanding were $156.9 million at December 31, 2019 and $223.6 million at December 31, 2018. Accrued interest payable was comprised primarily of interest due and unpaid on CO bonds, which are generally payable on a semi-annual basis. Fluctuations in unpaid interest balances on bonds are due to the timing of semi-annual coupon accruals and payments at the balance sheet dates. Other Liabilities Other liabilities — Amounts outstanding were $175.5 million at December 31, 2019 and $355.8 million at December 31, 2018. Other liabilities comprised of unfunded pension liabilities, Federal Reserve pass-through reserves held on behalf of members, and miscellaneous payables. 66 The following table summarizes the components of Stockholders’ capital (in thousands): December 31, 2018 December 31, 2017 Capital Stock (a) $ 6,065,799 $ 6,750,005 Unrestricted retained earnings (b) 1,102,801 1,067,097 Restricted retained earnings (c) 591,281 479,185 Accumulated Other Comprehensive Income (Loss) (13,259 ) (55,249 ) Total Capital $ 7,746,622 $ 8,241,038 The following table summarizes the components of AOCI (in thousands): December 31, 2018 December 31, 2017 Accumulated other comprehensive income (loss) Non-credit portion of OTTI on held-to-maturity securities, net of accretion (a) $ (11,061 ) $ (14,803 ) Net unrealized gains (losses) on available-for-sale securities (b) 4,034 10,178 Net unrealized gains (losses) on hedging activities (c) 16,759 (19,877 ) Employee supplemental retirement plans (d) (22,991 ) (30,747 ) Total Accumulated other comprehensive income (loss) $ (13,259 ) $ (55,249 ) The following table presents amounts recognized in and reclassified out of AOCI due to cash flow and fair value hedges (in thousands): Gains/ (losses) are recorded in AOCI. Dividends — By Finance Agency regulation, dividends may be paid out of current earnings or if certain conditions are met, may be paid out of previously retained earnings. We may be restricted from paying dividends if we do not comply with any of the Finance Agency’s minimum capital requirements or if payment would cause us to fail to meet any of the minimum capital requirements, including our Retained earnings target as established by the Board of Directors of the FHLBNY. In addition, we may not pay dividends if any principal or interest due on any Consolidated obligations has not been paid in full, or if we fail to satisfy certain liquidity requirements under applicable Finance Agency regulations. None of these restrictions applied for any period presented. The following table summarizes dividends paid and payout ratios: Twelve months ended December 31, 2018 December 31, 2017 Cash dividends paid per share $ 6.66 $ 5.54 Dividends paid (a) (c) $ 417,602 $ 345,152 Pay-out ratio (b) 74.51 % 71.99 % Derivative Instruments and Hedging Activities Interest rate swaps, swaptions, cap and floor agreements (collectively, derivatives) enable us to manage our exposure to changes in interest rates by adjusting the effective maturity, repricing frequency, or option characteristics of financial instruments. To a limited extent, we also use interest rate swaps to hedge changes in interest rates prior to debt issuance and essentially lock in funding costs. Finance Agency regulations prohibit the speculative use of derivatives. For additional information about the methodologies adopted for the fair value measurement of derivatives, see financial statements, Note 18. Fair Values of Financial Instruments. The following tables summarize the principal derivatives hedging strategies outstanding as of December 31, 2019 and December 31, 2018: Derivatives/Terms Hedging Strategy Accounting Designation December 31, 2018 December 31, 2017 Pay fixed, receive floating interest rate swap non-cancellable To convert fixed rate advance to LIBOR floating rate advance Economic Hedge of Fair Value Risk $ 13 $ 60 Pay fixed, receive floating interest rate swap cancellable by counterparty To convert fixed rate putable advance to LIBOR floating rate putable advance Economic Hedge of Fair Value Risk $ — $ 14 Pay fixed, receive adjustable interest rate swap To convert fixed rate advance (with embedded caps) to LIBOR adjustable rate Fair Value Hedge $ 30 $ 30 Pay fixed, receive floating interest rate swap cancellable by FHLBNY To convert fixed rate callable advance to LIBOR floating rate callable advance Fair Value Hedge $ 17 $ 17 Pay fixed, receive floating interest rate swap cancellable by counterparty To convert fixed rate putable advance to LIBOR floating rate putable advance Fair Value Hedge $ 4,735 $ 567 Pay fixed, receive floating interest rate swap no longer cancellable by counterparty To convert fixed rate advance (no-longer putable) to LIBOR floating rate advance (no-longer putable) Fair Value Hedge $ 635 $ 1,015 Pay fixed, receive floating interest rate swap no longer cancellable by FHLBNY To convert fixed rate advance (no-longer callable) to LIBOR floating rate advance (no-longer callable) Fair Value Hedge $ 5 $ 5 Pay fixed, receive floating interest rate swap non-cancellable To convert fixed rate advance to LIBOR floating rate advance Fair Value Hedge $ 40,482 $ 51,963 Purchased interest rate options To offset interest rate options in variable rate advance Economic Hedge of Fair Value Risk $ 3 $ 3 Derivatives/Terms Hedging Strategy Accounting Designation December 31, 2018 December 31, 2017 Receive fixed, pay floating interest rate swap cancellable by counterparty To convert fixed rate callable consolidated obligation bond to LIBOR floating rate callable bond Economic Hedge of Fair Value Risk $ 15 $ 15 Receive fixed, pay floating interest rate swap cancellable by counterparty To convert fixed rate callable consolidated obligation bond to LIBOR floating rate callable bond Fair Value Hedge $ 3,373 $ 1,453 Receive fixed, pay floating interest rate swap no longer cancellable To convert fixed rate consolidated obligation bond (no-longer callable) to LIBOR floating rate bond (no-longer callable) Fair Value Hedge $ 255 $ 130 Receive fixed, pay floating interest rate swap non-cancellable To convert fixed rate consolidated obligation bond to LIBOR floating rate bond Fair Value Hedge $ 8,045 $ 14,196 Pay fixed, receive LIBOR interest rate swap To offset the variability of cash flows associated with interest payments on forecasted issuance of fixed rate consolidated obligation bond Cash flow hedge $ 461 $ 30 Pay fixed, receive LIBOR interest rate swap To offset the variability of cash flows associated with interest payments on forecasted issuance of fixed rate consolidated obligation discount note Cash flow hedge $ 2,664 $ 2,349 Basis swap To convert one LIBOR index to another LIBOR index to reduce interest rate sensitivity and repricing gaps Economic Hedge of Cash Flows $ 29,735 $ 35,390 Receive fixed, pay floating interest rate swap cancellable by counterparty Fixed rate callable consolidated obligation bond converted to LIBOR floating rate callable bond; matched to callable bond accounted for under fair value option Fair Value Option $ 1,065 $ 1,115 Receive fixed, pay floating interest rate swap no longer cancelable Fixed rate callable consolidated obligation bond converted to LIBOR floating rate bond; matched to bond no-longer callable accounted for under fair value option. Fair Value Option $ — $ 15 Receive fixed, pay floating interest rate swap non-cancellable Fixed rate consolidated obligation bond converted to LIBOR floating rate bond; matched to bond accounted for under fair value option Fair Value Option $ 4,075 $ — Receive fixed, pay floating interest rate swap non-cancellable Fixed rate consolidated obligation discount note converted to LIBOR floating rate discount note; matched to discount note accounted for under fair value option Fair Value Option $ 3,171 $ 2,310 Derivatives/Terms Hedging Strategy Accounting Designation December 31, 2018 December 31, 2017 Pay fixed, receive OIS index interest rate swaps To convert fixed rate trading securities to the OIS indexed floating-rate. Economic Hedge $ 5,839 $ 1,408 Derivatives/Terms Hedging Strategy Accounting Designation December 31, 2018 December 31, 2017 Purchased interest rate cap Economic hedge on the Balance Sheet Economic Hedge $ 800 $ 2,692 Intermediary positions- interest rate swaps To offset interest rate swaps executed with members by executing offsetting derivatives with counterparties Economic Hedge of Fair Value Risk $ 666 $ 386 Derivative Credit Risk Exposure and Concentration In addition to market risk, we are subject to credit risk in derivative transactions because of the potential for non-performance by the counterparties, which could result in the FHLBNY having to acquire a replacement derivative from a different counterparty at a cost that may exceed its recorded fair values. We are also subject to operational risks in the execution and servicing of derivative transactions. The degree of counterparty credit risk may depend on, among other factors, the extent to which netting procedures and/or the provision of collateral are used to mitigate the risk. Summarized below are our risk measurement and mitigation processes: Risk measurement — We estimate exposure to credit loss on derivative instruments by calculating the replacement cost, on a present value basis, to settle at current market prices all outstanding derivative contracts in a gain position, net of collateral pledged by the counterparty. All derivative contracts with non-members are also subject to master netting agreements or other right of offset arrangements. Exposure — In determining credit risk, we consider accrued interest receivable and payable, and the legal right to offset assets and liabilities by counterparty. We attempt to mitigate exposure by requiring derivative counterparties to pledge cash collateral if the amount of exposure is above the collateral threshold agreements. When we post excess cash collateral, we consider the excess collateral as our derivative exposure. Our credit exposures (derivatives in a net gain position) were to highly-rated counterparties and Derivative Clearing Organizations (DCO) that met our credit quality standards. Our exposures also included open derivative contracts executed on behalf of member institutions, and the exposures were collateralized under standard advance collateral agreements with our members. For such transactions, acting as an intermediary, we offset the transaction by purchasing equivalent notional amounts of derivatives from unrelated derivative counterparties. For more information, see financial statements, Credit Risk due to non-performance by counterparties, in Note 17. Derivatives and Hedging Activities. Risk mitigation — We attempt to mitigate derivative counterparty credit risk by contracting only with experienced counterparties with investment-quality credit ratings that meet our credit quality standards. Annually, our management and Board of Directors review and approve all non-member derivative counterparties. We monitor counterparties on an ongoing basis for significant business events, including ratings actions taken by a Nationally Recognized Statistical Rating Organization (NRSRO). All approved derivatives counterparties must enter into a master ISDA agreement with us before we execute a trade through that counterparty. In addition, for all bilateral OTC derivatives, we have executed the Credit Support Annex to the ISDA agreement that provides for collateral support at predetermined thresholds. For Cleared-OTC derivatives, margin requirements are mandated under the Dodd-Frank Act. We believe that such arrangements — margin requirements, the selection of experienced, highly-rated counterparties and ongoing monitoring — have sufficiently mitigated our exposures, and we do not anticipate any credit losses on derivative contracts. Derivatives Counterparty Credit Ratings For information, and an analysis of our exposure due to non-performance of swap counterparties, see Table “Offsetting of Derivative Assets and Derivative Liabilities — Net Presentation” in Note 17. Derivatives and Hedging Activities to financial statements. For information about the methodologies adopted for the fair value measurement of derivatives, see financial statements, Note 18. Fair Values of Financial Instruments. The following tables summarize notional amounts and fair values for the FHLBNY’s derivative exposures as represented by derivatives in fair value gain positions (in thousands): December 31, 2018 Credit Rating Notional Net Derivatives Cash Collateral Balance Non-Cash Net Credit Non-member counterparties Asset positions with credit exposure Uncleared derivatives Single A asset (c) $ 3,125,000 $ 155,264 $ (44,970 ) $ 110,294 $ (102,262 ) $ 8,032 Cleared derivatives assets (d) 20,448,476 1,353 — 1,353 — 1,353 23,573,476 156,617 (44,970 ) 111,647 (102,262 ) 9,385 Liability positions with credit exposure Uncleared derivatives Single A liability (c) 3,414,264 (7,469 ) 9,164 1,695 — 1,695 Cleared derivatives liability (d) 70,236,929 — — — 239,813 239,813 73,651,193 (7,469 ) 9,164 1,695 239,813 241,508 Total derivative positions with non-member counterparties to which the Bank had credit exposure 97,224,669 149,148 (35,806 ) 113,342 137,551 250,893 Member institutions Derivative positions with member counterparties to which the Bank had credit exposure 28,000 363 — 363 (363 ) — Delivery Commitments Derivative position with delivery commitments 12,682 57 — 57 (57 ) — Total derivative position with members 40,682 420 — 420 (420 ) — Total $ 97,265,351 $ 149,568 $ (35,806 ) $ 113,762 $ 137,131 $ 250,893 Derivative positions without credit exposure 8,831,152 Total notional $ 106,096,503 December 31, 2017 Credit Rating Notional Net Derivatives Cash Collateral Balance Non-Cash Net Credit Exposure to Non-member counterparties Asset positions with credit exposure Uncleared derivatives Single A asset (c) $ 2,430,433 $ 157,922 $ (45,180 ) $ 112,742 $ (103,036 ) $ 9,706 Liability positions with credit exposure Cleared derivatives liability (d) 103,391,947 — — — 239,064 239,064 Total derivative positions with non-member counterparties to which the Bank had credit exposure 105,822,380 157,922 (45,180 ) 112,742 136,028 248,770 Total $ 105,822,380 $ 157,922 $ (45,180 ) $ 112,742 $ 136,028 $ 248,770 Derivative positions without credit exposure 9,354,161 Total notional $ 115,176,541 72 Our primary source of liquidity is the issuance of Consolidated Obligation bonds and discount notes. To refinance maturing Consolidated obligations, we rely on the willingness of our investors to purchase new issuances. We have access to the discount note market, and the efficiency of issuing discount notes is an important source of liquidity, since discount notes can be issued any time and in a variety of amounts and maturities. Member deposits and capital stock purchased by members are another source of funds. Short-term unsecured borrowings from other FHLBanks and in the federal funds market provide additional sources of liquidity. In addition, the Secretary of the Treasury is authorized to purchase up to $4.0 billion of Consolidated obligations from the FHLBanks. Our liquidity position remains in compliance with all regulatory requirements and management does not foresee any changes to that position. Finance Agency Regulations — Liquidity Regulatory requirements are specified in Parts 1239, 1270 and 1277 of the Finance Agency regulations and Advisory Bulletin 2018-07. Each FHLBank shall at all times have at least an amount of liquidity equal to the current deposits received from its members that may be invested in: (1) Obligations of the United States; (2) Deposits in banks or trust companies; and (3) Advances with a remaining maturity not to exceed five years that are made to members in conformity with part 1266. We are required to hold positive cash flow assuming no access to capital markets and assuming renewal of all maturing advances for a period of between ten to thirty calendar days and to maintain liquidity limits to reduce the risks associated with a mismatch in asset and liability maturities, including an undue reliance on short-term debt funding. In addition, each FHLBank shall provide for Contingency Liquidity, which is defined as the sources of cash a FHLBank may use to meet its operational requirements when its access to the capital markets is impeded. We met our Contingency Liquidity requirements during all periods in this report. Liquidity in excess of requirements is summarized in the table titled Contingency Liquidity. Violations of the liquidity requirements would result in non-compliance penalties under discretionary powers given to the Finance Agency under applicable regulations, which include other corrective actions. Advisory Bulletin 2018-07 concerning liquidity was by policy implemented in phases and was fully implemented on December 31, 2019. Liquidity Management We actively manage our liquidity position to maintain stable, reliable, and cost-effective sources of funds while taking into account market conditions, member demand and the maturity profile of our assets and liabilities. We recognize that managing liquidity is critical to achieving our statutory mission of providing low-cost funding to our members. In managing liquidity risk, we are required to maintain certain liquidity measures in accordance with the FHLBank Act, an Advisory Bulletin and policies developed by management and approved by our Board of Directors. The applicable liquidity requirements are described in the next four sections. 73 Deposit Liquidity. We are required to invest an aggregate amount at least equal to the amount of current deposits received from members in: (1) Obligations of the United States; (2) Deposits in banks or trust companies; or (3) Advances with a remaining maturity not to exceed five years that are made to members in conformity with 12 CFR part 1266. In addition to accepting deposits from our members, we may accept deposits from other FHLBanks or from any other governmental instrumentality. We met these requirements at all times. Quarterly average reserves and actual reserves are summarized below (in millions): Average Deposit Average Actual For the Quarters Ended Reserve Required Deposit Liquidity Excess December 31, 2018 $ 904 $ 93,526 $ 92,622 September 30, 2018 1,100 101,586 100,486 June 30, 2018 1,102 103,651 102,549 March 31, 2018 1,115 114,922 113,807 December 31, 2017 1,654 108,241 106,587 Operational Liquidity.We must be able to fund our activities as our balance sheet changes from day-to-day. We maintain the capacity to fund balance sheet growth through regular money market and capital market funding and investment activities. We monitor our operational liquidity needs by regularly comparing our demonstrated funding capacity with potential balance sheet growth. We take such actions as may be necessary to maintain adequate sources of funding for such growth. Operational liquidity is measured daily. We met these requirements at all times. The following table summarizes excess operational liquidity (in millions): Average Balance Sheet Average Actual For the Quarters Ended Liquidity Requirement Operational Liquidity Excess December 31, 2018 $ 10,091 $ 36,478 $ 26,387 September 30, 2018 10,125 38,739 28,614 June 30, 2018 10,059 38,398 28,339 March 31, 2018 7,941 38,370 30,429 December 31, 2017 9,705 33,398 23,693 Contingency Liquidity.We are required by Finance Agency regulations to hold “contingency liquidity” in an amount sufficient to meet our liquidity needs if we are unable to access the Consolidated obligation debt markets for at least five business days. Contingency liquidity includes (1) marketable assets with a maturity of one year or less; (2) self-liquidating assets with a maturity of one year or less; (3) assets that are generally acceptable as collateral in the repurchase market; and (4) irrevocable lines of credit from financial institutions receiving not less than the second-highest credit rating from a NRSRO. We consistently exceeded the regulatory minimum requirements for contingency liquidity. Contingency liquidity is measured daily. We met these requirements at all times. The following table summarizes excess contingency liquidity (in millions): Average Five Day Average Actual For the Quarters Ended Requirement Contingency Liquidity Excess December 31, 2018 $ 3,649 $ 32,494 $ 28,845 September 30, 2018 3,603 34,156 30,553 June 30, 2018 3,320 33,846 30,526 March 31, 2018 4,040 33,494 29,454 December 31, 2017 2,276 29,131 26,855 The Liquidity standards in our risk management policy address our day-to-day operational and contingency liquidity needs. These standards enumerate the specific types of investments to be held to satisfy such liquidity needs and are outlined above. These standards also establish the methodology to be used in determining our operational and contingency needs. We continually monitor and project our cash needs, daily debt issuance capacity, and the amount and value of investments available for use in the market for repurchase agreements. We use this information to determine our liquidity needs and to develop appropriate liquidity plans. The Finance Agency’s Liquidity Advisory Bulletin 2018-07 requires the Bank to maintain between 10 and 30 business days of positive cash flow assuming all advances renew. The Advisory Bulletin also requires us to hold liquidity in a range between 1% and 20% of the notional of our outstanding standby financial letters of credit. In addition, the Advisory Bulletin provides guidance on maintaining appropriate funding gaps for three-month (-10% to -20% of total assets) and one-year (-25% to -35% of total assets) maturity horizons. The FHFA has communicated specific initial liquidity levels to be maintained within these ranges in an accompanying supervisory letter, and may provide updated guidance in future supervisory letters. We remain in compliance with the Advisory Bulletin and all Liquidity regulations. Other Liquidity Contingencies. Finance Agency regulations also state that the FHLBanks must maintain, free from any lien or pledge, the following types of assets in an amount at least equal to the amount of Consolidated Obligations outstanding: Cash; Obligations of, or fully guaranteed by, the United States; Secured advances; Mortgages that have any guaranty, insurance, or commitment from the United States or any agency of the United States; and investments described in section 16(a) of the FHLBank Act, including securities that a fiduciary or trust fund may purchase under the laws of the state in which the FHLBank is located. Cash flows Cash and due from banks was $603.2 million at December 31, 2019 and $85.4 million at December 31, 2018. The following discussion highlights the major activities and transactions that affected our cash flows. Cash flows from operating activities— Operating assets and liabilities support our lending activities to members, and can vary significantly in the normal course of business due to the amount and timing of cash flows, which are affected by member-driven borrowing, our investment strategies, and market conditions. Management believes cash flows from operations, available cash balances and our ability to generate cash through the issuance of Consolidated obligation bonds and discount notes are sufficient to fund our operating liquidity needs. Net cash provided by operating activities in the twelve months ended December 31, 2019 was $14.6 million and $681.8 million in the prior year. By way of comparison, Net income was $472.6 million in the twelve months ended December 31, 2019 and $560.5 million in the prior year. Cash flows (used)/provided by investing activities— Investing activities resulted in $16.6 billion in net cash outflows in the twelve months ended December 31, 2019, compared to $14.7 billion in net cash inflows in 2018. In 2019, cash used by investing activities was driven largely by increases in balances of U.S. Treasury securities and Repurchase agreements. Cash flows provided/(used) in financing activities— Our primary source of funding is the issuance of Consolidated obligation debt. Issuance of capital stock is another source. Net cash inflows from our funding sources were $17.1 billion in the twelve months ended December 31, 2019, compared to net outflows of $15.4 billion in the prior year. For more information, see Statements of Cash Flows in the financial statements. Short-term Borrowings and Short-term Debt Our primary source of funds is the issuance of FHLBank debt. Consolidated obligation discount notes are issued with maturities up to one year and provide us with short-term funds. Discount notes are principally used in funding short-term advances, some long-term advances, as well as money market instruments. We also issue short-term Consolidated obligation bonds as part of our asset-liability management strategy. We may also borrow from another FHLBank, generally for a period of one day. Such borrowings have been historically insignificant. The following table summarizes short-term debt and their key characteristics (dollars in thousands): Table9.4: Short-term Debt Consolidated Obligations-Discount Notes Consolidated Obligations-Bonds With December 31, 2018 December 31, 2017 December 31, 2018 December 31, 2017 Outstanding at end of the period (a) $ 50,640,238 $ 49,613,671 $ 53,593,000 $ 56,494,100 Weighted-average rate at end of the period (b) 2.34 % 1.23 % 2.37 % 1.31 % Average outstanding for the period (a) $ 51,656,594 $ 45,895,662 $ 59,411,703 $ 39,454,853 Weighted-average rate for the period 1.79 % 0.85 % 1.86 % 0.96 % Highest outstanding at any month-end (a) $ 59,769,950 $ 57,330,972 $ 70,377,100 $ 56,494,100 Off-Balance Sheet Arrangements, Guarantees, and Other Commitments—In accordance with regulations governing the operations of the FHLBanks, each FHLBank, including the FHLBNY, is jointly and severally liable for the FHLBank System’s Consolidated obligations issued under sections 11(a) and 11(c) of the FHLBank Act. The joint and several liability regulation authorizes the Finance Agency to require any FHLBank to repay all or a portion of the principal or interest on Consolidated obligations for which another FHLBank is the primary obligor. In addition, in the ordinary course of business, the FHLBNY engages in financial transactions that, in accordance with U.S. GAAP, are not recorded on the FHLBNY’s balance sheet or may be recorded on the FHLBNY’s balance sheet in amounts that are different from the full contract or notional amount of the transactions. For example, the Bank routinely enters into commitments to purchase MPF loans from PFIs, and issues standby letters of credit. These commitments may represent future cash requirements of the Bank, although the standby letters of credit usually expire without being drawn upon. For more information about contractual obligations and commitments, see financial statements, Note 19. Commitments and Contingencies. Purchases of MBS. Finance Agency investment regulations limit the purchase of mortgage-backed securities to 300% of capital. We were in compliance with the regulation at all times. Table9.5:FHFA MBS Limits December 31, 2018 December 31, 2017 Actual Limits Actual Limits Mortgage securities investment authority 216 % 300 % 207 % 300 % Table9.6:Core Mission Achievement The Finance Agency has established a ratio by which the Finance Agency will assess each FHLBank’s core mission achievement. Core mission achievement is determined using a ratio of primary mission assets, which include advances and acquired member assets (mortgage loans acquired from members), to Consolidated obligations. The ratio will be determined at each year-end and will be calculated using annual average par values. December 31, 2018 December 31, 2017 Par Values (dollars in thousands) Annual Average Annual Average Advances $ 108,523,572 $ 109,222,746 Mortgage Loans 2,853,891 2,791,156 Total Primary Mission Assets $ 111,377,463 $ 112,013,902 Total Consolidated Obligations $ 144,953,712 $ 138,827,114 Core Mission Achievement Ratio 77 % 81 % Target Ratio 70 % 70 % Operational Risk Management Operational risk is the risk of loss resulting from inadequate or failed internal processes, systems or human factors, or from external events. Operational risk is inherent in our business activities and, as with other risk types, is managed through an overall framework designed to balance strong management oversight with well-defined independent risk management. This framework includes: policies and procedures for managing operational risks; recognized ownership of the risk by the business; a compliance group that evaluates compliance with board and regulatory policies, including the evaluation and reporting of operational risk incidents, and an internal audit function, which regularly reports directly to the Audit Committee of the Bank’s Board of Directors regarding compliance with policies and procedures, including those related to managing operational risks. Information Security and Business Continuity. The Bank has an Information Security Department that is responsible for the policy, procedures, reviews, education and management of the information security program. The Bank also has a department that is responsible for the overall business continuity program, which includes training, testing, coordination and continual updates. Information security and the protection of confidential customer data, and business continuity are priorities for the FHLBNY, and we have implemented processes that will help secure confidential data and continuity of operations. The information security program is reviewed and enhanced periodically to address emerging threats to data integrity and cyber attacks. The business continuity program includes annual testing of our capabilities. Results of business continuity testing and information security are routinely presented to senior management of the FHLBNY and its Board of Directors. The FHLBNY’s Information Technology group maintains and regularly reviews controls to ensure that technology assets are well managed and secure from unauthorized access and in accordance with approved policies and procedures. The following section provides a comparative discussion of the FHLBNY’s results of operations for the three years ended December 31, 2019, 2018 Interest income from advances is the principal source of revenue. Other sources of revenue are interest income from investment debt securities, trading securities, mortgage loans in the MPF portfolio, securities purchased under agreements to resell and federal funds sold. The primary expense is interest paid on Consolidated obligation debt. Other expenses are Compensation and benefits, Operating expenses, our share of operating expenses of the Office of Finance and the FHFA, and affordable housing program assessments on Net income. Other significant factors affecting our Net income include the volume and timing of investments in mortgage-backed securities, prepayments of advances, charges due to debt repurchased, gains and losses from derivatives and hedging activities, and earnings from investing our shareholders’ capital. Summarized below are the principal components of Net income (in thousands): Table10.1:Principal Components of Net Income Years ended December 31, 2018 2017 2016 Total interest income $ 3,586,484 $ 2,242,303 $ 1,360,847 Total interest expense 2,789,459 1,520,779 804,437 Net interest income before provision for credit losses 797,025 721,524 556,410 Provision (Reversal) for credit losses on mortgage loans (371 ) (287 ) 1,966 Net interest income after provision for credit losses 797,396 721,811 554,444 Total other income (loss) (23,871 ) (58,003 ) 6,853 Total other expenses 150,665 130,922 115,393 Income before assessments 622,860 532,886 445,904 Affordable Housing Program Assessments 62,382 53,417 44,752 Net income $ 560,478 $ 479,469 $ 401,152 Net income — For the FHLBNY, Net income is Net interest income, minus credit losses on mortgage loans, plus Other income (loss), less Other expenses and Assessments set aside for the FHLBNY’s Affordable Housing Program. 78 Net interest income — Net interest income (NII) is typically driven by the volume of earning assets, as measured by average balances of earning assets, and the net interest spread earned in the period. Other significant drivers would be prepayment fees earned when advances are early terminated by our borrowing members, and the impact on interest income and expense accruals by the execution of swaps that hedge our assets and liabilities. Other income (loss) — In 2018 vs. 2017 Net Interest Income, Margin and Interest Rate Spreads — 2019, 2018 Net interest income is our principal source of Net income. It represents the difference between income on interest-earning assets and expense on interest-bearing liabilities. The following table summarizes Net interest income (dollars in thousands): Table10.2:Net Interest Income Percentage Percentage Years ended December 31, Change Change 2018 2017 2016 2018 2017 Total interest income (a) $ 3,586,484 $ 2,242,303 $ 1,360,847 59.95 % 64.77 % Total interest expense (a) 2,789,459 1,520,779 804,437 (83.42 ) (89.05 ) Net interest income before provision for credit losses (b)(c) $ 797,025 $ 721,524 $ 556,410 10.46 % 29.67 % The following discusses the primary elements that impacted year-over-year changes: Aside from a rally in CO discount note pricing that benefited costing yields late in the fourth quarter, funding costs in the earlier quarters in 2019 were higher relative to Acquisition of fixed-rate MBS was constrained due to tight pricing and relatively lower yields. Additionally, we have Net interest income benefited from the increase in the portfolio of fixed-rate U.S. Treasury securities, which grew to $9.2 billion (as measured by average outstanding) in 2019, up from $3.6 billion in 2018. Our liquidity investments, including securities portfolio, overnight repurchase agreement and overnight Federal funds sold, remained significant investments on our balance sheet, all designed to maintain a high-quality and a highly liquid financial position. The Net interest income also benefited from increased prepayment activity in 2019. Prepayment fees generated by member initiated prepayments of advances were $23.7 million in 2019, compared to $7.5 million last year. The impact of net interest settlements (interest accruals) on swaps hedging The fair value impact of ASC qualifying hedges, representing the change in fair values of the hedging derivative and the hedged asset or liability together with the amortization effects of de-designated hedged items, was an immaterial net gain of $4.4 million recorded in Net interest income. 2018 vs. 2017 — 2018 Net interest income was $797.0 million, an increase of $75.5 million, or 10.5%, from 2017 Net interest income, driven almost entirely by volume-related changes. Increased utilization of shorter-term LIBOR-indexed floating-rate debt issued at favorable costing yields was the primary factors driving up Net interest income. Detailed analysis and discussions are available starting on page 74 through page 85 of the Form 10-K for the year ended December 31, 2018 filed on March 21, 2019. 81 Impact of Qualifying Hedges on Net Interest Income — 2019, 2018 The following table summarizes the impact of net interest adjustments from hedge qualifying interest-rate swaps (in thousands): Years ended December 31, 2018 2017 2016 Interest Income $ 3,396,087 $ 2,388,414 $ 1,753,320 Net interest adjustment from interest rate swaps 190,397 (146,111 ) (392,473 ) Reported interest income 3,586,484 2,242,303 1,360,847 Interest Expense 2,749,302 1,505,575 860,772 Net interest adjustment from interest rate swaps and basis amortization 40,157 15,204 (56,335 ) Reported interest expense 2,789,459 1,520,779 804,437 Net interest income $ 797,025 $ 721,524 $ 556,410 Net interest adjustment - interest rate swaps $ 150,240 $ (161,315 ) $ (336,138 ) 82 Spread and Yield Analysis— 2019, 2018 Years ended December 31, 2018 2017 2016 Interest Interest Interest Average Income/ Average Income/ Average Income/ (Dollars in thousands) Balance Expense Rate (a) Balance Expense Rate (a) Balance Expense Rate (a) Earning Assets: Advances $ 107,970,634 $ 2,522,040 2.34 % $ 109,187,643 $ 1,563,322 1.43 % $ 96,200,603 $ 919,890 0.96 % Interest bearing deposits and others 21,240 420 1.98 135,970 168 0.12 456,464 1,655 0.36 Federal funds sold and other overnight funds 21,125,197 390,619 1.85 18,705,074 188,920 1.01 13,702,951 53,323 0.39 Investments Trading securities 3,585,110 74,412 2.08 231,458 3,085 1.33 6,255 56 0.90 Mortgage-backed securities Fixed 8,700,768 260,608 3.00 7,961,719 237,729 2.99 7,116,150 215,183 3.02 Floating 8,616,252 209,447 2.43 8,627,485 136,331 1.58 7,465,096 74,596 1.00 State and local housing finance agency obligations 1,184,453 31,329 2.65 1,110,125 18,467 1.66 837,504 9,311 1.11 Mortgage loans held-for-portfolio 2,898,749 97,479 3.36 2,837,762 94,255 3.32 2,631,349 86,800 3.30 Loans to other FHLBanks 6,671 130 1.95 3,315 26 0.79 8,005 33 0.41 Total interest-earning assets $ 154,109,074 $ 3,586,484 2.33 % $ 148,800,551 $ 2,242,303 1.51 % $ 128,424,377 $ 1,360,847 1.06 % Funded By: Consolidated obligation bonds Fixed $ 26,650,358 $ 556,003 2.09 % $ 32,347,406 $ 463,181 1.43 % $ 41,444,068 $ 393,391 0.95 % Floating 66,878,818 1,252,229 1.87 61,004,233 609,189 1.00 31,729,864 188,509 0.59 Consolidated obligation discount notes 51,656,594 960,833 1.86 45,895,662 431,722 0.94 46,508,363 216,545 0.47 Interest-bearing deposits and other borrowings 1,035,303 19,430 1.88 1,768,332 15,402 0.87 1,428,394 4,375 0.31 Mandatorily redeemable capital stock 13,962 964 6.90 21,523 1,285 5.97 24,370 1,617 6.64 Total interest-bearing liabilities 146,235,035 2,789,459 1.91 % 141,037,156 1,520,779 1.08 % 121,135,059 804,437 0.66 % Other non-interest-bearing funds 100,509 — 62,928 — 262,920 — Capital 7,773,530 — 7,700,467 — 7,026,398 — Total Funding $ 154,109,074 $ 2,789,459 $ 148,800,551 $ 1,520,779 $ 128,424,377 $ 804,437 Net Interest Income/Spread $ 797,025 0.42 % $ 721,524 0.43 % $ 556,410 0.40 % Net Interest Margin (Net interest income/Earning Assets) 0.52 % 0.48 % 0.43 % Rate and Volume Analysis — 2019, 2018 and The Rate and Volume Analysis presents changes in interest income, interest expense and net interest income that are due to changes in both interest rates and the volume of interest-earning assets and interest-bearing liabilities, and their impact on interest income and interest expense (in thousands): For the years ended December 31, 2018 vs. December 31, 2017 Increase (Decrease) Volume Rate Total Interest Income Advances $ (17,616 ) $ 976,334 $ 958,718 Interest bearing deposits and others (254 ) 506 252 Federal funds sold and other overnight funds 27,179 174,520 201,699 Investments Trading securities 68,690 2,637 71,327 Mortgage-backed securities Fixed 22,134 745 22,879 Floating (178 ) 73,294 73,116 State and local housing finance agency obligations 1,311 11,551 12,862 Mortgage loans held-for-portfolio 2,041 1,183 3,224 Loans to other FHLBanks 43 61 104 Total interest income 103,350 1,240,831 1,344,181 Interest Expense Consolidated obligation bonds Fixed (90,476 ) 183,298 92,822 Floating 62,792 580,248 643,040 Consolidated obligation discount notes 60,219 468,892 529,111 Deposits and borrowings (8,332 ) 12,360 4,028 Mandatorily redeemable capital stock (500 ) 179 (321 ) Total interest expense 23,703 1,244,977 1,268,680 Changes in Net Interest Income $ 79,647 $ (4,146 ) $ 75,501 For the years ended December 31, 2017 vs. December 31, 2016 Increase (Decrease) Volume Rate Total Interest Income Advances $ 137,370 $ 506,062 $ 643,432 Interest bearing deposits and others (766 ) (721 ) (1,487 ) Federal funds sold and other overnight funds 25,248 110,349 135,597 Investments Trading securities 2,989 40 3,029 Mortgage-backed securities Fixed 25,279 (2,733 ) 22,546 Floating 13,042 48,693 61,735 State and local housing finance agency obligations 3,627 5,529 9,156 Mortgage loans held-for-portfolio 6,852 603 7,455 Loans to other FHLBanks (26 ) 19 (7 ) Total interest income 213,615 667,841 881,456 Interest Expense Consolidated obligation bonds Fixed (99,585 ) 169,375 69,790 Floating 242,055 178,625 420,680 Consolidated obligation discount notes (2,890 ) 218,067 215,177 Deposits and borrowings 1,261 9,766 11,027 Mandatorily redeemable capital stock (179 ) (153 ) (332 ) Total interest expense 140,662 575,680 716,342 Changes in Net Interest Income $ 72,953 $ 92,161 $ 165,114 84 Interest Income— 2019, 2018 and 2017 Interest income from advances is our principal source of interest income. We also earn interest income from investments in mortgage-backed securities and mortgage loans (“MPF”), liquidity portfolios of U.S. Treasury securities, federal funds and repurchase agreements. Changes in both rate and intermediation volume (average interest-yielding assets) explain the change in the current year from the prior year. Reported interest income is net of the impact of cash flows associated with interest rate swaps hedging certain fixed-rate advances that were converted to floating-rate generally indexed primarily to short-term LIBOR, or the overnight benchmark indices, SOFR and Fed funds. The principal categories of Interest Income are summarized below (dollars in thousands): Percentage Percentage Years ended December 31, Change Change 2018 2017 2016 2018 2017 Interest Income Advances (a) $ 2,522,040 $ 1,563,322 $ 919,890 61.33 % 69.95 % Interest-bearing deposits 420 168 1,655 150.00 (89.85 ) Securities purchased under agreements to resell (b) 78,341 25,509 6,940 207.11 267.56 Federal funds sold (b) 312,278 163,411 46,383 91.10 252.31 Trading securities (c) 74,412 3,085 56 2,312.06 5,408.93 Mortgage-backed securities (d) Fixed 260,608 237,729 215,183 9.62 10.48 Floating 209,447 136,331 74,596 53.63 82.76 State and local housing finance agency obligations 31,329 18,467 9,311 69.65 98.34 Mortgage loans held-for-portfolio (e) 97,479 94,255 86,800 3.42 8.59 Loans to other FHLBanks 130 26 33 400.00 (21.21 ) Total interest income $ 3,586,484 $ 2,242,303 $ 1,360,847 59.95 % 64.77 % Interest income was higher by $194.5 million, or 5.4%, in the current year compared to last year. In the first six months of 2019, interest income grew 21.8% compared to the same six month period last year, despite the effects of lower pricing on advances and declining advance balances, the increase in interest income primarily driven by higher market yields earned in the 2019 periods prior to FOMC rate cuts in July and September. In the last six months of 2019, interest income declined by 8.6%, compared to the same last six months last year. FOMC rate cuts in late July and September impacted yields on assets, as did the lagged impact of pricing reduction, specifically on short-term advances that repriced to lower coupons. For information about the effects of changes in rates and business volume, see Table 10.4 Spread and Yield Analysis and Table 10.5 Rate and Volume analysis. Advances — Interest income from advances, our primary source of revenues, was flat year-over-year, although interest income in the first six months was 18.8% higher than in the same six months last year, revenue declines taking effect in the last six months in 2019. Average volume of advance outstanding were lower through both periods in 2019. Short-and intermediate-term adjustable rate advances matured, and certain advances were prepaid and not replaced by new borrowings. The other key drivers that adversely impacted advance revenues in the second half of 2019 were due to a lower market interest rate environment driven by FOMC rate cuts, and the lagged effects of reduced advance pricing that were implemented by the FHLBNY effective January 1, 2019. Declining interest rates also adversely impacted swap interest settlements. Net swap accruals to income were lower, $170.4 million in the current year compared to $190.3 million in the prior year. In a fair value hedge, we make fixed-rate payments to swap counterparties, and in exchange we received benchmark indexed (primarily LIBOR) floating-rate cash flows. As interest rates declined post Fed rate cuts, we received lower amounts of cash flows. Beginning 2019 with the adoption of ASU 2017-12, fair value gains and losses on ASC 815 hedges on fixed-rate advances are recorded in interest income from advances. Prior to 2019, fair value gains and losses on derivatives and hedged advances were recorded in Other income (loss). In 2019, a net fair value hedging gain of $0.9 million was recorded in interest income, representingchanges in the fair values of hedged advances minus fair values of hedging instruments. Long-term fixed-rate advances are typically swapped to floating-rate. Intermediate-term are also swapped to floating-rate when deemed appropriate to meet our funding risk profile. Putable advances are fixed-rate with call options, and tenors that are typically intermediate- and long-term. Putable advances are swapped to floating-rate with mirrored option, a package that is designed to eliminate option risk and interest rate risk. For more information, see Note 17. Derivative and Hedging Activities in the Notes to Financial Statements. Prepayment fees, which are recorded in interest income from advances, were $23.7 million in 2019, compared to $7.5 million in the prior year. Liquidity Assets—Securities purchased under agreements to resell, Federal funds sold, and U.S. Treasury securities — Overnight lending rates were healthier, directly benefiting yields from liquid investments in Federal funds sold and repurchase lending. Revenues have grown year-over-year. Liquid assets are a significant aspect of our daily operations and improved market yields helped us maintain funds available for our borrowing members and at the same time earn a reasonable return. Lending in the repurchase market is operationally streamlined and well collateralized. Yields have improved year-over-year from overnight investments, and at the same time and we have increased our overnight lending. Interest income from fixed-rate U.S. government securities has grown in line with our objective of increasing investments in readily marketable liquid assets to meet our liquidity targets. The valuation impact of the securities are recorded separately in Other income, a line item that is not within interest income. Mortgage-backed securities — Interest income from floating-rate MBS has declined in parallel with our strategy of reducing holdings of LIBOR-indexed assets; instead, we have shifted our targeted acquisitions to fixed-rate MBS, which has grown as has interest income from the fixed-rate portfolio. In 2019, we executed ASC 815 fair value hedges of certain fixed-rate available-for-sale commercial mortgage-backed securities (“CMBS”); the fair value hedging impact was an immaterial loss of $0.1 million. Under the ASU 2017-12 accounting guidance, hedging gains and losses are recorded in interest income. The net swap accrual synthetically converting the fixed instruments to benchmark-indexed cash flows was an immaterial accrual gain of $0.2 million. For more information, see Note 17. Derivative and Hedging Activities in the Notes to Financial Statements. Mortgage loans — Interest income from MPF loans, which are 15-year and 30-year residential mortgage loans, has remained steady as the portfolio has grown only a little, and market yields have remained relatively flat year-over-year. Pricing remains highly competitive for high-quality conventional mortgage loans acquired in participation with our members. 2018 vs. 2017 — 2018 Interest income was $3.6 billion, an increase of $1.3 billion, or 60.0%, compared to 2017 Interest income, and was driven almost entirely by rate-related changes. Detailed analysis and discussions are available starting on page 74 through page 85 of the Form 10-K for the year ended December 31, 2018 filed on March 21, 2019. Impact of hedging on Interest income from advances — 2019, 2018 and 2017 We execute interest rate swaps to modify the effective interest rate terms of many of our fixed-rate advance products and typically all of our putable advances, effectively converting a fixed-rate stream of cash flows from fixed-rate advances to a floating-rate stream of cash flows, indexed primarily to LIBOR, or OIS Fed funds and OIS SOFR. In the periods in this report, hedging relationships, including those in economic hedges, achieved desired cash flow patterns and met our interest rate risk management practice of synthetically converting much of our fixed-rate interest exposures to the adopted benchmark. The table below summarizes interest income earned from advances and the impact of interest rate derivatives (in thousands): Years ended December 31, 2018 2017 2016 Advance Interest Income Advance interest income before adjustment for interest rate swaps $ 2,331,643 $ 1,709,433 $ 1,312,363 Net interest adjustment from interest rate swaps (a) 190,397 (146,111 ) (392,473 ) Total Advance interest income reported $ 2,522,040 $ 1,563,322 $ 919,890 Interest Expense— 2019, 2018 and 2017 Our primary source of funding is through the issuance of Consolidated obligation bonds and discount notes to investors in the global debt markets through the Office of Finance, the FHLBank’s fiscal agent. Consolidated obligation bonds are generally medium- and long-term bonds, while discount notes are short-term instruments. To fund our assets, our management considers our interest rate risk and liquidity requirements in conjunction with consolidated obligation buyers’ preferences and capital market conditions when determining the characteristics of debt to be issued. Typically, we have used fixed-rate callable and non-callable CO bonds to fund mortgage-related assets and advances. CO discount notes are generally issued to fund advances and investments with shorter interest rate reset characteristics. Changes in bond market rates, changes in intermediation volume (average interest-costing liabilities and interest earning assets), the mix of debt issuances between CO bonds and CO discount notes, and the impact of hedging strategies are the primary factors that drive period-over-period changes in interest expense. While, LIBOR is currently our primary benchmark rate for hedging under ASC 815, we intend to transition away from LIBOR over the next few years to the OIS/SOFR benchmark, in line with an industry-wide transition effort. In 2019, we adopted OIS/FF and OIS/SOFR as additional benchmarks that will facilitate the transition. For ASC 815 qualifying hedges, post adoption of ASU 2017-12 in 2019, fair value changes of the hedging derivative and hedged debt are reported together with the interest expense accrued on the CO debt. For hedges not qualifying under ASC 815, when an interest rate swap is designated in an economic hedge, swap interest accrual and swap fair value gains and losses are not recorded as an adjustment to debt interest expense but reported in Other income (below net interest income) as Derivatives gains (losses) in the Statements of income. In an economic hedge, the debt is not marked-to-market. As noted below, adoption of the accounting update resulted in an immaterial change to reported interest expense. The principal categories of Interest expense are summarized below (dollars in thousands): Percentage Percentage Years ended December 31, Change Change 2018 2017 2016 2018 2017 Interest Expense Consolidated obligations bonds (b) Fixed $ 556,003 $ 463,181 $ 393,391 (20.04 )% (17.74 )% Floating 1,252,229 609,189 188,509 (105.56 ) (223.16 ) Consolidated obligations discount notes (b) 960,833 431,722 216,545 (122.56 ) (99.37 ) Deposits 17,816 15,060 3,091 (18.30 ) (387.22 ) Mandatorily redeemable capital stock 964 1,285 1,617 24.98 20.53 Cash collateral held and other borrowings 1,614 342 1,284 (371.93 ) 73.36 Total interest expense (a) $ 2,789,459 $ 1,520,779 $ 804,437 (83.42 )% (89.05 )% 2019 vs. 2018 Interest expense in the current year increased by $324.4 million, or 11.6% from last year. Our funding portfolios were: floating-rate CO bonds, primarily indexed to the 1-month LIBOR (some swapped back to the 3-month LIBOR) and some linked to SOFR; CO discount notes, which were primarily overnight and short-maturity discount notes (discount notes may have maturities up to one year); fixed-rate CO bonds, which were primarily plain-vanilla short- and intermediate-term debt; and callable CO bonds, with call options and tenors that were typically intermediate- and long-term. Our debt hedging strategies under ASC 815 have remained unchanged, although in preparation for the market transition away from LIBOR, we have increased the use of OIS/FF OIS/SOFR as the alternative hedging benchmarks. Generally, the longer-term fixed-rate CO bonds and bonds with call options are hedged under ASC 815 fair value hedge, i.e. cash flows are swapped from fixed-rate to LIBOR-indexed variable-rate cash flows, synthetically converting fixed debt expense to a sub-LIBOR level. Cash flow hedges have also been executed to hedge rolling-issuances of discount notes to long-term fixed-rate predictable interest expense. In addition, we have also executed hedges that are designated as “economic” hedges that do not qualify under ASC 815 but serve to economically benefit balance sheet management strategies. Interest expense in the current year was higher in large part due to the higher market rates in the debt markets in the first half of 2019, before the FOMC action to lower rates in July and September of 2019. After the FOMC actions, costing yields declined with the general decline in CO debt yields. The weighted average costing yields on discount notes was 244 basis points in the first half of 2019. On a full year basis, costing yields in 2019 declined to 221 basis points. Similar fluctuations were observable for floating-rate debt and for short-term fixed-rate CO bonds issued post Fed rate actions. Year-over-year fluctuations in interest expense between the categories of debt — fixed-rate, floating-rate and discount notes — were due to changes in mix as we adjusted funding mix in step with changing bond market pricing and yields.In 2019, our funding mix, measured as the ratio of average CO debt to average interest-earning assets, shifted in the direction of greater utilization of CO discount notes; 40.3% of assets were funded by CO discount notes in 2019 compared to 33.5% in the prior year. CO floating-rate bonds indexed to LIBOR have declined to 29.1% in 2019, compared to 43.3% in the prior year as a result of voluntary restraints instituted on the issuance of LIBOR instruments with maturities past December 31, 2021, the expected LIBOR transition date. The utilization of fixed-rate CO bonds increased to 20.6% in 2019, compared to 17.3% last year. Changes in relative value of the CO funding is generally measured by the contraction and expansion of the sub-LIBOR spread between cost of funding and the 3-month LIBOR. That spread widened favorably in the fourth quarter of the current year after a tightening through the first three quarters. Compared to last year, the spread is narrower for almost all funding categories. For longer-term CO bonds the yields have remained above LIBOR, driving up the cost of funding longer-term debt. Interest expense is also impacted by interest rate swaps that synthetically convert fixed-rate CO debt cash flows to a variable-rate in a fair value hedge. Cash flow hedges are also employed to fix the variability of sequential future issuances of discount notes. The volume of cash flows exchanged in the two hedging strategies together with the variability of the benchmark rate (i.e. LIBOR) drive interest settlements, impacting interest expense and costing yields on hedged debt. In 2019, cash flows paid to swap dealers exceeded cash received, resulting in a net expense accrual of $7.9 million, compared to a net expense of $45.9 million in the prior year when LIBOR was higher. Fair value hedging impact, representing changes in the fair values of hedged debt minus fair values of hedging instruments together with the amortization effects of de-designated debt, resulted in a net fair value gain of $3.6 million recorded in Interest expense in 2019. In the prior year, pre adoption of ASU 2017-12, hedging fair value gains and losses were recorded in Other Income. 2018 vs. 2017 2018Interest expense was $2.8 billion, an increase of $1.3 billion, or 83.4%, compared to 2017 Interest expense. Detailed analysis and discussions are available starting on page 74 through page 85 of the Form 10-K for the year ended December 31, 2018 filed on March 21, 2019. Impact of Hedging on Interest Expense on Debt — 2019, 2018 and 2017 Derivative strategies are primarily used to manage the interest rate risk inherent in fixed-rate debt by converting the fixed-rate funding to floating-rate debt that is indexed to 3-month LIBOR, our preferred funding base. The strategies are designed to protect future interest margins. A significant percentage of non-callable fixed-rate debt is swapped primarily to plain vanilla 3-month LIBOR indexed cash flows and to OIS/FF and OIS/SOFR benchmark indices. We also issue fixed-rate callable debt that is typically issued with the simultaneous execution of cancellable interest rate swaps to modify the effective interest rate terms and the effective durations of our fixed-rate callable debt. We achieve our cash flow objectives by utilizing the fair value hedging strategy under ASC 815, which benefits us in two principal ways. First, the issuance of fixed-rate debt and the simultaneous execution of interest rate swap converts the debt to an adjustable-rate instrument tied to the designated benchmark rate, primarily LIBOR. Second, fixed-rate callable bond issued in conjunction with the execution of interest rate swap containing a call feature (that mirrors the option embedded in the callable bond), enables us to meet our funding needs at yields not otherwise directly attainable through the issuance of callable debt. We may also issue floating rate debt indexed to other than the 3-month LIBOR (SOFR, Federal funds rate and 1-month LIBOR) and may then execute interest rate swaps that would synthetically convert the cash flows to the desired floating-rate funding index, and designate the hedge as an economic hedge. We also create synthetic long-term fixed-rate funding to fund long-term investments, utilizing a Cash Flow hedging strategy under ASC 815 that converts forecasted long-term discount note variable-rate funding to fixed-rate funding by the use of long-term swaps. For such discount notes, the recorded interest expense is equivalent to long-term fixed rate coupons. Cash Flow hedging strategies are also discussed in Financial Statements Note 17. Derivatives and Hedging Activities. The table below summarizes interest expense paid on Consolidated obligation bonds and discount notes and the impact of interest rate swaps (in thousands): Allowance for Credit Losses — 2019, 2018 and 2017 At January 1, 2020, we concluded our assessment of the impact of CECL on all our business lines, including advances, investments and other financial assets, and adopted CECL as of January 1, 2020. Under the CECL standards, no credit loss allowances were necessary for advances and related credit products borrowed by our members. We recorded credit losses under the CECL methodology of $3.0 million on MPF loans, which are mortgage loans that we acquire from our members. We also recorded a credit loss allowance of $0.8 million under the CECL methodology on our investments in certain housing finance agency bonds. All other credit loss allowances under the CECL methodology were de minimis. These additional credit loss allowances were recorded directly to retained earnings at January 1, 2020, conforming with the adoption rules of a new methodology, and did not impact 2019 earnings. Credit loss allowances, provisions and reversals at December 31, 2019, 2018 and 2017 discussed below are based on the FHLBNY’s existing pre-CECL allowance methodology, which generally required that a loss be incurred before it is recognized. Years ended December 31, 2018 2017 2016 Bonds and discount notes-Interest expense Bonds-Interest expense before adjustment for swaps $ 1,779,595 $ 1,088,084 $ 673,143 Discount notes-Interest expense before adjustment for swaps 949,313 400,804 181,637 Amortization of basis adjustments (5,729 ) (4,269 ) (3,076 ) Net interest adjustment for swaps hedging CO bonds (a) 34,366 (11,445 ) (88,167 ) Net interest adjustment for swaps hedging discount notes (a) 11,520 30,918 34,908 Total bonds and discount notes-Interest expense $ 2,769,065 $ 1,504,092 $ 798,445 We recorded a net reversal of $0.1 million in the current year, compared to a net reversal of $0.4 million in 2018 and a net reversal of $0.3 million in 2017. We evaluate impaired conventional mortgage loans on an individual (loan-by-loan) basis, and compare the fair values of collateral (net of liquidation costs) to recorded investment values in order to calculate/measure credit losses on impaired loans. Loans are considered impaired when they are seriously delinquent (typically 90 days or more) or in bankruptcy or foreclosure, and loan loss allowances are computed at that point. When a loan is seriously delinquent, we believe it is probable that we will be unable to collect all contractual interest and principal in accordance with the terms of the loan agreement. We also perform a loss migration analysis to collectively measure impairment of loans that have not already been individually evaluated for impairment. FHA/VA (Insured mortgage loans) guaranteed loans are also evaluated collectively for impairment based on the credit worthiness of the PFI. The low amounts of reserves for credit losses are consistent with our historical experience with foreclosures or losses. Additionally, collateral values of impaired loans have continued to remain steady and have improved in the New York and New Jersey sectors, and the low loan loss reserves were reflective of the stability in home prices in our residential loan markets. For more information, see financial statements Note 10. Mortgage Loans Held-for-Portfolio. Analysis of Non-Interest Income (Loss) The principal components of non-interest income (loss) are summarized below (in thousands): Years ended December 31, 2018 2017 2016 Other income (loss): Service fees and other (a) $ 18,442 $ 15,841 $ 13,824 Instruments held at fair value - Unrealized gains (losses) (b) 209 (4,540 ) (1,854 ) Total OTTI losses (398 ) — (113 ) Net amount of impairment losses reclassified to (from) Accumulated other comprehensive income (loss) 257 — (118 ) Net impairment losses recognized in earnings (141 ) — (231 ) Net realized and unrealized gains (losses) on derivatives and hedging activities (c) (40,778 ) 1,939 (1,721 ) Net gains (losses) on Trading securities 3,216 (1,106 ) 142 Fair value gains (losses) on Equity Investments (4,819 ) — — Net realized gains from sale of available-for-sale securities — — 250 Provision for litigation settlement on derivative contracts (d) — (70,000 ) — Losses from extinguishment of debt — (137 ) (3,557 ) Total other income (loss) $ (23,871 ) $ (58,003 ) $ 6,853 (d) Net gains (losses) on Trading securities — We have invested in short- and medium-term fixed-rate U.S Treasury securities. Gains and losses are typically unrealized. The securities are not held for speculative trading and are held for liquidity in compliance with FHFA regulatory requirements. The portfolio of securities has grown in line with our expanded liquidity objectives. Market value gains improved for our fixed-rate securities in line with declining yield curve. (e) Fair value gains (losses) on Equity Investments — Our investments in the grantor trust are classified as equity investments, and are invested in equity and bond funds. Gains and losses are typically unrealized. Fluctuations represent year-over-year changes in portfolio valuations. The grantor trust is owned by the FHLBNY with the objective of providing liquidity to pay for pension benefits to retirees vested in retirement plans. The following table summarizes unrealized and realized gains (losses) in the trading portfolio Years ended December 31, 2018 2017 2016 Net unrealized gains (losses) on Trading securities held at period-end $ 2,494 $ (1,069 ) $ 142 Net unrealized and realized gains (losses) on Trading securities sold/matured during the period 722 (37 ) — Net gains (losses) on Trading securities $ 3,216 $ (1,106 ) $ 142 December 31, 2018 Consolidated Consolidated MPF Obligation Obligation Balance Intermediary Earnings Impact Advances Investments Loans Bonds Discount Notes Sheet Positions Other Total Amortization/accretion/interest accruals of hedging activities reported in net interest income $ 190,397 $ — $ (275 ) $ (28,637 ) $ (11,520 ) $ — $ — $ — $ 149,965 Net realized and unrealized gains (losses) on derivatives and hedging activities Gains (losses) on fair value hedges 1,255 — — (1,758 ) — — — — (503 ) Gains (losses) on cash flow hedges — — — (278 ) — — — — (278 ) Net fair value gains (losses) and interest income on swaps in economic hedges of FVO instruments — — — 491 438 — — — 929 Net gains (losses) on swaps and caps in other economic hedges 196 (1,696 ) (145 ) (27,148 ) — (255 ) 304 — (28,744 ) Price alignment interest paid on variation margin — — — — — — — (12,182 ) (12,182 ) Net realized and unrealized gains (losses) on derivatives and hedging activities (a) 1,451 (1,696 ) (145 ) (28,693 ) 438 (255 ) 304 (12,182 ) (40,778 ) Total earnings impact $ 191,848 $ (1,696 ) $ (420 ) $ (57,330 ) $ (11,082 ) $ (255 ) $ 304 $ (12,182 ) $ 109,187 December 31, 2017 Consolidated Consolidated MPF Obligation Obligation Balance Intermediary Earnings Impact Advances Investments Loans Bonds Discount Notes Sheet Positions Other Total Amortization/accretion/interest accruals of hedging activities reported in net interest income $ (146,111 ) $ — $ (242 ) $ 15,714 $ (30,918 ) $ — $ — $ — $ (161,557 ) Net realized and unrealized gains (losses) on derivatives and hedging activities Gains (losses) on fair value hedges 984 — — 11 — — — — 995 Gains (losses) on cash flow hedges — — — 388 — — — — 388 Net fair value gains (losses) and interest income on swaps in economic hedges of FVO instruments 10 — — (297 ) (1,109 ) — — — (1,396 ) Net gains (losses) on swaps and caps in other economic hedges 191 389 570 8,284 (63 ) (4,310 ) 141 — 5,202 Price alignment interest paid on variation margin — — — — — — — (3,250 ) (3,250 ) Net realized and unrealized gains (losses) on derivatives and hedging activities (a) 1,185 389 570 8,386 (1,172 ) (4,310 ) 141 (3,250 ) 1,939 Total earnings impact $ (144,926 ) $ 389 $ 328 $ 24,100 $ (32,090 ) $ (4,310 ) $ 141 $ (3,250 ) $ (159,618 ) December 31, 2016 Consolidated Consolidated MPF Obligation Obligation Balance Intermediary Earnings Impact Advances Investments Loans Bonds Discount Notes Sheet Positions Other Total Amortization/accretion/interest accruals of hedging activities reported in net interest income $ (392,473 ) $ — $ (273 ) $ 91,243 $ (34,908 ) $ — $ — $ — $ (336,411 ) Net realized and unrealized gains (losses) on derivatives and hedging activities Gains (losses) on fair value hedges 1,360 — — 882 — — — — 2,242 Gains (losses) on cash flow hedges — — — 58 — — — — 58 Net fair value gains (losses) and interest income on swaps in economic hedges of FVO instruments (3,039 ) — — 2,252 345 — — — (442 ) Net gains (losses) on swaps and caps in other economic hedges 261 34 (530 ) (3,428 ) (492 ) 281 295 — (3,579 ) Net realized and unrealized gains (losses) on derivatives and hedging activities (a) (1,418 ) 34 (530 ) (236 ) (147 ) 281 295 — (1,721 ) Total earnings impact $ (393,891 ) $ 34 $ (803 ) $ 91,007 $ (35,055 ) $ 281 $ 295 $ — $ (338,132 ) Years ended December 31, 2018 2017 2016 Accumulated other comprehensive income (loss) from cash flow hedges Beginning of period $ (19,877 ) $ (47,018 ) $ (91,037 ) Net hedging transactions (a) 36,816 26,000 41,892 Reclassified into earnings (180 ) 1,141 2,127 End of period (b) $ 16,759 $ (19,877 ) $ (47,018 ) Other income (loss)— Derivatives and Hedging Activities — 2019, 2018 and 2017 With the adoption of ASU 2017-12 effective January 1, 2019, we report the fair valuehedging effects in qualifying hedges within interest income and interest expense together with the hedged item. Prior to the adoption of the ASU, fair value impact of qualifying hedges and standalone derivatives were both reported in Other income (loss). Comparative information for the prior year periods has not been reclassified to conform to post-adoption standards as the adoption of ASU 2017-12 permitted prospective adoption. For derivatives that are not designated in a hedging relationship (i.e. in an economic hedge), the derivatives are considered as a “standalone” instrument and fair value changes are recorded in Other income (loss), without the offset of a hedged item. Gains and losses recorded in Other income (loss) on standalone derivatives include net interest accruals. The table presents fair value changes of derivatives in economic hedges (i.e. not in an ASC 815 qualifying hedge) in Other income (loss) in 2019 (post ASU 2017-12), 2018 and 2017. As noted previously, prior period comparatives have not been recast to conform to the post ASU presentation. We also believe the disclosure benefits of reclassification would not outweigh significant operational costs. As a result, for years prior to the adoption of the ASU, the presentation below includes the data for all derivatives and hedging activities, including hedges that qualified under ASC 815. Table10.12: Other Income (Loss) — Impact of Derivative Gains and Losses (in thousands) 2019 vs. 2018 Derivatives not designated as hedging instruments were primarily interest rate swaps that did not qualify for hedge accounting under ASC 815; the hedges economically benefited balance sheet interest rate risk management but were designated as standalone derivatives, which were marked-to-market without the offsetting benefit of marking-to-market the economically hedged securities. Derivatives gains (losses) were primarily driven by swaps hedging U.S. Treasury securities, swaps hedging the basis risk of floating-rate CO bonds, and swaps hedging instruments elected under the FVO. Interest accrual on swaps in economic hedges are also included in derivative gains and losses. Fair values of swaps in economic hedges of fixed-rate U.S. Treasury securities (held for liquidity/trading) have been volatile in a fluctuating interest rate environment, reporting losses of $33.2 million in 2019 compared to a loss of $1.7 million in 2018. Volume of swaps has grown year-over-year in line with the growth of U.S. Treasury Securities. To provide context, the fair values of Treasury securities, which are the underlying hedged instruments, reported fair value gains of $50.0 million in 2019 and $3.4 million in 2018. The hedging swaps are pay-fixed, receive floating-rate swaps, and fair values losses were consistent with the declining benchmark rates. The hedged Treasury securities are fixed-rate instruments and fluctuations in fair values were in line with the volatility of Treasury security prices in a volatile and declining interest rate environment. Basis swaps in economic hedges of floating-rate CO bonds reported fair value gains of $3.4 million in the current year, in contrast to a loss of $8.2 million in 2018. The basis swaps are structured to convert the floating-rate index of variable-rate CO bonds generally from 1-month LIBOR to the 3-month LIBOR and other CO bonds to SOFR. Fluctuations in reported fair values represent the volatility in the basis between the two LIBOR indices as well as fair value changes when swaps mature or approach maturity and previously recorded gains and losses reverse. 2018 vs. 2017 Detailed analysis and discussions are available starting on page 87 and Table 10.12 Earnings Impact of Derivatives and Hedging Activities in the MD&A included in the Form 10-K for the year ended December 31, 2018 filed on March 21, 2019. Operating Expenses, Compensation and Benefits, and Other Expenses— 2019, 2018 and 2017 The following table sets forth the major categories of operating expenses (dollars in thousands): Table10.13: Operating Expenses, and Compensation and Benefits Years ended December 31, 2018 Percentage of 2017 Percentage of 2016 Percentage of Operating Expenses (a) Occupancy $ 8,211 17.15 % $ 5,480 13.46 % $ 4,365 13.06 % Depreciation and leasehold amortization 5,492 11.47 4,432 10.89 3,462 10.36 All others (b) 34,179 71.38 30,799 75.65 25,602 76.58 Total Operating Expenses $ 47,882 100.00 % $ 40,711 100.00 % $ 33,429 100.00 % Total Compensation and Benefits $ 78,950 $ 71,090 $ 65,577 Finance Agency and Office of Finance (c) $ 15,874 $ 14,660 $ 12,859 Other expenses (d) $ 7,959 $ 4,461 $ 3,528 94 Assessments — 2019, 2018 and 2017 For more information about assessments, see Affordable Housing Program and Other Mission Related Programs and Assessments under Part I Item 1 Business in this Form 10-K. The following table provides rollforward information with respect to changes in Affordable Housing Program liabilities (in thousands): Table11.1: Years ended December 31, 2018 2017 2016 Beginning balance $ 131,654 $ 125,062 $ 113,352 Additions from current period’s assessments 62,382 53,417 44,752 Net disbursements for grants and programs (32,318 ) (46,825 ) (33,042 ) Ending balance $ 161,718 $ 131,654 $ 125,062 AHP assessments allocated from net income totaled $52.6 million in 2019, compared to $62.4 million and $53.4 million in 2018 Market Risk Management. Market risk or interest rate risk (IRR) is the risk of change to market value or future earnings due to a change in the interest rate environment. IRR arises from the Banks operation due to maturity mismatches between interest rate sensitive cash-flows of assets and liabilities. As the maturity mismatch increases so does the level of IRR. The Bank has opted to retain a modest level of IRR which allows for the preservation of capital value while generating steady and predictable income. Accordingly, The desired risk profile is primarily affected by the use of interest rate exchange agreements (Swaps) Although the Bank maintains a conservative IRR profile, income variability does arise from structural aspects in our portfolio. These include: embedded prepayment rights, basis risk on asset and liability positions, yield curve risk, and liquidity and funding needs. These varied risks are controlled by monitoring IRR measures including re-pricing gaps, duration of equity (DOE), value at risk (VaR), net interest income (NII) at risk, key rate durations (KRD) and forecasted dividend rates. Risk Our portfolio, including derivatives, is tracked and the overall mismatch between assets and liabilities is summarized by using a DOE measure. Our last five quarterly DOE results are shown in years in the table Base Case DOE -200bps DOE -100bps DOE +200bps DOE December 31, 2018 -0.05 -0.76 -0.79 0.31 September 30, 2018 0.10 -1.58 -0.46 0.43 June 30, 2018 0.00 -1.99 -0.62 0.44 March 31, 2018 -0.15 -1.75 -0.75 0.40 December 31, 2017 -0.37 N/A -0.95 0.36 The DOE has remained within policy limits. Duration indicates any cumulative re-pricing/maturity imbalance in the portfolio’s financial assets and liabilities. A positive DOE indicates that, on average, the liabilities will re-price or mature sooner than the assets, while a negative DOE indicates that, on average, the assets will re-price or mature earlier than the liabilities. We measure DOE using software that incorporates optionality within our portfolio using well-known and tested financial pricing theoretical models. We do not solely rely on the DOE measure as a mismatch measure between assets and liabilities. We analyze open key rate duration exposure across maturity buckets while also performing a more traditional gap measure that subtracts re-pricing/maturing liabilities from re-pricing/maturing assets over time. We observe the differences over various horizons, but have set a 10 percent of assets limit on cumulative re-pricings at the one-year point. This quarterly observation of the one-year cumulative re-pricing gap is provided in the table below and all values are below 10 percent of assets, well within the limit: One Year December 31, 2019 $ 6.418 Billion Our review of potential interest rate risk issues also includes the effect of changes in interest rates on expected net income. We project asset and liability volumes and spreads over a one-year horizon and then simulate expected income and expenses from those volumes and other inputs. The effects of changes in interest rates are measured to test whether the portfolio has too much exposure in its net interest income over the coming 12-month period. To measure the effect, Sensitivity in Sensitivity in Sensitivity in December 31, 2018 N/A -5.86 % 12.26 % September 30, 2018 N/A -6.56 % 13.14 % June 30, 2018 N/A -3.16 % 5.53 % March 31, 2018 N/A -2.69 % 3.98 % December 31, 2017 N/A -3.14 % 7.02 % Aside from net interest income, the other significant impact on changes in the interest rate environment is the potential impact on the value of the portfolio. These calculated and quoted market values are estimated based upon their financial attributes (including optionality) and then re-estimated under the assumption that interest rates suddenly rise or fall by 200bps. The worst effect, whether it is the up or the down shock, is compared to the internal limit of 10 percent. The quarterly potential maximum decline in the market value of equity under these 200bps shocks is provided -200bps Change -100bps Change +200bps Change December 31, 2018 -1.63 % -0.41 % -0.50 % September 30, 2018 -1.12 % -0.20 % -0.58 % June 30, 2018 -1.13 % -0.24 % -0.57 % March 31, 2018 -1.69 % -0.52 % -0.40 % December 31, 2017 N/A -0.81 % -0.20 % As noted, the potential declines under these shocks are within our limits of a maximum 10 percent. The following tables display the portfolio’s maturity/re-pricing gaps as of December 31, Interest Rate Sensitivity December 31, 2018 More Than More Than More Than Six Months Six Months to One Year to Three Years to More Than or Less One Year Three Years Five Years Five Years Interest-earning assets: Non-MBS investments $ 12,881 $ 143 $ 514 $ 424 $ 1,952 MBS investments 7,900 536 2,546 1,343 4,431 Adjustable-rate loans and advances 23,395 — — — — Net unswapped 44,176 679 3,060 1,767 6,383 Liquidity trading portfolio 1,712 1,963 1,980 3 — Swaps hedging investments 3,975 (1,975 ) (2,000 ) — — Net liquidity trading portfolio 5,687 (12 ) (20 ) 3 — Fixed-rate loans and advances 42,055 10,332 18,246 5,416 5,991 Swaps hedging advances 36,400 (9,276 ) (16,931 ) (4,255 ) (5,938 ) Net fixed-rate loans and advances 78,455 1,056 1,315 1,161 53 Loans to other FHLBanks 250 — — — — Total interest-earning assets $ 128,568 $ 1,723 $ 4,355 $ 2,931 $ 6,436 Interest-bearing liabilities: Deposits $ 1,038 $ 5 $ — $ — $ — Discount notes 50,230 410 — — — Swapped discount notes (2,664 ) — 971 85 1,608 Net discount notes 47,566 410 971 85 1,608 Consolidated Obligation Bonds FHLBank bonds 50,615 16,007 9,579 3,296 4,406 Swaps hedging bonds 23,556 (15,324 ) (6,490 ) (992 ) (750 ) Net FHLBank bonds 74,171 683 3,089 2,304 3,656 Total interest-bearing liabilities $ 122,775 $ 1,098 $ 4,060 $ 2,389 $ 5,264 Post hedge gaps (a): Periodic gap $ 5,793 $ 625 $ 295 $ 542 $ 1,172 Cumulative gaps $ 5,793 $ 6,418 $ 6,713 $ 7,255 $ 8,427 Interest Rate Sensitivity December 31, 2017 More Than More Than More Than Six Months Six Months to One Year to Three Years to More Than or Less One Year Three Years Five Years Five Years Interest-earning assets: Non-MBS investments $ 14,238 $ 159 $ 545 $ 442 $ 1,771 MBS investments 9,291 855 2,059 1,979 3,055 Adjustable-rate loans and advances 37,120 — — — — Net unswapped 60,649 1,014 2,604 2,421 4,826 Liquidity trading portfolio 239 1,256 147 — — Swaps hedging investments 1,408 (1,261 ) (147 ) — — Net liquidity trading portfolio 1,647 (5 ) — — — Fixed-rate loans and advances 43,147 11,835 21,227 7,438 1,940 Swaps hedging advances 39,629 (10,719 ) (19,886 ) (7,127 ) (1,897 ) Net fixed-rate loans and advances 82,776 1,116 1,341 311 43 Total interest-earning assets $ 145,072 $ 2,125 $ 3,945 $ 2,732 $ 4,869 Interest-bearing liabilities: Deposits $ 1,166 $ 12 $ — $ — $ — Discount notes 49,424 189 — — — Swapped discount notes (2,349 ) — 525 531 1,293 Net discount notes 47,075 189 525 531 1,293 Consolidated Obligation Bonds FHLBank bonds 65,519 18,199 9,250 2,545 3,509 Swaps hedging bonds 24,199 (16,754 ) (6,057 ) (638 ) (750 ) Net FHLBank bonds 89,718 1,445 3,193 1,907 2,759 Total interest-bearing liabilities $ 137,959 $ 1,646 $ 3,718 $ 2,438 $ 4,052 Post hedge gaps (a): Periodic gap $ 7,113 $ 479 $ 227 $ 294 $ 817 Cumulative gaps $ 7,113 $ 7,592 $ 7,819 $ 8,113 $ 8,930 Six Months More Than More Than More Than More Than Six Months More Than More Than More Than More Than PAGE Financial Statements Management’s Report on Internal Control over Financial Reporting Statements of Condition as of December 31, Statements of Income for the Years Ended December 31, 2019, 2018 Statements of Comprehensive Income for the Years Ended December 31, 2019, 2018 Statements of Capital for the Years Ended December 31, 2019, 2018 Statements of Cash Flows for the Years Ended December 31, 2019, 2018 Supplementary Data Supplementary financial data for each full quarter within the two years ended December 31, 2019 are included in Item 6. Selected Financial Data. 100 Federal Home Loan Bank of New York Management’s Report on Internal Control over Financial Reporting The management of the Federal Home Loan Bank of New York (the “Bank”) is responsible for establishing and maintaining adequate internal control over financial reporting. The Bank’s internal control over financial reporting is designed by, or under the supervision of, the Principal Executive Officer and the Principal Financial Officer to provide reasonable assurance regarding the reliability of financial reporting and the preparation of financial statements for external reporting purposes in accordance with accounting principles generally accepted in the United States of America. Because of its inherent limitations, internal control over financial reporting may not prevent or detect misstatements. Also, projections of any evaluation of effectiveness to future periods are subject to the risk that controls may become inadequate because of changes in conditions or that the degree of compliance with the policies or procedures may deteriorate. The Bank’s management assessed the effectiveness of the Bank’s internal control over financial reporting as of December 31, PricewaterhouseCoopers LLP, the Bank’s independent registered public accounting firm that audited the accompanying Financial Statements has also issued an audit report on the effectiveness of internal control over financial reporting. Their report appears on the following page. Federal Home Loan Bank of New York Statements of Condition — (In Thousands, Except Par Value of Capital Stock) As of December 31, December 31, 2018 December 31, 2017 Assets Cash and due from banks (Note 3) $ 85,406 $ 127,403 Securities purchased under agreements to resell (Note 4) 4,095,000 2,700,000 Federal funds sold (Note 4) 7,640,000 10,326,000 Trading securities (Note 5) 5,810,512 1,641,568 Equity Investments (Note 6) 48,179 — Available-for-sale securities, net of unrealized gains 422,216 577,269 Held-to-maturity securities (Note 8) 17,474,826 17,824,533 Advances (Note 9) (Includes $0 at December 31, 2018 and $2,205,624 at December 31, 2017 at fair value under the fair value option) 105,178,833 122,447,805 Mortgage loans held-for-portfolio, net of allowance for credit losses of $814 at December 31, 2018 and $992 at December 31, 2017 (Note 10) 2,927,230 2,896,976 Loans to other FHLBanks (Note 20) 250,000 — Accrued interest receivable 275,256 226,981 Premises, software, and equipment 51,572 29,697 Derivative assets (Note 17) 113,762 112,742 Other assets 8,602 7,398 Total assets $ 144,381,394 $ 158,918,372 Liabilities and capital Liabilities Deposits (Note 11) Interest-bearing demand $ 1,002,587 $ 1,142,056 Non-interest-bearing demand 20,050 17,999 Term 40,000 36,000 Total deposits 1,062,637 1,196,055 Consolidated obligations, net (Note 12) Bonds (Includes $5,159,792 at December 31, 2018 and $1,131,074 at December 31, 2017 at fair value under the fair value option) 84,153,776 99,288,048 Discount notes (Includes $3,180,086 at December 31, 2018 and $2,312,621 at December 31, 2017 at fair value under the fair value option) 50,640,238 49,613,671 Total consolidated obligations 134,794,014 148,901,719 Mandatorily redeemable capital stock (Note 14) 5,845 19,945 Accrued interest payable 223,570 162,176 Affordable Housing Program (Note 13) 161,718 131,654 Derivative liabilities (Note 17) 31,147 61,607 Other liabilities 355,841 204,178 Total liabilities 136,634,772 150,677,334 Commitments and Contingencies (Notes 14, 17 and 19) Capital (Note 14) Capital stock ($100 par value), putable, issued and outstanding shares: 6,065,799 6,750,005 Retained earnings Unrestricted 1,102,801 1,067,097 Restricted (Note 14) 591,281 479,185 Total retained earnings 1,694,082 1,546,282 Total accumulated other comprehensive income (loss) (13,259 ) (55,249 ) Total capital 7,746,622 8,241,038 Total liabilities and capital $ 144,381,394 $ 158,918,372 The accompanying notes are an integral part of these financial statements. Federal Home Loan Bank of New York Statements of Income — (In Thousands, Except Per Share Data) Years Ended December 31, 2019, 2018 and 2017 The accompanying notes are an integral part of these financial statements. Federal Home Loan Bank of New York Statements of Comprehensive Income — (In Years Ended December 31, 2019, 2018 Years ended December 31, 2018 2017 2016 Interest income Advances, net (Note 9) $ 2,522,040 $ 1,563,322 $ 919,890 Interest-bearing deposits 420 168 1,655 Securities purchased under agreements to resell (Note 4) 78,341 25,509 6,940 Federal funds sold (Note 4) 312,278 163,411 46,383 Trading securities (Note 5) 74,412 3,085 56 Available-for-sale securities (Note 7) 12,161 9,936 8,662 Held-to-maturity securities (Note 8) 489,223 382,591 290,428 Mortgage loans held-for-portfolio (Note 10) 97,479 94,255 86,800 Loans to other FHLBanks (Note 20) 130 26 33 Total interest income 3,586,484 2,242,303 1,360,847 Interest expense Consolidated obligation bonds (Note 12) 1,808,232 1,072,370 581,900 Consolidated obligation discount notes (Note 12) 960,833 431,722 216,545 Deposits (Note 11) 17,816 15,060 3,091 Mandatorily redeemable capital stock (Note 14) 964 1,285 1,617 Cash collateral held and other borrowings 1,614 342 1,284 Total interest expense 2,789,459 1,520,779 804,437 Net interest income before provision for credit losses 797,025 721,524 556,410 Provision (Reversal) for credit losses on mortgage loans (371 ) (287 ) 1,966 Net interest income after provision for credit losses 797,396 721,811 554,444 Other income (loss) Service fees and other 18,442 15,841 13,824 Instruments held at fair value - Unrealized gains (losses) (Note 18) 209 (4,540 ) (1,854 ) Total OTTI losses (398 ) — (113 ) Net amount of impairment losses reclassified to (from) Accumulated other comprehensive income (loss) 257 — (118 ) Net impairment losses recognized in earnings (141 ) — (231 ) Net realized and unrealized gains (losses) on derivatives and hedging activities (Note 17) (40,778 ) 1,939 (1,721 ) Net gains (losses) on Trading securities 3,216 (1,106 ) 142 Fair value gains (losses) on Equity Investments (Note 6) (4,819 ) — — Net realized gains from sale of available-for-sale securities (Note 7) — — 250 Provision for litigation settlement on derivative contracts — (70,000 ) — Losses from extinguishment of debt — (137 ) (3,557 ) Total other income (loss) (23,871 ) (58,003 ) 6,853 Other expenses Operating 47,882 40,711 33,429 Compensation and benefits 78,950 71,090 65,577 Finance Agency and Office of Finance 15,874 14,660 12,859 Other expenses 7,959 4,461 3,528 Total other expenses 150,665 130,922 115,393 Income before assessments 622,860 532,886 445,904 Affordable Housing Program Assessments (Note 13) 62,382 53,417 44,752 Net income $ 560,478 $ 479,469 $ 401,152 Basic earnings per share (Note 15) $ 9.09 $ 7.66 $ 7.02 The accompanying notes are an integral part of these financial statements. Federal Home Loan Bank of New York Statements of Years Ended December 31, 2019, 2018 Years ended December 31, 2018 2017 2016 Net Income $ 560,478 $ 479,469 $ 401,152 Other Comprehensive income (loss) Net change in unrealized gains (losses) on available-for-sale securities (1,220 ) 5,954 (5,059 ) Net change in non-credit portion of other-than-temporary impairment losses on held-to-maturity securities Non-credit portion of other-than-temporary impairment gains (losses) (257 ) — (105 ) Reclassification of non-credit portion included in net income — — 223 Accretion of non-credit portion of OTTI 3,999 15,431 6,461 Total net change in non-credit portion of other-than-temporary impairment losses on held-to-maturity securities 3,742 15,431 6,579 Net change in unrealized gains (losses) relating to hedging activities Unrealized gains (losses) 36,816 26,000 41,892 Reclassification of (gains) losses included in net income (180 ) 1,141 2,127 Total net change in unrealized gains (losses) relating to hedging activities 36,636 27,141 44,019 Net change in pension and postretirement benefits 7,756 (8,125 ) (5,502 ) Total other comprehensive income (loss) 46,914 40,401 40,037 Total comprehensive income (loss) $ 607,392 $ 519,870 $ 441,189 The accompanying notes are an integral part of these financial statements. Federal Home Loan Bank of New York Statements of Years Ended December 31, 2019, 2018 Accumulated Capital Stock (a) Other Class B Retained Earnings Comprehensive Total Shares Par Value Unrestricted Restricted Total Income (Loss) Capital Balance, December 31, 2015 55,850 $ 5,585,030 $ 967,078 $ 303,061 $ 1,270,139 $ (135,687 ) $ 6,719,482 Proceeds from issuance of capital stock 47,779 4,777,938 — — — — 4,777,938 Repurchase/redemption of capital stock (40,023 ) (4,002,300 ) — — — — (4,002,300 ) Shares reclassified to mandatorily redeemable capital stock (529 ) (52,902 ) — — — — (52,902 ) Cash dividends ($4.73 per share) on capital stock — — (259,326 ) — (259,326 ) — (259,326 ) Comprehensive income — — 320,922 80,230 401,152 40,037 441,189 Balance, December 31, 2016 63,077 $ 6,307,766 $ 1,028,674 $ 383,291 $ 1,411,965 $ (95,650 ) $ 7,624,081 Proceeds from issuance of capital stock 64,508 6,450,844 — — — — 6,450,844 Repurchase/redemption of capital stock (60,055 ) (6,005,596 ) — — — — (6,005,596 ) Shares reclassified to mandatorily redeemable capital stock (30 ) (3,009 ) — — — — (3,009 ) Cash dividends ($5.54 per share) on capital stock — — (345,152 ) — (345,152 ) — (345,152 ) Comprehensive income — — 383,575 95,894 479,469 40,401 519,870 Balance, December 31, 2017 67,500 $ 6,750,005 $ 1,067,097 $ 479,185 $ 1,546,282 $ (55,249 ) $ 8,241,038 Adjustments to opening balances (b) — — 4,924 — 4,924 (4,924 ) — Proceeds from issuance of capital stock 79,779 7,977,851 — — — — 7,977,851 Repurchase/redemption of capital stock (86,533 ) (8,653,301 ) — — — — (8,653,301 ) Shares reclassified to mandatorily redeemable capital stock (88 ) (8,756 ) — — — — (8,756 ) Cash dividends ($6.66 per share) on capital stock — — (417,602 ) — (417,602 ) — (417,602 ) Comprehensive income — — 448,382 112,096 560,478 46,914 607,392 Balance, December 31, 2018 60,658 $ 6,065,799 $ 1,102,801 $ 591,281 $ 1,694,082 $ (13,259 ) $ 7,746,622 The accompanying notes are an integral part of these financial statements. Federal Home Loan Bank of New York Statements of Cash Flows — (In Thousands) Years Ended December 31, 2019, 2018 Years ended December 31, 2018 2017 2016 Operating activities Net Income $ 560,478 $ 479,469 $ 401,152 Adjustments to reconcile net income to net cash provided by operating activities: Depreciation and amortization: Net premiums and discounts on consolidated obligations, investments, mortgage loans and other adjustments 87,628 (13,886 ) 29,625 Concessions on consolidated obligations 2,586 4,110 6,112 Premises, software, and equipment 5,492 4,432 3,461 Provision (Reversal) for credit losses on mortgage loans (371 ) (287 ) 1,966 Net realized gains from sale of available-for-sale securities — — (250 ) Credit impairment losses on held-to-maturity securities 141 — 231 Change in net fair value adjustments on derivatives and hedging activities 33,840 144,391 5,523 Net realized and unrealized (gains) losses on trading securities (3,216 ) 1,106 (142 ) Change in fair value on Equity Investments 4,819 — — Change in fair value adjustments on financial instruments held at fair value (209 ) 4,603 4,360 Losses from extinguishment of debt — 137 3,557 Net change in: Accrued interest receivable (49,850 ) (64,139 ) (17,328 ) Derivative assets due to accrued interest (150,869 ) (40,654 ) (30,069 ) Derivative liabilities due to accrued interest 93,482 50,354 5,526 Other assets (1,429 ) (1,809 ) 938 Affordable Housing Program liability 30,064 6,592 11,710 Accrued interest payable 61,394 31,998 21,603 Other liabilities 7,828 29,385 2,049 Total adjustments 121,330 156,333 48,872 Net cash provided by (used in) operating activities 681,808 635,802 450,024 Investing activities Net change in: Interest-bearing deposits (53,440 ) 235,061 114,562 Securities purchased under agreements to resell (1,395,000 ) 4,450,000 (3,150,000 ) Federal funds sold 2,686,000 (3,643,000 ) 562,000 Deposits with other FHLBanks 255 (67 ) (170 ) Premises, software, and equipment (27,366 ) (21,508 ) (6,618 ) Trading securities: Purchased (a) (5,550,105 ) (1,881,028 ) (131,013 ) Repayments 1,216,237 270,930 — Proceeds from sales 349,383 100,164 — Equity Investments (b): Purchased (3,846 ) — — Proceeds from sales 1,825 — — Available-for-sale securities (b): Purchased — (2,075 ) (8,100 ) Repayments 105,551 129,872 179,119 Proceeds from sales — 1,788 118,308 Held-to-maturity securities (c): Long-term securities Purchased (3,520,254 ) (4,478,887 ) (4,057,667 ) Repayments 3,858,408 2,686,796 1,968,561 Advances: Principal collected 1,107,754,440 1,060,666,397 771,152,466 Made (1,090,480,856 ) (1,074,132,845 ) (786,856,049 ) Mortgage loans held-for-portfolio: Principal collected 264,643 268,375 330,666 Purchased (301,694 ) (425,106 ) (564,083 ) Proceeds from sales of REO 2,799 4,135 3,249 Net change in loans to other FHLBanks (250,000 ) 255,000 (255,000 ) Net cash provided by (used in) investing activities 14,656,980 (15,515,998 ) (20,599,769 ) Years ended December 31, 2018 2017 2016 Financing activities Net change in: Deposits and other borrowings $ (123,357 ) $ (13,268 ) $ (64,763 ) Derivative contracts with financing element (8,457 ) (18,464 ) (49,357 ) Consolidated obligation bonds: Proceeds from issuance 111,130,060 93,274,082 59,498,806 Payments for maturing and early retirement (126,220,249 ) (78,726,129 ) (42,363,772 ) Consolidated obligation discount notes: Proceeds from issuance 1,177,557,595 1,191,518,054 441,811,057 Payments for maturing (1,176,600,469 ) (1,191,264,042 ) (439,333,285 ) Capital stock: Proceeds from issuance of capital stock 7,977,851 6,450,844 4,777,938 Payments for repurchase/redemption of capital stock (8,653,301 ) (6,005,596 ) (4,002,300 ) Redemption of mandatorily redeemable capital stock (22,856 ) (14,499 ) (40,966 ) Cash dividends paid (d) (417,602 ) (345,152 ) (259,326 ) Net cash provided by (used in) financing activities (15,380,785 ) 14,855,830 19,974,032 Net increase (decrease) in cash and due from banks (41,997 ) (24,366 ) (175,713 ) Cash and due from banks at beginning of the period (e) 127,403 151,769 327,482 Cash and due from banks at end of the period (e) $ 85,406 $ 127,403 $ 151,769 Supplemental disclosures: Interest paid $ 1,714,564 $ 1,064,684 $ 615,149 Interest paid for Discount Notes (f) $ 878,103 $ 371,993 $ 155,808 Affordable Housing Program payments (g) $ 32,318 $ 46,825 $ 33,042 Transfers of mortgage loans to real estate owned $ 1,090 $ 1,071 $ 1,089 Net amount of impairment losses reclassified to (from) Accumulated other comprehensive income (loss) $ 257 $ — $ (118 ) Capital stock subject to mandatory redemption reclassified from equity $ 8,756 $ 3,009 $ 52,902 Securities traded but not settled $ 149,874 $ — $ — Notes to Supplemental Disclosure: The following non-cash transactions were not included in the Statements of Cash Flows in the twelve months ended December 31, Other Notes The accompanying notes are an integral part of these financial statements. Federal Home Loan Bank of New York Background The Federal Home Loan Bank of New York (FHLBNY or the Bank) is a federally chartered corporation, and is one of 11 district Federal Home Loan Banks (FHLBanks). The FHLBanks are U.S. government-sponsored enterprises (GSEs), organized under the authority of the Federal Home Loan Bank Act of 1932, as amended (FHLBank Act). Each FHLBank is a cooperative owned by member institutions located within a defined geographic district. The FHLBNY’s defined geographic district is New Jersey, New York, Puerto Rico, and the U.S. Virgin Islands. Tax Status.The FHLBanks, including the FHLBNY, are exempt from ordinary federal, state, and local taxation except for real property taxes. Assessments.Affordable Housing Program (AHP) Assessments — Each FHLBank, including the FHLBNY, provides subsidies in the form of direct grants and below-market interest rate advances to members, who use the funds to assist in the purchase, construction or rehabilitation of housing for very low-, low- and moderate-income households. Annually, the 11 FHLBanks must allocate the greater of $100 million or 10% of their regulatory defined net income for the Affordable Housing Program. Note 1.Significant Accounting Policies and Estimates. Basis of Presentation The accompanying financial statements of the Federal Home Loan Bank of New York have been prepared in accordance with Generally Accepted Accounting Principles in the United States (GAAP) and with the instructions provided by the Securities and Exchange Commission (SEC). The FHLBNY has identified certain accounting policies that it believes are significant because they require management to make subjective judgments about matters that are inherently uncertain and because of the likelihood that materially different amounts would be reported under different conditions or by using different assumptions. Financial Instruments with Legal Right of Offset The FHLBNY has derivative instruments, and The net exposure for these financial instruments can change on a daily basis; therefore, there may be a delay between the time this exposure change is identified and additional collateral is requested, and the time when this collateral is received or pledged. Likewise, there may be a delay for excess collateral to be returned. For derivative instruments, any excess cash collateral received or pledged is recognized as a derivative liability or as a derivative asset based on the terms of the individual master agreement between the FHLBNY and its derivative counterparty. Additional information regarding these agreements is provided in Note 17. Derivatives and Hedging Activities. For securities purchased under agreements to resell, the FHLBNY did not have any unsecured amounts based on the fair value of the related collateral held at the end of the periods presented. Additional information about the FHLBNY’s investments in securities purchased under agreements to resell is disclosed in Note 4. Federal Funds Sold and Securities Purchased Under Agreements to Resell. 110 Federal Home Loan Bank of New York Notes to Financial Statements Fair Value Measurements and Disclosures Accounting Standards Codification Topic 820, Fair Value Measurements, discusses how entities should measure fair value based on whether the inputs to those valuation techniques are observable or unobservable. Fair value is defined as the price that would be received to sell an asset or paid to transfer a liability in an orderly transaction in the principal or most advantageous market for the asset or liability between market participants at the measurement date. This definition is based on an exit price rather than transaction or entry price. Valuation Techniques — Three valuation techniques are prescribed under the fair value measurement standards — Market approach, Income approach and Cost approach. Valuation techniques for which sufficient data is available and that are appropriate under the circumstances should be used. In determining fair value, the FHLBNY uses various valuation methods, including both the market and income approaches. The FHLBNY has complied with the accounting standards under Fair Value Measurement that defines fair value, establishes a consistent framework for measuring fair value, and requires disclosure about fair value measurement on assets and liabilities recorded at fair value on the balance sheet. For more information about the fair value hierarchy, and the hierarchy levels of the FHLBNY’s financial instruments, see Note 18. Fair Values of Financial Instruments. On a recurring basis, fair values were measured and recorded in the Statements of Condition for derivatives, available-for-sale securities (AFS or AFS securities), securities designated as trading, equity investments, and financial instruments elected under the Fair Value Option (FVO). On a non-recurring basis, credit impaired (OTTI) held-to-maturity securities were measured and recorded at their fair values in the Statements of Condition. When credit impaired mortgage loans held-for-portfolio were partially charged off, the loans were written down to their collateral values on a non-recurring basis. Fair values of derivative positions— The FHLBNY is an end-user of over-the-counter (OTC) derivatives to hedge assets, liabilities, and certain firm commitments to mitigate fair value risks. Valuations of derivative assets and liabilities reflect the value of the instrument including the value associated with counterparty risk. Derivative values also take into account the FHLBNY’s own credit standing. The computed fair values of the FHLBNY’s OTC derivatives take into consideration the effects of legally enforceable master netting agreements that allow the FHLBNY to settle positive and negative positions and offset cash collateral with the same counterparty on a net basis. The agreements include collateral thresholds that reflect the net credit differential between the FHLBNY and its derivative counterparties. On a contract-by-contract basis, the collateral and netting arrangements sufficiently mitigated the impact of the credit differential between the FHLBNY and its derivative counterparties to an immaterial level such that an adjustment for nonperformance risk was not deemed necessary. Fair values of investments classified as AFS securities— The FHLBNY’s investments classified as AFS are primarily GSE-issued mortgage-backed securities (MBS), which Federal Home Loan Bank of New York Notes to Financial Statements generally employ, but are not limited to, benchmark yields, recent trades, dealer estimates, valuation models, benchmarking of like securities, sector groupings, and/or matrix pricing. Classification of Investment Securities The FHLBNY classifies a debt security at the date of acquisition as trading, held-to-maturity or available-for-sale. Investments designated as held-to-maturity and available-for-sale are primarily GSE-issued mortgage-backed The Bank’s trading portfolio is to enhance the FHLBNY’s liquidity position, and is invested Held-to-Maturity Securities — The FHLBNY classifies debt securities for which it has both the ability and intent to hold to maturity as held-to-maturity investments. Such investments are recorded at amortized cost basis, which includes adjustments made to the cost of an investment for accretion and amortization of discounts and premiums, collection of cash and, if hedged, the fair value hedge accounting adjustments. If a held-to-maturity security is determined to be credit impaired or other-than-temporarily impaired (OTTI), the amortized cost basis of the security is adjusted for credit losses. Amortized cost basis of a held-to-maturity OTTI security is further adjusted for impairment related to all other factors (also referred as the non-credit component of OTTI) and recognized in AOCI; the adjusted amortized cost basis is the carrying value of the OTTI security as reported in the Statements of Condition. Carrying value In accordance with accounting standards for investments in debt As permitted by the new hedge accounting guidance under ASU 2017-12, effective January 1, 2019 the FHLBNY made a one-time election and transferred $1.6 billion (amortized cost basis) of unimpaired fixed-rate GSE-issued commercial mortgage-backed securities from HTM to AFS. Available-for-Sale Securities — The FHLBNY classifies debt securities that it may sell before maturity as AFS and carries them at fair value. Until AFS securities are sold, changes in fair values are recorded in AOCI as Net unrealized gain or (loss) on AFS securities. The FHLBNY computes gains and losses on sales of debt securities using the specific identification method and includes these gains and losses in Other income (loss). Trading Securities — Debt securities classified as trading are held for liquidity purposes and carried at fair value. We record changes in the fair value of these investments through Other income as net realized and unrealized gains or losses on trading securities. The Finance Agency prohibits speculative trading practices but allows permitted securities to be deemed held for liquidity if invested in a trading portfolio. We periodically evaluate our liquidity needs and may dispose these investments as deemed prudent by liquidity and market conditions. Federal Home Loan Bank of New York Notes to Financial Statements Equity Securities— Adoption at January 1, 2018 of ASU No. 2016-01,Recognition and Measurement of Financial Assets and Financial Liabilities,as an amendment toFinancial Instruments — Overall (Subtopic 825-10) provided guidance on the measurement and classification of equity investments. Effective Other-Than-Temporary Impairment (OTTI) The FHLBNY evaluates its investments for impairment quarterly, and determines if unrealized losses are temporary based in part on the creditworthiness of the issuers, and in part on the underlying collateral within the structure of the security and the cash flows expected to be collected on the security. A security is considered impaired if its fair value is less than its amortized cost basis. The FHLBNY has experienced de minimis OTTI in the most recent past on a small portfolio of private-label mortgage-backed securities (PLMBS). To assess whether the amortized cost basis of the FHLBNY’s The FHLBNY evaluates its individual securities issued by Fannie Mae and Freddie Mac, government agencies, or state and local housing agencies by considering the creditworthiness and performance of the debt securities and the strength of the guarantees underlying the securities. Based on the FHLBNY’s analysis, GSE securities are performing in accordance with their contractual agreements. The Housing Act contains provisions allowing the U.S. Treasury to provide support to Fannie Mae and Freddie Mac. The U.S. Treasury and the Finance Agency have placed Fannie Mae and Freddie Mac into conservatorship in an attempt to stabilize their financial conditions and their ability to support the secondary mortgage market. The FHLBNY believes that it will recover its investments in GSE and agency issued securities given the current levels of collateral and credit enhancements and guarantees that exist to protect the investments. Additional testing is performed on housing agency bonds by a review of fair values of bonds that are in unrealized loss position to assess whether fair values are in line with pricing curves with similar credit parameters. If a decision to sell the impaired investment has not been made, but management concludes that it is more likely than not that it will be required to sell such a security before recovery of the amortized cost basis of the security, an OTTI is also considered to have occurred. For securities designated as AFS, subsequent unrealized changes to the fair values (other than OTTI) are recorded in AOCI. For securities designated as HTM or held-to-maturity, the amount of OTTI recorded in AOCI for the non-credit component of OTTI is amortized prospectively over the remaining life of the securities based on the timing and amounts of estimated future cash flows. Amortization out of AOCI is offset by an increase in the carrying value of securities until the securities are repaid or are sold or additional OTTI is recognized in earnings. If subsequent evaluation indicates a significant increase in cash flows greater than previously expected to be collected or if actual cash flows are significantly greater than previously expected, the increases are accounted for as a prospective adjustment to the acceptable yield through interest income. In subsequent periods, if the fair value of the investment security has further declined below its then-current carrying value and there has been a decrease in the estimated cash flows the FHLBNY expects to collect, the FHLBNY will deem the security as OTTI. Accretion to interest income will be discontinued and will resume if improvements in cash flows are subsequently observed. Federal Home Loan Bank of New York Notes to Financial Statements Federal Funds Sold and Securities Purchased Under Agreements to Resell Federal Funds Sold. Federal funds sold are recorded at cost on settlement date and interest is accrued using contractual rates. Securities Purchased under Agreements to Resell. As part of the FHLBNY’s banking activities with counterparties, the FHLBNY may enter into secured financing transactions that mature overnight, and can be extended only at the discretion of the FHLBNY. These transactions involve the lending of cash, against which securities are taken as collateral. The FHLBNY does not have the right to repledge the securities received. Securities purchased under agreements to resell generally do not constitute a transfer of the underlying securities. The FHLBNY treats securities purchased under agreements to resell as collateralized financings because the counterparty retains control of the securities. Interest from such securities is included in Interest income. The FHLBNY did not have any offsetting liabilities related to its securities purchased under agreements to resell for the periods presented. Advances Accounting for Advances. The FHLBNY reports advances at amortized cost, net of The FHLBNY records interest on advances to income as earned, and amortizes the premium and accretes the discounts on a contractual basis to interest income using a level-yield methodology. Typically, advances are issued at par. Impairment Analysis of Advances. An advance will be considered impaired when, based on current information and events, it is probable that the FHLBNY will be unable to collect all amounts due according to the contractual terms of the advance agreement. The FHLBNY has established asset classification and reserve policies. All adversely classified assets of the FHLBNY will have a reserve established for probable losses. Following the requirements of the Federal Home Loan Bank Act of 1932 (FHLBank Act), as amended, the FHLBNY obtains sufficient collateral on advances to protect it from losses. The FHLBank Act limits eligible collateral to certain investment securities, residential mortgage loans, cash or deposits with the FHLBNY, and other eligible real estate related assets. Borrowing members pledge their capital stock of the FHLBNY as additional collateral for advances. The FHLBNY has not incurred any credit losses on advances since its inception. Based upon the financial condition of its borrowers, the collateral held as security on the advances and repayment history, management of the FHLBNY believes that an allowance for credit losses on advances is unnecessary. Advance Modifications. From time to time, the FHLBNY will enter into an agreement with a member to modify the terms of an existing advance. The FHLBNY evaluates whether the modified advance meets the accounting criteria under ASC 310-20 to qualify as a modification of an existing advance or as a new advance in accordance with provisions under creditor’s accounting for a modification or exchange of debt instruments. The evaluation includes analysis of (i) whether the effective yield on the new advance is at least equal to the effective yield for a comparable advance to a similar member that is not refinancing or restructuring, and (ii) whether the modification of the original advance is more than minor. If the FHLBNY determines that the modification is more than minor, the transaction is treated as an advance termination and the subsequent funding of a new advance, with gains or losses recognized in earnings for the period. If the advance is in a hedging relationship, and the modification is more than minor, the FHLBNY will consider the hedge relationship as terminated and previously recorded hedge basis adjustments are amortized over the life of the hedged advance through interest income as a yield adjustment. If the modification of the hedged item and the derivative instrument is considered minor, and if the hedge relationship is de-designated and contemporaneously re-designated, the FHLBNY would not require amortization of previously recorded hedge basis adjustments, although the assumption of no ineffectiveness is removed if the hedge was previously designated as a short-cut hedge. Federal Home Loan Bank of New York Notes to Financial Statements The FHLBNY performs a “test of a modification” under the guidance provided in ASC 310-20-35-11 each time a new advance is borrowed within a short-period of time, typically 5 business days after a prepayment. If a prepayment fee is received on an advance that is determined to be a modification of the original advance, the fee would be deferred, recorded in the basis of the modified advance, and amortized over the life of the modified advance using the level-yield method. This amortization would be recorded as a component of interest income from advances. Prepayment Fees on Advances. Generally, advances are prepaid by members at their fair values. The FHLBNY also charges the member a prepayment fee to make the FHLBNY financially indifferent to the early termination of the advance. For a prepaid advance that had been hedged under a qualifying fair value hedge, the FHLBNY would terminate the hedging relationship. Typically, the FHLBNY would terminate the interest rate swap, and would record the fair value exchanged with the swap counterparty as its settlement value. Prepayment fees received from the prepaying member to make the FHLBNY financially indifferent is recognized in earnings as interest income from advances. For prepaid advances that are not hedged or that are economically hedged, the FHLBNY would also charge the member the fair value of the advance, in addition to a prepayment fee that would make the FHLBNY financially indifferent to the early termination. The FHLBNY offers a rebate, which is typically a portion of the prepayment fee. The rebate is contingent upon the prepaying member borrowing new advances within a 30-day period following prepayment, also satisfying conditions to qualify for the rebate, and complying with the then prevailing terms and conditions for borrowing new advances. At the time a prepayment fee is received from the borrowing member, a portion of the fee, deemed to be potentially rebatable, is not recognized in earnings. The rebatable amount is deferred as a liability as the FHLBNY considers the rebate opportunity for the member a contingency for the FHLBNY. Until no likelihood exists, such that the member has a potential claim to a rebate within the 30-day rebate period, the potential rebatable amount will be considered to be contingently payable. That amount will be deferred, based on the supposition that the rebatable portion of the prepayment fee may not be recognized as a revenue in its entirety because it may be subject to a claim payable to a third party, the borrowing member. Amounts would be recorded once the contingency has been resolved, i.e. when any future potential claims to rebatable funds have expired (30-day rebate period has expired) or has been otherwise settled and resolved (member enters into new qualifying advances within the 30-day period). Only after the member has no further claims on the funds, and the FHLBNY has no obligations to rebate funds, the deferred amounts may only then be released to earnings. The actual rebate would depend on the amount and the maturity duration of the new advance. Mortgage ® program loans, or (MPF®), are mortgage loans held-for-portfolio. The FHLBNY participates in the MPF program by purchasing and originating conventional mortgage loans from its participating members (Participating Financial Institutions or PFIs). Credit Enhancement Obligations and Loss Layers.The FHLBNY and the PFI share the credit risks of the uninsured MPF loans by structuring potential credit losses into layers. Collectability of the loans is first supported by liens on the real estate securing the loan. For conventional mortgage loans, additional loss protection is provided by private mortgage insurance required for MPF loans with a loan-to-value ratio of more than 80% at origination, which is paid for by the borrower. Credit losses are absorbed by the FHLBNY to the extent of the First Loss Account (FLA) for which the maximum exposure is estimated to be $40.2 million at December 31, 2019 and $35.8 million at December 31, Federal Home Loan Bank of New York Notes to Financial Statements determine the amount of credit enhancement necessary to bring a pool of uninsured loans to a “Single A” credit risk. Prior to May 2017, the credit enhancement was calculated to a “Double A” credit risk. The credit enhancement becomes an obligation of the PFI. Delivery commitment fees are charged to a PFI for extending the scheduled delivery period of the loans. Pair-off fees may be assessed and charged to a PFI when the settlement of the delivery commitment (1) fails to occur, or (2) the principal amount of the loans purchased by the FHLBNY under a delivery commitment is not equal to the contract amount beyond established limits. Accounting for Mortgage Loans. The FHLBNY has the intent and ability to hold these mortgage loans for the foreseeable future or until maturity or payoff, and classifies mortgage loans as held-for-portfolio. Loans are reported at their principal amount outstanding, net of premiums and discounts, which is the fair value of the mortgage loan on settlement date. The FHLBNY defers premiums and discounts, and uses the contractual method to amortize premiums and accrete discounts on mortgage loans. The contractual method recognizes the income effects of premiums and discounts in a manner that is reflective of the actual behavior of the mortgage loans during the period in which the behavior occurs while also reflecting the contractual terms of the assets without regard to changes in estimated prepayments based upon assumptions about future borrower behavior. Mortgage loans are written down to their fair values either at foreclosure or to their collateral values when collectability is doubtful, typically when delinquent 180 days or greater and the loan is not well collateralized. The FHLBNY records credit enhancement fees as a reduction to mortgage loan interest income. Other non-origination fees, such as delivery commitment extension fees and pair-off fees, are considered as derivative income and recorded over the life of the commitment; all such fees were insignificant for all periods reported. Non-Accrual Mortgage Loans. The FHLBNY places a mortgage loan on non-accrual status when the collection of the contractual principal or interest is seriously delinquent, which for the FHLBNY is typically 90 days or more past due. When a mortgage loan is placed on non-accrual status, accrued but uncollected interest is reversed against interest income. A loan on non-accrual status may be restored to accrual when (1) principal and interest is no longer delinquent, (2) the FHLBNY expects to collect the remaining interest and principal, and (3) the collection is not under legal proceedings. For mortgage loans on non-accrual status, impairment calculations would consider if the collection of the remaining principal and interest due is determined to be doubtful, and any cash received would be applied first to principal until the remaining principal amount due is collected, and then as a recovery of any charge-offs. Any remaining cash flows would be recorded as interest income. If the FHLBNY determines that the loan servicer on a non-accrual loan has paid the accrued interest receivable as an advance, which is likely to be subject to recovery by the borrower, the FHLBNY would consider the cash received as a liability until the impaired loan returns to a performing status. The cumulative amounts of cash received and recorded as a liability was $1.6 million at December 31, 2019 and $2.3 million at December 31, Allowance for Credit Losses on Mortgage Loans. The FHLBNY reviews its portfolio to identify the losses inherent within the portfolio and to determine the likelihood of collection of the principal and interest. A valuation allowance for credit loss is separately established for each identified loan (individually evaluated) in order to provide for probable losses inherent in loans that are either classified under regulatory criteria (Special Mention, Sub-standard, Doubtful, or Loss) or seriously delinquent. The FHLBNY deems that foreclosure is probable when its mortgage loans become seriously delinquent. For the purposes of impairment, the FHLBNY deems loans that are in bankruptcy as impaired, regardless of their delinquency status. Loans discharged from bankruptcy are considered as Troubled Debt Restructurings (TDRs), and an impairment analysis is performed if the loan is seriously delinquent. Mortgage loans that are not seriously delinquent or are performing are assessed for impairment on a collective basis under the accounting standards for evaluating “large groups of smaller-balance homogenous loans”. In determining our collective reserve, we base our impairment analysis by performing a “loss emergence analysis” that applies historical default rates and historical probability of default. Federal Home Loan Bank of New York Notes to Financial Statements Credit losses calculated on a collective basis Impairment Methodology and Portfolio Segmentation and Disaggregation — Except for VA and FHA insured mortgage loans, all MPF loans are measured for impairment and analyzed for credit losses. Measurement of credit losses is based on current information and events and when it is probable that the FHLBNY will be unable to collect all amounts due according to the contractual terms of the loan agreement. Credit losses are measured for impairment based on the fair value of the underlying property less estimated selling costs. It is assumed that repayment is expected to be provided solely by the sale of the underlying property, that is, there is no other available and reliable source of repayment. To the extent that the net fair value of the property (collateral) is less than the recorded investment in the loan, a loan loss allowance is recorded. FHA and VA are insured loans, and are excluded from the loan-by-loan analysis. FHA and VA insured mortgage loans have minimal inherent credit risk; risk generally arises mainly from the servicers defaulting on their obligations. FHA and VA insured mortgage loans, if adversely classified, would have reserves established only in the event of a default of a PFI, and reserves would be based on aging, collateral value and estimated costs to recover any uninsured portion of the MPF loan. Aside from separating conventional mortgage loans from FHA and VA insured loans, the FHLBNY has determined that no further disaggregation or portfolio segmentation is needed as the credit risk is measured at the individual loan level. Charge-Off Policy — The FHLBNY complies with the guidance provided by the FHFA to perform a charge-off analysis when a loan is on non-accrual status for 180 days or more and the loan is not well collateralized. The charge-off is calculated as the amount of the shortfall of the fair value of the underlying collateral, less estimated selling costs, compared to the recorded investment in the loan. Real Estate Owned (REO) — REO includes assets that have been received in satisfaction of mortgage loans through foreclosure. REO is recorded at the lower of cost or fair value less estimated selling costs of the REO. At the date of transfer, from mortgage loan to REO, the FHLBNY recognizes a charge-off to allowance for credit losses if the fair value of the REO is less than the recorded investment in the loan. Any subsequent realized gains, realized or unrealized losses and carrying costs are included in Other income (non-interest) in the Statements of Income. REO is recorded in Other assets in the Statements of Condition. Mandatorily Redeemable Capital Stock Generally, the FHLBNY’s capital stock is redeemable at the option of both the member and the FHLBNY, subject to certain conditions. The FHLBNY’s capital stock is accounted for under the guidance for financial instruments with characteristics of both liabilities and equity. Dividends paid on capital stock classified as mandatorily redeemable stock are accrued at an estimated dividend rate and reported as interest expense in the Statements of Income. Mandatorily redeemable capital stock at December 31, Accounting Considerations under the Capital Plan — There are three triggering events that could cause the FHLBNY to repurchase capital stock. The member’s request to redeem excess Membership Stock will be considered to be revocable until the stock is repurchased. Since the member’s request to redeem excess Membership Stock can be withdrawn by the member without penalty, the FHLBNY considers the member’s intent regarding such request to not be substantive in nature; therefore, no reclassification to a liability will be made at the time the request is delivered. Federal Home Loan Bank of New York Notes to Financial Statements Under the Capital Plan, when a member delivers a notification of its intent to withdraw from membership, the reclassification from equity to a liability will become effective upon receipt of the notification. The FHLBNY considers the member’s intent regarding such notification to be substantive in nature; therefore, reclassification to a liability will be made at the time the notification of the intent to withdraw is delivered. When a member is acquired by a non-member, the FHLBNY reclassifies stock of former members to a liability on the day the member’s charter is dissolved. Unpaid dividends related to capital stock reclassified as a liability are accrued at an estimated dividend rate and reported as interest expense in the Statements of Income. The repurchase of these mandatorily redeemable financial instruments is reflected as a cash outflow in the financing activities section of the Statements of Cash Flows. The FHLBNY’s capital stock can only be acquired and redeemed at par value; and are not traded and no market mechanism exists for the exchange of stock outside the cooperative structure. Affordable Housing Program The FHLBank Act requires each FHLBank to establish and fund an AHP (see Note 13. Affordable Housing Program). The FHLBNY charges the required funding for AHP to earnings and establishes a liability. The AHP funds provide subsidies to members to assist in the purchase, construction, or rehabilitation of housing for very low-, low-, and moderate-income households. The AHP assessment is based on a fixed percentage of income before adjustment for dividends associated with mandatorily redeemable capital stock. Dividend payments are reported as interest expense in accordance with the accounting guidance for certain financial instruments with characteristics of both liabilities and equity. If the FHLBNY incurs a loss for the entire year, no AHP assessment or assessment credit is due or accrued, as explained more fully in Note 13. Affordable Housing Program. From time to time, the FHLBNY may also issue AHP advances at interest rates below the customary interest rates for non-subsidized advances. When the FHLBNY makes an AHP advance, the present value of the variation in the cash flow caused by the difference between the AHP advance interest rate and the FHLBNY’s related cost of funds for comparable maturity funding is charged against the AHP liability. The amounts are then recorded as a discount on the AHP advance. As an alternative, the FHLBNY has the authority to make the AHP subsidy available to members as a grant. Commitment Fees The FHLBNY records the present value of fees receivable from standby letters of credit as an asset and an offsetting liability for the obligation. Fees, which are generally received for one year in advance, are recorded as unrecognized standby commitment fees (deferred credit) and amortized monthly over the commitment period. The FHLBNY amortizes fees received to income using the straight line method. Derivatives and Hedging Activities All derivatives are recognized on the balance sheet at their estimated fair values, including accrued unpaid interest as either a derivative asset or a derivative liability net of cash collateral received from and posted to derivative counterparties. The FHLBNY has no foreign currency assets, liabilities or hedges. Premises, Software and Equipment The Bank computes depreciation using the straight-line method over the estimated useful lives of assets ranging from four to five years. Leasehold improvements are amortized on a straight-line basis over the lesser of the useful life of the asset or the remaining term of the lease. The FHLBNY capitalizes improvements and major renewals but expenses ordinary maintenance and repairs when incurred, and would include gains and losses on disposal of premises and equipment in Other income (loss). Federal Home Loan Bank of New York Notes to Financial Statements Lease Accounting In February 2016, the FASB issued ASU 2016-02,Leases (Topic 842).The FHLBNY adopted the standards effective January 1, 2019. Leases are recognized on the balance sheet as a lease liability with a right-of-use asset as an offset. See Operating lease commitment disclosures in Note 19. Commitments and Contingencies. Consolidated Obligations Accounting for Consolidated obligation debt. The FHLBNY reports Consolidated obligation bonds and discount notes at amortized cost, net of discounts and premiums. If the consolidated obligation debt is hedged in a benchmark hedge, its carrying value will include hedging valuation adjustments, which will typically be the changes in the LIBOR index. The carrying value of Consolidated obligation debt elected under the FVO will be its fair value. The FHLBNY records interest paid on Consolidated obligation bonds in interest expense. The FHLBNY expenses the discounts on Consolidated obligation discount notes, using the level-yield method, over the term of the related notes and amortizes the discounts and premiums on callable and non-callable Consolidated bonds, also using the contractual level-yield method, over the term to maturity of the Consolidated obligation bonds. Concessions on Consolidated Obligations. Concessions are paid to dealers in connection with the issuance of certain Consolidated obligation bonds. The Office of Finance prorates the amount of the concession to the FHLBNY based upon the percentage of the debt issued that is assumed by the FHLBNY. Concessions paid on Consolidated obligation bonds elected under the FVO are expensed as incurred. Concessions paid on Consolidated obligation bonds not designated under the FVO are deferred and amortized, using the contractual level-yield method, over the term to maturity of the Consolidated obligation bond. Unamortized debt issuance costs are recorded in Consolidated obligation bond liabilities in the Statements of Condition. The FHLBNY charges to expense, as incurred, the concessions applicable to the sale of Consolidated obligation discount notes because of their short maturities; amounts are recorded in Consolidated obligations interest expense. Finance Agency and Office of Finance Expenses The FHLBNY is assessed for its proportionate share of the costs of operating the Finance Agency and the Office of Finance. The Finance Agency is authorized to impose assessments on the FHLBanks and two other GSEs, in amounts sufficient to pay the Finance Agency’s annual operating expenses. The Office of Finance is also authorized to impose assessments on the FHLBanks, including the FHLBNY, in amounts sufficient to pay the Office of Finance’s annual operating and capital expenditures. Each FHLBank is assessed a prorated — (1) two-thirds based upon each FHLBank’s share of total Consolidated obligations outstanding and (2) one-third based upon an equal pro-rata allocation. Earnings per Share of Capital Basic earnings per share is computed by dividing income available to stockholders by the weighted average number of shares outstanding for the period. Capital stock classified as mandatorily redeemable capital stock is excluded from this calculation. Basic and diluted earnings per share are the same, as the FHLBNY has no additional potential shares that may be dilutive. Cash Flows In the Statements of Cash Flows, the FHLBNY considers Cash and due from banks to be cash. Federal funds sold, and securities purchased under agreements to resell are reported in the Statements of Cash Flows as investing activities. Federal funds sold, securities purchased under agreements to resell, and deposits with other FHLBanks are deemed short-term under ASC 320 and therefore, net presentation is appropriate. 119 Federal Home Loan Bank of New York Notes to Financial Statements Derivative instruments — Cash flows from a derivative instrument that is accounted for as a fair value or cash flow hedge, including those designated as economic hedges, are reflected as cash flows from operating activities if the derivative instrument did not include “an other-than-insignificant” financing element at inception. When the FHLBNY executes an off-market derivative, which would typically require an up-front cash exchange, the FHLBNY will analyze the transaction and would deem it to contain a financing element if the cash exchange is more than insignificant. Financing elements are recorded as a financing activity in the Statements of Cash Flows. Losses on debt extinguishment— Losses from debt retirement and transfers (debt retirement) are considered financing activities in the Statements of Cash Flows. Losses are added back as an adjustment to Net cash provided by operating activities, with an offsetting increase in payments on maturing Consolidated obligation bonds as a financing activity. Recently Adopted Significant Accounting Policies Recognition and Measurement of Financial Assets and Financial Liabilities. In January 2016, the FASB issued ASU No. 2016-01,Recognition and Measurement of Financial Assets and Financial Liabilities,as an amendment toFinancial Instruments — Overall (Subtopic 825-10).The amendments provide guidance on certain aspects of recognition, measurement, presentation, and disclosure of financial instruments. We adopted the guidance effective January 1, 2018. This ASU required entities to present separately in OCI the portion of the total change in the fair value of a liability resulting from a change in the instrument-specific credit risk when the entity has elected to measure the liability at fair value in accordance with the fair value option for financial instruments. We evaluated this provision by analyzing the FHLBank issued Consolidated obligation debt (CO debt) for which the fair value option was elected and estimated the instrument-specific credit risk of CO debt as de minimis, if any, and accordingly no cumulative catch-up reclassification was necessary upon adoption. The ASU also required certain equity investments to be measured at fair value with changes in fair value recognized in net income, thus eliminating eligibility for the available-for-sale category under pre-ASU legacy standards. Our analysis of this provision in the ASU identified certain mutual fund assets in grantor The Federal Home Loan Bank of New York Notes to Financial Statements Financial Accounting Standards Board (“FASB”) Standards Adopted Federal Home Loan Bank of New York Notes to Financial Statements Note 2. FASB Standards Issued But Not Yet Adopted. Note 3. Cash and Due from Banks. Cash on hand, cash items in the process of collection, and amounts due from correspondent banks and the Federal Reserve Banks are included in Cash and due from banks. The FHLBNY is exempted from maintaining any required clearing balance at the Federal Reserve Bank of New York. Compensating Balances The FHLBNY has arrangements with Citibank (a member/stockholder of the FHLBNY) to maintain compensating collected cash balances in return for certain fee based safekeeping and back office operational services that the counterparty provides to the FHLBNY. There are no restrictions on the withdrawal of Pass-through Deposit Reserves The FHLBNY acts as a pass-through correspondent for member institutions who are required by banking regulations to deposit reserves with the Federal Reserve Banks. Pass-through reserves deposited with Federal Reserve Banks on behalf of the members by the FHLBNY were $45.4 million at December 31, 2019 and $86.1 million at December 31, 122 Federal Home Loan Bank of New York Notes to Financial Statements Federal funds sold — Federal funds sold are unsecured advances to third parties. Securities purchased under agreements to resell — As part of the FHLBNY’s banking activities, the FHLBNY may enter into secured financing transactions that mature overnight, and can be extended only at the discretion of the FHLBNY. These transactions involve the lending of cash, against which marketable securities are taken as collateral. The amount of cash loaned against the collateral is a function of the liquidity and quality of the collateral. The collateral is typically in the form of securities that meet the FHLBNY’s credit quality standards, are highly-rated and readily marketable. The FHLBNY has the ability to call for additional collateral if the value of the securities falls below a pre-defined haircut. The FHLBNY can terminate the transaction and liquidate the collateral if the counterparty fails to post the additional margin. Agreements generally allow the FHLBNY to repledge securities under certain conditions. No adjustments for instrument-specific credit risk were deemed necessary as market values of collateral were in excess of principal amounts loaned. At December 31, 2018. Transactions recorded as Securities purchased under agreements to resell (reverse repos) were accounted as collateralized financing transactions. The carrying value of a trading security equals its fair value. The following table provides major security types at December 31, Fair value December 31, 2018 December 31, 2017 GSE securities $ 502,849 $ 356,899 Corporate notes 3,334 — U.S. Treasury notes 5,304,329 1,045,605 U.S. Treasury bills — 239,064 Total Trading securities $ 5,810,512 $ 1,641,568 Trading Securities Pledged The FHLBNY had pledged marketable securities at fair values of $251.2 million at December 31, 2019 and $239.8 million at December 31, 2018 Federal Home Loan Bank of New York Notes to Financial Statements The December 31, 2018 Due in one year Due after one year Total Fair Value GSE securities $ 502,849 $ — $ 502,849 Corporate notes — 3,334 3,334 U.S. Treasury notes 3,171,130 2,133,199 5,304,329 Total Trading securities $ 3,673,979 $ 2,136,533 $ 5,810,512 Yield on Trading securities 2.05 % 2.14 % December 31, 2017 Due in one year Due after one year Total Fair Value GSE securities $ 210,390 $ 146,509 $ 356,899 U.S. Treasury notes 1,045,605 — 1,045,605 U.S. Treasury bills 239,064 — 239,064 Total Trading securities $ 1,495,059 (b) $ 146,509 (b) $ 1,641,568 Yield on Trading securities 1.34 % 1.28 % The FHLBNY has classified its grantor December 31, 2018 Gross Gross Amortized Unrealized Unrealized Fair Cost Gains (b) Losses (b) Value (c) Cash equivalents $ 1,250 $ — $ — $ 1,250 Equity funds 25,788 2,481 (1,674 ) 26,595 Fixed income funds 21,036 7 (709 ) 20,334 Total Equity Investments (a) $ 48,074 $ 2,488 $ (2,383 ) $ 48,179 Federal Home Loan Bank of New York Notes to Financial Statements In the December 31, 2018 Net gains (losses) recognized during the period $ (4,540 ) Less: Net (gains) losses recognized during the period on equity investments sold during the period (279 ) Unrealized gains (losses) recognized during the reporting period on equity investments still held at the reporting date $ (4,819 ) As permitted by the new hedge accounting guidance under ASU 2017-12, effective January 1, 2019 the FHLBNY made a one-time election and transferred at an amortized cost basis of $1.6 billion (unrealized fair value loss was $13.5 million) of unimpaired fixed-rate GSE-issued commercial mortgage-backed securities from HTM to AFS. The carrying value of an AFS security equals its fair value. At December 31, December 31, 2018 Gross Gross Amortized Unrealized Unrealized Fair Cost Gains (b) Losses (b) Value GSE and U.S. Obligations Mortgage-backed securities CMO-Floating $ 402,540 $ 4,011 $ — $ 406,551 CMBS-Floating 15,642 23 — 15,665 Total Available-for-sale securities $ 418,182 $ 4,034 $ — $ 422,216 December 31, 2017 Gross Gross Amortized Unrealized Unrealized Fair Cost Gains (b) Losses (b) Value Cash equivalents (a) $ 893 $ — $ — $ 893 Equity funds (a) 24,869 5,126 (3 ) 29,992 Fixed income funds (a) 17,957 43 (243 ) 17,757 GSE and U.S. Obligations Mortgage-backed securities CMO-Floating 490,249 5,163 — 495,412 CMBS-Floating 33,123 92 — 33,215 Total Available-for-sale securities $ 567,091 $ 10,424 $ (246 ) $ 577,269 125 Federal Home Loan Bank of Notes to Financial Statements Impairment Analysis of AFS Securities The FHLBNY’s portfolio of MBS classified as AFS is comprised primarily of GSE-issued collateralized mortgage obligations and Based on Redemption Terms Expected maturities may differ from contractual maturities because borrowers may have the right to call or prepay obligations with or without call or prepayment fees. The amortized cost and estimated fair value(a) of investments classified as AFS, by contractual maturity, were as follows (in thousands): December 31, 2018 December 31, 2017 Amortized Cost (c) Fair Value Amortized Cost (c) Fair Value Mortgage-backed securities Due after one year through five years $ 15,642 $ 15,665 $ 33,123 $ 33,215 Due after ten years 402,540 406,551 490,249 495,412 Fixed income/bond funds, equity funds and cash equivalents (b) — — 43,719 48,642 Total Available-for-sale securities $ 418,182 $ 422,216 $ 567,091 $ 577,269 (a)The carrying value of AFS securities equals fair value. 126 Federal Home Loan Bank of New York Notes to Interest Rate Payment Terms The following table summarizes interest rate payment terms of investments in mortgage-backed securities classified as AFS securities (in thousands): December 31, 2018 December 31, 2017 Amortized Cost Fair Value Amortized Cost Fair Value Mortgage-backed securities CMO floating - LIBOR $ 402,540 $ 406,551 $ 490,249 $ 495,412 CMBS floating - LIBOR 15,642 15,665 33,123 33,215 Total Mortgage-backed securities (a) $ 418,182 $ 422,216 $ 523,372 $ 528,627 127 Federal Home Loan Bank of New York Notes to Financial Statements Major Security Types (in thousands) December 31, 2018 OTTI Gross Gross Amortized Recognized Carrying Unrecognized Unrecognized Fair Issued, guaranteed or insured: Cost (d) in AOCI Value Holding Gains (a) Holding Losses (a) Value Pools of Mortgages Fannie Mae $ 74,301 $ — $ 74,301 $ 4,355 $ — $ 78,656 Freddie Mac 13,673 — 13,673 953 — 14,626 Total pools of mortgages 87,974 — 87,974 5,308 — 93,282 Collateralized Mortgage Obligations/Real Estate Mortgage Investment Conduits Fannie Mae 1,752,909 — 1,752,909 5,057 (6,642 ) 1,751,324 Freddie Mac 1,079,824 — 1,079,824 4,971 (3,069 ) 1,081,726 Ginnie Mae 11,610 — 11,610 181 — 11,791 Total CMOs/REMICs 2,844,343 — 2,844,343 10,209 (9,711 ) 2,844,841 Commercial Mortgage-Backed Securities (b) Fannie Mae 2,596,388 — 2,596,388 888 (37,525 ) 2,559,751 Freddie Mac 10,635,137 — 10,635,137 59,025 (65,374 ) 10,628,788 Total commercial mortgage-backed securities 13,231,525 — 13,231,525 59,913 (102,899 ) 13,188,539 Non-GSE MBS (c) CMOs/REMICs 6,158 (380 ) 5,778 327 (42 ) 6,063 Asset-Backed Securities (c) Manufactured housing (insured) 35,528 — 35,528 1,490 — 37,018 Home equity loans (insured) 69,583 (6,214 ) 63,369 24,940 (14 ) 88,295 Home equity loans (uninsured) 42,426 (4,467 ) 37,959 5,886 (472 ) 43,373 Total asset-backed securities 147,537 (10,681 ) 136,856 32,316 (486 ) 168,686 Total MBS 16,317,537 (11,061 ) 16,306,476 108,073 (113,138 ) 16,301,411 Other State and local housing finance agency obligations 1,168,350 — 1,168,350 202 (24,207 ) 1,144,345 Total Held-to-maturity securities $ 17,485,887 $ (11,061 ) $ 17,474,826 $ 108,275 $ (137,345 ) $ 17,445,756 Federal Home Loan Bank of New York Notes to Financial Statements December 31, 2017 OTTI Gross Gross Amortized Recognized Carrying Unrecognized Unrecognized Fair Issued, guaranteed or insured: Cost (d) in AOCI Value Holding Gains (a) Holding Losses (a) Value Pools of Mortgages Fannie Mae $ 97,579 $ — $ 97,579 $ 7,978 $ — $ 105,557 Freddie Mac 20,160 — 20,160 1,512 — 21,672 Total pools of mortgages 117,739 — 117,739 9,490 — 127,229 Collateralized Mortgage Obligations/Real Estate Mortgage Investment Conduits Fannie Mae 1,612,543 — 1,612,543 10,716 (662 ) 1,622,597 Freddie Mac 960,374 — 960,374 7,485 (404 ) 967,455 Ginnie Mae 14,513 — 14,513 175 — 14,688 Total CMOs/REMICs 2,587,430 — 2,587,430 18,376 (1,066 ) 2,604,740 Commercial Mortgage-Backed Securities (b) Fannie Mae 2,955,640 — 2,955,640 8,497 (15,639 ) 2,948,498 Freddie Mac 10,834,852 — 10,834,852 76,196 (16,272 ) 10,894,776 Total commercial mortgage-backed securities 13,790,492 — 13,790,492 84,693 (31,911 ) 13,843,274 Non-GSE MBS (c) CMOs/REMICs 9,159 (172 ) 8,987 85 (385 ) 8,687 Asset-Backed Securities (c) Manufactured housing (insured) 47,660 — 47,660 2,439 (40 ) 50,059 Home equity loans (insured) 86,606 (8,746 ) 77,860 26,479 (21 ) 104,318 Home equity loans (uninsured) 52,740 (5,885 ) 46,855 7,847 (973 ) 53,729 Total asset-backed securities 187,006 (14,631 ) 172,375 36,765 (1,034 ) 208,106 Total MBS 16,691,826 (14,803 ) 16,677,023 149,409 (34,396 ) 16,792,036 Other State and local housing finance agency obligations 1,147,510 — 1,147,510 204 (32,977 ) 1,114,737 Total Held-to-maturity securities $ 17,839,336 $ (14,803 ) $ 17,824,533 $ 149,613 $ (67,373 ) $ 17,906,773 Securities Pledged The FHLBNY had pledged MBS, with an amortized cost basis of $3.7 million at December 31, 2019 and $4.5 million at December 31, 2018, Unrealized Losses The fair values and gross unrealized holding losses are aggregated by major security type and by the length of time the individual securities have been in a continuous unrealized loss position. Unrealized losses represent the difference between fair value and amortized cost. The baseline measure of unrealized loss is amortized cost, which is not adjusted for non-credit OTTI. Total unrealized losses in these tables will not equal unrecognized holding losses in the Major Security Types tables. Unrealized losses are calculated after adjusting for credit OTTI. In the previous tables, unrecognized holding losses are adjusted for credit and non-credit OTTI. Federal Home Loan Bank of New York Notes to Financial Statements The following tables summarize held-to-maturity securities with estimated fair values below their amortized cost basis (in thousands): December 31, 2018 Less than 12 months 12 months or more Total Estimated Unrealized Estimated Unrealized Estimated Unrealized Fair Value Losses Fair Value Losses Fair Value Losses Non-MBS Investment Securities State and local housing finance agency obligations $ 304,671 $ (29 ) $ 231,022 $ (24,178 ) $ 535,693 $ (24,207 ) MBS Investment Securities MBS-GSE Fannie Mae 1,212,164 (1,787 ) 2,134,166 (42,380 ) 3,346,330 (44,167 ) Freddie Mac 3,999,726 (14,431 ) 3,157,646 (54,012 ) 7,157,372 (68,443 ) Total MBS-GSE 5,211,890 (16,218 ) 5,291,812 (96,392 ) 10,503,702 (112,610 ) MBS-Private-Label 4,635 (24 ) 23,138 (600 ) 27,773 (624 ) Total MBS 5,216,525 (16,242 ) 5,314,950 (96,992 ) 10,531,475 (113,234 ) Total $ 5,521,196 $ (16,271 ) $ 5,545,972 $ (121,170 ) $ 11,067,168 $ (137,441 ) December 31, 2017 Less than 12 months 12 months or more Total Estimated Unrealized Estimated Unrealized Estimated Unrealized Fair Value Losses Fair Value Losses Fair Value Losses Non-MBS Investment Securities State and local housing finance agency obligations $ 191,872 $ (73 ) $ 343,791 $ (32,904 ) $ 535,663 $ (32,977 ) MBS Investment Securities MBS-GSE Fannie Mae 1,181,936 (7,047 ) 331,845 (9,254 ) 1,513,781 (16,301 ) Freddie Mac 2,051,154 (8,968 ) 781,211 (7,708 ) 2,832,365 (16,676 ) Total MBS-GSE 3,233,090 (16,015 ) 1,113,056 (16,962 ) 4,346,146 (32,977 ) MBS-Private-Label 10,674 (41 ) 31,527 (1,545 ) 42,201 (1,586 ) Total MBS 3,243,764 (16,056 ) 1,144,583 (18,507 ) 4,388,347 (34,563 ) Total $ 3,435,636 $ (16,129 ) $ 1,488,374 $ (51,411 ) $ 4,924,010 $ (67,540 ) The FHLBNY’s investments in housing finance agency bonds reported gross unrealized losses of $23.2 million and $24.2 million at December 31, Federal Home Loan Bank of New York Notes to Financial Statements Redemption Terms Expected maturities may differ from contractual maturities because borrowers may have the right to call or prepay obligations with or without call or prepayment features. The amortized cost and estimated fair value of held-to-maturity securities, arranged by contractual maturity, were as follows (in thousands): December 31, 2018 December 31, 2017 Amortized Estimated Amortized Estimated Cost (a) Fair Value Cost (a) Fair Value State and local housing finance agency obligations Due in one year or less $ — $ — $ 11,400 $ 11,388 Due after one year through five years 20,300 20,194 5,785 5,855 Due after five years through ten years 27,670 27,228 47,830 45,602 Due after ten years 1,120,380 1,096,923 1,082,495 1,051,892 State and local housing finance agency obligations 1,168,350 1,144,345 1,147,510 1,114,737 Mortgage-backed securities Due in one year or less 369,989 367,636 880,774 880,780 Due after one year through five years 4,587,009 4,590,849 4,617,456 4,670,742 Due after five years through ten years 8,201,200 8,157,858 8,225,685 8,225,011 Due after ten years 3,159,339 3,185,068 2,967,911 3,015,503 Mortgage-backed securities 16,317,537 16,301,411 16,691,826 16,792,036 Total Held-to-maturity securities $ 17,485,887 $ 17,445,756 $ 17,839,336 $ 17,906,773 Interest Rate Payment Terms The following table summarizes interest rate payment terms of securities classified as held-to-maturity (in thousands): December 31, 2018 December 31, 2017 Amortized Carrying Amortized Carrying Cost Value Cost Value Mortgage-backed securities CMO Fixed $ 680,247 $ 679,867 $ 880,842 $ 880,671 Floating 2,169,384 2,169,384 1,714,068 1,714,068 Total CMO 2,849,631 2,849,251 2,594,910 2,594,739 CMBS Fixed 8,348,709 8,348,709 7,310,487 7,310,487 Floating 4,882,816 4,882,816 6,480,005 6,480,005 Total CMBS 13,231,525 13,231,525 13,790,492 13,790,492 Pass Thru (a) Fixed 204,281 193,601 262,569 248,499 Floating 32,100 32,099 43,855 43,293 Total Pass Thru 236,381 225,700 306,424 291,792 Total MBS 16,317,537 16,306,476 16,691,826 16,677,023 State and local housing finance agency obligations Fixed 6,770 6,770 8,010 8,010 Floating 1,161,580 1,161,580 1,139,500 1,139,500 Total State and local housing finance agency obligations 1,168,350 1,168,350 1,147,510 1,147,510 Total Held-to-maturity securities $ 17,485,887 $ 17,474,826 $ 17,839,336 $ 17,824,533 Federal Home Loan Bank of New York Notes to Financial Statements Impairment Analysis (OTTI) of GSE-issued and Private Label Mortgage-backed Securities The FHLBNY evaluates its individual securities issued by Fannie Mae, Freddie Mac and U.S. government agency, (collectively GSE-issued securities), by considering the creditworthiness and performance of the debt securities and the strength of the GSEs’ guarantees of the securities. Based on analysis, GSE-issued securities are performing in accordance with their contractual Management evaluates its investments in private-label MBS (PLMBS) for OTTI on a quarterly basis by performing cash flow tests on its entire portfolio of PLMBS. In January 2020, we concluded our evaluation under the CECL guidance, which we adopted effective January 1, 2020. The CECL methodology was substantially unchanged for mortgage-backed securities from the (pre-CECL) OTTI methodology. No credit loss allowance was necessary for mortgage-backed securities as of January 1, 2020. The following table provides rollforward information about the cumulative credit losses and other components of OTTI that will be recognized in future periods as recoveries (in thousands): Years ended December 31, 2018 2017 2016 Beginning balance $ 22,731 $ 29,117 $ 31,892 Additional credit losses for which an OTTI charge was previously recognized 141 — 231 Realized credit losses (49 ) (269 ) — Increases in cash flows expected to be collected, recognized over the remaining life of the securities (6,239 ) (6,117 ) (3,006 ) Ending balance $ 16,584 $ 22,731 $ 29,117 Federal Home Loan Bank of New York Notes to Financial Statements The FHLBNY offers to its members a wide range of fixed- and adjustable-rate advance loan products with different maturities, interest rates, payment characteristics, and optionality. Redemption Terms Contractual redemption terms and yields of advances were as follows (dollars in thousands): December 31, 2018 December 31, 2017 Weighted (a) Weighted (a) Average Percentage Average Percentage Amount Yield of Total Amount Yield of Total Overdrawn demand deposit accounts $ 4,282 3.35 % — % $ — — % — % Due in one year or less 68,305,214 2.52 64.79 85,291,491 1.62 69.51 Due after one year through two years 18,019,447 2.46 17.09 16,866,935 1.78 13.74 Due after two years through three years 6,471,750 2.38 6.14 9,513,504 1.97 7.75 Due after three years through four years 3,505,420 2.61 3.32 5,173,778 2.18 4.22 Due after four years through five years 2,078,462 2.97 1.97 2,757,648 2.42 2.25 Thereafter 7,049,282 2.51 6.69 3,104,085 2.27 2.53 Total par value 105,433,857 2.51 % 100.00 % 122,707,441 1.72 % 100.00 % Hedge valuation basis adjustments (b) (255,024 ) (265,260 ) Fair value option valuation adjustments and accrued interest (c) — 5,624 Total $ 105,178,833 $ 122,447,805 Monitoring and Evaluating Credit Losses on Advances In June 2016, the FASB issued ASU 2016-13,Financial Instruments—Credit Losses (Topic 326).The ASU introduced a new accounting framework, Current Expected Credit Losses (CECL), which upon adoption on January 1, 2020, requires earlier recognition of credit losses. The FASB’s CECL framework utilizes a lifetime “expected credit loss” measurement objective for the recognition of credit losses. In January 2020, we concluded our evaluation under the CECL guidance, which we adopted effective January 1, 2020. No credit loss allowance was necessary for advances as of January 1, 2020. Summarized below are the FHLBNY’s The FHLBNY closely monitors the creditworthiness of the institutions to which it lends. The FHLBNY also closely monitors the quality and value of the assets that are pledged as collateral by its members. The FHLBNY’s members are required to pledge collateral to secure advances. Eligible collateral includes: (1) one-to-four-family and multi-family mortgages; (2) U.S. Treasury and government-agency securities; (3) mortgage-backed securities; and (4) certain other collateral which is real estate related and has a readily ascertainable value, and in which the FHLBNY can perfect a security interest. The FHLBNY has the right to take such steps, as it deems necessary to protect its secured position on outstanding advances, including requiring additional collateral (whether or not such additional collateral would otherwise be eligible to secure a loan; and the provision would benefit the FHLBNY in a scenario when a member defaults). The FHLBNY also has a statutory lien under the FHLBank Act on members’ capital stock, which serves as further collateral for members’ indebtedness to the FHLBNY. Federal Home Loan Bank of New York Notes to Financial Statements Credit Risk.The FHLBNY has policies and procedures in place to manage credit risk. There were no past due advances and all advances were current for all periods in this report. Management does not anticipate any credit losses, and accordingly, the FHLBNY has not provided an allowance for credit losses on advances. Potential credit risk from advances is concentrated in commercial banks, savings institutions, and insurance companies. Concentration of Advances Outstanding. Advances to the FHLBNY’s top ten borrowing member institutions are reported in Note 21. Segment Information and Concentration. The FHLBNY held sufficient collateral to cover the advances to all institutions and it does not expect to incur any credit losses. Advances borrowed by insurance companies accounted for Security Terms.The FHLBNY lends to financial institutions involved in housing finance within its district. Borrowing members are required to purchase capital stock of the FHLBNY and pledge collateral for advances. As of December 31, Beyond these provisions, Section 10(e) of the FHLBank Act affords any security interest granted by a member to the FHLBNY’s priority over the claims or rights of any other party. The two exceptions are claims that would be entitled to priority under otherwise applicable law or perfected security interests. All member obligations with the FHLBNY were fully collateralized throughout their entire term. The total of collateral pledged to the FHLBNY includes excess collateral pledged above the minimum collateral requirements. However, a “Maximum Lendable Value” is established to ensure that the FHLBNY has sufficient eligible collateral securing credit extensions. Mortgage Partnership Finance® program loans, or (MPF®), are the mortgage loans held-for-portfolio. The FHLBNY participates in the MPF program by purchasing and originating conventional mortgage loans from its participating members, hereafter referred to as Participating Financial Institutions (PFI). The FHLBNY manages the liquidity, interest rate and prepayment option risk of the MPF loans, while the PFIs retain servicing activities, and may credit-enhance the portion of the loans participated to the FHLBNY. No intermediary trust is involved. The FHLBNY classifies mortgage loans as held for investment, and accordingly reports them at their principal amount outstanding net of unamortized premiums, discounts, and unrealized gains and losses from loans initially classified as mortgage loan commitments. Federal Home Loan Bank of New York Notes to Financial Statements The following table presents information on mortgage loans held-for-portfolio (dollars in thousands): December 31, 2018 December 31, 2017 Amount Percentage Amount Percentage Percentage of Total Percentage of Total Real Estate(a): Fixed medium-term single-family mortgages $ 196,551 6.82 % $ 238,057 8.35 % Fixed long-term single-family mortgages 2,686,866 93.18 2,612,315 91.65 Total par value 2,883,417 100.00 % 2,850,372 100.00 % Unamortized premiums 45,451 48,011 Unamortized discounts (1,761 ) (1,833 ) Basis adjustment (b) 937 1,418 Total mortgage loans held-for-portfolio 2,928,044 2,897,968 Allowance for credit losses (814 ) (992 ) Total mortgage loans held-for-portfolio, net of allowance for credit losses $ 2,927,230 $ 2,896,976 (a) Conventional mortgages represent the majority of mortgage loans held-for-portfolio, with the remainder invested in FHA and VA insured loans (also referred to as government loans). (b) Balances represent unamortized fair value basis of closed delivery commitments. A basis adjustment is recorded at the settlement of the loan and it represents the difference in trade price paid for acquiring the loan and the price at the settlement date for a similar loan. The basis adjustment is amortized as a yield adjustment to Interest income. The FHLBNY and its members share the credit risk of MPF loans by structuring potential credit losses into layers. The first layer is typically 100 bps, but this varies with the particular MPF product. The amount of the first layer, or First Loss Account (FLA), was estimated at In terms of the credit enhancement waterfall, the MPF program structures potential credit losses on conventional MPF loans into layers on each loan pool as follows: 135 Federal Home Loan Bank of New York Notes to Financial Statements Allowance Methodology for Mortgage Loan Losses Summarized below is the FHLBNY’s existing pre-CECL allowance methodology at December 31, 2019, which generally requires that a loss be incurred before it is recognized. Mortgage loans under the existing (pre-CECL) GAAP are considered impaired when, based on current information and events, it is probable that the FHLBNY will be unable to collect all principal and interest amounts due according to the contractual terms of the mortgage loan agreements. The FHLBNY considers a loan to be seriously delinquent when it is past due 90 days or more. The FHLBNY considers the occurrence of serious delinquency as a primary confirming event of a credit loss. Bankruptcy and foreclosures are also considered as confirming events. When a loan is seriously delinquent, or in bankruptcy or in foreclosure, the FHLBNY measures estimated credit losses on an individual loan basis by looking to the value of the real property collateral. For such loans, the FHLBNY believes it is probable that we will be unable to collect all contractual interest and principal in accordance with the terms of the loan agreement. For loans that have not been individually measured for estimated credit losses (i.e. they are not seriously delinquent, or in bankruptcy or in foreclosure), the FHLBNY measures estimated incurred credit losses on a collective basis and records a valuation reserve. When a loan is delinquent 180 days or more, the FHLBNY will charge-off the excess carrying value over the net realizable value of the loan because the FHLBNY deems that foreclosure is probable at 180 days delinquency. When the loan is foreclosed and the FHLBNY takes possession of real estate, the balance of the loan that has not been charged off is recorded as real estate owned at the lower of carrying value or net realizable value. Allowance for Credit Losses Allowances for credit losses have been recorded against the uninsured MPF loans. All other types of mortgage loans were insignificant and no allowances were necessary. The following table provides a rollforward analysis of the allowance for credit losses (in thousands): Years ended December 31, 2018 2017 2016 Allowance for credit losses: Beginning balance $ 992 $ 1,554 $ 326 Charge-offs (172 ) (580 ) (738 ) Recoveries 365 305 — Provision (Reversal) for credit losses on mortgage loans (371 ) (287 ) 1,966 Ending balance $ 814 $ 992 $ 1,554 December 31, 2018 2017 2016 Ending balance, individually evaluated for impairment $ 238 $ 210 $ 600 Ending balance, collectively evaluated for impairment 576 782 954 Total Allowance for credit losses $ 814 $ 992 $ 1,554 Federal Home Loan Bank of New York Notes to Financial Statements The FHLBNY’s total MPF loans and impaired MPF loans were as follows (in thousands): December 31, 2018 December 31, 2017 Total Mortgage loans, carrying values net of allowance for credit losses (a) $ 2,927,230 $ 2,896,976 Non-performing mortgage loans - Conventional (a)(b) $ 8,453 $ 13,272 Insured MPF loans past due 90 days or more and still accruing interest (a)(b) $ 5,501 $ 5,582 The following summarizes the recorded investment in impaired loans (excluding insured FHA/VA loans), the unpaid principal balance, and the related allowance (individually assessed), and the average recorded investment of loans for which the related allowance was individually measured (in thousands): December 31, 2018 Unpaid Average Recorded Principal Related Recorded Investment Balance Allowance Investment (d) Conventional MPF Loans (a)(c) No related allowance (b) $ 10,507 $ 10,443 $ — $ 12,681 With a related allowance 993 974 238 1,161 Total individually measured for impairment $ 11,500 $ 11,417 $ 238 $ 13,842 December 31, 2017 Unpaid Average Recorded Principal Related Recorded Investment Balance Allowance Investment (d) Conventional MPF Loans (a)(c) No related allowance (b) $ 14,343 $ 14,222 $ — $ 14,386 With a related allowance 1,509 1,494 210 1,393 Total individually measured for impairment $ 15,852 $ 15,716 $ 210 $ 15,779 The following tables summarize the recorded investment, the unpaid principal balance, and the average recorded investment of loans for which the related allowance was collectively measured (in thousands): December 31, 2018 Unpaid Average Recorded Principal Related Recorded Investment Balance Allowance Investment (a) Collectively measured for impairment Insured loans $ 233,064 $ 227,268 $ — $ 237,144 Uninsured loans 2,697,827 2,644,732 576 2,660,060 Total loans collectively measured for impairment $ 2,930,891 $ 2,872,000 $ 576 $ 2,897,204 December 31, 2017 Unpaid Average Recorded Principal Related Recorded Investment Balance Allowance Investment (a) Collectively measured for impairment Insured loans $ 241,575 $ 235,232 $ — $ 238,661 Uninsured loans 2,654,882 2,599,424 782 2,602,298 Total loans collectively measured for impairment $ 2,896,457 $ 2,834,656 $ 782 $ 2,840,959 Federal Home Loan Bank of New York Notes to Financial Statements Recorded investments in MPF loans that were past due, and real estate owned are summarized below. Recorded investment, which includes accrued interest receivable, would not equal carrying values reported elsewhere (dollars in thousands): December 31, 2018 December 31, 2017 Conventional Insured Conventional Insured MPF Loans Loans MPF Loans Loans Mortgage loans: Past due 30 - 59 days $ 17,635 $ 12,724 $ 18,216 $ 12,561 Past due 60 - 89 days 2,683 3,025 3,914 2,712 Past due 90 - 179 days 1,169 1,663 3,860 2,545 Past due 180 days or more 7,316 4,216 9,464 3,378 Total past due 28,803 21,628 35,454 21,196 Total current loans 2,680,524 211,436 2,635,280 220,379 Total mortgage loans $ 2,709,327 $ 233,064 $ 2,670,734 $ 241,575 Other delinquency statistics: Loans in process of foreclosure, included above $ 5,149 $ 3,343 $ 6,191 $ 2,524 Number of foreclosures outstanding at period end 37 27 48 23 Serious delinquency rate (a) 0.31 % 2.52 % 0.50 % 2.45 % Serious delinquent loans total used in calculation of serious delinquency rate $ 8,525 $ 5,879 $ 13,324 $ 5,923 Past due 90 days or more and still accruing interest $ — $ 5,879 $ — $ 5,923 Loans on non-accrual status $ 8,485 $ — $ 13,324 $ — Troubled debt restructurings: Loans discharged from bankruptcy (b) $ 7,398 $ 823 $ 8,772 $ 648 Modified loans under MPF® program $ 1,423 $ — $ 1,144 $ — Real estate owned $ 767 $ 682 The FHLBNY accepts demand, overnight and term deposits from its members. Also, a member that services mortgage loans may deposit funds collected in connection with the mortgage loans as a pending disbursement to the owners of the mortgage loans. The following table summarizes deposits (in thousands): December 31, 2018 December 31, 2017 Interest-bearing deposits Interest-bearing demand $ 1,002,587 $ 1,142,056 Term (a) 40,000 36,000 Total interest-bearing deposits 1,042,587 1,178,056 Non-interest-bearing demand 20,050 17,999 Total deposits (b) $ 1,062,637 $ 1,196,055 Interest rate payment terms for deposits are summarized below (dollars in thousands): December 31, 2018 December 31, 2017 Amount Weighted Average Amount Weighted Average Due in one year or less Interest-bearing deposits (a) $ 1,042,587 1.73 % $ 1,178,056 0.85 % Non-interest-bearing deposits 20,050 17,999 Total deposits $ 1,062,637 $ 1,196,055 The FHLBanks have joint and several liability for all the Consolidated obligations issued on their behalf (for more information, see Note 19. Commitments and Contingencies). Consolidated obligations consist of bonds and discount notes. The FHLBanks issue Consolidated obligations through the Office of Finance as their fiscal agent. In connection with each debt issuance, a FHLBank specifies the amount of debt it wants issued on its behalf. The Office of Finance tracks the amount of debt issued on behalf of each FHLBank. Each FHLBank separately tracks and records as a liability for its specific portion of Consolidated obligations for which it is the primary obligor. Consolidated obligation bonds (CO bonds or Consolidated bonds) are issued primarily to raise intermediate- and long-term funds for the FHLBanks and are not subject to any statutory or regulatory limits on maturity. Consolidated obligation discount notes (CO discount notes, Discount notes, or Consolidated discount notes) are issued primarily to raise short-term funds. Discount notes sell at less than their face amount and are redeemed at par value when they mature. Federal Home Loan Bank of New York Notes to Financial Statements The following table summarizes carrying amounts of Consolidated obligations issued by the FHLBNY and outstanding at December 31, December 31, 2018 December 31, 2017 Consolidated obligation bonds-amortized cost $ 83,764,337 $ 98,878,469 Hedge valuation basis adjustments (a) 238,150 273,585 Hedge basis adjustments on terminated hedges (b) 131,497 134,920 FVO (c) - valuation adjustments and accrued interest 19,792 1,074 Total Consolidated obligation bonds $ 84,153,776 $ 99,288,048 Discount notes-amortized cost $ 50,631,066 $ 49,610,668 FVO (c) - valuation adjustments and remaining accretion 9,172 3,003 Total Consolidated obligation discount notes $ 50,640,238 $ 49,613,671 Redemption Terms of Consolidated Obligation Bonds The following table is a summary of carrying amounts of Consolidated obligation bonds outstanding by year of maturity (dollars in thousands): December 31, 2018 December 31, 2017 Weighted Weighted Average Percentage Average Percentage Maturity Amount Rate (a) of Total Amount Rate (a) of Total One year or less $ 64,893,475 2.29 % 77.48 % $ 82,118,565 1.30 % 83.07 % Over one year through two years 7,555,545 2.38 9.02 7,363,255 1.43 7.45 Over two years through three years 2,586,325 2.48 3.09 2,462,400 1.91 2.49 Over three years through four years 2,181,750 2.39 2.60 1,158,595 2.18 1.17 Over four years through five years 1,435,235 2.73 1.71 1,640,835 2.13 1.66 Thereafter 5,105,650 3.45 6.10 4,107,500 3.35 4.16 Total par value 83,757,980 2.39 % 100.00 % 98,851,150 1.44 % 100.00 % Bond premiums (b) 42,647 54,654 Bond discounts (b) (36,290 ) (27,335 ) Hedge valuation basis adjustments (c) 238,150 273,585 Hedge basis adjustments on terminated hedges (d) 131,497 134,920 FVO (e) - valuation adjustments and accrued interest 19,792 1,074 Total Consolidated obligation-bonds $ 84,153,776 $ 99,288,048 141 Federal Home Loan Bank of New York Notes to Financial Statements Interest Rate Payment Terms The following table summarizes par amounts of major types of Consolidated obligation bonds issued and outstanding (dollars in thousands): December 31, 2018 December 31, 2017 Percentage Percentage Amount of Total Amount of Total Fixed-rate, non-callable $ 22,745,980 27.16 % $ 24,080,150 24.36 % Fixed-rate, callable 4,966,000 5.93 3,658,000 3.70 Step Up, callable 880,000 1.05 253,000 0.26 Single-index floating rate 55,166,000 65.86 70,860,000 71.68 Total par value 83,757,980 100.00 % 98,851,150 100.00 % Bond premiums 42,647 54,654 Bond discounts (36,290 ) (27,335 ) Hedge valuation basis adjustments (a) 238,150 273,585 Hedge basis adjustments on terminated hedges (b) 131,497 134,920 FVO (c) - valuation adjustments and accrued interest 19,792 1,074 Total Consolidated obligation-bonds $ 84,153,776 $ 99,288,048 Discount Notes Consolidated obligation discount notes are issued to raise short-term funds. Discount notes are Consolidated obligations with original maturities of up to one year. These notes are issued at less than their face amount and redeemed at par when they mature. The FHLBNY’s outstanding Consolidated obligation discount notes were as follows (dollars in thousands): December 31, 2018 December 31, 2017 Par value $ 50,805,481 $ 49,685,334 Amortized cost $ 50,631,066 $ 49,610,668 FVO (a) - valuation adjustments and remaining accretion 9,172 3,003 Total discount notes $ 50,640,238 $ 49,613,671 Weighted average interest rate 2.34 % 1.23 % Note 13.Affordable Housing Program. The FHLBNY charges the amount allocated for the Affordable Housing Program (AHP) to income and recognizes it as a liability. The FHLBNY relieves the AHP liability as members use the subsidies. The following table provides rollforward information with respect to changes in Affordable Housing Program liabilities (in thousands): Years ended December 31, 2018 2017 2016 Beginning balance $ 131,654 $ 125,062 $ 113,352 Additions from current period’s assessments 62,382 53,417 44,752 Net disbursements for grants and programs (32,318 ) (46,825 ) (33,042 ) Ending balance $ 161,718 $ 131,654 $ 125,062 142 Federal Home Loan Bank of New York Notes to Financial Statements Note 14.Capital Stock, Mandatorily Redeemable Capital Stock and Restricted Retained Earnings. The FHLBanks, including the FHLBNY, have a cooperative structure. To access the FHLBNY’s products and services, a financial institution must be approved for membership and purchase capital stock in the FHLBNY. A member’s stock requirement is generally based on its use of FHLBNY products, subject to a minimum membership requirement as prescribed by the FHLBank Act and the FHLBNY’s Capital Plan. FHLBNY stock can be issued, exchanged, redeemed and repurchased only at its stated par value of $100 per share. It is not publicly traded. An option to redeem capital stock that is greater than a member’s minimum requirement is held by both the member and the FHLBNY. The FHLBNY’s Capital Plan offers two sub-classes of Class B capital stock, membership and activity-based capital Membership and Activity-based Class B capital stocks have the same voting rights and dividend rates. (See Statements of Capital): The FHLBNY is subject to risk-based capital rules of the Finance Agency, the regulator of the FHLBanks. Specifically, the FHLBNY is subject to three capital requirements under its capital plan. First, the FHLBNY must maintain at all times permanent capital in an amount at least equal to the sum of its credit risk, market risk, and operations risk capital requirements as calculated in accordance with the FHLBNY policy, and rules and regulations of the Finance Agency. Only permanent capital, defined as Class B stock and retained earnings, satisfies this risk-based capital requirement. The capital plan does not provide for the issuance of Class A capital stock. The Finance Agency may require the FHLBNY to maintain an amount of permanent capital greater than what is required by the risk-based capital requirements. Second, the FHLBNY is required to maintain at least a 4.0% total capital-to-asset ratio; and third, the FHLBNY will maintain at least a 5.0% leverage ratio at all times. The FHFA’s regulatory leverage ratio is defined as the sum of permanent capital weighted 1.5 times and non-permanent capital weighted 1.0 times divided by total assets. The FHLBNY was in compliance with the aforementioned capital rules and requirements for all periods presented, and met the “adequately capitalized” classification, which is the highest rating, under the capital rule. However, the Finance Agency has discretion to reclassify a FHLBank and to modify or add to the corrective action requirements for a particular capital classification. The following describes each capital classification and its related corrective action requirements, if any. Federal Home Loan Bank of New York Notes to Financial Statements Each required capital restoration plan must be submitted within 15 business days following notice from the Director of the Finance Agency unless an extension is granted and is subject to the Director of the Finance Agency’s review and must set forth a plan to restore permanent and total capital levels to levels sufficient to fulfill its risk-based and minimum capital requirements. The Director of the Finance Agency has discretion to add to or modify the corrective action requirements for each capital classification other than adequately capitalized if the Director of the Finance Agency determines that such action is necessary to ensure the safe and sound operation of the FHLBank and the FHLBank’s compliance with its risk-based and minimum capital requirements. Further, the Capital Rule provides the Director of the Finance Agency discretion to reclassify a FHLBank’s capital classification if the Director of the Finance Agency determines that: If the FHLBNY became classified into a capital classification other than adequately capitalized, the FHLBNY could be adversely impacted by the corrective action requirements for that capital classification. Federal Home Loan Bank of New York Notes to Financial Statements Risk-based Capital— The following table summarizes the FHLBNY’s risk-based capital ratios (dollars in thousands): December 31, 2018 December 31, 2017 Required (d) Actual Required (d) Actual Regulatory capital requirements: Risk-based capital (a)(e) $ 797,783 $ 7,765,726 $ 912,620 $ 8,316,231 Total capital-to-asset ratio 4.00 % 5.38 % 4.00 % 5.23 % Total capital (b) $ 5,775,256 $ 7,765,726 $ 6,356,735 $ 8,316,231 Leverage ratio 5.00 % 8.07 % 5.00 % 7.85 % Leverage capital (c ) $ 7,219,070 $ 11,648,589 $ 7,945,919 $ 12,474,347 Mandatorily Redeemable Capital Stock Generally, the FHLBNY’s capital stock is redeemable at the option of either the member or the FHLBNY subject to certain conditions, including the provisions under the accounting guidance for certain financial instruments with characteristics of both liabilities and equity. In accordance with the accounting guidance, the FHLBNY generally reclassifies the stock subject to redemption from equity to a liability once a member irrevocably exercises a written redemption right, gives notice of intent to withdraw from membership, or attains non-member status by merger or acquisition, charter termination, or involuntary termination from membership. Under such circumstances, the member shares will then meet the definition of a mandatorily redeemable financial instrument. Estimated redemption periods were as follows (in thousands): December 31, 2018 December 31, 2017 Redemption less than one year $ 229 $ 13,672 Redemption from one year to less than three years 1,068 1,145 Redemption from three years to less than five years 425 445 Redemption from five years or greater 4,123 4,683 Total $ 5,845 $ 19,945 The following table provides rollforward information with respect to changes in mandatorily redeemable capital stock liabilities (in thousands): Years ended December 31, 2018 2017 2016 Beginning balance $ 19,945 $ 31,435 $ 19,499 Capital stock subject to mandatory redemption reclassified from equity 8,756 3,009 52,902 Redemption of mandatorily redeemable capital stock (a) (22,856 ) (14,499 ) (40,966 ) Ending balance $ 5,845 $ 19,945 $ 31,435 Accrued interest payable (b) $ 112 $ 305 $ 606 145 Federal Home Loan Bank of New York Notes to Financial Statements Restricted Retained Earnings Under the FHLBank Joint Capital Enhancement Agreement (Capital Agreement), each FHLBank is required to set aside 20% of its Net income each quarter to a restricted retained earnings account until the balance of that account equals at least one percent of that FHLBank’s average balance of outstanding Consolidated obligations. The Capital Agreement is intended to enhance the capital position of each FHLBank. These restricted retained earnings will not be available to pay dividends. Retained earnings included Note 15.Earnings Per Share of Capital. The FHLBNY has a single class of capital stock, and earnings per share computation is for the Class B capital stock. The following table sets forth the computation of earnings per share. Basic and diluted earnings per share of capital are the same. The FHLBNY has no dilutive potential common shares or other common stock equivalents (dollars in thousands except per share amounts): Years ended December 31, 2018 2017 2016 Net income $ 560,478 $ 479,469 $ 401,152 Net income available to stockholders $ 560,478 $ 479,469 $ 401,152 Weighted average shares of capital 61,798 62,800 57,360 Less: Mandatorily redeemable capital stock (140 ) (215 ) (244 ) Average number of shares of capital used to calculate earnings per share 61,658 62,585 57,116 Basic earnings per share $ 9.09 $ 7.66 $ 7.02 Note 16.Employee Retirement Plans. The FHLBNY participates in the Pentegra Defined Benefit Plan for Financial Institutions (Pentegra DB Plan), a tax-qualified, defined-benefit multiemployer pension plan that covers all FHLBNY officers and Retirement Plan Expenses—Summary The following table presents employee retirement plan expenses for the periods ended (in thousands): Years ended December 31, 2018 2017 2016 Defined Benefit Plan $ 10,066 $ 7,455 $ 7,947 Benefit Equalization Plans (defined benefit and defined contribution) 6,838 5,705 4,566 Defined Contribution Plans 2,329 2,122 2,003 Postretirement Health Benefit Plan (1,145 ) (86 )(a) (176 ) Total retirement plan expenses $ 18,088 $ 15,196 $ 14,340 (a)Prior period number has been adjusted by immaterial amount. 146 Federal Home Loan Bank of New York Notes to Financial Statements Pentegra DB Plan Net Pension Cost and Funded Status The Pentegra DB Plan operates as a multiemployer plan for accounting purposes and as a multiple-employer plan under the Employee Retirement Income Security Act of 1974 (ERISA) and the Internal Revenue Code. As a result, certain multiemployer plan disclosures, including the certified zone status, are not applicable to the Pentegra DB Plan. Typically, multiemployer plans contain provisions for collective bargaining arrangements. There are no collective bargaining agreements in place at any of the FHLBanks (including the FHLBNY) that participate in the plan. Under the Pentegra DB Plan, contributions made by a participating employer may be used to provide benefits to employees of other participating employers because assets contributed by an employer are not segregated in a separate account or restricted to provide benefits only to employees of that employer. In addition, in the event a participating employer is unable to meet its contribution requirements, the required contributions for the other participating employers could increase proportionately. If an employee transfers employment to the FHLBNY, and the employee was a participant in the Pentegra Benefit Plan with another employer, the FHLBNY is responsible for the entire benefit. At the time of transfer, the former employer will transfer assets to the FHLBNY’s plan, in the amount of the liability for the accrued benefit. The Pentegra DB Plan operates on a fiscal year from July 1 through June 30, and files one Form 5500 on behalf of all employers who participate in the plan. The Employer Identification Number is 13-5645888 and the three-digit plan number is 333. The Pentegra DB Plan’s annual valuation process includes calculating the plan’s funded status, and separately calculating the funded status of each participating employer. The funded status is defined as the market value of assets divided by the funding target (100 percent of the present value of all benefit liabilities accrued at that date). As permitted by ERISA, the Pentegra DB Plan accepts contributions for the prior plan year up to eight and a half months after the asset valuation date. As a result, the market value of assets at the valuation date (July 1) may increase by any subsequent contributions designated for the immediately preceding plan year ended June 30. The following table presents multiemployer plan disclosure for the three years ended December 31, (dollars in thousands): 2018 2017 2016 Net pension cost charged to compensation and benefit expense for the year ended December 31 $ 10,066 $ 7,455 $ 7,947 Contributions allocated to plan year ended June 30 $ 10,158 $ 7,409 (a) $ 8,344 Pentegra DB Plan funded status as of July 1 (b) 109.86 % 111.30 % 104.12 % FHLBNY’s funded status as of July 1 (c) 114.77 % 115.79 % 114.86 % 147 Federal Home Loan Bank of Notes to Benefit Equalization Plan (BEP) The BEP restores defined benefits for those employees who have had their qualified defined benefits limited by IRS regulations. The method for determining the accrual expense and liabilities of the plan is the Projected Unit Credit Accrual Method. Under this method, the liability of the plan is composed mainly of two components, Projected Benefit Obligation (PBO) and Service Cost accruals. The total liability is determined by projecting each person’s expected plan benefits. These projected benefits are then discounted to the measurement date. Finally, the liability is allocated to service already worked (PBO) and service to be worked (Service Cost). There were no plan assets (this is an unfunded plan) that have been designated for the BEP plan. The accrued pension costs for the BEP plan were as follows (in thousands): December 31, 2018 2017 Accumulated benefit obligation $ 52,288 $ 51,065 Effect of future salary increases 10,819 12,067 Projected benefit obligation 63,107 63,132 Unrecognized net (loss)/gain (22,980 ) (27,976 ) Accrued pension cost $ 40,127 $ 35,156 Components of the projected benefit obligation for the BEP plan were as follows (in thousands): December 31, 2018 2017 Projected benefit obligation at the beginning of the year (a) $ 63,089 $ 53,741 Service cost 1,095 888 Interest cost 2,155 2,093 Benefits paid (1,824 ) (1,788 ) Actuarial (gain)/loss (b) (1,408 ) 8,198 Projected benefit obligation at the end of the year $ 63,107 $ 63,132 The measurement date used to determine projected benefit obligation for the BEP plan was December 31 in each of the two years. Amounts recognized in AOCI for the BEP plan were as follows (in thousands): December 31, 2018 2017 Net loss/(gain) $ 22,980 $ 27,976 Accumulated other comprehensive loss/(gain) $ 22,980 $ 27,976 Federal Home Loan Bank of New York Notes to Financial Statements Changes in the BEP plan assets were as follows (in thousands): December 31, 2018 2017 Fair value of the plan assets at the beginning of the year $ — $ — Employer contributions 1,824 1,788 Benefits paid (1,824 ) (1,788 ) Fair value of the plan assets at the end of the year $ — $ — Components of the net periodic pension cost for the defined benefit component of the BEP were as follows (in thousands): Years ended December 31, 2018 2017 2016 Service cost $ 1,095 $ 888 $ 743 Interest cost 2,155 2,093 1,904 Amortization of unrecognized net loss 3,545 2,554 1,966 Amortization of unrecognized past service (credit)/cost — — (47 ) Net periodic benefit cost -Defined Benefit BEP 6,795 5,535 4,566 Benefit Equalization plans - Thrift and Deferred incentive compensation plans (introduced in 2017) 43 170 — Total $ 6,838 $ 5,705 $ 4,566 Other changes in benefit obligations recognized in AOCI were as follows (in thousands): December 31, 2018 2017 Net (gain)/loss $ (1,408 ) $ 8,198 Amortization of net (loss)/gain (3,545 ) (2,554 ) Total recognized in other comprehensive loss/(income) $ (4,953 ) $ 5,644 Total recognized in net periodic benefit cost and other comprehensive income $ 1,842 $ 11,179 The net transition obligation (asset), prior service cost (credit), and the estimated net loss (gain) for the BEP plan that are expected to be amortized from AOCI into net periodic benefit cost over the next fiscal year are shown in the table below (in thousands): December 31, 2019 Expected amortization of net loss/(gain) $ 2,879 Federal Home Loan Bank of New York Notes to Financial Statements Key assumptions and other information for the actuarial calculations to determine benefit obligations for the BEP plan were as follows (dollars in thousands): December 31, 2018 December 31, 2017 December 31, 2016 Discount rate (a) 4.10 % 3.47 % 3.96 % Salary increases 4.50 % 4.50 % 4.50 % Amortization period (years) 6 6 7 Benefits paid during the period $ (1,824 ) $ (1,788 ) $ (1,704 ) Future BEP plan benefits to be paid were estimated to be as follows (in thousands): Years Payments 2019 $ 2,117 2020 2,335 2021 2,652 2022 2,925 2023 3,217 2024-2028 19,335 Total $ 32,581 The net periodic benefit cost for Postretirement Health Benefit Plan The Retiree Medical Benefit Plan (the Plan) is for retired employees and for employees who are eligible for retirement benefits. The Plan is unfunded. The Plan, as amended, is offered to active employees who have completed 10 years of employment service at the FHLBNY and attained age 55 as of January 1, 2015. Assumptions used in determining the accumulated postretirement benefit obligation (APBO) included a discount rate assumption of A percentage point increase in the assumed healthcare trend rates would have resulted in an increase in postretirement benefit expense by $26.0 thousand in 2019 and $36.0 thousand in Federal Home Loan Bank of New York Notes to Financial Statements Components of the accumulated postretirement benefit obligation for the postretirement health benefits plan for the years ended December 31, December 31, 2018 2017 Accumulated postretirement benefit obligation at the beginning of the year $ 17,120 $ 15,238 Service cost 87 100 Interest cost 465 629 Actuarial (gain)/loss (4,457 ) 1,665 Plan participant contributions 191 203 Actual benefits paid (636 ) (776 ) Retiree drug subsidy reimbursement 56 61 Accumulated postretirement benefit obligation at the end of the year $ 12,826 $ 17,120 Changes in postretirement health benefit plan assets (in thousands): December 31, 2018 2017 Fair value of plan assets at the beginning of the year $ — $ — Employer contributions 445 573 Plan participant contributions 191 203 Actual benefits paid (636 ) (776 ) Fair value of plan assets at the end of the year $ — $ — Amounts recognized in AOCI for the postretirement benefit obligation (in thousands): December 31, 2018 2017 Prior service (credit)/cost $ (258 ) $ (2,019 ) Net loss/(gain) 269 4,790 Accumulated other comprehensive loss/(gain) $ 11 $ 2,771 The net transition obligation (asset), prior service cost (credit), and estimated net loss (gain) for the postretirement health benefit plan are expected to be amortized from AOCI into net periodic benefit cost over the next fiscal year are shown in the table below (in thousands): December 31, 2019 Expected amortization of net loss/(gain) $ — Expected amortization of prior service (credit)/cost $ (258 ) Federal Home Loan Bank of New York Notes to Financial Statements Components of the net periodic benefit cost for the postretirement health benefit plan were as follows (in thousands): Years ended December 31, 2018 2017 2016 Service cost (benefits attributed to service during the period) $ 87 $ 100 $ 119 Interest cost on accumulated postretirement health benefit obligation 465 629 598 Amortization of loss/(gain) 64 946 868 Amortization of prior service (credit)/cost (1,761 ) (1,761 ) (1,761 ) Net periodic postretirement health benefit (income) (a) $ (1,145 ) $ (86 ) $ (176 ) Other changes in benefit obligations recognized in AOCI were as follows (in thousands): December 31, 2018 2017 Net (gain)/loss $ (4,457 ) $ 1,665 Amortization of net (loss)/gain (64 ) (946 ) Amortization of prior service credit/(cost) 1,761 1,761 Total recognized in other comprehensive income $ (2,760 ) $ 2,480 Total recognized in net periodic benefit cost and other comprehensive income $ (3,905 ) $ 2,394 The measurement date used to determine benefit obligations was December 31 in each of the two years. Key assumptions and other information to determine current year’s obligation for the postretirement health benefit plan were as follows: Years ended December 31, 2018 2017 2016 Weighted average discount rate (a) 4.09% 3.42% 3.88% Health care cost trend rates: Assumed for next year �� Pre 65 6.75% 7.10% 6.65% Post 65 4.90% 4.95% 6.00% Pre 65 Ultimate rate 4.50% 4.50% 4.50% Pre 65 Year that ultimate rate is reached 2025/2026 2026 2023 Post 65 Ultimate rate 4.50% 4.50% 4.50% Post 65 Year that ultimate rate is reached 2025/2026 2026 2023 Alternative amortization methods used to amortize Prior service cost Straight - line Straight - line Straight - line Unrecognized net (gain) or loss Straight - line Straight - line Straight - line Federal Home Loan Bank of New York Notes to Financial Statements Future postretirement health benefit plan expenses to be paid were estimated to be as follows (in thousands): Years Payments 2019 $ 779 2020 813 2021 840 2022 878 2023 902 2024-2028 4,471 Total $ 8,683 The postretirement health benefit plan accrual for Note 17.Derivatives and Hedging Activities. The FHLBNY, consistent with the Finance Agency’s regulations, may enter into interest-rate swaps, swaptions, and interest-rate cap and floor agreements to manage its interest rate exposure inherent in otherwise unhedged assets and funding positions. We are not a derivatives dealer and do not trade derivatives for short-term profit. The contractual or notional amount of derivatives reflects the involvement of the FHLBNY in the various classes of financial instruments, and Derivatives are instruments that derive their value from underlying asset prices, indices, reference rates and other inputs, or a combination of these factors. The FHLBNY executes derivatives with swap dealers and financial institution swap counterparties as negotiated contracts, which are usually referred to as over-the-counter (OTC) derivatives. The majority of OTC derivative contracts at December 31, 2019 and December 31, 2018 However, the FCM remains as the principal operational contact and interacts with the DCO through the life cycle events of the derivative transaction on behalf of the FHLBNY. The FHLBNY also transacts derivative contracts that are executed and settled bilaterally with counterparties, rather than settling the transaction as a cleared derivative with a DCO. Such Federal Home Loan Bank of New York Notes to Financial Statements The following table presents the FHLBNY’s derivative activities based on notional amounts (in thousands): Derivative Notionals Credit Risk Due to Non-performance by Counterparties Derivative transactions are customarily documented by the FHLBNY under industry standard master netting agreements, which provide that following an event of default, the non-defaulting party may promptly terminate all transactions between the parties and determine the net amount due to be paid to, or by the defaulting party. Obligations under master netting agreements are customarily secured by collateral posted under an industry standard credit support annex to the master netting agreements. The netting and collateral rights incorporated in the master netting agreements are considered to be legally enforceable if a supportive legal opinion has been obtained from counsel of recognized standing.Based on the analysis of the rules, and legal analysis obtained, the FHLBNY has made a determination that it has the right of setoff that is enforceable under applicable law. Credit risk on bilateral OTC — bilateral or uncleared derivative contracts— For derivatives that are not eligible for clearing with a DCO under the Dodd-Frank Act, the FHLBNY is subject to credit risk as a result of non-performance by swap counterparties to the derivative agreements. The FHLBNY enters into master netting arrangements and bilateral security agreements with all active derivative counterparties that provide for delivery of collateral at specified levels to limit the net unsecured credit exposure to these counterparties. The FHLBNY makes judgments on each counterparty’s creditworthiness, and makes estimates of the collateral values in analyzing counterparty non-performance credit risk. Bilateral agreements consider the credit risks and the agreement specifies thresholds to post or receive collateral with changes in credit ratings. When the FHLBNY has more than one derivative transaction outstanding with the counterparty, and a legally enforceable master netting agreement exists with the counterparty, the net exposure (less collateral held) represents the appropriate measure of credit risk. The FHLBNY conducts all its bilaterally executed derivative transactions under ISDA master netting agreements. Credit risk on OTC cleared derivative transactions — The FHLBNY’s derivative transactions that are eligible for clearing are subject to mandatory clearing rules under the Commodity Futures Trading Commission (CFTC) as provided under the Dodd-Frank Act. If a derivative transaction is listed as eligible for clearing, the FHLBNY must abide by the CFTC rules to clear the transaction through a DCO. The FHLBNY’s cleared derivatives are also initially executed bilaterally with a swap dealer (the executing swap counterparty) in the OTC market. The clearing process requires all parties to the derivative transaction to novate the contracts to a DCO, which then becomes the counterparty to all parties, including the FHLBNY, to the transaction. Offsetting of Derivative Assets and Derivative Liabilities — Net Presentation December 31, 2018 December 31, 2017 Derivative Derivative Derivative Derivative Derivative instruments - Nettable Gross recognized amount Uncleared derivatives $ 246,765 $ 162,650 $ 207,922 $ 103,901 Cleared derivatives 296,677 305,918 672,494 221,976 Total derivatives fair values 543,442 468,568 880,416 325,877 Variation margin (Note 1) — — (465,803 ) — Total gross recognized amount 543,442 468,568 414,613 325,877 Gross amounts of netting adjustments and cash collateral Uncleared derivatives (134,413 ) (142,097 ) (95,190 ) (57,594 ) Cleared derivatives (295,324 ) (295,324 ) (206,691 ) (206,691 ) Total gross amounts of netting adjustments and cash collateral (429,737 ) (437,421 ) (301,881 ) (264,285 ) Net amounts after offsetting adjustments and cash collateral $ 113,705 $ 31,147 $ 112,732 $ 61,592 Uncleared derivatives $ 112,352 $ 20,553 $ 112,732 $ 46,307 Cleared derivatives 1,353 10,594 — 15,285 Total net amounts after offsetting adjustments and cash collateral $ 113,705 $ 31,147 $ 112,732 $ 61,592 Derivative instruments - Not Nettable Uncleared derivatives (a) $ 57 $ — $ 10 $ 15 Total derivative assets and total derivative liabilities Uncleared derivatives 112,409 20,553 112,742 46,322 Cleared derivatives 1,353 10,594 — 15,285 Total derivative assets and total derivative liabilities presented in the Statements of Condition (b) $ 113,762 $ 31,147 $ 112,742 $ 61,607 Non-cash collateral received or pledged (c) Can be sold or repledged Security pledged as initial margin to Derivative Clearing Organization (d) $ 239,813 $ — $ 239,064 $ — Cannot be sold or repledged Uncleared derivatives securities received (102,682 ) — (103,036 ) — Total net amount of non-cash collateral received or repledged $ 137,131 $ — $ 136,028 $ — Total net exposure cash and non-cash (e) $ 250,893 $ 31,147 $ 248,770 $ 61,607 Net unsecured amount - Represented by: Uncleared derivatives $ 9,727 $ 20,553 $ 9,706 $ 46,322 Cleared derivatives 241,166 10,594 239,064 15,285 Total net exposure cash and non-cash (e) $ 250,893 $ 31,147 $ 248,770 $ 61,607 Federal Home Loan Bank of New York Notes to Financial Statements The table below presents the gross and net derivatives receivables by contract type and amount for those derivatives contracts for which netting is permissible under U.S. GAAP as Derivative instruments— nettable. Derivatives receivables have been netted with respect to those receivables as to which the netting requirements have been met, including obtaining a legal analysis with respect to the enforceability of the netting (in thousands): Federal Home Loan Bank of New York Notes to Financial Statements Fair Value of Derivative Instruments The following tables represent outstanding notional balances and estimated fair values of the derivatives outstanding at December 31, December 31, 2018 Notional Amount Derivative Derivative Fair value of derivative instruments (a) Derivatives designated as hedging instruments Interest rate swaps $ 60,701,776 $ 390,670 $ 314,448 Total derivatives in hedging relationships 60,701,776 390,670 314,448 Derivatives not designated as hedging instruments Interest rate swaps 43,913,045 145,726 144,190 Interest rate caps or floors 803,000 644 — Mortgage delivery commitments 12,682 57 — Other (b) 666,000 6,402 9,930 Total derivatives not designated as hedging instruments 45,394,727 152,829 154,120 Total derivatives before netting and collateral adjustments $ 106,096,503 543,499 468,568 Netting adjustments (372,917 ) (372,917 ) Cash Collateral and related accrued interest (56,820 ) (64,504 ) Total netting adjustments and cash collateral (429,737 ) (437,421 ) Total derivative assets and total derivative liabilities $ 113,762 $ 31,147 Security collateral pledged as initial margin to Derivative Clearing Organization (d) $ 239,813 Security collateral received from counterparty (d) (102,682 ) Net security 137,131 Net exposure $ 250,893 December 31, 2017 Notional Amount Derivative Derivative Fair value of derivative instruments (a) Derivatives designated as hedging instruments Interest rate swaps $ 71,755,576 $ 840,933 $ 267,888 Total derivatives in hedging relationships 71,755,576 840,933 267,888 Derivatives not designated as hedging instruments Interest rate swaps 40,327,013 32,655 52,448 Interest rate caps or floors 2,695,000 893 — Mortgage delivery commitments 12,952 10 15 Other (b) 386,000 5,935 5,541 Total derivatives not designated as hedging instruments 43,420,965 39,493 58,004 Total derivatives before netting, collateral adjustments and variation margin $ 115,176,541 880,426 325,892 Variation margin (c) (465,803 ) — Total derivatives before netting and collateral adjustments 414,623 325,892 Netting adjustments (253,221 ) (253,221 ) Cash Collateral and related accrued interest (48,660 ) (11,064 ) Total netting adjustments and cash collateral (301,881 ) (264,285 ) Total derivative assets and total derivative liabilities $ 112,742 $ 61,607 Security collateral pledged as initial margin to Derivative Clearing Organization (d) $ 239,064 Security collateral received from counterparty (d) (103,036 ) Net security 136,028 Net exposure $ 248,770 Federal Home Loan Bank of New York Notes to Financial Statements The FHLBNY To qualify as an accounting hedge under the The FHLBNY records derivatives on trade date, but records the associated hedged Consolidated obligations and advances on settlement date. Hedge accounting commences on trade date, at which time subsequent changes to the derivative’s fair value are recorded The FHLBNY reports derivative assets and derivative liabilities in its Statements of Condition after giving effect to legally enforceable master netting, or when an agreement is not available as with OTC cleared derivatives, enforceability is based on a legal analysis or legal opinion. Reported Derivative assets and liabilities include interest receivable and payable on derivative contracts and the fair values of the derivative contracts. The Bank records cash collateral received and posted in the Statements of Condition as an adjustment to Derivative assets and liabilities in the following manner — Cash collateral posted by the FHLBNY is reported as a deduction to Derivative liabilities; cash collateral received from derivative counterparties is reported as a deduction to Derivative assets. Cash posted by the FHLBNY in excess of margin requirements is recorded as a When derivative counterparties pledge marketable securities, they typically retain title and the securities are treated as non-cash collateral. When the FHLBNY pledges securities to counterparties, we also retain title to the securities and treat the securities as collateral. Securities pledged or received are not netted against the derivative exposures on the Statements of Condition. The FHLBNY routinely issues debt to investors and makes advances to members. In certain such instruments, the FHLBNY may embed a derivative. Typically, such derivatives are call and put options to early terminate the instruments at par on pre-determined dates. The FHLBNY may also embed interest rate caps and floors, or step-up or step-down interest rate features within the instruments. The FHLBNY also routinely structures interest rate swaps to hedge the FHLBank debt and advances, and the FHLBNY may also embed derivative instruments, such as those identified in the previous discussion, in the swaps. When such instruments are conceived, designed and structured, our control procedures require the identification and evaluation of embedded derivatives, as defined under accounting standards for derivatives and hedging Federal Home Loan Bank of New York Notes to Financial Statements of the remaining component of the advance or debt (the host contract) and whether a separate, non-embedded instrument with the same terms as the embedded instrument would meet the definition of a derivative instrument. In 2017, the FASB issued ASU 2017-12,Targeted Improvements to Accounting for Hedging Activities (Topic 815).We adopted the guidance prospectively effective January 1, 2019, and adoption primarily impacted the FHLBNY’s accounting for derivatives designated as cash flow hedges and fair value hedges. The new guidance required that we report the entire hedging effects of the hedging instruments in the same income statement line item as the hedged item in the Statements of income. Prior period comparative financial information was not reclassified to conform to current presentation. Certain post-adoption quantitative tabular disclosures required under ASU 2017-12 have been expanded to include the comparative period. We believe that the use of post-adoption tabular disclosures to include comparative information is not akin to the adoption of the ASU on a retrospective basis, since it only affects the manner in which previously recorded amounts are disclosed. The FASB issued ASU 2018-16, Inclusion of the Secured Overnight Financing Rate (SOFR) Overnight Index Swap (OIS) Rate as a Benchmark Interest Rate for Hedge Accounting Purposes (Topic 815), which adds the OIS rate based on SOFR as an approved U.S. benchmark rate to facilitate the LIBOR to SOFR transition. The other interest rates in the United States that are eligible benchmarks under Topic 815 are interest rates on direct Treasury obligations of the U.S. government (UST), the London Interbank Offered Rate (LIBOR) swap rate, the Overnight Index Swap (OIS) Rate based on the Fed Funds Effective Rate, and the Securities Industry and Financial Markets Association (SIFMA) Municipal Swap Rate. The FHLBNY’s primary benchmark is LIBOR, and the Fed funds indexed rate is an alternative benchmark. The FHLBNY implemented the SOFR rate as another benchmark rate for interest rate hedging in the third quarter of 2019. As noted previously, to qualify as an accounting hedge under the hedge accounting rules (versus an economic hedge where hedge accounting is not sought), a derivative must be highly effective in offsetting the risk designated as being hedged. The effectiveness of these hedging relationships is evaluated on a retrospective and prospective basis, typically using quantitative measures of correlation. Effectiveness testing — The effectiveness of these hedging relationships is evaluated at hedge inception and on an ongoing basis both on a retrospective and prospective basis when we deem the hedge as not eligible for the short-cut method, which assumes the hedged item and the hedging derivative are perfectly hedged as defined under ASC 815 and amended by ASU 2017-12. The FHLBNY has designed effectiveness testing criteria based on management’s knowledge of the hedged item and hedging instruments that are employed to create the hedging relationship. The FHLBNY uses statistical analyses to evaluate effectiveness results, which must fall within established tolerances. Effectiveness testing is performed at hedge inception and on at least a quarterly basis for both prospective considerations and retrospective evaluations. Effectiveness is determined by how closely the changes in the fair value of December 31, 2018 Gains (Losses) Gains (Losses) Earnings Effect of Derivatives designated as hedging instruments Interest rate swaps Advances $ (8,778 ) $ 10,033 $ 1,255 $ 190,397 Consolidated obligation bonds (35,067 ) 33,309 (1,758 ) (28,637 ) Net gains (losses) related to fair value hedges (43,845 ) 43,342 (503 ) $ 161,760 Cash flow hedges (278 ) (278 ) $ (11,520 ) Derivatives not designated as hedging instruments Interest rate swaps (9,863 ) (9,863 ) Caps or floors (268 ) (268 ) Mortgage delivery commitments (145 ) (145 ) Swaps economically hedging instruments designated under FVO (414 ) (414 ) Accrued interest on swaps in economic hedging relationships (17,125 ) (17,125 ) Net gains (losses) related to derivatives not designated as hedging instruments (27,815 ) (27,815 ) Price alignment interest paid on variation margin (12,182 ) (12,182 ) Net gains (losses) on derivatives and hedging activities $ (84,120 ) $ 43,342 $ (40,778 ) Federal Home Loan Bank of New York Notes to Financial Statements December 31, 2017 Gains (Losses) Gains (Losses) Earnings Effect of Derivatives designated as hedging instruments Interest rate swaps Advances $ 229,452 $ (228,468 ) $ 984 $ (146,111 ) Consolidated obligation bonds (16,422 ) 16,433 11 15,714 Net gains (losses) related to fair value hedges 213,030 (212,035 ) 995 $ (130,397 ) Cash flow hedges 388 388 $ (30,918 ) Derivatives not designated as hedging instruments Interest rate swaps 5,742 5,742 Caps or floors (4,331 ) (4,331 ) Mortgage delivery commitments 570 570 Swaps economically hedging instruments designated under FVO 4,295 4,295 Accrued interest on swaps in economic hedging relationships (2,470 ) (2,470 ) Net gains (losses) related to derivatives not designated as hedging instruments 3,806 3,806 Price alignment interest paid on variation margin (3,250 ) (3,250 ) Net gains (losses) on derivatives and hedging activities $ 213,974 $ (212,035 ) $ 1,939 regression and statistical validation parameters to determine that the hedging relationship was highly effective (i.e., it has remained within the 80% - 125% dollar value offset boundaries). December 31, 2016 Gains (Losses) Gains (Losses) Earnings Effect of Derivatives designated as hedging instruments Interest rate swaps Advances $ 295,080 $ (293,720 ) $ 1,360 $ (392,473 ) Consolidated obligation bonds (55,503 ) 56,385 882 91,243 Net gains (losses) related to fair value hedges 239,577 (237,335 ) 2,242 $ (301,230 ) Cash flow hedges 58 58 $ (34,908 ) Derivatives not designated as hedging instruments Interest rate swaps 1,889 1,889 Caps or floors 253 253 Mortgage delivery commitments (530 ) (530 ) Swaps economically hedging instruments designated under FVO 6,231 6,231 Accrued interest on swaps in economic hedging relationships (11,864 ) (11,864 ) Net gains (losses) related to derivatives not designated as hedging instruments (4,021 ) (4,021 ) Net gains (losses) on derivatives and hedging activities $ 235,614 $ (237,335 ) $ (1,721 ) Typically, we execute derivatives under three hedging strategies — by designating them as a fair value or cash flow hedge of an underlying financial instrument or a forecasted transaction that qualifies for hedge accounting treatment; by acting as an intermediary; or by designating the derivative as an asset-liability management hedge (i.e. an “economic hedge”). Derivative contracts hedging the risks associated with changes in fair value are referred to as fair value hedges, while contracts hedging the variability of expected future cash flows are cash flow hedges. Other than to elect the amendments under ASU 2017-12, which expanded the strategies that qualify for hedge accounting and simplified the application of hedge accounting, no other changes were made to hedge accounting strategies. Fair Value Hedges. Hedging of Benchmark interest Rate Risk — The FHLBNY’s fair value hedges are primarily hedges of fixed-rate Consolidated obligation bonds and fixed-rate advances, and beginning in 2019 we have executed fair value hedges of available-for-sale securities. For qualifying fair value hedges of interest rate risk, the changes in the fair value of the derivative and the changes in the fair value of the hedged item attributable to the hedged risk, either total cash flows or benchmark only cash flows, are presented withinInterest incomeorInterest expensebased on whether the hedged item is an asset or a liability. Prior to the adoption of ASU 2017-12, changes to the fair value of the derivative and the qualifying hedged item were presented in Other income (loss), a line item below the Net interest income line in the Statements of income. The two principal fair value hedging activities are summarized below: In the twelve months ended December 31, 2019, the FHLBNY executed interest rate hedges employing strategies under the new guidance for “partial-term hedges” and “benchmark rate component hedging”. The two strategies are among several hedging strategies permitted under the recently adopted ASU 2017-12. Federal Home Loan Bank of New York Notes to Financial Statements changes in interest rates because the principal repayment of the debt occurs on a different date than the swap’s maturity. ASU 2017-12 addresses this issue by allowing entities to calculate the change in the fair value of the hedged item in a partial-term hedge of a fixed-rate financial instrument using an assumed term that begins when the first hedged cash flow begins to accrue and ends when the last hedged cash flow is due and payable. Similar to other fair value hedges, where the hedged item is an asset, the fair value of the hedged item attributable to interest rate risk is recorded in P&L and presented in Interest income from investments along with the change in the fair value of the hedging instrument. The new strategy was utilized by the FHLBNY for hedging certain AFS designated mortgage-backed securities. December 31, 2018 AOCI Gains/(Losses) Recognized in Location: Amount Ineffectiveness Consolidated obligation bonds (a) $ (3,938 ) Interest Expense $ 180 $ (278 ) Consolidated obligation discount notes (b) 40,754 Interest Expense — — $ 36,816 $ 180 $ (278 ) December 31, 2017 AOCI Gains/(Losses) Recognized in Location: Amount Ineffectiveness Consolidated obligation bonds (a) $ 30 Interest Expense $ (1,141 ) $ 388 Consolidated obligation discount notes (b) 25,970 Interest Expense — — $ 26,000 $ (1,141 ) $ 388 December 31, 2016 AOCI Gains/(Losses) Recognized in Location: Amount Ineffectiveness Consolidated obligation bonds (a) $ 5,982 Interest Expense $ (2,127 ) $ 58 Consolidated obligation discount notes (b) 35,910 Interest Expense — — $ 41,892 $ (2,127 ) $ 58 December 31, 2018 December 31, 2017 Rollover Hedge Anticipatory Hedge Rollover Hedge Anticipatory Hedge Beginning balance $ (23,342 ) $ 3,465 $ (49,312 ) $ 2,294 Changes in fair values (a) 40,754 (4,377 ) 25,970 (1,772 ) Amount reclassified — (180 ) — 1,141 Fair Value - closed contract — 439 — 1,802 Ending balance $ 17,412 $ (653 ) $ (23,342 ) $ 3,465 Notional amount of swaps outstanding $ 2,664,000 $ 461,000 $ 2,349,000 $ 30,000 Federal Home Loan Bank of New York Notes to Financial Statements Gains and Losses on Fair value hedges under ASC 815 are summarized below (in thousands): Gains (losses) represent changes in fair values of derivatives and hedged items due to changes in the designated benchmark interest rates, the risk being hedged. Beginning in 2019, gains and losses on ASC 815 hedges are recorded in the same line in the Statements of income as the hedged assets and hedged liabilities. Prior to the adoption of ASU 2017-12 on January 1, 2019, gains and losses on derivatives and hedged items were recorded in Other income (loss). 161 Federal Home Loan Bank of New York Notes to Financial Statements Cumulative Basis Adjustment Upon electing to apply ASC 815 fair value hedge accounting, the carrying value of the hedged item is adjusted to reflect the cumulative impact of changes in the hedged risk. The hedge basis adjustment, whether arising from an active or de-designated hedge relationship, remains with the hedged item until the hedged item is derecognized from the balance sheet. The tables below present the carrying amount of FHLBNY’s assets and liabilities under active ASC 815 qualifying fair value hedges at December 31, 2019 and December 31, 2018, as well as the hedged item’s cumulative hedge basis adjustments, which were included in the carrying value of assets and liabilities in active hedges. The tables also present unamortized cumulative basis adjustments from discontinued hedges where the previously hedged item remains on the FHLBNY’s Statements of condition (in thousands): 162 Federal Home Loan Bank of New York Notes to Financial Statements Cash Flow Hedges FHLBNY hedges the variability of forecasted cash flows associatedprimarily when it hedges the anticipated issuance of fixed-rate CO bonds. Variable cash flows from forecasted liabilities are synthetically converted to fixed-rate cash flows by entering into receive-variable, pay-fixed interest rate swaps and receive-variable, pay-fixed forward-starting interest rate swaps. Prior to the adoption of ASU 2017-12, ASC 815 required the risk being hedged as the risk of overall variability in the hedged cash flows due to changes in the benchmark rate. With the adoption of ASU 2017-12, the FHLBNY may hedge the variability from changes in a contractually specified rate and recognize the entire change in fair value of the cash flow hedging instruments in Accumulated other comprehensive income (loss) AOCI. Prior to the adoption of ASU 2017-12, to the extent that these derivatives were not fully effective, changes in their fair values in excess of changes in the value of the hedged transactions were immediately included in Other income (loss). With the adoption of ASU 2017-12, such amounts are no longer required to be immediately recognized in earnings, but instead the full change in the value of the hedging instrument is required to be recorded in AOCI, and then recognized in earnings in the same period that the cash flows impact earnings. Accordingly, for hedges of anticipated/forecasted debt issuance, changes in fair value of interest rate swap will remain in AOCI and will be included in the earnings of future periods when the forecasted hedged cash flows impact earnings. However, if it becomes probable that some or all of the hedged forecasted transactions will not occur, any amounts that remain in AOCI related to these transactions must be immediately reflected in Other income (loss). The two principal cash flow hedging activities for the FHLBNY are summarized below: Federal Home Loan Bank of New York Notes to Financial Statements Cash flow hedge gains and losses The following tables present derivative instruments used in cash flow hedge accounting relationships and the gains and losses recorded on such derivatives (in thousands): Economic Hedges FHLBNY often uses economic hedges when hedge accounting would be too complex or operationally burdensome. End-user derivatives that are economic hedges are carried at fair value, with changes in value included in Other income (loss), a line item, which is below Net interest income. For hedges that either do not meet the ASC 815 hedging criteria or for which management decides not to apply ASC 815 hedge accounting, the derivative is recorded at fair value on the balance sheet with the associated changes in fair value recorded in earnings, while the “hedged” instrument continues to be carried at amortized cost. Therefore, current earnings are affected by the interest rate shifts and other factors that cause a change in the swap’s value, but for which no offsetting change in value is recorded on the hedged instrument. Economic hedges are an acceptable hedging strategy under the FHLBNY’s risk management program, and the strategies comply with the Finance Agency’s regulatory requirements prohibiting speculative use of derivatives. Federal Home Loan Bank of New York Notes to Financial Statements The FHLBNY may alternatively elect to account for instruments at fair value under the fair value option. Once the irrevocable election is made upon issuance of the debt or asset, the full change in fair value of the instrument is reported in earnings. If the FVO instrument is in an economic hedge, changes in fair value of the related interest rate swap are also reflected in earnings, which provides a natural offset to the FVO instrument’s fair value change. To the extent that the two amounts differ because the full change in the fair value of the FVO instrument includes risks not offset by the interest rate swap, the difference is automatically captured in current earnings. Economic hedges are also employed when the hedged item itself is marked-to-market through current earnings, such as hedges of commitments to originate one- to four-family mortgage loans. Gains and losses on economic hedges are presented below (in thousands): Federal Home Loan Bank of New York Notes to Financial Statements Estimated Fair Values — Summary Tables —The carrying values, estimated fair values and the levels within the fair value hierarchy were as follows (in thousands): December 31, 2018 Estimated Fair Value Financial Instruments Carrying Total Level 1 Level 2 Level 3 (a) Netting Assets Cash and due from banks $ 85,406 $ 85,406 $ 85,406 $ — $ — $ — Securities purchased under agreements to resell 4,095,000 4,095,150 — 4,095,150 — — Federal funds sold 7,640,000 7,639,998 — 7,639,998 — — Trading securities 5,810,512 5,810,512 5,304,329 506,183 — — Equity Investments 48,179 48,179 48,179 — — — Available-for-sale securities 422,216 422,216 422,216 — — Held-to-maturity securities 17,474,826 17,445,756 — 16,126,662 1,319,094 — Advances 105,178,833 105,137,214 — 105,137,214 — — Mortgage loans held-for-portfolio, net 2,927,230 2,852,611 — 2,852,611 — — Loans to other FHLBanks 250,000 250,000 — 250,000 — — Accrued interest receivable 275,256 275,256 — 275,256 — — Derivative assets 113,762 113,762 — 543,499 — (429,737 ) Other financial assets 767 767 — — 767 — Liabilities Deposits 1,062,637 1,062,625 — 1,062,625 — — Consolidated obligations Bonds 84,153,776 83,912,990 — 83,912,990 — — Discount notes 50,640,238 50,638,448 — 50,638,448 — — Mandatorily redeemable capital stock 5,845 5,845 5,845 — — — Accrued interest payable 223,570 223,570 — 223,570 — — Derivative liabilities 31,147 31,147 — 468,568 — (437,421 ) Other financial liabilities 86,095 86,095 86,095 — — — December 31, 2017 Estimated Fair Value Financial Instruments Carrying Total Level 1 Level 2 Level 3 (a) Netting Assets Cash and due from banks $ 127,403 $ 127,403 $ 127,403 $ — $ — $ — Securities purchased under agreements to resell 2,700,000 2,700,008 — 2,700,008 — — Federal funds sold 10,326,000 10,325,920 — 10,325,920 — — Trading securities 1,641,568 1,641,568 1,284,669 356,899 — — Available-for-sale securities 577,269 577,269 48,642 528,627 — — Held-to-maturity securities 17,824,533 17,906,773 — 16,575,243 1,331,530 — Advances 122,447,805 122,401,759 — 122,401,759 — — Mortgage loans held-for-portfolio, net 2,896,976 2,886,189 — 2,886,189 — Accrued interest receivable 226,981 226,981 — 226,981 — — Derivative assets 112,742 112,742 — 414,623 — (301,881 ) Other financial assets 682 682 — — 682 — Liabilities Deposits 1,196,055 1,196,027 — 1,196,027 — — Consolidated obligations Bonds 99,288,048 99,130,116 — 99,130,116 — — Discount notes 49,613,671 49,609,537 — 49,609,537 — — Mandatorily redeemable capital stock 19,945 19,945 19,945 — — — Accrued interest payable 162,176 162,176 — 162,176 — — Derivative liabilities 61,607 61,607 — 325,892 — (264,285 ) Other financial liabilities 84,194 84,194 84,194 — — — The fair value amounts recorded on the Statements of Condition or presented in the table above have been determined by the FHLBNY using available market information and our reasonable judgment of appropriate valuation methods. 166 Federal Home Loan Bank of New York Notes to Financial Statements Fair Value Hierarchy The FHLBNY records trading securities, equity investments, available-for-sale securities, derivative instruments, and Consolidated obligations and advances elected under the FVO at fair values on a recurring basis. On a non-recurring basis, when held-to-maturity securities are determined to be OTTI, the securities are written down The accounting standards under Fair Value Measurement defines fair value, establishes a consistent framework for measuring fair value and requires disclosures about fair value measurements. Fair value is defined as the price that would be received to sell an asset or paid to transfer a liability in an orderly transaction between market participants at the measurement date. Among other things, the standard requires the FHLBNY to maximize the use of observable inputs and minimize the use of unobservable inputs when measuring fair value. The standard specifies a hierarchy of inputs based on whether the inputs are observable or unobservable. Observable inputs reflect market data obtained from independent sources, while unobservable inputs reflect the FHLBNY’s market assumptions. These two types of inputs have created the following fair value hierarchy, and an entity must disclose the level within the fair value hierarchy in which the measurements are classified for all assets and liabilities measured on a recurring or non-recurring basis: The inputs are evaluated on an overall level for the fair value measurement to be determined. This overall level is an indication of market observability of the fair value measurement for the asset or liability. Changes in the observability of the valuation inputs may result in a reclassification of certain assets or liabilities. These reclassifications are reported as transfers in/out as of the beginning of the quarter in which the changes occur. There were no such transfers in any periods in this report. The availability of observable inputs can vary from product to product and is affected by a wide variety of factors including, for example, the characteristics peculiar to the transaction. To the extent that valuation is based on models or inputs that are less observable or unobservable in the market, the determination of fair value requires more judgment. Accordingly, the degree of judgment exercised by the FHLBNY in determining fair value is greatest for instruments categorized as Level 3. In certain cases, the inputs used to measure fair value may fall into different levels of the fair value hierarchy. In such cases, for disclosure purposes the level in the fair value hierarchy within which the fair value measurement falls is determined based on the lowest level input that is significant to the fair value measurement in its entirety. Summary of Valuation Techniques and Primary Inputs The fair value of a financial instrument that is an asset is defined as the price the FHLBNY would receive to sell the asset in an orderly transaction with market participants. A financial liability’s fair value is defined as the amount that would be paid to transfer the liability to a new obligor, not the amount that would be paid to settle the liability with the creditor. Where available, fair values are based on observable market prices or parameters, or derived from such prices or parameters. Where observable prices are not available, valuation models and inputs are utilized. These valuation techniques involve some level of management estimation and judgment, the degree of which is dependent on the price transparency for the instruments or markets and the instruments’ complexity. Because an Federal Home Loan Bank of New York Notes to Financial Statements active secondary market does not exist for a portion of the FHLBNY’s financial instruments, in certain cases, fair values are not subject to precise quantification or verification and may change as economic and market factors and evaluation of those factors change. For assets and liabilities relevant facts and circumstances that a market participant would consider. Such analysis is also applied in those limited instances where no third-party vendor price or only one third-party vendor price is available in order to arrive at an estimated fair value. In its analysis, the FHLBNY employs the concept of cluster pricing and cluster tolerances. Once the median prices are computed from the three pricing vendors, the second step is to determine which of the sourced prices fall within the required tolerance level interval to the median price, which forms the “cluster” of prices to be averaged. This average will determine a “default” price for the security. The cluster tolerance guidelines shall be reviewed annually and may be revised as necessary. To be included among the cluster, each price must fall within 7 points of the median price for residential private-label MBS or PLMBS (when PLMBS is determined to be OTTI) and within 3 points of the median price for GSE-issued MBS. The final step is to determine the final price of the security based on the cluster average and an evaluation of any outlier prices. If the analysis confirms that an outlier is not representative of fair value and that the average of the vendor prices within the tolerance threshold of the median price is the best estimate, then the average of the vendor prices within the tolerance threshold of the median price is used as the final price. If, on the other hand, an outlier (or some other price identified in the analysis) is determined to be a better estimate of fair value, then the outlier (or the other price as appropriate) is used as the final price. In all cases, the final price is used to determine the fair value of the security. The FHLBNY has also concluded that the pricing vendors use methods that generally employ, but are not limited to benchmark yields, recent trades, dealer estimates, valuation models, benchmarking of like securities, sector groupings, and/or matrix pricing. Based on the FHLBNY’s review processes, management has concluded that inputs into the pricing models employed by pricing services for the FHLBNY’s investments in GSE securities classified as available-for-sale are market based and observable and are considered to be within Level 2 of the fair value hierarchy. Fair values of Mortgage-backed securities deemed OTTI— When a PLMBS is deemed to be OTTI, it is recorded at fair value. The valuation of PLMBS may require pricing services to use significant inputs that are subjective and are considered by management to be within Level 3 of the fair value hierarchy. This determination was made based on management’s view that the private-label instruments may not have an active market because of the specific vintage of the securities as well as inherent conditions surrounding the trading of private-label MBS, so that the inputs may not be market based and observable. Trading Securities — The FHLBNY classifies trading securities as Level 1 of the fair value hierarchy when we use quoted market prices in active markets to determine the fair value of trading securities, such as U.S. government securities. We classify trading securities as Level 2 of the fair value hierarchy when we use quoted market prices in less active markets to determine the fair value of trading securities. Federal Home Loan Bank of New York Notes to Financial Statements Equity Investments — The FHLBNY has a grantor Advances elected under the FVO— When the FHLBNY elects the FVO designation for certain advances, the advances are recorded at their fair values in the Statements of Condition. The fair values are computed using standard option valuation models. The most significant inputs to the valuation model are (1) Consolidated obligation debt curve (CO Curve), published by the Office of Finance and available to the public, and (2) LIBOR swap curves and volatilities. Both these inputs are considered to be market based and observable as they can be directly corroborated by market participants. The CO Curve is the primary input, which is market based and observable. Inputs to apply spreads, which are FHLBNY specific, were not material. Fair values were classified within Level 2 of the valuation hierarchy. The FHLBNY determines the fair values of advances elected under the FVO by calculating the present value of expected future cash flows from the advances, a methodology also referred to as the Income approach under the Fair Value Measurement standards. The discount rates used in these calculations are equivalent to the replacement advance rates for advances with similar terms. In accordance with the Finance Agency’s “Advances” regulations, an advance with a maturity or repricing period greater than six months requires a prepayment fee sufficient to make a FHLBank financially indifferent to the borrower’s decision to prepay the advance. Therefore, the fair value of an advance does not assume prepayment risk. The inputs used to determine fair value of advances elected under the FVO are as follows: Consolidated Obligations elected under the FVO— The FHLBNY estimates the fair values of Consolidated obligations elected under the FVO based on the present values of expected future cash flows due on the debt obligations. Calculations are performed by using the FHLBNY’s industry standard option adjusted valuation models. Inputs are based on the cost of comparable term debt. The FHLBNY’s internal valuation models use standard valuation techniques and estimate fair values based on the following inputs: 169 Federal Home Loan Bank of New York Notes to Financial Statements Derivative Assets and Liabilities— The FHLBNY’s derivatives (cleared derivatives and bilaterally executed derivatives) are executed in the over-the-counter market and are valued using internal valuation techniques as no quoted market prices exist for such instruments. Discounted cash flow analysis is the primary methodology employed by the FHLBNY’s valuation models to measure the fair values of interest rate swaps. The valuation technique is considered as an “Income approach”. Interest rate caps and floors are valued under the “Market approach”. Interest rate swaps and interest rate caps and floors, collectively “derivatives”, were valued in industry-standard option adjusted valuation models, which generated fair values. The valuation models employed multiple market inputs including interest rates, prices and indices to create continuous yield or pricing curves and volatility factors. These multiple market inputs were corroborated by management to independent market data, and to relevant benchmark indices. In addition, derivative valuations were compared by management to counterparty valuations received as part of the collateral exchange process. These derivative positions were classified within Level 2 of the valuation hierarchy at December 31, The FHLBNY’s valuation model utilizes a modifiedBlack-Karasinski methodology. Significant market based and observable inputs into the valuation model include volatilities and interest rates. The Bank’s valuation model employs industry standard market-observable inputs (inputs that are actively quoted and can be validated to external sources). Inputs by class of derivative were as follows: Interest-rate related: Mortgage delivery commitments (considered a derivative)— TBA security prices are adjusted for differences in coupon, average loan rate and seasoning. Management considers the federal funds curve to be a Level 2 input. The FHLBNY’s valuation model utilizes industry standard OIS methodology. The model generates forecasted cash flows using the FF/OIS calibrated 3-month LIBOR curve. The model then discounts the cash flows by the FF/OIS curve to generate fair values. Credit risk and credit valuation adjustments The FHLBNY is subject to credit risk in derivatives transactions due to the potential non-performance of its derivatives counterparties or a DCO. To mitigate this risk, the FHLBNY has entered into master netting agreements and credit support agreements with its derivative counterparties for its bilaterally executed derivative contracts that provide for the delivery of collateral at specified levels at least weekly. The computed fair values of the derivatives took into consideration the effects of legally enforceable master netting agreements that allow the FHLBNY to settle positive and negative positions and offset cash collateral with the same counterparty on a net basis. For derivative transactions executed as a cleared derivative, the transactions are fully collateralized in cash and for the most part exchanged and settled daily with the DCO. The FHLBNY has also established the enforceability of offsetting rights incorporated in the agreements for the cleared derivative transactions. Federal Home Loan Bank of New York Notes to Financial Statements As a result of these practices and agreements and the FHLBNY’s assessment of any change in its own credit spread, the FHLBNY has concluded that the impact of the credit differential between the FHLBNY and its derivative counterparties and DCO was sufficiently mitigated to an immaterial level that no credit adjustments were deemed necessary to the recorded fair value of Derivative assets and Derivative liabilities in the Statements of Condition at December 31, Fair Value Measurement The tables below present the fair value of those assets and liabilities that are recorded at fair value on a recurring or non-recurring basis at December 31, Items Measured at Fair Value on a Recurring Basis (in thousands): December 31, 2018 Total Level 1 Level 2 Level 3 Netting Assets Trading securities GSE securities $ 502,849 $ — $ 502,849 $ — $ — Corporate notes 3,334 — 3,334 — — U.S. Treasury securities 5,304,329 5,304,329 — — — Equity Investments 48,179 48,179 — — — Available-for-sale securities GSE/U.S. agency issued MBS 422,216 — 422,216 — — Derivative assets (a) Interest-rate derivatives 113,705 — 543,442 — (429,737 ) Mortgage delivery commitments 57 — 57 — — Total recurring fair value measurement - assets $ 6,394,669 $ 5,352,508 $ 1,471,898 $ — $ (429,737 ) Liabilities Consolidated obligations: Discount notes (to the extent FVO is elected) $ (3,180,086 ) $ — $ (3,180,086 ) $ — $ — Bonds (to the extent FVO is elected) (b) (5,159,792 ) — (5,159,792 ) — — Derivative liabilities (a) Interest-rate derivatives (31,147 ) — (468,568 ) — 437,421 Total recurring fair value measurement - liabilities $ (8,371,025 ) $ — $ (8,808,446 ) $ — $ 437,421 December 31, 2017 Total Level 1 Level 2 Level 3 Netting Assets Trading securities GSE securities $ 356,899 $ — $ 356,899 $ — $ — U.S. Treasury securities 1,284,669 1,284,669 — — — Available-for-sale securities GSE/U.S. agency issued MBS 528,627 — 528,627 — — Equity and bond funds 48,642 48,642 — — — Advances (to the extent FVO is elected) 2,205,624 — 2,205,624 — — Derivative assets (a) Interest-rate derivatives 112,732 — 414,613 — (301,881 ) Mortgage delivery commitments 10 — 10 — — Total recurring fair value measurement - assets $ 4,537,203 $ 1,333,311 $ 3,505,773 $ — $ (301,881 ) Liabilities Consolidated obligations: Discount notes (to the extent FVO is elected) $ (2,312,621 ) $ — $ (2,312,621 ) $ — $ — Bonds (to the extent FVO is elected) (b) (1,131,074 ) — (1,131,074 ) — — Derivative liabilities (a) Interest-rate derivatives (61,592 ) — (325,877 ) — 264,285 Mortgage delivery commitments (15 ) — (15 ) — — Total recurring fair value measurement - liabilities $ (3,505,302 ) $ — $ (3,769,587 ) $ — $ 264,285 Federal Home Loan Bank of New York Notes to Financial Statements Items Measured at Fair Value on a Non-recurring Basis (in thousands): During the period ended December 31, 2018 Fair Value Level 1 Level 2 Level 3 Mortgage loans held-for-portfolio $ 741 $ — $ 741 $ — Real estate owned 795 — — 795 Total non-recurring assets at fair value $ 1,536 $ — $ 741 $ 795 During the period ended December 31, 2017 Fair Value Level 1 Level 2 Level 3 Mortgage loans held-for-portfolio $ 2,519 $ — $ 2,519 $ — Real estate owned 1,071 — — 1,071 Total non-recurring assets at fair value $ 3,590 $ — $ 2,519 $ 1,071 Mortgage loans and real estate owned (OREO or REO) — The FHLBNY measured and recorded certain impaired mortgage loans and Real estate owned (foreclosed properties) on a non-recurring basis. These assets were subject to fair value adjustments in certain circumstances at the occurrence of the events during the periods in this report. Impaired loans were primarily loans that were delinquent for 180 days or more, partially charged-off, with the remaining loans recorded at their collateral values at the dates the loans were charged off. Fair value adjustments on the impaired loans and real estate owned assets were based primarily on broker price opinions. In accordance with disclosure provisions, we have reported changes in fair values of such assets as of the date the fair value adjustments were recorded during the Fair Value Option Disclosures The fair value option (FVO) provides an irrevocable option to elect fair value as an alternative measurement for selected financial assets, financial liabilities, unrecognized firm commitments, and written loan commitments not previously carried at fair value. It requires entities to display the fair value of those assets and liabilities for which the entity has chosen to use fair value on the face of the Statements of Condition. Fair value is used for both the initial and subsequent measurement of the designated assets, liabilities and commitments, with the changes in fair value recognized in net income. Interest income and interest expense on advances and Consolidated obligations at fair value are recognized solely on the contractual amount of interest due or unpaid. Any transaction fees or costs are immediately recognized into non-interest income or non-interest expense. For instruments for which the fair value option has been elected, the related contractual interest income, contractual interest expense and the discount amortization on fair value option discount notes are recorded as part of net interest income in the Statements of Income. The remaining changes in fair value for instruments for which the fair value option has been elected are recorded as net gains (losses) on financial instruments held under fair value option in the Statements of Income. The change in fair value does not include changes in instrument-specific credit risk. The FHLBNY has determined that no adjustments to the fair values of its instruments recorded under the fair value option for instrument-specific credit risk were necessary at December 31, Federal Home Loan Bank of New York Notes to Financial Statements From time to time, the FHLBNY will elect the FVO for advances and Consolidated obligations on an instrument-by-instrument basis, with changes in fair value reported in earnings. No advances elected under the FVO were outstanding at December 31, 2019 and December 31, 2018. The following tables summarize the activity related to financial instruments for which the FHLBNY elected the fair value option (in thousands): Years ended December 31, 2018 Advances Bonds Discount Notes Balance, beginning of the period $ 2,205,624 $ (1,131,074 ) $ (2,312,621 ) New transactions elected for fair value option — (5,225,000 ) (4,735,290 ) Maturities and terminations (2,200,000 ) 1,215,000 3,873,993 Net gains (losses) on financial instruments held under fair value option (590 ) 681 118 Change in accrued interest/unaccreted balance (5,034 ) (19,399 ) (6,286 ) Balance, end of the period $ — $ (5,159,792 ) $ (3,180,086 ) Years ended December 31, 2017 Advances Bonds Discount Notes Balance, beginning of the period $ 9,873,157 $ (2,052,513 ) $ (12,228,412 ) New transactions elected for fair value option 5,000,000 (1,100,000 ) (5,980,042 ) Maturities and terminations (12,659,567 ) 2,019,550 15,875,322 Net gains (losses) on financial instruments held under fair value option (5,142 ) 224 378 Change in accrued interest/unaccreted balance (2,824 ) 1,665 20,133 Balance, end of the period $ 2,205,624 $ (1,131,074 ) $ (2,312,621 ) Years ended December 31, 2016 Advances Bonds Discount Notes Balance, beginning of the period $ 9,532,553 $ (13,320,909 ) $ (12,471,868 ) New transactions elected for fair value option 8,304,504 (2,295,300 ) (23,022,995 ) Maturities and terminations (7,979,746 ) 13,568,410 23,277,806 Net gains (losses) on financial instruments held under fair value option 12,744 (10,234 ) (4,364 ) Change in accrued interest/unaccreted balance 3,102 5,520 (6,991 ) Balance, end of the period $ 9,873,157 $ (2,052,513 ) $ (12,228,412 ) Federal Home Loan Bank of New York Notes to Financial Statements The following tables present the change in fair value included in the Statements of Income for financial instruments for which the fair value option has been elected (in thousands): December 31, 2018 Interest Income Net Gains Total Change in Fair Advances $ 10,085 $ (590 ) $ 9,495 December 31, 2017 Interest Income Net Gains Total Change in Fair Advances $ 54,023 $ (5,142 ) $ 48,881 December 31, 2016 Interest Income Net Gains Total Change in Fair Advances $ 78,787 $ 12,744 $ 91,531 December 31, 2018 Interest Expense Net Gains Total Change in Fair Consolidated obligation bonds $ (25,077 ) $ 681 $ (24,396 ) Consolidated obligation discount notes (21,617 ) 118 (21,499 ) $ (46,694 ) $ 799 $ (45,895 ) December 31, 2017 Interest Expense Net Gains Total Change in Fair Consolidated obligation bonds $ (6,436 ) $ 224 $ (6,212 ) Consolidated obligation discount notes (27,519 ) 378 (27,141 ) $ (33,955 ) $ 602 $ (33,353 ) December 31, 2016 Interest Expense Net Gains Total Change in Fair Consolidated obligation bonds $ (22,339 ) $ (10,234 ) $ (32,573 ) Consolidated obligation discount notes (54,557 ) (4,364 ) (58,921 ) $ (76,896 ) $ (14,598 ) $ (91,494 ) Federal Home Loan Bank of New York Notes to Financial Statements The following tables compare the aggregate fair value and aggregate remaining contractual principal balance outstanding of financial instruments for which the fair value option has been elected (in thousands): December 31, 2018 Aggregate Aggregate Fair Fair Value Advances (a) $ — $ — $ — Consolidated obligation bonds (b) $ 5,140,000 $ 5,159,792 $ 19,792 Consolidated obligation discount notes (c) 3,170,915 3,180,086 9,171 $ 8,310,915 $ 8,339,878 $ 28,963 December 31, 2017 Aggregate Aggregate Fair Fair Value Advances (a) $ 2,200,000 $ 2,205,624 $ 5,624 Consolidated obligation bonds (b) $ 1,130,000 $ 1,131,074 $ 1,074 Consolidated obligation discount notes (c) 2,309,618 2,312,621 3,003 $ 3,439,618 $ 3,443,695 $ 4,077 December 31, 2016 Aggregate Aggregate Fair Fair Value Advances (a) $ 9,859,504 $ 9,873,157 $ 13,653 Consolidated obligation bonds (b) $ 2,049,550 $ 2,052,513 $ 2,963 Consolidated obligation discount notes (c) 12,204,898 12,228,412 23,514 $ 14,254,448 $ 14,280,925 $ 26,477 Consolidated obligations — The FHLBanks have joint and several liability for all the Consolidated obligations issued on their behalf. Accordingly, should one or more of the FHLBanks be unable to repay their participation in the Consolidated obligations, each of the other FHLBanks could be called upon to repay all or part of such obligations, as determined or approved by the Finance Agency. Neither the FHLBNY nor any other FHLBank has ever had to assume or pay the Consolidated obligations of another FHLBank. The FHLBNY does not believe that it will be called upon to pay the Consolidated obligations of another FHLBank in the future. Under the provisions of accounting standards for guarantees, the FHLBNY would have been required to recognize the fair value of the FHLBNY’s joint and several liability for all the Consolidated obligations, as discussed above. However, the FHLBNY considers the joint and several liabilities as similar to a related party guarantee, which meets the scope exception under the accounting standard for guarantees. Accordingly, the FHLBNY has not recognized the fair value of a liability for its joint and several obligations related to other FHLBanks’ Consolidated obligations, which in aggregate were par amounts of $1.0 trillion as of December 31, Federal Home Loan Bank of New York Notes to Financial Statements MPF Program — Under the MPF program, the FHLBNY was unconditionally obligated to purchase Derivative contracts Deposits— The FHLBNY had pledged Lease contracts — The FHLBNY charged to operating expenses net rental costs of approximately $7.1 million, Affordable Housing Program — The 11 FHLBanks are expected to contribute $100 million in aggregate annually to the AHP. If the aggregate assessment is less than $100 million for all the FHLBanks, each FHLBank would be required to assure that the aggregate contributions of the FHLBanks equal $100 million. The proration would be made on the basis of Federal Home Loan Bank of New York Notes to Financial Statements The following table summarizes contractual obligations and contingencies as of December 31, December 31, 2018 Payments Due or Expiration Terms by Period Greater Than Greater Than Less Than One Year Three Years Greater Than One Year to Three Years to Five Years Five Years Total Contractual Obligations Consolidated obligation bonds at par (a) $ 64,893,475 $ 10,141,870 $ 3,616,985 $ 5,105,650 $ 83,757,980 Consolidated obligation discount notes at par 50,805,481 — — — 50,805,481 Mandatorily redeemable capital stock (a) 229 1,068 425 4,123 5,845 Premises (lease obligations) (b) 5,623 13,746 14,303 72,396 106,068 Remote backup site 1,503 267 — — 1,770 Other liabilities (c) 279,631 9,812 7,922 58,476 355,841 Total contractual obligations 115,985,942 10,166,763 3,639,635 5,240,645 135,032,985 Other commitments Standby letters of credit (d) 19,939,508 12,847 6,598 — 19,958,953 Consolidated obligation bonds/discount notes traded not settled 54,690 — — — 54,690 Commitments to fund additional advances 200,000 — — — 200,000 Commitments to fund pension 9,321 — — — 9,321 Open delivery commitments (MPF) 12,682 — — — 12,682 Total other commitments 20,216,201 12,847 6,598 — 20,235,646 Total obligations and commitments $ 136,202,143 $ 10,179,610 $ 3,646,233 $ 5,240,645 $ 155,268,631 The FHLBNY does not anticipate any credit losses from its off-balance sheet commitments and accordingly no provision for losses Federal Home Loan Bank of New York Notes to Financial Statements Operating Lease commitments Effective January 1, 2019, the FHLBNY adopted new guidance under ASU 2016-02, Leases (Topic 842) that requires lessees to recognize on the balance sheet all leases with lease terms greater than twelve months as a lease liability with a corresponding right-of-use (ROU) asset. Legacy operating lease contracts were recorded at adoption that resulted in the recognition of lease liabilities of $83.9 million and ROU assets of $71.6 million as of January 1, 2019. The adoption of the new lease guidance did not have a material impact on the FHLBNY’s Statements of income. The change in accounting due to the adoption of the new lease guidance did not result in a material change to the future net minimum rental payments/receivables or to the net rental expense when compared to December 31, 2018. At December 31, 2019, the FHLBNY was obligated under a number of noncancelable leases, predominantly operating leases for premises. These leases generally have terms of 15 years or less that contain escalation clauses that will increase rental payments. Operating leases also include backup datacenters and certain office equipment. Operating lease liabilities and ROU are recognized at the lease commencement date based on the present value of the future minimum lease payments over the lease term. The future lease payments are discounted at a rate that represents the FHLBNY’s borrowing rate for its own debt (Consolidated obligation bonds) of a similar term. ROU includes any lease prepayments made, plus any initial direct costs incurred, less any lease incentives received. Rental expense associated with operating leases is recognized on a straight-line basis over the lease term. Premise rental expense is included in occupancy expense, and datacenter and other lease expenses are included in other operating expense in the Statements of income. ROU and lease liabilities are reported in the Statements of condition. The following tables provide summarized information on our leases (dollars in thousands): Federal Home Loan Bank of New York Notes to Financial Statements The FHLBNY is a cooperative and the members own almost all of the stock of the FHLBNY. Stock issued and outstanding that is not owned by members is held by former members. The majority of the members of the Board of Directors of the FHLBNY are elected by and from the membership. The FHLBNY conducts its advances business almost exclusively with members, and considers its transactions with its members and non-member stockholders as related party transactions in addition to transactions with other FHLBanks, the Office of Finance, and the Finance Agency. The FHLBNY conducts all transactions with members and non-members in the ordinary course of business. All transactions with all members, including those whose officers may serve as directors of the FHLBNY, are at terms that are no more favorable than comparable transactions with other members. The FHLBNY may from time to time borrow or sell overnight and term federal funds at market rates to members. Debt Assumptions and Transfers.When debt is transferred or assumed, the transactions would be executed in the ordinary course of the FHLBNY’s business and at negotiated market pricing. Debt assumptions — No debt was assumed from another FHLBank in the twelve months ended December 31, Debt transfers — No debt was transferred to another FHLBank in the twelve months ended December 31, Advances Sold or Transferred No advances were transferred or sold to the FHLBNY or from the FHLBNY to another FHLBank in any periods in this report. When an advance is transferred or assumed, the transactions would be executed in the ordinary course of the FHLBNY’s business and at negotiated market pricing. MPF Program In the MPF program, the FHLBNY may participate to the FHLBank of Chicago portions of its purchases of mortgage loans from its members. Transactions are participated at market rates. Since 2004, the FHLBNY has not shared its purchases with the FHLBank of Chicago. From the inception of the program through 2004, the cumulative share of MPF Chicago’s participation in the FHLBNY’s MPF loans that has remained outstanding was Fees paid to the FHLBank of Chicago for providing MPF program services were approximately $2.5 million, $2.6 million Mortgage-backed Securities No mortgage-backed securities were acquired from other FHLBanks during the periods in this report. We pay an annual fee of $6.0 thousand to the FHLBank of Chicago for the use of MBS cash flow models in connection with OTTI analysis performed by the FHLBNY for certain of our private-label MBS. Intermediation From time to time, the FHLBNY acts as an intermediary to purchase derivatives to accommodate its smaller members. At December 31, Federal Home Loan Bank of New York Notes to Financial Statements Loans to Other Federal Home Loan Banks In the twelve months ended December 31, Borrowings from Other Federal Home Loan Banks The FHLBNY borrows from other FHLBanks, generally for a period of one day. In the twelve months ended December 31, 2019, the FHLBNY borrowed a total of $2.1 billion in overnight loans from other FHLBanks. The borrowings averaged $6.6 million for the twelve months ended December 31, 2019. Interest expense was immaterial. There were no borrowings from other FHLBanks in the twelve Cash and Due from Banks The following tables summarize significant balances and transactions with related parties at December 31, Related Party: Outstanding Assets, Liabilities and Capital December 31, 2018 December 31, 2017 Related Related Assets Advances $ 105,178,833 $ 122,447,805 Loans to other FHLBanks 250,000 — Accrued interest receivable 202,404 175,926 Liabilities and capital Deposits $ 1,062,637 $ 1,196,055 Mandatorily redeemable capital stock 5,845 19,945 Accrued interest payable 373 443 Affordable Housing Program (a) 161,718 131,654 Other liabilities (b) 86,095 84,194 Capital $ 7,746,622 $ 8,241,038 Federal Home Loan Bank of New York Notes to Financial Statements Related Party: Income and Expense Transactions Years ended December 31, 2018 2017 2016 Related Related Related Interest income Advances $ 2,522,040 $ 1,563,322 $ 919,890 Interest-bearing deposits 5 2 — Mortgage loans held-for-portfolio — — 1 Loans to other FHLBanks 130 26 33 Interest expense Deposits $ 17,816 $ 15,060 $ 3,091 Mandatorily redeemable capital stock 964 1,285 1,617 Cash collateral held and other borrowings — 26 — Service fees and other $ 14,439 $ 12,251 $ 10,984 The FHLBNY manages its operations as a single business segment. Management and the FHLBNY’s Board of Directors review enterprise-wide financial information in order to make operating decisions and assess performance. Advances to large members constitute a significant percentage of the FHLBNY’s advance portfolio and its source of revenues. The FHLBNY’s total assets and capital could significantly decrease if one or more large members were to withdraw from membership or decrease business with the FHLBNY. Members might withdraw or reduce their business as a result of consolidating with an institution that was a member of another FHLBank, or for other reasons. The FHLBNY has considered the impact of losing one or more large members. In general, a withdrawing member would be required to repay all indebtedness prior to the redemption of its capital stock. Under current conditions, the FHLBNY does not expect the loss of a large member to impair its operations, since the FHLBank Act, as amended, does not allow the FHLBNY to redeem the capital of an existing member if the redemption would cause the FHLBNY to fall below its capital requirements. Consequently, the loss of a large member should not result in an inadequate capital position for the FHLBNY. However, such an event could reduce the amount of capital that the FHLBNY has available for continued growth. This could have various ramifications for the FHLBNY, including a possible reduction in net income and dividends, and a lower return on capital stock for remaining members. The top ten advance holders at December 31, December 31, 2018 Percentage of Par Total Par Value Twelve Months City State Advances of Advances Interest Income Percentage (a) Citibank, N.A. New York NY $ 19,995,000 18.96 % $ 644,926 37.66 % Metropolitan Life Insurance Company New York NY 14,245,000 13.51 301,318 17.60 New York Community Bank (b) (c) Westbury NY 13,053,661 12.38 247,973 14.48 Signature Bank New York NY 4,970,000 4.71 92,592 5.41 Investors Bank (b) Short Hills NJ 4,925,681 4.67 95,921 5.60 Sterling National Bank Montebello NY 4,837,000 4.59 92,835 5.42 Manufacturers and Traders Trust Company Buffalo NY 4,774,712 4.53 13,256 0.77 AXA Equitable Life Insurance Company New York NY 3,990,415 3.78 72,582 4.24 New York Life Insurance Company New York NY 3,575,000 3.39 67,793 3.96 Valley National Bank (b) Wayne NJ 3,027,000 2.87 83,172 4.86 Total $ 77,393,469 73.39 % $ 1,712,368 100.00 % Federal Home Loan Bank of New York Notes to Financial Statements December 31, 2017 Percentage of Par Total Par Value Twelve Months City State Advances of Advances Interest Income Percentage (a) Citibank, N.A. New York NY $ 43,100,000 35.12 % $ 450,596 36.83 % Metropolitan Life Insurance Company New York NY 14,445,000 11.77 221,310 18.09 New York Community Bancorp, Inc.: New York Community Bank Westbury NY 11,830,600 9.64 182,103 14.88 New York Commercial Bank Westbury NY 273,900 0.22 3,822 0.31 Subtotal New York Community Bancorp, Inc. 12,104,500 9.86 185,925 15.19 Sterling National Bank (b)(d) Montebello NY 4,507,000 3.67 58,049 4.74 Investors Bank (b) Short Hills NJ 4,326,053 3.53 82,894 6.77 Signature Bank New York NY 4,195,000 3.42 36,503 2.98 Goldman Sachs Bank USA New York NY 3,390,000 2.76 30,433 2.49 HSBC Bank USA, National Association (c) Mc Lean VA 3,100,000 2.53 68,391 5.59 AXA Equitable Life Insurance Company New York NY 3,000,415 2.45 52,308 4.27 New York Life Insurance Company New York NY 2,625,000 2.14 37,263 3.05 Total $ 94,792,968 77.25 % $ 1,223,672 100.00 % December 31, 2016 Percentage of Par Total Par Value Twelve Months City State Advances of Advances Interest Income Percentage (a) Citibank, N.A. New York NY $ 33,551,388 30.71 % $ 188,265 22.73 % Metropolitan Life Insurance Company New York NY 14,445,000 13.22 202,428 24.44 New York Community Bancorp, Inc.: New York Community Bank Westbury NY 11,380,600 10.42 166,832 20.15 New York Commercial Bank Westbury NY 283,900 0.26 5,249 0.63 Subtotal New York Community Bancorp, Inc. 11,664,500 10.68 172,081 20.78 HSBC Bank USA, National Association (c) McLean VA 5,700,000 5.22 62,770 7.58 Investors Bank (b) Short Hills NJ 4,409,420 4.04 69,571 8.40 Goldman Sachs Bank USA New York NY 2,425,000 2.22 23,753 2.87 New York Life Insurance Company New York NY 2,275,000 2.08 24,816 3.00 AXA Equitable Life Insurance Company New York NY 2,238,498 2.05 18,879 2.28 Astoria Bank (b) Lake Success NY 2,090,000 1.91 41,007 4.95 Signature Bank New York NY 2,050,900 1.88 24,565 2.97 Total $ 80,849,706 74.01 % $ 828,135 100.00 % Federal Home Loan Bank of New York Notes to Financial Statements The following tables summarize capital stock held by members who were beneficial owners of more than 5 percent of the FHLBNY’s outstanding capital stock as of February Number Percent February 28, 2019 of Shares of Total Name of Beneficial Owner Principal Executive Office Address Owned Capital Stock Citibank, N.A. 399 Park Avenue, New York, NY, 10043 9,548 17.18 % Metropolitan Life Insurance Company 200 Park Avenue, New York, NY, 10166 7,237 13.02 New York Community Bank 615 Merrick Avenue, Westbury, NY, 11590 5,894 10.61 22,679 40.81 % Number Percent December 31, 2018 of Shares of Total Name of Beneficial Owner Principal Executive Office Address Owned Capital Stock Citibank, N.A. 399 Park Avenue, New York, NY, 10043 11,145 18.36 % Metropolitan Life Insurance Company 200 Park Avenue, New York, NY, 10166 7,237 11.92 New York Community Bank 615 Merrick Avenue, Westbury, NY, 11590 6,446 10.62 24,828 40.90 % Management’s Report on Internal Control over Financial Reporting and the Report of Independent Registered Public Accounting Firm thereon are set forth in Part II, Item 8 of the Annual Report on Form 10-K and incorporated herein by reference. None 184 The FHLBank Act, as amended by the Housing and Economic Recovery Act of 2008 (“HERA”), provides that a FHLBank’s board of directors is to comprise thirteen Directors, or such other number as the Director of the Federal Housing Finance Agency (“Finance Agency” or “FHFA”) determines appropriate. For both 2018 and 2019, the FHFA Director designated nineteen directorships for us, eleven of which were Member Directorships and eight of which were Independent Directorships. All individuals serving as Bank Directors must be United States citizens. A majority of the directors serving on the Board must be Member Directors and at least two-fifths must be Independent Directors. A Member Directorship may be held only by an officer or director of a member institution that is located within our district and that meets all minimum regulatory capital requirements. There are no other qualification requirements for Member Directors apart from the foregoing. Member Directors are, generally speaking, elected by our stockholders in, respectively, New York, New Jersey, Puerto Rico and the U.S. Virgin Islands. Our Board of Directors is ordinarily not permitted to nominate or elect Member Directors; however, the Board may appoint a director to fill a vacant Member Directorship in the event that no nominations are received from members in the course of the Member Director election process. In the event that only one nomination is received from members for an open Member Directorship, that nominee will automatically be declared elected by the Bank. (The Board may also take action to fill Member Directorship vacancies that arise for other reasons.) Each member institution that is required to hold stock as of the record date, which is December 31 of the year prior to the year in which the election is held, may nominate and/or vote for representatives from member institutions in its respective state to fill open Member Directorships. The Finance Agency’s election regulation provides that none of our directors, officers, employees, attorneys or agents, other than in a personal capacity, may support the nomination or election of a particular individual for a Member Directorship. Because of the process described above pertaining to how Member Directors are nominated and elected, we do not know what particular factors our member institutions may consider in nominating particular candidates for Member Directorships or in voting to elect Member Directors. However, if the Board takes action to fill a vacant Member Directorship, we can know what was considered in electing such Director. In general, such considerations may include satisfaction of the regulatory qualification requirements for the Directorship, the nature of the person’s experience in the financial industry and at a member institution, knowledge of the person by various members of the Board, and previous service on the Board, if any. In contrast to the requirements pertaining to Member Directorships, an Independent Directorship may, per FHFA regulations, be held, generally speaking, only by an individual who is a bona fide resident of our district, who is not a director, officer, or employee of a member institution or of any person that receives advances from us, and who is not an officer of any FHLBank. At least two Independent Directors must be “public interest” directors. Public interest directors, as defined by Finance Agency regulations, are Independent Directors who have at least four years of experience representing consumer or community interests in banking services, credit needs, housing or consumer financial protection. Pursuant to Finance Agency regulations, each Independent Director must either satisfy the aforementioned requirements to be a public interest director, or have knowledge or experience in one or more of the following areas: auditing and accounting, derivatives, financial management, organizational management, project development, risk management practices, and the law. Any individual may submit an Independent Director application form and request to be considered by us for inclusion on the Independent Director nominee slate. Our Board of Directors is then required by Finance Agency regulations to consult with our Affordable Housing Advisory Council (“Advisory Council”) in establishing the nominee slate. (The Advisory Council is an advisory body consisting of fifteen persons residing in our district appointed by our Board, the members of which are drawn from community and not-for-profit organizations that are actively involved in providing or promoting low and moderate income housing or community lending. The Advisory Council provides advice on ways in which we can better carry out our housing finance and community lending mission.) After the nominee slate is approved by the Board, the slate is then presented to our membership for a district-wide vote. The election regulation permits our directors, officers, attorneys, employees, agents, and Advisory Council to support the candidacy of the board of director’s nominees for Independent Directorships. (As is the case with Member Directorships, the Board may also take action to fill a vacancy of an Independent Directorship.) The Bank encourages diversity on its Board of Directors and encourages minorities and women to consider service as Bank Directors. Voting rights and processes with regard to the election of Member and Independent Directors are set forth in the FHLBank Act and FHFA regulations. For the election of both Member Directors and Independent Directors, each eligible member institution is entitled to cast one vote for each share of capital stock that it was required to hold as of the record date (which is December The following table sets forth information regarding each of the directors who served on our Board during the period from January 1, Following the table is biographical information for each Director. No Director has any family relationship with any other FHLBNY Directors or executive officers. In addition, no Director or executive officer has an involvement in any legal proceeding required to be disclosed pursuant to Item 401(f) of Regulation S-K. Director Name Age as of Bank Start of Expiration Represents Director Type John R. Buran (Chair) 12/2010 1/1/ 12/31/ NY Member Larry E. Thompson (Vice Chair) 1/2014 1/1/18 12/31/21 Districtwide Independent Kevin Cummings 1/2014 1/1/19 12/31/22 NJ Member Joseph R. Ficalora 1/2018 1/1/18 12/31/21 NY Member Jay M. Ford 6/2008 1/1/17 12/31/20 NJ Member Michael M. Horn 4/2007 1/1/18 12/31/21 Districtwide Independent Thomas L. Hoy 1/2012 1/1/ 12/31/ NY Member David R. Huber 1/2019 1/1/19 12/31/22 Districtwide Independent Charles E. Kilbourne, III 1/2019 1/1/19 12/31/20 Districtwide Independent* Gerald H. Lipkin 1/2014 1/1/18 12/31/21 NJ Member Kenneth J. Mahon 1/2017 1/1/17 12/31/20 NY Member Christopher P. Martin 1/2015 1/1/19 12/31/22 NJ Member Richard S. Mroz 3/2002 1/1/19 12/31/22 Districtwide Independent David J. Nasca 1/2015 1/1/19 12/31/22 NY Member C. Cathleen Raffaeli 4/2007 1/1/17 12/31/20 Districtwide Independent Stephen S. Romaine 1/2019 1/1/19 12/31/20 NY Member DeForest B. Soaries, Jr. 1/2009 1/1/ 12/31/ Districtwide Independent* Carlos J. Vázquez 11/2013 1/1/18 12/31/21 PR & USVI Member Ángela Weyne Independent Mr. Buran Mr. Thompson (Vice Chair) was Vice Chairman of The Depository Trust & Clearing Corporation (DTCC) through the end of 2018, and previously served as the Chief Legal Officer/General Counsel of the firm since 2005. He has more than 30 years of experience as a senior executive in corporate law, risk management and regulatory affairs. In his role as DTCC Vice Chairman, Mr. Thompson served as a senior advisor to DTCC and was responsible for all legal and regulatory activities of the company and its subsidiaries. He regularly interfaced with government and regulatory agencies on issues impacting the company. Mr. Thompson was Chairman of the Board of DTCC Deriv/SERV LLC and former Chairman of the DTCC Operating Committee. He was a member of the DTCC Management Committee, which is comprised of the company’s executive leadership. In addition, Mr. Thompson was a member of the DTCC Management Risk Committee, where he helped oversee and assess a broad range of issues related to market, capital and operational risks facing the corporation. Mr. Thompson previously served as Chair of a DTCC Board subcommittee charged with reviewing the potential risk impacts of high frequency trading and algorithmic trading as a result of the Knight Capital market event of 2012. Mr. Thompson is the former Co-Chair of the DTCC Internal Risk Management Committee and former Chairman of The Depository Trust Company (DTC) Internal Risk Management Committee. Mr. Thompson began his legal career with DTC as Associate Counsel in 1981 and was elected Vice President and Deputy General Counsel in 1991, Senior Vice President in 1993, General Counsel of DTC in 1999 and Managing Director and First Deputy General Counsel of DTCC in 2004. Previously, he was a partner in the New York law firm of Lake, Bogan, Lenoir, Jones & Thompson. Mr. Thompson began his legal career at Davis Polk & Wardwell. Mr. Thompson previously served on the Board of Directors of New York Portfolio Clearing (NYPC), a former joint venture derivatives clearinghouse owned by NYSE Euronext and DTCC. In addition, he also served as former Chairman of the Securities Clearing Group and former Co-Chairman of the Unified Clearing Group. His memberships include the New York State Bar Association; the New York County Lawyers’ Association; Association of the Bar of the City of New York; Business Executives for National Security; and the Global Association of Risk Professionals. He is a former director of the Legal Aid Society of New York and a former director of The Studio Museum of Harlem. Mr. Thompson’s legal and regulatory and risk management experience, as indicated by his background described above, supports his qualifications to serve on our Board as an Independent Director. 188 Mr. Cummings was appointed Chairman of the Board of Directors and Chief Executive Officer of Investors Bancorp and FHLBNY member Investors Bank effective May 22, 2018. He previously served as President and Chief Executive Officer of these companies since January 1, 2008 and was appointed to serve on the boards of these companies on the same date. Prior to 2008, he served as Executive Vice President and Chief Operating Officer of Investors Bank since July 2003. Prior to joining Investors Bank, Mr. Cummings had a 26-year career with the independent accounting firm of KPMG LLP, where he had been partner for 14 years. Immediately prior to joining Investors Bank, he was an audit partner in KPMG’s Financial Services practice in their New York City office and lead partner on a major commercial banking client. Mr. Cummings also worked in the New Jersey community bank practice for over 20 years. Mr. Cummings has a Bachelor’s degree in Economics from Middlebury College and a Master’s degree in Business Administration from Rutgers University. Mr. Cummings has served as a Commissioner on the Summit Board of Recreation. He is a Trustee of The Scholarship Fund for Inner-City Children Mr. Ficalora has been the President and Chief Executive Officer and a Director of New York Community Bancorp, Inc. (“NYCB”) since its inception on July 20, 1993. He has also been the President and Chief Executive Officer and a Director of FHLBNY member and NYCB primary subsidiary New York Community Bank (“New York Community”) 189 Mr. Ford serves as a director of FHLBNY member Crest Savings Bank, headquartered in Wildwood, New Jersey; he also served as President and CEO of the company from 1993 until his retirement on January 3, 2018. He has worked in the financial services industry in southern New Jersey for more than fifty years. Mr. Ford served as the 2003-2004 Chairman of the New Jersey League of Community Bankers. Mr. Ford served as Chairman of the Community Bank Council of the Federal Reserve Bank of Philadelphia in 1998-1999. He also served on the board of directors of America’s Community Bankers (“ACB”) and on ACB’s Audit and Finance & Investment Committees. Mr. Ford served on the board of the Cape Regional Medical Center Foundation and has previously served as a director and treasurer of Habitat for Humanity, Cape May County, as Divisional Chairman of the March of Dimes for Atlantic and Cape May Counties, and as a Director of the Atlantic Cape Community College Foundation. In December 2000, he was appointed by Governor Christine Todd Whitman to the New Jersey Department of Banking & Insurance Study Commission. Mr. Ford is a graduate of Marquette University with a degree in accounting and is a member of the American Institute of Certified Public Accountants and the New Jersey Society of CPAs. Mr. Horn has been a partner in the law firm of McCarter & English, LLP since 1990. He has served as the Commissioner of Banking for the State of New Jersey and as the New Jersey State Treasurer. He was also a member of the New Jersey State Assembly and served as a member of the Assembly Banking Committee. In addition, Mr. Horn served on New Jersey’s Executive Commission on Ethical Standards as both its Vice Chair and Chairman, was appointed as a State Advisory Member of the Federal Financial Institutions Examination Council, and was a member of the Municipal Securities Rulemaking Board. He is counsel to the New Jersey Bankers Association, was chairman of the Bank Regulatory Committee of the Banking Law Section of the New Jersey State Bar Association, and is a Fellow of the American Bar Foundation. Mr. Horn’s legal and regulatory experience, as indicated by his background described above, supports his qualifications to serve on our Board as an Independent Director. Mr. Hoy serves as Chairman of FHLBNY member Glens Falls National Bank and Trust Company; he also served as CEO of the company through December 31, 2012. He is also Chairman of Arrow Financial Corporation, the holding company for Glens Falls National Bank and Trust Company and FHLBNY member Saratoga National Bank and Trust Company; he served as President of the company through June 30, 2012 and CEO of the company through December 31, 2012. He also became a director of North Country Mutual Funds in 2015. Mr. Hoy joined Glens Falls National Bank in 1974 as a Management Trainee and became President of the Bank on January 1, 1995. He became President of Arrow in 1996 and CEO in 1997. Mr. Hoy is a graduate of Cornell University and has been active in various banking organizations, including serving as past President of the Independent Bankers Association of New York, past Chairman of the New York Bankers Association, and past member of the American Bankers Association Board of Directors. Mr. Hoy served four years on active duty in the Navy as a Surface Warfare Officer on various destroyers, and retired after twenty years as a Commander in the U.S. Naval Reserve. He has been extremely active in his community, serving on numerous Boards and leading several community fundraising efforts. He has been recognized for his community service with the J. Walter Juckett Award from the Adirondack Regional Chambers of Commerce, the Twin Rivers Council’s Good Scout Award, the C.R. Wood Theater’s Charles R. Wood Award, the Warren County Bar Association Liberty Bell Award, and the Henry Crandall Award from the Crandall Public Library. Mr. Huber 190 Mr. Kilbourne is a Managing Director of the Financial Services Volunteer Corps (FSVC), a not-for-profit, private-public partnership that helps to build sound financial systems in transition and emerging market countries. As a member of FSVC’s executive management team, he has extensive experience working to strengthen central banking capabilities, and to develop commercial banking systems and securities markets. Mr. Kilbourne is an officer of FSVC serving as Secretary of the Corporation. Mr. Kilbourne previously served as Senior Advisor to the Commissioner of New York State Homes and Community Renewal, and later as Vice President of the Financial Services Forum, a public-policy organization composed of CEOs from the largest, most diversified financial services institutions based in the United States. Mr. Kilbourne is a Trustee of the Wright Family Foundation in Schenectady, New York, and serves on the Board of Directors of the Boys and Girls Clubs of Schenectady. He is the President of the Board of Directors of Better Community Neighborhoods, Inc. based in Schenectady. He is a member of the Council on Foreign Relations. Mr. Kilbourne holds a Bachelor’s degree in Political Science from Tufts University, and a Master’s degree in International Affairs from Georgetown University. Mr. Kilbourne’s project development and financial management experience, as indicated by his background described above, supports his qualifications to serve on our Board as an Independent Director and a public interest director. Mr. Lipkin is the Chairman of FHLBNY member Valley National Bank as well as holding company Valley National Bancorp. He joined Valley in 1975 as a Senior Vice President and was elected a Director in 1986. He was promoted to Executive Vice President in 1987 and elected Chairman and Chief Executive Officer in 1989. The title of President was added in 1996; he held this title through January of 2017. In 2013, he was elected as a Class A director to the Federal Reserve Bank of New York. Mr. Lipkin’s career in the banking industry spans 54 years. He began his career in banking with the Comptroller of the Currency in New York/New Jersey in 1963 and was appointed Deputy Regional Administrator in 1970. Beyond his business accomplishments, Mr. Lipkin’s philanthropic contributions are widely acknowledged. He helped raise funds for basic cancer research at the Lautenberg Center for Tumor Immunology in Jerusalem for over 15 years and was honored for his contributions in 1988 with the prestigious “Torch of Learning Award.” Mr. Lipkin served as a Board Trustee at Beth Israel Hospital in Passaic for over 25 years. He has been honored to receive the Corporate Achievement Award from B’nai B’rith International, the Community Service Award from NJ Citizens Action, the Emily Bissell Honor Award from the American Lung Association, the Corporate Recognition Award from the Metro Chapter of the American Red Cross, the Corporate Award from the Sunrise House Foundation and the Community Achievement Award from the Urban League of Bergen County. Mr. Lipkin received the Corporate Excellence Award from The University of Medicine & Dentistry for his contributions to Musical Moments for MS. He has been honored by the American Heart Association and has served as a member of the Foundation Board at William Paterson University which earned him the “Legacy Award” in 1994. Mr. Lipkin has been a staunch supporter of Rutgers through the years as well. He is past Chairman of the Rutgers Business School Board of Advisors, a member of the Dean’s Advisory Council, and a past member of the University’s Board of Overseers. Rutgers recognized Mr. Lipkin’s contributions with the distinguished Alumni Award from the Newark College of Arts and Sciences in 2001 and in 2006 he was elected to the Rutgers University Hall of Distinguished Alumni. Mr. Lipkin earned a B.A. in Economics from Rutgers University and an M.B.A. in Banking & Finance from New York University. He is a graduate of the Stonier Graduate School of Banking as well. Mr. Mahon is President and Chief Executive Officer, and a Director, of Dime Community Bancshares, Inc., and its subsidiary, FHLBNY member Dime Community Bank, Brooklyn, New York. Prior to serving as Chief Executive Officer, Mr. Mahon served as Senior Executive Vice President and Chief Operating Officer, and before that as the company’s Chief Financial Officer. Mr. Mahon is currently a board member for The Committee for Hispanic Children and Families. Mr. Mahon was also formerly a board member of Brooklyn Legal Services Corporation A, a nonprofit which provides legal services for low income families in Brooklyn, and of Southside 191 Mr. Martin is Mr. Mroz has a long career in law, government, and public service. His experiences are as a regulator, lawyer, lobbyist and consultant. He is Managing Director, and Founding Member, of Resolute Strategies, LLC, a regulatory and public affairs consulting business based in New Jersey. He provides strategic advice to clients on issues including energy markets and energy technologies, cybersecurity, water & wastewater policy, and infrastructure development and financing. He continues to provide public service having been appointed in July 2018 by Energy Secretary Rick Perry as a member of the U.S. Department of Energy Electric Advisory Committee, which provides advice to the Department regarding modernizing the nation’s electricity delivery infrastructure. He is the immediate past President of the New Jersey Board of Public Utilities (NJBPU), serving as chairman and chief administrative officer of the agency and functioning as the chief energy officer for New Jersey. He was President of the NJBPU from October 2014 until January 2018, and remained as a Commissioner until April 2018. Prior to becoming President of the NJBPU, he worked in private practice as a lawyer and lobbyist as Managing Director of Archer Public Affairs LLC in Trenton, New Jersey and as Of Counsel to Archer & Greiner P.C., in Haddonfield, New Jersey. Previous New Jersey-related government service includes serving as the full time Solicitor for Camden County, New Jersey and as a Commissioner of the Delaware River & Bay Authority and, notably, he served as Chief Counsel to Governor Christine Todd Whitman after serving in various capacities in her Administration. He is a graduate of the University of Delaware, and holds a J.D. from the Villanova School of Law. Mr. Mroz’s legal and regulatory experience, Mr. Nasca is President and Chief Executive Officer of Evans Bancorp, Inc. and FHLBNY member Evans Bank, N.A., a nationally chartered bank and wholly-owned subsidiary of Evans Bancorp. He joined Evans Bank as President in December 2006, and CEO in April 2007, bringing over 30 years of experience in the Western New York banking and financial services industry. Prior to joining Evans, Mr. Nasca spent 11 years at First Niagara Financial Group serving as Executive Vice President of Strategic Initiatives, where he was integrally involved in the development of strategic plans for the organization, implementation of First Niagara’s merger and acquisition efforts and management of its enterprise-wide risk management program. While at First Niagara, Mr. Nasca also served as President and CEO of its subsidiary, Cayuga Bank, shortly after it was acquired by First Niagara, as well as Regional President in Central New York. Previous to that role, he served as First Niagara’s Senior Vice President and Treasurer. Mr. Nasca has interacted with the Federal Home Loan Bank of New York for over 30 years in his various roles pertaining to treasury management. He earned his MBA in Finance from the State University of New York at Buffalo and a BS in Management/Marketing from Canisius College. Mr. Nasca is a member of the Independent Bankers Association of New York State, having previously served as a member of the Board of Directors and President (2012 - 2013), and is a member of the New York Bankers Association, serving as Chair (2011 - 2012) and Vice-Chair (2010 - 2011) of the New York Bankers Association Service Corporation. Mr. Nasca was a member of the Board of Directors of the New York Business Development Corporation from 2012 to January 2015. Mr. Nasca has extensive community involvement as a board member of the Buffalo Niagara Partnership; Lifetime Healthcare Companies; Univera Healthcare Advisory Board; and Buffalo Urban Development Corporation, also serving as a member of its Finance and Audit Committee. He served as a member of the Catholic Charities Board of Trustees for 10 years, also serving as Treasurer, and was Chair of the Catholic Charities Annual Diocesan Appeal in 2011 and Corporate Campaign Chair from 2008 to 2010. Additionally, Mr. Nasca is a member of the Board of Trustees of Canisius College and the Richard J. Wehle School of Business Advisory Ms. Raffaeli serves as CEO and Managing Director of the Hamilton White Group, LLC, and Soho Venture Partners Inc. and affiliates, an investment and advisory firm with New York State and Arizona affiliates dedicated to assisting companies to grow their businesses, pursue new markets and acquire capital. Focusing on the financial, education and technology services marketplaces, Ms. Raffaeli brings over 30 years of experience in financial management, strategic planning, marketing, revenue-enhancement and asset redeployment to global businesses. In addition she has substantial experience assisting businesses with operations, technology, human resources and risk management challenges. She has worked with a variety of firms from start-ups to billion-dollar businesses, leading or assisting in maximizing the opportunities of their marketplace. While at Hamilton White, from 2004 to 2006, she was also the President and Chief Executive Officer of UNext and the Cardean Learning Group. From 1998 to 2002 she served as the President and Chief Executive Officer of Proact Technologies, Inc. and its predecessor Consumer Financial Network. During the first half of her career, Ms. Raffaeli served in a variety of traditional, large-corporate positions including the Executive Director of the Commercial Card Division of Citicorp a global, fully integrated business serving business customers with innovative payment products. She also held key executive positions in Citicorp’s Global Transaction Services and was a Senior Vice President in the Mortgage Banking Division. Ms. Raffaeli was a former Senior Vice President of Chemical Bank, now JPMorgan Chase, where she was responsible for New York retail mortgage and national telemarketing lending. Prior to that she was with Merrill Lynch, Emery Worldwide and Continental Group. Ms. Raffaeli serves on the Board of Standard Life Aberdeen PLC, a global investment and asset management company, where she serves on the Renumeration and Risk and Capital Committee. She also currently serves on two university and college boards and is Chairman of the Education Foundation. She previously served on the Board of Directors of E*Trade holding the leadership positions of Lead Director and Chairman of the Compensation Committee. She also served on the Board of American Home Financial Corporation from 1998 through 2010. Ms. Raffaeli graduated, with honors, from NYU with an MBA. Ms. Raffaeli’s financial and other management experience, as indicated by her background described above, support her qualifications to serve on our Board as an Independent Director. Mr. Romaine has served as Chairman of FHLBNY member Tompkins Trust Company (“TTC”) since May 2014 and as a Director, President and Chief Executive Officer of TTC’s holding company, Tompkins Financial Corporation (“TFC”), since January 1, 2007. He had previously served as President and Chief Executive Officer of Bank member Tompkins Mahopac Bank (“TMB”) from January 1, 2003 through December 31, 2006. Prior to that appointment, Mr. Romaine was Executive Vice President and Chief Financial Officer of Mahopac National Bank. In addition to his service with TTC and TFC, Mr. Romaine serves as a director on the boards of TTC affiliates and Bank members TMB and The Bank of Castile. Mr. Romaine currently serves on the Board of the New York Bankers Association, and served as its Chairman from March 2016 through March 2017. His civic involvement includes service as a member of the Board of Directors of the Ithaca Aviation Heritage Foundation and the Dr. Soarieshas served as the Senior Pastor of First Baptist Church of Lincoln Gardens (“FBCLG”) in Somerset, New Jersey since November 1990. His pastoral ministry focuses on spiritual growth, educational excellence, economic empowerment, and faith-based community development. As a pioneer of faith-based community development, Dr. Soaries’ impact on FBCLG and the community has been tremendous. In 1992, he founded the Central Jersey Community Development Corporation (“CJCDC”), a 501(c)(3) non-profit organization that specializes in helping vulnerable neighborhoods. In 1996, the CJCDC launched Harvest of Hope Family Services Network, Inc. This organization seeks to develop permanent solutions for foster children and parents. From 1999 to 2002, Dr. Soaries served as New Jersey’s Secretary of State, making him the first African-American male to do so. He also served as the former chairman of the United States Election Assistance Commission, which was established by Congress to implement the “Help America Vote Act” of 2002. In 2005, Dr. Soaries launched the dfree®Financial Freedom Movement. The Mr. Vázquez was named in 2013 as Chief Financial Officer of Popular Inc. (Popular), a financial holding company composed of two principal subsidiaries: Puerto Rico’s largest bank, FHLBNY member Banco Popular de Puerto Rico (BPPR), and a US-mainland operation, and officer of Chi Epsilon, the National Civil Engineering Honor Society. He also holds a Masters in Business Administration from Harvard University’s Graduate School of Business, Boston, Massachusetts. Ms. Weyne is a current Director of the FHLBNY, and currently serves on the FHLBNY Board’s Audit, Corporate Governance & External Affairs, Housing, and Strategic Planning Committees. Ms. Weyne was the Commissioner of lnsurance for the Commonwealth of Puerto Rico from January 2013 through December 2016, appointed by former Governor Alejandro Garcia Padilla. While Commissioner, Ms. Weyne served as Vice President of the board Commerce, the Puerto Rico Association of Insurance Companies, the Universidad Central del Caribe, Information about our Executive Officers The following sets forth the executive officers of the FHLBNY who served during Management Age as of Employee of Committee Executive Officer Position held as of 3/ 3/ Bank Since Member Since José R. González President & Chief Executive Officer 10/15/13 10/15/13 Eric P. Amig Former Senior Vice President & Head of Bank Relations 02/01/93 01/01/09 Stephen C. Angelo Senior Vice President, Chief Audit Officer 09/22/08 07/12/16 Edwin Artuz Senior Vice President & Head of Corporate Services and Director of Diversity and Inclusion 03/01/89 01/01/13 Melody J. Feinberg Senior Vice President & Chief Risk Officer 10/17/11 01/01/15 G. Robert Fusco Senior Vice President, 03/02/87 05/01/09 Adam Goldstein Senior Vice President & Chief Business Officer 07/14/97 03/20/08 Paul B. Héroux Former Senior Vice President & Chief Banking Operations Officer 02/27/84 03/31/04 Kevin M. Neylan Senior Vice President & Chief Financial Officer 04/30/01 03/31/04 Deborah Cynthia R Palladino**** Senior Vice President & Chief Capital Markets Officer 08/28/06 09/03/14 Michael A Volpe****** Senior Vice President & Chief Legal Officer Mr. González was appointed President and CEO of the Federal Home Loan Bank of New York on April 2, 2014. Mr. González joined the FHLBNY on October 15, 2013, as Executive Vice President. Mr. González served as Vice Chairman of the Board of Directors of the FHLBNY from 2008 through 2013, and as an elected industry director from 2004 through 2013. Prior to joining the FHLBNY, he served as Senior Executive Vice President, Banking & Corporate Development for OFG Bancorp (formerly Oriental Financial Group, Inc.). Mr. González has also been a member of the Board of Directors of the Pentegra Defined Benefit Plan for Financial Institutions since July 2014. On August 31, 2016, Mr. González was appointed by President Barack Obama to serve as one of the eight directors of the Oversight Board created by the Puerto Rico Oversight, Management, and Economic Stability Act (“PROMESA”) of 2016. Mr. González was a member of the Board of Directors of Santander BanCorp (“Santander”), a bank holding company, from 2000 to 2010. From 2002 to 2008, he was Vice Chairman of the Board, President and CEO of Santander. After joining Santander in 1996 as President and CEO of its securities broker dealer, Mr. González was named Senior Executive Vice President and Chief Financial Officer of the holding company in 2001. Mr. González began his career in banking in the early 1980s as Vice President, Investment Banking, for Credit Suisse First Boston (“CSFB”) and, from 1989 through 1995, served as President and CEO of CSFB’s Puerto Rico operations. He served as President and CEO of the Government Development Bank for Puerto Rico, a government instrumentality that acts as the Commonwealth’s fiscal agent, from 1986 to 1989. He is a past President of both the Puerto Rico Bankers Association and the Securities Industry Association of Puerto Rico. Mr. González holds a B.A. in Economics from Yale University and M.B.A. and Juris Doctor degrees from Harvard University. Mr. Amig joined us as Director of Bank Relations in February 1993. In January of 2009 he was named Senior Vice President and Head of Bank Mr. Angelo joined the Bank as Chief Audit Officer in September 2008. In this role, he oversees the activities of the Internal Audit Department, which provides independent, objective assurance and consulting services designed to add value and improve the Bank’s Mr. Artuz has served as Head of Corporate Services and Director of Diversity & Inclusion since July 1, 2014. In August 1, 2000, he was named Director of Human Resources; he was named as a Senior Vice President on January 1, 2013. Mr. Artuz directs the management of the Bank’s Office of Minority and Women Inclusion in the areas of Human Resources, Procurement and education and outreach to ensure that regulatory requirements are met and exceeded. Mr. Artuz also provides overall leadership, strategic direction, and oversight for all of the Bank’s human resources activities and operations. These activities and operations include the areas of employment, compensation, benefits, employee relations, employee and organizational training and development, performance management, succession planning, employee communications, and external and internal Human Resources information systems services. Mr. Artuz has the significant responsibility of providing support to the Compensation & Human Resources Committee of the Bank’s Board of Directors in connection with matters related to executive compensation and benefits. Mr. Artuz also provides strategic direction and leadership to the organization’s Corporate Real Estate departments to ensure efficient and effective management of the firm’s physical resources. From January 1996 through December 1996, Mr. Artuz served as Assistant Vice President, Administrative Services and from January 1997 through July 2000, Mr. Artuz served as Vice President, Administrative Services. In this capacity, Mr. Artuz managed the Human Resources function as well as each of the following: Purchasing; Telecommunications; Facilities; Mailroom Services; Security; Reception; Insurance; and Record Retention. Mr. Artuz holds a graduate degree from New York University in Human Resources Management and an undergraduate degree in History from the College of Staten Island. Prior to joining the Bank in 1989, Mr. Artuz held positions at Skadden, Arps, Slate, Meagher & Flom; Dillon, Read & Co.; and the Dime Savings Bank of New York. Ms. Feinberg has served as Senior Vice President and Chief Risk Officer since March 1, 2017. Ms. Feinberg previously served as Senior Vice President and Acting Chief Risk Officer from July 8, 2016 through February 28, 2017, and Senior Vice President and Deputy Chief Risk Officer from January 1, 2015 through July 7, 2016. In her current role, Ms. Feinberg oversees the Bank’s Enterprise-wide Risk Management Jersey, both Magna Cum Laude. She is a graduate of the RMA Wharton Advanced Risk Management Program and holds a PRMIA Market, Liquidity, and Asset Liability Management Certification. She is a member of the NYSCPA, AICPA and Mr. Fusco was named Chief Information Officer (“CIO”) in 2008 and took on the additional role of Head of Enterprise Services in 2009. In that role, Mr. Fusco Mr. Goldstein was named Chief Business Officer in December of 2015. In this role, he leads the Sales, Marketing and Research activities for all business lines. In addition, he manages the FHLBNY’s Mortgage Partnership Mr. Héroux was named Chief Bank Operations Officer and Community Investment Officer in December Executive Program as well as the ABA Stonier National Graduate School of Banking. Prior to joining us, Mr. Héroux held positions at Merrill Lynch & Co. and E.F. Hutton & Co. Mr. Neylan became Chief Financial Officer on March 30, 2012. Mr. Neylan is responsible for overseeing the Bank’s Accounting, Management Reporting and Strategic Planning Ms. Palladino was named Senior Vice President and Head of Affordable Housing and Community Investment in October 2019. She is responsible for oversight of Collateral Analytical Services and the Affordable Housing and Community Lending Programs. Ms. Palladino previously served as Vice President and Director of Collateral and Affordable Housing Services from July 2016 through September 2019. Prior to that, she served as Vice President holding the functional titles of Director of Collateral Analytical Services (February 2012 – June 2016) and Director of Loan Review Analysis (June 2010 – January 2012). Ms. Palladino joined the Bank in June of 2010. Prior to joining the Bank, Ms. Palladino held various management positions at GMAC Mortgage Corporation and Home Savings of America. She holds an M.B.A. in Finance from Long Island University and a B.A. in Communications from William Smith College. Mr. Radziemski was named Senior Vice President and Chief Information Officer on January 1, 2020. In this role, he directs and oversees several functions including Information Technology, Information Security, Business Continuity Planning, Vendor Management, and Records Management. Mr. Radziemski joined the FHLBNY in July 2019 as Deputy Chief Information Officer. Prior to joining the FHLBNY, he spent over 30 years working in information technology in the financial services industry, including senior technology leadership roles at Bankers Trust, MetLife, CitiGroup, and Lord, Abbett & Co., LLC (Lord Abbett). His last full-time role before joining the FHLBNY was as Chief Information Officer at Lord Abbett, from March 2003 until July 2016. After Lord Abbett, he did management consulting work as a Partner for Fortium Partners from July of 2017 until joining the FHLBNY. He received a B.Sc. in Operations Research and Industrial Engineering from Cornell University, and a M.S. in Industrial Engineering from Stanford University. Mr. Scott was named Chief Capital Markets Officer in September 2014, after serving as Director of Trading in the Capital Markets department, managing debt issuance and advance positions. He is responsible for all facets of balance sheet management including the Bank’s investments portfolio, advances position, funding, and debt issuance. He has served as the FHLBank representative to the Federal Reserve-sponsored committee on Libor replacement, the Alternative Reference Rates Committee, also known as “ARRC”, since 2017. Mr. Scott joined the Bank’s Capital Markets department in August of 2006, following 23 years of experience in the markets and on Wall Street where he was a trader and desk manager for interest rate products at Citibank, Deutsche Bank, and Credit Lyonnais. He received a Bachelor’s Degree in Economics from Tufts University and holds a Master’s degree in Finance and Economics from the Kellogg School of Management at Northwestern University. Mr. Volpe was named Senior Vice President and Head of Bank Operations in October 2019. In this role, he directs and oversees several functions, including Credit and Collateral Operations, Correspondent Services, Custody and Pledging Services, Business Process and Project Support, and Electronic Payments. Mr. Volpe previously served as First Vice President and Director of Bank Operations from January 2019 through September 2019. Prior to that, he served as Vice President beginning in October 2006, holding several functional titles during that time, including Director of Bank Operations (December 2018); Director of Member Services Operations (April 2015 – November 2018); Director of Collateral and Correspondent Services (February 2012 – April 2015); and Director of Collateral Operations (October 2006 – January 2012). He joined the FHLBNY in January 1989 and later took an eight year hiatus, from 1998 to 2006, where he held various positions at The Bank of New York. He received a B.S. in Finance and M.B.A. in International Finance from St. John’s University (NY), and is also a graduate of the ABA Stonier Graduate School of Banking. Mr. West assumed the role of Senior Vice President, Chief Legal Officer for the Bank on May 1, 2015. Mr. West left the Federal Home Loan Bank of Indianapolis (FHLBI) on December 31, 2014 having served as its Executive Vice President - Chief Operating Officer - Business Operations since July 30, 2010. He was appointed by the FHLBI’s Board to serve as Acting Co-President - CEO from April through July 2013. From 1994 to 2010, Mr. West served as Senior Vice President - Administration, General Counsel, Corporate Secretary & Ethics Officer, having started with the FHLBI in July 1985 as Associate Legal Counsel. From 1983 to 1985, Mr. West was an Associate with the Indianapolis, Indiana law firm of White & Raub and practiced in the areas of insurance and corporate law. Mr. West is a Phi Beta Kappa, B.A. with Distinction graduate in political science and psychology from Indiana University’s College of Arts and Sciences, and earned an M.B.A from Indiana University Kelley School of Business and a J.D. from Indiana University School of Law - Indianapolis. Mr. West is licensed to practice law in the state of Indiana and is registered to serve as In-House Counsel in the state of New York. Section 16 (a) Beneficial Ownership Reporting Compliance Audit Committee The Audit Committee of our Board of Directors is primarily responsible for overseeing the services performed by our independent registered public accounting firm and internal audit department, evaluating our accounting policies and its system of internal controls and reviewing significant financial transactions. For the period from January 1, Audit Committee Financial Expert Our Board of Directors has determined that Code of Ethics It is the duty of the Board of Directors to oversee the Chief Executive Officer and other senior management in the competent and ethical operation of the FHLBNY on a day-to-day basis and to assure that the long-term interests of the shareholders are being served. To satisfy this duty, the directors take a proactive, focused approach to their position, and set standards to ensure that we are committed to business success through maintenance of the highest standards of responsibility and ethics. In this regard, the Board has adopted a Code of Business Conduct and Ethics (Code) that applies to all employees as well as the Board. The Code is posted on the Corporate Governance Section of the FHLBNY’s website at http://www.fhlbny.com. We intend to disclose changes to or waivers from the Code by filing a Form 8-K and/or by posting such information on our website. 200 Compensation Discussion and Analysis I. Introduction The Bank’s compensationphilosophy and objectives are to attract, motivate, and retain high caliber of diverse financial services executives capable of achieving strategic business initiatives, enhancing business performance and increasing shareholder value. In this regard, it is the role of the Compensation & Human Resources Committee (“C&HR Committee”) of the Board of Directors (“Board”) to: The Board has delegated to the C&HR Committee the authority to approve fees and other retention terms for: i) any compensation and benefits consultant to be used to assist in the evaluation of the Chief Executive Officer’s compensation; and ii) any other advisors that it shall deem necessary to assist it in fulfilling its duties. The Charter of the C&HR Committee is available in the Corporate Governance section of our web site located at www.fhlbny.com. The role of Bank management (including Executive Officers) with respect to compensation is limited to administering Board-approved programs and providing proposals for the consideration of the C&HR Committee. No member of management serves on the Board or any Board committee. The Federal Housing Finance Agency (“Finance Agency”) has oversight authority over FHLBank executive officer compensation. Section 1113 of the Housing and Economic Recovery Act of 2008 requires that the Director of the Finance Agency prohibit an FHLBank from paying compensation to its executive officers that is not reasonable and comparable to that paid for employment in similar businesses involving similar duties and responsibilities.Pursuant to the Executive Compensation Rule, the Finance Agency requires the FHLBanks to provide information to the Finance Agency for review and non-objection concerning all compensation actions relating to the respective FHLBanks' executive officers. This information, including studies of comparable compensation, must be provided to the Finance Agency at least 30 days in advance of any planned FHLBank action with respect to the payment of compensation to executive officers. In addition, the FHLBanks are required to provide at least 60 days' advance notice to the Finance Agency of any arrangement that provides for incentive awards to executive officers. Under the supervision of our board of directors, we provide this information to the Finance Agency as required and requisite approvals have been obtained. In addition to these rules, the Finance Agency previously issued Advisory Bulletin 2009-AB-02 regarding principles for FHLBank executive compensation as to which the FHLBanks and the Office of Finance are expected to adhere in setting executive compensation policies and practices. These principles consist of the following: In evaluating an FHLBank's compensation, the Director will consider the extent to which an executive's compensation is consistent with these advisory bulletin principles. We have incorporated these principles into our development, implementation, and review of compensation policies and practices for executive officers, as described below.We are prohibited by regulations from offering equity-based compensation. Our total compensation program takes into account the existence of these other types of compensation by offering a defined benefit and defined contribution plan to help effectively compete for and retain talent. In light of the Finance Agency’s authority, the Bank’s compensation practices and policies described in this Item 11 are subject to adjustment as a result of regulatory guidance and directives. The Bank is exempt from SEC proxy rules and as such does not provide shareholder advisory “say on pay” votes regarding executive compensation. The mission of the We meet our mission by providing our members with access to economical wholesale credit and technical assistance through our credit products, mortgage finance programs, housing and community lending programs and correspondent services to increase the availability of home financing to families of all income levels. We operate in a very competitive market for talent. Without the capability to attract, motivate and retain talented diverse employees, the ability to fulfill our mission would be in jeopardy. All employees, and particularly senior and middle management, are frequently required to perform multiple tasks requiring a variety of skills. Our employees not only have the appropriate talent and experience to execute our mission, but they also possess skill sets that are difficult to find in the marketplace. The Board-approved Compensation Policy acknowledges and takes into account our compensation philosophy, business environment and factors to remain competitive in the labor market. The major components of the Compensation Policy, which was in effect In September 2018, the Board-approved an updated Compensation Policy as a result of the Additional factors that we take into account to remain competitive in our labor market include, but are not limited to: The Total Compensation Program In response to the challenging economic environment in which we operate, compensation and benefits consist of the following components: (a) cash compensation (i.e., base salary, and, for exempt employees, “variable” or “at risk” short-term incentive compensation opportunities available under the Bank’s Incentive Compensation Plan, hereinafter referred as the The objectives of the total compensation program In accordance with the Board-approved Compensation Policy, we evaluate the value of total compensation delivered to employees including base pay, incentive compensation, retirement and health and welfare benefits in determining market competitiveness In July 2018, the C&HR Committee engaged a benefits and compensation consultant, Willis Towers Watson (“Towers”), to perform a broad and comprehensive review of the Bank’s Compensation Policy and Total Rewards program for all employees including NEOs, and present recommendations to the C&HR Committee. The Bank conducted a competitive bid process with For the compensation component, the compensation and benefits consultant used job-level market data from proprietary Financial Services surveys and jobs from five designated tiers, including NEOs and Management Committee members. Specific Bank peer groups were included in the Total Rewards Study based on their available data and alignment with the September 2018 Board-approved Compensation Policy A representative list of the American Express Capital One M&T Bank Corporation Banco Santander New York Bank of America Corporation BMO Financial Group Cisco Systems, Inc. Citigroup Inc. State Street Corporation TD Bank ING Intuit Inc. For the year 2018, McLagan, a subsidiary of Aon, used for compensation benchmarking analysis purposes the Compensation Policy as of September 2015 for all NEO compensation decisions in effect beginning January 2019 (details of which are provided above). We received a “non-objection” letter from the Finance Agency with respect to the payment of merit increases (effective January 1, 2019) for the NEOs, which letter was based upon the results of compensation benchmarking analysis of McLagan. A representative list of the peer group that was used in the compensation benchmarking analysis, excluding all healthcare and welfare benefits analysis, is set forth in the table below. Compensation in the aggregate paid to compensation and benefits The objective of the Bank’s When employees are individually evaluated, they receive one of five performance ratings: “Outstanding”; “Exceeds Requirements”; “Meets Requirements”; “Needs Improvement”; or “Unsatisfactory”. Incentive Compensation Plan awards are only paid to participants who have attained at least a Bankwide performance goals, which are approved by the Board of Directors, are established to address the Bank’s business operations, mission and to help management focus on what it needs to succeed. Actual results of each goal are compared against the three benchmarks (threshold, target and maximum) that were established for the Incentive Plan year. The Incentive Compensation Plan participant receives a payout based on the benchmark level that is met for each goal. We believe that employees at higher ranks have a greater impact on the achievement of Bankwide goals than employees at lower ranks. Therefore, employees at higher ranks have a greater weighting placed on the Bankwide performance component of their Incentive Plan award opportunities as opposed to the individual performance component. For the Chief Executive Officer and the other Management Committee members (a group that includes all of the NEOs), the overall incentive compensation opportunity is weighted 90% on Bankwide performance goals and 10% on individual performance goals. There may be differences among the NEOs with regard to their individual performance goals. The actual results for each goal may fall between two benchmark levels. When this happens, the payout figures are interpolated for results that fall between the two applicable ranges; either threshold and target, or target and maximum. For example, if the actual results fall between target and maximum, the Incentive Plan participant will receive the payout for achieving target plus an additional amount for the excess over target. This calculation is performed for each Bankwide goal. For each goal, there is no payout if the actual result does not reach the threshold, and the payout is capped at maximum. Individual performance goals are capped at target. The The 2019 Bankwide goals are organized into three broad categories and are presented in the charts below. These charts contain: Bankwide Goals How Goal Weighting Threshold Target Maximum Results BUSINESS EFFECTIVENESS (1) 70% of Return Component- Dividend Capacity as forecasted in the 2018 business plan. Dividend Capacity is calculated as net income, divided by average capital stock. The Bank’s goal is to reward management for financial results that are generally controllable by management. Therefore, we adjust net income to eliminate the impact of items such as unrealized fair value changes on derivatives and associated hedged instruments. In addition, the target is adjusted due to changes in market interest rates during the year. Earnings provide value for shareholders through the ability to add to retained earnings and to pay a dividend. 35.00% 5.21 % 6.13 % 7.36 % 7.21 % Risk Component -The 2018 Bankwide Risk goal consists of two components, each with five complementary factors or metrics. Each metric will be evaluated on PASS/FAIL basis. Each component must have at a minimum three PASS rated metrics to qualify for incentive compensation. The more measures that receive PASS ratings, the higher the potential award. Lowering the Bank’s risk profile provides a level of assurance that unexpected losses will not impair members’ investment in the Bank and serves to preserve the par value of membership stock. Risk Component —Market, Capital and Earnings (“MCE”) Risk Exposure. The five metrics for the MCE Component are: 1) Conditional Value at Risk (CVaR); 2) Equity Sensitivity (Downside); 3) Dividend Sensitivity; 4) Capital Stock Protection; and 5) Retained Earnings Sufficiency. Each metric will be evaluated on PASS/FAIL basis. Each component must have at a Attempts to broadly cover financial risks within the Bank’s book of business. 24.50% 3 4 5 5 Bankwide Goals How Goal Weighting Threshold Target Maximum Results minimum three PASS rated metrics to qualify for incentive compensation. The more measures that receive PASS ratings, the higher the potential award. Risk Component—Operations and Controls (“BOC”) Exposure. The BOC Component attempts to focus on the effectiveness of controls used to manage the risks associated with business activities and operational processes. The five metrics for BOC measure are: 1) Operational Exceptions; 2) Controls over Financial Reporting; 3) Control Awareness and Sustainment Training; 4) Protection of Information Assets; and 5) Information Technology General Controls. Each metric will be evaluated on PASS/FAIL basis. Each component must have at a minimum three PASS rated metrics to qualify for incentive compensation. The more measures that receive PASS ratings, the higher the potential award. Attempts to focus on the effectiveness of controls used to manage the risks associated with business activities and operational processes. 10.50% 3 4 5 5 for the MCE Component are: 1) Equity Sensitivity (Downside); 2) Dividend Sensitivity; 3) Capital Protection; and 4) Retained Earnings Sufficiency. Each metric will be evaluated on PASS/FAIL basis. Each component must have at a minimum two PASS rated metrics to qualify for incentive compensation. The more measures that receive PASS ratings, the higher the potential award. (1)The Risk Goals are intended to encourage management to balance those actions taken to enhance earnings (i.e., Dividend Capacity) with actions that are needed to appropriately manage risk levels in the business. Preserving the value of member paid-in capital and providing a predictable dividend are important ways that the Bank helps to provide value to stockholders. Bankwide Goals How Goal Meets Weighting Threshold Target Maximum Results GROWTH EFFECTIVENESS (2) 15% of Number of New Member Institutions Positions the Bank for future growth and aligns with philosophy of being an “advances bank”. 3.75% 5 9 14 13 Number of New/Return Borrowers Positions the Bank for future growth and aligns with philosophy of being an “advances bank”. 3.75% 14 28 38 28 Advance Volume-Average Balance Advances Aligns with philosophy of being an “advances bank”. 3.75% $ 95.56B $ 106.17B $ 116.79B $ 108.52B Market Share — Calculated by comparing members’ outstanding advances against a pool of alternative wholesale funding sources Helps the Bank gauge its competitive position against a variety of wholesale funding alternatives used by members. Strengthens the franchise as an “advances bank”. 3.75% 48.00 % 52.00 % 54.00 % 55.08 % 209 210 Bankwide Goals How Goal Meets Weighting Threshold Target Maximum Results COMMUNITY INVESTMENT EFFECTIVENESS (3) 15% of Dollar Amount of Approved Community Lending Program Applications Supports the provision of liquidity to members for housing and community development activities 3.75% $ 1.7B $ 1.9B $ 2.2B $ 2.0B Year-to-date Average Balance of Outstanding Letters of Credit Supports the provision of liquidity for housing and community development activities 3.00% $ 13B $ 14B $ 16B $ 16.8B Community Investment and Affordable Housing Related Outreach and Technical Assistance Activities Supports the promotion, understanding and use of the Bank’s affordable housing and community lending programs 4.50% 130 140 160 191 Overall, the weighted average result for Bankwide goals was A clawback provision in the Incentive Plan provides as follows: If, within 3 years after an incentive has been paid or calculated as owed to a Participant who is a member of the Bank’s Management Committee, it is discovered that such amount was based on the achievement of financial or operational goals within this Plan that subsequently are deemed by the Bank to be inaccurate, misstated or misleading, the Board shall review such incentive amounts paid or owed. Inaccurate, misstated and/or misleading achievement of financial or operational goals shall include, but not be limited to, overstatements of revenue, income, capital, return measures and/or understatements of credit risk, market risk, operational risk or expenses. If the Board determines that an incentive amount paid or considered owed to the Participant (the “Awarded Amount”) would have been a lower amount when calculated barring the inaccurate, misstated and/or misleading achievement of financial or operational goals (the “Adjusted Amount”), the Board shall, except as provided below, seek to recover to the fullest extent possible the difference between the Awarded Amount and the Adjusted Amount (the “Undue Incentive Amount”). The Board may decide to not seek recovery of the Undue Incentive Amount if the Board determines that to do so would be unreasonable or contrary to the interests of the Bank. In making such determination, the Board may take into account such considerations as it deems appropriate including, but not limited to: (a) whether the Undue Incentive Amount is immaterial in impact to the Bank; (b) whether the Participant engaged in any intentional or unlawful misconduct that contributed to the inaccurate, misstated and/or misleading information; (c) whether the change in the applicable achievement level was a result of circumstances beyond the control of management; (d) the likelihood of success to recover the claimed Undue Incentive Amount under governing law versus the cost and effort involved; and (e) whether seeking recovery could prejudice the interests of the Bank. The decision by the Board to seek recovery of an Undue Incentive Amount need not be uniform If the Board determines to seek recovery of any or all of the Undue Incentive Amount (the “Recovery Amount”) A required deferral portion of the IC Plan (“DICP”) The DICP provides that 50% of the Total Communicated Award (as defined below), if any, under the Plan year communicated to Management Committee participants (which includes the NEOs) will ordinarily be paid by the middle of March following the Plan year. The remaining 50% will be deferred (the “Deferred Incentive Award”), subject to certain additional conditions specified in the Plan, such that 33 1/3% of the Deferred Incentive Award will ordinarily be paid by the middle of March of the following three years. An executive who terminates employment with the Bank other than for “good reason” or who is terminated by the Bank for “cause” will forfeit any portion of the Deferred Incentive Award that has not yet been paid. In addition, the Deferred Incentive Award will be paid, if otherwise earned, in full in the event of the executive’s death or disability, or a “change in control” (as defined in the DICP). In the chart below, the following terms have the following definitions: “Total Communicated Award” means the total amount of the incentive award (if any) under the Plan communicated to Management Committee Participants; “Current Communicated Incentive Award” means 50 percent of the Total Communicated Award and shall not exceed 100 percent of the participant’s base salary; and “Deferred Incentive Award” means the remaining 50 percent of the Total Communicated Award. Payment Description Payment Year Current Communicated Incentive Award 50% of the Total Communicated Award Base year* Deferred Incentive Award installment Up to 33 1/3% of the Deferred Incentive Award Year 1** Deferred Incentive Award installment Up to 33 1/3% of the Deferred Incentive Award Year 2** Deferred Incentive Award installment Up to 33 1/3% of the Deferred Incentive Award Year 3** *Payment shall ordinarily be made within the first two and a half weeks of March. **Payment shall ordinarily be made within the first two and a half weeks of March in the year indicated. We maintain comprehensive qualified and non-qualified defined benefit and defined contribution savings plans for our employees, including our NEOs. The benefits provided by these plans are components of the total compensation opportunity for employees. The Board and C&HR Committee believe these plans serve as valuable retention tools and provide significant tax deferral opportunities and resources for the participants’ long-term financial planning. These plans are discussed below. Profit Sharing Plan In 2010, the Board approved the establishment of a Profit Sharing Plan for employees who were not grandfathered in the Bank’s retirement plan and who were participants in the DB BEP. A provision of an amount equal to 8% of the prior year’s base pay and short-term incentive payment to the extent the requirements under the Bank’s IC Plan have been achieved. The 8% payment will not be included as income for calculating the benefits for the Qualified Defined Benefit Plan. There is one NEO who qualifies for this benefit: G. Robert Fusco. The DB Plan is an IRS-qualified defined benefit plan which covers all employees who have achieved four months of service. The DB Plan is part of a multiple-employer defined benefit program administered by Pentegra Retirement Services. Participants who, as of July 1, 2008, had five years of DB Plan service and were age 50 years or older, are provided with a benefit of 2.50% of a participant’s highest consecutive 3-year average earnings, multiplied by the participant’s years of benefit service, not to exceed 30 years. Earnings are defined as base salary plus short-term incentive compensation opportunities available under the Bank’s IC Plan, and overtime, subject to the annual Internal Revenue Code limit; short-term incentives for participants of the deferred incentive compensation plan is defined as the Total Communicated Award. The Normal Form of Payment is a life annuity with a guaranteed 12-year payout. A 1% simple interest cost of living adjustment (“COLA”) is provided annually to participants beginning at age 66. These participants are identified herein as For participants who, as of July 1, 2008, did not have five years of DB Plan service and attained age 50 years or older, identified herein as terminated effective July 1, 2008. In addition, for the Non-Grandfathered participants, COLAs are no longer provided on future accruals. For participants who were hired on or after July 1, 2014, the DB Plan provides a benefit of 1.50% of a participant’s highest consecutive 5-year average earnings, multiplied by the participant’s years of benefit service, not to exceed 30 years. Earnings for participants who were hired on or after July 1, 2014 are defined as base salary only, excluding short-term incentive compensation opportunities available under the Bank’s IC Plan, The table below summarizes the DB Plan changes affecting the Non-Grandfathered employees that went into effect on July 1, 2008 and July 1, 2014: DEFINED BENEFIT PLAN GRANDFATHERED NON-GRANDFATHERED PARTICIPANTS Benefit Multiplier 2.5% 2.0% 1.5% Final Average Pay Period High 3-Year High 5-Year High 5-Year Normal Form of Payment Life Annuity with Guaranteed 12 Year Payout Straight Life Annuity Straight Life Annuity Cost of Living Adjustments 1% Per Year Cumulative Commencing at Age 66 None None Early Retirement Subsidy<65: a) Rule of 70 1.5% Per Year 3% Per Year 3% Per Year b) Rule of 70 Not Met 3% Per Year Actuarial Equivalent Actuarial Equivalent *Vesting 20% Per Year Commencing Second Year of Employment 5-Year Cliff 5-Year Cliff *Greater of DB Plan Vesting or New Plan Vesting applied to employees participating in the DB Plan prior to July 1, 2008. ** This includes the following NEO: K. Neylan. *** This includes the following NEOs: M. Feinberg; G. Robert Fusco; J. González; P. Héroux and P. Scott. For purposes of the above table, please note the following definitions: Benefit Multiplier — The annuity paid from the DB Plan is calculated on an employee’s years of service, up to a maximum of 30 years, multiplied by the appropriate Benefit Multiplier for each participant, as described above. Final Average Pay Period —The period of time that an employee’s salary is used in the calculation of that employee’s benefit. Normal Form of Payment — The DB Plan must state the form of the annuity to be paid to the retiring employee. Cost of Living Adjustments (or “COLAs”) — Once a Early Retirement Subsidy— Early retirement under the plan is available after age 45. Vesting — Earnings under the DB Plan for The DB Plan pays monthly annuities, or a lump sum amount available at or after age 59-1/2, calculated on an actuarial basis, to vested participants or the beneficiaries of deceased vested participants. Annual benefits provided under the DB Plan also are subject to IRC limits, which vary by age and benefit payment option selected. The Bank’s practice is to attempt to maintain “economic” funding levels for the DB Plan; therefore in the last two years we made contributions to the DB Plan in amounts greater than the minimum required contribution as determined actuarially under current pension rules as defined by Highway and Transportation Funding Act of 2014 (“HATFA”) and the 2012 Moving Ahead for Progress Act for the 21st Century (“MAP-21”). Employees at the rank of Vice President and above (including the NEOs) who exceed income limitations established by the IRC for three out of five consecutive years and who are also approved for inclusion by the Bank’s Nonqualified Plan Committee are eligible to participate in the DB BEP, a non-qualified retirement plan that in many respects mirrors the DB Plan with the exception of the The primary objective of the DB BEP is to ensure that participants receive the full benefit to which they would have been entitled under the DB Plan in the absence of limits on maximum benefit levels imposed by the IRC. In the event that the benefits payable from the DB Plan have been reduced or otherwise limited by government regulations, the employee’s “lost” benefits are payable under the terms of the DB BEP. The DB BEP also enhances benefits for certain NEOs as follows: * This includes the following NEOs: K. Neylan and J. González. Effective January 1, 2019, the DB BEP Component of the Supplemental Executive Retirement Plan was amended to provide J. González with the provisions under DB Plan A of the DB Plan. ** This includes the following NEOs:M. Feinberg; G. Robert Fusco; P. Héroux and P. Scott. 215 The DB BEP is an unfunded arrangement. However, the Bank has established a grantor trust to assist in financing the payment of benefits under this plan. The Bank’s policy is to maintain assets in the grantor trust at a level up to the Accumulated Benefit Obligation for the DB BEP. The financing level for the DB BEP is reviewed annually. The Nonqualified Plan Committee administers various oversight responsibilities pertaining to the DB BEP. These matters include, but are not limited to, approving employees as participants of the DB BEP and adopting any amendment or taking any other action which may be appropriate to facilitate the DB BEP. The Nonqualified Plan Committee is chaired by the Chair of the C&HR Committee; other members include a Board Director who is a member of the C&HR Committee, our Chief Financial Officer, and the Director of Human Resources. The Nonqualified Plan Committee reports its actions to the C&HR An employee may contribute 1% to 100% of base salary into the DC Plan, up to IRC limitations. The IRC limit for If an employee contributes at least 4% of base salary, the Bank provides the maximum employer match of 6% of elective contributions upon plan entry. If an employee contributes less than 4% of base salary, the Bank will match at a rate of 150% of elective contributions. Contributions of less than 2% of base salary receive a match of Employees at the rank of Vice President and above (including the NEOs) who exceed income limitations established by the IRC, and who contribute to their qualified DC Plan up to the IRC Limits, are eligible to participate in the DC BEP. Amounts deferred and contributed as matching contributions under the DC BEP shall be credited to the participant’s DC BEP account. Participants may choose to invest their DC BEP funds within a menu of investment options. The NDICP Amounts deferred and contributed under the NDICP shall be credited to the participant’s NDICP account. Participants may choose to invest their NDICP funds within a menu of investment options. Participants may elect to receive their funds in a lump sum or in at least two annual installments (not to exceed ten annual installments). We offer We offer eligible employees, including certain NEOs, medical coverage when they retire. Employees are eligible to participate in the Retiree Medical Benefits Plan if they Percentage of Premium Completed Years of Service Paid by Retiree 10 50.0 % 11 47.5 % 12 45.0 % 13 42.5 % 14 40.0 % 15 37.5 % 16 35.0 % 17 32.5 % 18 30.0 % 19 27.5 % 20 or more 25.0 % The premium paid by retirees upon becoming Medicare-eligible (either at age 65 or prior thereto as a result of disability) is a premium reduced to take into account the status of Medicare as the primary payer of the medical benefits of Medicare-eligible retirees. Effective January 1, 2008, for employees who, as of December 31, 2007, did not have 5 years of service and were age 60 or older, After the retiree or a covered dependent of the retiree becomes Medicare-eligible, our contribution toward the premium for the coverage of the Medicare-eligible individual will be reduced to $14.93 per month multiplied by the number of years of service earned by the retiree after age 45 and by the number of individuals (including the retiree, the retiree’s spouse, and each other dependent of the retiree) covered under the Plan. The $26.87 and $14.93 amounts Below is Defined Dollar Plan: Active employee who has completed 10 years of employment at FHLBNY and attained age 55 as of January 1, 2015. Medical Plan Formula 1) Retiree (and covered individual), is eligible for $26.87/month x years of service after age 45, and has attained the age of 62. The 2) Retiree (and covered individual) is eligible for $14.93/month x years of service after age 45 and after age 65. The $0 for Pre-62 Pre-65/Post-65 $3,224/$1,792/Annually 15 years of service after age 45 $4,837/$2,687/Annually 20 years of service after age 45 $6,449/$3,583/Annually * Additional Life Insurance VI. Severance Plan, Other than as described below, all Bank employees are employed under an “at Severance benefits to an employee in the event of termination of his or her employment may be paid in accordance with the Bank’s formal Board-approved Severance Pay Plan (“Severance Plan”) available to all Bank employees who work twenty or more hours a week and have completed at least Severance benefits may be paid to employees who: (i) are part of a reduction in force; (ii) have resigned from the Bank following a reduction in salary grade, level, or rank; (iii) refuse a transfer of fifty miles or more; (iv) have their position eliminated; (v) are unable to perform his/her duties in a satisfactory manner and is warranted that the employee would not be discharged for cause; or (vi) had their employment terminated as a result of a change in control (however, in the event of a change in control that affects the Bank President, the other Bank NEOs, and the Chief Audit Officer, provisions contained in separate Executive Change in Control Agreements shall govern; see below for more information). An officer shall be eligible for two weeks of severance benefits for each six month period of service with the Bank (even if the employment has been less than six months), but not less than eight weeks of severance benefits nor more than thirty-six weeks of such benefits; in the event of a change in control, the ‘floor’ and ‘cap’ shall be twelve weeks and fifty-two weeks, respectively. Non-officers are eligible for severance benefits in accordance with different formulas. If the terminated employee is enrolled in the Bank’s medical benefits plan at the time of termination and elects to purchase health insurance continuation coverage, the Bank may provide a lump sum payment in an amount to be determined by the Bank intended to be used in connection with payments by terminated employees related to health insurance. The Bank may also in its discretion arrange for outplacement services. Payment of severance benefits under the Severance Plan is contingent on an employee executing a severance agreement which includes a release of any claim the employee may have against the Bank and any present and former director, officer and employee. Severance benefits payable under the Severance Plan shall be paid on a lump sum basis. Executive Change in Control Agreements (“CIC Agreements”) were executed in January 2016 and renewed in January 2019 for an additional three-year term between the FHLBNY and Under the terms of the CIC Agreement, if the executive’s employment with FHLBNY is terminated by FHLBNY without “cause” The payments and benefits include: (i) an amount equal to the product of the executive’s average gross base salary for the three years prior to his employment termination date (with any partial years being annualized), multiplied by 2.99 for the CEO, and 1.5 for other CIC Agreement participants; (ii) if the executive is a participant in FHLBNY’s Incentive Compensation Plan (the “Annual Plan”), an amount equal to the product of the executive’s full target incentive payout estimate, or the actual amount of the payment to the executive under the Annual Plan, if lower, in either case, in respect of the year prior to the year of the employment termination date, multiplied by 2.99 for the CEO, and 1.5 for other CIC Agreement participants; (iii) an amount equal to the cost of health, dental and vision care benefits that FHLBNY actually incurred by FHLBNY on behalf of the Executive and his dependents, if any, during the twelve (12) months prior to the executive’s employment termination date; (iv) $15,000, which the executive may put toward outplacement services; (v) $15,000, which the executive may put toward accounting, actuarial, financial, legal or tax services; (vi) additional age and service credits under the FHLBNY non-qualified Benefit Equalization Plan of three (3) years for the CEO and one and one-half (1.5) years for other CIC Agreement participants; and (vii) an amount equal to 2.99 times the CEO’s annual matching contribution under the DC Plan and 1.5 times the match for other CIC Agreement participants. The payments described above are payable in a lump sum within sixty (60) days following the executive’s employment termination date, with the benefits under the BEP being distributed in accordance with the terms of the BEP. All payments and benefits are conditioned on the executive having delivered an irrevocable general release of claims against FHLBNY before payment occurs. In addition, notwithstanding anything to the contrary, all payments and benefits remain subject to FHLBNY’s compliance with any applicable statutory and regulatory requirements relating to the payment of amounts under the CIC Agreements and in the event that a governmental authority or a court with competent jurisdiction directs that any portion or all of the payments may not be paid to the executive, the executive shall not be eligible to receive, or shall return, such payments. c) Golden Parachute Rule d) Mr. G. Robert Fusco’s Retention Agreement Mr. G. Robert Fusco, the Chief Information Officer, Head of e) Mr. Héroux’s Release and Cooperation Agreement Mr. Héroux, the former Senior Vice President and Chief Banking Operations Officer, announced his retirement effective September 30, 2019, and in connection to his retirement was offered a release and cooperation agreement. Mr. Héroux abided by the Agreement and received a cash payout of $466,310 on January 31, 2020. We received a “non-objection” letter from the Finance Agency with respect to the payment as directed by the release and cooperation agreement. Please see Section The Committee believes it has developed a unified, coherent system of compensation. Please refer to Our overall objectives with regard to our compensation and benefits program are to motivate employees to achieve consistent and superior results over a long period of time, and to provide a program that allows us to compete for and retain talent that otherwise might be lured away. As we make changes to one element of the compensation and benefits program mix, the C&HR Committee considers the impact on the other elements of the mix. In this regard, the C&HR Committee strives to maintain programs that keep the Bank within the parameters of its compensation philosophy as set forth in the Bank’s Compensation COMPENSATION COMMITTEE REPORT The C&HR Committee of the Board of Directors has reviewed and discussed the Compensation Discussion and Analysis required by Item 402(b) of Regulation S-K with management and, based on such review and discussions, the C&HR Committee recommended to the Board that the Compensation Discussion and Analysis be included in the annual report on Form 10-K for the year THE COMPENSATION AND HUMAN RESOURCES COMMITTEE DeForest B. Soaries, Jr., Chair C. Cathleen Raffaeli, Vice Chair Kevin Cummings Gerald H. Lipkin Christopher P. Martin David J. Nasca Stephen S. Romaine RISKS ARISING FROM COMPENSATION PRACTICES We do not believe that risks arising from the compensation policies with respect to its employees are reasonably likely to have a material adverse effect on the Bank. We do not structure any of our compensation plans in a way that inappropriately encourages risk taking to achieve payment. Our business model operates on a low return/low risk basis. One of the important characteristics of our culture is appropriate attention to risk management. We have established procedures with respect to risk which are reviewed frequently by entities such as our regulator, external audit firm, Risk Management Group, and Internal Audit Department. In addition, we have a Board and associated Committees that provide governance. The compensation programs are reviewed annually by the C&HR Committee its goals is to motivate management to take a balanced approach to managing risks and returns in the course of managing the business, while at the same time ensuring that we fulfill our mission. The Incentive Plan design is intended to motivate management to act in ways that are aligned with the Board’s wishes to have us achieve forecasted returns while managing risks within prescribed risk parameters. In addition, the goals in the In addition, we are prohibited by regulations careers — that is, the longer an employee works at the Bank, the greater the benefit the employee is likely to accumulate. Senior and mid-level employees are generally long-tenured and we believe that these employees would not want to endanger their pension benefits by inappropriately stretching rules to achieve a short-term financial gain. By definition, these programs are reflective of the low risk culture. The Finance Agency also has issued certain compensation principles, one of which is that executive compensation should be consistent with sound risk management and preservation of the Market value of Equity to Capital Stock Ratio Value of membership stock. Also, the Finance Agency reviews all executive compensation plans relative to these principles and such other factors as the Finance Agency determines to be appropriate, including the Bank’s annual Incentive Plan, prior to their becoming effective. Thus, the Bank’s low risk culture, which is reflected in the compensation policy, leads us to believe that any risks arising from the compensation policies with respect to our employees are not reasonably likely to have a material adverse effect. Compensation Committee Interlocks and Insider Participation The following persons served on the C&HR Committee during all or some of the period from January 1, 222 Executive Compensation The table below summarizes the total compensation earned by each of the Named Executive Officers (“NEOs”) for the years 2019, 2018 and 2017 Summary Compensation Table for Calendar Years 2019, 2018 Change in Non-Equity Pension Value Incentive and Nonqualified Stock Option Plan Deferred All Other Name and Principal Position Year (b) Salary (c) Bonus Awards Awards Compensation (d)(1) Compensation (e)(2) Compensation (f)(3)(4) Total (g) José R. González 2018 $ 920,000 $ — $ — $ — $ 927,184 $ 69,000 $ 61,989 $ 1,978,173 President & 2017 $ 875,000 $ — $ — $ — $ 860,851 $ 91,000 $ 47,024 $ 1,873,875 Chief Executive Officer (PEO) 2016 $ 791,779 $ — $ — $ — $ 781,402 $ 72,000 $ 45,954 $ 1,691,135 Kevin M. Neylan 2018 $ 515,048 $ — $ — $ — $ 376,879 $ 528,000 $ 38,402 $ 1,458,329 Senior Vice President, 2017 $ 484,751 $ — $ — $ — $ 343,265 $ 1,081,000 $ 78,941 $ 1,987,957 Chief Financial Officer (PFO) 2016 $ 469,492 $ — $ — $ — $ 347,149 $ 627,000 $ 64,267 $ 1,507,908 Melody Feinberg 2018 $ 425,000 $ — $ — $ — $ 309,608 $ 152,000 $ 34,064 $ 920,672 Senior Vice President, 2017 $ 386,282 $ — $ — $ — $ 268,465 $ 228,000 $ 93,461 $ 976,208 Chief Risk Officer G. Robert Fusco 2018 $ 411,601 $ — $ — $ — $ 301,229 $ 258,000 $ 86,565 $ 1,057,395 Senior Vice President, 2017 $ 398,645 $ — $ — $ — $ 281,650 $ 1,118,000 $ 104,949 $ 1,903,244 CIO & Head of Enterprise Services 2016 $ 386,097 $ — $ — $ — $ 284,905 $ 617,000 $ 84,665 $ 1,372,667 Paul B. Héroux 2018 $ 423,382 $ — $ — $ — $ 310,827 $ 89,000 $ 92,642 $ 915,851 Senior Vice President, 2017 $ 410,055 $ — $ — $ — $ 291,114 $ 1,040,000 $ 118,345 $ 1,859,514 Chief Banking Operations Officer 2016 $ 400,054 $ — $ — $ — $ 296,968 $ 574,000 $ 110,357 $ 1,381,379 Footnotes for Summary Compensation Table for the Year Ending December 31, (1)The amounts in column (2)The amounts in column (3)For (4)The amounts in column Name Bank Contributions under Matching contributions Perquisite (3) Tax Gross-ups (4) Total José R. González $ 11,983 $ 43,114 $ 6,892 $ — $ 61,989 Kevin M. Neylan $ 5,873 $ 23,771 $ 8,758 $ — $ 38,402 Melody Feinberg $ 16,500 $ 8,942 $ 8,622 $ — $ 34,064 G. Robert Fusco $ 14,218 $ 10,448 $ 61,899 $ — $ 86,565 Paul B. Héroux $ 16,500 $ 8,872 $ 67,106 $ 164 $ 92,642 ** P.Scott was not an NEO in 2017 and The following table sets forth information regarding all incentive plan award opportunities made available to NEOs for the calendar year Grants of Plan-Based Awards for Calendar Year Grants of Plan-Based Awards for Fiscal Year 2018 All Other All Other Exercise Grant Stock Option or Date Awards: Awards: Base Fair Value Estimated Future Payouts Estimated Future Payouts Number of Number of Price of of Stock Under Non-Equity Incentive Under Equity Incentive Shares of Securities Option and Option Grant Plan Awards (2) (3) Plan Awards Stock Underlying Awards Awards Name Date (1) Threshold Target Maximum Threshold Target Maximum or Units Options ($/Sh) ($/Sh) José R. González 1/17/2018 $ 487,600 $ 736,000 $ 901,600 $ — $ — $ — — — $ — $ — Kevin M. Neylan 1/17/2018 $ 164,815 $ 257,524 $ 373,409 $ — $ — $ — — — $ — $ — Melody Feinberg 1/17/2018 $ 136,000 $ 212,500 $ 308,125 $ — $ — $ — — — $ — $ — G. Robert Fusco 1/17/2018 $ 131,712 $ 205,800 $ 298,411 $ — $ — $ — — — $ — $ — Paul B. Héroux 1/17/2018 $ 135,482 $ 211,691 $ 306,952 $ — $ — $ — — — $ — $ — 225 Incentive Compensation Plan Opportunity Table for Calendar Year The table below provides information regarding the total incentive compensation amount awarded to NEOs based on Bankwide goal results (in dollars): Individual Bankwide Component (1) Component (1) (90% of Opportunity) (10% of Threshold Target Maximum Opportunity) Actual Result (2) Individual Total Current 2018 Performance Bankwide Individual Communicated Communicated Annual Salary Bank Performance at Target Component (3) Component (4) Award (5) Incentive Award (6) President 50 % 80 % 100 % 10 % José R. González President & Chief Executive Officer $ 920,000 $ 414,000 $ 662,400 $ 828,000 $ 73,600 $ 803,676 $ 73,600 $ 877,276 $ 438,638 Other NEOs 30 % 50 % 75 % 10 % Kevin M. Neylan Senior Vice President, Chief Financial Officer $ 515,048 $ 139,063 $ 231,772 $ 347,657 $ 25,752 $ 330,635 $ 25,752 $ 356,387 $ 178,194 Melody Feinberg Senior Vice President, Chief Risk Officer $ 425,000 $ 114,750 $ 191,250 $ 286,875 $ 21,250 $ 273,412 $ 21,250 $ 294,662 $ 147,331 G. Robert Fusco Senior Vice President, CIO and Head of Enterprise Services $ 411,601 $ 111,132 $ 185,220 $ 277,831 $ 20,580 $ 264,228 $ 20,580 $ 284,808 $ 142,404 Paul B. Héroux Senior Vice President, Chief Banking Operations Officer $ 423,382 $ 114,313 $ 190,522 $ 285,783 $ 21,169 $ 271,791 $ 21,169 $ 292,960 $ 146,480 * P. Héroux, who held the CBOO position, left the Bank on September 30, 2019. Employment Arrangements We are an “at will” employer and do not provide written employment agreements to any of its employees, except that we do provide Executive Change in Control Agreements to An additional benefit offered to all officers who are at Vice President rank or above (including the NEOs) is a physical examination every 18 months. The annual base salaries for the NEOs are as follows 2019 2018 José R. González $ 993,600 $ 920,000 Kevin M. Neylan $ 531,787 $ 515,048 Melody Feinberg $ 438,813 $ 425,000 G. Robert Fusco $ 424,978 $ 411,601 Paul B. Héroux $ 437,142 $ 423,382 Note: Figures represent salaries approved by our Board of Directors for each year. * P. Héroux, who held the CBOO position, left the Bank on September 30, 2019. A performance-based merit increase program exists for all employees, including NEOs that have a direct impact on base pay. Generally, employees receive merit increases on an annual basis. Such merit increases are based upon the attainment of a performance rating of “Outstanding,” “Exceeds Requirements,” or “Meets Requirements” achieved on individual performance evaluations. may also contain a market adjustment based on market compensation job benchmarking. Refer to Short-Term Incentive Compensation Plan (“IC Plan”) Refer to Section III of the Compensation Discussion and Analysis IC Plan for further details. Qualified Defined Contribution Plan Employees who have met the eligibility requirements contained in the Pentegra Qualified Defined Contribution Plan for Financial Institutions (“DC Plan”) can choose to contribute to the DC Plan, a retirement savings plan qualified under the IRC. Employees are eligible for membership in the DC Plan on the first day of the month following three full calendar months of employment. Refer to OUTSTANDING EQUITY AWARDS AT CALENDAR YEAR-END The tables disclosing (i) outstanding option and stock awards and (ii) exercises of stock options and vesting of restricted stock for NEOs are omitted because all employees are prohibited by law from holding capital stock issued by a Federal Home Loan Bank. As such, these tables are not applicable. PENSION BENEFITS The table below shows the present value of accumulated benefits payable to each of the NEO, the number of years of service credited to each such person, and payments during the last Calendar year (if any) to each such person, under the Pentegra Defined Benefit Plan for Financial Institutions and the Nonqualified Defined Benefit Portion of the Benefit Equalization Plan (amounts in whole dollars) (refer to Pension Benefits Number of Present Value Payment During Plan Years Credited of Accumulated Last Name Name Service (1) Benefit (2) Fiscal Year José R. González Pentegra Defined Benefit Plan for Financial Institutions Qualified Plan 4.83 $ 342,000 $ — Nonqualified Defined Benefit Portion of the Benefit Equalization Plan $ — $ — Kevin M. Neylan Pentegra Defined Benefit Plan for Financial Institutions Qualified Plan 17.33 $ 1,608,000 $ — Nonqualified Defined Benefit Portion of the Benefit Equalization Plan 17.33 $ 3,206,000 $ — Melody Feinberg Pentegra Defined Benefit Plan for Financial Institutions Qualified Plan 6.83 $ 367,000 $ — Nonqualified Defined Benefit Portion of the Benefit Equalization Plan 6.83 $ 362,000 $ — G. Robert Fusco Pentegra Defined Benefit Plan for Financial Institutions Qualified Plan 30.00 $ 2,336,000 $ — Nonqualified Defined Benefit Portion of the Benefit Equalization Plan 30.00 $ 2,982,000 $ — Paul B. Héroux Pentegra Defined Benefit Plan for Financial Institutions Qualified Plan 30.00 $ 2,344,000 $ — Nonqualified Defined Benefit Portion of the Benefit Equalization Plan 30.00 $ 3,588,000 $ — 228 NONQUALIFIED DEFERRED COMPENSATION PLAN The following table discloses contributions to Nonqualified Deferred Compensation plans, each Named Executive Officer’s withdrawals (if any), aggregate earnings and year-end balances in such plans Nonqualified Deferred Compensation for Fiscal Year 2018 Executive Registrant Agrregate Aggregate Aggregate Contributions in Contributions in Earnings in Withdrawals/ Balance at Name Last FY (1) Last FY (2) Last FY Distributions Last FYE José R. González DC BEP $ 73,327 $ 43,114 $ (5,655 ) $ — $ 110,786 NDICP $ — $ — $ — $ — $ — Kevin M. Neylan DC BEP $ 73,138 $ 23,771 $ (11,893 ) $ — $ 175,069 NDICP $ 61,900 $ — $ (9,084 ) $ — $ 92,314 Melody Feinberg DC BEP $ 6,942 $ 8,942 $ (1,602 ) $ — $ 26,420 NDICP $ 197,023 $ — $ (7,229 ) $ — $ 222,056 G. Robert Fusco DC BEP $ 14,388 $ 10,448 $ (2,808 ) $ — $ 46,400 NDICP $ — $ — $ — $ — $ — Paul B. Héroux DC BEP $ 6,872 $ 8,872 $ (2,006 ) $ — $ 28,930 NDICP $ — $ — $ — $ — $ — Refer to Section IV of the Compensation and Discussion Analysis for more information concerning the DC BEP and 229 DISCLOSURE REGARDING TERMINATION AND CHANGE IN CONTROL PROVISIONS Severance Plan The Bank has a formal Board-approved Severance Plan available to all Bank employees who work twenty or more hours a week and have at least one year of employment. (Refer to Section The following table describes estimated severance payout information under the Severance Plan for each NEO assuming that severance would have occurred on December 31, Number of Weeks Used to 2018 Annual Severance Amount Calculate Severance Amount Base Salary Based on Years of Service* José R. González 20 $ 920,000 $ 353,846 Kevin M. Neylan 36 $ 515,048 $ 356,572 Melody Feinberg 28 $ 425,000 $ 228,846 G. Robert Fusco 36 $ 411,601 $ 284,954 Paul B. Héroux 36 $ 423,382 $ 293,111 230 Executive Change in Control Agreements Executive Change in Control Agreements (“CIC Agreements”) were executed in January 2016 between the FHLBNY and each of the members of the Management Committee, including the CEO and the other Named Executive Officers, which, as more fully described below, would provide the executive with certain severance payments and benefits in the event employment is terminated in connection with a Bank “change in control” The following table describes estimated severance and benefit payout information under the CIC Agreements for each NEO assuming that a “change in control” merger or acquisition would have occurred on December 31, Provision José González Kevin Neylan Melody Feinberg G. Robert Fusco Paul Héroux Amount equal to the executive’s average gross base salary for the three years prior to his employment termination date (with any partial years being annualized), multiplied by 2.99 for Mr. González, and 1.5 for Messrs. Neylan, Héroux, Fusco, and Ms. Feinberg $ 2,576,016 $ 733,775 $ 567,363 $ 597,104 $ 616,354 Amount equal to the executive’s full target incentive payout estimate, or the actual amount of the payment to the executive under the FHLBNY’s Incentive Compensation Plan, if lower, in either case, in respect of the year prior to the year of the employment termination date, multiplied by 2.99 for Mr. González, and 1.5 for Messrs. Neylan, Héroux, Fusco, and Ms. Feinberg $ 2,623,055 $ 534,582 $ 393,176 $ 427,211 $ 439,440 Amount equal to the cost of health, dental and vision care benefits that FHLBNY actually incurred by FHLBNY on behalf of the Executive and his dependents, if any, during the twelve (12) months prior to the executive’s employment termination date $ 20,049 $ 29,168 $ 194 $ 19,462 $ 29,168 A payment in the amount of $15,000 which may be used by the Executive for job search-related expenses $ 15,000 $ 15,000 $ 15,000 $ 15,000 $ 15,000 A payment in the amount of $15,000 which may be used by the Executive for accounting, actuarial, financial, legal and/or tax services $ 15,000 $ 15,000 $ 15,000 $ 15,000 $ 15,000 Additional age and service credits under the FHLBNY non-qualified Benefit Equalization Plan (“Nonqualified DB BEP”) of three (3) years for Mr. González and one and one-half (1.5) years for Messrs. Neylan, Héroux, Fusco, and Ms. Feinberg $ 1,870,235 $ 748,636 $ 363,263 $ 398,574 $ 274,908 Additional age and service credits under the FHLBNY qualified & non-qualified defined contribution plan of three (3) years for Mr. González and one and one-half (1.5) years for Messrs. Neylan, Héroux, Fusco, and Ms. Feinberg $ 165,600 $ 46,354 $ 38,250 $ 37,044 $ 38,104 Total value of contract $ 7,284,955 $ 2,122,515 $ 1,392,246 $ 1,509,395 $ 1,427,974 CIC Agreement contract pay-outs Assuming December 31, 2019 Bank Merger or Acquisition Additionally, in the event of a change in control, the executive will be paid deferred incentive compensation otherwise owed under the terms of the deferred portion of the Bank’s Incentive Compensation Plan (as described at Section CEO Pay Ratio For the year ended December 31, We identified the Median Employee by comparing the amount of base salary and incentive awards as reflected in our payroll records for 231 DIRECTOR COMPENSATION The following table summarizes the compensation paid by us to each of our Directors for the year ended December 31, Change in Pension Value and Fees Non-Equity Nonqualified All Earned or Stock Option Incentive Plan Deferred Compensation Other Name Paid in Cash Awards Awards Compensation Earnings Compensation Total John R. Buran $ 127,500 $ — $ — $ — $ — $ — $ 127,500 Larry E. Thompson 112,500 — — — — — 112,500 Kevin Cummings 102,500 — — — — — 102,500 Anne Evans Estabrook (a) 106,250 — — — — — 106,250 Joseph R. Ficalora 102,500 — — — — — 102,500 Jay M. Ford 112,500 — — — — — 112,500 Michael M. Horn 112,500 — — — — — 112,500 Thomas L. Hoy 112,500 — — — — — 112,500 Gerald H. Lipkin 102,500 — — — — — 102,500 Kenneth J. Mahon 102,500 — — — — — 102,500 Christopher P. Martin 102,500 — — — — — 102,500 Richard S. Mroz (b) 76,880 — — — — — 76,880 David J. Nasca 102,500 — — — — — 102,500 C. Cathleen Raffaeli 102,500 — — — — — 102,500 Monte N. Redman (c) 38,430 — — — — — 38,430 Edwin C. Reed (d) 70,300 — — — — 25,000 95,300 DeForest B. Soaries, Jr. 112,500 — — — — — 112,500 Carlos J. Vázquez 112,500 — — — — — 112,500 Ángela Weyne 102,500 — — — — — 102,500 Total Fees $ 1,914,360 $ — $ — $ — $ — $ 25,000 $ 1,939,360 Director Compensation Policy: Director Fee Opportunities The Board establishes on an annual basis a Director Compensation Policy governing compensation for Board meeting attendance. This policy is established in accordance with the provisions of the Federal Home Loan Bank Act (Bank Act) and related Federal Housing Finance Agency. In sum, the applicable statutes and regulations allow each FHLBank to pay its Directors reasonable compensation and expenses, subject to the authority of the Director of the Finance Agency to object to, and to prohibit prospectively, compensation and/or expenses that the Director of the Finance Agency determines are not reasonable. The Director Compensation Policy provides that directors shall be paid a meeting fee for their attendance at meetings of the Board of Directors up to a maximum annual compensation amount as set forth in the Director Compensation Policy. The Board Below are tables summarizing the Director fees and the annual compensation limits that were set by the Board for Position Fees For Each Board Chairman $ 15,930 Vice Chairman $ 14,060 Committee Chair (b) $ 14,060 All Other Directors $ 12,810 Position Annual Limit Chairman $ 127,500 Vice Chairman $ 112,500 Committee Chair $ 112,500 All Other Directors $ 102,500 Director Fee Opportunities — 2019 (in whole dollars) Position Fees For Each Board Chairman $ 16,625 Vice Chairman $ 14,750 Audit Committee Chair $ 14,500 All Other Committee Chairs $ 14,060 All Other Directors $ 12,810 Director Annual Compensation Limits — 2019 (in whole dollars) Director Fee Opportunities — 2020 (in whole dollars) Director Annual Compensation Limits — 2020 (in whole dollars) Director Compensation Policy: Director Expenses The Director Compensation Policy also authorizes us to reimburse Directors for necessary and reasonable travel, subsistence, and other related expenses incurred in connection with the performance of their official duties. For expense reimbursement purposes, Directors’ official duties can include: FHLBNY stock can only be held by member financial institutions. No person, including directors and executive officers of the FHLBNY, may own our capital stock. As such, we do not offer any compensation plan to any individuals under which equity securities of the Bank are authorized for issuance. The following tables provide information about those members who were beneficial owners of more than 5% of our outstanding capital stock (shares in thousands) as of February Number Percent February 28, 2019 of Shares of Total Name of Beneficial Owner Principal Executive Office Address Owned Capital Stock Citibank, N.A. 399 Park Avenue, New York, NY, 10043 9,548 17.18 % Metropolitan Life Insurance Company 200 Park Avenue, New York, NY, 10166 7,237 13.02 New York Community Bank 615 Merrick Avenue, Westbury, NY, 11590 5,894 10.61 22,679 40.81 % Number Percent December 31, 2018 of Shares of Total Name of Beneficial Owner Principal Executive Office Address Owned Capital Stock Citibank, N.A. 399 Park Avenue, New York, NY, 10043 11,145 18.36 % Metropolitan Life Insurance Company 200 Park Avenue, New York, NY, 10166 7,237 11.92 New York Community Bank (a) 615 Merrick Avenue, Westbury, NY, 11590 6,446 10.62 24,828 40.90 % All capital stock held by each member of the FHLBNY is by law automatically pledged to the FHLBNY as additional collateral for all indebtedness of each such member to the FHLBNY. Number Percent of Shares of Total Name Director City State Owned Capital Stock New York Community Bank Joseph R. Ficalora Westbury NY 6,446 10.62 % Investors Bank Kevin Cummings Short Hills NJ 2,602 4.28 Valley National Bank Gerald H. Lipkin Wayne NJ 1,552 2.56 Provident Bank Christopher P. Martin Iselin NJ 685 1.13 Dime Community Bank Kenneth J. Mahon Brooklyn NY 576 0.95 Flushing Bank John R. Buran Uniondale NY 573 0.94 Banco Popular de Puerto Rico Carlos J. Vázquez San Juan PR 261 0.43 Popular Bank Carlos J. Vázquez San Juan PR 255 0.42 Glens Falls National Bank & Trust Company Thomas L. Hoy Glens Falls NY 129 0.21 Crest Savings Bank Jay M. Ford Wildwood NJ 30 0.05 Evans Bank, N.A. David J. Nasca Hamburg NY 15 0.02 13,124 21.61 % 235 We have a cooperative structure and our customers own the entity’s capital stock. Capital stock ownership is a prerequisite to the transaction by members of any business with us. The majority of the members of our Board of Directors are Member Directors (i.e., directors elected by our members who are officers or directors of our members). The remaining members of the Board are Independent Directors (i.e., directors elected by our members who are not officers or directors of our members). We conduct our advances and mortgage loan business almost exclusively with members. Grants under the AHP and AHP advances are also made in partnership or in connection with our members. Therefore, in the normal course of business, we may extend credit to members whose officers or directors may serve as our directors. In addition, we may also extend credit and offer services and AHP benefits to members who own more than 5% of our stock. All products, services and AHP benefits extended by us to such members are provided at market terms and conditions that are no more favorable to them than the terms and conditions of comparable transactions with other members. Under the provisions of Section 7(j) of the FHLBank Act (12 U.S.C. § 1427(j)), our Board is required to administer our business with our members without discrimination in favor of or against any member. For more information about transactions with stockholders, see Note 20. Related Party Transactions, in the audited financial statements in this Form 10-K. The review and approval of transactions with related persons is governed by the Bank’s written Code of Ethics and Business Conduct (Code), which is posted on the Corporate Governance Section of the FHLBNY’s website at http://www.fhlbny.com. Under the Code, each director is required to disclose to the Board of Directors all actual or apparent conflicts of interest, including any personal financial interest that he or she has, as well as such interests of any immediate family member or business associate of the director known to the director, in any matter to be considered by the Board of Directors or in which another person does, or proposes to do, business with the Bank. Following such disclosure, the Board of Directors is empowered to determine whether an actual conflict exists. In the event the Board of Directors determines the existence of a conflict with respect to any matter, the affected director must recuse himself or herself from all further considerations relating to that matter. Issues under the Code regarding conflicts of interests involving directors are administered by the Board or, in the Board’s discretion, the Board’s Corporate Governance Committee. The Code also provides that, subject to certain limited exceptions for, among other items, interests arising through ownership of mutual funds and certain financial interests acquired prior to employment by the Bank, no Bank employee may have a financial interest in any Bank member. Extensions of credit from members to employees are acceptable that are entered into or established in the ordinary, normal course of business, so long as the terms are no more favorable than would be available in like circumstances to persons who are not employees of the Bank. Employees provide disclosures regarding financial interests and financial relationships on a periodic basis. These disclosures are provided to and reviewed by the Director of Human Resources, who is (along with the Chief Audit Officer) one of the Bank’s two Ethics Officers; the Ethics Officers have responsibility for enforcing the Code of Ethics with respect to employees on a day-to-day basis. Director Independence In General During the period from January 1, assessing the independence of its directors. In addition, Rule 10A-3 promulgated under the Exchange Act sets forth the independence requirements of directors serving on the Audit Committee of an SEC reporting company. Finance Agency Regulations Regarding Independence The Finance Agency director independence standards prohibit individuals from serving as members of the Bank’s Audit Committee if they have one or more disqualifying relationships with the Bank or its management that would interfere with the exercise of that individual’s independent judgment. Under Finance Agency regulations, disqualifying relationships can include, but are not limited to: employment with the Bank at any time during the last five years; acceptance of compensation from the Bank other than for service as a director; being a consultant, advisor, promoter, underwriter or legal counsel for the Bank at any time within the last five years; and being an immediate family member of an individual who is or who has been within the past five years, a Bank executive officer. The Board of Directors has assessed the independence of all directors under the Finance Agency’s independence standards, regardless of whether they serve on the Audit Committee. From January 1, Exchange Act and NYSE Rules Regarding Independence In addition, pursuant to SEC regulations, for disclosure purposes, the Board applies the independence standards of the New York Stock Exchange (NYSE) to determine which of its directors and committee members are independent. The Board also applies Rule 10A-3 to determine the independence of the directors serving on its Audit Committee. After applying the NYSE independence standards, the Board has determined that all of the Bank’s Independent Directors who served at any time during the period from January 1, Separately, the Board was unable to affirmatively determine that there were no material relationships (as defined in the NYSE rules) between the Bank and its Member Directors, and has therefore concluded that none of the Bank’s Member Directors who served at any time during the aforementioned period (i.e., John R. Buran, Kevin Cummings, Joseph R. Ficalora, Jay M. Ford, Thomas L. Hoy, Gerald H. Lipkin, Kenneth J. Mahon, Christopher P. Martin, David J. Nasca, In making this determination, the Board considered the cooperative relationship between the Bank and its members. Specifically, the Board considered the fact that each of the Bank’s Member Directors are officers of a Bank member institution, and that each member institution has access to, and is encouraged to use, the Bank’s products and services. Furthermore, the Board acknowledges that under NYSE rules, there are certain objective tests that, if not passed, would preclude a finding of independence. One such test pertains to the amount of business conducted with the Bank by the Member Director’s institution. It is possible that a Member Director could satisfy this test on a particular day. However, because the amount of business conducted by a Member Director’s institution may change frequently, and because the Bank generally desires to increase the amount of business it conducts with each member, the directors deemed it inappropriate to draw distinctions among the Member Directors based solely upon the amount of business conducted with the Bank by any director’s institution at a specific time. Notwithstanding the foregoing, the Board believes that it functions as a governing body that can and does act with good judgment with respect to the corporate governance and business affairs of the Bank. The Board is aware of its statutory responsibilities under Section 7(j) of the Federal Home Loan Bank Act, which specifically provides that the Board of Directors of a Federal Home Loan Bank must administer the affairs of the Home Loan Bank fairly and impartially and without discrimination in favor of or against any member borrower. The Board has a standing Audit Committee. For the reasons noted above, the Board has determined that none of the Member Directors who served at any time as members of the Board’s Audit Committee during the period from January 1, The Board also has a standing Compensation & Human Resources Committee (C&HRC). For the reasons noted above, the Board has determined that none of the Member Directors who served at any time as members of the Bank’s C&HRC during the period from January 1, The following table sets forth the fees paid to our independent registered public accounting firm, PricewaterhouseCoopers, LLP (PwC), during years ended December 31, 2019, 2018 Years ended December 31, 2018 (a) 2017 (a) 2016 (a) Audit Fees and Expenses $ 1,017 $ 828 $ 859 Audit-related Fees 134 60 261 Tax Fees 35 8 26 All Other Fees 4 4 10 Total $ 1,190 $ 900 $ 1,156 AUDIT FEES Audit fees relate to professional services rendered in connection with the audit of the FHLBNY’s annual financial statements, and review of interim financial statements included in quarterly reports on Form 10-Q. AUDIT-RELATED FEES Audit-related fees primarily relate to consultation services provided in connection with respect to certain accounting and reporting standards. TAX FEES Tax fees relate to consultation services provided primarily with respect to tax withholding matters. ALL OTHER FEES These other fees are primarily related to review of various accounting matters and consultation services. Policy on Audit Committee Pre-approval of Audit and Non-Audit Services Performed by the Independent Registered Public Accounting Firm. We have adopted a policy that prohibits our independent registered public accounting firm from performing non-financial consulting services, such as information technology consulting and internal audit services. This policy also mandates that the audit and non-audit services and related budget be approved by the full Audit Committee or Audit Committee Chair in advance, and that the Audit Committee be provided with periodic reporting on actual spending. In accordance with this policy, all services to be performed by PwC were pre-approved by either the full Audit Committee or the Audit Committee Chair. Subsequent to the enactment of the Sarbanes-Oxley Act of 2002 (the “Act”), the Audit Committee has met with PwC to further understand the provisions of that Act as it relates to independence. PwC will rotate the lead audit partner and other partners as appropriate in compliance with the Act. The Audit Committee will continue to monitor the activities undertaken by PwC to comply with the Act. (a) 1. Financial Statements The financial statements included as part of this Form 10-K are identified in the index to the Financial Statements appearing in Item 8 of this Form 10-K, which index is incorporated in this Item 15 by reference. 2. Financial Statement Schedules Financial statement schedules have been omitted because they are not applicable or the required information is shown in the financial statements or notes, under Item 8, “Financial Statements and Supplementary Data.” 3. Exhibits No. Exhibit Description Filed with Form* Date Filed Restated Organization Certificate of the Federal Home Loan Bank of New York (“Bank”) Bank Amended And Restated Supplemental Executive Retirement Defined Benefit & Defined Contribution Benefit Equalization Plan(a) Amended and Restated Federal Home Loan Banks P&I Funding and Contingency Agreement (2017) Form of Executive Change in Control Agreement between the Bank and each of the CEO and the other members of the Bank’s Management Committee(a) Amended Joint Capital Enhancement Agreement among the Federal Home Loan Banks 101.INS XBRL Instance Document X 101.SCH XBRL Taxonomy Extension Schema Document X 101.CAL XBRL Taxonomy Extension Calculation Linkbase Document X 101.LAB XBRL Taxonomy Extension Label Linkbase Document X 101.PRE XBRL Taxonomy Extension Presentation Linkbase Document X 101.DEF XBRL Taxonomy Extension Definition Linkbase Document X Notes: *Means that this exhibit is incorporated by reference from the named Form; the filing date of such named Form is listed in the next column. (a)This exhibit includes a management contract, compensatory plan or arrangement required to be noted herein. 241 None. 242 Pursuant to the requirements of Section 13 or 15(d) of the Securities Exchange Act of 1934, the registrant has duly caused this report to be signed on its behalf by the undersigned, thereunto duly authorized. Federal Home Loan Bank of New York By: /s/ José R. González José R. González President and Chief Executive Officer (Principal Executive Officer) Date: March Pursuant to the requirements of the Securities Exchange Act of 1934, this report has been signed below by the following persons on behalf of the registrant and in the capacities and on the dates indicated below: Signature Title Date /s/ José R. González President and Chief Executive Officer March José R. González (Principal Executive Officer) /s/ Kevin M. Neylan Senior Vice President and Chief Financial Officer March Kevin M. Neylan (Principal Financial Officer) /s/ Backer Ali Vice President, Chief Accounting Officer and Controller March Backer Ali (Principal Accounting Officer) /s/ John R. Buran Chairman of the Board of Directors March John R. Buran /s/ Larry E. Thompson Vice Chairman of the Board of Directors March Larry E. Thompson /s/ Kevin Cummings Director March Kevin Cummings /s/ Joseph R. Ficalora Director March Joseph R. Ficalora /s/ Jay M. Ford Director March Jay M. Ford /s/ Michael M. Horn Director March Michael M. Horn /s/ Thomas L. Hoy Director March Thomas L. Hoy Director March David R. Huber /s/ Charles E. Kilbourne, III Director March Charles E. Kilbourne, III /s/ Gerald H. Lipkin Director March Gerald H. Lipkin /s/ Kenneth J. Mahon Director March Kenneth J. Mahon /s/ Christopher P. Martin Director March Christopher P. Martin /s/ Richard S. Mroz Director March Richard S. Mroz /s/ David J. Nasca Director March David J. Nasca /s/ C. Cathleen Raffaeli Director March C. Cathleen Raffaeli /s/ Stephen S. Romaine Director March Stephen S. Romaine /s/ DeForest B. Soaries, Jr. Director March DeForest B. Soaries, Jr. /s/ Carlos J. Vázquez Director March Carlos J. Vázquez /s/ Ángela Weyne Director March Ángela Weyne Table6.10: FHLBNY Ratings S&PMoody’sLong-Term/ Short-TermLong-Term/ Short-TermYearRatingOutlookRatingOutlook2018August 2, 2018AA+/A-1+Stable/AffirmedOctober 24, 2018Aaa/P-1Stable/Affirmed2017August 21, 2017AA+/A-1+Stable/AffirmedNovember 3, 2017Aaa/P-1Stable/Affirmed2016August 3, 2016AA+/A-1+Stable/AffirmedNovember 11, 2016Aaa/P-1Stable/AffirmedMay 6, 2016Aaa/P-1Stable/AffirmedApril 20, 2016Aaa/P-1Stable/AffirmedAccrued interest payableS&P Moody's Long-Term/ Short-Term Long-Term/ Short-Term Year Rating Outlook Rating Outlook 2019 August 22, 2019 AA+/A-1+ Stable/Affirmed October 23, 2019 Aaa/P-1 Stable/Affirmed 2018 August 2, 2018 AA+/A-1+ Stable/Affirmed October 24, 2018 Aaa/P-1 Stable/Affirmed 2017 August 21, 2017 AA+/A-1+ Stable/Affirmed November 3, 2017 Aaa/P-1 Stable/Affirmed Accrued interest payable — Amounts outstanding were $223.6 million at December 31, 2018 and $162.2 million at December 31, 2017. Accrued interest payable was comprised primarily of interest due and unpaid on Consolidated obligation bonds, which are generally payable on a semi-annual basis. Fluctuations in unpaid interest balances on bonds are due to the timing of semi-annual coupon accruals and payments at the balance sheet dates.Other liabilitiesOther liabilities — Amounts outstanding were $355.8 million at December 31, 2018, and $204.2 million at December 31, 2017. Other liabilities comprised of unfunded pension liabilities, Federal Reserve pass-through reserves held on behalf of members, and miscellaneous payables.Stockholders’ CapitalStockholders’ CapitalTable7.1: Stockholders’ Capital December 31, 2019 December 31, 2018 Capital Stock(a) $ 5,778,666 $ 6,065,799 Unrestricted retained earnings(b) 1,115,236 1,102,801 Restricted retained earnings(c) 685,798 591,281 Accumulated Other Comprehensive Income (Loss) (47,805 ) (13,259 ) Total Capital $ 7,531,895 $ 7,746,622 (a) Stockholders’ Capital — Capital stock decreased in line with the decrease in advances borrowed. When an advance matures or is prepaid, the excess capital stock is repurchased by the FHLBNY. When an advance is borrowed or a member joins the FHLBNY’s membership, the member is required to purchase capital stock. For more information about activity and membership stock, see Note 14. Capital Stock, Mandatorily Redeemable Capital Stock and Restricted Retained Earnings.(b) Unrestricted retained earnings—Net Income for the twelve months ended December 31, 2018 was $560.5 million; $4.9 million of a cumulative adjustment from adoption of ASU 2016-01 at January 1, 2018 wasincome is added to Unrestricted retained earnings; $112.1 million was set aside towardsthis balance. Dividends are paid out of this balance. Funds are transferred to Restricted retained earnings. Fromearnings balances that are determined in line with the remaining amount, we paid $417.6 million to members as dividends inapproved provisions of the twelve months ended December 31, 2018. As a result, Unrestrictedconduct of restricted retained earnings increased by $35.7 million to $1.1 billion at December 31, 2018.account.(c) Restricted retained earnings—Restricted retained earnings balance at December 31, 20182019 has grown to $591.3$685.8 million from the time the provisions were implemented in the third quarter of 2011 when the FHLBanks, including the FHLBNY agreed to set up a restricted retained earnings account. The FHLBNY will allocate at least 20% of its net income to the FHLBNY’s Restricted retained earnings account until the balance of the account equals at least 1% of FHLBNY’s average balance of outstanding Consolidated Obligations for the previous quarter.Table 7.2: Accumulated Other Comprehensive Income (Loss) (AOCI) December 31, 2019 December 31, 2018 Accumulated other comprehensive income (loss) Non-credit portion of OTTI on held-to-maturitysecurities, net of accretion(a) $ (7,571 ) $ (11,061 ) Net market value unrealized gains (losses) on available-for-sale securities(b) 97,868 4,034 Net Fair value hedging gains (losses) on available-for-sale securities(b) (11,593 ) - Net Cash flow hedging gains (losses)(c) (94,516 ) 16,759 Employee supplemental retirement plans(d) (31,993 ) (22,991 ) Total Accumulated other comprehensive income (loss) $ (47,805 ) $ (13,259 ) (a) OTTI — Non-credit OTTI losses in AOCI have declined at December 31, 2018,in the periods in this report, primarily due to accretion recorded as a reduction in AOCI (and a corresponding increase in the balance sheet carrying values of the OTTI securities); non-credit adjustments added to AOCI in 2018 were not material..(b) Fair values of available-for-sale securities — $97.9 million represents market value unrealized gains of securities designated as AFS; effective January 1, 2019, we transferred $1.6 billion fixed-rate CMBS to the AFS category from HTM, a one-time transfer permitted under ASU 2017-12. The market value unrealized gains at December 31, 2018 balance represents net unrealized2019 were primarily on the $1.6 billion of AFS securities. Net fair value losses of $11.6 million represent hedging valuation basis losses of MBS securities. At December 31, 2017, the balance also included grantor trust funds, which had then beenAFS securities designated as available-for-sale.(c)Cash flowin ASC 815 fair value hedges. The hedge valuation gains (losses) — Balances represented cumulative fair value basis on the two cash flow hedging strategies at the balance sheet dates. Financial statements, Note 17. Derivatives and Hedging Activities, includes a rollforward analysis, which provides more information with respectlosses were due to changes in AOCI.the OIS-FF benchmark rate, which was the risk being hedged.(c) Hedging activity losses in AOCI were primarily the result of cash flow hedges of discount notes, and also cash flow hedges of anticipatory issuance of CO bonds. See Table 7.3 AOCI Rollforward due to ASC 815 Hedging Programs. (d) Employee supplemental plans — Balances represent actuarially determined supplemental pension and postretirement health benefit liabilities that were not recognized through earnings. Amounts are amortized as an expense through Compensation and benefits over an actuarially determined period. Table 7.3: AOCI Rollforward due to ASC 815 Hedging Programs December 31, 2019 Cash Flow Hedges Fair Value Hedges Rollover Hedge
Program Anticipatory
Hedge Program AFS Securities Beginning balance $ 17,412 $ (653 ) $ - Changes in fair values(a) (106,495 ) 5,478 (11,593 ) Amount reclassified - 613 - Fair Value - closed contract - (10,871 ) - Ending balance $ (89,083 ) $ (5,433 ) $ (11,593 ) Notional amount of swaps outstanding $ 2,664,000 $ 89,000 $ 532,000 December 31, 2018 Cash Flow Hedges Rollover Hedge
Program Anticipatory
Hedge Program Beginning balance $ (23,342 ) $ 3,465 Changes in fair values(a) 40,754 (4,377 ) Amount reclassified - (180 ) Fair Value - closed contract - 439 Ending balance $ 17,412 $ (653 ) Notional amount of swaps outstanding $ 2,664,000 $ 461,000 (a) Represents fair value changes of open swap contracts in cash flow hedges. For more information see financial statements,Financial Statements, Note 16. Employee Retirement Plans.17. Derivatives and Hedging Activities.Dividends — By Finance Agency regulation, dividends may be paid out of current earnings or if certain conditions are met, may be paid out of previously retained earnings. We may be restricted from paying dividends if we do not comply with any of the Finance Agency’s minimum capital requirements or if payment would cause us to fail to meet any of the minimum capital requirements, including our Retained earnings target as established by the Board of Directors of the FHLBNY. In addition, we may not pay dividends if any principal or interest due on any Consolidated obligations has not been paid in full, or if we fail to satisfy certain liquidity requirements under applicable Finance Agency regulations. None of these restrictions applied for any period presented.Table 7.3: 7.4:Dividends Paid and Payout Ratios Twelve months ended December 31, 2019 December 31, 2018 Cash dividends paid per share $ 6.49 $ 6.66 Dividends paid(a) (c) $ 365,636 $ 417,602 Pay-out ratio(b) 77.37 % 74.51 % (a) In thousands. (b) Dividend paid during the period divided by net income for the period. (c) Does not include dividenddividends paid to non-member;non-members; for accounting purposes, such dividends are recorded as interest expense.Derivative Instruments and Hedging ActivitiesInterest rate swaps, swaptions, cap and floor agreements (collectively, derivatives) enable us to manage our exposure to changes in interest rates by adjusting the effective maturity, repricing frequency, or option characteristics of financial instruments. To a limited extent, we also use interest rate swaps to hedge changes in interest rates prior to debt issuance and essentially lock in funding costs. Finance Agency regulations prohibit the speculative use of derivatives. For additional information about the methodologies adopted for the fair value measurement of derivatives, see financial statements, Note 18. Fair Values of Financial Instruments.The following tables summarize the principal derivatives hedging strategies outstanding as of December 31, 2018 and December 31, 2017:Table8.1: Derivative Hedging Strategies — Advances Hedged Item / Hedging Instrument Hedging Objective Hedge Accounting
Designation December 31, 2019
Notional Amount
(in millions) December 31, 2018
Notional Amount
(in millions) Pay-fixed, receive float interest rate swap (without options) Converts the advance’s fixed rate to a variable-rate index. Fair Value $ 32,336 $ 41,122 Economic $ - $ 13 Pay-fixed, receive float interest rate swap (with options) Converts the advance’s fixed rate to a variable-rate index and offsets option risk in the advance. Fair Value $ 8,366 $ 4,752 Pay-fixed with embedded features, receive-float interest-rate swap (non-callable) Reduces interest-rate sensitivity and repricing gaps by converting the advance’s fixed rate to a variable-rate index and/or offsets embedded option risk in the advance. Fair Value $ 20 $ 30 Interest rate cap, floor, corridor, or collar Offsets the interest cap, floor, corridor or collar embedded in a variable-rate advance. Economic $ - $ 3
Notional Amount
(in millions)
Notional Amount
(in millions)Table 8.2: Derivative Hedging Strategies — Investments Hedged Item / Hedging Instrument Hedging Objective Hedge Accounting
Designation December 31, 2019
Notional Amount
(in millions) December 31, 2018
Notional Amount
(in millions) Pay-fixed, receive float interest-rate swap Converts the investment’s fixed rate to a variable-rate index. Fair Value $ 532 $ - Economic $ 15,230 $ 5,839 Table 8.3: Derivative Hedging Strategies — Consolidated Obligation LiabilitiesBonds
Notional Amount
(in millions)
Notional Amount
(in millions)Hedged Item / Hedging Instrument Hedging Objective Hedge Accounting
Designation December 31, 2019
Notional Amount
(in millions) December 31, 2018
Notional Amount
(in millions) Receive-fixed or -structured, pay float interest rate swap (without options) Converts the bond’s fixed or structured rate to a variable-rate index. Fair Value $ 11,803 $ 8,300 Economic $ 9,075 $ 4,075 Receive-fixed or -structured, pay float interest rate swap (with options) Converts the bond’s fixed- or structured-rate to a variable-rate index and offsets option risk in the bond. Fair Value $ 70 $ 3,373 Economic $ 3,042 $ 1,080 Receive-float, pay-float basis swap Reduces interest-rate sensitivity and repricing gaps by converting the bond’s variable-rate to a different variable-rate index. Economic $ 17,875 $ 29,735 Forward-starting interest rate swap Locks in the cost of funding on anticipated issuance of debt. Cash Flow $ 89 $ 461 Table 8.3:8.4: Derivative Hedging Strategies — Economic hedges of Trading SecuritiesConsolidated Obligation Discount NotesHedged Item / Hedging Instrument Hedging Objective Hedge Accounting
Designation December 31, 2019
Notional Amount
(in millions) December 31, 2018
Notional Amount
(in millions) Receive-fixed, pay float interest-rate swap Converts the discount note’s fixed rate to a variable-rate index. Fair Value $ 3,482 $ - Economic $ 2,183 $ 3,171 Pay-fixed, Receive float interest-rate swap Hedging sequential issuance of discount notes. Cash Flow $ 2,664 $ 2,664
Notional Amount
(in millions)
Notional Amount
(in millions)Table 8.4:8.5: Derivative Hedging Strategies — Balance Sheet andHedged Item / Hedging Instrument Hedging Objective Hedge Accounting
Designation December 31, 2019
Notional Amount
(in millions) December 31, 2018
Notional Amount
(in millions) Interest-rate cap or floor Protects against changes in income of certain assets due to changes in interest rates. Economic $ 800 $ 800 Table 8.6: Derivative Hedging Strategies — Intermediation Hedged Item / Hedging Instrument Hedging Objective Hedge Accounting
Designation December 31, 2019
Notional Amount
(in millions) December 31, 2018
Notional Amount
(in millions) Pay-fixed, receive-float interest rate swap, and receive-fixed, pay-float interest rate swap To offset interest-rate swaps executed with members by executing interest rate swaps with derivatives counterparties. Economic $ 1,072 $ 666
Notional Amount
(in millions)
Notional Amount
(in millions)Table 8.7: Derivative Credit Risk Exposure and ConcentrationIn addition to market risk, we are subject to credit risk in derivative transactions because of the potential for non-performance by the counterparties, which could result in the FHLBNY having to acquire a replacement derivative from a different counterparty at a cost that may exceed its recorded fair values. We are also subject to operational risks in the execution and servicing of derivative transactions. The degree of counterparty credit risk may depend on, among other factors, the extent to which netting procedures and/or the provision of collateral are used to mitigate the risk. Summarized below are our risk measurement and mitigation processes:Risk measurementHedging Strategies — We estimate exposure to credit loss on derivative instruments by calculating the replacement cost, on a present value basis, to settle at current market prices all outstanding derivative contracts in a gain position, net of collateral pledged by the counterparty. All derivative contracts with non-members are also subject to master netting agreements or other right of offset arrangements.ExposureStand-Alone — In determining credit risk, we consider accrued interest receivable and payable, and the legal right to offset assets and liabilities by counterparty. We attempt to mitigate exposure by requiring derivative counterparties to pledge cash collateral if the amount of exposure is above the collateral threshold agreements. When we post excess cash collateral, we consider the excess collateral as our derivative exposure.Our credit exposures (derivatives in a net gain position) were to highly-rated counterparties and Derivative Clearing Organizations (DCO) that met our credit quality standards. Our exposures also included open derivative contracts executed on behalf of member institutions, and the exposures were collateralized under standard advance collateral agreements with our members. For such transactions, acting as an intermediary, we offset the transaction by purchasing equivalent notional amounts of derivatives from unrelated derivative counterparties. For more information, see financial statements, Credit Risk due to non-performance by counterparties, in Note 17. Derivatives and Hedging Activities.Risk mitigation — We attempt to mitigate derivative counterparty credit risk by contracting only with experienced counterparties with investment-quality credit ratings that meet our credit quality standards. Annually, our management and Board of Directors review and approve all non-member derivative counterparties. We monitor counterparties on an ongoing basis for significant business events, including ratings actions taken by a Nationally Recognized Statistical Rating Organization (NRSRO). All approved derivatives counterparties must enter into a master ISDA agreement with us before we execute a trade through that counterparty. In addition, for all bilateral OTC derivatives, we have executed the Credit Support Annex to the ISDA agreement that provides for collateral support at predetermined thresholds. For Cleared-OTC derivatives, margin requirements are mandated under the Dodd-Frank Act. We believe that such arrangements — margin requirements, the selection of experienced, highly-rated counterparties and ongoing monitoring — have sufficiently mitigated our exposures, and we do not anticipate any credit losses on derivative contracts.Derivatives Counterparty Credit RatingsFor information, and an analysis of our exposure due to non-performance of swap counterparties, see Table “Offsetting of Derivative Assets and Derivative Liabilities — Net Presentation” in Note 17. Derivatives and Hedging Activities to financial statements. For information about the methodologies adopted for the fair value measurement of derivatives, see financial statements, Note 18. Fair Values of Financial Instruments.Hedged Item / Hedging Instrument Hedging Objective Hedge Accounting
Designation December 31, 2019
Notional Amount
(in millions) December 31, 2018
Notional Amount
(in millions) Mortgage delivery commitment Exposed to fair-value risk associated with fixed-rate mortgage purchase commitments. Economic $ 45 $ 13 Table 8.5:8.8:Derivatives Counterparty Credit Ratings December 31, 2019 Credit Rating Notional Amount Net Derivatives
Fair Value
Before Collateral Cash Collateral
Pledged To
(From)
Counterparties(a) Balance
Sheet
Net Credit
Exposure Non-Cash
Collateral
Pledged To
(From)
Counterparties(b) Net Credit
Exposure to
Counterparties Non-member counterparties Asset positions with credit exposure Uncleared derivatives Double A asset(c) $ 25,000 $ 6 $ - $ 6 $ - $ 6 Single A asset(c) 4,415,000 122,157 (4,400 ) 117,757 (105,667 ) 12,090 Cleared derivatives assets(d) 80,839,066 15,111 85,241 100,352 251,177 351,529 85,279,066 137,274 80,841 218,115 145,510 363,625 Liability positions with credit exposure Uncleared derivatives Single A liability(c) 4,270,446 (43,240 ) 47,310 4,070 - 4,070 Triple B liability(c) 2,893,000 (128,059 ) 134,250 6,191 - 6,191 7,163,446 (171,299 ) 181,560 10,261 - 10,261 Total derivative positions with non-member counterparties to which the Bank had credit exposure 92,442,512 (34,025 ) 262,401 228,376 145,510 373,886 Member institutions Derivative positions with member counterparties to which the Bank had credit exposure 536,000 9,467 - 9,467 (9,467 ) - Delivery commitments Derivative position with delivery commitments 44,768 104 - 104 (104 ) - Total derivative position with members 580,768 9,571 - 9,571 (9,571 ) - Total $ 93,023,280 $ (24,454 ) $ 262,401 $ 237,947 $ 135,939 $ 373,886 Derivative positions without credit exposure 15,659,413 Total notional $ 108,682,693 December 31, 2018 Credit Rating Notional Amount Net Derivatives Fair
Value Before
Collateral Cash Collateral
Pledged To
(From)
Counterparties (a) Balance
Sheet
Net Credit
Exposure Non-Cash
Collateral
Pledged To
(From)
Counterparties(b) Net Credit
Exposure to
Counterparties Non-member counterparties Asset positions with credit exposure Uncleared derivatives Single A asset(c) $ 3,125,000 $ 155,264 $ (44,970 ) $ 110,294 $ (102,262 ) $ 8,032 Cleared derivatives assets(d) 20,448,476 1,353 - 1,353 - 1,353 23,573,476 156,617 (44,970 ) 111,647 (102,262 ) 9,385 Liability positions with credit exposure Uncleared derivatives Single A liability(c) 3,414,264 (7,469 ) 9,164 1,695 - 1,695 Cleared derivatives liability(d) 70,236,929 - - - 239,813 239,813 73,651,193 (7,469 ) 9,164 1,695 239,813 241,508 Total derivative positions with non-member counterparties to which the Bank had credit exposure 97,224,669 149,148 (35,806 ) 113,342 137,551 250,893 Member institutions Derivative positions with member counterparties to which the Bank had credit exposure 28,000 363 - 363 (363 ) - Delivery commitments Derivative position with delivery commitments 12,682 57 - 57 (57 ) - Total derivative position with members 40,682 420 - 420 (420 ) - Total $ 97,265,351 $ 149,568 $ (35,806 ) $ 113,762 $ 137,131 $ 250,893 Derivative positions without credit exposure 8,831,152 Total notional $ 106,096,503
Amount
Fair Value
Before
Collateral
Pledged To
(From)
Counterparties (a)
Sheet Net
Credit
Exposure
Collateral Pledged
To (From)
Counterparties (b)
Exposure to
Counterparties
Amount
Fair Value
Before
Collateral
Pledged To
(From)
Counterparties (a)
Sheet Net
Credit
Exposure
Collateral Pledged
To (From)
Counterparties (b)
Counterparties(a) Includes variation marginsWhen collateral is posted to counterparties in excess of fair valuesvalue liabilities that were postedare due to counterparties, and werethe excess collateral is classified as a component of derivative assets, as they representedthe excess represents a receivable and an exposure for the FHLBNY.(b) (b)Non-cash collateral securities. Non-cash collateral iswas not deducted from net derivative assets on the balance sheet as control over the securities arewas not transferred.(c) (c)NRSRO Ratings.(d) (d)On Clearedcleared derivatives, we are required to pledge initial margin (considered as collateral) to Derivative Clearing Organizations (DCOs) in cash or securities. At December 31, 2018 and December 31, 2017,2019, we had pledged $239.8$251.2 million in marketable securities and $239.1$85.2 million in cash to fulfill our obligation to pledge initial margin as collateral. At December 31, 2018, we had pledged $239.8 million in marketable securities to fulfill our obligation to pledge initial margin as collateral.Liquidity, Cash Flows, Short-Term Borrowings and Short-Term DebtOur primary source of liquidity is the issuance of Consolidated obligation bonds and discount notes. To refinance maturing Consolidated obligations, we rely on the willingness of our investors to purchase new issuances. We have access to the discount note market, and the efficiency of issuing discount notes is an important source of liquidity, since discount notes can be issued any time and in a variety of amounts and maturities. Member deposits and capital stock purchased by members are another source of funds. Short-term unsecured borrowings from other FHLBanks and in the federal funds market provide additional sources of liquidity. In addition, the Secretary of the Treasury is authorized to purchase up to $4.0 billion of Consolidated obligations from the FHLBanks. Our liquidity position remains in compliance with all regulatory requirements and management does not foresee any changes to that position.Finance Agency Regulations — LiquidityRegulatory requirements are specified in Parts 932, 1239 and 1270 of the Finance Agency regulations. Each FHLBank shall at all times have at least an amount of liquidity equal to the current deposits received from its members that may be invested in: (1) Obligations of the United States; (2) Deposits in banks or trust companies; or (3) Advances with a remaining maturity not to exceed five years that are made to members in conformity with part 1266.In addition, each FHLBank shall provide for contingency liquidity, which is defined as the sources of cash a FHLBank may use to meet its operational requirements when its access to the capital markets is impeded. We met our contingency liquidity requirements during all periods in this report. Liquidity in excess of requirements is summarized in the table titled Contingency Liquidity. Violations of the liquidity requirements would result in non-compliance penalties under discretionary powers given to the Finance Agency under applicable regulations, which include other corrective actions.Liquidity ManagementWe actively manage our liquidity position to maintain stable, reliable, and cost-effective sources of funds while taking into account market conditions, member demand and the maturity profile of our assets and liabilities. We recognize that managing liquidity is critical to achieving our statutory mission of providing low-cost funding to our members. In managing liquidity risk, we are required to maintain certain liquidity measures in accordance with the FHLBank Act and policies developed by management and approved by our Board of Directors. The applicable liquidity requirements are described in the next four sections.Deposit Liquidity, Cash Flows, Short-Term Borrowings and Short-Term DebtTable 9.1: Deposit Liquidity Average Deposit Average Actual For the Quarters Ended Reserve Required Deposit Liquidity Excess December 31, 2019 $ 1,271 $ 84,245 $ 82,974 September 30, 2019 1,199 81,421 80,222 June 30, 2019 1,075 93,965 92,890 March 31, 2019 1,065 90,100 89,035 December 31, 2018 904 93,526 92,622 Table 9.2: Operational Liquidity Average Balance Sheet Average Actual For the Quarters Ended Liquidity Requirement Operational Liquidity Excess December 31, 2019 $ 17,138 $ 35,360 $ 18,222 September 30, 2019 17,868 36,260 18,392 June 30, 2019 16,184 33,661 17,477 March 31, 2019 10,912 33,899 22,987 December 31, 2018 10,091 36,478 26,387 Table 9.3: Contingency Liquidity The standards in our risk management policy address our day-to-day operational and contingency liquidity needs. These standards enumerate the specific types of investments to be held to satisfy such liquidity needs and are outlined above. These standards also establish the methodology to be used in determining our operational and contingency needs. We continually monitor and project our cash needs, daily debt issuance capacity, and the amount and value of investments available for use in the market for repurchase agreements. We use this information to determine our liquidity needs and to develop appropriate liquidity plans.Advance “Roll-Off” and “Roll-Over” Liquidity Guidelines Average Five Day Average Actual For the Quarters Ended Requirement Contingency Liquidity Excess December 31, 2019 $ 4,764 $ 30,966 $ 26,202 September 30, 2019 6,133 31,983 25,850 June 30, 2019 3,984 29,181 25,197 March 31, 2019 3,169 29,509 26,340 December 31, 2018 3,649 32,494 28,845 The Finance Agency’s Minimum Liquidity Requirement Guidelines expanded the existing liquidity requirements to include additional cash flow requirements under two scenarios: Advance “Roll-Over” and “Roll-Off” scenarios. Each FHLBank, including the FHLBNY, must have positive cash balances to be able to maintain positive cash flows for 15 days under the Roll-Off scenario, and for 5 days under the Roll-Over scenario. The Roll-Off scenario assumes that advances maturing under their contractual terms would mature, and in that scenario we would maintain positive cash flows for a minimum of 15days on a daily basis. The Roll-Over scenario assumes that maturing advances borrowed by members with assets below $100 billion would be rolled over, and in that scenario we would maintain positive cash flows for a minimum of 5 days on a daily basis. We calculate the amount of cash flows under each scenario on a daily basis and have been in compliance with these guidelines.Other Liquidity Contingencies. As discussed more fully under the section Debt Financing Activity and Consolidated Obligations, we are primarily liable for Consolidated obligations issued on our behalf. We are also jointly and severally liable with the other FHLBanks for the payment of principal and interest on the Consolidated obligations of all the FHLBanks. If the principal or interest on any Consolidated obligation issued on our behalf is not paid in full when due, we may not pay dividends, redeem or repurchase shares of stock of any member or non-member stockholder until the Finance Agency approves our Consolidated obligation payment plan or other remedy and until we pay all the interest or principal currently due on all our Consolidated obligations. The Finance Agency, at its discretion, may require any FHLBank to make principal or interest payments due on any Consolidated obligations.Finance Agency regulations also state that the FHLBanks must maintain, free from any lien or pledge, the following types of assets in an amount at least equal to the amount of Consolidated obligations outstanding: Cash; Obligations of, or fully guaranteed by, the United States; Secured advances; Mortgages that have any guaranty, insurance, or commitment from the United States or any agency of the United States; and investments described in section 16(a) of the FHLBank Act, including securities that a fiduciary or trust fund may purchase under the laws of the state in which the FHLBank is located.Cash flowsCash and due from banks was $85.4 million at December 31, 2018 and $127.4 million at December 31, 2017. The following discussion highlights the major activities and transactions that affected our cash flows.Cash flows from operating activities — Operating assets and liabilities support our lending activities to members, and can vary significantly in the normal course of business due to the amount and timing of cash flows, which are affected by member-driven borrowing, our investment strategies, and market conditions. Management believes cash flows from operations, available cash balances and our ability to generate cash through the issuance of Consolidated obligation bonds and discount notes are sufficient to fund our operating liquidity needs.Net cash provided by operating activities in the twelve months ended December 31, 2018 was $681.8 million and $635.8 million in the prior year. By way of comparison, Net income was $560.5 million in the twelve months ended December 31, 2018 and $479.5 million in the prior year.Cash flows provided by investing activities — Investing activities resulted in $14.7 billion in net cash inflows in the twelve months ended December 31, 2018, compared to $15.5 billion in net cash outflows in 2017. In 2018, cash provided by investing activities was driven largely by maturing advances that exceed new advances.Cash flows used in financing activities — Our primary source of funding is the issuance of Consolidated obligation debt. Issuance of capital stock is another source. Net cash outflows from our funding sources were $15.4 billion in the twelve months ended December 31, 2018, compared to net inflows of $14.9 billion in the prior year.For more information, see Statements of Cash Flows in the financial statements.Short-term Borrowings and Short-term DebtOur primary source of funds is the issuance of FHLBank debt. Consolidated obligation discount notes are issued with maturities up to one year and provide us with short-term funds. Discount notes are principally used in funding short-term advances, some long-term advances, as well as money market instruments. We also issue short-term Consolidated obligation bonds as part of our asset-liability management strategy. We may also borrow from another FHLBank, generally for a period of one day. Such borrowings have been historically insignificant.The following table summarizes short-term debt and their key characteristics (dollars in thousands):Table 9.4: As discussed more fully under the section Debt Financing Activity and Consolidated Obligations, we are primarily liable for Consolidated Obligations issued on our behalf. We are also jointly and severally liable with the other FHLBanks for the payment of principal and interest on the Consolidated Obligations of all the FHLBanks. If the principal or interest on any Consolidated Obligation issued on our behalf is not paid in full when due, we may not pay dividends, redeem or repurchase shares of stock of any member or non-member stockholder until the Finance Agency approves our Consolidated Obligation payment plan or other remedy and until we pay all the interest or principal currently due on all our Consolidated Obligations. The Finance Agency, at its discretion, may require any FHLBank to make principal or interest payments due on any Consolidated Obligations.
Original Maturities of One Year or Less Consolidated Obligations-Discount Notes Consolidated Obligations-Bonds With Original Maturities of One Year or Less December 31, 2019 December 31, 2018 December 31, 2019 December 31, 2018 Outstanding at end of the period(a) $ 73,959,205 $ 50,640,238 $ 48,087,050 $ 53,593,000 Weighted-average rate at end of the period(b) 1.60 % 2.34 % 1.74 % 2.37 % Average outstanding for the period(a) $ 58,317,547 $ 51,656,594 $ 46,409,731 $ 59,411,703 Weighted-average rate for the period 2.15 % 1.79 % 2.25 % 1.86 % Highest outstanding at any month-end(a) $ 73,959,205 $ 59,769,950 $ 51,728,000 $ 70,377,100 (a)Outstanding balances represent the carrying value of discount notes and par value of bonds (one year or less) issued and outstanding at the reported dates.(b)Weighted-average rate is calculated on outstanding balances at period-end.(a) Outstanding balances represent the carrying value of discount notes and par value of bonds (one year or less) issued and outstanding at the reported dates. (b) Weighted-average rate is calculated on outstanding balances at period-end. December 31, 2019 December 31, 2018 Actual Limits Actual Limits Mortgage securities investment authority 220 % 300 % 216 % 300 % December 31, 2019 December 31, 2018 Par Values (dollars in thousands) Annual Average Annual Average Advances $ 95,615,681 $ 108,523,572 Mortgage Loans 2,963,520 2,853,891 Total Primary Mission Assets $ 98,579,201 $ 111,377,463 Total Consolidated Obligations $ 135,589,946 $ 144,953,712 U.S. Treasury obligations qualifying as HQLA under AB 2018-07 $ 8,915,081 (a) $ - Core Mission Achievement Ratio 78 % 77 % Target Ratio 70 % 70 % (a) The annual average par value of the U.S. Treasury Securities that are held as Trading securities is deducted from the denominator of the Primary Core Mission Asset ratio, as allowed under the FHFA guidelines. 2017 and 2016.2017. For a discussion of the significant accounting estimates used by the FHLBNY that affect the results of operations, see financial statements, Note 1. Significant Accounting Policies and Estimates. Years ended December 31, 2019 2018 2017 Total interest income $ 3,780,946 $ 3,586,484 $ 2,242,303 Total interest expense 3,113,856 2,789,459 1,520,779 Net interest income before provision for credit losses 667,090 797,025 721,524 Provision (Reversal) for credit losses on mortgage loans (142 ) (371 ) (287 ) Net interest income after provision for credit losses 667,232 797,396 721,811 Total other income (loss) 33,888 (23,871 ) (58,003 ) Total other expenses 175,980 150,665 130,922 Income before assessments 525,140 622,860 532,886 Affordable Housing Program Assessments 52,552 62,382 53,417 Net income $ 472,588 $ 560,478 $ 479,469 20182019 Net Income Compared to 2017201820182019 Net income was $560.5$472.6 million, an increasea decrease of $81.0$87.9 million, or 16.9%,15.7% compared to 2017.2018. Summarized below are the primary components of our Net income:20182019 Net interest income was $797.0$667.1 million, an increasea decrease of $75.5$129.9 million, or 10.5%,16.3% from 2017. In 2018, yields earned on LIBOR-indexed assets, primarily ARC advances and floating-rate mortgage-backed securities, benefited from the rising LIBOR. Overnight and short-term investments in the federal funds and the overnight repurchase agreements benefited from rising yields for money market investments. Prepayment fees were $7.5 million in 2018,compared to $23.8 million in 2017, and were recorded in Net interest income. Although funding costs were also higher in the rising rate environment for LIBOR-indexed CO floaters and discount notes, the price/yield relationship to the FHLBNY for the issuance of shorter-term floating-rate CO bonds continued to be at advantageous spreads. 2018. Net interest spread declined a little,to 35 basis points in 2019, compared to 42 basis points in 2018, compared to 43 basis points in 2017, primarily due to the increase in the liquidity portfolio of federal funds sold and treasury securities.2018.2018,2019, Other income (loss) reported a gain of $33.9 million, in contrast to a loss of $23.9 million compared to a loss of $58.0 million in 2017.2018.· Service fees and other are primarily correspondent banking fees and fee revenues from financial letters of credit. Such revenues were $18.2 million in the current year, compared to $18.4 million in 2018. · Financial instruments carried at fair values reported a net valuation loss of $4.1 million in the current year, compared to a net gain of $0.2 million in 2018. For more information, see financial statements, Fair Value Option Disclosures in Note 18. Fair Values of Financial Instruments. Also see Table 10.10 Other Income (Loss) and accompanying discussions in this MD&A. · Derivative activitiesreported a net loss of $40.7 million in the current year, compared to a net loss of $40.8 million in 2018. Losses primarily represented the impact of standalone derivatives in economic hedges of assets and liabilities. While the hedges met our interest rate management objectives, the hedges did not qualify under ASC 815. For more information, see financial statements, Note 17. Derivatives and Hedging Activities. Also see Table 10.12 Other Income (Loss) — Impact of Derivative Gains and Losses and accompanying discussions in this MD&A. · Securities held for liquidity (classified as trading) reported net gains of $51.3 million in the current year, compared to net gains of $3.2 million in 2018. · Equity Investments, held to fund payments to retirees in non-qualified pension plans, reported net gains of $9.8 million in the current year, compared to net losses of $4.8 million in 2018. ·OtherService fees and other expenses are primarily correspondent banking fees and fee revenues from financial letters of credit. Such revenues were $18.4$176.0 million in the current year, compared to $15.8 million in 2017.·Financial instruments carried at fair values reported a net valuation gain of $0.2 million in the current year, compared to a net loss of $4.5 million in 2017. For more information, see financial statements, Fair Value Option Disclosures in Note 18. Fair Values of Financial Instruments. Also see Table 10.10 Other Income (Loss) and accompanying discussions in this MD&A.·Derivative and hedging activities reported a net loss of $40.8 million in the current year, compared to a net gain of $1.9 million in 2017. For more information, see financial statements, Earnings Impact of Derivatives and Hedging Activities disclosures in Note 17. Derivatives and Hedging Activities. Also see Table 10.12 Earnings Impact of Derivatives and Hedging Activities — By Financial Instrument Type and accompanying discussions in this MD&A.· In 2017, the Bank paid $70.0 million to settle the Lehman litigation, which contributed to the aggregate loss reported in Other income (loss).Other expenses were $150.7 million in the current year, compared to $130.9 million in 2017.2018. Other expenses are primarily Operating expenses, Compensation and benefits, and our share of expenses of the Office of Finance and the Federal Housing Finance Agency.· Operating expenses were $62.8 million in the current year, up from $47.9 million in 2018. The increase was primarily due to professional and consulting expenses incurred as part of multi-year technology initiatives. · Compensation and benefits expenses were $88.2 million in the current year, up from $79.0 million in 2018. · The expenses allocated for our share of the costs to operate the Office of Finance and the Federal Housing Finance Agency were $16.8 million in the current year, compared to $15.9 million in 2018. · Other expenses were $8.3 million in the current year, up from $8.0 million in 2018. · Operating expenses were $47.9 million in the current year, up from $40.7 million in 2017. Expense increases were primarily due to new long-term lease agreements executed in the second half of 2017.·AHP assessments Compensation and benefits expensesallocated from Net income were $79.0 million in the current year, up from $71.1 million in 2017.· The expenses allocated for our share of the costs to operate the Office of Finance and the Federal Housing Finance Agency were $15.9$52.6 million in the current year, compared to $14.7 million in 2017.· Other expenses were $8.0 million in the current year, up from $4.5 million in 2017. Expense increase was primarily due to contributions towards disaster relief programs and the non-service costs of employer sponsored pension programs.AHP assessments allocated from Net income were $62.4 million in the current year, compared to $53.4 million in 2017.2018. Assessments are calculated as a percentage of Net income, and changes in allocations were in parallel with changes in Net income. Net Income Compared to 20162017 — 2018 Net income was $479.5$560.5 million, an increase of $78.3 million,$81.0, or 19.5%16.9%, compared to 2016. Summarized below2017. Detailed analysis and discussions are available starting on page 74 through page 85 of the primary components of our Net income:Form 10-K for the year ended December 31, 2018 filed on March 21, 2019.2017 Net interest income was $721.5 million, an increase of $165.1 million, or 29.7%, from 2016. Net interest income benefited from higher average earning assets, which grew to $148.8 billion in 2017, up from $128.4 billion in 2016. Average advance balances were $109.2 billion in 2017, compared to $96.2 billion in 2016.Net interest spread was 43 basis points in 2017, compared to 40 basis points in 2016.Other income (loss) — In 2017, Other income (loss) reported a loss of $58.0 million, compared to a gain of $6.9 million in 2016. In 2017, a $70.0 million legal charge was recorded on the Lehman settlement matter.·Service fees and other were $15.8 million in 2017, compared to $13.8 million in 2016.·Financial instruments carried at fair values reported a net valuation loss of $4.5 million in 2017, compared to a net loss of $1.9 million in 2016.·Derivative and hedging activities reported a net gain of $1.9 million in 2017, compared to a net loss of $1.7 million in 2016.Other expenses were $130.9 million in 2017, compared to $115.4 million in 2016.· Operating expenses were $40.7 million in 2017, up from $33.4 million in 2016.· Compensation and benefits expenses were $71.1 million in 2017, up from $65.6 million in 2016.· The expenses allocated for our share of the costs to operate the Office of Finance and the Federal Housing Finance Agency were $14.7 million in 2017, compared to $12.9 million in 2016.AHP assessments allocated from Net income were $53.4 million in 2017, compared to $44.8 million in 2016.2017 and 20162017Period-over-periodYear-over-year changes in Net interest income are typically driven by changes in the volume of earning assets, as measured by average balances of earning assets, and the impact of market interest rates on earnings assets and funding costs. Interest income and expense accruals on interest rate swaps that qualified under the ASC 815 hedge accounting rules may impact period-over-periodyear-over-year changes. Shareholders’ capital stock and retained earnings are also factors that impact net interest income as they provide interest free funding. Earnings on capital typically move directly with changes in short-term market interest rates. In a period when members prepay advances, the prepayment fees, which we receive may cause period-over-periodyear-over-year fluctuations in net interest income. For more information about factors that impact Interest income and Interest expense, see Table 10.3 Net Interest Adjustments from Hedge Qualifying Interest Rate Swaps and discussions thereto. Also, see Table 10.4 Spread and Yield Analysis, and Table 10.5 Rate and Volume Analysis. Percentage Percentage Years ended December 31, Change Change 2019 2018 2017 2019 2018 Total interest income(a) $ 3,780,946 $ 3,586,484 2,242,303 5.42 % 59.95 % Total interest expense(a) 3,113,856 2,789,459 1,520,779 11.63 83.42 Net interest income before provision for credit losses $ 667,090 $ 797,025 $ 721,524 (16.30 )% 10.46 % (a)(a) Total Interest Income and Total Interest Expense — See Tables 10.6 and 10.8 and accompanying discussions (b)Attribution of the primary factors driving changes in Net interest income are summarized below:20182019 vs. 2017 2018— Net interest income improveddeclined by $75.5$129.9 million, period-over-period.or 16.3% from the prior year. Our net interest income is impacted by the spread between costing yields on debt and the yields earned on advances, mortgage-backed securities, other investments, and other interest earning assets.Volume-related changesLower advances balances negatively impacted net interest income. The funding environment was generally less favorable, resulting in a higher cost of funding on a spread basis. Finally, management’s decision to lower advance pricing spreads for 2019 reduced yields and revenues.In summary, volume-related declines in assets and funding mix made a positive contributionnegative impact of $79.6 million.$32.4 million in 2019. Average interest-earning assets totaled $144.6 billion in 2019, compared to $154.1 billion last year. Yield related changes resulted in a decline of $4.1$97.5 million. Average interest-earning assets totaled $154.1 billion in 2018, compared to $148.8 billion. Net interest spread, which is the yield from earning assets minus interest paid to fund earning assets, was 35 basis points in 2019, compared to 42 basis points in 2018, compared to 43 basis pointsin 2017.2018. Net interest margin, a measure of margin efficiency, which is calculated as Net interest income divided by average earning assets, was 46 basis points in 2019, compared to 52 basis points in 2018, compared2018.48 basis points in 2017.Funding costs continued to benefit from the increased utilization of favorably priced shorter-term LIBOR-indexed2018. Short-term CO bond floaters. CO LIBOR floatersdebt, bonds and discount notes, which are typically issued at favorable sub-LIBOR spreads, were issued at narrower spreads in the periods in 2019 before the FOMC action to lower interest rates, driving up costing yields for almost all short-term funding categories. In 2019, for longer-term CO bonds, the yields remained above LIBOR, also driving up the cost of funding.largely become the primary funding vehicles, in line with thestopped acquiring LIBOR-indexed floating-rate MBS as a policy decision to restrain growth of variable-rate ARCLIBOR assets. Typically, the revenue streams from MBS is a significant source of net income, second to revenue from advances, and LIBOR-indexed floating-rate mortgage-backed securities.the constraints have also had a negative impact on margins, spreads and revenues in 2019.rising LIBOR has driven up the LIBOR-indexed cash flows we received, such that theinvestments generated incremental net cash flows we receivedinterest income, although margins and spreads were relatively low.advancesassets and liabilities under ASC 815 have remained favorable to net interest income and margin. Interest settlements made a significantfavorable contribution of $162.8 million to interest accruals in the current year, compared to $144.4 million in the prior year. The favorable contribution to 2018net interest income continued to be driven by interest settlements on swaps hedging advances. In that hedge relationship, benchmark-indexed cash flows (primarily LIBOR) received from swap counterparties exceeded the fixed-rate cash flows paid to swap counterparties. On liability hedges, the interest settlement effects of fair value hedges of fixed-rate CO bonds and interest settlement effects of cash flow hedges of CO discount notes resulted in adverse cash flow but were not as significant. For more information, see Table 10.3 Net Interest Adjustments from Hedge Qualifying Interest Rate Swaps.Net interest income in 2018 benefited by $150.2 million in interest accruals on swaps inThe ASC 815 qualifying hedges in contrast to an expensewere highly effective, so that fair value changes of $161.3 million in 2017. Whilehedged instruments closely matched offsetting changes of hedging instruments (interest rate swaps). Comparative information for 2018 has been omitted since the rising LIBOR had an adverse impact on LIBOR-indexed cash flows paid on swapsfair value hedging debt, the negative impact was not as significant.recorded in Other income, prior to the adoption of ASU 2017-12 in 2019. For more information, see Note 17. Derivatives and Hedging Activities in Notes to Financial Statements.2017 vs. 2016 — Net interest income increased by $165.1 million.Volume-related changes in net interest income contributed $73.0 million; rate-related changes contributed $92.2 million.Net interest spread was 43 basis points in 2017, compared to 40 basis points in 2016. Net interest margin was 48 basis points in 2017, compared to 43 basis points in 2016. Several factors contributed to the favorable increase in our interest margins. Business volume increased period-over-period by $20.4 billion, with $148.8 billion in average earning assets in 2017, compared to $128.4 billion in 2016.(c)Net interest income from investing member capital. — We earn interest income from investing our members’ capital to fund interest-earning assets. Such earnings are sensitive to the changes in short-term interest rates (Rate effects), and changes in the average outstanding capital and non-interest bearing liabilities (Volume effects). Typically, we invest capital and net non-interest costing liabilities to fund short-term investment assets that yield money market rates. In the periods in this report, market yields for investments in the federal funds and repo markets have improvedwere higher than in 2018 and the potential contribution to interest margin from memberof funding with capital has also improved. MemberOur capital is retained earnings and capital stock, which increases or decreases in parallel with the volume of advances borrowed by members. Average capital was $7.3 billion in the current year, compared to $7.8 billion in 2018, compared to $7.7 billion in 2017 and $7.0 billion in 2016.the prior year.2017 and 20162017Table 10.3:Net Interest Adjustments from Hedge Qualifying Interest Rate SwapsTable10.3: Net Interest Adjustments from Hedge Qualifying Interest Rate Swaps See Table 10.12 Earnings Impact of Derivatives and Hedging Activities — By Financial Instrument Type in this MD&A for discussions and analysis. Years ended December 31, 2019 2018 2017 Interest income $ 3,609,475 $ 3,396,087 $ 2,388,414 Fair value hedging effects 863 - - Amortization of basis (56 ) 88 (4 ) Interest rate swap accruals 170,664 190,309 (146,107 ) Reported interest income 3,780,946 3,586,484 2,242,303 Interest expense 3,109,530 2,749,302 1,505,575 Fair value hedging effects 2,001 - - Amortization of basis (5,558 ) (5,729 ) (4,269 ) Interest rate swap accruals 7,883 45,886 19,473 Reported interest expense 3,113,856 2,789,459 1,520,779 Net interest income $ 667,090 $ 797,025 $ 721,524 Net interest adjustment - interest rate swaps $ 167,145 $ 150,240 $ (161,315 ) 2017 and 20162017Table 10.4:Table 10.4: Spread and Yield Analysis Years ended December 31, 2019 2018 2017 Interest Interest Interest Average Income/ Average Income/ Average Income/ (Dollars in thousands) Balance Expense Rate(a) Balance Expense Rate(a) Balance Expense Rate(a) Earning Assets: Advances $ 95,837,983 $ 2,526,662 2.64 % $ 107,970,634 $ 2,522,040 2.34 % $ 109,187,643 $ 1,563,322 1.43 % Interest bearing deposits and others 243,800 4,561 1.87 21,240 420 1.98 135,970 168 0.12 Federal funds sold and other overnight funds 18,570,561 406,953 2.19 21,125,197 390,619 1.85 18,705,074 188,920 1.01 Investments Trading securities 9,155,523 215,583 2.35 3,585,110 74,412 2.08 231,458 3,085 1.33 Mortgage-backed securities Fixed 10,109,341 310,849 3.07 8,700,768 260,608 3.00 7,961,719 237,729 2.99 Floating 6,499,680 181,330 2.79 8,616,252 209,447 2.43 8,627,485 136,331 1.58 State and local housing finance agency obligations 1,148,680 33,620 2.93 1,184,453 31,329 2.65 1,110,125 18,467 1.66 Mortgage loans held-for-portfolio 3,008,225 101,223 3.36 2,898,749 97,479 3.36 2,837,762 94,255 3.32 Loans to other FHLBanks 6,904 165 2.39 6,671 130 1.95 3,315 26 0.79 Total interest-earning assets $ 144,580,697 $ 3,780,946 2.62 % $ 154,109,074 $ 3,586,484 2.33 % $ 148,800,551 $ 2,242,303 1.51 % Funded By: Consolidated obligation bonds Fixed $ 29,764,963 $ 707,408 2.38 % $ 26,650,358 $ 556,003 2.09 % $ 32,347,406 $ 463,181 1.43 % Floating 47,906,230 1,090,759 2.28 66,878,818 1,252,229 1.87 61,004,233 609,189 1.00 Consolidated obligation discount notes 58,317,547 1,291,576 2.21 51,656,594 960,833 1.86 45,895,662 431,722 0.94 Interest-bearing deposits and other borrowings 1,132,147 23,734 2.10 1,035,303 19,430 1.88 1,768,332 15,402 0.87 Mandatorily redeemable capital stock 5,973 379 6.35 13,962 964 6.90 21,523 1,285 5.97 Total interest-bearing liabilities 137,126,860 3,113,856 2.27 % 146,235,035 2,789,459 1.91 % 141,037,156 1,520,779 1.08 % Other non-interest-bearing funds 181,382 - 100,509 - 62,928 - Capital 7,272,455 - 7,773,530 - 7,700,467 - Total Funding $ 144,580,697 $ 3,113,856 $ 154,109,074 $ 2,789,459 $ 148,800,551 $ 1,520,779 Net Interest Income/Spread $ 667,090 0.35 % $ 797,025 0.42 % $ 721,524 0.43 % Net Interest Margin (Net interest income/Earning Assets) 0.46 % 0.52 % 0.48 % (a) Reported yields with respect to advances and Consolidated obligations may not necessarily equal the coupons on the instruments as derivatives are extensively used to change the yield and optionality characteristics of the underlying hedged items. When we issue fixed-rate debt that is hedged with an interest rate swap, the hedge effectively converts the debt into a simple floating-rate bond. Similarly, we make fixed-rate advances to members and hedge the advances with a pay-fixed and receive-variable interest rate swap that effectively converts the fixed-rate asset to one that floats with prevailing LIBOR rates.the designated benchmark rate (LIBOR, OIS/FF or OIS/SOFR) in the hedging relationship. Average balance sheet information is presented, as it is more representative of activity throughout the periods presented. For most components of the average balances, a daily weighted average balance is calculated for the period. When daily weighted average balance information is not available, a simple monthly average balance is calculated. Average yields are derived by dividing income by the average balances of the related assets, and average costs are derived by dividing expenses by the average balances of the related liabilities.Volume Analysis — 2018, 2017 and 2016Table10.5: Rate and Volume Analysis Interest Income — 2018, 2017 and 2016Interest income from advances, investments in mortgage-backed securities and MPF loans, federal funds and repurchase agreements are our principal sources of income. Changes in both rate and intermediation volume (average interest-yielding assets) explain the change in the current year period from the prior year period. Reported interest income is net of the impact of cash flows associated with interest rate swaps hedging certain fixed-rate advances that were converted to floating-rate generally indexed to short-term LIBOR. For the years ended December 31, 2019 vs. December 31, 2018 Increase (Decrease) Volume Rate Total Interest Income Advances $ (300,400 ) $ 305,022 $ 4,622 Interest bearing deposits and others 4,164 (23 ) 4,141 Federal funds sold and other overnight funds (50,692 ) 67,026 16,334 Investments Trading securities 129,927 11,244 141,171 Mortgage-backed securities Fixed 43,049 7,192 50,241 Floating (56,079 ) 27,962 (28,117 ) State and local housing finance agency obligations (968 ) 3,259 2,291 Mortgage loans held-for-portfolio 3,685 59 3,744 Loans to other FHLBanks 5 30 35 Total interest income (227,309 ) 421,771 194,462 Interest Expense Consolidated obligation bonds Fixed 69,107 82,298 151,405 Floating (398,805 ) 237,335 (161,470 ) Consolidated obligation discount notes 133,427 197,316 330,743 Deposits and borrowings 1,912 2,392 4,304 Mandatorily redeemable capital stock (513 ) (72 ) (585 ) Total interest expense (194,872 ) 519,269 324,397 Changes in Net Interest Income $ (32,437 ) $ (97,498 ) $ (129,935 ) For the years ended December 31, 2018 vs. December 31, 2017 Increase (Decrease) Volume Rate Total Interest Income Advances $ (17,616 ) $ 976,334 $ 958,718 Interest bearing deposits and others (254 ) 506 252 Federal funds sold and other overnight funds 27,179 174,520 201,699 Investments Trading securities 68,690 2,637 71,327 Mortgage-backed securities Fixed 22,134 745 22,879 Floating (178 ) 73,294 73,116 State and local housing finance agency obligations 1,311 11,551 12,862 Mortgage loans held-for-portfolio 2,041 1,183 3,224 Loans to other FHLBanks 43 61 104 Total interest income 103,350 1,240,831 1,344,181 Interest Expense Consolidated obligation bonds Fixed (90,476 ) 183,298 92,822 Floating 62,792 580,248 643,040 Consolidated obligation discount notes 60,219 468,892 529,111 Deposits and borrowings (8,332 ) 12,360 4,028 Mandatorily redeemable capital stock (500 ) 179 (321 ) Total interest expense 23,703 1,244,977 1,268,680 Changes in Net Interest Income $ 79,647 $ (4,146 ) $ 75,501 Table10.6: Interest Income — Principal Sources Interest income in 2018 grew to $3.6 billion, yielding 233 basis points, compared to $2.2 billion yielding 151 basis points in 2017 and $1.4 billion yielding 106 basis points in 2016. Primary factors driving changes period-over-period in Interest income are summarized below:(a)Interest income from Advances2018 vs. 2017 — Interest income from advances grew to $2.5 billion, yielding 234 basis points in 2018, compared to $1.6 billion, yielding 143 basis points in 2017. Short-term yields in 2018 outpaced the rise in long-term yields, driving the flatness of the yield curve during much of the latter periods in 2018, favorably impacting the yields on our adjustable rate advances, overnight advances and short-term fixed-rate advances.The average 3-month LIBOR (our benchmark rate) was 231 basis points in 2018, compared to 126 basis points in 2017. Variable-rate advances, short-term fixed rate and overnight Advance borrowings by members have remained significant and yields benefited in the rising rate environment. Variable-rate advances re-price typically at monthly intervals and yields increased over the term of the advance. Short-term fixed-rate and overnight advances re-priced at their maturities at frequent intervals (when rolled over by borrowing members), and benefited from higher coupons along an upwardly sloping yield curve.Rate-related increases were partly offset by a decline in advance transaction volume, as measured by average balances, which was $108.0 billion in 2018, compared to $109.2 billion in 2017. Volume-related decline in interest income was $17.6 million, offset by $976.3 million in rate-related increases in interest income. For information about the effects of changes in rates and business volume, see Table 10.4 Spread and Yield Analysis and Table 10.5 Rate and Volume analysis.Hedging under ASC 815 benefited advance interest income accruals. Interest accruals from ASC 815 qualifying interest rate swaps hedging advances were pay fixed-rate in exchange for receive floating-rate cash flows. The rising LIBOR has driven up the LIBOR-indexed cash flows we received, such that the net cash flows we received on swaps hedging advances made a significant contribution to 2018 Net interest income, contributing $190.4 million in interest accruals, in contrast to an expense of $146.1 million in 2017. Historically, the interest rate exchanges have resulted in a net accrual expense that has typically reduced interest income from hedged advances. In the current rising rate environment for the 3-month LIBOR, the swap accruals made a positive contribution. For more information, see Table 10.7 Impact of Interest Rate Swaps on Interest Income Earned from Advances.Prepayment fees recorded in interest income were $7.5 million in 2018, compared to $23.8 million in 2017. When members prepay advances ahead of their contractual maturities, we receive prepayment fees.2017 vs. 2016 — Interest income from advances grew to $1.6 billion, yielding 143 basis points in 2017, compared to $919.9 million, at a yield of 96 basis points in 2016. Net prepayment fees recorded as interest income from advances were $23.8 million in 2017 and $18.0 million in 2016.The higher interest rate environment in 2017, specifically LIBOR, was the primary driver for the significant increase in interest income. Transaction volume grew to $109.2 billion in 2017 compared to $96.2 billion in 2016, and also made a favorable contribution.(b)Federal funds and Securities purchased under agreements to resell2018 vs. 2017 — Interest income from federal funds and repurchase agreements increased in parallel with higher investment balances, which grew in line with our liquidity objectives. In 2018, average invested balance was $21.1 billion, compared to $18.7 billion in 2017. Income growth was also driven by higher yields in line with improved market yields. Yields grew to 185 basis points in 2018, compared to 101 basis points in 2017.2017 vs. 2016 — Interest income from federal funds and repurchase agreements grew in line with our liquidity objectives, yielding 101 basis points in 2017, compared to 39 basis points in 2016. Primary drivers were higher overnight and short-term rates for interbank money market lending and higher volume of investments, which averaged $18.7 billion in 2017, compared to $13.7 billion in 2016.(c)Trading securitiesPortfolio comprised primarily of shorter-term, highly liquid U.S. Treasury and GSE securities that were available to enhance and meet our liquidity objectives; securities were not acquired for speculative purpose. Securities are marked-to-market, gains and losses are recorded in Other income, and yield income is recorded in Interest income. For more information about trading securities, see financial statements Note 5. Trading Securities.2018 vs. 2017 — Interest income grew primarily due to higher volume of acquisitions.2017 vs. 2016 — Interest income grew as the portfolio had been established in late 2016.(d)Mortgage-backed securities — Investment yields and interest incomeInterest income from investments in mortgage-backed securities (MBS) were generated by fixed- and floating-rate securities in our held-to-maturity and available-for-sale portfolios.2018 vs. 2017 — Interest income from MBS was $470.0 million in 2018, compared to $374.0 million in 2017.·Fixed-rate MBS yielded 300 basis points, or $260.6 million in 2018, compared to a yield of 299 basis points, or $237.7 million in 2017. Reported yields are a blend of accretable yields on OTTI securities and yields based on amortized cost on all other MBSsecurities. Interest income has increased, driven by higher investment balances, which averaged $8.7 billion in 2018, up from $8.0 billion in 2017.·Floating-rate MBS yielded 243 basis points, or $209.4 million in 2018, compared to a yield of 158 basis points, or $136.3 million in 2017. The portfolio re-priced in line with the rising 1- month LIBOR, which is the primary index on the floating-rate securities. The average 1-month LIBOR was 202 basis points in 2018, compared to 111 basis points in 2017. Investment volume averaged $8.6 billion in 2018, almost unchanged from 2017.2017 vs. 2016 — Interest income was $374.0 million in 2017, compared to $289.8 million in 2016.·Fixed-rate MBS yielded 299 basis points, or $237.7 million in 2017, compared to a yield of 302 basis points, or $215.2 million in 2016. Yields declined a little as high-yielding vintage MBS continued to pay down. Increase in interest income was driven by higher investment balances, which averaged $8.0 billion in 2017, up from $7.1 billion in 2016.·Floating-rate MBS yielded 158 basis points, or $136.3 million in 2017, compared to a yield of 100 basis points, or $74.6 million in 2016. Contributing factors were higher 1-month LIBOR and higher invested balances. The floating-rate portfolio re-priced in line with the rising 1- month LIBOR, the primary index on the floating-rate securities. The average 1- month LIBOR was 111 basis points in 2017, compared to 50 basis points in 2016. Investment volume averaged $8.6 billion in 2017, up from $7.5 billion in 2016.(e)Mortgage loans held-for-portfolio2018 vs. 2017 — Interest income grew to $97.5 million in 2018, compared to $94.3 million in 2017. Pricing has remained competitive, and the average portfolio stood at $2.9 billion, a small increase of $60.9 million net of paydowns. The portfolio yielded 336 basis points in 2018, compared to 332 basis points in 2017.2017 vs. 2016 — Interest income grew to $94.3 million in 2017, compared to $86.8 million in 2016. Pricing was competitive, and the average portfolio stood at $2.8 billion, a small increase of $206.5 million net of paydowns. The portfolio yielded 332 basis points in 2017, compared to 330 basis points in 2016.Impact of hedging on Interest income from advances — 2018, 2017 and 2016We have executed interest rate swaps to modify the effective interest rate terms of many of our fixed-rate advance products and typically all of our putable advances, effectively converting a fixed-rate stream of cash flows from fixed-rate advances to a floating-rate stream of cash flows, typically indexed to LIBOR. The cash flow patterns achieved our interest rate risk management practices of synthetically converting much of our fixed-rate interest exposures to a LIBOR exposure. Years ended December 31, Percentage Percentage Change Change 2019 2018 2017 2019 2018 Interest Income Advances $ 2,526,662 $ 2,522,040 $ 1,563,322 0.18 % 61.33 % Interest-bearing deposits 4,561 420 168 985.95 150.00 Securities purchased under agreements to resell 178,565 78,341 25,509 127.93 207.11 Federal funds sold 228,388 312,278 163,411 (26.86 ) 91.10 Trading securities 215,583 74,412 3,085 189.72 2,312.06 Mortgage-backed securities Fixed 310,849 260,608 237,729 19.28 9.62 Floating 181,330 209,447 136,331 (13.42 ) 53.63 State and local housing finance agency obligations 33,620 31,329 18,467 7.31 69.65 Mortgage loans held-for-portfolio 101,223 97,479 94,255 3.84 3.42 Loans to other FHLBanks 165 130 26 26.92 400.00 Total interest income $ 3,780,946 $ 3,586,484 $ 2,242,303 5.42 % 59.95 % Table10.7: Impact of Interest Rate Swaps on Interest Income Earned from Advances Years ended December 31, 2019 2018 2017 Advance interest income Advance interest income before adjustment for interest rate swaps $ 2,355,337 $ 2,331,643 $ 1,709,433 Fair value hedging effects(a) 929 - - Amortization of basis (56 ) 88 (4 ) Interest rate swap accruals 170,452 190,309 (146,107 ) Total advance interest income reported $ 2,526,662 $ 2,522,040 $ 1,563,322 (a) In a Fair value hedge under ASC 815, certain fixed-rate advances are hedged by the executionperiods prior to the adoption of interest rate swaps; the hedges create synthetic floaters. AASU 2017-12 on January 1, 2019, fair value hedge of an advance is accomplished by the execution of an interest rate swap in which we pay fixed-rate cash flows and receive LIBOR-indexed variable rate cash flows. The mismatch between the two cash exchanges determines the net interest adjustments under ASC 815. Historically, the fixed-rate cash flows we pay to swap dealers on swaps hedging advances have been greater than the LIBOR indexed cash flows we receive from swap dealers, resulting in a net cash outflow. However, in 2018 our interest margin benefited in a rising LIBOR environment as the cash interest accruals received exceeded payments. The higher LIBOR-indexed cash flows we have received in 2018 have reversed the typical unfavorable expense adjustments, so that a net benefit of $190.4 million to advance income waseffects were recorded in 2018, compared to net charges of $146.1 million in 2017 and $392.5 million in 2016.Interest Expense — 2018, 2017 and 2016Our primary source of funding is through the issuance of Consolidated obligation bonds and discount notes in the global debt markets. Consolidated obligation bonds are generally medium- and long-term bonds, while discount notes are short-term instruments. To fund our assets, our management considers our interest rate risk and liquidity requirements in conjunction with consolidated obligation buyers’ preferences and capital market conditions when determining the characteristics of debt to be issued. Typically, we have used fixed-rate callable and non-callable CO bonds to fund mortgage-related assets and advances. CO discount notes are generally issued to fund advances and investments with shorter interest rate reset characteristics.Changes in rate and intermediation volume (average interest-costing liabilities), the mix of debt issuances between CO bonds and CO discount notes, and the impact of hedging strategies explain the changes in interest expense. Reported Interest expense is net of the impact of hedge strategies. The primary hedging strategy is the Fair value hedge that creates LIBOR-indexed funding, the benchmark rate for the FHLBNY. We also use the Cash Flow hedge strategy that creates long-term fixed-rate funding to lock in future net interest margin. In a Fair value hedge strategy of a bond or discount note, we generally pay variable-rate LIBOR-indexed cash flows to swap counterparties. In exchange, we receive fixed-rate cash flows, which typically mirror the fixed-rate coupon payments to investors holding the FHLBank debt. This exchange effectively converts fixed-rate coupons to floating-rate coupons indexed to the 3-month LIBOR. The primary cash flow hedge strategy is designed to eliminate the variability of cash flows attributable to changes in the benchmark interest rate (3-month LIBOR), hedging long-term issuances of consolidated obligation discount notes and create long-term fixed-rate funding.Certain floating-rate CO bonds were designated in economic hedges, primarily basis hedges that converted a contractual variable index to a preferred funding variable index, typically the 3-month LIBOR. Interest rate swaps designated in an economic hedge do not qualify as an ASC 815 hedge, and interest accrual is not recorded as an adjustment to debt interest expense (as would a swap that qualified); swap accruals together with changes in the fair values of the swaps in economic hedges are reported in Other income (below net(loss) and not in Advance interest income) as an impact of derivative and hedging activities in the Statements of income.Table 10.8: Interest Expenses — Principal Categories (a)Total Interest expense in Years ended December 31, Percentage
Change Percentage
Change 2019 2018 2017 2019 2018 Interest Expense Consolidated obligations bonds Fixed $ 707,408 $ 556,003 $ 463,181 27.23 % 20.04 % Floating 1,090,759 1,252,229 609,189 (12.89 ) 105.56 Consolidated obligations discount notes 1,291,576 960,833 431,722 34.42 122.56 Deposits 22,839 17,816 15,060 28.19 18.30 Mandatorily redeemable capital stock 379 964 1,285 (60.68 ) (24.98 ) Cash collateral held and other borrowings 895 1,614 342 (44.55 ) 371.93 Total interest expense $ 3,113,856 $ 2,789,459 $ 1,520,779 11.63 % 83.42 % grew to $2.8 billion, at a costing yield of 191 basis points, compared to $1.5 billion at a costing yield of 108 basis points in 2017. Short-term yields in 2018 outpaced the rise in long-term yields, driving the flatness of the yield curve during much of the latter periods in 2018, impacting costing yields on our CO floaters and shorter-term discount notes.(b)Interest expense on Consolidated obligation bonds and discount notes — While interest expense on CO floaters and CO discount notes has increased in a rising rate environment, shorter maturity CO floating-rate bonds indexed to LIBOR have continued to be in demand at relatively attractive pricing. CO discount note issuances have also been in demand by investors and coupons have remained relatively attractive at tight spreads to similar maturity U.S. treasuries.Our funding mix in 2018, between the use of floating-rate CO bonds and fixed-rate CO bonds, has continued to shift in the direction of greater utilization of floating-rate CO bonds. Usage of CO discount notes in 2018 has also increased. Utilization of fixed-rate CO bonds has declined. The robust demand from the money market fund community for discount notes has kept discount note spreads to treasuries tight, benefiting funding costs for the FHLBNY. Short-duration CO floaters have also been an attractive investment for money market funds, the demand largely a function of anticipated FOMC rate hikes, and that too has benefited FHLBNY funding costs.Our hedging strategies under ASC 815 have remained unchanged. Generally, the longer-term fixed-rate CO bonds and bonds with call options are hedged under ASC 815, i.e. cash flows are swapped from fixed-rate to LIBOR-indexed variable-rate cash flows, synthetically converting fixed debt expense to a sub-LIBOR level. As of December 31, 2018, LIBOR was the benchmark hedging rate.·2018 vs. 2017 — Fixed-rate Consolidated obligation bonds — Interest expense on fixed-rate CO bonds has increased, as short-maturity, fixed-rate CO bonds matured and were replaced by new issuance at higher costing yields. As part of the tactical shift in the funding mix, usage of fixed-rate bonds has continued to decline. Utilization volume, as measured by average balance was $26.7 billion in 2018, compared to $32.3 billion in 2017. Interest expense was $556.0 million at a funding cost of 209 basis points in 2018, compared to $463.2 million at a funding cost of 143 basis points in 2017. Interest expense includes the impact of hedging effects.ASC 815 hedging effects on interest expense accruals reported a net expense of $34.4 million in 2018, in contrast to a favorable (reduction) of $11.4 million in 2017. The rising LIBOR has driven up the LIBOR-indexed cash flows we pay in the hedging relationship, such that the net cash flows we paid on the swaps exceeded the fixed-rate interest we received. The average 3-month LIBOR (our benchmark rate) was 231 basis points in 2018, compared to 126 basis points in 2017. Interest accruals from ASC 815 qualifying interest rate swaps hedging fixed-rate CO bonds are pay LIBOR-indexed floating-rate cash flows in exchange for receive fixed-rate cash flows. Historically, the swap interest rate exchanges have resulted in a favorable net reduction to fixed-rate CO bond interest expense to a sub-LIBOR level. For more information, see Table 10.9 Impact of Interest Rate Swaps on Consolidated Obligations Interest Expense.2017 vs. 2016 — Fixed-rate bonds — Interest expense was $463.2 million at a funding cost of 143 basis points in 2017, compared to $393.4 million at a funding cost of 95 basis points in 2016. In a rising rate environment in 2017, interest expense on CO bonds also increased. Utilization volume, as measured by average balance was $32.3 billion in 2017, compared to $41.4 billion in 2016.Hedging effects on fixed-rate CO bond recorded a favorable reduction of $11.4 million and $88.2 million to interest expense in 2017 and 2016. The steep rise of the 3-month LIBOR narrowed the historical favorable hedging cash flow differential between the fixed-rate cash flows we received in exchange for LIBOR-indexed payments made to swap dealers. The 3-month LIBOR averaged 126 basis points in 2017, compared to 74 basis points in 2016.2018 vs. 2017 — Floating-rate Consolidated obligation bonds — In 2018, interest expense on floating-rate CO bonds was $1.3 billion at a funding cost of 187 basis points, compared to $609.2 million at a funding cost of 100 basis points in 2017. Utilization volume, as measured by average balance grew to $66.9 billion in 2018, up from $61.0 billion in 2017. Floating-rate bonds were typically indexed to the 1-month LIBOR, and higher yields paid in 2018 were primarily in line with a rising LIBOR. The average 1-month LIBOR was 202 basis points in 2018, compared to 111 basis points in 2017. A significant volume of 1-month LIBOR indexed CO bonds were converted to 3-month LIBOR by the execution of basis swaps, which were designated as economic hedges of the 1-month LIBOR indexed CO bonds. In compliance with hedge accounting rules for economic hedges, interest accruals on the basis swaps were not recorded as adjustments to the cost of funds, rather the accruals were recorded in Other income together with fair value gains and losses from derivatives and hedging activities. For more information about the impact of economic hedging and accruals, see Table 10.12 Earnings Impact of Derivatives and Hedging Activities — By Financial Instrument Type.2017 vs. 2016 — Floating-rate bonds — Interest expense on floating-rate CO bonds was $609.2 million at a funding cost of 100 basis points in 2017, compared to $188.5 million at a funding cost of 59 basis points in 2016. The average volume grew to $61.0 billion in 2017, up from $31.7 billion in 2016. Variable-rate balance sheet assets increased, driving up the need for variable-rate funding. Floating-rate bonds were typically indexed to the 1-month LIBOR, and the higher cost was in line with a rising LIBOR. While interest expense has increased in a rising rate environment, strong investor demand for shorter-term floating-rate CO bonds had a favorable impact on yields and pricing, making it attractive for us to fund our balance sheet assets with floaters. The use of floating-rate CO bonds also allowed us to diversify as a funding alternative to the issuance of discount notes.·2018 vs. 2017 — Consolidated obligation discount notes (CO discount notes or discount notes) — In a rising rate environment, costing yields on CO discount notes have also increased.Interest expense on discount notes was $960.8 million at a funding cost of 186 basis points in 2018, compared to $431.7 million at a funding cost of 94 basis points in 2017. Increase in interest expense was primarily rate related as discount notes are short-term and re-priced to higher coupons in a rising rate environment when new discount notes were issued to replace maturing debt. Increase in interest expense was also in line with the increased utilization of discount notes (Volume effects) as measured by average balances.Cash flow hedging programs under ASC 815 also impacted interest expense. The hedges synthetically converted the 91-day variability of cash flows on $2.7 billion of discount notes ($2.3 billion at December 31, 2017) to long-term fixed-rate swap yields. The hedging strategy increased interest expense by $11.5 million in 2018, compared to an increase of $30.9 million in 2017. However, the hedging strategy assured us of long-term funding at predictable rates.2017 vs. 2016 — Consolidated obligation discount notes (CO discount notes or discount notes) — In a rising rate environment, interest expense on CO discount notes increased. Interest expense on discount notes, including the impact of cash flow hedging strategies, was $431.7 million at a funding cost of 94 basis points in 2017, compared to $216.5 million at a funding cost of 47 basis points in 2016. Utilization of discount notes in 2017, as measured by average balances, declined period-over-period by $612.7 million. The decline was more evident when measured in terms of percentage of average earning assets funded by discount notes, 30.8% in 2017, compared to 36.2% in 2016.Cash flow hedging programs under ASC 815 synthetically converted the 91-day variability of cash flows and yields on $2.3 billion (par) of discount note at December 31, 2017 ($1.8 billion, par at December 31, 2016) to long-term fixed-rate swap yields, and resulted in swap accrual expense of $30.9 million in 2017, compared to $34.9 million in 2016.Impact of Hedging on Interest Expense on Debt — 2018, 2017 and 2016Derivative strategies are primarily used to manage the interest rate risk inherent in fixed-rate debt by converting the fixed-rate funding to floating-rate debt that is indexed to 3-month LIBOR, our preferred funding base. The strategies are designed to protect future interest margins. A significant percentage of non-callable fixed-rate debt is swapped to plain vanilla 3-month LIBOR indexed cash flows. We also issue fixed-rate callable debt that is typically issued with the simultaneous execution of cancellable interest rate swaps to modify the effective interest rate terms and the effective durations of our fixed-rate callable debt. The cash flow objectives are accomplished by utilizing a Fair value hedging strategy, benefiting us in two principal ways. First, the issuances of fixed-rate debt and the simultaneous execution of interest rate swaps convert the debt to an adjustable-rate instrument tied to the 3-month LIBOR. Second, fixed-rate callable bonds issued in conjunction with the execution of interest rate swaps containing a call feature (that mirrors the option embedded in the callable bond), enables us to meet our funding needs at yields not otherwise directly attainable through the issuance of callable debt. We may also issue floating rate debt indexed to other than the 3-month LIBOR (Prime, federal funds rate and 1-month LIBOR). Typically, we would then execute interest rate swaps that would convert the cash flows to the 3-month LIBOR, and designate the hedge as an economic hedge.We have also created synthetic long-term fixed rate funding to fund long-term investments, utilizing a Cash Flow hedging strategy that converted forecasted long-term discount note variable-rate funding to fixed-rate funding by the use of long-term swaps. For such discount notes, the recorded interest expense is equivalent to long-term fixed rate coupons. Cash Flow hedging strategies are also discussed under Table 10.13 Accumulated Other Comprehensive Income (loss) to Current Period Income from Cash Flow Hedges.Table 10.9: Impact of Interest Rate Swaps on Consolidated Obligations Interest Expense Years ended December 31, 2019 2018 2017 Bonds and discount notes - interest expense Bonds - interest expense before adjustment for swaps $ 1,799,624 $ 1,779,595 $ 1,088,084 Discount notes - interest expense before adjustment for swaps 1,285,793 949,313 400,804 Fair value hedging effect on CO bonds(a) 2,220 - - Fair value hedging effect on discount notes(a) (219 ) - - Amortization of basis adjustments on CO bonds (5,753 ) (5,729 ) (4,269 ) Amortization of basis adjustments on discount notes 195 - - Net interest adjustment for swaps hedging CO bonds 2,076 34,366 (11,445 ) Net interest adjustment for swaps hedging discount notes 5,807 11,520 30,918 Total bonds and discount notes - interest expense $ 3,089,743 $ 2,769,065 $ 1,504,092 (a) In 2018 and 2017, prior to the adoption of ASU 2017-12, fair value hedging effects were recorded in Other income (loss) and not in CO debt interest expense. (a)CO bond and discount note hedging — Fair value and cash flow hedges under ASC 815 have been executed to hedge certain fixed-rate CO bonds and discount notes. The cash flows exchanged in the two hedging strategies resulted in Net interest adjustments (also referred to as interest accruals) as noted in the table above and discussed below:A fair value hedge of Consolidated obligation bonds is accomplished by the execution of interest rate swaps in which we receive fixed-rate cash flows, and pay LIBOR-indexed variable cash flows, creating synthetic floating-rate cash flows. The cash flows exchanged between the receive-leg and pay-leg of the cash determine the net interest adjustments. Historically, in a fair value hedge of our debt, the fixed-rate cash flows received from swap dealers on swaps hedging CO bonds have been greater than the LIBOR indexed cash flows we pay to swap dealers, typically resulting in favorable sub-LIBOR cash flows. In 2018, the higher LIBOR-indexed cash flows paid in 2018 have reversed the typical favorable expense adjustments, so that a net unfavorable adjustment of $34.4 million was recorded in 2018, in contrast to favorable adjustments of $11.4 million and $88.2 million in 2017 and 2016.Cash flow hedges under ASC 815 have been executed to hedge future issuances of designated CO discount notes. Long-term interest rate swaps have been executed that have created synthetic fixed-rate cash flows — we pay fixed-rate cash flows and receive LIBOR-indexed variable rate cash flows. The pay fixed-rate cash flows are typically based on long-term swap rates, which have remained significantly higher than the 3-month LIBOR that we receive in exchange. Although the cash flow exchanged in the hedge results in a net interest expense, it achieves our hedging objective of a stable and predictable long-term funding expense. The cash flows exchanged in the two hedging strategies resulted in net unfavorable interest expense accruals of $11.5 million, $30.9 million and $34.9 million in 2018, 2017 and 2016. Unfavorable interest accruals have declined in line with the rising LIBOR, which is the index that references the cash flows received by the FHLBNY.For further information, see Table 10.8 Interest Expenses and accompanying discussions.Allowance for Credit Losses — 2018, 2017 and 2016· Mortgage loans held-for-portfolio— Credit quality continues to be strong, delinquencies low, and allowance for credit losses have remained insignificant. We recorded a net reversal of $0.4 million in the current year, compared to a net reversal of $0.3 million in 2017 and a provision of $2.0 million in 2016.· Advances— Based on the collateral held as security and prior repayment history, no allowance for losses was currently deemed necessary. Our credit risk from advances was concentrated in commercial banks, savings institutions and insurance companies. All advances were fully collateralized during their entire term. In addition, borrowing members pledged their stock in the FHLBNY as additional collateral for advances. —— 2019, 2018 and 2017 and 2016Table10.10: Other Income (Loss) Years ended December 31, 2019 2018 2017 Other income (loss): Service fees and other(a) $ 18,224 $ 18,442 $ 15,841 Instruments held under the fair value option gains (losses)(b) (4,146 ) 209 (4,540 ) Total OTTI losses - (398 ) - Net amount of impairment losses reclassified to (from) Accumulated other comprehensive income (loss) (640 ) 257 - Net impairment losses recognized in earnings (640 ) (141 ) - Derivative gains (losses)(c) (40,720 ) (40,778 ) 1,939 Trading securities gains (losses)(d) 51,327 3,216 (1,106 ) Equity investments gains (losses)(e) 9,843 (4,819 ) - Provision for litigation settlement on derivative contracts(f) - - (70,000 ) Losses from extinguishment of debt - - (137 ) Total other income (loss) $ 33,888 $ (23,871 ) $ (58,003 ) (a) Service fees and other — Service fees are derived primarily from providing correspondent banking services to members,, primarily fees earned on standby financial letters of credit issued by the FHLBNY on behalf of members. Fee income earned on financial letters of credit were $15.3$17.9 million, $12.4$15.3 million and $10.4$12.4 million for the years ended December 31, 2019, 2018 2017 and 2016.2017. Letters of credit are primarily issued on behalf of members to units of state and local governments to collateralize their deposits at member banks.(b) ChangesRepresents changes in fair values on advancesof CO bonds and debtCO discount notes elected under the FVO were not materialFVO; the net loss was in the 2018 periodsline with a declining debt yield curve in parallel with the decline in new elections to replace run offs.2019.(c) Net realized and unrealized gains (losses) on derivatives and hedging activities—Hedging activities reported a net losslosses of $40.7 million and $40.8 million in 2019 and 2018 comparedattributable primarily to a net gainfair value losses on swaps designated in standalone hedges of $1.9 millionU.S. Treasury securities and basis swaps designated in 2017 and a net lossstandalone hedges of $1.7 million in 2016. floating-rate CO bonds. See Table 10.12 Other Income (Loss)—10.12 Earnings Impact of DerivativesDerivative Gains and Hedging Activities — By Financial Instrument Type Losses for more information.(d)(f)Litigation settlement — In the first quarter of 2017, wewe took a charge of $70.0 million and settled the long-standing dispute with Lehman Brothers Special Financing Inc. (Lehman) in a Chapter 11 bankruptcy proceeding. at December 31, 2018, 2017 and 2016 (in thousands):Table 10.11: Net Gains (Losses) on Trading Securities Recorded in the Statements of Income(a) Years ended December 31, 2019 2018 2017 Net unrealized gains (losses) on trading securities held at period-end $ 49,402 $ 2,494 $ (1,069 ) Net unrealized and realized gains (losses) on trading securities sold/matured during the period 1,925 722 (37 ) Net gains (losses) on trading securities $ 51,327 $ 3,216 $ (1,106 ) (a) Securities classified as trading are held for liquidity objectives and carried at fair values. We record changes in fair values of the fair value of these investments through Other income as net unrealizedsecurities together with realized gains (losses) on trading securities.in the Statements of Income as Other income. FHFA regulations prohibit trading in or the speculative use of financial instruments.Earnings Impact of Derivatives and Hedging Activities — 2018, 2017 and 2016We may designate a derivative as either a hedge of (1) the fair value changes of a recognized fixed-rate asset (Advance) or liability (Consolidated obligation debt), or an unrecognized firm commitment; (2) a forecasted transaction; or (3) the variability of future cash flows of a floating-rate asset or liability (Cash flow hedge). We may also designate a derivative as an economic hedge, which does not qualify for hedge accounting under the accounting standards.Derivative fair values are driven largely by the rise and fall of the forward swap curve, which determines forward cash flows, and by changes in the OIS curve, which is the discounting basis. Hedged advances and debt fair values are also driven largely by the rise and fall of the LIBOR curve, which is the discounting basis of hedged advances and bonds in a fair value hedge. Other market factors include interest rate spreads and interest rate volatility. The volume of derivatives and their duration to maturity are factors that are also key drivers of changes in fair values.For derivatives that are not designated in a hedging relationship (i.e. in an economic hedge), the derivatives are considered as a “standalone” instrument and fair value changes are recorded as net unrealized gains or losses, without the offset of a hedged item. Net interest accruals on such “standalone” derivative instruments in economic hedges may also have a significant impact on reported derivatives gains and losses.Generally for the FHLBNY, derivative and hedging gains and losses are primarily from two sources. First, from mismatches between the changes in fair values of the derivative (the hedging instrument) and the changes in fair values of the hedged items on ASC 815 qualifying hedges (fair value effects of derivatives, net of the fair value effects of hedged items); and, second, from fair value changes of standalone derivatives in an economic hedge (fair value changes of derivatives without the offsetting fair value changes of the hedged items). Typically, the largest source of gains or losses from derivative and hedging activities arise from derivatives designated as standalone derivatives. For the FHLBNY, standalone derivatives have typically comprised of swaps in economic hedges of debt and advances when elected under the FVO, interest rate caps in economic hedges of capped floating-rate MBS, and basis swaps hedging floating-rate debt indexed to other than the 3-month LIBOR. For both categories, derivatives that are standalone, and derivatives and hedged items that qualify under hedge accounting rules, fair value gains and losses are unrealized and sum to zero if held to maturity. Interest accruals on standalone derivatives are considered as hedging gains or losses on standalone hedges, and are realized at the periodic accrual settlement dates.Summarized below is the impact of hedging activities on earnings, and a description of where the primary components of expenses and income are reported in the Statements of income (in thousands):Table 10.12:Earnings Impact of Derivatives and Hedging Activities — By Financial Instrument Type(a)Net realized and unrealized gains and losses on derivatives and hedging activities recorded a net loss of $40.8 million in 2018, compared to a net gain of $1.9 million in 2017 and a net loss of $1.7 million in 2016. The primary components were - Price alignment interest (PAI, the interest expense paid on variation margin) was $12.2 million in 2018, compared to $3.3 million in 2017; ASC 815 hedging effects recorded a net fair value loss of $0.5 million in 2018, compared to a net gains of $1.0 million and $2.2 million in 2017 and 2016; standalone derivatives in economic hedges recorded a net loss of $28.7 million in 2018, compared to a net gain of $5.2 million in 2017 and a net loss of $3.6 million in 2016.Impact of Cash flow hedging on earnings and AOCI and Derivative gains and losses reclassified from AOCI to income.The following table summarizes changes in derivative gains and (losses), including reclassifications into earnings from AOCI in the Statements of Condition (in thousands):Table 10.13:Accumulated Other Comprehensive Income (Loss) to Current Period Income from Cash Flow Hedges(a)Net hedging transactions represented the effects of valuation changes of interest rate swaps in ASC 815 cash flow hedges. Valuation gains were unrealized and were consistent with higher long-term swap rates at December 31, 2018, compared to long-term swap rates at the beginning of each previous period. Impact on Other Income (Loss) Years ended December 31, 2019 2018 2017 Derivatives designated as hedging instruments under ASC 815 interest rate swaps Advances $ 1,255 $ 984 Consolidated obligation bonds (1,758 ) 11 Net gains (losses) related to fair value hedges (503 ) 995 Cash flow hedges (278 ) 388 ASC 815 hedging impact $ (781 ) $ 1,383 Derivatives not designated as hedging instruments Interest rate swaps $ (29,688 ) (9,863 ) 5,742 Caps or floors (599 ) (268 ) (4,331 ) Mortgage delivery commitments 709 (145 ) 570 Swaps economically hedging instruments designated under FVO 1,359 (414 ) 4,295 Accrued interest on derivatives in economic hedging relationships (12,501 ) (17,125 ) (2,470 ) Net gains (losses) related to derivatives not designated as hedging instruments $ (40,720 ) $ (27,815 ) $ 3,806 Price alignment interest paid on variation margin - (12,182 ) (3,250 ) Net gains (losses) on derivatives and hedging activities $ (40,720 ) $ (40,778 ) $ 1,939 Years ended December 31, 2019 Percentage of Total 2018 Percentage of Total 2017 Percentage of Total Operating Expenses(a) Occupancy $ 8,305 13.23 % $ 8,211 17.15 % $ 5,480 13.46 % Depreciation and leasehold amortization 8,773 13.97 5,492 11.47 4,432 10.89 All others(b) 45,704 72.80 34,179 71.38 30,799 75.65 Total Operating Expenses $ 62,782 100.00 % $ 47,882 100.00 % $ 40,711 100.00 % Total Compensation and Benefits(c) $ 88,192 $ 78,950 $ 71,090 Finance Agency and Office of Finance(d) $ 16,752 $ 15,874 $ 14,660 Other expenses(e) $ 8,254 $ 7,959 $ 4,461 Valuation changes recorded in AOCI were associated with the two cash flow programs described below, but primarily represented changes in fair values of swaps in the discount note cash flow hedging program. In this program, valuation changes are typically determined by changes in long-term swap rates; and generally, valuation gains will be recorded when long-term swap rates rise, and valuation losses will be recorded when long-term swap rates decline.(a)(b)End of period balances represent effective portions of fair values of contracts that were open at period end. Ineffectiveness, if any associated with the open contracts were de minimis and were recorded through earnings. For more information, see table: Cash Flow hedges — Fair Value changes in AOCI Rollforward Analysis in financial statements Note 17. Derivatives and Hedging Activities.The two Cash Flow hedging strategies were:Hedges of anticipated issuances of Consolidated obligation bonds — From time to time, we execute interest rate swaps on the anticipated issuance of debt to “lock-in” a spread between the earning asset that is expected to settle in a future period and the cost of funding. The swaps are structured to pay fixed-rate, receive LIBOR indexed cash flows. Open swap contracts are valued at the end of each reporting period and fair values are recorded in the balance sheet as a derivative asset or a liability, with an offset to AOCI. In the periods in this report, the effective portion of changes in the fair values of the swaps is recorded in AOCI, and ineffectiveness, if any, is recorded through earnings. In this program, the swap is typically terminated upon issuance of the debt instrument. The termination fair value is recorded in AOCI and reclassified to earnings in the periods in which earnings are affected by the variability of the cash flows of the debt that was issued. Upon adoption of ASU 2017-12 on January 1, 2019, all gains and losses on the swaps will be recorded in AOCI until reclassified to earnings. The maximum period of time that we typically hedge our exposure to the variability in future cash flows (for forecasted transactions to issue Consolidated obligation bonds) is between three and six months.Hedges of discount note issuances — In the “rollover” cash flow hedge strategy, fair values of derivatives are recorded as a derivative asset or a liability in the balance sheet, and the effective portion is recorded as an offset to AOCI. The ineffective portion is recorded in earnings. The objective of this cash flow strategy is to hedge the long-term issuances of Consolidated obligation discount notes, to eliminate the variability of cash flows attributable to changes in the benchmark interest rate (3-month LIBOR), and to create predictable long-term fixed-rate funding.For more information about cash flow strategies, see financial statements, Note 17. Derivatives and Hedging Activities.Operating Expenses, Compensation and Benefits, and Other Expenses — 2018, 2017 and 2016The following table sets forth the major categories of operating expenses (dollars in thousands):Table 10.14: �� Operating Expenses, and Compensation and Benefits
Total
Total
Total(a)Operating expenses included the administrative and overhead costs of operating the FHLBNY, as well as the operating costs of providing advances and managing collateral associated with the advances, managing the investment portfolios, and providing correspondent banking services to members. Occupancy expense has increased in line with new long-term lease agreements effective beginning in the second half of 2017.(b) The category “All others” included temporary workers, computer service agreements, contractual services, professional and legal fees, audit fees, director fees and expenses, insurance and telecommunications. Expenses increased in the current year periods primarily due to increase in consulting fees forexpenses to implement several multi-year technology related projects.enhancement initiatives.(c) Compensation expense increased driven by additions to staff. (c)(d)We are also assessed for our share of the operating expenses for the Finance Agency and the Office of Finance. The FHLBanks and two other GSEs share the entire cost of the Finance Agency. Expenses are allocated by the Finance Agency and the Office of Finance. (d)(e)The category Other expenses included contributions to homeowners and small businesses under a newly established multi-year hurricane relief grant program, the non-service elements of Net periodic pension benefit costs, and derivative clearing fees. — 2018, 2017 and 2016For more information about assessments, see Affordable Housing Program and Other Mission Related Programs and Assessments under Part I Item 1 Business in this Form 10-K.The following table provides rollforward information with respect to changes in Affordable Housing Program liabilities (in thousands):Table 11.1:Affordable Housing Program Liabilities Years ended December 31, 2019 2018 2017 $ 161,718 $ 131,654 $ 125,062 Additions from current period's assessments 52,552 62,382 53,417 (60,376 ) (32,318 ) (46,825 ) $ 153,894 $ 161,718 $ 131,654 compared to $53.4 million and $44.8 million in 2017 and 2016.2017. Assessments are calculated as a percentage of Net income, and the changes in allocations were in parallel with changes in Net income.Item 7A. Quantitative and Qualitative Disclosures about Market Risk.Item 7A. Quantitative and Qualitative Disclosures about Market Risk. 90%84% of the balance sheet consists of predominantly short-term and LIBOR-based assets and liabilities.liabilities synthetically swapped to floating-rate indices. A conservative and limited maturity gap profile of asset and liability positions protect our capital from changes in value arising from interest and rate volatility environment.. All which the LIBOR-based advancesBank uses to match asset and long-term advances are swapped toliability index exposure. Historically the index concentration was 1- or 3-month LIBOR. Advances with adjustable ratesLIBOR driven, however as the Bank strategizes to address LIBOR cessation, the SOFR and OIS indices are tailored to reset to a LIBOR index while long-term consolidated obligations are swapped to 1- or 3-month LIBOR. These features createincreasingly being utilized. Index matching allows for a relatively steady income that changes in concert with prevailing interest rate changes to maintain a spread to short-term rates.Measurements.Measurements. Our Risk Management Policy assigns comprehensive risk limits which we calculate on a regular basis. The risk limits are as follows:· The option-adjusted DOE is limited to a range of +2.0 years to -3.5 years in the rates unchanged case, and to a range of +/-5.0 years in the +/-200bps shock cases.· The one-year cumulative re-pricing gap is limited to 10 percent of total assets.· The sensitivity of expected net interest income over a one-year period is limited to a -15 percent change under the +200bps shock compared to the rates in the unchanged case. Although, we previously also had a limit at a -200bps shock, in the third quarter of 2018 an internal review was performed and at the recommendation of management, the -200bp shock was suspended by the Board of Directors on September 20, 2018 for the remainder of the year.· The potential decline in the market value of equity is limited to a 10 percent change under the +/-200bps shocks.· KRD exposure at any of nine term points (3-month, 1-year, 2-year, 3-year, 5-year, 7-year, 10-year, 15-year, and 30-year) is limited to between +/-12 months through the 3-year term point and a cumulative limit of +/-30 months from the 5-year through 30-year term points.· The option-adjusted DOE is limited to a range of +2.0 years to -3.5 years in the rates unchanged case, and to a range of +/-5.0 years in the +/-200bps shock cases. · The one-year cumulative re-pricing gap is limited to 10 percent of total assets. · The sensitivity of expected net interest income over a one-year period is limited to a -15 percent change under the +200bps shock compared to the rates in the unchanged case. The sensitivity of expected net interest income over a one-year period is limited to a -40 percent change under the -200bps shock compared to the rates in the unchanged case. This limit was re-established and made consistent with current market conditions and reflective of updated modelling assumptions. This metric models the Bank’s sensitivity of earnings to changes in the level of rates along the yield curve. The model results will reflect the impact of net interest income compression when the Bank’s floating rate advances and related debt both decline towards zero. · The potential decline in the market value of equity is limited to a 10 percent change under the +/-200bps shocks. · KRD exposure at any of nine term points (3-month, 1-year, 2-year, 3-year, 5-year, 7-year, 10-year, 15-year, and 30-year) is limited to between +/-12 months through the 3-year term point and a cumulative limit of +/-30 months from the 5-year through 30-year term points. below (due to the on-going low interest rate environment, there was no down 200bps measurement presented in the fourth quarter of 2017. However, the Bank has presented a down 100bps measurement beginning in the fourth quarter of 2017 and a down 200bps in 2018):below: Base Case DOE -200bps DOE -100bps DOE +200bps DOE December 31, 2019 -0.87 0.12 -2.11 0.37 September 30, 2019 0.06 1.64 0.88 0.72 June 30, 2019 -0.28 0.82 -1.09 0.44 March 31, 2019 -0.19 0.72 -1.04 0.42 December 31, 2018 -0.05 -0.76 -0.79 0.31
Re-pricing Gap$ 5.936 Billion September 30, 2019 $ 5.632 Billion June 30, 2019 $ 5.818 Billion March 31, 2019 $ 6.053 Billion December 31, 2018 September 30, 2018$6.363 BillionJune 30, 2018$6.527 BillionMarch 31, 2018$6.738 BillionDecember 31, 2017$7.592 Billionthe change to the spread in the shocksa parallel shift of +200bps is calculated and compared against the base case and subjected to a -15 percent limit. DueThe sensitivity of expected net interest income over a one-year period is limited to a -40 percent change under the -200bps shock compared to the ongoing low interest rate environment, the down 200bps measurement was not presented between the fourth quarter of 2017 to the fourth quarter of 2018; however, the Bank has presented a down 100bps measurement beginningrates in the fourth quarterunchanged case. This limit was re-established and made consistent with current market conditions and reflective of 2017.updated modelling assumptions.With respect to the Bank’s Net Interest Income (NII) Sensitivity to a -200bps parallel yield shift, this Board limit contained in this model was originally constructed to measure income variability from mortgage prepayment risk. However, the model’s measurement did not account for either outlier results in near zero interest rate environments or expected management actions. An internal review was performed and, at the recommendation of management, this limit was suspended by the Board of Directors on September 20, 2018 for the remainder of the year. The FHLBNY is refining the methodology and will also consider it for reporting in future filings. Sensitivity in
the -200bps
Shock Sensitivity in
the -100bps
Shock Sensitivity in
the +200bps
Shock December 31, 2019 -32.91 % -5.55 % 6.96 % September 30, 2019 -31.16 % -3.05 % 2.72 % June 30, 2019 -14.30 % -7.37 % 11.10 % March 31, 2019 -12.91 % -6.44 % 9.61 % December 31, 2018 N/A -5.86 % 12.26 %
the -200bps
Shock
the -100bps
Shock
the +200bps
Shockbelow (due to the ongoing low interest rate environment, the down 200bps measurement was not presented in the fourth quarter of 2017; however, the Bank has presented a down 100bps measurement beginning the fourth quarter of 2017 and a down 200bps in 2018):below:
in MVE
in MVE
in MVE -200bps Change
in MVE -100bps Change
in MVE +200bps Change
in MVE December 31, 2019 -1.93 % -1.60 % 0.19 % September 30, 2019 -0.55 % -0.63 % -0.95 % June 30, 2019 -1.51 % -0.81 % -0.34 % March 31, 2019 -1.61 % -0.51 % -0.81 % December 31, 2018 -1.63 % -0.41 % -0.50 % 20182019 and December 31, 20172018 (in millions): Interest Rate Sensitivity December 31, 2019
or Less
Six Months to
One Year
One Year to
Three Years
Three Years to
Five Years
Five Years Interest-earning assets: Non-MBS investments $ 25,527 $ 234 $ 646 $ 472 $ 1,639 MBS investments 5,781 943 2,167 1,657 6,142 Swaps hedging MBS 532 - - - (532 ) Adjustable-rate loans and advances 16,368 - - - - Net investments, adjustable rate loans and advances 48,208 1,177 2,813 2,129 7,249 Liquidity trading portfolio 2,446 3,708 9,109 2 - Swaps hedging investments 12,780 (3,710 ) (9,070 ) - - Net liquidity trading portfolio 15,226 (2 ) 39 2 - Fixed-rate loans and advances 49,892 4,502 14,493 5,557 9,584 Swaps hedging advances 31,083 (4,008 ) (12,966 ) (4,566 ) (9,543 ) Net fixed-rate loans and advances 80,975 494 1,527 991 41 Total interest-earning assets $ 144,409 $ 1,669 $ 4,379 $ 3,122 $ 7,290 Interest-bearing liabilities: Deposits $ 1,155 $ 5 $ - $ - $ - Discount notes 73,942 - - - - Swapped discount notes (2,664 ) 525 531 90 1,518 Net discount notes 71,278 525 531 90 1,518 Consolidated Obligation Bonds FHLBank bonds 57,598 6,463 6,518 2,424 5,320 Swaps hedging bonds 8,601 (5,483 ) (2,305 ) (88 ) (725 ) Net FHLBank bonds 66,199 980 4,213 2,336 4,595 Total interest-bearing liabilities $ 138,632 $ 1,510 $ 4,744 $ 2,426 $ 6,113 Post hedge gaps(a): Periodic gap $ 5,777 $ 159 $ (365 ) $ 696 $ 1,177 Cumulative gaps $ 5,777 $ 5,936 $ 5,571 $ 6,267 $ 7,444 (a)Re-pricing gaps are estimated at the scheduled rate reset dates for floating rate instruments, and at maturity for fixed rate instruments. For callable instruments, the re-pricing period is estimated by the earlier of the estimated call date under the current interest rate environment or the instrument’s contractual maturity. Interest Rate Sensitivity December 31, 2018
or Less
Six Months to
One Year
One Year to
Three Years
Three Years to
Five Years
Five Years Interest-earning assets: Non-MBS investments $ 12,881 $ 143 $ 514 $ 424 $ 1,952 MBS investments 7,900 536 2,546 1,343 4,431 Adjustable-rate loans and advances 23,395 - - - - Net investments, adjustable rate loans and advances 44,176 679 3,060 1,767 6,383 Liquidity trading portfolio 1,712 1,963 1,980 3 - Swaps hedging investments 3,975 (1,975 ) (2,000 ) - - Net liquidity trading portfolio 5,687 (12 ) (20 ) 3 - Fixed-rate loans and advances 42,055 10,332 18,246 5,416 5,991 Swaps hedging advances 36,400 (9,276 ) (16,931 ) (4,255 ) (5,938 ) Net fixed-rate loans and advances 78,455 1,056 1,315 1,161 53 Loans to other FHLBanks 250 - - - - Total interest-earning assets $ 128,568 $ 1,723 $ 4,355 $ 2,931 $ 6,436 Interest-bearing liabilities: Deposits $ 1,038 $ 5 $ - $ - $ - Discount notes 50,230 410 - - - Swapped discount notes (2,664 ) - 971 85 1,608 Net discount notes 47,566 410 971 85 1,608 Consolidated Obligation Bonds FHLBank bonds 50,615 16,007 9,579 3,296 4,406 Swaps hedging bonds 23,556 (15,324 ) (6,490 ) (992 ) (750 ) Net FHLBank bonds 74,171 683 3,089 2,304 3,656 Total interest-bearing liabilities $ 122,775 $ 1,098 $ 4,060 $ 2,389 $ 5,264 Post hedge gaps(a): Periodic gap $ 5,793 $ 625 $ 295 $ 542 $ 1,172 Cumulative gaps $ 5,793 $ 6,418 $ 6,713 $ 7,255 $ 8,427 Item 8.Financial Statements and Supplementary Data.(a) Re-pricing gaps are estimated at the scheduled rate reset dates for floating rate instruments, and at maturity for fixed rate instruments. For callable instruments, the re-pricing period is estimated by the earlier of the estimated call date under the current interest rate environment or the instrument’s contractual maturity. Item 8. Financial Statements and Supplementary Data. 979820182019 and 201720181002017 and 201620171012017 and 201620171022017 and 201620171032017 and 20162017104106Supplementary financial data for each full quarter within the two years ended December 31, 2018 are included in Item 6. Selected Financial Data.2018.2019. In making this assessment, it used the criteria set forth by the Committee of Sponsoring Organizations of the Treadway Commission (COSO) inInternal Control-Integrated Framework (2013). Based on its assessment, management of the Bank determined that as of December 31, 2018,2019, the Bank’s internal control over financial reporting was effective based on those criteria.Report of Independent Registered Public Accounting Firm
To the Board of Directors and Shareholders of the
Opinions on the Financial Statements and Internal Control over Financial ReportingWe have audited the accompanying statements of condition of the Federal Home Loan Bank of New York (the “FHLBank”) as of December 31, 2018 and 2017, and the related statements of income, comprehensive income, capital and cash flows for each of the three years in the period ended December 31, 2018, including the related notes (collectively referred to as the “financial statements”). We also have audited the FHLBank’s internal control over financial reporting as of December 31, 2018 based on criteria established in Internal Control - Integrated Framework (2013) issued by the Committee of Sponsoring Organizations of the Treadway Commission (COSO).In our opinion, the financial statements referred to above present fairly, in all material respects, the financial position of the FHLBank as of December 31, 2018 and 2017, and the results of its operations and its cash flows for each of the three years in the period ended December 31, 2018 in conformity with accounting principles generally accepted in the United States of America. Also in our opinion, the FHLBank maintained, in all material respects, effective internal control over financial reporting as of December 31, 2018, based on criteria established in Internal Control - Integrated Framework (2013) issued by the COSO.Basis for OpinionsThe FHLBank’s management is responsible for these financial statements, for maintaining effective internal control over financial reporting, and for its assessment of the effectiveness of internal control over financial reporting, included in the accompanying Management’s Report on Internal Control over Financial Reporting. Our responsibility is to express opinions on the FHLBank’s financial statements and on the FHLBank’s internal control over financial reporting based on our audits. We are a public accounting firm registered with the Public Company Accounting Oversight Board (United States) (PCAOB) and are required to be independent with respect to the FHLBank in accordance with the U.S. federal securities laws and the applicable rules and regulations of the Securities and Exchange Commission and the PCAOB.We conducted our audits in accordance with the standards of the PCAOB. Those standards require that we plan and perform the audits to obtain reasonable assurance about whether the financial statements are free of material misstatement, whether due to error or fraud, and whether effective internal control over financial reporting was maintained in all material respects.Our audits of the financial statements included performing procedures to assess the risks of material misstatement of the financial statements, whether due to error or fraud, and performing procedures that respond to those risks. Such procedures included examining, on a test basis, evidence regarding the amounts and disclosures in the financial statements. Our audits also included evaluating the accounting principles used and significant estimates made by management, as well as evaluating the overall presentation of the financial statements. Our audit of internal control over financial reporting included obtaining an understanding of internal control over financial reporting, assessing the risk that a material weakness exists, and testing and evaluating the design and operating effectiveness of internal control based on the assessed risk. Our audits also included performing such other procedures as we considered necessary in the circumstances. We believe that our audits provide a reasonable basis for our opinions.Definition and Limitations of Internal Control over Financial ReportingA company’s internal control over financial reporting is a process designed to provide reasonable assurance regarding the reliability of financial reporting and the preparation of financial statements for external purposes in accordance with generally accepted accounting principles. A company’s internal control over financial reporting includes those policies and procedures that (i) pertain to the maintenance of records that, in reasonable detail, accurately and fairly reflect the transactions and dispositions of the assets of the company; (ii) provide reasonable assurance that transactions are recorded as necessary to permit preparation of financial statements in accordance with generally accepted accounting principles, and that receipts and expenditures of the company are being made only in accordance with authorizations of management and directors of the company; and (iii) provide reasonable assurance regarding prevention or timely detection of unauthorized acquisition, use, or disposition of the company’s assets that could have a material effect on the financial statements.Because of its inherent limitations, internal control over financial reporting may not prevent or detect misstatements. Also, projections of any evaluation of effectiveness to future periods are subject to the risk that controls may become inadequate because of changes in conditions, or that the degree of compliance with the policies or procedures may deteriorate.
New York, New YorkMarch 21, 2019We have served as the FHLBank’s auditor since 1990.Federal Home Loan Bank of New York20182019 and December 31, 20172018 December 31, 2019 December 31, 2018 $ 603,241 $ 85,406 14,985,000 4,095,000 8,640,000 7,640,000
(Includes $239,813 pledged as collateral at December 31, 2018 and $239,064 at December 31, 2017)Trading securities (Note 5)
(Includes $251,177 pledged as collateral at December 31, 2019 and $239,813 at December 31, 2018) 15,318,809 5,810,512 60,047 48,179
of $4,034 at December 31, 2018 and $10,178 at December 31, 2017 (Note 7)
(Includes $4,548 pledged as collateral at December 31, 2018 and $5,728 at December 31, 2017)Available-for-sale securities, net of unrealized gains (losses)
of $97,868 at December 31, 2019 and $4,034 at December 31, 2018 (Note 7) 2,653,418 422,216 Held-to-maturity securities (Note 8)
(Includes $3,719 pledged as collateral at December 31, 2019 and $4,548 at December 31, 2018) 15,234,482 17,474,826 Advances (Note 9)
(Includes $0 at December 31, 2019 and December 31, 2018 at fair value under the fair value option) 100,695,241 105,178,833 Mortgage loans held-for-portfolio, net of allowance for credit losses
of $653 at December 31, 2019 and $814 at December 31, 2018 (Note 10) 3,173,352 2,927,230 - 250,000 312,559 275,256 63,426 51,572 Operating lease right-of-use assets (Note 19) 75,464 - 237,947 113,762 9,036 8,602 $ 162,062,022 $ 144,381,394 $ 1,144,519 $ 1,002,587 34,890 20,050 15,000 40,000 1,194,409 1,062,637 Bonds (Includes $12,134,043 December 31, 2019
and $5,159,792 at December 31, 2018 at fair value under the fair value option) 78,763,309 84,153,776 Discount notes (Includes $2,186,603 at December 31, 2019
and $3,180,086 at December 31, 2018 at fair value under the fair value option) 73,959,205 50,640,238 152,722,514 134,794,014 5,129 5,845 156,889 223,570 153,894 161,718 32,411 31,147 175,516 355,841 Operating lease liabilities (Note 19) 89,365 - 154,530,127 136,634,772
60,658 at December 31, 2018 and 67,500 at December 31, 2017Capital stock ($100 par value), putable, issued and outstanding shares:
57,787 at December 31, 2019 and 60,658 at December 31, 2018 5,778,666 6,065,799 1,115,236 1,102,801 685,798 591,281 1,801,034 1,694,082 (47,805 ) (13,259 ) 7,531,895 7,746,622 $ 162,062,022 $ 144,381,394 Years ended December 31, 2019 2018 2017 Interest income Advances, net (Note 9) $ 2,526,662 $ 2,522,040 $ 1,563,322 Interest-bearing deposits 4,561 420 168 Securities purchased under agreements to resell (Note 4) 178,565 78,341 25,509 Federal funds sold (Note 4) 228,388 312,278 163,411 Trading securities (Note 5) 215,583 74,412 3,085 Available-for-sale securities (Note 7) 68,053 12,161 9,936 Held-to-maturity securities (Note 8) 457,746 489,223 382,591 Mortgage loans held-for-portfolio (Note 10) 101,223 97,479 94,255 Loans to other FHLBanks (Note 20) 165 130 26 Total interest income 3,780,946 3,586,484 2,242,303 Interest expense Consolidated obligation bonds (Note 12) 1,798,167 1,808,232 1,072,370 Consolidated obligation discount notes (Note 12) 1,291,576 960,833 431,722 Deposits (Note 11) 22,839 17,816 15,060 Mandatorily redeemable capital stock (Note 14) 379 964 1,285 Cash collateral held and other borrowings 895 1,614 342 Total interest expense 3,113,856 2,789,459 1,520,779 Net interest income before provision for credit losses 667,090 797,025 721,524 Provision (Reversal) for credit losses on mortgage loans (142 ) (371 ) (287 ) Net interest income after provision for credit losses 667,232 797,396 721,811 Other income (loss) Service fees and other 18,224 18,442 15,841 Instruments held under the fair value option gains (losses) (Note 18) (4,146 ) 209 (4,540 ) Total OTTI losses - (398 ) - Net amount of impairment losses reclassified to (from) Accumulated other comprehensive income (loss) (640 ) 257 - Net impairment losses recognized in earnings (640 ) (141 ) - Derivative gains (losses) (Note 17) (40,720 ) (40,778 ) 1,939 Trading securities gains (losses) (Note 5) 51,327 3,216 (1,106 ) Equity investments gains (losses) (Note 6) 9,843 (4,819 ) - Provision for litigation settlement on derivative contracts - - (70,000 ) Losses from extinguishment of debt - - (137 ) Total other income (loss) 33,888 (23,871 ) (58,003 ) Other expenses Operating 62,782 47,882 40,711 Compensation and benefits 88,192 78,950 71,090 Finance Agency and Office of Finance 16,752 15,874 14,660 Other expenses 8,254 7,959 4,461 Total other expenses 175,980 150,665 130,922 Income before assessments 525,140 622,860 532,886 Affordable Housing Program Assessments (Note 13) 52,552 62,382 53,417 Net income $ 472,588 $ 560,478 $ 479,469 Basic earnings per share (Note 15) $ 8.52 $ 9.09 $ 7.66 Thousands, Except Per Share Data)Thousands)2017 and 20162017 Years ended December 31, 2019 2018 2017 Net Income $ 472,588 $ 560,478 $ 479,469 Other Comprehensive income (loss) Net change in unrealized gains (losses) on available-for-sale securities 93,834 (1,220 ) 5,954 Net change in non-credit portion of other-than-temporary impairment losses
on held-to-maturity securities Non-credit portion of other-than-temporary impairment gains (losses) - (257 ) - Reclassification of non-credit portion included in net income 640 - - Accretion of non-credit portion of OTTI 2,850 3,999 15,431 Total net change in non-credit portion of other-than-temporary
impairment losses on held-to-maturity securities 3,490 3,742 15,431 Net change due to hedging activities Cash flow hedges(a) (111,275 ) 36,636 27,141 Fair value hedges(b) (11,593 ) - - Total net change due to hedging activities (122,868 ) 36,636 27,141 Net change in pension and postretirement benefits (9,002 ) 7,756 (8,125 ) Total other comprehensive income (loss) (34,546 ) 46,914 40,401 Total comprehensive income (loss) $ 438,042 $ 607,392 $ 519,870 (a) Represents changes in the fair values of derivatives in cash flow hedging programs, primarily from open contracts in the hedging of rolling issuance of CO discount notes, and any open contracts in cash flow hedges of anticipatory issuance of CO bonds. Also includes unamortized gains and losses related to closed cash flow hedges that will be amortized in future periods from AOCI to Interest expense. For more information, see table “Cash flow hedge gains and losses” in Note 17. Derivatives and Hedging Activities. (b) Represents cumulative hedge valuation basis adjustments on fair value hedges of AFS securities under the partial-term hedging provisions of ASU 2017-12. The amount was the change in the unrealized fair value of the hedged security due to change in the benchmark rate component elected in the hedging strategy. Quarterly changes in the benchmark rate will be recorded through AOCI with an offset to earnings until the hedged securities mature or are sold. Comprehensive IncomeCapital — (In Thousands)Thousands, Except Per Share Data)2017 and 20162017 Accumulated Capital Stock(a) Other Class B Retained Earnings Comprehensive Total Shares Par Value Unrestricted Restricted Total Income (Loss) Capital Balance, December 31, 2016 63,077 $ 6,307,766 $ 1,028,674 $ 383,291 $ 1,411,965 $ (95,650 ) $ 7,624,081 Proceeds from issuance of capital stock 64,508 6,450,844 - - - - 6,450,844 Repurchase/redemption of capital stock (60,055 ) (6,005,596 ) - - - - (6,005,596 ) Shares reclassified to mandatorily redeemable capital stock (30 ) (3,009 ) - - - - (3,009 ) Cash dividends ($5.54 per share) on capital stock - - (345,152 ) - (345,152 ) - (345,152 ) Comprehensive income (loss) - - 383,575 95,894 479,469 40,401 519,870 Balance, December 31, 2017 67,500 $ 6,750,005 $ 1,067,097 $ 479,185 $ 1,546,282 $ (55,249 ) $ 8,241,038 Adjustments to opening balances(b) - - 4,924 - 4,924 (4,924 ) - Proceeds from issuance of capital stock 79,779 7,977,851 - - - - 7,977,851 Repurchase/redemption of capital stock (86,533 ) (8,653,301 ) - - - - (8,653,301 ) Shares reclassified to mandatorily redeemable capital stock (88 ) (8,756 ) - - - - (8,756 ) Cash dividends ($6.66 per share) on capital stock - - (417,602 ) - (417,602 ) - (417,602 ) Comprehensive income (loss) - - 448,382 112,096 560,478 46,914 607,392 Balance, December 31, 2018 60,658 $ 6,065,799 $ 1,102,801 $ 591,281 $ 1,694,082 $ (13,259 ) $ 7,746,622 Proceeds from issuance of capital stock 82,801 8,280,054 - - - - 8,280,054 Repurchase/redemption of capital stock (85,630 ) (8,563,003 ) - - - - (8,563,003 ) Shares reclassified to mandatorily redeemable capital stock (42 ) (4,184 ) - - - - (4,184 ) Cash dividends ($6.49 per share) on capital stock - - (365,636 ) - (365,636 ) - (365,636 ) Comprehensive income (loss) - - 378,071 94,517 472,588 (34,546 ) 438,042 Balance, December 31, 2019 57,787 $ 5,778,666 $ 1,115,236 $ 685,798 $ 1,801,034 $ (47,805 ) $ 7,531,895 (a) Putable stock. Cash dividends paid — Dividends per share and aggregate dividends were paid on a single class of shares of capital stock. For more information, see Note 14. Capital Stock, Mandatorily Redeemable Capital Stock and Restricted Earnings. (b) Cumulative catch-up adjustment upon adoption of ASU 2016-01 relating to change in the designation of funds in the grantor trust from AFS to Equity Investments. CapitalCash Flows — (In Thousands, Except Per Share Data)Thousands)2017 and 20162017(a)Putable stock. Cash dividends paid — Dividends per share and aggregate dividends were paid on a single class of shares of capital stock. For more information, see Note 14. Capital Stock, Mandatorily Redeemable Capital Stock and Restricted Earnings.(b)Cumulative catch-up adjustment upon adoption of ASU 2016-01 relating to change in the designation of funds in the grantor trusts from AFS to Equity Investments. Years ended December 31, 2019 2018 2017 Operating activities Net Income $ 472,588 $ 560,478 $ 479,469 Adjustments to reconcile net income to net cash provided by operating activities: Depreciation and amortization: Net premiums and discounts on consolidated obligations,
investments, mortgage loans and other adjustments(a) (88,742 ) 87,628 (13,886 ) Concessions on consolidated obligations 3,223 2,586 4,110 Premises, software, and equipment 8,773 5,492 4,432 Provision (Reversal) for credit losses on mortgage loans (142 ) (371 ) (287 ) Credit impairment losses on held-to-maturity securities 640 141 - Change in net fair value adjustments on derivatives and hedging activities (249,537 ) 33,840 144,391 Net realized and unrealized (gains) losses on trading securities (51,327 ) (3,216 ) 1,106 Change in fair value on Equity Investments (7,866 ) 4,819 - Change in fair value adjustments on financial instruments held at fair value 4,146 (209 ) 4,603 Losses from extinguishment of debt - - 137 Net change in: Accrued interest receivable (38,012 ) (49,850 ) (64,139 ) Derivative assets due to accrued interest (223 ) (150,869 ) (40,654 ) Derivative liabilities due to accrued interest 12,436 93,482 50,354 Other assets (883 ) (1,429 ) (1,809 ) Affordable Housing Program liability (7,824 ) 30,064 6,592 Accrued interest payable (66,681 ) 61,394 31,998 Other liabilities(a) 24,057 7,828 29,385 Total adjustments (457,962 ) 121,330 156,333 Net cash provided by (used in) operating activities 14,626 681,808 635,802 Investing activities Net change in: Interest-bearing deposits (278,148 ) (53,440 ) 235,061 Securities purchased under agreements to resell (10,890,000 ) (1,395,000 ) 4,450,000 Federal funds sold (1,000,000 ) 2,686,000 (3,643,000 ) Deposits with other FHLBanks 46 255 (67 ) Premises, software, and equipment (20,627 ) (27,366 ) (21,508 ) Trading securities: Purchased (13,258,945 ) (5,550,105 ) (1,881,028 ) Repayments 2,489,363 1,216,237 270,930 Proceeds from sales 1,199,179 349,383 100,164 Equity Investments: Purchased (6,055 ) (3,846 ) - Proceeds from sales 2,054 1,825 - Available-for-sale securities: Purchased (621,869 ) - (2,075 ) Repayments 76,499 105,551 129,872 Proceeds from sales - - 1,788 Held-to-maturity securities: Long-term securities Purchased (2,382,169 ) (3,520,254 ) (4,478,887 ) Repayments(b) 3,015,579 3,858,408 2,686,796 Advances: Principal collected 1,125,987,329 1,107,754,440 1,060,666,397 Made (1,120,949,550 ) (1,090,480,856 ) (1,074,132,845 ) Mortgage loans held-for-portfolio: Principal collected 313,813 264,643 268,375 Purchased (566,416 ) (301,694 ) (425,106 ) Proceeds from sales of REO 2,666 2,799 4,135 Net change in loans to other FHLBanks 250,000 (250,000 ) 255,000 Net cash provided by (used in) investing activities (16,637,251 ) 14,656,980 (15,515,998 ) 2017 and 20162017 Years ended December 31, 2019 2018 2017 Financing activities Net change in: Deposits and other borrowings $ 62,195 $ (123,357 ) $ (13,268 ) Derivative contracts with financing element (16,542 ) (8,457 ) (18,464 ) Consolidated obligation bonds: Proceeds from issuance 99,473,389 111,130,060 93,274,082 Payments for maturing and early retirement (105,040,533 ) (126,220,249 ) (78,726,129 ) Consolidated obligation discount notes: Proceeds from issuance 1,272,192,911 1,177,557,595 1,191,518,054 Payments for maturing (1,248,877,475 ) (1,176,600,469 ) (1,191,264,042 ) Capital stock: Proceeds from issuance of capital stock 8,280,054 7,977,851 6,450,844 Payments for repurchase/redemption of capital stock (8,563,003 ) (8,653,301 ) (6,005,596 ) Redemption of mandatorily redeemable capital stock (4,900 ) (22,856 ) (14,499 ) Cash dividends paid(c) (365,636 ) (417,602 ) (345,152 ) Net cash provided by (used in) financing activities 17,140,460 (15,380,785 ) 14,855,830 Net increase (decrease) in cash and due from banks 517,835 (41,997 ) (24,366 ) Cash and due from banks at beginning of the period(d) 85,406 127,403 151,769 Cash and due from banks at end of the period(d) $ 603,241 $ 85,406 $ 127,403 Supplemental disclosures: Interest paid $ 1,905,145 $ 1,714,564 $ 1,064,684 Interest paid for Discount Notes(e) $ 1,268,051 $ 878,103 $ 371,993 Affordable Housing Program payments(f) $ 60,376 $ 32,318 $ 46,825 Transfers of mortgage loans to real estate owned $ 773 $ 1,090 $ 1,071 Net amount of impairment losses reclassified to (from)
Accumulated other comprehensive income (loss)
$
(640
)
$
257
$
-
Capital stock subject to mandatory redemption reclassified from equity $ 4,184 $ 8,756 $ 3,009 Securities traded but not settled $ - $ 149,874 $ - Transfers of HTM securities to AFS that are not other-than-temporarily impaired(g) $ 1,597,207 $ - $ - The accompanying notes are an integral part of these financial statements.Federal Home Loan Bank of New YorkStatements of Cash Flows — (In Thousands)Years Ended December 31, 2018, 2017 and 20162018:2019:(a)Ambac corporate notes at fair values of $3.6 million were received as non-cash considerations on mortgage-backed securities insured by the Ambac Corporation. The notes were designated as Trading Securities.(b)Equity Investments at fair values of $48.6 million were recorded at January 1, 2018 as a non-cash transfer from the available-for-sale category to Equity Investments upon adoption of ASU 2016-01. The ASU required the equity investments to be measured at fair value through earnings, thus eliminating eligibility for the available-for-sale category. Upon implementation of the ASU, a $4.9 million cumulative catch-up adjustment, representing a net valuation gain at December 31, 2017, was reclassified from AOCI to retained earnings at January 1, 2018, the adoption date.(c)Includes $0.4 million non-cash principal pay-down on held-to-maturity MBS, and $3.3 million non-cash reduction of amortized cost basis of certain insured MBS. The non-cash amounts were also part of the considerations received from Ambac Corporation.(a) The adoption of ASU 2016-02, Leases (Topic 842) resulted in the recognition of non-cash right-of-use operating assets of $71.6 million and lease liabilities of $83.9 million as of January 1, 2019. For cash flow information on operating leases outstanding at December 31, 2019, including additions, see Operating Lease Commitments in Note 19. Commitments and Contingencies. (b) Non-cash paydowns on HTM securities were $3.8 million. (d)(c) Does not include payments to holders of mandatorily redeemable capital stock. Such payments are considered as interest expense and reported within operating cash flows. (d) Cash and due from banks did not include any restricted cash or cash equivalents. Includes pass-thru reserves at the Federal Reserve Bank of New York. See Note 3. Cash and Due from Banks for further information. (e) Interest paid disclosures have been supplemented for the years ended December 31, 2019, 2018 and 2017 under the disclosure guidance provided under ASU 2016-15, Statements of Cash flows (Topic 230), “Classification of Certain Cash Receipts and Cash Payments”, which the FHLBNY adopted on January 1, 2018: the line item, Interest paid for Discount Notes, is the portion of the cash payments at settlement of zero-coupon Consolidated obligation discount notes. (f) AHP payments = (beginning accrual - ending accrual) + AHP assessment for the period; payments represent funds released to the Affordable Housing Program. (g) As of January 1, 2019, the FHLBNY elected (as permitted under ASU 2017-12) and transferred $1.6 billion (amortized cost basis) of fixed-rate MBS from HTM classification to AFS classification. (e)Cash and due from banks did not include any restricted cash or cash equivalents. Includes pass-thru reserves at the Federal Reserve Bank of New York. See Note 3. Cash and Due from Banks for further information.(f)Interest paid disclosures have been supplemented for the twelve months ended December 31, 2018, 2017 and 2016 under the disclosure guidance provided by ASU 2016-15, Statements of Cash flows (Topic 230), “Classification of Certain Cash Receipts and Cash Payments”, which the FHLBNY adopted on January 1, 2018: the line item is the portion of the cash payments at settlement of zero-coupon Consolidated obligation discount notes.(g)AHP payments = (beginning accrual - ending accrual) + AHP assessment for the period; payments represent funds released to the Affordable Housing Program.TheseThe most significant of these policies include derivative hedging relationships, estimating the fair values of certain assets and liabilities, estimating the allowance for credit losses on the advance and mortgage loan portfolios, and evaluating the impairment of the FHLBNY’s securities portfolios, and estimating fair values of certain assets and liabilities.portfolios. from time to time, securities purchased under agreements to resell that are subject to enforceable master netting arrangements. The FHLBNY has elected to offset its derivative asset and liability positions, as well as cash collateral received or pledged, when it has the legal right of offset under these master agreements. The FHLBNY did not have any offsetting liabilities related to its securities purchased under agreements to resell for the periods presented.· Market approach — This technique uses prices and other relevant information generated by market transactions involving identical or comparable assets or liabilities.· Income approach — This technique uses valuation techniques to convert future amounts (for example, cash flows or earnings) to a single present amount (discounted), based on assumptions used by market participants. When the income approach is used, the fair value measurement reflects current market expectations about those future amounts. The present value technique used to measure fair value depends on the facts and circumstances specific to the asset or liability being measured and the availability of data.· Cost approach — This approach is based on the amount that currently would be required to replace the service capacity of an asset (often referred to as current replacement cost).· Market approach — This technique uses prices and other relevant information generated by market transactions involving identical or comparable assets or liabilities. · Income approach — This technique uses valuation techniques to convert future amounts (for example, cash flows or earnings) to a single present amount (discounted), based on assumptions used by market participants. When the income approach is used, the fair value measurement reflects current market expectations about those future amounts. The present value technique used to measure fair value depends on the facts and circumstances specific to the asset or liability being measured and the availability of data. · Cost approach — This approach is based on the amount that currently would be required to replace the service capacity of an asset (often referred to as current replacement cost). are GSE-issued variable-rate collateralized mortgage obligations and are recorded at fair values. The MBS fair values are estimated by management using specialized pricing services that employ pricing models or quoted prices of securities with similar characteristics. The FHLBNY has established that the pricing vendors use methods thatFederal Home Loan Bank of New YorkNotes to Financial StatementsFair values of Other assets and liabilities —For more information about methodologies used by the FHLBNY to validate vendor pricing, and fair value “Levels” associated with assets and liabilities recorded on the FHLBNY’s Statements of Condition at December 31, 20182019 and 2017,2018, see financial statements, Note 18. Fair Values of Financial Instruments.securities.securities, and a small portfolio of bonds issued by housing finance agencies. Investments designated as trading are primarily U.S. Treasury securities. Purchases and sales of securities are recorded on a trade date basis. Prepayments are estimated for purposes of amortizing premiums and accreting discounts on investment securities in accordance with accounting standards for investments in debt and equity securities, which requires premiums and discounts to be recognized in income at a constant effective yield over the life of the instrument. Because actual prepayments often deviate from the estimates, the effective yield is recalculated periodically to reflect actual prepayments to date. Adjustments of the effective yields for mortgage-backed securities are recorded on a retrospective basis, as if the new estimated life of the security had been known at its original acquisition date.primarilytypically in U.S. Treasury securities and GSE-issued bonds. The securities are carried at fair value with changes in the fair value of these investments recorded in Other income. The Bank does not participate in speculative trading practices and holds these investments indefinitely as the FHLBNY periodically evaluates its liquidity needs.forof a held-to-maturity security that is not OTTI is its amortized cost basis. Interest earned on such securities is included in Interest income. and equity securities, sales of debt securities that meet either of the following two conditions may be considered as maturities for purposes of the classification of securities: (1) the sale occurs near enough to its maturity date (or call date if exercise of the call is probable) such that interest rate risk is substantially eliminated as a pricing factor and the changes in market interest rates would not have a significant effect on the security’s fair value, or (2) the sale of a security occurs after the FHLBNY has already collected a substantial portion (at least 85%) of the principal outstanding at acquisition.Federal Home Loan Bank of New YorkNotes to Financial StatementsJanuary 1, 2018,with the adoption of the ASU, the FHLBNY measures its equity investments at fair value with changes in fair value recognized in net income, thus eliminating eligibility for the available-for-sale category. Prior to the adoption of the ASU, the FHLBNY classified its equity investments as AFS. The FHLBNY’s equity investments comprise of mutual fund assets in grantor truststrust owned by the FHLBNY. The intent of the grantor truststrust is to set aside cash to meet current and future payments for supplemental unfunded pensionretirement plans. Prior period financial statements were not required to be restated under the transition provisions of this ASU.— Accounting and Governance Policies, and Impairment AnalysisThe Financial Accounting Standards Board (FASB) guidance on the recognition and presentation of OTTI is primarily intended to provide greater clarity to investors about the credit and non-credit component of an OTTI event and to more effectively communicate when an OTTI event has occurred. The guidance is incorporated in the FHLBNY’s investment policies, and is summarized below. private-label MBS (PLMBS) will be recovered in future periods, the FHLBNY performs OTTI analysis by cash flow testing its entire portfolio of private-label MBS (PLMBS), all of which were classified as held-to-maturity.��For the FHLBNY’s PLMBS, even if management does not intend to sell an impaired PLMBS, management determines whether an OTTI has occurred by comparing the present value of the cash flows expected to be collected to the amortized cost basis of the security. If the present value of the cash flows expected to be collected is less than the security’s amortized cost, an OTTI exists, irrespective of whether management will be required to sell such a security. The FHLBNY’s methodology to calculate the present value of expected cash flows is to discount the expected cash flows (principal and interest) of a fixed-rate security that is being evaluated for OTTI, by using the effective interest rate of the security as of the date it was acquired. For a variable-rate security that is evaluated for OTTI, the expected cash flows are computed using a forward-rate curve and discounted using the forward rates.If the FHLBNY determines that OTTI has occurred, it accounts for the investment security as if it had been purchased on the measurement date of the other-than-temporary impairment. The investment security is written down to fair value, which becomes its new amortized cost basis. The new amortized cost basis is not adjusted for subsequent recoveries in fair value.Federal Home Loan Bank of New YorkNotes to Financial StatementsOTTI FHLBank System Governance Committee — The OTTI Governance Committee (OTTI Committee) of the FHLBanks has the responsibility for reviewing and approving key modeling assumptions, inputs, and methodologies to be used by the FHLBanks to generate the cash flow projections used in analyzing credit losses and determining OTTI for PLMBS, also referred to as the “Common platform”. The goal is to promote consistency among all FHLBanks in the process for determining OTTI for PLMBS. The OTTI Committee charter provides a formal process by which the FHLBanks can provide input on and approve the assumptions. FHLBanks that hold the same PLMBS are required to consult with one another to make sure that any decision that a commonly held PLMBS is OTTI, including the determination of fair value and the credit loss component of the unrealized loss, is consistent among those FHLBanks.113Consistent with guidelines provided by the OTTI Committee, the FHLBNY has contracted with the FHLBanks of San Francisco and Chicago to provide cash flows using the Common platform for certain of the FHLBNY’s PLMBS that had appropriate loan-level performance data that the Common platform could utilize to generate cash flows. Cash flows generated in the Common platform is the primary source for OTTI assumption parameters for those securities. The FHLBNY performs its own review of the cash flows generated by the Common platform.For the remaining PLMBS securities, expected cash flows are generated by the FHLBNY using historical loan performance parameters and its own assumptions.Cash Flow Analysis Derived from the FHLBNY’s Own Assumptions — Assessment for OTTI employed by the FHLBNY’s own techniques and assumptions are determined primarily using historical performance data. These are then benchmarked by comparing to performance parameters from the “Market consensus” measures.The FHLBNY calculates the historical average of each bond’s prepayments, defaults, and loss severities, and considers other factors such as delinquencies and foreclosures, primarily based on performance statistics extracted from reports from trustees, loan servicers and other sources. Many of the FHLBNY’s PLMBS are insured by monoline insurers, and the FHLBNY makes an assessment of the monoline’s ability to fulfill its guarantee obligations to cover future cash flow shortfalls. The analysis also considers various characteristics of each security including, but not limited to, the following: the credit rating and related outlook or status; the creditworthiness of the issuers of the debt securities; the underlying type of collateral; the year of securitization or vintage, the duration and level of the unrealized loss, credit enhancements, if any; and other collateral-related characteristics such as FICO® credit scores, and delinquency rates. The relative importance of this information varies based on the facts and circumstances surrounding each security as well as the economic environment at the time of assessment.Under the FHLBNY’s internal processes, each bond’s performance parameters, primarily prepayments, defaults and loss severities, and bond insurance financial guarantee predictors, as calculated by the FHLBNY’s internal approach are then input into the specialized bond cash flow model that allocates the projected collateral level losses to the various security classes in the securitization structure in accordance with its prescribed cash flow and loss allocation rules. In a securitization in which the credit enhancements for the senior securities are derived from the presence of subordinate securities, losses are generally allocated first to the subordinate securities until their principal balance is reduced to zero.Cash Flows derived by the FHLBanks OTTI Committee — The Common platform considers borrower characteristics and the particular attributes of the loans underlying a security, in conjunction with assumptions about future changes in home prices and interest rates, to project prepayments, defaults and loss severities.· the remaining payment terms for the security;· reliance on monoline insurers to fulfill guarantees;· prepayment speeds based on underlying loan-level borrower and loan characteristics;· default rates based on underlying loan-level borrower and loan characteristics;· loss severity on the collateral supporting each FHLBank’s security based on underlying loan-level borrower and loan characteristics;· expected housing price changes; and· interest-rate assumptions.Future loan performance parameters, such as projected prepayments, defaults and loss severities, and others, are then input into a second model that allocates the projected loan level cash flows and losses to the various security classes in the securitization structure in accordance with its prescribed cash flow and loss allocation rules. In a securitization in which the credit enhancement for the senior securities is derived from the presence of subordinate securities, losses are generally allocated first to the subordinate securities until their principal balance is reduced to zero.GSE-Issued Securities — The FHLBNY evaluates its individual securities issued by Fannie Mae and Freddie Mac or government agency, collectively GSE or Agency securities, by considering the creditworthiness and performance of the debt securities and the strength of the GSE’s guarantees of the securities. Based on the FHLBNY’s analysis, GSE securities are performing in accordance with their contractual agreements. The Housing Act contains provisions allowing the U.S. Treasury to provide support to Fannie Mae and Freddie Mac. The U.S. Treasury and the Finance Agency have placed Fannie Mae and Freddie Mac into conservatorship in an attempt to stabilize their financial conditions and their ability to support the secondary mortgage market. The FHLBNY believes that it will recover its investments in GSE and agency issued securities given the current levels of collateral and credit enhancements and guarantees that exist to protect the investments.unearned commitment fees,any discounts and premiums (discounts are generally associated with advances for the Affordable Housing Program). If the advance is hedged in a benchmarkan ASC 815 qualifying hedge, its carrying value will include hedging valuation adjustments, which will typically be the result of changes in the LIBORdesignated benchmark index. If an advance is accounted under the Fair Value Option, the carrying value of the advances elected will be its full fair value.Federal Home Loan Bank of New YorkNotes to Financial StatementsFederal Home Loan Bank of New YorkNotes to Financial StatementsMortgage Loans Held-for-PortfolioLoans Held-for-PortfolioPartnership Finance2018 and $33.3 million at December 31, 2017.2018. The aggregate amount of FLA is memorialized and tracked but is neither recorded nor reported as a loan loss reserve in the FHLBNY’s financial statements. If “second losses” beyond this layer are incurred, they are absorbed through a credit enhancement provided by the PFI. The credit enhancement held by PFIs ensures that the lender retains a credit stake in the loans it sells to the FHLBNY, or for the MPF 100 product that the PFI originates as an agent for the FHLBNY. For assuming the second loss credit risk, PFIs receive monthly credit enhancement fees from the FHLBNY. For most MPF products, the credit enhancement fee is accrued and paid monthly after the FHLBNY has accrued 12 months of credit enhancement fees. For new loans acquired after May 2017, the amount of the credit enhancement is computed with the use of a Standard & Poor’s model toMortgage loans are held-for-portfolio, and whenWhen a loan is partially charged off, the remaining loan balance is typically written down and recorded at its collateral value on a non-recurring basis (see Note 18. Fair Values of Financial Instruments).Federal Home Loan Bank of New YorkNotes to Financial Statements2018 and $3.9 million at December 31, 2017.2018.are aggregated with credit losses calculatedand on an individual basis. The aggregate allowance for credit losses on mortgage loans wasbasis summed to $0.7 million and $0.8 million at December 31, 20182019 and $1.0 million at December 31, 2017.2018.Federal Home Loan Bank of New YorkNotes to Financial Statements20182019 and 20172018 represented capital stocks held by former members.· a member requests redemption of excess membership stock;· a member delivers notice of its intent to withdraw from membership; or· a member attains non-member status (through merger into or acquisition by a non-member, charter termination, or involuntary termination from membership).· a member requests redemption of excess membership stock; · a member delivers notice of its intent to withdraw from membership; or · a member attains non-member status (through merger into or acquisition by a non-member, charter termination, or involuntary termination from membership). Federal Home Loan Bank of New YorkNotes to Financial StatementsTo qualify as an accounting hedge under the hedge accounting rules (versus an economic hedge where hedge accounting is not sought), aFHLBNY’s derivative must be highly effective in offsetting the risk designated as being hedged. The hedge relationship must be formally documented at inception, detailing the particular risk management objective and strategy for the hedge, which includes the item and risk that is being hedged and the derivative that is being used, as well as how effectiveness will be assessed and measured. The effectiveness of these hedging relationships is evaluated on a retrospective and prospective basis, typically using quantitative measures of correlation. For hedges that are highly effective, changes in the fair values of the hedging instrument and the offsetting changes in the fair values of the hedged item are recorded in current earnings. If a hedge relationship is found to be not highly effective, it will no longer qualify as an accounting hedge and hedge accounting would be prospectively withdrawn. When hedge accounting is discontinued, the offsetting changes of fair values of the hedged itempolicies under ASC 815, as amended by ASU 2017-12, are also discontinued.summarized in Note 17. Derivatives and Hedging.Until ASU 2017-12, Derivatives and Hedging (Topic 815), Targeted Improvements to Accounting for Hedging Activities, was adopted on January 1, 2019, realized gains or losses attributable to the derivatives and changes in the fair values of derivatives are recognized in Other Income (loss) as a Net realized and unrealized gains (losses) on derivatives and hedging activities. Upon adoption of ASU 2017-12, the entire hedging effects of the hedging instruments will be reported in the same income statement line item as the hedged item. While this is a change in presentation from the legacy hedging standards, the impact for the FHLBNY will not be material.FHLBNY’s derivative and hedging policies summarized below are based on legacy hedging standards prior to the adoption of ASU 2017-12.Each derivative is designated as one of the following:(1) a qualifying hedge of the fair value of a recognized asset or liability or an unrecognized firm commitment (a “Fair value” hedge);(2) a qualifying hedge of a forecasted transaction or the variability of cash flows that are to be received or paid in connection with a recognized asset or liability (a “Cash flow” hedge);(3) a non-qualifying hedge of an asset or liability (“economic hedge”) for asset-liability management purposes; or(4) a non-qualifying hedge of another derivative (an “intermediation” hedge) that is offered as a product to members or used to offset other derivatives with non-member counterparties.·Fair value hedging. Changes in the fair value of a derivative that is designated and qualifies as a Fair value hedge, along with changes in the fair value of the hedged asset or liability that are attributable to the hedged risk (including changes that reflect losses or gains on firm commitments), are recorded in current period’s earnings in Other income (loss) as a Net realized and unrealized gain (loss) on derivatives and hedging activities.·Cash flow hedging. Changes in the fair value of a derivative that is designated and qualifies as a Cash flow hedge, to the extent that the hedge is highly effective, are reported in AOCI, a component of equity, until earnings are affected by the variability of the cash flows of the hedged transaction (i.e., until the recognition of interest on a variable rate asset or liability is recorded in earnings).Measurement of the effects of hedging — For each financial statement reporting period, the FHLBNY measures the changes in the fair values of all derivatives, and changes in fair value of the hedged items attributable to the risk being hedged and reports changes through current earnings. To the extent the changes in fair values of the derivatives do not offset the changes in the fair values of the hedged item, the mismatch impacts current period earnings.Federal Home Loan Bank of New YorkNotes to Financial StatementsFor hedged items eligible for the short-cut method, the FHLBNY will assume that during the life of the hedge the change in fair value of the hedged item attributable to the benchmark interest rates (LIBOR in the periods in this report) equals the change in fair value of the derivative. The short-cut method is employed only for highly effective hedging relationships that meet certain specific criteria under the accounting standards for derivatives and hedging that would qualify for an assumption of no ineffectiveness in a hedging relationship or a perfect hedge relationship.Effectiveness testing — The FHLBNY has designed effectiveness testing criteria based on management’s knowledge of the hedged item and hedging instruments that are employed to create the hedging relationship. The FHLBNY uses statistical analyses to evaluate effectiveness results, which must fall within established tolerances. Effectiveness testing is performed at hedge inception and on at least a quarterly basis for both prospective considerations and retrospective evaluations.Effectiveness is determined by how closely the changes in the fair value of the hedging instrument offset the changes in the fair value or cash flows of the hedged item relating to the risk being hedged. Hedge accounting is permitted only if the hedging relationship is expected to be highly effective at the inception of the hedge and on an ongoing basis. The FHLBNY assesses hedge effectiveness in the following manner:·Inception prospective assessment. Upon designation of the hedging relationship and on an ongoing basis, the FHLBNY hedge documentation demonstrates that it expects the hedging relationship to be highly effective. This is a forward-looking consideration. A prospective assessment is performed at the designation of the hedging relationship. The assessment uses sensitivity analysis employing an option-adjusted valuation model to generate changes in market value of the hedged item and the swap. These projected market values are run under instantaneous parallel rate shocks, and the hedge is expected to be highly effective if the change in fair value of the swap divided by the change in the fair value of the hedged item is within the 80% - 125% dollar value offset boundaries.·Retrospective assessment. At least quarterly, the FHLBNY’s hedge documentation demonstrates whether the hedging relationship was highly effective in offsetting changes in fair value or cash flows through the date of the periodic assessment. This is an evaluation of the past experience. The retrospective test utilizes multiple regression and statistical validation parameters to determine that the hedging relationship was highly effective (i.e., it has remained within the 80% - 125% dollar value offset boundaries).·Ongoing prospective assessment. For purposes of assessing effectiveness on an ongoing basis, the FHLBNY’s documentation utilizes the regression results from the retrospective assessment as a means of demonstrating that the hedge relationships are expected to be highly effective in future periods.Measurement of effectiveness on Fair value hedging. For fair value hedges that are highly effective and qualify for hedge accounting treatment, changes in the fair values of the derivative and the offsetting changes in the fair value of the hedged item are recorded in current period’s earnings. The accruals of interest income and expense on derivatives designated as a qualifying fair value hedge are recognized as adjustments to the interest income or expense of the hedged item.Measurement of effectiveness on Cash flow hedging. For cash flow hedges that qualify for hedge accounting treatment and are highly effective, the gains and losses on the derivative instruments are recorded in AOCI and reclassified into earnings in the same period or periods during which the hedged transaction affects earnings and are also presented in the same income statement line item as the earnings effect of the hedged item. Gains and losses on the derivative instrument representing either hedges that are not highly effective or hedge components excluded (none for the FHLBNY) from the assessment of effectiveness are recognized currently in current earnings.Derivatives in economic hedges. Changes in the fair value of a derivative designated as economic hedges (also referred to as standalone hedges) and changes in the fair value of a derivative that no longer qualifies as an accounting hedge are recorded in current period earnings with no fair value adjustment to the asset or liability that is being hedged on an economic basis. The net interest associated with a standalone derivative is recorded together with changes in its fair value in Other income (loss) as a Net realized and unrealized gain (loss) on derivatives and hedging activities. When derivatives are executed as intermediated derivatives for members, the derivatives are treated as standalone derivatives.Federal Home Loan Bank of New YorkNotes to Financial StatementsTrade date conventions. The FHLBNY records derivatives on trade date, but records the associated hedged Consolidated obligations and advances on settlement date. Hedge accounting commences on trade date, at which time subsequent changes to the derivative’s fair value are recorded along with the offsetting changes in the fair value of the hedged item attributable to the risk being hedged. On settlement date, the basis adjustments to the hedged item’s carrying amount are combined with the principal amounts and the basis becomes part of the total carrying amount of the hedged item. The FHLBNY has defined its market settlement conventions for hedged items to be five business days or less for advances and thirty calendar days or less, using a next business day convention, for Consolidated obligations bonds and discount notes. These market settlement conventions are the shortest period possible for each type of advance and Consolidated obligation from the time the instruments are committed to the time they settle.The FHLBNY considers hedges of committed advances and Consolidated obligation bonds eligible for the “short cut” provisions (assumption of no-ineffectiveness), as long as settlement of the committed asset or liability occurs within the market settlement conventions for that type of instrument. A short-cut hedge is a perfectly effective hedging relationship that uses an interest rate swap as the hedging instrument to hedge a recognized asset or liability and that meets the criteria under the accounting standards for derivatives and hedging to qualify for an assumption of no ineffectiveness. To meet the short-cut provisions, which assume perfect effectiveness, hedge accounting standards also require the fair value of the swap to approximate zero on the date the FHLBNY designates the hedge.Embedded Derivatives. The FHLBNY routinely issues debt to investors and makes advances to members. In certain such instruments, the FHLBNY may embed a derivative. Typically, such derivatives are call and put options to early terminate the instruments at par on pre-determined dates. The FHLBNY may also embed interest rate caps and floors, or step-up or step-down interest rate features within the instruments. The FHLBNY also routinely structures interest rate swaps to hedge the FHLBank debt and advances, and the FHLBNY may also embed derivative instruments, such as those identified in the previous discussion, in the swaps. When such instruments are conceived, designed and structured, our control procedures require the identification and evaluation of embedded derivatives, as defined under accounting standards for derivatives and hedging activities. This evaluation will consider whether the economic characteristics of the embedded derivative are clearly and closely related to the economic characteristics of the remaining component of the advance or debt (the host contract) and whether a separate, non-embedded instrument with the same terms as the embedded instrument would meet the definition of a derivative instrument. If the FHLBNY determines that (1) the embedded derivative has economic characteristics that are not clearly and closely related to the economic characteristics of the host contract, and (2) a separate, standalone instrument with the same terms would qualify as a derivative instrument, the embedded derivative would be separated from the host contract as prescribed for hybrid financial instruments under accounting standards for derivatives and hedge accounting, and carried at fair value. However, if the entire contract (the host contract and the embedded derivative) is to be measured at fair value, the changes in fair value would be reported in current earnings (such as an investment security classified as “trading”; or, if the FHLBNY cannot reliably identify and measure the embedded derivative for purposes of separating that derivative from its host contract, the entire contract would be carried on the balance sheet at fair value and no portion of the contract would be designated as a hedging instrument). The FHLBNY had no financial instruments with embedded derivatives that required separate accounting as a result of meeting the bifurcation test under ASC 815.Discontinuation of Hedge Accounting. When hedge accounting is discontinued because the FHLBNY determines that the derivative no longer qualifies as an effective Fair value hedge of an existing hedged item, the FHLBNY continues to carry the derivative on the balance sheet at its fair value, ceases to adjust the hedged asset or liability for changes in fair value, and amortizes the cumulative basis adjustment on the hedged item into earnings over the remaining life of the hedged item (for callable as well as non-callable previously hedged debt and advances) using the level-yield methodology. When the hedged item is a firm commitment, and hedge accounting is discontinued because the hedged item no longer meets the definition of a firm commitment, the FHLBNY would continue to carry the derivative on the balance sheet at its fair value, removing from the balance sheet any asset or liability that was recorded to recognize the firm commitment and recording it as a gain or loss in current period earnings.When hedge accounting is discontinued because the FHLBNY determines that the derivative no longer qualifies as an effective Cash flow hedge of an existing hedged item, the FHLBNY continues to carry the derivative on the balance sheet at its fair value and reclassifies the basis adjustment in AOCI to earnings when earnings are affected by the existing hedge item, which is the original forecasted transaction. Under limited circumstances, when theFederal Home Loan Bank of New YorkNotes to Financial StatementsFHLBNY discontinues cash flow hedge accounting because it is no longer probable that the forecasted transaction will occur in the originally expected period plus the following two months, but it is probable the transaction will still occur in the future, the gain or loss on the derivative remains in AOCI and is recognized into earnings when the forecasted transaction affects earnings. However, if it is probable that a forecasted transaction will not occur by the end of the originally specified time period or within two months after that, the gains and losses that were included in AOCI are recognized immediately in earnings.The FHLBNY treats modifications of hedged items (e.g. reduction in par amounts, change in maturity date, and change in strike rates) that are other than minor as a termination of a hedge relationship, and previously recorded hedge basis adjustments of the hedged items are amortized over the life of the hedged item.Hedges of Similar Assets. It is not our practice to engage in portfolio hedging. However, from time to time, we may execute interest rate swaps in a portfolio hedge of advances if the hedge meets the specific provisions under hedge accounting. The FHLBNY has insignificant amounts of similar advances that were hedged in aggregate as a portfolio. For such hedges, the FHLBNY performs a similar asset test for homogeneity to ensure the hedged advances share the risk exposure for which they are designated as being hedged. Other than the very limited number of portfolio hedges, our other hedged items and derivatives are hedged as separately identifiable instruments.Cash Collateral Associated with Derivative Contracts. The FHLBNY reports derivative assets and derivative liabilities in its Statements of Condition after giving effect to legally enforceable master netting, or when an agreement is not available as with OTC cleared derivatives, enforceability is based on a legal analysis or legal opinion.Reported Derivative assets and liabilities include interest receivable and payable on derivative contracts and the fair values of the derivative contracts. The Bank records cash collateral received and posted in the Statements of Condition as an adjustment to Derivative assets and liabilities in the following manner — Cash collateral posted by the FHLBNY is reported as a deduction to Derivative liabilities; cash collateral received from derivative counterparties is reported as a deduction to Derivative assets. Cash posted by the FHLBNY in excess of margin requirements is recorded as a receivable in Derivative assets.Variation margin exchanged with Derivative Clearing Organizations on cleared derivatives is treated as a settlement of the derivative itself — a reduction of the fair value of the derivative — and not as collateral.When derivative counterparties pledge marketable securities, they typically retain title and the securities are treated as non-cash collateral. When the FHLBNY pledges securities to counterparties, we also retain title to the securities and treat the securities as collateral. Securities pledged or received are not netted against the derivative exposures on the Statements of Condition.Consolidated Obligations118Federal Home Loan Bank of New YorkNotes to Financial StatementsFederal Home Loan Bank of New YorkNotes to Financial Statementstruststrust that had beenwere designated as available-for-sale and subject to this provision of the ASU. The adoption of the guidance on January 1, 2018, resulted in an immaterial cumulative catch-up reclassification of the fair values of the trust assets from AOCI to retained earnings. Prior period financial statements were not required to be restated under the transition provisions of this ASU.Revenue Recognition. In May 2014, the FASB issued ASU No. 2014-09, (Topic 606): Revenue from Contracts with Customers. The core principle of the guidance is that an entity should recognize revenue to depict the transfer of promised goods or services to customers in an amount that reflects the consideration to which the entity expects to be entitled in exchange for those goods or services. The guidance provided entities with the option of using either of the following adoption methods: a full retrospective method, retrospectively to each prior reporting period presented; or a modified retrospective method, retrospectively with the cumulative effect of initially applying this guidance recognized at the date of initial application. The FHLBNY elected to use the modified retrospective method to adopt the guidance as of January 1, 2018,Significant Accounting Policies and adoption resulted in an immaterial impact on our financial condition, results of operations, and cash flows.Our net income is derived principally from net interest income on financial assets and liabilities, which is explicitly excluded from the scope of this guidance. Certain other streams of non-interest revenues, which relate to fee revenues from commitments and financial letters of credit, were evaluated and we have concluded that such fees and associated expenses are out of scope of the standard and therefore will not be impacted by the adoption of this guidance. We have also analyzed the recognition of gains and losses when mortgage loans are foreclosed and transferred to real estate owned status, and concluded that while such line items are in-scope of the standard, they are not material for the FHLBNY.Note 2.Recently Issued Accounting Standards and InterpretationsDerivatives and Hedging. In August 2017, the FASB issued ASU 2017-12, Targeted Improvements to Accounting for Hedging Activities (Topic 815). The FHLBNY adopted the ASU on January 1, 2019. Other than changes in disclosures required under the ASU, adoption did not have a material effect on its financial condition, results of operations, and cash flows.EstimatesFASBFHLBNY has issued this ASU with the objective of improving the financial reporting of hedging relationshipsidentified certain accounting policies that it believes are significant because they require management to better portray the economic results of an entity’s risk management activities in its financial statements. In addition tomake subjective judgments about matters that main objective, the amendments in this ASU make certain targeted improvements to simplify the applicationare inherently uncertain and because of the hedge accounting guidance in current GAAP. The new guidance requireslikelihood that we reportmaterially different amounts would be reported under different conditions or by using different assumptions. These policies include estimating the entire hedging effectsallowance for credit losses on the advance and mortgage loan portfolios, evaluating the impairment of the hedging instruments in the same income statement line item as the hedged item. While this is a change in presentation from the legacy standards, the impact for the FHLBNY will not be material.FHLBNY’s securities portfolios, and estimating fair values of certain assets and liabilities.We expect to realize operational benefits beginning January 1, 2019, and potentially to also benefit from expanded hedging opportunities permitted under the ASU. The ASU allows a one-time transfer of fixed-rate, pre-payable debt securities from HTM to AFS. The FHLBNY transferred approximately $1.6 billion of HTM securities into AFS classification effective January 1, 2019 as a one-time transfer permitted under the standard.120On October 25, 2018, the FASB issued ASU 2018-16, Inclusion of the Secured Overnight Financing Rate (SOFR) Overnight Index Swap (OIS) Rate as a Benchmark Interest Rate for hedge Accounting Purposes (Topic 815). TheRecently Adopted Accounting Guidance: Standard Summary of Guidance Effective Date Effects on the Financial Statements Derivatives and Hedging ASU 2017-12, Targeted Improvements to Accounting for Hedging Activities (Topic 815) Issued in August 2017 This guidance amends the accounting for derivatives and hedging activities to better portray the economic results of an entity's risk management activities in its financial statements. In addition to that main objective, the amendments in this ASU made certain targeted improvements to simplify the application of the hedge accounting guidance in pre-existing GAAP. The new guidance also requires that we report the entire hedging effects of the hedging instruments in the same income statement line item as the hedged item. This guidance became effective for the FHLBNY for the interim and annual periods beginning on January 1, 2019. While this is a change in presentation from the legacy standards, the impact for the FHLBNY was not material. The amended presentation was applied prospectively in the Statements of income and prior period comparative financial information was not reclassified to conform to current presentation. ASU 2017-12 allowed a one-time transfer of fixed-rate, pre-payable debt securities from HTM to AFS. The FHLBNY transferred $1.6 billion of HTM securities into AFS classification effective January 1, 2019 as a one-time transfer permitted under the standard. Other than changes in disclosures as required under the ASU and a one-time election to transfer the HTM securities to AFS, adoption did not have a material effect on the FHLBNY’s financial condition, results of operations, and cash flows. ASU 2018-16, Inclusion of the Secured Overnight Financing Rate (SOFR) Overnight Index Swap (OIS) Rate as a Benchmark Interest Rate for Hedge Accounting Purposes (Topic 815) Issued in October 2018 The new ASU added the OIS rate based on SOFR as a U.S. benchmark rate to facilitate the LIBOR to SOFR transition. The amendments in the ASU became effective for the FHLBNY concurrently with the adoption of ASU 2017-12 on January 1, 2019. The FHLBNY has adopted OIS/SOFR as another ASC 815 hedging benchmark for its interest rate risk management objectives. The FHLBNY’s primary benchmark for hedges under ASC 815 remains LIBOR. Beginning in the first quarter, the FHLBNY has also executed hedges under ASC 815 designating the FED funds OIS index (FF/OIS) as a benchmark rate. For further information, see Note 17 Derivatives and Hedging Activities. Leases ASU 2016-02, Leases (Topic 842)
Issued in February 2016This guidance amends the accounting for lease arrangements. In particular, it requires a lessee of operating and financing leases to recognize on the statements of condition, a right-of-use asset and a lease liability for leases. This guidance became effective for the FHLBNY for the interim and annual periods beginning on January 1, 2019. At January 1, 2019, we recognized lease liabilities of $83.9 million and right-of-use assets of $71.6 million, primarily related to operating premise leases. Other than the recognition of leases on the balance sheet, adoption on January 1, 2019 did not result in material changes to the recognition of operating lease expense in the FHLBNY’s Statements of income. For further information, see Note 19. Commitments and Contingencies. new ASU adds the OIS rate based on SOFR as a U.S. benchmark rate to facilitate the LIBOR to SOFR transition. The amendments in the ASU became effective for the FHLBNY concurrently with the adoption of ASU 2017-12 on January 1, 2019.Standard Summary of Guidance Effective Date Effects on the Financial Statements Facilitation of the Effects of Reference Rate Reform on Financial Reporting ASU 2020-04, Reference Rate Reform (Topic 848)
Issued in March 2020This guidance provides temporary optional guidance to ease the potential burden in accounting for reference rate reform. The new guidance provides optional expedients and exceptions for applying generally accepted accounting principles to transactions affected by reference rate reform if certain criteria are met. These transactions include:
• contract modifications,
• hedging relationship, and
• sale or transfer of debt securities classified as HTM.This guidance is effective for the FHLBNY beginning on March 12, 2020, and we may elect to apply the amendments prospectively through December 31, 2022. We are in the process of evaluating the guidance, and its effect on the financial condition, results of operations, and cash flows has not yet been determined. Accounting for Financial Instruments — Credit Losses ASU 2016-13, Financial Instruments — Credit Losses (Topic 326) Issued in June 2016 The adoption of this guidance established a single allowance framework for all financial assets carried at amortized cost, including Federal funds sold and repurchase agreements, advances, mortgage loans held-for-portfolio, held-to-maturity securities, other receivables and certain off-balance sheet credit exposures. For available-for-sale securities where fair value is less than cost, credit related impairment, if any, will be recognized in an allowance for credit losses and adjusted each period for changes in expected credit risk. This framework requires that management’s estimate reflects credit losses over the full remaining expected life and considers expected future changes in macroeconomic conditions. The FHLBNY will adopt the ASU effective January 1, 2020. We have concluded our assessment of the impact of CECL on all our business lines, including advances, investments and other financial assets. Adoption of the guidance will increase our allowances for credit losses by $3.8 million, which we consider to be an immaterial impact on our regulatory capital, financial condition, results of operations, and cash flows. The CECL guidance also expands credit quality disclosures beginning in the first quarter of 2020. We have established controls and validation processes over models pertaining to expected losses, and have also designed and established as of January 1, 2020 policies and control procedures over the implementation of the CECL framework. Accounting for Financial Instruments — Credit Losses. In June 2016, the FASB issued ASU 2016-13, Financial Instruments — Credit Losses (Topic 326). The ASU introduces a new accounting model, the Current Expected Credit Losses model (CECL), which requires earlier recognition of credit losses, while also providing additional transparency about credit risk. The FASB’s CECL model utilizes a lifetime “expected credit loss” measurement objective for the recognition of credit losses for loans, held-to-maturity securities and other receivables at the time the financial asset is originated or acquired. The expected credit losses are adjusted each period for changes in expected lifetime credit losses. For available-for-sale securities where fair value is less than cost, credit-related impairment, if any, will be recognized in an allowance for credit losses and adjusted each period for changes in expected credit risk. This model replaces the multiple existing impairment models in current GAAP, which generally require that a loss be incurred before it is recognized. We have concluded our preliminary assessment of the impact of CECL on all our business lines, including advances, investments and other financial assets. While the CECL model represents a significant departure from existing GAAP, based on our preliminary assessments, we do not expect adoption will have a material impact on our financial condition, results of operations, and cash flows. This guidance is effective for interim and annual periods beginning on January 1, 2020. The FHLBNY will adopt the ASU effective January 1, 2020.Lease Accounting. In February 2016, the FASB issued ASU No. 2016-02, Leases (Topic 842), which is intended to increase transparency and comparability of accounting for lease transactions. The ASU requires the FHLBNY to recognize all leases on the balance sheet as lease assets and lease liabilities and disclose material information about its leasing arrangements. We adopted the ASU effective January 1, 2019, and recognized lease liabilities and corresponding right-of-use assets (at their present value) related to predominantly all of the $106 million of future minimum payments required under operating leases as disclosed in Note 19. Commitments and Contingencies at December 31, 2018. Other than the recognition of leases on the balance sheet, adoption on January 1, 2019 did not result in material changes to the recognition of operating lease expense in the FHLBNY’s Statements of income.funds.funds in this arrangement. There were no compensating balance at December 31, 2018; the compensating balance at Citibank included in Cash2019 and due from banks was $41.1 million at December 31, 2017.2018.2018 and $84.2 million at December 31, 2017.2018. The liabilities offsetting the pass-through reserves were due to member institutions and were recorded in Other liabilities in the Statements of Condition.Note 4.Federal Funds Sold and Securities Purchased Under Agreements to Resell.Note 4. Federal Funds Sold and Securities Purchased Under Agreements to Resell. 20182019 and 2017,2018, the outstanding balances of Securities purchased under agreements to resell were $4.1$15.0 billion and $2.7$4.1 billion; the investments typically matured overnight, and were executed through a tri-party arrangement that involved transfer of overnight funds to a segregated safekeeping account at the Bank of New York (BONY). BONY, acting as an independent agent on behalf of the FHLBNY and the counterparty to the transactions, assumes the responsibility of receiving eligible securities as collateral and releasing funds to the counterparty. U.S. Treasury securities at market values $4.2of $15.2 billion and $2.8$4.2 billion were received at BONY to collateralize the overnight investments at December 31, 20182019 and 2017.2018. Securities purchased under agreements to resell averaged $8.3 billion and $4.1 billion and $2.7 billion infor the twelve months ended December 31, 20182019 and 2017.2018. Interest income from securities purchased under agreements to resell were $178.6 million, $78.3 million $25.5 million and $6.9$25.5 million for the years ended December 31,2019, 2018 2017 and 2016.2017. No overnight investments had been executed bilaterally with counterparties at December 31, 20182019 and 2017.Note 5.Trading Securities.In January 2020, we concluded our evaluation under the CECL guidance, which we adopted effective January 1, 2020. No credit loss allowance was recorded at January 1, 2020 for investments in Federal funds sold and Securities purchased under agreements to resell due to the de minimis nature of the allowance.Note 5. Trading Securities. 20182019 and December 31, 20172018 (in thousands): December 31, 2019 December 31, 2018 $ - $ 502,849 3,217 3,334 15,315,592 5,304,329 Total trading securities $ 15,318,809 $ 5,810,512 The FHLBNY received Ambac corporate notes from the Ambac Corporation as consideration for insurance claims on certain Ambac insured private-label mortgage-backed securities owned by the FHLBNY. The Ambac notes were designated as trading securities. The carrying values of trading securities included net unrealized fair value gains of $53.1 million at December 31, 2019, and $2.6 million at December 31, 2018,2018. We have classified investments acquired for purposes of meeting short-term contingency and unrealized fair value losses of $1.1 million at December 31, 2017.other liquidity needs as trading securities. In accordance with Finance Agency guidance, we do not participate in speculative trading practices. and $239.1 million at December 31, 2017 to derivative clearing organizations to fulfill the FHLBNY’s initial margin requirements as mandated under margin rules of the CommoditiesCommodity Futures Trading Commission (CFTC). The clearing organizations have rights to sell or repledge the collateral securities under certain conditions.Redemption Termsremaining maturities and estimated fair valuesfollowing tables present redemption terms of investments classified asthe major types of trading (a) were as followssecurities (dollars in thousands):
or less
through five years
or less
through five years(a)We have classified investments acquired for purposes of meeting short-term contingency and other liquidity needs as trading securities, which are carried at their fair values. In accordance with Finance Agency guidance, we do not participate in speculative trading practices.(b)Total amounts for the redemption categories were revised for mathematical error. It was not necessary to revise any other data.Redemption Terms December 31, 2019 Due in one year
or less Due after one year
through five years Total Fair Value Corporate notes $ 869 $ 2,348 $ 3,217 U.S. Treasury notes 6,176,952 9,138,640 15,315,592 Total trading securities $ 6,177,821 $ 9,140,988 $ 15,318,809 Yield on trading securities 2.36 % 2.36 % December 31, 2018 Due in one year
or less Due after one year
through five years Total Fair Value GSE securities $ 502,849 $ - $ 502,849 Corporate notes - 3,334 3,334 U.S. Treasury notes 3,171,130 2,133,199 5,304,329 Total trading securities $ 3,673,979 $ 2,136,533 $ 5,810,512 Yield on trading securities 2.05 % 2.14 % Note 6.Equity Investments.Note 6. Equity Investments. truststrust as equity investments. The carrying value of equity investments in the StatementStatements of Condition, and the types of assets in the grantor truststrust were as follows (in thousands): December 31, 2019 Gross Gross Amortized Unrealized Unrealized Fair Cost Gains(b) Losses(b) Value(c) Cash equivalents $ 1,322 $ - $ - $ 1,322 Equity funds 28,650 8,312 (623 ) 36,339 Fixed income funds 22,104 412 (130 ) 22,386 Total Equity Investments(a) $ 52,076 $ 8,724 $ (753 ) $ 60,047 December 31, 2018 Gross Gross Amortized Unrealized Unrealized Fair Cost Gains(b) Losses(b) Value(c) $ 1,250 $ - $ - $ 1,250 25,788 2,481 (1,674 ) 26,595 21,036 7 (709 ) 20,334 $ 48,074 $ 2,488 $ (2,383 ) $ 48,179 (a)ASU 2016-01 was adopted on January 1, 2018 and the FHLBNY made a non-cash transfer of grantor trusts to the Equity Investments category. Prior to January 1, 2018, these investments were classified as available-for-sale. The intent of the grantor trusts(a) The intent of the grantor trust is to set aside cash to meet current and future payments for supplemental unfunded pension plans. Neither the pension plans nor employees of the FHLBNY own the trust. (b) Changes in unrealized gains and losses are recorded through earnings, specifically in Other income in the Statements of Income. (c) The grantor trust invests in money market, equity and fixed income and bond funds. Daily net asset values (NAVs) are readily available and investments are redeemable at short notice. NAVs are the fair values of the funds in the grantor trust. The grantor trust is to set aside cash to meet current and future payments for supplemental unfunded pension plans. Neither the pension plans nor employees of the FHLBNY own the trust.(b)Changes in unrealized gains and losses are recorded through earnings, specifically in Other income in the Statements of Income.(c)The grantor trusts invest in money market, equity and fixed income and bond funds. Daily net asset values (NAVs) are readily available and investments are redeemable at short notice. NAVs are the fair values of the funds in the grantor trusts. The grantor trusts are owned by the FHLBNY.StatementStatements of Income unrealized gains and losses related to outstanding Equity Investments were as follows (in thousands): Years ended December 31, 2019 2018 Unrealized gains (losses) recognized during the reporting period on equity investments still held at the reporting date $ 7,866 $ (5,098 )(a) Net gains (losses) recognized during the period on equity investments sold during the period 17 279 Net dividend and other 1,960 - Net gains (losses) recognized during the period $ 9,843 $ (4,819 ) Federal Home Loan Bank of New York(a) Prior year beginning balance was reclassified to conform to the classification adopted in 2019. Notes to Financial StatementsNote 7. Available-for-Sale Securities. Note 7.Available-for-Sale Securities.20182019 and at December 31, 2017,2018, no AFS security was other-than-temporarily impaired.OTTI. The following tables provide major security types (in thousands): December 31, 2019 Gross Gross Amortized Unrealized Unrealized Fair Cost Gains Losses Value GSE and U.S. Obligations Mortgage-backed securities Floating CMO $ 339,419 $ 2,164 $ (74 ) $ 341,509 CMBS 2,539 1 - 2,540 Total Floating 341,958 2,165 (74 ) 344,049 Fixed CMBS 2,213,592 99,532 (3,755 ) 2,309,369 AFS before hedging adjustments $ 2,555,550 $ 101,697 (a) $ (3,829 )(a) $ 2,653,418 Hedging basis adjustments in AOCI 11,593 14,925 (b) 3,332 (b) - Total Available-for-sale securities $ 2,567,143 $ 86,772 $ (497 ) $ 2,653,418 December 31, 2018 Gross Gross Amortized Unrealized Unrealized Fair Cost Gains Losses Value $ 402,540 $ 4,011 $ - $ 406,551 15,642 23 - 15,665 $ 418,182 $ 4,034 $ - $ 422,216 (a) Amounts represents vendor priced gains/losses of AFS securities based on market pricing and historical amortized cost adjusted for pay downs and amortization of premiums and discounts; amounts are before adjusting book values for hedge basis adjustments, and will equal market values of AFS securities recorded in AOCI. Fair value hedges were executed internally to mitigate the interest rate risk of the hedged fixed-rate securities due to changes in the designated benchmark rate. (b) Amounts represent fair value hedging basis that were recorded as an adjustment to the amortized cost of hedged securities, impacting reported unrealized gains and losses. Securities in a fair value hedging relationship at December 31, 2019 reported $11.6 million as hedging basis and will agree with fair value hedging basis recorded in AOCI. The hedging basis adjustment had no impact on reported fair values, which remained market based. (a)At December 31, 2017, funds in the FHLBNY’s grantor trusts were designated as available-for-sale. Upon adoptionASU 2016-01 effective January 1, 2018, the funds were designated as Equity Investments. For more information, see Note 6. Equity Investments.New York(b)Recorded in AOCI — Net unrealized fair value gains were $4.0 million at December 31, 2018 and $10.2 million at December 31, 2017.floating rate CMBS, and U.S. Agency issued MBS.CMBS. The FHLBNY evaluates its GSE-issued securities by considering the creditworthiness and performance of the debt securities and the strength of the government-sponsored enterprises’ guarantees of the securities. Fair values of mortgage-backed securities in the AFS portfolio were in excess of their amortized costs at December 31, 2018, and no security was in a loss position for 12 months or longer in 2018. thecredit and performance analysis, GSE-issued securities are performing in accordance with their contractual agreements. The FHLBNY believes that it will recover its investments in GSE-issued securities given the current levels of collateral, credit enhancements and guarantees that exist to protect the investments. At December 31, 2019 unrealized fair value losses have been aggregated in the table below by the length of time a security was in a continuous unrealized loss position. At December 31, 2018, there was no available-for-sale debt security at a fair value below its amortized cost basis.There were noThe following table summarizes available-for-sale debt securities with estimated fair values below their amortized cost basis at December 31, 2018.Federal Home Loan Bank of New YorkNotes to Financial Statements(in thousands): December 31, 2019 Less than 12 months 12 months or more Total Estimated Unrealized Estimated Unrealized Estimated Unrealized Fair Value Losses Fair Value Losses Fair Value Losses MBS Investment Securities MBS-GSE Fannie Mae-CMO $ 32,012 $ (65 ) $ - $ - $ 32,012 $ (65 ) Fannie Mae-CMBS - - - - - - Freddie Mac-CMO 7,071 (9 ) - - 7,071 (9 ) Freddie Mac-CMBS 129,496 (423 ) - - 129,496 (423 ) Total $ 168,579 $ (497 ) $ - $ - $ 168,579 $ (497 ) December 31, 2019 December 31, 2018 Amortized Cost(b) Fair Value Amortized Cost(b) Fair Value Mortgage-backed securities Due in one year of less $ 2,539 $ 2,540 $ - $ - Due after one year through five years - - 15,642 15,665 Due after five year through ten years 2,189,350 2,273,352 - - Due after ten years 375,254 377,526 402,540 406,551 Total Available-for-sale securities $ 2,567,143 $ 2,653,418 $ 418,182 $ 422,216 (b) Amortized cost is UPB after adjusting for net unamortized premiums of $30.4 million and net unamortized discounts of $1.5 million at December 31, 2019 and December 31, 2018. Additionally, historical amortized cost at December 31, 2019 was adjusted for hedging basis as noted previously. No AFS security was OTTI. (b)Funds in the grantor trusts are determinedbe redeemable at short notice. Fair values are the daily NAVs of the bond and equity funds.(c)Amortized cost is after adjusting for net unamortized discounts of $1.5 million and $1.9 million at December 31, 2018 and December 31, 2017.Financial Statements December 31, 2019 December 31, 2018 Amortized Cost Fair Value Amortized Cost Fair Value Mortgage-backed securities Floating CMO - LIBOR $ 339,419 $ 341,509 $ 402,540 $ 406,551 CMBS - LIBOR 2,539 2,540 15,642 15,665 Total Floating 341,958 344,049 418,182 422,216 Fixed CMBS 2,225,185 2,309,369 - - Total Mortgage-backed securities $ 2,567,143 $ 2,653,418 $ 418,182 $ 422,216 (a)Total will not agree to total AFS portfolio because the grantor trusts, which primarily comprise of mutual funds, have been excluded.Note 8.Held-to-Maturity Securities.Note 8. Held-to-Maturity Securities. December 31, 2019 OTTI Gross Gross Amortized Recognized Carrying Unrecognized Unrecognized Fair Issued, guaranteed or insured: Cost(d) in AOCI Value Holding Gains(a) Holding Losses(a) Value Pools of Mortgages Fannie Mae $ 61,990 $ - $ 61,990 $ 6,255 $ - $ 68,245 Freddie Mac 11,526 - 11,526 1,135 - 12,661 Total pools of mortgages 73,516 - 73,516 7,390 - 80,906 Collateralized Mortgage Obligations/Real Estate Mortgage Investment Conduits Fannie Mae 1,403,787 - 1,403,787 4,281 (3,130 ) 1,404,938 Freddie Mac 878,068 - 878,068 2,871 (2,526 ) 878,413 Ginnie Mae 9,265 - 9,265 113 - 9,378 Total CMOs/REMICs 2,291,120 - 2,291,120 7,265 (5,656 ) 2,292,729 Commercial Mortgage-Backed Securities(b) Fannie Mae 1,822,310 - 1,822,310 16,796 (1,372 ) 1,837,734 Freddie Mac 9,815,215 - 9,815,215 215,919 (18,584 ) 10,012,550 Total commercial mortgage-backed securities 11,637,525 - 11,637,525 232,715 (19,956 ) 11,850,284 Non-GSE MBS(c) CMOs/REMICs 4,451 (331 ) 4,120 56 (30 ) 4,146 Asset-Backed Securities(c) Manufactured housing (insured) 28,618 - 28,618 1,175 - 29,793 Home equity loans (insured) 61,186 (4,062 ) 57,124 17,912 - 75,036 Home equity loans (uninsured) 23,322 (3,178 ) 20,144 4,209 (146 ) 24,207 Total asset-backed securities 113,126 (7,240 ) 105,886 23,296 (146 ) 129,036 Total MBS 14,119,738 (7,571 ) 14,112,167 270,722 (25,788 ) 14,357,101 Other State and local housing finance agency obligations 1,122,315 - 1,122,315 400 (23,210 ) 1,099,505 Total Held-to-maturity securities $ 15,242,053 $ (7,571 ) $ 15,234,482 $ 271,122 $ (48,998 ) $ 15,456,606 (a)Unrecognized gross holding gains and losses represent the difference between fair value and carrying value.(b)Commercial mortgage-backed securities (CMBS) are Agency issued securities, collateralized by income-producing “multifamily properties”. Eligible property types include standard conventional multifamily apartments, affordable multifamily housing, seniors housing, student housing, military housing, and rural rent housing.(c)The amounts represent non-agency private-label mortgage- and asset-backed securities.(d)Amortized cost — For securities that were deemed to be OTTI, amortized cost represents unamortized cost less credit OTTI, net of credit OTTI reversed due to improvements in cash flows.Certain non-Agency Private label MBS are insured by Ambac Assurance Corp (Ambac), MBIA Insurance Corp (MBIA) and Assured Guarantee Municipal Corp., (AGM). Assumptions on the extent of expected reliance by the FHLBNY on insurance support by Ambac, AGM and MBIA to make whole expected cash shortfalls are noted under “Monoline insurance” within this Note 8. Held-to-Maturity Securities. December 31, 2018 OTTI Gross Gross Amortized Recognized Carrying Unrecognized Unrecognized Fair Issued, guaranteed or insured: Cost(d) in AOCI Value Holding Gains(a) Holding Losses(a) Value Pools of Mortgages Fannie Mae $ 74,301 $ - $ 74,301 $ 4,355 $ - $ 78,656 Freddie Mac 13,673 - 13,673 953 - 14,626 Total pools of mortgages 87,974 - 87,974 5,308 - 93,282 Collateralized Mortgage Obligations/Real Estate Mortgage Investment Conduits Fannie Mae 1,752,909 - 1,752,909 5,057 (6,642 ) 1,751,324 Freddie Mac 1,079,824 - 1,079,824 4,971 (3,069 ) 1,081,726 Ginnie Mae 11,610 - 11,610 181 - 11,791 Total CMOs/REMICs 2,844,343 - 2,844,343 10,209 (9,711 ) 2,844,841 Commercial Mortgage-Backed Securities(b) Fannie Mae 2,596,388 - 2,596,388 888 (37,525 ) 2,559,751 Freddie Mac 10,635,137 - 10,635,137 59,025 (65,374 ) 10,628,788 Total commercial mortgage-backed securities 13,231,525 - 13,231,525 59,913 (102,899 ) 13,188,539 Non-GSE MBS(c) CMOs/REMICs 6,158 (380 ) 5,778 327 (42 ) 6,063 Asset-Backed Securities(c) Manufactured housing (insured) 35,528 - 35,528 1,490 - 37,018 Home equity loans (insured) 69,583 (6,214 ) 63,369 24,940 (14 ) 88,295 Home equity loans (uninsured) 42,426 (4,467 ) 37,959 5,886 (472 ) 43,373 Total asset-backed securities 147,537 (10,681 ) 136,856 32,316 (486 ) 168,686 Total MBS 16,317,537 (11,061 ) 16,306,476 108,073 (113,138 ) 16,301,411 Other State and local housing finance agency obligations 1,168,350 - 1,168,350 202 (24,207 ) 1,144,345 Total Held-to-maturity securities $ 17,485,887 $ (11,061 ) $ 17,474,826 $ 108,275 $ (137,345 ) $ 17,445,756 (a) Unrecognized gross holding gains and losses represent the difference between fair value and carrying value. (b) Commercial mortgage-backed securities (CMBS) are Agency issued securities, collateralized by income-producing “multifamily properties”. Eligible property types include standard conventional multifamily apartments, affordable multifamily housing, seniors housing, student housing, military housing, and rural rent housing. As permitted by the new hedge accounting guidance effective January 1, 2019, the FHLBNY elected to transfer fixed-rate GSE-issued CMBS at amortized cost basis of $1.6 billion from HTM to AFS. (c) The amounts represent non-agency private-label mortgage- and asset-backed securities. (d) Amortized cost — For securities that were deemed to be OTTI, amortized cost represents unamortized cost less credit OTTI, net of credit OTTI reversed due to improvements in cash flows. and $5.7 million at December 31, 2017, to the FDIC in connection with deposits maintained by the FDIC at the FHLBNY. The FDIC does not have rights to sell or repledge the collateral unless the FHLBNY defaults under the terms of its deposit arrangements with the FDIC.Federal Home Loan Bank of New YorkNotes to Financial Statements December 31, 2019 Less than 12 months 12 months or more Total Estimated Unrealized Estimated Unrealized Estimated Unrealized Fair Value Losses Fair Value Losses Fair Value Losses $ 124,654 $ (1 ) $ 216,241 $ (23,209 ) $ 340,895 $ (23,210 ) 370,710 (335 ) 982,923 (4,167 ) 1,353,633 (4,502 ) 1,922,472 (11,531 ) 1,688,774 (9,579 ) 3,611,246 (21,110 ) 2,293,182 (11,866 ) 2,671,697 (13,746 ) 4,964,879 (25,612 ) 21 - 9,325 (462 ) 9,346 (462 ) 2,293,203 (11,866 ) 2,681,022 (14,208 ) 4,974,225 (26,074 ) $ 2,417,857 $ (11,867 ) $ 2,897,263 $ (37,417 ) $ 5,315,120 $ (49,284 ) December 31, 2018 Less than 12 months 12 months or more Total Estimated Unrealized Estimated Unrealized Estimated Unrealized Fair Value Losses Fair Value Losses Fair Value Losses Non-MBS Investment Securities State and local housing finance agency obligations $ 304,671 $ (29 ) $ 231,022 $ (24,178 ) $ 535,693 $ (24,207 ) MBS Investment Securities MBS-GSE Fannie Mae 1,212,164 (1,787 ) 2,134,166 (42,380 ) 3,346,330 (44,167 ) Freddie Mac 3,999,726 (14,431 ) 3,157,646 (54,012 ) 7,157,372 (68,443 ) Total MBS-GSE 5,211,890 (16,218 ) 5,291,812 (96,392 ) 10,503,702 (112,610 ) MBS-Private-Label 4,635 (24 ) 23,138 (600 ) 27,773 (624 ) Total MBS 5,216,525 (16,242 ) 5,314,950 (96,992 ) 10,531,475 (113,234 ) Total $ 5,521,196 $ (16,271 ) $ 5,545,972 $ (121,170 ) $ 11,067,168 $ (137,441 ) 20182019 and $33.0 million at December 31, 2017.2018. Our analyses of the fair values of HFA bonds have concluded that the market is generally pricing our investments in the HFA bonds to the “AA municipal sector”. The bonds are performing to their contractual terms, and management has concluded that the gross unrealized losses on its housing finance agency bonds are temporary because the underlying collateral and credit enhancements are sufficient to protect the FHLBNY from losses based on current expectations. The credit enhancements may include additional support from Monoline Insurance, Reserve and investment funds allocated to the securities that may be used to make principal and interest payments in the event that the underlying loans pledged for these securities are not sufficient to make the necessary payments and the general obligation of the State issuing the bond. In January 2020, we concluded our evaluation under the CECL guidance, which we adopted effective January 1, 2020. A credit loss allowance of $0.8 million will be recorded effective January 1, 2020 as an adjustment to the amortized cost balance of housing finance agency bonds. We consider the amount to be immaterial to our financial condition, results of operations and cash flows. December 31, 2019 December 31, 2018 Amortized Estimated Amortized Estimated Cost(a) Fair Value Cost(a) Fair Value State and local housing finance agency obligations Due in one year or less $ - $ - $ - $ - Due after one year through five years 9,770 9,781 20,300 20,194 Due after five years through ten years 36,810 36,250 27,670 27,228 Due after ten years 1,075,735 1,053,474 1,120,380 1,096,923 State and local housing finance agency obligations 1,122,315 1,099,505 1,168,350 1,144,345 Mortgage-backed securities Due in one year or less 613,863 619,948 369,989 367,636 Due after one year through five years 4,102,650 4,142,443 4,587,009 4,590,849 Due after five years through ten years 6,648,746 6,815,921 8,201,200 8,157,858 Due after ten years 2,754,479 2,778,789 3,159,339 3,185,068 Mortgage-backed securities 14,119,738 14,357,101 16,317,537 16,301,411 Total Held-to-maturity securities $ 15,242,053 $ 15,456,606 $ 17,485,887 $ 17,445,756 (a)Amortized cost is after adjusting for net unamortized premiums of $63.7 million and $51.8 million (net of unamortized discounts) at December 31, 2018 and December 31, 2017.(a) Amortized cost is UPB after adjusting for net unamortized premiums of $72.5 million and $63.7 million (net of unamortized discounts) and before OTTI adjustments at December 31, 2019 and December 31, 2018. December 31, 2019 December 31, 2018 Amortized Carrying Amortized Carrying Cost Value Cost Value $ 507,026 $ 506,695 $ 680,247 $ 679,867 1,788,297 1,788,297 2,169,384 2,169,384 2,295,323 2,294,992 2,849,631 2,849,251 8,351,180 8,351,180 8,348,709 8,348,709 3,286,345 3,286,345 4,882,816 4,882,816 11,637,525 11,637,525 13,231,525 13,231,525 171,889 164,649 204,281 193,601 15,001 15,001 32,100 32,099 186,890 179,650 236,381 225,700 14,119,738 14,112,167 16,317,537 16,306,476 5,525 5,525 6,770 6,770 1,116,790 1,116,790 1,161,580 1,161,580 1,122,315 1,122,315 1,168,350 1,168,350 $ 15,242,053 $ 15,234,482 $ 17,485,887 $ 17,474,826 (a) Includes MBS supported by pools of mortgages. (a)Includes MBS supported by pools of mortgages.agreements. The FHLBNY believes that itagreements, and we will recover itsour investments in GSE- issuedGSE-issued securities given the current levels of collateral, credit enhancements and guarantees that exist to protect the investments.OTTI — No mortgage-backed security was impaired at December 31, 2018. De minimis amountsOTTI losses of credit-related impairment (OTTI)$0.6 million and $0.1 million were recorded in the second quarter ofduring 2019 and 2018. No impairment was recorded in the prior year periods. Based on cash flow testing, the Bank believes no material OTTI exists for the remaining investments. The Bank’s conclusion is also based upon multiple factors, but not limited to the expected performance of the underlying collateral, and the evaluation of the fundamentals of the issuers’ financial condition. Management has not made a decision to sell such securities at December 31, 2018,2019, and has concluded that it will not be required to sell such securities before recovery of the amortized cost basis of the securities. Years ended December 31, 2019 2018 2017 $ 16,584 $ 22,731 $ 29,117 640 141 - - (49 ) (269 ) (2,787 ) (6,239 ) (6,117 ) $ 14,437 $ 16,584 $ 22,731 Monoline insurance — Certain PLMBS owned by the FHLBNY are insured by third-party bond insurers (monoline insurers). The bond insurance on these investments guarantees the timely payments of principal and interest if these payments cannot be satisfied from the cash flows of the underlying mortgage pool. The FHLBNY performs cash flow credit impairment tests on all of its PLMBS, and the analysis of the securities protected by such third-party insurance looks first to the performance of the underlying security, and considers its embedded credit enhancements in the form of excess spread, overcollateralization, and credit subordination, to determine the collectability of all amounts due. If the embedded credit enhancement protections are deemed insufficient to make timely payment of all amounts due, then the FHLBNY considers the capacity of the third-party bond insurer to cover any shortfalls. Certain monoline insurers have been subject to adverse ratings, rating downgrades, and weakening financial performance measures. In estimating the insurers’ capacity to provide credit protection in the future to cover any shortfall in cash flows expected to be collected for securities deemed OTTI, the FHLBNY has developed a methodology to analyze and assess the ability of the monoline insurers to meet future insurance obligations. Based on analysis performed, the FHLBNY has determined that for bond insurer Assured Guaranty Municipal (AGM), insurance guarantees can be relied upon to cover projected shortfalls. For bond insurer MBIA, financial guarantee is at risk and no financial guarantees are assumed in 2018 and 2019. For bond insurer Ambac, our analysis has determined improvements in the insurer’s financial position, and we have expanded the reliance basis from 45% at December 31, 2017 to 100% at December 31, 2018 through 2024.Note 9.Advances.Note 9. Advances. December 31, 2019 December 31, 2018 Weighted(a) Weighted(a) Average Percentage Average Percentage Amount Yield of Total Amount Yield of Total $ - - % - % $ 4,282 3.35 % - % 69,206,283 1.99 68.93 68,305,214 2.52 64.79 8,727,277 2.16 8.69 18,019,447 2.46 17.09 6,214,853 2.32 6.19 6,471,750 2.38 6.14 3,032,507 2.68 3.02 3,505,420 2.61 3.32 2,709,805 2.02 2.70 2,078,462 2.97 1.97 10,505,353 2.13 10.47 7,049,282 2.51 6.69 100,396,078 2.06 % 100.00 % 105,433,857 2.51 % 100.00 % 299,163 (255,024 ) $ 100,695,241 $ 105,178,833 (a)The weighted average yield is the weighted average coupon rates for advances, unadjusted for swaps. For floating-rate advances, the weighted average rate is the rate outstanding at the reporting dates.(b)Hedge valuation basis adjustments represent changes in the fair values of fixed-rate advances due to changes in LIBOR, which is the FHLBNY’s benchmark rate in a Fair value hedge.(c)No advances elected under the FVO were outstanding at December 31, 2018. Valuation adjustments at December 31, 2017 represent changes in the entire fair values of advances elected under the FVO.(a) The weighted average yield is the weighted average coupon rates for advances, unadjusted for swaps. For floating-rate advances, the weighted average rate is the rate outstanding at the reporting dates. (b) Hedge valuation basis adjustments under ASC 815 hedges represent changes in the fair values of fixed-rate advances due to changes in designated benchmark rates. The FHLBNY’s primary benchmark rate is LIBOR; the FHLBNY may also hedge to the OIS/FF index and OIS/SOFR index. assessment methodologies for evaluating advances forpre-CECL credit losses.loss allowance methodology at December 31, 2019, which generally requires that a loss be incurred before it is recognized.Federal Home Loan Bank of New YorkNotes to Financial Statements21.1%24.9% and 17.1%21.1% of total advances at December 31, 20182019 and December 31, 2017.2018. Lending to insurance companies poses a number of unique risks not present in lending to federally insured depository institutions. For example, there is no single federal regulator for insurance companies. They are supervised by state regulators and subject to state insurance codes and regulations. There is uncertainty about whether a state insurance commissioner would try to void the FHLBNY’s claims on collateral in the event of an insurance company failure. As with all members, insurance companies are also required to purchase the FHLBNY’s capital stock as a prerequisite to membership and borrowing activity. The FHLBNY’s management takes a number of steps to mitigate the unique risk of lending to insurance companies. At the time of membership, the FHLBNY requires an insurance company to be highly-rated and to meet the FHLBNY’s credit quality standards. The FHLBNY performs quarterly credit analysis of the insurance borrower.The Insurance companies are required to successfully complete an on-site review prior to pledging collateral. Additionally, in order to ensure its position as a first priority secured creditor, FHLBNY alsotypically requires member insurance companies to pledge highly-rated readily marketable securitiesplace physical possession of all pledged eligible collateral with FHLBNY or mortgage collateral which are held in the FHLBNY’s custody or by ourdeposit it with a third party custodian.custodian or control agent. Such collateral must meet the FHLBNY’s credit quality standards, with appropriate minimum margins applied. Very high credit quality insurance companies may be allowed to retain possession of the mortgage collateral provided the mortgage collateral is held by a third-party custodian pursuant to a tri-party security agreement. Marketable securities pledged as collateral by the insurance company must be held by the FHLBNY’s third party custodian.20182019 and 2017,December 31, 2018, the FHLBNY had rights to collateral with an estimated value greater than outstanding advances. Based upon the financial condition of the member, the FHLBNY:(1) Allows a member to retain possession of the mortgage collateral pledged to the FHLBNY if the member executes a written security agreement, provides periodic listings and agrees to hold such collateral for the benefit of the FHLBNY; however, securities and cash collateral are always in physical possession; or(2) Requires the member specifically to assign or place physical possession of such mortgage collateral with the FHLBNY or its custodial agent.(1) Allows a member to retain possession of the mortgage collateral pledged to the FHLBNY if the member executes a written security agreement, provides periodic listings and agrees to hold such collateral for the benefit of the FHLBNY; however, securities and cash collateral are always in physical possession; or (2) Requires the member specifically to assign or place physical possession of such mortgage collateral with the FHLBNY or its custodial agent. Note 10.Mortgage Loans Held-for-Portfolio.Note 10. Mortgage Loans Held-for-Portfolio. December 31, 2019 December 31, 2018
of Total
of Total Amount Amount $ 174,291 5.57 % $ 196,551 6.82 % 2,953,453 94.43 2,686,866 93.18 3,127,744 100.00 % 2,883,417 100.00 % 46,442 45,451 (1,562 ) (1,761 ) 1,381 937 3,174,005 2,928,044 (653 ) (814 ) $ 3,173,352 $ 2,927,230 $35.8$40.2 million and $33.3$35.8 million at December 31, 20182019 and 2017.December 31, 2018. The FLA is not recorded or reported as a reserve for loan losses, as it serves as a memorandum or information account. The FHLBNY is responsible for absorbing the first layer. The second layer is that amount of credit obligations that the PFI has agreed to assume at the “Master Commitment” level. The FHLBNY pays a credit enhancement fee to the PFI for taking on this obligation. The FHLBNY assumes all residual risk. Credit enhancement fees accrued were $2.5 million in 2019 and 2018, and $2.4 million and $2.3 million in 2018, 2017, and 2016.2017. These fees were reported as a reduction to mortgage loan interest income.(1)(1) Thefirst layer of protection against loss is the liquidation value of the real property securing the loan. (2) The next layer of protection comes from the primary mortgage insurance (PMI) that is required for loans with a loan-to-value ratio greater than 80% at origination. (3) Losses that exceed the liquidation value of the real property and any PMI will be absorbed by the FHLBNY, limited to the amount of the FLA available under the Master Commitment. For certain MPF products, the FHLBNY could recover previously absorbed losses by withholding future credit enhancement fees (CE Fees) otherwise payable to the PFI, and applying the amounts to recover losses previously absorbed. In effect, the FHLBNY may recover losses allocated to the FLA from CE Fees. The amount of CE Fees depends on the MPF product and the outstanding balances of loans funded in the Master Commitment. CE Fees payable (potentially available for loss recovery) will decline as the outstanding loan balances in the Master Commitment declines. (4) Thesecond layer or portion of credit losses is incurred by the PFI and/or the Supplemental Mortgage Insurance (SMI) provider as follows: The PFI absorbs losses in excess of any FLA up to the amount of the PFI’s credit obligation amount and/or to the SMI provider for MPF 125 Plus products if the PFI has selected SMI coverage. (5) Thethird layer of losses is absorbed by the FHLBNY. (2) The next layer of protection comes from the primary mortgage insurance (PMI) that is required for loans with a loan-to-value ratio greater than 80% at origination.(3) Losses that exceed the liquidation value of the real property and any PMI will be absorbed by the FHLBNY, limited to the amount of the FLA available under the Master Commitment. For certain MPF products, the FHLBNY could recover previously absorbed losses by withholding future credit enhancement fees (CE Fees) otherwise payable to the PFI, and applying the amounts to recover losses previously absorbed. In effect, the FHLBNY may recover losses allocated to the FLA from CE Fees. The amount of CE Fees depends on the MPF product and the outstanding balances of loans funded in the Master Commitment. CE Fees payable (potentially available for loss recovery) will decline as the outstanding loan balances in the Master Commitment declines.(4) The second layer or portion of credit losses is incurred by the PFI and/or the Supplemental Mortgage Insurance (SMI) provider as follows: The PFI absorbs losses in excess of any FLA up to the amount of the PFI’s credit obligation amount and/or to the SMI provider for MPF 125 Plus products if the PFI has selected SMI coverage.(5) The third layer of losses is absorbed by the FHLBNY.Allowance policy — In January 2020, we concluded our evaluation under the CECL guidance, which we adopted effective January 1, 2020. An additional credit loss allowance of $3.0 million will be recorded effective January 1, 2020 as a reduction to the amortized cost balance of mortgage loans. We consider the amount to be immaterial to our financial condition, results of operations and cash flows.Periodic review — The FHLBNY performs periodic reviews of impaired mortgage loans within the MPF loan portfolio to identify the potential for credit losses inherent in the impaired loan to determine the likelihood of collection of the principal and interest. We utilize an allowance for credit losses to reserve for estimated losses in our conventional mortgage loan portfolio (uninsured MPF loans). The measurement of our allowance for credit losses is determined by (i) reviewing certain conventional mortgage loans for impairment on an individual basis, (ii) reviewing remaining conventional mortgage loans (not individually assessed) on a collective basis, and (iii) reviewing government insured loans (FHA- and VA-insured MPF loans) on a collective basis.We compute the provision for credit losses without considering the private mortgage insurance and other accompanying credit enhancement features that provide credit assurance to the FHLBNY.·Individually evaluated conventional mortgage loans — We evaluate impaired conventional mortgage loans for impairment individually. A conventional mortgage loan is considered impaired when, based on current information and events, it is probable that we will be unable to collect all amounts due according to the contractual terms of the loan agreement. The primary credit quality indicator that we use in evaluating impairment on mortgage loans includes a serious delinquency rate — MPF loans that are 90 days or more past due, in bankruptcy, or in the process of foreclosure. We also individually measure credit losses on loans that are restructured in a troubled debt restructuring involving a modification of terms. Loans discharged under Chapter 7 bankruptcy are considered TDR, and are individually measured for credit losses when seriously delinquent. We measure estimated credit impairment based on the estimated fair value of the underlying collateral, which is determined using property values, less selling costs.·Collectively evaluated conventional mortgage loans — We collectively evaluate the majority of our conventional mortgage loan portfolio for impairment (excluding those individually evaluated), and estimate an allowance for credit losses based primarily upon the following factors: (i) loan delinquencies, and (ii) actual historical loss severities. We utilize a roll-rate methodology when estimating allowance for credit losses. This methodology projects loans migrating to charge off status (180 days delinquency) based on historical average rates of delinquency. We then apply a loss severity factor to calculate an estimate of credit losses.·Collectively evaluated government insured loans — The FHLBNY invests in government-insured mortgage loans that are insured or guaranteed by the Federal Housing Administration, the Department of Veterans Affairs, and/or the Rural Housing Service of the Department of Agriculture. The servicer or PFI obtains and maintains insurance or a guaranty from the applicable government agency. The servicer or PFI is responsible for compliance with all government agency requirements and for obtaining the benefit of the applicable guarantee or insurance with respect to defaulted government-insured mortgage loans. Any losses incurred on these loans that are not recovered from the insurer/guarantor are absorbed by the servicers. The FHLBNY’s credit risk for these loans is if the servicer or PFI fails to pay for losses not covered by the guarantee or insurance. We evaluate the credit worthiness of our member, the PFI.Federal Home Loan Bank of New YorkNotes to Financial StatementsClasses of the MPF loan portfolio would be subject to disaggregation to the extent that it is needed to understand the exposure to credit risk arising from these loans. The FHLBNY has determined that no further disaggregation of portfolio segments is needed other than the methodology discussed above.Credit Enhancement FeesThe credit enhancement fee (CE fees) due to the PFI for taking on a credit enhancement obligation is accrued based on the master commitments outstanding. For certain MPF products, the CE fees are held back for 12 months and then paid monthly to the PFIs. Under the MPF agreements with PFIs, the FHLBNY may recover credit losses from future CE fees. The FHLBNY does not consider CE fees when computing the allowance for credit losses. It is assumed that repayment is expected to be provided solely by the sale of the underlying property, and there is no other available and reliable source of repayment. If losses were incurred, the FHLBNY would withhold CE fee payments to the PFI associated with the loan that is in a loss position. The amount withheld would be commensurate with the credit loss and the loss layer for which the PFI has assumed the credit enhancement responsibility. The FHLBNY’s loss experience has been insignificant and amounts of CE fees withheld have been insignificant in all periods in this report. Years ended December 31, 2019 2018 2017 $ 814 $ 992 $ 1,554 (19 ) (172 ) (580 ) - 365 305 (142 ) (371 ) (287 ) $ 653 $ 814 $ 992 December 31, 2019 2018 2017 160 $ 238 $ 210 493 576 782 $ 653 $ 814 $ 992 December 31, 2019 December 31, 2018 Total Mortgage loans, carrying values net of allowance for credit losses(a) $ 3,173,352 $ 2,927,230 Non-performing mortgage loans - Conventional(a)(b) $ 6,899 $ 8,453 Insured MPF loans past due 90 days or more and still accruing interest(a)(b) $ 3,935 $ 5,501 (a)Includes loans classified as special mention, sub-standard, doubtful or loss under regulatory criteria, net of amounts charged-off if delinquent for 180 days or more.(b)Data in this table represents UPB, and would not agree to data reported in other tables at “recorded investment,” which includes interest receivable.Federal Home Loan Bank of New YorkNotes to Financial Statements(a) Includes loans classified as special mention, sub-standard, doubtful or loss under regulatory criteria, net of amounts charged-off if delinquent for 180 days or more. (b) Data in this table represents UPB, and would not agree to data reported in other tables at “recorded investment,” which includes interest receivable. December 31, 2019 Unpaid Average Recorded Principal Related Recorded Investment Balance Allowance Investment(d) $ 9,061 $ 9,025 $ - $ 10,169 1,412 1,408 160 987 $ 10,473 $ 10,433 $ 160 $ 11,156 December 31, 2018 Unpaid Average Recorded Principal Related Recorded Investment Balance Allowance Investment(d) $ 10,507 $ 10,443 $ - $ 12,681 993 974 238 1,161 $ 11,500 $ 11,417 $ 238 $ 13,842 (a) Based on analysis of the nature of risks of the FHLBNY’s investments in MPF loans, including its methodologies for identifying and measuring impairment, management has determined that presenting such loans as a single class is appropriate. (b) Collateral values, net of estimated costs to sell, exceeded the recorded investments in impaired loans and no allowances were deemed necessary. (c) Interest received is not recorded as Interest income if an uninsured loan is past due 90 days or more. Cash received is recorded as a liability on the assumption that cash was remitted by the servicer to the FHLBNY that could potentially be recouped by the borrower in a foreclosure. (d) Represents the average recorded investment for the twelve months ended December 31, 2019 and 2018. (a)Based on analysisFederal Home Loan Bank of the nature of risks of the FHLBNY’s investments in MPF loans, including its methodologies for identifying and measuring impairment, management has determined that presenting such loans as a single class is appropriate.New York(b)Collateral values, net of estimated costsNotes to sell, exceeded the recorded investments in impaired loans and no allowances were deemed necessary.(c)Interest received is not recorded as Interest income if an uninsured loan is past due 90 days or more. Cash received is recorded as a liability on the assumption that cash was remitted by the servicer to the FHLBNY that could potentially be recouped by the borrower in a foreclosure.(d)Represents the average recorded investment for the twelve months ended December 31, 2018 and 2017.Financial Statements December 31, 2019 Unpaid Average Recorded Principal Related Recorded Investment Balance Allowance Investment(a) $ 222,266 $ 217,000 $ - $ 227,695 2,956,793 2,900,311 493 2,794,030 $ 3,179,059 $ 3,117,311 $ 493 $ 3,021,725 December 31, 2018 Unpaid Average Recorded Principal Related Recorded Investment Balance Allowance Investment(a) $ 233,064 $ 227,268 $ - $ 237,144 2,697,827 2,644,732 576 2,660,060 $ 2,930,891 $ 2,872,000 $ 576 $ 2,897,204 (a) Represents the average recorded investment for the twelve months ended December 31, 2019 and 2018. (a)Average recorded investment is for the twelve months ended December 31, 2018 and 2017. December 31, 2019 December 31, 2018 Conventional Insured Conventional Insured MPF Loans Loans MPF Loans Loans $ 15,775 $ 11,418 $ 17,635 $ 12,724 3,424 2,611 2,683 3,025 1,742 1,391 1,169 1,663 5,177 2,756 7,316 4,216 26,118 18,176 28,803 21,628 2,941,148 204,090 2,680,524 211,436 $ 2,967,266 $ 222,266 $ 2,709,327 $ 233,064 $ 4,198 $ 2,408 $ 5,149 $ 3,343 31 14 37 27 0.24 % 1.87 % 0.31 % 2.52 % $ 7,223 $ 4,147 $ 8,525 $ 5,879 $ - $ 4,147 $ - $ 5,879 $ 6,919 $ - $ 8,485 $ - $ 7,711 $ 1,028 $ 7,398 $ 823 Modified loans under MPF® program $ 1,138 $ - $ 1,423 $ - $ 293 $ 767 (a) Serious delinquency rate is defined as recorded investments in loans that are 90 days or more past due or in the process of foreclosure expressed as a percentage of total loan class. (b) Loans discharged from Chapter 7 bankruptcies are considered as TDRs. (a)Serious delinquency rate is defined as recorded investments in loans that are 90 days or more past due or in the processFederal Home Loan Bank of foreclosure expressed as a percentage of total loan class.New York(b)Loans discharged from Chapter 7 bankruptcies are considered as TDRs.Notes to Financial StatementsNote 11.Deposits.Note 11. Deposits. December 31, 2019 December 31, 2018 $ 1,144,519 $ 1,002,587 15,000 40,000 1,159,519 1,042,587 34,890 20,050 $ 1,194,409 $ 1,062,637 (a)Term deposits were for periods of one year or less.(b)Specific disclosures about deposits that exceed FDIC limits have been omitted as deposits are not insured by the FDIC. Deposits are received in the ordinary course of the FHLBNY’s business. The FHLBNY has pledged securities to the FDIC to collateralize deposits maintained at the FHLBNY by the FDIC; for more information, see Securities Pledged in Note 8. Held-to-Maturity Securities.Federal Home Loan Bank of New YorkNotes to Financial Statements(a) Term deposits were for periods of one year or less. (b) Specific disclosures about deposits that exceed FDIC limits have been omitted as deposits are not insured by the FDIC. Deposits are received in the ordinary course of the FHLBNY’s business. The FHLBNY has pledged securities to the FDIC to collateralize deposits maintained at the FHLBNY by the FDIC; for more information, see Securities Pledged in Note 8. Held-to-Maturity Securities. December 31, 2019 December 31, 2018
Outstanding
Interest Rate (b)
Outstanding
Interest Rate (b) Amount Outstanding Average Interest Rate(b) Amount Outstanding Average Interest Rate(b) $ 1,159,519 2.03 % $ 1,042,587 1.73 % 34,890 20,050 $ 1,194,409 $ 1,062,637 (a) Primarily adjustable rate. (b) The weighted average interest rate is calculated based on the average balance. (a)Primarily adjustable rate.(b)The weighted average interest rate is calculated based on the average balance.Note12. Consolidated Obligations. Note 12.Consolidated Obligations.20182019 and December 31, 20172018 (in thousands):(a)Hedge valuation basis adjustments represent changes in the fair values due to changes in the LIBOR benchmark rate on fixed-rate bonds in a Fair value hedge.(b)Hedge basis adjustments on terminated hedges represent the unamortized balances of valuation basis of fixed-rate bonds that were previously in a qualifying hedge relationship. The valuation basis at the time of hedge termination is amortized as a yield adjustment through Interest expense.(c)Valuation adjustments represent changes in the entire fair values of bonds and discount notes elected under the FVO.Federal Home Loan Bank of New YorkNotes to Financial Statements December 31, 2019 December 31, 2018 Consolidated obligation bonds-amortized cost $ 78,179,661 $ 83,764,337 Hedge valuation basis adjustments 377,000 238,150 Hedge basis adjustments on de-designated hedges 139,605 131,497 FVO - valuation adjustments and accrued interest 67,043 19,792 Total Consolidated obligation bonds $ 78,763,309 $ 84,153,776 Discount notes-amortized cost $ 73,955,552 $ 50,631,066 Hedge value basis adjustments (105 ) - FVO - valuation adjustments and remaining accretion 3,758 9,172 Total Consolidated obligation discount notes $ 73,959,205 $ 50,640,238 December 31, 2019 December 31, 2018 Weighted Weighted Average Percentage Average Percentage Amount Rate(a) of Total Amount Rate(a) of Total $ 62,319,595 1.77 % 79.79 % $ 64,893,475 2.29 % 77.48 % 4,061,125 2.10 5.20 7,555,545 2.38 9.02 2,817,715 2.22 3.61 2,586,325 2.48 3.09 1,538,835 2.69 1.97 2,181,750 2.39 2.60 1,240,735 2.60 1.58 1,435,235 2.73 1.71 6,130,800 3.34 7.85 5,105,650 3.45 6.10 78,108,805 1.96 % 100.00 % 83,757,980 2.39 % 100.00 % 95,560 42,647 (24,704 ) (36,290 ) 377,000 238,150 Hedge basis adjustments on de-designated hedges(d) 139,605 131,497 67,043 19,792 $ 78,763,309 $ 84,153,776 (a)Weighted average rate represents the weighted average contractual coupons of bonds, unadjusted for swaps.(b)Amortization of CO bond premiums and discounts are recorded in interest expense as yield adjustments.(c)Hedge valuation basis adjustments represent changes in the fair values due to changes in LIBOR on fixed-rate bonds in a Fair value hedge.(d)Hedge basis adjustments on terminated hedges represent the unamortized balances of valuation basis of fixed-rate bonds that were previously in a fair value hedging relationship. Generally, when a hedging relationship is de-designated, the valuation basis is no longer adjusted for changes in the valuation of the debt for changes in the benchmark rate; instead, the basis is amortized over the debt’s remaining life, so that at maturity of the debt, the unamortized basis is reversed to zero.(e)(a) Weighted average rate represents the weighted average contractual coupons of bonds, unadjusted for swaps. (b) Amortization of CO bond premiums and discounts are recorded in interest expense as yield adjustments. (c) Hedge valuation basis adjustments under ASC 815 fair value hedges represent changes in the fair values of fixed-rate CO bonds due to changes in the designated benchmark rate. LIBOR is the primary benchmark index; the FHLBNY may also hedge to the FF/OIS index and the FF/SOFR index. (d) Hedge basis adjustments on de-designated hedges represent the unamortized balances of valuation basis of fixed-rate CO bonds that were previously in a fair value hedging relationship. Generally, when a hedging relationship is de-designated, the valuation basis is no longer adjusted for changes in the valuation of the debt for changes in the benchmark rate; instead, the basis is amortized over the debt’s remaining life, so that at maturity of the debt the unamortized basis is reversed to zero. (e) Valuation adjustments represent changes in the entire fair values of CO bonds elected under the FVO. (a)Hedge valuation basis adjustments represent changes in the fair values of fixed-rate CO bonds in a Fair value hedge due to changes in the LIBOR benchmark rate.(b)Hedge basis adjustments on terminated hedges represent the unamortized balances of valuation basis of fixed-rate bonds that were previously in a hedging relationship.(c)Valuation adjustments represent changes in the entire fair values of bonds elected under the FVO.Federal Home Loan Bank of New YorkNotes to Financial Statements December 31, 2019 December 31, 2018 Amount Percentage of
Total Amount Percentage of
Total Fixed-rate, non-callable $ 32,588,805 41.72 % $ 22,745,980 27.16 % Fixed-rate, callable 4,803,000 6.15 4,966,000 5.93 Step Up, callable 15,000 0.02 880,000 1.05 Single-index floating rate 40,702,000 52.11 55,166,000 65.86 Total par value $ 78,108,805 100.00 % $ 83,757,980 100.00 % December 31, 2019 December 31, 2018 $ 74,094,586 $ 50,805,481 $ 73,955,552 $ 50,631,066 Hedge value basis adjustments (105 ) - 3,758 9,172 $ 73,959,205 $ 50,640,238 1.60 % 2.34 % (a)Valuation adjustments represent changes in the entire fair values of discount notes elected under the FVO.(a) Valuation adjustments represent changes in the entire fair values of discount notes elected under the FVO. Years ended December 31, 2019 2018 2017 $ 161,718 $ 131,654 $ 125,062 Additions from current period's assessments 52,552 62,382 53,417 (60,376 ) (32,318 ) (46,825 ) $ 153,894 $ 161,718 $ 131,654 stock. Membershipstock, and Activity-based Class B capital stock have the same voting rights and dividend rates. Membersmembers can redeem Class B stock by giving five years notice. The FHLBNY’s capital plan does not provide for the issuance of Class A capital stock.Federal Home Loan Bank of New YorkNotes to Financial StatementsThe FHLBNY’s Class B capital stock issued and outstanding was $5.8 billion and $6.1 billion at December 31, 20182019 and $6.8 billion at December 31, 20172018.· Membership stock is issued to meet membership stock purchase requirements. The FHLBNY requires member institutions to maintain membership stock based on a percentage of the member’s mortgage-related assets. The current capital stock purchase requirement for membership is 12.5 basis points. In addition, notwithstanding this requirement, the FHLBNY introduced a $100 million cap on membership stock per member effective January 1, 2019. · Membership stock is issued to meet membership stock purchase requirements. The FHLBNY requires member institutions to maintain membership stock based on a percentage of the member’s mortgage-related assets. Effective August 1, 2017, the FHLBNY reduced the capital stock purchase requirement for membership from 15.0 basis points to 12.5 basis points. In addition in 2018, notwithstanding the membership purchase requirements noted, the FHLBNY added a provision to its Capital Plan effective January 1, 2019, to permit (but not require) a member to purchase membership stock of no more than $100 million.· Activity based stock is issued on a percentage of outstanding balances of advances, MPF loans and certain commitments. The FHLBNY’s current capital plan requires a stock purchase of 4.5% of the member’s borrowed amount. Excess activity-based capital stock is repurchased daily.· Activity based stock is issued on a percentage of outstanding balances of advances, MPF loans and certain commitments. The FHLBNY’s current capital plan requires a stock purchase of 4.5% of the member’s borrowed amount. Excess activity-based capital stock is repurchased daily. IfThe Director of the FHLBNY became classified into aFinance Agency has discretion to add to or modify the corrective action requirements for each capital classification other than adequately capitalized if the Bank could be adversely impacted byDirector of the correctiveFinance Agency determines that such action requirements for thatis necessary to ensure the safe and sound operation of the FHLBank and the FHLBank’s compliance with its risk-based and minimum capital classification.requirements.· Adequately capitalized. A FHLBank is adequately capitalized if it has sufficient permanent and total capital to meet or exceed its risk-based and minimum capital requirements. FHLBanks that are adequately capitalized have no corrective action requirements. ·Adequately capitalized. A FHLBank is adequately capitalized if it has sufficient permanent and total capital to meet or exceed its risk-based and minimum capital requirements. FHLBanks that are adequately capitalized have no corrective action requirements.· Undercapitalized. A FHLBank is undercapitalized if it does not have sufficient permanent or total capital to meet one or more of its risk-based and minimum capital requirements, but such deficiency is not large enough to classify the FHLBank as significantly undercapitalized or critically undercapitalized. A FHLBank classified as undercapitalized must submit a capital restoration plan that conforms with ·Undercapitalized. A FHLBank is undercapitalized if it does not have sufficient permanent or total capital to meet one or more of its risk-based and minimum capital requirements, but such deficiency is not large enough to classify the FHLBank as significantly undercapitalized or critically undercapitalized. A FHLBank classified as undercapitalized must submit a capital restoration plan that conforms with regulatory requirements to the Director of the Finance Agency for approval, execute the approved plan, suspend dividend payments and excess stock redemptions or repurchases, and not permit growth of its average total assets in any calendar quarter beyond the average total assets of the preceding quarter unless otherwise approved by the Director of the Finance Agency.·Significantly undercapitalized. A FHLBank is significantly undercapitalized if either (1) the amount of permanent or total capital held by the FHLBank is less than 75% of any one of its risk-based or minimum capital requirements, but such deficiency is not large enough to classify the FHLBank as critically undercapitalized or (2) an undercapitalized FHLBank fails to submit or adhere to a Finance Agency Director-approved capital restoration plan in conformance with regulatory requirements. A FHLBank classified as significantly undercapitalized must submit a capital restoration plan that conforms with regulatory requirements to the Director of the Finance Agency for approval, execute the approved plan, suspend dividend payments and excess stock redemptions or repurchases, and is prohibited from paying a bonus to or increasing the compensation of its executive officers without prior approval of the Director of the Finance Agency.regulatory requirements to the Director of the Finance Agency for approval, execute the approved plan, suspend dividend payments and excess stock redemptions or repurchases, and not permit growth of its average total assets in any calendar quarter beyond the average total assets of the preceding quarter unless otherwise approved by the Director of the Finance Agency. · Significantly undercapitalized. A FHLBank is significantly undercapitalized if either (1) the amount of permanent or total capital held by the FHLBank is less than 75% of any one of its risk-based or minimum capital requirements, but such deficiency is not large enough to classify the FHLBank as critically undercapitalized or (2) an undercapitalized FHLBank fails to submit or adhere to a Finance Agency Director-approved capital restoration plan in conformance with regulatory requirements. A FHLBank classified as significantly undercapitalized must submit a capital restoration plan that conforms with regulatory requirements to the Director of the Finance Agency for approval, execute the approved plan, suspend dividend payments and excess stock redemptions or repurchases, and is prohibited from paying a bonus to or increasing the compensation of its executive officers without prior approval of the Director of the Finance Agency. ·Critically undercapitalized. A FHLBank is critically undercapitalized if either (1) the amount of total capital held by the FHLBank is less than two percent of the FHLBank’s total assets or (2) a significantly undercapitalized FHLBank fails to submit or adhere to a Finance Agency Director-approved capital restoration plan in conformance with regulatory requirements. The Director of the Finance Agency may place a FHLBank in conservatorship or receivership. A FHLBank will be placed in mandatory receivership if (1) the assets of a FHLBank are less than its obligations during a 60-day period or (2) the FHLBank has not being paying its debts on a regular basis, or during a 60-day period. Until such time the Finance Agency is appointed as conservator or receiver for a critically undercapitalized FHLBank, the FHLBank is subject to all mandatory restrictions and obligations applicable to a significantly undercapitalized FHLBank.· Critically undercapitalized. A FHLBank is critically undercapitalized if either (1) the amount of total capital held by the FHLBank is less than two percent of the FHLBank’s total assets or (2) a significantly undercapitalized FHLBank fails to submit or adhere to a Finance Agency Director-approved capital restoration plan in conformance with regulatory requirements. The Director of the Finance Agency may place a FHLBank in conservatorship or receivership. A FHLBank will be placed in mandatory receivership if (1) the assets of a FHLBank are less than its obligations during a 60-day period or (2) the FHLBank has not being paying its debts on a regular basis, or during a 60-day period. Until such time the Finance Agency is appointed as conservator or receiver for a critically undercapitalized FHLBank, the FHLBank is subject to all mandatory restrictions and obligations applicable to a significantly undercapitalized FHLBank. · The FHLBank is engaging in conduct that could result in the rapid depletion of permanent or total capital;· The value of collateral pledged to the FHLBank has decreased significantly;· The value of property subject to mortgages owned by the FHLBank has decreased significantly;· The FHLBank is in an unsafe and unsound condition following notice to the FHLBank and an informal hearing before the Director of the Finance Agency; or· The FHLBank is engaging in an unsafe and unsound practice because the FHLBank’s asset quality, management, earnings, or liquidity were found to be less than satisfactory during the most recent examination, and such deficiency has not been corrected.· The FHLBank is engaging in conduct that could result in the rapid depletion of permanent or total capital; · The value of collateral pledged to the FHLBank has decreased significantly; · The value of property subject to mortgages owned by the FHLBank has decreased significantly; · The FHLBank is in an unsafe and unsound condition following notice to the FHLBank and an informal hearing before the Director of the Finance Agency; or · The FHLBank is engaging in an unsafe and unsound practice because the FHLBank’s asset quality, management, earnings, or liquidity were found to be less than satisfactory during the most recent examination, and such deficiency has not been corrected. December 31, 2019 December 31, 2018 Required(d) Actual Required(d) Actual $ 1,107,356 $ 7,584,829 $ 797,783 $ 7,765,726 4.00 % 4.68 % 4.00 % 5.38 % $ 6,482,481 $ 7,584,829 $ 5,775,256 $ 7,765,726 5.00 % 7.02 % 5.00 % 8.07 % $ 8,103,101 $ 11,377,244 $ 7,219,070 $ 11,648,589 (a)Actual “Risk-based capital” is capital stock and retained earnings plus mandatorily redeemable capital stock. Section 932.2 of the Finance Agency’s regulations also refers to this amount as “Permanent Capital.”(b)Required “Total capital” is 4.0% of total assets.(c)The required leverage ratio of total capital to total assets should be at least 5.0%. For the purposes of determining the leverage ratio, total capital shall be computed by multiplying the Bank’s Permanent Capital by 1.5.(d)Required minimum.(e)Under regulatory guidelines issued by the Finance Agency in August 2011 that was consistent with guidance provided by other federal banking agencies with respect to capital rules, risk weights are maintained at AAA for U.S. Treasury securities and other securities issued or guaranteed by the U.S. Government, government agencies, and government-sponsored entities for purposes of calculating risk-based capital.Federal Home Loan Bank of New YorkNotes to Financial Statements(a) Actual “Risk-based capital” is capital stock and retained earnings plus mandatorily redeemable capital stock. Section 1277.3 of the Finance Agency’s regulations (superseding section 932.2 effective January 1, 2020) also refers to this amount as “Permanent Capital.” (b) Required “Total capital” is 4.0% of total assets. (c) The required leverage ratio of total capital to total assets should be at least 5.0%. For the purposes of determining the leverage ratio, total capital shall be computed by multiplying the Bank’s Permanent Capital by 1.5. (d) Required minimum. (e) Under regulatory guidelines issued by the Finance Agency in August 2011 that was consistent with guidance provided by other federal banking agencies with respect to capital rules, risk weights are maintained at AAA for U.S. Treasury securities and other securities issued or guaranteed by the U.S. Government, government agencies, and government-sponsored entities for purposes of calculating risk-based capital. December 31, 2019 December 31, 2018 $ 835 $ 229 371 1,068 402 425 3,521 4,123 $ 5,129 $ 5,845 Years ended December 31, 2019 2018 2017 Beginning balance $ 5,845 $ 19,945 $ 31,435 Capital stock subject to mandatory redemption reclassified from equity 4,184 8,756 3,009 Redemption of mandatorily redeemable capital stock(a) (4,900 ) (22,856 ) (14,499 ) Ending balance $ 5,129 $ 5,845 $ 19,945 Accrued interest payable(b) $ 84 $ 112 $ 305 (a)Redemption includes repayment of excess stock.(b)The annualized accrual rates at the period end dates were 6.90%, 6.00% and 5.00% at December 31, 2018, 2017 and 2016.(a) Redemption includes repayment of excess stock. (b) The annualized accrual rates for the three months ended December 31, 2019, 2018 and 2017 were 6.35%, 6.90% and 6.00%. Accrual rates are based on estimated dividend rates. $591.3$685.8 million and $479.2$591.3 million as restricted retained earnings in the FHLBNY’s Total Capital at December 31, 20182019 and December 31, 2017.Federal Home Loan Bank of New YorkNotes to Financial Statements2018. Years ended December 31, 2019 2018 2017 $ 472,588 $ 560,478 $ 479,469 $ 472,588 $ 560,478 $ 479,469 55,511 61,798 62,800 (60 ) (140 ) (215 ) 55,451 61,658 62,585 $ 8.52 $ 9.09 $ 7.66 The FHLBNY has a single class of capital stock, and earnings per share computation is for the Class B capital stock. For more information, see Note 14. Capital Stock, Mandatorily Redeemable Capital Stock and Restricted Earnings.employees of the Bank.employees. The BankFHLBNY also participates in the Pentegra Defined Contribution Plan for Financial Institutions, a tax-qualified defined contribution plan. The FHLBNY also offers two non-qualified Benefit Equalization Plans, which are retirement plans. The two plans restore defined benefits for those employees who have had their qualified Defined Benefit Plan and their Defined Contribution Plan limited by IRS regulations. The non-qualified BEP that restores benefits to participant’s Defined Contribution Plan was introduced and became effective at January 1, 2017. The two non-qualified Benefit Equalization Plans (BEP) are unfunded. Years ended December 31, 2019 2018 2017 $ 9,976 $ 10,066 $ 7,455 7,613 6,838 5,705 2,501 2,329 2,122 (230 ) (1,145 ) (86 )(a) $ 19,860 $ 18,088 $ 15,196 2019 2018 2017 $ 9,976 $ 10,066 $ 7,455 $ 9,696 $ 10,158 $ 7,409 (a) 108.59 % 109.86 % 111.30 % FHLBNY's funded status as of July 1(c) 108.67 % 114.77 % 115.79 % (a) Contributions by the FHLBNY were not more than 5% of the total contribution made to the multi-employer plan by all participants for the plan year ended June 30 of the prior year. The most recent Form 5500 available for the Pentegra DB Plan is for the plan year ended June 30, 2018. (b) Funded status is based on actuarial valuation of the Pentegra DB Plan, and includes all participants allocated to plan years and known at the time of the preparation of the actuarial valuation. The funded status may increase because the plan’s participants are permitted to make contributions through March 15 of the following year. Funded status remains preliminary until the Form 5500 is filed no later than April 15, 2020 for the plan year ended June 30, 2019. For information with respect to contributions expensed by the FHLBNY, see previous Table — Retirement Plan Expenses Summary. Contributions include minimum required under ERISA that are prepaid for the fiscal plan year that ends at June 30 in the following year, and as a result contributions may not equal amounts expensed. (c) Based on cash contributions made through December 31, 2019 and allocated to the DB Plan year(s). The funded status may increase because the FHLBNY is permitted to make contributions through March 15 of the following year. (a)Contributions by the FHLBNY were not more than 5%the total contribution madeNew Yorkthe multi-employer plan by all participants. The most recent Form 5500 available for the Pentegra DB Plan is for the plan year ended June 30, 2017.Financial Statements(b)Funded status is based on actuarial valuation of the Pentegra DB Plan, and includes all participants allocated to plan years and known at the time of the preparation of the actuarial valuation. The funded status may increase because the plan’s participants are permitted to make contributions through March 15 of the following year. Funded status remains preliminary until the Form 5500 is filed no later than April 15, 2019 for the plan year ended June 30, 2018. For information with respect to contributions expensed by the FHLBNY, see previous Table — Retirement Plan Expenses Summary. Contributions include minimum required under ERISA that are prepaid for the fiscal plan year that ends at June 30 in the following year, and as a result contributions may not equal amounts expensed.(c)Based on cash contributions made through December 31, 2018 and allocated to the DB Plan year(s). The funded status may increase because the FHLBNY is permitted to make contribution through March 15 of the following year.Federal Home Loan Bank of New YorkNotes to Financial Statements December 31, 2019 2018 $ 67,274 $ 52,288 11,032 10,819 78,306 63,107 Unrecognized prior service (cost)/credit (1,548 ) - (31,954 ) (22,980 ) $ 44,804 $ 40,127 December 31, 2019 2018 Projected benefit obligation at the beginning of the year $ 63,107 $ 63,089 1,265 1,095 2,544 2,155 (2,011 ) (1,824 ) Actuarial loss/(gain)(a) 11,853 (1,408 ) Plan amendments 1,548 - $ 78,306 $ 63,107 (a)Prior year ending balance was not adjusted. The amounts were de minimis.(b) Actuarial loss of $8.2 million in 2017 was primarily due to unfavorable changes in demographic experience, and decrease in the discount rate. Unfavorable changes were partly offset by gain due to change in mortality assumptions.(a) Actuarial loss of $11.9 million in 2019 was primarily due to decline in discount rate and unfavorable change in demographic experience, partly offset by favorable changes in mortality assumptions. December 31, 2019 2018 $ 31,954 $ 22,980 Prior service cost/(credit) 1,548 - $ 33,502 $ 22,980 Federal Home Loan Bank of New YorkNotes to Financial Statements December 31, 2019 2018 Fair value of the plan assets at the beginning of the year $ - $ - Employer contributions 2,011 1,824 Benefits paid (2,011 ) (1,824 ) Fair value of the plan assets at the end of the year $ - $ - Years ended December 31, 2019 2018 2017 $ 1,265 $ 1,095 $ 888 2,544 2,155 2,093 2,879 3,545 2,554 6,688 6,795 5,535 925 43 170 $ 7,613 $ 6,838 $ 5,705 December 31, 2019 2018 Net loss/(gain) $ 11,853 $ (1,408 ) Prior service cost/(credit) 1,548 - (2,879 ) (3,545 ) $ 10,522 $ (4,953 ) $ 17,210 $ 1,842 December 31, 2020 Expected amortization of net loss/(gain) $ 4,561 Expected amortization of past service cost/(credit) $ 697 December 31, 2019 December 31, 2018 December 31, 2017 3.05 % 4.10 % 3.47 % 4.50 % 4.50 % �� 4.50 % 5 6 6 $ (2,011 ) $ (1,824 ) $ (1,788 ) (a)The discount rates were based on the Citigroup Pension Liability Index at December 31, adjusted for duration in each of the three years.Federal Home Loan Bank of New YorkNotes to Financial Statements(a) The discount rates were based on the Citigroup Pension Liability Index at December 31, adjusted for duration in each of the three years. Payments $ 2,651 2,968 3,202 3,455 2024 3,668 2025-2029 21,704 $ 37,648 20192020 is expected to be $6.7$9.2 million ($6.86.7 million in 2018)2019).The net periodic benefit costs were immaterial in the periods in this report, benefiting from amortization of gains from plan amendments in 2014 that resulted in a reduction of $8.8 million in plan obligations. The gains from the amendments are amortized over an actuarially determined period, effectively reducing net periodic benefit cost in each period in this report.4.09%3.04%.2018 and $50.1 thousand in 2017;2018; it would also have resulted in an increase in Benefit obligations by $0.7 million at December 31, 2019 and $1.0 million at December 31, 2018 and $1.5 million at December 31, 2017.2018. A percentage point decrease in the assumed healthcare trend rates would have resulted in a decrease in postretirement benefit expense by $22.8 thousand in 2019 and $31.4 thousand in 2018, and $43.3 thousand in 2017, and a decrease in Benefit obligations by $0.6 million at December 31, 2019 and $0.9 million at December 31, 2018 and $1.3 million at December 31, 2017.2018.20182019 and 20172018 (in thousands):Federal Home Loan Bank of New YorkNotes to Financial Statements December 31, 2019 2018 Accumulated postretirement benefit obligation at the beginning of the year $ 12,826 $ 17,120 Service cost 72 87 Interest cost 406 465 Actuarial (gain)/loss (2,228 ) (4,457 ) Plan participant contributions 220 191 Actual benefits paid (738 ) (636 ) Retiree drug subsidy reimbursement 52 56 Accumulated postretirement benefit obligation at the end of the year $ 10,610 $ 12,826 December 31, 2019 2018 $ - $ - 518 445 220 191 (738 ) (636 ) $ - $ - December 31, 2019 2018 $ - $ (258 ) Net (gain)/loss (1,509 ) 269 $ (1,509 ) $ 11 December 31, 2020 Expected amortization of net (gain)/loss $ (152 ) (a)Plan amendments in a prior year reduced plan obligations by $8.8 million, and the resulting gain is being amortized over an actuarially determined period, reducing net periodic benefit costs.Federal Home Loan Bank of New YorkNotes to Financial Statements Years ended December 31, 2019 2018 2017 Service cost (benefits attributed to service during the period) $ 72 $ 87 $ 100 Interest cost on accumulated postretirement health benefit obligation 406 465 629 Amortization of (gain)/loss (451 ) 64 946 Amortization of prior service (credit)/cost (257 ) (1,761 ) (1,761 ) Net periodic postretirement health benefit (income) $ (230 ) $ (1,145 ) $ (86 ) December 31, 2019 2018 $ (2,228 ) $ (4,457 ) Amortization of net gain/(loss) 451 (64 ) 257 1,761 $ (1,520 ) $ (2,760 ) $ (1,750 ) $ (3,905 ) Years ended December 31, 2019 2018 2017 3.04% 4.09% 3.42% 6.75% 6.75% 7.10% 5.00% 4.90% 4.95% 4.50% 4.50% 4.50% 2028 2025/2026 2026 4.50% 4.50% 4.50% 2028 2025/2026 2026 Straight - line Straight - line Straight - line Straight - line Straight - line Straight - line (a)(a) The discount rates were based on the Citigroup Pension Liability Index adjusted for duration in each of the periods in this report. Payments $ 623 656 689 718 2024 722 2025-2029 3,547 $ 6,955 20192020 is expected to be a cost of $0.3$0.2 million (a credit of $1.1$0.2 million in 2018)2019).Federal Home Loan Bank of New YorkNotes to Financial StatementsGeneral — The FHLBNY accounts for its hedging activities in accordance with ASC 815, Derivatives and Hedging (formerly SFAS 133). As a general rule, hedge accounting is permitted where the FHLBNY is exposed to a particular risk, such as interest-rate risk that causes changes in the fair value of an asset or liability or variability in the expected future cash flows of an existing asset, liability or a forecasted transaction that may affect earnings. Derivative contracts hedging the risks associated with the changes in fair value are referred to as Fair value hedges, while contracts hedging the risks affecting the expected future cash flows are called Cash flow hedges.In 2017, the FASB issued ASU 2017-12, Targeted Improvements to Accounting for Hedging Activities (Topic 815), with the primary objective of simplifying and improving the financial reporting of hedging relationships to better portray the economic results of an entity’s risk management activities in its financial statements. In addition, the new guidance requires that we report the entire hedging effects of the hedging instruments in the same income statement line item as the hedged item. Additionally, in 2018, the FASB issued ASU 2018-16, Inclusion of the Secured Overnight Financing Rate (SOFR) Overnight Index Swap (OIS) Rate as a Benchmark Interest Rate for Hedge Accounting Purposes (Topic 815), which adds the OIS rate based on SOFR as an approved U.S. benchmark rate to facilitate the LIBOR to SOFR transition. The other interest rates in the United States that are eligible benchmark under Topic 815 are interest rates on direct Treasury obligations of the U.S. government (UST), the London Interbank Offered Rate (LIBOR) swap rate, the Overnight Index Swap (OIS) Rate based on the Fed Funds Effective Rate, and the Securities Industry and Financial Markets Association (SIFMA) Municipal Swap Rate. For all periods through December 31, 2018, the FHLBNY’s benchmark interest rate for the purposes of ASC 815 was LIBOR.For more information, see Derivatives in Note 1. Significant Accounting Polices and Estimates.Typically, we execute derivatives under three hedging strategies — by designating them as a fair value or cash flow hedge of an underlying financial instrument or a forecasted transaction that qualifies for hedge accounting treatment; by acting as an intermediary; or by designating the derivative as an asset-liability management hedge (i.e. an “economic hedge”).For fair value hedges, in which derivatives hedge the fair values of assets and liabilities, changes in the fair value of derivatives are recorded in Other income in the Statements of Income, together with fair values of the hedged item related to the hedged risk. These amounts are expected to, and generally do, offset each other. Upon adoption of ASU 2017-12 on January 1, 2019, the entire hedging effects of the hedging instruments will be reported in the same income statement line item as the hedged item.For cash flow hedges, in which derivatives hedge the variability of cash flows related to floating- and fixed-rate assets, liabilities or forecasted transactions, the accounting treatment depends on the effectiveness of the hedge. To the extent these derivatives are effective in offsetting the variability of hedged cash flows, the effective portion of the changes in the derivatives’ fair values will not be included in current earnings, but is reported in AOCI. These changes in fair value will be included in earnings of future periods when the hedged cash flows impact earnings. To the extent these cash flow hedges are not effective, changes in their fair values are immediately recorded in Other income in the Statements of Income. Upon adoption of ASU 2017-12 on January 1, 2019, the entire hedging effects of the hedging instruments will remain in AOCI and reclassified to earnings when the cash flows of hedged item impact earnings.When designating a derivative in an economic hedge, it is after considering the operational costs and benefits of executing a hedge that would remain highly-effective through its term and qualify for hedge accounting. When entering into such hedges that do not qualify for hedge accounting, changes in fair value of the derivatives is recorded in earnings with no offsetting fair value adjustments for the hedged asset, liability, or firm commitment. As a result, an economic hedge introduces the potential for earnings variability. Economic hedges are an acceptableFederal Home Loan Bank of New YorkNotes to Financial Statementshedging strategy under the FHLBNY’s risk management program, and the strategies comply with the Finance Agency’s regulatory requirements prohibiting speculative use of derivatives.Principal hedging activities are summarized below:Consolidated ObligationsThe FHLBNY may manage the risk arising from changing market prices and volatility of a Consolidated obligation debt by matching the cash inflows on the derivative with the cash outflow on the Consolidated obligation debt.Fair value hedges — In a typical transaction, fixed-rate Consolidated obligations are issued by the FHLBNY and we would concurrently enter into a matching interest rate swap in which the counterparty pays to the FHLBNY fixed cash flows designed to mirror, in timing and amounts, the cash outflows the FHLBNY pays to the holders of the Consolidated obligations.When such a transaction qualifies for hedge accounting, it is treated as a “Fair value hedge” under the accounting standards for derivatives and hedging. By electing to use fair value hedge accounting, the carrying value of the debt is adjusted for changes in the benchmark interest rate, with any such changes in fair value recorded in current earnings. The interest-rate swap that hedges the interest rate risk of the debt is also recorded on the balance sheet at fair value, with any changes in fair value reflected in earnings.Cash flow hedges — The FHLBNY also hedges variable cash flows resulting from rollover (re-issuance) of 3-month Consolidated obligation discount notes. Variable cash flows from those liabilities are converted to fixed-rate cash flows by entering into receive-variable, pay-fixed interest rate swaps. We also hedge the variability of cash flows of anticipated issuance of fixed-rate debt to changes in the benchmark rate.When such a transaction qualifies for hedge accounting, the hedge is accounted for under the provisions of a “Cash flow hedge”. The interest-rate swaps are recorded at fair values on the balance sheet as a derivative asset or liability, with the offset in AOCI. Changes in fair values of the hedging derivatives are reflected in AOCI to the extent the hedges are effective. Hedge ineffectiveness, if any, is recorded in current earnings. Fair values of swaps in the cash flow hedge programs are reclassified from AOCI to earnings as an interest expense at the same time as when the interest expense from the discount note or the anticipated debt impacts interest expense. Since efforts are made to match the terms of the derivatives to those of the hedged forecasted cash flows as closely as possible, the amount deemed to be ineffective has not been significant.As previously noted, adoption of ASU 2017-12 on January 1, 2019 will amend certain cash flow hedge provisions, including the timing of the recognition in earnings of amounts reclassified from AOCI that would be deemed as not effective.The two Cash flow strategies are described below:Cash flow hedges of “Anticipated Consolidated Bond Issuance” — The FHLBNY enters into interest-rate swaps to hedge the anticipated issuance of debt, and to “lock in” the interest to be paid for the cost of funding. The swaps are terminated upon issuance of the debt instrument, and gains or losses upon termination are recorded in AOCI. Gains and losses are reclassified to earnings in the periods in which earnings are affected by the variability of the cash flows of the debt that was issued.Cash flow hedges of “Rolling Issuance of Discount Notes” — The FHLBNY executes long-term pay-fixed, receive-variable interest rate swaps as hedges of the variable quarterly interest payments on the discount note borrowing program. In this program, we issue a series of discount notes with 91-day terms over periods typically up to 13 years. We will continue issuing new 91-day discount notes over the terms of the swaps as each outstanding discount note matures. The interest rate swaps require a settlement every 91 days, and the variable rate, which is based on the 3-month LIBOR, is reset immediately following each payment. The swaps are expected to eliminate the risk of variability of cash flows for each forecasted discount note issuance every 91 days. The fair values of the interest rate swaps are recorded in AOCI and amounts that fail the highly effective assessment, if any, are recorded immediately in earnings; amounts remaining in AOCI are reclassified to earnings in the same periods in whichFederal Home Loan Bank of New YorkNotes to Financial Statementsinterest expenses are affected by the variability of the cash flows of the discount notes. Upon adoption of ASU 2017-12 effective January 1, 2019, the entire gain or loss of a highly effective hedging swap will remain in AOCI and amounts that are deemed to be effective will be reclassified to earnings in future periods in which earnings are affected by the variability of cash flows of the debt that was issued.Economic hedges of Consolidated obligation debt — When we issue variable-rate Consolidated obligation bonds indexed to 1-month LIBOR, the U.S. Prime rate, or the Federal funds rate, we will generally execute interest-rate swaps (basis swaps) to hedge the basis risk of the variable rate debt to 3-month LIBOR, the FHLBNY’s preferred funding base. The basis swaps are designated as economic hedges of the floating-rate bonds. The choice of an economic hedge is made because the FHLBNY has determined that the operational cost of designating the hedges under accounting standards for derivatives and hedge accounting would outweigh the accounting benefits. In this economic hedge, only the interest rate swap is carried at fair value, with changes in fair values recorded though earnings.Consolidated obligation debt elected under the Fair Value Option — An alternative to hedge accounting, which permits the debt to be carried at the benchmark (LIBOR) fair value, is to elect debt under the FVO. Once the irrevocable election is made upon issuance of the debt, the entire change in fair value of the debt is reported in earnings. We have elected to carry certain fixed-rate Consolidated bonds and certain discount notes under the FVO. For more information, see Fair Value Option Disclosures in Note 18. Fair Values of Financial Instruments. Typically, we would also execute interest rate swaps (to convert the fixed-rate cash flows of the FVO debt to variable-rate cash flows), and changes in the fair values of the swaps would also be recorded in earnings, creating a natural offset to the debt’s fair value changes through earnings. The interest rate swap would be designated as an economic hedge of the debt.AdvancesWe offer a wide array of advances structures to meet members’ funding needs. These advances may have maturities up to 30 years with fixed or adjustable rates and may include early termination features or options. We may use derivatives to adjust the repricing and/or options characteristics of advances to more closely match the characteristics of its funding liabilities.Fair value hedges — In general, whenever a member executes a longer-term fixed rate advance, or a fixed or variable-rate advance with call or put or other embedded options, we will simultaneously execute a derivative transaction, generally an interest rate swap, with terms that offset the terms of the fixed rate advance, or terms of the advance with embedded put or call options or other options. When such instruments are conceived, designed and structured, our control procedures require the identification and evaluation of embedded derivatives, as defined under accounting standards for derivatives and hedging activities.When a fixed-rate advance is hedged, the combination of the fixed rate advance and the derivative transaction effectively creates a variable rate asset, indexed to LIBOR, which is the benchmark rate for the FHLBNY in the periods in this report. With a putable advance borrowed by a member, we would purchase from the member a put option that is embedded in the advance. We may hedge a putable advance by entering into a cancellable interest rate swap in which we pay to the swap counterparty fixed-rate cash flows, and in return the swap counterparty pays us variable-rate cash flows. The swap counterparty can cancel the swap on the put date, which would normally occur in a rising rate environment, and we can terminate the advance and extend additional credit to the member on new terms. We also offer callable advances to members, which is a fixed-rate advance borrowed by a member. Within the structure of the advance, the FHLBNY sells to the member an embedded call option that enables the member to terminate the advance at pre-determined exercise dates. The call option is embedded in the advance. We hedge such advances by executing interest rate swaps with cancellable option features that would allow us to terminate the swaps also at pre-determined option exercise dates.Advances elected under the Fair Value Option — From time to time, we have elected the FVO on an instrument-by-instrument basis on certain advances. Once the irrevocable election is made upon issuance of the advance, the entire change in fair value of the advance is reported in earnings, and provides a natural economic offset when a Consolidated obligation debt is elected under the FVO.Federal Home Loan Bank of New YorkNotes to Financial StatementsEconomic hedges of variable rate capped advances — We offer variable rate advances with an embedded option that caps the interest rate payable by the borrower. The FHLBNY would typically offset the risk presented by the embedded cap by executing a matching standalone cap.Mortgage LoansMortgage loans are fixed-rate MPF loans held-for-portfolio, and the FHLBNY manages the interest rate and prepayment risk associated with mortgages through debt issuance, without the use of derivatives. Firm commitments to purchase or deliver mortgage loans are accounted for as a derivative.Firm Commitment Strategies — Mortgage delivery commitments are considered derivatives under the accounting standards for derivatives and hedging. We account for them as freestanding derivatives, and record the fair values of mortgage loan delivery commitments on the balance sheet with an offset to Other income (loss) as Net realized and unrealized gains (losses) on derivatives and hedging activities. Fair values were not significant for all periods in this report.Member IntermediationTo meet the hedging needs of its members, the FHLBNY acts as an intermediary between the members and the other counterparties. This intermediation allows smaller members to access the derivatives market. The derivatives used in intermediary activities do not qualify for hedge accounting, and fair value changes are recorded in earnings. Since the FHLBNY mitigates the fair value exposure of these positions by executing identical offsetting transactions, the net impact in earnings is not significant. The notional principal of interest rate swaps executed as intermediary activity were $333.0 million and $193.0 million at December 31, 2018 and 2017. The FHLBNY’s exposure with respect to the transactions with members was fully collateralized.Other Economic HedgesThe derivatives in economic hedges are considered freestanding and changes in the fair values of the swaps are recorded through income. In general, economic hedges comprised of (1) interest rate caps to hedge balance sheet risk, specifically interest rate risk arising from certain capped floating rate investment securities, (2) interest rate swaps that had previously qualified as hedges under the accounting standards for derivatives and hedging, but had been subsequently de-designated from hedge accounting as they were assessed as being not highly effective hedges, (3) interest rate swaps in economic hedges of advances and debt when elected under the FVO, and (4) interest rate swaps in economic hedges of securities in the trading/liquidity portfolio.Credit Risk Due to Non-performance by Counterpartiesservesserve as a basis for calculating periodic interest payments or cash flows. Notional amount of a derivative does not measure the credit risk exposure, and the maximum credit exposure is substantially less than the notional amount. The maximum credit risk is the estimated cost of replacing interest-rate swaps, forward agreements, mandatory delivery contracts for mortgage loans and purchased caps and floors (derivatives) in a gain position if the counterparty defaults and the related collateral, if any, is of insufficient value to the FHLBNY.and 2017 were cleared derivatives. The“Cleared derivatives”, which are contracts are transacted bilaterally with executing swap counterparties, then cleared and settled through derivative clearing organizations (DCOs) as mandated under the Dodd-Frank Act. When transacting a derivative for clearing, the FHLBNY utilizes a designated clearing agent, the Futures ClearingCommission Merchant (FCM) that acts on behalf of the FHLBNY to clear and settle the interest rate exchange transaction through the DCO. Once the transaction is accepted for clearing by the FCM, acting in the capacity of an intermediary between the FHLBNY and the DCO, the original transaction between the FHLBNY and the executing swap counterparty is extinguished, and is replaced by an identical transaction between the FHLBNY and the DCO. The DCO becomes the counterparty to the FHLBNY.Federal Home Loan Bank of New YorkNotes to Financial Statementsbilateral derivative transactionshave to be transacted bilaterally and are not clearable as the structures have not yet been mandated for clearing under the Dodd-Frank Act, typically because the transactions are complex and their ongoing pricing and settlement mechanisms have not yet been operationalized by the DCOs. Hedging Instruments Under ASC 815 December 31, 2019 December 31, 2018 Interest rate contracts Interest rate swaps $ 107,837,925 $ 105,280,821 Interest rate caps 800,000 803,000 Mortgage delivery commitments 44,768 12,682 Total interest rate contracts notionals $ 108,682,693 $ 106,096,503 The enforceability of offsetting rights incorporated in the agreements for the cleared derivative transactions has been analyzed by the FHLBNY to establish the extent to which supportive legal opinion, obtained from counsel of recognized standing, provides the requisite level of certainty regarding the enforceability of these agreements. Further analysis was performed to reach a view that the exercise of rights by the non-defaulting party under these agreements would not be stayed, or avoided under applicable law upon an event of default including bankruptcy, insolvency or similar proceeding involving the DCO or the FHLBNY’s clearing agents or both. Based on the analysis of the rules, and legal analysis obtained, the FHLBNY has made a determination that it has the right of setoff that is enforceable under applicable law that would allow it to net individual derivative contracts executed through a specific clearing agent, the FCM, to a designated DCO, so that a net derivative receivable or payable will be recorded for the DCO; that exposure (less margin held) would be represented by a single amount receivable from the DCO and the appropriate measure of credit risk. This policy election for netting cleared derivatives is consistent with the policy election for netting bilaterally settled derivative transactions under master netting agreements.For all cleared derivative contracts that have not matured, “Variation margin” is exchanged between the FHLBNY and the FCM, acting as agents on behalf of DCOs. Variation margin is determined by the DCO and fluctuates with the fair values of the open contracts. When the aggregate contract value of open derivatives is “in-the-money” for the FHLBNY (gain position), the FHLBNY would receive variation margin from the DCO. If the value of the open contracts is “out-of-the-money” (liability position), the FHLBNY would post variation margin to the DCO. At December 31, 2018 and 2017, our analysis concluded that variation margin exchanged with the DCOs - Chicago Mercantile Exchange (CME) and London Clearing House (LCH) were the daily settlement values of the derivative contracts, and not as collateral, and variation margin is a direct reduction of the fair values of the open contracts.The FHLBNY is also required to post an “Initial margin” on open derivative contracts to the DCO through an FCM. Initial margin is determined by the DCO and fluctuates with the volatility of the FHLBNY’s portfolio of cleared derivatives; volatility is measured by the speed and severity of market price changes of the portfolio. Initial margin is considered as collateral, and if exchanged in cash, it would be netted against the fair values of open derivative contracts after applying variation margin.Federal Home Loan Bank of New YorkNotes to Financial StatementsThe following table presentsDerivative notional amounts are reference amounts from which contractual payments are derived and do not represent a complete and accurate measure of FHLBNY’s exposure to derivative transactions. Rather, FHLBNY’s derivative exposure arises primarily from market fluctuations (i.e., market risk), counterparty failure (i.e., credit risk) and/or periods of high volatility or financial stress (i.e., liquidity risk), as well as any market valuation adjustments that may be required on the gross and net derivatives receivables by contract type and amount for those derivatives contracts for which netting is permissible under U.S. GAAP (Derivative instruments — Nettable) (in thousands). Derivatives receivables have been netted with respect to those receivables as to which the netting requirements have been met, including obtaining a legal analysis with respect to the enforceability of the netting. Where such a legal analysis has not been either sought or obtained, the receivables were not netted, and were reported as Derivative instruments — Not Nettable.The following table presents the gross and net derivatives receivables by contract type and amount for those derivatives contracts for which netting is permissible under U.S. GAAP (Derivative instruments — Nettable) (in thousands). Derivatives receivables have been netted with respect to those receivables as to which the netting requirements have been met, including obtaining a legal analysis with respect to the enforceability of the netting. Where such a legal analysis has not been either sought or obtained, the receivables were not netted, and were reported as Derivative instruments — Not Nettable.transactions. The table below also presents security collateral, which are not permitted to be offset, but which would be eligible for offsetting to the extent an event of default occurred and a legal opinion supporting enforceability of the netting and collateral rights has beenis obtained. See footnote (c) to the table.
Assets
Liabilities
Assets
Liabilities(a)Derivative instruments without legal right of offset were synthetic derivatives representing forward mortgage delivery commitments of 45 business days or less. Amounts were not material, and it was operationally not practical to separate receivable from payables, and net presentation was adopted. No cash collateral was involved with the mortgage delivery commitments.(b)Amounts represented Derivative assets and liabilities recorded in the Statements of Conditions. Derivative balances are not netted with non-cash collateral received or pledged, since legal ownership of the non-cash collateral remains with the pledging counterparty (see footnote c below).(c)Non-cash collateral received or pledged — For bilateral derivatives, certain counterparties have pledged U.S. Treasury securities to the FHLBNY as collateral. Amounts also included non-cash mortgage collateral on derivative positions with member counterparties where we acted as an intermediary. For cleared derivatives, we are required to pledge “Initial margin” as collateral under CFTC rules. The FHLBNY may pledge marketable securities to satisfy the CFTC rules.(d)Securities pledged to Derivative Clearing Organization to fulfill our initial margin obligations on cleared derivatives. Securities pledged may be sold or repledged if the FHLBNY defaults on our obligations under rules established by the CFTC.(e)Amounts represented net exposure after applying non-cash collateral pledged to and by the FHLBNY. Since legal ownership and control over the securities are not transferred, the net exposure represented in the table above is for information only and is not reported as such in the Statements of Condition.Note 1As discussed previously in this Note 17, variation margin is exchanged daily between the DCOs and the FHLBNY for cleared derivatives, and generally represented daily settlement of mark-to-market gains and losses on the derivative contracts. In the 2018 periods, variation margin was netted as settlements of gross derivative fair values on a category-by-category basis in the table above. At December 31, 2017, $465.8 million in variation margin received by the FHLBNY was netted and reported in aggregate as a reduction of the gross derivative fair values and was not considered collateral, rather the settlement of the derivative itself. December 31, 2019 December 31, 2018 Derivative Assets Derivative Liabilities Derivative Assets Derivative Liabilities Derivative instruments - nettable Gross recognized amount Uncleared derivatives $ 241,501 $ 365,397 $ 246,765 $ 162,650 Cleared derivatives(f) 367,202 352,576 296,677 305,918 Total gross recognized amount 608,703 717,973 543,442 468,568 Gross amounts of netting adjustments and cash collateral Uncleared derivatives (104,011 ) (333,471 ) (134,413 ) (142,097 ) Cleared derivatives (266,850 ) (352,092 ) (295,324 ) (295,324 ) Total gross amounts of netting adjustments and cash collateral (370,861 ) (685,563 ) (429,737 ) (437,421 ) Net amounts after offsetting adjustments and cash collateral $ 237,842 $ 32,410 $ 113,705 $ 31,147 Uncleared derivatives $ 137,490 $ 31,926 $ 112,352 $ 20,553 Cleared derivatives 100,352 484 1,353 10,594 Total net amounts after offsetting adjustments and cash collateral $ 237,842 $ 32,410 $ 113,705 $ 31,147 Derivative instruments - not nettable Uncleared derivatives(a) $ 105 $ 1 $ 57 $ - Total derivative assets and total derivative liabilities Uncleared derivatives 137,595 31,927 112,409 20,553 Cleared derivatives 100,352 484 1,353 10,594 Total derivative assets and total derivative liabilities presentedin the Statements of Condition(b) $ 237,947 $ 32,411 $ 113,762 $ 31,147 Non-cash collateral received or pledged(c) Can be sold or repledged Security pledged as initial margin to Derivative Clearing Organization(d) $ 251,177 $ - $ 239,813 $ - Cannot be sold or repledged Uncleared derivatives securities received (115,238 ) - (102,682 ) - Total net amount of non-cash collateral received or repledged $ 135,939 $ - $ 137,131 $ - Total net exposure cash and non-cash(e) $ 373,886 $ 32,411 $ 250,893 $ 31,147 Net unsecured amount - Represented by: Uncleared derivatives $ 22,357 $ 31,927 $ 9,727 $ 20,553 Cleared derivatives 351,529 484 241,166 10,594 Total net exposure cash and non-cash(e) $ 373,886 $ 32,411 $ 250,893 $ 31,147 (a) Not nettable derivative instruments are without legal right of offset, and were synthetic derivatives representing forward mortgage delivery commitments of 45 business days or less. Amounts were not material, and it was operationally not practical to separate receivables from payables; net presentation was adopted. No cash collateral was involved with the mortgage delivery commitments. (b) Amounts represented Derivative assets and liabilities that were recorded in the Statements of Condition. Derivative cash balances were not netted with non-cash collateral received or pledged, since legal ownership of the non-cash collateral remains with the pledging counterparty (see footnote (c) below). (c) Non-cash collateral received or pledged — For certain uncleared derivatives, counterparties have pledged U.S. Treasury securities to the FHLBNY as collateral. Amounts also included non-cash mortgage collateral on derivative positions with member counterparties where we acted as an intermediary. For certain cleared derivatives, we have pledged marketable securities to satisfy initial margin or collateral requirements. (d) Amounts represented securities pledged to Derivative Clearing Organization to fulfill our initial margin obligations on cleared derivatives. Securities pledged may be sold or repledged if the FHLBNY defaults on our obligations under rules established by the CFTC. (e) Amounts represented net exposure after applying non-cash collateral pledged to and by the FHLBNY. Since legal ownership and control over the securities are not transferred, the net exposure represented in the table above is for information only and is not reported as such in the Statements of Condition. (f) Note on variation margin — For all cleared derivative contracts that have not matured, “Variation margin” is exchanged between the FHLBNY and the FCM, acting as agents on behalf of DCOs. Variation margin is determined by the DCO and fluctuates with the fair values of the open contracts. When the aggregate contract value of open derivatives is “in-the-money” for the FHLBNY (gain position), the FHLBNY would receive variation margin from the DCO. If the value of the open contracts is “out-of-the-money” (liability position), the FHLBNY would post variation margin to the DCO. At December 31, 2019, the FHLBNY posted $100.1 million in cash as settlement variation margin to FCMs. At December 31, 2018, we had received $514.7 million in cash as settlement variation margin from FCMs. As noted, variation margin is not considered as collateral, rather as the daily settlement amounts of outstanding derivative contracts. 20182019 and 2017December 31, 2018 (in thousands):
of Derivatives
Assets
Liabilities December 31, 2019 Notional Amount
of Derivatives Derivative
Assets Derivative
Liabilities Fair value of derivative instruments(a) Derivatives designated as hedging instruments under ASC 815 interest rate swaps $ 59,361,080 $ 414,480 $ 550,758 Total derivatives in hedging relationships under ASC 815 59,361,080 414,480 550,758 Derivatives not designated as hedging instruments Interest rate swaps 47,404,845 179,784 162,702 Interest rate caps 800,000 50 - Mortgage delivery commitments 44,768 105 1 Other(b) 1,072,000 14,389 4,513 Total derivatives not designated as hedging instruments 49,321,613 194,328 167,216 Total derivatives before netting and collateral adjustments $ 108,682,693 608,808 717,974 Netting adjustments (342,911 ) (342,911 ) Cash collateral and related accrued interest (27,950 ) (342,652 ) Total netting adjustments and cash collateral (370,861 ) (685,563 ) Total derivative assets and total derivative liabilities $ 237,947 $ 32,411 Security collateral pledged as initial margin to Derivative Clearing Organization(c) $ 251,177 Security collateral received from counterparty(c) (115,238 ) Net security 135,939 Net exposure $ 373,886
of Derivatives
Assets
Liabilities December 31, 2018 Notional Amount
of Derivatives Derivative
Assets Derivative
Liabilities Fair value of derivative instruments(a) Derivatives designated as hedging instruments under ASC 815 interest rate swaps $ 60,701,776 $ 390,670 $ 314,448 Total derivatives in hedging relationships under ASC 815 60,701,776 390,670 314,448 Derivatives not designated as hedging instruments Interest rate swaps 43,913,045 145,726 144,190 Interest rate caps 803,000 644 - Mortgage delivery commitments 12,682 57 - Other(b) 666,000 6,402 9,930 Total derivatives not designated as hedging instruments 45,394,727 152,829 154,120 Total derivatives before netting and collateral adjustments $ 106,096,503 543,499 468,568 Netting adjustments (372,917 ) (372,917 ) Cash collateral and related accrued interest (56,820 ) (64,504 ) Total netting adjustments and cash collateral (429,737 ) (437,421 ) Total derivative assets and total derivative liabilities $ 113,762 $ 31,147 Security collateral pledged as initial margin to Derivative Clearing Organization(c) $ 239,813 Security collateral received from counterparty(c) (102,682 ) Net security 137,131 Net exposure $ 250,893 (a) All derivative assets and liabilities with swap dealers and counterparties are executed under collateral agreements; derivative instruments executed bilaterally are subject to legal right of offset under master netting agreements. (b) The Other category comprised of interest rate swaps intermediated for member, and notional amounts represent purchases by the FHLBNY from dealers and an offsetting purchase from us by the member. (c) Non-cash security collateral is not permitted to be offset on the balance sheet, but would be eligible for offsetting in an event of default. Amounts represent U.S. Treasury securities pledged to and received from counterparties as collateral at December 31, 2019 and December 31, 2018. (a)All derivative assets and liabilities with swap dealers and counterparties are executed under collateral agreements; derivative instruments executed bilaterally are subject to legal right of offset under master netting agreements.(b)The Other category comprised of swaps intermediated for member, and notional amounts represent purchases by the FHLBNY from dealers and an offsetting purchase from us by the member.(c)Variation margin — See Note 1 in the previous table.(d)Non-cash security collateral is not permitted to be offset on the balance sheet, but would be eligible for offsetting in an event of default. Amounts represent U.S. Treasury securities pledged to and received from counterparties as collateral at December 31, 2018 and 2017.Earnings Impact of Derivatives andAccounting for Derivative Hedging Activitiescarries all derivative instruments onaccounts for its hedging activities in accordance with ASC 815,Derivatives and Hedging. As a general rule, hedge accounting is permitted where the Statements of Condition atFHLBNY is exposed to a particular risk, typically interest-rate risk that causes changes in the fair value asof an asset or liability or variability in the expected future cash flows of an existing asset, liability or a forecasted transaction that may affect earnings. Derivative Assets and Derivative Liabilities. If derivatives meetcontracts hedging the hedging criteria under hedge accounting rules, including effectiveness measures,risks associated with the changes in fair value ofare referred to as Fair value hedges, while contracts hedging the associated hedged financial instrument attributable torisks affecting the risk being hedged (benchmark interest-rate risk, which is LIBOR forexpected future cash flows are called Cash flow hedges. FHLBNY) may also be recorded so that some or all of the unrealized fair value gains or losses recognized on the derivatives are offset by corresponding unrealized gains or losses on the associated hedged financial assets and liabilities. The net differential between fair value changes of the derivatives and the hedged items represents hedge ineffectiveness. The net ineffectiveness from hedges that qualify under hedge accounting rules (versus an economic hedge where hedge accounting is recordednot sought), a derivative must be highly effective in offsetting the risk designated as being hedged. The hedge relationship must be formally documented at inception, detailing the particular risk management objective and strategy for the hedge, which includes the item and risk that is being hedged and the derivative that is being used, as well as how effectiveness will be assessed and measured. The effectiveness of these hedging relationships is evaluated on a Net realizedretrospective and unrealized gain (loss) on derivatives and hedging activities in Other income (loss)prospective basis, typically using quantitative measures of correlation. For hedges that are highly effective, changes in the Statements of Income. If derivatives do not qualify for the hedging criteria under hedge accounting rules, but are executed as economic hedges of financial assets or liabilities under a FHLBNY-approved hedge strategy, only the fair value changes of the derivatives are recorded as a Net realized and unrealized gain (loss) on derivatives and hedging activities in Other income (loss) in the Statements of Income. The FHLBNY has elected to measure certain debt under the accounting designation for the fair value option (FVO), and has executed interest rate swaps as economic hedges of the debt. While changes in fair values of the interest rate swaphedging instrument and the debt elected underoffsetting changes in the FVOfair values of the hedged item are both recorded in earnings within Other income (loss), theycurrent earnings. If a hedge relationship is found to be not highly effective, it will no longer qualify as an accounting hedge and hedge accounting would be prospectively withdrawn. When hedge accounting is discontinued, the offsetting changes of fair values of the hedged item are also discontinued.as separate line items: Changesalong with the offsetting changes in the fair value of the swapshedged item attributable to the risk being hedged. On settlement date, the basis adjustments to the hedged item’s carrying amount are combined with the principal amounts and the basis becomes part of the total carrying amount of the hedged item. The FHLBNY has defined its market settlement conventions for hedged items to be five business days or less for advances and thirty calendar days or less, using a next business day convention, for Consolidated obligations bonds and discount notes. These market settlement conventions are the shortest period possible for each type of advance and Consolidated obligation from the time the instruments are committed to the time they settle.Net realizedreceivable in Derivative assets. Variation margin exchanged with Derivative Clearing Organizations on cleared derivatives is treated as a settlement of the derivative itself — a reduction of the fair value of the derivative — and unrealized gain (loss)not as collateral.activities;activities. This evaluation will consider whether the economic characteristics of the embedded derivative are clearly and closely related to the economic characteristicsdebtthe hedging instrument offset the changes in the fair value or cash flows of the hedged item relating to the risk being hedged. Hedge accounting is permitted only if the hedging relationship is expected to be highly effective at the inception of the hedge and advances when elected underon an ongoing basis. The FHLBNY assesses hedge effectiveness in the FVO are recorded as an Unrealized (losses) or gains from Instruments held at fair value.following manner:· Inception prospective assessment. Within the time frame allowed under ASU 2017-12 upon designation of the hedging relationship and on an ongoing basis, the FHLBNY hedge documentation demonstrates that it expects the hedging relationship to be highly effective. This is a forward-looking consideration. A prospective assessment is performed at the designation of the hedging relationship. The assessment uses quantitative sensitivity analysis employing an option-adjusted valuation model to generate changes in market value of the hedged item and the swap. These projected market values are run under instantaneous parallel rate shocks, and the hedge is expected to be highly effective if the change in fair value of the swap divided by the change in the fair value of the hedged item is within the 80% - 125% dollar value offset boundaries and also meets a regressions slope test. · Retrospective assessment. At least quarterly, the FHLBNY’s hedge documentation demonstrates whether the hedging relationship was highly effective in offsetting changes in fair value or cash flows through the date of the periodic assessment. This is an evaluation of the past experience. The retrospective test utilizes multiple Components of net gains (losses) on Derivatives and hedging activities as presented in the Statements of Income are summarized below (in thousands):
on Derivative
on Hedged
Item
Impact
Derivatives on Net
Interest Income
on Derivative
on Hedged
Item
Impact
Derivatives on Net
Interest Income
on Derivative
on Hedged
Item
Impact
Derivatives on Net
Interest Income· Ongoing prospective assessment. For purposes of assessing effectiveness on an ongoing basis, the FHLBNY’s documentation utilizes the regression results from the retrospective assessment as a means of demonstrating that the hedge relationships are expected to be highly effective in future periods. Under certain circumstances, we may employ qualitative ongoing hedge effectiveness as permitted under ASU 2017-12. · Consolidated Obligations — The FHLBNY may manage the risk arising from changing market prices and volatility of a Consolidated obligation debt by matching the cash inflows on the derivative with the cash outflow on the Consolidated obligation debt and may include early termination features or options. In general, whenever we issue a longer-term fixed-rate debt, or a fixed-rate debt with call or put or other embedded options, we will simultaneously execute a derivative transaction, generally an interest rate swap, with terms that offset the terms of the fixed-rate debt, or terms of the debt with embedded put or call options or other options. When a fixed-rate debt is hedged, the combination of the fixed-rate debt and the derivative transaction effectively creates a variable rate liability, indexed to a benchmark interest rate. · Advances — We offer a wide array of advances structures to meet members’ funding needs. These advances may have maturities up to 30 years with fixed or adjustable rates and may include early termination features or options. We may use derivatives to adjust the repricing and/or options characteristics of advances to more closely match the characteristics of its funding liabilities. In general, whenever a member executes a longer term fixed-rate advance, or a fixed-rate advance with call or put or other embedded options, we will simultaneously execute a derivative transaction, generally an interest rate swap, with terms that offset the terms of the fixed-rate advance, or terms of the advance with embedded put or call options or other options. When a fixed-rate advance is hedged, the combination of the fixed-rate advance and the derivative transaction effectively creates a variable rate asset, indexed to a benchmark interest rate. · The partial-term hedging strategy makes it possible to hedge selected fixed-rate payments in a fair value hedge of interest rate risk. While U.S. GAAP has long permitted entities to designate one or more contractual cash flows in a financial instrument, the hedge strategy could result in hedge ineffectiveness. This is because the fair value of the hedging instrument and the hedged item would react differently to · Benchmark rate component hedging is permitted under the ASU, which addressed the issue that measuring changes in the fair value of the hedged item using the total coupon cash flows misrepresents the true effectiveness of these hedging relationships. Additionally, these hedging relationships are not meant to manage credit risk, and that using the total contractual cash flows to determine the change in the fair value of the hedged item attributable to the change in the benchmark interest rate creates an earnings mismatch that reflects the portion of the financial instrument that the entity does not intend to hedge. The new guidance addresses these issues by allowing entities to use either (1) the full contractual coupon cash flows or (2) the benchmark rate component of the contractual coupon cash flows to calculate the change in the fair value of the hedged item attributable to changes in the benchmark interest rate in a fair value hedge of interest rate risk. We have used the concept selectively in 2019. Cash Flow HedgesDiscontinuation of Hedge Accounting. When hedge accounting is discontinued because the FHLBNY determines that the derivative no longer qualifies as an effective Fair value hedge of an existing hedged item, the FHLBNY continues to carry the derivative on the balance sheet at its fair value, ceases to adjust the hedged asset or liability for changes in fair value, and amortizes the cumulative basis adjustment on the hedged item into earnings over the remaining life of the hedged item (for callable as well as non-callable previously hedged debt and advances) using the level-yield methodology. When the hedged item is a firm commitment, and hedge accounting is discontinued because the hedged item no longer meets the definition of a firm commitment, the FHLBNY would continue to carry the derivative on the balance sheet at its fair value, removing from the balance sheet any asset or liability that was recorded to recognize the firm commitment and recording it as a gain or loss in current period earnings.The effect of interest rate swaps in cash flow hedging relationships wasWhen hedge accounting is discontinued because the FHLBNY determines that the derivative no longer qualifies as follows (in thousands):
AOCI (c)
Reclassified to
Earnings (c)
Reclassified to
Earnings (c)
Recognized in
Earnings
AOCI (c)
Reclassified to
Earnings (c)
Reclassified to
Earnings (c)
Recognized in
Earnings
AOCI (c)
Reclassified to
Earnings (c)
Reclassified to
Earnings (c)
Recognized in
Earnings(a)an effective Cash flow hedgeshedge of anticipated issuance of Consolidated obligation bondsChanges in period recognized in AOCI — Amounts reported typically representan existing hedged item, the FHLBNY continues to carry the derivative on the balance sheet at its fair value gains and losses recordedreclassifies the basis adjustment in AOCI underto earnings when earnings are affected by the CO bondexisting hedge item, which is the original forecasted transaction. Under limited circumstances, when the FHLBNY discontinues cash flow hedge strategy duringaccounting because it is no longer probable that the periods, and including fair values of hedging contracts open atforecasted transaction will occur in the originally expected period end dates. Fair values recordedplus the following two months, but it is probable the transaction will still occur in AOCI are adjusted for any hedge ineffectiveness on the contracts. When a cash flow hedge is closed,future, the fair value gain or loss on the derivative is recordedremains in AOCI and is amortized and reclassified to interest expense with an offset to the cumulative balance in AOCI.Amount Reclassified to Earnings — Amounts represented amortization of unrecognized gains and losses from previously closed CO bond cash flow hedging contracts that were recorded as a yield adjustment to interest expense with an offset to reduce the unamortized balance in AOCI.Ineffectiveness Recognized in Earnings — Amounts represented ineffectiveness primarily arising from CO bond cash flow hedging strategies. Ineffectiveness is recorded in earnings as a gain or loss from derivative activities in Other income, while the effective portion is recorded in AOCI. Amounts recorded in AOCI are subsequently reclassified prospectively as a yield adjustment to debt expense over the term of the debt.(b)Hedges of discount notes in rolling issuancesChanges in period recognized in AOCI — Amounts represented period-over-period change in the fair values of open swap contracts in this CO discount note cash flow hedging strategy (Rolling issuances of discount notes). The cash flow hedges mitigated exposure to the variability in future cash flows over a maximum period of 13 years.(c)Ineffectiveness recognized in earnings — The effective portion of the fair values of open contracts is recorded in AOCI. Ineffectiveness is recorded in Other income as a component of derivatives and hedging gains and losses.Federal Home Loan Bank of New YorkNotes to Financial StatementsCash Flow Hedges — Fair Value changes in AOCI Rollforward Analysis (in thousands):
Program
Program
Program
Program(a)Changes in fair value of contracts that were outstanding at the beginning and at the end of the twelve-month periods in the Rollforward table above.There were no amounts that were reclassified into earnings due to discontinuation of cash flow hedges. Reclassification would occurwhen the forecasted transaction affects earnings. However, if it becameis probable that the originala forecasted transactions wouldtransaction will not occur by the end of the originally specified time period or within a two-month period thereafter.two months after that, the gains and losses that were included in AOCI are recognized immediately in earnings.It is expectedThe FHLBNY treats modifications of hedged items (e.g. reduction in par amounts, change in maturity date, and change in strike rates) that are other than minor as a termination of a hedge relationship, and previously recorded hedge basis adjustments of the hedged items are amortized over the next 12 months, $0.4 millionlife of the unrecognized gain in AOCI will be recognized as a yield adjustment to debt interest expense.hedged item.Note 18.Fair Values of Financial Instruments.value hedge gains and losses Gains (Losses) on Fair Value Hedges Years ended December 31, 2019 2018 2017 Recorded in Interest
Income/Expense Recorded in Other
Income (Loss) Recorded in Other
Income (Loss) Gains (losses) on derivatives in designated and qualifying fair value hedges: Interest rate hedges $ (447,416 ) $ (43,845 ) $ 213,030 Gains (losses) on hedged item in designated and qualifying fair value hedges: Interest rate hedges $ 446,278 $ 43,342 $ (212,035 ) December 31, 2019 Cumulative Fair Value Hedging
Adjustment Included in the Carrying
Amount of Hedged Items Gains (Losses) Carrying Amount of
Hedged
Assets/Liabilities(a) Active Hedging
Relationship Discontinued
Hedging
Relationship Assets: Hedged advances $ 40,722,558 $ 298,818 $ - Hedged AFS debt securities(a) 547,807 11,593 - De-designated advances(b) - - 345 $ 41,270,365 $ 310,411 $ 345 Liabilities: Hedged consolidated obligation bonds $ 11,366,044 $ (377,000 ) $ - Hedged consolidated obligation discount notes 3,493,297 105 - De-designated consolidated obligation bonds(b) - - (139,605 ) $ 14,859,341 $ (376,895 ) $ (139,605 ) December 31, 2018 Cumulative Fair Value Hedging
Adjustment Included in the Carrying
Amount of Hedged Items Gains (Losses) Carrying Amount of
Hedged
Assets/Liabilities(a) Active Hedging
Relationship Discontinued
Hedging
Relationship Assets: Hedged advances $ 45,904,804 $ (255,426 ) $ - De-designated advances(b) - - 402 $ 45,904,804 $ (255,426 ) $ 402 Liabilities: Hedged consolidated obligation bonds $ 11,664,558 $ (238,150 ) $ - De-designated consolidated obligation bonds(b) - - (131,497 ) $ 11,664,558 $ (238,150 ) $ (131,497 ) (a) Carrying amounts represent amortized cost adjusted for cumulative fair value hedging basis. For AFS securities in a fair value partial-term hedge, changes in the fair values due to changes in the benchmark rate were recorded as an adjustment to amortized cost and an offset to interest income from the hedged AFS securities. (b) Basis valuation adjustments of de-designated (discontinued hedging relationships) on advances and debt were reported in the same line as the carrying amounts of hedged assets/liabilities. Par amounts of de-designated advances were not material; par amounts of de-designated CO bonds were approximately $1.3 billion. Cumulative fair value hedging adjustments for active and discontinued hedging relationships will remain on the balance sheet until the items are derecognized. · Cash flow hedges of “Anticipated Consolidated Bond Issuance” — The FHLBNY enters into interest-rate swaps to hedge the anticipated issuance of debt, and to “lock in” the interest to be paid for the cost of funding. The swaps are terminated upon issuance of the debt instrument, and gains or losses upon termination are recorded in AOCI. Gains and losses are reclassified to earnings in the periods in which earnings are affected by the variability of the cash flows of the debt that was issued. · Cash flow hedges of “Rolling Issuance of Discount Notes” — The FHLBNY executes long-term pay-fixed, receive-variable interest rate swaps as hedges of the variable quarterly interest payments on the discount note borrowing program. In this program, we issue a series of discount notes with 91-day terms over periods typically up to 10-15 years. We will continue issuing new 91-day discount notes over the terms of the swaps as each outstanding discount note matures. The interest rate swaps require a settlement every 91 days, and the variable-rate, which is based on the 3-month LIBOR, is reset immediately following each payment. The swaps are expected to eliminate the risk of variability of cash flows for each forecasted discount note issuance every 91 days. The hedging swaps and the hedged 91-day discount notes are issued contemporaneously and recorded on the balance sheet. The accrued interest on the swaps and the accretion on the discount notes are recorded daily to interest expense, synthetically converting the fixed costing yield on the 91-day discount notes to the net accrual on the swaps. The fair values of the interest rate swaps are recorded in AOCI with an offset to derivative asset and liability in the balance sheet using the hypothetical derivative method under ASC 815. No amounts were reclassified in any periods in this report to income because it became probable that the original forecasted issuance of discount notes would not occur by the original forecasted time frame or two months thereafter. Derivative Gains (Losses) Recorded in Income and Other Comprehensive
Income/Loss December 31, 2019 Amounts Reclassified
from AOCI to
Interest Expense(b) Amounts
Reclassified from
AOCI to Other
Income (Loss)(c) Amounts
Recorded in
OCI(d) Total Change
in OCI for
Period Interest rate contracts(a) $ (613 ) $ - $ (111,888 ) $ (111,275 ) Derivative Gains (Losses) Recorded in Income and Other Comprehensive
Income/Loss December 31, 2018 Amounts Reclassified
from AOCI to
Interest Expense(b) Amounts
Reclassified from
AOCI to Other Income (Loss)(c) Amounts
Recorded in
OCI(d) Total Change
in OCI for
Period Interest rate contracts(a) $ 180 $ (278 ) $ 36,816 $ 36,636 Derivative Gains (Losses) Recorded in Income and Other Comprehensive
Income/Loss December 31, 2017 Amounts Reclassified
from AOCI to
Interest Expense(b) Amounts
Reclassified from
AOCI to Other Income (Loss)(c) Amounts
Recorded in
OCI(d) Total Change
in OCI for
Period Interest rate contracts(a) $ (1,141 ) $ 388 $ 26,000 $ 27,141 (a) Amounts represents cash flow hedges of CO debt hedged with benchmark interest rate swaps indexed to LIBOR. Beginning January 1, 2019 post implementation of ASU 2017-12, the FHLBNY includes the gain and loss on the hedging derivatives in the same line in the Statements of income as the change in cash flows on the hedged item. (b) Amounts represent amortization of gains (losses) related to closed cash flow hedges of anticipated issuance of CO bonds that were reclassified during the period to interest expense as a yield adjustment. Losses reclassified represent losses in AOCI that were amortized as an expense to debt interest expense. If debt is held to maturity, losses in AOCI will be relieved through amortization. It is expected that over the next 12 months, $1.0 million of the unrecognized losses in AOCI will be recognized as yield adjustments to debt interest expense. (c) Amount represents the ineffectiveness recorded in the prior year periods through Other income (loss). Subsequent to the adoption of ASU 2017-12, hedge ineffectiveness (as defined under ASC 815) is reclassified only if the original transaction would not occur by the end of the specified time period or within a two-month period thereafter. There were no amounts that were reclassified into earnings due to discontinuation of cash flow hedges. Reclassification would occur if it became probable that the original forecasted transactions would not occur by the end of the originally specified time period or within a two-month period thereafter. (d) Amounts represent changes in the fair values of open interest rate swap contracts in cash flow hedges of CO debt, primarily those hedging the rolling issuance of CO discount notes. Gains (Losses) on Economic Hedges Recorded in Other Income (Loss) Years ended December 31, 2019(a) 2018(b) 2017(b) Gains (losses) on derivatives designated in economic hedges Interest rate hedges $ (40,833 ) $ (39,584 ) $ 4,317 Caps (596 ) (268 ) (4,331 ) Mortgage delivery commitments 709 (145 ) 570 Total gains (losses) on derivatives in economic hedges $ (40,720 ) $ (39,997 ) $ 556 (a) Valuation changes (including accrued interest on the swaps) of derivatives not eligible for hedge accounting under ASC 815 continue to be reported in Other income (loss) in the Statements of income, and total derivative gains (losses) in the table above will agree to the line item – “Derivative gains (losses)” in Other income in the Statements of income for the year ended December 31, 2019. (b) The Table above reports valuation changes of derivatives in economic hedges (not qualifying under ASC 815). Gains and losses reported in the table above for 2018 and 2017 will not agree with the line item “Derivative gains (losses)” in the Statements of Income which included the impact of both ASC 815 qualifying hedges and derivatives not qualifying. As permitted under the ASU 2017-12, prior year presentations in the Statements of income has not been reclassified to reporting classifications under ASU 2017-12. Note 18. Fair Values of Financial Instruments.
Value
Adjustment and
Cash Collateral December 31, 2019 Estimated Fair Value Financial Instruments Carrying
Value Total Level 1 Level 2 Level 3(a) Netting
Adjustment and
Cash Collateral Assets Cash and due from banks $ 603,241 $ 603,241 $ 603,241 $ - $ - $ - Securities purchased under agreements to resell 14,985,000 14,984,909 - 14,984,909 - - Federal funds sold 8,640,000 8,639,966 - 8,639,966 - - Trading securities 15,318,809 15,318,809 15,315,592 3,217 - - Equity Investments 60,047 60,047 60,047 - - - Available-for-sale securities 2,653,418 2,653,418 - 2,653,418 - - Held-to-maturity securities 15,234,482 15,456,606 - 14,223,919 1,232,687 - Advances 100,695,241 100,738,675 - 100,738,675 - - Mortgage loans held-for-portfolio, net 3,173,352 3,190,109 - 3,190,109 - - Accrued interest receivable 312,559 312,559 - 312,559 - - Derivative assets 237,947 237,947 - 608,808 - (370,861 ) Other financial assets 293 293 - - 293 - Liabilities Deposits 1,194,409 1,194,419 - 1,194,419 - - Consolidated obligations Bonds 78,763,309 78,980,672 - 78,980,672 - - Discount notes 73,959,205 73,961,316 - 73,961,316 - - Mandatorily redeemable capital stock 5,129 5,129 5,129 - - - Accrued interest payable 156,889 156,889 - 156,889 - - Derivative liabilities 32,411 32,411 - 717,974 - (685,563 ) Other financial liabilities 45,388 45,388 45,388 - - - Federal Home Loan Bank of New YorkNotes to Financial Statements December 31, 2018 Estimated Fair Value Financial Instruments Carrying
Value Total Level 1 Level 2 Level 3(a) Netting
Adjustment and
Cash Collateral Assets Cash and due from banks $ 85,406 $ 85,406 $ 85,406 $ - $ - $ - Securities purchased under agreements to resell 4,095,000 4,095,150 - 4,095,150 - - Federal funds sold 7,640,000 7,639,998 - 7,639,998 - - Trading securities 5,810,512 5,810,512 5,304,329 506,183 - - Equity Investments 48,179 48,179 48,179 - - - Available-for-sale securities 422,216 422,216 - 422,216 - - Held-to-maturity securities 17,474,826 17,445,756 - 16,126,662 1,319,094 - Advances 105,178,833 105,137,214 - 105,137,214 - - Mortgage loans held-for-portfolio, net 2,927,230 2,852,611 - 2,852,611 - - Loans to other FHLBanks 250,000 250,000 - 250,000 - - Accrued interest receivable 275,256 275,256 - 275,256 - - Derivative assets 113,762 113,762 - 543,499 - (429,737 ) Other financial assets 767 767 - - 767 - Liabilities Deposits 1,062,637 1,062,625 - 1,062,625 - - Consolidated obligations Bonds 84,153,776 83,912,990 - 83,912,990 - - Discount notes 50,640,238 50,638,448 - 50,638,448 - - Mandatorily redeemable capital stock 5,845 5,845 5,845 - - - Accrued interest payable 223,570 223,570 - 223,570 - - Derivative liabilities 31,147 31,147 - 468,568 - (437,421 ) Other financial liabilities 86,095 86,095 86,095 - - -
Value
Adjustment and
Cash Collateral(a)(a) Level 3 Instruments — The fair values of non-Agency private-label MBS and housing finance agency bonds were estimated by management based on pricing services. Valuations may have required pricing services to use significant inputs that were subjective because of the current lack of significant market activity; the inputs may not be market based and observable. they areand recorded at their fair values,values; and, when mortgage loans held-for-portfolio are written down or are foreclosed as Other real estate owned (REO or OREO), they are recorded at the fair values of the real estate collateral supporting the mortgage loans.Federal Home Loan Bank of New YorkNotes to Financial Statements· Level 1 Inputs — Quoted prices (unadjusted) for identical assets or liabilities in an active market that the reporting entity can access on the measurement date.· Level 2 Inputs — Inputs other than quoted prices within Level 1 that are observable inputs for the asset or liability, either directly or indirectly. If the asset or liability has a specified (contractual) term, a Level 2 input must be observable for substantially the full term of the asset or liability. Level 2 inputs include the following: (1) quoted prices for similar assets or liabilities in active markets; (2) quoted prices for identical or similar assets or liabilities in markets that are not active; (3) inputs other than quoted prices that are observable for the asset or liability (e.g., interest rates and yield curves that are observable at commonly quoted intervals, and volatilities).· Level 3 Inputs — Inputs that are unobservable and significant to the valuation of the asset or liability.· Level 1 Inputs — Quoted prices (unadjusted) for identical assets or liabilities in an active market that the reporting entity can access on the measurement date. · Level 2 Inputs — Inputs other than quoted prices within Level 1 that are observable inputs for the asset or liability, either directly or indirectly. If the asset or liability has a specified (contractual) term, a Level 2 input must be observable for substantially the full term of the asset or liability. Level 2 inputs include the following: (1) quoted prices for similar assets or liabilities in active markets; (2) quoted prices for identical or similar assets or liabilities in markets that are not active; (3) inputs other than quoted prices that are observable for the asset or liability (e.g., interest rates and yield curves that are observable at commonly quoted intervals, and volatilities). · Level 3 Inputs — Inputs that are unobservable and significant to the valuation of the asset or liability. The fair values of financialreported incarried at fair value, the tables above are discussedFHLBNY measures fair value using the procedures set out below:DebtMortgage-backed securities classified as available-for-sale— The fair value of investment debtsuch securities is estimated by the FHLBNY using pricing primarily from pricing services. The pricing vendors typically use market multiples derived from a set of comparables, including matrix pricing, and other techniques.Mortgage-backed securities — The FHLBNY’s valuation technique incorporates prices from up to three designated third-party pricing services at December 31, 20182019 and 2017.December 31, 2018. The FHLBNY’s base investment pricing methodology establishes a median price for each security using a formula that is based on the number of prices received. If three prices are received, the middle price is used; if two prices are received, the average of the two prices is used; and if one price is received, it is used, typically subject to further validation. Vendor prices that are outside of a defined tolerance threshold of the median price are identified as outliers and subject to additional review, including, but not limited to, comparison to prices provided by an additional third-party valuation service, prices for similar securities, and/or non-binding dealer estimates, or use of internal model prices, which are deemed to be reflective of allFederal Home Loan Bank of New YorkNotes to Financial StatementsAt December 31, 2018, no held-to-maturity private-label MBS was deemed OTTI; a de minimis OTTI wasSee Note 8. Held-to-Maturity securities for impairment information and recorded in the 2018 second quarter. In 2017, no held-to-maturity private-label MBS was deemed OTTI.trusts,trust, which invest in money market, equity and fixed income and bond funds. Investments in the trusts were classified as AFS before January 1, 2018. Daily net asset values (NAVs) are readily available and investments are redeemable at short notice. NAVs are the fair values of the funds in the grantor trusts.trust. Because of the highly liquid nature of the investments at their NAVs, they are categorized as Level 1 financial instruments under the valuation hierarchy.Federal Home Loan Bank of New YorkNotes to Financial Statements· CO Curve. The FHLBNY uses the CO Curve, which represents its cost of funds, as an input to estimate the fair value of advances, and to determine current advance rates. This input is considered market observable and therefore a Level 2 input. · CO Curve. The FHLBNY uses the CO Curve, which represents its cost of funds, as an input to estimate the fair value of advances, and to determine current advance rates. This input is considered market observable and therefore a Level 2 input.· Volatility assumption. To estimate the fair value of advances with optionality, the FHLBNY uses market-based expectations of future interest rate volatility implied from current market prices for similar options. This input is considered a Level 2 input as it is market based and market observable. · Volatility assumption. To estimate the fair value of advances with optionality, the FHLBNY uses market-based expectations of future interest rate volatility implied from current market prices for similar options. This input is considered a Level 2 input as it is market based and market observable.· Spread adjustment. Adjustments represent the FHLBNY’s mark-up based on its pricing strategy. The input is considered as unobservable, and is classified as a Level 3 input. The spread adjustment is not a significant input to the overall fair value of an advance.· Spread adjustment. Adjustments represent the FHLBNY’s mark-up based on its pricing strategy. The input is considered as unobservable, and is classified as a Level 3 input. The spread adjustment is not a significant input to the overall fair value of an advance. · CO Curve and LIBOR Swap Curve. The Office of Finance constructs an internal curve, referred to as the CO Curve, using the U.S. Treasury Curve as a base curve that is then adjusted by adding indicative spreads obtained from market observable sources. These market indications are generally derived from pricing indications from dealers, historical pricing relationships, recent GSE trades and secondary market activity. The FHLBNY considers the inputs as Level 2 inputs as they are market observable. · CO Curve and LIBOR Swap Curve. The Office of Finance constructs an internal curve, referred to as the CO Curve, using the U.S. Treasury Curve as a base curve that is then adjusted by adding indicative spreads obtained from market observable sources. These market indications are generally derived from pricing indications from dealers, historical pricing relationships, recent GSE trades and secondary market activity. The FHLBNY considers the inputs as Level 2 inputs as they are market observable.·· Volatility assumption. To estimate the fair values of Consolidated obligations with optionality, the FHLBNY uses market-based expectations of future interest rate volatility implied from current market prices for similar options. These inputs are also considered Level 2 as they are market based and observable. No CO debt elected under the FVO were structured with options in any periods in this report. The CO Curve and volatility assumptions (for debt with call options) were primary inputs, which are market based and observable. Fair values were classified within Level 2 of the valuation hierarchy.20182019 and 2017.Federal Home Loan Bank of New YorkNotes to Financial StatementsDecember 31, 2018.· LIBOR Swap Curve.· Volatility assumption. Market-based expectations of future interest rate volatility implied from current market prices for similar options.· Prepayment assumption (if applicable).· Federal funds curve (OIS curve).· LIBOR Swap Curve. · Volatility assumption. Market-based expectations of future interest rate volatility implied from current market prices for similar options. · Prepayment assumption (if applicable). · Federal funds curve (FF/OIS curve). · SOFR curve (SOFR/OIS) OIS —To be announced (TBA) is the term describing forward-settling MBS trades issued by Freddie Mac, Fannie Mae, and Ginnie Mae trade in the TBA market. The FHLBNY incorporates the overnight indexed swap (OIS)(FF/OIS) curves as fair value measurement inputs for the valuation of its derivatives, as the FF/OIS curves reflect the interest rates paid on cash collateral provided against the fair value of these derivatives. The FHLBNY believes using relevant FF/OIS curves as inputs to determine fair value measurements provides a more representative reflection of the fair values of these collateralized interest-rate related derivatives. The FF/OIS curve (federal funds rate curve) is an input to the valuation model. The input for the federal funds curve is obtained from industry standard pricing vendors and the input is available and observable over its entire term structure. — 20182019 and 2017.December 31, 2018.20182019 and 2017,December 31, 2018, by level within the fair value hierarchy. The FHLBNY also measures certain held-to-maturity securities at fair value on a non-recurring basis when a credit loss is recognized and the carrying value of the asset is adjusted to fair value. Certain mortgage loans that were partially charged-off were recorded at their collateral values on a non-recurring basis. Other real estate owned (OREO) is measured at fair value when the asset’s fair value less costs to sell is lower than its carrying amount.Federal Home Loan Bank of New YorkNotes to Financial Statements December 31, 2019 Total Level 1 Level 2 Level 3 Netting
Adjustment and
Cash Collateral Assets Trading securities Corporate notes $ 3,217 $ - $ 3,217 $ - $ - U.S. Treasury securities 15,315,592 15,315,592 - - - Equity Investments 60,047 60,047 - - - Available-for-sale securities GSE/U.S. agency issued MBS 2,653,418 - 2,653,418 - - Derivative assets(a) Interest-rate derivatives 237,842 - 608,703 - (370,861 ) Mortgage delivery commitments 105 - 105 - - Total recurring fair value measurement - assets $ 18,270,221 $ 15,375,639 $ 3,265,443 $ - $ (370,861 ) Liabilities Consolidated obligation: Discount notes (to the extent FVO is elected) (2,186,603 ) - (2,186,603 ) - - Bonds (to the extent FVO is elected)(b) (12,134,043 ) - (12,134,043 ) - - Derivative liabilities(a) Interest-rate derivatives (32,410 ) - (717,973 ) - 685,563 Mortgage delivery commitments (1 ) - (1 ) - - Total recurring fair value measurement - liabilities $ (14,353,057 ) $ - $ (15,038,620 ) $ - $ 685,563 December 31, 2018
Adjustment and
Cash Collateral Total Level 1 Level 2 Level 3 Netting
Adjustment and
Cash Collateral $ 502,849 $ - $ 502,849 $ - $ - 3,334 - 3,334 - - 5,304,329 5,304,329 - - - 48,179 48,179 - - - 422,216 - 422,216 - - 113,705 - 543,442 - (429,737 ) 57 - 57 - - $ 6,394,669 $ 5,352,508 $ 1,471,898 $ - $ (429,737 ) (3,180,086 ) - (3,180,086 ) - - (5,159,792 ) - (5,159,792 ) - - (31,147 ) - (468,568 ) - 437,421 $ (8,371,025 ) $ - $ (8,808,446 ) $ - $ 437,421
Adjustment and
Cash Collateral(a) Based on analysis of the nature of the risk, the presentation of derivatives as a single class is appropriate. (b) Based on analysis of the nature of risks of Consolidated obligation bonds measured at fair value, the FHLBNY has determined that presenting the bonds as a single class is appropriate. (a)Based on analysis of the nature of the risk, the presentation of derivatives as a single class is appropriate.(b)Based on analysis of the nature of risks of Consolidated obligation bonds measured at fair value, the FHLBNY has determined that presenting the bonds as a single class is appropriate. During the period ended December 31, 2019 Fair Value Level 1 Level 2 Level 3 Mortgage loans held-for-portfolio $ 80 $ - $ 80 $ - Real estate owned 306 - - 306 Total non-recurring assets at fair value $ 386 $ - $ 80 306 During the period ended December 31, 2018 Fair Value Level 1 Level 2 Level 3 $ 741 $ - $ 741 $ - 795 - - 795 $ 1,536 $ - $ 741 $ 795 yearsperiod ended December 31, 20182019 and 2017,December 31, 2018, and reported fair values were not as of the period end dates.TheFrom time to time, the FHLBNY typically electswill elect the FVO for certain advances and certain Consolidated obligations thaton an instrument-by-instrument basis with changes in fair value reported in earnings. Customarily, the election is made when either the instruments do not qualify for hedge accounting or may be at risk for not meeting hedge effectiveness requirements; the objective is primarily to mitigate the potential income statement volatility that can arise from economic hedging relationships in which the carrying value of the hedged item is not adjusted for changes in fair value. We may also elect advances under the FVO when analysis indicates that changes in the fair values of the advance would be an offset to fair value volatility of debt elected under the FVO. The FVO election is made at inception of the contracts for advances and debt obligations.20182019 and 2017.December 31, 2018.The FHLBNY elects the FVO on an instrument-by-instrument basis for certain short-term advances with tenors that were generally less than 24 months. As with all advances, advances elected under the FVO advances wereare also fully collateralized through their terms to maturity. Certain consolidated obligation bonds and discount notes are also elected under the FVO on an instrument-by-instrument basis. We consider our Consolidated obligation debt as high credit-quality, highly-rated instruments, and changes in fair values wereare generally related to changes in interest rates and investor preference, including investor asset allocation strategies. The FHLBNY believes the credit-quality of Consolidated obligation debt has remained stable, and changes in fair value attributable to instrument-specific credit risk, if any, were not material given that the debt elected under the FVO had been issued within the past 24 months, and no adverse changes have been observed in their credit characteristics. Years ended December 31, 2019 Bonds Discount Notes $ (5,159,792 ) $ (3,180,086 ) (18,392,000 ) (2,182,845 ) 11,465,000 3,170,915 (3,952 ) (194 ) (43,299 ) 5,607 Balance, end of the period $ (12,134,043 ) $ (2,186,603 ) Years ended December 31, 2018 Advances Bonds Discount Notes Balance, beginning of the period $ 2,205,624 $ (1,131,074 ) $ (2,312,621 ) New transactions elected for fair value option - (5,225,000 ) (4,735,290 ) Maturities and terminations (2,200,000 ) 1,215,000 3,873,993 Net gains (losses) on financial instruments held under fair value option (590 ) 681 118 Change in accrued interest/unaccreted balance (5,034 ) (19,399 ) (6,286 ) Balance, end of the period $ - $ (5,159,792 ) $ (3,180,086 ) Years ended December 31, 2017 Advances Bonds Discount Notes Balance, beginning of the period $ 9,873,157 $ (2,052,513 ) $ (12,228,412 ) New transactions elected for fair value option 5,000,000 (1,100,000 ) (5,980,042 ) Maturities and terminations (12,659,567 ) 2,019,550 15,875,322 Net gains (losses) on financial instruments held under fair value option (5,142 ) 224 378 Change in accrued interest/unaccreted balance (2,824 ) 1,665 20,133 Balance, end of the period $ 2,205,624 $ (1,131,074 ) $ (2,312,621 )
(Losses) Due to
Changes in Fair
Value
Value Included in
Current Period
Earnings December 31, 2018 Interest
Income Net Gains
(Losses) Due to
Changes in Fair Value Total Change in
Fair Value Included
in Current Period
Earnings Advances $ 10,085 $ (590 ) $ 9,495 December 31, 2017 Interest
Income Net Gains
(Losses) Due to
Changes in Fair
Value Total Change in
Fair Value Included
in Current Period
Earnings Advances $ 54,023 $ (5,142 ) $ 48,881
(Losses) Due to
Changes in Fair
Value
Value Included in
Current Period
Earnings December 31, 2019 Interest
Expense Net Gains
(Losses) Due to
Changes in Fair
Value Total Change in
Fair Value Included
in Current Period
Earnings Consolidated obligation bonds $ (168,329 ) $ (3,952 ) $ (172,281 ) Consolidated obligation discount notes (26,475 ) (194 ) (26,669 ) $ (194,804 ) $ (4,146 ) $ (198,950 )
(Losses) Due to
Changes in Fair
Value
Value Included in
Current Period
Earnings December 31, 2018 Interest
Expense Net Gains
(Losses) Due to
Changes in Fair
Value Total Change in
Fair Value Included
in Current Period
Earnings Consolidated obligation bonds $ (25,077 ) $ 681 $ (24,396 ) Consolidated obligation discount notes (21,617 ) 118 (21,499 ) $ (46,694 ) $ 799 $ (45,895 ) December 31, 2017 Interest
Expense Net Gains
(Losses) Due to
Changes in Fair
Value Total Change in
Fair Value Included
in Current Period
Earnings Consolidated obligation bonds $ (6,436 ) $ 224 $ (6,212 ) Consolidated obligation discount notes (27,519 ) 378 (27,141 ) $ (33,955 ) $ 602 $ (33,353 )
(Losses) Due to
Changes in Fair
Value
Value Included in
Current Period
Earnings
(Losses) Due to
Changes in Fair
Value
Value Included in
Current Period
Earnings
(Losses) Due to
Changes in Fair
Value
Value Included in
Current Period
Earnings
Unpaid Principal
Balance
Value
Over/(Under)
Aggregate Unpaid
Principal Balance December 31, 2019 Aggregate Unpaid
Principal Balance Aggregate Fair
Value Fair Value Over/(Under)
Aggregate Unpaid
Principal Balance Consolidated obligation bonds(b) $ 12,067,000 $ 12,134,043 $ 67,043 Consolidated obligation discount notes(c) 2,182,845 2,186,603 3,758 $ 14,249,845 $ 14,320,646 $ 70,801 December 31, 2018 Aggregate Unpaid
Principal Balance Aggregate Fair
Value Fair Value Over/(Under)
Aggregate Unpaid
Principal Balance Consolidated obligation bonds(b) $ 5,140,000 $ 5,159,792 $ 19,792 Consolidated obligation discount notes(c) 3,170,915 3,180,086 9,171 $ 8,310,915 $ 8,339,878 $ 28,963 December 31, 2017 Aggregate Unpaid
Principal Balance Aggregate Fair
Value Fair Value Over/(Under)
Aggregate Unpaid
Principal Balance Advances(a) $ 2,200,000 $ 2,205,624 $ 5,624 Consolidated obligation bonds(b) $ 1,130,000 $ 1,131,074 $ 1,074 Consolidated obligation discount notes(c) 2,309,618 2,312,621 3,003 $ 3,439,618 $ 3,443,695 $ 4,077
Unpaid Principal
Balance
Value
Over/(Under)
Aggregate Unpaid
Principal Balance(a) Advances – No advances elected under the FVO were outstanding at December 31, 2019 and 2018. From time to time, the FHLBNY has elected the FVO for advances on an instrument by instrument basis on advances that were primarily short-and intermediate-term floating-rate advances. The elections were made primarily as a natural fair value offset to debt elected under the FVO. (b) The FHLBNY has elected the FVO on an instrument-by-instrument basis for CO bonds, primarily fixed-rate, intermediate- and short-term debt, because management was not able to assert with confidence that the debt would qualify for hedge accounting as such short-term debt may not remain highly effective hedges through the maturity of the bonds. (c) Discount notes were elected under the FVO because management was not able to assert with confidence that the debt would qualify for hedge accounting as the short-term discount note debt may not remain highly effective hedges through maturity.
Unpaid Principal
Balance
Value
Over/(Under)
Aggregate Unpaid
Principal Balance(a)Advances — No advances elected under the FVO were outstanding at December 31, 2018. From time to time, the FHLBNY has elected the FVO for advances on an instrument by instrument basis on advances that were primarily short- and intermediate-term floating-rate advances. The elections were made primarily as a natural fair value offset to debt elected under the FVO.(b)The FHLBNY has elected the FVO for certain short-term CO bonds, primarily fixed-rate shorter-term debt, because management was not able to assert with confidence that the debt would qualify for hedge accounting as such short-term debt may not remain highly effective hedges through the maturity of the bonds.(c)Discount notes were elected under the FVO because management was not able to assert with confidence that the debt would qualify for hedge accounting as the short-term discount note debt may not remain highly effective hedges through maturity.Federal Home Loan Bank of New YorkNotes to Financial StatementsNote 19. Commitmentsand Contingencies. Note 19.Commitments and Contingencies.20182019 and 2017.December 31, 2018.$12.7$44.8 million and $13.0$12.7 million of mortgage loans at December 31, 20182019 and 2017.December 31, 2018. Commitments were generally for periods not to exceed 45 business days. Such commitments were recorded as derivatives at their fair values in compliance with the provisions of the accounting standards for derivatives and hedging.· When the FHLBNY executes derivatives that are eligible to be cleared, the FHLBNY and the FCMs, acting as agents of Derivative Clearing Organizations or DCOs, would enter into margin agreements. The fair values of open derivative contracts are settled on a daily basis by the exchange of variation margin, which is not considered as collateral, rather as the settlement value of the derivative contract. The FHLBNY posts initial margin to DCOs and the initial margin is considered as collateral. ·· When the FHLBNY executes derivatives that are not eligible to be cleared under the CFTC rules, the FHLBNY and the swap counterparties enter into bilateral collateral agreements. On bilateral derivatives, the FHLBNY had posted $257.4 million and $64.5 million in cash to derivative counterparties at December 31, 2019 and December 31, 2018. · When the FHLBNY executes derivatives that are eligible to be cleared, the FHLBNY and the FCMs, acting as agents of Derivative Clearing Organizations or DCOs, would enter into margin agreements. The fair values of open derivative contracts are settled on a daily basis by the exchange of variation margin. In addition, the FHLBNY posts initial margin to DCOs.The FHLBNY had posted $64.5 million and $11.1 million in cash to derivative counterparties at December 31, 2018 and 2017. In addition,for cleared derivatives, the FHLBNY had pledged $239.8$251.2 million in marketable securities and $239.1posted $85.2 million in cash also as collateral to fulfill our initial margin obligation at December 31, 2019. At December 31, 2018, we had pledged $239.8 million of marketable securities to derivative counterparties at December 31, 2018 and 2017.Derivative Clearing Organizations. Further information is provided in Note 17. Derivatives and Hedging Activities.$4.5mortgage-backed securities of $3.7 million and $5.7$4.5 million of mortgage-backed securities to the FDIC to collateralize depositdeposits placed by the FDIC at December 31, 20182019 and 2017.December 31, 2018.$4.6$7.1 million and $3.3$4.6 million for each of the years ended December 31, 2019, 2018 2017 and 2016.2017. Lease agreements for FHLBNY premises generally provide for inflationary increases in the basic rentals resulting from increases in property taxes and maintenance expenses. Additionally, the FHLBNY has a lease agreement for a shared offsite data backup site at a cost estimated to be $1.8$2.8 million. Components of the offsite agreement are generally renewable up to threefive years.anthe FHLBank’s income in relation to the income of all FHLBanks for the previous year. There have been no shortfalls in any periods in this report.20182019 (in thousands): December 31, 2019 Payments Due or Expiration Terms by Period Greater Than Greater Than Less Than One Year Three Years Greater Than One Year to Three Years to Five Years Five Years Total Contractual Obligations Consolidated obligation bonds at par(a) $ 62,319,595 $ 6,878,840 $ 2,779,570 $ 6,130,800 $ 78,108,805 Consolidated obligation discount notes at par 74,094,586 - - - 74,094,586 Mandatorily redeemable capital stock(a) 835 371 402 3,521 5,129 Premises (lease obligations)(b) 6,763 15,209 16,097 70,222 108,291 Remote backup site 706 1,273 838 - 2,817 Other liabilities(c) 86,480 10,910 8,563 69,563 175,516 Total contractual obligations 136,508,965 6,906,603 2,805,470 6,274,106 152,495,144 Other commitments Standby letters of credit(d) 21,720,973 263,120 6,938 - 21,991,031 Consolidated obligation bonds/discount notes traded not settled 500,000 - - - 500,000 Commitments to fund additional advances 250,000 - - - 250,000 Commitments to fund pension 10,000 - - - 10,000 Open delivery commitments (MPF) 44,768 - - - 44,768 Total other commitments 22,525,741 263,120 6,938 - 22,795,799 Total obligations and commitments $ 159,034,706 $ 7,169,723 $ 2,812,408 $ 6,274,106 $ 175,290,943 (a)Callable bonds contain an exercise date or a series of exercise dates that may result in a shorter redemption period. Redemption dates of mandatorily redeemable capital stock are assumed to correspond to maturity dates of member advances. Excess capital stock is redeemed at that time, and hence, these dates better represent the related commitments than the put dates associated with capital stock.(b)We renewed the lease for the New York City office in 2017. In addition, our existing office lease in New Jersey expired in the fourth quarter of 2018 and a new long-term lease was executed for our New Jersey operating space. The Bank adopted ASU 2016-02, Leases (Topic 842) on January 1, 2019. Upon adoption, the lease obligations were recorded in the Statements of Condition. Under legacy pre-ASU GAAP, lease obligations were reported as off-balance sheet commitments. Immaterial amounts of equipment and other leases have been excluded in the table above.(c)Includes accounts payable and accrued expenses, liabilities recorded for future settlements of investments, Pass-through reserves due to member institutions held at the FRB, and projected payment obligations for pension plans. Where it was not possible to estimate the exact timing of payment obligations, they were assumed to be due within one year; amounts were not material. For more information about employee retirement plans in general, see Note 16. Employee Retirement Plans.(d)Financial letters of credit — Standby letters of credit are executed for a fee on behalf of members to facilitate residential housing, community lending, and members’ asset/liability management or to provide liquidity. A standby letter of credit is a financing arrangement between the FHLBNY and its member. Members assume an unconditional obligation to reimburse the FHLBNY for value given by the FHLBNY to the beneficiary under the terms of the standby letter of credit. The FHLBNY may, in its discretion, permit the member to finance repayment of their obligation by receiving a collateralized advance.(a) Callable bonds contain an exercise date or a series of exercise dates that may result in a shorter redemption period. Redemption dates of mandatorily redeemable capital stock are assumed to correspond to maturity dates of member advances. Excess capital stock is redeemed at that time, and hence, these dates better represent the related commitments than the put dates associated with capital stock. (b) Amounts represent undiscounted obligations. The Bank adopted ASU 2016-02, Leases (Topic 842) on January 1, 2019. Upon adoption, all lease obligations, including legacy leases were recorded in the Statements of Condition as a Right-of-use (ROU) asset and a corresponding lease liability. Under legacy pre-ASU GAAP, lease obligations were reported as off-balance sheet commitments. Immaterial amounts of equipment and other leases have been excluded in the table above. (c) Includes accounts payable and accrued expenses, liabilities recorded for future settlements of investments, Pass-through reserves due to member institutions held at the FRB, and projected payment obligations for pension plans. Where it was not possible to estimate the exact timing of payment obligations, they were assumed to be due within one year; amounts were not material. For more information about employee retirement plans in general, see Note 16. Employee Retirement Plans. (d) Financial letters of credit — Standby letters of credit are executed for a fee on behalf of members to facilitate residential housing, community lending, and members’ asset/liability management or to provide liquidity. A standby letter of credit is a financing arrangement between the FHLBNY and its member. Members assume an unconditional obligation to reimburse the FHLBNY for value given by the FHLBNY to the beneficiary under the terms of the standby letter of credit. The FHLBNY may, in its discretion, permit the member to finance repayment of their obligation by receiving a collateralized advance. iswas required at December 31, 2019.Note 20.Related Party Transactions.In January 2020, we concluded our evaluation under the CECL guidance, which we adopted effective January 1, 2020. No credit loss allowance was necessary for standby letters of credit or off balance sheet receivables as of January 1, 2020. December 31, 2019 Operating Leases(a) Right-of-use assets $ 75,464 Lease Liabilities $ 89,365 Twelve months ended December 31, 2019 Operating Lease Expense $ 7,585 Operating cash flows - Cash Paid $ 6,624 Weighted Average Discount Rate 3.29 % Weighted Average Remaining Lease Term 12.98Years Remaining maturities through Operating lease liabilities December 31, 2019 December 31, 2018 2019 - 6,687 2020 7,886 6,927 2021 8,107 6,860 2022 8,205 6,949 2023 8,575 7,282 2024 8,282 7,331 Thereafter 69,886 64,705 Total undiscounted lease payments 110,941 $ 106,741 Imputed interest (21,576 ) Total operating lease liabilities $ 89,365 (a) We have elected to exclude immaterial amounts of short-term operating lease liabilities in the Right-of-use assets and lease liabilities. Note 20. Related Party Transactions. Federal Home Loan Bank of New YorkNotes to Financial Statements20182019 and in the same period in the prior year.20182019 and in the same period in the prior year.$8.6$7.3 million and $11.5$8.6 million at December 31, 20182019 and 2017.December 31, 2018.$2.3 million, and $2.1$2.3 million for the twelve months ended December 31, 2019, 2018 2017 and 2016.2017.20182019 and 2017,December 31, 2018, outstanding notional amounts were $333.0$536.0 million and $193.0$333.0 million and represented derivative contracts in which the FHLBNY acted as an intermediary to execute derivative contracts with members. Separately, the contracts were offset with contracts purchased from unrelated derivatives dealers. Net fair value exposures of these transactions at December 31, 20182019 and 2017December 31, 2018 were not significant. The intermediated derivative transactions with members and derivative counterparties were fully collateralized.20182019 and 2017,2018, overnight loans extended to other FHLBanks averaged $6.7$6.9 million and $3.3$6.7 million. Generally, loans made to other FHLBanks are uncollateralized. Interest income from such loans was immaterial in the periods in this report.months ended December 31, 2018. In the twelve months ended December 31, 2017, the FHLBNY borrowed a total of $0.8 billion in overnight loans from other FHLBanks.Federal Home Loan Bank of New YorkNotes to Financial StatementsDuringCompensating balance arrangements exist between Citibank and the twelve months ended FHLBNY, but were not active in 2019 and 2018.December 31, 2018, there was no compensating cash balances held at Citibank. The balance was $41.1 million at December 31, 2017. Citibank is a member and stockholder of the FHLBNY. For more information, see Note 3. Cash and Due from Banks.20182019 and December 31, 20172018 and transactions for each of the years ended December 31, 2019, 2018 2017 and 20162017 (in thousands): December 31, 2019 December 31, 2018 Related Related $ 100,695,241 $ 105,178,833 - 250,000 181,792 202,404 $ 1,194,409 $ 1,062,637 5,129 5,845 140 373 153,894 161,718 45,388 86,095 $ 7,531,895 $ 7,746,622 (a)Represents funds not yet allocated or disbursed to AHP programs.(b)Related column includes(a) Represents funds not yet allocated or disbursed to AHP programs. (b) Includes member pass-through reserves at the Federal Reserve Bank of New York. Federal Home Loan Bank of New YorkNotes to Financial Statements Years ended December 31, 2019 2018 2017 Related Related Related Interest income Advances $ 2,526,662 $ 2,522,040 $ 1,563,322 Interest-bearing deposits 6 5 2 Loans to other FHLBanks 165 130 26 Interest expense Deposits $ 22,839 $ 17,816 $ 15,060 Mandatorily redeemable capital stock 379 964 1,285 Cash collateral held and other borrowings 165 - 26 Service fees and other $ 17,022 $ 14,439 $ 12,251 Note 21.Segment Information and Concentration.Note 21. Segment Information and Concentration. 2018,2019, December 31, 20172018 and December 31, 20162017 and associated interest income for the periods then ended are summarized as follows (dollars in thousands): December 31, 2019 Percentage of Par Total Par Value Twelve Months City State Advances of Advances Interest Income Percentage(a) New York NY $ 23,045,000 22.95 % $ 486,275 27.71 % New York NY 14,445,000 14.39 367,507 20.94 New York Community Bank(b) Westbury NY 13,102,661 13.05 259,207 14.77 AXA Equitable Life Insurance Company New York NY 6,900,415 6.87 111,997 6.38 Investors Bank(b) Short Hills NJ 4,986,397 4.97 115,789 6.60 New York NY 4,142,144 4.13 127,299 7.26 New York NY 2,825,000 2.81 81,348 4.64 Wayne NJ 2,397,769 2.39 88,389 5.04 Sterling National Bank Montebello NY 2,245,000 2.24 76,029 4.33 ESL Federal Credit Union Rochester NY 1,739,823 1.73 40,937 2.33 $ 75,829,209 75.53 % $ 1,754,777 100.00 % (a) Interest income percentage is the member’s interest income from advances as a percentage of the top 10 members. (b) At December 31, 2019, an officer of this member bank also served on the Board of Directors of the FHLBNY. (a)Interest income percentage is the member’s interest income from advances as a percentage of the top 10 members.(b)At December 31, 2018, an officer of this member bank also served on the Board of Directors of the FHLBNY.(c)New York Commercial Bank merged into New York Community Bank in the fourth quarter 2018. Par advances are for New York Community Bank. Interest income reported in the table represent interest income received from New York Commercial Bank and New York Community Bank in 2018. December 31, 2018 Percentage of Par Total Par Value Twelve Months City State Advances of Advances Interest Income Percentage(a) Citibank, N.A. New York NY $ 19,995,000 18.96 % $ 644,926 37.66 % Metropolitan Life Insurance Company New York NY 14,245,000 13.51 301,318 17.60 New York Community Bank(b) (c) Westbury NY 13,053,661 12.38 247,973 14.48 Signature Bank New York NY 4,970,000 4.71 92,592 5.41 Investors Bank(b) Short Hills NJ 4,925,681 4.67 95,921 5.60 Sterling National Bank Montebello NY 4,837,000 4.59 92,835 5.42 Manufacturers and Traders Trust Company Buffalo NY 4,774,712 4.53 13,256 0.77 AXA Equitable Life Insurance Company New York NY 3,990,415 3.78 72,582 4.24 New York Life Insurance Company New York NY 3,575,000 3.39 67,793 3.96 Valley National Bank(b) Wayne NJ 3,027,000 2.87 83,172 4.86 Total $ 77,393,469 73.39 % $ 1,712,368 100.00 % (a)Interest income percentage is the member’s interest income from advances as a percentage of the top 10 members.(b)At December 31, 2017, officer of member bank also served on the Board of Directors of the FHLBNY.(c)For Bank membership purposes, principal place of business is New York, NY.(d)Astoria Bank merged into Sterling National Bank in the fourth quarter 2017. Both entities are member banks and are related parties. The par advance balance represents advances outstanding with Sterling, the merged entity. Interest income reported in the table represented interest income received from Astoria and Sterling in 2017.(a) Interest income percentage is the member’s interest income from advances as a percentage of the top 10 members. (b) At December 31, 2018, an officer of this member bank also served on the Board of Directors of the FHLBNY. (c) New York Commercial Bank merged into New York Community Bank in the fourth quarter 2018. Par advances are for New York Community Bank. Interest income reported in the table represent interest income received from New York Commercial Bank and New York Community Bank in 2018. December 31, 2017 Percentage of Par Total Par Value Twelve Months City State Advances of Advances Interest Income Percentage(a) New York NY $ 43,100,000 35.12 % $ 450,596 36.83 % New York NY 14,445,000 11.77 221,310 18.09 Westbury NY 11,830,600 9.64 182,103 14.88 Westbury NY 273,900 0.22 3,822 0.31 12,104,500 9.86 185,925 15.19 Sterling National Bank(b)(d) Montebello NY 4,507,000 3.67 58,049 4.74 Investors Bank(b) Short Hills NJ 4,326,053 3.53 82,894 6.77 Signature Bank New York NY 4,195,000 3.42 36,503 2.98 Goldman Sachs Bank USA New York NY 3,390,000 2.76 30,433 2.49 Mc Lean VA 3,100,000 2.53 68,391 5.59 AXA Equitable Life Insurance Company New York NY 3,000,415 2.45 52,308 4.27 New York NY 2,625,000 2.14 37,263 3.05 $ 94,792,968 77.25 % $ 1,223,672 100.00 % (a) Interest income percentage is the member’s interest income from advances as a percentage of the top 10 members. (b) At December 31, 2017, an officer of this member bank also served on the Board of Directors of the FHLBNY. (c) For Bank membership purposes, principal place of business is New York, NY. (d) Astoria Bank merged into Sterling National Bank in the fourth quarter 2017. Both entities are member banks and are related parties. The par advance balance represents advances outstanding with Sterling, the merged entity. Interest income reported in the table represented interest income received from Astoria and Sterling in 2017. (a)Interest income percentage is the member’s interest income from advances as a percentage of the top 10 members.(b)At December 31, 2016, officer of member bank also served on the Board of Directors of the FHLBNY.(c)For Bank membership purposes, principal place of business is New York, NY.28, 201929, 2020 and December 31, 20182019 (shares in thousands): Number Percent February 29, 2020 of Shares of Total Principal Executive Office Address Owned Capital Stock 399 Park Avenue, New York, NY 10043 8,805 16.15 % 200 Park Avenue, New York, NY 10166 7,366 13.51 615 Merrick Avenue, Westbury, NY 11590 6,337 11.62 22,508 41.28 % Number Percent December 31, 2019 of Shares of Total Principal Executive Office Address Owned Capital Stock 399 Park Avenue, New York, NY 10043 11,370 19.66 % 200 Park Avenue, New York, NY 10166 7,366 12.74 (a) 615 Merrick Avenue, Westbury, NY 11590 6,476 11.20 AXA Equitable Life Insurance Company 1290 Avenue of the Americas, New York, 10104 3,222 5.57 28,434 49.17 % (a)New York Commercial Bank merged into New York Community Bank in the fourth quarter 2018.Item 9.Changes in and Disagreements with Accountants on Accounting and Financial Disclosure.Item 9. Changes in and Disagreements with Accountants on Accounting and Financial Disclosure. None.None. Item 9A.Controls and Procedures.Item 9A. Controls and Procedures. (a) Evaluation of Disclosure Controls and Procedures: An evaluation of the Bank’s disclosure controls and procedures (as defined in Rules 13a-15(e) and 15d-15(e) under the Securities Exchange Act of 1934, as amended (the “Act”)) was carried out under the supervision and with the participation of the Bank’s President and Chief Executive Officer, José R. González, and Senior Vice President and Chief Financial Officer, Kevin M. Neylan, at December 31, 2018. Based on this evaluation, they concluded that as of December 31, 2018, the Bank’s disclosure controls and procedures were effective at a reasonable level of assurance in ensuring that the information required to be disclosed by the Bank in the reports it files or submits under the Act is (i) accumulated and communicated to the Bank’s management (including the President and Chief Executive Officer and Senior Vice President and Chief Financial Officer) in a timely manner, and (ii) recorded, processed, summarized and reported within the time periods specified in the Securities and Exchange Commission’s rules and forms.(a) Evaluation of Disclosure Controls and Procedures: An evaluation of the Bank’s disclosure controls and procedures (as defined in Rules 13a-15(e) and 15d-15(e) under the Securities Exchange Act of 1934, as amended (the “Act”)) was carried out under the supervision and with the participation of the Bank’s President and Chief Executive Officer, José R. González, and Senior Vice President and Chief Financial Officer, Kevin M. Neylan, at December 31, 2019. Based on this evaluation, they concluded that as of December 31, 2019, the Bank’s disclosure controls and procedures were effective at a reasonable level of assurance in ensuring that the information required to be disclosed by the Bank in the reports it files or submits under the Act is (i) accumulated and communicated to the Bank’s management (including the President and Chief Executive Officer and Senior Vice President and Chief Financial Officer) in a timely manner, and (ii) recorded, processed, summarized and reported within the time periods specified in the Securities and Exchange Commission’s rules and forms. (b) Changes in Internal Control Over Financial Reporting: There were no changes in the Bank’s internal control over financial reporting (as defined in Rules 13a-15(f) and 15d-15(f) under the Act) during the Bank’s fourth quarter that have materially affected, or are reasonably likely to materially affect, the Bank’s internal control over financial reporting.(b) Changes in Internal Control Over Financial Reporting: There were no changes in the Bank’s internal control over financial reporting (as defined in Rules 13a-15(f) and 15d-15(f) under the Act) during the Bank’s fourth quarter that have materially affected, or are reasonably likely to materially affect, the Bank’s internal control over financial reporting. Item 9B.Other Information.Item 9B.Other Information. PricewaterhouseCoopers LLP (PwC) serves as the independent registered public accounting firm for us and the other FHLBs. Rule 2-01(c)(1)(ii)(A) of Regulation S-X (the Loan Rule) prohibits an accounting firm, such as PwC, and any covered person in the firm, from having certain financial relationships with their audit clients and affiliated entities. Specifically, the Loan Rule provides, in the relevant part, that an accounting firm generally would not be independent if the accounting firm or any covered person in the firm receives a loan from a lender that is a “record or beneficial owner of more than ten percent of the audit client’s equity securities.”PwC has advised the Bank that as of December 31, 2018, it has borrowing relationships with two Bank members and certain covered persons in the firm also have borrowing relationships with two members (referred to below as the “Lenders”) who each own more than ten percent of the Bank’s capital stock which could call into question PwC’s independence with respect to the Bank. The Bank is providing this disclosure to explain the facts and circumstances of PwC’s and its covered persons’ relationships with these Lenders as well as PwC’s and the Audit Committee’s conclusions concerning PwC’s objectivity and impartiality with respect to the audit of the Bank.Item 10. Directors, Executive Officers and Corporate Governance. PwC advised the Audit Committee of the Bank that it believed that, in light of the facts of each borrowing relationship, its ability to exercise objective2019 and impartial judgment on all matters encompassed within PwC’s audit engagement is not impaired and that a reasonable investor with knowledge of all relevant facts and circumstances would reach the same conclusion.PwC advised the Audit Committee that this conclusion is based in part on the following considerations with respect to borrowing relationships between one of the Lenders and PwC:· the borrowings are in good standing and the Lender does not have the right to take action against PwC, as borrower, in connection with the financings;· the debt balances outstanding were immaterial to PwC and to the Lender;· PwC has borrowing relationships with a diverse group of lenders, therefore PwC is not dependent on any single lender or group of lenders; and· the PwC audit engagement team has no involvement in PwC’s treasury function and PwC’s treasury function has no oversight or ability to influence the PwC audit engagement team.PwC advised the Audit Committee that with respect to borrowing relationships between one of the Lenders and an engagement team member, its conclusion is based on factors listed above and the following considerations:· the Lender has not made any attempt to influence the conduct of the audits or objectivity and impartiality of this engagement team member;· each loan was obtained under the Lender’s normal lending procedures, terms, and requirements; and· each loan is current.Additionally, PwC advised the Audit Committee that with respect to certain covered persons who do not play an active role in the Bank’s audit and that have borrowing relationships with the Lenders, its conclusion is based on such professionals being required to disclose immediately any relationships that may raise issues about objectivity, independence, conflicts of interest, or favoritism.Moreover, the Audit Committee of the Bank assessed PwC’s ability to perform an objective and impartial audit, including consideration of the ownership and governance structure of the Bank, the limited voting rights of the Bank’s members and the composition of the board of directors. In addition to the above listed considerations, the Audit Committee considered the following:· although each of the Lenders owned more than ten percent of the Bank’s capital stock, the voting power of each Lender’s capital stock is less than ten percent; and· no officer or director of either Lender served on the board of directors of the Bank.Based on the Audit Committee’s evaluation, the Audit Committee concluded that PwC’s ability to exercise objective and impartial judgment on all issues encompassed within PwC’s audit engagement has not been impaired.If in the future, however, PwC is ultimately determined under the Loan Rule not to be independent with respect to the Bank, or permanent relief regarding this matter is not granted by the SEC, the Bank may need to take other actions and incur other costs in order for the Bank’s previously filed Annual Reports on Form 10-K and Quarterly Reports on Form 10-Q to be deemed compliant with applicable securities laws. Such actions may include, among other things, obtaining a new audit and review of our historical financial statements by another independent registered public accounting firm. Any of the foregoing could have an adverse impact on the Bank.For further discussion of Bank members owning more than ten percent of the Bank’s capital stock at December 31, 2018, please see Note 21. Segment Information and Concentration to the financial statements in this Form 10-K. For a discussion of the voting rights of our members, please see Item 10 — Directors, Executive Officers, and Corporate Governance — 2018 and 20192020 Board of Directors in this Form 10-K.Item 10.Directors, Executive Officers and Corporate Governance.2018 and 2019 Board of Directors31st)31st). However, the number of votes that each institution may cast for each Directorship cannot exceed the average number of shares of capital stock that were required to be held by all member institutions located in the voting member’s state on the record date. The Board does not solicit proxies, nor are member institutions permitted to solicit or use proxies in order to cast their votes in an election.20182019 through the date of this annual report on Form 10-K. Footnotes are used to specifically identify (i) four Directors whose terms expired at the end of 20182019 and who were elected by the Bank’s membership to serve again on the Board;Board and (ii) a Director whose term expired at the end of 2018 and who did not run again; (iii) a Director who did not serve on the Board in 2018 but who was elected by the Bank’s membership to serve on the Board commencing on January 1, 2019; (iv) two Directors who resigned from the Board during 2018; (v) two Directors who were selected by the Board to fill the vacancies resulting from the foregoing resignations commencing on January 1, 2019; and (vi) four Independent Directors who also served or who are currently servingserve as public interest directors.
3/21/2019
Director
Since
Most
Recent
Term
of Most
Recent
Term
Bank
Members in69161968(a)64Anne Evans Estabrook(b)742/20041/1/1512/31/18DistrictwideIndependent*726979701619(c)55(d)467868(a)62(e)57(f)6162Monte N. Redman(g)681/20141/1/175/22/18NYMemberEdwin C. Reed(h)654/20071/1/179/14/18DistrictwideIndependent*(i)546716196076 9/2017 1/1/20 12/31/23 Districtwide Independent 75Directors Buran and Hoy served on the Board as New York Member Directors throughout 2019, and their terms both expired on December 31, 2019. On November 5, 2019, they were both elected by the Bank’s New York membership to serve as New York Member Directors for new four year terms each commencing on January 1, 2020. 9/2017Directors Soaries and Weyne served on the Board as Independent Directors throughout 2019, and their terms both expired on December 31, 2019. On November 5, 2019, they were both elected by the Bank’s districtwide membership to serve as Independent Directors for new four year terms each commencing on January 1, 2020. 9/7/1712/31/19Districtwide Directors so indicated served as public interest directors throughout the entire course of their service covered by this table. (a)Directors Cummings and Martin served on the Board as New Jersey Member Directors throughout 2018, and their terms both expired on December 31, 2018. On November 6, 2018, they were both elected by the Bank’s New Jersey membership to serve as New Jersey Member Directors for new four year terms each commencing on January 1, 2019.(b)Director Estabrook served on the Board as an Independent Director throughout 2018, and her term expired on December 31, 2018; she did not run again for another term.(c)Director Huber was elected on November 6, 2018 by the Bank’s membership to serve as an Independent Director for a four year term commencing on January 1, 2019.(d)Director Kilbourne was elected by the Board on November 15, 2018 (and a non-objection notice was received from the Federal Housing Finance Agency on November 29, 2018) to fill the Independent Director vacancy that resulted from the departure of Director Reed; his term as an Independent Director commenced on January 1, 2019 and will end on December 31, 2020 (what would have been the end of Director Reed’s term had he stayed on the Board).(e)Director Mroz served on the Board as an Independent Director throughout 2018, and his term expired on December 31, 2018. He was elected on November 6, 2018 by the Bank’s membership to serve as an Independent Director for a new four year term commencing on January 1, 2019.(f)Director Nasca served on the Board as a New York Member Director throughout 2018, and his term expired on December 31, 2018. He was elected on November 6, 2018 by the Bank’s New York membership to serve as a New York Member Director for a new four year term commencing on January 1, 2019.(g)Director Redman, a New York Member Director, resigned from the Board effective May 22, 2018.(h)Director Reed, an Independent Director, resigned from the Board effective September 14, 2018.(i)Director Romaine was elected by the Board on November 15, 2018 to fill the New York Member Director vacancy that resulted from the departure of Director Redman; his term commenced on January 1, 2019 and will end on December 31, 2020 (what would have been the end of Director Redman’s term had he stayed on the Board).*Independent Directors so indicated also served or are serving as public interest directors throughout the entire course of their service covered by this table, with the exception of Director Soaries, whose service as a public interest director commenced effective October 3, 2018. (Chair(Chair)) is Director, President and Chief Executive Officer of Flushing Financial Corporation, the holding company for FHLBNY member Flushing Bank (formerly Flushing Savings Bank). He joined the holding company and the bank in 2001 as Chief Operating Officer and he became a Director of these entities in 2003. In 2005, he was named President and Chief Executive Officer of both entities. Mr. Buran’s career in the banking industry began with Citibank in 1977. There, he held a variety of management positions including Business Manager of its retail distribution in Westchester, Long Island and Manhattan and Vice President in charge of its Investment Sales Division. Mr. Buran left Citibank to become Senior Vice President, Division Head for Retail Services of NatWest Bank and later Executive Vice President of Fleet Bank’s (now Bank of America) retail branch system in New York City, Long Island, Westchester and Southern Connecticut. He also spent time as a consultant and Assistant to the President of Carver Bank. Mr. Buran is past Chairman and current Board member of the New York Bankers Association. From 2011 to 2017 he served on the Community Depository Institutions Advisory Council of The Federal Reserve Bank of New York. Since 2012 he has beenJohn is also a former member of the Nassau County Interim Finance Authority.Authority where he served for eight years. Mr. Buran has devoted his time to a variety of charitable and not-for-profit organizations. He has been a Board member of the Long Island Association, both the Nassau and Suffolk County Boy Scouts, EAC, Long Island University, the Long Island Philharmonic and Channel 21. He was the fundraising Chairman for the Suffolk County Vietnam Veteran’s War Memorial in Farmingville, New York and has been recipient of the Boy Scouts’ Chief Scout Citizen Award. His work in the community has been recognized by Family and Children’s Association, and Gurwin Jewish Geriatric Center. He was also a recipient of the Long Island Association’s SBA Small Business Advocate Award. Mr. Buran was honored twice with St. Joseph’s College’s Distinguished Service Award. Mr. Buran also serves on the Advisory Board and is a former Board President of Neighborhood Housing Services of New York City. He is a Board member of The Korean American Youth Foundation. Mr. Buran also serves on the Board of the Long Island Conservatory. He was recently presented with an honorary Doctorate of Humane Letters from St. Francis College of Brooklyn and was the recipient of the Catholic Charities Gold Medal Award in 2019. He holds a B.S. in Management and an M.B.A., both from New York University.a Trustee of the Liberty Science Center, and the former Chairman of the Board of the New Jersey Bankers Association. He is also a board member of the Independent College Fund of New Jersey and The Community Foundation of New Jersey. He also serves as a member of the Development Leadership Council of Morris Habitat for Humanity.Jersey and St. Benedicts Prep in Newark. Mr. Cummings is a certified public accountant.Ms. Estabrook is Chairman of Elberon Development Group in Elizabeth, New Jersey and was the chief executive officer from 1984 through 2014. It, together with its affiliated companies, owns and manages approximately 2.1 million square feet of rental property. Most of the property is industrial with the remainder serving commercial tenants. Elberon Development Group also engages in redevelopment projects. Ms. Estabrook was appointed by Governor Christine Todd Whitman to the NJ Economic Development Authority Board in 1995 until 2000. Ms. Estabrook also served as a director on the board of New Brunswick Savings Bank, Constellation Bancorp and Summit Bank, all in New Jersey. Since 2005 and currently Ms. Estabrook serves as a Director of New Jersey American Water Company. Ms. Estabrook is a past chairman of the New Jersey Chamber of Commerce, served on its executive committee, and chaired its nominating committee. In 2003-2004, she was the first woman to serve in that capacity in the Chamber’s 90 plus years of existence. She also served as a member of the Lay Board of Trustees of the Delbarton School in Morristown for 15 years including five years as chair. Until December 2012, Ms. Estabrook was a member and Secretary of the Board of Trustees of Catholic Charities, served on its Executive Committee and its Audit Committee, and chaired its Finance Committee and Building and Facilities Committees. She is presently on the Board of Overseers of the Weill Cornell Medical School. She is a Trustee of RWJ Barnabas Health and serves on its Nominating/Governance, Compensation and Strategic Planning Committees. She also chairs its Sub-committee on Diversity and Inclusion. She previously served on its Audit Committee for six years. She serves on the Board of Trustees at Monmouth Medical Center where she is on its Executive and Nominating Committees. She also serves on the Strategic Planning Committee with regard to the hospital’s real estate needs. Ms. Estabrook serves on the Board of Trustees of the New Jersey Performing Arts Center (NJPAC) and serves on its Executive and Operations and Finance Committees and its Business Partners Committee. In September 2011, she became a member of the Board of Managers of the Theatre Square Development Company LLC in Newark, NJ. She currently serves as its Co-Chair. It has recently completed a 245 residential unit housing project which includes retail space and affordable housing units. It has purchased additional land on which it will develop hi-rise and low-rise housing accompanied by community amenities such as shops and restaurants. In 2015 she was named as a Director of Y Homes, Inc., an affiliate of the Gateway family YMCA. Ms. Estabrook’s experience in, among other areas, representing community interests in housing as indicated by her background described above, supported her qualifications to serve on our Board as an Independent Director and public interest director. which has been a FHLBNY member since January 1, 1994. On January 1, 2007, he was appointed Chairman of NYCB and New York Community (a position he previously held at NYCB from July 20, 1993 through July 31, 2001 and at New York Community from May 20, 1997 through July 31, 2001); he served as Chairman of these two entities until December 2010. Since 1965, when he joined New York Community (formerly Queens County Savings Bank), Mr. Ficalora has held increasingly responsible positions, crossing all lines of operations. Prior to his appointment as President and Chief Executive Officer of New York Community in 1994, Mr. Ficalora served as President and Chief Operating Officer (beginning in October 1989); before that, he served as Executive Vice President, Comptroller and Secretary. A graduate of Pace University with a degree in business and finance, Mr. Ficalora provides leadership to several professional banking organizations. In addition to previously servingHe currently serves as a member of the Executive Committee and as Chairman of the former Community Bankers Association of New York State, Mr. Ficalora is a Director of the New York State Bankers Association and Chairman of its Metropolitan Area Division. Additionally, he is a member of the Government Relations Administrative Committee and the American Bankers Council of the American Bankers Association, as well as a former member of their Boardthe American Bankers Association’s Government Relations Council Administrative Committee, a member of Directors.the American Bankers Association Federal Home Loan Bank Committee, and is a director of the New York Bankers Association, also serving as Chairman of its Metropolitan Area Division. Mr. Ficalora also serves on the Board of Trustees of Pace University, as well as on their Investment/Pension Committee, the Boards of Directors of the New York Community Bank Foundation, and the Richmond County Savings Foundation.Foundation, and Pentegra Retirement Trust. In addition, he is a member of the Board of Pentegra Services, Inc. He also serves on the Pentegra Boards, which provide retirement services principally to the banking industry, andis a former Director of Peter B. Cannell and Co., Inc., an investment advisory firm, that became a subsidiary of New York Community in 2004. In addition, Mr. Ficalora is onand the Board of the Foreign Policy Association. Previously, Mr. Ficalora served as a Member Director of the FHLBNY for ten years, ultimately timing out as the Vice Chairman. Mr. Ficalora served as a member of the Board of Directors of the Thrift Institutions Advisory Council of the Federal Reserve Board in Washington, D.C., and also served as a member of the Thrift Institutions Advisory Panel of the Federal Reserve Bank of New York. Mr. Ficalora has also previously served as a director of Computhrift Corporation, Chairman and board member of the New York Savings Bank Life Insurance Fund, President and Director of the MSB Fund andformer President and Director of the Asset Management Fund Large Cap Equity Institutional Fund, Inc. With respect toMr. Ficalora also is an active participant in community activities, Mr. Ficaloraaffairs. He has been a member of the Board of Directors of the Queens Chamber of Commerce since 1990, and has previously served as a member ofon its Executive Committee. HeIn addition, Mr. Ficalora serves on the BoardBoards of Directors of the Foreign Policy Association, Partnership for NYC, the Board of Trustees of the Flushing Cemetery, the Board of Directors and the Finance and Audit Committee of the New York Hall of Science,City, and Flushing Cemetery; the Board of Directors, the Executive Committee, and the Development Committee of New York-Presbyterian/Queens; the Board of Trustees, the Finance and Audit Committee, and Vice Chair of the President’s Council of the New York-Presbyterian/Queens and onYork Hall of Science; the Advisory Council of the Queens Museum of Art.Art, and he is a Board member of Nassau County Crime Stoppers, Inc. Mr. Ficalora previously served onis a former member of the Board of TrusteesDirectors of the American Bankers Association, the Thrift Institutions Advisory Council of the Federal Reserve Board in Washington, and the Federal Reserve Bank of New York Thrift Institutions Advisory Panel. He is also the former Chairman of the New York State Savings Forum for Operations Audit CommitteeControl, the former Chairman of CBANYS, as well as the former Chairman of CBANYS' Auditors and Comptrollers Forum, the former Chairman of the SBLI Fund, the former Director of Computhrift Corporation, a former Trustee of the Museum of the Moving Image.Image, and past President and Director of the MSB Fund. In addition, Mr. Ficalora was the formerhe previously served as President of the Queens Library Foundation and was theas Chairman of the Board and of the Administrative Committee of the Queens Borough Public Library, having served as its President.Library. presidentis the President of Huber Advisory Services in Red Bank, New Jersey, which provides financial advisory services to clients in the healthcare and insurance industries. He served through the end of 2018 as Senior Vice President and Chief Financial Officer of Horizon Blue Cross Blue Shield of New Jersey (Horizon), which is New Jersey’s largest health insurer. He had been with Horizon since 2002 and served as Vice President of Finance before being promoted to CFO in 2012. Mr. Huber was formerly a Partner with the independent public accounting firm of Arthur Andersen LLP. Immediately prior to joining Horizon, he was an audit partner in Arthur Andersen’s Financial Services practice in Metro New York, where he lead the insurance industry practice and served clients in the insurance and banking industries. Mr. Huber has a Bachelor’s degree in Accounting from Lehigh University and is a CPA. Mr. Huber is the Chair of the Red Bank Redevelopment Agency and serves as Co-Chair ofon the Board of Trustees of the New Jersey Symphony Orchestra. He served on the board of the New Jersey Economic Development Authority and was Chair of the Loan Committee and the Audit Committee. Mr. Huber’s auditing and accounting and financial management experience supports his qualifications to serve on our Board as an Independent Director.United /LosUnited/Los Sures, which mission is maintaining and improving housing in the Williamsburg community for those of low and moderate income. Mr. Mahon is a member of the National Association of Corporate Directors. Prior to joining the Bank in 1980, Mr. Mahon served in similar capacity at two New York metropolitan area savings banks. He is a graduate of Saint Peter’s University, and has an M.B.A. in finance from Rutgers University.chairman, presidentChairman, President and chief executive officerChief Executive Officer of Provident Financial Services, Inc. and FHLBNY member Provident Bank, New Jersey’s oldest state-chartered bank. He has been in the banking industry for over 35 years. Mr. Martin previously served as president and chief executive officer of First Sentinel Bancorp, Inc., which was acquired by Provident Financial Services, Inc. in July 2004. Beginning with First Sentinel in 1984 as controller, Mr. Martin advanced and was appointed president of First Sentinel Bancorp and its subsidiary, First Savings Bank, in 2003. Prior to his banking career, Mr. Martin worked for Johnson & Johnson in inventory control and as a financial analyst. Mr. Martin serves on the board of directors of the New Jersey Bankers Association. In addition, he serves on the Federal Reserve Community Depository Institutions Advisory Council and the ICBA’s Large Community Bank Council. He also dedicates much of his spare time helping to improve the community. Mr. Martin is a vice president of The 200 Club of Middlesex County, which provides financial assistance and scholarships to families of law enforcement, fire and public safety officials. He serves on the board of trustees and the executive committee of Elon University, and is a past president of the alumni board. Mr. Martin volunteers at local food pantries and Habitat for Humanity build sites. He also spends time teaching financial literacy to high school students at inner city schools. Mr. Martin is president of The Provident Bank Foundation, which, since its founding in 2003, has provided more than $23 million in grants for programs focusing on community enrichment, education, and health, youth and families in New Jersey and Pennsylvania. Mr. Martin has been honored for his philanthropic endeavors as a recipient of the New Jersey State Governor’s Jefferson Awards for Public Service, has been honored by the National MS Society, the American Jewish Committee, The Scholarship Fund for Inner-City Children, Habitat for Humanity, Boys and Girls Club of America, Project Live and Felician College. Mr. Martin received a bachelor’s degree in accounting and business from Elon University and holds a MBA from Monmouth University., as indicated by his background described above, supports his qualifications to serve on our Board as an Independent Director.Board.Board and the Board of Directors of Brothers of Mercy.Mr. Redman joined FHLBNY member Astoria Bank (formerly Astoria Federal Savings and Loan Association) in 1977 and during his tenure served in various accounting, investment and treasury positions, including Executive Vice President and Chief Financial Officer and Chief Operating Officer, ultimately serving, beginning in July 2011, as President and Chief Executive Officer and a Director of Astoria Bank and its holding company, Astoria Financial Corporation. On October 2, 2017, Astoria Financial Corporation merged into Sterling National Bancorp and Astoria Bank merged into FHLBNY member Sterling National Bank, and Mr. Redman joined both Sterling Bancorp and Sterling National Bank’s Board of Directors until he retired from their Boards in May 2018. A Magna Cum Laude graduate of New York Institute of Technology (NYIT) with a degree in accounting, Mr. Redman also serves as a member of NYIT’s Board of Trustees. Mr. Redman has provided leadership to several professional banking organizations. In addition to previously serving as the President of the Nassau/Suffolk Chapter of the Financial Managers Society, he is a former instructor and chapter officer of the Institute of Financial Education, a prior member of the Accounting and Tax Committee of the Community Bankers Association of New York State and a former Director of the New York State Bankers Association. Mr. Redman is also a Director and former Chairman of the Board of the Tourette Association of America which under his leadership has helped influence legislation, furthered education and supported cutting-edge research. His work in the community has been recognized by such organizations as St. Francis College, Variety Child Learning Center, Quality Services for the Autism Community, Queens Botanical Garden, Queens Council Boy Scouts of America, Queens Theatre in the Park, Queens Chamber of Commerce, The Safe Center LI, SCO Family of Services and the American Heart Association.Rev. Reed is the founder and CEO of GGT Development LLC, a company which started in May of 2009. The strategic plan of the corporation focuses on the successful implementation of housing and community development projects, including affordable housing projects, schools, and multi-purpose facilities. Additionally, he pastors a church which has a feeding program of more than ten thousand monthly. He has been involved in development projects totaling more than $125 million. He also is co-owner of Safonique, a natural laundry detergent, that is sold on the east coast in Wal-Mart, Shoprite and on Amazon.com. As a community developer, he is engaged primarily in uplifting communities by serving the elderly, community revitalization and accessing programs that will provide a foundation for growth. He formerly served as Chief Executive Officer of the Greater Allen Development Corporation from July 2007 through March 2009, and previously was the Chief Financial Officer of Greater Allen AME Cathedral, located in Jamaica, Queens, New York, from 1996 to July 2007. From 1996 to 2009, Rev. Reed was responsible for building and securing financing for over $60 million of affordable, senior, and commercial development projects. At GGT Development LLC, Rev. Reed continues a focus on broad based neighborhood revitalization affordable housing projects, mixed use commercial/residential projects, and other development opportunities. In 1986, Rev. Reed served as the campaign manager for Rev. Floyd H. Flake. From 1987 to 1996, Rev. Reed served as the Congressional Chief of Staff for Congressman Flake and was involved in the legislative process and debate during the formation of FIRREA. Prior to becoming involved in public policy, Rev. Reed managed the $6 billion liquid asset portfolio for General Motors and was a financial analyst for Chevrolet, Oldsmobile, Pontiac, Cadillac, Buick and GM of Canada. Rev. Reed gained his initial financial experience as a banker at First Tennessee Bank in Memphis, Tennessee. Rev. Reed earned a Masters of Business Administration from Harvard Business School, a Bachelor of Business Administration from Memphis State University and a Masters of Divinity at Virginia Union University. He served on the following organizations in the following positions: Board of Trustees, Hofstra University; Secretary/Treasurer, Outreach Project; and Board Member, Wheelchair Charities. Rev. Reed pastors Morris Brown AME Church in Queens New York. Rev. Reed’s experience in representing community interests in housing, as indicated by his background described above, supported his qualifications to serve on our Board as an Independent Director and public interest director.TC3Tompkins Cortland Community College Foundation. In taking action to place Mr. Romaine on the Board to fill a vacant Member Directorship, the Board took into account, besides the regulatory qualification requirements for the Directorship, the nature of his experience in the financial industry and at FHLBNY member institutions.dfree®dfree® strategy teaches people how to break free from debt. In 2011, Dr. Soaries wrote his first book: “dfree®“dfree®: Breaking Free from Financial Slavery” (Zondervan), which highlights his top 12 keys to debt-free living. Dr. Soaries currently serves as an Independent Director at Independence Realty Trust, a position he has held since February 2011. In January 2015, he became aan Independent Director of Ocwen Financial Corporation. He is chair of the Compensation Committees at both public companies. Dr. Soaries earned a Bachelor of Arts Degree from Fordham University, a Master of Divinity Degree from Princeton Theological Seminary, and a Doctor of Ministry Degree from United Theological Seminary. Dr. Soaries resides in Monmouth Junction, New Jersey with his wife, Donna, and twin sons. Dr. Soaries’ project development experience, as indicated by his background described above, supports his qualifications to serve on our Board as an Independent Director and a public interest director.Banco Popular North America (BPNA)Bank (PB). Popular Inc. is a NASDACNASDAQ listed and SEC registered company (ticker: BPOP), presently the 41st largest financial holding company in the United States with assets over $45$52 billion, principally supervised by the Federal Reserve Bank of NY. From 2010 to 2014, Mr. Vázquez served as President of BPNA.PB. Mr. Vázquez joined Popular, Inc. as Executive Vice President in March 1997 to establish and head Popular’s first-ever Risk Management Group, which included the Credit Risk Management, Audit, Corporate Compliance, Operational Risk Management, and the Risk Management MIS Divisions. From 2004 through 2010 he headed Popular’s Consumer Lending Group for Puerto Rico, responsible: forresponsible for: personal loans, credit cards, overdraft lines-of-credit, the mortgage origination and servicing business via Popular Mortgage; as well as the auto, marine and equipment financing business via Popular Auto. Before joining Popular, Inc., Mr. Vázquez spent fifteen years in a variety of corporate finance, capital markets and banking positions with JP Morgan & Co. Inc. During the two years prior to his joining Popular, Inc., he was Senior Banker and Region Manager for JP Morgan’s business in Colombia, Venezuela, Central America and the Caribbean. Mr. Vázquez serves as Senior Executive Vice President of BPPR. He is also an Executive Vice President of Popular Inc.;Popular; a member of Popular Inc.’sPopular’s Senior Management Council; as welland serves as a member of itsPopular’s Credit Strategy Committee and the head of its Asset & Liability Management Committee. In addition, he is a member of the Board of Directors of Banco Popular de Puerto Rico, Banco Popular North America,BPPR, PB, Popular Securities Inc. and Vice Chairman of the Banco Popular Foundation. He also serves on the national Board of Directors of Operation Hope, a national non-for-profit focusing on financial literacy. Finally, he is a member of the Advisory Committee to the Dean of the School of Engineering at his alma matter, the Rensselaer Polytechnic Institute. Previously, Mr. Vázquez served as a member of the board of directors for the Puerto Rico Community Foundation, the largest community foundation in the Caribbean; where he headed the Audit and Investment Committees. He was a director of Teatro de la Opera, a non-for-profit entity dedicated to the promotion of opera. He also contributed to various educational institutions in Puerto Rico, serving as a member of the board of trustees of the Saint John’s School and a member of the Development Committee for Colegio San Ignacio de Loyola. Mr. Vázquez holds a Bachelor of Science in Civil Engineering, with an economics minor, from the Rensselaer Polytechnic Institute, Troy, New York; from which he graduated on the Dean’s List and as a member member of the Puerto Rico State Insurance Fund Corporation and of the Puerto Rico Health Insurance Administration, and she presided over the board of the Puerto Rico Automobile Accident Compensation Administration. She was also a member of various committees of the National Association of Insurance Commissioners.Commissioners and also a member of the Association of Latin American Insurance Superintendents Association. Ms. Weyne’s accomplishments during her 40 years of experience in the insurance sector, which started as an actuary in the Office of the Commissioner of Insurance, have included management ofpresiding a premium finance company, management of a claims adjusting firm, a managing general agent of which she later became owner, and presidencies of both life and ofdisability and property and casualty companies and the presidency of the largest bank owned insurance agency in Puerto Rico. She was also president of the first reinsurance company incorporated in Puerto Rico and served as president of two health maintenance organizations. Ms. Weyne received her bachelor’s degree in mathematics from the University of Puerto Rico.Rico, where she also taught mathematics. Among the entities where she has served as a board member are the Puerto Rico Chamber ofand the Trust of the Supreme Court of Puerto Rico, the Puerto Rico Chapter of the World Presidents Organization as well as the Tourism Scholarship Foundation and the School of Architecture of the University of Puerto Rico. She has also received numerous awards and recognitions such as the Top Management Award from the Sales and Marketing Association of Puerto Rico, Outstanding Woman in Business Award from the Puerto Rico Chamber of Commerce, Outstanding Woman Award from the Girl Scouts of America, and Successful Woman of the Year Award from El Nuevo Dia Newspaper. She was also named National Judge for the Ernst & Young Entrepreneur of the Year Award program. Presently, Ms. Weyne is a consultant and serves as a member of the advisory board of Rafael J. Nido, Inc,Inc., and as a member of the board of directors of Friends of El Yunque Foundation and of MMM Foundation. Ms. Weyne’s organizational and financial management experience, as indicated by her background described above, supports her qualifications to serve on our Board as an Independent Director.20182019 and as of the date of this annual report. We have determined that our executive officers are those officers who are members of our internal Management Committee. All officers are “at will” employees and do not serve for a fixed term.21/1921/20196460515756*CIO & Head of Enterprise Services60456061Senior Vice President, Head of Affordable Housing and Community Investment 63 06/01/10 10/01/19 Michael L Radziemski***** Senior Vice President, Chief Information Officer 58 07/15/19 01/01/20 Philip A. Scott 60Senior Vice President, Head of Bank Operations 52 12/22/86 10/01/19 Jonathan R. West 63 05/01/15 05/01/15 *Retired from position 3/29/19. 62**Left employment 1/8/93; rehired 5/10/93. Held the CIO position until 12/31/19. Will retire from current position on 3/31/20. 05/01/15***Retired from position 9/30/19. 05/01/15****MC Member as of 10/1/19. *****MC Member as of 1/1/20. ******Left employment 7/25/98; rehired 10/23/06. MC Member as of 10/1/19. *Left employment 1/8/93; rehired 5/10/93.Relations.Relations and served in that role until his retirement at the end of the first quarter of 2019. From January 1985 through January 1993, he was a senior officer at the U.S. Department of Housing and Urban Development; during this time he served as Special Assistant to the Deputy Secretary from 1990 to 1993. Mr. Amig has also served as a legislative aide to the President Pro Tempore of the Pennsylvania Senate and was the Executive Director of the Federal/State Relations Committee of the Pennsylvania House of Representatives. Mr. Amig received his undergraduate degree in Political Science from Albright College (Reading, PA).operations, and heoperations. He is also responsible for providing support to the Audit Committee of the Bank’s Board of Directors, in connection with matters related to internal controls. Mr. Angelo was appointed to the Management Committee in July 2016. Mr. Angelo holds an M.B.A. in Finance and a B.S. in Accounting, both from New York University’s Stern School of Business. He is a Certified Public Accountant and is a member of the AICPAAmerican Institute of CPAs and NYSSCPAthe New York State Society of CPAs as well as the Institute of Internal Auditors. Mr. Angelo began his career as an associate auditor with Coopers & Lybrand, and then held positions of increasing responsibilities in internal audit roles at Bankers Trust Company and Bear, Stearns & Co.practice.practice and serves as the Bank’s Compliance Officer. This role encompasses Financial Risk Management and Credit Risk Analytics; Credit Policy and Review; Model Risk Management; Technology Risk; and Compliance. She also chairs the Bank’s internal Enterprise Risk Committee. Ms. Feinberg joined the Bank in October 2011 as the Director of Finance. In that capacity, she was responsible for all aspects of the Bank’s finance functions, including advisory on business initiatives, funding and investment decisions, capital planning, tax and regulatory issues, etc. Ms. Feinberg began her career as a CPA with Ernst & Young, and then held positions of increasing responsibilities in accounting and finance roles at three investment banks, namely, JP Morgan Chase, HSBC and Goldman Sachs over the course of 18 years. She earned an M.B.A. in Finance from Drexel University and a B.S. in Accounting from The College of NewAICPA.the PRMIA Market, Liquidity and Asset Liability Management Risk Leader Group.directsdirected and overseesoversaw all of the Bank’s technology functions and Bank programs for information security, project management, records management, vendor management and business continuity. He iswas also Chairman of the Bank’s internal Operational Risk Committee.Committee from 2011 through 2019. Mr. Fusco has been with the Bank since March 1987. During his 31-year33 year tenure, he has held various management positions in Information Technology, including IT Director starting in 2000 and Chief Technology Officer starting in 2006. Mr. Fusco received an undergraduate degree from the State University of New York at Stony Brook. He has earned numerous post-graduate technical and management certifications throughout his career, and is a graduate of the American Bankers Association National Graduate School of Banking. Prior to joining the Bank, Mr. Fusco held positions at Citicorp and the Federal Reserve Bank of New York. In 2019, Mr. Fusco announced plans to retire from the Bank at the end of the first quarter of 2020. As part of the transition plan, he relinquished the CIO position at end of 2019 and will serve as the Special Advisor to the CEO until his retirement.Finance®Finance® Program and Member Service Desk. Mr. Goldstein previously served as the Head of Sales, Business Development and Marketing. Mr. Goldstein joined us in June 1997 and has held a number of key positions in our business areas. He has been a member of the FHLBNY’s Management Committee since 2008. He serves on many of the FHLBNY’s internal Committees and chairscreated the Products, Services and Membership Committee. He is also actively involved in the FHLBNY’s Strategic Planning process, where he assists with the development and implementation of the strategic plan and new initiatives. He speaks at a variety of trade conventions and conferences and also provides training for regulatory agencies and bond investors. In addition to an undergraduate degree from the SUNY College at Oneonta and an M.B.A. in Financial Marketing from SUNY Binghamton University, Mr. Goldstein has received post-graduate program certifications in Business Excellence from Columbia University, in Management Development from Cornell University, in Management Practices from New York University, and in Finance from The New York Institute of Finance.Finance and in Management Excellence from Harvard University. He is also a trustee on the Board of the Kennedy Child Study Center and Chairman of their Audit Committee.2015.2015, a role he held until he retired from the FHLBNY in September of 2019. In this role, he overseesoversaw several functions, including Credit and Correspondent Services, Collateral Services and Community Investment/Affordable Housing Operations. Prior to this, he was Head of Member Services from 2004 to 2015. Mr. Héroux joined the Bank in 1984 as a Human Resources Generalist and served as the Director of Human Resources from 1988 to 1990. During his tenure, he has held other key positions including Chief Credit Officer and Director of Financial Operations. He received an undergraduate degree from St. Bonaventure University and is a graduate of the Columbia Senior and Asset Liability Modeling and Strategy functions. He has held several positions with strategic planning, finance and administrative responsibilities since joining us in April 2001. Immediately prior to becoming the CFO, Mr. Neylan was the Head of Strategy and Finance, and served as the Head of Strategy and Business Development from January 2009 through December 2011. Mr. Neylan had approximately twenty years of experience in the financial services industry prior to joining the Bank, and was previously a partner in the financial services consulting group of one of the Big Four accounting firms. He holds an M.S. in corporate strategy from the MIT Sloan School of Management and a B.S. in management from St. John’s University (NY).Mr. West is a Member of the American Bar Association, and serves on its business law committee and its derivatives, futures and securitizations section.In accordance with correspondence from the Office of Chief Counsel of the Division of Corporation Finance of the U.S. Securities and Exchange Commission dated August 26, 2005, Directors, officers and 10% stockholders of the Bank are exempted from Section 16 of the Securities Exchange Act of 1934 with respect to transactions in or ownership of Bank capital stock.20182019 through the date of the filing of this annual report on Form 10-K, the members of the Audit Committee included: Jay M. Ford (Chair)(Chair through December 31, 2019), Kevin Cummings (Vice Chair)Chair through December 31, 2019 and Chair commencing January 1, 2020), David R. Huber (Vice Chair commencing January 1, 2020), Joseph R. Ficalora, Thomas L. Hoy, David R. Huber (commencing January 1, 2019), Christopher P. Martin, and Ángela Weyne.Kevin CummingsDavid R. Huber of the FHLBNY’s Audit Committee qualifies as an “audit committee financial expert” under Item 407 (d) of Regulation S-K but was not considered “independent” as the term is defined by the rules of the New York Stock Exchange.S-K.ITEM 11.EXECUTIVE COMPENSATION.Item 11. Executive Compensation. AboutThis section describes and analyzes the Bank’s Mission2019 compensation program for our “named executive officers” (“NEOs”). Our NEO’s include ourchief executive officer, chief financial officer and our other most highly-compensated executive officers who were serving as executive officers on December 31, 2019. The Bank’s named executive officers during 2019 are identified as: 1) JoséR. González (President and Chief Executive Officer); 2) Kevin M. Neylan (Senior Vice President and Chief Financial Officer); 3) Melody Feinberg (Senior Vice President and Chief Risk Officer); 4) G. Robert Fusco (Senior Vice President, Chief Information Officer and Head of Enterprise Services); 5) Phillip Scott (Senior Vice President and Chief Capital Markets Officer); and 6) Paul B. Héroux (Former Senior Vice President and Chief Banking Operations Officer).a) Compensation & Human Resources Committee Oversight of Compensation 1. Review and recommend to the Board changes regarding our compensation and benefits programs for employees and retirees; 2. Review and approve individual performance ratings and related merit increases for our Chief Executive Officer and for the other Management Committee members (which Committee includes all the NEOs of the Bank; 3. Review salary adjustments and benefits for Chief Executive Officer and for the other Management Committee members; 4. Review and approve annually the Bank’s Incentive Compensation Plan (“Incentive Plan”), year-end Incentive Plan results and Incentive Plan award payouts for Management Committee members; 5. Advise the Board on compensation, benefits and human resources matters affecting Bank employees; 6. Review and discuss with Bank management the Compensation Discussion and Analysis (“CD&A”) to be included in our Form 10-K and determine whether to recommend to the Board that the CD&A be included in the Form 10-K; and 7. Review and monitor compensation arrangements for our executives so that we continue to retain, attract, motivate and align quality management consistent with the investment rationale and performance objectives contained in our annual business plan and budget, subject to the direction of the Board. b) Regulatory Oversight of Executive Compensation • Executive compensation must be reasonable and comparable to that offered to executives in similar positions at other comparable financial institutions; • Executive incentive compensation should be consistent with sound risk management and preservation of the par value of the FHLBank's capital stock; • A significant percentage of an executive's incentive-based compensation should be tied to longer-term performance and outcome indicators; • A significant percentage of an executive's incentive-based compensation should be deferred and made contingent upon performance over several years; and • The FHLBank's board of directors should promote accountability and transparency in the process of setting compensation. c) About the Bank’s Mission Federal Home Loan Bank of New York (“Bank”, or “we”, “us” or “our”) is to advance housing opportunity and local community development by maximizing the capacity of its community-based member-lenders to servesupporting members in serving their markets.Achieving the Bank’s Mission In this regard, as of December 31, 2018 we employed 314 employees, a relatively small workforce for a New York City-based financial institution that had, as of that date, $144.4 billion in assets. Exempt employees constituted 95% of all employees as of year-end 2018.Compensation & Human Resources Committee Oversight of CompensationCompensation is a key element in attracting, motivating and retaining talent. In this regard, it is the role of the Compensation & Human Resources Committee (“C&HR Committee”) of the Board of Directors (“Board”) to:1. Review and recommend to the Board changes regarding our compensation and benefits programs for employees and retirees;2. Review and approve individual performance ratings and related merit increases for our Chief Executive Officer and for the other Management Committee members (which Committee includes all Named Executive Officers of the Bank (the “NEOs”));3. Review salary adjustments for Chief Executive Officer and for the other Management Committee members;4. Review and approve annually the Bank’s Incentive Compensation Plan (“Incentive Plan”), year-end Incentive Plan results and Incentive Plan award payouts for Management Committee members;5. Advise the Board on compensation, benefits and human resources matters affecting Bank employees;6. Review and discuss with Bank management the Compensation Discussion and Analysis (“CD&A”) to be included in our Form 10-K and determine whether to recommend to the Board that the CD&A be included in the Form 10-K; and7. Review and monitor compensation arrangements for our executives so that we continue to retain, attract, motivate and align quality management consistent with the investment rationale and performance objectives contained in our annual business plan and budget, subject to the direction of the Board.The Board has delegated to the C&HR Committee the authority to approve fees and other retention terms for: i) any compensation and benefits consultant to be used to assist in the evaluation of the Chief Executive Officer’s compensation; and ii) any other advisors that it shall deem necessary to assist it in fulfilling its duties. The Charter of the C&HR Committee is available in the Corporate Governance section of our web site located at www.fhlbny.com. The role of Bank management (including Executive Officers) with respect to compensation is limited to administering Board-approved programs and providing proposals for the consideration of the C&HR Committee. No member of management serves on the Board or any Board committee.Regulatory Oversight of Executive CompensationThe Federal Housing Finance Agency (“Finance Agency”) has oversight authority over FHLBank executive officer compensation. Section 1113 of the Housing and Economic Recovery Act of 2008 requires that the Director of the Finance Agency prohibit an FHLBank from paying compensation to its executive officers that is not reasonable and comparable to that paid for employment in similar businesses involving similar duties and responsibilities. In connection with this statutory responsibility, the Finance Agency issued final rules on executive compensation and golden parachute payments relating to the regulator’s oversight of such compensation and payments located at 12 CFR Parts 1230 and 1231.In addition to these rules, the Finance Agency previously issued Advisory Bulletin 2009-AB-02 regarding principles for FHLBank executive compensation as to which the FHLBanks are expected to adhere in setting executive compensation policies and practices. The Finance Agency also previously issued certain protocols for the review of proposed FHLBank compensation actions pertaining to Named Executive Officers (“NEOs”).The Bank is exempt from SEC proxy rules and as such does not provide shareholder advisory “say on pay” votes regarding executive compensation.How We Stay Competitive in the Labor Marketd) Our Compensation Policy as offor all compensation decisions effective January 20182019 through December 2019 include the following:·· The Bank will focus on Regional/Commercial Banks $20B+ in assets within the Metro New York Market (where available) as the “Primary Peer Group” for benchmarking at the 50th percentile of the market total compensation (base pay + incentive compensation) for establishing competitive pay levels. · The Bank will use other Federal Home Loan Banks as a “Secondary Peer Group” for benchmarking at the 75th percentile of the market total compensation for establishing competitive pay levels. · Use publicly available data from Regional/Commercial Banks $5-20B in assets for the five NEOs at the 50th percentile of market total compensation (base pay + incentive compensation) for establishing competitive pay levels. · For jobs within Risk Management and Capital Markets and other specialty areas not in ready supply within the Regional Banks, the Bank will use a customized peer group of Banks with $50B+ in assets including Bulge Bracket banks (i.e. large and global financial firms) at the 25th and 50th percentile to reflect realistic recruiting pressures in the Metro New York market. · Bank Management Committee members will be matched one position level down versus Commercial/Regional Banks, and Officers and below will be matched against ‘level-for-level’ jobs versus other Federal Home Loan Banks and the publically available proxy data. · A commitment to conduct detailed cash compensation benchmarking for approximately one-third of officer positions each year. · A commitment to evaluate the value of total compensation delivered to employees including base pay, incentive compensation, retirement and health and welfare benefits (“Total Rewards Study”) in determining market competitiveness every third year. market total2018 Total Rewards Study discussed in Section II below which impacts compensation (base pay + incentive compensation) for establishing competitive pay levels.·decisions made in the fourth quarter 2019 through the date of this filing. The Bank will use other Federal Home Loan Banks as a “Secondary Peer Group” for benchmarking at the 75th percentilemajor components of the market total compensation for establishing competitive pay levels.· Use publicly available data from Regional/Commercial Banks $5-$20B in assets forCompensation Policy changes include the five NEOs at the 50th percentile of market total compensation (base pay + incentive compensation) for establishing competitive pay levels.· For jobs within Risk Management and Capital Markets and other specialty areas not in ready supply within the Regional Banks, the Bank will use a customized peer group of Banks with $50B+ in assets including Bulge Bracket banks (i.e. large and global financial firms) at the 25th and 50th percentile to reflect realistic recruiting pressures in the Metro New York market.· Bank Management Committee members will be matched one position level down versus Commercial/Regional Banks, and Officers and below will be matched against ‘level-for-level’ jobs versus other Federal Home Loan Banks and the publically available proxy data.· A commitment to conduct detailed cash compensation benchmarking for approximately one-third of officer positions each year.· A commitment to evaluate the value of total compensation delivered to employees including base pay, incentive compensation, retirement and health and welfare benefits (“Total Rewards Study”) in determining market competitiveness every third year.following:· The Bank will benchmark NEOs and Management Committee positions against “like-for-like” position at Regional/Commercial Banks of $20-$65B in assets; · “Secondary Peer Group” will be benchmarked at the 75th percentile or higher; · Custom analysis will be utilized for certain Risk, Capital Markets and other Specialty Areas to account for the limited availability and concentration of talent within the largest financial firms typically located in New York; and · Include other Federal Home Loan Banks and Bulge Bracket banks (i.e. large and global financial firms) as a secondary comparator group. · Geographical area — The New York metropolitan area is a highly-competitive market for talent in the financial disciplines; a) Geographical area — The New York metropolitan area is a highly-competitive market for talent in the financial disciplines;· Cost of living — The New York metropolitan area has a high cost of living that may require compensation premiums for some positions, particularly at more junior levels; and · Availability of/demand for talent — Recruiting critical positions with high market demand typically requires a recruiting premium to entice an individual to change firms. b)II. Cost of living — The New York metropolitan area has a high cost of living that may require compensation premiums for some positions, particularly at more junior levels; andc) Availability of/demand for talent — Recruiting critical positions with high market demand typically requires a recruiting premium to entice an individual to change firms.(“IC“IC Plan”)); (b) retirement-related benefits (i.e., the Qualified Defined Benefit Plan (“DB Plan”); the Qualified Defined Contribution Plan (“DC Plan”); the Nonqualified Defined Benefit Component of the Amended and Restated Supplemental Executive Retirement Defined Benefit and Defined Contribution Benefit Equalization Plan (“DB BEP”), the Nonqualified Defined Contribution Component of the Amended and Restated Supplemental Executive Retirement Defined Benefit and Defined Contribution Benefit Equalization Plan (“DC BEP”), and the Nonqualified Deferred Incentive Compensation Plan (“NDICP”); and (c) health and welfarelife and disability insurance programs and other benefits which are listed in Section IV C below. These components, along with certain benefits described in the next paragraph, comprised the elements of our total compensation program and are discussed in detail in Section IV below.This CD&A provides information relatedavailable to the total compensation program provided to our NEOs for 2018 — that is, our Principal Executive Officer (“PEO”), Principal Financial Officer (“PFO”) and the three most highly-compensated executive officers other than the PEO and PFO. The information includes, among other things, the objectives of the total compensation program and the elements of compensation provided to our NEOs. These compensation programs are not exclusive to the NEOs; they also apply to employees, as explained throughout the CD&A.I. Objectives of the total compensation programall employees. (described above) are to help motivate employees to achieve consistent and superior results, taking into account prudent risk management, over a long period of time. We also provide a program that allows us to compete for and retain talent that otherwise might be lured away.a) 2018 Total Rewards Study Results every third year after the date we complete the final implementation of Board-approved total compensation program design changes.II. The total compensation program is designed to reward for performance and employee longevity, to balance risk and returns, and to compete with compensation programs offered by our competitorsThe total compensation program is designed to attract, retain and motivate employees and to reward employees based on overall performance achievement as compared to the goals and individual employee performance. We also strive to ensure that our employees are compensated fairly and consistent with employees in our peer group.All of the elements of the total compensation program are available to all employees, including NEOs, except with respect to: 1) the IC Plan; 2) the DB BEP; 3) the DC BEP; 4) the NDICP; and 5) Non-qualified Profit Sharing Plan.All exempt (non-hourly) employees are eligible to receive annual incentive awards through participation in the Incentive Plan. These awards are based on a combinationcontext of Bank performance resultsrecruitment and individual performance results. The better the Bank and/or the employee perform, the higher the employee’s potential award is likely to be, up to a predetermined limit. In addition, the better the employee’s performance, the greater the employee’s annual salary increase is likely to be, up to a predetermined limit. Participation in the Deferred Incentive Compensation Plan is mandatory for members of the Bank’s Management Committee which include NEOs.We are prohibited by regulations from offering equity-based compensation and the Bank cannot make incentive compensation payments (i.e., Total Communicated Award) which are greater than 100% of the employee’s base salary for that plan year. However, many of the firms in our peer groups do offer equity-based compensation or incentive compensation that exceeds 100% of base salary. Our total compensation program takes into account the existence of these other types of compensation by offering a defined benefit and defined contribution plan to help effectively compete for talent. Senior and mid-level employees are generally long-tenured and would not want to endanger their pension benefits by inappropriately increasing risk to the Bank to achieve a short-term financial gain.We do not structure any of our compensation plans in a way that inappropriately encourages risk taking. As described in Section IV.A.2. below, the rationale for having the equally-weighted Bank wide goals of Return and Risk within the Incentive Plan is to motivate management to take a balanced approach to managing risks and returns in the course of managing the business, while at the same time ensuring that we fulfill our mission. In addition, Incentive Plan participants employed in the Risk Management Group have a higher weighting on the “Risk” component of the Business Effectiveness goal category than Incentive Plan participants that are not employed in the Risk Management Group. Risk Management Group participants have a 40% weighting on the “Risk” Goal portion and the remaining at 30% for a total Business Effectiveness weighting of 70%.In addition, the DB and DC Plans are designed to reward employees for continued strong performance over their careers — that is, the longer an employee works at the Bank, the greater the benefit the employee is likely to accumulate. This combined with the compensation philosophy and the structure of the compensation programs helps to ensure that the compensation paid to employees at termination of employment is aligned with the interest of our shareholders.III. The elements of total compensationPlease refer to the introduction section under the heading “The Total Compensation Program” for an explanation of the components that make up our total compensation program.IV. Explanation of why we provide each element of total compensationOur Compensation PolicyThe Compensation Policy was established to help identify the Bank’s peer group that it competes against for talent; to benchmark jobs; and serve as the basis for analyzing the competitiveness of compensation and benefit programs to help ensure alignment with the marketplace.Beginning in 2014, the Bank began to experience the impact of the improvement in the economy and financial markets with an increase in turnover for certain positions in risk management, information technology and otherareas. The Bank continues to be challenged in attracting replacements who meet our job requirements and that would accept a position within the Bank’s compensation structure. The Bank’s compensation structure is based on its history as a Government Sponsored Enterprise even though some Bank positions require skill sets similar to those required in Wall Street firms. In addition, as a wholesale bank the Bank manages large and complex risks with a small employee population within one of the most expensive geographic locations in the United States.In certain cases, the Bank discovered that our current pay scales for a position were not allowing us to recruit the talent that we needed. As a result, McLagan, a compensation benchmarking consultant was engaged to explore options that would help with the retention and recruitment of employees in high demand areas and to help ensure that our compensation structure is not negatively affected by these atypical hiring pay packages.In alignment with McLagan’s recommendations, the Board approved changes to our Compensation Policy in September 2015. The Board-approved Compensation Policy is outlined above. Please refer to the Introduction section under the heading “How We Stay Competitive in the Labor Market” for an explanation of the Bank’s Board-approved Compensation Policy.It should be noted that, due to the fact that we conduct detailed cash compensation benchmarking for only one-third of the officer positions on an annual basis with respect to cash compensation, the effectiveness of the benchmarking program can be demonstrated only once every three years. However, NEOs are benchmarked every year.Compensation BenchmarkingPlease refer to the introduction section under the heading “Regulatory Oversight of Executive Compensation” for an explanation of how the Finance Agency provides oversight of executive compensation.The following is an explanation of why we provide each element of compensation.A. Cash Compensation1. Base PayThe goal of offering competitive base pay is to make the Bank successful in attracting, motivating and retaining the talent needed to execute the business strategies.In addition to the benchmarking process provided for in the Compensation Policy as described above, a performance-based merit increase program exists for all employees, including NEOs, that have a direct impact on base pay. Generally, employees receive merit increases on an annual basis. Such merit increases are based upon the achievement of a performance rating of “Outstanding,” “Exceeds Requirements,” or “Meets Requirements” on individual performance evaluations. Merit guidelines are determined each year and distributed to managers. These guidelines establish the maximum merit increase percentage permissible for employee performance during that year.In November of 2017, the C&HR Committee determined that merit-related officer base pay increases for 2018 would be 2.50% for officers rated “Meets Requirements”; 3.25% for officers rated “Exceeds Requirements”; and 4.25% for officers rated “Outstanding” for their performance in 2018.To comply with the Finance Agency requirement that the FHLBanks submit all compensation actions involving a NEO to the Finance Agency for review at least four weeks in advance of any planned board of directors’ decision with respect to those actions, we submitted the proposed merit increase percentages for 2019 performance for the NEOs in November of 2018. In addition, to help support the proposed merit increases, the Finance Agency requires that a compensation benchmarking analysis be submitted. The analysis was performed by McLagan and indicated that the salary increases for the NEOs were consistent with the factors included within the Board-approved Compensation Policy described above in the “Introduction” section under the heading “How We Stay Competitive in the Labor Market”.The peer groups in establishing competitive market pay for 2018 were: 1) Commercial Banks including former “bulge bracket” investment banks (global investment banks were specifically excluded); 2) Federal Home Loan Banks; and 3) Publicly-available proxy data for banks with assets between $10B and $20B. Please refer to the Introduction Section under the heading “How We Stay Competitive in the Labor Market” for an explanation of the components that make up our Compensation Policy.McLagan also used salary rank from the proxies from publicly-traded banks. Salary rank compares a firm’s top paid incumbents against the market’s top paid incumbents regardless of position.Per the Bank’s Compensation Policy, McLagan used median data as the initial benchmark statistic for commercial banks and proxy benchmarks and the high quartile is used for the Federal Home Loan Bank system benchmarks. Higher/lower benchmark statistics were used to account for larger/smaller responsibilities. The value of retirement plans and other benefits, including the defined benefit pension plans were not represented in this analysis and was addressed in the total compensation review, as discussed in the Introduction Section under the heading “How We Stay Competitive in the Labor Market”.For the year 2018, McLagan used for compensation benchmarking analysis purposes the Compensation Policy that was approved by the Board in September 2015 (details of which are provided above). Please refer to the introduction section under the heading “The Total Compensation Program” for an explanation of the components that make up our total compensation program.We received a “non-objection” letter from the Finance Agency with respect to the payment of merit increases (effective January 1, 2018) for the NEOs, which letter was based upon the results of compensation benchmarking analysis of McLagan.A representative list of the peer group that was used in the compensation benchmarking analysis, excluding all healthcare and welfare benefits analysis, is set forth in the table below.Market Data Participants — Commercial Banks and FHLBanks used for 2018 market pay analysis:ABN AMRODZ BankMUFG SecuritiesAgricultural Bank Of ChinaFannie MaeNational Australia BankAIBFederal Reserve Bank of AtlantaNatixisAlly Financial Inc.Federal Reserve Bank of BostonNew York Community BankAustralia & New Zealand BankingFederal Reserve Bank of ChicagoNord/LB GroupBanco Bilbao Vizcaya ArgentariaFederal Reserve Bank of ClevelandNordea BankBanco Itaú UnibancoFederal Reserve Bank of Kansas CityNorinchukin Bank, New York BranchBank HapoalimFederal Reserve Bank of MinneapolisNorthern Trust CorporationBank of America Merrill LynchFederal Reserve Bank of New YorkPeople’s United Bank, National Assoc.Bank of New York MellonFederal Reserve Bank of RichmondPNC BankBank of Nova ScotiaFederal Reserve Bank of San FranciscoRabobankBank of the WestFederal Reserve Bank of St LouisRegions Financial CorporationBank of Tokyo - Mitsubishi UFJFifth Third BankRoyal Bank of CanadaBayerische LandesbankFirst Citizens BankSantander Bank, NABBVA CompassFirst Republic BankSociete GeneraleBMO Financial GroupFNB OmahaStandard Chartered BankBNP ParibasFreddie MacState Street CorporationBOK Financial CorporationGE CapitalSumitomo Mitsui Banking CorporationBranch Banking & Trust Co.Hancock BankSumitomo Mitsui Trust BankBrown Brothers HarrimanHSBCSunTrust BanksCapital OneHuntington Bancshares, Inc.SVB Financial GroupCharles Schwab & Co.Industrial and Commercial Bank of ChinaSynchrony FinancialChina Construction BankINGSynovusCIBC World MarketsIntesa SanpaoloTCF National BankCIT GroupInvestors Bancorp, Inc.TD AmeritradeCiti Global Consumer GroupJP Morgan Commercial BankTD SecuritiesCitigroupJP Morgan Corporate SectorTexas Capital BankCitizens Financial GroupJPMC Consumer & Community BankingThe PrivateBankCity National BankKBC BankUMB Financial CorporationComericaKeyCorpUmpqua Holding CorporationCommerzbankLandesbank Baden-WuerttembergUniCredit Bank AGCommonwealth Bank of AustraliaLloyds Banking GroupU.S. BancorpCrédit Agricole CIBM&T Bank CorporationValley National BankCredit Industriel et Commercial — N.Y.Macquarie BankWebster BankCullen Frost Bankers, Inc.Mizuho BankWells Fargo BankDBS BankMizuho Capital MarketsWestpac Banking CorporationDnB BankMizuho Trust & Banking Co. (USA)Zions Bancorporation2018 Total Rewards Studyretention.topexperienced compensation and benefits consulting firms that resulted in the C&HR Committee engaging Towers as the compensation and benefits consultant to perform the review.The compensation and benefits consultant was instructed by the C&HR Committee to: (i) determine how the compensation and benefit programs and level of rewards were compared to and aligned with the market; (ii) determine the optimal mix of compensation and benefits; and (iii) determine if there were alternative benefit structures that should be considered. The compensation and benefits consultant was informed of our continued desire to attract, motivate and retain talented employees.During the review process the compensation and benefits consultant was asked to identify peer groups for “benchmarking” purposes to conduct the Total Rewards study (that is, for purposes of comparing levels of benefits and compensation). Representatives from the compensation and benefits consulting firm met with the Chair and Co-Chair of the C& HR Committee to solicit feedback on the Bank’s Compensation Policy. The compensation and benefits consultant weighed a number of factors in order to arrive at the selection of a peer group. Among the factors considered were firms that were either business competitors or labor market competitors (focusing attention on firms either headquartered or having major offices in the same or similar geographic markets), and firms similar in size (assets, revenues and employee population). Through the compensation and benefits consultant’s experience working with other Federal Home Loan Banks and through direct interviews with the senior management, the compensation and benefits consultant identified the current and future skill sets needed to meet the business objectives and also noted the firms that we tend to hire employees from and lose employees to.as described below.set forth above.2018 Total Rewards Study ResultsThe compensationFor the health and benefits consultant’s reviewwelfare component, Towers used their Benefits/Value (“BenVal”) methodology to determine the value of the Bank’s Compensation Policy was presented to the Board in September 2018. The results of the review indicated:· Using total cash compensation (base + short-term incentives) as the primary comparison for the Bank’s level of compensation is appropriate for establishing compensation levels;· Including larger financial services/banks in FHLBNY’s comparator groups would provide a more realistic view of the Bank’s talent market;· The current approach to comparator organizations may not fully reflect the Bank’s talent market; and· Lack of ability to provide equity incentives, as competitors in the market do, should be a consideration in defining the total rewards package for the Bank, including certain benefits· Targeting the 75th percentile (or even higher) is a reasonable approach in the context of NEOs and Management CommitteeAs a result, the Board approved changesbenefit programs which assigned an actuarial value to the Bank’s Compensation Policy effective September 2018. Changes tobenefits programs and programs offered by other employers included in the Compensation Policy include: 1) benchmarking against “level-to-level” position , rather than the position one company level lower, at a Primary Peer Group of Regional/Commercial Banks of $20-$65B in assets for NEOs and Management Committee; 2) include other Federal Home Loan Banks and large global financial firms (e.g., Morgan Stanley, Bank of America, JPMorgan, Citigroup, etc.) as a secondary comparator group; 3) “Secondary PeerGroups” benchmarked at the 75th percentile or higher; and 4) custom analysis for specialty areas. The methodology will be applied when benchmarking positions in 2019 for proposed adjustments to salaries effective January 1, 2020.Total Rewards Study. primary peer group that was used in Towers’the Towers healthcare and welfare component of the benefits study in 2018 is set forth in the table below. Please see Section IV.A.1 below for a list of the peer group used for compensation other than with respect to healthcare and welfare benefits. For the firms listed below that had multiple lines of business, the Bank benchmarked total compensation against the wholesale banking functions at those companies.CIBC CIBCPNC Financial Services Group, Inc.RBC Bank- USBMO Financial GroupBNY MellonINGBNY Mellon PNC Financial Services Group, Inc. b) 2018 Compensation Benchmarking c) Market Data Participants — Commercial Banks and FHLBanks used for 2019 market pay analysis: AIB Federal Reserve Bank of Atlanta Northern Trust Corporation Ally Financial Inc. Federal Reserve Bank of Boston PacWest Bancorp Associated Bank Federal Reserve Bank of Cleveland People's United Bank, National Assoc. Australia & New Zealand Banking Group Federal Reserve Bank of New York PNC Bank Banco Bilbao Vizcaya Argentaria Federal Reserve Bank of Richmond Popular Community Bank Banco Itaú Unibanco Federal Reserve Bank of San Francisco Rabobank Bank Hapoalim Federal Reserve Bank of St Louis Regions Financial Corporation Bank of America Merrill Lynch Fifth Third Bank Royal Bank of Canada Bank of New York Mellon First Citizens Bank Royal Bank of Scotland Group Bank of Nova Scotia First Republic Bank Santander Bank, NA Bank of the West First Tennessee Bank/ First Horizon Signature Bank - NY Bayerische Landesbank FNB Omaha Societe Generale BBVA Compass Freddie Mac Standard Chartered Bank BMO Financial Group GE Capital State Street Corporation BNP Paribas Hancock Bank Sterling National Bank BOK Financial Corporation HSBC Sumitomo Mitsui Banking Corporation Branch Banking & Trust Co. Huntington Bancshares, Inc. Sumitomo Mitsui Trust Bank Brown Brothers Harriman ICBC Financial Services SunTrust Banks Capital One ING SVB Financial Group Charles Schwab & Co. Intesa Sanpaolo Synchrony Financial China Construction Bank Investors Bancorp, Inc. Synovus CIBC World Markets JP Morgan Chase TD Ameritrade CIT Group KBC Bank TD Securities Citigroup KeyCorp Texas Capital Bank Citizens Financial Group Landesbank Baden-Wuerttemberg The PrivateBank City National Bank Lloyds Banking Group U.S. Bancorp Comerica M&T Bank Corporation UMB Financial Corporation Commerce Bank Macquarie Bank Umpqua Holding Corporation Commerzbank MB Financial Bank UniCredit Bank AG Commonwealth Bank of Australia MUFG Bank, Ltd. Valley National Bank Crédit Agricole CIB MUFG Securities Webster Bank Credit Industriel et Commercial – N.Y. National Australia Bank Wells Fargo Bank Cullen Frost Bankers, Inc. Natixis Westpac Banking Corporation DBS Bank New York Community Bank Zions Bancorporation DZ Bank Nord/LB East West Bancorp Nordea Bank Fannie Mae Norinchukin Bank, New York Branch Services Provided by Compensation and Benefits Consultantd) Services Provided by Compensation and Benefits Consultant consultant Willisconsultants Towers Watson (“Towers”) during 2018and McLagan in 2019 was $345,998.$418,894. Regarding compensation consulting, payments made regarding the 2018 Total Rewards Study performed byto Towers were in the amount of $211,874. Payments made regarding separate officer$392,144. McLagan also provided services for 2019 NEO compensation benchmarking performed by Towers wereservices in the amount of $12,177.$26,750. The Bank also engaged Towers for insurance placement services and, through insurance commissions, compensated Towers for these additional services unrelated to compensation consulting in the amount of $121,947$122,686 in 2018. Bank management reported2019. The Board reviewed Towers’ compensation and benchmarking data and recommendations to the Board during the course of 2018.2019. While the C& HR&HR Committee has concluded that no conflict of interest was created by management’smanagement's engagement of Towers or McLagan for the referenced additional services, any potential conflicts of interest were mitigated through multiple safeguards and constraints, including Board oversight of the Bank’s management, operations, budget, compensation arrangements and amounts;benefits consultants; and comprehensive Finance Agency regulations and monitoring of our compensation, corporate governance, and safety and soundness.2. IC PlanIII. Incentive Compensation Plan a) Overview of the 2018 IC Plana) Overview of the 2019 IC Plan 20182019 IC Plan is to motivate employees to take actions that support the Bank’s strategies and lead to the attainment of the Bank’s business plan and fulfillment of its mission. The 20182019 IC Plan is also intended to help retain employees by affording them the opportunity to share in the Bank’s performance results. The 20182019 IC Plan seeks to accomplish these objectives by linking annual cash payout award opportunities to Bank performance and to individual performance. All salaried exempt and non-exempt employees are eligible to participate in the 20182019 IC Plan. Awards under the 20182019 IC Plan were calculated based upon performance during 20182019 and paid to participants on March 8, 2019. We received a “non-objection” from the Finance Agency to pay the Plan awards to NEOs, subject to the deferral feature for Management Committee participants discussed below. The 2018 IC Plan was developed in accordance with regulations issued by and other guidance received from the Finance Agency.6, 2020. specified threshold rating within the “Meets Requirements” categoryrating on their individual performance evaluations and do not have any unresolved disciplinary matters.b) Bankwide Performance Goalsb) Bankwide Performance Goals 20182019 Incentive Compensation Opportunity is summarized as follows:Rank Bank Performance/Individual Performance Incentive Compensation Opportunity President – CEO 90%/10% 50% (Threshold)
80% (Target)
100% (Maximum) Other NEOs 90%/10% 30% (Threshold)
50% (Target)
75% (Maximum)···(i)Business Effectiveness Goal
(Measure and calculation of measure)
Meets Stated
Purpose
Bankwide
Goal
(Measure and calculation of measure)
Meets Stated
Purpose1. Business Effectiveness Goal Bankwide Goals
(Measure and calculation of measure) How Goal
Meets Stated
Purpose Weighting Threshold Target Maximum Results BUSINESS EFFECTIVENESS(1) 70% of
Bankwide
Goal Return Component- Dividend Capacity as forecasted in the 2019 business plan. Dividend Capacity is calculated as net income, divided by average capital stock. The Bank’s goal is to reward management for financial results that are generally controllable by management. Therefore, we adjust net income to eliminate the impact of items such as unrealized fair value changes on derivatives and associated hedged instruments. In addition, the target is adjusted due to changes in market interest rates during the year. Earnings provide value for shareholders through the ability to add to retained earnings and to pay a dividend. 35.00 % 5.11 % 5.86 % 6.86 % 6.26 % Risk Component -The 2019 Bankwide Risk goal consists of two components, each with five complementary factors or metrics. Each metric will be evaluated on PASS/FAIL basis. Each component must have at a minimum three PASS rated metrics to qualify for incentive compensation. The more measures that receive PASS ratings, the higher the potential award. Lowering the Bank’s risk profile provides a level of assurance that unexpected losses will not impair members’ investment in the Bank and serves to preserve the par value of membership stock. Risk Component —Market, Capital and Earnings (“MCE”) Risk Exposure. The four metrics Attempts to broadly cover financial risks within the Bank’s book of business. Bankwide Goals
(Measure and calculation of measure) How Goal
Meets Stated
Purpose Weighting Threshold Target Maximum Results 24.50 % 2 3 4 4 Risk Component—Operations and Controls (“BOC”) Exposure. The BOC Component attempts to focus on the effectiveness of controls used to manage the risks associated with business activities and operational processes. The four metrics for BOC measure are: 1) Operational Exception; 2) Controls over Financial Reporting; 3) Control Awareness and Sustainment Training; 4) Information Technology General Controls. Each metric will be evaluated on PASS/FAIL basis. Each component must have at a minimum two PASS rated metrics to qualify for incentive compensation. The more measures that receive PASS ratings, the higher the potential award. Attempts to focus on the effectiveness of controls used to manage the risks associated with business activities and operational processes. 10.50 % 2 3 4 4 (ii) Growth Effectiveness Goal
(Measure and calculation of measure)
Stated Purpose
Bankwide
Goal2. Growth Effectiveness Goal Bankwide Goals
(Measure and calculation of measure) How Goal Meets
Stated Purpose Weighting Threshold Target Maximum Results GROWTH EFFECTIVENESS(2) 15 % of Bankwide Goal Number of New Member Institutions Positions the Bank for future growth and aligns with philosophy of being an “advances bank”. 3.75 % 5 10 15 14 Number of New/Return Borrowers Positions the Bank for future growth and aligns with philosophy of being an “advances bank”. 3.75 % 11 21 31 28 Advance Volume-Average Balance Advances Aligns with philosophy of being an “advances bank”. 3.75 % $ 91.03B $ 101.14B $ 106.20B $ 95.61B Market Share — Calculated by comparing members’ outstanding advances against a pool of alternative wholesale funding sources Helps the Bank gauge its competitive position against a variety of wholesale funding alternatives used by members. Strengthens the franchise as an “advances bank”. 3.75 % 49.00 % 53.00 % 55.00 % 53.34 % (2) The Bank’s Growth Effectiveness goal is intended to “plant the seeds” for future growth. Our district has historically been subject to a high level of merger and acquisition activity, and we consistently have had the least, or second least, number of members of all the FHLBs. Increasing the number of new members and increasing the number of new and returning borrowing members is a method employed to help manage the risk of the Bank having fewer members and borrowers in the future. (2)The Bank’s Growth Effectiveness goal is intended to “plant the seeds” for future growth. Our district has historically been subject to a high level of merger and acquisition activity, and we consistently have had the least, or second least, number of members of all the FHLBs. Increasing the number of new members and increasing the number of new and returning borrowing members is a method employed to help manage the risk of the Bank having fewer members and borrowers in the future.(iii) Community Investment Effectiveness Goal3. Community Investment Effectiveness Goal
(Measure and calculation of measure)
Stated Purpose
Bankwide
GoalBankwide Goals
(Measure and calculation of measure) How Goal Meets
Stated Purpose Weighting Threshold Target Maximum Results COMMUNITY
INVESTMENT
EFFECTIVENESS(3) 15% of Bankwide Goal Completion, Implementation and Roll-Out of the New First-time Homebuyer Set-aside Program The number of members that are enrolled and approved to participate in the new first-time homebuyer AHP set-aside program 3.00 % 50 55 65 110 Dollar Amount of Approved Community Lending Program Applications Supports the provision of liquidity to members for housing and community development activities 3.00 % $ 1.7 B $ 1.9 B $ 2.2 B $ 1.7 B Increase Member participation in AHP Competitive program The number of members who, in 2019, either: 1) submit AHP applications for the first time; 2) submit an AHP application after having not participated in the past two years; or 3) submit more AHP applications than what was submitted in 2018. 3.00 % 10 12 15 17 Community Investment and Affordable Housing Related Outreach and Technical Assistance Activities Supports the promotion, understanding and use of the Bank’s affordable housing and community lending programs 6.00 % 72 80 92 128 (3)The Community Effectiveness Goal was implemented as a composite of several programs and activities as all of these components contribute to how the Bank achieves its mission-related housing and community development activities.(3) The Community Effectiveness Goal was implemented as a composite of several programs and activities as all of these components contribute to how the Bank achieves its mission-related housing and community development activities. 85.3%63.2% above target. The weighted average result for the Risk Management Group was 85.9%66.2% above target. Payments are interpolated between the target and maximum amounts.c) Clawback Provision of the Incentive Compensation Planc) Clawback Provision of the Incentive Compensation Plan amongstamong Participants. Authority of the Board under this Article XIIC Plan may be delegated to the Committee, but may not be delegated to the President. pursuant to this Article XI,, it will make a written demand from the Participant for the repayment of the Recovery Amount. Subject to the IC Plan provisions of Schedule B regarding the forfeiture of unpaid amounts, if the Participant does not within a reasonable period, after receiving the written demand, provide repayment of the Recovery Amount, and the Board determines that he or she is unlikely to do so, the Board may seek a court order against the Participant for repayment of the Recovery Amount.d) Required Deferral of IC Plan Awards for MC Membersd) Required Deferral of Incentive Compensation Plan Awards was implemented beginning on January 1, 2012 forapplies to members of the Bank’s Management Committee.Committee including all NEOs. Such deferred compensation plan provides that the payments made to Management Committee members under the IC Plan are deferred and will be made as described below.For the Plan years 2012-2014, each deferred payment could Deferred Incentive Awards will be increased or decreased by 25% based onpaid if the Bank’s performance on Market Valueratio of Equitymarket value of equity to Par Valuepar value of Capital Stock performance scorecard (“MVE”) and other performance measures as outlined in the table below.Beginning with the 2015 Plan year, the C&HR Committee approved changes to the payment of the deferral amount as follows:· If the MVE ratiocapital stock is equal to, or greater than 100%, eligible participants will become qualified to receive. To compensate employees for the deferral payment. If MVE is less than 100%, then a participant would receive no payment for that year.· Thelost time value of money, the Bank will pay an interest rate on the deferred amount equal to the Bank’s return on equity over the deferral period, subject to a floor of zero.The first deferred payment affected by this change was under the 2015 IC Plan and the first deferred installment in 2017.B. IV. Retirement Benefitsa) Introduction IntroductionThere were elements of the Bank’s total compensation program in 2018 intended to help encourage the accumulation of wealth by consistent and superior results from qualified employees, including NEOs, over a long period of time.These benefits (in addition to the Health and Welfare Programs and Other Benefits noted in Section IV C below) were part of our strategy to compete for and retain talent that might otherwise be lured away from the Bank by competing financial enterprises who offer their employees long-term incentives and equity-sharing opportunities- forms of compensation that we do not offer.1. DBDefined Benefit Plan“Grandfathered”.“DB Plan A.”“Non-Grandfathered”“DB Plan B”, the DB Plan provides a benefit of 2.0% of a participant’s highest consecutive 5-year average earnings (as opposed to consecutive 3-year average earnings as provided to Grandfathered participants), multiplied by the participant’s years of benefit service, not to exceed 30 years. The Normal Form of Payment for participants hired on or after July 1, 2008 is a life annuity (i.e., an annuity paid until the death of the participant). The guaranteed 12-year payout option under a life annuity, as previously provided to Grandfathered participants, wasand overtime, subject to the annual Internal Revenue Code limit. These participants are identified herein as “DB Plan C.”
PROVISIONS
EMPLOYEES
EMPLOYEES
HIRED ON OR
AFTER JULY 1, 2014DEFINED BENEFIT PLAN(DB PLAN)
PROVISIONS DB PLAN A** DB PLAN B*** DB PLAN C 2.5% 2.0% 1.5% High 3-Year High 5-Year High 5-Year Life Annuity with Guaranteed 12 Year Payout Straight Life Annuity Straight Life Annuity 1% Per Year Cumulative Commencing at Age 66 None None 1.5% Per Year 3% Per Year 3% Per Year 3% Per Year Actuarial Equivalent Actuarial Equivalent 20% Per Year Commencing Second Year of Employment 5-Year Cliff 5-Year Cliff For Grandfathered Employees, the Benefit Multiplier, 2.5%, is multiplied by the average of the employee’s three highest consecutive years of salary multiplied by that employee’s years of service, not to exceed thirty years at the date of termination. For Non-Grandfathered Employees, any accrued benefits prior to July 1, 2008, the accrued Benefit Multiplier mirrors the Grandfathered Employees at 2.5%. For non-grandfathered employees benefits accrued after July 1, 2008, a Benefits Multiplier of 2% is multiplied by the employee’s years of service (total service not to exceed thirty years) multiplied by the average of the employee’s five highest consecutive years of salary. For non-grandfathered employees, benefits accrued after July 1, 2014, a Benefits Multiplier of 1.50% is multiplied by the employee’s years of service (total service not to exceed thirty years) multiplied by the average of the employee’s five highest consecutive years of salary, excluding short-term incentive compensation opportunities available under the Bank’s IC Plan and overtime . For unmarried Grandfathered retirees, the Normal Form of Payment is a life annuity with a 12-year guaranteed payment (“Guaranteed 12-Year Payout”) which means that if the unmarried Grandfathered retiree dies prior to receiving 12 years of annuity payments, the retiree’s beneficiary will receive a lump sum equal to the remaining unpaid payments in the 12-year period. For married Grandfathered retirees, the Normal Form of Payment is a 50% joint and survivor annuity, which provides a continuation of half of the monthly annuity to the surviving beneficiary. The initial 50% joint and survivor annuity monthly payment is actuarially equivalent to the 12-year guaranteed payment provided to single retirees under the formula. Effective July 1, 2008, the DB Plan provides single Non-Grandfathered retirees with a straight “Life Annuity” as the Normal Form of Payment, which means that, once a retiree dies, the annuity terminates. For married Non-Grandfathered retirees, the Normal Form of Payment will be a 50% joint and survivor annuity (continuation of half the monthly annuity to the surviving beneficiary) that is actuarially equivalent to the straight Life Annuity.Grandfathered EmployeeDB Plan A retiree reaches age 65, in each succeeding year he/she will receive an extra payment annually equal to one percent of the original benefit amount multiplied by the number of years in pay status after age 65. As of July 1, 2008, this adjustment is no longer offered to Non-GrandfatheredDB Plan B Employees on benefits accruing after that date.GrandfatheredDB Plan A Employees are entitled, starting with the second year of employment service, to 20% of his/her accumulated benefit per year. As a result, after the sixth year of employment service, an employee will be entitled to 100% of his/her accumulated benefit. Non-GrandfatheredDB Plan B Employees who entered the DB Plan on or after July 1, 2008 will not receive such benefit until such employee has completed five years of employment service. At that point, the employee will be entitled to 100% of his/her accumulated benefit. The term “5-Year Cliff” is a reference to the foregoing provision. GrandfatheredDB Plan A and Non-GrandfatheredDB Plan B Employees already participating in the DB Plan prior to July 1, 2008 will vest at 20% per year starting with the second year through the fourth year of employment service and will be accelerated to 100% vesting after the fifth year.GrandfatheredDB Plan A and Non-GrandfatheredDB Plan B Employees continue to be defined as base salary plus short-term incentives, and overtime, subject to the annual Internal Revenue Code (“IRC”) limit. The IRC limit on earnings for calculation of the DB Plan benefit for 20182019 was $275,000.$225,000.2. DB BEP1. Defined Benefit Component of the Benefit Equalization Plan DB Plan changesbenefit multiplier reduction to 1.5% implemented effective July 1, 2014.2014 under DB Plan C.NON-QUALIFIED
DEFINED BENEFIT
(DB BEP PLAN)
PROVISIONS DB PLAN A* DB PLAN B** Benefit Multiplier 2.5% 2.0% Final Average Pay Period High 3-Year High 5-Year Normal Form of Payment Life Annuity with Guaranteed 12 Year Payout Straight Life Annuity Cost of Living Adjustments 1% Per Year Cumulative Commencing at Age 66 None Committee by submitting its meeting minutes to the C&HR Committee on a regular basis.Committee.3. DC Plan2. Defined Contribution Plan Employees who have met certain eligibility requirements can choose toNEOs may contribute to the DC Plan, a retirement savings plan qualified under the IRC. EmployeesAll employees are eligible for membership in the DC Plan on the first day of the month following three full calendar months of employment.20182019 was $18,500$19,000 for employees under the age of 50. An additional “catch up” contribution of $6,000 is permitted under IRC rules for employees who attain age 50 before the end of the calendar year.2%up to 1.5% of the employee’s base salary or $34.61 per pay period (whichever is less).salary.4. DC BEPOn November 17, 2016, the Board approved and authorized the implementation of the Amended and Restated Supplemental Executive Retirement Defined Benefit & Defined Contribution Benefit Equalization Plan, effective as of January 1, 2017 (the “Amended and Restated BEP”), and the separate NDICP, also effective as of January 1, 2017. On December 5, 2016 the Bank’s primary regulator, the Federal Housing Finance Agency, informed the Bank that it had no objection to the Bank’s adoption and implementation of the Amended and Restated BEP and the NDICP which is discussed immediately following.3. Defined Contribution Component of the Benefit Equalization Plan Effective January 1, 2017, qualifiedParticipating employees wereare allowed to defer up to 19% of the employee’s base salary (less the amount of salary deferrals allowed under the DC Plan pursuant to the IRS Limits).Similar toAs a continuation of the qualified DC Plan, the Bank will make a matching contribution each plan year of up to 6% of base salary on the first 4% of elective deferrals made under the DC BEP. If an employee elects to defer less than 4% of base salary, the Bank will match at a rate of 150% of elective deferred contributions. For deferrals beginning January 1, 2020, the Bank will make a matching contribution of up to 9% of base salary for NEO elective deferrals (in excess of the DC Plan contribution limits). All deferred monies will be the property of the Bank until distribution to the employee and thus subject to claims of Bank creditors until distribution.5. NDICP4. Nonqualified Deferred Incentive Contribution Plan which became effective on January 1, 2017, will allowallows employees serving at the rank of a Vice President or above (including the NEOs) to elect to defer all or a portion of the employee’s annual incentive compensation that is paid to the employee under the terms of any Board-approved IC Plan or deferred portion of such IC Plan. The Bank does not provide a match on these deferrals. All deferred monies will be the property of the Bank until distribution to the employee and thus subject to claims of Bank creditors until distribution.C. V. Health and Welfare Programs and Other Benefitsa) Perquisites and Benefits In addition to the foregoing, we a comprehensive benefits package for all regular employees (including NEOs) which include the following significant benefits:additional perquisites and other benefits to all employees, including the NEOs, under the same general terms and conditions:• Medical, dental, and vision insurance (subject to employee expense sharing); • Vacation leave, which increases based upon officer title and years of service; • Life and long-term disability insurance (NEOs are eligible for enhanced monthly benefits under our disability insurance program); • Travel and accident insurance which include life insurance benefits; • Educational assistance; and • Employee relocation assistance, where appropriate, for new hires. Medical and DentalEmployees can choose preferred provider, open access or managed care medical plans. All types of medical coverage include a prescription benefit. Dental plan choices include preferred provider or managed care. Employees contribute to cover a portion of the costs for these benefits. Effective January 1, 2015, the medical plans were replaced with a HDHP which includes a Health Savings Account HSA which are discussed in Section I above. In order for the healthcare plan to be eligible for an HSA account, the IRS requires that plan deductibles and maximum out-of-pocket limits be increased and pharmacy benefits be paid only after the deductible is met. The Bank established, and contributed to, employee HSA accounts on January 1, 2015 and thereafter to offset costs associated with these changes.Retiree Medicalb) Retiree Medical arewere at least 55 years old as of January 1, 2015 with 10 years of service as of January 1, 2015 when they retire from active service.Under the Plan as in effect from May 1, 1995 until December 31, 2007, retireesRetirees who retire before age 62 pay the full premium for the coverage they had as employees until they attain age 62. Thereafter, they contribute a percentage of the premium based on their total completed years of service (no adjustment is made for partial years of service) on a “Defined Benefit” basis, as defined below, as follows:As a result of the Aon study described previously and the recommendations that resulted from such study, the Board directed that certain changes inUnder the Plan be made, effective Januaryas in effect from May 1, 2008. Employees who, on1995 until December 31, 2007, hadherein identified as “Grandfathered,” retirees beginning at age 62, we contributed a percentage of the premium based on their total completed years of service (no adjustment is made for partial years of service) on a “Defined Benefit” basis. There are no NEOs who qualify for this benefit.were not affected by this change. These employees areherein identified herein as “Grandfathered.” However, for all other employees, identified herein as “Non-Grandfathered,” the Plan premium-payment requirements beginning at age 62 were changed. From age 62 until the retiree or a covered dependent of the retiree becomes Medicare-eligible (usually at age 65 or earlier, if disabled), we contributecontributed $45 per month toward the premium of a Non-Grandfathered retiree multiplied by the number of years of service earned by the retiree after age 45 and by the number of individuals (including the retiree, the retiree’s spouse, and each other dependent of the retiree) covered under the Plan.AfterPlan from age 62 until the retiree or a covered dependent of the retiree becomes Medicare-eligible our contribution toward the premium(usually at age 65 or earlier, if disabled). There are no NEOs who qualify for the coverage of the Medicare-eligible individual will be reduced to $25 per month multiplied by the number of years of service earned by the retiree after age 45 and by the number of individuals (including the retiree, the retiree’s spouse, and each other dependent of the retiree) covered under the Plan. The $45 and $25 amounts were fixed for the 2008 calendar year. Each year thereafter, these amounts will increase by a cost-of-living adjustment (“COLA”) factor not to exceed 3%. The table below summarizes the Retiree Medical Benefits Plan changes that affect Non-Grandfathered employees who retire on or after January 1, 2008.this benefit.EffectiveFor all covered employees as of as of January 1, 2015, for all other employees,including the Plan premium-payment requirements beginning at age 62 were changed. FromNEOs, from age 62 until the retiree or a covered dependent of the retiree becomes Medicare-eligible (usually at age 65 or earlier, if disabled), we contribute $26.87 per month toward the premium of a Non-Grandfathered retiree multiplied by the number of years of service earned by the retiree after age 45 and by the number of individuals (including the retiree, the retiree’s spouse, and each other dependent of the retiree) covered under the Plan.wereare fixed for the 2015 calendar year. The COLA factorand not cost-of-living (COLA) adjusted.eliminated. The table below summarizesa summary of the Retiree Medical Benefits Plan changes that affect employees who retire on or after January 1, 2015.For purposes of the following table and the preceding discussion on the Retiree Medical Benefits Plan, the following definitions have been used:Plan:DefinedRetiree Medical Benefit Plan Provisions For Retirees January 1, 2015 and After* Plan Type — A medical plan in which we provide medical coverage to a retired employee and collect from the retiree a monthly fixed dollar portion of the premium for the coverage elected by the employee.Defined Dollar Plan — A medical plan in which we provide medical coverage is provided to a retired employee up to a fixed cost for the coverage elected by the employee and the retiree assumes all costs above the stated contribution.Provisions forGrandfatheredProvisions for Non-GrandfatheredProvisionsFor RetireesRetireesEligibility Retirees2015 and AfterPlan TypeDefined BenefitDefined Dollar PlanDefined Dollar Plan1) Same coverage offered to active employees prior to age 651) Retiree (and covered individual), is eligible for $45/month x years of service after age 45, and has attained the age of 62. There is a 3% Cost of Living Adjustment each year.3% Cost of Living Adjustment is eliminated.excluded. 2) Supplement Medicare coverage for retirees age 65 and over2) Retiree (and covered individual) is eligible for $25/month x years of service after age 45 and after age 65. There is a 3% Cost of Living Adjustment each year.3% Cost of Living Adjustment is eliminated.excluded. EmployerCost Share Examples:0% for Pre-62$0 for Pre-62 Pre-65/Post-65Employer Cost Share Examples: 10 years of service after age 45 50% for Post-62$5,400/$3,000/Annually62.5% for Post-62$8,100/$4,500/Annually75% for Post-62$10,800/$6,000/AnnuallyVision CareThis includes the following NEOs: G. Robert Fusco; P. Héroux and K. Neylan.Employees can choose from two types of coverage offered. Basic vision care is offered at no charge to employees. Employees contribute to the cost for the enhanced coverage.Life InsuranceThe Group Term Life insurance provides a death benefit of twice an employee’s base salary (including short-term incentive compensation) at no cost to the employee other than taxation of the imputed value of coverage in excess of $50,000. The maximum amount of life insurance coverage is $2,000,000 (with proof of good health), otherwise maximum life insurance coverage is $750,000.Additional Life Insurancec) Additional Life Insurance iswas provided to one NEO (the Chief Bank Operations Officer)Mr. Heroux who, in 2003, was a participant in the Split Dollar life insurance program, as consideration for his assigning to the Bank his portion of the Split Dollar life insurance policy. The Split Dollar life insurance program was terminated in 2003. The total insurance coverage for the participating NEO iswas $1,000,000 with an annual premium expense to the Bank of $3,910$6,790 in 2018.2019This Additional Term Life InsuranceEffective October 1, 2019, the policy is paid bywas terminated upon the Bank; however, the NEO owns the policy. We purchased in 2003 and renewed our policy for an additional 15 years in 2018.Retiree Life InsuranceRetiree Life Insurance provides a death benefit in relation to the amountretirement of coverage one chooses at the time of retirement. The continued benefit is calculated by the insurance broker and is paid for by the retiree. Coverage can be chosen in $1,000 increments up to a maximum of $20,000.Defined Benefit Plan - Active Service Death Benefit (“ASDB”)Upon the death of an active employee in the DB Plan, a death benefit shall be paid to the employee’s beneficiary in a lump sum at least one to three times the employee’s ASDB salary.Defined Benefit BEP — ASDBUpon the death of an active employee in the DB BEP, a death benefit shall be paid to the employee’s beneficiary in a lump sum pursuant to the BEPs.If you are an active employee in the DB BEP and you die in active service, your beneficiary would be eligible to a lump sum pursuant to the administration of the BEP.Business Travel Accident InsuranceBusiness Travel Accident insurance provides a death benefit while traveling on Bank business, outside of the normal commute, at no cost to the employee.Short-and Long-Term Disability InsuranceShort-and long-term disability insurance is provided at no cost to the employee.Supplemental Short-Term Disability CoverageWe provide supplemental short-term disability coverage at no cost to the employee. This coverage provides 66.67% (up to a maximum of $1,000 per week) of a person’s salary while they are on disability leave. Once state disability coverage is confirmed, we reduce supplemental calculations by the amount payable from the Short-Term Disability provider.Supplemental Long-Term Disability CoverageWe provide supplemental long-term disability coverage at no cost to the employee. This coverage provides an additional monthly benefit of up to $15,000Mr. Héroux with no additional underwriting and an additional $5,000 with underwriting for a maximum benefit of $20,000further expense to employees whose monthly base salary exceeds $30,769.Flexible Spending AccountsFlexible spending accounts in accordance with IRC rules are provided to employees to allow tax benefits for certain medical expenses, dependent medical expenses and mass transit expenses and parking expenses associated with commuting. The administrative costs for these accounts are paid by the Bank.Health Savings AccountsHealth savings accounts, in accordance with IRC rules, are provided to employees to allow tax benefits for certain medical expenses associated with a high-deductible health plan. The administrative costs for these accounts are paid by the Bank.Employee Assistance ProgramEmployee assistance counseling is available at no cost to employees. This is a Bank-provided benefit that allows employees to anonymously speak to a 3rd party provider regarding various issues such as stress, finance, smoking cessation, weight management and personal therapy.Educational Development AssistanceEducational Development Assistance provides tuition reimbursement up to an annual dollar limit, subject to the satisfaction of certain conditions.Voluntary Life InsuranceEmployees are afforded the opportunity to purchase additional life insurance for themselves and their eligible dependents.Fitness Center ReimbursementFitness center reimbursement is available to all employees subject to the satisfaction of certain criteria.Service AwardWe provide employees, including NEOs, who are employed at the Bank for 10 years or more with a service award. This award is presented after 10 years in increments of 5 years.PerquisitesPerquisites are expenditures valued at the actual amounts paid by the Bank for the year 2018 per NEO.supplemental life insurance program.D. and Executive Change in Control Agreements and Golden Parachute Rule1.a) Severance Planwill”will��� arrangement. Accordingly, an employee may resign employment at any time and the Bank may terminate the employee’s employment at any time for any reason with or without cause.one yeartwo “periods of employment.service” (the number of six (6) month periods, in the aggregate, for which an employee is employed by the Bank).2.b) Executive Change in Control Agreementseach of the members of the Management Committee, including the CEO and the other Named Executive Officers, and the Chief Audit Officer,NEOs, which as more fully described below, would provide the executive with certain severance payments and benefits in the event employment is terminated in connection with a “change in control” of FHLBNY. Previously, on December 10, 2015, the Federal Housing Finance Agency indicated to FHLBNY that it would have no objection to the FHLBNY entering into agreements containing the severance payment provisions that are included in the CIC Agreements. The CIC Agreements were renewed in January 2019 for an additional three-year period.The CIC Agreements are effective commencing December 1, 2015 for three (3) years from the date the CIC Agreement is executed. (as defined in the CIC Agreement) or by the executive for “good reason” (as defined in the CIC Agreement) during the period beginning on the earliest of (a) twelve (12) months prior to the execution by FHLBNY of a definitive agreement regarding a Change in Control, (b) twelve (12) months prior to Change in Control mandated by federal statute, rule or directive, and (c) twelve (12) months prior to the adoption of a plan or proposal for the liquidation or dissolution of FHLBNY, and ending, in all cases, twenty-four (24) months following the effective date of the Change in Control, the executive becomes entitled to certain severance payments and benefits. TheseV. ExplanationThe Finance Agency issued final rules on executive compensation and golden parachute payments relating to the regulator’s oversight of how we determinesuch compensation and payments located at 12 CFR Parts 1230 and 1231 the amount (“Golden Parachute Rule”). This sets forth the standards that the Finance Agency will take into consideration when limiting or prohibiting golden parachute payments by an FHLBank, the Office of Finance, Fannie Mae or Freddie Mac. The Golden Parachute Rule generally prohibits golden parachute payments except in limited circumstances with Finance Agency approval. Golden parachute payments may include compensation paid to a director, officer or employee following the termination of such person's employment by a regulated entity that is insolvent, is in conservatorship or receivership, is required by the Director to improve its financial condition, or has been assigned a composite examination rating of 4 or 5 by the Finance Agency. Golden parachute payments generally do not include payments made pursuant to a qualified pension or retirement plan, an employee welfare benefit plan, a bona fide deferred compensation plan, a nondiscriminatory severance pay plan, or payments made by reason of the death or disability of the individual. Our benefit plans comply with the Golden Parachute Rule and where applicable, the formula for each elementBank has not had a payment in 2019 restricted by the Finance Agency.compensationEnterprise Services, announced his planned retirement date of April 3, 2020, and in connection to his retirement was offered a retention agreement, effective June 20, 2019. A cash payment of $425,000 will be provided if Mr. G. Robert Fusco stays through March 31, 2020 to assist in transitioning a new Chief Information Officer. We received a “non-objection” letter from the Finance Agency with respect to the payment as directed by the retention agreement.VII. Explanation of how we determine the amount and, where applicable, the formula for each element of compensation IVII directly above for an explanation of the mechanisms used to determine employee compensation.VI. Explanation of how each element of compensation and the decisions regarding that element fit into the overall compensation objectives and affect decisions regarding other elements of compensationVIII. Explanation of how each element of compensation and the decisions regarding that element fit into the overall compensation objectives and affect decisions regarding other elements of compensation the Introduction sectionSection II under the heading “The Total Compensation Program” for an explanation of the components that make up our total compensation program. Together, these components comprised the total compensation program for 2017,2019, and they are established in accordance with our Compensation Philosophy and the regulated environment that we operate in as discussed in detail in Section IVI above. Section IV of the CD&A above describes how each element of the compensation objectives and the decisions regarding each element fit within such objectives.Policy.We note that differences in compensation levels that may exist among the NEOs are primarily attributable to the benchmarking process. The Board does have the power to adjust compensation from the results of the benchmarking process; however, this power is not normally exercised.Policy and Compensation Benchmarking.2018.2019.to ensure they followand the goals.The structure of our compensation programs provides evidence of the balanced approach to risk and reward in our culture. The rationale behind the structure of the Incentive Plan andIncentiveIC Plan will not motivate management to increase returns if they require imprudently increasing risk.We operate with a philosophy that all our employees are risk managers and are, therefore, responsible for managing risk. It is true that we have separated operational management from risk oversight, and those employees who work in the Risk Management Group have a special responsibility to identify, measure, and report risk. However, all employees need to be aware of and responsible for managing risks at the Bank, and to consider the risk implications of their decisions. To do otherwise is to relegate the management of risks to a limited number of professionals and allow other managers to believe that managing risks is not part of their jobs. In our view, such an approach could lead to imprudent risk-taking and may erode the Bank’s value over time.regulations from offering equity-based compensation, and we do not currently offer long-term incentives. However, many of the firms in our peer group do offer these types of compensation. The total compensation program takes into account the existence of these other types of compensation by offering defined benefit and defined contribution plans to help effectively compete for talent. The defined benefit and defined contribution plans are designed to reward employees for continued strong performance over the course of their20182019 through the date of this annual report on Form 10-K: DeForest B. Soaries, Jr., Kevin Cummings, Anne Evans Estabrook, Gerald H. Lipkin, Christopher P. Martin, David J. Nasca, C. Cathleen Raffaeli Monte N. Redman and Stephen S. Romaine. During this period, no interlocking relationships existed between any member of the Bank’s Board of Directors or the C&HR Committee and any member of the board of directors or compensation committee of any other company, nor did any such interlocking relationship exist in the past. Further, no member of the C&HR Committee listed above was an officer or our employee during the course of their service as a member of the Committee, or was formerly an officer or our employee before becoming a member of the Committee. 2016 (in dollars):2017 and 20162017 Change in Non-Equity Pension Value Incentive and Nonqualified Stock Option Plan Deferred All Other Total (a) Year Salary Bonus Awards Awards Compensation (a)(1) Compensation(b)(2) Compensation (c)(3)(4) (d) 2019 $ 993,600 $ - $ - $ - $ 961,906 $ 2,736,000 $ 145,233 $ 4,836,739 2018 $ 920,000 $ - $ - $ - $ 927,184 $ 69,000 $ 61,989 $ 1,978,173 2017 $ 875,000 $ - $ - $ - $ 860,851 $ 91,000 $ 47,024 $ 1,873,875 2019 $ 531,787 $ - $ - $ - $ 365,340 $ 1,598,000 $ 71,995 $ 2,567,122 2018 $ 515,048 $ - $ - $ - $ 376,879 $ 528,000 $ 38,402 $ 1,458,329 2017 $ 484,751 $ - $ - $ - $ 343,265 $ 1,081,000 $ 78,941 $ 1,987,957 Melody J. Feinberg 2019 $ 438,813 $ - $ - $ - $ 302,648 $ 453,000 $ 60,018 $ 1,254,479 2018 $ 425,000 $ - $ - $ - $ 309,608 $ 152,000 $ 34,064 $ 920,672 2017 $ 386,282 $ - $ - $ - $ 268,465 $ 228,000 $ 93,461 $ 976,208 2019 $ 424,978 $ - $ - $ - $ 292,414 $ 1,458,000 $ 113,407 $ 2,288,799 2018 $ 411,601 $ - $ - $ - $ 301,229 $ 258,000 $ 86,565 $ 1,057,395 2017 $ 398,645 $ - $ - $ - $ 281,650 $ 1,118,000 $ 104,949 $ 1,903,244 Paul B. Héroux* 2019 $ 345,769 $ - $ - $ - $ 19,734 $ 2,650,048 $ 113,886 $ 3,129,437 2018 $ 423,382 $ - $ - $ - $ 310,827 $ 89,000 $ 92,642 $ 915,851 2017 $ 410,055 $ - $ - $ - $ 291,114 $ 1,040,000 $ 118,345 $ 1,859,514 Phillip A. Scott** 2019 $ 475,000 $ - $ - $ - $ 324,382 $ 742,000 $ 61,996 $ 1,603,378 Senior Vice President, Chief Capital Markets Officer 20182019(d)(a) reflect the dollar value of all earnings for services performed during the fiscal years ended December 31, 2019, 2018, 2017, and 20162017 pursuant to awards under the ICP, even though fifty percent of the ICP awards for each year were subject to mandatory deferral and distribution over three years. As discussed in the Compensation Discussion and Analysis, the 20182019 non-equity incentive compensation awards were subject to a 30-day review period and receipt of non-objection by the Finance Agency. The Bank received written non-objection from the Finance Agency on February 13, 2018.12, 2019. The amounts in column (d)(a) also include the dollar value of all interest during each year earned on Deferred Incentive related to ICP awards for prior fiscal years, in the following amounts for 2018: $49,9082019: $55,853 for J. González, $20,492$23,352 for K. Neylan, $14,946$17,489 for M. Feinberg, $16,421$19,114 for G. Robert Fusco, and $17,867$19,734 for P. Héroux.roux and $18,913 for P. Scott.(e)(b) reflects the sum of the actuarial change in pension value for (i) the Pentegra Defined Benefit Plan for Financial Institutions and (ii) the Nonqualified Defined Benefit Portion of the Benefit Equalization Plan. These values are based on actuarial calculations and depend on the level of market interest rates in addition to other factors. These plans are described in greater detail below under “Pension Benefits”. 2016 and 2017, the Bank included in “All Other Compensation” items that need not have been included in this chart as they involved benefits available to all employees, including costs relating to health (including employee assistance), dental and vision insurance premiums.(f)(c) for 20182019 consist of the following amounts:amounts
the 401(k) Plan (1)
under the Bank’s non-
qualified Defined
Contribution Benefit
Equalization Plan (2)(1)For all NEOs, includes amount of funds matched in connection with the Pentegra Defined Contribution Plan for Financial Institutions.(2)For all NEOs, includes payment for funds matched in connection with the Pentegra Nonqualified Defined Contribution Portion of the BEP.(3)Perquisites are valued at the actual amounts paid by the Bank and are benefits not available to all employees on equal terms. The Bank paid premiums for each named executive officer for group term life and long term disability insurance. The Bank provided payment to G. Robert Fusco,* P. Héroux, who held the CBOO position, left the Bank on September 30, 2019. His Board-approved annual salary was $437,142; the salary actually paid was $345,769.K. Neylan for executive medical benefits. The Bank provided payment to P. Héroux for term life insurance premiums. The Bank provided Mr. Fusco2018. Therefore, footnotes regarding 2017 and Mr. Héroux with payments under the replacement plan for the Nonqualified Profit Sharing Plan.(4)The tax gross-up amount for Mr. Héroux’s reimbursement for fitness club membership. This amount is2018 compensation are not included in column (f) of the Summary Compensation Table.this year’s report.Name Bank Contributions
under the 401(k)
Plan (1) Matching
contributions under
the Bank’s non-
qualified Defined Contribution Benefit Equalization Plan (2) Perquisite (3) Tax Gross-ups (4) Other(5) Total José R. González $ 11,278 $ 48,151 $ 10,804 $ - $ 75,000 $ 145,233 Kevin M. Neylan $ 6,094 $ 28,078 $ 10,330 $ 904 $ 26,589 $ 71,995 Melody J. Feinberg $ 16,800 $ 9,494 $ 10,553 $ 1,230 $ 21,941 $ 60,018 G. Robert Fusco $ 14,677 $ 10,788 $ 66,693 $ - $ 21,249 $ 113,407 Paul B. Héroux $ 16,800 $ 3,946 $ 92,645 $ 495 $ - $ 113,886 Phillip A. Scott $ 10,790 $ 17,538 $ 6,366 $ 3,552 $ 23,750 $ 61,996 (1) For all NEOs, includes amount of funds matched in connection with the Pentegra Defined Contribution Plan for Financial Institutions. (2) For all NEOs, includes payment for funds matched in connection with the Pentegra Nonqualified Defined Contribution Portion of the BEP. (3) Perquisites are valued at the actual amounts paid by the Bank and are benefits not available to all employees on equal terms. The Bank paid premiums for each named executive officer for group term life and long term disability insurance. The Bank provided payment to J. González and K. Neylan for executive medical benefits. The Bank provided payment to P. Héroux for term life insurance premiums. The Bank provided G. Robert Fusco and P. Héroux with payments under the replacement plan for the Nonqualified Profit Sharing Plan. The Bank provided $20,000 for P. Héroux the value of outplacement services. (4) The Bank paid tax gross-up amounts for P. Héroux, K. Neylan and P. Scott’s reimbursements for fitness club membership. The Bank paid tax gross-up amounts for M. Feinberg, K. Neylan and P. Scott’s reimbursements for tax preparation advice. The Bank paid tax gross-up amount for P. Héroux’s service award. This amount is included in column (c) of the Summary Compensation Table. (5) The Bank paid a performance-based award to employees (including NEOs) who received a rating of “Exceed Requirements” or “Outstanding” on their 2019 annual performance review. 20182019 (in whole dollars):20182019Grants of Plan-Based Awards for Fiscal Year 2019 All Other All Other Exercise Grant Stock Option or Date Awards: Awards: Base Fair Value Estimated Future Payouts Estimated Future Payouts Number of Number of Price of of Stock Under Non-Equity Incentive Under Equity Incentive Shares of Securities Option and Option Grant Plan Awards(2) (3) Plan Awards Stock Underlying Awards Awards Name Date(1) Threshold Target Maximum Threshold Target Maximum or Units Options ($/Sh) ($/Sh) José R. González 2/12/2019 $ 526,608 $ 794,880 $ 973,728 $ - $ - $ - - - $ - $ - Kevin M. Neylan 2/12/2019 $ 170,172 $ 265,893 $ 385,546 $ - $ - $ - - - $ - $ - Melody J. Feinberg 2/12/2019 $ 140,420 $ 219,406 $ 318,139 $ - $ - $ - - - $ - $ - G. Robert Fusco 2/12/2019 $ 135,993 $ 212,489 $ 308,109 $ - $ - $ - - - $ - $ - Paul B. Héroux 2/12/2019 $ 110,646 $ 172,884 $ 250,683 $ - $ - $ - - - $ - $ - Philip A. Scott 2/12/2019 $ 152,000 $ 237,500 $ 344,375 $ - $ - $ - - - $ - $ - (1) On this date, the Board of Directors’ C&HR Committee approved the 2019 Incentive Plan. Approval of the ICP does not mean a payout is guaranteed. (2) Figures represent an assumed rating attained by the NEO of at least a specified threshold rating within the “Meets Requirements” category for the NEO with respect to their individual performance. (3) Amounts represent potential awards under the 2019 Incentive Plan. (1)On this date, the Board of Directors’ C&HR Committee approved the 2018 Incentive Plan. Approval of the ICP does not mean a payout is guaranteed.(2)Figures represent an assumed rating attained by the NEO of at least a specified threshold rating within the “Meets Requirements” category for the NEO with respect to their individual performance.(3)Amounts represent potential awards under the 2018 Incentive Plan.20182019 Individual Bankwide Component(1) Component(1) 2019 (90% of Opportunity) (10% of Annual Salary Threshold Target Maximum Opportunity) Actual Result(2) Individual Total Current Performance Bankwide Individual Communicated Communicated Bank Performance at Target Component(3) Component(4) Award(5) Incentive Award(6) President 50 % 80 % 100 % 10 % José R. González $ 993,600 $ 447,120 $ 715,392 $ 894,240 $ 79,488 $ 826,565 $ 79,488 $ 906,053 $ 453,026 President & Chief Executive Officer Other NEOs 30 % 50 % 75 % 10 % Kevin M. Neylan $ 531,787 $ 143,582 $ 239,304 $ 358,956 $ 26,589 $ 315,399 $ 26,589 $ 341,988 $ 170,994 Senior Vice President, Chief Financial Officer Melody J. Feinberg $ 438,813 $ 118,479 $ 197,466 $ 296,198 $ 21,941 $ 263,218 $ 21,941 $ 285,159 $ 142,579 Senior Vice President, Chief Risk Officer G. Robert Fusco $ 424,978 $ 114,744 $ 191,240 $ 286,860 $ 21,249 $ 252,051 $ 21,249 $ 273,300 $ 136,650 Senior Vice President, CIO and Head of Enterprise Services Paul B. Héroux* $ 345,769 $ - $ - $ - $ - $ - $ - $ - $ - Senior Vice President, Chief Banking Operations Officer Phillip A. Scott $ 475,000 $ 128,250 $ 213,750 $ 320,625 $ 23,750 $ 281,719 $ 23,750 $ 305,469 $ 152,734 Senior Vice President, Chief Capital Markets Officer 1 Each NEO’s Incentive Compensation is made up of two components: Bankwide goals (90%) and Individual Performance (10%). 2 Overall weighted average result for Bankwide goals was 63.2% above target; for employees in the Risk Management Group the overall weighted average result was 66.2% above target. Payments are interpolated between the target and maximum amounts. 3 The Bankwide component is calculated as follows: a. The portion of the award for achieving target equals: Annual Salary multiplied by Bankwide component Percentage multiplied by Target percentage, plus b. The portion of the award for exceeding target equals: Annual Salary multiplied by Bankwide component Percentage multiplied by (Maximum minus Target) percentage multiplied by the above-target overall weighted average results as defined in note 2 above [i.e., 63.2% or 66.2%]. 4 Individual component is calculated as follows: Annual Salary multiplied by Individual Component multiplied by Target percentage (When participants receive an Individual Component award, the award amount is at Target. 5 There may be small differences in the calculated payout amounts due to rounding. 6 The Bank established a deferred compensation component for the Incentive Compensation Plan starting in 2012. The amount represented here is the Current Communicated Award of Incentive Compensation. The Current Communicated Incentive Award is the actual payout awarded to the NEO in 2020 for performance in 2019. [Refer to Section IV.A.2 (Required Deferral of IC Plan Awards for MC Members) of this Compensation Discussion and Analysis for further details]. (1)Each NEO’s Incentive Compensation is made up of two components: Bankwide goals (90%) and Individual Performance (10%).(2)Overall weighted average result for Bankwide goals was 85.3% above target; for employees in the Risk Management Group the overall weighted average result was 85.9% above target. Payments are interpolated between the target and maximum amounts.(3)The Bankwide component is calculated as follows:a.The portion of the award for achieving target equals: Annual Salary multiplied by Bankwide component Percentage multiplied by Target percentage, plusb.The portion of the award for exceeding target equals: Annual Salary multiplied by Bankwide component Percentage multiplied by (Maximum minus Target) percentage multiplied by the above-target overall weighted average results as defined in note 2 above [i.e., 85.3% or 85.9%].(4)Individual component is calculated as follows: Annual Salary multiplied by Individual Component multiplied by Target percentage (When participants receive an Individual Component award, the award amount is at Target, with exception to the CEO whose award amount is at Maximum for the Individual Component).(5)There may be small differences in the calculated payout amounts due to rounding.(6)The Bank established a deferred compensation component for the Incentive Compensation Plan starting in 2012. The amount represented here is the Current Communicated Award of Incentive Compensation. The Current Communicated Incentive Award is the actual payout awarded to the NEO in 2019 for performance in 2018. [Refer to Section IV.A.2 (Required Deferral of IC Plan Awards for MC Members) of this Compensation Discussion and Analysis for further details].certain senior executivesthe NEOs (refer to Section IV.DVI. 2. of the Compensation Discussion and Analysis, “Severance Plan and Executive Change in Control Agreements”, for further details). However, employees, including NEOs, receive: (a) cash compensation (i.e., base salary, and, for exempt employees, “variable” or “at risk” short-term incentive compensation); (b) retirement-related benefits (i.e., the Qualified Defined Benefit Plan; the Qualified Defined Contribution Plan; and the Nonqualified Defined Benefit Portion of the Benefit Equalization Plan (“DB BEP”)) and (c) health and welfare programs and other benefits. Other benefits, which are available to all regular employees, include medical, dental, vision care, life, business travel accident, and short and long term disability insurance, flexible spending accounts, an employee assistance program, educational development assistance, voluntary life insurance, long term care insurance, fitness club reimbursement and severance pay.(in(amounts in whole dollars): 2020 2019 % Increase $ 996,000 $ 993,600 0.24 % $ 550,000 $ 531,787 3.42 % Melody J. Feinberg $ 475,000 $ 438,813 8.25 % $ 438,790 $ 424,978 3.25 % Paul B. Héroux* $ - $ 345,769 - % Phillip A. Scott $ 490,438 $ 475,000 3.25 % Merit guidelines are determined each year and distributed to managers. These guidelines establish the maximumAnnual merit increase percentage permissible for employee performance during that year. In November of 2018, the C&HR Committee determined that merit-related officer base pay increases for 2019 would be 2.50% for officers rated ‘Meets Requirements’; 3.25% for officers rated ‘Exceeds Requirements’; and 4.25% for officers rated ‘Outstanding’ for their performance in 2018.Short-Term Incentive Compensation Plan (“Incentive Plan”)section IV.A.2 (Cash Compensation; Incentive Plan — Deferred PortionSection II of Incentive Compensation Plan) of thisthe Compensation Discussion and Analysis, “The Total Compensation Program” for further details.section IV.B.3Section IV (DC Plan) of this Compensation Discussion and Analysis for further details.
AND OPTION EXERCISES AND STOCK VESTEDsections IV.B.1and 2Sections IV of the Compensation Discussion and Analysis for further details about these plans): Pension Benefits Number of Present Value Payment During Years Credited of Accumulated Last Plan Name Service(1) Benefit(2) Fiscal Year Pentegra Defined Benefit Plan for Financial Institutions Qualified Plan 5.83 $ 476,000 $ - Nonqualified Defined Benefit Portion of the Benefit Equalization Plan 5.83 $ 4,015,000 $ - Pentegra Defined Benefit Plan for Financial Institutions Qualified Plan 18.33 $ 2,034,000 $ - Nonqualified Defined Benefit Portion of the Benefit Equalization Plan 18.33 $ 4,378,000 $ - Melody J. Feinberg Pentegra Defined Benefit Plan for Financial Institutions Qualified Plan 7.83 $ 525,000 $ - Nonqualified Defined Benefit Portion of the Benefit Equalization Plan 7.83 $ 657,000 $ - Pentegra Defined Benefit Plan for Financial Institutions Qualified Plan 30.00 $ 2,775,000 $ - Nonqualified Defined Benefit Portion of the Benefit Equalization Plan 30.00 $ 4,001,000 $ - Paul B. Héroux* Pentegra Defined Benefit Plan for Financial Institutions Qualified Plan 30.00 $ 2,768,000 $ - Nonqualified Defined Benefit Portion of the Benefit Equalization Plan 30.00 $ 5,769,000 $ 45,048 Phillip A. Scott Pentegra Defined Benefit Plan for Financial Institutions Qualified Plan 13.00 $ 996,000 $ - Nonqualified Defined Benefit Portion of the Benefit Equalization Plan 13.00 $ 1,384,000 $ - (1) Number of years of credited service pertains to eligibility/participation in the qualified plan. Assuming the NEO is eligible for the Nonqualified Defined Benefit Portion of the Benefit Equalization Plan, years of credited service are the same as for the Pentegra Defined Benefit Plan for Financial Institutions Qualified Plan. (2) As of 12/31/19. * P. Héroux, who held the CBOO position, left the Bank on September 30, 2019 and elected to begin receiving a distribution from the nonqualified defined benefit plan in 2019. The amounts listed under “Payment During Last Fiscal Year” is the total amount of distribution Mr. Héroux received in 2019. (1)Number of years of credited service pertains to eligibility/participation in the qualified plan. Assuming the NEO is eligible for the Nonqualified Defined Benefit Portion of the Benefit Equalization Plan, years of credited service are the same as for the Pentegra Defined Benefit Plan for Financial Institutions Qualified Plan.(2)As of 12/31/18.(whole(in whole dollars): Nonqualified Deferred Compensation for Fiscal Year 2019 Executive Registrant Aggregate Aggregate Aggregate Contributions in Contributions in Earnings in Withdrawals/ Balance at Name Last FY(1) Last FY(2) Last FY Distributions Last FYE José R. González DC BEP $ 74,049 $ 48,151 $ 31,827 $ - $ 264,813 NDICP $ - $ - $ - $ - $ - Kevin M. Neylan DC BEP $ 75,905 $ 28,078 $ 56,726 $ - $ 335,778 NDICP $ 105,383 $ - $ 35,200 $ - $ 232,897 Melody J. Feinberg DC BEP $ 1,294 $ 9,494 $ 8,738 $ - $ 45,946 NDICP $ 263,048 $ - $ 91,576 $ - $ 576,680 G. Robert Fusco DC BEP $ 8,953 $ 10,788 $ 17,648 $ - $ 83,789 NDICP $ - $ - $ - $ - $ - Paul B. Héroux* DC BEP $ 1,141 $ 3,946 $ - $ 42,117 $ - NDICP $ - $ - $ - $ - $ - Phillip S. Scott DC BEP $ 26,935 $ 17,538 $ 22,250 $ - $ 142,857 NDICP $ 171,208 $ - $ 69,734 $ - $ 489,044 (1) (1)These amounts as they pertain to the DC BEP and NDICP are also included in the “Salary” and “Non-Equity Incentive Compensation” columns of the Summary Compensation Table, respectively, forif an executive is an NEO in a particular year; these amounts would have been paid as salary or incentive compensation but for deferral into the nonqualified plans (described above as our DC BEP and NDICP).(2) These totals as they pertain to the DC BEP are also included in the “All Other Compensation” column of the Summary Compensation Table. There are no registrant contributions in connection with the NDICP. * P. Héroux, who held the CBOO position, left the Bank on September 30, 2019 and received a distribution from the nonqualified defined contribution plan in 2019 in accordance with previous elections he had made in compliance with IRS rules. The amounts listed under “Aggregate Withdrawals/Distributions” is the total amount of distribution Mr. Héroux received in 2019. NDICP are also included in the “Salary” and “Non-Equity Incentive Compensation” columns of the Summary Compensation Table, respectively, for NDICP.if an executive is an NEO in a particular year; these amounts would have been paid as salary or incentive compensation but for deferral into the nonqualified plans (described above as our DC BEP and NDICP).(2)These totals as they pertain to the DC BEP are also included in the “All Other Compensation” column of the Summary Compensation Table. There are no registrant contributions in connection with the NDICP.IV.D.1VI of the Compensation Discussion and Analysis, “Severance Plan”, for further details.)20182019 for reasons other than a change in control (for example, a reduction in force) (amounts in whole dollars): Number of Weeks Used to 2019 Annual Severance Amount Calculate Severance Amount Base Salary Based on Years of Service* 24 $ 993,600 $ 458,585 36 $ 531,787 $ 368,160 Melody J. Feinberg 32 $ 438,813 $ 270,038 36 $ 424,978 $ 294,215 Paul B. Héroux** 36 $ 345,769 $ 239,379 Phillip A. Scott 36 $ 475,000 $ 328,846 * Additionally, under the Bank’s Severance Plan, the Bank, in its discretion, may provide a payment to be used in connection with health insurance replacement costs. ** P. Héroux, who held the CBOO position, left the Bank on September 30, 2019. His total severance amount paid included 52 weeks of salary ($437,142) and health insurance replacement costs ($29,168).Refer to section IV.D.1 of this Compensation Discussion and Analysis, “Severance Plan”, for further details. * Additionally, under the Bank’s Severance Plan, the Bank, in its discretion, may provide a payment to be used in connection with health insurance replacement costs. of FHLBNY.. The CIC Agreements were renewed in January 2019 for an additional three-year period.20182019 (amounts in whole dollars). (Refer to section IV.D.2Section VI of the Compensation Discussion and Analysis, “Executive Change in Control Agreements”, for further details).Provision Jose González Kevin Neylan Paul Héroux Melody Feinberg G. Robert Fusco Phillip Scott Amount equal to the executive's average gross base salary for the three years prior to his employment termination date (with any partial years being annualized), multiplied by 2.99 for Mr. González, and 1.5 for Messrs. Neylan, Heroux, Fusco, and Ms. Feinberg $ 2,779,305 $ 765,793 $ 635,290 $ 625,303 $ 617,612 $ 638,125 Amount equal to the executive's full target incentive payout estimate, or the actual amount of the payment to the executive under the FHLBNY's Incentive Compensation Plan, if lower, in either case, in respect of the year prior to the year of the employment termination date, multiplied by 2.99 for Mr. González, and 1.5 for Messrs. Neylan, Héroux, Fusco, Scott, and Ms. Feinberg $ 2,093,000 $ 363,563 $ 307,542 $ 250,070 $ 298,984 $ 295,841 Amount equal to the cost of health, dental and vision care benefits that FHLBNY actually incurred by FHLBNY on behalf of the Executive and his dependents, if any, during the twelve (12) months prior to the executive's employment termination date $ 20,049 $ 29,168 $ 21,876 $ 1,137 $ 19,462 $ 19,972 A payment in the amount of $15,000 which may be used by the Executive for job search-related expenses $ 15,000 $ 15,000 $ 15,000 $ 15,000 $ 15,000 $ 15,000 A payment in the amount of $15,000 which may be used by the Executive for accounting, actuarial, financial, legal and/or tax services $ 15,000 $ 15,000 $ 15,000 $ 15,000 $ 15,000 $ 15,000 Additional age and service credits under the FHLBNY non-qualified Benefit Equalization Plan ("Nonqualified DB BEP") of three (3) years for Mr. González and one and one-half (1.5) years for Messrs. Neylan, Héroux, Fusco, Scott, and Ms. Feinberg $ 2,151,389 $ 526,585 $ 34,854 $ 358,110 $ 91,596 $ 451,326 Additional age and service credits under the FHLBNY qualified & non-qualified defined contribution plan of three (3) years for Mr. González and one and one-half (1.5) years for Messrs. Neylan, Heroux, Fusco, Scott, and Ms. Feinberg $ 178,848 $ 47,861 $ 39,343 $ 39,493 $ 38,248 $ 42,750 Total value of contracts $ 7,252,591 $ 1,762,970 $ 1,068,905 $ 1,304,113 $ 1,095,902 $ 1,478,014 IV.A.2IV of this Compensation Discussion and Analysis, “Deferred Portion of Incentive Compensation Plan”).2018,2019, the ratio of our CEO’s Total Compensation to the FHLBNYsFHLBNY’s median of the annual Total Compensation of all our employees, except the CEO (“Median Employee”) is 11.7:28.3:1. Total Compensation of the Median Employee for 20182019 is calculated in the same manner “Total Compensation” for 20182019 is shown for our CEO in the Summary Compensation Table, which includes among other things, amounts attributable to the change in pension value, which will vary among employees based upon their tenure at the FHLBNY. For 2018,2019, the Total Compensation of the Median Employee was $169,671$168,218 and the Total Compensation of the CEO, as reported in the Summary Compensation Table, was $1,978,173.$4,836,739.20182019 for each of the employees who were employed by the FHLBNY on October 1, 2018,2019, and ranking the annual cash compensation for all such employees (a list of 341363 employees) from lowest to highest, excluding the CEO. FHLBNY identified the Median Employee using base salaryCEO, and incentive awards, which was applied consistently to all our employees included in the calculation, and wecalculation. We believe this compensation measure reasonably reflects the annual compensation of all the FHLBNY employees.employees and was prepared under applicable SEC rules. The FHLBNY included all full-time and part-time employees in the calculation of the Median Employee and annualized all such employees who were not employed by us for all of 2018.2019.20182019 (whole dollars):(a)Director Estabrook began serving as a Committee Chair beginning with the August 2018 Board meeting.(b)Director Mroz began collecting Director fees starting with the May 2018 Board meeting.(c)Director Redman resigned from the Board prior to the May 2018 Board meeting.(d)Director Reed served as a Committee Chair through and until the June 2018 Board meeting. He resigned from the Board prior to the September 2018 Board meeting. He received in November 2018 an honorary award of $25,000 in recognition of his service. Change in Pension Value and Fees Non-Equity Nonqualified All Earned or Stock Option Incentive Plan Deferred Compensation Other Name Paid in Cash Awards Awards Compensation Earnings Compensation Total John R. Buran $ 133,000 $ — $ — $ — $ — $ — $ 133,000 Larry E. Thompson 118,000 — — — — — 118,000 Kevin Cummings 102,500 — — — — — 102,500 Joseph R. Ficalora 102,500 — — — — — 102,500 Jay M. Ford 116,000 — — — — — 116,000 Michael M. Horn 112,500 — — — — — 112,500 Thomas L. Hoy 112,500 — — — — — 112,500 David R. Huber 102,500 — — — — — 102,500 Charles E. Kilbourne, III 102,500 — — — — — 102,500 Gerald H. Lipkin 102,500 — — — — — 102,500 Kenneth J. Mahon 102,500 — — — — — 102,500 Christopher P. Martin 102,500 — — — — — 102,500 Richard S. Mroz 112,500 — — — — — 112,500 David J. Nasca 102,500 — — — — — 102,500 C. Cathleen Raffaeli 102,500 — — — — — 102,500 Stephen S. Romaine 102,500 — — — — — 102,500 DeForest B. Soaries, Jr. 112,500 — — — — — 112,500 Carlos J. Vázquez 112,500 — — — — — 112,500 Ángela Weyne 102,500 — — — — — 102,500 Total Fees $ 2,057,000 $ — $ — $ — $ — $ — $ 2,057,000 With respectIn determining appropriate and reasonable fee opportunities available to recent director compensation reviews, in September 2015FHLBNY Directors, the Board reviewed the matter of director compensation, and tooktakes into consideration recommendations contained in a director compensation survey performed earlier in the year by the McLagan firm. following factors:· the desire to attract and retain highly qualified and skilled individuals in order to help guide a complex and highly-regulated financial institution that is subject to a variety of financial, reputational and other risks; · the highly competitive environment for talent in the New York City metropolitan area— a center of world finance in which stock exchanges, securities companies and other sophisticated financial institutions are located; · the demands of the Director position, including the time and effort that Directors must devote to FHLBNY and Board business— demands that have grown over the past several years; · the overall performance of the FHLBNY, an institution that is a Federal Home Loan Bank System leader, a strong financial performer, a reliable source of liquidity for its customers, and a provider of a consistent dividend— and an institution which wishes to maintain this performance; · information pertaining to compensation opportunities available to directors of other Federal Home Loan Banks; and · director compensation surveys performed over time by outside compensation consulting firm McLagan, most recently in 2019— surveys which provide the Directors with the ability to compare Director compensation opportunities with compensation opportunities available at other institutions. determined that an adjustment to Director compensation limits in 2016 inreviews the amountissue of $15,000 per Director was appropriate given the FHLBNY’s performance. The Board noted that the increases were generally at the low end of the ranges suggested by McLagan’s study, and that the comparators used in the study appeared appropriate. In September 2016, the Board determined that the 2016 director compensation structure continued to remain appropriate and did not require adjustment for 2017. In June 2017, the Board once again reviewed the matter of director compensation, and took into consideration recommendations contained in a director compensation survey performed earlier in the year by McLagan. The Board determined thatreasonable Director fee opportunities on an adjustment to Director compensation limits in 2018 in the amount of $7,500 per Director was appropriate given the FHLBNY’s continued financial performance. The Board noted that the increases were generally at the low end of the ranges suggested by McLagan’s study, and that the comparators used in the study appeared appropriate. Finally, as a result of a review in 2018 of Director compensation opportunities at other FHLBanks, the Board determined to raise the compensation opportunity for each of the Board Chair, Board Vice Chair, and Audit Committee Chair effective January 1, 2019 to $133,000, $118,000 and $116,000, respectively. No other changes were made.annual basis.2018.2019. Following these tables are additional tables summarizing the Director fees and the annual compensation limits set by the Board for 2019.2020.Director Fee Opportunities — 2018 (in whole dollars)
Meeting Attended (Paid
Quarterly in Arrears) (a)Director Annual Compensation Limits — 2018 (in whole dollars)
Meeting Attended (Paid
Quarterly in Arrears) (c) Fees For Each Board
Meeting Attended (Paid
Quarterly in Arrears) (b) $ 16,625 $ 14,750 (b)(a) $ 14,500 (b)(a) $ 14,060 $ 12,810 Position Annual Limit Chairman $ 133,000 Vice Chairman $ 118,000 Audit Committee Chair $ 116,000 All Other Committee Chairs $ 112,500 All Other Directors $ 102,500 Position Fees For Each Board
Meeting Attended (Paid
Quarterly in Arrears) (c) Chairman $ 18,125 Vice Chairman $ 15,625 Committee Chairs(a) $ 15,250 All Other Directors $ 14,060 Position Annual Limit Chairman $ 145,000 Vice Chairman $ 125,000 Committee Chairs $ 122,000 All Other Directors $ 112,500 (a) A Committee Chair does not receive any additional payment if he or she serves as the Chair of more than one Board Committee. In addition, the Board Chair and Board Vice Chair do not receive any additional compensation if they serve as a Chair of one or more Board Committees. (b) The numbers in this column represent payments for each of eight meetings attended by the Board Chair, the Board Vice Chair and the Audit Committee Chair. The numbers in this column also represent payments for each of seven meetings attended by all other Committee Chairs and all other Directors. If an eighth meeting is attended by the other Committee Chairs, they will receive $14,080 for that eighth meeting; all other Directors will receive $12,830 for that eighth meeting. (c) The numbers in this column represent payments for each of eight meetings attended by the Board Chair, the Board Vice Chair and the Committee Chairs. The numbers in this column also represent payments for each of seven meetings attended by all other Directors. If an eighth meeting is attended by the other Directors, they will receive $14,080 for that eighth meeting. (a)The numbers in this column represent payments for each of seven meetings attended. If an eighth meeting is attended, the Chairman will receive $15,990 for that meeting; the Vice Chairman will receive $14,080 for that meeting; Committee Chairs will receive $14,080 for that meeting; and all other Directors will receive $12,830 for that meeting.(b)A Committee Chair does not receive any additional payment if he or she serves as the Chair of more than one Board Committee. In addition, the Board Chair and Board Vice Chair do not receive any additional compensation if they serve as a Chair of one or more Board Committees.(c)The numbers in this column represent payments for each of eight meetings attended by the Board Chair, the Board Vice Chair and the Audit Committee Chair. The numbers in this column also represent payments for each of seven meetings attended by all other Committee Chairs and all other Directors. If an eighth meeting is attended by the other Committee Chairs, they will receive $14,080 for that eighth meeting; all other Directors will receive $12,830 for that eighth meeting.·· Meetings of the Board and Board Committees · Meetings requested by the Federal Housing Finance Agency · Meetings of Federal Home Loan Bank System committees · Federal Home Loan Bank System director orientation meetings · Meetings of the Council of Federal Home Loan Banks and Council committees · Attendance at other events on behalf of the Bank with prior approval · Meetings requested by the Federal Housing Finance Agency· Meetings of Federal Home Loan Bank System committees234· Federal Home Loan Bank System director orientation meetings· Meetings of the Council of Federal Home Loan Banks and Council committees· Attendance at other events on behalf of the Bank with prior approval of the Board of DirectorsItem 12.Security Ownership of Certain Beneficial Owners and Management and Related Stockholder Matters.Item 12. Security Ownership of Certain Beneficial Owners and Management and Related Stockholder Matters. 28, 201929, 2020 and December 31, 2018:2019:(a)New York Commercial Bank merged into New York Community Bank in the fourth quarter 2018. Number Percent February 29, 2020 of Shares of Total Name of Beneficial Owner Principal Executive Office Address Owned Capital Stock Citibank, N.A. 399 Park Avenue, New York, NY 10043 8,805 16.15 % Metropolitan Life Insurance Company 200 Park Avenue, New York, NY 10166 7,366 13.51 New York Community Bank 615 Merrick Avenue, Westbury, NY 11590 6,337 11.62 22,508 41.28 % Number Percent December 31, 2019 of Shares of Total Name of Beneficial Owner Principal Executive Office Address Owned Capital Stock Citibank, N.A. 399 Park Avenue, New York, NY 10043 11,370 19.66 % Metropolitan Life Insurance Company 200 Park Avenue, New York, NY 10166 7,366 12.74 New York Community Bank 615 Merrick Avenue, Westbury, NY 11590 6,476 11.20 AXA Equitable Life Insurance Company 1290 Avenue of the Americas, New York, 10104 3,222 5.57 28,434 49.17 % Number Percent of Shares of Total Director City State Owned Capital Stock (a) Josepeh R.Ficalora Westbury NY 6,476 11.20 % Kevin Cummings Short Hills NJ 2,671 4.62 Gerald H. Lipkin Wayne NJ 1,375 2.38 Christopher P.Martin Iselin NJ 571 0.99 Flushing Bank John R. Buran Uniondale NY 569 0.98 Kenneth J. Mahon Brooklyn NY 560 0.97 Carlos J. Vázquez San Juan PR 226 0.39 (b) Carlos J. Vázquez San Juan PR 212 0.37 Thomas L. Hoy Glens Falls NY 79 0.14 Jay M. Ford Wildwood NJ 29 0.05 Evans Bank, N.A David J. Nasca Hamburg NY 16 0.03 12,784 22.12 % (a)New York Commercial Bank merged into New York Community Bank in the fourth quarter 2018.(b)Banco Popular North America changed its name to Popular Bank in the second quarter 2018.Item 13.Certain Relationships and Related Transactions, and Director Independence.Item 13. Certain Relationships and Related Transactions, and Director Independence. 20182019 through and including the date of this annual report on Form 10-K, the Bank had a total of 2219 directors serving on its Board, 1211 of whom were Member Directors (i.e., directors elected by the Bank’s members who are officers or directors of Bank members) and 108 of whom were Independent Directors (i.e., directors elected by the Bank’s members who are not officers or directors of Bank members). All of the Bank’s directors were independent of management from the standpoint that they were not, and could not serve as, Bank employees or officers. Also, all individuals, including the Bank’s directors, are prohibited by law from personally owning stock or stock options in the Bank. In addition, the Bank is required to determine whether at least some of its directors are independent under two distinct director independence standards. First, Federal Housing Finance Agency (Finance Agency) regulations establish independence criteria for directors who serve as members of the Audit Committee of the Board of Directors. Second, for disclosure purposes, the Securities and Exchange Commission’s (SEC) regulations require that the Bank’sBank disclose whether the members of its Board of Directors applyare independent under the independence criteria of a national securities exchange or automatedan inter-dealer quotation system in20182019 through and including the date of this Annual Report on Form 10-K, the Board has determined that all of the persons who served as a director of the Bank, including all directors who served as members of the Audit Committee, were independent under these criteria.20182019 through and including the date of this annual report on Form 10-K (i.e., Anne Evans Estabrook, Michael M. Horn, David R. Huber, Charles E. Kilbourne, III, Richard S. Mroz, C. Cathleen Raffaeli, Edwin C. Reed, DeForest B. Soaries, Jr., Larry E. Thompson and Ángela Weyne) were independent. Monte N. Redman, Stephen S. Romaine, and Carlos J. Vázquez) were independent under the NYSE independence standards.20182019 through and including the date of this annual report on Form 10-K (Kevin Cummings, Joseph R. Ficalora, Jay M. Ford, Thomas L. Hoy and Christopher P. Martin and Monte N. Redman)Martin) were independent under the NYSE standards for such committee members. The Board also determined that the Independent Directors who served as members of the Board’s Audit Committee during the period from January 1, 20182019 through and including the date of this annual report on Form 10-K (David R. Huber and Ángela Weyne) were independent under the NYSE independence standards for such committee members. The Board also applied Rule 10A-3 to assess the independence of the members of its Audit Committee. Under Rule 10A-3, in order to be considered independent, a member of the Audit Committee may not, other than in his or her capacity as a member of the Board or any other Board Committee (i) accept any consulting, advisory, or other compensation from us or (ii) be an affiliated person of the Bank. During the period from January 1, 20182019 through and including the date of this annual report on Form 10-K, all of our directors, including all members of our Audit Committee, were independent under these criteria.20182019 through and including the date of this annual report on Form 10-K (Kevin Cummings, Gerald H. Lipkin, Christopher P. Martin, David J. Nasca Monte N. Redman and Stephen S. Romaine) were independent under the NYSE standards for such committee members. The Board also determined that the Independent Directors who served as members of the Board’s C&HRC during the period from January 1, 20182019 through and including the date of this annual report on Form 10-K (C. Cathleen Raffaeli and DeForest B. Soaries, Jr.) were independent under the NYSE independence standards for such committee members.Item 14.Principal Accounting Fees and Services.Item 14. Principal Accounting Fees and Services. 2017 and 20162017 (in thousands): Years ended December 31, 2019(a) 2018(a) 2017(a) $ 874 $ 1,017 $ 828 148 134 60 12 35 8 1 4 4 $ 1,035 $ 1,190 $ 900 (a)The amounts in the table do not include the assessment from the Office of Finance (OF) for the Bank’s share of the audit fees of approximately $63 thousand, $62 thousand and $58 thousand for 2018, 2017 and 2016, incurred in connection with the audit of the combined financial statements published by the OF.(a) The amounts in the table do not include the assessment from the Office of Finance (OF) for the Bank’s share of the audit fees of approximately $66 thousand, $63 thousand and $62 thousand for 2019, 2018 and 2017, incurred in connection with the audit of the combined financial statements published by the OF. Item 15.Exhibits, Financial Statement Schedules.Item 15. Exhibits, Financial Statement Schedules.
this Form
10-K3.13.24.110.1X 10.01 Bank 2016 Incentive Compensation Plan(a) 10.210.310.410.510.610.710-K3/22/201810.8X 8-K12/9/201610.9X10.1110.12X10-K 3/21/2019 31.18-K 8/5/2011 31.01 Certification of Registrant’s Chief Executive Officer, as required by Section 302 of the Sarbanes-Oxley Act of 2002 31.232.1No. Exhibit Description Filed with
this Form
10-KForm* Date Filed 32.2No. Exhibit DescriptionFiled withthis Form10-KForm*Date Filed99.01 99.199.2SIGNATURES 21, 201920, 202021, 201921, 201921, 201921, 201921, 201921, 201921, 201921, 201921, 201921, 2019/s/ David R. Huber 21, 2019Signature Title Date 21, 201921, 201921, 201921, 201921, 201921, 201921, 201921, 201921, 201921, 201921, 2019