| Delaware | 04-3510455 | |||||||
(State or other jurisdiction of incorporation or organization) | (I.R.S. Employer Identification No.) | |||||||
| 60 State Street | Boston | Massachusetts | 02109 | |||||||||||
| (Address of principal executive offices) | (Zip Code) | |||||||||||||
| Title of each class | Trading Symbol(s) | Name of Exchange on which registered | ||||||||||||||||||
| Common stock, par value $0.01 per share | BHLB | New York Stock Exchange | ||||||||||||||||||
Large Accelerated Filer | x | Accelerated Filer | ☐ | |||||||||||
Non-Accelerated Filer | o | Smaller Reporting Company | ☐ | |||||||||||
| Emerging Growth Company | ☐ | |||||||||||||
| TABLE INDEX | |||||||||||

| 2023 | 2022 | 2021 | ||||||||||||||||||||||||||||||
| (In millions) | Amount | Percent of Total | Amount | Percent of Total | Amount | Percent of Total | ||||||||||||||||||||||||||
| Loans: | ||||||||||||||||||||||||||||||||
| Construction | $ | 640 | 7.1 | % | $ | 320 | 3.9 | % | $ | 324 | 4.7 | % | ||||||||||||||||||||
| Commercial multifamily | 599 | 6.6 | 620 | 7.5 | 516 | 7.6 | ||||||||||||||||||||||||||
| Commercial real estate owner occupied | 629 | 7.0 | 641 | 7.7 | 607 | 8.9 | ||||||||||||||||||||||||||
| Commercial real estate non-owner occupied | 2,607 | 28.8 | 2,496 | 29.9 | 2,157 | 31.6 | ||||||||||||||||||||||||||
| Commercial and industrial | 1,359 | 15.1 | 1,445 | 17.3 | 1,285 | 18.8 | ||||||||||||||||||||||||||
| Residential real estate | 2,760 | 30.5 | 2,312 | 27.7 | 1,489 | 21.8 | ||||||||||||||||||||||||||
| Home equity | 224 | 2.5 | 227 | 2.7 | 252 | 3.7 | ||||||||||||||||||||||||||
| Consumer other | 221 | 2.4 | 274 | 3.3 | 196 | 2.9 | ||||||||||||||||||||||||||
| Total | $ | 9,039 | 100.0 | % | $ | 8,335 | 100.0 | % | $ | 6,826 | 100.0 | % | ||||||||||||||||||||
| Allowance for credit losses | (105) | (96) | (106) | |||||||||||||||||||||||||||||
| Net loans | $ | 8,934 | $ | 8,239 | $ | 6,720 | ||||||||||||||||||||||||||
| 2017 | 2016 | 2015 | 2014 | 2013 | |||||||||||||||||||||||||||||||
| Percent | Percent | Percent | Percent | Percent | |||||||||||||||||||||||||||||||
| of | of | of | of | of | |||||||||||||||||||||||||||||||
| (In millions) | Amount | Total | Amount | Total | Amount | Total | Amount | Total | Amount | Total | |||||||||||||||||||||||||
| Commercial real estate | $ | 3,264 | 39 | % | $ | 2,617 | 40 | % | $ | 2,060 | 36 | % | $ | 1,612 | 35 | % | $ | 1,417 | 34 | % | |||||||||||||||
| Commercial and industrial loans | 1,804 | 22 | 1,062 | 16 | 1,048 | 18 | 804 | 17 | 687 | 16 | |||||||||||||||||||||||||
| Total commercial loans | 5,068 | 61 | 3,679 | 56 | 3,108 | 54 | 2,416 | 52 | 2,104 | 50 | |||||||||||||||||||||||||
| Residential mortgages | 2,103 | 25 | 1,893 | 29 | 1,815 | 32 | 1,496 | 32 | 1,384 | 33 | |||||||||||||||||||||||||
| Consumer | 1,128 | 14 | 978 | 15 | 802 | 14 | 768 | 16 | 692 | 17 | |||||||||||||||||||||||||
| Total loans | $ | 8,299 | 100 | % | $ | 6,550 | 100 | % | $ | 5,725 | 100 | % | $ | 4,680 | 100 | % | $ | 4,180 | 100 | % | |||||||||||||||
| Allowance for loan losses | (52 | ) | (44 | ) | (39 | ) | (35 | ) | (33 | ) | |||||||||||||||||||||||||
| Net loans | $ | 8,247 | $ | 6,506 | $ | 5,686 | $ | 4,645 | $ | 4,147 | |||||||||||||||||||||||||
| Contractual Maturity | One Year | One to | More Than | |||||||||||||
| (In thousands) | or Less | Five Years | Five Years | Total | ||||||||||||
| Construction real estate loans: | ||||||||||||||||
| Commercial | $ | 59,909 | $ | 206,427 | $ | — | $ | 266,336 | ||||||||
| Residential | 2,717 | 124 | 2,569 | 5,410 | ||||||||||||
| Commercial and industrial loans | 307,577 | 918,136 | 578,226 | 1,803,939 | ||||||||||||
| Total | $ | 370,203 | $ | 1,124,687 | $ | 580,795 | $ | 2,075,685 | ||||||||
| Contractual Maturity | One Year | One to | Five to | More Than | ||||||||||||||||||||||||||||
| (In thousands) | or Less | Five Years | Fifteen Years | Fifteen Years | Total | |||||||||||||||||||||||||||
| Loans: | ||||||||||||||||||||||||||||||||
| Construction | $ | 979 | $ | 471,837 | $ | 155,573 | $ | 11,982 | $ | 640,371 | ||||||||||||||||||||||
| Commercial multifamily | 564 | 184,183 | 412,290 | 2,108 | 599,145 | |||||||||||||||||||||||||||
| Commercial real estate owner occupied | 2,741 | 169,940 | 369,367 | 86,598 | 628,646 | |||||||||||||||||||||||||||
| Commercial real estate non-owner occupied | 34,626 | 1,336,589 | 1,193,906 | 41,288 | 2,606,409 | |||||||||||||||||||||||||||
| Commercial and industrial | 89,765 | 935,592 | 318,503 | 15,389 | 1,359,249 | |||||||||||||||||||||||||||
| Residential real estate | 237 | 24,570 | 205,675 | 2,529,830 | 2,760,312 | |||||||||||||||||||||||||||
| Home equity | 69 | 1,017 | 54,277 | 168,860 | 224,223 | |||||||||||||||||||||||||||
| Consumer other | 805 | 128,844 | 74,985 | 16,697 | 221,331 | |||||||||||||||||||||||||||
| Total | $ | 129,786 | $ | 3,252,572 | $ | 2,784,576 | $ | 2,872,752 | $ | 9,039,686 | ||||||||||||||||||||||
| (In thousands) | Fixed Interest Rate | Variable Interest Rate | Total | |||||||||||||||||
| Loans: | ||||||||||||||||||||
| Construction | $ | 187,736 | $ | 451,656 | $ | 639,392 | ||||||||||||||
| Commercial multifamily | 129,014 | 469,567 | 598,581 | |||||||||||||||||
| Commercial real estate owner occupied | 230,994 | 394,911 | 625,905 | |||||||||||||||||
| Commercial real estate non-owner occupied | 1,070,743 | 1,501,040 | 2,571,783 | |||||||||||||||||
| Commercial and industrial | 393,534 | 875,950 | 1,269,484 | |||||||||||||||||
| Residential real estate | 1,813,349 | 946,726 | 2,760,075 | |||||||||||||||||
| Home equity | 3,421 | 220,733 | 224,154 | |||||||||||||||||
| Consumer other | 214,207 | 6,319 | 220,526 | |||||||||||||||||
| Total | $ | 4,042,998 | $ | 4,866,902 | $ | 8,909,900 | ||||||||||||||
| (In thousands) | 2017 | 2016 | 2015 | 2014 | 2013 | |||||||||||||||
| Non-accruing loans: | ||||||||||||||||||||
| Commercial real estate | $ | 7,267 | $ | 5,883 | $ | 4,882 | $ | 12,878 | $ | 13,739 | ||||||||||
| Commercial and industrial loans | 7,311 | 7,523 | 8,259 | 1,705 | 2,355 | |||||||||||||||
| Residential mortgages | 2,883 | 3,795 | 3,966 | 3,908 | 7,868 | |||||||||||||||
| Consumer | 5,438 | 5,039 | 3,768 | 3,214 | 3,493 | |||||||||||||||
| Total non-performing loans | 22,899 | 22,240 | 20,875 | 21,705 | 27,455 | |||||||||||||||
| Real estate owned | — | 151 | 1,725 | 2,049 | 2,758 | |||||||||||||||
| Repossessed assets | 1,147 | — | — | — | — | |||||||||||||||
| Total non-performing assets | $ | 24,046 | $ | 22,391 | $ | 22,600 | $ | 23,754 | $ | 30,213 | ||||||||||
| Troubled debt restructurings (accruing) | $ | 36,172 | $ | 28,241 | $ | 12,497 | $ | 12,612 | $ | 8,344 | ||||||||||
| Accruing loans 90+ days past due | $ | 16,480 | $ | 9,863 | $ | 5,229 | $ | 4,568 | $ | 9,223 | ||||||||||
| Total non-performing loans/total loans | 0.28 | % | 0.34 | % | 0.36 | % | 0.46 | % | 0.66 | % | ||||||||||
| Total non-performing assets/total assets | 0.21 | % | 0.24 | % | 0.29 | % | 0.37 | % | 0.53 | % | ||||||||||
| 2023 | 2022 | 2021 | ||||||||||||||||||||||||||||||
| Ratios: | ||||||||||||||||||||||||||||||||
| Allowance for credit losses on loans/total loans | 1.17 | % | 1.15 | % | 1.55 | % | ||||||||||||||||||||||||||
| Nonaccrual loans/total loans | 0.24 | % | 0.37 | % | 0.52 | % | ||||||||||||||||||||||||||
| Allowance for credit losses/nonaccruing loans | 492.47 | % | 309.41 | % | 300.33 | % | ||||||||||||||||||||||||||
| Net charge-offs/average loans | 0.26 | % | 0.27 | % | 0.29 | % | ||||||||||||||||||||||||||
| 2023 | 2022 | 2021 | ||||||||||||||||||
| Net charge-offs to average loans: | ||||||||||||||||||||
| Construction | — | % | — | % | — | % | ||||||||||||||
| Commercial multifamily | — | — | — | |||||||||||||||||
| Commercial real estate owner occupied | (0.01) | — | 0.02 | |||||||||||||||||
| Commercial real estate non-owner occupied | — | 0.06 | 0.17 | |||||||||||||||||
| Commercial and industrial | 0.17 | 0.20 | 0.09 | |||||||||||||||||
| Residential real estate | — | (0.01) | — | |||||||||||||||||
| Home equity | — | — | — | |||||||||||||||||
| Consumer other | 0.10 | 0.02 | 0.01 | |||||||||||||||||
| (In thousands) | 2017 | 2016 | 2015 | 2014 | 2013 | |||||||||||||||
| Balance at beginning of year | $ | 43,998 | $ | 39,308 | $ | 35,662 | $ | 33,323 | $ | 33,208 | ||||||||||
| Charged-off loans: | ||||||||||||||||||||
| Commercial real estate | 4,646 | 3,104 | 7,546 | 5,684 | 5,026 | |||||||||||||||
| Commercial and industrial loans | 4,217 | 5,715 | 3,110 | 3,010 | 2,917 | |||||||||||||||
| Residential mortgages | 1,603 | 2,865 | 1,857 | 2,596 | 2,426 | |||||||||||||||
| Consumer | 4,118 | 2,342 | 2,175 | 2,563 | 2,467 | |||||||||||||||
| Total charged-off loans | 14,584 | 14,026 | 14,688 | 13,853 | 12,836 | |||||||||||||||
| Recoveries on charged-off loans: | ||||||||||||||||||||
| Commercial real estate | 235 | 303 | 582 | 270 | 549 | |||||||||||||||
| Commercial and industrial loans | 424 | 389 | 458 | 228 | 211 | |||||||||||||||
| Residential mortgages | 313 | 304 | 205 | 365 | 399 | |||||||||||||||
| Consumer | 423 | 358 | 363 | 361 | 414 | |||||||||||||||
| Total recoveries | 1,395 | 1,354 | 1,608 | 1,224 | 1,573 | |||||||||||||||
| Net loans charged-off | 13,189 | 12,672 | 13,080 | 12,629 | 11,263 | |||||||||||||||
| Provision for loan losses | 21,025 | 17,362 | 16,726 | 14,968 | 11,378 | |||||||||||||||
| Balance at end of year | $ | 51,834 | $ | 43,998 | $ | 39,308 | $ | 35,662 | $ | 33,323 | ||||||||||
| Ratios: | ||||||||||||||||||||
| Net charge-offs/average loans | 0.19 | % | 0.21 | % | 0.25 | % | 0.29 | % | 0.29 | % | ||||||||||
| Recoveries/charged-off loans | 9.57 | 9.65 | 10.95 | 8.84 | 12.25 | |||||||||||||||
| Net loans charged-off/allowance for loan losses | 25.44 | 28.80 | 33.28 | 35.41 | 33.80 | |||||||||||||||
| Allowance for loan losses/total loans | 0.62 | 0.67 | 0.69 | 0.76 | 0.80 | |||||||||||||||
| Allowance for loan losses/non-accruing loans | 226.36 | 197.83 | 188.30 | 164.30 | 121.37 | |||||||||||||||
| 2023 | 2022 | 2021 | ||||||||||||||||||||||||||||||||||||||||||||||||||||||||||||
| (Dollars in thousands) | Amount Allocated | Percent Allocated to Total Loans in Each Category | Amount Allocated | Percent Allocated to Total Loans in Each Category | Amount Allocated | Percent Allocated to Total Loans in Each Category | ||||||||||||||||||||||||||||||||||||||||||||||||||||||||
| Construction | $ | 2,885 | 0.5 | % | $ | 1,227 | 0.4 | % | $ | 3,206 | 1.0 | % | ||||||||||||||||||||||||||||||||||||||||||||||||||
| Commercial multifamily | 2,475 | 0.4 | 1,810 | 0.3 | 6,120 | 1.2 | ||||||||||||||||||||||||||||||||||||||||||||||||||||||||
| Commercial real estate owner occupied | 9,443 | 1.5 | 10,739 | 1.7 | 12,752 | 2.1 | ||||||||||||||||||||||||||||||||||||||||||||||||||||||||
| Commercial real estate non-owner occupied | 38,221 | 1.5 | 30,724 | 1.2 | 32,106 | 1.5 | ||||||||||||||||||||||||||||||||||||||||||||||||||||||||
| Commercial and industrial | 18,602 | 1.4 | 18,743 | 1.3 | 22,584 | 1.8 | ||||||||||||||||||||||||||||||||||||||||||||||||||||||||
| Residential real estate | 19,622 | 0.7 | 18,666 | 0.8 | 22,734 | 1.5 | ||||||||||||||||||||||||||||||||||||||||||||||||||||||||
| Home equity | 2,015 | 0.9 | 2,173 | 1.0 | 4,006 | 1.6 | ||||||||||||||||||||||||||||||||||||||||||||||||||||||||
| Consumer other | 12,094 | 5.5 | 12,188 | 4.5 | 2,586 | 1.3 | ||||||||||||||||||||||||||||||||||||||||||||||||||||||||
| Total | $ | 105,357 | 1.2 | % | $ | 96,270 | 1.2 | % | $ | 106,094 | 1.6 | % | ||||||||||||||||||||||||||||||||||||||||||||||||||
| 2023 | 2022 | 2021 | ||||||||||||||||||||||||||||||||||||||||||||||||||||||||||||
| (Dollars in thousands) | Amount Allocated | Percent of Loans in Each Category to Total Loans | Amount Allocated | Percent of Loans in Each Category to Total Loans | Amount Allocated | Percent of Loans in Each Category to Total Loans | ||||||||||||||||||||||||||||||||||||||||||||||||||||||||
| Construction | $ | 2,885 | 7.1 | % | $ | 1,227 | 3.8 | % | $ | 3,206 | 4.8 | % | ||||||||||||||||||||||||||||||||||||||||||||||||||
| Commercial multifamily | 2,475 | 6.6 | 1,810 | 7.4 | 6,120 | 7.5 | ||||||||||||||||||||||||||||||||||||||||||||||||||||||||
| Commercial real estate owner occupied | 9,443 | 7.0 | 10,739 | 7.7 | 12,752 | 8.9 | ||||||||||||||||||||||||||||||||||||||||||||||||||||||||
| Commercial real estate non-owner occupied | 38,221 | 28.8 | 30,724 | 30.0 | 32,106 | 31.6 | ||||||||||||||||||||||||||||||||||||||||||||||||||||||||
| Commercial and industrial | 18,602 | 15.0 | 18,743 | 17.4 | 22,584 | 18.8 | ||||||||||||||||||||||||||||||||||||||||||||||||||||||||
| Residential real estate | 19,622 | 30.5 | 18,666 | 27.7 | 22,734 | 21.8 | ||||||||||||||||||||||||||||||||||||||||||||||||||||||||
| Home equity | 2,015 | 2.5 | 2,173 | 2.7 | 4,006 | 3.7 | ||||||||||||||||||||||||||||||||||||||||||||||||||||||||
| Consumer other | 12,094 | 2.5 | 12,188 | 3.3 | 2,586 | 2.9 | ||||||||||||||||||||||||||||||||||||||||||||||||||||||||
| Total | $ | 105,357 | 100.0 | % | $ | 96,270 | 100.0 | % | $ | 106,094 | 100.0 | % | ||||||||||||||||||||||||||||||||||||||||||||||||||
| 2017 | 2016 | 2015 | 2014 | 2013 | |||||||||||||||||||||||||||||||
| (Dollars in thousands) | Amount Allocated | Percent Allocated to Total Loans in Each Category | Amount Allocated | Percent Allocated to Total Loans in Each Category | Amount Allocated | Percent Allocated to Total Loans in Each Category | Amount Allocated | Percent Allocated to Total Loans in Each Category | Amount Allocated | Percent Allocated to Total Loans in Each Category | |||||||||||||||||||||||||
| Commercial real estate | $ | 20,699 | 0.63 | % | $ | 18,801 | 0.72 | % | $ | 16,494 | 0.80 | % | $ | 15,539 | 0.96 | % | $ | 16,112 | 1.13 | % | |||||||||||||||
| Commercial and industrial loans | 14,975 | 0.83 | % | 10,611 | 1.00 | % | 8,715 | 0.83 | % | 6,322 | 0.79 | % | 5,770 | 0.85 | % | ||||||||||||||||||||
| Residential mortgages | 10,018 | 0.48 | % | 8,571 | 0.45 | % | 8,589 | 0.47 | % | 7,480 | 0.50 | % | 7,562 | 0.55 | % | ||||||||||||||||||||
| Consumer | 6,142 | 0.54 | % | 6,015 | 0.61 | % | 5,510 | 0.69 | % | 6,321 | 0.82 | % | 3,879 | 0.56 | % | ||||||||||||||||||||
| Total | $ | 51,834 | 0.62 | % | $ | 43,998 | 0.67 | % | $ | 39,308 | 0.69 | % | $ | 35,662 | 0.76 | % | $ | 33,323 | 0.80 | % | |||||||||||||||
| 2017 | 2016 | 2015 | 2014 | 2013 | |||||||||||||||||||||||||||||||
| (Dollars in thousands) | Amount Allocated | Percent of Loans in Each Category to Total Loans | Amount Allocated | Percent of Loans in Each Category to Total Loans | Amount Allocated | Percent of Loans in Each Category to Total Loans | Amount Allocated | Percent of Loans in Each Category to Total Loans | Amount Allocated | Percent of Loans in Each Category to Total Loans | |||||||||||||||||||||||||
| Commercial real estate | $ | 20,699 | 39.33 | % | $ | 18,801 | 39.95 | % | $ | 16,494 | 41.96 | % | $ | 15,539 | 34.43 | % | $ | 16,112 | 41.26 | % | |||||||||||||||
| Commercial and industrial loans | 14,975 | 21.74 | % | 10,611 | 16.22 | % | 8,715 | 22.10 | % | 6,322 | 17.19 | % | 5,770 | 9.08 | % | ||||||||||||||||||||
| Residential mortgages | 10,018 | 25.34 | % | 8,571 | 28.90 | % | 8,589 | 21.91 | % | 7,480 | 31.97 | % | 7,562 | 33.11 | % | ||||||||||||||||||||
| Consumer | 6,142 | 13.59 | % | 6,015 | 14.93 | % | 5,510 | 14.03 | % | 6,321 | 16.41 | % | 3,879 | 16.55 | % | ||||||||||||||||||||
| Total | $ | 51,834 | 100.00 | % | $ | 43,998 | 100.00 | % | $ | 39,308 | 100.00 | % | $ | 35,662 | 100.00 | % | $ | 33,323 | 100.00 | % | |||||||||||||||
| 2017 | 2016 | 2015 | ||||||||||||||||||||||
| (In thousands) | Amortized Cost | Fair Value | Amortized Cost | Fair Value | Amortized Cost | Fair Value | ||||||||||||||||||
| Securities available for sale | ||||||||||||||||||||||||
| Municipal bonds and obligations | $ | 113,427 | $ | 118,233 | $ | 117,910 | $ | 119,816 | $ | 99,922 | $ | 104,561 | ||||||||||||
| Mortgage-backed securities | 1,142,656 | 1,130,403 | 948,661 | 945,129 | 960,907 | 959,865 | ||||||||||||||||||
| Other bonds and obligations | 131,167 | 132,278 | 78,877 | 79,051 | 57,742 | 56,064 | ||||||||||||||||||
| Marketable equity securities | 36,483 | 45,185 | 47,858 | 65,541 | 30,522 | 33,967 | ||||||||||||||||||
| Total securities available for sale | $ | 1,423,733 | $ | 1,426,099 | $ | 1,193,306 | $ | 1,209,537 | $ | 1,149,093 | $ | 1,154,457 | ||||||||||||
| Securities held to maturity | ||||||||||||||||||||||||
| Municipal bonds and obligations | $ | 270,310 | $ | 278,895 | $ | 203,463 | $ | 204,986 | $ | 94,642 | $ | 97,967 | ||||||||||||
| Mortgage-backed securities | 92,115 | 92,242 | 95,302 | 95,495 | 68 | 71 | ||||||||||||||||||
| Tax advantaged economic development bonds | 34,357 | 33,818 | 35,278 | 36,874 | 36,613 | 38,537 | ||||||||||||||||||
| Other bonds and obligations | 321 | 321 | 325 | 325 | 329 | 329 | ||||||||||||||||||
| Total securities held to maturity | $ | 397,103 | $ | 405,276 | $ | 334,368 | $ | 337,680 | $ | 131,652 | $ | 136,904 | ||||||||||||
| Trading account security | $ | 10,755 | $ | 12,277 | $ | 11,387 | $ | 13,229 | $ | 11,984 | $ | 14,189 | ||||||||||||
| Restricted equity securities | $ | 63,085 | $ | 63,085 | $ | 71,112 | $ | 71,112 | $ | 71,018 | $ | 71,018 | ||||||||||||
| 2017 | 2016 | 2015 | ||||||||||||||||||||||
| (In thousands) | Amortized Cost | Fair Value | Amortized Cost | Fair Value | Amortized Cost | Fair Value | ||||||||||||||||||
| U.S. Treasuries, other Government agencies and corporations | $ | 1,271,254 | $ | 1,267,830 | $ | 1,091,821 | $ | 1,106,165 | $ | 991,497 | $ | 993,903 | ||||||||||||
| Municipal bonds and obligations | 428,849 | 443,223 | 368,038 | 374,905 | 243,161 | 255,254 | ||||||||||||||||||
| Other bonds and obligations | 194,573 | 195,684 | 150,314 | 150,488 | 129,089 | 127,411 | ||||||||||||||||||
| Total Securities | $ | 1,894,676 | $ | 1,906,737 | $ | 1,610,173 | $ | 1,631,558 | $ | 1,363,747 | $ | 1,376,568 | ||||||||||||
| One Year or Less | More than One Year to Five Years | More than Five Years to Ten Years | More than Ten Years | Total | |||||||||||||||||||||||||||||||||||||||||||||||||||||||
| (In millions) | Amortized Cost | Weighted Average Yield | Amortized Cost | Weighted Average Yield | Amortized Cost | Weighted Average Yield | Amortized Cost | Weighted Average Yield | Amortized Cost | Weighted Average Yield | |||||||||||||||||||||||||||||||||||||||||||||||||
| Municipal bonds and obligations | $ | 0.7 | 6.5 | % | $ | 6.9 | 4.3 | % | $ | 53.6 | 4.8 | % | $ | 254.6 | 4.0 | % | $ | 315.8 | 4.2 | % | |||||||||||||||||||||||||||||||||||||||
| Mortgage-backed securities | — | — | % | 18.3 | 2.2 | % | 94.1 | 2.1 | % | 1,272.6 | 1.6 | % | 1,385.0 | 1.7 | % | ||||||||||||||||||||||||||||||||||||||||||||
| Other bonds and obligations | 8.0 | 1.0 | % | 6.1 | 8.6 | % | 38.2 | 4.3 | % | 1.5 | 5.0 | % | 53.8 | 4.3 | % | ||||||||||||||||||||||||||||||||||||||||||||
| Total | $ | 8.7 | 1.4 | % | $ | 31.3 | 3.9 | % | $ | 185.9 | 3.3 | % | $ | 1,528.7 | 2.0 | % | $ | 1,754.6 | 2.2 | % | |||||||||||||||||||||||||||||||||||||||
| One Year or Less | More than One Year to Five Years | More than Five Years to Ten Years | More than Ten Years | Total | ||||||||||||||||||||||||||||||
| (In millions) | Amortized Cost | Weighted Average Yield | Amortized Cost | Weighted Average Yield | Amortized Cost | Weighted Average Yield | Amortized Cost | Weighted Average Yield | Amortized Cost | Weighted Average Yield | ||||||||||||||||||||||||
| Municipal bonds and obligations | $ | 1.6 | 3.6 | % | $ | 28.7 | 3.8 | % | $ | 26.4 | 4.8 | % | $ | 327.0 | 5.0 | % | $ | 383.7 | 4.9 | % | ||||||||||||||
| Mortgage-backed securities | 0.1 | 3.0 | % | 4.1 | 2.4 | % | 45.8 | 2.3 | % | 1,184.6 | 2.5 | % | 1,234.6 | 2.5 | % | |||||||||||||||||||
| Other bonds and obligations | 0.3 | 4.7 | % | 29.8 | 5.0 | % | 57.6 | 5.4 | % | 78.4 | 3.5 | % | 166.1 | 4.4 | % | |||||||||||||||||||
| Total | $ | 2.0 | 3.7 | % | $ | 62.6 | 4.3 | % | $ | 129.8 | 4.2 | % | $ | 1,590.0 | 3.1 | % | $ | 1,784.4 | 3.2 | % | ||||||||||||||
| 2023 | 2022 | 2021 | ||||||||||||||||||||||||||||||||||||||||||||||||||||||
| (In millions) | Average Balance | Percent of Total Average Deposits | Weighted Average Rate | Average Balance | Percent of Total Average Deposits | Weighted Average Rate | Average Balance | Percent of Total Average Deposits | Weighted Average Rate | |||||||||||||||||||||||||||||||||||||||||||||||
| Demand | $ | 2,584.6 | 27 | % | — | % | $ | 2,914.9 | 30 | % | — | % | $ | 3,008.5 | 30 | % | — | % | ||||||||||||||||||||||||||||||||||||||
| NOW and other | 1,048.9 | 11 | 0.6 | 1,416.7 | 14 | 0.4 | 976.4 | 10 | 0.1 | |||||||||||||||||||||||||||||||||||||||||||||||
| Money market | 2,727.3 | 28 | 3.4 | 2,809.1 | 29 | 0.5 | 3,293.5 | 32 | 0.2 | |||||||||||||||||||||||||||||||||||||||||||||||
| Savings | 1,067.2 | 11 | 1.0 | 1,114.8 | 11 | 0.1 | 1,111.6 | 11 | 0.1 | |||||||||||||||||||||||||||||||||||||||||||||||
| Time | 2,275.8 | 23 | 4.0 | 1,541.7 | 16 | 0.9 | 1,678.9 | 17 | 0.9 | |||||||||||||||||||||||||||||||||||||||||||||||
| Total | $ | 9,703.8 | 100 | % | 2.4 | % | $ | 9,797.2 | 100 | % | 0.9 | % | $ | 10,068.9 | 100 | % | 0.3 | % | ||||||||||||||||||||||||||||||||||||||
| 2017 | 2016 | 2015 | ||||||||||||||||||||||||||||
| (In millions) | Average Balance | Percent of Total Average Deposits | Weighted Average Rate | Average Balance | Percent of Total Average Deposits | Weighted Average Rate | Average Balance | Percent of Total Average Deposits | Weighted Average Rate | |||||||||||||||||||||
| Demand | $ | 1,296.4 | 18 | % | — | % | $ | 1,081.0 | 19 | % | — | % | $ | 972.6 | 19 | % | — | % | ||||||||||||
| NOW | 591.0 | 8 | 0.3 | 487.8 | 8 | 0.1 | 462.9 | 9 | 0.2 | |||||||||||||||||||||
| Money market | 1,935.8 | 27 | 0.6 | 1,470.3 | 26 | 0.5 | 1,444.1 | 28 | 0.4 | |||||||||||||||||||||
| Savings | 680.1 | 10 | 0.1 | 610.8 | 11 | 0.1 | 582.4 | 11 | 0.2 | |||||||||||||||||||||
| Time | 2,581.1 | 37 | 1.2 | 2,094.8 | 36 | 1.1 | 1,684.8 | 33 | 0.9 | |||||||||||||||||||||
| Total | $ | 7,084.4 | 100 | % | 0.6 | % | $ | 5,744.7 | 100 | % | 0.5 | % | $ | 5,146.8 | 100 | % | 0.5 | % | ||||||||||||
| Maturity Period | Amount | Weighted Average Rate | |||||||
| Maturity Period | |||||||||
| Maturity Period | |||||||||
| (In thousands) | |||||||||
| (In thousands) | |||||||||
| (In thousands) | |||||||||
| Three months or less | $ | 656,814 | 1.10 | % | |||||
| Three months or less | |||||||||
| Three months or less | |||||||||
| Over 3 months through 6 months | |||||||||
| Over 3 months through 6 months | |||||||||
| Over 3 months through 6 months | 350,824 | 1.31 | |||||||
| Over 6 months through 12 months | 395,429 | 1.39 | |||||||
| Over 6 months through 12 months | |||||||||
| Over 6 months through 12 months | |||||||||
| Over 12 months | |||||||||
| Over 12 months | |||||||||
| Over 12 months | 753,353 | 1.72 | |||||||
| Total | $ | 2,156,420 | 1.40 | % | |||||
| Total | |||||||||
| Total | |||||||||
| † Human Capital* | † Total number of FTEs | 1340 | ||||||
| † Turnover Rate | 21% | |||||||
| † Retention Rate | 79% | |||||||
| † Promotion Rate | 11% | |||||||
| † Minimum Starting Pay | $17/hour | |||||||
| † Average Tenure (years) | 7 years | |||||||
| † Diversity, Equity & Inclusion* | † Percent of workforce comprised of women | 66 | % | |||||
| † Percent of workforce comprised of ethnic minorities | 16 | % | ||||||
| † Percent of the Board comprised of women | 38 | % | ||||||
| † Percent of the Board comprised of ethnic minorities | 31 | % | ||||||
| † Percent of manager roles (officer+) comprised of women | 55 | % | ||||||
| † Percent of manager roles (officer+) comprised of ethnic minorities | 12 | % | ||||||
| † Percent of executive management roles comprised of women | 29 | % | ||||||
| † Percent of executive management roles comprised of ethnic minorities | 14 | % | ||||||
| 2017 | High | Low | Dividends Declared | |||||||||
| First quarter | $ | 37.45 | $ | 32.90 | $ | 0.21 | ||||||
| Second quarter | 38.65 | 33.55 | 0.21 | |||||||||
| Third quarter | 39.00 | 32.85 | 0.21 | |||||||||
| Fourth quarter | 40.00 | 35.10 | 0.21 | |||||||||
| 2016 | ||||||||||||
| First quarter | $ | 28.93 | $ | 24.71 | $ | 0.20 | ||||||
| Second quarter | 28.18 | 24.80 | 0.20 | |||||||||
| Third quarter | 28.37 | 25.90 | 0.20 | |||||||||
| Fourth quarter | 37.35 | 27.25 | 0.20 | |||||||||
| Period | Total number of shares purchased | Average price paid per share | Total number of shares purchased as part of publicly announced plans or programs | Maximum number of shares that may yet be purchased under the plans or programs | ||||||||||||||||||||||
| October 1-31, 2023 | 151,027 | $ | 19.16 | 151,027 | 1,055,914 | |||||||||||||||||||||
| November 1-30, 2023 | 124,090 | 20.38 | 124,090 | 931,824 | ||||||||||||||||||||||
| December 1-31, 2023 | 52,831 | 22.43 | 52,831 | — | ||||||||||||||||||||||
| Total | 327,948 | $ | 20.15 | 327,948 | — | |||||||||||||||||||||

| Period Ending | ||||||||||||||||||||||||||||||||||||||
| Index | 12/31/18 | 12/31/19 | 12/31/20 | 12/31/21 | 12/31/22 | 12/31/23 | ||||||||||||||||||||||||||||||||
| Berkshire Hills Bancorp, Inc. | 100.00 | 125.69 | 68.86 | 116.51 | 124.86 | 106.96 | ||||||||||||||||||||||||||||||||
| NYSE Composite Index | 100.00 | 125.51 | 134.28 | 162.04 | 146.89 | 167.12 | ||||||||||||||||||||||||||||||||
| KBW NASDAQ Regional Banking Index | 100.00 | 123.81 | 113.03 | 154.45 | 143.75 | 143.17 | ||||||||||||||||||||||||||||||||
| Period Ending | ||||||||||||||||||
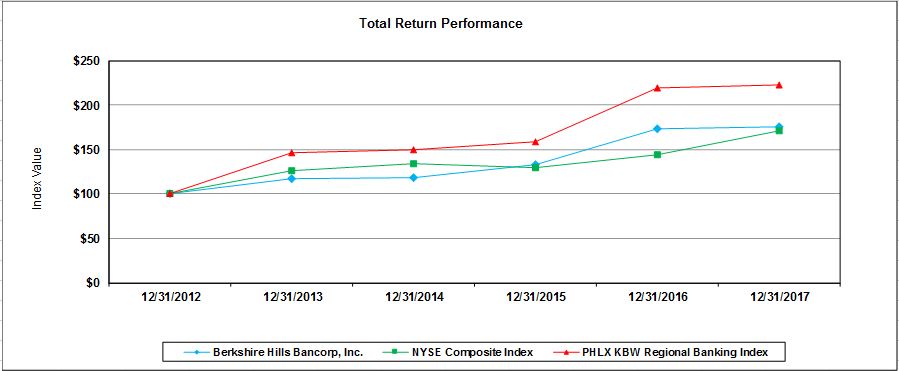
| Index | 12/31/12 | 12/31/13 | 12/31/14 | 12/31/15 | 12/31/16 | 12/31/17 | ||||||||||||
| Berkshire Hills Bancorp, Inc. | 100.00 | 117.53 | 118.35 | 132.76 | 173.10 | 175.94 | ||||||||||||
| NYSE Composite Index | 100.00 | 126.06 | 134.62 | 129.40 | 144.72 | 171.66 | ||||||||||||
| PHLX KBW Regional Banking Index | 100.00 | 146.30 | 149.67 | 158.62 | 219.27 | 223.02 | ||||||||||||
| At or For the Years Ended December 31, | ||||||||||||||||||||
| (In thousands, except per share data) | 2017 | 2016 | 2015 | 2014 | 2013 | |||||||||||||||
| Per Common Share Data: | ||||||||||||||||||||
| Net earnings, diluted | $ | 1.39 | $ | 1.88 | $ | 1.74 | $ | 1.36 | $ | 1.65 | ||||||||||
| Total book value per common share | 32.14 | 30.65 | 28.64 | 28.17 | 27.08 | |||||||||||||||
| Dividends | 0.84 | 0.80 | 0.76 | 0.72 | 0.72 | |||||||||||||||
| Common stock price: | ||||||||||||||||||||
| High | 40.00 | 37.35 | 30.40 | 27.28 | 29.38 | |||||||||||||||
| Low | 32.85 | 24.71 | 24.32 | 22.06 | 23.38 | |||||||||||||||
| Close | 36.60 | 36.85 | 29.11 | 26.66 | 27.27 | |||||||||||||||
| Performance Ratios: (1) | ||||||||||||||||||||
| Return on assets | 0.56 | % | 0.74 | % | 0.68 | % | 0.55 | % | 0.78 | % | ||||||||||
| Return on equity | 4.45 | 6.44 | 6.14 | 4.87 | 6.09 | |||||||||||||||
| Net interest margin, fully taxable equivalent (FTE) (2) | 3.40 | 3.31 | 3.34 | 3.30 | 3.67 | |||||||||||||||
| Fee income/Net interest and fee income | 29.41 | 22.80 | 21.18 | 23.02 | 23.04 | |||||||||||||||
| Growth Ratios: | ||||||||||||||||||||
| Total commercial loans | 37.79% | 18.39 | % | 28.65 | % | 14.80 | % | 4.51 | % | |||||||||||
| Total loans | 26.71 | 14.41 | 22.32 | 11.96 | 4.81 | |||||||||||||||
| Total deposits | 32.13 | 18.48 | 20.08 | 20.95 | (6.14 | ) | ||||||||||||||
| Total net revenues, (compared to prior year) | 41.05 | 11.18 | 18.40 | (0.23 | ) | 14.96 | ||||||||||||||
| Earnings per share, (compared to prior year) | (26.06 | ) | 8.62 | 27.21 | (17.58 | ) | 10.74 | |||||||||||||
| Selected Financial Data: | ||||||||||||||||||||
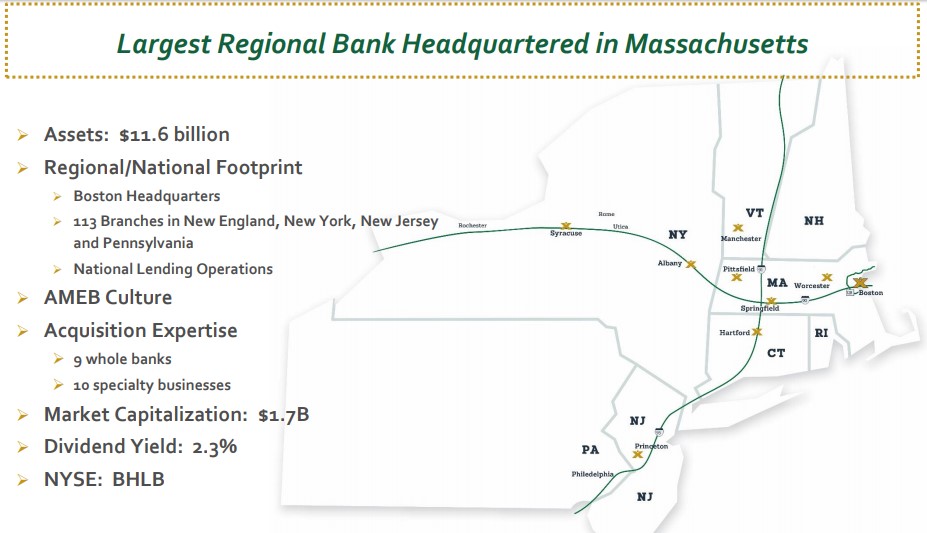
| Total assets | $ | 11,570,751 | $ | 9,162,542 | $ | 7,831,086 | $ | 6,501,079 | $ | 5,671,724 | ||||||||||
| Total earning assets | 10,509,163 | 8,340,287 | 7,140,387 | 5,923,462 | 5,085,152 | |||||||||||||||
| Securities | 1,898,564 | 1,628,246 | 1,371,316 | 1,205,794 | 870,091 | |||||||||||||||
| Total loans | 8,299,338 | 6,549,787 | 5,725,236 | 4,680,600 | 4,180,523 | |||||||||||||||
| Allowance for loan losses | (51,834 | ) | (43,998 | ) | (39,308 | ) | (35,662 | ) | (33,323 | ) | ||||||||||
| Total intangible assets | 557,583 | 422,551 | 334,607 | 276,270 | 270,662 | |||||||||||||||
| Total deposits | 8,749,530 | 6,622,092 | 5,589,135 | 4,654,679 | 3,848,529 | |||||||||||||||
| Total borrowings | 1,137,075 | 1,313,997 | 1,263,318 | 1,051,371 | 1,063,032 | |||||||||||||||
| Total shareholders’ equity | 1,496,264 | 1,093,298 | 887,189 | 709,287 | 678,062 | |||||||||||||||
| At or For the Years Ended December 31, | ||||||||||||||||||||
| 2017 | 2016 | 2015 | 2014 | 2013 | ||||||||||||||||
| Selected Operating Data: | ||||||||||||||||||||
| Total interest and dividend income | $ | 360,258 | $ | 280,439 | $ | 247,030 | $ | 207,042 | $ | 203,741 | ||||||||||
| Total interest expense | 65,463 | 48,172 | 33,181 | 28,351 | 34,989 | |||||||||||||||
| Net interest income (3) | 294,795 | 232,267 | 213,849 | 178,691 | 168,752 | |||||||||||||||
| Fee income | 122,801 | 68,606 | 57,480 | 53,434 | 50,525 | |||||||||||||||
| All other non-interest income (loss) | 2,888 | (2,755 | ) | (3,192 | ) | (5,664 | ) | 7,707 | ||||||||||||
| Total net revenue | 420,484 | 298,118 | 268,137 | 226,461 | 226,984 | |||||||||||||||
| Provision for loan losses | 21,025 | 17,362 | 16,726 | 14,968 | 11,378 | |||||||||||||||
| Total non-interest expense | 299,710 | 203,302 | 196,829 | 165,986 | 157,359 | |||||||||||||||
| Income tax expense - continuing operations | 44,502 | 18,784 | 5,064 | 11,763 | 17,104 | |||||||||||||||
| Net income | $ | 55,247 | $ | 58,670 | $ | 49,518 | $ | 33,744 | $ | 41,143 | ||||||||||
| Dividends per preferred share | $ | 0.42 | $ | — | $ | — | $ | — | $ | — | ||||||||||
| Dividends per common share | 0.84 | 0.80 | 0.76 | 0.72 | 0.72 | |||||||||||||||
| Basic earnings per common share | 1.40 | 1.89 | 1.74 | 1.36 | 1.66 | |||||||||||||||
| Diluted earnings per common share | 1.39 | 1.88 | 1.73 | 1.36 | 1.65 | |||||||||||||||
| Weighted average common shares outstanding - basic | 39,456 | 30,988 | 28,393 | 24,730 | 24,802 | |||||||||||||||
| Weighted average common shares outstanding - diluted | 39,695 | 31,167 | 28,564 | 24,854 | 24,965 | |||||||||||||||
| Asset Quality and Condition Ratios: (4) | ||||||||||||||||||||
| Net loans charged-off/average loans | 0.19 | % | 0.21 | % | 0.25 | % | 0.29 | % | 0.29 | % | ||||||||||
| Allowance for loan losses/total loans | 0.62 | 0.67 | 0.69 | 0.76 | 0.80 | |||||||||||||||
| Loans/deposits | 95 | 99 | 102 | 101 | 109 | |||||||||||||||
| Capital Ratios: | ||||||||||||||||||||
| Tier 1 capital to average assets - Company (5) | 9.01 | % | 7.88 | % | 7.71 | % | 7.01 | % | N/A | |||||||||||
| Total capital to risk-weighted assets - Company (5) | 12.43 | 11.87 | 11.91 | 11.38 | N/A | |||||||||||||||
| Tier 1 capital to risk-weighted assets - Company (5) | 11.15 | 10.07 | 9.94 | 9.03 | N/A | |||||||||||||||
| Shareholders’ equity/total assets | 12.93 | 11.93 | 11.33 | 10.91 | 11.95 | |||||||||||||||
| 2017 | 2016 | 2015 | |||||||||||||||||||||||||||||||
| (Dollars in millions) | Average Balance | Interest | Average Yield/ Rate | Average Balance | Interest | Average Yield/ Rate | Average Balance | Interest | Average Yield/ Rate | ||||||||||||||||||||||||
| Assets | |||||||||||||||||||||||||||||||||
| Loans: (1) | |||||||||||||||||||||||||||||||||
| Commercial real estate | $ | 2,789.8 | $ | 130.0 | 4.66 | % | $ | 2,239.6 | $ | 95.8 | 4.28 | % | $ | 1,881.2 | $ | 81.1 | 4.31 | % | |||||||||||||||
| Commercial and industrial loans | 1,259.9 | 65.7 | 5.21 | 1,019.7 | 51.2 | 5.02 | 932.4 | 41.8 | 4.48 | ||||||||||||||||||||||||
| Residential loans | 1,962.4 | 71.5 | 3.64 | 1,808.8 | 66.1 | 3.66 | 1,622.8 | 62.6 | 3.86 | ||||||||||||||||||||||||
| Consumer loans | 1,032.6 | 39.4 | 3.82 | 873.3 | 29.9 | 3.42 | 802.5 | 26.1 | 3.25 | ||||||||||||||||||||||||
| Total loans | 7,044.7 | 306.6 | 4.35 | 5,941.4 | 243.0 | 4.09 | 5,238.9 | 211.6 | 4.04 | ||||||||||||||||||||||||
| Investment securities (2) | 1,757.3 | 60.3 | 3.43 | 1,260.5 | 41.4 | 3.28 | 1,300.9 | 38.9 | 2.99 | ||||||||||||||||||||||||
| Short-term investments and loans held for sale | 134.5 | 4.6 | 3.38 | 51.6 | 0.9 | 1.70 | 62.2 | 0.7 | 1.10 | ||||||||||||||||||||||||
| Total interest-earning assets | 8,936.5 | 371.5 | 4.16 | 7,253.5 | 285.3 | 3.93 | 6,602.0 | 251.2 | 3.81 | ||||||||||||||||||||||||
| Intangible assets | 449.7 | 0 | 347.7 | 311.5 | |||||||||||||||||||||||||||||
| Other non-interest earning assets | 428.4 | 0 | 357.9 | 341.0 | |||||||||||||||||||||||||||||
| Total assets | $ | 9,814.6 | $ | 7,959.1 | $ | 7,254.5 | |||||||||||||||||||||||||||
| Liabilities and shareholders' equity | |||||||||||||||||||||||||||||||||
| Deposits: | |||||||||||||||||||||||||||||||||
| NOW | $ | 591.0 | $ | 1.5 | 0.25 | % | $ | 487.8 | $ | 0.7 | 0.14 | % | $ | 462.9 | $ | 0.7 | 0.15 | % | |||||||||||||||
| Money market | 1,935.8 | 11.2 | 0.58 | 1,470.3 | 7.0 | 0.48 | 1,444.1 | 5.9 | 0.41 | ||||||||||||||||||||||||
| Savings | 680.1 | 0.9 | 0.14 | 610.8 | 0.7 | 0.12 | 582.4 | 0.9 | 0.15 | ||||||||||||||||||||||||
| Certificates of deposit | 2,581.1 | 30.3 | 1.17 | 2,094.8 | 22.5 | 1.07 | 1,684.8 | 15.5 | 0.92 | ||||||||||||||||||||||||
| Total interest-bearing deposits | 5,788.0 | 43.9 | 0.76 | 4,663.7 | 30.9 | 0.66 | 4,174.2 | 23.0 | 0.55 | ||||||||||||||||||||||||
| Borrowings and notes (3) | 1,373.8 | 21.6 | 1.57 | 1,218.2 | 17.3 | 1.42 | 1,212.5 | 10.2 | 0.84 | ||||||||||||||||||||||||
| Total interest-bearing liabilities | 7,161.8 | 65.5 | 0.91 | 5,881.9 | 48.2 | 0.82 | 5,386.7 | 33.2 | 0.62 | ||||||||||||||||||||||||
| Non-interest-bearing demand deposits | 1,296.4 | 1,081.0 | 972.6 | ||||||||||||||||||||||||||||||
| Other non-interest-bearing liabilities | 112.6 | 85.2 | 89.1 | ||||||||||||||||||||||||||||||
| Total liabilities | 8,570.8 | 7,048.1 | 6,448.4 | ||||||||||||||||||||||||||||||
| Total shareholders' equity | 1,243.8 | 911.0 | 806.1 | ||||||||||||||||||||||||||||||
| Total liabilities and equity | $ | 9,814.6 | $ | 7,959.1 | $ | 7,254.5 | |||||||||||||||||||||||||||
| Net interest-earning assets | $ | 1,774.7 | $ | 1,371.6 | $ | 1,215.3 | |||||||||||||||||||||||||||
| Net interest income | $ | 306.0 | $ | 237.1 | $ | 218.0 | |||||||||||||||||||||||||||
| 2017 | 2016 | 2015 | |||||||||||||||||||||||||||||||
| (Dollars in millions) | Average Balance | Interest | Average Yield/ Rate | Average Balance | Interest | Average Yield/ Rate | Average Balance | Interest | Average Yield/ Rate | ||||||||||||||||||||||||
| Net interest spread | 3.25 | % | 3.11 | % | 3.19 | % | |||||||||||||||||||||||||||
| Net interest margin (4) | 3.40 | 3.31 | 3.34 | ||||||||||||||||||||||||||||||
| Cost of funds | 0.77 | 0.69 | 0.52 | ||||||||||||||||||||||||||||||
| Cost of deposits | 0.62 | 0.54 | 0.45 | ||||||||||||||||||||||||||||||
| Interest-earning assets/interest-bearing liabilities | 124.78 | 123.32 | 122.56 | ||||||||||||||||||||||||||||||
| Supplementary data | |||||||||||||||||||||||||||||||||
| Total non-maturity deposits | $ | 4,503.3 | $ | 3,649.9 | $ | 3,462.0 | |||||||||||||||||||||||||||
| Total deposits | 7,084.4 | 5,744.7 | 5,146.8 | ||||||||||||||||||||||||||||||
| Fully taxable equivalent adjustment | 11.2 | 8.1 | 6.4 | ||||||||||||||||||||||||||||||
| 2017 Compared with 2016 | 2016 Compared with 2015 | |||||||||||||||||||||||
| (Decrease) Increase Due to | (Decrease) Increase Due to | |||||||||||||||||||||||
| (In thousands) | Rate | Volume | Net | Rate | Volume | Net | ||||||||||||||||||
| Interest income: | ||||||||||||||||||||||||
| Commercial real estate | $ | 9,145 | $ | 25,080 | $ | 34,225 | $ | (591 | ) | $ | 15,335 | $ | 14,744 | |||||||||||
| Commercial and industrial loans | 1,999 | 12,457 | 14,456 | 5,294 | 4,120 | 9,414 | ||||||||||||||||||
| Residential loans | (259 | ) | 5,595 | 5,336 | (3,427 | ) | 6,920 | 3,493 | ||||||||||||||||
| Consumer loans | 3,698 | 5,839 | 9,537 | 1,416 | 2,379 | 3,795 | ||||||||||||||||||
| Total loans | 14,583 | 48,971 | 63,554 | 2,692 | 28,754 | 31,446 | ||||||||||||||||||
| Investment securities | 1,985 | 16,978 | 18,963 | 3,667 | (1,238 | ) | 2,429 | |||||||||||||||||
| Short-term investments and loans held for sale | 1,405 | 2,271 | 3,676 | 324 | (132 | ) | 192 | |||||||||||||||||
| Total interest income | $ | 17,973 | $ | 68,220 | $ | 86,193 | $ | 6,683 | $ | 27,384 | $ | 34,067 | ||||||||||||
| Interest expense: | ||||||||||||||||||||||||
| NOW accounts | $ | 627 | $ | 165 | $ | 792 | $ | (39 | ) | $ | 35 | $ | (4 | ) | ||||||||||
| Money market accounts | 1,698 | 2,506 | 4,204 | 1,000 | 109 | 1,109 | ||||||||||||||||||
| Savings accounts | 122 | 88 | 210 | (212 | ) | 42 | (170 | ) | ||||||||||||||||
| Certificates of deposit | 2,205 | 5,561 | 7,766 | 2,861 | 4,140 | 7,001 | ||||||||||||||||||
| Total deposits | 4,652 | 8,320 | 12,972 | 3,610 | 4,326 | 7,936 | ||||||||||||||||||
| Borrowings | 1,981 | 2,338 | 4,319 | 7,008 | 48 | 7,056 | ||||||||||||||||||
| Total interest expense | $ | 6,633 | $ | 10,658 | $ | 17,291 | $ | 10,618 | $ | 4,374 | $ | 14,992 | ||||||||||||
| Change in net interest income | $ | 11,340 | $ | 57,562 | $ | 68,902 | $ | (3,935 | ) | $ | 23,010 | $ | 19,075 | |||||||||||
| At or For the Years Ended | ||||||||||||
| (Dollars in thousands) | December 31, 2017 | December 31, 2016 | December 31, 2015 | |||||||||
| GAAP Net income | $ | 55,247 | $ | 58,670 | $ | 49,518 | ||||||
| Non-GAAP measures | ||||||||||||
| Adj: Gain on sale of securities, net | (12,598 | ) | 551 | (2,110 | ) | |||||||
| Adj: Net gains on sale of business operations | (296 | ) | (1,085 | ) | — | |||||||
| Adj: Loss on termination of hedges | 6,629 | — | — | |||||||||
| Adj: Acquisition, restructuring, conversion, and other related expenses (1) | 31,558 | 15,761 | 17,611 | |||||||||
| Adj: Employee and Community Investment | 3,400 | — | — | |||||||||
| Adj: Deferred tax asset impairment | 18,145 | — | — | |||||||||
| Adj: Income taxes | (11,277 | ) | (5,455 | ) | (5,409 | ) | ||||||
| Net non-operating charges | 35,561 | 9,772 | 10,092 | |||||||||
| Total adjusted net income (non-GAAP) | $ | 90,808 | $ | 68,442 | $ | 59,610 | ||||||
| GAAP Total revenue | $ | 420,484 | $ | 298,118 | $ | 268,137 | ||||||
| Adj: Gain on sale of securities, net | (12,598 | ) | 551 | (2,110 | ) | |||||||
| Adj: Net gains on sale of business operations | (296 | ) | (1,085 | ) | — | |||||||
| Adj: Loss on termination of hedges | 6,629 | — | — | |||||||||
| Total adjusted operating revenue (non-GAAP) | $ | 414,219 | $ | 297,584 | $ | 266,027 | ||||||
| GAAP Total non-interest expense | $ | 299,710 | $ | 203,302 | $ | 196,830 | ||||||
| Less: Total non-operating expense (see above) | (31,558 | ) | (15,761 | ) | (17,611 | ) | ||||||
| Less: Employee and Community Reinvestment | (3,400 | ) | — | — | ||||||||
| Adjusted operating non-interest expense (non-GAAP) | $ | 264,752 | $ | 187,541 | $ | 179,219 | ||||||
| (in millions, except per share data) | ||||||||||||
| Total average assets | $ | 9,815 | $ | 7,958 | $ | 7,249 | ||||||
| Total average shareholders' equity | 1,244 | 911 | 805 | |||||||||
| Total average tangible shareholders equity | 793 | 563 | 494 | |||||||||
| Total average tangible common shareholders equity | 784 | 563 | 494 | |||||||||
| Total tangible shareholders’ equity, period-end | 939 | 671 | 553 | |||||||||
| Total tangible common shareholders’ equity, period-end | 898 | 671 | 553 | |||||||||
| Total tangible assets, period-end | 11,013 | 8,740 | 7,496 | |||||||||
| Total common shares outstanding, period-end (thousands) | 45,290 | 35,673 | 30,974 | |||||||||
Average diluted shares outstanding (thousands) | 39,695 | 31,167 | 28,564 | |||||||||
| Earnings per share, diluted | $ | 1.39 | $ | 1.88 | $ | 1.73 | ||||||
| Plus: Net adjustments per share, diluted | 0.90 | 0.32 | 0.36 | |||||||||
| Adjusted earnings per share, diluted | 2.29 | 2.20 | 2.09 | |||||||||
| Book value per common share, period-end | 32.14 | 30.65 | 28.64 | |||||||||
| Tangible book value per common share, period-end | 19.83 | 18.81 | 17.84 | |||||||||
| Total shareholders' equity/total assets | 12.93 | 11.93 | 11.33 | |||||||||
| Total tangible shareholders' equity/total tangible assets | 8.52 | 7.68 | 7.37 | |||||||||
Average operating diluted shares outstanding (thousands) | 39,695 | 31,167 | 28,564 | |||||||||
| Performance Ratios | ||||||||||||
| GAAP return on assets | 0.56 | 0.74 | 0.68 | |||||||||
| Adjusted return on assets | 0.93 | 0.86 | 0.82 | |||||||||
| GAAP return on equity | 4.45 | 6.44 | 6.15 | |||||||||
| Adjusted return on equity | 7.31 | 7.51 | 7.40 | |||||||||
| Adjusted return on tangible common equity | 11.82 | 12.47 | 12.49 | |||||||||
| Efficiency ratio | 59.97 | 58.27 | 60.88 | |||||||||
Supplementary Data (in thousands) | ||||||||||||
| Tax benefit on tax-credit investments | 10,182 | 11,134 | 16,127 | |||||||||
| Non-interest income charge on tax-credit investments | (8,693 | ) | (8,993 | ) | (11,406 | ) | ||||||
| Net income on tax-credit investments | 1,489 | 2,143 | 4,721 | |||||||||
| Intangible amortization | 3,493 | 2,927 | 3,563 | |||||||||
| Fully taxable equivalent income adjustment | 11,227 | 8,098 | 6,354 | |||||||||
| At or For the Years Ended December 31, | ||||||||||||||||||||||||||||||||
| (In thousands, except per share data) | 2023 | 2022 | 2021 | 2020 | 2019 | |||||||||||||||||||||||||||
| Per Common Share Data: | ||||||||||||||||||||||||||||||||
| Net earnings/(loss), diluted - continuing operations | $ | 1.60 | $ | 2.02 | $ | 2.39 | $ | (10.21) | $ | 2.05 | ||||||||||||||||||||||
| Net (loss), diluted - discontinued operations | — | — | — | (0.39) | (0.08) | |||||||||||||||||||||||||||
| Net earnings/(loss), diluted | $ | 1.60 | $ | 2.02 | $ | 2.39 | $ | (10.60) | $ | 1.97 | ||||||||||||||||||||||
| Total book value per common share | 23.27 | 21.51 | 24.30 | 23.37 | 34.65 | |||||||||||||||||||||||||||
| Dividends | 0.72 | 0.54 | 0.48 | 0.72 | 0.92 | |||||||||||||||||||||||||||
| Common stock price: | ||||||||||||||||||||||||||||||||
| High | 31.52 | 31.78 | 29.16 | 33.04 | 33.72 | |||||||||||||||||||||||||||
| Low | 18.07 | 23.62 | 16.35 | 8.55 | 26.02 | |||||||||||||||||||||||||||
| Close | 24.83 | 29.90 | 28.43 | 17.12 | 32.88 | |||||||||||||||||||||||||||
| Performance Ratios: (1) | ||||||||||||||||||||||||||||||||
| Return on assets | 0.59 | % | 0.82 | % | 0.98 | % | (4.15) | % | 0.75 | % | ||||||||||||||||||||||
| Return on equity, including unrealized losses on AFS securities | 7.07 | 8.70 | 9.96 | 37.15 | 5.73 | |||||||||||||||||||||||||||
| Return on equity, excluding unrealized losses on AFS securities | 5.68 | 7.76 | 10.18 | (37.50) | 5.75 | |||||||||||||||||||||||||||
Return on tangible common equity, including unrealized losses on AFS securities (2) | 7.60 | 9.29 | 10.57 | (46.88) | 9.31 | |||||||||||||||||||||||||||
Return on tangible common equity, excluding unrealized losses on AFS securities (2) | 6.07 | 8.26 | 10.80 | (48.60) | 9.36 | |||||||||||||||||||||||||||
Net interest margin, fully taxable equivalent ("FTE") (3) | 3.27 | 3.26 | 2.60 | 2.72 | 3.17 | |||||||||||||||||||||||||||
| Growth Ratios: | ||||||||||||||||||||||||||||||||
| Total commercial loans | 5.66 | % | 12.99 | % | (12.09) | % | (4.58) | % | 9.19 | % | ||||||||||||||||||||||
| Total loans | 8.45 | 22.11 | (15.54) | 14.95 | 5.08 | |||||||||||||||||||||||||||
| Total deposits | 2.96 | 2.57 | (1.44) | (1.16) | 15.07 | |||||||||||||||||||||||||||
| Earnings per share, (compared to prior year) | (20.79) | (15.48) | 122.55 | (638.07) | (13.97) | |||||||||||||||||||||||||||
| Selected Financial Data: | ||||||||||||||||||||||||||||||||
| Total assets | $ | 12,430,821 | $ | 11,662,864 | $ | 11,554,913 | $ | 12,838,013 | $ | 13,215,970 | ||||||||||||||||||||||
| Total earning assets | 11,704,515 | 10,913,069 | 10,899,109 | 12,089,939 | 11,916,007 | |||||||||||||||||||||||||||
| Securities | 1,607,496 | 2,033,436 | 2,548,590 | 2,223,417 | 1,769,878 | |||||||||||||||||||||||||||
| Total loans | 9,039,686 | 8,335,309 | 6,825,847 | 8,081,519 | 9,502,428 | |||||||||||||||||||||||||||
| Allowance for credit losses | (105,357) | (96,270) | (106,094) | (127,302) | (63,575) | |||||||||||||||||||||||||||
| Total intangible assets | 19,664 | 24,483 | 26,619 | 34,819 | 599,377 | |||||||||||||||||||||||||||
| Total deposits | 10,633,384 | 10,327,269 | 10,068,953 | 10,215,808 | 10,335,977 | |||||||||||||||||||||||||||
| Total borrowings | 506,586 | 125,509 | 110,844 | 571,637 | 827,550 | |||||||||||||||||||||||||||
| Total shareholders’ equity | 1,012,221 | 954,062 | 1,182,435 | 1,187,773 | 1,758,564 | |||||||||||||||||||||||||||
| At or For the Years Ended December 31, | ||||||||||||||||||||||||||||||||
| 2023 | 2022 | 2021 | 2020 | 2019 | ||||||||||||||||||||||||||||
| Selected Operating Data: | ||||||||||||||||||||||||||||||||
| Total interest and dividend income | $ | 576,299 | $ | 387,257 | $ | 329,065 | $ | 409,782 | $ | 509,513 | ||||||||||||||||||||||
| Total interest expense | 207,252 | 42,660 | 37,899 | 93,000 | 144,255 | |||||||||||||||||||||||||||
| Net interest income | 369,047 | 344,597 | 291,166 | 316,782 | 356,258 | |||||||||||||||||||||||||||
| Fee income | 65,281 | 63,995 | 84,462 | 69,990 | 76,824 | |||||||||||||||||||||||||||
| All other non-interest income/(loss) | (22,499) | 4,942 | 58,786 | (3,683) | 7,178 | |||||||||||||||||||||||||||
| Total net revenue | 411,829 | 413,534 | 434,414 | 383,089 | 449,260 | |||||||||||||||||||||||||||
| Provision for credit losses | 31,999 | 11,000 | (500) | 75,878 | 35,419 | |||||||||||||||||||||||||||
| Total non-interest expense | 301,508 | 288,716 | 285,893 | 840,239 | 289,857 | |||||||||||||||||||||||||||
| Income/(loss) from continuing operations before income taxes | 78,322 | 113,818 | 149,021 | (533,028) | 123,984 | |||||||||||||||||||||||||||
| Income tax expense/(benefit) from continuing operations | 8,724 | 21,285 | 30,357 | (19,853) | 22,463 | |||||||||||||||||||||||||||
| Net income/(loss) from continuing operations | 69,598 | 92,533 | 118,664 | (513,175) | 101,521 | |||||||||||||||||||||||||||
| (Loss)/income from discontinued operations before income taxes | — | — | — | (26,855) | (5,539) | |||||||||||||||||||||||||||
| Income tax (benefit)/expense from discontinued operations | — | — | — | (7,013) | (1,468) | |||||||||||||||||||||||||||
| Net (loss)/income from discontinued operations | — | — | — | (19,842) | (4,071) | |||||||||||||||||||||||||||
| Net income/(loss) | $ | 69,598 | $ | 92,533 | $ | 118,664 | $ | (533,017) | $ | 97,450 | ||||||||||||||||||||||
| Basic earnings/(loss) per common share: | ||||||||||||||||||||||||||||||||
| Continuing operations | $ | 1.61 | $ | 2.03 | $ | 2.41 | $ | (10.21) | $ | 2.06 | ||||||||||||||||||||||
| Discontinued operations | — | — | — | (0.39) | (0.08) | |||||||||||||||||||||||||||
| Total basic earnings/(loss) per share | $ | 1.61 | $ | 2.03 | $ | 2.41 | $ | (10.60) | $ | 1.98 | ||||||||||||||||||||||
| Diluted earnings/(loss) per common share: | ||||||||||||||||||||||||||||||||
| Continuing operations | $ | 1.60 | $ | 2.02 | $ | 2.39 | $ | (10.21) | $ | 2.05 | ||||||||||||||||||||||
| Discontinued operations | — | — | — | (0.39) | (0.08) | |||||||||||||||||||||||||||
| Total diluted earnings/(loss) per share | $ | 1.60 | $ | 2.02 | $ | 2.39 | $ | (10.60) | $ | 1.97 | ||||||||||||||||||||||
| Weighted average common shares outstanding - basic | 43,288 | 45,564 | 49,240 | 50,270 | 49,263 | |||||||||||||||||||||||||||
| Weighted average common shares outstanding - diluted | 43,504 | 45,914 | 49,554 | 50,270 | 49,421 | |||||||||||||||||||||||||||
| Dividends per preferred share | $ | — | $ | — | $ | — | $ | 1.20 | $ | 1.84 | ||||||||||||||||||||||
| Dividends per common share | $ | 0.72 | $ | 0.54 | $ | 0.48 | $ | 0.72 | $ | 0.92 | ||||||||||||||||||||||
| Asset Quality and Condition Ratios: (4) | ||||||||||||||||||||||||||||||||
| Net loans charged-off/average loans | 0.26 | % | 0.27 | % | 0.29 | % | 0.41 | % | 0.35 | % | ||||||||||||||||||||||
| Allowance for credit losses/total loans | 1.17 | 1.15 | 1.55 | 1.58 | 0.67 | |||||||||||||||||||||||||||
| Loans/deposits | 85 | 81 | 68 | 79 | 92 | |||||||||||||||||||||||||||
| Capital Ratios: | ||||||||||||||||||||||||||||||||
| Tier 1 capital to average assets - Company | 9.65 | % | 10.18 | % | 10.49 | % | 9.38 | % | 9.33 | % | ||||||||||||||||||||||
| Total capital to risk-weighted assets - Company | 14.36 | 14.60 | 17.32 | 16.10 | 13.73 | |||||||||||||||||||||||||||
| Tier 1 capital to risk-weighted assets - Company | 12.27 | 12.60 | 15.30 | 14.06 | 12.30 | |||||||||||||||||||||||||||
| Shareholders’ equity/total assets | 8.14 | 8.18 | 10.23 | 9.25 | 13.31 | |||||||||||||||||||||||||||
| 2023 | 2022 | 2021 | ||||||||||||||||||||||||||||||||||||||||||||||||||||||
| (Dollars in millions) | Average Balance | Interest | Average Yield/ Rate | Average Balance | Interest | Average Yield/ Rate | Average Balance | Interest | Average Yield/ Rate | |||||||||||||||||||||||||||||||||||||||||||||||
| Assets | ||||||||||||||||||||||||||||||||||||||||||||||||||||||||
| Loans: (1)(2) | ||||||||||||||||||||||||||||||||||||||||||||||||||||||||
| Commercial real estate | $ | 4,326.8 | $ | 272.5 | 6.30 | % | $ | 3,836.2 | $ | 167.6 | 4.37 | % | $ | 3,600.2 | $ | 124.4 | 3.46 | % | ||||||||||||||||||||||||||||||||||||||
| Commercial and industrial loans | 1,455.9 | 107.9 | 7.41 | 1,435.3 | 74.7 | 5.20 | 1,527.6 | 71.8 | 4.70 | |||||||||||||||||||||||||||||||||||||||||||||||
| Residential loans | 2,512.3 | 98.1 | 3.91 | 1,784.2 | 63.3 | 3.55 | 1,560.4 | 58.4 | 3.75 | |||||||||||||||||||||||||||||||||||||||||||||||
| Consumer loans | 518.5 | 37.8 | 7.29 | 556.8 | 32.1 | 5.77 | 569.1 | 22.0 | 3.87 | |||||||||||||||||||||||||||||||||||||||||||||||
| Total loans | 8,813.5 | 516.3 | 5.86 | 7,612.5 | 337.7 | 4.44 | 7,257.3 | 276.6 | 3.81 | |||||||||||||||||||||||||||||||||||||||||||||||
| Investment securities (2)(3) | 2,186.6 | 50.8 | 2.32 | 2,489.7 | 51.2 | 2.06 | 2,283.6 | 49.4 | 2.16 | |||||||||||||||||||||||||||||||||||||||||||||||
| Short-term investments and loans held for sale (4) | 372.4 | 17.1 | 4.59 | 569.1 | 4.9 | 0.86 | 1,619.4 | 2.3 | 0.58 | |||||||||||||||||||||||||||||||||||||||||||||||
| Mid-Atlantic region loans held for sale | — | — | — | — | — | — | 179.5 | 7.1 | 3.97 | |||||||||||||||||||||||||||||||||||||||||||||||
| Total interest-earning assets | 11,372.5 | 584.2 | 5.14 | 10,671.3 | 393.8 | 3.69 | 11,339.8 | 335.4 | 2.60 | |||||||||||||||||||||||||||||||||||||||||||||||
| Intangible assets | 21.9 | 26.8 | 32.0 | |||||||||||||||||||||||||||||||||||||||||||||||||||||
| Other non-interest earning assets (4) | 443.2 | 518.2 | 708.8 | |||||||||||||||||||||||||||||||||||||||||||||||||||||
| Total assets | $ | 11,837.6 | $ | 11,216.3 | $ | 12,080.6 | ||||||||||||||||||||||||||||||||||||||||||||||||||
| Liabilities and shareholders' equity | ||||||||||||||||||||||||||||||||||||||||||||||||||||||||
| Deposits: | ||||||||||||||||||||||||||||||||||||||||||||||||||||||||
| Non-interest-bearing demand deposits | $ | 2,584.6 | $ | — | — | % | $ | 2,914.9 | $ | — | — | % | $ | 2,817.4 | $ | — | — | % | ||||||||||||||||||||||||||||||||||||||
| NOW and other | 1,048.9 | 14.9 | 1.42 | % | 1,416.7 | 6.1 | 0.43 | % | 1,340.2 | 1.0 | 0.07 | % | ||||||||||||||||||||||||||||||||||||||||||||
| Money market | 2,727.3 | 65.6 | 2.40 | 2,809.1 | 13.8 | 0.49 | 2,749.7 | 5.3 | 0.19 | |||||||||||||||||||||||||||||||||||||||||||||||
| Savings | 1,067.2 | 6.1 | 0.57 | 1,114.8 | 0.4 | 0.03 | 1,067.7 | 0.5 | 0.05 | |||||||||||||||||||||||||||||||||||||||||||||||
| Certificates of deposit | 2,275.8 | 72.4 | 3.18 | 1,541.7 | 13.1 | 0.85 | 1,978.9 | 18.6 | 0.94 | |||||||||||||||||||||||||||||||||||||||||||||||
| Total deposits | 9,703.8 | 159.0 | 1.64 | 9,797.2 | 33.4 | 0.34 | 9,953.9 | 25.4 | 0.26 | |||||||||||||||||||||||||||||||||||||||||||||||
| Borrowings and notes (4) | 913.6 | 48.3 | 5.29 | 176.1 | 9.2 | 5.24 | 320.2 | 10.7 | 3.34 | |||||||||||||||||||||||||||||||||||||||||||||||
| Mid-Atlantic region interest-bearing deposits | — | — | — | — | — | — | 335.1 | 1.8 | 0.54 | |||||||||||||||||||||||||||||||||||||||||||||||
| Total funding liabilities | 10,617.4 | 207.3 | 1.95 | 9,973.3 | 42.6 | 0.43 | 10,609.2 | 37.9 | 0.35 | |||||||||||||||||||||||||||||||||||||||||||||||
| Other non-interest-bearing liabilities | 236.3 | 180.1 | 280.9 | |||||||||||||||||||||||||||||||||||||||||||||||||||||
| Total liabilities | 10,853.7 | 10,153.4 | 10,890.1 | |||||||||||||||||||||||||||||||||||||||||||||||||||||
| Total shareholders' equity | 983.9 | 1,062.9 | 1,190.5 | |||||||||||||||||||||||||||||||||||||||||||||||||||||
| Total liabilities and equity | $ | 11,837.6 | $ | 11,216.3 | $ | 12,080.6 | ||||||||||||||||||||||||||||||||||||||||||||||||||
| Net interest margin (5) | 3.27 | 3.26 | 2.60 | |||||||||||||||||||||||||||||||||||||||||||||||||||||
| Supplementary data | ||||||||||||||||||||||||||||||||||||||||||||||||||||||||
| Net Interest Income, non FTE | $ | 369.0 | $ | 344.6 | $ | 291.2 | ||||||||||||||||||||||||||||||||||||||||||||||||||
| FTE income adjustment (6) | 7.9 | 6.6 | 6.3 | |||||||||||||||||||||||||||||||||||||||||||||||||||||
| Net Interest Income, FTE | 376.9 | 351.2 | 297.5 | |||||||||||||||||||||||||||||||||||||||||||||||||||||
| 2023 Compared with 2022 | 2022 Compared with 2021 | |||||||||||||||||||||||||||||||||||||
| (Decrease) Increase Due to | (Decrease) Increase Due to | |||||||||||||||||||||||||||||||||||||
| (In thousands) | Rate | Volume | Net | Rate | Volume | Net | ||||||||||||||||||||||||||||||||
| Interest income: | ||||||||||||||||||||||||||||||||||||||
| Commercial real estate | $ | 81,238 | $ | 23,568 | $ | 104,806 | $ | 34,681 | $ | 8,582 | $ | 43,263 | ||||||||||||||||||||||||||
| Commercial and industrial loans | 32,105 | 1,086 | 33,191 | 7,397 | (4,501) | 2,896 | ||||||||||||||||||||||||||||||||
| Residential loans | 6,883 | 27,931 | 34,814 | (3,179) | 8,061 | 4,882 | ||||||||||||||||||||||||||||||||
| Consumer loans | 8,004 | (2,329) | 5,675 | 10,572 | (482) | 10,090 | ||||||||||||||||||||||||||||||||
| Total loans | 128,230 | 50,256 | 178,486 | 49,471 | 11,660 | 61,131 | ||||||||||||||||||||||||||||||||
| Investment securities | 6,239 | (6,628) | (389) | (2,468) | 4,316 | 1,848 | ||||||||||||||||||||||||||||||||
| Short-term investments and loans held for sale (1) | 14,416 | (2,244) | 12,172 | 4,968 | (2,335) | 2,633 | ||||||||||||||||||||||||||||||||
| Mid-Atlantic region loans held for sale | — | — | — | — | (7,120) | (7,120) | ||||||||||||||||||||||||||||||||
| Total interest income | $ | 148,885 | $ | 41,384 | $ | 190,269 | $ | 51,971 | $ | 6,521 | $ | 58,492 | ||||||||||||||||||||||||||
| Interest expense: | ||||||||||||||||||||||||||||||||||||||
| NOW accounts | $ | 6,380 | $ | 2,324 | $ | 8,704 | $ | 5,053 | $ | 62 | $ | 5,115 | ||||||||||||||||||||||||||
| Money market accounts | 59,450 | (7,713) | 51,737 | 8,402 | 116 | 8,518 | ||||||||||||||||||||||||||||||||
| Savings accounts | 5,299 | 453 | 5,752 | (204) | 23 | (181) | ||||||||||||||||||||||||||||||||
| Certificates of deposit | 60,555 | (1,271) | 59,284 | (1,593) | (3,839) | (5,432) | ||||||||||||||||||||||||||||||||
| Total deposits | 131,684 | (6,207) | 125,477 | 11,658 | (3,638) | 8,020 | ||||||||||||||||||||||||||||||||
| Borrowings | 8 | 39,111 | 39,119 | 4,568 | (6,010) | (1,442) | ||||||||||||||||||||||||||||||||
| Mid-Atlantic region interest-bearing deposits | — | — | — | — | (1,820) | (1,820) | ||||||||||||||||||||||||||||||||
| Total interest expense | $ | 131,692 | $ | 32,904 | $ | 164,596 | $ | 16,226 | $ | (11,468) | $ | 4,758 | ||||||||||||||||||||||||||
| Change in net interest income | $ | 17,193 | $ | 8,480 | $ | 25,673 | $ | 35,745 | $ | 17,989 | $ | 53,734 | ||||||||||||||||||||||||||
| At or For the Years Ended | ||||||||||||||||||||||||||||||||
| (Dollars in thousands) | December 31, 2023 | December 31, 2022 | December 31, 2021 | |||||||||||||||||||||||||||||
| GAAP Net income | $ | 69,598 | $ | 92,533 | $ | 118,664 | ||||||||||||||||||||||||||
| Non-GAAP measures | ||||||||||||||||||||||||||||||||
Adj: Fair value adjustments on securities (1) | — | 2,037 | 787 | |||||||||||||||||||||||||||||
| Adj: Loss/(gain) on sale of AFS securities | 25,057 | (6) | — | |||||||||||||||||||||||||||||
| Adj: Net gains on sale of business operations | — | — | (52,942) | |||||||||||||||||||||||||||||
Adj: Acquisition, restructuring, conversion, and other related expenses (2) | 6,261 | 8,909 | 5,781 | |||||||||||||||||||||||||||||
| Adj: Income taxes | (7,723) | (2,940) | 11,696 | |||||||||||||||||||||||||||||
| Net non-operating charges | 23,595 | 8,000 | (34,678) | |||||||||||||||||||||||||||||
| Operating net income (non-GAAP) | $ | 93,193 | $ | 100,533 | $ | 83,986 | ||||||||||||||||||||||||||
| GAAP Total revenue from continuing operations | $ | 411,829 | $ | 413,534 | $ | 434,414 | ||||||||||||||||||||||||||
| Adj: Fair value adjustments on securities | — | 2,037 | 787 | |||||||||||||||||||||||||||||
| Adj: Loss/(gain) on sale of AFS securities | 25,057 | (6) | — | |||||||||||||||||||||||||||||
| Adj: Net gains on sale of business operations | — | — | (52,942) | |||||||||||||||||||||||||||||
| Operating revenue (non-GAAP) | $ | 436,886 | $ | 413,528 | $ | 382,259 | ||||||||||||||||||||||||||
| GAAP Total non-interest expense from continuing operations | $ | 301,508 | $ | 288,716 | $ | 285,893 | ||||||||||||||||||||||||||
| Less: Total non-operating expense (see above) | (6,261) | (8,909) | (5,781) | |||||||||||||||||||||||||||||
| Operating non-interest expense (non-GAAP) | $ | 295,247 | $ | 279,807 | $ | 280,112 | ||||||||||||||||||||||||||
| Pre-tax, pre-provision net revenue (PPNR) | $ | 110,321 | $ | 124,818 | $ | 148,521 | ||||||||||||||||||||||||||
| Operating pre-tax, pre-provision net revenue (PPNR) | 141,639 | 135,758 | 102,147 | |||||||||||||||||||||||||||||
| (in millions, except per share data) | ||||||||||||||||||||||||||||||||
| Total average assets | $ | 11,838 | $ | 11,216 | $ | 12,081 | ||||||||||||||||||||||||||
| Total average shareholders' equity, including unrealized losses on AFS securities | 984 | 1,063 | 1,191 | |||||||||||||||||||||||||||||
| Total average shareholders' equity, excluding unrealized losses on AFS securities | 1,226 | 1,193 | 1,166 | |||||||||||||||||||||||||||||
| Total average tangible shareholders' equity, including unrealized losses on AFS securities | 962 | 1,036 | 1,159 | |||||||||||||||||||||||||||||
| Total average tangible shareholders' equity, excluding unrealized losses on AFS securities | 1,204 | 1,166 | 1,134 | |||||||||||||||||||||||||||||
| Total tangible shareholders’ equity, period-end | 993 | 930 | 1,153 | |||||||||||||||||||||||||||||
| Total tangible assets, period-end | 12,411 | 11,638 | 11,525 | |||||||||||||||||||||||||||||
| Total common shares outstanding, period-end (thousands) | 43,501 | 44,361 | 48,667 | |||||||||||||||||||||||||||||
Average diluted shares outstanding (thousands) | 43,504 | 45,914 | 49,554 | |||||||||||||||||||||||||||||
| Earnings per share, diluted | $ | 1.60 | $ | 2.02 | $ | 2.39 | ||||||||||||||||||||||||||
| Plus: Net adjustments per share, diluted | 0.54 | 0.17 | (0.70) | |||||||||||||||||||||||||||||
| Operating earnings per share, diluted | 2.14 | 2.19 | 1.69 | |||||||||||||||||||||||||||||
| Book value per common share, period-end | 23.27 | 21.51 | 24.30 | |||||||||||||||||||||||||||||
| Tangible book value per common share, period-end | 22.82 | 20.95 | 23.69 | |||||||||||||||||||||||||||||
| Total shareholders' equity/total assets | 8.14 | 8.18 | 10.23 | |||||||||||||||||||||||||||||
| Total tangible shareholders' equity/total tangible assets | 8.00 | 7.99 | 10.00 | |||||||||||||||||||||||||||||
| At or For the Years Ended | ||||||||||||||||||||||||||||||||
| (Dollars in thousands) | December 31, 2023 | December 31, 2022 | December 31, 2021 | |||||||||||||||||||||||||||||
| Performance Ratios | ||||||||||||||||||||||||||||||||
| Return on equity, including unrealized losses on AFS securities | 7.07 | % | 8.70 | % | 9.96 | % | ||||||||||||||||||||||||||
| Return on equity, excluding unrealized losses on AFS securities | 5.68 | 7.76 | 10.18 | |||||||||||||||||||||||||||||
| Operating return on equity, including unrealized losses on AFS securities | 9.47 | 9.46 | 7.05 | |||||||||||||||||||||||||||||
| Operating return on equity, excluding unrealized losses on AFS securities | 7.60 | 8.43 | 7.20 | |||||||||||||||||||||||||||||
Return on tangible common equity, including unrealized losses on AFS securities (3) | 7.60 | 9.29 | 10.57 | |||||||||||||||||||||||||||||
Return on tangible common equity, excluding unrealized losses on AFS securities (3) | 6.07 | 8.26 | 10.80 | |||||||||||||||||||||||||||||
Operating return on tangible common equity, including unrealized losses on AFS securities (3) | 10.05 | 10.07 | 7.58 | |||||||||||||||||||||||||||||
Operating return on tangible common equity, excluding unrealized losses on AFS securities (3) | 8.03 | 8.94 | 7.74 | |||||||||||||||||||||||||||||
| Return on assets | 0.59 | 0.82 | 0.98 | |||||||||||||||||||||||||||||
| Operating return on assets | 0.79 | 0.90 | 0.70 | |||||||||||||||||||||||||||||
| Efficiency ratio (4) | 63.88 | 64.31 | 69.96 | |||||||||||||||||||||||||||||
Supplementary Data (in thousands) | ||||||||||||||||||||||||||||||||
| Tax benefit on tax-credit investments | $ | 9,863 | $ | 4,880 | $ | 4,372 | ||||||||||||||||||||||||||
| Non-interest income charge on tax-credit investments | (8,018) | (3,508) | (3,445) | |||||||||||||||||||||||||||||
| Net income on tax-credit investments | 1,845 | 1,372 | 928 | |||||||||||||||||||||||||||||
| Intangible amortization | 4,820 | 5,134 | 5,200 | |||||||||||||||||||||||||||||
| Fully taxable equivalent income adjustment | 7,870 | 6,644 | 6,344 | |||||||||||||||||||||||||||||
| (In thousands) | Total | Less than One Year | One to Three Years | Three to Five Years | After Five Years | |||||||||||||||
| FHLBB borrowings (1) | $ | 1,047,736 | $ | 836,115 | $ | 204,183 | $ | 7,438 | $ | — | ||||||||||
| Subordinated notes | 89,339 | — | — | — | 89,339 | |||||||||||||||
| Operating lease obligations (2) | 96,356 | 12,830 | 20,080 | 15,859 | 47,587 | |||||||||||||||
| Purchase obligations (3) | 102,002 | 16,321 | 31,086 | 27,507 | 27,088 | |||||||||||||||
| Total Contractual Obligations | $ | 1,335,433 | $ | 865,266 | $ | 255,349 | $ | 50,804 | $ | 164,014 | ||||||||||
Change in Interest Rates-Basis Points (Rate Ramp) | ||||||||||||||
| 1- 12 Months | 13- 24 Months | |||||||||||||
| $ Change | % Change | $ Change | % Change | |||||||||||
| (In thousands) | ||||||||||||||
| At December 31, 2017 | ||||||||||||||
| +300 | $ | 9,806 | 2.95 | % | $ | 11,193 | 3.40 | % | ||||||
| +200 | 7,940 | 2.39 | 9,374 | 2.85 | ||||||||||
| +100 | 4,683 | 1.41 | 5,890 | 1.79 | ||||||||||
| -100 | (6,424 | ) | (1.93 | ) | (12,532 | ) | (3.81 | ) | ||||||
| At December 31, 2016 | ||||||||||||||
| +300 | $ | 9,904 | 3.96 | % | $ | 7,659 | 3.07 | % | ||||||
| +200 | 7,497 | 3.00 | 6,527 | 2.62 | ||||||||||
| +100 | 4,632 | 1.85 | 4,448 | 1.78 | ||||||||||
| -100 | (5,853 | ) | (2.34 | ) | (10,100 | ) | (4.05 | ) | ||||||
| Parallel Interest Rate Shock (basis points) | ||||||||||||||
| Estimated Percent Change in Net Interest Income | ||||||||||||||
| December 31, 2023 | December 31, 2022 | |||||||||||||
| +200 | 0.5 | % | 1.8 | % | ||||||||||
| +100 | 0.3 | 0.8 | ||||||||||||
| -100 | (0.6) | (1.6) | ||||||||||||
| -200 | (2.1) | (5.2) | ||||||||||||
| Yield Curve Twist Interest Rate Shock | December 31, 2023 | December 31, 2022 | ||||||||||||
| Short End +100 | (0.5) | % | 0.1 | % | ||||||||||
| Short End -100 | (0.5) | (1.3) | ||||||||||||
| Long End +100 | 1.1 | 1.0 | ||||||||||||
| Long End -100 | (1.1) | (1.2) | ||||||||||||
| Estimated Percent Change in Economic Value of Equity | ||||||||||||||
| Parallel Shock Rate Change (basis points | December 31, 2023 | December 31, 2022 | ||||||||||||
| +200 | (3.9) | % | — | % | ||||||||||
| +100 | (1.8) | — | ||||||||||||
| -100 | 1.2 | (1.5) | ||||||||||||
| -200 | 1.3 | (5.4) | ||||||||||||
| Name | Age | Position | ||||||
| Nitin J. Mhatre | 53 | |||||||
| President and Chief Executive Officer of the Company; Chief Executive Officer - Berkshire Bank; Director of Berkshire Hills Bancorp and Berkshire Bank | ||||||||
| Senior Executive Vice President, | ||||||||
| Senior Executive Vice President, Chief Financial Officer | ||||||||
| Senior Executive Vice President, Head of Commercial Banking | ||||||||
| Senior Executive Vice President, | ||||||||
| Executive Vice President, | ||||||||
| Philip Jurgeleit | 54 | Executive Vice President, Chief Credit Officer | ||||||
| Gregory D. Lindenmuth | Senior Executive Vice President, Chief Risk Officer | |||||||
| Executive Vice President, | ||||||||
| Wm. Gordon Prescott | 62 | Senior Executive Vice President, General Counsel and Corporate Secretary | ||||||
| Sumant Pustake | 39 | Executive Vice President, Chief Transformation & | ||||||
| Ellen Steinfeld | 62 | Senior Executive Vice President, Head of Consumer Lending & Payments | ||||||
| Jason T. White | 48 | Senior Executive Vice President, Chief Information Officer – Berkshire Bank | ||||||

 | |||||


 | |||||


 | Ashlee Flores. Age 39. Ms. Flores was promoted to Executive Vice President, Chief Compliance Officer in September 2022. She oversees all aspects of the compliance risk management program, including compliance with the Bank Secrecy Act, Community Reinvestment Act, consumer protection laws and regulations, as well as the Security and Fraud Investigations functions. Ms. Flores previously served as SVP, Compliance, where she oversaw Berkshire Bank's compliance program. Prior to joining Berkshire Bank, Ms. Flores was a compliance officer at Hampden Bank in Springfield, MA where she managed the compliance and audit program. | ||||
 | Philip Jurgeleit. Age 54. Mr. Jurgeleit joined the Company in January 2023 as Executive Vice President, Chief Credit Officer. He oversees all aspects of the company's credit underwriting, policy, and approval processes. Mr. Jurgeleit most recently served as SVP and Senior Director of Credit Risk at Santander Bank where he was responsible for all aspects of credit risk management including credit approval, asset quality, underwriting guidelines, and credit policies for the Middle Market, Mid-Corporate, Asset Based Lending, and Healthcare/Not-for-Profit business units. He also held senior leadership roles at Citizens Bank, Webster Bank and Bank of | ||||
 | Gregory D. Lindenmuth. Age 56. Mr. Lindenmuth is Senior Executive Vice President, Chief Risk Officer of the Bank, a position he was promoted to in October | ||||


 | |||||
 | Wm. Gordon Prescott, Age 62. Mr. Prescott is Senior Executive Vice President, General Counsel and Corporate Secretary, a position he was promoted to in October 2018. Mr. Prescott joined Berkshire in 2008 as VP, General Counsel and Corporate Secretary. Mr. Prescott has 30 plus years of experience in the legal profession, including extensive experience as in-house corporate counsel, most recently with KB Toys Inc. prior to joining the Bank. | ||||
 | Sumant Pustake. Age 39. Mr. Pustake was promoted to Executive Vice President in February 2023 and has served as Chief Transformation and Strategy Officer since June 2021. Mr. Pustake previously oversaw Berkshire's corporate development efforts, where he served as the development leader and | ||||
 | Ellen Steinfeld, Age 62.Ms. Steinfeld is Senior Executive Vice President and Head of Consumer Lending & Payments. She | ||||
 | Jason T. White, Age 48.Mr. White is Senior Executive Vice President and was named Chief Information Officer of Berkshire Bank in November 2020.He previously served as Senior Vice President, Chief Technology Officer since May 2019 when he joined the Bank following the acquisition of Savings Institute Bank & Trust, where he served as | ||||
| Plan category | Number of securities to be issued upon exercise of outstanding options, warrants and rights | Weighted-average exercise price of outstanding options, warrants and rights | Number of securities remaining available for future issuance under equity compensation plans (excluding securities reflected in the first column) | |||||||||||||||||
| Equity compensation plans approved by security holders | 49,200 | $ | 26.46 | 1,158,196 | ||||||||||||||||
| Equity compensation plans not approved by security holders | — | — | — | |||||||||||||||||
| Total | 49,200 | $ | 26.46 | 1,158,196 | ||||||||||||||||
| Plan category | Number of securities to be issued upon exercise of outstanding options, warrants and rights | Weighted-average exercise price of outstanding options, warrants and rights | Number of securities remaining available for future issuance under equity compensation plans (excluding securities reflected in the first column) | |||||||
| Equity compensation plans approved by security holders | 75,589 | $ | 13.59 | 389,536 | ||||||
| Equity compensation plans not approved by security holders | — | — | — | |||||||
| Total | 75,589 | $ | 13.59 | 389,536 | ||||||
(a) [1] Consolidated Financial Statements |
| 3.1 | ||||||||
| 3.2 | ||||||||
| 4.1 | ||||||||
| 4.2 | ||||||||
| 10.1 | ||||||||
| 10.2 | ||||||||
| 10.3 | ||||||||
| 10.4 | ||||||||
| 10.5 | ||||||||
| 10.7 | ||||||||
| 10.10 | ||||||||
| 21.0 | ||||||||
| 23.1 | ||||||||
| 31.2 | ||||||||
| 32.1 | ||||||||
| 32.2 | ||||||||
| 101 | ||||||||
| (1) | Incorporated herein by reference from the Exhibits to Form 10-Q as filed on August 9, 2018 | |||||||
| (2) | Incorporated herein by reference from the Exhibits to the Form 8-K as filed on June 26, 2017. | |||||||
| (3) | ||||||||
| Incorporated herein by reference from the Exhibits to Form S-1, Registration Statement and amendments thereto, initially filed on March 10, 2000, Registration No. 333-32146. | ||||||||
Incorporated herein by reference from the Exhibits to the Form 8-K as filed on October 16, 2017. | ||||||||
| (5) | Incorporated herein by reference from the Exhibits to the Form 8-K as filed on September 26, 2012. | |||||||
| (6) | Incorporated herein by reference from | |||||||
| Incorporated herein by reference from the Exhibit to the Form | ||||||||
| Incorporated herein by reference from the | ||||||||
| Incorporated herein by reference from the Exhibits to the Form 10-K as filed on March 16, 2011. | ||||||||
| Incorporated herein by reference from the Exhibits to the Form 8-K as filed on February 22, 2019. | ||||||||
| (11) | Incorporated herein by reference from the Exhibits to the Form 10-K as filed on March 17, 2014. | |||||||
| (12) | Incorporated herein by reference from the Exhibits to the Form 10-K as filed on February 28, 2020. | |||||||
| (13) | Incorporated herein by reference from the Exhibit to the Form 8-K as filed on January 19, 2011. | |||||||
| (14) | ||||||||
| Incorporated herein by reference from the Exhibits to the Form 8-K as filed on January 23, 2015. | ||||||||
| (15) | Incorporated herein by reference from the Appendix to the Proxy Statement as filed on April 6, 2018. | |||||||
| (16) | Incorporated herein by reference from the Exhibits to the Form 10-Q as filed on May 10, 2019. | |||||||
| (17) | Incorporated herein by reference from the Appendix to the Proxy Statement as filed on April 8, 2022. | |||||||
| Berkshire Hills Bancorp, Inc. | |||||||||
| Date: | By: | /s/ | |||||||
| President & Chief Executive Officer | |||||||||
| /s/ | Director, President, & Chief Executive Officer | ||||||||||||||
| (principal executive officer) | |||||||||||||||
| /s/ | Senior Executive Vice President, Chief Financial Officer | ||||||||||||||
| (principal financial | |||||||||||||||
| /s/ David M. Brunelle | |||||||||||||||
| David M. Brunelle | |||||||||||||||
| /s/ Baye Adofo-Wilson | Director | February 28, 2024 | |||||||||||||
| Baye Adofo-Wilson | |||||||||||||||
| /s/ | Director | ||||||||||||||
| /s/ Nina A. Charnley | Director | February 28, 2024 | |||||||||||||
| Nina A. Charnley | |||||||||||||||
| /s/ | Director | ||||||||||||||
| /s/ William H. Hughes, III | Director | February 28, 2024 | |||||||||||||
| William H. Hughes, III | |||||||||||||||
| /s/ | Director | ||||||||||||||
| /s/ Sylvia Maxfield | Director | February 28, 2024 | |||||||||||||
| /s/ Laurie Norton Moffatt | Director | ||||||||||||||
| Laurie Norton Moffatt | |||||||||||||||
| /s/ Karyn Polito | Director | February 28, 2024 | |||||||||||||
| Karyn Polito | |||||||||||||||
| /s/ | Director | ||||||||||||||
| /s/ Michael A. Zaitzeff | Director | February 28, 2024 | |||||||||||||
| /s/ Nitin J. Mhatre | /s/ R. David Rosato | |||||||
| Nitin J. Mhatre | R. David Rosato | |||||||
| President & Chief Executive Officer | Senior Executive Vice President & Chief Financial Officer | |||||||

| December 31, | December 31, | |||||||||||||||||||||||||||
| (In thousands, except share data) | 2017 | 2016 | (In thousands, except share data) | 2023 | 2022 | |||||||||||||||||||||||
| Assets | Assets | |||||||||||||||||||||||||||
| Cash and due from banks | $ | 91,122 | $ | 71,494 | ||||||||||||||||||||||||
| Short-term investments | 157,641 | 41,581 | ||||||||||||||||||||||||||
| Total cash and cash equivalents | 248,763 | 113,075 | ||||||||||||||||||||||||||
| Trading security | 12,277 | 13,229 | ||||||||||||||||||||||||||
| Trading security | ||||||||||||||||||||||||||||
| Trading security | ||||||||||||||||||||||||||||
| Marketable equity securities, at fair value | ||||||||||||||||||||||||||||
| Securities available for sale, at fair value | 1,426,099 | 1,209,537 | ||||||||||||||||||||||||||
| Securities held to maturity (fair values of 405,276 in 2017 and $337,680 in 2016) | 397,103 | 334,368 | ||||||||||||||||||||||||||
| Securities held to maturity (fair values of $476,228 in 2023 and $507,464 in 2022) | ||||||||||||||||||||||||||||
| Federal Home Loan Bank stock and other restricted securities | 63,085 | 71,112 | ||||||||||||||||||||||||||
| Total securities | 1,898,564 | 1,628,246 | ||||||||||||||||||||||||||
| Less: Allowance for credit losses on investment | ||||||||||||||||||||||||||||
| Net Securities | ||||||||||||||||||||||||||||
| Loans held for sale, at fair value | 153,620 | 120,673 | ||||||||||||||||||||||||||
| Loans held for sale | ||||||||||||||||||||||||||||
| Loans held for sale | ||||||||||||||||||||||||||||
| Loans held for sale | ||||||||||||||||||||||||||||
| Commercial real estate | 3,264,742 | 2,616,438 | ||||||||||||||||||||||||||
| Commercial and industrial loans | 1,803,939 | 1,062,038 | ||||||||||||||||||||||||||
| Residential mortgages | 2,102,807 | 1,893,131 | ||||||||||||||||||||||||||
| Consumer loans | 1,127,850 | 978,180 | ||||||||||||||||||||||||||
| Total loans | 8,299,338 | 6,549,787 | ||||||||||||||||||||||||||
| Less: Allowance for loan losses | (51,834 | ) | (43,998 | ) | ||||||||||||||||||||||||
| Total loans | ||||||||||||||||||||||||||||
| Total loans | ||||||||||||||||||||||||||||
| Less: Allowance for credit losses on loans | ||||||||||||||||||||||||||||
| Net loans | 8,247,504 | 6,505,789 | ||||||||||||||||||||||||||
| Premises and equipment, net | 109,352 | 93,215 | ||||||||||||||||||||||||||
| Other real estate owned | — | 151 | ||||||||||||||||||||||||||
| Goodwill | 519,287 | 403,106 | ||||||||||||||||||||||||||
| Premises and equipment, net | ||||||||||||||||||||||||||||
| Premises and equipment, net | ||||||||||||||||||||||||||||
| Other intangible assets | ||||||||||||||||||||||||||||
| Other intangible assets | ||||||||||||||||||||||||||||
| Other intangible assets | 38,296 | 19,445 | ||||||||||||||||||||||||||
| Cash surrender value of bank-owned life insurance | 191,221 | 139,257 | ||||||||||||||||||||||||||
| Deferred tax assets, net | 47,061 | 41,128 | ||||||||||||||||||||||||||
| Other assets | 117,083 | 98,457 | ||||||||||||||||||||||||||
| Other assets | ||||||||||||||||||||||||||||
| Other assets | ||||||||||||||||||||||||||||
| Assets held for sale | ||||||||||||||||||||||||||||
| Total assets | ||||||||||||||||||||||||||||
| Total assets | ||||||||||||||||||||||||||||
| Total assets | $ | 11,570,751 | $ | 9,162,542 | ||||||||||||||||||||||||
| Liabilities | ||||||||||||||||||||||||||||
| Liabilities | ||||||||||||||||||||||||||||
| Liabilities | ||||||||||||||||||||||||||||
| Demand deposits | $ | 1,667,323 | $ | 1,278,875 | ||||||||||||||||||||||||
| NOW deposits | 673,891 | 570,583 | ||||||||||||||||||||||||||
| NOW and other deposits | ||||||||||||||||||||||||||||
| Money market deposits | 2,776,157 | 1,781,605 | ||||||||||||||||||||||||||
| Savings deposits | 741,954 | 657,486 | ||||||||||||||||||||||||||
| Time deposits | 2,890,205 | 2,333,543 | ||||||||||||||||||||||||||
| Total deposits | 8,749,530 | 6,622,092 | ||||||||||||||||||||||||||
| Short-term debt | 667,300 | 1,082,044 | ||||||||||||||||||||||||||
| Long-term Federal Home Loan Bank advances | 380,436 | 142,792 | ||||||||||||||||||||||||||
| Subordinated notes | 89,339 | 89,161 | ||||||||||||||||||||||||||
| Total borrowings | 1,137,075 | 1,313,997 | ||||||||||||||||||||||||||
| Other liabilities | 187,882 | 133,155 | ||||||||||||||||||||||||||
| Total liabilities | 10,074,487 | 8,069,244 | ||||||||||||||||||||||||||
| Total liabilities | ||||||||||||||||||||||||||||
| Total liabilities | ||||||||||||||||||||||||||||
| December 31, | ||||||||||||||||||||||||||||
| (In thousands, except share data) | (In thousands, except share data) | 2023 | 2022 | |||||||||||||||||||||||||
| Shareholders’ equity | Shareholders’ equity | |||||||||||||||||||||||||||
| Preferred Stock (Series B non-voting convertible preferred stock - $0.01 par value; 1,000,000 shares authorized, 521,607 shares issued and outstanding in 2017; 1,000,000 shares authorized, no shares issued and outstanding in 2016) | 40,633 | — | ||||||||||||||||||||||||||
| Common stock ($.01 par value; 50,000,000 shares authorized, 46,211,894 shares issued, and 45,290,433 shares outstanding in 2017; 50,000,000 shares authorized, 36,732,129 shares issued, and 35,672,817 shares outstanding in 2016) | 460 | 366 | ||||||||||||||||||||||||||
| Common stock ($0.01 par value; 100,000,000 shares authorized and 51,903,190 shares issued and 43,500,872 shares outstanding in 2023; 100,000,000 shares authorized; 51,903,190 shares issued, and 44,361,222 shares outstanding in 2022) | ||||||||||||||||||||||||||||
| Common stock ($0.01 par value; 100,000,000 shares authorized and 51,903,190 shares issued and 43,500,872 shares outstanding in 2023; 100,000,000 shares authorized; 51,903,190 shares issued, and 44,361,222 shares outstanding in 2022) | ||||||||||||||||||||||||||||
| Common stock ($0.01 par value; 100,000,000 shares authorized and 51,903,190 shares issued and 43,500,872 shares outstanding in 2023; 100,000,000 shares authorized; 51,903,190 shares issued, and 44,361,222 shares outstanding in 2022) | ||||||||||||||||||||||||||||
| Additional paid-in capital - common stock | 1,242,487 | 898,989 | ||||||||||||||||||||||||||
| Unearned compensation | (6,531 | ) | (6,374 | ) | ||||||||||||||||||||||||
| Retained earnings | 239,179 | 217,494 | ||||||||||||||||||||||||||
| Accumulated other comprehensive income (loss) | 4,161 | 9,766 | ||||||||||||||||||||||||||
| Treasury stock, at cost (921,461 shares in 2017 and 1,059,312 shares in 2016) | (24,125 | ) | (26,943 | ) | ||||||||||||||||||||||||
| Retained (deficit) | ||||||||||||||||||||||||||||
| Accumulated other comprehensive (loss) | ||||||||||||||||||||||||||||
| Treasury stock, at cost (8,402,318 shares in 2023 and 7,541,968 shares in 2022) | ||||||||||||||||||||||||||||
| Total shareholders’ equity | 1,496,264 | 1,093,298 | ||||||||||||||||||||||||||
| Total liabilities and shareholders’ equity | $ | 11,570,751 | $ | 9,162,542 | ||||||||||||||||||||||||
| Years Ended December 31, | ||||||||||||
| (In thousands) | 2017 | 2016 | 2015 | |||||||||
| Interest and dividend income | ||||||||||||
| Loans | $ | 308,099 | $ | 242,600 | $ | 211,347 | ||||||
| Securities and other | 52,159 | 37,839 | 35,683 | |||||||||
| Total interest and dividend income | 360,258 | 280,439 | 247,030 | |||||||||
| Interest expense | ||||||||||||
| Deposits | 43,855 | 30,883 | 22,948 | |||||||||
| Borrowings and subordinated notes | 21,608 | 17,289 | 10,233 | |||||||||
| Total interest expense | 65,463 | 48,172 | 33,181 | |||||||||
| Net interest income | 294,795 | 232,267 | 213,849 | |||||||||
| Non-interest income | ||||||||||||
| Mortgage banking income | 54,251 | 7,555 | 4,133 | |||||||||
| Loan related income | 21,401 | 16,694 | 8,310 | |||||||||
| Deposit related fees | 27,165 | 24,963 | 25,084 | |||||||||
| Insurance commissions and fees | 10,589 | 10,477 | 10,251 | |||||||||
| Wealth management fees | 9,395 | 8,917 | 9,702 | |||||||||
| Total fee income | 122,801 | 68,606 | 57,480 | |||||||||
| Other | (3,377 | ) | (3,289 | ) | (5,302 | ) | ||||||
| Gain (Loss) on securities, net | 12,598 | (551 | ) | 2,110 | ||||||||
| Gain on sale of business operations, net | 296 | 1,085 | — | |||||||||
| Loss on termination of hedges | (6,629 | ) | — | — | ||||||||
| Total non-interest income | 125,689 | 65,851 | 54,288 | |||||||||
| Total net revenue | 420,484 | 298,118 | 268,137 | |||||||||
| Provision for loan losses | 21,025 | 17,362 | 16,726 | |||||||||
| Non-interest expense | ||||||||||||
| Compensation and benefits | 152,979 | 104,600 | 97,370 | |||||||||
| Occupancy and equipment | 35,422 | 27,220 | 28,486 | |||||||||
| Technology and communications | 25,900 | 19,883 | 16,881 | |||||||||
| Marketing and promotion | 11,877 | 3,161 | 3,306 | |||||||||
| Professional services | 9,165 | 6,199 | 5,172 | |||||||||
| FDIC premiums and assessments | 6,457 | 5,066 | 4,649 | |||||||||
| Other real estate owned and foreclosures | 44 | 691 | 833 | |||||||||
| Amortization of intangible assets | 3,493 | 2,927 | 3,563 | |||||||||
| Merger, restructuring and conversion related expenses | 31,558 | 15,461 | 17,611 | |||||||||
| Other | 22,815 | 18,094 | 18,958 | |||||||||
| Total non-interest expense | 299,710 | 203,302 | 196,829 | |||||||||
| Income from continuing operations before income taxes | 99,749 | 77,454 | 54,582 | |||||||||
| Income tax expense | 44,502 | 18,784 | 5,064 | |||||||||
| Net income | $ | 55,247 | $ | 58,670 | $ | 49,518 | ||||||
| Preferred stock dividend | 219 | — | — | |||||||||
| Income available to common shareholders | $ | 55,028 | $ | 58,670 | $ | 49,518 | ||||||
| Earnings per common share: | ||||||||||||
| Basic | $ | 1.40 | $ | 1.89 | $ | 1.74 | ||||||
| Diluted | $ | 1.39 | $ | 1.88 | $ | 1.73 | ||||||
| Weighted average common shares outstanding: | ||||||||||||
| Basic | 39,456 | 30,988 | 28,393 | |||||||||
| Diluted | 39,695 | 31,167 | 28,564 | |||||||||
| Years Ended December 31, | ||||||||||||
| (In thousands) | 2017 | 2016 | 2015 | |||||||||
| Net income | $ | 55,247 | $ | 58,670 | $ | 49,518 | ||||||
| Other comprehensive income (loss), before tax: | ||||||||||||
| Changes in unrealized gains and losses on securities available-for-sale | (15,142 | ) | 18,859 | (9,677 | ) | |||||||
| Changes in unrealized gains and losses on derivative hedges | 6,573 | 1,959 | (5,232 | ) | ||||||||
| Changes in unrealized gains and losses on pension | (94 | ) | 515 | (1,177 | ) | |||||||
| Total other comprehensive income (loss), before tax | (8,663 | ) | 21,333 | (16,086 | ) | |||||||
| Income taxes related to other comprehensive income (loss): | ||||||||||||
| Changes in unrealized gains and losses on securities available-for-sale | 5,610 | (7,199 | ) | 3,640 | ||||||||
| Changes in unrealized gains and losses on derivative hedges | (2,589 | ) | (835 | ) | 2,094 | |||||||
| Changes in unrealized gains and losses on pension | 37 | (228 | ) | 468 | ||||||||
| Total income tax (expense) benefit related to other comprehensive income (loss) | 3,058 | (8,262 | ) | 6,202 | ||||||||
| Total other comprehensive income (loss) | (5,605 | ) | 13,071 | (9,884 | ) | |||||||
| Total comprehensive income | $ | 49,642 | $ | 71,741 | $ | 39,634 | ||||||
| Years Ended December 31, | ||||||||||||||||||||
| (In thousands) | 2023 | 2022 | 2021 | |||||||||||||||||
| Interest and dividend income | ||||||||||||||||||||
| Loans | $ | 512,535 | $ | 335,312 | $ | 282,164 | ||||||||||||||
| Securities and other | 63,764 | 51,945 | 46,901 | |||||||||||||||||
| Total interest and dividend income | 576,299 | 387,257 | 329,065 | |||||||||||||||||
| Interest expense | ||||||||||||||||||||
| Deposits | 158,913 | 33,437 | 27,236 | |||||||||||||||||
| Borrowings and subordinated notes | 48,339 | 9,223 | 10,663 | |||||||||||||||||
| Total interest expense | 207,252 | 42,660 | 37,899 | |||||||||||||||||
| Net interest income | 369,047 | 344,597 | 291,166 | |||||||||||||||||
| Non-interest income | ||||||||||||||||||||
| Deposit related fees | 34,155 | 32,026 | 29,813 | |||||||||||||||||
| Loan related fees | 10,595 | 9,467 | 16,427 | |||||||||||||||||
| Gain on SBA loan sales | 10,334 | 12,494 | 20,689 | |||||||||||||||||
| Insurance commissions and fees | — | — | 7,003 | |||||||||||||||||
| Wealth management fees | 10,197 | 10,008 | 10,530 | |||||||||||||||||
| Total fee income | 65,281 | 63,995 | 84,462 | |||||||||||||||||
| Other | 2,045 | 6,973 | 6,631 | |||||||||||||||||
| Fair value adjustments on securities | 513 | (2,037) | (787) | |||||||||||||||||
| (Loss)/gain on sale of AFS securities | (25,057) | 6 | — | |||||||||||||||||
| Gain on sale of business operations and assets, net | — | — | 52,942 | |||||||||||||||||
| Total non-interest income | 42,782 | 68,937 | 143,248 | |||||||||||||||||
| Total net revenue | 411,829 | 413,534 | 434,414 | |||||||||||||||||
| Provision expense/(benefit) for credit losses | 31,999 | 11,000 | (500) | |||||||||||||||||
| Non-interest expense | ||||||||||||||||||||
| Compensation and benefits | 159,281 | 152,741 | 150,589 | |||||||||||||||||
| Occupancy and equipment | 35,718 | 37,638 | 41,782 | |||||||||||||||||
| Technology and communications | 41,878 | 35,586 | 33,803 | |||||||||||||||||
| Marketing and promotion | 5,377 | 5,103 | 2,749 | |||||||||||||||||
| Professional services | 11,643 | 12,043 | 15,860 | |||||||||||||||||
| FDIC premiums and assessments | 7,019 | 3,105 | 3,759 | |||||||||||||||||
| Other real estate owned and foreclosures | 15 | 36 | 17 | |||||||||||||||||
| Amortization of intangible assets | 4,820 | 5,134 | 5,200 | |||||||||||||||||
| Merger, restructuring and conversion related expenses | 6,261 | 8,909 | 5,781 | |||||||||||||||||
| Other | 29,496 | 28,421 | 26,353 | |||||||||||||||||
| Total non-interest expense | 301,508 | 288,716 | 285,893 | |||||||||||||||||
| Income before income taxes | 78,322 | 113,818 | 149,021 | |||||||||||||||||
| Income tax expense | 8,724 | 21,285 | 30,357 | |||||||||||||||||
| Net income | $ | 69,598 | $ | 92,533 | $ | 118,664 | ||||||||||||||
| Basic earnings per share | $ | 1.61 | $ | 2.03 | $ | 2.41 | ||||||||||||||
| Diluted earnings per share | $ | 1.60 | $ | 2.02 | $ | 2.39 | ||||||||||||||
| Weighted average common shares outstanding: | ||||||||||||||||||||
| Basic | 43,288 | 45,564 | 49,240 | |||||||||||||||||
| Diluted | 43,504 | 45,914 | 49,554 | |||||||||||||||||
| Years Ended December 31, | ||||||||||||||||||||
| (In thousands) | 2023 | 2022 | 2021 | |||||||||||||||||
| Net income | $ | 69,598 | $ | 92,533 | $ | 118,664 | ||||||||||||||
| Other comprehensive income/(loss), before tax: | ||||||||||||||||||||
| Changes in unrealized gains and losses on securities available-for-sale | 47,960 | (235,081) | (46,794) | |||||||||||||||||
| Changes in unrealized gains and losses on cash flow hedges | 2,402 | (6,667) | — | |||||||||||||||||
| Changes in unrealized gains and losses on pension | 316 | 1,674 | 993 | |||||||||||||||||
| Total other comprehensive income/(loss), before tax | 50,678 | (240,074) | (45,801) | |||||||||||||||||
| Income taxes related to other comprehensive income/(loss): | ||||||||||||||||||||
| Changes in unrealized gains and losses on securities available-for-sale | (11,928) | 60,922 | 11,937 | |||||||||||||||||
| Changes in unrealized gains and losses on cash flow hedges | (630) | 1,789 | — | |||||||||||||||||
| Changes in unrealized gains and losses on pension | (84) | (446) | (250) | |||||||||||||||||
| Total income tax (expense)/benefit related to other comprehensive income/(loss) | (12,642) | 62,265 | 11,687 | |||||||||||||||||
| Total other comprehensive income/(loss) | 38,036 | (177,809) | (34,114) | |||||||||||||||||
| Total comprehensive income/(loss) | $ | 107,634 | $ | (85,276) | $ | 84,550 | ||||||||||||||
| Preferred Stock | Common Stock | Additional paid-in | Unearned | Retained | Accumulated other comprehensive | Treasury | |||||||||||||||||||||
| (In thousands, except per share data) | Shares | Amount | Shares | Amount | capital | compensation | earnings | (loss) income | stock | Total | |||||||||||||||||
| Balance at January 1, 2015 | — | — | 25,183 | $ | 265 | $ | 585,289 | $ | (6,147 | ) | $ | 156,446 | $ | 6,579 | $ | (33,145 | ) | $ | 709,287 | ||||||||
| Comprehensive income: | |||||||||||||||||||||||||||
| Net income | — | — | — | — | — | — | 49,518 | — | — | 49,518 | |||||||||||||||||
| Other net comprehensive (loss) | — | — | — | — | — | — | — | (9,884 | ) | — | (9,884 | ) | |||||||||||||||
| Total comprehensive income | =sum(J5:J6) | =sum(J5:J6) | =sum(J5:J6) | =sum(J5:J6) | =sum(J5:J6) | =sum(J5:J6) | 49,518 | (9,884 | ) | — | 39,634 | ||||||||||||||||
| Acquisition of Hampden Bancorp, Inc | — | — | 4,186 | 42 | 114,562 | — | — | — | — | 114,604 | |||||||||||||||||
| Acquisition of Firestone Financial | — | — | 1,442 | 15 | 42,092 | — | — | — | — | 42,107 | |||||||||||||||||
| Cash dividends declared on common shares ($0.76 per share) | — | — | — | — | — | — | (21,903 | ) | — | — | (21,903 | ) | |||||||||||||||
| Treasury stock purchased | — | — | (18 | ) | — | — | — | — | — | (550 | ) | (550 | ) | ||||||||||||||
| Forfeited shares | — | — | (20 | ) | — | 47 | 509 | — | — | (556 | ) | — | |||||||||||||||
| Exercise of stock options | — | — | 16 | — | — | — | (176 | ) | — | 415 | 239 | ||||||||||||||||
| Restricted stock grants | — | — | 226 | — | 440 | (6,029 | ) | — | — | 5,589 | — | ||||||||||||||||
| Stock-based compensation | — | — | — | — | — | 4,670 | — | — | — | 4,670 | |||||||||||||||||
| Net tax benefit related to stock-based compensation | — | — | — | — | 167 | — | — | — | — | 167 | |||||||||||||||||
| Other, net | — | — | (41 | ) | — | 22 | — | — | — | (1,088 | ) | (1,066 | ) | ||||||||||||||
| Balance at December 31, 2015 | — | — | 30,974 | $ | 322 | $ | 742,619 | $ | (6,997 | ) | $ | 183,885 | $ | (3,305 | ) | $ | (29,335 | ) | $ | 887,189 | |||||||
| Comprehensive income: | 0 | ||||||||||||||||||||||||||
| Net income | — | — | — | — | — | — | 58,670 | — | — | 58,670 | |||||||||||||||||
| Other net comprehensive income | — | — | — | — | — | — | — | 13,071 | — | 13,071 | |||||||||||||||||
| Total comprehensive income | — | — | — | — | — | — | 58,670 | 13,071 | — | 71,741 | |||||||||||||||||
| Acquisition of 44 Business Capital | — | — | 45 | — | — | — | — | — | 1,217 | 1,217 | |||||||||||||||||
| Acquisition of First Choice Bank | — | — | 4,410 | 44 | 151,004 | — | — | — | — | 151,048 | |||||||||||||||||
| Cash dividends declared on common shares ($0.80 per share) | — | — | — | — | — | — | (24,916 | ) | — | — | (24,916 | ) | |||||||||||||||
| Treasury stock adjustment (1) | — | — | — | — | 4,632 | — | — | — | (4,632 | ) | — | ||||||||||||||||
| Forfeited shares | — | — | (70 | ) | — | 148 | 1,789 | — | — | (1,937 | ) | — | |||||||||||||||
| Exercise of stock options | — | — | 151 | — | — | — | (145 | ) | — | 3,857 | 3,712 | ||||||||||||||||
| Restricted stock grants | — | — | 211 | — | 575 | (5,787 | ) | — | — | 5,212 | — | ||||||||||||||||
| Stock-based compensation | — | — | — | — | — | 4,621 | — | — | — | 4,621 | |||||||||||||||||
| Net tax benefit related to stock-based compensation | — | — | — | — | (1 | ) | — | — | — | — | (1 | ) | |||||||||||||||
| Other, net | — | — | (48 | ) | — | 12 | — | — | — | (1,325 | ) | (1,313 | ) | ||||||||||||||
| Balance at December 31, 2016 | — | — | 35,673 | $ | 366 | $ | 898,989 | $ | (6,374 | ) | $ | 217,494 | $ | 9,766 | $ | (26,943 | ) | $ | 1,093,298 | ||||||||
| Comprehensive income: | |||||||||||||||||||||||||||
| Net income | — | — | — | — | — | — | 55,247 | — | — | 55,247 | |||||||||||||||||
| Other net comprehensive (loss) | — | — | — | — | — | — | — | (5,605 | ) | — | (5,605 | ) | |||||||||||||||
| Total comprehensive income | — | — | — | — | — | — | 55,247 | (5,605 | ) | — | 49,642 | ||||||||||||||||
| Acquisition of Commerce Bank | 522 | 40,633 | 4,842 | 48 | 188,552 | — | — | — | — | 229,233 | |||||||||||||||||
| Common stock issued, net of $7.1 million offering costs | — | — | 4,638 | 46 | 152,938 | — | — | — | — | 152,984 | |||||||||||||||||
| Cash dividends declared on common shares ($0.84 per share) | — | — | — | — | — | — | (33,022 | ) | — | — | (33,022 | ) | |||||||||||||||
| Cash dividends declared on preferred shares ($0.42 per share) | — | — | — | — | — | — | (219 | ) | — | — | (219 | ) | |||||||||||||||
| Forfeited shares | — | — | (17 | ) | — | 102 | 516 | — | — | (618 | ) | — | |||||||||||||||
| Exercise of stock options | — | — | 19 | — | — | — | (158 | ) | — | 487 | 329 | ||||||||||||||||
| Restricted stock grants | — | — | 161 | — | 1,650 | (5,775 | ) | — | — | 4,125 | — | ||||||||||||||||
| Stock-based compensation | — | — | — | — | — | 5,102 | — | — | — | 5,102 | |||||||||||||||||
| Other, net | — | — | (26 | ) | — | 256 | — | (163 | ) | — | (1,176 | ) | (1,083 | ) | |||||||||||||
| Balance at December 31, 2017 | 522 | 40,633 | 45,290 | $ | 460 | $ | 1,242,487 | $ | (6,531 | ) | $ | 239,179 | $ | 4,161 | $ | (24,125 | ) | $ | 1,496,264 | ||||||||
| Common Stock | Additional paid-in | Unearned | Retained (deficit) | Accumulated other comprehensive | Treasury | |||||||||||||||||||||||||||
| (In thousands, except per share data) | Shares | Amount | capital | compensation | earnings | (loss) income | stock | Total | ||||||||||||||||||||||||
| Balance at January 1, 2021 | 50,833 | $ | 528 | $ | 1,427,239 | $ | (6,245) | $ | (233,344) | $ | 30,871 | $ | (31,276) | $ | 1,187,773 | |||||||||||||||||
| Comprehensive income: | ||||||||||||||||||||||||||||||||
| Net income | — | — | — | — | 118,664 | — | — | 118,664 | ||||||||||||||||||||||||
| Other net comprehensive (loss) | — | — | — | — | — | (34,114) | — | (34,114) | ||||||||||||||||||||||||
| Total comprehensive income | — | — | — | — | (118,664) | (34,114) | — | 84,550 | ||||||||||||||||||||||||
| Cash dividends declared on common shares ($0.48 per share) | — | — | — | — | (24,553) | — | — | (24,553) | ||||||||||||||||||||||||
| Treasury stock purchased | (2,500) | — | — | — | — | — | (68,712) | (68,712) | ||||||||||||||||||||||||
| Forfeited shares | (113) | — | 90 | 2,644 | — | — | (2,734) | — | ||||||||||||||||||||||||
| Exercise of stock options | 20 | — | — | — | (150) | — | 567 | 417 | ||||||||||||||||||||||||
| Restricted stock grants | 476 | — | (3,898) | (9,625) | — | — | 13,523 | — | ||||||||||||||||||||||||
| Stock-based compensation | — | — | — | 4,170 | — | — | — | 4,170 | ||||||||||||||||||||||||
| Other, net | (49) | — | 14 | — | — | — | (1,224) | (1,210) | ||||||||||||||||||||||||
| Balance at December 31, 2021 | 48,667 | $ | 528 | $ | 1,423,445 | $ | (9,056) | $ | (139,383) | $ | (3,243) | $ | (89,856) | $ | 1,182,435 | |||||||||||||||||
| Comprehensive (loss): | ||||||||||||||||||||||||||||||||
| Net income | — | — | — | — | 92,533 | — | — | 92,533 | ||||||||||||||||||||||||
| Other net comprehensive (loss) | — | — | — | — | — | (177,809) | — | (177,809) | ||||||||||||||||||||||||
| Total comprehensive (loss) | — | — | — | — | 92,533 | (177,809) | — | (85,276) | ||||||||||||||||||||||||
| Cash dividends declared on common shares ($0.54 per share) | — | — | — | — | (24,527) | — | — | (24,527) | ||||||||||||||||||||||||
| Treasury stock purchased | (4,485) | — | — | — | — | — | (124,519) | (124,519) | ||||||||||||||||||||||||
| Forfeited shares | (98) | — | 189 | 2,560 | — | — | (2,749) | — | ||||||||||||||||||||||||
| Exercise of stock options | 12 | — | — | — | (51) | — | 321 | 270 | ||||||||||||||||||||||||
| Restricted stock grants | 328 | — | 537 | (9,440) | — | — | 8,903 | — | ||||||||||||||||||||||||
| Stock-based compensation | — | — | — | 7,338 | — | — | — | 7,338 | ||||||||||||||||||||||||
| Other, net | (63) | — | 12 | — | — | — | (1,671) | (1,659) | ||||||||||||||||||||||||
| Balance at December 31, 2022 | 44,361 | $ | 528 | $ | 1,424,183 | $ | (8,598) | $ | (71,428) | $ | (181,052) | $ | (209,571) | $ | 954,062 | |||||||||||||||||
| Comprehensive income: | ||||||||||||||||||||||||||||||||
| Net income | — | — | — | — | 69,598 | — | — | 69,598 | ||||||||||||||||||||||||
| Other net comprehensive income | — | — | — | — | — | 38,036 | — | 38,036 | ||||||||||||||||||||||||
| Total comprehensive income | — | — | — | — | 69,598 | 38,036 | — | 107,634 | ||||||||||||||||||||||||
| Impact of ASU No. 2022-02 Adoption | — | — | — | — | 401 | — | — | 401 | ||||||||||||||||||||||||
| Cash dividends declared common shares ($0.72 per share) | — | — | — | — | (31,707) | — | — | (31,707) | ||||||||||||||||||||||||
| Treasury stock purchased | (1,135) | — | — | — | — | — | (23,844) | (23,844) | ||||||||||||||||||||||||
| Forfeited shares | (103) | — | (184) | 2,657 | — | — | (2,473) | — | ||||||||||||||||||||||||
| Exercise of stock options | — | — | — | — | — | — | — | — | ||||||||||||||||||||||||
| Restricted stock grants | 446 | — | (568) | (11,666) | — | — | 12,234 | — | ||||||||||||||||||||||||
| Stock-based compensation | — | — | — | 7,498 | — | — | — | 7,498 | ||||||||||||||||||||||||
| Other, net | (68) | — | (158) | — | — | — | (1,665) | (1,823) | ||||||||||||||||||||||||
| Balance at December 31, 2023 | 43,501 | $ | 528 | $ | 1,423,273 | $ | (10,109) | $ | (33,136) | $ | (143,016) | $ | (225,319) | $ | 1,012,221 | |||||||||||||||||
| Years Ended December 31, | ||||||||||||||||||||
| (In thousands) | 2023 | 2022 | 2021 | |||||||||||||||||
| Cash flows from operating activities: | ||||||||||||||||||||
| Net income | $ | 69,598 | $ | 92,533 | $ | 118,664 | ||||||||||||||
| Adjustments to reconcile net income to net cash provided by operating activities: | ||||||||||||||||||||
| Provision expense/(benefit) for credit losses | 31,999 | 11,000 | (500) | |||||||||||||||||
| Net amortization of securities | 1,451 | 2,886 | 1,939 | |||||||||||||||||
| Change in unamortized net loan origination costs and premiums | 764 | 3,312 | (1,918) | |||||||||||||||||
| Premises and equipment depreciation and amortization expense | 8,445 | 9,576 | 11,035 | |||||||||||||||||
| Stock-based compensation expense | 7,498 | 7,338 | 4,170 | |||||||||||||||||
| Accretion of purchase accounting entries, net | (716) | (1,637) | (6,577) | |||||||||||||||||
| Amortization of other intangibles | 4,820 | 5,134 | 5,200 | |||||||||||||||||
| Income from cash surrender value of bank-owned life insurance policies | (5,392) | (5,540) | (5,561) | |||||||||||||||||
| Securities losses/(gains), net | 24,544 | 2,031 | 787 | |||||||||||||||||
| (Gain) on SBA loan sales | (10,334) | (12,494) | (20,689) | |||||||||||||||||
| Net change in loans held-for-sale | 2,074 | 5,168 | 5,775 | |||||||||||||||||
| Loss on disposition of assets | — | — | 2,811 | |||||||||||||||||
| Loss on sale of real estate | — | — | 6 | |||||||||||||||||
| Amortization of interest in tax-advantaged projects | 8,018 | 3,508 | 3,444 | |||||||||||||||||
| Gain on sale of business operations and other assets | — | — | (52,942) | |||||||||||||||||
| Prepayment penalties on repayment of Federal Home Loan Bank advances | — | — | 862 | |||||||||||||||||
| Net change in other | 14,387 | (12,076) | 18,282 | |||||||||||||||||
| Net cash provided by operating activities | $ | 157,156 | $ | 110,739 | $ | 84,788 | ||||||||||||||
| Cash flows from investing activities: | ||||||||||||||||||||
| Net decrease in trading security | 860 | 818 | 776 | |||||||||||||||||
| Proceeds from sales of marketable equity securities | — | — | 2,880 | |||||||||||||||||
| Purchases of securities available for sale | (44,586) | (478,940) | (804,616) | |||||||||||||||||
| Proceeds from sales of securities available for sale | 267,199 | 149,994 | — | |||||||||||||||||
| Proceeds from maturities, calls, and prepayments of securities available for sale | 201,624 | 548,423 | 575,538 | |||||||||||||||||
| Purchases of securities held to maturity | (700) | (807) | (219,470) | |||||||||||||||||
| Proceeds from maturities, calls, and prepayments of securities held to maturity | 39,193 | 51,961 | 46,061 | |||||||||||||||||
| Net change in loans | (716,591) | (1,546,518) | 1,283,210 | |||||||||||||||||
| Net change in Mid-Atlantic region loans held for sale | — | — | 50,914 | |||||||||||||||||
| Proceeds from surrender of bank-owned life insurance | 2,002 | 2,311 | 2,566 | |||||||||||||||||
| Purchase of Federal Home Loan Bank stock | (494,159) | (124,331) | — | |||||||||||||||||
| Proceeds from sales of Federal Home Loan Bank stock | 478,689 | 127,912 | 24,078 | |||||||||||||||||
| Net investment in limited partnership tax credits | (16,172) | (14,537) | (2,878) | |||||||||||||||||
| Purchase of premises and equipment, net | (1,820) | (1,495) | (1,606) | |||||||||||||||||
| Proceeds from sales of seasoned commercial loan portfolios | — | 24,323 | 16,417 | |||||||||||||||||
| Proceeds from sales of other real estate owned | — | — | 187 | |||||||||||||||||
| Cash outflows from sale of business operations and other assets | — | — | (352,814) | |||||||||||||||||
| Net cash (used)/provided by investing activities | $ | (284,461) | $ | (1,260,886) | $ | 621,243 | ||||||||||||||
| (Continued) | ||||||||||||||||||||
| Years Ended December 31, | ||||||||||||
| (In thousands) | 2017 | 2016 | 2015 | |||||||||
| Cash flows from operating activities: | ||||||||||||
| Net income | $ | 55,247 | $ | 58,670 | $ | 49,518 | ||||||
| Adjustments to reconcile net income to net cash provided by operating activities: | ||||||||||||
| Provision for loan losses | 21,025 | 17,362 | 16,726 | |||||||||
| Net amortization of securities | 1,678 | 4,052 | 3,010 | |||||||||
| Net change in unamortized loan origination costs and premium | 2,232 | (4,138 | ) | (961 | ) | |||||||
| Premises and equipment depreciation and amortization expense | 9,916 | 8,393 | 8,594 | |||||||||
| Stock-based compensation expense | 5,102 | 4,621 | 4,686 | |||||||||
| Accretion of purchase accounting entries, net | (18,189 | ) | (9,407 | ) | (10,074 | ) | ||||||
| Amortization of other intangibles | 3,493 | 2,927 | 3,563 | |||||||||
| Write down of other real estate owned | 10 | 395 | 480 | |||||||||
| Excess tax loss from stock-based payment arrangements | — | (105 | ) | (167 | ) | |||||||
| Income from cash surrender value of bank-owned life insurance policies | (3,615 | ) | (3,913 | ) | (3,356 | ) | ||||||
| (Loss) gain on sales of securities, net | (12,598 | ) | 551 | (2,110 | ) | |||||||
| Net (increase) decrease in loans held for sale | (32,947 | ) | 5,185 | (3,212 | ) | |||||||
| Loss on disposition of assets | 912 | 1,318 | 3,514 | |||||||||
| (Gain) loss on sale of real estate | (51 | ) | 40 | 191 | ||||||||
| Amortization of tax credits | 8,477 | 8,882 | 11,428 | |||||||||
| Remeasurement of deferred tax asset | 18,145 | — | — | |||||||||
| Net change in other | 19,254 | 3,309 | 4,458 | |||||||||
| Net cash provided by operating activities | 78,091 | 98,142 | 86,288 | |||||||||
| Cash flows from investing activities: | ||||||||||||
| Net decrease in trading security | 632 | 599 | 570 | |||||||||
| Proceeds from sales of securities available for sale | 188,921 | 421,843 | 41,169 | |||||||||
| Proceeds from maturities, calls and prepayments of securities available for sale | 206,648 | 166,736 | 184,753 | |||||||||
| Purchases of securities available for sale | (498,646 | ) | (400,053 | ) | (285,637 | ) | ||||||
| Proceeds from maturities, calls and prepayments of securities held to maturity | 12,600 | 7,734 | 8,534 | |||||||||
| Purchases of securities held to maturity | (77,208 | ) | (7,115 | ) | (62,274 | ) | ||||||
| Net change in loans | (468,331 | ) | (334,347 | ) | (388,091 | ) | ||||||
| Acquisitions, net of cash paid | 374,611 | (48,180 | ) | 74,324 | ||||||||
| Net cash used for branch sale | — | — | (11,715 | ) | ||||||||
| Proceeds from surrender of bank-owned life insurance | 310 | 258 | 554 | |||||||||
| Purchase of bank-owned life insurance | (20,000 | ) | — | — | ||||||||
| Proceeds from sale of Federal Home Loan Bank stock | 96,378 | 19,461 | 2,357 | |||||||||
| Purchase of Federal Home Loan Bank stock | (88,351 | ) | (19,555 | ) | (10,706 | ) | ||||||
| Proceeds from premises and equipment | — | 226 | 2,261 | |||||||||
| Purchase of premises and equipment, net | (12,528 | ) | (9,101 | ) | (7,340 | ) | ||||||
| Net investment in limited partnership tax credits | (5,102 | ) | (7,616 | ) | (5,105 | ) | ||||||
| Payment to terminate cash flow hedges | 6,573 | — | — | |||||||||
| Proceeds from sale of other real estate | 590 | 1,515 | 1,854 | |||||||||
| Net cash used in investing activities | (282,903 | ) | (207,595 | ) | (454,492 | ) | ||||||
| Years ended December 31, | Years Ended December 31, | ||||||||||||||||||||||||||||||||||||||||
| (In thousands) | 2017 | 2016 | 2015 | (In thousands) | 2023 | 2022 | 2021 | ||||||||||||||||||||||||||||||||||
| Cash flows from financing activities: | Cash flows from financing activities: | ||||||||||||||||||||||||||||||||||||||||
| Net increase in deposits | $ | 418,550 | $ | 140,730 | $ | 475,823 | |||||||||||||||||||||||||||||||||||
| Net change in Mid-Atlantic region deposits held for sale | |||||||||||||||||||||||||||||||||||||||||
| Proceeds from Federal Home Loan Bank advances and other borrowings | 5,978,358 | 9,364,599 | 8,566,300 | ||||||||||||||||||||||||||||||||||||||
| Repayments of Federal Home Loan Bank advances and other borrowings | (6,174,781 | ) | (9,365,159 | ) | (8,620,064 | ) | |||||||||||||||||||||||||||||||||||
| Issuance of common stock, net of $7.1 million offering costs | 152,985 | — | — | ||||||||||||||||||||||||||||||||||||||
| Proceeds from issuance of subordinated debt | |||||||||||||||||||||||||||||||||||||||||
| Proceeds from issuance of subordinated debt | |||||||||||||||||||||||||||||||||||||||||
| Proceeds from issuance of subordinated debt | |||||||||||||||||||||||||||||||||||||||||
| Repayment from calling of subordinated debt | |||||||||||||||||||||||||||||||||||||||||
| Purchase of treasury stock | — | — | (550 | ) | |||||||||||||||||||||||||||||||||||||
| Exercise of stock options | 329 | 3,712 | 239 | ||||||||||||||||||||||||||||||||||||||
| Excess tax loss from stock-based payment arrangements | — | — | 167 | ||||||||||||||||||||||||||||||||||||||
| Cash dividends paid | (33,241 | ) | (24,916 | ) | (21,903 | ) | |||||||||||||||||||||||||||||||||||
| Acquisition contingent consideration paid | (1,700 | ) | — | — | |||||||||||||||||||||||||||||||||||||
| Net cash provided by financing activities | 340,500 | 118,966 | 400,012 | ||||||||||||||||||||||||||||||||||||||
| Common and preferred stock cash dividends paid | |||||||||||||||||||||||||||||||||||||||||
| Settlement of derivative contracts with financial institution counterparties | |||||||||||||||||||||||||||||||||||||||||
| Net cash provided/(used) by financing activities | |||||||||||||||||||||||||||||||||||||||||
| Net cash provided/(used) by financing activities | |||||||||||||||||||||||||||||||||||||||||
| Net cash provided/(used) by financing activities | |||||||||||||||||||||||||||||||||||||||||
| Net change in cash and cash equivalents | |||||||||||||||||||||||||||||||||||||||||
| Net change in cash and cash equivalents | |||||||||||||||||||||||||||||||||||||||||
| Net change in cash and cash equivalents | 135,688 | 9,513 | 31,808 | ||||||||||||||||||||||||||||||||||||||
| Cash and cash equivalents at beginning of year | 113,075 | 103,562 | 71,754 | ||||||||||||||||||||||||||||||||||||||
| Cash and cash equivalents at beginning of year | |||||||||||||||||||||||||||||||||||||||||
| Cash and cash equivalents at beginning of year | |||||||||||||||||||||||||||||||||||||||||
| Cash and cash equivalents at end of year | $ | 248,763 | $ | 113,075 | $ | 103,562 | |||||||||||||||||||||||||||||||||||
| Cash and cash equivalents at end of year | |||||||||||||||||||||||||||||||||||||||||
| Cash and cash equivalents at end of year | |||||||||||||||||||||||||||||||||||||||||
| Supplemental cash flow information: | |||||||||||||||||||||||||||||||||||||||||
| Supplemental cash flow information: | |||||||||||||||||||||||||||||||||||||||||
| Supplemental cash flow information: | |||||||||||||||||||||||||||||||||||||||||
| Interest paid on deposits | $ | 43,133 | $ | 28,777 | $ | 22,130 | |||||||||||||||||||||||||||||||||||
| Interest paid on borrowed funds | 21,336 | 16,674 | 9,974 | ||||||||||||||||||||||||||||||||||||||
| Income taxes paid, net | 18,323 | 16,229 | 429 | ||||||||||||||||||||||||||||||||||||||
| Acquisition of non-cash assets and liabilities: | |||||||||||||||||||||||||||||||||||||||||
| Assets acquired | 1,584,786 | 1,169,086 | 948,796 | ||||||||||||||||||||||||||||||||||||||
| Liabilities assumed | (1,959,489 | ) | (965,529 | ) | (762,261 | ) | |||||||||||||||||||||||||||||||||||
| Other non-cash changes: | |||||||||||||||||||||||||||||||||||||||||
| Other net comprehensive (loss) income | (5,605 | ) | 13,071 | (9,884 | ) | ||||||||||||||||||||||||||||||||||||
| Real estate owned acquired in settlement of loans | 490 | 340 | 2,085 | ||||||||||||||||||||||||||||||||||||||
| Other non-cash changes: | |||||||||||||||||||||||||||||||||||||||||
| Other non-cash changes: | |||||||||||||||||||||||||||||||||||||||||
| Other net comprehensive income/(loss) | |||||||||||||||||||||||||||||||||||||||||
| Impact to retained earnings from adoption of ASU 2022-02 | |||||||||||||||||||||||||||||||||||||||||
| Premises and equipment reclassified to held-for-sale | |||||||||||||||||||||||||||||||||||||||||
| Premises and equipment reclassified to held-for-sale | |||||||||||||||||||||||||||||||||||||||||
| Premises and equipment reclassified to held-for-sale | |||||||||||||||||||||||||||||||||||||||||
| Mid-Atlantic loans held-for-sale reclassified to portfolio loans, net | |||||||||||||||||||||||||||||||||||||||||
| Mid-Atlantic deposits held-for-sale reclassified to deposits, net | |||||||||||||||||||||||||||||||||||||||||
| Seasoned loan portfolios reclassified to held-for-sale, net | |||||||||||||||||||||||||||||||||||||||||
| Held-for-sale loans reclassified to held-for-investment, net | |||||||||||||||||||||||||||||||||||||||||
| Premium payable on cash flow hedges | |||||||||||||||||||||||||||||||||||||||||
| Premium payable on cash flow hedges | |||||||||||||||||||||||||||||||||||||||||
| Premium payable on cash flow hedges | |||||||||||||||||||||||||||||||||||||||||
| Fair Value | As Recorded by | |||||||||||||
| (in thousands) | As Acquired | Adjustments | the Company | |||||||||||
| Consideration Paid: | ||||||||||||||
| Company common stock issued to Commerce common shareholders | $ | 188,599 | ||||||||||||
| Company preferred stock issued to certain Commerce shareholders | 40,633 | |||||||||||||
| Cash in lieu paid to Commerce shareholders | 1 | |||||||||||||
| Total consideration paid | $ | 229,233 | ||||||||||||
| Recognized amounts of identifiable assets acquired and (liabilities) assumed, at fair value: | ||||||||||||||
| Cash and short-term investments | $ | 374,611 | $ | — | $ | 374,611 | ||||||||
| Investment securities | 115,274 | (1,427 | ) | (a) | 113,847 | |||||||||
| Loans, net | 1,327,256 | (86,505 | ) | (b) | 1,240,751 | |||||||||
| Premises and equipment | 8,931 | 5,346 | (c) | 14,277 | ||||||||||
| Core deposit intangibles | — | 22,400 | (d) | 22,400 | ||||||||||
| Deferred tax assets, net | 7,956 | 26,580 | (e) | 34,536 | ||||||||||
| Goodwill and other intangibles | 11,233 | (11,233 | ) | (f) | — | |||||||||
| Other assets | 52,709 | (3,664 | ) | (g) | 49,045 | |||||||||
| Deposits | (1,710,872 | ) | (1,180 | ) | (h) | (1,712,052 | ) | |||||||
| Borrowings | (19,542 | ) | — | (19,542 | ) | |||||||||
| Other liabilities | (5,086 | ) | 265 | (4,821 | ) | |||||||||
| Total identifiable net assets | $ | 162,470 | $ | (49,418 | ) | $ | 113,052 | |||||||
| Goodwill | $ | 116,181 | ||||||||||||
| ASC 310-30 Loans | |||
| Gross contractual receivable amounts at acquisition | $ | 163,125 | |
| Contractual cash flows not expected to be collected (nonaccretable discount) | (81,205 | ) | |
| Expected cash flows at acquisition | 81,920 | ||
| Interest component of expected cash flows (accretable discount) | (10,815 | ) | |
| Fair value of acquired loans | $ | 71,105 | |
| Pro Forma (unaudited) Years ended December 31, | ||||||||
| 2017 | 2016 | |||||||
| Net interest income | $ | 344,797 | $ | 302,012 | ||||
| Non-interest income | 134,818 | 77,192 | ||||||
| Income available to common shareholders | 77,340 | 78,859 | ||||||
| (In thousands) | Amortized Cost | Gross Unrealized Gains | Gross Unrealized Losses | Fair Value | Allowance | |||||||||||||||||||||||||||
| December 31, 2023 | ||||||||||||||||||||||||||||||||
| Securities available for sale | ||||||||||||||||||||||||||||||||
| Debt securities: | ||||||||||||||||||||||||||||||||
| U.S Treasuries | $ | 7,980 | $ | 1 | $ | — | $ | 7,981 | $ | — | ||||||||||||||||||||||
| Municipal bonds and obligations | 64,788 | 494 | (1,429) | 63,853 | — | |||||||||||||||||||||||||||
| Agency collateralized mortgage obligations | 426,986 | — | (79,112) | 347,874 | — | |||||||||||||||||||||||||||
| Agency mortgage-backed securities | 492,633 | 2 | (75,155) | 417,480 | — | |||||||||||||||||||||||||||
| Agency commercial mortgage-backed securities | 174,879 | — | (29,553) | 145,326 | — | |||||||||||||||||||||||||||
| Corporate bonds | 43,291 | 34 | (4,210) | 39,115 | — | |||||||||||||||||||||||||||
| Other bonds and obligations | 655 | 67 | (66) | 656 | — | |||||||||||||||||||||||||||
| Total securities available for sale | 1,211,212 | 598 | (189,525) | 1,022,285 | — | |||||||||||||||||||||||||||
| Securities held to maturity | ||||||||||||||||||||||||||||||||
| Municipal bonds and obligations | 251,046 | 698 | (16,987) | 234,757 | 48 | |||||||||||||||||||||||||||
| Agency collateralized mortgage obligations | 112,929 | — | (18,360) | 94,569 | — | |||||||||||||||||||||||||||
| Agency mortgage-backed securities | 47,379 | — | (8,052) | 39,327 | — | |||||||||||||||||||||||||||
| Agency commercial mortgage-backed securities | 130,169 | — | (24,368) | 105,801 | — | |||||||||||||||||||||||||||
| Tax advantaged economic development bonds | 1,540 | 6 | (60) | 1,486 | 20 | |||||||||||||||||||||||||||
| Other bonds and obligations | 288 | — | — | 288 | — | |||||||||||||||||||||||||||
| Total securities held to maturity | 543,351 | 704 | (67,827) | 476,228 | 68 | |||||||||||||||||||||||||||
| Marketable equity securities | 15,035 | — | (2,006) | 13,029 | — | |||||||||||||||||||||||||||
| Total | $ | 1,769,598 | $ | 1,302 | $ | (259,358) | $ | 1,511,542 | $ | 68 | ||||||||||||||||||||||
| December 31, 2022 | ||||||||||||||||||||||||||||||||
| Securities available for sale | ||||||||||||||||||||||||||||||||
| Debt securities: | ||||||||||||||||||||||||||||||||
| U.S Treasuries | $ | 11,972 | $ | 1 | $ | — | $ | 11,973 | $ | — | ||||||||||||||||||||||
| Municipal bonds and obligations | 65,943 | 422 | (3,030) | 63,335 | — | |||||||||||||||||||||||||||
| Agency collateralized mortgage obligations | 631,732 | — | (99,787) | 531,945 | — | |||||||||||||||||||||||||||
| Agency mortgage-backed securities | 643,308 | 1 | (96,996) | 546,313 | — | |||||||||||||||||||||||||||
| Agency commercial mortgage-backed securities | 264,218 | — | (35,750) | 228,468 | — | |||||||||||||||||||||||||||
| Corporate bonds | 43,368 | 80 | (2,938) | 40,510 | — | |||||||||||||||||||||||||||
| Other bonds and obligations | 655 | 67 | (66) | 656 | — | |||||||||||||||||||||||||||
| Total securities available for sale | 1,661,196 | 571 | (238,567) | 1,423,200 | — | |||||||||||||||||||||||||||
| Securities held to maturity | ||||||||||||||||||||||||||||||||
| Municipal bonds and obligations | 266,793 | 691 | (23,704) | 243,780 | 66 | |||||||||||||||||||||||||||
| Agency collateralized mortgage-backed securities | 128,136 | — | (20,420) | 107,716 | — | |||||||||||||||||||||||||||
| Agency mortgage-backed securities | 50,958 | — | (9,240) | 41,718 | — | |||||||||||||||||||||||||||
| Agency commercial mortgage-backed securities | 135,206 | — | (23,203) | 112,003 | — | |||||||||||||||||||||||||||
| Tax advantaged economic development bonds | 2,069 | 8 | (121) | 1,956 | 25 | |||||||||||||||||||||||||||
| Other bonds and obligations | 291 | — | — | 291 | — | |||||||||||||||||||||||||||
| Total securities held to maturity | 583,453 | 699 | (76,688) | 507,464 | 91 | |||||||||||||||||||||||||||
| Marketable equity securities | 15,035 | — | (2,179) | 12,856 | — | |||||||||||||||||||||||||||
| Total | $ | 2,259,684 | $ | 1,270 | $ | (317,434) | $ | 1,943,520 | $ | 91 | ||||||||||||||||||||||
| (In thousands) | Amortized Cost | Gross Unrealized Gains | Gross Unrealized Losses | Fair Value | ||||||||||||
| December 31, 2017 | ||||||||||||||||
| Securities available for sale | ||||||||||||||||
| Debt securities: | ||||||||||||||||
| Municipal bonds and obligations | $ | 113,427 | $ | 5,012 | $ | (206 | ) | $ | 118,233 | |||||||
| Agency collateralized mortgage obligations | 859,705 | 397 | (8,944 | ) | 851,158 | |||||||||||
| Agency mortgage-backed securities | 218,926 | 279 | (2,265 | ) | 216,940 | |||||||||||
| Agency commercial mortgage-backed securities | 64,025 | 41 | (1,761 | ) | 62,305 | |||||||||||
| Corporate bonds | 110,076 | 882 | (237 | ) | 110,721 | |||||||||||
| Trust preferred securities | 11,334 | 343 | — | 11,677 | ||||||||||||
| Other bonds and obligations | 9,757 | 154 | (31 | ) | 9,880 | |||||||||||
| Total debt securities | 1,387,250 | 7,108 | (13,444 | ) | 1,380,914 | |||||||||||
| Marketable equity securities | 36,483 | 9,211 | (509 | ) | 45,185 | |||||||||||
| Total securities available for sale | 1,423,733 | 16,319 | (13,953 | ) | 1,426,099 | |||||||||||
| Securities held to maturity | ||||||||||||||||
| Municipal bonds and obligations | 270,310 | 8,675 | (90 | ) | 278,895 | |||||||||||
| Agency collateralized mortgage obligations | 73,742 | 1,045 | (486 | ) | 74,301 | |||||||||||
| Agency mortgage-backed securities | 7,892 | — | (164 | ) | 7,728 | |||||||||||
| Agency commercial mortgage-backed securities | 10,481 | — | (268 | ) | 10,213 | |||||||||||
| Tax advantaged economic development bonds | 34,357 | 596 | (1,135 | ) | 33,818 | |||||||||||
| Other bonds and obligations | 321 | — | — | 321 | ||||||||||||
| Total securities held to maturity | 397,103 | 10,316 | (2,143 | ) | 405,276 | |||||||||||
| Total | $ | 1,820,836 | $ | 26,635 | $ | (16,096 | ) | $ | 1,831,375 | |||||||
| December 31, 2016 | ||||||||||||||||
| Securities available for sale | ||||||||||||||||
| Debt securities: | ||||||||||||||||
| Municipal bonds and obligations | $ | 117,910 | $ | 2,955 | $ | (1,049 | ) | $ | 119,816 | |||||||
| Agency collateralized mortgage obligations | 652,680 | 2,522 | (3,291 | ) | 651,911 | |||||||||||
| Agency mortgage-backed securities | 230,308 | 557 | (2,181 | ) | 228,684 | |||||||||||
| Agency commercial mortgage-backed securities | 65,673 | 229 | (1,368 | ) | 64,534 | |||||||||||
| Corporate bonds | 56,320 | 408 | (722 | ) | 56,006 | |||||||||||
| Trust preferred securities | 11,578 | 368 | (59 | ) | 11,887 | |||||||||||
| Other bonds and obligations | 10,979 | 195 | (16 | ) | 11,158 | |||||||||||
| Total debt securities | 1,145,448 | 7,234 | (8,686 | ) | 1,143,996 | |||||||||||
| Marketable equity securities | 47,858 | 19,296 | (1,613 | ) | 65,541 | |||||||||||
| Total securities available for sale | 1,193,306 | 26,530 | (10,299 | ) | 1,209,537 | |||||||||||
| Securities held to maturity | ||||||||||||||||
| Municipal bonds and obligations | 203,463 | 3,939 | (2,416 | ) | 204,986 | |||||||||||
| Agency collateralized mortgage-backed securities | 75,655 | 1,281 | (411 | ) | 76,525 | |||||||||||
| Agency mortgage-backed securities | 9,102 | — | (243 | ) | 8,859 | |||||||||||
| Agency commercial mortgage-backed securities | 10,545 | — | (434 | ) | 10,111 | |||||||||||
| Tax advantaged economic development bonds | 35,278 | 1,596 | — | 36,874 | ||||||||||||
| Other bonds and obligations | 325 | — | — | 325 | ||||||||||||
| Total securities held to maturity | 334,368 | 6,816 | (3,504 | ) | 337,680 | |||||||||||
| Total | $ | 1,527,674 | $ | 33,346 | $ | (13,803 | ) | $ | 1,547,217 | |||||||
| (In thousands) | Municipal bonds and obligations | Tax advantaged economic development bonds | Total | ||||||||||||||
| Balance at December 31, 2022 | $ | 66 | $ | 25 | $ | 91 | |||||||||||
| Provision (benefit) for credit losses | (18) | (5) | (23) | ||||||||||||||
| Balance at December 31, 2023 | $ | 48 | $ | 20 | $ | 68 | |||||||||||
| (In thousands) | Municipal bonds and obligations | Tax advantaged economic development bonds | Total | ||||||||||||||
| Balance at December 31, 2021 | $ | 70 | $ | 35 | $ | 105 | |||||||||||
| Provision (benefit) for credit losses | (4) | (10) | (14) | ||||||||||||||
| Balance at December 31, 2022 | $ | 66 | $ | 25 | $ | 91 | |||||||||||
| (In thousands) | Municipal bonds and obligations | Tax advantaged economic development bonds | Total | ||||||||||||||
| Balance at December 31, 2020 | $ | 64 | $ | 40 | $ | 104 | |||||||||||
| Provision expense/(benefit) for credit losses | 6 | (5) | 1 | ||||||||||||||
| Balance at December 31, 2021 | $ | 70 | $ | 35 | $ | 105 | |||||||||||
| Available for sale | Held to maturity | Available for sale | Held to maturity | |||||||||||||||||||||||||||||||||||||||||||||||||||
| (In thousands) | Amortized Cost | Fair Value | Amortized Cost | Fair Value | (In thousands) | Amortized Cost | Fair Value | Amortized Cost | Fair Value | |||||||||||||||||||||||||||||||||||||||||||||
| Within 1 year | $ | 622 | $ | 623 | $ | 1,261 | $ | 1,261 | ||||||||||||||||||||||||||||||||||||||||||||||
| Over 1 year to 5 years | 32,659 | 32,972 | 25,892 | 26,422 | ||||||||||||||||||||||||||||||||||||||||||||||||||
| Over 5 years to 10 years | 75,261 | 76,745 | 8,752 | 8,917 | ||||||||||||||||||||||||||||||||||||||||||||||||||
| Over 10 years | 136,052 | 140,171 | 269,083 | 276,434 | ||||||||||||||||||||||||||||||||||||||||||||||||||
| Total bonds and obligations | 244,594 | 250,511 | 304,988 | 313,034 | ||||||||||||||||||||||||||||||||||||||||||||||||||
| Marketable equity securities | 36,483 | 45,185 | — | — | ||||||||||||||||||||||||||||||||||||||||||||||||||
| Mortgage-backed securities | 1,142,656 | 1,130,403 | 92,115 | 92,242 | ||||||||||||||||||||||||||||||||||||||||||||||||||
| Total | $ | 1,423,733 | $ | 1,426,099 | $ | 397,103 | $ | 405,276 | ||||||||||||||||||||||||||||||||||||||||||||||
| 2017 | 2016 | 2023 | 2022 | |||||||||||||||||||||||||||||||||||||||||||||||||||
| (In thousands) | Amortized Cost | Fair Value | Amortized Cost | Fair Value | (In thousands) | Amortized Cost | Fair Value | Amortized Cost | Fair Value | |||||||||||||||||||||||||||||||||||||||||||||
| Securities pledged to swap counterparties | $ | 24,410 | $ | 24,240 | $ | 51,292 | $ | 51,290 | ||||||||||||||||||||||||||||||||||||||||||||||
| Securities pledged for municipal deposits | 210,382 | 214,513 | 147,950 | 148,435 | ||||||||||||||||||||||||||||||||||||||||||||||||||
| Total | $ | 234,792 | $ | 238,753 | $ | 199,242 | $ | 199,725 | ||||||||||||||||||||||||||||||||||||||||||||||
| Total | ||||||||||||||||||||||||||||||||||||||||||||||||||||||
| Total | ||||||||||||||||||||||||||||||||||||||||||||||||||||||
| (In thousands) | 2017 | 2016 | 2015 | |||||||||
| Gross realized gains | $ | 13,877 | $ | 2,762 | $ | 4,567 | ||||||
| Gross realized losses | (1,279 | ) | (3,313 | ) | (2,457 | ) | ||||||
| Net realized gains/(losses) | $ | 12,598 | $ | (551 | ) | $ | 2,110 | |||||
| (In thousands) | 2023 | 2022 | 2021 | |||||||||||||||||
| Gross recognized gains | $ | 1,199 | $ | 72 | $ | 108 | ||||||||||||||
| Gross recognized losses | (26,083) | (2,009) | (550) | |||||||||||||||||
| Net recognized (losses) | $ | (24,884) | $ | (1,937) | $ | (442) | ||||||||||||||
| Less Than Twelve Months | Over Twelve Months | Total | ||||||||||||||||||||||||||||||||||||
| (In thousands) | Gross Unrealized Losses | Fair Value | Gross Unrealized Losses | Fair Value | Gross Unrealized Losses | Fair Value | ||||||||||||||||||||||||||||||||
| December 31, 2023 | ||||||||||||||||||||||||||||||||||||||
| Securities available for sale | ||||||||||||||||||||||||||||||||||||||
| Debt securities: | ||||||||||||||||||||||||||||||||||||||
| Municipal bonds and obligations | $ | 76 | $ | 9,326 | $ | 1,353 | $ | 22,739 | $ | 1,429 | $ | 32,065 | ||||||||||||||||||||||||||
| Agency collateralized mortgage obligations | — | — | 79,112 | 347,874 | 79,112 | 347,874 | ||||||||||||||||||||||||||||||||
| Agency mortgage-backed securities | 1 | 22 | 75,154 | 417,151 | 75,155 | 417,173 | ||||||||||||||||||||||||||||||||
| Agency commercial mortgage-back securities | — | — | 29,553 | 145,326 | 29,553 | 145,326 | ||||||||||||||||||||||||||||||||
| Corporate bonds | 457 | 6,543 | 3,753 | 31,690 | 4,210 | 38,233 | ||||||||||||||||||||||||||||||||
| Other bonds and obligations | — | — | 66 | 295 | 66 | 295 | ||||||||||||||||||||||||||||||||
| Total securities available for sale | $ | 534 | $ | 15,891 | $ | 188,991 | $ | 965,075 | $ | 189,525 | $ | 980,966 | ||||||||||||||||||||||||||
| Securities held to maturity | ||||||||||||||||||||||||||||||||||||||
| Municipal bonds and obligations | 229 | 28,895 | 16,758 | 92,063 | 16,987 | 120,958 | ||||||||||||||||||||||||||||||||
| Agency collateralized mortgage obligations | 1 | 21 | 18,359 | 94,548 | 18,360 | 94,569 | ||||||||||||||||||||||||||||||||
| Agency mortgage-backed securities | — | — | 8,052 | 39,327 | 8,052 | 39,327 | ||||||||||||||||||||||||||||||||
| Agency commercial mortgage-back securities | — | — | 24,368 | 105,801 | 24,368 | 105,801 | ||||||||||||||||||||||||||||||||
| Tax advantaged economic development bonds | — | — | 60 | 922 | 60 | 922 | ||||||||||||||||||||||||||||||||
| Total securities held to maturity | 230 | 28,916 | 67,597 | 332,661 | 67,827 | 361,577 | ||||||||||||||||||||||||||||||||
| Total | $ | 764 | $ | 44,807 | $ | 256,588 | $ | 1,297,736 | $ | 257,352 | $ | 1,342,543 | ||||||||||||||||||||||||||
| December 31, 2022 | ||||||||||||||||||||||||||||||||||||||
| Securities available for sale | ||||||||||||||||||||||||||||||||||||||
| Debt securities: | ||||||||||||||||||||||||||||||||||||||
| Municipal bonds and obligations | $ | 2,406 | $ | 36,696 | $ | 624 | $ | 2,763 | $ | 3,030 | $ | 39,459 | ||||||||||||||||||||||||||
| Agency collateralized mortgage obligations | 23,052 | 247,509 | 76,735 | 284,434 | 99,787 | 531,943 | ||||||||||||||||||||||||||||||||
| Agency mortgage-backed securities | 3,124 | 37,540 | 93,872 | 508,683 | 96,996 | 546,223 | ||||||||||||||||||||||||||||||||
| Agency commercial mortgage-backed securities | 9,885 | 96,396 | 25,865 | 132,043 | 35,750 | 228,439 | ||||||||||||||||||||||||||||||||
| Corporate bonds | 1,709 | 25,657 | 1,229 | 9,929 | 2,938 | 35,586 | ||||||||||||||||||||||||||||||||
| Other bonds and obligations | — | — | 66 | 295 | 66 | 295 | ||||||||||||||||||||||||||||||||
| Total securities available for sale | $ | 40,176 | $ | 443,798 | $ | 198,391 | $ | 938,147 | $ | 238,567 | $ | 1,381,945 | ||||||||||||||||||||||||||
| Securities held to maturity | ||||||||||||||||||||||||||||||||||||||
| Municipal bonds and obligations | 5,476 | 125,494 | 18,228 | 38,341 | 23,704 | 163,835 | ||||||||||||||||||||||||||||||||
| Agency collateralized mortgage obligations | 2,734 | 49,539 | 17,686 | 58,177 | 20,420 | 107,716 | ||||||||||||||||||||||||||||||||
| Agency mortgage-backed securities | 300 | 2,419 | 8,940 | 39,299 | 9,240 | 41,718 | ||||||||||||||||||||||||||||||||
| Agency commercial mortgage-back securities | 447 | 9,713 | 22,756 | 102,290 | 23,203 | 112,003 | ||||||||||||||||||||||||||||||||
| Tax advantaged economic development bonds | 1 | 142 | 120 | 1,008 | 121 | 1,150 | ||||||||||||||||||||||||||||||||
| Total securities held to maturity | 8,958 | 187,307 | 67,730 | 239,115 | 76,688 | 426,422 | ||||||||||||||||||||||||||||||||
| Total | $ | 49,134 | $ | 631,105 | $ | 266,121 | $ | 1,177,262 | $ | 315,255 | $ | 1,808,367 | ||||||||||||||||||||||||||
| Less Than Twelve Months | Over Twelve Months | Total | ||||||||||||||||||||||
| (In thousands) | Gross Unrealized Losses | Fair Value | Gross Unrealized Losses | Fair Value | Gross Unrealized Losses | Fair Value | ||||||||||||||||||
| December 31, 2017 | ||||||||||||||||||||||||
| Securities available for sale | ||||||||||||||||||||||||
| Debt securities: | ||||||||||||||||||||||||
| Municipal bonds and obligations | $ | — | $ | — | $ | 206 | $ | 8,985 | $ | 206 | $ | 8,985 | ||||||||||||
| Agency collateralized mortgage obligations | 6,849 | 655,479 | 2,095 | 80,401 | 8,944 | 735,880 | ||||||||||||||||||
| Agency mortgage-backed securities | 765 | 95,800 | 1,500 | 65,323 | 2,265 | 161,123 | ||||||||||||||||||
| Agency commercial mortgage-back securities | 334 | 17,379 | 1,427 | 39,268 | 1,761 | 56,647 | ||||||||||||||||||
| Corporate bonds | 1 | 328 | 236 | 15,769 | 237 | 16,097 | ||||||||||||||||||
| Trust preferred securities | — | — | — | — | — | — | ||||||||||||||||||
| Other bonds and obligations | 11 | 1,096 | 20 | 2,004 | 31 | 3,100 | ||||||||||||||||||
| Total debt securities | 7,960 | 770,082 | 5,484 | 211,750 | 13,444 | 981,832 | ||||||||||||||||||
| Marketable equity securities | 509 | 3,731 | — | — | 509 | 3,731 | ||||||||||||||||||
| Total securities available for sale | $ | 8,469 | $ | 773,813 | $ | 5,484 | $ | 211,750 | $ | 13,953 | $ | 985,563 | ||||||||||||
| Securities held to maturity | ||||||||||||||||||||||||
| Municipal bonds and obligations | 35 | 10,213 | 55 | 2,059 | 90 | 12,272 | ||||||||||||||||||
| Agency collateralized mortgage obligations | — | — | 486 | 12,946 | 486 | 12,946 | ||||||||||||||||||
| Agency mortgage-backed securities | — | — | 164 | 7,728 | 164 | 7,728 | ||||||||||||||||||
| Agency commercial mortgage-back securities | — | — | 268 | 10,213 | 268 | 10,213 | ||||||||||||||||||
| Tax advantaged economic development bonds | 1,135 | 7,305 | — | — | 1,135 | 7,305 | ||||||||||||||||||
| Total securities held to maturity | 1,170 | 17,518 | 973 | 32,946 | 2,143 | 50,464 | ||||||||||||||||||
| Total | $ | 9,639 | $ | 791,331 | $ | 6,457 | $ | 244,696 | $ | 16,096 | $ | 1,036,027 | ||||||||||||
| December 31, 2016 | ||||||||||||||||||||||||
| Securities available for sale | ||||||||||||||||||||||||
| Debt securities: | ||||||||||||||||||||||||
| Municipal bonds and obligations | $ | 1,049 | $ | 13,839 | $ | — | $ | — | $ | 1,049 | $ | 13,839 | ||||||||||||
| Agency collateralized mortgage obligations | 3,291 | 319,448 | — | — | 3,291 | 319,448 | ||||||||||||||||||
| Agency mortgage-backed securities | 2,153 | 130,766 | 28 | 2,061 | 2,181 | 132,827 | ||||||||||||||||||
| Agency commercial mortgage-backed securities | 1,368 | 44,860 | — | — | 1,368 | 44,860 | ||||||||||||||||||
| Corporate bonds | 11 | 4,780 | 711 | 19,655 | 722 | 24,435 | ||||||||||||||||||
| Trust preferred securities | — | — | 59 | 1,204 | 59 | 1,204 | ||||||||||||||||||
| Other bonds and obligations | 15 | 3,014 | 1 | 27 | 16 | 3,041 | ||||||||||||||||||
| Total debt securities | 7,887 | 516,707 | 799 | 22,947 | 8,686 | 539,654 | ||||||||||||||||||
| Marketable equity securities | 157 | 6,600 | 1,456 | 5,927 | 1,613 | 12,527 | ||||||||||||||||||
| Total securities available for sale | $ | 8,044 | $ | 523,307 | $ | 2,255 | $ | 28,874 | $ | 10,299 | $ | 552,181 | ||||||||||||
| Securities held to maturity | ||||||||||||||||||||||||
| Municipal bonds and obligations | 2,416 | 69,308 | — | — | 2,416 | 69,308 | ||||||||||||||||||
| Agency collateralized mortgage obligations | 411 | 14,724 | — | — | 411 | 14,724 | ||||||||||||||||||
| Agency mortgage-backed securities | 243 | 8,859 | — | — | 243 | 8,859 | ||||||||||||||||||
| Agency commercial mortgage-back securities | 434 | 10,111 | — | — | 434 | 10,111 | ||||||||||||||||||
| Total securities held to maturity | 3,504 | 103,002 | — | — | 3,504 | 103,002 | ||||||||||||||||||
| Total | $ | 11,548 | $ | 626,309 | $ | 2,255 | $ | 28,874 | $ | 13,803 | $ | 655,183 | ||||||||||||
| (In thousands) | December 31, 2023 | December 31, 2022 | ||||||||||||
| Construction | $ | 640,371 | $ | 319,452 | ||||||||||
| Commercial multifamily | 599,145 | 620,088 | ||||||||||||
| Commercial real estate owner occupied | 628,646 | 640,489 | ||||||||||||
| Commercial real estate non-owner occupied | 2,606,409 | 2,496,237 | ||||||||||||
| Commercial and industrial | 1,359,249 | 1,445,236 | ||||||||||||
| Residential real estate | 2,760,312 | 2,312,447 | ||||||||||||
| Home equity | 224,223 | 227,450 | ||||||||||||
| Consumer other | 221,331 | 273,910 | ||||||||||||
| Total loans | $ | 9,039,686 | $ | 8,335,309 | ||||||||||
| Allowance for credit losses | 105,357 | 96,270 | ||||||||||||
| Net loans | $ | 8,934,329 | $ | 8,239,039 | ||||||||||
| December 31, 2017 | December 31, 2016 | |||||||||||||||||||||||
| (In thousands) | Business Activities Loans | Acquired Loans | Total | Business Activities Loans | Acquired Loans | Total | ||||||||||||||||||
| Commercial real estate: | ||||||||||||||||||||||||
| Construction | $ | 181,371 | $ | 84,965 | $ | 266,336 | $ | 253,302 | $ | 34,207 | $ | 287,509 | ||||||||||||
| Single and multi-family | 217,083 | 206,082 | 423,165 | 191,819 | 125,672 | 317,491 | ||||||||||||||||||
| Other commercial real estate | 1,819,253 | 755,988 | 2,575,241 | 1,481,223 | 530,215 | 2,011,438 | ||||||||||||||||||
| Total commercial real estate | 2,217,707 | 1,047,035 | 3,264,742 | 1,926,344 | 690,094 | 2,616,438 | ||||||||||||||||||
| Commercial and industrial loans | 1,182,569 | 621,370 | 1,803,939 | 908,102 | 153,936 | 1,062,038 | ||||||||||||||||||
| Total commercial loans | 3,400,276 | 1,668,405 | 5,068,681 | 2,834,446 | 844,030 | 3,678,476 | ||||||||||||||||||
| Residential mortgages: | ||||||||||||||||||||||||
| 1-4 family | 1,808,024 | 289,373 | 2,097,397 | 1,583,794 | 297,355 | 1,881,149 | ||||||||||||||||||
| Construction | 5,177 | 233 | 5,410 | 11,178 | 804 | 11,982 | ||||||||||||||||||
| Total residential mortgages | 1,813,201 | 289,606 | 2,102,807 | 1,594,972 | 298,159 | 1,893,131 | ||||||||||||||||||
| Consumer loans: | ||||||||||||||||||||||||
| Home equity | 294,954 | 115,227 | 410,181 | 313,521 | 80,279 | 393,800 | ||||||||||||||||||
| Auto and other | 603,767 | 113,902 | 717,669 | 478,368 | 106,012 | 584,380 | ||||||||||||||||||
| Total consumer loans | 898,721 | 229,129 | 1,127,850 | 791,889 | 186,291 | 978,180 | ||||||||||||||||||
| Total loans | $ | 6,112,198 | $ | 2,187,140 | $ | 8,299,338 | $ | 5,221,307 | $ | 1,328,480 | $ | 6,549,787 | ||||||||||||
| (In thousands) | December 31, 2017 | December 31, 2016 | ||||||
| Unamortized net loan origination costs | $ | 24,669 | $ | 21,972 | ||||
| Unamortized net premium on purchased loans | 4,311 | 4,849 | ||||||
| Total unamortized net costs and premiums | $ | 28,980 | $ | 26,821 | ||||
| (In thousands) | 2017 | 2016 | 2015 | |||||||||
| Balance at beginning of period | $ | 8,738 | $ | 6,925 | $ | 2,541 | ||||||
| Acquisitions | 10,815 | 6,125 | 4,777 | |||||||||
| Reclassification from nonaccretable difference for loans with improved cash flows | (23 | ) | 2,488 | 3,640 | ||||||||
| Changes in expected cash flows that do not affect nonaccretable difference | (2,380 | ) | (3,018 | ) | — | |||||||
| Reclassification to TDR | — | (185 | ) | — | ||||||||
| Accretion | (5,589 | ) | (3,597 | ) | (4,033 | ) | ||||||
| Balance at end of period | $ | 11,561 | $ | 8,738 | $ | 6,925 | ||||||
| (in thousands) | 30-59 Days Past Due | 60-89 Days Past Due | >90 Days Past Due | Total Past Due | Current | Total Loans | Past Due > 90 days and Accruing | |||||||||||||||||||||
| December 31, 2017 | ||||||||||||||||||||||||||||
| Commercial real estate: | ||||||||||||||||||||||||||||
| Construction | $ | — | $ | — | $ | — | $ | — | $ | 181,371 | $ | 181,371 | $ | — | ||||||||||||||
| Single and multi-family | — | — | 451 | 451 | 216,632 | 217,083 | — | |||||||||||||||||||||
| Commercial real estate | 1,925 | 48 | 5,023 | 6,996 | 1,812,257 | 1,819,253 | 457 | |||||||||||||||||||||
| Total | 1,925 | 48 | 5,474 | 7,447 | 2,210,260 | 2,217,707 | 457 | |||||||||||||||||||||
| Commercial and industrial loans | ||||||||||||||||||||||||||||
| Total | 4,031 | 1,912 | 6,023 | 11,966 | 1,170,603 | 1,182,569 | 128 | |||||||||||||||||||||
| Residential mortgages: | ||||||||||||||||||||||||||||
| 1-4 family | 2,412 | 242 | 2,186 | 4,840 | 1,803,184 | 1,808,024 | 520 | |||||||||||||||||||||
| Construction | — | — | — | — | 5,177 | 5,177 | — | |||||||||||||||||||||
| Total | 2,412 | 242 | 2,186 | 4,840 | 1,808,361 | 1,813,201 | 520 | |||||||||||||||||||||
| Consumer loans: | ||||||||||||||||||||||||||||
| Home equity | 444 | 1,235 | 1,747 | 3,426 | 291,528 | 294,954 | 120 | |||||||||||||||||||||
| Auto and other | 3,389 | 599 | 1,597 | 5,585 | 598,182 | 603,767 | 143 | |||||||||||||||||||||
| Total | 3,833 | 1,834 | 3,344 | 9,011 | 889,710 | 898,721 | 263 | |||||||||||||||||||||
| Total | $ | 12,201 | $ | 4,036 | $ | 17,027 | $ | 33,264 | $ | 6,078,934 | $ | 6,112,198 | $ | 1,368 | ||||||||||||||
| (In thousands) | Balance at Beginning of Period | Adoption of ASU No. 2022-02 | Charge-offs | Recoveries | Provision for Credit Losses | Balance at End of Period | ||||||||||||||||||||||||||||||||
| Year ended December 31, 2023 | ||||||||||||||||||||||||||||||||||||||
| Construction | $ | 1,227 | $ | — | $ | (1) | $ | — | $ | 1,659 | $ | 2,885 | ||||||||||||||||||||||||||
| Commercial multifamily | 1,810 | — | — | 6 | 659 | 2,475 | ||||||||||||||||||||||||||||||||
| Commercial real estate owner occupied | 10,739 | 24 | (489) | 1,139 | (1,970) | 9,443 | ||||||||||||||||||||||||||||||||
| Commercial real estate non-owner occupied | 30,724 | — | (65) | 204 | 7,358 | 38,221 | ||||||||||||||||||||||||||||||||
| Commercial and industrial | 18,743 | (23) | (17,872) | 2,659 | 15,095 | 18,602 | ||||||||||||||||||||||||||||||||
| Residential real estate | 18,666 | 2 | (313) | 610 | 657 | 19,622 | ||||||||||||||||||||||||||||||||
| Home equity | 2,173 | — | (88) | 519 | (589) | 2,015 | ||||||||||||||||||||||||||||||||
| Consumer other | 12,188 | (404) | (10,429) | 1,586 | 9,153 | 12,094 | ||||||||||||||||||||||||||||||||
| Total allowance for credit losses | $ | 96,270 | $ | (401) | $ | (29,257) | $ | 6,723 | $ | 32,022 | $ | 105,357 | ||||||||||||||||||||||||||
| (in thousands) | 30-59 Days Past Due | 60-89 Days Past Due | >90 Days Past Due | Total Past Due | Current | Total Loans | Past Due > 90 days and Accruing | |||||||||||||||||||||
| December 31, 2016 | ||||||||||||||||||||||||||||
| Commercial real estate: | ||||||||||||||||||||||||||||
| Construction | $ | — | $ | — | $ | — | $ | — | $ | 253,302 | $ | 253,302 | $ | — | ||||||||||||||
| Single and multi-family | 618 | 110 | 624 | 1,352 | 190,467 | 191,819 | 155 | |||||||||||||||||||||
| Commercial real estate | 481 | 2,243 | 4,212 | 6,936 | 1,474,287 | 1,481,223 | — | |||||||||||||||||||||
| Total | 1,099 | 2,353 | 4,836 | 8,288 | 1,918,056 | 1,926,344 | 155 | |||||||||||||||||||||
| Commercial and industrial loans | ||||||||||||||||||||||||||||
| Total | 3,090 | 1,301 | 6,290 | 10,681 | 897,421 | 908,102 | 5 | |||||||||||||||||||||
| Residential mortgages: | ||||||||||||||||||||||||||||
| 1-4 family | 1,393 | 701 | 4,179 | 6,273 | 1,577,521 | 1,583,794 | 1,956 | |||||||||||||||||||||
| Construction | 10 | — | — | 10 | 11,168 | 11,178 | — | |||||||||||||||||||||
| Total | 1,403 | 701 | 4,179 | 6,283 | 1,588,689 | 1,594,972 | 1,956 | |||||||||||||||||||||
| Consumer loans: | ||||||||||||||||||||||||||||
| Home equity | 99 | — | 2,981 | 3,080 | 310,441 | 313,521 | 306 | |||||||||||||||||||||
| Auto and other | 2,483 | 494 | 968 | 3,945 | 474,423 | 478,368 | 16 | |||||||||||||||||||||
| Total | 2,582 | 494 | 3,949 | 7,025 | 784,864 | 791,889 | 322 | |||||||||||||||||||||
| Total | $ | 8,174 | $ | 4,849 | $ | 19,254 | $ | 32,277 | $ | 5,189,030 | $ | 5,221,307 | $ | 2,438 | ||||||||||||||
| (In thousands) | Balance at Beginning of Period | Charge-offs | Recoveries | Provision for Credit Losses | Balance at End of Period | |||||||||||||||||||||||||||
| Year ended December 31, 2022 | ||||||||||||||||||||||||||||||||
| Construction | $ | 3,206 | $ | — | $ | — | $ | (1,979) | $ | 1,227 | ||||||||||||||||||||||
| Commercial multifamily | 6,120 | (94) | 112 | (4,328) | 1,810 | |||||||||||||||||||||||||||
| Commercial real estate owner occupied | 12,752 | (687) | 702 | (2,028) | 10,739 | |||||||||||||||||||||||||||
| Commercial real estate non-owner occupied | 32,106 | (5,894) | 1,549 | 2,963 | 30,724 | |||||||||||||||||||||||||||
| Commercial and industrial | 22,584 | (18,447) | 3,050 | 11,556 | 18,743 | |||||||||||||||||||||||||||
| Residential real estate | 22,406 | (555) | 1,019 | (4,204) | 18,666 | |||||||||||||||||||||||||||
| Home equity | 4,006 | (166) | 283 | (1,950) | 2,173 | |||||||||||||||||||||||||||
| Consumer other | 2,914 | (2,215) | 505 | 10,984 | 12,188 | |||||||||||||||||||||||||||
| Total allowance for credit losses | $ | 106,094 | $ | (28,058) | $ | 7,220 | $ | 11,014 | $ | 96,270 | ||||||||||||||||||||||
| (in thousands) | 30-59 Days Past Due | 60-89 Days Past Due | >90 Days Past Due | Total Past Due | Acquired Credit Impaired | Total Loans | Past Due > 90 days and Accruing | |||||||||||||||||||||
| December 31, 2017 | ||||||||||||||||||||||||||||
| Commercial real estate: | ||||||||||||||||||||||||||||
| Construction | $ | — | $ | — | $ | — | $ | — | $ | 7,655 | $ | 84,965 | $ | — | ||||||||||||||
| Single and multi-family | 671 | — | 203 | 874 | 2,846 | 206,082 | — | |||||||||||||||||||||
| Commercial real estate | 816 | 1,875 | 2,156 | 4,847 | 42,801 | 755,988 | 109 | |||||||||||||||||||||
| Total | 1,487 | 1,875 | 2,359 | 5,721 | 53,302 | 1,047,035 | 109 | |||||||||||||||||||||
| Commercial and industrial loans | ||||||||||||||||||||||||||||
| Total | 1,252 | 268 | 1,439 | 2,959 | 34,629 | 621,370 | 23 | |||||||||||||||||||||
| Residential mortgages: | ||||||||||||||||||||||||||||
| 1-4 family | 957 | 2,581 | 1,247 | 4,785 | 6,974 | 289,373 | 30 | |||||||||||||||||||||
| Construction | — | — | — | — | — | 233 | — | |||||||||||||||||||||
| Total | 957 | 2,581 | 1,247 | 4,785 | 6,974 | 289,606 | 30 | |||||||||||||||||||||
| Consumer loans: | ||||||||||||||||||||||||||||
| Home equity | 286 | 40 | 1,965 | 2,291 | 1,956 | 115,227 | — | |||||||||||||||||||||
| Auto and other | 346 | 135 | 430 | 911 | 483 | 113,902 | 38 | |||||||||||||||||||||
| Total | 632 | 175 | 2,395 | 3,202 | 2,439 | 229,129 | 38 | |||||||||||||||||||||
| Total | $ | 4,328 | $ | 4,899 | $ | 7,440 | $ | 16,667 | $ | 97,344 | $ | 2,187,140 | $ | 200 | ||||||||||||||
| (In thousands) | Balance at Beginning of Period | Charge-offs | Recoveries | Provision for Credit Losses | Balance at End of Period | |||||||||||||||||||||||||||
| Year ended December 31, 2021 | ||||||||||||||||||||||||||||||||
| Construction | $ | 5,111 | $ | — | $ | — | $ | (1,905) | $ | 3,206 | ||||||||||||||||||||||
| Commercial multifamily | 5,916 | (404) | 157 | 451 | $ | 6,120 | ||||||||||||||||||||||||||
| Commercial real estate owner occupied | 12,380 | (1,640) | 204 | 1,808 | $ | 12,752 | ||||||||||||||||||||||||||
| Commercial real estate non-owner occupied | 35,850 | (14,557) | 2,522 | 8,291 | $ | 32,106 | ||||||||||||||||||||||||||
| Commercial and industrial | 25,013 | (10,841) | 4,565 | 3,847 | $ | 22,584 | ||||||||||||||||||||||||||
| Residential real estate | 28,491 | (1,664) | 1,767 | (6,188) | $ | 22,406 | ||||||||||||||||||||||||||
| Home equity | 6,482 | (334) | 335 | (2,477) | $ | 4,006 | ||||||||||||||||||||||||||
| Consumer other | 8,059 | (1,578) | 761 | (4,328) | 2,914 | |||||||||||||||||||||||||||
| Total allowance for credit losses | $ | 127,302 | $ | (31,018) | $ | 10,311 | $ | (501) | $ | 106,094 | ||||||||||||||||||||||
| (in thousands) | 30-59 Days Past Due | 60-89 Days Past Due | >90 Days Past Due | Total Past Due | Acquired Credit Impaired | Total Loans | Past Due > 90 days and Accruing | |||||||||||||||||||||
| December 31, 2016 | ||||||||||||||||||||||||||||
| Commercial real estate: | ||||||||||||||||||||||||||||
| Construction | $ | — | $ | — | $ | — | $ | — | $ | 47 | $ | 34,207 | $ | — | ||||||||||||||
| Single and multi-family | 2 | — | 437 | 439 | 4,726 | 125,672 | — | |||||||||||||||||||||
| Commercial real estate | 1,555 | — | 765 | 2,320 | 30,047 | 530,215 | — | |||||||||||||||||||||
| Total | 1,557 | — | 1,202 | 2,759 | 34,820 | 690,094 | — | |||||||||||||||||||||
| Commercial and industrial loans: | ||||||||||||||||||||||||||||
| Total | 1,850 | 15 | 1,262 | 3,127 | 3,369 | 153,936 | 24 | |||||||||||||||||||||
| Residential mortgages: | ||||||||||||||||||||||||||||
| 1-4 family | 321 | 343 | 2,015 | 2,679 | 7,283 | 297,355 | 443 | |||||||||||||||||||||
| Construction | — | — | — | — | — | 804 | — | |||||||||||||||||||||
| Total | 321 | 343 | 2,015 | 2,679 | 7,283 | 298,159 | 443 | |||||||||||||||||||||
| Consumer loans: | ||||||||||||||||||||||||||||
| Home equity | 753 | — | 870 | 1,623 | 957 | 80,279 | 353 | |||||||||||||||||||||
| Auto and other | 542 | 314 | 1,686 | 2,542 | 387 | 106,012 | 791 | |||||||||||||||||||||
| Total | 1,295 | 314 | 2,556 | 4,165 | 1,344 | 186,291 | 1,144 | |||||||||||||||||||||
| Total | $ | 5,023 | $ | 672 | $ | 7,035 | $ | 12,730 | $ | 46,816 | $ | 1,328,480 | $ | 1,611 | ||||||||||||||
| December 31, 2017 | December 31, 2016 | |||||||||||||||||||||||
| (In thousands) | Business Activities Loans | Acquired Loans (1) | Total | Business Activities Loans | Acquired Loans (2) | Total | ||||||||||||||||||
| Commercial real estate: | ||||||||||||||||||||||||
| Construction | — | — | — | — | — | — | ||||||||||||||||||
| Single and multi-family | 451 | 203 | 654 | 469 | 437 | 906 | ||||||||||||||||||
| Other commercial real estate | 4,566 | 2,047 | 6,613 | 4,212 | 765 | 4,977 | ||||||||||||||||||
| Total | 5,017 | 2,250 | 7,267 | 4,681 | 1,202 | 5,883 | ||||||||||||||||||
| Commercial and industrial loans: | ||||||||||||||||||||||||
| Total | 5,895 | 1,333 | 7,228 | 6,285 | 1,155 | 7,440 | ||||||||||||||||||
| Residential mortgages: | ||||||||||||||||||||||||
| 1-4 family | $ | 1,666 | $ | 1,217 | $ | 2,883 | $ | 2,223 | $ | 1,572 | $ | 3,795 | ||||||||||||
| Construction | — | — | — | — | — | — | ||||||||||||||||||
| Total | 1,666 | 1,217 | 2,883 | 2,223 | 1,572 | 3,795 | ||||||||||||||||||
| Consumer loans: | ||||||||||||||||||||||||
| Home equity | 1,627 | 1,965 | 3,592 | 2,675 | 517 | 3,192 | ||||||||||||||||||
| Auto and other | 1,454 | 392 | 1,846 | 952 | 895 | 1,847 | ||||||||||||||||||
| Total | 3,081 | 2,357 | 5,438 | 3,627 | 1,412 | 5,039 | ||||||||||||||||||
| Total non-accrual loans | $ | 15,659 | $ | 7,157 | $ | 22,816 | $ | 16,816 | $ | 5,341 | $ | 22,157 | ||||||||||||
| (In thousands) 2017 | Commercial real estate | Commercial and industrial | Residential mortgages | Consumer | Total | |||||||||||||||
| Loans receivable: | ||||||||||||||||||||
| Balance at end of year | ||||||||||||||||||||
| Individually evaluated for impairment | $ | 33,732 | $ | 5,761 | $ | 3,872 | $ | — | $ | 43,365 | ||||||||||
| Collectively evaluated | 2,183,975 | 1,176,808 | 1,809,329 | 898,721 | 6,068,833 | |||||||||||||||
| Total | $ | 2,217,707 | $ | 1,182,569 | $ | 1,813,201 | $ | 898,721 | $ | 6,112,198 | ||||||||||
| (In thousands) 2016 | Commercial real estate | Commercial and industrial | Residential mortgages | Consumer | Total | |||||||||||||||
| Loans receivable: | ||||||||||||||||||||
| Balance at end of year | ||||||||||||||||||||
| Individually evaluated for impairment | $ | 25,549 | $ | 5,705 | $ | 2,775 | $ | 2,703 | $ | 36,732 | ||||||||||
| Collectively evaluated | 1,900,795 | 902,397 | 1,592,197 | 789,186 | 5,184,575 | |||||||||||||||
| Total | $ | 1,926,344 | $ | 908,102 | $ | 1,594,972 | $ | 791,889 | $ | 5,221,307 | ||||||||||
| (In thousands) 2017 | Commercial real estate | Commercial and industrial | Residential mortgages | Consumer | Total | |||||||||||||||
| Loans receivable: | ||||||||||||||||||||
| Balance at end of year | ||||||||||||||||||||
| Individually evaluated for impairment | $ | 4,244 | $ | 421 | $ | 2,617 | $ | 27 | $ | 7,309 | ||||||||||
| Purchased credit-impaired loans | 53,302 | 34,629 | 6,974 | 2,439 | 97,344 | |||||||||||||||
| Collectively evaluated | 989,489 | 586,320 | 280,015 | 226,663 | 2,082,487 | |||||||||||||||
| Total | $ | 1,047,035 | $ | 621,370 | $ | 289,606 | $ | 229,129 | $ | 2,187,140 | ||||||||||
| (In thousands) 2016 | Commercial real estate | Commercial and industrial | Residential mortgages | Consumer | Total | |||||||||||||||
| Loans receivable: | ||||||||||||||||||||
| Balance at end of year | ||||||||||||||||||||
| Individually evaluated for impairment | $ | 4,256 | $ | 635 | $ | 308 | $ | 406 | $ | 5,605 | ||||||||||
| Purchased credit-impaired loans | 34,820 | 3,369 | 7,283 | 1,344 | 46,816 | |||||||||||||||
| Collectively evaluated | 651,018 | 149,932 | 290,568 | 184,541 | 1,276,059 | |||||||||||||||
| Total | $ | 690,094 | $ | 153,936 | $ | 298,159 | $ | 186,291 | $ | 1,328,480 | ||||||||||
| At December 31, 2017 | ||||||||||||
| (In thousands) | Recorded Investment (1) | Unpaid Principal Balance (2) | Related Allowance | |||||||||
| With no related allowance: | ||||||||||||
| Commercial real estate - construction | $ | — | $ | — | $ | — | ||||||
| Commercial real estate - single and multifamily | 1,077 | 3,607 | — | |||||||||
| Other commercial real estate | 18,285 | 18,611 | — | |||||||||
| Other commercial and industrial loans | 2,060 | 2,629 | — | |||||||||
| Residential mortgages - 1-4 family | 660 | 1,075 | — | |||||||||
| Consumer - home equity | 867 | 1,504 | — | |||||||||
| With an allowance recorded: | ||||||||||||
| Commercial real estate - construction | $ | 159 | $ | 159 | $ | 1 | ||||||
| Commercial real estate - single and multifamily | 159 | 171 | 1 | |||||||||
| Other commercial real estate | 14,321 | 15,235 | 227 | |||||||||
| Other commercial and industrial loans | 3,716 | 4,249 | 66 | |||||||||
| Residential mortgages - 1-4 family | 1,344 | 1,446 | 130 | |||||||||
| Consumer - home equity | 1,014 | 999 | 34 | |||||||||
| Consumer - other | 17 | 17 | 1 | |||||||||
| Total | ||||||||||||
| Commercial real estate | $ | 34,001 | $ | 37,783 | $ | 229 | ||||||
| Commercial and industrial | 5,776 | 6,878 | 66 | |||||||||
| Residential mortgages | 2,004 | 2,521 | 130 | |||||||||
| Consumer | 1,898 | 2,520 | 35 | |||||||||
| Total impaired loans | $ | 43,679 | $ | 49,702 | $ | 460 | ||||||
| At December 31, 2016 | ||||||||||||
| (In thousands) | Recorded Investment (1) | Unpaid Principal Balance (2) | Related Allowance | |||||||||
| With no related allowance: | ||||||||||||
| Other commercial real estate | $ | 18,905 | $ | 18,905 | $ | — | ||||||
| Other commercial and industrial loans | 382 | 382 | — | |||||||||
| Residential mortgages - 1-4 family | 2,101 | 2,101 | — | |||||||||
| Consumer - home equity | 1,605 | 1,605 | — | |||||||||
| With an allowance recorded: | ||||||||||||
| Commercial real estate - single and multifamily | $ | 179 | $ | 181 | $ | 2 | ||||||
| Other commercial real estate | 6,306 | 6,462 | 156 | |||||||||
| Other commercial and industrial loans | 5,060 | 5,324 | 264 | |||||||||
| Residential mortgages - 1-4 family | 538 | 674 | 136 | |||||||||
| Consumer - home equity | 942 | 1,098 | 156 | |||||||||
| Total | ||||||||||||
| Commercial real estate | $ | 25,390 | $ | 25,548 | $ | 158 | ||||||
| Commercial and industrial | 5,442 | 5,706 | 264 | |||||||||
| Residential mortgages | 2,639 | 2,775 | 136 | |||||||||
| Consumer | 2,547 | 2,703 | 156 | |||||||||
| Total impaired loans | $ | 36,018 | $ | 36,732 | $ | 714 | ||||||
| At December 31, 2017 | ||||||||||||
| (In thousands) | Recorded Investment (1) | Unpaid Principal Balance (2) | Related Allowance | |||||||||
| With no related allowance: | ||||||||||||
| Commercial real estate - single and multifamily | $ | 204 | $ | 290 | $ | — | ||||||
| Other commercial real estate loans | 1,123 | 2,794 | — | |||||||||
| Other commercial and industrial loans | 255 | 310 | — | |||||||||
| Residential mortgages - 1-4 family | 658 | 671 | — | |||||||||
| Consumer - home equity | 1,374 | 1,654 | — | |||||||||
| Consumer - other | 27 | 27 | — | |||||||||
| With an allowance recorded: | ||||||||||||
| Commercial real estate - single and multifamily | $ | 887 | $ | 880 | $ | 18 | ||||||
| Other commercial real estate loans | 2,043 | 1,661 | 38 | |||||||||
| Other commercial and industrial loans | 165 | 166 | 1 | |||||||||
| Residential mortgages - 1-4 family | 166 | 185 | 9 | |||||||||
| Consumer - home equity | 433 | 540 | 45 | |||||||||
| Total | ||||||||||||
| Commercial real estate | $ | 4,257 | $ | 5,625 | $ | 56 | ||||||
| Commercial and industrial | 420 | 476 | 1 | |||||||||
| Residential mortgages | 824 | 856 | 9 | |||||||||
| Consumer | 1,834 | 2,221 | 45 | |||||||||
| Total impaired loans | $ | 7,335 | $ | 9,178 | $ | 111 | ||||||
| December 31, 2016 | ||||||||||||
| (In thousands) | Recorded Investment (1) | Unpaid Principal Balance (2) | Related Allowance | |||||||||
| With no related allowance: | ||||||||||||
| Other commercial real estate loans | $ | 547 | $ | 547 | $ | — | ||||||
| Residential mortgages - 1-4 family | 208 | 208 | — | |||||||||
| Consumer - home equity | — | — | — | |||||||||
| Consumer - other | — | — | — | |||||||||
| With an allowance recorded: | ||||||||||||
| Commercial real estate - single and multifamily | $ | 1,250 | $ | 1,358 | $ | 108 | ||||||
| Other commercial real estate loans | 2,209 | 2,351 | 142 | |||||||||
| Other Commercial and industrial loans | 576 | 635 | 59 | |||||||||
| Residential mortgages - 1-4 family | 89 | 100 | 11 | |||||||||
| Consumer - home equity | 292 | 406 | 114 | |||||||||
| Total | ||||||||||||
| Commercial real estate | $ | 4,006 | $ | 4,256 | $ | 250 | ||||||
| Commercial and industrial | 576 | 635 | 59 | |||||||||
| Residential mortgages | 297 | 308 | 11 | |||||||||
| Consumer | 292 | 406 | 114 | |||||||||
| Total impaired loans | $ | 5,171 | $ | 5,605 | $ | 434 | ||||||
| December 31, 2017 | December 31, 2016 | December 31, 2015 | ||||||||||||||||||||||
| (in thousands) | Average Recorded Investment | Cash Basis Interest Income Recognized | Average Recorded Investment | Cash Basis Interest Income Recognized | Average Recorded Investment | Cash Basis Interest Income Recognized | ||||||||||||||||||
| With no related allowance: | ||||||||||||||||||||||||
| Commercial real estate - construction | $ | — | $ | — | $ | — | $ | — | $ | 2,245 | $ | 92 | ||||||||||||
| Commercial real estate - single and multifamily | 341 | 214 | 36 | 1 | 60 | — | ||||||||||||||||||
| Other commercial real estate | 20,867 | 1,123 | 6,463 | 1,155 | 12,487 | 302 | ||||||||||||||||||
| Other commercial and industrial | 4,437 | 265 | 3,349 | 131 | 3,870 | 177 | ||||||||||||||||||
| Residential mortgages - 1-4 family | 1,128 | 31 | 2,403 | 91 | 1,353 | 38 | ||||||||||||||||||
| Consumer-home equity | 1,291 | 30 | 612 | 5 | 442 | 13 | ||||||||||||||||||
| Consumer-other | 72 | 3 | 2 | — | — | — | ||||||||||||||||||
| With an allowance recorded: | ||||||||||||||||||||||||
| Commercial mortgages - construction | $ | 41 | $ | 3 | $ | — | $ | — | $ | — | $ | — | ||||||||||||
| Commercial real estate - single and multifamily | 169 | 12 | 15 | 6 | — | — | ||||||||||||||||||
| Other commercial real estate | 11,372 | 520 | 7,576 | 349 | 3,214 | 132 | ||||||||||||||||||
| Other commercial and industrial | 3,251 | 267 | 2,002 | 225 | 810 | 37 | ||||||||||||||||||
| Residential mortgages - 1-4 family | 1,289 | 59 | 682 | 26 | 1,704 | 72 | ||||||||||||||||||
| Consumer-home equity | 1,007 | 29 | 999 | 35 | 83 | — | ||||||||||||||||||
| Consumer - other | 4 | 1 | 103 | 4 | 112 | 4 | ||||||||||||||||||
| Total | ||||||||||||||||||||||||
| Commercial real estate | $ | 32,790 | $ | 1,872 | $ | 14,090 | $ | 1,511 | $ | 18,006 | $ | 526 | ||||||||||||
| Commercial and industrial | 7,688 | 532 | 5,351 | 356 | 4,680 | 214 | ||||||||||||||||||
| Residential mortgages | 2,417 | 90 | 3,085 | 117 | 3,057 | 110 | ||||||||||||||||||
| Consumer loans | 2,374 | 63 | 1,716 | 44 | 637 | 17 | ||||||||||||||||||
| Total impaired loans | $ | 45,269 | $ | 2,557 | $ | 24,242 | $ | 2,028 | $ | 26,380 | $ | 867 | ||||||||||||
| December 31, 2017 | December 31, 2016 | December 31, 2015 | ||||||||||||||||||||||
| (in thousands) | Average Recorded Investment | Cash Basis Interest Income Recognized | Average Recorded Investment | Cash Basis Interest Income Recognized | Average Recorded Investment | Cash Basis Interest Income Recognized | ||||||||||||||||||
| With no related allowance: | ||||||||||||||||||||||||
| Commercial real estate - construction | $ | — | $ | — | $ | — | $ | — | $ | 445 | $ | 60 | ||||||||||||
| Commercial real estate - single and multifamily | 342 | 82 | — | — | 2,014 | 57 | ||||||||||||||||||
| Other commercial real estate | 487 | 239 | 521 | 20 | 1,721 | 37 | ||||||||||||||||||
| Other commercial and industrial | 581 | 43 | 492 | 9 | — | — | ||||||||||||||||||
| Residential mortgages - 1-4 family | 390 | 28 | 293 | 12 | 463 | 6 | ||||||||||||||||||
| Consumer - home equity | 773 | 22 | — | — | 152 | 5 | ||||||||||||||||||
| Consumer - other | 7 | 1 | 105 | 1 | 59 | 5 | ||||||||||||||||||
| With an allowance recorded: | ||||||||||||||||||||||||
| Commercial real estate - construction | $ | — | $ | — | $ | — | $ | — | $ | — | $ | — | ||||||||||||
| Commercial real estate - single and multifamily | 903 | 47 | 1,064 | 115 | 623 | 33 | ||||||||||||||||||
| Other commercial real estate | 1,719 | 91 | 2,618 | 165 | 1,384 | 96 | ||||||||||||||||||
| Other commercial and industrial | 47 | 13 | 369 | 17 | 31 | 3 | ||||||||||||||||||
| Residential mortgages - 1-4 family | 173 | 9 | 214 | 25 | 304 | 9 | ||||||||||||||||||
| Consumer - home equity | 400 | 21 | — | — | 195 | 7 | ||||||||||||||||||
| Total | ||||||||||||||||||||||||
| Commercial real estate | $ | 3,451 | $ | 459 | $ | 4,203 | $ | 300 | $ | 6,187 | $ | 283 | ||||||||||||
| Commercial and industrial | 628 | 56 | 861 | 26 | 31 | 3 | ||||||||||||||||||
| Residential mortgages | 563 | 37 | 507 | 37 | 767 | 15 | ||||||||||||||||||
| Consumer loans | 1,180 | 44 | 105 | 1 | 406 | 17 | ||||||||||||||||||
| Total impaired loans | $ | 5,822 | $ | 596 | $ | 5,676 | $ | 364 | $ | 7,391 | $ | 318 | ||||||||||||
| Modifications by Class For the twelve months ending December 31, 2017 | |||||||||||
| Number of Modifications | Pre-Modification Outstanding Recorded Investment (In thousands) | Post-Modification Outstanding Recorded Investment | |||||||||
| Troubled Debt Restructurings | |||||||||||
| Commercial - Single and multifamily | 1 | $ | 235 | $ | 235 | ||||||
| Commercial - Other | 15 | 13,445 | 11,718 | ||||||||
| Commercial and industrial - Other | 12 | 3,507 | 3,507 | ||||||||
| Residential - 1-4 Family | 4 | 331 | 314 | ||||||||
| Consumer - Home Equity | 3 | 122 | 122 | ||||||||
| 35 | $ | 17,640 | $ | 15,896 | |||||||
| Modifications by Class For the twelve months ending December 31, 2016 | |||||||||||
| Number of Modifications | Pre-Modification Outstanding Recorded Investment (In thousands) | Post-Modification Outstanding Recorded Investment | |||||||||
| Troubled Debt Restructurings | |||||||||||
| Commercial - Single and multifamily | 5 | $ | 437 | $ | 437 | ||||||
| Commercial - Other | 5 | 16,651 | 16,651 | ||||||||
| Commercial and industrial - Other | 4 | 555 | 555 | ||||||||
| Residential - 1-4 Family | 2 | 5 | 5 | ||||||||
| Consumer - Home Equity | 1 | 117 | 117 | ||||||||
| 17 | $ | 17,765 | $ | 17,765 | |||||||
| Modifications by Class For the twelve months ending December 31, 2015 | |||||||||||
| Number of Modifications | Pre-Modification Outstanding Recorded Investment (In thousands) | Post-Modification Outstanding Recorded Investment | |||||||||
| Troubled Debt Restructurings | |||||||||||
| Commercial - Construction | 1 | $ | 123 | $ | 123 | ||||||
| Commercial - Single and multifamily | 2 | 307 | 307 | ||||||||
| Commercial - Other | 4 | 8,577 | 7,274 | ||||||||
| Commercial and industrial - Other | 6 | 9,041 | 8,904 | ||||||||
| Consumer - Other | 1 | 999 | 999 | ||||||||
| 14 | $ | 19,047 | $ | 17,607 | |||||||
Modifications that subsequently defaulted for the twelve months ending December 31, 2017 | |||||||
| Number of Contracts | Recorded Investment | ||||||
| Troubled Debt Restructurings | |||||||
| Commercial - Single and multifamily | — | $ | — | ||||
| Commercial - Other | 1 | 113 | |||||
| Commercial and industrial - Other | 2 | 492 | |||||
| Residential - 1-4 Family | — | — | |||||
| 3 | $ | 605 | |||||
Modifications that subsequently defaulted for the twelve months ending December 31, 2015 | |||||||
| Number of Contracts | Recorded Investment | ||||||
| Troubled Debt Restructurings | |||||||
| Commercial - Single and multifamily | 1 | $ | — | ||||
| Commercial - Other | 1 | 373 | |||||
| Commercial and industrial - Other | 4 | 6,579 | |||||
| Residential - 1-4 Family | 2 | 169 | |||||
| 8 | $ | 7,121 | |||||
| (In thousands) | 2017 | 2016 | 2015 | |||||||||
| Balance at beginning of year | $ | 33,829 | $ | 22,048 | $ | 16,714 | ||||||
| Principal payments | (3,213 | ) | (5,870 | ) | (5,460 | ) | ||||||
| TDR status change (1) | — | 2,235 | — | |||||||||
| Other reductions (2) | (4,522 | ) | (2,349 | ) | (3,160 | ) | ||||||
| Newly identified TDRs | 15,896 | 17,765 | 13,954 | |||||||||
| Balance at end of year | $ | 41,990 | $ | 33,829 | $ | 22,048 | ||||||
| (In thousands) | Total | |||||||
| $ | 8,588 | |||||||
| Expense for credit losses | 668 | |||||||
| Balance at | $ | 9,256 | ||||||
| (In thousands) | Total | |||||||
| Balance at December 31, 2021 | $ | 7,043 | ||||||
| Release of | 1,545 | |||||||
| Balance at December 31, 2022 | $ | 8,588 | ||||||
| (In thousands) | Total | |||||||
| Balance at December 31, 2020 | $ | 7,629 | ||||||
| Release of expense for credit losses | (586) | |||||||
| Balance at December 31, 2021 | $ | 7,043 | ||||||
| (In thousands) 2017 | Commercial real estate | Commercial and industrial | Residential mortgages | Consumer | Total | |||||||||||||||
| Balance at beginning of year | $ | 16,498 | $ | 9,447 | $ | 7,805 | $ | 5,479 | $ | 39,229 | ||||||||||
| Charged-off loans | 3,875 | 3,373 | 806 | 3,470 | 11,524 | |||||||||||||||
| Recoveries on charged-off loans | 170 | 179 | 270 | 270 | 889 | |||||||||||||||
| Provision for loan losses | 4,050 | 7,597 | 2,151 | 3,528 | 17,326 | |||||||||||||||
| Balance at end of year | $ | 16,843 | $ | 13,850 | $ | 9,420 | $ | 5,807 | $ | 45,920 | ||||||||||
| Individually evaluated for impairment | 229 | 66 | 130 | 35 | 460 | |||||||||||||||
| Collectively evaluated | 16,614 | 13,784 | 9,290 | 5,772 | 45,460 | |||||||||||||||
| Total | $ | 16,843 | $ | 13,850 | $ | 9,420 | $ | 5,807 | $ | 45,920 | ||||||||||
| (In thousands) 2016 | Commercial real estate | Commercial and industrial | Residential mortgages | Consumer | Total | |||||||||||||||
| Balance at beginning of year | $ | 14,591 | $ | 7,385 | $ | 7,613 | $ | 4,985 | $ | 34,574 | ||||||||||
| Charged-off loans | 2,127 | 4,620 | 2,036 | 1,722 | 10,505 | |||||||||||||||
| Recoveries on charged-off loans | 243 | 123 | 159 | 267 | 792 | |||||||||||||||
| Provision for loan losses | 3,791 | 6,559 | 2,069 | 1,949 | 14,368 | |||||||||||||||
| Balance at end of year | $ | 16,498 | $ | 9,447 | $ | 7,805 | $ | 5,479 | $ | 39,229 | ||||||||||
| Individually evaluated for impairment | 158 | 264 | 136 | 156 | 714 | |||||||||||||||
| Collectively evaluated | 16,340 | 9,183 | 7,669 | 5,323 | 38,515 | |||||||||||||||
| Total | $ | 16,498 | $ | 9,447 | $ | 7,805 | $ | 5,479 | $ | 39,229 | ||||||||||
| (In thousands) 2015 | Commercial real estate | Commercial and industrial | Residential mortgages | Consumer | Total | |||||||||||||||
| Balance at beginning of year | $ | 14,740 | $ | 5,246 | $ | 6,864 | $ | 5,945 | $ | 32,795 | ||||||||||
| Charged-off loans | 6,865 | 2,358 | 1,215 | 1,183 | 11,621 | |||||||||||||||
| Recoveries on charged-off loans | 164 | 169 | 141 | 285 | 759 | |||||||||||||||
| Provision for loan losses | 6,552 | 4,328 | 1,823 | (62 | ) | 12,641 | ||||||||||||||
| Balance at end of year | $ | 14,591 | $ | 7,385 | $ | 7,613 | $ | 4,985 | $ | 34,574 | ||||||||||
| Individually evaluated for impairment | 149 | 21 | 153 | 103 | 426 | |||||||||||||||
| Collectively evaluated | 14,442 | 7,364 | 7,460 | 4,882 | 34,148 | |||||||||||||||
| Total | $ | 14,591 | $ | 7,385 | $ | 7,613 | $ | 4,985 | $ | 34,574 | ||||||||||
| (In thousands) 2017 | Commercial real estate | Commercial and industrial | Residential mortgages | Consumer | Total | |||||||||||||||
| Balance at beginning of year | $ | 2,303 | $ | 1,164 | $ | 766 | $ | 536 | $ | 4,769 | ||||||||||
| Charged-off loans | 771 | 844 | 797 | 648 | 3,060 | |||||||||||||||
| Recoveries on charged-off loans | 65 | 245 | 43 | 153 | 506 | |||||||||||||||
| Provision for loan losses | 2,259 | 560 | 586 | 294 | 3,699 | |||||||||||||||
| Balance at end of year | $ | 3,856 | $ | 1,125 | $ | 598 | $ | 335 | $ | 5,914 | ||||||||||
| Individually evaluated for impairment | 56 | 1 | 9 | 45 | 111 | |||||||||||||||
| Collectively evaluated | 3,800 | 1,124 | 589 | 290 | 5,803 | |||||||||||||||
| Total | $ | 3,856 | $ | 1,125 | $ | 598 | $ | 335 | $ | 5,914 | ||||||||||
| (In thousands) 2016 | Commercial real estate | Commercial and industrial | Residential mortgages | Consumer | Total | |||||||||||||||
| Balance at beginning of year | $ | 1,903 | $ | 1,330 | $ | 976 | $ | 525 | $ | 4,734 | ||||||||||
| Charged-off loans | 977 | 1,095 | 829 | 620 | 3,521 | |||||||||||||||
| Recoveries on charged-off loans | 61 | 266 | 144 | 91 | 562 | |||||||||||||||
| Provision for loan losses | 1,316 | 663 | 475 | 540 | 2,994 | |||||||||||||||
| Balance at end of year | $ | 2,303 | $ | 1,164 | $ | 766 | $ | 536 | $ | 4,769 | ||||||||||
| Individually evaluated for impairment | 250 | 59 | 11 | 114 | 434 | |||||||||||||||
| Collectively evaluated | 2,053 | 1,105 | 755 | 422 | 4,335 | |||||||||||||||
| Total | $ | 2,303 | $ | 1,164 | $ | 766 | $ | 536 | $ | 4,769 | ||||||||||
| (In thousands) 2015 | Commercial real estate | Commercial and industrial | Residential mortgages | Consumer | Total | |||||||||||||||
| Balance at beginning of year | $ | 790 | $ | 1,093 | $ | 615 | $ | 369 | $ | 2,867 | ||||||||||
| Charged-off loans | 681 | 752 | 642 | 992 | 3,067 | |||||||||||||||
| Recoveries on charged-off loans | 418 | 289 | 64 | 78 | 849 | |||||||||||||||
| Provision for loan losses | 1,376 | 700 | 939 | 1,070 | 4,085 | |||||||||||||||
| Balance at end of year | $ | 1,903 | $ | 1,330 | $ | 976 | $ | 525 | $ | 4,734 | ||||||||||
| Individually evaluated for impairment | 43 | — | 30 | 25 | 98 | |||||||||||||||
| Purchased credit-impaired loans | 42 | — | — | — | 42 | |||||||||||||||
| Collectively evaluated | 1,818 | 1,330 | 946 | 500 | 4,594 | |||||||||||||||
| Total | $ | 1,903 | $ | 1,330 | $ | 976 | $ | 525 | $ | 4,734 | ||||||||||
| Term Loans Amortized Cost Basis by Origination Year | |||||||||||||||||||||||||||||
| (In thousands) | 2023 | 2022 | 2021 | 2020 | 2019 | Prior | Revolving Loans Amortized Cost Basis | Revolving Loans Converted to Term | Total | ||||||||||||||||||||
| As of December 31, 2023 | |||||||||||||||||||||||||||||
| Construction | |||||||||||||||||||||||||||||
| Current period gross write-offs | $ | — | $ | — | $ | — | $ | — | $ | — | $ | 1 | $ | — | $ | — | $ | 1 | |||||||||||
| Risk rating | |||||||||||||||||||||||||||||
| Pass | $ | 104,507 | $ | 346,419 | $ | 138,802 | $ | 29,176 | $ | 2,545 | $ | 1,098 | $ | — | $ | — | $ | 622,547 | |||||||||||
| Special Mention | — | — | 512 | — | — | — | — | — | 512 | ||||||||||||||||||||
| Substandard | — | — | 17,312 | — | — | — | — | — | 17,312 | ||||||||||||||||||||
| Total | $ | 104,507 | $ | 346,419 | $ | 156,626 | $ | 29,176 | $ | 2,545 | $ | 1,098 | $ | — | $ | — | $ | 640,371 | |||||||||||
| Commercial multifamily: | |||||||||||||||||||||||||||||
| Current period gross write-offs | $ | — | $ | — | $ | — | $ | — | $ | — | $ | — | $ | — | $ | — | $ | — | |||||||||||
| Risk rating | |||||||||||||||||||||||||||||
| Pass | $ | 16,020 | $ | 216,477 | $ | 56,817 | $ | 26,566 | $ | 94,733 | $ | 179,923 | $ | 377 | $ | — | $ | 590,913 | |||||||||||
| Special Mention | — | — | — | — | — | — | — | — | — | ||||||||||||||||||||
| Substandard | — | — | 242 | 2,554 | — | 5,436 | — | — | 8,232 | ||||||||||||||||||||
| Total | $ | 16,020 | $ | 216,477 | $ | 57,059 | $ | 29,120 | $ | 94,733 | $ | 185,359 | $ | 377 | $ | — | $ | 599,145 | |||||||||||
| Commercial real estate owner occupied: | |||||||||||||||||||||||||||||
| Current period gross write-offs | $ | — | $ | — | $ | — | $ | 380 | $ | — | $ | 109 | $ | — | $ | — | $ | 489 | |||||||||||
| Risk rating | |||||||||||||||||||||||||||||
| Pass | $ | 97,271 | $ | 120,327 | $ | 122,151 | $ | 37,914 | $ | 70,393 | $ | 165,224 | $ | 2,653 | $ | — | $ | 615,933 | |||||||||||
| Special Mention | — | — | 424 | 222 | — | 788 | — | — | 1,434 | ||||||||||||||||||||
| Substandard | — | — | 81 | 47 | 4,703 | 6,448 | — | — | 11,279 | ||||||||||||||||||||
| Total | $ | 97,271 | $ | 120,327 | $ | 122,656 | $ | 38,183 | $ | 75,096 | $ | 172,460 | $ | 2,653 | $ | — | $ | 628,646 | |||||||||||
| Commercial real estate non-owner occupied: | |||||||||||||||||||||||||||||
| Current period gross write-offs | $ | — | $ | — | $ | — | $ | — | $ | — | $ | 65 | $ | — | $ | — | $ | 65 | |||||||||||
| Risk rating | |||||||||||||||||||||||||||||
| Pass | $ | 404,687 | $ | 591,897 | $ | 385,247 | $ | 135,134 | $ | 277,870 | $ | 736,566 | $ | 4,553 | $ | — | $ | 2,535,954 | |||||||||||
| Special Mention | — | — | — | 229 | 19,465 | 726 | — | — | 20,420 | ||||||||||||||||||||
| Substandard | — | — | — | 6,814 | 13,483 | 29,738 | — | — | 50,035 | ||||||||||||||||||||
| Total | $ | 404,687 | $ | 591,897 | $ | 385,247 | $ | 142,177 | $ | 310,818 | $ | 767,030 | $ | 4,553 | $ | — | $ | 2,606,409 | |||||||||||
| Commercial and industrial: | |||||||||||||||||||||||||||||
| Current period gross write-offs | $ | — | $ | 1,154 | $ | 863 | $ | 2,763 | $ | 1,496 | $ | 9,283 | $ | 2,313 | $ | — | $ | 17,872 | |||||||||||
| Risk rating | |||||||||||||||||||||||||||||
| Pass | $ | 142,946 | $ | 203,126 | $ | 118,191 | $ | 69,722 | $ | 39,437 | $ | 112,770 | $ | 554,153 | $ | — | $ | 1,240,345 | |||||||||||
| Special Mention | 526 | 23,149 | 3,735 | 1,621 | 610 | 1,353 | 35,244 | — | 66,238 | ||||||||||||||||||||
| Substandard | 432 | 761 | 11,702 | 1,135 | 3,785 | 12,538 | 22,313 | — | 52,666 | ||||||||||||||||||||
| Total | $ | 143,904 | $ | 227,036 | $ | 133,628 | $ | 72,478 | $ | 43,832 | $ | 126,661 | $ | 611,710 | $ | — | $ | 1,359,249 | |||||||||||
| Construction | Single and multi-family | Real Estate | Total commercial real estate | |||||||||||||||||||||||||||||
| (In thousands) | 2017 | 2016 | 2017 | 2016 | 2017 | 2016 | 2017 | 2016 | ||||||||||||||||||||||||
| Grade: | ||||||||||||||||||||||||||||||||
| Pass | $ | 181,371 | $ | 253,302 | $ | 214,289 | $ | 189,310 | $ | 1,775,091 | $ | 1,434,762 | $ | 2,170,751 | $ | 1,877,374 | ||||||||||||||||
| Special mention | — | — | 504 | 334 | 12,999 | 5,827 | 13,503 | 6,161 | ||||||||||||||||||||||||
| Substandard | — | — | 2,290 | 2,175 | 31,163 | 40,598 | 33,453 | 42,773 | ||||||||||||||||||||||||
| Doubtful | — | — | — | — | — | 36 | — | 36 | ||||||||||||||||||||||||
| Total | $ | 181,371 | $ | 253,302 | $ | 217,083 | $ | 191,819 | $ | 1,819,253 | $ | 1,481,223 | $ | 2,217,707 | $ | 1,926,344 | ||||||||||||||||
| Total comm. and industrial | |||||||||
| (In thousands) | 2017 | 2016 | |||||||
| Grade: | |||||||||
| Pass | $ | 1,156,240 | $ | 890,974 | |||||
| Special mention | 12,806 | 123 | |||||||
| Substandard | 11,123 | 13,825 | |||||||
| Doubtful | 2,400 | 3,180 | |||||||
| Total | $ | 1,182,569 | $ | 908,102 | |||||
| 1-4 family | Construction | Total residential mortgages | ||||||||||||||||||||||
| (In thousands) | 2017 | 2016 | 2017 | 2016 | 2017 | 2016 | ||||||||||||||||||
| Grade: | ||||||||||||||||||||||||
| Pass | $ | 1,805,596 | $ | 1,578,913 | $ | 5,177 | $ | 11,178 | $ | 1,810,773 | $ | 1,590,091 | ||||||||||||
| Special mention | 242 | 701 | — | — | 242 | 701 | ||||||||||||||||||
| Substandard | 2,186 | 4,179 | — | — | 2,186 | 4,179 | ||||||||||||||||||
| Total | $ | 1,808,024 | $ | 1,583,793 | $ | 5,177 | $ | 11,178 | $ | 1,813,201 | $ | 1,594,971 | ||||||||||||
| Home equity | Auto and other | Total consumer | ||||||||||||||||||||||
| (In thousands) | 2017 | 2016 | 2017 | 2016 | 2017 | 2016 | ||||||||||||||||||
| Performing | $ | 293,327 | $ | 310,846 | $ | 602,313 | $ | 477,416 | $ | 895,640 | $ | 788,262 | ||||||||||||
| Nonperforming | 1,627 | 2,675 | 1,454 | 952 | 3,081 | 3,627 | ||||||||||||||||||
| Total | $ | 294,954 | $ | 313,521 | $ | 603,767 | $ | 478,368 | $ | 898,721 | $ | 791,889 | ||||||||||||
| Term Loans Amortized Cost Basis by Origination Year | |||||||||||||||||||||||||||||
| (In thousands) | 2023 | 2022 | 2021 | 2020 | 2019 | Prior | Revolving Loans Amortized Cost Basis | Revolving Loans Converted to Term | Total | ||||||||||||||||||||
| Residential real estate | |||||||||||||||||||||||||||||
| Current period gross write-offs | $ | — | $ | 50 | $ | — | $ | 50 | $ | 174 | $ | 39 | $ | — | $ | — | $ | 313 | |||||||||||
| Risk rating | |||||||||||||||||||||||||||||
| Pass | $ | 599,124 | $ | 973,031 | $ | 266,055 | $ | 88,302 | $ | 66,837 | $ | 755,372 | $ | 81 | $ | — | $ | 2,748,802 | |||||||||||
| Special Mention | — | — | — | — | 140 | 664 | — | — | 804 | ||||||||||||||||||||
| Substandard | — | 129 | 1,176 | 379 | 574 | 8,448 | — | — | 10,706 | ||||||||||||||||||||
| Total | $ | 599,124 | $ | 973,160 | $ | 267,231 | $ | 88,681 | $ | 67,551 | $ | 764,484 | $ | 81 | $ | — | $ | 2,760,312 | |||||||||||
| Construction | Single and multi-family | Real Estate | Total commercial real estate | |||||||||||||||||||||||||||||
| (In thousands) | 2017 | 2016 | 2017 | 2016 | 2017 | 2016 | 2017 | 2016 | ||||||||||||||||||||||||
| Grade: | ||||||||||||||||||||||||||||||||
| Pass | $ | 76,611 | $ | 33,461 | $ | 203,624 | $ | 119,414 | $ | 684,846 | $ | 496,562 | $ | 965,081 | $ | 649,437 | ||||||||||||||||
| Special mention | — | — | 603 | 907 | 22,070 | 1,622 | 22,673 | 2,529 | ||||||||||||||||||||||||
| Substandard | 8,354 | 746 | 1,855 | 5,351 | 49,072 | 32,031 | 59,281 | 38,128 | ||||||||||||||||||||||||
| Total | $ | 84,965 | $ | 34,207 | $ | 206,082 | $ | 125,672 | $ | 755,988 | $ | 530,215 | $ | 1,047,035 | $ | 690,094 | ||||||||||||||||
| Total comm. and industrial | |||||||||
| (In thousands) | 2017 | 2016 | |||||||
| Grade: | |||||||||
| Pass | $ | 606,922 | $ | 147,102 | |||||
| Special mention | 1,241 | 1,260 | |||||||
| Substandard | 13,207 | 5,574 | |||||||
| Total | $ | 621,370 | $ | 153,936 | |||||
| 1-4 family | Construction | Total residential mortgages | ||||||||||||||||||||||
| (In thousands) | 2017 | 2016 | 2017 | 2016 | 2017 | 2016 | ||||||||||||||||||
| Grade: | ||||||||||||||||||||||||
| Pass | $ | 281,160 | $ | 294,983 | $ | 233 | $ | 804 | $ | 281,393 | $ | 295,787 | ||||||||||||
| Special mention | 2,704 | 343 | — | — | 2,704 | 343 | ||||||||||||||||||
| Substandard | 5,509 | 2,029 | — | — | 5,509 | 2,029 | ||||||||||||||||||
| Total | $ | 289,373 | $ | 297,355 | $ | 233 | $ | 804 | $ | 289,606 | $ | 298,159 | ||||||||||||
| Home equity | Auto and other | Total consumer | ||||||||||||||||||||||
| (In thousands) | 2017 | 2016 | 2017 | 2016 | 2017 | 2016 | ||||||||||||||||||
| Performing | $ | 113,262 | $ | 79,762 | $ | 113,510 | $ | 105,117 | $ | 226,772 | $ | 184,879 | ||||||||||||
| Nonperforming | 1,965 | 517 | 392 | 895 | 2,357 | 1,412 | ||||||||||||||||||
| Total | $ | 115,227 | $ | 80,279 | $ | 113,902 | $ | 106,012 | $ | 229,129 | $ | 186,291 | ||||||||||||
| Term Loans Amortized Cost Basis by Origination Year | |||||||||||||||||||||||||||||
| (In thousands) | 2022 | 2021 | 2020 | 2019 | 2018 | Prior | Revolving Loans Amortized Cost Basis | Revolving Loans Converted to Term | Total | ||||||||||||||||||||
| As of December 31, 2022 | |||||||||||||||||||||||||||||
| Construction | |||||||||||||||||||||||||||||
| Risk rating | |||||||||||||||||||||||||||||
| Pass | $ | 153,393 | $ | 133,708 | $ | 25,634 | $ | 3,432 | $ | 1,361 | $ | 1,924 | $ | — | $ | — | $ | 319,452 | |||||||||||
| Special Mention | — | — | — | — | — | — | — | — | — | ||||||||||||||||||||
| Substandard | — | — | — | — | — | — | — | — | — | ||||||||||||||||||||
| Total | $ | 153,393 | $ | 133,708 | $ | 25,634 | $ | 3,432 | $ | 1,361 | $ | 1,924 | $ | — | $ | — | $ | 319,452 | |||||||||||
| Commercial multifamily: | |||||||||||||||||||||||||||||
| Risk rating | |||||||||||||||||||||||||||||
| Pass | $ | 205,124 | $ | 61,032 | $ | 27,583 | $ | 100,696 | $ | 67,675 | $ | 149,633 | $ | 205 | $ | — | $ | 611,948 | |||||||||||
| Special Mention | — | — | 2,628 | — | — | — | — | — | 2,628 | ||||||||||||||||||||
| Substandard | — | — | — | — | 5,512 | — | — | — | 5,512 | ||||||||||||||||||||
| Total | $ | 205,124 | $ | 61,032 | $ | 30,211 | $ | 100,696 | $ | 73,187 | $ | 149,633 | $ | 205 | $ | — | $ | 620,088 | |||||||||||
| Commercial real estate owner occupied: | |||||||||||||||||||||||||||||
| Risk rating | |||||||||||||||||||||||||||||
| Pass | $ | 131,096 | $ | 127,270 | $ | 58,835 | $ | 82,576 | $ | 75,322 | $ | 154,056 | $ | 3,464 | $ | — | $ | 632,619 | |||||||||||
| Special Mention | — | — | 387 | — | — | — | — | — | 387 | ||||||||||||||||||||
| Substandard | 1,003 | 122 | 31 | 282 | 1,056 | 4,989 | — | — | 7,483 | ||||||||||||||||||||
| Total | $ | 132,099 | $ | 127,392 | $ | 59,253 | $ | 82,858 | $ | 76,378 | $ | 159,045 | $ | 3,464 | $ | — | $ | 640,489 | |||||||||||
| Commercial real estate non-owner occupied: | |||||||||||||||||||||||||||||
| Risk rating | |||||||||||||||||||||||||||||
| Pass | $ | 621,685 | $ | 410,359 | $ | 175,456 | $ | 333,783 | $ | 313,124 | $ | 530,322 | $ | 17,846 | $ | — | $ | 2,402,575 | |||||||||||
| Special Mention | — | — | — | — | 20,000 | 18,462 | — | — | 38,462 | ||||||||||||||||||||
| Substandard | — | — | 7,237 | 13,623 | 15,610 | 18,730 | — | — | 55,200 | ||||||||||||||||||||
| Total | $ | 621,685 | $ | 410,359 | $ | 182,693 | $ | 347,406 | $ | 348,734 | $ | 567,514 | $ | 17,846 | $ | — | $ | 2,496,237 | |||||||||||
| Commercial and industrial: | |||||||||||||||||||||||||||||
| Risk rating | |||||||||||||||||||||||||||||
| Pass | $ | 282,781 | $ | 147,070 | $ | 56,880 | $ | 67,975 | $ | 83,223 | $ | 99,367 | $ | 648,956 | $ | — | $ | 1,386,252 | |||||||||||
| Special Mention | — | 5,811 | 1,290 | 1,332 | 11,502 | 912 | 2,632 | — | 23,479 | ||||||||||||||||||||
| Substandard | 204 | 496 | 3,640 | 8,139 | 1,981 | 2,799 | 10,581 | — | 27,840 | ||||||||||||||||||||
| Doubtful | — | — | — | — | — | 56 | 7,609 | — | 7,665 | ||||||||||||||||||||
| Total | $ | 282,985 | $ | 153,377 | $ | 61,810 | $ | 77,446 | $ | 96,706 | $ | 103,134 | $ | 669,778 | $ | — | $ | 1,445,236 | |||||||||||
| Residential real estate | |||||||||||||||||||||||||||||
| Risk rating | |||||||||||||||||||||||||||||
| Pass | $ | 997,981 | $ | 280,308 | $ | 96,548 | $ | 70,845 | $ | 138,894 | $ | 713,744 | $ | 165 | $ | — | $ | 2,298,485 | |||||||||||
| Special Mention | — | 364 | — | 861 | 202 | 707 | — | — | 2,134 | ||||||||||||||||||||
| Substandard | — | 284 | 448 | 267 | 1,857 | 8,972 | — | — | 11,828 | ||||||||||||||||||||
| Total | $ | 997,981 | $ | 280,956 | $ | 96,996 | $ | 71,973 | $ | 140,953 | $ | 723,423 | $ | 165 | $ | — | $ | 2,312,447 | |||||||||||
| Term Loans Amortized Cost Basis by Origination Year | |||||||||||||||||||||||||||||
| (In thousands) | 2023 | 2022 | 2021 | 2020 | 2019 | Prior | Revolving Loans Amortized Cost Basis | Revolving Loans Converted to Term | Total | ||||||||||||||||||||
| As of December 31, 2023 | |||||||||||||||||||||||||||||
| Home equity: | |||||||||||||||||||||||||||||
| Current period gross write-offs | $ | — | $ | — | $ | — | $ | 70 | $ | — | $ | — | $ | 18 | $ | — | $ | 88 | |||||||||||
| Payment performance | |||||||||||||||||||||||||||||
| Performing | $ | — | $ | — | $ | — | $ | 439 | $ | — | $ | 2,614 | $ | 220,209 | $ | — | $ | 223,262 | |||||||||||
| Nonperforming | — | — | — | — | — | — | 961 | — | 961 | ||||||||||||||||||||
| Total | $ | — | $ | — | $ | — | $ | 439 | $ | — | $ | 2,614 | $ | 221,170 | $ | — | $ | 224,223 | |||||||||||
| Consumer other: | |||||||||||||||||||||||||||||
| Current period gross write-offs | $ | 109 | $ | 8,843 | $ | 1,149 | $ | 11 | $ | 78 | $ | 239 | $ | — | $ | — | $ | 10,429 | |||||||||||
| Payment performance | |||||||||||||||||||||||||||||
| Performing | $ | 49,588 | $ | 108,284 | $ | 19,679 | $ | 5,843 | $ | 7,054 | $ | 19,587 | $ | 10,614 | $ | — | $ | 220,649 | |||||||||||
| Nonperforming | 77 | 104 | 47 | 26 | 110 | 284 | 34 | — | 682 | ||||||||||||||||||||
| Total | $ | 49,665 | $ | 108,388 | $ | 19,726 | $ | 5,869 | $ | 7,164 | $ | 19,871 | $ | 10,648 | $ | — | $ | 221,331 | |||||||||||
| Term Loans Amortized Cost Basis by Origination Year | |||||||||||||||||||||||||||||
| (In thousands) | 2022 | 2021 | 2020 | 2019 | 2018 | Prior | Revolving Loans Amortized Cost Basis | Revolving Loans Converted to Term | Total | ||||||||||||||||||||
| As of December 31, 2022 | |||||||||||||||||||||||||||||
| Home equity: | |||||||||||||||||||||||||||||
| Payment performance | |||||||||||||||||||||||||||||
| Performing | $ | — | $ | 114 | $ | 454 | $ | — | $ | — | $ | 17 | $ | 224,746 | $ | — | $ | 225,331 | |||||||||||
| Nonperforming | — | — | — | — | — | — | 2,119 | — | 2,119 | ||||||||||||||||||||
| Total | $ | — | $ | 114 | $ | 454 | $ | — | $ | — | $ | 17 | $ | 226,865 | $ | — | $ | 227,450 | |||||||||||
| Consumer other: | |||||||||||||||||||||||||||||
| Payment performance | |||||||||||||||||||||||||||||
| Performing | $ | 161,157 | $ | 28,279 | $ | 8,312 | $ | 12,670 | $ | 27,608 | $ | 24,682 | $ | 9,070 | $ | — | $ | 271,778 | |||||||||||
| Nonperforming | 588 | 137 | 44 | 280 | 477 | 567 | 39 | — | 2,132 | ||||||||||||||||||||
| Total | $ | 161,745 | $ | 28,416 | $ | 8,356 | $ | 12,950 | $ | 28,085 | $ | 25,249 | $ | 9,109 | $ | — | $ | 273,910 | |||||||||||
| (In thousands) | December 31, 2023 | December 31, 2022 | ||||||||||||
| Nonaccrual | $ | 21,407 | $ | 31,114 | ||||||||||
| Substandard Accruing | 131,689 | 88,665 | ||||||||||||
| Total Classified | 153,096 | 119,779 | ||||||||||||
| Special Mention | 91,502 | 68,127 | ||||||||||||
| Total Criticized | $ | 244,598 | $ | 187,906 | ||||||||||
| (In thousands) | 30-59 Days Past Due | 60-89 Days Past Due | 90 Days or Greater Past Due | Total Past Due | Current | Total Loans | ||||||||||||||||||||||||||||||||
| December 31, 2023 | ||||||||||||||||||||||||||||||||||||||
| Construction | $ | — | $ | — | $ | — | $ | — | $ | 640,371 | $ | 640,371 | ||||||||||||||||||||||||||
| Commercial multifamily | 5,436 | 187 | — | 5,623 | 593,522 | 599,145 | ||||||||||||||||||||||||||||||||
| Commercial real estate owner occupied | 581 | 286 | 804 | 1,671 | 626,975 | 628,646 | ||||||||||||||||||||||||||||||||
| Commercial real estate non-owner occupied | 139 | 251 | 3,798 | 4,188 | 2,602,221 | 2,606,409 | ||||||||||||||||||||||||||||||||
| Commercial and industrial | 2,749 | 689 | 8,769 | 12,207 | 1,347,042 | 1,359,249 | ||||||||||||||||||||||||||||||||
| Residential real estate | 5,669 | 943 | 10,687 | 17,299 | 2,743,013 | 2,760,312 | ||||||||||||||||||||||||||||||||
| Home equity | 707 | 498 | 1,281 | 2,486 | 221,737 | 224,223 | ||||||||||||||||||||||||||||||||
| Consumer other | 2,363 | 1,642 | 1,606 | 5,611 | 215,720 | 221,331 | ||||||||||||||||||||||||||||||||
| Total | $ | 17,644 | $ | 4,496 | $ | 26,945 | $ | 49,085 | $ | 8,990,601 | $ | 9,039,686 | ||||||||||||||||||||||||||
| (In thousands) | 30-59 Days Past Due | 60-89 Days Past Due | 90 Days or Greater Past Due | Total Past Due | Current | Total Loans | ||||||||||||||||||||||||||||||||
| December 31, 2022 | ||||||||||||||||||||||||||||||||||||||
| Construction | $ | — | $ | — | $ | — | $ | — | $ | 319,452 | $ | 319,452 | ||||||||||||||||||||||||||
| Commercial multifamily | — | 214 | — | 214 | 619,874 | 620,088 | ||||||||||||||||||||||||||||||||
| Commercial real estate owner occupied | 122 | — | 3,302 | 3,424 | 637,065 | 640,489 | ||||||||||||||||||||||||||||||||
| Commercial real estate non-owner occupied | 143 | — | 191 | 334 | 2,495,903 | 2,496,237 | ||||||||||||||||||||||||||||||||
| Commercial and industrial | 1,173 | 1,438 | 18,658 | 21,269 | 1,423,967 | 1,445,236 | ||||||||||||||||||||||||||||||||
| Residential real estate | 3,694 | 2,134 | 11,724 | 17,552 | 2,294,895 | 2,312,447 | ||||||||||||||||||||||||||||||||
| Home equity | 168 | 57 | 2,119 | 2,344 | 225,106 | 227,450 | ||||||||||||||||||||||||||||||||
| Consumer other | 1,990 | 1,028 | 2,158 | 5,176 | 268,734 | 273,910 | ||||||||||||||||||||||||||||||||
| Total | $ | 7,290 | $ | 4,871 | $ | 38,152 | $ | 50,313 | $ | 8,284,996 | $ | 8,335,309 | ||||||||||||||||||||||||||
| December 31, 2017 | December 31, 2016 | |||||||||||||||||||||||
| (In thousands) | Business Activities Loans | Acquired Loans | Total | Business Activities Loans | Acquired Loans | Total | ||||||||||||||||||
| Non-Accrual | $ | 15,659 | $ | 7,240 | $ | 22,899 | $ | 16,816 | $ | 5,424 | $ | 22,240 | ||||||||||||
| Substandard Accruing | 36,846 | 73,412 | 110,258 | 51,125 | 44,177 | 95,302 | ||||||||||||||||||
| Total Classified | 52,505 | 80,652 | 133,157 | 67,941 | 49,601 | 117,542 | ||||||||||||||||||
| Special Mention | 28,387 | 26,802 | 55,189 | 7,479 | 4,323 | 11,802 | ||||||||||||||||||
| Total Criticized | $ | 80,892 | $ | 107,454 | $ | 188,346 | $ | 75,420 | $ | 53,924 | $ | 129,344 | ||||||||||||
| December 31, 2023 | ||||||||||||||||||||||||||||||||
| (In thousands) | Nonaccrual Amortized Cost | Nonaccrual With No Related Allowance | Past Due 90 Days or Greater and Accruing | Interest Income Recognized on Nonaccrual | ||||||||||||||||||||||||||||
| Construction | $ | — | $ | — | $ | — | $ | — | ||||||||||||||||||||||||
| Commercial multifamily | — | — | — | — | ||||||||||||||||||||||||||||
| Commercial real estate owner occupied | 605 | 285 | 199 | — | ||||||||||||||||||||||||||||
| Commercial real estate non-owner occupied | 3,798 | 45 | — | — | ||||||||||||||||||||||||||||
| Commercial and industrial | 8,665 | 5,586 | 104 | — | ||||||||||||||||||||||||||||
| Residential real estate | 6,696 | 2,796 | 3,991 | — | ||||||||||||||||||||||||||||
| Home equity | 961 | 122 | 320 | — | ||||||||||||||||||||||||||||
| Consumer other | 682 | — | 924 | — | ||||||||||||||||||||||||||||
| Total | $ | 21,407 | $ | 8,834 | $ | 5,538 | $ | — | ||||||||||||||||||||||||
| December 31, 2022 | ||||||||||||||||||||||||||||||||
| (In thousands) | Nonaccrual Amortized Cost | Nonaccrual With No Related Allowance | Past Due 90 Days or Greater and Accruing | Interest Income Recognized on Nonaccrual | ||||||||||||||||||||||||||||
| Construction | $ | — | $ | — | $ | — | $ | — | ||||||||||||||||||||||||
| Commercial multifamily | — | — | — | — | ||||||||||||||||||||||||||||
| Commercial real estate owner occupied | 2,202 | 1,411 | 1,100 | — | ||||||||||||||||||||||||||||
| Commercial real estate non-owner occupied | 191 | 73 | — | — | ||||||||||||||||||||||||||||
| Commercial and industrial | 16,992 | 14,223 | 1,666 | — | ||||||||||||||||||||||||||||
| Residential real estate | 8,901 | 5,307 | 2,823 | — | ||||||||||||||||||||||||||||
| Home equity | 1,568 | 388 | 551 | — | ||||||||||||||||||||||||||||
| Consumer other | 1,260 | 2 | 898 | — | ||||||||||||||||||||||||||||
| Total | $ | 31,114 | $ | 21,404 | $ | 7,038 | $ | — | ||||||||||||||||||||||||
| Type of Collateral | ||||||||||||||||||||||||||||||||
| (In thousands) | Real Estate | Investment Securities/Cash | Other | |||||||||||||||||||||||||||||
| December 31, 2023 | ||||||||||||||||||||||||||||||||
| Construction | $ | — | $ | — | $ | — | ||||||||||||||||||||||||||
| Commercial multifamily | — | — | — | |||||||||||||||||||||||||||||
| Commercial real estate owner occupied | 650 | — | — | |||||||||||||||||||||||||||||
| Commercial real estate non-owner occupied | 342 | — | — | |||||||||||||||||||||||||||||
| Commercial and industrial | 4,788 | — | 944 | |||||||||||||||||||||||||||||
| Residential real estate | 5,035 | — | — | |||||||||||||||||||||||||||||
| Home equity | 135 | — | — | |||||||||||||||||||||||||||||
| Consumer other | 40 | — | — | |||||||||||||||||||||||||||||
| Total loans | $ | 10,990 | $ | — | $ | 944 | ||||||||||||||||||||||||||
| Type of Collateral | ||||||||||||||||||||||||||||||||
| (In thousands) | Real Estate | Investment Securities/Cash | Other | |||||||||||||||||||||||||||||
| December 31, 2022 | ||||||||||||||||||||||||||||||||
| Construction | $ | — | $ | — | $ | — | ||||||||||||||||||||||||||
| Commercial multifamily | — | — | — | |||||||||||||||||||||||||||||
| Commercial real estate owner occupied | 2,793 | — | — | |||||||||||||||||||||||||||||
| Commercial real estate non-owner occupied | 384 | — | — | |||||||||||||||||||||||||||||
| Commercial and industrial | 288 | — | 16,931 | |||||||||||||||||||||||||||||
| Residential real estate | 3,910 | — | — | |||||||||||||||||||||||||||||
| Home equity | 501 | — | — | |||||||||||||||||||||||||||||
| Consumer other | 2 | — | — | |||||||||||||||||||||||||||||
| Total loans | $ | 7,878 | $ | — | $ | 16,931 | ||||||||||||||||||||||||||
| (In thousands) | Principal Forgiveness | Payment Delay | Term Extension | Interest Rate Reduction | Combination Term Extension and Principal Forgiveness | Combination Term Extension and Interest Rate Reduction | Total Class of Financing Receivable | |||||||||||||||||||||||||||||||||||||
| Year ended December 31, 2023 | ||||||||||||||||||||||||||||||||||||||||||||
| Construction | $ | — | $ | — | $ | — | $ | — | $ | — | $ | — | — | % | ||||||||||||||||||||||||||||||
| Commercial multifamily | — | — | — | — | — | — | — | |||||||||||||||||||||||||||||||||||||
| Commercial real estate owner occupied | — | — | 222 | — | — | — | 0.04 | |||||||||||||||||||||||||||||||||||||
| Commercial real estate non-owner occupied | — | — | 11,454 | — | — | 3,600 | 0.58 | |||||||||||||||||||||||||||||||||||||
| Commercial and industrial | — | 34 | 16,005 | — | — | 9 | 1.18 | % | ||||||||||||||||||||||||||||||||||||
| Residential real estate | — | — | — | — | — | — | — | |||||||||||||||||||||||||||||||||||||
| Home equity | — | — | — | — | — | — | — | |||||||||||||||||||||||||||||||||||||
| Consumer other | — | — | — | — | — | — | — | |||||||||||||||||||||||||||||||||||||
| Total | $ | — | $ | 34 | $ | 27,681 | $ | — | $ | — | $ | 3,609 | 0.35 | % | ||||||||||||||||||||||||||||||
| (In thousands) | 30 - 59 Days Past Due | 60 - 89 Days Past Due | Greater Than 89 Days Past Due | Total Past Due | ||||||||||||||||||||||
| December 31, 2023 | ||||||||||||||||||||||||||
| Construction | $ | — | $ | — | $ | — | $ | — | ||||||||||||||||||
| Commercial multifamily | — | — | — | — | ||||||||||||||||||||||
| Commercial real estate owner occupied | — | — | — | — | ||||||||||||||||||||||
| Commercial real estate non-owner occupied | — | — | — | — | ||||||||||||||||||||||
| Commercial and industrial | 34 | — | — | 34 | ||||||||||||||||||||||
| Residential real estate | — | — | — | — | ||||||||||||||||||||||
| Home equity | — | — | — | — | ||||||||||||||||||||||
| Consumer other | — | — | — | — | ||||||||||||||||||||||
| Total | $ | 34 | $ | — | $ | — | $ | 34 | ||||||||||||||||||
| (In thousands) | Principal Forgiveness | Weighted Average Interest Rate Reduction | Weighted Average Term Extension (months) | ||||||||||||||
| Years ended December 31, 2023 | |||||||||||||||||
| Construction | $ | — | — | % | 0 | ||||||||||||
| Commercial multifamily | — | — | 0 | ||||||||||||||
| Commercial real estate owner occupied | — | — | 120 | ||||||||||||||
| Commercial real estate non-owner occupied | — | 0.05 | 16 | ||||||||||||||
| Commercial and industrial | — | 1.25 | 23 | ||||||||||||||
| Residential real estate | — | — | 0 | ||||||||||||||
| Home equity | — | — | 0 | ||||||||||||||
| Consumer other | — | — | 0 | ||||||||||||||
| (In thousands) | 2017 | 2016 | Estimated Useful Life | (In thousands) | 2023 | 2022 | Estimated Useful Life | |||||||||||||||||||||||||||||||||||
| Land | $ | 14,177 | $ | 10,563 | N/A | Land | $ | 12,525 | $ | $ | 15,536 | N/A | N/A | |||||||||||||||||||||||||||||
| Buildings and improvements | 99,821 | 85,319 | 5 - 39 years | Buildings and improvements | 89,222 | 99,977 | 99,977 | 5 - 39 years | 5 - 39 years | |||||||||||||||||||||||||||||||||
| Furniture and equipment | 49,600 | 42,693 | 3 - 7 years | Furniture and equipment | 64,290 | 63,554 | 63,554 | 3 - 7 years | 3 - 7 years | |||||||||||||||||||||||||||||||||
| Construction in process | 5,177 | 4,084 | Construction in process | 327 | 1,147 | 1,147 | ||||||||||||||||||||||||||||||||||||
| Premises and equipment, gross | 168,775 | 142,659 | Premises and equipment, gross | 166,364 | 180,214 | 180,214 | ||||||||||||||||||||||||||||||||||||
| Accumulated depreciation and amortization | (59,423 | ) | (49,444 | ) | Accumulated depreciation and amortization | (97,449) | (94,997) | (94,997) | ||||||||||||||||||||||||||||||||||
| Premises and equipment, net | $ | 109,352 | $ | 93,215 | ||||||||||||||||||||||||||||||||||||||
| Premises and equipment, net | ||||||||||||||||||||||||||||||||||||||||||
| Premises and equipment, net | $ | 68,915 | $ | 85,217 | ||||||||||||||||||||||||||||||||||||||
| (In thousands) | 2017 | 2016 | ||||||
| Balance, beginning of the period | $ | 403,106 | $ | 323,943 | ||||
| Goodwill acquired and adjusted: | ||||||||
| Commerce Bank | 116,181 | — | ||||||
| 44 Business Capital | — | 15,892 | ||||||
| Ronald N. Lazzaro, PC | — | 5,492 | ||||||
| First Choice Bank | — | 58,036 | ||||||
| Adjustments (1) | — | (257 | ) | |||||
| Balance, end of the period | $ | 519,287 | $ | 403,106 | ||||
| (In thousands) | Gross Intangible Assets | Accumulated Amortization | Net Intangible Assets | |||||||||||||||||
| December 31, 2023 | ||||||||||||||||||||
| Non-maturity deposits (core deposit intangible) | $ | 77,213 | $ | (58,965) | $ | 18,248 | ||||||||||||||
| All other intangible assets | 7,866 | (6,450) | 1,416 | |||||||||||||||||
| Total | $ | 85,079 | $ | (65,415) | $ | 19,664 | ||||||||||||||
| December 31, 2022 | ||||||||||||||||||||
| Non-maturity deposits (core deposit intangible) | $ | 77,213 | $ | (54,618) | $ | 22,595 | ||||||||||||||
| All other intangible assets | 7,866 | (5,978) | 1,888 | |||||||||||||||||
| Total | $ | 85,079 | $ | (60,596) | $ | 24,483 | ||||||||||||||
| (In thousands) | Gross Intangible Assets | Accumulated Amortization | Net Intangible Assets | |||||||||
| December 31, 2017 | ||||||||||||
| Non-maturity deposits (core deposit intangible) | $ | 66,923 | $ | (33,024 | ) | $ | 33,899 | |||||
| Insurance contracts | 7,558 | (7,526 | ) | 32 | ||||||||
| All other intangible assets | 7,810 | (3,445 | ) | 4,365 | ||||||||
| Total | $ | 82,291 | $ | (43,995 | ) | $ | 38,296 | |||||
| December 31, 2016 | ||||||||||||
| Non-maturity deposits (core deposit intangible) | $ | 44,523 | $ | (30,099 | ) | $ | 14,424 | |||||
| Insurance contracts | 7,558 | (7,504 | ) | 54 | ||||||||
| All other intangible assets | 7,866 | (2,899 | ) | 4,967 | ||||||||
| Total | $ | 59,947 | $ | (40,502 | ) | $ | 19,445 | |||||
| (In thousands) | 2023 | 2022 | ||||||||||||
| Capitalized servicing rights | $ | 12,095 | $ | 13,047 | ||||||||||
| Accrued interest receivable | 53,096 | 46,868 | ||||||||||||
| Accrued federal and state tax receivable | 33,564 | 34,386 | ||||||||||||
| Right-of-use assets | 47,348 | 46,411 | ||||||||||||
| Derivative assets | 45,668 | 54,241 | ||||||||||||
| Deferred tax asset | 110,068 | 118,331 | ||||||||||||
| Other | 39,918 | 35,651 | ||||||||||||
| Total other assets | $ | 341,757 | $ | 348,935 | ||||||||||
| (In thousands) | 2017 | 2016 | ||||||
| Capitalized servicing rights | $ | 16,361 | $ | 11,524 | ||||
| Accrued interest receivable | 33,739 | 26,113 | ||||||
| Accrued federal and state tax receivable (1) | 33,101 | 19,076 | ||||||
| Derivative assets | 19,308 | 21,617 | ||||||
| Assets held for sale | 1,392 | — | ||||||
| Other | 13,182 | 20,127 | ||||||
| Total other assets | $ | 117,083 | $ | 98,457 | ||||
| (In thousands) | 2023 | 2022 | 2021 | |||||||||||||||||
| Balance at beginning of year | $ | 13,047 | $ | 16,022 | $ | 16,348 | ||||||||||||||
| Additions | 2,892 | 3,119 | 4,568 | |||||||||||||||||
| Amortization | (4,330) | (4,590) | (4,921) | |||||||||||||||||
| Payoffs | (952) | (958) | — | |||||||||||||||||
| Allowance adjustment | 1,438 | (546) | 27 | |||||||||||||||||
| Balance at end of year | $ | 12,095 | $ | 13,047 | $ | 16,022 | ||||||||||||||
| (In thousands) | 2017 | 2016 | ||||||
| Balance at beginning of year | $ | 11,524 | $ | 5,187 | ||||
| Acquired from 44 Business Capital | — | 3,489 | ||||||
| Acquired from First Choice Bank (1) | — | 696 | ||||||
| Additions | 7,604 | 4,116 | ||||||
| Amortization | (2,446 | ) | (1,964 | ) | ||||
| Change in fair value | (221 | ) | — | |||||
| Allowance adjustment | (100 | ) | — | |||||
| Balance at end of year | $ | 16,361 | $ | 11,524 | ||||
| (In thousands) | 2017 | 2016 | (In thousands) | 2023 | 2022 | |||||||||||||||||||||||
| Maturity date: | Maturity date: | |||||||||||||||||||||||||||
| Within 1 year | $ | 1,790,056 | $ | 1,316,973 | ||||||||||||||||||||||||
| Over 1 year to 2 years | 546,381 | 582,764 | ||||||||||||||||||||||||||
| Over 2 years to 3 years | 268,897 | 142,160 | ||||||||||||||||||||||||||
| Over 3 years to 4 years | 161,314 | 150,388 | ||||||||||||||||||||||||||
| Over 4 years to 5 years | 121,400 | 137,845 | ||||||||||||||||||||||||||
| Over 5 years | 2,157 | 3,413 | ||||||||||||||||||||||||||
| Total | $ | 2,890,205 | $ | 2,333,543 | ||||||||||||||||||||||||
| Account balances: | Account balances: | |||||||||||||||||||||||||||
| Less than $100,000 | $ | 733,785 | $ | 656,055 | ||||||||||||||||||||||||
| $100,000 or more | 2,156,420 | 1,677,488 | ||||||||||||||||||||||||||
| $100,000 through $250,000 | ||||||||||||||||||||||||||||
| $250,000 or more | ||||||||||||||||||||||||||||
| Total | $ | 2,890,205 | $ | 2,333,543 | ||||||||||||||||||||||||
| 2017 | 2016 | 2023 | 2022 | |||||||||||||||||||||||||||||||||||||||||||||||||||
| (in thousands, except rates) | Principal | Weighted Average Rate | Principal | Weighted Average Rate | (in thousands, except rates) | Principal | Weighted Average Rate | Principal | Weighted Average Rate | |||||||||||||||||||||||||||||||||||||||||||||
| Short-term borrowings: | Short-term borrowings: | |||||||||||||||||||||||||||||||||||||||||||||||||||||
| Advances from the FHLBB | $ | 667,300 | 1.48 | % | $ | 1,072,044 | 0.71 | % | Advances from the FHLBB | $ | 260,000 | 5.54 | 5.54 | % | $ | — | — | — | % | |||||||||||||||||||||||||||||||||||
| Other Borrowings | — | — | 10,000 | 2.42 | ||||||||||||||||||||||||||||||||||||||||||||||||||
| Total short-term borrowings: | ||||||||||||||||||||||||||||||||||||||||||||||||||||||
| Total short-term borrowings: | ||||||||||||||||||||||||||||||||||||||||||||||||||||||
| Total short-term borrowings: | 667,300 | 1.48 | 1,082,044 | 0.72 | ||||||||||||||||||||||||||||||||||||||||||||||||||
| Long-term borrowings: | Long-term borrowings: | |||||||||||||||||||||||||||||||||||||||||||||||||||||
| Advances from the FHLBB | 380,436 | 1.54 | 142,792 | 1.53 | ||||||||||||||||||||||||||||||||||||||||||||||||||
| Subordinated notes | 73,875 | 7.00 | 73,697 | 7.00 | ||||||||||||||||||||||||||||||||||||||||||||||||||
| Junior subordinated notes | 15,464 | 3.30 | 15,464 | 2.77 | ||||||||||||||||||||||||||||||||||||||||||||||||||
| Subordinated notes | ||||||||||||||||||||||||||||||||||||||||||||||||||||||
| Subordinated notes | ||||||||||||||||||||||||||||||||||||||||||||||||||||||
| Junior subordinated borrowing - Trust I | ||||||||||||||||||||||||||||||||||||||||||||||||||||||
| Junior subordinated borrowing - Trust II | ||||||||||||||||||||||||||||||||||||||||||||||||||||||
| Total long-term borrowings: | 469,775 | 2.46 | 231,953 | 3.35 | ||||||||||||||||||||||||||||||||||||||||||||||||||
| Total | $ | 1,137,075 | 1.88 | % | $ | 1,313,997 | 1.19 | % | Total | $ | 506,586 | 5.44 | 5.44 | % | $ | 125,509 | 5.52 | 5.52 | % | |||||||||||||||||||||||||||||||||||
| 2023 | ||||||||||||||
| (In thousands) | Amount | Weighted Average Rate | ||||||||||||
| Fixed rate advances maturing: | ||||||||||||||
| 2024 | $ | 290,010 | 5.48 | % | ||||||||||
| 2025 | 90,000 | 5.01 | ||||||||||||
| 2026 | 521 | 2.20 | ||||||||||||
| 2027 | 158 | 2.00 | ||||||||||||
| 2028 and beyond | 4,534 | 0.34 | ||||||||||||
| Total FHLBB advances | $ | 385,223 | 5.30 | % | ||||||||||
| 2017 | |||||||
| (In thousands) | Amount | Weighted Average Rate | |||||
| Fixed rate advances maturing: | |||||||
| 2018 | $ | 836,115 | 1.43 | % | |||
| 2019 | 150,082 | 1.64 | |||||
| 2020 | 54,101 | 2.04 | |||||
| 2021 | 220 | 3.21 | |||||
| 2022 and beyond | 7,218 | 2.64 | |||||
| Total fixed rate advances | $ | 1,047,736 | 1.50 | ||||
| Total FHLBB advances | $ | 1,047,736 | 1.50 | % | |||
| (In thousands) | 2023 | 2022 | ||||||||||||
| Derivative liabilities | $ | 75,957 | $ | 97,030 | ||||||||||
| Collateral on interest rate swaps | 25,520 | — | ||||||||||||
| Finance lease liabilities | 8,681 | 9,306 | ||||||||||||
| Employee benefits liability | 43,042 | 45,175 | ||||||||||||
| Operating lease liabilities | 53,026 | 53,736 | ||||||||||||
| Accrued interest payable | 13,766 | 1,610 | ||||||||||||
| Customer transaction clearing accounts | 12,366 | 5,758 | ||||||||||||
| Allowance for credit losses on unfunded commitments | 9,256 | 8,588 | ||||||||||||
| Other | 37,016 | 34,821 | ||||||||||||
| Total other liabilities | $ | 278,630 | $ | 256,024 | ||||||||||
| December 31, | ||||||||
| (In thousands) | 2017 | 2016 | ||||||
| Derivative liabilities | $ | 15,838 | $ | 24,420 | ||||
| Capital lease obligation | 11,323 | 11,639 | ||||||
| Asset purchase settlement payable | 70,637 | 29,158 | ||||||
| Employee benefits liability | 27,093 | 17,972 | ||||||
| Level lease liability | 5,766 | 6,997 | ||||||
| Accrued interest payable | 6,813 | 4,394 | ||||||
| Customer transaction clearing accounts | 9,118 | 1,786 | ||||||
| Other | 41,294 | 36,789 | ||||||
| Total other liabilities | $ | 187,882 | $ | 133,155 | ||||
| December 31, | ||||||||||||||
| (In thousands) | 2023 | 2022 | ||||||||||||
| Change in projected benefit obligation: | ||||||||||||||
| Projected benefit obligation at beginning of year | $ | 3,729 | $ | 5,328 | ||||||||||
| Service Cost | 59 | 68 | ||||||||||||
| Interest cost | 186 | 141 | ||||||||||||
| Actuarial loss | (20) | (1,508) | ||||||||||||
| Benefits paid | (250) | (263) | ||||||||||||
| Settlements | (62) | (37) | ||||||||||||
| Projected benefit obligation at end of year | 3,642 | 3,729 | ||||||||||||
| Accumulated benefit obligation | 3,642 | 3,729 | ||||||||||||
| Change in fair value of plan assets: | ||||||||||||||
| Fair value of plan assets at plan beginning of year | 4,683 | 5,962 | ||||||||||||
| Actual return on plan assets | 628 | (979) | ||||||||||||
| Contributions by employer | — | — | ||||||||||||
| Benefits paid | (250) | (263) | ||||||||||||
| Settlements | (62) | (37) | ||||||||||||
| Fair value of plan assets at end of year | 4,999 | 4,683 | ||||||||||||
| (Overfunded) status | $ | (1,357) | $ | (954) | ||||||||||
| December 31, | ||||||||
| (In thousands) | 2017 | 2016 | ||||||
| Change in projected benefit obligation: | ||||||||
| Projected benefit obligation at beginning of year | $ | 6,126 | $ | 6,585 | ||||
| Service Cost | 66 | 76 | ||||||
| Interest cost | 237 | 267 | ||||||
| Actuarial gain | 309 | (308 | ) | |||||
| Benefits paid | (324 | ) | (318 | ) | ||||
| Settlements | (61 | ) | (176 | ) | ||||
| Projected benefit obligation at end of year | 6,353 | 6,126 | ||||||
| Accumulated benefit obligation | 6,353 | 6,126 | ||||||
| Change in fair value of plan assets: | ||||||||
| Fair value of plan assets at plan beginning of year | 5,121 | 5,211 | ||||||
| Actual return on plan assets | 710 | 404 | ||||||
| Benefits paid | (324 | ) | (318 | ) | ||||
| Settlements | (61 | ) | (176 | ) | ||||
| Fair value of plan assets at end of year | 5,446 | 5,121 | ||||||
| Underfunded status | $ | 907 | $ | 1,005 | ||||
| Amounts Recognized on Consolidated Balance Sheets | ||||||||||||||
| Other assets | $ | 1,357 | $ | 954 | ||||||||||
| Other liabilities | — | — | ||||||||||||
| Amounts Recognized in Consolidated Balance Sheet | ||||||||
| Other Liabilities | $ | 907 | $ | 1,005 | ||||
| December 31, | ||||||||||||||||||||||||||||||||||||||||||||||||||
| December 31, | December 31, | |||||||||||||||||||||||||||||||||||||||||||||||||
| (In thousands) | 2017 | 2016 | (In thousands) | 2023 | 2022 | 2021 | ||||||||||||||||||||||||||||||||||||||||||||
| Service Cost | $ | 66 | $ | 76 | ||||||||||||||||||||||||||||||||||||||||||||||
| Interest Cost | 237 | 267 | ||||||||||||||||||||||||||||||||||||||||||||||||
| Expected return on plan assets | (346 | ) | (361 | ) | ||||||||||||||||||||||||||||||||||||||||||||||
| Amortization of unrecognized actuarial loss | 100 | 163 | ||||||||||||||||||||||||||||||||||||||||||||||||
| Net periodic pension costs | $ | 57 | $ | 145 | ||||||||||||||||||||||||||||||||||||||||||||||
| Net periodic pension (credit) | ||||||||||||||||||||||||||||||||||||||||||||||||||
| December 31, | ||||||||||||||||||||
| (In thousands) | 2023 | 2022 | 2021 | |||||||||||||||||
| Amortization of actuarial (loss) | $ | (6) | $ | (11) | $ | (103) | ||||||||||||||
| Actuarial (gain) | (353) | (154) | (495) | |||||||||||||||||
| Settlement charge | — | — | (58) | |||||||||||||||||
| Total recognized in accumulated other comprehensive income | (359) | (165) | (656) | |||||||||||||||||
| Total recognized in net periodic pension cost recognized and other comprehensive income | $ | (403) | $ | (321) | $ | (764) | ||||||||||||||
| December 31, | ||||||||
| (In thousands) | 2017 | 2016 | ||||||
| Amortization of actuarial (loss) | $ | (100 | ) | $ | (163 | ) | ||
| Actuarial (gain) loss | (54 | ) | (351 | ) | ||||
| Total recognized in accumulated other comprehensive income | (154 | ) | (514 | ) | ||||
| Total recognized in net periodic pension cost recognized and other comprehensive income | $ | (97 | ) | $ | (369 | ) | ||
| December 31, | ||||||||||||||||||||||||||||||||||||||||||||||||
| December 31, | December 31, | |||||||||||||||||||||||||||||||||||||||||||||||
| 2017 | 2016 | 2023 | 2022 | 2021 | ||||||||||||||||||||||||||||||||||||||||||||
| Projected benefit obligation | ||||||||||||||||||||||||||||||||||||||||||||||||
| Discount rate | 3.510 | % | 3.980 | % | ||||||||||||||||||||||||||||||||||||||||||||
| Discount rate | ||||||||||||||||||||||||||||||||||||||||||||||||
| Discount rate | 4.99 | % | 5.21 | % | 2.73 | % | ||||||||||||||||||||||||||||||||||||||||||
| Net periodic pension cost | ||||||||||||||||||||||||||||||||||||||||||||||||
| Discount rate | 3.980 | % | 4.170 | % | ||||||||||||||||||||||||||||||||||||||||||||
| Discount rate | ||||||||||||||||||||||||||||||||||||||||||||||||
| Discount rate | 5.21 | % | 2.73 | % | 2.35 | % | ||||||||||||||||||||||||||||||||||||||||||
| Long term rate of return on plan assets | 7.000 | % | 7.000 | % | Long term rate of return on plan assets | 6.50 | % | 6.50 | % | 7.00 | % | |||||||||||||||||||||||||||||||||||||
| December 31, 2017 | ||||||||||||
| Asset Category (In thousands) | Total | Level 1 | Level 2 | |||||||||
| Equity Mutual Funds: | ||||||||||||
| Large-Cap | $ | 1,820 | $ | — | $ | 1,820 | ||||||
| Mid-Cap | 439 | — | 439 | |||||||||
| Small-Cap | 438 | — | 438 | |||||||||
| International | 893 | — | 893 | |||||||||
| Fixed Income Funds | ||||||||||||
| Fixed Income - US Core | 1,308 | — | 1,308 | |||||||||
| Intermediate Duration | 437 | — | 437 | |||||||||
| Cash Equivalents - money market | 111 | 29 | 82 | |||||||||
| Total | $ | 5,446 | $ | 29 | $ | 5,417 | ||||||
| December 31, 2016 | ||||||||||||
| Asset Category (In thousands) | Total | Level 1 | Level 2 | |||||||||
| Equity Mutual Funds: | ||||||||||||
| Large-Cap | $ | 1,624 | $ | — | $ | 1,624 | ||||||
| Mid-Cap | 401 | — | 401 | |||||||||
| Small-Cap | 415 | — | 415 | |||||||||
| International | 757 | — | 757 | |||||||||
| Fixed Income Funds | ||||||||||||
| Fixed Income - US Core | 1,378 | — | 1,378 | |||||||||
| Intermediate Duration | 472 | — | 472 | |||||||||
| Cash Equivalents - money market | 74 | 30 | 44 | |||||||||
| Total | $ | 5,121 | $ | 30 | $ | 5,091 | ||||||
| December 31, 2023 | ||||||||||||||||||||
| Asset Category (In thousands) | Total | Level 1 | Level 2 | |||||||||||||||||
| Equity Mutual Funds: | ||||||||||||||||||||
| Large-Cap | $ | 1,357 | $ | 1,357 | $ | — | ||||||||||||||
| Mid-Cap | 364 | 364 | — | |||||||||||||||||
| Small-Cap | 386 | 386 | — | |||||||||||||||||
| International | 828 | 828 | — | |||||||||||||||||
| Fixed Income Mutual Funds: | ||||||||||||||||||||
| Intermediate Duration | 1,674 | 1,674 | — | |||||||||||||||||
| Equity Common/Collective Trusts: | ||||||||||||||||||||
| Large-Cap | 336 | — | 336 | |||||||||||||||||
| Cash Equivalents - money market | 54 | 54 | — | |||||||||||||||||
| Total | $ | 4,999 | $ | 4,663 | $ | 336 | ||||||||||||||
| December 31, 2022 | ||||||||||||||||||||
| Asset Category (In thousands) | Total | Level 1 | Level 2 | |||||||||||||||||
| Equity Mutual Funds: | ||||||||||||||||||||
| Large-Cap | $ | 1,441 | $ | — | $ | 1,441 | ||||||||||||||
| Mid-Cap | 383 | — | 383 | |||||||||||||||||
| Small-Cap | 318 | — | 318 | |||||||||||||||||
| International | 814 | — | 814 | |||||||||||||||||
| Fixed Income - US Core | 1,167 | — | 1,167 | |||||||||||||||||
| Intermediate Duration | 396 | — | 396 | |||||||||||||||||
| Cash Equivalents - money market | 164 | 72 | 92 | |||||||||||||||||
| Total | $ | 4,683 | $ | 72 | $ | 4,611 | ||||||||||||||
| Year | Payments (In thousands) | |||||||
| 2024 | 277 | |||||||
| 2025 | 271 | |||||||
| 2026 | 264 | |||||||
| 2027 | 258 | |||||||
| 2028 - 2033 | 1,551 | |||||||
| Year | Payments (In thousands) | ||
| 2018 | 343 | ||
| 2019 | 380 | ||
| 2020 | 372 | ||
| 2021 | 361 | ||
| 2022 | 386 | ||
| 2023 - 2027 | 1,792 | ||
| December 31, | ||||||||||||||
| (In thousands) | 2023 | 2022 | ||||||||||||
| Change in accumulated postretirement benefit obligation: | ||||||||||||||
| Accumulated post-retirement benefit obligation at beginning of year | $ | 3,215 | $ | 4,521 | ||||||||||
| Service Cost | 7 | 12 | ||||||||||||
| Interest cost | 166 | 122 | ||||||||||||
| Participant contributions | — | — | ||||||||||||
| Actuarial loss | 58 | (1,396) | ||||||||||||
| Benefits paid | (140) | (44) | ||||||||||||
| Accumulated post-retirement benefit obligation at end of year | $ | 3,306 | $ | 3,215 | ||||||||||
| Change in plan assets: | ||||||||||||||
| Fair value of plan assets at beginning of year | $ | — | $ | — | ||||||||||
| Contributions by employer | 140 | 44 | ||||||||||||
| Contributions by participant | — | — | ||||||||||||
| Benefits paid | (140) | (44) | ||||||||||||
| Fair value of plan assets at end of year | $ | — | $ | — | ||||||||||
| December 31, | ||||||||
| (In thousands) | 2017 | 2016 | ||||||
| Change in accumulated postretirement benefit obligation: | ||||||||
| Accumulated post-retirement benefit obligation at beginning of year | $ | 3,249 | $ | 3,039 | ||||
| Service Cost | 35 | 32 | ||||||
| Interest cost | 131 | 129 | ||||||
| Participant contributions | 46 | 47 | ||||||
| Actuarial loss (gain) | 326 | 130 | ||||||
| Benefits paid | (94 | ) | (128 | ) | ||||
| Accumulated post-retirement benefit obligation at end of year | $ | 3,693 | $ | 3,249 | ||||
| Change in plan assets: | ||||||||
| Fair value of plan assets at beginning of year | $ | — | $ | — | ||||
| Contributions by employer | 48 | 81 | ||||||
| Contributions by participant | 46 | 47 | ||||||
| Benefits paid | (94 | ) | (128 | ) | ||||
| Fair value of plan assets at end of year | $ | — | $ | — | ||||
| Amounts Recognized on Consolidated Balance Sheets | ||||||||||||||
| Other Liabilities | $ | 3,306 | $ | 3,215 | ||||||||||
| Amounts Recognized in Consolidated Balance Sheet | ||||||||
| Other Liabilities | $ | 3,693 | $ | 3,249 | ||||
| December 31, | ||||||||||||||||||||
| (In thousands) | 2023 | 2022 | 2021 | |||||||||||||||||
| Service cost | $ | 7 | $ | 12 | $ | 13 | ||||||||||||||
| Interest costs | 166 | 122 | 113 | |||||||||||||||||
| Amortization of net prior service credit | 83 | 83 | 83 | |||||||||||||||||
| Amortization of net actuarial loss | (64) | 30 | 55 | |||||||||||||||||
| Net periodic post-retirement costs | $ | 192 | $ | 247 | $ | 264 | ||||||||||||||
| December 31, | ||||||||
| (In thousands) | 2017 | 2016 | ||||||
| Service cost | $ | 35 | $ | 32 | ||||
| Interest costs | 131 | 129 | ||||||
| Amortization of net prior service credit | 83 | 83 | ||||||
| Amortization of net actuarial loss | — | — | ||||||
| Net periodic post-retirement costs | $ | 249 | $ | 244 | ||||
| December 31, | December 31, | |||||||||||||||||||||||||||||||||||||||||||||||||
| (In thousands) | (In thousands) | 2023 | 2022 | 2021 | ||||||||||||||||||||||||||||||||||||||||||||||
| December 31, | ||||||||||||||||||||||||||||||||||||||||||||||||||
| (In thousands) | 2017 | 2016 | ||||||||||||||||||||||||||||||||||||||||||||||||
| Amortization of actuarial loss | $ | — | $ | — | ||||||||||||||||||||||||||||||||||||||||||||||
| Amortization of prior service credit | (83 | ) | (83 | ) | ||||||||||||||||||||||||||||||||||||||||||||||
| Net actuarial (gain) loss | 199 | (126 | ) | |||||||||||||||||||||||||||||||||||||||||||||||
| Amortization of prior service credit | ||||||||||||||||||||||||||||||||||||||||||||||||||
| Amortization of prior service credit | ||||||||||||||||||||||||||||||||||||||||||||||||||
| Net actuarial (gain) | ||||||||||||||||||||||||||||||||||||||||||||||||||
| Total recognized in accumulated other comprehensive income | 116 | (209 | ) | |||||||||||||||||||||||||||||||||||||||||||||||
| Accrued post-retirement liability recognized | $ | 1,918 | $ | 1,718 | ||||||||||||||||||||||||||||||||||||||||||||||
| December 31, | ||||||||||||||||||||||||||||||||||||||||||||||||||
| December 31, | December 31, | |||||||||||||||||||||||||||||||||||||||||||||||||
| (In thousands) | 2017 | 2016 | (In thousands) | 2023 | 2022 | 2021 | ||||||||||||||||||||||||||||||||||||||||||||
| Net prior service cost (credit) | $ | 1,576 | $ | 1,659 | ||||||||||||||||||||||||||||||||||||||||||||||
| Net actuarial (gain) loss | 199 | (126 | ) | |||||||||||||||||||||||||||||||||||||||||||||||
| Net prior service cost | ||||||||||||||||||||||||||||||||||||||||||||||||||
| Net actuarial (gain)/loss | ||||||||||||||||||||||||||||||||||||||||||||||||||
| Total recognized in accumulated other comprehensive income | $ | 1,775 | $ | 1,533 | ||||||||||||||||||||||||||||||||||||||||||||||
| Year | Payments (In thousands) | ||
| 2018 | 103 | ||
| 2019 | 103 | ||
| 2020 | 102 | ||
| 2021 | 106 | ||
| 2022 | 109 | ||
| 2023 - 2027 | 548 | ||
| Year | Payments (In thousands) | |||||||
| 2024 | 115 | |||||||
| 2025 | 112 | |||||||
| 2026 | 108 | |||||||
| 2027 | 111 | |||||||
| 2028 - 2033 | 1,140 | |||||||
| (In thousands) | 2023 | 2022 | 2021 | |||||||||||||||||
| Current: | ||||||||||||||||||||
| Federal tax expense | $ | 5,596 | $ | 17,915 | $ | 17,340 | ||||||||||||||
| State tax expense | 7,497 | 6,831 | 7,580 | |||||||||||||||||
Total current tax expense (1) | 13,093 | 24,746 | 24,920 | |||||||||||||||||
| Deferred: | ||||||||||||||||||||
| Federal tax (benefit)/expense | (2,658) | (2,274) | 5,125 | |||||||||||||||||
| State tax (benefit)/expense | (1,711) | (1,187) | 112 | |||||||||||||||||
| Total deferred tax (benefit)/expense | (4,369) | (3,461) | 5,237 | |||||||||||||||||
| Change in valuation allowance | — | — | 200 | |||||||||||||||||
| Income tax expense | $ | 8,724 | $ | 21,285 | $ | 30,357 | ||||||||||||||
| (In thousands) | 2017 | 2016 | 2015 | |||||||||
| Current: | ||||||||||||
| Federal tax expense | $ | 11,686 | $ | 6,758 | $ | 4,696 | ||||||
| State tax expense | 1,112 | 1,101 | (1,631 | ) | ||||||||
| Total current expense | 12,798 | 7,859 | 3,065 | |||||||||
| Deferred: | ||||||||||||
| Federal tax expense | 29,824 | 9,438 | 2,023 | |||||||||
| State tax expense | 1,805 | 1,591 | (24 | ) | ||||||||
| Total deferred tax expense (1) | 31,629 | 11,029 | 1,999 | |||||||||
| Change in valuation allowance | 75 | (104 | ) | — | ||||||||
| Total income tax expense | $ | 44,502 | $ | 18,784 | $ | 5,064 | ||||||
| 2023 | 2022 | 2021 | ||||||||||||||||||||||||||||||||||||
| (In thousands, except rates) | Amount | Rate | Amount | Rate | Amount | Rate | ||||||||||||||||||||||||||||||||
| Statutory tax rate | $ | 16,448 | 21.0 | % | $ | 23,902 | 21.0 | % | $ | 31,294 | 21.0 | % | ||||||||||||||||||||||||||
| Increase (decrease) resulting from: | ||||||||||||||||||||||||||||||||||||||
| State taxes, net of federal tax benefit | 4,570 | 5.8 | 4,459 | 3.9 | 6,077 | 4.1 | ||||||||||||||||||||||||||||||||
| Tax exempt income - investments, net | (3,611) | (4.6) | (3,515) | (3.1) | (3,475) | (2.3) | ||||||||||||||||||||||||||||||||
| Bank-owned life insurance | (1,568) | (2.0) | (1,258) | (1.1) | (1,348) | (0.9) | ||||||||||||||||||||||||||||||||
| Tax credits, net of basis reduction | (7,804) | (10.0) | (2,129) | (1.9) | (2,881) | (1.9) | ||||||||||||||||||||||||||||||||
| Change in valuation allowance | — | — | — | — | 200 | 0.1 | ||||||||||||||||||||||||||||||||
| Tax rate benefit on net operating loss carryback | — | — | — | — | (493) | (0.3) | ||||||||||||||||||||||||||||||||
| Other, net | 689 | 0.9 | (174) | (0.1) | 983 | 0.6 | ||||||||||||||||||||||||||||||||
| Effective tax rate | $ | 8,724 | 11.1 | % | $ | 21,285 | 18.7 | % | $ | 30,357 | 20.4 | % | ||||||||||||||||||||||||||
| 2017 | 2016 | 2015 | |||||||||||||||||||
| (In thousands, except rates) | Amount | Rate | Amount | Rate | Amount | Rate | |||||||||||||||
| Statutory tax rate | $ | 34,912 | 35.0 | % | $ | 27,108 | 35.0 | % | $ | 19,104 | 35.0 | % | |||||||||
| Increase (decrease) resulting from: | |||||||||||||||||||||
| State taxes, net of federal tax benefit | 2,232 | 2.2 | 1,675 | 2.2 | (974 | ) | (1.8 | ) | |||||||||||||
| Tax exempt income - investments, net | (5,395 | ) | (5.4 | ) | (3,849 | ) | (5.0 | ) | (3,463 | ) | (6.3 | ) | |||||||||
| Bank-owned life insurance | (1,556 | ) | (1.6 | ) | (1,364 | ) | (1.8 | ) | (1,284 | ) | (2.4 | ) | |||||||||
| Non-deductible merger costs | 368 | 0.4 | 542 | 0.7 | 422 | 0.8 | |||||||||||||||
| Non-deductible goodwill on disposal operations sale | — | — | — | — | 313 | 0.6 | |||||||||||||||
| Tax credits, net of basis reduction | (4,656 | ) | (4.7 | ) | (6,225 | ) | (8.0 | ) | (8,308 | ) | (15.2 | ) | |||||||||
| Change in valuation allowance | 75 | 0.1 | 125 | 0.2 | — | — | |||||||||||||||
| Impact of federal tax reform enactment | 18,145 | 18.2 | — | — | — | — | |||||||||||||||
| Other, net | 377 | 0.4 | 772 | 1.0 | (746 | ) | (1.4 | ) | |||||||||||||
| Effective tax rate | $ | 44,502 | 44.6 | % | $ | 18,784 | 24.3 | % | $ | 5,064 | 9.3 | % | |||||||||
| (In thousands) | 2017 | 2016 | (In thousands) | 2023 | 2022 | |||||||||||||||||||||||
| Deferred tax assets: | Deferred tax assets: | |||||||||||||||||||||||||||
| Allowance for loan losses | $ | 14,578 | $ | 17,747 | ||||||||||||||||||||||||
| Tax credit carryforwards | 4,100 | 4,100 | ||||||||||||||||||||||||||
| Allowance for credit losses | ||||||||||||||||||||||||||||
| Unrealized capital loss on tax credit investments | 6,502 | 6,999 | ||||||||||||||||||||||||||
| Unrealized capital loss on tax credit investments | ||||||||||||||||||||||||||||
| Unrealized capital loss on tax credit investments | ||||||||||||||||||||||||||||
| Net unrealized loss on securities available for sale, swaps, and pension in OCI | ||||||||||||||||||||||||||||
| Employee benefit plans | 4,983 | 7,813 | ||||||||||||||||||||||||||
| Purchase accounting adjustments | 37,843 | 23,520 | ||||||||||||||||||||||||||
| Net operating loss carryforwards | 1,374 | 2,643 | ||||||||||||||||||||||||||
| Deferred loan fees | ||||||||||||||||||||||||||||
| Lease liability | ||||||||||||||||||||||||||||
| Premises and equipment | ||||||||||||||||||||||||||||
| Nonaccrual interest | ||||||||||||||||||||||||||||
| Intangible amortization | ||||||||||||||||||||||||||||
| Other | 2,332 | 4,997 | ||||||||||||||||||||||||||
| Deferred tax assets, net before valuation allowances | 71,712 | 67,819 | ||||||||||||||||||||||||||
| Valuation allowance | (200 | ) | (125 | ) | ||||||||||||||||||||||||
| Deferred tax assets, net of valuation allowances | $ | 71,512 | $ | 67,694 | ||||||||||||||||||||||||
| Deferred tax liabilities: | ||||||||||||||||||||||||||||
| Net unrealized gain on swaps, securities available for sale, and pension in OCI | $ | (1,888 | ) | $ | (5,884 | ) | ||||||||||||||||||||||
| Premises and equipment | (1,126 | ) | (2,519 | ) | ||||||||||||||||||||||||
| Deferred tax liabilities: | ||||||||||||||||||||||||||||
| Deferred tax liabilities: | ||||||||||||||||||||||||||||
| Loan servicing rights | (2,174 | ) | (4,546 | ) | ||||||||||||||||||||||||
| Deferred loan fees | (3,900 | ) | — | |||||||||||||||||||||||||
| Intangible amortization | (15,001 | ) | (11,543 | ) | ||||||||||||||||||||||||
| Other | (362 | ) | (2,074 | ) | ||||||||||||||||||||||||
| Loan servicing rights | ||||||||||||||||||||||||||||
| Loan servicing rights | ||||||||||||||||||||||||||||
| Unamortized tax credit reserve | ||||||||||||||||||||||||||||
| Unamortized tax credit reserve | ||||||||||||||||||||||||||||
| Unamortized tax credit reserve | ||||||||||||||||||||||||||||
| Right-of-use asset | ||||||||||||||||||||||||||||
| Deferred tax liabilities | $ | (24,451 | ) | $ | (26,566 | ) | ||||||||||||||||||||||
| Deferred tax assets, net | $ | 47,061 | $ | 41,128 | ||||||||||||||||||||||||
| (in thousands) | 2023 | 2022 | ||||||||||||
| State valuation allowances | $ | (400) | $ | (400) | ||||||||||
| (in thousands) | 2017 | 2016 | ||||||
| State tax basis difference, net of Federal tax benefit | $ | (200 | ) | $ | (125 | ) | ||
| Valuation allowances | $ | (200 | ) | $ | (125 | ) | ||
| (In thousands) | 2023 | 2022 | 2021 | |||||||||||||||||
| Unrecognized tax benefits at January 1 | $ | 1,042 | $ | 1,025 | $ | 516 | ||||||||||||||
| Increase in gross amounts of tax positions related to prior years | 782 | 17 | 509 | |||||||||||||||||
| Decrease in gross amounts of tax positions related to prior years | — | — | — | |||||||||||||||||
| Decrease due to settlement with taxing authority | — | — | — | |||||||||||||||||
| Decrease due to lapse in statute of limitations | — | — | — | |||||||||||||||||
| Unrecognized tax benefits at December 31 | $ | 1,824 | $ | 1,042 | $ | 1,025 | ||||||||||||||
| (In thousands) | 2017 | 2016 | 2015 | |||||||||
| Unrecognized tax benefits at January 1 | $ | 460 | $ | 307 | $ | 553 | ||||||
| Increase in gross amounts of tax positions related to prior years | — | 270 | — | |||||||||
| Decrease in gross amounts of tax positions related to prior years | (156 | ) | — | — | ||||||||
| Decrease due to settlement with taxing authority | — | — | — | |||||||||
| Increase in gross amounts of tax positions related to current year | — | — | — | |||||||||
| Decrease due to lapse in statute of limitations | — | (117 | ) | (246 | ) | |||||||
| Unrecognized tax benefits at December 31 | $ | 304 | $ | 460 | $ | 307 | ||||||
| Notional Amount | Weighted Average Maturity | Weighted Average Rate | Estimated Fair Value Asset (Liability) | |||||||||||||||||||||||||||||
| December 31, 2023 | Received | Contract pay rate | ||||||||||||||||||||||||||||||
| (In thousands) | (In years) | (In thousands) | ||||||||||||||||||||||||||||||
| Cash flow hedges: | ||||||||||||||||||||||||||||||||
| Interest rate swaps on commercial loans (1) | $ | 600,000 | 1.9 | 3.64 | % | 5.35 | % | $ | — | |||||||||||||||||||||||
| Interest rate collars on commercial loans | 200,000 | 2.5 | 1,658 | |||||||||||||||||||||||||||||
| Total cash flow hedges | 800,000 | 1,658 | ||||||||||||||||||||||||||||||
| Economic hedges: | ||||||||||||||||||||||||||||||||
| Interest rate swap on tax advantaged economic development bond | $ | 6,202 | 5.9 | 5.82 | % | 5.09 | % | $ | (172) | |||||||||||||||||||||||
| Interest rate swaps on loans with commercial loan customers (1) | 1,795,562 | 4.9 | 4.36 | % | 6.27 | % | (63,865) | |||||||||||||||||||||||||
| Reverse interest rate swaps on loans with commercial loan customers (1) | 1,795,562 | 4.9 | 6.27 | % | 4.36 | % | 32,053 | |||||||||||||||||||||||||
| Risk participation agreements with dealer banks | 376,553 | 5.5 | (18) | |||||||||||||||||||||||||||||
| Forward sale commitments | 2,207 | 0.2 | 21 | |||||||||||||||||||||||||||||
| Total economic hedges | 3,976,086 | (31,981) | ||||||||||||||||||||||||||||||
| Non-hedging derivatives: | ||||||||||||||||||||||||||||||||
| Commitments to lend | 11,104 | 0.2 | 34 | |||||||||||||||||||||||||||||
| Total non-hedging derivatives | 11,104 | 34 | ||||||||||||||||||||||||||||||
| Total | $ | 4,787,190 | $ | (30,289) | ||||||||||||||||||||||||||||
Notional Amount | Weighted Average Maturity | Weighted Average Rate | Estimated Fair Value Asset (Liability) | |||||||||||||
| December 31, 2017 | Received | Contract pay rate | ||||||||||||||
| (In thousands) | (In years) | (In thousands) | ||||||||||||||
| Cash flow hedges: | ||||||||||||||||
| Interest rate swaps on FHLBB borrowings | $ | — | 0 | — | % | — | % | $ | — | |||||||
| Total cash flow hedges | — | — | ||||||||||||||
| Economic hedges: | ||||||||||||||||
| Interest rate swap on tax advantaged economic development bond | 10,755 | 11.9 | 1.73 | % | 5.09 | % | (1,649 | ) | ||||||||
| Interest rate swaps on loans with commercial loan customers | 943,795 | 5.9 | 3.26 | % | 4.25 | % | (3,195 | ) | ||||||||
| Reverse interest rate swaps on loans with commercial loan customers | 943,795 | 5.9 | 4.25 | % | 3.26 | % | 3,204 | |||||||||
| Risk participation agreements with dealer banks | 142,054 | 8.4 | (26 | ) | ||||||||||||
| Forward sale commitments | 276,572 | 0.2 | (123 | ) | ||||||||||||
| Total economic hedges | 2,316,971 | (1,789 | ) | |||||||||||||
| Non-hedging derivatives: | ||||||||||||||||
| Commitments to lend | 193,966 | 0.2 | 5,259 | |||||||||||||
| Total non-hedging derivatives | 193,966 | 5,259 | ||||||||||||||
| Total | $ | 2,510,937 | $ | 3,470 | ||||||||||||
| Notional Amount | Weighted Average Maturity | Weighted Average Rate | Estimated Fair Value Asset (Liability) | |||||||||||||||||||||||||||||
| December 31, 2022 | Received | Contract pay rate | ||||||||||||||||||||||||||||||
| (In thousands) | (In years) | (In thousands) | ||||||||||||||||||||||||||||||
| Cash flow hedges: | ||||||||||||||||||||||||||||||||
| Interest rate swaps on commercial loans (1) | $ | 400,000 | 2.7 | 4.09 | % | 3.51 | % | $ | — | |||||||||||||||||||||||
| Forward-starting interest rate swaps on commercial loans (1) | 200,000 | 3.3 | — | % | 3.90 | % | — | |||||||||||||||||||||||||
| Interest rate collars on commercial loans | 200,000 | 3.5 | 1,937 | |||||||||||||||||||||||||||||
| Total cash flow hedges | 800,000 | 1,937 | ||||||||||||||||||||||||||||||
| Economic hedges: | ||||||||||||||||||||||||||||||||
| Interest rate swap on tax advantaged economic development bond | $ | 7,062 | 6.9 | 4.49 | % | 5.09 | % | $ | (193) | |||||||||||||||||||||||
| Interest rate swaps on loans with commercial loan customers | 1,685,263 | 5.7 | 4.11 | % | 5.55 | % | (95,114) | |||||||||||||||||||||||||
| Reverse interest rate swaps on loans with commercial loan customers (1) | 1,685,263 | 5.7 | 5.55 | % | 4.11 | % | 50,267 | |||||||||||||||||||||||||
| Risk participation agreements with dealer banks | 341,885 | 6.6 | (89) | |||||||||||||||||||||||||||||
| Forward sale commitments | 927 | 0.2 | 8 | |||||||||||||||||||||||||||||
| Total economic hedges | 3,720,400 | (45,121) | ||||||||||||||||||||||||||||||
| Non-hedging derivatives: | ||||||||||||||||||||||||||||||||
| Commitments to lend | 4,114 | 0.2 | 17 | |||||||||||||||||||||||||||||
| Total non-hedging derivatives | 4,114 | 17 | ||||||||||||||||||||||||||||||
| Total | $ | 4,524,514 | $ | (43,167) | ||||||||||||||||||||||||||||
Notional Amount | Weighted Average Maturity | Weighted Average Rate | Estimated Fair Value Asset (Liability) | |||||||||||||
| December 31, 2016 | Received | Contract pay rate | ||||||||||||||
| (In thousands) | (In years) | (In thousands) | ||||||||||||||
| Cash flow hedges: | ||||||||||||||||
| Forward-starting interest rate swaps on FHLBB borrowings | $ | 300,000 | 2.3 | 0.63 | % | 2.29 | % | $ | (6,573 | ) | ||||||
| Total cash flow hedges | 300,000 | (6,573 | ) | |||||||||||||
| Economic hedges: | ||||||||||||||||
| Interest rate swap on tax advantaged economic development bond | 11,386 | 12.9 | 0.98 | % | 5.09 | % | (2,021 | ) | ||||||||
| Interest rate swaps on loans with commercial loan customers | 668,541 | 6.2 | 2.43 | % | 4.21 | % | (6,752 | ) | ||||||||
| Reverse interest rate swaps on loans with commercial loan customers | 668,541 | 6.2 | 4.21 | % | 2.43 | % | 7,077 | |||||||||
| Risk participation agreements with dealer banks | 83,360 | 11.6 | 5 | |||||||||||||
| Forward sale commitments | 259,889 | 0.2 | 722 | |||||||||||||
| Total economic hedges | 1,691,717 | (969 | ) | |||||||||||||
| Non-hedging derivatives: | ||||||||||||||||
| Commitments to lend | 208,145 | 0.2 | 4,738 | |||||||||||||
| Total non-hedging derivatives | 208,145 | 4,738 | ||||||||||||||
| Total | $ | 2,199,862 | $ | (2,804 | ) | |||||||||||
| Years Ended December 31, | ||||||||||||
| (In thousands) | 2017 | 2016 | 2015 | |||||||||
| Interest rate swaps on FHLBB borrowings: | ||||||||||||
| Unrealized (loss) recognized in accumulated other comprehensive loss | $ | (449 | ) | $ | (2,023 | ) | $ | (5,232 | ) | |||
| Less: Reclassification of unrealized (loss) from accumulated other comprehensive loss to interest expense | (393 | ) | (3,981 | ) | — | |||||||
| Less: reclassification of unrealized (loss) from accumulated other comprehensive income to other non-interest expense | (6,629 | ) | — | — | ||||||||
| Net tax effect on items recognized in accumulated other comprehensive income | (2,589 | ) | (835 | ) | 2,094 | |||||||
| Other comprehensive income recorded in accumulated other comprehensive income, net of reclassification adjustments and tax effects | $ | 3,984 | $ | 1,123 | $ | (3,138 | ) | |||||
| Years Ended December 31, | |||||||||||||||||
| (In thousands) | 2023 | 2022 | 2021 | ||||||||||||||
| Interest rate swaps and collars on commercial loans: | |||||||||||||||||
| Unrealized gain/(loss) recognized in accumulated other comprehensive loss | $ | 1,770 | $ | (6,667) | $ | — | |||||||||||
| Less: Reclassification of unrealized (loss) from accumulated other comprehensive loss to interest income | (632) | — | — | ||||||||||||||
| Net tax benefit on items recognized in accumulated other comprehensive income | (630) | 1,789 | — | ||||||||||||||
| Other comprehensive gain/(loss) recorded in accumulated other comprehensive income/(loss), net of reclassification adjustments and tax effects | $ | 1,772 | $ | (4,878) | $ | — | |||||||||||
| Net interest expense recognized on hedged commercial loans | $ | 9,026 | $ | (15) | $ | — | |||||||||||
| Years Ended December 31, | |||||||||||||||||||||||||||||||||||||||||
| (In thousands) | (In thousands) | 2023 | 2022 | 2021 | |||||||||||||||||||||||||||||||||||||
| Economic hedges | |||||||||||||||||||||||||||||||||||||||||
| Economic hedges | |||||||||||||||||||||||||||||||||||||||||
| Economic hedges | |||||||||||||||||||||||||||||||||||||||||
| Interest rate swap on industrial revenue bond: | |||||||||||||||||||||||||||||||||||||||||
| Interest rate swap on industrial revenue bond: | |||||||||||||||||||||||||||||||||||||||||
| Interest rate swap on industrial revenue bond: | |||||||||||||||||||||||||||||||||||||||||
| Unrealized gain/(loss) recognized in other non-interest income | |||||||||||||||||||||||||||||||||||||||||
| Unrealized gain/(loss) recognized in other non-interest income | |||||||||||||||||||||||||||||||||||||||||
| Unrealized gain/(loss) recognized in other non-interest income | |||||||||||||||||||||||||||||||||||||||||
| Interest rate swaps on loans with commercial loan customers: | |||||||||||||||||||||||||||||||||||||||||
| Interest rate swaps on loans with commercial loan customers: | |||||||||||||||||||||||||||||||||||||||||
| Interest rate swaps on loans with commercial loan customers: | |||||||||||||||||||||||||||||||||||||||||
| Unrealized gain/(loss) recognized in other non-interest income | |||||||||||||||||||||||||||||||||||||||||
| Unrealized gain/(loss) recognized in other non-interest income | |||||||||||||||||||||||||||||||||||||||||
| Unrealized gain/(loss) recognized in other non-interest income | |||||||||||||||||||||||||||||||||||||||||
| Favorable/(unfavorable) change in credit valuation adjustment recognized in other non-interest income | |||||||||||||||||||||||||||||||||||||||||
| Reverse interest rate swaps on loans with commercial loan customers: | |||||||||||||||||||||||||||||||||||||||||
| Unrealized (loss)/gain recognized in other non-interest income | |||||||||||||||||||||||||||||||||||||||||
| Unrealized (loss)/gain recognized in other non-interest income | |||||||||||||||||||||||||||||||||||||||||
| Unrealized (loss)/gain recognized in other non-interest income | |||||||||||||||||||||||||||||||||||||||||
| Risk Participation Agreements: | |||||||||||||||||||||||||||||||||||||||||
| Risk Participation Agreements: | |||||||||||||||||||||||||||||||||||||||||
| Risk Participation Agreements: | |||||||||||||||||||||||||||||||||||||||||
| Unrealized (loss) recognized in other non-interest income | |||||||||||||||||||||||||||||||||||||||||
| Unrealized (loss) recognized in other non-interest income | |||||||||||||||||||||||||||||||||||||||||
| Unrealized (loss) recognized in other non-interest income | |||||||||||||||||||||||||||||||||||||||||
| Forward Commitments: | |||||||||||||||||||||||||||||||||||||||||
| Forward Commitments: | |||||||||||||||||||||||||||||||||||||||||
| Forward Commitments: | |||||||||||||||||||||||||||||||||||||||||
| Unrealized gain/(loss) recognized in other non-interest income | |||||||||||||||||||||||||||||||||||||||||
| Unrealized gain/(loss) recognized in other non-interest income | |||||||||||||||||||||||||||||||||||||||||
| Unrealized gain/(loss) recognized in other non-interest income | |||||||||||||||||||||||||||||||||||||||||
| Years Ended December 31, | |||||||||||||||||||||||||||||||||||||||||
| (In thousands) | 2017 | 2016 | 2015 | ||||||||||||||||||||||||||||||||||||||
| Economic hedges | |||||||||||||||||||||||||||||||||||||||||
| Interest rate swap on industrial revenue bond: | |||||||||||||||||||||||||||||||||||||||||
| Unrealized gain (loss) recognized in other non-interest income | $ | 371 | $ | (75 | ) | $ | (344 | ) | |||||||||||||||||||||||||||||||||
| Interest rate swaps on loans with commercial loan customers: | |||||||||||||||||||||||||||||||||||||||||
| Unrealized gain recognized in other non-interest income | 3,557 | 1,312 | (4,852 | ) | |||||||||||||||||||||||||||||||||||||
| Reverse interest rate swaps on loans with commercial loan customers: | |||||||||||||||||||||||||||||||||||||||||
| Unrealized (loss) recognized in other non-interest income | (3,557 | ) | (1,312 | ) | 4,852 | ||||||||||||||||||||||||||||||||||||
| (Unfavorable) Favorable change in credit valuation adjustment recognized in other non-interest income | (316 | ) | 338 | (51 | ) | ||||||||||||||||||||||||||||||||||||
| Risk Participation Agreements: | |||||||||||||||||||||||||||||||||||||||||
| Unrealized (loss) recognized in other non-interest income | (31 | ) | (61 | ) | (36 | ) | |||||||||||||||||||||||||||||||||||
| Forward Commitments: | |||||||||||||||||||||||||||||||||||||||||
| Unrealized gain (loss) recognized in non-interest income | (123 | ) | (1,176 | ) | (247 | ) | |||||||||||||||||||||||||||||||||||
| Realized (loss) in non-interest income | (1,764 | ) | (3,705 | ) | 45 | ||||||||||||||||||||||||||||||||||||
| Non-hedging derivatives | |||||||||||||||||||||||||||||||||||||||||
| Non-hedging derivatives | |||||||||||||||||||||||||||||||||||||||||
| Non-hedging derivatives | |||||||||||||||||||||||||||||||||||||||||
| Commitments to lend: | |||||||||||||||||||||||||||||||||||||||||
| Unrealized gain recognized in non-interest income | $ | 5,259 | $ | 8,373 | $ | 2,436 | |||||||||||||||||||||||||||||||||||
| Realized gain in non-interest income | 50,879 | 3,650 | 1,899 | ||||||||||||||||||||||||||||||||||||||
| Commitments to lend: | |||||||||||||||||||||||||||||||||||||||||
| Commitments to lend: | |||||||||||||||||||||||||||||||||||||||||
| Unrealized gain/(loss) recognized in other non-interest income | |||||||||||||||||||||||||||||||||||||||||
| Unrealized gain/(loss) recognized in other non-interest income | |||||||||||||||||||||||||||||||||||||||||
| Unrealized gain/(loss) recognized in other non-interest income | |||||||||||||||||||||||||||||||||||||||||
| Realized gain in other non-interest income | |||||||||||||||||||||||||||||||||||||||||
| Realized gain in other non-interest income | |||||||||||||||||||||||||||||||||||||||||
| Realized gain in other non-interest income | |||||||||||||||||||||||||||||||||||||||||
| Gross Amounts of Recognized Assets | Gross Amounts Offset in the Statements of Condition | Net Amounts of Assets Presented in the Statements of Condition | Gross Amounts Not Offset in the Statements of Condition | |||||||||||||||||||||||||||||||||||
| Financial Instruments | Cash Collateral Received | |||||||||||||||||||||||||||||||||||||
| (in thousands) | Net Amount | |||||||||||||||||||||||||||||||||||||
| As of December 31, 2023 | ||||||||||||||||||||||||||||||||||||||
| Interest Rate Swap Agreements: | ||||||||||||||||||||||||||||||||||||||
| Institutional counterparties | $ | 71,579 | $ | (31,812) | $ | 39,767 | $ | — | $ | — | $ | 39,767 | ||||||||||||||||||||||||||
| Commercial counterparties | 5,992 | — | 5,992 | — | — | 5,992 | ||||||||||||||||||||||||||||||||
| Total | $ | 77,571 | $ | (31,812) | $ | 45,759 | $ | — | $ | — | $ | 45,759 | ||||||||||||||||||||||||||
| Gross Amounts of Recognized Assets | Gross Amounts Offset in the Statements of Condition | Net Amounts of Assets Presented in the Statements of Condition | Gross Amounts Not Offset in the Statements of Condition | |||||||||||||||||||||
| Financial Instruments | Cash Collateral Received | |||||||||||||||||||||||
| (in thousands) | Net Amount | |||||||||||||||||||||||
| As of December 31, 2017 | ||||||||||||||||||||||||
| Interest Rate Swap Agreements: | ||||||||||||||||||||||||
| Institutional counterparties | $ | 2,692 | $ | (1,622 | ) | $ | 1,070 | $ | — | $ | — | $ | 1,070 | |||||||||||
| Commercial counterparties | 8,577 | — | 8,577 | — | — | 8,577 | ||||||||||||||||||
| Total | $ | 11,269 | $ | (1,622 | ) | $ | 9,647 | $ | — | $ | — | $ | 9,647 | |||||||||||
| Gross Amounts of Recognized Liabilities | |||||||||||||||||||||||||||||||||||||||||||||||||||||||||||||||||
| Gross Amounts of Recognized Liabilities | Gross Amounts Offset in the Statements of Condition | Net Amounts of Liabilities Presented in the Statement of Condition | Gross Amounts Not Offset in the Statements of Condition | ||||||||||||||||||||||||||||||||||||||||||||||||||||||||||||||
| Financial Instruments | Cash Collateral Received | Financial Instruments | Cash Collateral Received | ||||||||||||||||||||||||||||||||||||||||||||||||||||||||||||||
| (in thousands) | Net Amount | (in thousands) | Net Amount | ||||||||||||||||||||||||||||||||||||||||||||||||||||||||||||||
| As of December 31, 2017 | |||||||||||||||||||||||||||||||||||||||||||||||||||||||||||||||||
| As of December 31, 2023 | As of December 31, 2023 | ||||||||||||||||||||||||||||||||||||||||||||||||||||||||||||||||
| Interest Rate Swap Agreements: | Interest Rate Swap Agreements: | Interest Rate Swap Agreements: | |||||||||||||||||||||||||||||||||||||||||||||||||||||||||||||||
| Institutional counterparties | $ | (8,777 | ) | $ | 2,835 | $ | (5,942 | ) | $ | 3,982 | $ | 1,960 | $ | — | |||||||||||||||||||||||||||||||||||||||||||||||||||
| Commercial counterparties | (5,375 | ) | 2 | (5,373 | ) | — | — | (5,373 | ) | ||||||||||||||||||||||||||||||||||||||||||||||||||||||||
| Total | $ | (14,152 | ) | $ | 2,837 | $ | (11,315 | ) | $ | 3,982 | $ | 1,960 | $ | (5,373 | ) | ||||||||||||||||||||||||||||||||||||||||||||||||||
| Gross Amounts of Recognized Assets | Gross Amounts Offset in the Statements of Condition | Net Amounts of Assets Presented in the Statements of Condition | Gross Amounts Not Offset in the Statements of Condition | |||||||||||||||||||||||||||||||||||
| Financial Instruments | Cash Collateral Received | |||||||||||||||||||||||||||||||||||||
| (in thousands) | Net Amount | |||||||||||||||||||||||||||||||||||||
| As of December 31, 2022 | ||||||||||||||||||||||||||||||||||||||
| Interest Rate Swap Agreements: | ||||||||||||||||||||||||||||||||||||||
| Institutional counterparties | $ | 96,295 | $ | (45,046) | $ | 51,249 | $ | — | $ | — | $ | 51,249 | ||||||||||||||||||||||||||
| Commercial counterparties | 975 | — | 975 | — | — | 975 | ||||||||||||||||||||||||||||||||
| Total | $ | 97,270 | $ | (45,046) | $ | 52,224 | $ | — | $ | — | $ | 52,224 | ||||||||||||||||||||||||||
| Gross Amounts of Recognized Assets | Gross Amounts Offset in the Statements of Condition | Net Amounts of Assets Presented in the Statements of Condition | Gross Amounts Not Offset in the Statements of Condition | |||||||||||||||||||||
| Financial Instruments | Cash Collateral Received | |||||||||||||||||||||||
| (in thousands) | Net Amount | |||||||||||||||||||||||
| As of December 31, 2016 | ||||||||||||||||||||||||
| Interest Rate Swap Agreements: | ||||||||||||||||||||||||
| Institutional counterparties | $ | 49 | $ | — | $ | 49 | $ | — | $ | — | $ | 49 | ||||||||||||
| Commercial counterparties | 11,461 | — | 11,461 | — | — | 11,461 | ||||||||||||||||||
| Total | $ | 11,510 | $ | — | $ | 11,510 | $ | — | $ | — | $ | 11,510 | ||||||||||||
| Gross Amounts of Recognized Liabilities | Gross Amounts Offset in the Statements of Condition | Net Amounts of Liabilities Presented in the Statement of Condition | Gross Amounts Not Offset in the Statements of Condition | ||||||||||||||||||||||||||||||||
| Financial Instruments | Cash Collateral Received | ||||||||||||||||||||||||||||||||||
| (in thousands) | Net Amount | ||||||||||||||||||||||||||||||||||
| As of December 31, 2022 | |||||||||||||||||||||||||||||||||||
| Interest Rate Swap Agreements: | |||||||||||||||||||||||||||||||||||
| Institutional counterparties | $ | (1,271) | $ | 36 | $ | (1,235) | $ | 11,973 | $ | — | $ | 10,738 | |||||||||||||||||||||||
| Commercial counterparties | (102,595) | 6,507 | (96,088) | — | — | (96,088) | |||||||||||||||||||||||||||||
| Total | $ | (103,866) | $ | 6,543 | $ | (97,323) | $ | 11,973 | $ | — | $ | (85,350) | |||||||||||||||||||||||
| Gross Amounts of Recognized Liabilities | Gross Amounts Offset in the Statements of Condition | Net Amounts of Liabilities Presented in the Statement of Condition | Gross Amounts Not Offset in the Statements of Condition | ||||||||||||||||||||
| Financial Instruments | Cash Collateral Received | ||||||||||||||||||||||
| (in thousands) | Net Amount | ||||||||||||||||||||||
| As of December 31, 2016 | |||||||||||||||||||||||
| Interest Rate Swap Agreements: | |||||||||||||||||||||||
| Institutional counterparties | $ | (20,077 | ) | $ | 4,689 | $ | (15,388 | ) | $ | 14,738 | $ | 650 | $ | — | |||||||||
| Commercial counterparties | (4,407 | ) | 23 | (4,384 | ) | — | — | (4,384 | ) | ||||||||||||||
| Total | $ | (24,484 | ) | $ | 4,712 | $ | (19,772 | ) | $ | 14,738 | $ | 650 | $ | (4,384 | ) | ||||||||
| (In thousands) | December 31, 2023 | December 31, 2022 | ||||||||||||||||||
| Lease Right-of-Use Assets | Classification | |||||||||||||||||||
| Operating lease right-of-use assets | Other assets | $ | 47,348 | $ | 46,411 | |||||||||||||||
| Finance lease right-of-use assets | Premises and equipment, net | 5,597 | 6,151 | |||||||||||||||||
| Total Lease Right-of-Use Assets | $ | 52,945 | $ | 52,562 | ||||||||||||||||
| Lease Liabilities | ||||||||||||||||||||
| Operating lease liabilities | Other liabilities | $ | 53,026 | $ | 53,736 | |||||||||||||||
| Finance lease liabilities | Other liabilities | 8,681 | 9,306 | |||||||||||||||||
| Total Lease Liabilities | $ | 61,707 | $ | 63,042 | ||||||||||||||||
| December 31, 2023 | December 31, 2022 | ||||||||||
| Weighted-Average Remaining Lease Term (in years) | |||||||||||
| Operating leases | 8.3 | 9.3 | |||||||||
| Finance leases | 10.8 | 11.8 | |||||||||
| Weighted-Average Discount Rate | |||||||||||
| Operating leases | 2.90 | % | 2.56 | % | |||||||
| Finance leases | 5.00 | % | 5.00 | % | |||||||
| (In thousands) | December 31, 2023 | December 31, 2022 | December 31, 2021 | |||||||||||||||||
| Cash paid for amounts included in the measurement of lease liabilities: | ||||||||||||||||||||
| Operating cash flows from operating leases | $ | 9,009 | $ | 9,438 | $ | 10,897 | ||||||||||||||
| Operating cash flows from finance leases | 446 | 476 | 503 | |||||||||||||||||
| Financing cash flows from finance leases | 593 | 555 | 528 | |||||||||||||||||
| Right-of-use assets obtained in exchange for lease obligations: | ||||||||||||||||||||
| Operating leases | 8,512 | 5,730 | 2,976 | |||||||||||||||||
| Finance leases | — | — | — | |||||||||||||||||
| (In thousands) | Operating Leases | Finance Leases | ||||||||||||
| 2024 | $ | 9,519 | $ | 1,039 | ||||||||||
| 2025 | 8,533 | 1,039 | ||||||||||||
| 2026 | 7,471 | 1,039 | ||||||||||||
| 2027 | 6,589 | 1,039 | ||||||||||||
| 2028 | 5,567 | 1,039 | ||||||||||||
| Thereafter | 21,399 | 6,036 | ||||||||||||
| Total undiscounted lease payments | 59,078 | 11,231 | ||||||||||||
| Less amounts representing interest | (6,052) | (2,550) | ||||||||||||
| Lease liability | $ | 53,026 | $ | 8,681 | ||||||||||
| (In thousands) | 2023 | 2022 | ||||||||||||
| Commitments to originate new loans | $ | 256,877 | $ | 305,474 | ||||||||||
| Unused funds on commercial and other lines of credit | 1,146,415 | 966,523 | ||||||||||||
| Unadvanced funds on home equity lines of credit | 347,543 | 336,924 | ||||||||||||
| Unadvanced funds on construction and real estate loans | 467,702 | 694,091 | ||||||||||||
| Standby letters of credit | 18,975 | 21,387 | ||||||||||||
| Total | $ | 2,237,512 | $ | 2,324,399 | ||||||||||
| (In thousands) | 2017 | 2016 | ||||||
| Commitments to originate new loans | $ | 244,252 | $ | 243,519 | ||||
| Unused funds on commercial and other lines of credit | 678,567 | 574,043 | ||||||
| Unadvanced funds on home equity lines of credit | 297,367 | 281,621 | ||||||
| Unadvanced funds on construction and real estate loans | 360,472 | 320,635 | ||||||
| Standby letters of credit | 13,613 | 14,939 | ||||||
| Lease obligation | 11,323 | 11,639 | ||||||
| Total | $ | 1,605,594 | $ | 1,446,396 | ||||
| Minimum Capital Requirement | ||||||||||||||||||||||||||
| Actual | ||||||||||||||||||||||||||
| (Dollars in thousands) | Amount | Ratio | Amount | Ratio | ||||||||||||||||||||||
| December 31, 2023 | ||||||||||||||||||||||||||
| Company (Consolidated) | ||||||||||||||||||||||||||
| Total capital to risk-weighted assets | $ | 1,371,740 | 14.36 | % | $ | 764,130 | 8.00 | % | ||||||||||||||||||
| Common Equity Tier 1 Capital to risk weighted assets | 1,149,620 | 12.04 | 429,823 | 4.50 | ||||||||||||||||||||||
| Tier 1 capital to risk-weighted assets | 1,171,957 | 12.27 | 573,098 | 6.00 | ||||||||||||||||||||||
| Tier 1 capital to average assets | 1,171,957 | 9.65 | 382,065 | 4.00 | ||||||||||||||||||||||
| Total risk-weighted assets | 9,551,627 | N/A | N/A | N/A | ||||||||||||||||||||||
| December 31, 2022 | ||||||||||||||||||||||||||
| Company (Consolidated) | ||||||||||||||||||||||||||
| Total capital to risk-weighted assets | $ | 1,336,029 | 14.60 | % | $ | 732,070 | 8.00 | % | ||||||||||||||||||
| Common Equity Tier 1 Capital to risk weighted assets | 1,130,522 | 12.35 | 411,789 | 4.50 | ||||||||||||||||||||||
| Tier 1 capital to risk-weighted assets | 1,152,808 | 12.60 | 549,052 | 6.00 | ||||||||||||||||||||||
| Tier 1 capital to average assets | 1,152,808 | 10.18 | 366,035 | 4.00 | ||||||||||||||||||||||
| Total risk-weighted assets | 9,150,869 | N/A | N/A | N/A | ||||||||||||||||||||||
Minimum Capital Requirement | Minimum to be Well Capitalized Under Prompt Corrective Action Provisions | ||||||||||||||||||||
| Actual | |||||||||||||||||||||
| (Dollars in thousands) | Amount | Ratio | Amount | Ratio | Amount | Ratio | |||||||||||||||
| December 31, 2017 | |||||||||||||||||||||
| Company (Consolidated) | |||||||||||||||||||||
| Total capital to risk-weighted assets | $ | 1,063,843 | 12.43 | % | $ | 684,692 | 8.00 | % | $ | 855,865 | N/A | ||||||||||
| Common Equity Tier 1 Capital to risk weighted assets | 942,389 | 11.01 | 385,139 | 4.50 | 556,312 | N/A | |||||||||||||||
| Tier 1 capital to risk-weighted assets | 954,103 | 11.15 | 513,519 | 6.00 | 684,692 | N/A | |||||||||||||||
| Tier 1 capital to average assets | 954,103 | 9.01 | 342,346 | 4.00 | 427,932 | N/A | |||||||||||||||
| Bank | |||||||||||||||||||||
| Total capital to risk-weighted assets | $ | 954,172 | 11.17 | % | $ | 683,103 | 8.00 | % | $ | 853,879 | 10.00 | % | |||||||||
| Common Equity Tier 1 Capital to risk weighted assets | 881,324 | 10.32 | 384,245 | 4.50 | 555,021 | 6.50 | |||||||||||||||
| Tier 1 capital to risk-weighted assets | 881,324 | 10.32 | 512,327 | 6.00 | 683,103 | 8.00 | |||||||||||||||
| Tier 1 capital to average assets | 881,324 | 8.32 | 341,552 | 4.00 | 426,939 | 5.00 | |||||||||||||||
| December 31, 2016 | |||||||||||||||||||||
| Company (Consolidated) | |||||||||||||||||||||
| Total capital to risk-weighted assets | $ | 803,618 | 11.87 | % | $ | 541,603 | 8.00 | % | $ | 677,004 | N/A | ||||||||||
| Common Equity Tier 1 Capital to risk weighted assets | 670,120 | 9.90 | 304,652 | 4.50 | 440,053 | N/A | |||||||||||||||
| Tier 1 capital to risk-weighted assets | 681,500 | 10.07 | 406,202 | 6.00 | 541,603 | N/A | |||||||||||||||
| Tier 1 capital to average assets | 681,500 | 7.88 | 270,802 | 4.00 | 338,502 | N/A | |||||||||||||||
| Bank | |||||||||||||||||||||
| Total capital to risk-weighted assets | $ | 756,792 | 11.21 | % | $ | 539,893 | 8.00 | % | $ | 674,866 | 10.00 | % | |||||||||
| Common Equity Tier 1 Capital to risk weighted assets | 672,244 | 9.96 | 303,690 | 4.50 | 438,663 | 6.50 | |||||||||||||||
| Tier 1 capital to risk-weighted assets | 672,244 | 9.96 | 404,920 | 6.00 | 539,893 | 8.00 | |||||||||||||||
| Tier 1 capital to average assets | 672,244 | 7.84 | 269,920 | 4.00 | 337,433 | 5.00 | |||||||||||||||
| Minimum Capital Requirement | Minimum to be Well Capitalized Under Prompt Corrective Action Provisions | |||||||||||||||||||||||||||||||||||||
| Actual | ||||||||||||||||||||||||||||||||||||||
| (Dollars in thousands) | Amount | Ratio | Amount | Ratio | Amount | Ratio | ||||||||||||||||||||||||||||||||
| December 31, 2023 | ||||||||||||||||||||||||||||||||||||||
| Bank | ||||||||||||||||||||||||||||||||||||||
| Total capital to risk-weighted assets | $ | 1,268,037 | 13.29 | % | $ | 763,503 | 8.00 | % | $ | 954,379 | 10.00 | % | ||||||||||||||||||||||||||
| Common Equity Tier 1 Capital to risk weighted assets | 1,167,282 | 12.23 | 429,470 | 4.50 | 620,346 | 6.50 | ||||||||||||||||||||||||||||||||
| Tier 1 capital to risk-weighted assets | 1,167,282 | 12.23 | 572,627 | 6.00 | 763,503 | 8.00 | ||||||||||||||||||||||||||||||||
| Tier 1 capital to average assets | 1,167,282 | 9.61 | 381,751 | 4.00 | 477,189 | 5.00 | ||||||||||||||||||||||||||||||||
| Total risk-weighted assets | 9,543,786 | N/A | N/A | N/A | N/A | N/A | ||||||||||||||||||||||||||||||||
| December 31, 2022 | ||||||||||||||||||||||||||||||||||||||
| Bank | ||||||||||||||||||||||||||||||||||||||
| Total capital to risk-weighted assets | $ | 1,239,722 | 13.56 | % | $ | 731,259 | 8.00 | % | $ | 914,074 | 10.00 | % | ||||||||||||||||||||||||||
| Common Equity Tier 1 Capital to risk weighted assets | 1,155,280 | 12.64 | 411,333 | 4.50 | 594,148 | 6.50 | ||||||||||||||||||||||||||||||||
| Tier 1 capital to risk-weighted assets | 1,155,280 | 12.64 | 548,444 | 6.00 | 731,259 | 8.00 | ||||||||||||||||||||||||||||||||
| Tier 1 capital to average assets | 1,155,280 | 10.20 | 365,629 | 4.00 | 457,037 | 5.00 | ||||||||||||||||||||||||||||||||
| Total risk-weighted assets | 9,140,737 | N/A | N/A | N/A | N/A | N/A | ||||||||||||||||||||||||||||||||
| (In thousands) | 2017 | 2016 | (In thousands) | 2023 | 2022 | |||||||||||||||||||||||
| Other accumulated comprehensive income/(loss), before tax: | ||||||||||||||||||||||||||||
| Net unrealized holding gain on AFS securities | $ | 10,034 | $ | 25,176 | ||||||||||||||||||||||||
| Other accumulated comprehensive (loss), before tax: | Other accumulated comprehensive (loss), before tax: | |||||||||||||||||||||||||||
| Net unrealized holding (loss) on AFS securities | ||||||||||||||||||||||||||||
| Net (loss) on effective cash flow hedging derivatives | — | (6,573 | ) | |||||||||||||||||||||||||
| Net unrealized holding (loss) on pension plans | ||||||||||||||||||||||||||||
| Net unrealized holding (loss) on pension plans | ||||||||||||||||||||||||||||
| Net unrealized holding (loss) on pension plans | (3,048 | ) | (2,954 | ) | ||||||||||||||||||||||||
| Income taxes related to items of accumulated other comprehensive income/(loss): | ||||||||||||||||||||||||||||
| Net unrealized holding (gain) on AFS securities | (4,026 | ) | (9,636 | ) | ||||||||||||||||||||||||
| Income taxes related to items of accumulated other comprehensive (loss): | ||||||||||||||||||||||||||||
| Income taxes related to items of accumulated other comprehensive (loss): | ||||||||||||||||||||||||||||
| Income taxes related to items of accumulated other comprehensive (loss): | ||||||||||||||||||||||||||||
| Net unrealized holding loss on AFS securities | ||||||||||||||||||||||||||||
| Net loss on effective cash flow hedging derivatives | — | 2,589 | ||||||||||||||||||||||||||
| Net unrealized holding loss on pension plans | 1,201 | 1,164 | ||||||||||||||||||||||||||
| Accumulated other comprehensive income/(loss) | $ | 4,161 | $ | 9,766 | ||||||||||||||||||||||||
| Net unrealized holding loss on pension plans | ||||||||||||||||||||||||||||
| Net unrealized holding loss on pension plans | ||||||||||||||||||||||||||||
| Accumulated other comprehensive (loss) | ||||||||||||||||||||||||||||
| (In thousands) | Before Tax | Tax Effect | Net of Tax | |||||||||||||||||
| Year Ended December 31, 2023 | ||||||||||||||||||||
| Net unrealized holding gain on AFS securities: | ||||||||||||||||||||
| Net unrealized gain arising during the period | $ | 22,903 | $ | (5,122) | $ | 17,781 | ||||||||||||||
| Less: reclassification adjustment for (losses) realized in net income | (25,057) | 6,806 | (18,251) | |||||||||||||||||
| Net unrealized holding gain on AFS securities | 47,960 | (11,928) | 36,032 | |||||||||||||||||
| Net gain on cash flow hedging derivatives: | ||||||||||||||||||||
| Net unrealized gain arising during the period | 1,770 | (458) | 1,312 | |||||||||||||||||
| Less: reclassification adjustment for (losses) realized in net income | (632) | 172 | (460) | |||||||||||||||||
| Net gain on cash flow hedging derivatives | 2,402 | (630) | 1,772 | |||||||||||||||||
| Net unrealized holding gain on pension plans | ||||||||||||||||||||
| Net unrealized gain arising during the period | 316 | (84) | 232 | |||||||||||||||||
| Less: reclassification adjustment for (losses) realized in net income | — | — | — | |||||||||||||||||
| Net unrealized holding gain on pension plans | 316 | (84) | 232 | |||||||||||||||||
| Other comprehensive income | $ | 50,678 | $ | (12,642) | $ | 38,036 | ||||||||||||||
| (In thousands) | Before Tax | Tax Effect | Net of Tax | |||||||||||||||||
| Year Ended December 31, 2022 | ||||||||||||||||||||
| Net unrealized holding (loss) on AFS securities: | ||||||||||||||||||||
| Net unrealized (loss) arising during the period | $ | (235,075) | $ | 60,920 | $ | (174,155) | ||||||||||||||
| Less: reclassification adjustment for gains realized in net income | 6 | (2) | 4 | |||||||||||||||||
| Net unrealized holding (loss) on AFS securities | (235,081) | 60,922 | (174,159) | |||||||||||||||||
| Net (loss) on cash flow hedging derivatives: | ||||||||||||||||||||
| Net unrealized (loss) arising during the period | (6,667) | 1,789 | (4,878) | |||||||||||||||||
| Less: reclassification adjustment for (losses) realized in net income | — | — | — | |||||||||||||||||
| Net (loss) on cash flow hedging derivatives | (6,667) | 1,789 | (4,878) | |||||||||||||||||
| Net unrealized holding gain on pension plans | ||||||||||||||||||||
| Net unrealized gain arising during the period | 1,674 | (446) | 1,228 | |||||||||||||||||
| Less: reclassification adjustment for (losses) realized in net income | — | — | — | |||||||||||||||||
| Net unrealized holding gain on pension plans | 1,674 | (446) | 1,228 | |||||||||||||||||
| Other comprehensive (loss) | $ | (240,074) | $ | 62,265 | $ | (177,809) | ||||||||||||||
| (In thousands) | Before Tax | Tax Effect | Net of Tax | |||||||||||||||||
| Year Ended December 31, 2021 | ||||||||||||||||||||
| Net unrealized holding (loss) on AFS securities: | ||||||||||||||||||||
| Net unrealized (loss) arising during the period | $ | (46,794) | $ | 11,937 | $ | (34,857) | ||||||||||||||
| Less: reclassification adjustment for gains realized in net income | — | — | — | |||||||||||||||||
| Net unrealized holding (loss) on AFS securities | (46,794) | 11,937 | (34,857) | |||||||||||||||||
| Net unrealized holding gain on pension plans | ||||||||||||||||||||
| Net unrealized gain arising during the period | 993 | (250) | 743 | |||||||||||||||||
| Less: reclassification adjustment for (losses) realized in net income | — | — | — | |||||||||||||||||
| Net unrealized holding gain on pension plans | 993 | (250) | 743 | |||||||||||||||||
| Other comprehensive (loss) | $ | (45,801) | $ | 11,687 | $ | (34,114) | ||||||||||||||
| (In thousands) | Before Tax | Tax Effect | Net of Tax | |||||||||
| Year Ended December 31, 2017 | ||||||||||||
| Net unrealized holding gain on AFS securities: | ||||||||||||
| Net unrealized (loss) arising during the period | $ | (2,544 | ) | $ | 1,075 | $ | (1,469 | ) | ||||
| Less: reclassification adjustment for gains realized in net income | 12,598 | (4,535 | ) | 8,063 | ||||||||
| Net unrealized holding (loss) on AFS securities | (15,142 | ) | 5,610 | (9,532 | ) | |||||||
| Net loss on cash flow hedging derivatives: | ||||||||||||
| Net unrealized (loss) arising during the period | (449 | ) | 180 | (269 | ) | |||||||
| Less: reclassification adjustment for (losses) realized in net income | (7,022 | ) | 2,769 | (4,253 | ) | |||||||
| Net gain on cash flow hedging derivatives | 6,573 | (2,589 | ) | 3,984 | ||||||||
| Net unrealized holding (loss) on pension plans | ||||||||||||
| Net unrealized (loss) arising during the period | (311 | ) | 124 | (187 | ) | |||||||
| Less: reclassification adjustment for losses realized in net income | (217 | ) | 87 | (130 | ) | |||||||
| Net unrealized holding (loss) on pension plans | (94 | ) | 37 | (57 | ) | |||||||
| Other Comprehensive Income(Loss) | $ | (8,663 | ) | $ | 3,058 | $ | (5,605 | ) | ||||
| (In thousands) | Before Tax | Tax Effect | Net of Tax | |||||||||
| Year Ended December 31, 2016 | ||||||||||||
| Net unrealized holding gain on AFS securities: | ||||||||||||
| Net unrealized gain arising during the period | $ | 18,308 | $ | (6,979 | ) | $ | 11,329 | |||||
| Less: reclassification adjustment for (losses) realized in net income | (551 | ) | 220 | (331 | ) | |||||||
| Net unrealized holding gain on AFS securities | 18,859 | (7,199 | ) | 11,660 | ||||||||
| Net (loss) on cash flow hedging derivatives: | ||||||||||||
| Net unrealized (loss) arising during the period | (2,022 | ) | 754 | (1,268 | ) | |||||||
| Less: reclassification adjustment for (losses) realized in net income | (3,981 | ) | 1,589 | (2,392 | ) | |||||||
| Net gain on cash flow hedging derivatives | 1,959 | (835 | ) | 1,124 | ||||||||
| Net unrealized holding gain on pension plans | ||||||||||||
| Net unrealized gain arising during the period | 351 | (155 | ) | 196 | ||||||||
| Less: reclassification adjustment for (losses) realized in net income | (164 | ) | 73 | (91 | ) | |||||||
| Net unrealized holding gain on pension plans | 515 | (228 | ) | 287 | ||||||||
| Other Comprehensive Income | $ | 21,333 | $ | (8,262 | ) | $ | 13,071 | |||||
| (In thousands) | Before Tax | Tax Effect | Net of Tax | |||||||||
| Year Ended December 31, 2015 | ||||||||||||
| Net unrealized holding gain on AFS securities: | ||||||||||||
| Net unrealized loss arising during the period | $ | (7,567 | ) | $ | 2,793 | $ | (4,774 | ) | ||||
| Less: reclassification adjustment for gains realized in net income | 2,110 | (847 | ) | 1,263 | ||||||||
| Net unrealized holding loss on AFS securities | (9,677 | ) | 3,640 | (6,037 | ) | |||||||
| Net (loss) on cash flow hedging derivatives: | ||||||||||||
| Net unrealized (loss) arising during the period | (5,232 | ) | 2,094 | (3,138 | ) | |||||||
| Less: reclassification adjustment for (losses) realized in net income | — | — | — | |||||||||
| Net (loss) on cash flow hedging derivatives | (5,232 | ) | 2,094 | (3,138 | ) | |||||||
| Net unrealized holding (loss) on pension plans | ||||||||||||
| Net unrealized (loss) arising during the period | (1,436 | ) | 572 | (864 | ) | |||||||
| Less: reclassification adjustment for (losses) realized in net income | (259 | ) | 104 | (155 | ) | |||||||
| Net unrealized holding (loss) on pension plans | (1,177 | ) | 468 | (709 | ) | |||||||
| Other Comprehensive Loss | $ | (16,086 | ) | $ | 6,202 | $ | (9,884 | ) | ||||
| (in thousands) | Net unrealized holding gain (loss) on AFS Securities | Net loss on effective cash flow hedging derivatives | Net unrealized holding gain (loss) on pension plans | Total | ||||||||||||||||||||||||||||
| Year Ended December 31, 2023 | ||||||||||||||||||||||||||||||||
| Balance at Beginning of Year | $ | (175,557) | $ | (4,878) | $ | (617) | $ | (181,052) | ||||||||||||||||||||||||
| Other comprehensive income before reclassifications | 17,781 | 1,312 | 232 | 19,325 | ||||||||||||||||||||||||||||
| Amounts reclassified from accumulated other comprehensive income | (18,251) | (460) | — | (18,711) | ||||||||||||||||||||||||||||
| Total other comprehensive income | 36,032 | 1,772 | 232 | 38,036 | ||||||||||||||||||||||||||||
| Balance at End of Period | $ | (139,525) | $ | (3,106) | $ | (385) | $ | (143,016) | ||||||||||||||||||||||||
| Year Ended December 31, 2022 | ||||||||||||||||||||||||||||||||
| Balance at Beginning of Year | $ | (1,398) | $ | — | $ | (1,845) | $ | (3,243) | ||||||||||||||||||||||||
| Other comprehensive (loss)/income before reclassifications | (174,155) | (4,878) | 1,228 | (177,805) | ||||||||||||||||||||||||||||
| Amounts reclassified from accumulated other comprehensive income | 4 | — | — | 4 | ||||||||||||||||||||||||||||
| Total other comprehensive (loss)/income | (174,159) | (4,878) | 1,228 | (177,809) | ||||||||||||||||||||||||||||
| Balance at End of Period | $ | (175,557) | $ | (4,878) | $ | (617) | $ | (181,052) | ||||||||||||||||||||||||
| Year Ended December 31, 2021 | ||||||||||||||||||||||||||||||||
| Balance at Beginning of Year | $ | 33,459 | $ | — | $ | (2,588) | $ | 30,871 | ||||||||||||||||||||||||
| Other comprehensive (loss)/income before reclassifications | (34,857) | — | 743 | (34,114) | ||||||||||||||||||||||||||||
| Amounts reclassified from accumulated other comprehensive income | — | — | — | — | ||||||||||||||||||||||||||||
| Total other comprehensive (loss)/income | (34,857) | — | 743 | (34,114) | ||||||||||||||||||||||||||||
| Balance at End of Period | $ | (1,398) | $ | — | $ | (1,845) | $ | (3,243) | ||||||||||||||||||||||||
| (in thousands) | Net unrealized holding gain (loss) on AFS Securities | Net loss on effective cash flow hedging derivatives | Net unrealized holding gain (loss) on pension plans | Total | ||||||||||||
| Year Ended December 31, 2017 | ||||||||||||||||
| Balance at Beginning of Year | $ | 15,540 | $ | (3,984 | ) | $ | (1,790 | ) | $ | 9,766 | ||||||
| Other comprehensive gain (loss) before reclassifications | (1,469 | ) | (269 | ) | (187 | ) | (1,925 | ) | ||||||||
| Amounts reclassified from accumulated other comprehensive income | 8,063 | (4,253 | ) | (130 | ) | 3,680 | ||||||||||
| Total Other Comprehensive (Loss) Income | (9,532 | ) | 3,984 | (57 | ) | (5,605 | ) | |||||||||
| Balance at End of Period | $ | 6,008 | $ | — | $ | (1,847 | ) | $ | 4,161 | |||||||
| Year Ended December 31, 2016 | ||||||||||||||||
| Balance at Beginning of Year | $ | 3,880 | $ | (5,108 | ) | $ | (2,077 | ) | $ | (3,305 | ) | |||||
| Other comprehensive gain (loss) before reclassifications | 11,329 | (1,268 | ) | 196 | 10,257 | |||||||||||
| Amounts reclassified from accumulated other comprehensive income | (331 | ) | (2,392 | ) | (91 | ) | (2,814 | ) | ||||||||
| Total Other Comprehensive Income | 11,660 | 1,124 | 287 | 13,071 | ||||||||||||
| Balance at End of Period | $ | 15,540 | $ | (3,984 | ) | $ | (1,790 | ) | $ | 9,766 | ||||||
| Year Ended December 31, 2015 | ||||||||||||||||
| Balance at Beginning of Year | $ | 9,916 | $ | (1,969 | ) | $ | (1,368 | ) | $ | 6,579 | ||||||
| Other comprehensive gain (loss) Before reclassifications | (4,774 | ) | (3,138 | ) | (864 | ) | (8,776 | ) | ||||||||
| Amounts reclassified from accumulated other comprehensive income | 1,263 | — | (155 | ) | 1,108 | |||||||||||
| Total Other Comprehensive (Loss) | (6,037 | ) | (3,138 | ) | (709 | ) | (9,884 | ) | ||||||||
| Balance at End of Period | $ | 3,880 | $ | (5,108 | ) | $ | (2,077 | ) | $ | (3,305 | ) | |||||
| Affected Line Item in the Statement Where Net Income Is Presented | ||||||||||||||||||||||||||
| Years Ended December 31, | ||||||||||||||||||||||||||
| (in thousands) | 2023 | 2022 | 2021 | |||||||||||||||||||||||
| Realized (losses)/gains on AFS securities: | ||||||||||||||||||||||||||
| $ | (25,057) | $ | 6 | $ | — | Non-interest income | ||||||||||||||||||||
| 6,806 | (2) | — | Tax expense | |||||||||||||||||||||||
| (18,251) | 4 | — | ||||||||||||||||||||||||
| Realized (losses) on cash flow hedging derivatives: | ||||||||||||||||||||||||||
| (632) | — | — | Interest expense | |||||||||||||||||||||||
| — | — | — | Non-interest expense | |||||||||||||||||||||||
| 172 | — | — | Tax benefit | |||||||||||||||||||||||
| (460) | — | — | ||||||||||||||||||||||||
| Realized (losses) on pension plans: | ||||||||||||||||||||||||||
| — | — | — | Non-interest expense | |||||||||||||||||||||||
| — | — | — | Tax expense | |||||||||||||||||||||||
| — | — | — | ||||||||||||||||||||||||
| Total reclassifications for the period | $ | (18,711) | $ | 4 | $ | — | ||||||||||||||||||||
| Affected Line Item in the Statement Where Net Income Is Presented | ||||||||||||||
| Years Ended December 31, | ||||||||||||||
| (in thousands) | 2017 | 2016 | 2015 | |||||||||||
| Realized (losses) gains on AFS securities: | ||||||||||||||
| $ | 12,598 | $ | (551 | ) | $ | 2,110 | Non-interest income | |||||||
| (4,535 | ) | 220 | (847 | ) | Tax expense | |||||||||
| 8,063 | (331 | ) | 1,263 | |||||||||||
| Realized (losses) on cash flow hedging derivatives: | ||||||||||||||
| (393 | ) | — | — | Interest expense | ||||||||||
| (6,629 | ) | — | — | Non-interest income | ||||||||||
| — | (3,981 | ) | — | Non-interest expense | ||||||||||
| 2,769 | 1,589 | — | Tax benefit | |||||||||||
| (4,253 | ) | (2,392 | ) | — | ||||||||||
| Realized (losses) on pension plans | ||||||||||||||
| (217 | ) | (164 | ) | (259 | ) | Non-interest expense | ||||||||
| 87 | 73 | 104 | Tax expense | |||||||||||
| (130 | ) | (91 | ) | (155 | ) | |||||||||
| Total reclassifications for the period | $ | 3,680 | $ | (2,814 | ) | $ | 1,108 | |||||||
| Years Ended December 31, | Years Ended December 31, | ||||||||||||||||||||||||||||||||||||||||
| (In thousands, except per share data) | 2017 | 2016 | 2015 | (In thousands, except per share data) | 2023 | 2022 | 2021 | ||||||||||||||||||||||||||||||||||
| Net income | |||||||||||||||||||||||||||||||||||||||||
| Net income | |||||||||||||||||||||||||||||||||||||||||
| Net income | $ | 55,247 | $ | 58,670 | $ | 49,518 | |||||||||||||||||||||||||||||||||||
| Average number of common shares issued | 40,627 | 32,604 | 30,074 | ||||||||||||||||||||||||||||||||||||||
| Average number of common shares issued | |||||||||||||||||||||||||||||||||||||||||
| Average number of common shares issued | |||||||||||||||||||||||||||||||||||||||||
| Less: average number of treasury shares | 963 | 1,116 | 1,215 | ||||||||||||||||||||||||||||||||||||||
| Less: average number of unvested stock award shares | 437 | 500 | 466 | ||||||||||||||||||||||||||||||||||||||
| Plus: average participating preferred shares | 229 | — | — | ||||||||||||||||||||||||||||||||||||||
| Average number of basic common shares outstanding | |||||||||||||||||||||||||||||||||||||||||
| Average number of basic common shares outstanding | |||||||||||||||||||||||||||||||||||||||||
| Average number of basic common shares outstanding | 39,456 | 30,988 | 28,393 | ||||||||||||||||||||||||||||||||||||||
| Plus: dilutive effect of unvested stock award shares | 202 | 122 | 106 | ||||||||||||||||||||||||||||||||||||||
| Plus: dilutive effect of stock options outstanding | 37 | 57 | 65 | ||||||||||||||||||||||||||||||||||||||
| Average number of diluted common shares outstanding | 39,695 | 31,167 | 28,564 | ||||||||||||||||||||||||||||||||||||||
| Basic earning per common share | $ | 1.40 | $ | 1.89 | $ | 1.74 | |||||||||||||||||||||||||||||||||||
| Basic earnings per common share | |||||||||||||||||||||||||||||||||||||||||
| Basic earnings per common share | |||||||||||||||||||||||||||||||||||||||||
| Basic earnings per common share | |||||||||||||||||||||||||||||||||||||||||
| Diluted earnings per common share | $ | 1.39 | $ | 1.88 | $ | 1.73 | |||||||||||||||||||||||||||||||||||
| Diluted earnings per common share | |||||||||||||||||||||||||||||||||||||||||
| Diluted earnings per common share | |||||||||||||||||||||||||||||||||||||||||
| Non-vested Stock Awards Outstanding | Stock Options Outstanding | |||||||||||||||||||||||||
| (Shares in thousands) | Number of Shares | Weighted- Average Grant Date Fair Value | Number of Shares | Weighted- Average Exercise Price | ||||||||||||||||||||||
| Balance, December 31, 2022 | 704 | $ | 22.85 | 49 | $ | 26.46 | ||||||||||||||||||||
| Granted | 446 | 26.18 | — | — | ||||||||||||||||||||||
| Stock options exercised | — | — | — | — | ||||||||||||||||||||||
| Stock awards vested | (262) | 21.29 | — | — | ||||||||||||||||||||||
| Forfeited | (103) | 25.67 | — | — | ||||||||||||||||||||||
| Expired | — | — | — | — | ||||||||||||||||||||||
| Balance, December 31, 2023 | 785 | $ | 24.92 | 49 | $ | 26.46 | ||||||||||||||||||||
| Non-vested Stock Awards Outstanding | Stock Options Outstanding | |||||||||||||
| (Shares in thousands) | Number of Shares | Weighted- Average Grant Date Fair Value | Number of Shares | Weighted- Average Exercise Price | ||||||||||
| Balance, December 31, 2016 | 448 | $ | 26.28 | 109 | $ | 15.72 | ||||||||
| Granted | 161 | 35.84 | — | — | ||||||||||
| Stock options exercised | — | — | (19 | ) | 17.74 | |||||||||
| Stock awards vested | (174 | ) | 25.68 | — | — | |||||||||
| Forfeited | (17 | ) | 30.04 | — | — | |||||||||
| Expired | — | — | (14 | ) | 29.35 | |||||||||
| Balance, December 31, 2017 | 418 | $ | 29.68 | 76 | $ | 13.59 | ||||||||
| December 31, 2023 | ||||||||||||||||||||||||||
| (In thousands) | Level 1 Inputs | Level 2 Inputs | Level 3 Inputs | Total Fair Value | ||||||||||||||||||||||
| Trading security | $ | — | $ | — | $ | 6,142 | $ | 6,142 | ||||||||||||||||||
| Available-for-sale securities: | ||||||||||||||||||||||||||
| U.S Treasuries | 7,981 | — | — | 7,981 | ||||||||||||||||||||||
| Municipal bonds and obligations | — | 63,853 | — | 63,853 | ||||||||||||||||||||||
| Agency collateralized mortgage obligations | — | 347,874 | — | 347,874 | ||||||||||||||||||||||
| Agency residential mortgage-backed securities | — | 417,480 | — | 417,480 | ||||||||||||||||||||||
| Agency commercial mortgage-backed securities | — | 145,326 | — | 145,326 | ||||||||||||||||||||||
| Corporate bonds | — | 35,192 | 3,923 | 39,115 | ||||||||||||||||||||||
| Other bonds and obligations | — | 656 | — | 656 | ||||||||||||||||||||||
| Marketable equity securities | 13,029 | — | — | 13,029 | ||||||||||||||||||||||
| Loans held for investment | — | — | 374 | 374 | ||||||||||||||||||||||
| Loans held for sale | — | 2,237 | — | 2,237 | ||||||||||||||||||||||
| Derivative assets | — | 45,613 | 55 | 45,668 | ||||||||||||||||||||||
| Capitalized servicing rights | — | — | 1,526 | 1,526 | ||||||||||||||||||||||
| Derivative liabilities | — | 75,957 | — | 75,957 | ||||||||||||||||||||||
| December 31, 2022 | |||||||||||||||||||||||
| Level 1 Inputs | Level 2 Inputs | Level 3 Inputs | Total Fair Value | ||||||||||||||||||||
| (In thousands) | |||||||||||||||||||||||
| Trading security | $ | — | $ | — | $ | 6,708 | $ | 6,708 | |||||||||||||||
| Securities available for sale: | |||||||||||||||||||||||
| U.S Treasuries | 11,973 | — | — | 11,973 | |||||||||||||||||||
| Municipal bonds and obligations | — | 63,335 | — | 63,335 | |||||||||||||||||||
| Agency collateralized mortgage obligations | — | 531,945 | — | 531,945 | |||||||||||||||||||
| Agency residential mortgage-backed securities | — | 546,313 | — | 546,313 | |||||||||||||||||||
| Agency commercial mortgage-backed securities | — | 228,468 | — | 228,468 | |||||||||||||||||||
| Corporate bonds | — | 36,510 | 4,000 | 40,510 | |||||||||||||||||||
| Other bonds and obligations | — | 656 | 656 | ||||||||||||||||||||
| Marketable equity securities | 12,856 | — | — | 12,856 | |||||||||||||||||||
| Loans held for investment at fair value | — | — | 605 | 605 | |||||||||||||||||||
| Loans held for sale | — | 942 | — | 942 | |||||||||||||||||||
| Derivative assets | — | 54,216 | 25 | 54,241 | |||||||||||||||||||
| Capitalized servicing rights | — | — | 1,846 | 1,846 | |||||||||||||||||||
| Derivative liabilities | — | 97,030 | — | 97,030 | |||||||||||||||||||
| December 31, 2017 | ||||||||||||||||
| (In thousands) | Level 1 Inputs | Level 2 Inputs | Level 3 Inputs | Total Fair Value | ||||||||||||
| Trading security | $ | — | $ | — | $ | 12,277 | $ | 12,277 | ||||||||
| Available-for-sale securities: | ||||||||||||||||
| Municipal bonds and obligations | — | 118,233 | — | 118,233 | ||||||||||||
| Agency collateralized mortgage obligations | — | 851,158 | — | 851,158 | ||||||||||||
| Agency residential mortgage-backed securities | — | 216,940 | — | 216,940 | ||||||||||||
| Agency commercial mortgage-backed securities | — | 62,305 | — | 62,305 | ||||||||||||
| Corporate bonds | — | 110,721 | — | 110,721 | ||||||||||||
| Trust preferred securities | — | 11,677 | — | 11,677 | ||||||||||||
| Other bonds and obligations | — | 9,880 | — | 9,880 | ||||||||||||
| Marketable equity securities | 44,851 | 334 | — | 45,185 | ||||||||||||
| Loans held for sale | — | 153,620 | — | 153,620 | ||||||||||||
| Derivative assets | — | 14,049 | 5,259 | 19,308 | ||||||||||||
| Other assets | — | — | 3,834 | 3,834 | ||||||||||||
| Derivative liabilities | 104 | 15,715 | 19 | 15,838 | ||||||||||||
| December 31, 2016 | ||||||||||||||||
| (In thousands) | Level 1 Inputs | Level 2 Inputs | Level 3 Inputs | Total Fair Value | ||||||||||||
| Trading security | $ | — | $ | — | $ | 13,229 | $ | 13,229 | ||||||||
| Available-for-sale securities: | ||||||||||||||||
| Municipal bonds and obligations | — | 119,816 | — | 119,816 | ||||||||||||
| Agency collateralized mortgage obligations | — | 651,911 | — | 651,911 | ||||||||||||
| Agency residential mortgage-backed securities | — | 228,684 | — | 228,684 | ||||||||||||
| Agency commercial mortgage-backed securities | — | 64,534 | — | 64,534 | ||||||||||||
| Corporate bonds | — | 56,006 | — | 56,006 | ||||||||||||
| Trust preferred securities | — | 11,887 | — | 11,887 | ||||||||||||
| Other bonds and obligations | — | 11,158 | — | 11,158 | ||||||||||||
| Marketable equity securities | 62,284 | 3,257 | — | 65,541 | ||||||||||||
| Loans held for sale | — | 120,673 | — | 120,673 | ||||||||||||
| Derivative assets | 622 | 16,157 | 4,838 | 21,617 | ||||||||||||
| Other assets | — | — | 798 | 798 | ||||||||||||
| Derivative liabilities | — | 24,420 | — | 24,420 | ||||||||||||
| Aggregate Fair Value | ||||||||||||||||||||
| December 31, 2023 | Aggregate | Aggregate | Less Aggregate | |||||||||||||||||
| (In thousands) | Fair Value | Unpaid Principal | Unpaid Principal | |||||||||||||||||
| Loans held for investment at fair value | $ | 374 | $ | 8,809 | $ | (8,435) | ||||||||||||||
| Aggregate Fair Value | ||||||||||||||||||||
| December 31, 2022 | Aggregate | Aggregate | Less Aggregate | |||||||||||||||||
| (In thousands) | Fair Value | Unpaid Principal | Unpaid Principal | |||||||||||||||||
| Loans held for investment at fair value | $ | 605 | $ | 10,948 | $ | (10,343) | ||||||||||||||
| Aggregate Fair Value | Aggregate Unpaid Principal | Aggregate Fair Value Less Aggregate Unpaid Principal | ||||||||||||||||||
| December 31, 2023 (In thousands) | ||||||||||||||||||||
| Loans held for sale | $ | 2,237 | $ | 2,205 | $ | 32 | ||||||||||||||
| Aggregate Fair Value | Aggregate Unpaid Principal | Aggregate Fair Value Less Aggregate Unpaid Principal | ||||||||||
| December 31, 2017 (In thousands) | ||||||||||||
| Loans Held for Sale | $ | 153,620 | $ | 149,022 | $ | 4,598 | ||||||
| Aggregate Fair Value | Aggregate Unpaid Principal | Aggregate Fair Value Less Aggregate Unpaid Principal | ||||||||||
| December 31, 2016 (In thousands) | ||||||||||||
| Loans Held for Sale | $ | 120,673 | $ | 118,178 | $ | 2,495 | ||||||
| Aggregate Fair Value | Aggregate Unpaid Principal | Aggregate Fair Value Less Aggregate Unpaid Principal | ||||||||||||||||||
| December 31, 2022 (In thousands) | ||||||||||||||||||||
| Loans held for sale | $ | 942 | $ | 927 | $ | 15 | ||||||||||||||
| Assets (Liabilities) | ||||||||||||||||||||||||||||||||||||||
| (In thousands) | Trading Security | Securities Available for Sale | Loans Held for Investment | Commitments to Lend | Forward Commitments | Capitalized Servicing Rights | ||||||||||||||||||||||||||||||||
| Balance as of December 31, 2021 | $ | 8,354 | $ | 4,030 | $ | 1,200 | $ | 124 | $ | 134 | $ | 1,966 | ||||||||||||||||||||||||||
| Unrealized (loss) gain, net recognized in other non-interest income | (828) | — | 314 | 200 | (126) | (120) | ||||||||||||||||||||||||||||||||
| Unrealized (loss) included in accumulated other comprehensive loss | — | (30) | — | — | — | — | ||||||||||||||||||||||||||||||||
| Paydown of asset | (818) | — | (909) | — | — | — | ||||||||||||||||||||||||||||||||
| Transfers to loans held for sale | — | — | — | (307) | — | — | ||||||||||||||||||||||||||||||||
| Balance as of December 31, 2022 | $ | 6,708 | $ | 4,000 | $ | 605 | $ | 17 | $ | 8 | $ | 1,846 | ||||||||||||||||||||||||||
| Unrealized gain (loss), net recognized in other non-interest income | 294 | — | (128) | 305 | 13 | (320) | ||||||||||||||||||||||||||||||||
| Unrealized (loss) in included in accumulated other comprehensive loss | — | (77) | — | — | — | — | ||||||||||||||||||||||||||||||||
| Paydown of asset | (860) | — | (103) | — | — | — | ||||||||||||||||||||||||||||||||
| Transfers to loans held for sale | — | — | (288) | — | — | |||||||||||||||||||||||||||||||||
| Balance as of December 31, 2023 | $ | 6,142 | $ | 3,923 | $ | 374 | $ | 34 | $ | 21 | $ | 1,526 | ||||||||||||||||||||||||||
| Unrealized (losses)/gains relating to instruments still held at December 31, 2023 | $ | (60) | $ | (77) | $ | — | $ | 34 | $ | 21 | $ | — | ||||||||||||||||||||||||||
| Unrealized (losses)/gains relating to instruments still held at December 31, 2022 | $ | (354) | $ | — | $ | — | $ | 17 | $ | 8 | $ | — | ||||||||||||||||||||||||||
| Assets (Liabilities) | ||||||||||||||||||||
| (In thousands) | Trading Security | Securities Available for Sale | Commitments to Lend | Forward Commitments | Capitalized Servicing Rights | |||||||||||||||
| Balance as of December 31, 2015 | $ | 14,189 | $ | 708 | $ | 323 | $ | 9 | $ | — | ||||||||||
| Amounts acquired from First Choice Bank | — | — | 3,900 | — | 696 | |||||||||||||||
| Unrealized (loss) gain, net recognized in other non-interest income | (362 | ) | — | 13,563 | 91 | 102 | ||||||||||||||
| Unrealized gain included in accumulated other comprehensive loss | — | — | — | — | — | |||||||||||||||
| Transfers to Level 2 | — | (708 | ) | — | — | — | ||||||||||||||
| Paydown of trading security | (598 | ) | — | — | — | — | ||||||||||||||
| Transfers to loans held for sale | — | — | (13,048 | ) | — | — | ||||||||||||||
| Balance as of December 31, 2016 | $ | 13,229 | $ | — | $ | 4,738 | $ | 100 | $ | 798 | ||||||||||
| Unrealized (loss) gain, net recognized in other non-interest income | (320 | ) | — | 63,894 | (81 | ) | (221 | ) | ||||||||||||
| Unrealized gain included in accumulated other comprehensive loss | — | — | — | — | — | |||||||||||||||
| Transfers to Level 2 | — | — | — | — | — | |||||||||||||||
| Paydown of trading security | (632 | ) | — | — | — | — | ||||||||||||||
| Transfers to loans held for sale | — | — | (63,373 | ) | — | — | ||||||||||||||
| Additions to servicing rights | — | — | — | — | 3,257 | |||||||||||||||
| Balance as of December 31, 2017 | $ | 12,277 | $ | — | $ | 5,259 | $ | 19 | $ | 3,834 | ||||||||||
| Unrealized gains (losses) relating to instruments still held at December 31, 2017 | $ | 1,522 | $ | — | $ | 5,259 | $ | 19 | $ | (221 | ) | |||||||||
| Unrealized gains relating to instruments still held at December 31, 2016 | $ | 1,843 | $ | — | $ | 4,738 | $ | 100 | $ | 102 | ||||||||||
| Fair Value | Significant Unobservable Input Value | |||||||||||||||||||||||||
| (In thousands) | December 31, 2023 | Valuation Techniques | Unobservable Inputs | |||||||||||||||||||||||
| Assets | ||||||||||||||||||||||||||
| Trading Security | $ | 6,142 | Discounted Cash Flow | Discount Rate | 4.19 | % | ||||||||||||||||||||
| Securities Available for Sale | 3,923 | Indication from Market Maker | Price | 98.07 | % | |||||||||||||||||||||
| Loans held for investment | 374 | Discounted Cash Flow | Discount Rate | 25.00 | % | |||||||||||||||||||||
| Collateral Value | $0.0 - $18.3 | |||||||||||||||||||||||||
| Commitments to Lend | 34 | Historical Trend | Closing Ratio | 84.29 | % | |||||||||||||||||||||
| Pricing Model | Origination Costs, per loan | $ | 3 | |||||||||||||||||||||||
| Forward Commitments | 21 | Historical Trend | Closing Ratio | 84.29 | % | |||||||||||||||||||||
| Pricing Model | Origination Costs, per loan | $ | 3 | |||||||||||||||||||||||
| Capitalized Servicing Rights | 1,526 | Discounted cash flow | Constant prepayment rate (CPR) | 7.63 | % | |||||||||||||||||||||
| Discount rate | 11.08 | % | ||||||||||||||||||||||||
| Total | $ | 12,020 | ||||||||||||||||||||||||
| Fair Value | Significant Unobservable Input Value | |||||||||||
| (In thousands) | December 31, 2017 | Valuation Techniques | Unobservable Inputs | |||||||||
| Assets | ||||||||||||
| Trading Security | $ | 12,277 | Discounted Cash Flow | Discount Rate | 2.74 | % | ||||||
| Forward Commitments | 19 | Historical Trend | Closing Ratio | 81.53 | % | |||||||
| Pricing Model | Origination Costs, per loan | $ | 3,692 | |||||||||
| Commitments to Lend | 5,259 | Historical Trend | Closing Ratio | 81.53 | % | |||||||
| Pricing Model | Origination Costs, per loan | $ | 3,692 | |||||||||
| Capitalized Servicing Rights | 3,834 | Discounted cash flow | Constant prepayment rate (CPR) | 10.00 | % | |||||||
| Discount rate | 10.95 | % | ||||||||||
| Total | $ | 21,389 | ||||||||||
| Fair Value | Significant Unobservable Input Value | |||||||||||||||||||||||||
| (In thousands) | December 31, 2022 | Valuation Techniques | Unobservable Inputs | |||||||||||||||||||||||
| Assets | ||||||||||||||||||||||||||
| Trading Security | $ | 6,708 | Discounted Cash Flow | Discount Rate | 5.92 | % | ||||||||||||||||||||
| Securities Available for Sale | 4,000 | Indication from Market Maker | Price | 100.00 | % | |||||||||||||||||||||
| Loans held for investment | 605 | Discounted Cash Flow | Discount Rate | 25.00 | % | |||||||||||||||||||||
| Collateral Value | $0.0 -$20.4 | |||||||||||||||||||||||||
| Commitments to Lend | 17 | Historical Trend | Closing Ratio | 80.63 | % | |||||||||||||||||||||
| Pricing Model | Origination Costs, per loan | $ | 2 | |||||||||||||||||||||||
| Forward Commitments | 8 | Historical Trend | Closing Ratio | 80.63 | % | |||||||||||||||||||||
| Pricing Model | Origination Costs, per loan | $ | 2 | |||||||||||||||||||||||
| Capitalized Servicing Rights | 1,846 | Discounted cash flow | Constant prepayment rate (CPR) | 11.07 | % | |||||||||||||||||||||
| Discount rate | 9.56 | % | ||||||||||||||||||||||||
| Total | $ | 13,184 | ||||||||||||||||||||||||
| Fair Value | Significant Unobservable Input Value | |||||||||||
| (In thousands) | December 31, 2016 | Valuation Techniques | Unobservable Inputs | |||||||||
| Assets | ||||||||||||
| Trading Security | $ | 13,229 | Discounted Cash Flow | Discount Rate | 2.62 | % | ||||||
| Forward Commitments | 100 | Historical Trend | Closing Ratio | 80.36 | % | |||||||
| Commitments to Lend | 4,738 | Pricing Model | Origination Costs, per loan | $ | 3.692 | |||||||
| Historical Trend | Closing Ratio | 80.36 | % | |||||||||
| Capitalized Servicing Rights | 798 | Pricing Model | Origination Costs, per loan | $ | 3.692 | |||||||
| Discounted cash flow | Constant prepayment rate (CPR) | 10.40 | % | |||||||||
| Discount rate | 11.00 | % | ||||||||||
| Total | $ | 18,865 | ||||||||||
| December 31, 2023 | Fair Value Measurements as of December 31, 2023 | |||||||||||||||||||
| (In thousands) | Level 3 Inputs | Level 3 Inputs | ||||||||||||||||||
| Assets | ||||||||||||||||||||
| Individually evaluated loans | $ | 4,395 | December 2023 | |||||||||||||||||
| Capitalized servicing rights | 10,569 | December 2023 | ||||||||||||||||||
| Total | $ | 14,964 | ||||||||||||||||||
| December 31, 2017 | Fair Value Measurements as of December 31, 2017 | ||||||
| (In thousands) | Level 3 Inputs | Level 3 Inputs | |||||
| Assets | |||||||
| Impaired loans | $ | 23,853 | December 2017 | ||||
| Capitalized servicing rights | 12,527 | December 2017 | |||||
| Other real estate owned | — | — | |||||
| Total | $ | 36,380 | |||||
| December 31, 2022 | Fair Value Measurements as of December 31, 2022 | |||||||||||||||||||
| (In thousands) | Level 3 Inputs | Level 3 Inputs | ||||||||||||||||||
| Assets | ||||||||||||||||||||
| Individually evaluated loans | $ | 14,571 | December 2022 | |||||||||||||||||
| Loans held for sale | $ | 3,369 | December 2022 | |||||||||||||||||
| Capitalized servicing rights | 11,201 | December 2022 | ||||||||||||||||||
| Total | $ | 29,141 | ||||||||||||||||||
| December 31, 2016 | Fair Value Measurements as of December 31, 2016 | ||||||
| (In thousands) | Level 3 Inputs | Level 3 Inputs | |||||
| Assets | |||||||
| Impaired loans | $ | 17,761 | December 2016 | ||||
| Capitalized servicing rights | 10,726 | December 2016 | |||||
| Other real estate owned | 151 | Feb. 2016 - July 2016 | |||||
| Total | $ | 28,638 | |||||
| (in thousands) | December 31, 2017 | Valuation Techniques | Unobservable Inputs | Range (Weighted Average) (a) | |||||||
| Assets | |||||||||||
| Impaired loans | $ | 23,853 | Fair value of collateral | Loss severity | 38.72% to 0.21% (3.40%) | ||||||
| Appraised value | $10.9 to $5967 ($2,197) | ||||||||||
| Capitalized servicing rights | 12,527 | Discounted cash flow | Constant prepayment rate (CPR) | 7.78% to 12.78% (10.38%) | |||||||
| Discount rate | 10.00% to 13.28% (11.72%) | ||||||||||
| Other real estate owned | — | Fair value of collateral | Appraised value | — | |||||||
| Total Assets | $ | 36,380 | |||||||||
| (in thousands) | December 31, 2023 | Valuation Techniques | Unobservable Inputs | Range (Weighted Average) (a) | ||||||||||||||||||||||
| Assets | ||||||||||||||||||||||||||
| Individually evaluated loans | $ | 4,395 | Fair value of collateral | Discounted Cash Flow- Loss Severity | (100.00)% to (0.08)% ((67.00)%) | |||||||||||||||||||||
| Appraised value | $0 to $3,389 ($2,774) | |||||||||||||||||||||||||
| Capitalized servicing rights | 10,569 | Discounted cash flow | Constant prepayment rate (CPR) | 5.43% to 17.15% 12.31% | ||||||||||||||||||||||
| Discount rate | 10.09% to 16.59% (13.82%) | |||||||||||||||||||||||||
| Total Assets | $ | 14,964 | ||||||||||||||||||||||||
| (in thousands) | December 31, 2016 | Valuation Techniques | Unobservable Inputs | Range (Weighted Average) (a) | (in thousands) | December 31, 2022 | Valuation Techniques | Unobservable Inputs | Range (Weighted Average) (a) | |||||||||||||||||||||||||||||||||||||||||
| Assets | ||||||||||||||||||||||||||||||||||||||||||||||||||
| Impaired loans | $ | 17,761 | Fair value of collateral | Loss severity | 0% to 88.70% (9.73%) | |||||||||||||||||||||||||||||||||||||||||||||
| Appraised value | $0 to $2,192 ($1,026) | |||||||||||||||||||||||||||||||||||||||||||||||||
| Individually evaluated loans | ||||||||||||||||||||||||||||||||||||||||||||||||||
| Individually evaluated loans | ||||||||||||||||||||||||||||||||||||||||||||||||||
| Individually evaluated loans | $ | 14,571 | Fair value of collateral | Discounted Cash Flow- Loss Severity | (100.00)% to 74.74% ((40.02)%) | |||||||||||||||||||||||||||||||||||||||||||||
| Appraised value | $0 to $2,160 ($643) | |||||||||||||||||||||||||||||||||||||||||||||||||
| Loans held for sale | Loans held for sale | 3,369 | Fair value of collateral | Appraised value | $3,369 | |||||||||||||||||||||||||||||||||||||||||||||
| Capitalized servicing rights | 10,726 | Discounted cash flow | Constant prepayment rate (CPR) | 7.35% to 14.28% (10.44%) | Capitalized servicing rights | 11,201 | Discounted cash flow | Discounted cash flow | Constant prepayment rate (CPR) | 5.81% to 13.18% (10.94%) | ||||||||||||||||||||||||||||||||||||||||
| Discount rate | 10.00% to 14.00% (11.77%) | Discount rate | 9.59% to 22.70% (16.83%) | |||||||||||||||||||||||||||||||||||||||||||||||
| Other real estate owned | 151 | Fair value of collateral | Appraised value | $101 to $129 ($122) | ||||||||||||||||||||||||||||||||||||||||||||||
| Total Assets | $ | 28,638 | Total Assets | $ | 29,141 | |||||||||||||||||||||||||||||||||||||||||||||
| December 31, 2023 | ||||||||||||||||||||||||||||||||
| Carrying Amount | Fair Value | |||||||||||||||||||||||||||||||
| (In thousands) | Level 1 | Level 2 | Level 3 | |||||||||||||||||||||||||||||
| Financial Assets | ||||||||||||||||||||||||||||||||
| Cash and cash equivalents | $ | 1,203,244 | $ | 1,203,244 | $ | 1,203,244 | $ | — | $ | — | ||||||||||||||||||||||
| Trading security | 6,142 | 6,142 | — | — | 6,142 | |||||||||||||||||||||||||||
| Marketable equity securities | 13,029 | 13,029 | 13,029 | — | — | |||||||||||||||||||||||||||
| Securities available for sale | 1,022,285 | 1,022,285 | 7,981 | 1,010,381 | 3,923 | |||||||||||||||||||||||||||
| Securities held to maturity | 543,351 | 476,228 | — | 474,742 | 1,486 | |||||||||||||||||||||||||||
| FHLB stock and restricted equity securities | 22,689 | N/A | N/A | N/A | N/A | |||||||||||||||||||||||||||
| Net loans | 8,934,329 | 8,768,108 | — | — | 8,768,108 | |||||||||||||||||||||||||||
| Loans held for sale | 2,237 | 2,237 | — | 2,237 | — | |||||||||||||||||||||||||||
| Accrued interest receivable | 53,096 | 53,096 | — | 53,096 | — | |||||||||||||||||||||||||||
| Derivative assets | 45,668 | 45,668 | — | 45,613 | 55 | |||||||||||||||||||||||||||
| Financial Liabilities | ||||||||||||||||||||||||||||||||
| Total deposits | 10,633,384 | 10,615,655 | — | 10,615,655 | — | |||||||||||||||||||||||||||
| Short-term debt | 260,000 | 260,035 | — | 260,035 | — | |||||||||||||||||||||||||||
| Long-term FHLB advances | 125,223 | 123,747 | — | 123,747 | — | |||||||||||||||||||||||||||
| Subordinated notes | 121,363 | 98,138 | — | 98,138 | — | |||||||||||||||||||||||||||
| Accrued interest payable | 13,766 | 13,766 | — | 13,766 | — | |||||||||||||||||||||||||||
| Derivative liabilities | 75,957 | 75,957 | — | 75,957 | — | |||||||||||||||||||||||||||
| December 31, 2022 | ||||||||||||||||||||||||||||||||
| Carrying Amount | Fair Value | |||||||||||||||||||||||||||||||
| (In thousands) | Level 1 | Level 2 | Level 3 | |||||||||||||||||||||||||||||
| Financial Assets | ||||||||||||||||||||||||||||||||
| Cash and cash equivalents | $ | 685,355 | $ | 685,355 | $ | 685,355 | $ | — | $ | — | ||||||||||||||||||||||
| Trading security | 6,708 | 6,708 | — | — | 6,708 | |||||||||||||||||||||||||||
| Marketable equity securities | 12,856 | 12,856 | 12,856 | — | — | |||||||||||||||||||||||||||
| Securities available for sale | 1,423,200 | 1,423,200 | 11,973 | 1,407,227 | 4,000 | |||||||||||||||||||||||||||
| Securities held to maturity | 583,453 | 507,464 | — | 505,508 | 1,956 | |||||||||||||||||||||||||||
| FHLB stock and restricted equity securities | 7,219 | N/A | N/A | N/A | N/A | |||||||||||||||||||||||||||
| Net loans | 8,239,039 | 8,194,110 | — | — | 8,194,110 | |||||||||||||||||||||||||||
| Loans held for sale | 4,311 | 4,311 | — | 942 | 3,369 | |||||||||||||||||||||||||||
| Accrued interest receivable | 46,868 | 46,868 | — | 46,868 | — | |||||||||||||||||||||||||||
| Derivative assets | 54,241 | 54,241 | — | 54,216 | 25 | |||||||||||||||||||||||||||
| Financial Liabilities | ||||||||||||||||||||||||||||||||
| Total deposits | 10,327,269 | 10,283,543 | — | 10,283,543 | — | |||||||||||||||||||||||||||
| Short-term debt | — | — | — | — | — | |||||||||||||||||||||||||||
| Long-term FHLB advances | 4,445 | 2,782 | — | 2,782 | — | |||||||||||||||||||||||||||
| Subordinated notes | 121,064 | 110,853 | — | 110,853 | — | |||||||||||||||||||||||||||
| Accrued interest payable | 1,610 | 1,610 | — | 1,610 | — | |||||||||||||||||||||||||||
| Derivative liabilities | 97,030 | 97,030 | — | 97,030 | — | |||||||||||||||||||||||||||
| December 31, 2017 | ||||||||||||||||||||
| Carrying Amount | Fair Value | |||||||||||||||||||
| (In thousands) | Level 1 | Level 2 | Level 3 | |||||||||||||||||
| Financial Assets | ||||||||||||||||||||
| Cash and cash equivalents | $ | 248,763 | $ | 248,763 | $ | 248,763 | $ | — | $ | — | ||||||||||
| Trading security | 12,277 | 12,277 | — | — | 12,277 | |||||||||||||||
| Securities available for sale | 1,426,099 | 1,426,099 | 44,850 | 1,381,249 | — | |||||||||||||||
| Securities held to maturity | 397,103 | 405,276 | — | 371,458 | 33,818 | |||||||||||||||
| FHLB stock and restricted equity securities | 63,085 | N/A | — | N/A | — | |||||||||||||||
| Net loans | 8,247,504 | 8,422,034 | — | — | 8,422,034 | |||||||||||||||
| Loans held for sale | 153,620 | 153,620 | — | 153,620 | — | |||||||||||||||
| Accrued interest receivable | 33,739 | 33,739 | — | 33,739 | — | |||||||||||||||
| Derivative assets | 19,308 | 19,308 | — | 14,049 | 5,259 | |||||||||||||||
| Assets held for sale | 1,392 | 1,392 | — | 1,392 | — | |||||||||||||||
| Financial Liabilities | ||||||||||||||||||||
| Total deposits | 8,749,530 | 8,731,527 | — | 8,731,527 | — | |||||||||||||||
| Short-term debt | 667,300 | 667,246 | — | 667,246 | — | |||||||||||||||
| Long-term FHLB advances | 380,436 | 378,766 | — | 378,766 | — | |||||||||||||||
| Subordinated notes | 89,339 | 97,414 | — | 97,414 | — | |||||||||||||||
| Derivative liabilities | 15,838 | 15,838 | 104 | 15,715 | 19 | |||||||||||||||
| December 31, 2016 | ||||||||||||||||||||
| Carrying Amount | Fair Value | |||||||||||||||||||
| (In thousands) | Level 1 | Level 2 | Level 3 | |||||||||||||||||
| Financial Assets | ||||||||||||||||||||
| Cash and cash equivalents | $ | 113,075 | $ | 113,075 | $ | 113,075 | $ | — | $ | — | ||||||||||
| Trading security | 13,229 | 13,229 | — | — | 13,229 | |||||||||||||||
| Securities available for sale | 1,209,537 | 1,209,537 | 62,284 | 1,147,253 | — | |||||||||||||||
| Securities held to maturity | 334,368 | 337,680 | — | 300,806 | 36,874 | |||||||||||||||
| FHLB stock and restricted equity securities | 71,112 | N/A | — | N/A | — | |||||||||||||||
| Net loans | 6,505,789 | 6,532,745 | — | — | 6,532,745 | |||||||||||||||
| Loans held for sale | 120,673 | 120,673 | — | 120,673 | — | |||||||||||||||
| Accrued interest receivable | 26,113 | 26,113 | — | 26,113 | — | |||||||||||||||
| Derivative assets | 21,617 | 21,617 | 622 | 16,157 | 4,838 | |||||||||||||||
| Assets held for sale | 322 | 322 | — | 322 | — | |||||||||||||||
| Financial Liabilities | ||||||||||||||||||||
| Total deposits | 6,622,092 | 6,624,108 | — | 6,624,108 | — | |||||||||||||||
| Short-term debt | 1,082,044 | 1,081,996 | — | 1,081,996 | — | |||||||||||||||
| Long-term FHLB advances | 142,792 | 143,151 | — | 143,151 | — | |||||||||||||||
| Subordinated notes | 89,161 | 96,973 | — | 96,973 | — | |||||||||||||||
| Derivative liabilities | 24,420 | 24,420 | — | 24,420 | — | |||||||||||||||
| December 31, | December 31, | |||||||||||||||||||||||||||
| (In thousands) | 2017 | 2016 | (In thousands) | 2023 | 2022 | |||||||||||||||||||||||
| Assets | Assets | |||||||||||||||||||||||||||
| Cash due from Berkshire Bank | $ | 83,380 | $ | 43,018 | ||||||||||||||||||||||||
| Investment in subsidiaries | 1,470,859 | 1,127,706 | ||||||||||||||||||||||||||
| Securities available for sale, at fair value | 21,827 | 23,651 | ||||||||||||||||||||||||||
| Other assets | ||||||||||||||||||||||||||||
| Other assets | ||||||||||||||||||||||||||||
| Other assets | 12,138 | 1,372 | ||||||||||||||||||||||||||
| Total assets | $ | 1,588,204 | $ | 1,195,747 | ||||||||||||||||||||||||
| Liabilities and Shareholders’ Equity | ||||||||||||||||||||||||||||
| Short term debt | $ | — | $ | 10,000 | ||||||||||||||||||||||||
| Liabilities and Shareholders’ Equity | ||||||||||||||||||||||||||||
| Liabilities and Shareholders’ Equity | ||||||||||||||||||||||||||||
| Subordinated notes | ||||||||||||||||||||||||||||
| Subordinated notes | ||||||||||||||||||||||||||||
| Subordinated notes | 89,339 | 89,161 | ||||||||||||||||||||||||||
| Accrued expenses | 2,601 | 3,288 | ||||||||||||||||||||||||||
| Shareholders’ equity | 1,496,264 | 1,093,298 | ||||||||||||||||||||||||||
| Total liabilities and shareholders’ equity | $ | 1,588,204 | $ | 1,195,747 | ||||||||||||||||||||||||
| Years Ended December 31, | Years Ended December 31, | ||||||||||||||||||||||||||||||||||||||||
| (In thousands) | 2017 | 2016 | 2015 | (In thousands) | 2023 | 2022 | 2021 | ||||||||||||||||||||||||||||||||||
| Income: | Income: | ||||||||||||||||||||||||||||||||||||||||
| Dividends from subsidiaries | $ | 39,000 | $ | 33,000 | $ | 34,000 | |||||||||||||||||||||||||||||||||||
| Other | 5,864 | 4,072 | 2,763 | ||||||||||||||||||||||||||||||||||||||
| Total income | 44,864 | 37,072 | 36,763 | ||||||||||||||||||||||||||||||||||||||
| Interest expense | 5,338 | 5,743 | 5,674 | ||||||||||||||||||||||||||||||||||||||
| Non-interest expenses | 6,042 | 3,740 | 3,670 | ||||||||||||||||||||||||||||||||||||||
| Total expense | 11,380 | 9,483 | 9,344 | ||||||||||||||||||||||||||||||||||||||
| Income before income taxes and equity in undistributed income of subsidiaries | 33,484 | 27,589 | 27,419 | ||||||||||||||||||||||||||||||||||||||
| Income tax benefit | (1,783 | ) | (2,123 | ) | (2,518 | ) | |||||||||||||||||||||||||||||||||||
| Income tax (benefit) | |||||||||||||||||||||||||||||||||||||||||
| Income before equity in undistributed income of subsidiaries | 35,267 | 29,712 | 29,937 | ||||||||||||||||||||||||||||||||||||||
| Equity in undistributed income of subsidiaries | 19,980 | 28,958 | 19,581 | ||||||||||||||||||||||||||||||||||||||
| Equity in undistributed results of operations of subsidiaries | |||||||||||||||||||||||||||||||||||||||||
| Net income | 55,247 | 58,670 | 49,518 | ||||||||||||||||||||||||||||||||||||||
| Preferred stock dividend | 219 | — | — | ||||||||||||||||||||||||||||||||||||||
| Income available to common shareholders | $ | 55,028 | $ | 58,670 | $ | 49,518 | |||||||||||||||||||||||||||||||||||
| Net income | |||||||||||||||||||||||||||||||||||||||||
| Net income | |||||||||||||||||||||||||||||||||||||||||
| Comprehensive income/(loss) | |||||||||||||||||||||||||||||||||||||||||
| Comprehensive income/(loss) | |||||||||||||||||||||||||||||||||||||||||
| Comprehensive income/(loss) | |||||||||||||||||||||||||||||||||||||||||
| Years Ended December 31, | ||||||||||||||||||||
| (In thousands) | 2023 | 2022 | 2021 | |||||||||||||||||
| Cash flows from operating activities: | ||||||||||||||||||||
| Net income | $ | 69,598 | $ | 92,533 | $ | 118,664 | ||||||||||||||
| Adjustments to reconcile net income to net cash provided by operating activities: | ||||||||||||||||||||
| Equity in undistributed results of operations of subsidiaries | (14,447) | 8,278 | (6,609) | |||||||||||||||||
| Other, net | 8,688 | 5,998 | 5,816 | |||||||||||||||||
| Net cash provided by operating activities | 63,839 | 106,809 | 117,871 | |||||||||||||||||
| Cash flows from investing activities: | ||||||||||||||||||||
| Sale of securities | — | — | 167 | |||||||||||||||||
| Net cash provided by investing activities | — | — | 167 | |||||||||||||||||
| Cash flows from financing activities: | ||||||||||||||||||||
| Proceeds from issuance of short term debt | — | — | 232 | |||||||||||||||||
| Proceeds from issuance of long term debt | — | 98,032 | — | |||||||||||||||||
| Repayment of long term debt | — | (75,000) | — | |||||||||||||||||
| Payment to repurchase common stock | (23,844) | (124,519) | (68,712) | |||||||||||||||||
| Common stock cash dividends paid | (31,707) | (24,527) | (24,553) | |||||||||||||||||
| Other, net | 142 | 281 | 431 | |||||||||||||||||
| Net cash (used) in financing activities | (55,409) | (125,733) | (92,602) | |||||||||||||||||
| Net change in cash and cash equivalents | 8,430 | (18,924) | 25,436 | |||||||||||||||||
| Cash and cash equivalents at beginning of year | 90,022 | 108,946 | 83,510 | |||||||||||||||||
| Cash and cash equivalents at end of year | $ | 98,452 | $ | 90,022 | $ | 108,946 | ||||||||||||||
| Years Ended December 31, | ||||||||||||
| (In thousands) | 2017 | 2016 | 2015 | |||||||||
| Cash flows from operating activities: | ||||||||||||
| Net income | $ | 55,247 | $ | 58,670 | $ | 49,518 | ||||||
| Adjustments to reconcile net income to net cash (used) provided by operating activities: | ||||||||||||
| Equity in undistributed income of subsidiaries | (19,980 | ) | (28,958 | ) | (19,581 | ) | ||||||
| Other, net | (7,964 | ) | 1,988 | 10,904 | ||||||||
| Net cash provided by operating activities | 27,303 | 31,700 | 40,841 | |||||||||
| Cash flows from investing activities: | ||||||||||||
| Advances to subsidiaries | (100,000 | ) | — | — | ||||||||
| Acquisitions, net of cash paid | — | — | (3,293 | ) | ||||||||
| Purchase of securities | (1,057 | ) | (18,016 | ) | (18 | ) | ||||||
| Sale of securities | 2,101 | — | — | |||||||||
| Other, net | 1,508 | 9,728 | — | |||||||||
| Net cash (used) in investing activities | (97,448 | ) | (8,288 | ) | (3,311 | ) | ||||||
| Cash flows from financing activities: | ||||||||||||
| Proceed from issuance of short term debt | — | 9,349 | — | |||||||||
| Repayment of short term debt | (9,822 | ) | — | (9,935 | ) | |||||||
| Net proceeds from common stock | 153,313 | 3,712 | — | |||||||||
| Net proceeds from preferred stock | — | — | — | |||||||||
| Net proceeds from reissuance of treasury stock | — | — | 240 | |||||||||
| Payment to repurchase common stock | — | (4,632 | ) | (550 | ) | |||||||
| Common stock cash dividends paid | (33,022 | ) | (24,916 | ) | (21,903 | ) | ||||||
| Preferred stock cash dividends paid | (219 | ) | — | — | ||||||||
| Other, net | 257 | 11 | 167 | |||||||||
| Net cash provided provided/(used) by financing activities | 110,507 | (16,476 | ) | (31,981 | ) | |||||||
| Net change in cash and cash equivalents | 40,362 | 6,936 | 5,549 | |||||||||
| Cash and cash equivalents at beginning of year | 43,018 | 36,082 | 30,533 | |||||||||
| Cash and cash equivalents at end of year | $ | 83,380 | $ | 43,018 | $ | 36,082 | ||||||
| 2023 | 2022 | |||||||||||||||||||||||||||||||||||||||||||||||||
| (In thousands, except per share data) | Fourth Quarter | Third Quarter | Second Quarter | First Quarter | Fourth Quarter | Third Quarter | Second Quarter | First Quarter | ||||||||||||||||||||||||||||||||||||||||||
| Interest and dividend income | $ | 150,537 | $ | 148,021 | $ | 145,425 | $ | 132,316 | $ | 121,384 | $ | 103,671 | $ | 87,379 | $ | 74,823 | ||||||||||||||||||||||||||||||||||
| Interest expense | 62,116 | 57,687 | 52,666 | 34,783 | 19,292 | 11,587 | 6,021 | 5,760 | ||||||||||||||||||||||||||||||||||||||||||
| Net interest income | 88,421 | 90,334 | 92,759 | 97,533 | 102,092 | 92,084 | 81,358 | 69,063 | ||||||||||||||||||||||||||||||||||||||||||
| Non-interest income | (8,383) | 17,465 | 17,094 | 16,606 | 15,654 | 16,251 | 16,351 | 20,681 | ||||||||||||||||||||||||||||||||||||||||||
| Total revenue | 80,038 | 107,799 | 109,853 | 114,139 | 117,746 | 108,335 | 97,709 | 89,744 | ||||||||||||||||||||||||||||||||||||||||||
| Provision expense/(benefit) for credit losses | 7,000 | 8,000 | 8,000 | 8,999 | 12,000 | 3,000 | — | (4,000) | ||||||||||||||||||||||||||||||||||||||||||
| Non-interest expense | 78,992 | 76,513 | 74,048 | 71,955 | 70,014 | 81,677 | 68,475 | 68,550 | ||||||||||||||||||||||||||||||||||||||||||
| Income before income taxes | (5,954) | 23,286 | 27,805 | 33,185 | 35,732 | 23,658 | 29,234 | 25,194 | ||||||||||||||||||||||||||||||||||||||||||
| Income tax (benefit)/expense | (4,509) | 3,741 | 3,944 | 5,548 | 5,227 | 4,941 | 6,119 | 4,998 | ||||||||||||||||||||||||||||||||||||||||||
| Net income | $ | (1,445) | $ | 19,545 | $ | 23,861 | $ | 27,637 | $ | 30,505 | $ | 18,717 | $ | 23,115 | $ | 20,196 | ||||||||||||||||||||||||||||||||||
| Basic earnings per share | $ | (0.03) | $ | 0.45 | $ | 0.55 | $ | 0.63 | $ | 0.69 | $ | 0.42 | $ | 0.50 | $ | 0.42 | ||||||||||||||||||||||||||||||||||
| Diluted earnings per share | $ | (0.03) | $ | 0.45 | $ | 0.55 | $ | 0.63 | $ | 0.69 | $ | 0.42 | $ | 0.50 | $ | 0.42 | ||||||||||||||||||||||||||||||||||
| Weighted average common shares outstanding: | ||||||||||||||||||||||||||||||||||||||||||||||||||
| Basic | 42,852 | 43,164 | 43,443 | 43,693 | 44,105 | 44,700 | 45,818 | 47,668 | ||||||||||||||||||||||||||||||||||||||||||
| Diluted | 43,101 | 43,347 | 43,532 | 44,036 | 44,484 | 45,034 | 46,102 | 48,067 | ||||||||||||||||||||||||||||||||||||||||||
| 2017 | 2016 | |||||||||||||||||||||||||||||||
| (In thousands, except per share data) | Fourth Quarter | Third Quarter | Second Quarter | First Quarter | Fourth Quarter | Third Quarter | Second Quarter | First Quarter | ||||||||||||||||||||||||
| Interest and dividend income | $ | 105,823 | $ | 89,060 | $ | 84,666 | $ | 80,709 | $ | 72,434 | $ | 70,511 | $ | 69,018 | $ | 68,476 | ||||||||||||||||
| Interest expense | 19,457 | 17,062 | 15,121 | 13,823 | 13,276 | 12,540 | 11,577 | 10,779 | ||||||||||||||||||||||||
| Net interest income | 86,366 | 71,998 | 69,545 | 66,886 | 59,158 | 57,971 | 57,441 | 57,697 | ||||||||||||||||||||||||
| Non-interest income | 29,298 | 28,836 | 32,798 | 34,757 | 16,725 | 18,941 | 14,555 | 15,630 | ||||||||||||||||||||||||
| Total revenue | 115,664 | 100,834 | 102,343 | 101,643 | 75,883 | 76,912 | 71,996 | 73,327 | ||||||||||||||||||||||||
| Provision for loan losses | 6,141 | 4,900 | 4,889 | 5,095 | 4,100 | 4,734 | 4,522 | 4,006 | ||||||||||||||||||||||||
| Non-interest expense | 90,041 | 65,820 | 69,523 | 74,326 | 61,090 | 48,844 | 46,268 | 47,100 | ||||||||||||||||||||||||
| Income before income taxes | 19,482 | 30,114 | 27,931 | 22,222 | 10,693 | 23,334 | 21,206 | 22,221 | ||||||||||||||||||||||||
| Income tax expense (1) | 22,292 | 7,211 | 8,237 | 6,762 | 362 | 6,953 | 5,249 | 6,220 | ||||||||||||||||||||||||
| Net (loss)/income | $ | (2,810 | ) | $ | 22,903 | $ | 19,694 | $ | 15,460 | $ | 10,331 | $ | 16,381 | $ | 15,957 | $ | 16,001 | |||||||||||||||
| Basic (loss)/earnings per common share | $ | (0.06 | ) | $ | 0.57 | $ | 0.53 | $ | 0.44 | $ | 0.32 | $ | 0.53 | $ | 0.52 | $ | 0.52 | |||||||||||||||
| Diluted (loss)/earnings per share | $ | (0.06 | ) | $ | 0.57 | $ | 0.53 | $ | 0.44 | $ | 0.32 | $ | 0.53 | $ | 0.52 | $ | 0.52 | |||||||||||||||
| Weighted average common shares outstanding: | ||||||||||||||||||||||||||||||||
| Basic | 45,122 | 39,984 | 37,324 | 35,280 | 32,185 | 30,621 | 30,605 | 30,511 | ||||||||||||||||||||||||
| Diluted | 45,122 | 40,145 | 37,474 | 35,452 | 32,381 | 30,811 | 30,765 | 30,688 | ||||||||||||||||||||||||
| Years Ended December 31, | ||||||||||||||||||||
| (In thousands) | 2023 | 2022 | 2021 | |||||||||||||||||
| Net interest income | $ | 369,047 | $ | 344,597 | $ | 291,166 | ||||||||||||||
| Provision expense/(benefit) for credit losses | 31,999 | 11,000 | (500) | |||||||||||||||||
| Net interest income after provision for credit losses | 337,048 | 333,597 | 291,666 | |||||||||||||||||
| Total non-interest income | 42,782 | 68,937 | 143,248 | |||||||||||||||||
| Total non-interest expense | 301,508 | 288,716 | 285,893 | |||||||||||||||||
| Income before income taxes | 78,322 | 113,818 | 149,021 | |||||||||||||||||
| Income tax expense | 8,724 | 21,285 | 30,357 | |||||||||||||||||
| Net income | 69,598 | 92,533 | 118,664 | |||||||||||||||||
| Years Ended December 31, | ||||||||||||
| (In thousands) | 2017 | 2016 | 2015 | |||||||||
| Net interest income | $ | 294,795 | $ | 232,267 | $ | 213,849 | ||||||
| Provision for loan losses | 21,025 | 17,362 | 16,726 | |||||||||
| Net interest income after provision for loan losses | 273,770 | 214,905 | 197,123 | |||||||||
| Total non-interest income | 125,689 | 65,851 | 54,288 | |||||||||
| Total non-interest expense | 299,710 | 203,302 | 196,829 | |||||||||
| Income from continuing operations before income taxes | 99,749 | 77,454 | 54,582 | |||||||||
| Income tax expense | 44,502 | 18,784 | 5,064 | |||||||||
| Net income | $ | 55,247 | $ | 58,670 | $ | 49,518 | ||||||
| Years Ended December 31, | ||||||||||||||||||||
| (In thousands) | 2023 | 2022 | 2021 | |||||||||||||||||
| Non-interest income | ||||||||||||||||||||
| In-scope of Topic 606: | ||||||||||||||||||||
| Service charges on deposit accounts | $ | 24,160 | $ | 22,396 | $ | 20,249 | ||||||||||||||
| Wealth management fees | 10,197 | 10,008 | 10,530 | |||||||||||||||||
| Interchange income | 8,395 | 8,470 | 8,321 | |||||||||||||||||
| Insurance commissions and fees | — | — | 7,003 | |||||||||||||||||
| Non-interest income (in-scope of Topic 606) | $ | 42,752 | $ | 40,874 | $ | 46,103 | ||||||||||||||
| Non-interest income (out-of-scope of Topic 606) | 30 | 28,063 | 97,145 | |||||||||||||||||
| Total non-interest income | $ | 42,782 | $ | 68,937 | $ | 143,248 | ||||||||||||||