UNITED STATES
SECURITIES AND EXCHANGE COMMISSION
WASHINGTON, D.C. 20549
FORM 10-K
| | | | | |
| ☒ | ANNUAL REPORT PURSUANT TO SECTION 13 OR 15(d) OF THE SECURITIES EXCHANGE ACT OF 1934 |
For the Fiscal Year Ended December 31, 20202023
OR
| | | | | |
| ☐ | TRANSITION REPORT PURSUANT TO SECTION 13 OR 15(d) OF THE SECURITIES EXCHANGE ACT OF 1934 |
For the transition period from to
Commission file number 000-29961
ALLIANCEBERNSTEIN L.P.
(Exact name of registrant as specified in its charter)
| | | | | | | | |
| Delaware | | 13-4064930 |
| (State or other jurisdiction of incorporation or organization) | | (I.R.S. Employer Identification No.) |
1345 Avenue of the Americas, New York, NY 10105501 Commerce Street, Nashville, TN 37203
(Address of principal executive offices)
(Zip Code)
Registrant’s telephone number, including area code: (212) 969-1000(615) 622-0000
Securities registered pursuant to Section 12(b) of the Act: None
Securities registered pursuant to Section 12(g) of the Act:
| | | | | | | | | | | | | | |
| Title of Class | | Trading Symbol | | Name of each exchange on which registered |
| Units of Limited Partnership Interest | | None | | None |
Indicate by check mark if the registrant is a well-known seasoned issuer, as defined in Rule 405 of the Securities Act. Yes ☒ No ☐
Indicate by check mark if the registrant is not required to file reports pursuant to Section 13 or Section 15(d) of the Act. Yes ☐ No ☒
Indicate by check mark whether the registrant (1) has filed all reports required to be filed by Section 13 or 15(d) of the Securities Exchange Act of 1934 during the preceding 12 months (or for such shorter period that the registrant was required to file such reports), and (2) has been subject to such filing requirements for the past 90 days. Yes ☒ No ☐
Indicate by check mark whether the registrant has submitted electronically every Interactive Data File required to be submitted pursuant to Rule 405 of Regulation S-T (§232.405 of this chapter) during the preceding 12 months (or for such shorter period that the registrant was required to submit such files). Yes ☒ No ☐
Indicate by check mark whether the registrant is a large accelerated filer, an accelerated filer, a non-accelerated filer, smaller reporting company, or an emerging growth company. See definitions of “large accelerated filer”, “accelerated filer”, “smaller reporting company”, and “emerging growth company” in Rule 12b-2 of the Exchange Act. (Check one):
| | | | | | | | | | | | | | |
| Large accelerated filer | ☐ | | Accelerated filer | ☐ |
| | | | |
| Non-accelerated filer | ☒ | | Smaller reporting company | ☐ |
| | | | |
| | Emerging growth company | ☐ |
| | | | |
|
If an emerging growth company, indicate by check mark if the registrant has elected not to use the extended transition period for complying with any new or revised financial accounting standards provided pursuant to Section 13(a) of the Exchange Act. ☐
Indicate by check mark whether the registrant has filed a report on and attestation to its management's assessment of the effectiveness of its internal control over financial reporting under Section 404(b) of the Sarbanes-Oxley Act (15 U.S.C. 7262(b)) by the registered public accounting firm that prepared or issued its audit report. Yes ☒ No ☐
Indicate by check mark whether the registrant is a shell company (as defined in Rule 12b-2 of the Act). Yes ☐ No ☒
If securities are registered pursuant to Section 12 (b) of the Act, indicate by check mark whether the financial statements of the registrant included in the filing reflect the correction of an error to previously issued financial statements. ☐
Indicate by check mark whether any of those error corrections are restatements that required a recovery analysis of incentive-based compensation received by any of the registrant's executive officers during the relevant recovery period pursuant to §240.10D-1(b). ☐
The number of units of limited partnership interest outstanding as of December 31, 20202023 was 270,509,658.286,609,212.
DOCUMENTS INCORPORATED BY REFERENCE
This Form 10-K does not incorporate any document by reference.
| | | | | | | | | | | |
| |
| | | |
| | | |
| | | |
| Item 1A. | | |
| Item 1B. | | |
| Item 1C. | | |
| Item 2. | | |
| Item 3. | | |
| Item 4. | | |
| | | |
| | | |
| | | |
| | | |
| | | |
| | | |
| | | |
| | | |
| | | |
| | | |
| | | |
| | | |
| | | |
| Item 10. | | |
| Item 11. | | |
| Item 12. | | |
| Item 13. | | |
| Item 14. | | |
| | | |
| | | |
| | | |
| | | |
| | | |
| |
| | |
| Glossary of Certain Defined Terms
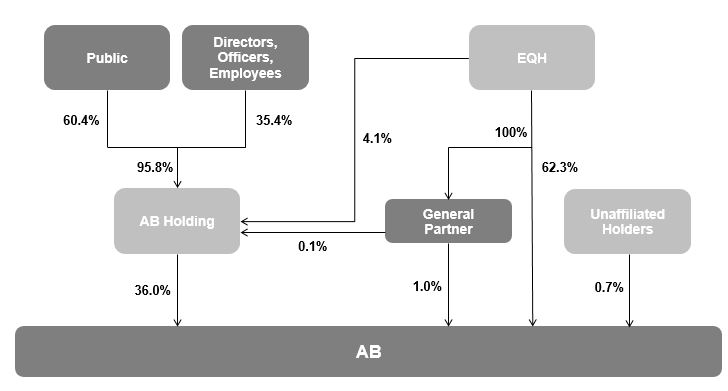
“AB” – AllianceBernstein L.P. (Delaware limited partnership formerly known as Alliance Capital Management L.P., “Alliance Capital”), the operating partnership, and its subsidiaries and, where appropriate, its predecessors, AB Holding and ACMC, Inc. and their respective subsidiaries.
“AB Holding” – AllianceBernstein Holding L.P. (Delaware limited partnership).
“AB Holding Partnership Agreement” – the Amended and Restated Agreement of Limited Partnership of AB Holding, dated as of October 29, 1999 and as amended February 24, 2006.
“AB Holding Units” – units representing assignments of beneficial ownership of limited partnership interests in AB Holding.
“AB Partnership Agreement” – the Amended and Restated Agreement of Limited Partnership of AB, dated as of October 29, 1999 and as amended February 24, 2006.
“AB Units” – units of limited partnership interest in AB.
“AUM” – AB's assets under management.
“AXA” – AXA (société anonyme organized under the laws of France) is the holding company for the AXA Group, a worldwide leader in financial protection.
“Bernstein Transaction” – AB's acquisition of the business and assets of SCB Inc., formerly known as Sanford C. Bernstein Inc., and the related assumption of the liabilities of that business, completed on October 2, 2000.
“Equitable America” – Equitable Financial Insurance Company of America (f/k/a MONY Life Insurance Company of America, an Arizona corporation) and a subsidiary of Equitable Holdings.
“Equitable Financial” – Equitable Financial Life Insurance Company (New York stock life insurance company), a subsidiary of Equitable Holdings, and its subsidiaries other than AB and its subsidiaries.
“Equitable Holdings” or “EQH” – Equitable Holdings, Inc. (Delaware corporation) and its subsidiaries other than AB and its subsidiaries.
“Exchange Act” – the Securities Exchange Act of 1934, as amended.
“ERISA” – the Employee Retirement Income Security Act of 1974, as amended.
"GAAP" – U.S. Generally Accepted Accounting Principles.
“General Partner” – AllianceBernstein Corporation (Delaware corporation), the general partner of AB and AB Holding and a subsidiary of Equitable Holdings, and, where appropriate, ACMC, LLC, its predecessor.
“Investment Advisers Act” – the Investment Advisers Act of 1940, as amended.
“Investment Company Act” – the Investment Company Act of 1940, as amended.
“NYSE” – the New York Stock Exchange, Inc.
“Partnerships” – AB and AB Holding together.
“SEC” – the United States Securities and Exchange Commission.
“Securities Act” – the Securities Act of 1933, as amended.
|
|
ii | | | | | |
| AB | AllianceBernstein L.P. (Delaware limited partnership formerly known as Alliance Capital Management L.P., “Alliance Capital”), the operating partnership, and its subsidiaries and, where appropriate, its predecessors, AB Holding and ACMC, Inc. and their respective subsidiaries. |
| |
| AB Holding | AllianceBernstein Holding L.P. (Delaware limited partnership). |
| |
| AB Holding Partnership Agreement | the Amended and Restated Agreement of Limited Partnership of AB Holding, dated as of October 29, 1999 and as amended February 24, 2006. |
| |
| AB Holding Units | units representing assignments of beneficial ownership of limited partnership interest in AB Holding. |
| |
| AB Partnership Agreement | the Amended and Restated Agreement of Limited Partnership of AB, dated as of October 29, 1999 and as amended February 24, 2006. |
| |
| AB Units | units of limited partnership interest in AB. |
| |
| AUM | AB's assets under management. |
| |
| Bernstein Transaction | AB's acquisition of the business and assets of SCB Inc., formerly known as Sanford C. Bernstein Inc., and the related assumption of the liabilities of that business, completed on October 2, 2000. |
| |
| Equitable America | Equitable Financial Insurance Company of America (f/k/a MONY Life Insurance Company of America, an Arizona corporation), a subsidiary of Equitable Holdings. |
| | | | | |
| Equitable Financial | Equitable Financial Life Insurance Company (New York stock life insurance company), a subsidiary of Equitable Holdings. |
| |
| Equitable Holdings or EQH | Equitable Holdings, Inc. (Delaware corporation) and its subsidiaries other than AB and its subsidiaries. |
| |
| Exchange Act | the Securities Exchange Act of 1934, as amended. |
| |
| ERISA | the Employee Retirement Income Security Act of 1974, as amended. |
| |
| GAAP | U.S. Generally Accepted Accounting Principles. |
| |
| General Partner | AllianceBernstein Corporation (Delaware corporation), the general partner of AB and AB Holding and a subsidiary of Equitable Holdings, and, where appropriate, ACMC, LLC, its predecessor. |
| |
| Investment Advisers Act | the Investment Advisers Act of 1940, as amended. |
| |
| Investment Company Act | the Investment Company Act of 1940, as amended. |
| |
| NYSE | the New York Stock Exchange, Inc. |
| |
| Partnerships | AB and AB Holding together. |
| |
| SEC | the United States Securities and Exchange Commission. |
| |
| Securities Act | the Securities Act of 1933, as amended. |
Item 1.Business
The words “we” and “our” in this Form 10-K refer collectively to AB Holding and AB and its subsidiaries, or to their officers and employees. Similarly, the words “company” and “firm” refer to both AB Holding and AB. Where the context requires distinguishing between AB Holding and AB, we identify which company is being discussed. Cross-references are in italics.
We use “global” in this Form 10-K to refer to all nations, including the United States; we use “international” or “non-U.S.” to refer to nations other than the United States.
We use “emerging markets” in this Form 10-K to refer to countries included in the Morgan Stanley Capital International (“MSCI”) emerging markets index, which are,include, as of December 31, 2020: Argentina,2023: Brazil, Chile, China, Colombia, Czech Republic, Egypt, Greece, Hungary, India, Indonesia, Korea, Kuwait, Malaysia, Mexico, Pakistan, Peru, Philippines, Poland, Qatar, Russia, Saudi Arabia, South Africa, Taiwan, Thailand, Turkey and United Arab Emirates.
Clients
We provide diversified investment management, research and related services globally to a broad range of clients through our three buy-side distribution channels: Institutions, Retail and Private Wealth Management, and our sell-side business, Bernstein Research Services. SSeeee “Distribution Channels” in this Item 1 for additional information.
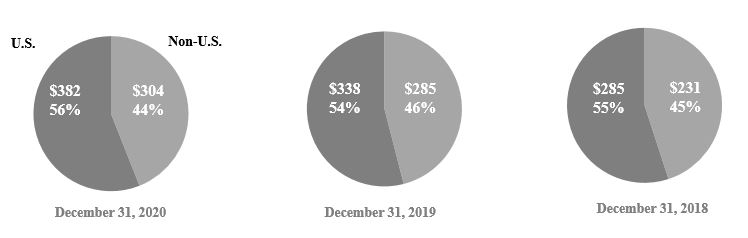
As of December 31, 2020, 20192023, 2022 and 2018,2021, our AUM were approximately $686$725 billion, $623$646 billion and $516$779 billion, respectively, and our net revenues were approximately $3.7$4.2 billion, $3.5$4.1 billion and $3.4$4.4 billion, as of December 31, 2020, 2019 and 2018, respectively. EQH (our(our parent company)company) and its subsidiaries, whose AUM consist primarily of fixed income investments, is our largest client. Our EQH affiliates represented approximately 19%16%, 18%16% and 18%17% of our AUM as of December 31, 2020, 20192023, 2022 and 2018,2021, and we earned approximately 3%5%, 4% and 4% of our net revenues from services we provided to them in each of those years. Also, AXA2023, 2022 and its subsidiaries represented approximately 3%, 5% and 6% of our AUM as of December 31, 2020, 2019 and 2018, and we earned approximately 2% of our net revenues from services we provided to them in each of those years. 2021, respectively.
| | | | | |
| |
Assets Under Management (AUM) ($ billions) | Net Revenues ($ billions) |
| |
| |
| |
See “Distribution Channels” below and “Assets Under Management” and “Net Revenues” in Item 7 for additional information regarding our AUM and net revenues.
Generally, we are compensated for our investment services on the basis of investment advisory and services fees calculated as a percentage of AUM. For additional information about our investment advisory and services fees, including performance-based fees, see “Risk Factors” in Item 1A and “Net Revenues – Investment Advisory and Services Fees” in Item 7.
Research
Our high-quality, in-depth research is the foundation of our business.asset management and private wealth management businesses. We believe that our global team of research professionals, whose disciplines include economic, fundamental equity, fixed income and quantitative research, gives us a competitive advantage in achieving investment success for our clients. We also have experts focused on multi-asset strategies, wealth management, environmental, social and governance (“ESG”), and alternative investments.
Purpose, Values and Corporate Responsibility
At AB, we constantly are workingpursue insight that unlocks opportunity. This is our firm's purpose. Together with our firm's mission and values, which we have described below, our purpose forms the foundation of corporate responsibility at AB.
AB's mission is to help our clients define and achieve their investment goals, explicitly stating what we do to unlock opportunity for our clients. As an active manager, our differentiated insights drive our ability to deliver alpha and design innovative investment solutions. Our clients and their needs come first, always.
Our values provide a framework for the behaviors and actions that create our strong culture and enable us to meet our clients' needs. Each value inspires us to be better:
•We invest in one another, meaning that we have a strong organizational culture in which diversity is celebrated and mentorship is critical to our success.
•We strive for distinctive knowledge, meaning that we collaboratively identify creative solutions to clients' investment challenges through our expertise in a wide range of investment disciplines.
•We speak with courage and conviction, which informs how we engage with our AB colleagues, clients and others.
•We act with integrity — always, which is the bedrock of our relationships and drives us to avoid activities that could create potential conflicts of interest or distract us from our singular focus to provide asset management and research to our clients.
As noted above, we challenge ourselves to become a better firm. To us, thisversion of AB. We are committed to being a responsible firm and striving to model the behavior that we expect from the companies in which we invest. This means, in part, giving back to the communities in which we work, through our firm-wide philanthropic initiative, AB Gives Back, and reducing our environmental footprint by increasing our use of “green buildings,” such as our new headquarters in Nashville, Tennessee.footprint. Additionally, by promoting diversity, equity and inclusion, we are afforded different perspectives and ways of thinking, which can lead to better outcomes for our clients (See Diversity, Equity and Inclusion below in this Item 1).
Also, striving to be more responsiblea good corporate citizen gives us a richer perspective for evaluating other companies. As longtime fundamental investors with a strong research heritage, we have integrated ESG considerations into various processes. This helps us make fully informed risk/return assessments and draw insightful investment conclusions. Our investors — research analysts and portfolio managers — understand the companies and industries they cover in-depth. This positions them well to determine which ESG issues are material to particular companies, to determine the financial impact of an ESG issue and to incorporate that insight into their cash-flow, earnings and credit models. And, we continue to invest in technology and innovation to further enable our investment teams to formalize their ESG evaluations and share insights from our engagements with other companies.
COVID-19 has caused vast suffering and disruption to the global economy, while also causing significant volatility in the financial markets through much of 2020. As a firm, AB has adapted rapidly to protect our employees' health and welfare, support our communities and ensure we can continue managing clients' investments safely and securely. Furthermore, COVID-19 has become a prominent theme in engagement: it not only impacts business models but also highlights corporate ESG practices. We are advocating that issuers be responsible corporate citizens, and we are working to better understand opportunities and threats created by the pandemic.
We provide additional information in this regard in our corporate responsibility report,the AB Responsibility Report, which is entitled "Advancing Responsible Investing" and can be found under “Corporate Responsibility“Responsibility - Overview” on www.alliancebernstein.com.And, we have described our firm's governance structure, including our Board and its committees, in Item 10 of this Form 10-K.
Investment Services
We providebelieve that by using differentiated research insights and a broad rangedisciplined process to build high active share portfolios, we can achieve strong investment results for our clients over time. We are fully invested in delivering better outcomes for our clients. Key to this philosophy is developing and integrating research on material ESG issues, as well as our approach to engagement, when in the best interest of our clients. Our global research network, intellectual curiosity and collaborative culture allow us to advance clients' investment objectives, whether our clients are seeking idiosyncratic alpha, total return, downside mitigation, or sustainability and impact-focused outcomes.
Our investment services withinclude expertise in:
| | | | | |
• | Actively-managed•Actively managed equity strategies with global and regional portfolios across global and regional universes, as well as capitalization ranges, concentration ranges and investment strategies, including value, growth and core equities; |
• | Actively-managed traditional and unconstrained fixed income strategies, including taxable and tax-exempt strategies; |
• | Alternative investments, including hedge funds, fund of funds, direct lending, real estate and private equity; |
• | Multi-asset solutions and services, including dynamic asset allocation, customized target-date funds and target-risk funds, and |
• | Some passive management, including value, growth and core equities;•Actively managed traditional and unconstrained fixed income strategies, including taxable and tax-exempt strategies; •Actively managed alternative investments, including fundamental and systematically-driven hedge funds, fund of hedge funds and direct assets (e.g., direct lending, real estate debt and private equity); •Portfolios with Purpose, including Sustainable, Impact and Responsible+ (Climate-Conscious and ESG leaders) equity, fixed income and multi-asset strategies that address our clients' desire to invest their capital with a dedicated ESG focus, while pursuing strong investment returns; •Multi-asset services and solutions, including dynamic asset allocation, customized target-date funds and target-risk funds; and •Passively managed equity and fixed income strategies, including index, ESG index and enhanced index strategies. |
Our AUM by client domicile and investment service as of December 31, 2020, 20192023, 2022 and 2018 were2021 are as follows:
By Client Domicile ($ in billions): 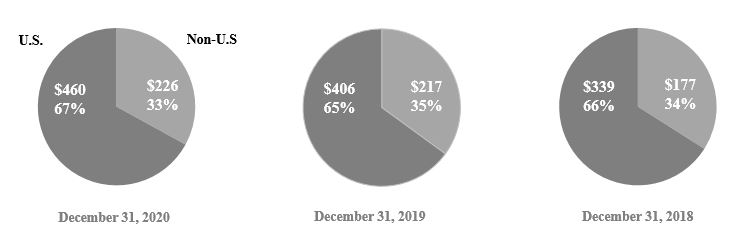
| | | | | |
| |
AUM by Client Domicile ($ in billions) | AUM by Investment Service ($ in billions) |
| |
| |
| |
Part I
By Investment Service ($ in billions):
Distribution Channels
Institutions
We offer to our institutional clients, which include private and public pension plans, foundations and endowments, insurance companies, central banks and governments worldwide, and affiliates such as EQH and its subsidiaries, separately-managedseparately managed accounts, sub-advisorysub-advisory relationships, structured products, collective investment trusts, mutual funds, hedge funds and other investment vehicles (“Institutional Services”).
We manage the assets of our institutional clients pursuant to written investment management agreements or other arrangements, which generally are terminable at any time or upon relatively short notice by either party. In general, our written investment management agreements may not be assigned without the client's consent. For information about our institutional investment advisory and services fees, including performance-based fees, see “Risk Factors” in Item 1A and “Net Revenues – Investment Advisory and Services Fees” in Item 7.
EQH and its subsidiaries constitute our largest institutional client. EQH and its subsidiaries combined AUM accounted for approximately 29%25%, 28%24% and 26%25% of our institutional AUM as of December 31, 2020, 20192023, 2022 and 2018,2021, respectively, and approximately 18%22%, 17%19% and 16%18% of our institutional revenues for 2020, 20192023, 2022 and 2018, respectively. Also, AXA and its subsidiaries combined AUM accounted for approximately 5%, 10% and 11% of our institutional AUM as of December 31, 2020, 2019 and 2018, respectively, and approximately 12%, 11% and 11% of our institutional revenues for 2020, 2019 and 2018,2021, respectively. No single institutional client other than EQH AXA and theirits respective subsidiaries accounted for more than approximately 1% of our net revenues for the year ended December 31, 2020.2023.
| | | | | |
|
|
| EQH and Subsidiaries as a % of our Institutional AUM | EQH and Subsidiaries as a % of our Institutional Revenues |
|
|
| |
| |
As of December 31, 2020, 20192023, 2022 and 2018,2021, Institutional Services represented approximately 46%44%, 45%46% and 48%43%, respectively, of our AUM, and the fees we earned from providing these services represented approximately 14%16%, 16% and 13%, respectively, of our net revenues for each of those years. Our AUM and revenues are as follows:
| | |
|
Institutional Services Assets Under Management (by Investment Service) |
|
Institutional Services Assets Under Management | | | | | | | | | | | | | | | | | | | | | | | | | | | | | |
| | Years Ended December 31 | | % Change |
| 2023 | 2022 | 2021 | | 2023-22 | 2022-21 |
| | (in millions) | | | |
| Equity: | | | | | | | | | |
| Equity Actively Managed | | $ | 59,423 | | | $ | 55,731 | | | $ | 73,726 | | | 6.6 | % | (24.4 | %) |
Equity Passively Managed(1) | | 23,630 | | | 21,062 | | | 28,995 | | | 12.2 | | (27.4) | |
| Total Equity | | 83,053 | | | 76,793 | | | 102,721 | | | 8.2 | | (25.2) | |
| U.S. | | 40,930 | | | 35,428 | | | 47,409 | | | 15.5 | | (25.3) | |
| Global & Non-U.S. | | 42,123 | | | 41,365 | | | 55,312 | | | 1.8 | | (25.2) | |
| Total Equity | | 83,053 | | | 76,793 | | | 102,721 | | | 8.2 | | (25.2) | |
| Fixed Income: | | | | | | | | | |
| Fixed Income Taxable | | 126,350 | | | 121,871 | | | 155,940 | | | 3.7 | | (21.8) | |
| Fixed Income Tax-Exempt | | 1,317 | | | 849 | | | 1,108 | | | 55.1 | | (23.4) | |
Fixed Income Passively Managed(1) | | 306 | | | 192 | | | 224 | | | 59.4 | | (14.3) | |
| Total Fixed Income | | 127,973 | | | 122,912 | | | 157,272 | | | 4.1 | | (21.8) | |
| U.S. | | 95,808 | | | 88,800 | | | 110,312 | | | 7.9 | | (19.5) | |
| Global & Non-U.S. | | 32,165 | | | 34,112 | | | 46,960 | | | (5.7) | | (27.4) | |
| Total Fixed Income | | 127,973 | | | 122,912 | | | 157,272 | | | 4.1 | | (21.8) | |
Alternatives/Multi-Asset Solutions(2): | | | | | | | | | |
| U.S. | | 13,810 | | | 12,873 | | | 7,697 | | | 7.3 | | 67.2 | |
| Global & Non-U.S. | | 92,288 | | | 84,703 | | | 69,390 | | | 9.0 | | 22.1 | |
| Total Alternatives/Multi-Asset Solutions | | 106,098 | | | 97,576 | | | 77,087 | | | 8.7 | | 26.6 | |
| Total: | | | | | | | | | |
| U.S. | | 150,548 | | | 137,101 | | | 165,418 | | | 9.8 | | (17.1) | |
| Global & Non-U.S. | | 166,576 | | | 160,180 | | | 171,662 | | | 4.0 | | (6.7) | |
| Total | | $ | 317,124 | | | $ | 297,281 | | | $ | 337,080 | | | 6.7 | | (11.8) | |
| Affiliated - EQH | | 78,942 | | | 70,924 | | | 84,096 | | | 11.3 | | (15.7) | |
| | | | | | | | | |
| Non-affiliated | | 238,182 | | | 226,357 | | | 252,984 | | | 5.2 | | (10.5) | |
| Total | | $ | 317,124 | | | $ | 297,281 | | | $ | 337,080 | | | 6.7 | | (11.8) | |
(by Investment Service)
| | | | | | | | | | | | | | | | | | | | | | | | | | | | | |
| December 31, | | % Change |
| 2020 | | 2019 | | 2018 | | 2020-19 | | 2019-18 |
| (in millions) | | | | |
| Equity Actively Managed: | | | | | | | | | |
| U.S. | $ | 17,435 | | | $ | 13,861 | | | $ | 9,629 | | | 25.8 | % | | 44.0 | % |
| Global & Non-US | 42,632 | | | 30,767 | | | 23,335 | | | 38.6 | | | 31.8 | |
| Total | 60,067 | | | 44,628 | | | 32,964 | | | 34.6 | | | 35.4 | |
Equity Passively Managed(1): | | | | | | | | | |
| U.S. | 23,806 | | | 21,349 | | | 17,481 | | | 11.5 | | | 22.1 | |
| Global & Non-US | 4,067 | | | 3,951 | | | 3,174 | | | 2.9 | | | 24.5 | |
| Total | 27,873 | | | 25,300 | | | 20,655 | | | 10.2 | | | 22.5 | |
| Total Equity | 87,940 | | | 69,928 | | | 53,619 | | | 25.8 | | | 30.4 | |
| Fixed Income Taxable: | | | | | | | | | |
| U.S. | 115,488 | | | 107,436 | | | 96,913 | | | 7.5 | | | 10.9 | |
| Global & Non-US | 48,560 | | | 50,281 | | | 51,156 | | | (3.4) | | | (1.7) | |
| Total | 164,048 | | | 157,717 | | | 148,069 | | | 4.0 | | | 6.5 | |
| Fixed Income Tax-Exempt: | | | | | | | | | |
| U.S. | 1,271 | | | 1,209 | | | 1,046 | | | 5.1 | | | 15.6 | |
| Global & Non-US | — | | | — | | | — | | | — | | | — | |
| Total | 1,271 | | | 1,209 | | | 1,046 | | | 5.1 | | | 15.6 | |
Fixed Income Passively Managed(1): | | | | | | | | | |
| U.S. | 74 | | | 69 | | | 73 | | | 7.2 | | | (5.5) | |
| Global & Non-US | 10 | | | 20 | | | 15 | | | (50.0) | | | 33.3 | |
| Total | 84 | | | 89 | | | 88 | | | (5.6) | | | 1.1 | |
| Total Fixed Income | 165,403 | | | 159,015 | | | 149,203 | | | 4.0 | | | 6.6 | |
Alternatives/Multi-Asset Solutions(2): | | | | | | | | | |
| U.S. | 6,104 | | | 5,568 | | | 5,024 | | | 9.6 | | | 10.8 | |
| Global & Non-US | 56,151 | | | 48,179 | | | 38,433 | | | 16.5 | | | 25.4 | |
| Total Alternatives/Multi-Asset Solutions | 62,255 | | | 53,747 | | | 43,457 | | | 15.8 | | | 23.7 | |
| Total: | | | | | | | | | |
| U.S. | 164,178 | | | 149,492 | | | 130,166 | | | 9.8 | | | 14.8 | |
| Global & Non-US | 151,420 | | | 133,198 | | | 116,113 | | | 13.7 | | | 14.7 | |
| Total | $ | 315,598 | | | $ | 282,690 | | | $ | 246,279 | | | 11.6 | | | 14.8 | |
| Affiliated - EQH | $ | 91,396 | | | $ | 78,506 | | | $ | 64,447 | | | 16.4 | | | 21.8 | |
| AXA | 16,448 | | | 27,136 | | | 25,948 | | | (39.4) | | | 4.6 | |
| Non-affiliated | 207,754 | | | 177,048 | | | 155,884 | | | 17.3 | | | 13.6 | |
| Total | $ | 315,598 | | | $ | 282,690 | | | $ | 246,279 | | | 11.6 | | | 14.8 | |
(1)Includes index and enhanced index services.
(2)Includes certain multi-asset solutions and services not included in equity or fixed income services.
| | |
|
Revenues from Institutional Services (by Investment Service) |
|
| | | | | | | | | | | | | | | | | | | | | | | | | | | | | |
| | Years Ended December 31 | | % Change |
| 2023 | 2022 | 2021 | | 2023-22 | 2022-21 |
| | (in thousands) | | | |
| Equity: | | | | | | | | | |
| Equity Actively Managed | | $ | 197,822 | | | $ | 220,917 | | | $ | 240,049 | | | (10.5 | %) | (8.0 | %) |
Equity Passively Managed(1) | | 4,115 | | | 4,910 | | | 6,119 | | | (16.2) | | (19.8) | |
| Total Equity | | 201,937 | | | 225,827 | | | 246,168 | | | (10.6) | | (8.3) | |
| U.S. | | 75,861 | | | 80,908 | | | 97,522 | | | (6.2) | | (17.0) | |
| Global & Non-U.S. | | 126,076 | | | 144,919 | | | 148,646 | | | (13.0) | | (2.5) | |
| Total Equity | | 201,937 | | | 225,827 | | | 246,168 | | | (10.6) | | (8.3) | |
| Fixed Income: | | | | | | | | | |
| Fixed Income Taxable | | 180,625 | | | 189,679 | | | 199,866 | | | (4.8) | | (5.1) | |
| Fixed Income Tax-Exempt | | 1,300 | | | 1,182 | | | 1,356 | | | 10.0 | | (12.8) | |
Fixed Income Passively Managed(1) | | 580 | | | 425 | | | 105 | | | 36.5 | | n/m |
Fixed Income Servicing(2) | | 20,149 | | | 15,991 | | | 14,738 | | | 26.0 | | 8.5 | |
| Total Fixed Income | | 202,654 | | | 207,277 | | | 216,065 | | | (2.2) | | (4.1) | |
| U.S. | | 135,560 | | | 128,392 | | | 124,004 | | | 5.6 | | 3.5 | |
| Global & Non-U.S. | | 67,094 | | | 78,885 | | | 92,061 | | | (14.9) | | (14.3) | |
| Total Fixed Income | | 202,654 | | | 207,277 | | | 216,065 | | | (2.2) | | (4.1) | |
Alternatives/Multi-Asset Solutions(3): | | | | | | | | | |
| U.S. | | 94,488 | | | 114,982 | | | 64,646 | | | (17.8) | | 77.9 | |
| Global & Non-U.S. | | 166,964 | | | 111,202 | | | 59,179 | | | 50.1 | | 87.9 | |
| Total Alternatives/Multi-Asset Solutions | | 261,452 | | | 226,184 | | | 123,825 | | | 15.6 | | 82.7 | |
| Total Investment Advisory and Services Fees: | | | | | | | | | |
| U.S. | | 305,909 | | | 324,282 | | | 286,172 | | | (5.7) | | 13.3 | |
| Global & Non-U.S. | | 360,134 | | | 335,004 | | | 299,886 | | | 7.5 | | 11.7 | |
| | | | | | | | | |
| Total | | 666,043 | | | 659,286 | | | 586,058 | | | 1.0 | | 12.5 | |
| Distribution Revenues | | 250 | | | 268 | | | 474 | | | (6.7) | | (43.5) | |
| Shareholder Servicing Fees | | 377 | | | 429 | | | 485 | | (12.1) | | (11.5) | |
| Total | | $ | 666,670 | | | $ | 659,983 | | | $ | 587,017 | | | 1.0 | | 12.4 | |
| Affiliated - EQH | | 144,523 | | | 125,229 | | | 105,415 | | | 15.4 | | 18.8 | |
| | | | | | | | | |
| Non-affiliated | | 522,147 | | | 534,754 | | | 481,602 | | | (2.4) | | 11.0 | |
| Total | | $ | 666,670 | | | $ | 659,983 | | | $ | 587,017 | | | 1.0 | | 12.4 | |
(1)Includes index and enhanced index services.
(2)Fixed Income Servicing includes advisory-related services fees that are not based on AUM, including derivative transaction fees, capital purchase program-related advisory services and other fixed income advisory services.
(3)Includes certain multi-asset solutions and services not included in equity or fixed income services.
| | | | | | | | | | | | | | | | | | | | | | | | | | | | | |
| Years Ended December 31, | | % Change |
| 2020 | | 2019 | | 2018 | | 2020-19 | | 2019-18 |
| (in thousands) | | | | |
| Equity Actively Managed: | | | | | | | | | |
| U.S. | $ | 66,118 | | | $ | 62,252 | | | $ | 60,465 | | | 6.2 | % | | 3.0 | % |
| Global & Non-US | 104,684 | | | 98,169 | | | 103,763 | | | 6.6 | | | (5.4) | |
| Total | 170,802 | | | 160,421 | | | 164,228 | | | 6.5 | | | (2.3) | |
Equity Passively Managed(1): | | | | | | | | | |
| U.S. | 3,677 | | | 3,846 | | | 3,713 | | | (4.4) | | | 3.6 | |
| Global & Non-US | 2,174 | | | 1,992 | | | 1,880 | | | 9.1 | | | 6.0 | |
| Total | 5,851 | | | 5,838 | | | 5,593 | | | 0.2 | | | 4.4 | |
| Total Equity | 176,653 | | | 166,259 | | | 169,821 | | | 6.3 | | | (2.1) | |
| Fixed Income Taxable: | | | | | | | | | |
| U.S. | 103,414 | | | 103,735 | | | 102,356 | | | (0.3) | | | 1.3 | |
| Global & Non-US | 90,612 | | | 100,352 | | | 106,314 | | | (9.7) | | | (5.6) | |
| Total | 194,026 | | | 204,087 | | | 208,670 | | | (4.9) | | | (2.2) | |
| Fixed Income Tax-Exempt: | | | | | | | | | |
| U.S. | 1,355 | | | 1,309 | | | 1,217 | | | 3.5 | | | 7.6 | |
| Global & Non-US | — | | | — | | | — | | | — | | | — | |
| Total | 1,355 | | | 1,309 | | | 1,217 | | | 3.5 | | | 7.6 | |
Fixed Income Passively Managed(1): | | | | | | | | | |
| U.S. | 47 | | | 86 | | | 49 | | | (45.3) | | | 75.5 | |
| Global & Non-US | 35 | | | 21 | | | 28 | | | 66.7 | | | (25.0) | |
| Total | 82 | | | 107 | | | 77 | | | (23.4) | | | 39.0 | |
Fixed Income Servicing(2): | | | | | | | | | |
| U.S. | 14,108 | | | 13,215 | | | 12,708 | | | 6.8 | | | 4.0 | |
| Global & Non-US | — | | | — | | | — | | | — | | | — | |
| Total | 14,108 | | | 13,215 | | | 12,708 | | | 6.8 | | | 4.0 | |
| Total Fixed Income | 209,571 | | | 218,718 | | | 222,672 | | | (4.2) | | | (1.8) | |
Alternatives/Multi-Asset Solutions(3): | | | | | | | | | |
| U.S. | 52,222 | | | 54,582 | | | 52,131 | | | (4.3) | | | 4.7 | |
| Global & Non-US | 73,354 | | | 39,405 | | | 33,530 | | | 86.2 | | | 17.5 | |
| Total Alternatives/Multi-Asset Solutions | 125,576 | | | 93,987 | | | 85,661 | | | 33.6 | | | 9.7 | |
| Total Investment Advisory and Services Fees: | | | | | | | | | |
| U.S. | 240,941 | | | 239,025 | | | 232,639 | | | 0.8 | | | 2.7 | |
| Global & Non-US | 270,859 | | | 239,939 | | | 245,515 | | | 12.9 | | | (2.3) | |
| Consolidated company-sponsored investment funds | — | | | — | | | (372) | | | — | | | 100.0 | |
| Total | 511,800 | | | 478,964 | | | 477,782 | | | 6.9 | | | 0.2 | |
| Distribution Revenues | 588 | | | 704 | | | 757 | | | (16.5) | | | (7.0) | |
| Shareholder Servicing Fees | 526 | | | 476 | | | 529 | | | 10.5 | | | (10.0) | |
| Total | $ | 512,914 | | | $ | 480,144 | | | $ | 479,068 | | | 6.8 | | | 0.2 | |
Affiliated - EQH(4) | $ | 90,101 | | | $ | 82,413 | | | $ | 78,011 | | | 9.3 | | | 5.6 | |
| AXA | 62,999 | | | 55,135 | | | 53,745 | | | 14.3 | | | 2.6 | |
Non-affiliated(4) | 359,814 | | | 342,596 | | | 347,312 | | | 5.0 | | | (1.4) | |
| Total | $ | 512,914 | | | $ | 480,144 | | | $ | 479,068 | | | 6.8 | | | 0.2 | |
(1)Includes index and enhanced index services.
(2)Fixed Income Servicing includes advisory-related services fees that are not based on AUM, including derivative transaction fees, capital purchase program-related advisory services and other fixed income advisory services.
(3)Includes certain multi-asset solutions and services not included in equity or fixed income services.
(4)Amounts in 2019 and 2018 have been reclassified to conform to the current period's presentation.
Retail
| | | | | |
| 6 |
We provide investment management and related services to a wide variety of individual retail investors, both in the U.S. and internationally, through retail mutual funds we sponsor, mutual fund sub-advisory relationships, separately-managed account programs (see below), and other investment vehicles (“Retail Products and Services”).
We distribute our Retail Products and Services through financial intermediaries, including broker-dealers, insurance sales representatives, banks, registered investment advisers and financial planners. These products and services include open-end and closed-end funds that are either (i) registered as investment companies under the Investment Company Act (“U.S. Funds”), or (ii) not registered under the Investment Company Act and generally not offered to U.S. persons (“Non-U.S. Funds” and, collectively with the U.S. Funds, “AB Funds”). They also include separately-managed account programs, which are sponsored by financial intermediaries and generally charge an all-inclusive fee covering investment management, trade execution, asset allocation, and custodial and administrative services. In addition, we provide distribution, shareholder servicing, transfer agency services and administrative services for our Retail Products and Services. See “Net Revenues – Investment Advisory and Services Fees” in Item 7 for information about our retail investment advisory and services fees. See Note 2 to AB’s consolidated financial statements in Item 8 for a discussion of the commissions we pay to financial intermediaries in connection with the sale of open-end AB Funds.
Fees paid by the U.S. Funds are reflected in the applicable investment management agreement, which generally must be approved annually by the board of directors or trustees of those funds, by a majority vote of the independent directors or trustees. Increases in these fees must be approved by fund shareholders; decreases need not be, including any decreases implemented by a fund’s directors or trustees. In general, each investment management agreement with the U.S. Funds provides for termination by either party,at any time, upon 60 days’ notice.
Fees paid by Non-U.S. Funds are reflected in management agreements that continue until they are terminated. Increases in these fees generally must be approved by the relevant regulatory authority, depending on the domicile and structure of the fund, and Non-U.S. Fund shareholders must be given advance notice of any fee increases.
The mutual funds we sub-advise for EQH and its subsidiaries constitute our largest retail client. EQH and its subsidiaries accounted for approximately 14%, 14% and 16% of our retail AUM as of December 31, 2020, 2019 and 2018, respectively, and approximately 1%, 2% and 2% of our retail net revenues for the years ended December 31, 2020, 2019 and 2018, respectively. Also, AXA and its subsidiaries accounted for approximately 2%, 2% and 3% of our retail AUM as of December 31, 2020, 2019 and 2018, respectively, and approximately 1%, 1% and 2% of our retail net revenues for the years ended December 31, 2020, 2019 and 2018, respectively.
HSBC was responsible for approximately 6%, 14% and 7% of our open-end mutual fund sales in 2020, 2019 and 2018, respectively. HSBC is not under any obligation to sell a specific amount of AB Fund shares and is not our affiliate.
Most open-end U.S. Funds have adopted a plan under Rule 12b-1 of the Investment Company Act that allows the fund to pay, out of assets of the fund, distribution and service fees for the distribution and sale of its shares (“Rule 12b-1 Fees”). The open-end U.S. Funds have entered into such agreements with us, and we have entered into selling and distribution agreements pursuant to which we pay sales commissions to the financial intermediaries that distribute our open-end U.S. Funds. These agreements are terminable by either party upon notice (generally 30 days) and do not obligate the financial intermediary to sell any specific amount of fund shares.
As of December 31, 2020, retail U.S. Fund AUM were approximately $62 billion, or 23% of retail AUM, as compared to $55 billion, or 23%, as of December 31, 2019, and $43 billion, or 24%, as of December 31, 2018. Non-U.S. Fund AUM, as of December 31, 2020, totaled $110 billion, or 41% of retail AUM, as compared to $103 billion, or 43%, as of December 31, 2019, and $71 billion, or 39%, as of December 31, 2018.
|
Retail
We provide investment management and related services to a wide variety of individual retail investors globally through retail mutual funds we sponsor, mutual fund sub-advisory relationships, separately-managed account programs (see below), and other investment vehicles (“Retail Products and Services”).
We distribute our Retail Products and Services through financial intermediaries, including broker-dealers, insurance sales representatives, banks, registered investment advisers and financial planners. These products and services include open-end and closed-end funds that are either (i) registered as investment companies under the Investment Company Act (“U.S. Funds”), or (ii) not registered under the Investment Company Act and generally not offered to U.S. persons (“Non-U.S. Funds” and, collectively with the U.S. Funds, “AB Funds”). They also include separately-managed account programs, which are sponsored by financial intermediaries and generally charge an all-inclusive fee covering investment management, trade execution, asset allocation, and custodial and administrative services. In addition, we provide distribution, shareholder servicing, transfer agency services and administrative services for our Retail Products and Services. See “Net Revenues – Investment Advisory and Services Fees” in Item 7 for information about our retail investment advisory and services fees. See Note 2 to AB’s consolidated financial statements in Item 8 for a discussion of the commissions we pay to financial intermediaries in connection with the sale of open-end AB Funds.
Fees paid by the U.S. Funds are reflected in the applicable investment management agreement, which generally must be approved annually by the board of directors or trustees of those funds, by a majority vote of the independent directors or trustees. Increases in these fees must be approved by fund shareholders; decreases need not be, including any decreases implemented by a fund’s directors or trustees. In general, each investment management agreement with the U.S. Funds provides for termination by either party, at any time, upon 60 days’ notice.
Fees paid by Non-U.S. Funds are reflected in management agreements that continue until they are terminated. Increases in these fees generally must be approved by the relevant regulatory authority, depending on the domicile and structure of the fund, and Non-U.S. Fund shareholders must be given advance notice of any fee increases.
The mutual funds we sub-advise for EQH and its subsidiaries constitute our largest retail client. EQH and its subsidiaries accounted for approximately 14% of our retail AUM as of December 31, 2023, 2022 and 2021 and approximately 1% of our retail net revenues for the years ended December 31, 2023, 2022 and 2021.
Most open-end U.S. Funds have adopted a plan under Rule 12b-1 of the Investment Company Act that allows the fund to pay, out of assets of the fund, distribution and service fees for the distribution and sale of its shares. The open-end U.S. Funds have entered into such agreements with us, and we have entered into selling and distribution agreements pursuant to which we pay sales commissions to the financial intermediaries that distribute our open-end U.S. Funds. These agreements are terminable by either party upon notice (generally 30 days) and do not obligate the financial intermediary to sell any specific amount of fund shares.
As of December 31, 2023, retail U.S. Fund AUM were approximately $66 billion, or 23% of retail AUM, as compared to $54 billion, or 22%, as of December 31, 2022, and $73 billion, or 23%, as of December 31, 2021. Retail non-U.S. Fund AUM, as of December 31, 2023, totaled $107 billion, or 37% of retail AUM, as compared to $96 billion, or 39%, as of December 31, 2022, and $130 billion, or 41%, as of December 31, 2021.
Our Retail Services represented approximately 39%, 39% and 35% of our AUM as of December 31, 2020, 2019 and 2018, respectively, and the fees we earned from providing these services represented approximately 49%, 46% and 44% of our net revenues for the years ended December 31, 2020, 2019 and 2018,
Our Retail Services represented approximately 39%, 38% and 41% of our AUM as of December 31, 2023, 2022 and 2021, respectively, and the fees we earned from providing these services represented approximately 46%, 49% and 50% of our net revenues for the years ended December 31, 2023, 2022 and 2021, respectively. Our AUM and revenues are as follows:
| | |
|
Retail Services Assets Under Management (by Investment Service) | | | | | | | | | | | | | | | | | | | | | | | | | | | | | | | December 31, | | % Change | | 2020 | | 2019 | | 2018 | | 2020-19 | | 2019-18 | | (in millions) | | | | | | Equity Actively Managed: | | | | | | | | | | | U.S. | $ | 79,569 | | | $ | 57,125 | | | $ | 41,450 | | | 39.3 | % | | 37.8 | % | | Global & Non-US | 27,297 | | | 24,497 | | | 19,475 | | | 11.4 | | | 25.8 | | | Total | 106,866 | | | 81,622 | | | 60,925 | | | 30.9 | | | 34.0 | | Equity Passively Managed(1): | | | | | | | | | | | U.S. | 28,937 | | | 27,153 | | | 22,658 | | | 6.6 | | | 19.8 | | | Global & Non-US | 7,058 | | | 7,530 | | | 6,697 | | | (6.3) | | | 12.4 | | | Total | 35,995 | | | 34,683 | | | 29,355 | | | 3.8 | | | 18.2 | | | Total Equity | 142,861 | | | 116,305 | | | 90,280 | | | 22.8 | | | 28.8 | | | Fixed Income Taxable: | | | | | | | | | | | U.S. | 8,510 | | | 9,093 | | | 7,029 | | | (6.4) | | | 29.4 | | | Global & Non-US | 76,144 | | | 79,315 | | | 53,413 | | | (4.0) | | | 48.5 | | | Total | 84,654 | | | 88,408 | | | 60,442 | | | (4.2) | | | 46.3 | | | Fixed Income Tax-Exempt: | | | | | | | | | | | U.S. | 23,167 | | | 20,706 | | | 16,403 | | | 11.9 | | | 26.2 | | | Global & Non-US | 35 | | | 44 | | | 42 | | | (20.5) | | | 4.8 | | | Total | 23,202 | | | 20,750 | | | 16,445 | | | 11.8 | | | 26.2 | | Fixed Income Passively Managed(1): | | | | | | | | | | | U.S. | 4,460 | | | 5,031 | | | 4,965 | | | (11.3) | | | 1.3 | | | Global & Non-US | 3,771 | | | 3,794 | | | 3,964 | | | (0.6) | | | (4.3) | | | Total | 8,231 | | | 8,825 | | | 8,929 | | | (6.7) | | | (1.2) | | | Total Fixed Income | 116,087 | | | 117,983 | | | 85,816 | | | (1.6) | | | 37.5 | | Alternatives/Multi-Asset Solutions(2): | | | | | | | | | | | U.S. | 3,071 | | | 2,470 | | | 2,476 | | | 24.3 | | | (0.2) | | | Global & Non-US | 3,321 | | | 2,408 | | | 2,197 | | | 37.9 | | | 9.6 | | | Total Alternatives/Multi-Asset Solutions | 6,392 | | | 4,878 | | | 4,673 | | | 31.0 | | | 4.4 | | | Total: | | | | | | | | | | | U.S. | 147,714 | | | 121,578 | | | 94,981 | | | 21.5 | | | 28.0 | | | Global & Non-US | 117,626 | | | 117,588 | | | 85,788 | | | — | | | 37.1 | | | Total | $ | 265,340 | | | $ | 239,166 | | | $ | 180,769 | | | 10.9 | | | 32.3 | | | Affiliated - EQH | $ | 36,765 | | | $ | 34,448 | | | $ | 29,206 | | | 6.7 | | | 17.9 | | | AXA | 6,150 | | | 5,680 | | | 5,471 | | | 8.3 | | | 3.8 | | | Non-affiliated | 222,425 | | | 199,038 | | | 146,092 | | | 11.8 | | | 36.2 | | | Total | $ | 265,340 | | | $ | 239,166 | | | $ | 180,769 | | | 10.9 | | | 32.3 | |
|
|
| | | | | | | | | | | | | | | | | | | | | | | | | | | | | |
| | Years Ended December 31 | | % Change |
| 2023 | 2022 | 2021 | | 2023-22 | 2022-21 |
| | (in millions) | | | |
| Equity: | | | | | | | | | |
| Equity Actively Managed | | $ | 137,702 | | | $ | 116,235 | | | $ | 154,200 | | | 18.5 | % | (24.6 | %) |
Equity Passively Managed(1) | | 34,582 | | | 30,445 | | | 40,821 | | | 13.6 | | (25.4) | |
| Total Equity | | 172,284 | | | 146,680 | | | 195,021 | | | 17.5 | | (24.8) | |
| U.S. | | 141,721 | | | 118,547 | | | 152,106 | | | 19.5 | | (22.1) | |
| Global & Non-U.S. | | 30,563 | | | 28,133 | | | 42,915 | | | 8.6 | | (34.4) | |
| Total Equity | | 172,284 | | | 146,680 | | | 195,021 | | | 17.5 | | (24.8) | |
| Fixed Income: | | | | | | | | | |
| Fixed Income Taxable | | 64,051 | | | 53,995 | | | 75,813 | | | 18.6 | | (28.8) | |
| Fixed Income Tax-Exempt | | 33,014 | | | 26,714 | | | 29,009 | | | 23.6 | | (7.9) | |
Fixed Income Passively Managed(1) | | 11,066 | | | 9,206 | | | 12,762 | | | 20.2 | | (27.9) | |
| Total Fixed Income | | 108,131 | | | 89,915 | | | 117,584 | | | 20.3 | | (23.5) | |
| U.S. | | 52,683 | | | 41,151 | | | 46,361 | | | 28.0 | | (11.2) | |
| Global & Non-U.S. | | 55,448 | | | 48,764 | | | 71,223 | | | 13.7 | | (31.5) | |
| Total Fixed Income | | 108,131 | | | 89,915 | | | 117,584 | | | 20.3 | | (23.5) | |
Alternatives/Multi-Asset Solutions(2): | | | | | | | | | |
| U.S. | | 2,724 | | | 2,697 | | | 3,595 | | | 1.0 | | (25.0) | |
| Global & Non-U.S. | | 3,636 | | | 3,594 | | | 3,718 | | | 1.2 | | (3.3) | |
| Total Alternatives/Multi-Asset Solutions | | 6,360 | | | 6,291 | | | 7,313 | | | 1.1 | | (14.0) | |
| Total: | | | | | | | | | |
| U.S. | | 197,128 | | | 162,395 | | | 202,062 | | | 21.4 | | (19.6) | |
| Global & Non-U.S. | | 89,647 | | | 80,491 | | | 117,856 | | | 11.4 | | (31.7) | |
| Total | | $ | 286,775 | | | $ | 242,886 | | | $ | 319,918 | | | 18.1 | % | (24.1 | %) |
| Affiliated - EQH | | 40,516 | | | 34,110 | | | 44,417 | | | 18.8 | | (23.2) | |
| | | | | | | | | |
| Non-affiliated | | 246,259 | | | 208,776 | | | 275,501 | | | 18.0 | | (24.2) | |
| Total | | $ | 286,775 | | | $ | 242,886 | | | $ | 319,918 | | | 18.1 | % | (24.1 | %) |
(1)Includes index and enhanced index services.
(2)Includes certain multi-asset solutions and services not included in equity or fixed income services
| | | | | |
| 8 | (2)AllianceBernsteinIncludes certain multi-asset solutions and services not included in equity or fixed income services. |
| | |
|
Revenues from Retail Services (by Investment Service) | | | | | | | | | | | | | | | | | | | | | | | | | | | | | | | Years Ended December 31, | | % Change | | 2020 | | 2019 | | 2018 | | 2020-19 | | 2019-18 | | (in thousands) | | | | | | Equity Actively Managed: | | | | | | | | | | | U.S. | $ | 346,538 | | | $ | 283,461 | | | $ | 235,611 | | | 22.3 | % | | 20.3 | % | | Global & Non-US | 162,435 | | | 153,156 | | | 149,995 | | | 6.1 | | | 2.1 | | | Total | 508,973 | | | 436,617 | | | 385,606 | | | 16.6 | | | 13.2 | | Equity Passively Managed(1): | | | | | | | | | | | U.S. | 9,004 | | | 9,179 | | | 8,901 | | | (1.9) | | | 3.1 | | | Global & Non-US | 5,343 | | | 6,994 | | | 7,861 | | | (23.6) | | | (11.0) | | | Total | 14,347 | | | 16,173 | | | 16,762 | | | (11.3) | | | (3.5) | | | Total Equity | 523,320 | | | 452,790 | | | 402,368 | | | 15.6 | | | 12.5 | | | Fixed Income Taxable: | | | | | | | | | | | U.S. | 25,127 | | | 26,963 | | | 25,194 | | | (6.8) | | | 7.0 | | | Global & Non-US | 509,037 | | | 479,886 | | | 438,048 | | | 6.1 | | | 9.6 | | | Total | 534,164 | | | 506,849 | | | 463,242 | | | 5.4 | | | 9.4 | | | Fixed Income Tax-Exempt: | | | | | | | | | | | U.S. | 70,661 | | | 65,375 | | | 58,824 | | | 8.1 | | | 11.1 | | | Global & Non-US | 73 | | | 99 | | | 132 | | | (26.3) | | | (25.0) | | | Total | 70,734 | | | 65,474 | | | 58,956 | | | 8.0 | | | 11.1 | | Fixed Income Passively Managed(1): | | | | | | | | | | | U.S. | 6,037 | | | 5,972 | | | 6,086 | | | 1.1 | | | (1.9) | | | Global & Non-US | 6,192 | | | 6,133 | | | 6,809 | | | 1.0 | | | (9.9) | | | Total | 12,229 | | | 12,105 | | | 12,895 | | | 1.0 | | | (6.1) | | | Total Fixed Income | 617,127 | | | 584,428 | | | 535,093 | | | 5.6 | | | 9.2 | | Alternatives/Multi-Asset Solutions(2): | | | | | | | | | | | U.S. | 57,069 | | | 51,958 | | | 63,232 | | | 9.8 | | | (17.8) | | | Global & Non-US | 12,723 | | | 8,946 | | | 8,575 | | | 42.2 | | | 4.3 | | | Total Alternatives/Multi-Asset Solutions | 69,792 | | | 60,904 | | | 71,807 | | | 14.6 | | | (15.2) | | | Total Investment Advisory and Services Fees: | | | | | | | | | | | U.S. | 514,436 | | | 442,908 | | | 397,848 | | | 16.1 | | | 11.3 | | | Global & Non-US | 695,803 | | | 655,214 | | | 611,420 | | | 6.2 | | | 7.2 | | | Consolidated company-sponsored investment funds | 733 | | | 883 | | | 1,047 | | | (17.0) | | | (15.7) | | | Total | 1,210,972 | | | 1,099,005 | | | 1,010,315 | | | 10.2 | | | 8.8 | | | Distribution Revenues | 522,056 | | | 447,050 | | | 411,996 | | | 16.8 | | | 8.5 | | | Shareholder Servicing Fees | 78,920 | | | 73,777 | | | 72,134 | | | 7.0 | | | 2.3 | | | Total | $ | 1,811,948 | | | $ | 1,619,832 | | | $ | 1,494,445 | | | 11.9 | | | 8.4 | | | Affiliated - EQH | $ | 27,130 | | | $ | 27,737 | | | $ | 27,814 | | | (2.2) | | | (0.3) | | | AXA | 23,762 | | | 23,293 | | | 24,946 | | | 2.0 | | | (6.6) | | | Non-affiliated | 1,761,056 | | | 1,568,802 | | | 1,441,685 | | | 12.3 | | | 8.8 | | | Total | $ | 1,811,948 | | | $ | 1,619,832 | | | $ | 1,494,445 | | | 11.9 | | | 8.4 | |
|
|
| | | | | | | | | | | | | | | | | | | | | | | | | | | | | |
| | Years Ended December 31 | | % Change |
| 2023 | 2022 | 2021 | | 2023-22 | 2022-21 |
| | (in thousands) | | | |
| Equity: | | | | | | | | | |
| Equity Actively Managed | | $ | 732,186 | | | $ | 746,889 | | | $ | 766,578 | | | (2.0 | %) | (2.6 | %) |
Equity Passively Managed(1) | | 11,283 | | | 12,870 | | | 14,773 | | | (12.3) | | (12.9) | |
| Total Equity | | 743,469 | | | 759,759 | | | 781,351 | | | (2.1) | | (2.8) | |
| U.S. | | 556,751 | | | 558,319 | | | 556,398 | | | (0.3) | | 0.3 | |
| Global & Non-U.S. | | 186,718 | | | 201,440 | | | 224,953 | | | (7.3) | | (10.5) | |
| Total Equity | | 743,469 | | | 759,759 | | | 781,351 | | | (2.1) | | (2.8) | |
| Fixed Income: | | | | | | | | | |
| Fixed Income Taxable | | 373,659 | | | 390,708 | | | 517,327 | | | (4.4) | | (24.5) | |
| Fixed Income Tax-Exempt | | 88,128 | | | 89,450 | | | 84,945 | | | (1.5) | | 5.3 | |
Fixed Income Passively Managed(1) | | 12,247 | | | 13,682 | | | 12,994 | | | (10.5) | | 5.3 | |
| Total Fixed Income | | 474,034 | | | 493,840 | | | 615,266 | | | (4.0) | | (19.7) | |
| U.S. | | 118,288 | | | 119,053 | | | 115,248 | | | (0.6) | | 3.3 | |
| Global & Non-U.S. | | 355,746 | | | 374,787 | | | 500,018 | | | (5.1) | | (25.0) | |
| Total Fixed Income | | 474,034 | | | 493,840 | | | 615,266 | | | (4.0) | | (19.7) | |
Alternatives/Multi-Asset Solutions(2): | | | | | | | | | |
| U.S. | | 44,273 | | | 55,356 | | | 81,872 | | | (20.0) | | (32.4) | |
| Global & Non-U.S. | | 13,499 | | | 13,484 | | | 13,117 | | | 0.1 | | 2.8 | |
| Total Alternatives/Multi-Asset Solutions | | 57,772 | | | 68,840 | | | 94,989 | | | (16.1) | | (27.5) | |
| Total Investment Advisory and Services Fees: | | | | | | | | | |
| U.S. | | 719,312 | | | 732,728 | | | 753,518 | | | (1.8) | | (2.8) | |
| Global & Non-U.S. | | 555,963 | | | 589,711 | | | 738,086 | | | (5.7) | | (20.1) | |
| Consolidated company-sponsored investment funds | | 836 | | | 770 | | | 1,243 | | | 8.6 | | (38.1) | |
| Total | | 1,276,111 | | | 1,323,209 | | | 1,492,847 | | | (3.6) | | (11.4) | |
| Distribution Revenues | | 569,485 | | | 594,431 | | | 644,125 | | | (4.2) | | (7.7) | |
| Shareholder Servicing Fees | | 80,424 | | | 83,268 | | | 86,857 | | | (3.4) | | (4.1) | |
| Total | | $ | 1,926,020 | | | $ | 2,000,908 | | | $ | 2,223,829 | | | (3.7 | %) | (10.0 | %) |
| Affiliated - EQH | | 21,842 | | | 23,836 | | | 28,334 | | | (8.4) | | (15.9) | |
| | | | | | | | | |
| Non-affiliated | | 1,904,178 | | | 1,977,072 | | | 2,195,495 | | | (3.7) | | (9.9) | |
| Total | | $ | 1,926,020 | | | $ | 2,000,908 | | | $ | 2,223,829 | | | (3.7 | %) | (10.0 | %) |
(1)Includes index and enhanced index services.
(2)Includes certain multi-asset solutions and services not included in equity or fixed income services.
| | | | | |
(2)2023 Annual ReportIncludes certain multi-asset solutions and services not included in equity or fixed income services.
| 9 |
Private Wealth Management
We offerpartner with our clients, embracing innovation and research to our private wealthaddress increasingly complex challenges. Our clients which include high-net-worth individuals and families trustswho have created generational wealth as successful business owners, athletes, entertainers, corporate executives and estates, charitableprivate practice owners. We also provide investment and wealth advice to foundations partnerships, private and endowments, family corporations,offices and other entities,entities. Our flexible and extensive investment platform offers a range of solutions, including separately-managed accounts, hedge funds, mutual funds and other investment vehicles, (“tailored to meet each distinct client's needs. Our investment platform is complimented with a wealth platform that includes complex tax and estate planning, pre-IPO and pre-transaction planning, multi-generational family engagement, and philanthropic advice in addition to tailored approaches to meeting the unique needs of emerging wealth and multi-cultural demographics ("Private Wealth Services”").
We manage these accounts pursuant to written investment advisory agreements, which generally are terminable at any time or upon relatively short notice by any authorized party, and may not be assigned without the client's consent. For information about our investment advisory and services fees, including performance-based fees, see “Risk Factors” in Item 1A and “Net Revenues – Investment Advisory and Services Fees” in Item 7.
Our Private Wealth Services represented approximately 15%17%, 16% and 17%16% of our AUM as of December 31, 2020, 20192023, 2022 and 2018,2021, respectively. The fees we earned from providing these services represented approximately 24%, 26% and 26%25% of our net revenues for 2020, 20192023, 2022 and 2018, respectively.2021. Our AUM and revenues are as follows:
| | |
|
Private Wealth Services Assets Under Management (by Investment Service) |
|
Private Wealth Services Assets Under Management | | | | | | | | | | | | | | | | | | | | | | | | | | | | | |
| | Years Ended December 31 | | % Change |
| 2023 | 2022 | 2021 | | 2023-22 | 2022-21 |
| | (in millions) | | | |
| Equity: | | | | | | | | | |
| Equity Actively Managed | | $ | 50,351 | | | $ | 45,977 | | | $ | 59,709 | | | 9.5 | % | (23.0 | %) |
Equity Passively Managed(1) | | 3,851 | | | 2,304 | | | 1,764 | | | 67.1 | % | 30.6 | % |
| Total Equity | | 54,202 | | | 48,281 | | | 61,473 | | | 12.3 | | (21.5) | |
| U.S. | | 33,639 | | | 28,014 | | | 35,014 | | | 20.1 | | (20.0) | |
| Global & Non-U.S. | | 20,563 | | | 20,267 | | | 26,459 | | | 1.5 | | (23.4) | |
| Total Equity | | 54,202 | | | 48,281 | | | 61,473 | | | 12.3 | | (21.5) | |
| Fixed Income: | | | | | | | | | |
| Fixed Income Taxable | | 18,201 | | | 14,391 | | | 14,567 | | | 26.5 | | (1.2) | |
| Fixed Income Tax-Exempt | | 26,760 | | | 24,953 | | | 26,929 | | | 7.2 | | (7.3) | |
Fixed Income Passively Managed(1) | | 2 | | | 2 | | | 231 | | | — | | (99.1) | |
| Total Fixed Income | | 44,963 | | | 39,346 | | | 41,727 | | | 14.3 | | (5.7) | |
| U.S. | | 40,166 | | | 34,764 | | | 36,166 | | | 15.5 | | (3.9) | |
| Global & Non-U.S. | | 4,797 | | | 4,582 | | | 5,561 | | | 4.7 | | (17.6) | |
| Total Fixed Income | | 44,963 | | | 39,346 | | | 41,727 | | | 14.3 | | (5.7) | |
Alternatives/Multi-Asset Solutions(2): | | | | | | | | | |
| U.S. | | 6,923 | | | 6,607 | | | 6,926 | | | 4.8 | | (4.6) | |
| Global & Non-U.S. | | 15,167 | | | 12,021 | | | 11,446 | | | 26.2 | | 5.0 | |
| Total Alternatives/Multi-Asset Solutions | | 22,090 | | | 18,628 | | | 18,372 | | | 18.6 | | 1.4 | |
| Total: | | | | | | | | | |
| U.S. | | 80,728 | | | 69,385 | | | 78,106 | | | 16.3 | | (11.2) | |
| Global & Non-U.S. | | 40,527 | | | 36,870 | | | 43,466 | | | 9.9 | | (15.2) | |
| Total | | $ | 121,255 | | | $ | 106,255 | | | $ | 121,572 | | | 14.1 | % | (12.6 | %) |
(by Investment Service)
| | | | | | | | | | | | | | | | | | | | | | | | | | | | | |
| December 31, | | % Change |
| 2020 | | 2019 | | 2018 | | 2020-19 | | 2019-18 |
| (in millions) | | | | |
| Equity Actively Managed: | | | | | | | | | |
| U.S. | $ | 28,135 | | | $ | 26,840 | | | $ | 22,504 | | | 4.8 | % | | 19.3 | % |
| Global & Non-US | 22,719 | | | 24,094 | | | 19,809 | | | (5.7) | | | 21.6 | |
| Total | 50,854 | | | 50,934 | | | 42,313 | | | (0.2) | | | 20.4 | |
Equity Passively Managed(1): | | | | | | | | | |
| U.S. | 641 | | | 142 | | | 113 | | | n/m | | 25.7 | |
| Global & Non-US | 25 | | | 32 | | | 42 | | | (21.9) | | | (23.8) | |
| Total | 666 | | | 174 | | | 155 | | | n/m | | 12.3 | |
| Total Equity | 51,520 | | | 51,108 | | | 42,468 | | | 0.8 | | | 20.3 | |
| Fixed Income Taxable: | | | | | | | | | |
| U.S. | 9,293 | | | 7,583 | | | 7,022 | | | 22.6 | | | 8.0 | |
| Global & Non-US | 5,222 | | | 4,587 | | | 4,154 | | | 13.8 | | | 10.4 | |
| Total | 14,515 | | | 12,170 | | | 11,176 | | | 19.3 | | | 8.9 | |
| Fixed Income Tax-Exempt: | | | | | | | | | |
| U.S. | 25,749 | | | 25,102 | | | 24,129 | | | 2.6 | | | 4.0 | |
| Global & Non-US | 15 | | | 15 | | | 15 | | | — | | | — | |
| Total | 25,764 | | | 25,117 | | | 24,144 | | | 2.6 | | | 4.0 | |
Fixed Income Passively Managed(1): | | | | | | | | | |
| U.S. | — | | | — | | | 11 | | | — | | | (100.0) | |
| Global & Non-US | 195 | | | 372 | | | 404 | | | (47.6) | | | (7.9) | |
| Total | 195 | | | 372 | | | 415 | | | (47.6) | | | (10.4) | |
| Total Fixed Income | 40,474 | | | 37,659 | | | 35,735 | | | 7.5 | | | 5.4 | |
Alternatives/Multi-Asset Solutions(2): | | | | | | | | | |
| U.S. | 5,927 | | | 6,808 | | | 5,762 | | | (12.9) | | | 18.2 | |
| Global & Non-US | 7,064 | | | 5,484 | | | 5,340 | | | 28.8 | | | 2.7 | |
| Total Alternatives/Multi-Asset Solutions | 12,991 | | | 12,292 | | | 11,102 | | | 5.7 | | | 10.7 | |
| Total: | | | | | | | | | |
| U.S. | 69,745 | | | 66,475 | | | 59,541 | | | 4.9 | | | 11.6 | |
| Global & Non-US | 35,240 | | | 34,584 | | | 29,764 | | | 1.9 | | | 16.2 | |
| Total | $ | 104,985 | | | $ | 101,059 | | | $ | 89,305 | | | 3.9 | | | 13.2 | |
(1)Includes index and enhanced index services.
(2)Includes certain multi-asset solutions and services not included in equity or fixed income services.
| | |
|
Revenues from Private Wealth Services (by Investment Service) | | | | | | | | | | | | | | | | | | | | | | | | | | | | | | | Years Ended December 31, | | % Change | | 2020 | | 2019 | | 2018 | | 2020-19 | | 2019-18 | | (in thousands) | | | | | | Equity Actively Managed: | | | | | | | | | | | U.S. | $ | 262,885 | | | $ | 267,671 | | | $ | 274,320 | | | (1.8) | % | | (2.4) | % | Global & Non-US(3) | 225,014 | | | 243,240 | | | 240,332 | | | (7.5) | | | 1.2 | | | Total | 487,899 | | | 510,911 | | | 514,652 | | | (4.5) | | | (0.7) | | Equity Passively Managed(1): | | | | | | | | | | | U.S. | 1,053 | | | 144 | | | 117 | | | n/m | | 23.1 | | | Global & Non-US | 60 | | | 190 | | | 254 | | | (68.4) | | | (25.2) | | | Total | 1,113 | | | 334 | | | 371 | | | n/m | | (10.0) | | | Total Equity | 489,012 | | | 511,245 | | | 515,023 | | | (4.3) | | | (0.7) | | | Fixed Income Taxable: | | | | | | | | | | | U.S. | 36,789 | | | 34,546 | | | 33,034 | | | 6.5 | | | 4.6 | | | Global & Non-US | 34,786 | | | 29,418 | | | 28,358 | | | 18.2 | | | 3.7 | | | Total | 71,575 | | | 63,964 | | | 61,392 | | | 11.9 | | | 4.2 | | | Fixed Income Tax-Exempt: | | | | | | | | | | | U.S. | 123,871 | | | 122,350 | | | 118,811 | | | 1.2 | | | 3.0 | | | Global & Non-US | 81 | | | 97 | | | 109 | | | (16.5) | | | (11.0) | | | Total | 123,952 | | | 122,447 | | | 118,920 | | | 1.2 | | | 3.0 | | Fixed Income Passively Managed(1): | | | | | | | | | | | U.S. | 6 | | | 13 | | | 156 | | | (53.8) | | | (91.7) | | Global & Non-US(3) | 2,885 | | | 4,462 | | | 5,312 | | | (35.3) | | | (16.0) | | | Total | 2,891 | | | 4,475 | | | 5,468 | | | (35.4) | | | (18.2) | | | Total Fixed Income | 198,418 | | | 190,886 | | | 185,780 | | | 3.9 | | | 2.7 | | Alternatives/Multi-Asset Solutions(2): | | | | | | | | | | | U.S. | 109,169 | | | 123,216 | | | 122,686 | | | (11.4) | | | 0.4 | | Global & Non-US(3) | 76,065 | | | 68,728 | | | 51,839 | | | 10.7 | | | 32.6 | | | Total Alternatives/Multi-Asset Solutions | 185,234 | | | 191,944 | | | 174,525 | | | (3.5) | | | 10.0 | | | Total Investment Advisory and Services Fees: | | | | | | | | | | | U.S. | 533,773 | | | 547,940 | | | 549,124 | | | (2.6) | | | (0.2) | | | Global & Non-US | 338,891 | | | 346,135 | | | 326,204 | | | (2.1) | | | 6.1 | | | Consolidated company-sponsored investment funds | — | | | — | | | (1,214) | | | — | | | 100.0 | | | Total | 872,664 | | | 894,075 | | | 874,114 | | | (2.4) | | | 2.3 | | | Distribution Revenues | 7,137 | | | 7,289 | | | 5,809 | | | (2.1) | | | 25.5 | | | Shareholder Servicing Fees | 2,871 | | | 3,141 | | | 3,311 | | | (8.6) | | | (5.1) | | | Total | $ | 882,672 | | | $ | 904,505 | | | $ | 883,234 | | | (2.4) | | | 2.4 | |
|
|
| | | | | | | | | | | | | | | | | | | | | | | | | | | | | |
| | Years Ended December 31 | | % Change |
| 2023 | 2022 | 2021 | | 2023-22 | 2022-21 |
| | (in thousands) | | | |
| Equity: | | | | | | | | | |
| Equity Actively Managed | | $ | 502,673 | | | $ | 521,155 | | | $ | 584,455 | | | (3.5 | %) | (10.8 | %) |
Equity Passively Managed(1) | | 14,711 | | | 8,700 | | | 4,780 | | | 69.1 | | 82.0 | |
| Total Equity | | 517,384 | | | 529,855 | | | 589,235 | | | (2.4) | | (10.1) | |
| U.S. | | 304,456 | | | 295,235 | | | 325,154 | | | 3.1 | | (9.2) | |
| Global & Non-U.S. | | 212,928 | | | 234,620 | | | 264,081 | | | (9.2) | | (11.2) | |
| Total Equity | | 517,384 | | | 529,855 | | | 589,235 | | | (2.4) | | (10.1) | |
| Fixed Income: | | | | | | | | | |
| Fixed Income Taxable | | 70,887 | | | 66,851 | | | 72,404 | | | 6.0 | | (7.7) | |
| Fixed Income Tax-Exempt | | 124,438 | | | 125,123 | | | 130,391 | | | (0.5) | | (4.0) | |
Fixed Income Passively Managed(1) | | 13 | | | 1,804 | | | 2,634 | | | (99.3) | | (31.5) | |
| Total Fixed Income | | 195,338 | | | 193,778 | | | 205,429 | | | 0.8 | | (5.7) | |
| U.S. | | 164,601 | | | 159,411 | | | 167,402 | | | 3.3 | | (4.8) | |
| Global & Non-U.S. | | 30,737 | | | 34,367 | | | 38,027 | | | (10.6) | | (9.6) | |
| Total Fixed Income | | 195,338 | | | 193,778 | | | 205,429 | | | 0.8 | | (5.7) | |
Alternatives/Multi-Asset Solutions(2): | | | | | | | | | |
| U.S. | | 223,518 | | | 195,666 | | | 249,432 | | | 14.2 | | (21.6) | |
| Global & Non-U.S. | | 97,074 | | | 69,245 | | | 71,524 | | | 40.2 | | (3.2) | |
| Total Alternatives/Multi-Asset Solutions | | 320,592 | | | 264,911 | | | 320,956 | | | 21.0 | | (17.5) | |
| Total Investment Advisory and Services Fees: | | | | | | | | | |
| U.S. | | 692,575 | | | 650,311 | | | 741,987 | | | 6.5 | | (12.4) | |
| Global & Non-U.S. | | 340,739 | | | 338,232 | | | 373,632 | | | 0.7 | | (9.5) | |
| | | | | | | | | |
| Total | | 1,033,314 | | | 988,543 | | | 1,115,619 | | | 4.5 | % | (11.4 | %) |
| Distribution Revenues | | 16,528 | | | 12,496 | | | 7,641 | | | 32.3 | | 63.5 | |
| Shareholder Servicing Fees | | 3,001 | | | 2,964 | | | 2,882 | | | 1.2 | | 2.8 | |
| Total | | $ | 1,052,843 | | | $ | 1,004,003 | | | $ | 1,126,142 | | | 4.9 | % | (10.8 | %) |
(1)Includes index and enhanced index services.
(2)Includes certain multi-asset solutions and services not included in equity or fixed income services.
| | | | | |
(2)2023 Annual ReportIncludes certain multi-asset solutions and services not included in equity or fixed income services.(3)Amounts in 2019 have been reclassified to conform to the current period's presentation.
| 11 |
Bernstein Research Services
We offer high-quality fundamental and quantitative research quantitative services and brokerage-relatedtrade execution services in equities and listed options to institutional investors, such as pensionmutual fund and hedge fund and mutual fund managers, pension funds and other institutional investors (“("Bernstein Research ServicesServices" ”or "BRS"). We serve our clients, which are based in the United States and in other major markets around the world, through our trading professionals, who are primarily based in New York, London and Hong Kong, and our sell-sideresearch analysts, who provide fundamental company and industry research along with quantitative research into securities valuation and factors affecting stock-price movements.
We earn revenues for providing investment research to, and executing brokerage transactions for, institutional clients. These clients compensate us principally by directing us to execute brokerage transactions on their behalf, for which we earn commissions, and to a lesser but increasing extent, by paying us directly for research through commission sharing agreements or cash payments. Bernstein Research Services accounted for approximately 12%9%, 12%10% and 13%10% of our net revenues as offor the years ended December 31, 2020, 20192023, 2022 and 2018,2021, respectively.
For information regarding trends in fee rates charged for brokerage transactions, see “Risk Factors” in Item 1A.
Our Bernstein Research Services revenues are as follows:
| | |
|
| Revenues from Bernstein Research Services |
|
Revenues from Bernstein Research Services
| | | | | | | | | | | | | | | | | | | | | | | | | | | | | |
| Years Ended December 31, | | % Change |
| 2020 | | 2019 | | 2018 | | 2020-19 | | 2019-18 |
| (in thousands) | | | | |
| Bernstein Research Services | $ | 459,744 | | | $ | 407,911 | | | $ | 439,432 | | | 12.7 | % | | (7.2) | % |
| | | | | | | | | | | | | | | | | | | | | | | | | | | | | |
| | Years Ended December 31 | | % Change |
| 2023 | 2022 | 2021 | | 2023-22 | 2022-21 |
| | (in thousands) | | | |
| Bernstein Research Services | | $ | 386,142 | | | $ | 416,273 | | | $ | 452,017 | | | (7.2 | %) | (7.9 | %) |
Custody
Our U.S. based broker-dealer subsidiary acts as custodian for the majority of our Private Wealth Management AUM and some of our Institutional AUM. Other custodian arrangements, directed by clients, include banks, trust companies, brokerage firms and other financial institutions.
Human CapitalPeople Management
As a leading global investment-managementinvestment management and research firm, we bring together a wide range of insights, expertise and innovations to advance the interests of our clients around the world. The intellectual capital and distinctive knowledge of our employees isare collectively the most important assetassets of our firm, so the long-term sustainability and success of our firm is heavily dependent on our people. In 2022, our human capital and administrative services teams became our "People" team, a key acknowledgement of the central role they play in supporting our employees and advancing their work experience. We are constantlykeenly focused on:
•fostering an inclusive culture by incorporating diversity, equity and inclusion in all levels of our business;
•encouraging innovation;
•developing, retaining and recruiting high-qualityhigh quality talent; and
•aligning employees’ incentives and risk taking with those of the firm.
As a result, we have a strong firm culture that helps us maximize performance and drive excellence. Further, our firm’s role as a fiduciary is embedded in our culture. As a fiduciary, our firm’s primary objective is to act in our clients' best interests and help our clientsthem reach their financial goals.
Also, our Board of Directors (the "Board") and committees of the Board, particularly our Compensation and Workplace Practices Committee, provide oversight into various human capital matters affecting our people, including emerging human capitalpeople management risks and strategies to mitigate our exposure to those risks. These collaborative efforts contribute to the overall framework that guides how AB attracts, retains and develops a workforce that supports our values and strategic initiatives.
Talent Acquisition and Development
AB seeks to achieve excellence in business, including investment performance, client service, and being defined as an employer of choice. Across our global offices, we recruit and hire a workforce with diverse perspectives, backgrounds, and experiences. Our talent acquisition strategy helps us serve both our clients and our workforce, hand in hand, at an optimal level. We engage external organizations, including search firms and partnerships to assist in attracting and recruiting top talent at all levels. We also leverage technology tools to source and evaluate candidates against our needs and we continue to prioritize attracting diverse talent throughout our search activities. Outside of traditional recruiting, we believe investing in emerging talent is key to our future planning. Both our internship and associate programs serve as robust pipelines for future leadership. The talent acquisition process is our firm’s first impression to future employees, and we strive to provide all candidates with an excellent experience. We focus heavily on high candidate engagement, an efficient offer process and sound onboarding to support success. Investing in the continued development of our talent is ongoing through a blend of formal training, independent learning, mentoring, and progressing assignments of responsibility. Internal mobility is championed throughout the firm. We are highly committed to development and believe that top performers expect and deserve this ongoing investment.
Employee Engagement and Culture
We believe a workforce is most engaged when employees feel connected to our culture. We seek to create a workplace where our people recognize the high importance of the work they do and enjoy the environment where the work gets done. By creating a culture of excellence and accountability, we see employees thrive and contribute at their highest levels. It is important that our employees are not only connected to our business but also to the communities in which we operate. We offer many opportunities to volunteer, including our firm-wide philanthropic initiative, AB Gives Back. Coming out of the global pandemic, we continue to prioritize the well-being of our staff through our global wellness programming, employee wellness groups, and our hybrid work schedule. We believe that the flexibility to work remotely up to two days per week allows our employees to maintain the important benefits of in-person collaboration while providing greater work-life balance. Measuring engagement is key to understanding the views of the organization. We utilize AB Voice, a periodic engagement survey designed to measure employee sentiment, to identify and address gaps that could impact productivity and retention.
Diversity, Equity and Inclusion
The past year has been a robust year for Diversity, Equity and Inclusion ("DEI") as we continued to focus on delivering equitable positive outcomes across the various segments of our business: colleagues, clients and communities. These elements included increasing education and support to address emerging topics, retaining and developing key diverse talent segments, improving data capture and reporting capabilities and scaling infrastructure for a more global, distributed DEI and philanthropy model. As DEI was again catapulted into the spotlight for a myriad of reasons, these elements have allowed for a more intentional, consistent approach and have acted to accelerate the overall success of the strategy. Furthermore, our Board and Board committees evaluate the overall effectiveness of our social responsibility policies, goals and programs and recommend changes to management as necessary. These collaborative efforts
Over the past few years, we have seen an increase in social issues being brought to the forefront of national and global conversations including in the workplace. In an effort to appropriately respond to such issues, we formed the Social Response Committee (the "SRC"). The SRC has developed an approach to value-driven action that is rooted in broad evaluation of the various issues integrated with AB’s purpose and values to maintain consistency in decision making. The SRC’s remit is to surface, review and direct AB’s public or internal response to social issues that impact our business and our people.
Data is at the heart of a strong and agile DEI strategy and serves as an incredibly effective tool to best uncover gaps and determine key focus areas. This year, we continued to closely monitor internal quantitative and qualitative metrics such as our AB Voice employee engagement survey to measure progress and determine which populations may require additional focus and development. We also leveraged external data sources such as the Investment Company Institute Asset Management D&I benchmarking survey, Disability Equality Index and Coqual’s Asian/Asian American and Pacific Islander focused research to maintain awareness of how we are performing relative to peers and competitors and ensure alignment with common practices.
As global demographics change and employee needs and expectations evolve, providing platforms for education and productive discourse becomes even more critical. In 2023, we introduced several intentional engagement and retention initiatives including disability inclusion, expanded programs and focus groups. Our Employee Resource Groups which hosted over 50 events, remain essential to AB’s commitment to inclusivity as they not only encourage a positive work culture, but also contribute to business development and the overall framework that guides how AB attracts, retains and develops a workforce that supports our values and strategic initiatives.
Talent Acquisition
AB seeks to achieve excellence in business and investment performance by recruiting and hiring a workforce with diversityprofessional development of thought, backgrounds and experiences. We believe that diverse and inclusive teams generate better ideas and reach more balanced decisions. We seek to leverage the unique backgrounds of our employees to meet the needs of a broad range of clientsworldwide.
Part I
and engage with the communities in which we operate. We engage several external organizations to assist in attracting and recruiting top talent at all levels, with a particular focus on attracting diverse talent. We have a sizable group of internal human capital associates focused on recruiting, and we have implemented various human capital initiatives to develop and provide for a balanced workforce. Additionally, we offer internship programs for students to work in positions across functional areas of the firm; an important part of our college recruitment strategy is to convert a high percentage of our interns into full-time employees.
Employee Engagement
We believe a workforce is most productive, effective and highly engaged when they feel connected to our business and culture. We seek to provide diverse work experiences, professional development opportunities, competitive compensation and benefits, an inclusive and diverse culture and social engagement projects to keep our employees motivated, connected to our firm and engaged throughout their careers. We strive to create a culture of intellectual curiosity and collaboration, creating an environment where our employees can thrive and do their best work. We foster growth and advancement through different training avenues to develop skill sets, create opportunities for networking, both internally and externally, and we encourage internal mobility as a part of our employees' career trajectory. It is important that our employees are not only connected to our business but also to the communities in which we operate. As such, AB offers many opportunities for our employees to volunteer in the communities in which we serve including our firm-wide philanthropic initiative, AB Gives Back. Other initiatives in support of these objectives include a five-year refresh award for employees that mark a five-year anniversary are eligible to receive two additional weeks off. In addition, we utilize AB Voice, a periodic survey designed to measure employee satisfaction and engagement, allowing us to identify and address performance gaps.
Diversity and Inclusion
As noted previously, we believe that diverse and inclusive teams generate better ideas and best serve the needs of our clients. As such, we strive to cultivate a dynamic, diverse and inclusive workplace where employees feel challenged and valued for their contributions. We offer leadership development programs that cater to the needs of various groups, including an African American Leadership program, an Asian Leadership program, a Women's leadership program and a variety of Employee Resource Groups ("ERGs"). These ERG programs, which are central to our diversity and inclusion efforts, share a common purpose, interest and backgrounds and accelerate the advancement of our employees from traditionally underrepresented groups. Our ERG groups are spread across seven categories, including AB Asians, Black ERG, Family Matters, AB Veterans, AB Out (LGBTQ), Synergy (Women) and Adelante (Latinx). These groups serve as a source of inclusion, and they help to support our acquisition of diverse talent. Our senior leadership is committed to our diversity and inclusion efforts and is active in a variety of coalitions pledging to advance diversity and inclusion. Additionally, the Firm has implemented several measures to help ensure accountability for contributing to our diversity and inclusion initiatives. For instance, our senior business leaders have diversity and inclusion objectives embedded in their annual performance goals.
Compensation and Benefits
We have demonstratedrecognize the role that a history of investingcompetitive total rewards offering plays in our workforce by offering competitive compensation. We utilize a variety of compensation elements, includingattracting and retaining top talent. Our pay practices include base salaries, annual short-term compensation awards (i.e., cash bonuses)bonuses, and, for those of our employees who earn more than $200,000with total compensation over $300,000 annually, a long-term compensation award program. Long-term incentive compensation award. These awards are generally are denominated in restricted AB Holding Units.We utilize this structure with intentionality to foster a stronger sense of ownership and align theby employees, aligning their interests of our employees directly with the interests of our Unitholders and indirectly with the interests of our clients, as strongclients. We are a meritocracy and pay for performance for our clients generally contributes directly to increases in assets under management and improved financial performance for the firm. Furthermore, we offer health and welfare, 401(k) profit-sharing and other benefits programs to all eligible employees.In the U.S. (and elsewhere, although benefits may differ by jurisdiction):
•We provide employee wagesauspices of providing compensation that areis competitive and consistent with employee positions, skill levels, performance, experience, knowledge, and geographic location;
•Welocation. Annually, we engage nationally recognized outsidea compensation and benefits consulting firmsfirm to independently evaluate the effectivenessaccuracy of our executive compensation and benefit programs, as well as consulting services relating to the amount and form of compensation paid to employees other than executives, and to provide benchmarking against our peers;
•industry peers. We providealso use these insights to make pay decisions for the broader organization. Periodically, we engage outside counsel to conduct privileged pay equity reviews. Pay is evaluated on an annual basis, with the firm providing merit-based and performance-basedcost of living annual base salary increases, andas well as incentive compensation, which arecompensation. This information is communicated to employees at the time of hiring and documented through our talent management process as part of our annual review procedures and uponyear-end. On occasion, pay is adjusted off-cycle due to internal transfer and/or promotion; and
•Thepromotion. Based on unique geographies, the firm makes benefits available to all eligible employees, including health insurance, paid and unpaid leaves, a retirement plan, and life and disability/accident coverage. We also offer a variety of voluntary benefits, that allowranging from adoption and surrogacy assistance to tuition reimbursement, which allows employees to select the options that meet their needs, including flexible time-off, telemedicine, paid parental leave,
adoption assistance, prescription savings solutions, Veterans' Health Administration coverage in U.S. medical plans, a personalized wellness program and a financial wellness program.
Health and Safety
The health and safety of our employees is our highest priority and is evident in our response to the COVID-19 pandemic around the globe. At the initial onset of COVID-19 during the first quarter of 2020, we quickly responded in the various jurisdictions where we operate, including the U.S., EMEA (including the U.K., Luxembourg, France and other jurisdictions), Hong Kong, Shanghai, Singapore and Taiwan. We implemented business continuity measures, including travel restrictions and a work-from-home requirement for almost all personnel (other than a relatively small number of employees whose physical presence in our offices was considered critical), which has remained in place (except in our Asia offices, most of which have reopened), to ensure operating continuity for all critical functions. We also instituted a confidential notification process for any employee who tests positive for COVID-19 or has been exposed to someone else who has tested positive. As the COVID-19 crisis has continued to evolve since the lockdown in the first quarter, certain key functions of the business, such as Risk Management, Business Continuity, Finance and Human Capital, have maintained constant communication and monitored the evolution of the pandemic to keep our employees safe and advised of key developments. Additionally, we continue to monitor communications from the World Health Organization and the U.S. Centers for Disease Control and Prevention to ensure we have current information. We have also instituted various other protocols in response to the COVID-19 pandemic, such as increased cleaning protocols, modifying workspaces to allow for social distancing and requiring masks to be worn in all office locations when social distancing cannot be maintained.
Employees
As of December 31, 2020,2023, our firm had 3,9294,707 full-time employees, representing a 3.1% increaseincluding 284 new hires onboarded during the first quarter of 2023, which were previously outsourced consultants in Pune, India. Net of these hires, headcount declined year-over-year, as compared to the endwith 4,436 employees as of 2019.
As of December 31, 2020,2023, our employees reflected the following by gendercharacteristics and region:locations:
| | Region: | Region: | | Female | | % Female | | Male | | % Male | | Grand Total | | % of Total | Region: | Female | % Female | Male | % Male | Grand Total | % of Total |
| Americas | Americas | | 1,084 | | 37 | % | | 1,871 | | 63 | % | | 2,955 | | 75 | % | Americas | 1,133 | 25 | % | 2,037 | 45 | % | 3,170 | 70 | % |
| Asia ex Japan | Asia ex Japan | | 210 | | 52 | % | | 197 | | 48 | % | | 407 | | 10 | % | Asia ex Japan | 298 | 7 | % | 378 | 8 | % | 676 | 15 | % |
| EMEA | EMEA | | 175 | | 36 | % | | 307 | | 64 | % | | 482 | | 12 | % | EMEA | 224 | 5 | % | 350 | 8 | % | 574 | 13 | % |
| Japan | Japan | | 41 | | 48 | % | | 44 | | 52 | % | | 85 | | 2 | % | Japan | 55 | 1 | % | 42 | 1 | % | 97 | 2 | % |
| Grand Total | | 1,510 | | 38 | % | | 2,419 | | 62 | % | | 3,929 | | 100 | % |
Grand Total(1) | | Grand Total(1) | 1,710 | 38 | % | 2,807 | 62 | % | 4,517 | 100 | % |
In connection with our establishing 1,250 roles in Nashville, Tennessee, we have relocated many of our employees from our New York City and White Plains, New York, locations. Employees whose roles are in-scope for the move, but who are not relocating, will receive a separation package. We expect layoffs to continue on a rolling basis until all in-scope roles are filled in Nashville.
Information about our Executive Officers
Please refer to "Item 10. Directors, Executive Officers and Corporate Governance" below for information relating to our firm's executive officers.
Service Marks
We have registered a number of service marks with the U.S. Patent and Trademark Office and various foreign trademark offices, including the mark “AllianceBernstein.” The logo set forth below is a service mark of AB:
In 2015, we established a new brand identity by prominently incorporating “AB” into our brand architecture, while maintaining the legal names of our corporate entities. With this and other related refinements, our company, and our Institutional and Retail businesses, are referred to as “AllianceBernstein (AB)” or simply “AB.” Private Wealth Management and Bernstein Research Services are referred to as “AB Bernstein.” Also, we adopted the logo service mark described above.
In connection with the Bernstein Transaction, we acquired all of the rights in, and title to, the Bernstein service marks, including the mark “Bernstein.”
In connection with an acquisition we completed in 2013, we acquired all of the rights in, and title to, the W.P. Stewart & Co. service marks, including the logo “WPSTEWART.”
Service marks are generally valid and may be renewed indefinitely, as long as they are in use and/or their registrations are properly maintained.
Virtually all aspects of our business are subject to various federal and state laws and regulations, rules of various securities regulators and exchanges, and laws in the foreign countries in which our subsidiaries conduct business. These laws and regulations primarily are intended to protect clients and fund shareholders and generally grant supervisory agencies broad administrative powers, including the power to limit or restrict the carrying on of business for failure to comply with such laws and regulations. Possible sanctions that may be imposed on us include the suspension of individual employees, limitations on engaging in business for specific periods, the revocation of the registration as an investment adviser or broker-dealer, censures and fines.
AB, AB Holding, the General Partner and fivesix of our subsidiaries (Sanford C. Bernstein & Co., LLC (“SCB LLC”), AB Broadly Syndicated Loan Manager LLC, AB Custom Alternative Solutions LLC, AB Private Credit Investors LLC, AB CarVal Investors and W.P. Stewart Asset Management LLC)Ltd.) are registered with the SEC as investment advisers under the Investment Advisers Act. Additionally, AB Holding is an NYSE-listed company and, accordingly, is subject to applicable regulations promulgated by the NYSE. Also, AB, SCB LLC and AB Custom Alternative Solutions LLC are registered with the Commodity Futures Trading Commission (“CFTC”) as commodity pool operators and commodity trading advisers; SCB LLC also is registered with the CFTC as a commodities introducing broker.
Each U.S. Fund is registered with the SEC under the Investment Company Act and each Non-U.S. Fund is subject to the laws in the jurisdiction in which the fund is registered. For example, our platform of Luxembourg-based funds operates pursuant to Luxembourg laws and regulations, including Undertakings for the Collective Investment in Transferable Securities Directives, and is authorized and supervised by the Commission de Surveillance du Secteur Financier (“CSSF”), the primary regulator in Luxembourg. AllianceBernstein Investor Services, Inc., one of our subsidiaries, is registered with the SEC as a transfer and servicing agent.
SCB LLC and another of our subsidiaries, AllianceBernstein Investments, Inc., are registered with the SEC as broker-dealers, and both are members of the Financial Industry Regulatory Authority. In addition, SCB LLC is a member of the NYSE and other principal U.S. exchanges.
Many of our subsidiaries are subject to the oversight of regulatory authorities in the jurisdictions outside the United States in which they operate, including the Ontario Securities Commission, the Investment Industry Regulatory Organization of Canada, the European Securities and Markets Authority, the Financial Conduct Authority in the U.K., the CSSF in Luxembourg, the Financial Services Agency in Japan, the Securities & Futures Commission in Hong Kong, the Monetary Authority of Singapore, the Financial Services Commission in South Korea, the Financial Supervisory Commission in Taiwan and The Securities and Exchange Board of India. While these regulatory requirements often may be comparable to the requirements of the SEC and other U.S. regulators, they are sometimes more restrictive and may cause us to incur substantial expenditures of time and money related to our compliance efforts. For additional information relating to the regulations that impact our business, please refer to "Risk Factors" in Item 1A.
History and Structure
We have been in the investment research and management business for more than 50 years. Bernstein was founded in 1967. Alliance Capital was founded in 1971 when the investment management department of Donaldson, Lufkin & Jenrette, Inc. (since November 2000, a part of Credit Suisse Group) merged with the investment advisory business of Moody’s Investors Service, Inc.
In April 1988, AB Holding “went public” as a master limited partnership. AB Holding Units, which trade under the ticker symbol “AB,” have been listed on the NYSE since that time.
In October 1999, AB Holding reorganized by transferring its business and assets to AB, a newly-formed operating partnership, in exchange for all of the AB Units (“(the “Reorganization”). Since the date of the Reorganization, AB has conducted the business formerly conducted by AB Holding and AB Holding’s activities have consisted of owning AB Units and engaging in related
activities. Unlike AB Holding Units, AB Units do not trade publicly and are subject to significant restrictions on transfer. The General Partner is the general partner of both AB and AB Holding.
In October 2000, our two legacy firms, Alliance Capital and Bernstein, combined, bringing together Alliance Capital’s expertise in growth equity and corporate fixed income investing and its family of retail mutual funds, with Bernstein’s expertise in value equity investing, tax-exempt fixed income management, and its Private Wealth Management and Bernstein Research Services businesses.
As of December 31, 2020,2023, the condensed ownership structure of AB is as follows (for a more complete description of our ownership structure, see “Principal Security Holders” in Item 12):
The General Partner owns 100,000 general partnership units in AB Holding and a 1%1.0% general partnership interest in AB. Including these general partnership interests, EQH, directly and through certain of its subsidiaries (see “Principal Security Holders” in Item 12), had an approximate 64.8%61.2% economic interest in AB as of December 31, 2020.
Competition
We compete in all aspects of our business with numerous investment management firms, mutual fund sponsors, brokerage and investment banking firms, insurance companies, banks savings and loan associations, and other financial institutions that often provide investment products with similar features and objectives as those we offer. Our competitors offer a wide range of financial services to the same customers that we seek to serve. Some of our competitors are larger, have a broader range of product choices and investment capabilities, conduct business in more markets, and have substantially greater resources than we do. These factors may place us at a competitive disadvantage, and we can give no assurance that our strategies and efforts to maintain and enhance our current client relationships, and create new ones, will be successful.
In addition, EQH and its subsidiaries provide financial services, some of which compete with those we offer. The AB Partnership Agreement specifically allows EQH and its subsidiaries (other than the General Partner) to compete with AB and to pursue opportunities that may be available to us. EQH and certain of its subsidiaries have substantially greater financial resources than we do and are not obligated to provide resources to us.
To grow our business, we believe we must be able to compete effectively for AUM. Key competitive factors include:
15•our investment performance for clients;
Table•our commitment to place the interests of Contentsour clients first;•the quality of our research;
| | | | | |
| •our ability to attract, motivate and retain highly skilled, and often highly specialized, personnel; •the array of investment products we offer; •the fees we charge; •Morningstar/Lipper rankings for the AB Funds; •our ability to sell our actively-managed investment services despite the fact that many investors favor passive services; •our operational effectiveness; •our ability to further develop and market our brand; and • | our investment performance for clients; |
• | our commitment to place the interests of our clients first; |
• | the quality of our research; |
• | our ability to attract, motivate and retain highly skilled, and often highly specialized, personnel; |
• | the array of investment products we offer; |
• | the fees we charge; |
• | Morningstar/Lipper rankings for the AB Funds; |
• | our ability to sell our actively-managed investment services despite the fact that many investors favor passive services; |
• | our operational effectiveness; |
• | our ability to further develop and market our brand; and |
• | our global presence. |
Competition is an important risk that our business faces and should be considered along with the other factors we discuss in “Risk Factors” in Item 1A.
Available Information
AB and AB Holding file or furnish annual reports on Form 10-K, quarterly reports on Form 10-Q, current reports on Form 8-K, amendments to such reports, and other reports (and amendments thereto) required to comply with federal securities laws, including Section 16 beneficial ownership reports on Forms 3, 4 and 5, registration statements and proxy statements. We maintain an Internet site (http://www.alliancebernstein.com) where the public can view these reports, free of charge, as soon as reasonably practicable after each report is filed with, or furnished to, the SEC.Securities and Exchange Commission ("SEC"). In addition, the SEC maintains an Internet site (http://www.sec.gov) that contains reports, proxy and information statements, and other information regarding issuers that file electronically with the SEC.
Item 1A.Risk Factors
Please consider this section along with the description of our business in Item 1, the competition section immediately above and AB’s financial information contained in Items 6, 7 and 8. The majority of the risk factors discussed below directly affect AB. These risk factors also affect AB Holding because AB Holding’s principal source of income and cash flow is attributable to its investment in AB. See also “Cautions Regarding Forward-Looking Statements” in Item 7.
Business-related Risks including risks relating to COVID-19
Our revenues and results of operations depend on the market value and composition of our AUM, which can fluctuate significantly based on various factors, including many factors outside of our control.
We derive most of our revenues from investment advisory and services fees, which typically are calculated as a percentage of the value of AUM as of a specified date, or as a percentage of the value of average AUM for the applicable billing period, and vary with the type of investment service, the size of the account and the total amount of assets we manage for a particular client. The value and composition of our AUM can be adversely affected by several factors, including:
•Market Factors. The dramatic securitiesOur AUM remain sensitive to the volatility associated with global financial market declines experienced during March 2020, whichconditions. For example, the heightened global inflationary pressures that resulted from the global effects of COVID-19, caused a significant reduction in our AUM. Marketssizable interest rate increases and AUM levels have since recovered to new highs following unprecedented, coordinated monetaryassociated market volatility in 2022 and fiscal policy support and, more recently, the approval of vaccines to help remedy the global pandemic. However, we2023. We recognize that, due to continued uncertainty associated with these circumstances,the global response to heightened global inflationary pressures, markets may remain volatile and, accordingly, there remains risk of a significant reduction in our revenues and net income in future periods, particularly if the negative effects on the global economy from COVID accelerate.
periods. Global economies and financial markets are increasingly interconnected, which increases the probability that conditions in one country or region might adversely impact a different country or region. Conditions affecting the general economy, including political, social or economic instability at the local, regional or global level such as the civil unrest centered around racial inequity experienced across the U.S. during the second, third and fourth quarters of 2020, and the riot experienced in Washington D.C. in January 2021 surrounding the transition to a new Presidential administration, may also affect the market value of our AUM. Health crises,War, such as the ongoing conflict in Ukraine and the middle east, or civil disturbance, acts of terrorism (whether foreign or domestic), health crises (such as the COVID-19 pandemic,pandemic), as well as other incidents that interrupt the expected course of events, such as natural disasters, war or civil disturbance, acts of terrorism (whether foreign or domestic), power outages and other unforeseeable and external events, and the public response to or fear of such diseases or events, have had and may in the future have a significant adverse effect on financial markets and our AUM, revenues and net income. Furthermore, the preventative and protective health-related actions, such as business activity suspensions and population lock-downs, that governments have taken, and may continue to take, in response to COVID-19 have resulted, and may continue to result, in periods of business interruption, inability to obtain raw materials, supplies and component parts, and reduced or disrupted operations. These circumstances have caused, and may continue to cause, significant economic disruption and high levels of unemployment, which will adversely affect the financial condition and results of operations of many of the companies in which we invest, and likely reduce the market value of their securities and thus our AUM and revenues. Furthermore, theAlso, significant market volatility and uncertainty, and reductions in the availability of margin financing, we experienced during the first quarter of 2020 severely limitedcan significantly limit the liquidity of certain asset backed and other securities, making it at times impossible to sell these securities at prices reflecting their true economic value. While liquidity conditions have improved considerably since the first quarter following the stimulus programs announced by the U.S. Federal Reserve and U.S. Treasury,were relatively stable in 2023 despite market volatility, we recognize the possibility that conditions could deteriorate in the future. Lack of liquidity makes it more difficult for our funds to meet redemption requests. If liquidity were to worsen, this may have a significant adverse effect on our AUM, revenues and net income in the future.
•Client Preferences. Generally, our clients may withdraw their assets at any time and on short notice. Also, changing market dynamics and investment trends, particularly with respect to sponsors of defined benefit plans choosing to invest in less risky investments and the ongoing shift to lower-fee passive services described below,, may continue to reduce interest in some of the investment products we offer, and/or clients and prospects may continue to seek investment products that we may not currently offer. Loss of, or decreases in, AUM reduces our investment advisory and services fees and revenues.
•Our Investment Performance. Our ability to achieve investment returns for clients that meet or exceed investment returns for comparable asset classes and competing investment services is a key consideration when clients decide to keep their assets with us or invest additional assets, and when a prospective client is deciding whether to invest with
us. Poor investment performance, both in absolute terms and/or relative to peers and stated benchmarks, may result in clients withdrawing assets and prospective clients choosing to invest with competitors.
•Investing Trends. Our fee rates can vary significantly among the various investment products and services we offer to our clients (see “Net Revenues” in Item 7 for additional information regarding our fee rates); our fee realization rate fluctuates as clients shift assets between accounts or products with different fee structures.
•Service Changes. We may be required to reduce our fee levels, restructure the fees we charge and/or adjust the services we offer to our clients because of, among other things, regulatory initiatives (whether industry-wide or specifically targeted), changing technology in the asset management business (including algorithmic strategies and emerging financial technology), court decisions and competitive considerations. A reduction in fee levels would reduce our revenues.
•Interest Rate Changes. Investor interest in and the valuation of our fixed income and multi-asset investment portfolios can be adversely affected by changes in interest rates, particularly if interest rates increase substantially and quickly.
A decrease in the value of our AUM, a decrease in the amount of AUM we manage, an adverse mix shift in our AUM and/or a reduction in the level of fees we charge would adversely affect our investment advisory fees and revenues. A reduction in revenues, without a commensurate reduction in expenses, adversely affects our results of operations.
The industry-wide shift from actively-managedactively managed investment services to passive services has adversely affected our investment advisory and services fees, revenues and results of operations, and this trend may continue.
Our competitive environment has become increasingly difficult, over the past decade, as active managers, which invest based on individual security selection, have, on average, consistently underperformed passive services, which invest based on market indices. ActiveIn the most recent period this trend reversed, as active performance relative to benchmarks in the first half of 2020 remained mixed,improved, with 51%57% of active managers outperforming their passive benchmarks for the six12 months ended June 30, 20202023 (latest data available). Non-U.S., compared to 43% for the prior 12-month period. 57% of active US stock active funds fared better with 60% outperforming benchmarks, while 48% of U.S. stock active funds outperformed, and just 40%up from 48% the prior year, while 63% of active bondnon-U.S. stock funds outperformed their benchmarks. Also, results varied among growth, value and core managers.benchmarks, up from just 33% the prior period. Performance of actively managed bond funds also improved in 2023, with 55% outperforming benchmarks, up from just 30% in the prior-year period.
Demand for passive strategies persisted, and while active equity managers continued to struggle to attract new assets, flows to active fixed income managers remained positive. In theFlows into actively managed funds substantially improved industry-wide in 2023, with U.S., total industry-wide active mutual fund inflows of $549 billion in 2023, compared with outflows of $196$931 billion in 2020 increased from net2022. The improvement was led by $927 billion in inflows to Money Market funds, as investors responded to the higher interest rate environment. Active fixed income U.S. mutual funds also experienced improvement, with inflows of $16 billion in 2023, compared with outflows of $12$465 billion in 2019.2022. Active equity U.S. mutual fund outflows of $338 billion in 2020 increased by 23% year-over-year. Active fixed income U.S. mutual funds showed continued strength with inflows ofwere $246 billion in 2020, though they decreased 9% from $2712023, compared to outflows of $235 billion in 2019. Fixed income active flows were positive2022. Demand for passive strategies in each quarter in 2020 following the sell-off in March 2020. TotalU.S. continued to grow, though at a reduced rate from the prior year, as industry-wide total passive mutual fund net inflows of $361$489 billion declined by 20% from last year's inflows of $450 billion. In this environment, organicin 2023 compared to $540 billion in 2022. Organic growth through positive net inflows iscontinues to be difficult to achieve for active managers, such as AB, and requires taking market share from other active managers.
The significant shift from active services to passive services adversely affects Bernstein Research Services revenues as well. WhileInstitutional global market trading volumes increased in 2020 duecontinue to higher market volatility, predominantly relating to COVID, the broader trend in recent years has been declines, which we would expect to continue, fueledbe pressured by persistent active equity outflows and passive equity inflows. As a result, portfolio turnover has declined and investors hold fewer shares that are actively traded by managers.
Our reputation could suffer if we are unable to deliver consistent, competitive investment performance.
Our business is based on the trust and confidence of our clients. Damage to our reputation, resulting from poor or inconsistent investment performance, among other factors, can reduce substantially our AUM and impair our ability to maintain or grow our business.
EQH and its subsidiaries, and to a lesser extent AXA and its subsidiaries provide a significant amount of our AUM and fund a significant portion of our seed investments, and if our agreements with them terminate or they withdraw capital support whether as a result of EQH's public offerings since 2018 or another factor, it could have a material adverse effect on our business, results of operations and/or financial condition.
EQH (our parent company) and its subsidiaries isconstitute our largest client. Our EQH affiliates represented approximately 19%,16% of our AUM as of December 31, 2020,2023, and we earned approximately 3%5% of our net revenues from services we provided to them in 2020. Also, AXA and its subsidiaries represented approximately 3% of our AUM as of December 31, 2020, and we earned approximately 2% of our net revenues from services we provided to them in 2020.them. Our related investment management agreements are terminable at any time or on short notice by either party, and neither EQH nor AXA is not under any obligation to maintain any level of AUM with us. A material adverse effect on our business, results of operations and/or financial condition could result if EQH were to terminate its investment management agreements with us.
Part I
During the second quarter of 2018, AXA completed the sale of a minority stake in EQH through an initial public offering ("IPO"). Since then, AXA has completed additional offerings and taken other steps, most recently during the fourth quarter of 2019. As a result, AXA owned less than 10% of the outstanding common stock of EQH as of December 31, 2020.
While we cannot at this time predict the full impact on AB of this transaction, such impact has included a reduction in the support AXA provided to AB in the past with respect to AB's investment management business, resulting in a modest decrease in our revenues and ability to initiate new investment services. Also, AB relies on AXA, including its subsidiary, AXA Business Services, for several significant services, and AB has benefited from its affiliation with AXA in certain common vendor relationships. Some of these arrangements have changed, and others are expected to change, with immaterial financial implications for AB.
Our business is dependent on investment advisory agreements with clients, and selling and distribution agreements with various financial intermediaries and consultants, which generally are subject to termination or non-renewal on short notice.
We derive most of our revenues pursuant to written investment management agreements (or other arrangements) with institutional investors, mutual funds and private wealth clients, and selling and distribution agreements with financial intermediaries that distribute AB Funds. Generally, the investment management agreements (and other arrangements), including our agreements with EQH and its subsidiaries, are terminable at any time or upon relatively short notice by either party. The investment management agreements pursuant to which we manage the U.S. Funds must be renewed and approved by the Funds’ boards of directors annually. A significant majority of the directors are independent. Consequently, there can be no assurance that the board of directors of each fund will approve the fund’s investment management agreement each year, or will not condition its approval on revised terms that may be adverse to us. In addition, investors in AB Funds can redeem their investments without notice. Any termination of, or failure to renew, a significant number of these agreements, or a significant increase in redemption rates, could have a material adverse effect on our results of operations and business prospects.
Similarly, the selling and distribution agreements with securities firms, brokers, banks and other financial intermediaries are terminable by either party upon notice (generally 30 days) and do not obligate the financial intermediary to sell any specific amount of fund shares. These intermediaries generally offer their clients investment products that compete with our products. In addition, certain institutional investors rely on consultants to advise them about choosing an investment adviser and some of our services may not be considered among the best choices by these consultants. As a result, investment consultants may advise their clients to move their assets invested with us to other investment advisers, which could result in significant net outflows.
Lastly, our Private Wealth Services rely on referrals from financial planners, registered investment advisers and other professionals. We cannot be certain that we will continue to have access to, or receive referrals from, these third parties. Loss of such access or referrals could have a material adverse effect on our results of operations and business prospects.
Performance-based fee arrangements with our clients may cause greater fluctuations in our net revenues.
We sometimes charge our clients performance-based fees, whereby we charge a base advisory fee and are eligible to earn an additional performance-based fee or incentive allocation that is calculated as either a percentage of absolute investment results or a percentage of investment results in excess of a stated benchmark over a specified period of time. Some performance-based fees include a high-watermark provision, which generally provides that if a client account under-performs relative to its performance target (whether in absolute terms or relative to a specified benchmark), it must gain back such under-performance before we can collect future performance-based fees. Therefore, if we fail to achieve the performance target for a particular period, we will not earn a performance-based fee for that period and, for accounts with a high-watermark provision, our ability to earn future performance-based fees will be impaired.
We are eligible to earn performance-based fees on 6.0%9.3%, 8.5%8.3% and 0.8%0.4% of the assets we manage for institutional clients, private wealth clients and retail clients, respectively (in total, 4.4%5.6% of our AUM). If the percentage of our AUM subject to performance-based fees increases, seasonality and volatility of revenue and earnings are likely to become more significant. Our performance-based fees were $132.6$144.9 million, $99.6$145.2 million and $118.1$245.1 million in 2020, 20192023, 2022 and 2018,2021, respectively.
The revenues generated by Bernstein Research Services may be adversely affected by circumstances beyond our control, including declines in brokerage transaction rates, declines in global market volumes, failure to settle our trades by significant counterparties and the effects of MiFID II.
Electronic, or “low-touch,” trading represents a significant percentage of buy-side trading activity and typically produces transaction fees that are significantly lower than the price of traditional full servicefull-service fee rates. As a result, blended pricing throughout our industry is lower now than it was historically, and price declines may continue. In addition, fee rates we charge
and charged by other brokers for brokerage services have historically experienced price pressure, and we expect these trends to continue. Also, while increases in transaction volume and market share often can offset decreases in rates, this may not continue.
In addition, the failure or inability of any of our broker-dealer's significant counterparties to perform could expose us to substantial expenditures and adversely affect our revenues. For example, SCB LLC, as a member of clearing and settlement organizations, would be required to settle open trades of any non-performing counterparty. This exposes us to the mark-to-market adjustment on the trades between trade date and settlement date, which could be significant, especially during periods of severe market volatility. Also, our ability to access liquidity in such situations may be limited by what our funding relationships are able to offer us at such times.
Lastly, extensive changes proposed by the SEC to the equity market structure, including Regulation Best Execution, the proposed Order Competition Rule, the proposed volume-based exchange transaction pricing rule and proposed changes to Regulation NMS establishing, among other things, minimum pricing increments and required disclosures by larger broker-dealers and specified trading platforms, if adopted as proposed, could substantially increase the cost of conducting our buy-side and broker-dealer operations and, possibly, adversely impact trade execution quality.
We discussmay be unable to develop new products and services, and the risksdevelopment of new products and services may expose us to reputational harm, additional costs or operational risk.
Our financial performance depends, in part, on our ability to react nimbly to changes in the asset management industry, respond to evolving client needs, and develop, market and manage new investment products and services. Conversely, the development and introduction of new products and services, including the creation of products with concentrations in industries or sectors specific to individual client criteria, or with a focus on ESG, requires continuous innovative effort on our part and may require significant time and resources as well as ongoing support and investment. Substantial risk and uncertainties are associated with the second installmentintroduction of new products and services, including the Markets in Financial Instruments Directive II (“MiFID II”) below in "Legalimplementation of new and Regulatory-related Risks" in this Item 1A.appropriate operational controls and procedures, shifting client and market preferences, the introduction of competing products or services, and compliance with regulatory and disclosure requirements. We can make no assurance that we will be able to develop new products and services that successfully address the needs of clients within needed timeframes. Any failure to successfully develop new products and services, or effectively manage associated operational risks, could harm our reputation and expose us to additional costs, which could adversely affect our AUM, revenues and operating income.
Fluctuations in the exchange rates between the U.S. dollar and various other currencies can adversely affect our AUM, revenues and results of operations.
Although significant portions of our net revenues and expenses, as well as our AUM, presently are denominated in U.S. dollars, we have subsidiaries and clients outside of the United States with functional currencies other than the U.S. dollar. Weakening of these currencies relative to the U.S. dollar adversely affects the value in U.S. dollar terms of our revenues and our AUM denominated in these other currencies. Accordingly, fluctuations in U.S. dollar exchange rates affect our AUM, revenues and reported financial results from one period to the next.
We may not be successful in our efforts to hedge our exposure to such fluctuations, which could negatively impact our revenues and reported financial results.
Our seed capital investments are subject to market risk. While we enter into various futures, forwards, swap and option contracts to economically hedge many of these investments, we also may be exposed to market risk and credit-related losses in the event of non-performance by counterparties to these derivative instruments.
We have a seed investment program for the purpose of building track records and assisting with the marketing initiatives pertaining to our firm's new products. These seed capital investments are subject to market risk. Our risk management team oversees a seed hedging program that attempts to minimize this risk, subject to practical and cost considerations. Also, not all seed investments are deemed appropriate to hedge, and in those cases we are exposed to market risk. In addition, we may be subject to basis risk in that we cannot always hedge with precision our market exposure and, as a result, we may be subject to relative spreads between market sectors. As a result, volatility in the capital markets may cause significant changes in our period-to-period financial and operating results.
We use various derivative instruments, including futures, forwards, swapswaps and option contracts, in conjunction with our seed hedging program. While in most cases broad market risks are hedged, our hedges are imperfect and some market risk remains. In addition, our use of derivatives results in counterparty risk (i.e., the risk that we may be exposed to credit-related losses in the event of non-performance by counterparties to these derivative instruments), regulatory risk (e.g., short selling restrictions) and cash/synthetic basis risk (i.e., the risk that the underlying positions do not move identically to the related derivative instruments).
We may engage in strategic transactions that could pose risks.
As part of our business strategy, we consider potential strategic transactions, including acquisitions (such as our purchase of CarVal Investors in 2022), dispositions, mergers, consolidations, joint venture partnerships (such as our planned joint venture partnership with SocGen) and similar transactions, some of which may be material. These transactions, if undertaken, may involve various risks and present financial, managerial and operational challenges, including:.
•adverse effects on our earnings if acquired intangible assets or goodwill become impaired;
•existence of unknown liabilities or contingencies that arise after closing;
•potential disputes with counterparties; and
•the possible need for us to increase our firm's leverage or, if we fund the purchase price of a transaction with AB Units or AB Holding Units, likely dilution to our existing unitholders.
Acquisitions also pose the risk that any business we acquire may lose customers or employees or could under-perform relative to expectations. Additionally, the loss of investment personnel poses the risk that we may lose the AUM we expected to manage, which could adversely affect our results of operations.
We may not accurately value the securities we hold on behalf of our clients or our company investments.
In accordance with applicable regulatory requirements, contractual obligations or client direction, we employ procedures for the pricing and valuation of securities and other positions held in client accounts or for company investments. We have established a Valuation Committee and sub-committees, consisting of senior officers and employees, which overseesoversee a consistent framework of pricing controls and valuation processes.processes for the firm and each of its advisory affiliates. If market quotations for a security are not readily available, the Valuation Committee determines a fair value for the security.
Extraordinary volatility in financial markets, significant liquidity constraints or our failure to adequately consider one or more factors when determining the fair value of a security based on information with limited market observability could result in our failing to properly value securities we hold for our clients or investments accounted for on our balance sheet. Improper valuation likely would result in our basing fee calculations on inaccurate AUM figures, our striking incorrect net asset values for company-sponsored mutual funds or hedge funds or, in the case of company investments, our inaccurately calculating and reporting our financial condition and operating results. Although the overall percentage of our AUM that we fair value based on information with limited market observability is not significant, inaccurate fair value determinations can harm our clients, create regulatory issues and damage our reputation.
We may not have sufficient information to confirm or review the accuracy of valuations provided to us by underlying external managers for the funds in which certain of our alternative investment products invest.
Certain of our alternative investment services invest in funds managed by external managers (“External Managers”) rather than investing directly in securitiesThe quantitative and other instruments. As a result, our abilities will be limited with regard to (i) monitoring such investments, (ii) regularly obtaining complete, accurate and current information with respect to such investments and (iii) exercising control over such investments. Accordingly, we may not have sufficient information to confirm or review the accuracy of valuations provided to us by External Managers. In addition, we will be required to rely on External Managers’ compliance with any applicable investment guidelines and restrictions. Any failure of an External Manager to operate within such guidelines or to provide accurate information with respect to the investment could subject our alternative investment products to losses and cause damage to our reputation.
The quantitativesystematic models we use in certain of our investment services may contain errors, resulting in imprecise risk assessments and unintended output.
We use quantitative and systematic models in a variety of our investment services, generallyusually in combination with fundamental research. These models are developed by senior quantitative professionals and typically are implemented by IT professionals. Our Model Risk Oversight Committee oversees the model governance framework and associated model review activities, which are then executed by our Model Risk Team. However, due to the complexity and large data dependency of such models, it is possible that errors in the models could exist and our controls could fail to detect such errors. Failure to detect errors could result in client losses and reputational damage.
The financial services industry is intensely competitive.
We compete on the basis of a number of factors, including our investment performance for our clients, our array of investment services, innovation, reputation and price. By having a global presence, we often face competitors with more experience and more established relationships with clients, regulators and industry participants in the relevant market, which could adversely affect our ability to expand. Furthermore, if we are unable to maintain and/or continue to improve our investment performance, our client flows may be adversely affected, which may make it more difficult for us to compete effectively.
Also, increased competition could reduce the demand for our products and services, which could have a material adverse effect on our financial condition, results of operations and business prospects. For additional information regarding competitive factors, see “Competition” in Item 1.
Human Capital-relatedPeople-related Risks
We may be unable to continue to attract, motivate and retain key personnel, and the cost to retain key personnel could put pressure on our adjusted operating margin.
Our business depends on our ability to attract, motivate and retain highly skilled, and often highly specialized, technical, investment, managerial and executive personnel, and there is no assurance that we will be able to continue to do so.
The market for these professionals is extremely competitive. TheyCertain of these professionals often maintain strong, personal relationships with investors in our products and other members of the business community so their departure may cause us to lose client accounts or result in fewer opportunities to win new business, either of which factors could have a material adverse effect on our results of operations and business prospects.
Additionally, a decline in revenues may limit our ability to pay our employees at competitive levels, and maintaining (or increasing) compensation without a revenue increase, in order to retain key personnel, may adversely affect our adjusted operating margin. As a result, we remain vigilant about aligning our cost structure (including headcount) with our revenue base. For additional information regarding our compensation practices, see "Compensation Discussion and Analysis" in Item 11.
Our process of relocating our headquarters may not be executed as we envision.
We have announced that we will establishestablished our corporate headquarters in and relocate approximately 1,250have relocated a large number of the positions jobs previously located in the New York metropolitan area to Nashville, Tennessee (for additional information, see “Relocation Strategy” in Item 7). Although the eventualongoing impact on AB from this process is not yet known, the uncertainty created by these circumstances could have a significant adverse effect onadversely affect AB’s ability to motivate and retain current employees. Further significant managerialemployees and operational challenges could arise, such as ineffective transfer of institutional knowledge from current employees to newly-hired employees, if AB experiences significantly greater attrition among current employees than the firm anticipates in connection with the relocation and/or if the firm encounters more difficulty than expected in hiringhire qualified employees to help staffin our Nashville headquarters.
Additionally, our estimates for both the transition costs and the corresponding expense savings relating to our headquarters relocation which we discuss in more detail in “Relocation Strategy” in Item 7, are based on our current assumptions of employee relocation costs, severance, and overlapping compensation and occupancy costs. If our assumptions turn out to be inaccurate, our adjusted net revenuesexpenses and adjusted operating income could be adversely affected.
Employee misconduct, which can be difficult to detect and deter, could harm us by impairing our ability to attract and retain clients and subjecting us to significant regulatory scrutiny, legal liability and reputational harm.
There have been several highly publicized cases involving fraud or other misconduct by employees in the financial services industry generally, and we are not immune. Misconduct by employees could involve the improper use or disclosure of confidential information, which could result in legal action, regulatory sanctions, and reputational or financial harm. Further, fraud, payment or solicitation of bribes and other deceptive practices or other misconduct by our employees could similarly subject us to regulatory scrutiny, legal liability and reputational damage.
Operational, Technology and Cyber-related Risks
Technology failures and disruptions, including failures to properly safeguard confidential information, can significantly constrain our operations and result in significant time and expense to remediate, which could result in a material adverse effect on our results of operations and business prospects.
We are highly dependent on software and related technologies throughout our business, including both proprietary systems and those provided by third-party vendors. We use our technology to, among other things, obtain securities pricing information, process client transactions, store and maintain data, and provide reports and other services to our clients. Despite our protective measures, including measures designed to effectively secure information through system security technology and established and tested business continuity plans, we may still experience system delays and interruptions as a result of natural disasters, hardware failures, software defects, power outages, acts of war and third-party failures. We cannot predict with certainty all of the adverse effects that could result from our failure, or the failure of a third party, to efficiently address and resolve these delays and interruptions. These adverse effects could include the inability to perform critical business functions or failure to comply with financial reporting and other regulatory requirements, which could lead to loss of client confidence, reputational damage, exposure to disciplinary action and liability to our clients.
Many of the software applications that we use in our business are licensed from, and supported, upgraded and maintained by, third-party vendors. A suspension or termination of certain of these licenses or the related support, upgrades and maintenance could cause temporary system delays or interruption. Additionally, technology rapidly evolves and we cannot guarantee that our competitors may not implement more advanced technology platforms for their products and services, which may place us at a competitive disadvantage and adversely affect our results of operations and business prospects.
Also, we could be subject to losses if we fail to properly safeguard sensitive and confidential information. As part of our normal operations, we maintain and transmit confidential information about our clients as well as proprietary information relating to
our business operations. Although we take protective measures, our systems still could be vulnerable to cyber attack or other forms of unauthorized access (including computer viruses) that have a security impact, such as an authorized employee or vendor inadvertently or intentionally causing us to release confidential or proprietary information. Such disclosure could, among other things, allow competitors access to our proprietary business information and require significant time and expense to investigate and remediate the breach. Moreover, loss of confidential client information could harm our reputation and subject us to liability under laws that protect confidential personal data, resulting in increased costs or loss of revenues.
Any significant security breach of our information and cyber security infrastructure, as well as our failure to properly escalate and respond to such an incident, may significantly harm our operations and reputation.
It is critical that we ensure the continuity and effectiveness of our information and cyber security infrastructure, policies, procedures and capabilities to protect our computer and telecommunications systems and the data that reside on or are transmitted through them and contracted third-party systems. Although we take protective measures, including measures to effectively secure information through system security technology, our technology systems may still be vulnerable to unauthorized access, supply chain attacks, computer viruses or other events that have a security impact, such as an external attack by one or more cyber criminals (including phishing attacks attempting to obtain confidential information and ransomware attacks attempting to block access to a computer system until a sum of money is paid), which could materially harm our operations and reputation. Additionally, while we take precautions to password protect and encrypt our laptops and sensitive information on our other mobile electronic devices, if such devices are stolen, misplaced or left unattended, they may become vulnerable to hacking or other unauthorized use, creating a possible security risk and resulting in potentially costly actions by us.
Furthermore, although we maintain a robust cyber security infrastructure and incident preparedness strategy, which we test periodically,frequently, we may be unable to respond, both internally and externally, to a cyber incident in a sufficiently expeditious manner. Any such failure could cause significant harm to our reputation and result in litigation, regulatory scrutiny and/or significant remediation costs.costs, see "Cybersecurity" in Item 1C.
Climate change and other unpredictable events, including climate change, outbreak of infectious disease, natural disaster, dangerous weather conditions, technology failure, terrorist attack and political unrest, may adversely affect our ability to conduct business.
War, terrorist attack, political unrest, power failure, climate change, natural disaster and rapid spread of infectious disease (such as the ongoing COVID-19 pandemic) could interrupt our operations by:
•causing disruptions in global economic conditions, thereby decreasing investor confidence and making investment products generally less attractive;
•inflicting loss of life;
•triggering large-scale technology failures or delays;
•breaching our information and cyber security infrastructure; and
•requiring substantial capital expenditures and operating expenses to remediate damage and restore operations.
Furthermore, climate change may increase the severity and frequency of catastrophes, or adversely affect our investment portfolio or investor sentiment. Climate change may also increase the frequency and severity of weather-related disasters and pandemics. And, climate change regulation may affect the prospects of companies and other entities whose securities in which we invest, or our willingness to continue to invest in such securities.
Despite the contingency plans and facilities we have in place, including system security measures, information back-up and disaster recovery processes, our ability to conduct business, including in key business centers where we have significant operations, such as Nashville, Tennessee, New York City, San Antonio, Texas, London, England, Hong Kong, and Nashville, Tennessee,India, may be adversely affected by a disruption in the infrastructure that supports our operations and the communities in which they are located. This may include a disruption involving electrical, communications, transportation or other services we may use or third parties with which we conduct business. If a disruption occurs in one location and our employees in that location are unable to occupy our offices or communicate with or travel to other locations, our ability to conduct business with and on behalf of our clients may suffer, and we may not be able to successfully implement contingency plans that depend on communication or travel. Furthermore, unauthorized access to our systems as a result of a security breach, the failure of our systems, or the loss of data could give rise to legal proceedings or regulatory penalties under laws protecting the privacy of personal information, disrupt operations, and damage our reputation.
Our operations require experienced, professional staff. Loss of a substantial number of such persons or an inability to provide properly equipped places for them to work may, by disrupting our operations, adversely affect our financial condition, results of operations and business prospects. In addition, our property and business interruption insurance may not be adequate to compensate us for all losses, failures or breaches that may occur.
Our own operational failures or those of third parties on which we rely, including failures arising out of human error, could disrupt our business, damage our reputation and reduce our revenues.
Weaknesses or failures in our internal processes or systems could lead to disruption of our operations, liability to clients, exposure to disciplinary action or harm to our reputation. Our business is highly dependent on our ability to process, on a daily basis, large numbers of transactions, many of which are highly complex, across numerous and diverse markets. These transactions generally must comply with client investment guidelines, as well as stringent legal and regulatory standards.
Our obligations to clients require us to exercise skill, care and prudence in performing our services. Despite our employees being highly trained and skilled, the large number of transactions we process makes it highly likely that errors will occasionally occur. If we make a mistake in performing our services that causes financial harm to a client, we have a duty to act promptly to put the client in the position the client would have been in had we not made the error. The occurrence of mistakes, particularly significant ones, can have a material adverse effect on our reputation, results of operations and business prospects.
The individuals and third-party vendors or issuers on whom we rely to perform services for us or our clients may be unable or unwilling to honor their contractual obligations to us.
We rely on various counterparties and other third-party vendors to augment our existing investment, operational, financial and technological capabilities, but the use of a third-party vendor does not diminish AB's responsibility to ensure that client and regulatory obligations are met. Default rates, credit downgrades and disputes with counterparties as to the valuation of collateral increase significantly in times of market stress. Disruptions in the financial markets and other economic challenges may cause our counterparties and other third-party vendors to experience significant cash flow problems or even render them insolvent, which may expose us to significant costs and impair our ability to conduct business.
Weaknesses or failures within a third-party vendor's internal processes or systems, or inadequate business continuity plans, can materially disrupt our business operations. Also, third-party vendors may lack the necessary infrastructure or resources to effectively safeguard our confidential data. If we are unable to effectively manage the risks associated with such third-party relationships, we may suffer fines, disciplinary action and reputational damage.
We may not always successfully manage actual and potential conflicts of interest that arise in our business.
Increasingly, we must manage actual and potential conflicts of interest, including situations where our services to a particular client conflict, or are perceived to conflict, with the interests of another client. Failure to adequately address potential conflicts of interest could adversely affect our reputation, results of operations and business prospects.
We have procedures and controls that are designed to identify and mitigate conflicts of interest, including those designed to prevent the improper sharing of information. However, appropriately managing conflicts of interest is complex. Our reputation could be damaged and the willingness of clients to enter into transactions in which such a conflict might arise may be affected if we fail, or appear to fail, to deal appropriately with actual or perceived conflicts of interest. In addition, potential or perceived conflicts could give rise to litigation or regulatory enforcement actions.
Maintaining adequate liquidity for our general business needs depends on certain factors, including operating cash flows and our access to credit on reasonable terms.
Our financial condition is dependent on our cash flow from operations, which is subject to the performance of the capital markets, our ability to maintain and grow AUM and other factors beyond our control. Our ability to issue public or private debt on reasonable terms may be limited by adverse market conditions, our profitability, our creditworthiness as perceived by lenders and changes in government regulations, including tax rates and interest rates. Furthermore, our access to credit on reasonable terms is partially dependent on our firm’s credit ratings.
Both Moody’s Investors Service, Inc. and Standard & Poor's Rating Service affirmed AB’s long-term and short-term credit ratings and indicated a stable outlook in 2020.2023. Future changes in our credit ratings are possible and any downgrade to our ratings is likely to increase our borrowing costs and limit our access to the capital markets. If this occurs, we may be forced to incur unanticipated costs or revise our strategic plans, which could have a material adverse effect on our financial condition, results of operations and business prospects.
An impairment of goodwill may occur.
Determining whether an impairment of the goodwill asset exists requires management to exercise a substantial amount of judgment. In addition, to the extent that securities valuations are depressed for prolonged periods of time and/or market conditions deteriorate, or if we experience significant net redemptions, our AUM, revenues, profitability and unit price will be adversely affected. Although the price of an AB Holding Unit is just one factor in the calculation of fair value, if AB Holding Unit price levels decline significantly, reaching the conclusion that fair value exceeds carrying value will, over time, become more difficult. In addition, control premiums, industry earnings multiples and discount rates are impacted by economic conditions. As a result, subsequent impairment tests may occur more frequently and be based on more negative assumptions and future cash flow projections, and may result in an impairment of goodwill. An impairment may result in a material charge to our earnings. For additional information about our impairment testing, see Item 7.
The insurance that we maintainpurchase may not fully cover all potential exposures.
We maintain professional liability, errors & omissions, fidelity, cyber, property, casualty, business interruption and other types of insurance, but such insurance may not cover all risks associated with the operation of our business. Our coverage is subject to exclusions and limitations, including high self-insured retentions or deductibles and maximum limits and liabilities covered. In addition, from time to time, various types of insurance may not be available on commercially acceptable terms or, in some cases, at all. We can make no assurance that a claim or claims will be covered by our insurance policies or, if covered, will not exceed our available insurance coverage, or that our insurers will remain solvent and meet their obligations.
In the future, we may not be able to obtain coverage at current levels, if at all, and our premiums may increase significantly on coverage that we maintain. Also, we currently are party to certain joint insurance arrangements with subsidiaries of EQH. If our affiliates choose not to include us as insured parties under any such policies, we may need to obtain stand-alone insurance coverage, which could have coverage terms that are less beneficial to us and/or cost more.
Legal and Regulatory-related Risks
Our business is subject to pervasive, complex and continuously evolving global regulation, compliance with which involves substantial expenditures of time and money, and violation of which may result in material adverse consequences.
Virtually all aspects of our business are subject to federal and state laws and regulations, rules of securities regulators and exchanges, and laws and regulations in the foreign jurisdictions in which our subsidiaries conduct business. If we violate these laws or regulations, we could be subject to civil liability, criminal liability or sanction, including restriction or revocation of our and our subsidiaries’ professional licenses or registrations, revocation of the licenses of our employees, censures, fines, or temporary suspension or permanent bar from conducting business. Any such liability or sanction could have a material adverse effect on our financial condition, results of operations and business prospects. A regulatory proceeding, even if it does not result in a finding of wrongdoing or sanction, could require substantial expenditures of time and money and could potentially damage our reputation.
In recent years, global regulators have substantially increased their oversight of financial services. Some of the newly-adopted and proposed regulations are focused on investment management services. Others, while more broadly focused, nonetheless impact our business. Moreover, the adoption of new laws, regulations or standards and changes in the interpretation or enforcement of existing laws, regulations or standards have directly affected, and will continue to affect, our business, including making our efforts to comply more expensive and time-consuming.
For example,Also, in 2015 the Financial Supervisory Commission in Taiwan (the “FSC”) implemented new limits on the degree to which local investors can own an offshore investment product. While certain exemptions have been available to us, should we not continue to qualify, the FSC’s rules could force some of our local resident investors to redeem their investments in our funds sold in Taiwan (and/or prevent further sales of those funds in Taiwan), some of which funds have local ownership levels substantially above the FSC limits. This could lead to significant declines in our investment advisory and services fees and revenues earned from these funds.
In Europe, MiFID II, which became effective in January 2018, makes significant modifications to the manner in which European broker-dealers can be compensated for research. These modifications have reduced, and are believed to have significantly reduced, the overall research spend by European buy-side firms, which has decreased the revenues we derive from our European clients. Our European clients may continue to reduce their research budgets, which could result in a significant decline in our sell-side revenues.
Also, while MiFID II is not applicable to firms operating outside of Europe, competitive and client pressures increasingly may force buy-side firms operating outside of Europe to pay for research from their own resources instead of through bundled trading commissions. To the extent that occurs, we expect that research budgets from those clients will decrease further, which could result in an additional significant decline in our sell-side revenues. Additionally, these competitive and client pressures may result in our buy-side operation paying for research out of our own resources instead of through bundled trading commissions, which could increase our firm's expenses and decrease our operating income.
Additionally, in July 2017 the Chief Executive of the U.K. Financial Conduct Authority (the “FCA”), which regulates the London Interbank Offered Rate, or “LIBOR,” as a “benchmark” or “reference rate” for various interest rate calculations, announced that the FCA will no longer persuade or compel banks to submit rates for the calculation of the LIBOR benchmark after 2021. In November 2020, the ICE Benchmark Administration Limited announced a plan to extend the date as of which most U.S. LIBOR values would cease being computed from December 31, 2021 to June 30, 2023. Although financial regulators and industry working groups have suggested alternative reference rates, global consensus on alternative rates is lacking and the process for amending existing contracts or instruments to transition away from LIBOR remains unclear. The elimination of LIBOR or changes to other reference rates or any other changes or reforms to the determination or supervision of reference rates may adversely affect the amount of interest payable or interest receivable on certain of our firm's portfolio investments. These changes may also impact the market liquidity and market value of these portfolio investments. We are finalizing our global assessment of exposure in relation to funds utilizing LIBOR based instruments and benchmarks. Further, we are prioritizing the mitigation of risks associated with the forecast changes to financial instruments and performance benchmarks referencing existing LIBOR rates, and concurrently any impact on AB portfolios and investment strategies.
Lastly, it also is uncertain how regulatory trends will further evolve, both in the U.S. and abroad. For example, following the Brexit referendum in June 2016, the U.K.'s departure from the European Union (the "EU") resulted in the U.K. leaving the EU Single Market on December 31, 2020. While the U.K. and the EU have agreed to a trade deal, which took effect on January 1, 2021, this deal does not include specific arrangements for financial services. Accordingly, since the start of 2021, our U.K.-based buy-side and sell-side subsidiaries have implemented alternative arrangements in EU jurisdictions (utilizing AB's EU-based subsidiaries) to ensure continued operations in the EU Single Market. These arrangements are subject to potential change due to ongoing negotiations between the U.K. and the EU on future regulatory cooperation, and it is difficult to ascertain how any such changes may impact the ability of our U.K.-based subsidiaries to provide services to EU-based clients in the future.
We are involved in various legal proceedings and regulatory matters and may be involved in such proceedings in the future, any one or combination of which could have a material adverse effect on our reputation, financial condition, results of operations and business prospects.
We may beare involved in various matters, including regulatory inquiries, administrative proceedings and litigation, some of which allege significant damages, and we may be involved in additional matters in the future. Litigation is subject to significant uncertainties, particularly when plaintiffs allege substantial or indeterminate damages, the litigation is in its early stages, or when the litigation is highly complex or broad in scope.
Structure-related Risks
The partnership structure of AB Holding and AB limits Unitholders’ abilities to influence the management and operation of AB’s business and is highly likely to prevent a change in control of AB Holding and AB.
The General Partner, as general partner of both AB Holding and AB, generally has the exclusive right and full authority and responsibility to manage, conduct, control and operate their respective businesses, except as otherwise expressly stated in their respective Amended and Restated Agreements of Limited Partnership. AB Holding and AB Unitholders have more limited voting rights on matters affecting AB than do holders of common stock in a corporation. Both Amended and Restated Agreements of Limited Partnership provide that Unitholders do not have any right to vote for directors of the General Partner and that Unitholders only can vote on certain extraordinary matters (including removal of the General Partner under certain extraordinary circumstances). Additionally, the AB Partnership Agreement includes significant restrictions on the transfer of AB Units and provisions that have the practical effect of preventing the removal of the General Partner, which provisions are highly likely to prevent a change in control of AB’s management.
AB Units are illiquid and subject to significant transfer restrictions.
There is no public trading market for AB Units and we do not anticipate that a public trading market will develop. The AB Partnership Agreement restricts our ability to participate in a public trading market or anything substantially equivalent to one by providing that any transfer that may cause AB to be classified as a “publicly traded partnership” (“PTP”) as defined in
Section 7704 of the Internal Revenue Code of 1986, as amended (the “Code”), shall be deemed void and shall not be recognized by AB. In addition, AB Units are subject to significant restrictions on transfer, such as obtaining the written consent of EQH and the General Partner pursuant to the AB Partnership Agreement. Generally, neither EQH nor the General Partner will permit any transfer that it believes would create a risk that AB would be treated as a corporation for tax purposes. EQH and the General Partner have implemented a transfer program that requires a seller to locate a purchaser and imposes annual volume restrictions on transfers. You may request a copy of the transfer program from our Corporate Secretary (corporate_secretary@alliancebernstein.com(corporate_secretary@alliancebernstein.com)). Also, we have filed the transfer program as Exhibit 10.07 to this Form 10-K.
Changes in the partnership structuretreatment of AB Holding and AB and/or changes in theas partnerships for tax law governing partnershipspurposes would have significant tax ramifications.
AB Holding, havingHaving elected under Section 7704(g) of the Code to be subject to a 3.5% federal tax on partnership gross income from the active conduct of a trade or business, AB Holding is a “grandfathered” PTP that is taxable as a partnership for federal income tax purposes. AB Holding is also subject to the 4.0% New York City unincorporated business tax (“UBT”), net of credits for UBT paid by AB. In order toTo preserve AB Holding’sHolding's status as a “grandfathered” PTP that is taxed as a partnership for federal income tax purposes, management seeks to ensure that AB Holding doesmust not directly or indirectly (through AB) enter into a substantial new line of business. A “new line of business” includes any business
that is not closely related to AB’s historical business of providing research and diversified investment management and related services to its clients. A new line of business is “substantial” when a partnership derives more than 15% of its gross income from, or uses more than 15% (by value) of its total assets in, the new line of business.
AB isTo preserve AB’s status as a private partnership for federal income tax purposes, AB Units must not be considered publicly traded.
If either or both AB Holding and accordingly, is notAB were taxable as a corporation, the return on investment to Unitholders generally would be reduced because distributions to Unitholders generally would be subject to two layers of taxation: first, amounts available for distribution would be subject to federal (and applicable state and local) taxes at the corporate entity level; and second, Unitholders generally would be subject to federal (and applicable state corporate income taxes. However, and local) taxes upon receipt of dividends.
AB isHolding and AB are subject to the 4.0% UBT. Domestic corporate subsidiariesNew York City unincorporated business tax (“UBT”). AB Holding may net credits for UBT paid by AB.
Changes in tax law governing us or an increase in business activities outside the U.S. could have a material impact on us.
Legislative proposals have been or may be introduced that, if enacted, could have a material adverse effect on us. We cannot predict the outcome of such legislative proposals. AB which are subjectmanagement continues to federal, statemonitor and local income taxes, generally are included in the filing of a consolidated federal income tax return with separate state and local income tax returns being filed. assess how any new legislation could affect AB.
Each of AB's non-U.S. corporate subsidiaries generally is subject to taxes in the foreign jurisdiction where it is located. If our business increasingly operates in countries other than the U.S., AB’sor if there are changes in tax law or rates of taxation in foreign jurisdictions where our corporate subsidiaries operate, AB's effective tax rate will increase as our international subsidiaries are subject to corporate taxes in the jurisdictions where they are located.
In order to preserve AB’s status as a private partnership for federal income tax purposes, AB Units must not be considered publicly traded. If such units were to be considered readily tradable, AB would be subject to federal and state corporate income tax on its net income. Furthermore, as noted above, should AB enter into a substantial new line of business, AB Holding, by virtue of its ownership of AB, would lose its status as a grandfathered PTP and would become subject to corporate income tax as set forth above. If AB and AB Holding were to become subject to corporate income tax as set forth above, their net income and quarterly distributions to Unitholders would be materially reduced. For information about the significant restrictions on transfer of AB Units, see the risk factor immediately above.
If pursuant to the Bipartisan Budget Act of 2015 ("2015 Act"), any audit by the Internal Revenue Service ("IRS") of our income tax returns for any of our taxable years beginning after December 31, 2017 results in any adjustments, the IRS may collect any resulting taxes, including any applicable penalties and interest, directly from us, in which case our net income and the cash available for quarterly Unitholder distributions may be substantially reduced.
Although the IRS, under current law, generally determines tax adjustments at the partnership level when it audits the income tax return of a partnership, the IRS, with respect to taxable years beginning on or before December 31, 2017, is required to collect any additional taxes, interest and penalties from the partnership's individual partners. The 2015 Act modifies this procedure for audits of a partnership’sFor taxable years beginning after December 31, 2017, a "partnership representative" that we designate (a “Partnership Representative”) will have the sole authority to act on our behalf for purposes of, among other things, IRS audits and if a partnership meets certain requirementsrelated proceedings (and any similar state or local audits and makes a proper election, forproceedings). Any actions taken by us or by the Partnership Representative on our behalf in connection with such audits or proceedings will be binding on us and our Unitholders.
For an audit of a partnership’spartnership's taxable years beginning before January 1, 2018. We may choose to make suchafter December 31, 2017, the IRS, absent an election if we receive a written notice of selection for examination for an eligible taxableby the partnership to the contrary (see discussion below), generally determines adjustments at the partnership level in the year or if we file, on or after January 1, 2018, an administrative adjustment request for an eligible taxable year and otherwise qualify to make such an election.
Generally, we will have the ability to collect any resulting tax liability (and any related interest and penalties) from our Unitholders in accordance with their percentage interests during the year under audit, but there can be no assurance that we will elect to do so or be able to do so under all circumstances. If we do not collect such tax liability from our Unitholders in accordance with their percentage interests in the tax year under audit, our net income and the available cash for quarterly distributions to current Unitholders may be substantially reduced. Accordingly, our current Unitholders may bear some or all of the tax liability resulting from such audit adjustment, even if such Unitholders did not own Units during the tax year under audit. In particular, as a publicly traded partnership,with respect to AB Holding, our Partnership Representative (as defined below) may, in certain instances, request that any “imputed underpayment”under-payment” resulting from an audit be adjusted by amounts of certain of our passive losses. If we successfully make such a request, we would have to reduce suspended passive loss carryovers in a manner which is binding on the partners.
For taxable years beginning after December 31, 2017, a "partnership representative" that we designate (a “Partnership Representative”) will have the sole authority to act on our behalf for purposes of, among other things, U.S. federal income tax audits and judicial review of administrative adjustments by the IRS. If we do not make such a designation, the IRS can select any person as the Partnership Representative. Any actions taken by us or by the Partnership Representative on our behalf with respect to, among other things, U.S. federal income tax audits and judicial review of administrative adjustments by the IRS, will be binding on us and our Unitholders.
In addition, for taxable years beginning after December 31, 2017, we may, but are not required to, make an election to require our Unitholders to take into account on their income tax returns an audit adjustment made to our income tax items, also known as a “push-out” election. This may also require Unitholders to provide certain information to us (possibly including information about the beneficial owners of our Unitholders). Also, a partnership that is a partner of another partnership (such as AB Holding with respect to AB) may elect to have its unitholders take an audit adjustment of the lower-tier partnership into account (i.e., the upper-tier partnership may push adjustments received from the lower-tier partnership through to the partners of the upper-tier partnership). The upper-tier partnership must timely complete the “push-out” of the adjustment in order for it to be effective. Such election must be made by the extended due date for the return for the adjustment year of the audited partnership, regardless of whether the audited partnership is required to file a return for the adjustment year or timely files a request for an extension for its return. There are a number ofseveral requirements to make a “push-out” election and we may be unable or unwilling to comply with such requirements. If we do not make a “push-out” election, we would be required to pay any tax resulting from the adjustments to our income tax items, and the cash available for distribution to unitholders would be substantially reduced.
Non-U.S. unitholders may be subject to a 10% withholding tax on the sale of their AB Units or AB Holding Units, which could reduce the value of such Units.as well as on distributions, and we may be liable for any under-withholding.
Gain or loss from the sale or exchange of a partnership units after November 27, 2017unit by a non-U.S. unitholder areis treated as effectively connected with a U.S. trade or business and is subject to U.S. federal income tax to the extent that the non-U.S. unitholder would have had effectively connected gain or loss on a hypothetical sale by the partnership of all of its assets at fair market value as of the date of the sale or exchange of the partnership units. The Tax Cuts and Jobs Act also imposed certain withholding requirements forIn furtherance of the saleforegoing, a transferee of a partnership unitsunit is required to withhold a tax equal to 10% of the amount realized on any transfer of such a partnership unit unless an exception applies.
Distributions by a PTP to a non-U.S. unitholder also are subject to U.S. withholding tax if the PTP has effectively connected gross income, gain or loss.
A transferee is not required to withhold tax if it relies on a certification issued by the transferor or the underlying partnership establishing that an exception to withholding applies. If a transferee of AB Units is required to withhold and authorized the IRSfailed to issue regulations to carry out the withholding rules in the case of publicly traded partnerships. The requirementproperly do so, AB would be required to withhold on amounts realized in connection withdistributions to the sale, exchange or dispositiontransferee to satisfy that liability.
A broker is not required to withhold on the transfer of certain interestsan interest in a publicly traded partnership (including by brokers) is suspended under Notice 2018-08 for transfers that occur before January 1, 2022, and therefore no withholding will apply. On November 30, 2020, the IRS published final regulations (the "1446 Final Regulations") that address withholding tax and information reporting with respect to interests in publicly traded partnerships engaged inPTP or on a U.S. trade or business. The 1446 Final Regulations end the suspension of withholding on the sale, exchange or disposition of certain interests in a publicly traded partnership, effective January 1, 2022, but place the primary responsibility for such withholding obligations for transfers effected through brokers on the broker, and not the publicly trade partnership. However, a publicly traded partnership may be liable for any under-withholdingdistribution by a brokerPTP if the PTP certifies that relies on a qualified notice for which the publicly traded partnership failed to make a reasonable estimate of the amounts required for determining the applicability of the "ten percent exception." The "ten percent"10% exception" applies. This exception applies if, either (1) the publicly traded partnershipPTP was not engaged in a U.S. trade or business during a specified time period, of time, or (2) upon a hypothetical sale of the publicly traded partnership'sPTP's assets at fair market value, (i) the amount of net gain that would have been effectively connected with the conduct of a trade or business within the United StatesU.S. would be less than 10 percent10% of the total net gain, or (ii) no gain would have been effectively connected with the conduct of a trade or business in the United States.U.S.
We may be liableTo make this certification, the PTP must issue a "qualified notice" indicating that it qualifies for any under-withholding by nominees on our Unitholder distributions after January 1, 2022.
Under the 1446 Final Regulations, for distributions made after January 1, 2022, a publicly traded partnership must post on its primary public website (and keep accessible for 10 years),this exception, which we have done and deliverintend to any registered holder that is a nominee, acontinue to do. The qualified notice that statesmust state the amount of a distribution that is attributable to each type of income group specified in the 1446 FinalTreasury Regulations. If theThe PTP must post each qualified notice on its primary public website (and keep it accessible for 10 years) and deliver it to any registered holder that is a nominee. A broker may not rely on such a certification if it has actual knowledge that the certification is incorrect such that it causesor unreliable.
As a broker to under-withhold with respect to an amount in excess of cumulative net income, the publicly traded partnership isPTP, AB Holding may be liable for any under-withholding by a broker that relies on such amount.a qualified notice for which we failed to make a reasonable estimate of the amounts required for determining the applicability of the 10% exception.
Item 1B.Unresolved Staff Comments
We have noNeither AB nor AB Holding has unresolved comments from the staff of the SEC to report.
Item 1C. Cybersecurity
Cyber Risk Management and Strategy
We rely on digital technology to conduct our business operations and engage with our clients, business partners and employees. The technology that we, our clients, business partners and employees rely upon becomes more complex over time as do threats to our business operations from cyber intrusions, denial of service attacks, manipulation and other cyber misconduct. Information Security is an ongoing process of exercising the due care necessary to protect corporate, client and employee information and systems from unauthorized access, destruction, disclosure, disruption and modification of use.
Through a combination of security, risk and compliance resources, AB implements Information Security through a dedicated Information Security Program ("ISP") that is intended to identify, assess and manage material risks from cybersecurity threats and which includes a focus on safeguarding information and assets from cyber threats, engaging in cyber threat monitoring and responding to actual or potential cyber incidents. Our ISP is led by our Chief Information Security Officer ("CISO") who actively partners with our Chief Compliance Officer ("CCO") and Chief Risk Officer "("CRO"). Ultimately, our ISP is part of our full enterprise risk framework, which includes information technology, business continuity and resiliency, in addition to cybersecurity risk. Our ISP is coordinated with our broader risk management team, including our Chief Security Officer. Enterprise risk, including cybersecurity risk, is overseen by the Audit and Risk Committee on behalf of the Board.
Our CISO, with assistance from internal and external resources, is responsible for implementing and providing oversight of our ISP. The ISP employs a defense-in-depth strategy: an information assurance concept in which multiple layers of security controls are distributed throughout an operating environment. The concept manages risk with diverse defensive strategies, so that if one layer of defense fails, another later of defense will attempt to compensate. Our ISP features cybersecurity policies, standards and guidelines, committee governance, training, access controls and data controls. We periodically execute table top exercises as a part of our ISP program.
Part I
Item 2.Properties
Our principal executive officesISP, together with our risk and compliance resources, proactively manage the risk of threat from cybersecurity incidents through (i) implementing protocols to take cybersecurity considerations into account in adopting and onboarding our technology resources, (ii) monitoring IT controls to better ensure compliance with cybersecurity and other related legal and regulatory requirements, (iii) assessing adherence by critical and material third parties we partner with to ensure that the appropriate risk management standards are met, (iv) ensuring essential business functions remain available during a business disruption, and (v) regularly developing and updating response plans to address potential IT or cyber incidents should they occur. Our security, risk and compliance resources are designed to prioritize IT and cybersecurity risk areas, identify solutions that minimize such risks, pursue optimal outcomes and maintain compliance standards. We also maintain an operational security function that has a real time response capability that triages potential incidents and triggers impact mitigation protocols. Additionally, we utilize third parties to conduct periodic cybersecurity assessments and our internal audit function includes certain cyber risk audits as part of its overall risk audit. We review the recommendations and findings from those assessments and audits and implement corrective and other measures as appropriate. Our cybersecurity processes rely predominantly on internal resources, but also include important third party resources for certain matters, including the aforementioned assessments as well as our continuous cybersecurity threat monitoring and initial incident reporting system.
As part of our ISP, we also perform cyber risk assessments on our critical and material third party vendors during onboarding, then periodically thereafter.
We have not had a cybersecurity incident that has materially affected, or was reasonably likely to, materially affect our business strategy, results of operations or financial condition. There are risks from cybersecurity threats that if they were to occur could materially affect our business strategy, results of operations or financial condition, including those discussed in Item 1A Risk Factors - Operations, Technology and Cyber-Related Risks although we do not currently believe that such a result is reasonably likely.
Cyber Risk Governance
The Audit and Risk Committee is responsible for assisting the Board with oversight of our enterprise risk framework, including cybersecurity, information security, information technology and business continuity and resiliency. Our CISO and other members of senior management including our General Counsel, CCO and CRO report quarterly to the Audit and Risk Committee at its regular meetings on the status of the Company's cybersecurity risk, risk management policies and risk assessment initiatives. the full Board is updated on an as needed basis. In the event of an immediate cyber threat to our business operations, our ISP would involve our General Counsel, who would promptly notify the Chairperson of the Audit and Risk Committee, as to the nature, timing and extent of the threat and our applicable contingency plans would go into effect. Our CRO, in collaboration with our CISO, is responsible for notifying the Audit and Risk Committee of world events or of other significant external events that may pose cybersecurity threats or material risks to our business continuity.
While our Board provides oversight of our cybersecurity risk environment, the ultimate responsibility for our processes for identifying, assessing and managing cybersecurity risks resides with management. Our CISO, with assistance from internal and external resources, is responsible for the implementation and providing oversight to our ISP within the organization and maintaining the appropriate level of expertise to manage and implement cybersecurity policies, programs and strategies. Our CISO has years of applied experience in actively managing cybersecurity and information security programs for large global publicly traded companies with complex and evolving information systems. Management oversight of our ISP is provided by various governance committees including the Operational Risk Oversight Committee, the Information Security Risk Oversight Subcommittee and the Financial Crimes Control Oversight Subcommittee.
Item 2. Properties
Our headquarters is located at 501 Commerce Street, Nashville, Tennessee. We occupy 218,976 square feet of space at this location under a 15-year lease agreement that commenced in the fourth quarter of 2020.
We lease space at our other principal location, 1345 Avenue of the Americas, New York, New York are occupied pursuant to a lease expiring in 2024. At this location, we currently lease 999,963 square feet of space, within which we currently occupy approximately 512,284 square feet of space and have sub-let (or are seeking to sub-let) approximately 487,679 square feet of space.
In addition,Also, we lease approximately 229,147 square feet of space at One North Lexington, White Plains, New York under a lease expiring in 2021. At this location, we currently do not occupy any space and have sub-let (or are seeking to sub-let) the full 229,147 square feet of space.
We entered into a 20-year lease agreement in New York, New York, at 66 Hudson Boulevard, for 190,000 square feet that is expected to commence in 2024. During the fourth quarter of 2020, we exercised an option whereby we were able to reduce our committed footprint by half a floor, reducing our square feet commitment from 190,000 square feet to approximately 166,000 square feet.
We entered into short-term leases for office space in Nashville, Tennessee during the construction of our new corporate headquarters at 501 Commerce Street, which we will vacate upon completion of 501 Commerce Street.
We entered into a 15-year lease agreement in Nashville, Tennessee, at 501 Commerce Street, for 218,976166,015 square feet that commenced in the fourth quarter of 2020.
January 2024.
We also lease 50,792 square feet of space in San Antonio, Texas under a lease expiring April 30, 2029 with options to extend through 2039.in 2029.
In addition,Additionally, we lease less significant100,000 square feet of space in Pune, India under a lease expiring in 2033.
We lease more modest amounts of space in 2327 other cities in the United States.
Our subsidiaries lease space in 3032 cities outside the United States, the most significant of which areis a lease in London, England, under a lease expiring in 2022,2031, and in Hong Kong, China, under a lease expiring in 2027. In London we currently lease 65,488 square feet of space, within which we currently occupy approximately 54,746 square feet of space and have sub-let approximately 10,74260,732 square feet of space. In Hong Kong, we currently lease and occupy 35,878 square feet of space.
Item 3.Legal Proceedings
With respect to all significant litigation matters, we consider the likelihood of a negative outcome. If we determine the likelihood of a negative outcome is probable and the amount of the loss can be reasonably estimated, we record an estimated loss for the expected outcome of the litigation. If the likelihood of a negative outcome is reasonably possible andAny such accruals are adjusted thereafter as appropriate to reflect changed circumstances. When we are able to do so, we also determine estimates of reasonably possible losses or ranges of reasonably possible losses for such matters, whether in excess of any related accrued liability or where there is no accrued liability, and disclose an estimate of the possible loss or range of loss in excess of amounts already accrued, if any, we disclose that fact together with the estimate of the possible loss or range of loss.losses. However, it is often difficult to predict the outcome or estimate a possible loss or range of loss because litigation is subject to inherent uncertainties, particularly when plaintiffs allege substantial or indeterminate damages. Such is alsoparticularly the case when the litigation is in its early stages or when the litigation is highly complex or broad in scope. In these cases, we disclose that we are unable to predict the outcome or estimate a possible loss or range of loss. As a result of these types of factors, we are unable, at this time, to estimate the losses that are reasonably possible to be incurred or ranges of such losses with respect to our significant litigation matters.
AB may be involved in various other matters, including regulatory inquiries, administrative proceedings and litigation, some of which may allege significant damages. It is reasonably possible that we could incur losses pertaining to these matters, but we cannot currently estimate any such losses.
Management, after consultation with legal counsel, currently believes that the outcome of any individual matter that is pending or threatened, or all of them combined, will not have a material adverse effect on our results of operations, financial condition or liquidity. However, any inquiry, proceeding or litigation has an element of uncertainty; management cannot determine whether further developments relating to any individual matter that is pending or threatened, or all of them combined, will have a material adverse effect on our results of operation, financial condition or liquidity in any future reporting period.
Item 4.Mine Safety Disclosures
Not applicable.
Item 5.Market for Registrant’s Common Equity, Related Stockholder Matters and Issuer Purchases of Equity Securities
Market for AB Holding Units and AB Units; Cash Distributions
AB Holding Units are listed on the NYSE and trade publicly under the ticker symbol “AB”. There is no established public trading market for AB Units, which are subject to significant restrictions on transfer. For information about these transfer restrictions, see “Structure-related Risks” in Item 1A.
AB Holding’s principal source of income and cash flow is attributable to its limited partnership interests in AB.
Each of AB Holding and AB distributes on a quarterly basis all of its Available Cash Flow, as defined in the AB Holding Partnership Agreement and the AB Partnership Agreement, respectively, to its Unitholders and the General Partner. For additional information concerning distribution of Available Cash Flow by AB Holding, see Note 2 to AB Holding’s financial statements in Item 8. For additional information concerning distribution of Available Cash Flow by AB, see Note 2 to AB’s consolidated financial statements in Item 8.
On December 31, 2020,29, 2023 (the last trading day of the year), the closing price of an AB Holding Unit on the NYSE was $33.77$31.03 per Unit. On December 31, 2020,2023, there were (i) 974871 AB Holding Unitholders of record for approximately 81,000112,000 beneficial owners, and (ii) 378359 AB Unitholders of record (we do not believe there are substantial additional beneficial owners).
Recent Sales of Unregistered Securities; Use of Proceeds from Registered Securities
We did not engage in any unregistered sales of our securities during the years ended December 31, 2020, 20192023, 2022 and 2018.
Purchases of Equity Securities by the Issuer and Affiliated Purchasers
Each quarter, since the third quarter of 2011, AB has implemented plansconsiders whether to implement a plan to repurchase AB Holding Units pursuant to Rules 10b5-1 and 10b-18 under the Exchange Act. TheWe did not adopt a plan adopted during the fourth quarter of 2020 expired at the close of business on February 10, 2021.2023. AB may adopt additional plans in the future to engage in open-market purchases of AB Holding Units to help fund anticipated obligations under the firm’s incentive compensation award program and for other corporate purposes. For additional information about Rule 10b5-1 plans, see “Units Outstanding” in Item 7.
AB Holding Units bought by us or one of our affiliates during the fourth quarter of 20202023 are as follows:
| | |
|
| Issuer Purchases of Equity Securities |
|
Issuer Purchases of Equity Securities | | | | | | | | | | | | | | | | | |
| Period | Total
Number of
AB Holding
Units
Purchased | Average
Price Paid
Per AB
Holding Unit,
net of
Commissions | Total
Number of
AB Holding
Units
Purchased as
Part of
Publicly
Announced
Plans or
Programs | Maximum
Number (or
Approximate
Dollar Value)
of AB
Holding
Units that
May Yet Be
Purchased
Under the
Plans or
Programs |
10/1/23-10/31/23(1)(2) | 191,411 | | | $ | 30.47 | | — | | — |
11/1/23-11/30/23(1) | 3,309 | | | 30.38 | | — | | — |
12/1/23-12/31/23(1) | 2,157,787 | | | 29.09 | | — | | — |
| Total | 2,352,507 | | | $ | 29.20 | | — | | — |
| | | | | | | | | | | | | | | | | | | | | | | |
| Period | Total
Number of
AB Holding
Units
Purchased | | Average
Price Paid
Per AB
Holding Unit,
net of
Commissions | | Total
Number of
AB Holding
Units
Purchased as
Part of
Publicly
Announced
Plans or
Programs | | Maximum
Number (or
Approximate
Dollar Value)
of AB
Holding
Units that
May Yet Be
Purchased
Under the
Plans or
Programs |
10/1/20-10/31/20(1)(2) | 109,738 | | | $ | 27.95 | | | — | | | — | |
11/1/20-11/30/20(1)(2) | 490,480 | | | 30.97 | | | — | | | — | |
12/1/20-12/31/20(1)(2) | 2,343,310 | | | 32.58 | | | — | | | — | |
| Total | 2,943,528 | | | 32.14 | | | — | | | — | |
(1)During the fourth quarter of 2020, we purchased 2,221,9132023, AB retained from employees 2,166,396 AB Holding Units from employees to allow them to fulfill statutory withholding tax requirements at the time of distribution of long-term incentive compensation awards.
(2)During the fourth quarter of 2020, we2023, AB purchased 721,615186,111 AB Holding Units on the open market pursuant to a Rule 10b5-1 plan to help fund anticipated obligations under our incentive compensation award program.
AB Units bought by us or one of our affiliates during the fourth quarter of 20202023 are as follows:
| | |
|
| Issuer Purchases of Equity Securities |
|
Issuer Purchases of Equity Securities | | | | | | | | | | | | | | | | | |
| Period | Total
Number of
AB
Units
Purchased | Average
Price Paid
Per AB
Unit,
net of
Commissions | Total
Number of
AB Units
Purchased as
Part of
Publicly
Announced
Plans or
Programs | Maximum
Number (or
Approximate
Dollar Value)
of AB
Units that
May Yet Be
Purchased
Under the
Plans or
Programs |
| 10/1/23-10/31/23 | — | | | $ | — | | — | | — |
| 11/1/23-11/30/23 | — | | | — | | — | | — |
12/1/23-12/31/23(1) | 1,603 | | | 28.75 | | — | | — |
| Total | 1,603 | | | $ | 28.75 | | — | | — |
| | | | | | | | | | | | | | | | | | | | | | | |
| Period | Total Number
of
AB
Units
Purchased | | Average
Price Paid
Per
AB
Unit, net of
Commissions | | Total
Number of
AB
Units Purchased as
Part of
Publicly
Announced
Plans or
Programs | | Maximum
Number (or
Approximate
Dollar Value)
of AB
Units that
May Yet Be
Purchased
Under the
Plans or
Programs |
| 10/1/20-10/31/20 | — | | | — | | | — | | | — | |
| 11/1/20-11/30/20 | — | | | — | | | — | | | — | |
12/1/20-12/31/20(1) | 800 | | | 32.57 | | | — | | | — | |
| Total | 800 | | | $ | 32.57 | | | — | | | — | |
(1)During December 2020,the fourth quarter of 2023, we purchased 8001,603 AB Units in a private transaction.
Item 6.[Selected Financial DataReserved]
Selected Consolidated Financial Data
| | | | | | | | | | | | | | | | | | | | | | | | | | | | | |
| | Years Ended December 31, |
| | 2020 | | 2019 | | 2018 | | 2017 | | 2016 |
| | (in thousands, except per unit amounts and unless otherwise indicated) |
| INCOME STATEMENT DATA: | |
| Revenues: | | | | | | | | | |
| Investment advisory and services fees | $ | 2,595,436 | | | $ | 2,472,044 | | | $ | 2,362,211 | | | $ | 2,201,305 | | | $ | 1,933,471 | |
| Bernstein research services | 459,744 | | | 407,911 | | | 439,432 | | | 449,919 | | | 479,875 | |
| Distribution revenues | 529,781 | | | 455,043 | | | 418,562 | | | 412,063 | | | 384,405 | |
| Dividend and interest income | 50,923 | | | 104,421 | | | 98,226 | | | 71,162 | | | 46,939 | |
| Investment (losses) gains | (16,401) | | | 38,659 | | | 2,653 | | | 92,102 | | | 93,353 | |
| Other revenues | 104,703 | | | 97,559 | | | 98,676 | | | 97,135 | | | 99,859 | |
| Total revenues | 3,724,186 | | | 3,575,637 | | | 3,419,760 | | | 3,323,686 | | | 3,037,902 | |
| Less: interest expense | 15,650 | | | 57,205 | | | 52,399 | | | 25,165 | | | 9,123 | |
| Net revenues | 3,708,536 | | | 3,518,432 | | | 3,367,361 | | | 3,298,521 | | | 3,028,779 | |
| | | | | | | | | |
| Expenses: | | | | | | | | | |
| Employee compensation and benefits: | | | | | | | | | |
| Employee compensation and benefits | 1,494,198 | | | 1,442,783 | | | 1,378,811 | | | 1,313,469 | | | 1,229,721 | |
| Promotion and servicing: | | | | | | | | | |
| Distribution-related payments | 569,283 | | | 487,965 | | | 427,186 | | | 411,467 | | | 363,603 | |
| Amortization of deferred sales commissions | 27,355 | | | 15,029 | | | 21,343 | | | 31,886 | | | 41,066 | |
| Trade execution, marketing, T&E and other | 189,787 | | | 219,860 | | | 222,630 | | | 213,275 | | | 216,542 | |
| General and administrative: | | | | | | | | | |
| General and administrative | 485,544 | | | 484,750 | | | 448,996 | | | 481,488 | | | 426,147 | |
| Real estate charges | 5,526 | | | 3,324 | | | 7,160 | | | 36,669 | | | 17,704 | |
| Contingent payment arrangements | 1,855 | | | (510) | | | (2,219) | | | 267 | | | (20,245) | |
| Interest on borrowings | 6,180 | | | 13,035 | | | 10,359 | | | 8,194 | | | 4,765 | |
| Amortization of intangible assets | 21,372 | | | 28,759 | | | 27,781 | | | 27,896 | | | 26,311 | |
| Total expenses | 2,801,100 | | | 2,694,995 | | | 2,542,047 | | | 2,524,611 | | | 2,305,614 | |
| Operating income | 907,436 | | | 823,437 | | | 825,314 | | | 773,910 | | | 723,165 | |
| Income taxes | 45,653 | | | 41,754 | | | 45,816 | | | 53,110 | | | 28,319 | |
| Net income | 861,783 | | | 781,683 | | | 779,498 | | | 720,800 | | | 694,846 | |
| Net (loss) income of consolidated entities attributable to non-controlling interests | (4,169) | | | 29,641 | | | 21,910 | | | 58,397 | | | 21,488 | |
| Net income attributable to AB Unitholders | $ | 865,952 | | | $ | 752,042 | | | $ | 757,588 | | | $ | 662,403 | | | $ | 673,358 | |
| Basic net income per AB Unit | $ | 3.19 | | | $ | 2.78 | | | $ | 2.79 | | | $ | 2.46 | | | $ | 2.48 | |
| Diluted net income per AB Unit | $ | 3.19 | | | $ | 2.78 | | | $ | 2.78 | | | $ | 2.45 | | | $ | 2.47 | |
Operating margin(1) | 24.6 | % | | 22.6 | % | | 23.9 | % | | 21.7 | % | | 23.2 | % |
CASH DISTRIBUTIONS PER AB UNIT(2) | $ | 3.20 | | | $ | 2.82 | | | $ | 2.96 | | | $ | 2.57 | | | $ | 2.15 | |
| BALANCE SHEET DATA AT PERIOD END: | | | | | | | | | |
| Total assets | $ | 9,697,840 | | | $ | 8,706,092 | | | $ | 8,789,098 | | | $ | 9,282,734 | | | $ | 8,741,158 | |
| Debt | $ | 675,000 | | | $ | 560,000 | | | $ | 546,267 | | | $ | 565,745 | | | $ | 512,970 | |
| Total capital | $ | 4,111,523 | | | $ | 4,017,101 | | | $ | 3,916,209 | | | $ | 4,063,304 | | | $ | 4,068,189 | |
| ASSETS UNDER MANAGEMENT AT PERIOD END (in millions) | $ | 685,923 | | | $ | 622,915 | | | $ | 516,353 | | | $ | 554,491 | | | $ | 480,201 | |
(1)Operating income excluding net (loss) income attributable to non-controlling interests as a percentage of net revenues.
(2) Cash distributions per AB Unit reflect the impact of AB's non-GAAP adjustments. Refer to Item 7 for additional information concerning our non-GAAP adjustments.
Item 7.Management’s Discussion and Analysis of Financial Condition and Results of Operations
Impact of COVID-19
General Economic Conditions
During the first quarter of 2020, COVID-19 significantly impacted the global economy. The impact has been profound, has continued through the fourth quarter of 2020 and is likely to persist for months to come. While many businesses have re-opened, vaccinations have begun and leading economic indicators are showing signs of improvement, the overall extent and duration of COVID-19's impact on businesses and economic activity generally remains unclear. A recession in the near term remains possible. Economic effects from COVID-19, which have impacted virtually all countries and industries, include:
•Many small and large businesses being forced to interrupt their operations and as a result, lay off employees or even close;
•The re-opening and subsequent shuttering again of certain businesses in various countries around the world;
•Temporary large-scale population lock-downs, domestic and international travel restrictions and social-distancing measures were implemented, driving sharp declines in consumer and business spending. Further, while many businesses have re-opened, some are only allowing limited capacity, imposing social distancing restrictions and providing limited hours of operation, and while consumer spending has improved during the second half of 2020, uncertainty remains;
•Schools, many of which were shuttered during the first quarter, have allowed students to return to in-person instruction, but the constant concern and uncertainty of whether an outbreak may occur, have forced many schools to re-implement remote instruction, creating significant strain and uncertainty for working parents, which may slow or reverse the economicrecovery;
•Significant declines and increased volatility impacted global financial markets during the first quarter, including 23.2% and 20.0% declines in the Dow Jones Industrial Average (“Dow”) and S&P 500 Index (“S&P”), respectively. Although the financial markets recovered their first quarter losses to new highs in the months since, the prospect of continued volatility remains, especially given the uncertainty surrounding the continued economic effects of the virus (please see "Market Environment" below for additional details).
•The initial distribution of multiple COVID-19 vaccinations was initiated in the later part of the fourth quarter, but the speed, selective nature and logistical challenges of distribution, and the concerns in some communities around the safety and efficacy of the vaccine, have caused turmoil for many, further heightening the anxiety around the virus.
Governments around the world have responded to COVID-19 with economic stimulus measures, including a $2 trillion emergency relief bill passed in the U.S during the first quarter of 2020 and an additional $900 billion in aid passed during the fourth quarter of 2020. Similar fiscal stimulus was passed by many governments around the world. These measures and possible additional stimulus and aid measures are intended to steady businesses and consumers until economic activity meaningfully recovers. The timing and magnitude of any such recovery, however, remains uncertain.
Various countries around the world have continued to experience surges in the rates of COVID-19 infections, which are likely the result of greatly increased social interactions, including at colleges and universities, after re-opening of economies, as well as more contagious strains of the virus. As a result, several countries have paused the continued progression of their re-openings or re-imposed closing mandates on certain businesses, such as bars, restaurants and entertainment venues. These circumstances may adversely affect consumer sentiment and the pace of business re-openings, and they also may delay any economic recovery.
AB Impact
At the initial onset of COVID-19 during the first quarter of 2020, we quickly responded in the various jurisdictions where we operate, including the U.S., the U.K., Hong Kong, Shanghai, Singapore and Taiwan. We implemented business continuity measures, including travel restrictions and a work-from-home requirement for almost all personnel (other than a relatively small number of employees whose physical presence in our offices was considered critical), which has remained in place (except in our Asia offices, most of which have reopened) throughout the second, third and fourth quarters, to ensure operating continuity for all critical functions. We also instituted a notification process for any employee who tests positive for COVID-19 or has been exposed to someone else who has tested positive. As the COVID-19 crisis has continued to evolve since the lockdown in the first quarter, certain key functions of the business, such as Risk Management, Business Continuity, Finance and Human Capital, have maintained constant communication and monitored the evolution of the pandemic to keep our employees safe and advise of key developments. Additionally, we continue to monitor communications from the World Health Organization and the U.S. Centers for Disease Control and Prevention to ensure we have current information.
We have continued to enhance our technology, which has increased the effectiveness of our remote work force. We have also continued to enhance our virtual programs to support business functions, such as training on cybersecurity and enhancements to our existing technology platforms. There has been a heightened focus on the emotional well-being of our employees, and we have provided regular touch points with employees through virtual town halls and management communications. Additionally, we have maintained regular communications and updates on the virus and the Company's response, which are posted on the Company's internal website, to ensure transparent communication with our employees. If any of our employees test positive for COVID-19 or interact with someone who has the virus, they are required to contact AB immediately for support and contact-tracing.
We continue to consider, and in some cases methodically implement, return to office programs for our U.S., European and Asia offices. However, we continue to monitor the daily evolution of the crisis in order to ensure the health and safety of our employees remains our top priority. We will modify our return to office plans, as needed, to ensure the safety of our employees and to ensure that the highest safety and cleanliness protocols are followed. We believe that our business continuity plan and technology platform will continue to support the effectiveness of our employees working remotely.
Asset managers, such as AB, rely heavily on the performance of the financial markets largely to determine assets under management (“AUM”) and revenues. Our results during the first quarter of 2020 were strong, which was primarily a reflection of financial market conditions during January and February, which were not adversely affected by COVID-19. Market conditions deteriorated dramatically during March, which negatively impacted our performance in that month. Financial markets, and hence our performance, rebounded during the ensuing months, primarily due to a U.S. Federal Government stimulus package and U.S. Treasury programs, which were instituted during March 2020 and throughout the second quarter. These programs renewed confidence in the financial markets by introducing liquidity through government purchasing of financial instruments. As various states and countries around the world eased restrictions on business and lockdown protocols during the second quarter and increasingly throughout the third and fourth quarters, increases in consumer spending, decreases in the unemployment rate and improvement in other leading economic indicators have stimulated domestic and global financial market performance. As a result of these developments, our AUM has increased in the second, third and fourth quarters. However, as U.S. states and countries globally have continued to ease restrictions, there has been a resurgence in the spread of the virus, causing certain states and countries to, among other things, shutter some businesses again or impose new social distancing restrictions. As a result, market volatility continues.
The economic impact of COVID-19 and any additional declines in the financial markets could have a significant adverse effect on our AUM and revenues, particularly if economic activity does not continue to recover. Although countries throughout the world continue to grapple with re-opening their economies, this will continue to be a gradual process, and there is a significant risk that the opening process may be further interrupted if infection rates increase. Also, although unemployment rates have declined, they are still considered high and any reluctance of consumers to resume spending will do long-term damage to the global economy, which would have an adverse effect on our business. Additionally, as most of our workforce is working remotely, we are mindful of increased risk related to cybersecurity, which could significantly disrupt our business functions.
Ultimately, the return to normal business and economic activity will likely require the broad application of effective vaccines. Although the distribution of multiple vaccines was initiated towards the end of the fourth quarter, the speed, selective nature of those who are eligible to receive the vaccination, as well as logistical challenges regarding availability and distribution of the vaccines, could mean many months until the general population has been vaccinated.
Executive Overview
Percentage change figures are calculated using assets under management rounded to the nearest million and financial statement amounts rounded to the nearest thousand.(1)
Our total assets under managementAssets Under Management ("AUM") as of December 31, 20202023 were $685.9$725.2 billion, up $63.0$78.8 billion, or 10.1%12.2%, during 2020.2023. The increase was driven primarily by market appreciation of $65.4$85.8 billion, offset by net outflows of $7.0 billion (reflecting Institutional net outflows of $11.8 billion, offset by Retail net inflows of $3.7 billion and Private Wealth Management net inflows of $1.1 billion).
Institutional AUM increased $19.8 billion, or 6.7%, to $317.1 billion during 2023, primarily due to market appreciation of $31.5 billion, partially offset by net outflows of $2.6$11.8 billion. Gross sales decreased $20.4 billion, (duefrom $32.2 billion in 2022 to Private Wealth Management net outflows of $2.0 billion and Retail net outflows of $1.6 billion, offset by Institutional net inflows of $1.0 billion). Excluding AXA's redemption of low-fee fixed income mandates of $11.8 billion the firm generated net inflows of $9.2in 2023. Redemptions and terminations decreased $0.7 billion, from $13.3 billion in 2020.2022 to $12.6 billion in 2023.
InstitutionalRetail AUM increased $32.9$43.9 billion, or 11.6%18.1%, to $315.6$286.8 billion during 2020,2023, primarily due to market appreciation of $30.5$40.3 billion and net inflows of $1.0$3.7 billion. Gross sales increased $13.8$5.2 billion, from $17.1$65.9 billion in 20192022 to $30.9$71.1 billion in 2020.2023. Redemptions and terminations increased $11.3decreased $8.2 billion, from $12.0$66.3 billion in 20192022 to $23.3$58.1 billion in 2020. Excluding AXA's redemption of low-fee fixed income mandates of $11.8 billion, institutional net inflows were $12.8 billion in 2020.
Retail AUM increased $26.1 billion, or 10.9%, to $265.3 billion during 2020, primarily due to market appreciation of $28.1 billion, partially offset by net outflows of $1.6 billion. Gross sales increased $3.6 billion, from $75.3 billion in 2019 to $78.9
billion in 2020. Redemptions and terminations increased $25.5 billion, from $44.0 billion in 2019 to $69.5 billion in 2020, due to record first quarter 2020 redemptions, reflecting the financial market sell-off in March amidst the onset of COVID-19.
Private Wealth Management AUM increased $4.0$15.1 billion, or 3.9%14.1%, to $105.0$121.3 billion during 2020, primarily2023, due to market appreciation of $6.8$14.0 billion partially offset byand net outflowsinflows of $2.0$1.1 billion. Gross sales increased $3.0$1.1 billion, from $11.3$17.5 billion in 20192022 to $14.3$18.6 billion in 2020.2023. Redemptions and terminations increased $4.1$1.7 billion, from $12.4$15.8 billion in 20192022 to $16.5$17.5 billion in 2020.2023.
Bernstein Research Services ("BRS") revenue increased $51.8decreased $30.1 million, or 12.7%7.2%, in 2020.2023. The decrease was primarily driven by significantly lower global customer trading activity due to the prevailing macro-economic environment. In the fourth quarter of 2022, AB and Société Générale (EURONEXT: GLE, “SocGen”), a leading European bank, announced plans to form a joint venture combining their respective cash equities and research businesses. As a result, the BRS business has been classified as held for sale. For further discussion, see Note 24 Acquisitions and Divestitures to our consolidated financial statements in Item 8.
Our 2023 net revenues of $4.2 billion increased $101.0 million, or 2.5%, compared to net revenues of $4.1 billion in the prior year. The increase was due to higher market volatility, particularly between March and June 2020, primarily as a result of COVID-19, which led to higher customer activity and greater global trading volumes. We expect customer activity and trading volumes to gradually decreasedriven by investment gains in 2021 and to normalize in 2022, as the volatility surrounding COVID-19 begins to decline. Any decreases in customer activity and trading volumes will have a corresponding effect on Bernstein Research services revenue. Furthermore, all of 2020 reflects the inclusion of revenues from our acquisition of Autonomous Research ("Autonomous"), which closed on April 1, 2019.
Our 2020 net revenues of $3.7 billion increased $190.1 million, or 5.4%,current year compared to investment losses in the prior year's net revenues. The most significant contributors to the increase wereyear (impact of $116.6 million), higher base advisory fees of $90.4 million, higher distribution revenues of $74.7 million, higher Bernstein Research Services revenue of $51.8 million and higher performance-based fees of $33.0 million, partially offset by higher investment losses of $55.1 million and lower net dividend and interest income of $11.9$35.2 million and higher base advisory fees of $4.8 million, partially offset by lower Bernstein Research Services revenue of $30.1 million and lower distribution revenues of $20.9 million.
Our operating expenses of $2.8$3.3 billion increased $106.1$98.5 million, or 3.9%3.0%, compared to the prior year's expenses.year. The increase was primarily was due todriven by higher employee compensation and benefits expenses of $102.5 million, higher interest on borrowings of $36.5 million, higher amortization of intangibles of $20.3 million and higher contingent payment arrangements of $16.3 million, partially offset by lower general and administrative expenses of $60.1 million and lower promotion and servicing expenses of $63.6 million, higher employee compensation and benefits of $51.4 million and higher general and administrative expenses (including real estate charges) of $3.0 million, partially offset by lower amortization of intangible assets of $7.4 million and lower interest on borrowings of $6.9$17.1 million. Our operating income increased $84.0$2.6 million, or 10.2%0.3%, to $907.4$817.7 million from $823.4$815.1 million in 20192022 and our operating margin increaseddecreased to 19.1% in 2023 from 22.6%21.5% in 2019 to 24.6% in 2020.2022.
Market Environment
Despite 2020 being a year markedU.S. Equities
U.S. Equity markets registered strong gains in the final quarter of 2023, buoyed by a global pandemic, record-breaking recessionslowing inflation data and unemployment levels,expectations that the U.S. Federal Reserve (the "Fed") has finished its rate hiking cycle and a contentious U.S. presidential election, equity markets closed the year with solid gains. The S&P 500, Dow Jones Industrial Average and Nasdaq each rallied for most of the fourth quarter, finishing the yearwill move towards cuts in positive territory. In the U.S., the presidential election passed with a market-friendly outcome, the distribution of multiple COVID-19 vaccines was initiated and the unemployment rate continued to decline. Meanwhile, after months of deadlock, a COVID-19 relief package was passed2024. Market breadth improved in the fourth quarter, consistingwith share price appreciation moving beyond mega-cap technology stocks. Both the cap-weighted S&P 500 and the equal-weighted S&P 500 returned positive 12% in the fourth quarter (including dividends). Previously lagging segments of direct payments, unemployment benefitsthe market rebounded, with Small-Caps (market capitalization ranges between $250 million to $2 billion) and small business aid. However, evenMid-Caps (market capitalization ranges between $2 billion to $10 billion) outperforming Large-Caps (market capitalization above $10 billion) with the increasing likelihood of COVID-19 vaccines potentially boosting activity in 2021, significant slackRussell 2000 index posting a positive 14% return in the economyfourth quarter and labor market by the end of this year are likely. As a result, the U.S. Federal Reserve will likely keep interest rates near zero as the economy improves.
In the U.K., COVID-19 and Brexit uncertainty resultedValue stocks outperforming Growth stocks in the worst performing year for its equity market since the 2008 financial crisis. However, with a Brexit deal reached in the final days of 2020 between the U.K. and the E.U. and the distribution of a COVID-19 vaccine, the U.K. economy may rebound in 2021. The Bank of England is likely to keep rates on hold during the recovery phase. In China, the economy has returned to almost pre-pandemic output levels. Chinese efforts to re-center the economy on a consumer-led modelfourth quarter.
1 Percentage change figures are expected to continue and fiscal policy will likely remain supportive through 2021. More stimulus may be announced in the first quarter of 2021 as the government continues to support consumption. While the economic outlook for China in 2021 appears positive, one big unknown is the future of the relationship between China and the new U.S. administration.
MiFID II
In Europe, MiFID II, which became effective on January 3, 2018, has made significant modificationscalculated using assets under management rounded to the manner in which European broker-dealers can be compensated for research. These modificationsnearest million, while financial statement amounts are believedrounded to have significantly reduced the overall research spend by European buy-side firms, which has decreased the revenues we derive from our European clients. Our European clients may continue to reduce their research budgets, which could result in a significant decline in our sell-side revenues.
Also, while MiFID II is not applicable to firms operating outside of Europe, competitive and client pressures may force buy-side firms operating outside of Europe to pay for research from their own resources instead of through bundled trading commissions. If that occurs, we would expect that research budgets from those clients will decrease further, which could result in an additional significant decline in our sell-side revenues. Additionally, these competitive and client pressures may result in our buy-side operation paying for research out of our own resources instead of through bundled trading commissions, which could increase our firm's expenses and decrease our operating income.
Despite the broadening rally in late 2023, annual index returns were largely concentrated within the "Magnificent-7" companies: a term coined for Apple, Amazon, Alphabet, Meta Platforms, Microsoft, NVIDIA and Tesla which were perceived as the main beneficiaries of the Artificial Intelligence revolution. These seven companies boast the largest market capitalization values in the S&P 500 and account for more than a quarter of the index, disproportionally driving the capitalization-weighted S&P 500's 2023 total return of positive 26% versus positive 14% for the equal-weighted version.
Global and Non-U.S. Equities
Moderating inflation data and peaking interest rates drove nearly unilateral gains beyond U.S. equity markets (MSCI World Index was positive 11.4% in the fourth quarter). Within the Eurozone, annual inflation fell to 2.4% (as of November 2023) from 10.1% a year ago, sending the MSCI European Economic and Monetary Union index 7.8% higher in the fourth quarter. In the U.K., gains were led by Small-Cap and Mid-Cap indices while Large-Cap lagged on account of a strengthening GBP (sterling). Japan's TOPIX trading index posted a positive 2.0% total return despite a volatile quarter and overall Emerging Market equities were strong in the fourth quarter, albeit lagging Developed Markets. All markets in the MSCI Asia (ex Japan) index ended the quarter positively, apart from China, where lackluster growth continues to be a drag on asset prices.
Global Bonds
The ultimate impactRelationship with EQH and its Subsidiaries
EQH (our parent company) and its subsidiaries are our largest client. EQH is collaborating with AB in order to improve the risk-adjusted yield for the General Accounts of MiFID II on payments for research globally remains uncertain.
EQH's insurance subsidiaries by investing additional assets at AB, including the utilization of AB's higher-fee, longer-duration alternative offerings. In mid-2021, Equitable Holdings IPO
Financial Life Insurance Company, a subsidiary of EQH ("DuringEquitable Financial"), agreed to provide an initial $10 billion in permanent capital to build out AB's private illiquid offerings, including private alternatives and private placements. Deployment of this capital commitment is approximately 90% completed and is expected to continue over the next year. In addition, during the second quarter of 2018, AXA S.A. ("AXA") completed2023, EQH committed to provide an additional $10 billion in permanent capital, which will begin following the sale of a minority stake in Equitable Holdings, Inc. (“EQH”) through an initial public offering ("IPO"). Since then, AXA has completed additional offerings and taken other steps, most recently during the fourth quarter of 2019. As a result, AXA owned less than 10%completion of the outstanding common stock of EQH as of December 31, 2020.
While we cannot atinitial $10 billion commitment. We expect this time predict the full impact on AB of this transaction, such impact hasanticipated capital from Equitable Financial will continue to accelerate both organic and inorganic growth in our private alternatives business, allowing us to continue to deliver for our clients, employees, unitholders and other stakeholders. For example, included a reduction in the support AXA providedinitial $10 billion commitment by EQH is $750 million in capital to be deployed through AB CarVal.
Permanent capital means investment capital of indefinite duration, for which commitments may be withdrawn under certain conditions. Such conditions primarily include potential regulatory restrictions, lacking sufficient liquidity to fund the capital commitments to AB inand AB's inability to identify attractive investment opportunities which align with the past with respectinvestment strategy. Although EQH’s insurance subsidiaries have indicated their intention over time to AB'sprovide this investment management business, resulting in a modest decrease incapital to AB, they have no binding commitment to do so. While the withdrawal of their commitment could potentially slow down our revenues and ability to initiate new investment services. Also, AB relies on AXA, including its subsidiary, AXA Business Services, for several significant services and AB has benefited from its affiliation with AXA in certain common vendor relationships. Some of these arrangements have changed, and others are expected to change, with immaterial financial implications for AB.
Our ending AUM at December 31, 2020 reflects $11.8 billion in 2020 outflows resulting from AXA's redemptionintroduction of certain low-fee fixed income mandates. We expect these redemptionsproducts, the impact to total approximately $14 billion, with the remaining redemptions expected toour overall operations would not be completed during the first half of 2021. The revenue we earn from the management of these assets is not significant.material.
Relocation Strategy
On May 2, 2018,As previously announced, we announced that we would establishhave established our corporate headquarters in and relocate approximately 1,050 jobs located in the New York metro area to, Nashville, TN. Subsequently, on January 14, 2020, we announced our plans to relocate an additional 200 jobs to Nashville thereby increasing the total relocated jobs to 1,250. The decision to add the additional jobs was the result of the growth in our business, select investments we are making, and the in-sourcing of roles typically performed by consultants.TN, at 501 Commerce Street. Our Nashville headquarters will househouses Finance, IT, Operations, Legal, Compliance, Internal Audit, Human Capital, and Sales and Marketing. We have been actively relocating jobsMarketing, and expect this transition to take several years.at year-end 2023 we had 1,048 employees in Nashville. We will continue to maintain a principal location in New York City, which will househouses our Portfolio Management, Sell-Side Research and Trading, and New York-based Private Wealth Management businesses.
We believe relocating our corporate headquarters to Nashville will affordaffords us the opportunity to provide an improved quality of life alternative for our employees and enableenables us to attract and recruit new talented employees to a highly desirable location while improving the long-term cost structure of the firm.
During the transition period, which began in 2018 and is expected to continue through 2024, we currently estimate that we will incur transition costs of approximatelybetween $145 million to $155 million, which is less than our previous estimate of $155 million to $165 million. These costs include employee relocation, severance, recruitment, and overlapping compensation and occupancy costs. Over this same period, we expect to realize total expense savings of approximatelybetween $205 million to $215 million, which is greater than our previous estimate of $185 million to $195 million, and is an amount greater than the total transition costs.million. However, we did incur some transition costs before we began to realize expense savings. For the period beginning in 2018 and ending in 2020,the fourth quarter of 2023, we incurred $70$140 million of cumulative transition costs compared to $46$175 million of cumulative savings. In 2020,We incurred $20 million of transition costs for the twelve months ended December 31, 2023, compared to $43 million of expense savings, of $30 million were greater than transition costs of $26 million, resulting in aan overall net increasesavings of $0.01 in
$23 million for the period. In 2023, our net income per unit (("“EPU”EPU"). We currently anticipate an increased $0.08 as a result of our relocation strategy, which compares to the $0.07 EPU increase that occurred in 2021 of approximately $0.02 and2022. We also expect to achieve increasing EPU accretion in each year thereafter.future year. Beginning in 2025, once the transition period has been completed, we estimate ongoing annual expense savings towards the upper end of the range ofapproximately $75 million to $80 million, which will result from a combination of occupancy and compensation-related savings. Our estimates for both the transition costs and the corresponding expense savings are based uponon our current assumptions of employee relocation costs, severance, and overlapping compensation and occupancy costs. In addition, our estimates for both the timing of when we incur transition costs and realize the related expense savings are based on our current relocation implementation plan and the timing for execution of each phase. The actual total charges we eventually record, the related expense savings we realize, and the timing of EPU impact may differ from our current estimates as we implement each phase of our headquarters relocation.
During October 2018, we signed a lease, which commenced in the fourth quarter of 2020, relating to 218,976 square feet of space at our new Nashville headquarters. Our estimated total base rent obligation (excluding taxes, operating expenses and utilities) over the 15-year initial lease term is $134 million.
Although we have presented many of our transition costs and annual expense savings with numerical specificity, and we believe these targets to be reasonable as of the date of this report, the uncertainties surrounding the assumptions we discuss above create a significant risk that these targets may not be achieved. Accordingly, the expenses we actually incur and the savings we actually realize may differ from our targets, particularly if actual events adversely differ from one or more of our key assumptions. The transition costs and expense savings, together with their underlying assumptions, are Forward-Looking Statements and can be affected by any of the factors discussed in “Risk“Risk Factors” and “Cautions“Cautions Regarding Forward-Looking Statements” in this 2023 10-K. We strongly caution investors not to place undue reliance on any of these assumptions or our cost and expense targets. Except as may be required by applicable securities laws, we are not under any obligation, and we expressly disclaim any obligation, to update or alter any assumptions, estimates, financial goals, targets, projections or other related statements that we may make.
Adjusted Operating Margin Target
We previously adopted a goal of increasing our adjusted operating margin to a target of 30% by 2020 (the “2020 Margin Target”), subject to the assumptions, factors and contingencies described as part of our initial disclosure of this target. Our adjusted operating margin, which was 27.5% for 2019, increased to 30.1% for 2020, achieving our target. We do not currently expect to set a new adjusted operating margin target going forward.
Our AUM and, therefore, our investment advisory revenues, including performance-based fee revenues, are heavily dependent on the level and volatility of the financial markets, which ended 2020 favorably. Despite the challenges faced from the COVID-19 pandemic (please refer to “Impact of COVID-19” above and “Risk Factors” in Item 1A), we benefited from certain of our adjusted operating expenses declining significantly, such as costs associated with travel and entertainment and client meetings during 2020. We do not anticipate the COVID-19-related cost-savings or market tailwinds to be indicative of future performance. We also expect continued investments in growth initiatives for our firm. Considering these factors, our adjusted operating margin may be less favorable in future periods, although we will continue to strive for improvement over the long-term.
Assets Under Management
Assets under management by distribution channel are as follows:
| | | | As of December 31, | | % Change | | As of December 31 | | % Change |
| | | 2020 | | 2019 | | 2018 | | 2020-19 | | 2019-18 | | 2023 | 2022 | 2021 | | 2023-22 | 2022-21 |
| | | (in billions) | | | | | | (in billions) | | | |
| Institutions | Institutions | $ | 315.6 | | | $ | 282.7 | | | $ | 246.3 | | | 11.6 | % | | 14.8 | % | Institutions | | $ | 317.1 | | | $ | | $ | 297.3 | | | $ | | $ | 337.1 | | | 6.7 | | 6.7 | % | (11.8 | %) |
| Retail | Retail | 265.3 | | | 239.2 | | | 180.8 | | | 10.9 | | | 32.3 | |
| Private Wealth Management | Private Wealth Management | 105.0 | | | 101.0 | | | 89.3 | | | 3.9 | | | 13.2 | |
| Total | Total | $ | 685.9 | | | $ | 622.9 | | | $ | 516.4 | | | 10.1 | | | 20.6 | | Total | | $ | 725.2 | | | $ | | $ | 646.4 | | | $ | | $ | 778.6 | | | 12.2 | | 12.2 | % | (17.0) | % |
Assets under management by investment service are as follows:
| | | | | | | | | | | | | | | | | | | | | | | | | | | | | |
| | As of December 31, | | % Change |
| | 2020 | | 2019 | | 2018 | | 2020-19 | | 2019-18 |
| | (in billions) | | | | |
| Equity | | | | | | | | | |
| Actively Managed | $ | 217.8 | | | $ | 177.2 | | | $ | 136.2 | | | 22.9 | % | | 30.1 | % |
Passively Managed (1) | 64.5 | | | 60.1 | | | 50.2 | | | 7.3 | | | 19.9 | |
| Total Equity | 282.3 | | | 237.3 | | | 186.4 | | | 19.0 | | | 27.4 | |
| | | | | | | | | |
| Fixed Income | | | | | | | | | |
| Actively Managed | | | | | | | | | |
| Taxable | 263.2 | | | 258.3 | | | 219.7 | | | 1.9 | | | 17.6 | |
| Tax-exempt | 50.3 | | | 47.1 | | | 41.7 | | | 6.7 | | | 13.1 | |
| | 313.5 | | | 305.4 | | | 261.4 | | | 2.6 | | | 16.9 | |
Passively Managed (1) | 8.5 | | | 9.3 | | | 9.4 | | | (8.4) | | | (1.5) | |
| Total Fixed Income | 322.0 | | | 314.7 | | | 270.8 | | | 2.3 | | | 16.2 | |
| | | | | | | | | |
Alternatives/Multi-Asset Solutions(2) | | | | | | | | | |
| Actively Managed | 79.1 | | | 69.3 | | | 58.3 | | | 14.2 | | | 18.8 | |
Passively Managed (1) | 2.5 | | | 1.6 | | | 0.9 | | | 54.1 | | | 76.8 | |
| Total Other | 81.6 | | | 70.9 | | | 59.2 | | | 15.1 | | | 19.7 | |
| Total | $ | 685.9 | | | $ | 622.9 | | | $ | 516.4 | | | 10.1 | | | 20.6 | |
| | | | | | | | | |
| | | | | | | | | | | | | | | | | | | | | | | | | | | | | |
| | As of December 31 | | % Change |
| | 2023 | 2022 | 2021 | | 2023-22 | 2022-21 |
| | (in billions) | | | |
| Equity | | | | | | | | | |
| Actively Managed | | $ | 247.5 | | | $ | 217.9 | | | $ | 287.6 | | | 13.6 | % | (24.2 | %) |
Passively Managed(1) | | 62.1 | | | 53.8 | | | 71.6 | | | 15.3 | | (24.8) | |
| Total Equity | | 309.6 | | | 271.7 | | | 359.2 | | | 13.9 | | (24.3) | |
| Fixed Income | | | | | | | | | |
| Actively Managed | | | | | | | | | |
| Taxable | | 208.6 | | | 190.3 | | | 246.3 | | | 9.6 | | (22.8) | |
| Tax–exempt | | 61.1 | | | 52.5 | | | 57.1 | | | 16.3 | | (7.9) | |
| Total | | 269.7 | | | 242.8 | | | 303.4 | | | 11.1 | | (20.0) | |
Passively Managed(1) | | 11.4 | | | 9.4 | | | 13.2 | | | 21.0 | | (28.9) | |
| Total Fixed Income | | 281.1 | | | 252.2 | | | 316.6 | | | 11.5 | | (20.3) | |
Alternatives/Multi-Asset Solutions(2) | | | | | | | | | |
| Actively Managed | | 125.9 | | | 115.8 | | | 97.3 | | | 8.7 | | 19.1 | |
Passively Managed(1) | | 8.6 | | | 6.7 | | | 5.5 | | | 29.7 | | 21.5 | |
| Total Alternatives/Multi-Asset Solutions | | 134.5 | | | 122.5 | | | 102.8 | | | 9.8 | | 19.2 | |
| Total | | $ | 725.2 | | | $ | 646.4 | | | $ | 778.6 | | | 12.2 | % | (17.0 | %) |
(1)Includes index and enhanced index services.
(2)Includes certain multi-asset solutions and services not included in equity or fixed income services.
Changes in assets under management during 20202023 and 20192022 are as follows:
| | | | | | | | | | | | | | | | | | | | | | | |
| | Distribution Channel |
| | Institutions | | Retail | | Private
Wealth
Management | | Total |
| | (in billions) |
| Balance as of December 31, 2019 | $ | 282.7 | | | $ | 239.2 | | | $ | 101.0 | | | $ | 622.9 | |
| Long-term flows: | | | | | | | |
| Sales/new accounts | 30.9 | | | 78.9 | | | 14.3 | | | 124.1 | |
| Redemptions/terminations | (23.3) | | | (69.5) | | | (16.5) | | | (109.3) | |
| Cash flow/unreinvested dividends | (6.6) | | | (11.0) | | | 0.2 | | | (17.4) | |
Net long-term inflows (outflows)(2) | 1.0 | | | (1.6) | | | (2.0) | | | (2.6) | |
| Acquisitions | — | | | 0.2 | | | — | | | 0.2 | |
| Transfers | 1.4 | | | (0.6) | | | (0.8) | | | — | |
| Market appreciation | 30.5 | | | 28.1 | | | 6.8 | | | 65.4 | |
| Net change | 32.9 | | | 26.1 | | | 4.0 | | | 63.0 | |
| Balance as of December 31, 2020 | $ | 315.6 | | | $ | 265.3 | | | $ | 105.0 | | | $ | 685.9 | |
| | | | | | | |
| Balance as of December 31, 2018 | $ | 246.3 | | | $ | 180.8 | | | $ | 89.3 | | | $ | 516.4 | |
| Long-term flows: | | | | | | | |
| Sales/new accounts | 17.1 | | | 75.3 | | | 11.3 | | | 103.7 | |
| Redemptions/terminations | (12.0) | | | (44.0) | | | (12.4) | | | (68.4) | |
| Cash flow/unreinvested dividends | (2.7) | | | (7.5) | | | 0.1 | | | (10.1) | |
| Net long-term inflows (outflows) | 2.4 | | | 23.8 | | | (1.0) | | | 25.2 | |
Adjustments(1) | — | | | — | | | (0.9) | | | (0.9) | |
| Transfers | — | | | 0.1 | | | (0.1) | | | — | |
| Market appreciation | 34.0 | | | 34.5 | | | 13.7 | | | 82.2 | |
| Net change | 36.4 | | | 58.4 | | | 11.7 | | | 106.5 | |
| Balance as of December 31, 2019 | $ | 282.7 | | | $ | 239.2 | | | $ | 101.0 | | | $ | 622.9 | |
| | | | | | | | | | | | | | | | | | | | | | | | | | | |
| | Distribution Channel | |
| | Institutions | Retail | Private
Wealth
Management | Total | |
| | (in billions) | |
| Balance as of December 31, 2022 | | $ | 297.3 | | | $ | 242.9 | | | $ | 106.2 | | | $ | 646.4 | | |
| Long-term flows: | | | | | | | | | |
| Sales/new accounts | | 11.8 | | | 71.1 | | | 18.6 | | | 101.5 | | |
| Redemptions/terminations | | (12.6) | | | (58.1) | | | (17.5) | | | (88.2) | | |
| Cash flow/unreinvested dividends | | (11.0) | | | (9.3) | | | — | | | (20.3) | | |
| Net long-term (outflows) inflows | | (11.8) | | | 3.7 | | | 1.1 | | | (7.0) | | |
| | | | | | | | | |
| | | | | | | | | |
| Transfers | | 0.1 | | | (0.1) | | | — | | | — | | |
| Market appreciation | | 31.5 | | | 40.3 | | | 14.0 | | | 85.8 | | |
| Net change | | 19.8 | | | 43.9 | | | 15.1 | | | 78.8 | | |
| Balance as of December 31, 2023 | | $ | 317.1 | | | $ | 286.8 | | | $ | 121.3 | | | $ | 725.2 | | |
| | | | | | | | | |
| Balance as of December 31, 2021 | | $ | 337.1 | | | $ | 319.9 | | | $ | 121.6 | | | $ | 778.6 | | |
| Long-term flows: | | | | | | | | | |
| Sales/new accounts | | 32.2 | | | 65.9 | | | 17.5 | | | 115.6 | | |
| Redemptions/terminations | | (13.3) | | | (66.3) | | | (15.8) | | | (95.4) | | |
| Cash flow/unreinvested dividends | | (12.6) | | | (11.2) | | | — | | | (23.8) | | |
Net long-term inflows (outflows)(1) | | 6.3 | | | (11.6) | | | 1.7 | | | (3.6) | | |
Adjustments(2) | | (0.4) | | | — | | | — | | | (0.4) | | |
Acquisitions(3) | | 12.2 | | | — | | | — | | | 12.2 | | |
| Transfers | | (0.1) | | | 0.1 | | | — | | | — | | |
| Market (depreciation) | | (57.8) | | | (65.5) | | | (17.1) | | | (140.4) | | |
| Net change | | (39.8) | | | (77.0) | | | (15.4) | | | (132.2) | | |
| Balance as of December 31, 2022 | | $ | 297.3 | | | $ | 242.9 | | | $ | 106.2 | | | $ | 646.4 | | |
(1)Approximately $900 millionNet flows include $4.5 billion of non-investment management fee earning taxable and tax-exempt money market assetsAXA redemptions for 2022.
were(2)Approximately $0.4 billion of Institutional AUM was removed from our total assets under management during the second quarter of 2019.2022 due to a change in the fee structure.
(2)(3)Institutional net flows for 2020 include $11.8The CarVal acquisition added approximately $12.2 billion of AXA redemptionsInstitutional AUM in the third quarter of certain low-fee fixed income mandates.2022.
| | | | | | | | | | | | | | | | | | | | | | | | | | | | | | | | | | | | | | | | | |
| | Investment Service |
| | Equity
Actively
Managed | | Equity Passively Managed(1) | | Fixed
Income
Actively
Managed
- Taxable | | Fixed
Income
Actively
Managed -
Tax-
Exempt | | Fixed Income Passively Managed(1) | | Alternatives/Multi-Asset Solutions(2) | | Total |
| (in billions) |
| Balance as of December 31, 2019 | $ | 177.2 | | | $ | 60.1 | | | $ | 258.3 | | | $ | 47.1 | | | $ | 9.3 | | | $ | 70.9 | | | $ | 622.9 | |
| Long-term flows: | | | | | | | | | | | | | |
| Sales/new accounts | 51.4 | | | 1.7 | | | 54.3 | | | 10.3 | | | — | | | 6.4 | | | 124.1 | |
| Redemptions/terminations | (36.7) | | | (1.9) | | | (58.3) | | | (9.5) | | | (0.3) | | | (2.6) | | | (109.3) | |
| Cash flow/unreinvested dividends | (7.3) | | | (4.4) | | | (5.8) | | | 0.2 | | | (1.3) | | | 1.2 | | | (17.4) | |
Net long-term inflows (outflows)(3) | 7.4 | | | (4.6) | | | (9.8) | | | 1.0 | | | (1.6) | | | 5.0 | | | (2.6) | |
| Acquisition | — | | | — | | | — | | | — | | | — | | | 0.2 | | | 0.2 | |
| | | | | | | | | | | | | |
| Market appreciation | 33.2 | | | 9.0 | | | 14.7 | | | 2.2 | | | 0.8 | | | 5.5 | | | 65.4 | |
| Net change | 40.6 | | | 4.4 | | | 4.9 | | | 3.2 | | | (0.8) | | | 10.7 | | | 63.0 | |
| Balance as of December 31, 2020 | $ | 217.8 | | | $ | 64.5 | | | $ | 263.2 | | | $ | 50.3 | | | $ | 8.5 | | | $ | 81.6 | | | $ | 685.9 | |
| | | | | | | | | | | | | |
| Balance as of December 31, 2018 | $ | 136.2 | | | $ | 50.2 | | | $ | 219.7 | | | $ | 41.7 | | | $ | 9.4 | | | $ | 59.2 | | | $ | 516.4 | |
| Long-term flows: | | | | | | | | | | | | | |
| Sales/new accounts | 34.7 | | | 0.5 | | | 53.0 | | | 10.0 | | | 0.1 | | | 5.4 | | | 103.7 | |
| Redemptions/terminations | (26.4) | | | (0.8) | | | (31.5) | | | (6.8) | | | (0.4) | | | (2.5) | | | (68.4) | |
| Cash flow/unreinvested dividends | (4.3) | | | (3.8) | | | (2.8) | | | (0.2) | | | (0.6) | | | 1.6 | | | (10.1) | |
| Net long-term inflows (outflows) | 4.0 | | | (4.1) | | | 18.7 | | | 3.0 | | | (0.9) | | | 4.5 | | | 25.2 | |
Adjustments(4) | — | | | — | | | (0.4) | | | (0.5) | | | — | | | — | | | (0.9) | |
| Market (depreciation) appreciation | 37.0 | | | 14.0 | | | 20.3 | | | 2.9 | | | 0.8 | | | 7.2 | | | 82.2 | |
| Net change | 41.0 | | | 9.9 | | | 38.6 | | | 5.4 | | | (0.1) | | | 11.7 | | | 106.5 | |
| Balance as of December 31, 2019 | $ | 177.2 | | | $ | 60.1 | | | $ | 258.3 | | | $ | 47.1 | | | $ | 9.3 | | | $ | 70.9 | | | $ | 622.9 | |
| | | | | | | | | | | | | | | | | | | | | | | | | | | | | | | | | | | | | | | | | | | | |
| | Investment Service |
| | Equity
Actively
Managed | Equity Passively Managed(1) | Fixed
Income
Actively
Managed-
Taxable | Fixed Income
Actively
Managed-Tax-
Exempt | Fixed Income Passively Managed(1) | Alternatives/ Multi-Asset Solutions(2) | Total |
| (in billions) |
| Balance as of December 31, 2022 | | $ | 217.9 | | | $ | 53.8 | | | $ | 190.3 | | | $ | 52.5 | | | $ | 9.4 | | | $ | 122.5 | | | $ | 646.4 | |
| Long-term flows: | | | | | | | | | | | | | | |
| Sales/new accounts | | 37.3 | | | 1.3 | | | 36.4 | | | 16.5 | | | 1.7 | | | 8.3 | | | 101.5 | |
| Redemptions/terminations | | (43.8) | | | (0.3) | | | (27.3) | | | (11.1) | | | (0.3) | | | (5.4) | | | (88.2) | |
| Cash flow/unreinvested dividends | | (9.0) | | | (5.0) | | | (2.5) | | | 0.3 | | | 0.1 | | | (4.2) | | | (20.3) | |
| Net long-term (outflows) inflows | | (15.5) | | | (4.0) | | | 6.6 | | | 5.7 | | | 1.5 | | | (1.3) | | | (7.0) | |
| | | | | | | | | | | | | | |
| | | | | | | | | | | | | | |
| | | | | | | | | | | | | | |
| Market appreciation | | 45.1 | | | 12.3 | | | 11.7 | | | 2.9 | | | 0.5 | | | 13.3 | | | 85.8 | |
| Net change | | 29.6 | | | 8.3 | | | 18.3 | | | 8.6 | | | 2.0 | | | 12.0 | | | 78.8 | |
| Balance as of December 31, 2023 | | $ | 247.5 | | | $ | 62.1 | | | $ | 208.6 | | | $ | 61.1 | | | $ | 11.4 | | | $ | 134.5 | | | $ | 725.2 | |
| | | | | | | | | | | | | | |
| Balance as of December 31, 2021 | | $ | 287.6 | | | $ | 71.6 | | | $ | 246.3 | | | $ | 57.1 | | | $ | 13.2 | | | $ | 102.8 | | | $ | 778.6 | |
| Long-term flows: | | | | | | | | | | | | | | |
| Sales/new accounts | | 46.0 | | | 1.8 | | | 25.5 | | | 16.0 | | | (0.1) | | | 26.4 | | | 115.6 | |
| Redemptions/terminations | | (39.0) | | | (3.1) | | | (32.6) | | | (15.0) | | | (1.5) | | | (4.2) | | | (95.4) | |
| Cash flow/unreinvested dividends | | (9.7) | | | (4.0) | | | (10.8) | | | (0.4) | | | 0.3 | | | 0.8 | | | (23.8) | |
Net long-term (outflows) inflows(3) | | (2.7) | | | (5.3) | | | (17.9) | | | 0.6 | | | (1.3) | | | 23.0 | | | (3.6) | |
Adjustments(4) | | — | | | — | | | — | | | — | | | — | | | (0.4) | | | (0.4) | |
Acquisitions(5) | | — | | | — | | | — | | | — | | | — | | | 12.2 | | | 12.2 | |
| Market (depreciation) | | (67.0) | | | (12.5) | | | (38.1) | | | (5.2) | | | (2.5) | | | (15.1) | | | (140.4) | |
| Net change | | (69.7) | | | (17.8) | | | (56.0) | | | (4.6) | | | (3.8) | | | 19.7 | | | (132.2) | |
| Balance as of December 31, 2022 | | $ | 217.9 | | | $ | 53.8 | | | $ | 190.3 | | | $ | 52.5 | | | $ | 9.4 | | | $ | 122.5 | | | $ | 646.4 | |
(1)Includes index and enhanced index services.
(2)Includes certain multi-asset solutions and services not included in equity or fixed income services.
(3)Fixed income – taxable investment service netNet flows for 2020 include $11.8$4.5 billion of AXA redemptions of certain low-fee fixed income mandates.for 2022.
(4)Approximately $900 million$0.4 billion of non-investment management fee earning taxable and tax-exempt money market assets
wereInstitutional AUM was removed from our total assets under management during the second quarter of 2019.2022 due to a change in the fee structure.
(5)The CarVal acquisition added approximately $12.2 billion of Institutional AUM in the third quarter of 2022.
Part II
Net long-term (outflows) inflows (outflows) for actively managed investment services as compared to passively managed investment services during 20202023 and 20192022 are as follows:
| | | | | | | | | | | |
| | Years Ended December 31, |
| | 2020 | | 2019 |
| | (in billions) |
| Actively Managed | | | |
| Equity | $ | 7.4 | | | $ | 4.0 | |
| Fixed Income | (8.8) | | | 21.7 | |
| Alternatives/Multi-Asset Solutions | 4.5 | | | 4.0 | |
| 3.1 | | | 29.7 | |
| Passively Managed | | | |
| Equity | (4.6) | | | (4.1) | |
| Fixed Income | (1.6) | | | (0.9) | |
| Alternatives/Multi-Asset Solutions | 0.5 | | | 0.5 | |
| | (5.7) | | | (4.5) | |
| Total net long-term (outflows) inflows | $ | (2.6) | | | $ | 25.2 | |
| | | | | | | | | | | | | | |
| Years Ended December 31 |
| 2023 | 2022 |
| (in billions) |
| Actively Managed | | | | |
| Equity | | $ | (15.5) | | | $ | (2.7) | |
| Fixed Income | | 12.3 | | | (17.3) | |
| Alternatives/Multi- Asset Solutions | | (2.0) | | | 20.9 | |
| Total | | (5.2) | | | 0.9 | |
| | | | |
| Passively Managed | | | | |
| Equity | | (4.0) | | | (5.3) | |
| Fixed Income | | 1.5 | | | (1.3) | |
| Alternatives/Multi- Asset Solutions | | 0.7 | | | 2.1 | |
| Total | | (1.8) | | | (4.5) | |
| | | | |
| Total net long-term (outflows) | | $ | (7.0) | | | $ | (3.6) | |
Average assets under management by distribution channel and investment service are as follows:
| | | | | | | | | | | | | | | | | | | | | | | | | | | | | |
| | Years Ended December 31, | | % Change |
| | 2020 | | 2019 | | 2018 | | 2020-19 | | 2019-18 |
| | (in billions) | | | | |
| Distribution Channel: | | | | | | | | | |
| Institutions | $ | 285.9 | | | $ | 265.4 | | | $ | 258.1 | | | 7.7 | % | | 2.8 | % |
| Retail | 236.5 | | | 212.3 | | | 191.8 | | | 11.4 | | | 10.7 | |
| Private Wealth Management | 97.1 | | | 96.5 | | | 94.3 | | | 0.7 | | | 2.3 | |
| Total | $ | 619.5 | | | $ | 574.2 | | | $ | 544.2 | | | 7.9 | | | 5.5 | |
| | | | | | | | | |
| Investment Service: | | | | | | | | | |
| Equity Actively Managed | $ | 179.8 | | | $ | 158.4 | | | $ | 146.4 | | | 13.5 | | | 8.2 | |
Equity Passively Managed(1) | 57.1 | | | 56.4 | | | 53.8 | | | 1.2 | | | 4.8 | |
| Fixed Income Actively Managed – Taxable | 254.4 | | | 239.7 | | | 230.3 | | | 6.2 | | | 4.1 | |
| Fixed Income Actively Managed – Tax-exempt | 47.9 | | | 44.6 | | | 41.3 | | | 7.5 | | | 8.0 | |
Fixed Income Passively Managed(1) | 9.4 | | | 9.4 | | | 9.8 | | | 0.2 | | | (4.4) | |
Alternatives/Multi-Asset Solutions(2) | 70.9 | | | 65.7 | | | 62.6 | | | 7.8 | | | 5.1 | |
| Total | $ | 619.5 | | | $ | 574.2 | | | $ | 544.2 | | | 7.9 | | | 5.5 | |
| | | | | | | | | | | | | | | | | | | | | | | | | | | | | |
| | Years Ended December 31 | | % Change |
| | 2023 | 2022 | 2021 | | 2023-22 | 2022-21 |
| | (in billions) | | | |
| Distribution Channel: | | | | | | | | | |
| Institutions | | $ | 304.6 | | | $ | 308.4 | | | $ | 325.7 | | | (1.2 | %) | (5.3 | %) |
| Retail | | 262.0 | | | 267.8 | | | 291.0 | | | (2.1) | | (8.0) | |
| Private Wealth Management | | 113.7 | | | 110.3 | | | 114.1 | | | 3.0 | | (3.3) | |
| Total | | $ | 680.3 | | | $ | 686.5 | | | $ | 730.8 | | | (0.9) | % | (6.1) | % |
| Investment Service: | | | | | | | | | |
| Equity Actively Managed | | $ | 231.5 | | | $ | 239.7 | | | $ | 252.2 | | | (3.4) | | (4.9) | |
Equity Passively Managed(1) | | 57.7 | | | 60.4 | | | 68.7 | | | (4.5) | | (12.1) | |
| Fixed Income Actively Managed – Taxable | | 198.3 | | | 210.0 | | | 253.1 | | | (5.6) | | (17.1) | |
| Fixed Income Actively Managed – Tax-exempt | | 56.0 | | | 54.1 | | | 53.8 | | | 3.4 | | 0.6 | |
Fixed Income Passively Managed(1) | | 9.7 | | | 11.5 | | | 9.6 | | | (15.2) | | 20.2 | |
Alternatives/Multi-Asset Solutions(2) | | 127.1 | | | 110.8 | | | 93.4 | | | 14.8 | | 18.6 | |
| Total | | $ | 680.3 | | | $ | 686.5 | | | $ | 730.8 | | | (0.9) | % | (6.1) | % |
(1)Includes index and enhanced index services.
(2)Includes certain multi-asset solutions and services not included in equity or fixed income services.
During 2020,2023, our Institutional channel average AUM of $285.9$304.6 billion increased $20.5decreased $3.8 billion, or 7.7%1.2%, compared to 2019, primarily due to this2022, while ending AUM increasing $32.9increased $19.8 billion, or 11.6%6.7%, to $315.6$317.1 billion over the last twelve months.from December 31, 2022. The $32.9$19.8 billion increase in AUM resulted primarily from market appreciation of $30.5$31.5 billion and(with $22.7 billion of market appreciation occurring in the fourth quarter of 2023), partially offset by net inflowsoutflows of $1.0$11.8 billion. During 2019,2022, our Institutional channel average AUM of $265.4$308.4 billion increased $7.3decreased $17.3 billion, or 2.8%5.3%, compared to 2018,2021, primarily due to this AUM increasing $36.4decreasing $39.8 billion, or 14.8%11.8%, to $282.7$297.3 billion during 2019.from December 31, 2021. The $36.4$39.8 billion increasedecrease in AUM resulted primarily from market appreciationdepreciation of $34.0$57.8 billion, partially offset by an addition of $12.2 billion due to the acquisition of CarVal and net inflows of $2.4$6.3 billion.
During 2020,2023, our Retail channel average AUM of $236.5$262.0 billion increased $24.2decreased $5.8 billion, or 11.4%2.1%, compared to 2019, primarily due to this2022, while ending AUM increasing $26.1increased $43.9 billion, or 10.9%18.1%, to $265.3$286.8 billion over the last twelve months.from December 31, 2022. The $26.1$43.9 billion increase in AUM resulted primarily from market appreciation of $28.1$40.3 billion partially offset by(with $26.3 billion of market appreciation occurring in the fourth quarter of 2023) and net outflowsinflows of $1.6$3.7 billion. During 2019,2022, our Retail channel average AUM of $212.3$267.8 billion increased $20.5decreased $23.2 billion, or 10.7%8.0%, compared to 2018,2021, primarily due to this AUM increasing $58.4decreasing $77.0 billion, or 32.3%24.1%, to $239.2$242.9 billion during 2019.from December 31, 2021. The $58.4$77.0 billion increasedecrease in AUM resulted primarily from market appreciationdepreciation of $34.5$65.5 billion and net inflowsoutflows of $23.8$11.6 billion.
During 2020,2023, our Private Wealth Management channel average AUM of $97.1$113.7 billion increased $0.6$3.4 billion, or 0.7%3.0%, compared to 2019,2022, primarily due to this AUM increasing $4.0$15.1 billion, or 3.9%14.1%, to $105.0$121.3 billion over the last twelve months.from December 31, 2022. The $4.0 billion increase in AUM resulted primarily from market appreciation of $6.8 billion, partially offset by net outflows of $2.0 billion. During 2019, our Private Wealth Management channel average AUM of $96.5 billion increased $2.2 billion, or 2.3%, compared to 2018, primarily due to this AUM increasing $11.7 billion, or 13.2%, to $101.0 billion during 2019. The $11.7$15.1 billion increase in AUM resulted from market appreciation of $13.7$14.0 billion partially(with $9.0 billion of market appreciation occurring in the fourth quarter of 2023) and net inflows of $1.1 billion. During 2022, our Private Wealth Management channel average AUM of $110.3 billion decreased $3.8 billion, or 3.3%, compared to 2021, primarily due to this AUM decreasing $15.4 billion, or 12.6%, to $106.2 billion from December 31, 2021. The $15.4 billion decrease in AUM resulted from market depreciation of $17.1 billion, offset by net outflowsinflows of $1.0 billion and an adjustment of $0.9 billion in the second quarter of 2019 relating to the removal of non-investment management fee earning assets.
Absolute investment composite returns, gross of fees, and relative performance as of December 31, 20202023 compared to benchmarks for certain representative Institutional equity and fixed income services are as follows:
| | | | 1-Year | | 3-Year | | 5-Year | | 1-Year | 3-Year(1) | 5-Year(1) |
| | Global High Income - Hedged (fixed income) | |
| Income - Hedged (fixed income) | |
| Absolute return | |
| Absolute return | |
| Absolute return | Absolute return | 3.6 | % | | 4.7 | % | | 7.8 | % | 9.7 | % | (0.8 | %) | 3.3 | % |
| Relative return (vs. Bloomberg Barclays Global High Yield Index - Hedged) | Relative return (vs. Bloomberg Barclays Global High Yield Index - Hedged) | (2.1) | | | (0.6) | | | (0.1) | |
| High Income (fixed income) | |
| Absolute return | |
| Absolute return | |
| Absolute return | |
| Relative return (vs. Bloomberg Barclays U.S. Aggregate Index) | |
| Global Plus - Hedged (fixed income) | Global Plus - Hedged (fixed income) | |
| Absolute return | |
| Absolute return | |
| Absolute return | Absolute return | 5.9 | | | 5.3 | | | 5.1 | |
| Relative return (vs. Bloomberg Barclays Global Aggregate Index - Hedged) | Relative return (vs. Bloomberg Barclays Global Aggregate Index - Hedged) | 0.3 | | | 0.1 | | | 0.6 | |
| Intermediate Municipal Bonds (fixed income) | Intermediate Municipal Bonds (fixed income) | |
| Absolute return | Absolute return | 4.3 | | | 3.9 | | | 3.1 | |
| Absolute return | |
| Absolute return | |
| Relative return (vs. Lipper Short/Int. Blended Muni Fund Avg) | Relative return (vs. Lipper Short/Int. Blended Muni Fund Avg) | 0.9 | | | 0.8 | | | 0.7 | |
| U.S. Strategic Core Plus (fixed income) | U.S. Strategic Core Plus (fixed income) | |
| Absolute return | |
| Absolute return | |
| Absolute return | Absolute return | 8.0 | | | 5.7 | | | 5.3 | |
| Relative return (vs. Bloomberg Barclays U.S. Aggregate Index) | Relative return (vs. Bloomberg Barclays U.S. Aggregate Index) | 0.5 | | | 0.4 | | | 0.8 | |
| Emerging Market Debt (fixed income) | Emerging Market Debt (fixed income) | |
| Absolute return | Absolute return | 8.3 | | | 5.3 | | | 8.1 | |
| Absolute return | |
| Absolute return | |
| Relative return (vs. JPM EMBI Global/JPM EMBI) | Relative return (vs. JPM EMBI Global/JPM EMBI) | 2.4 | | | 0.3 | | | 1.2 | |
| Sustainable Global Thematic | |
| Absolute return | 40.9 | | | 19.0 | | | 18.3 | |
| Relative return (vs. MSCI ACWI Index) | 24.6 | | | 8.9 | | | 6.1 | |
| International Strategic Core Equity | |
| Absolute return | 6.9 | | | 5.5 | | | 8.3 | |
| Relative return (vs. MSCI EAFE Index) | (0.9) | | | 1.2 | | | 0.9 | |
| | | | 1-Year | | 3-Year | | 5-Year | | 1-Year | 3-Year(1) | 5-Year(1) |
| Sustainable Global Thematic | |
| Absolute return | |
| Absolute return | |
| Absolute return | |
| Relative return (vs. MSCI ACWI Index) | |
| International Strategic Core Equity | |
| Absolute return | |
| Absolute return | |
| Absolute return | |
| Relative return (vs. MSCI EAFE Index) | |
| U.S. Small & Mid Cap Value | U.S. Small & Mid Cap Value | |
| Absolute return | |
| Absolute return | |
| Absolute return | Absolute return | 4.6 | | | 2.8 | | | 9.3 | |
| Relative return (vs. Russell 2500 Value Index) | Relative return (vs. Russell 2500 Value Index) | (0.3) | | | (1.6) | | | (0.1) | |
| U.S. Strategic Value | U.S. Strategic Value | |
| Absolute return | Absolute return | 1.8 | | | 2.0 | | | 6.4 | |
| Absolute return | |
| Absolute return | |
| Relative return (vs. Russell 1000 Value Index) | Relative return (vs. Russell 1000 Value Index) | (1.0) | | | (4.0) | | | (3.3) | |
| U.S. Small Cap Growth | U.S. Small Cap Growth | |
| Absolute return | |
| Absolute return | |
| Absolute return | Absolute return | 55.6 | | | 28.8 | | | 25.6 | |
| Relative return (vs. Russell 2000 Growth Index) | Relative return (vs. Russell 2000 Growth Index) | 20.9 | | | 12.6 | | | 9.3 | |
| U.S. Large Cap Growth | U.S. Large Cap Growth | |
| Absolute return | Absolute return | 35.4 | | | 23.4 | | | 21.0 | |
| Absolute return | |
| Absolute return | |
| Relative return (vs. Russell 1000 Growth Index) | Relative return (vs. Russell 1000 Growth Index) | (3.1) | | | 0.4 | | | — | |
| U.S. Small & Mid Cap Growth | U.S. Small & Mid Cap Growth | |
| Absolute return | |
| Absolute return | |
| Absolute return | Absolute return | 54.0 | | | 25.1 | | | 22.5 | |
| Relative return (vs. Russell 2500 Growth Index) | Relative return (vs. Russell 2500 Growth Index) | 13.5 | | | 5.2 | | | 3.8 | |
| Concentrated U.S. Growth | Concentrated U.S. Growth | |
| Absolute return | Absolute return | 21.6 | | | 20.5 | | | 18.4 | |
| Absolute return | |
| Absolute return | |
| Relative return (vs. S&P 500 Index) | Relative return (vs. S&P 500 Index) | 3.2 | | | 6.3 | | | 3.2 | |
| Select U.S. Equity | Select U.S. Equity | |
| Absolute return | |
| Absolute return | |
| Absolute return | Absolute return | 16.5 | | | 13.4 | | | 14.7 | |
| Relative return (vs. S&P 500 Index) | Relative return (vs. S&P 500 Index) | (1.9) | | | (0.8) | | | (0.6) | |
| Strategic Equities | Strategic Equities | |
| Absolute return | Absolute return | 18.2 | | | 13.6 | | | 14.2 | |
| Absolute return | |
| Absolute return | |
| Relative return (vs. Russell 3000 Index) | Relative return (vs. Russell 3000 Index) | (2.6) | | | (0.8) | | | (1.2) | |
| Global Core Equity | Global Core Equity | |
| Absolute return | |
| Absolute return | |
| Absolute return | Absolute return | 11.2 | | | 11.1 | | | 13.5 | |
| Relative return (vs. MSCI ACWI Index) | Relative return (vs. MSCI ACWI Index) | (5.0) | | | 1.0 | | | 1.2 | |
| U.S. Strategic Core Equity | U.S. Strategic Core Equity | |
| Absolute return | Absolute return | 8.2 | | | 12.0 | | | 12.5 | |
| Absolute return | |
| Absolute return | |
| Relative return (vs. S&P 500 Index) | Relative return (vs. S&P 500 Index) | (10.2) | | | (2.1) | | | (2.7) | |
| Select U.S. Equity Long/Short | Select U.S. Equity Long/Short | |
| Absolute return | Absolute return | 11.6 | | | 9.7 | | | 10.0 | |
| Absolute return | |
| Absolute return | |
| Relative return (vs. S&P 500 Index) | Relative return (vs. S&P 500 Index) | (6.8) | | | (4.4) | | | (5.2) | |
| Global Strategic Core Equity | |
| Absolute return | |
| Absolute return | |
| Absolute return | |
| Relative return (vs. S&P 500 Index) | |
(1)Reflects annualized returns.
Consolidated Results of Operations
| | | | | | | | | | | | | | | | | | | | | | | | | | | | | |
| | Years Ended December 31, | | % Change |
| | 2020 | | 2019 | | 2018 | | 2020-19 | | 2019-18 |
| | (in thousands, except per unit amounts) | | | | |
| Net revenues | $ | 3,708,536 | | | $ | 3,518,432 | | | $ | 3,367,361 | | | 5.4 | % | | 4.5 | % |
| Expenses | 2,801,100 | | | 2,694,995 | | | 2,542,047 | | | 3.9 | | | 6.0 | |
| Operating income | 907,436 | | | 823,437 | | | 825,314 | | | 10.2 | | | (0.2) | |
| Income taxes | 45,653 | | | 41,754 | | | 45,816 | | | 9.3 | | | (8.9) | |
| Net income | 861,783 | | | 781,683 | | | 779,498 | | | 10.2 | | | 0.3 | |
| Net (loss) income of consolidated entities attributable to non-controlling interests | (4,169) | | | 29,641 | | | 21,910 | | | n/m | | 35.3 | |
| Net income attributable to AB Unitholders | $ | 865,952 | | | $ | 752,042 | | | $ | 757,588 | | | 15.1 | | | (0.7) | |
| Diluted net income per AB Unit | $ | 3.19 | | | $ | 2.78 | | | $ | 2.78 | | | 14.7 | | | — | |
| Distributions per AB Unit | $ | 3.20 | | | $ | 2.82 | | | $ | 2.96 | | | 13.5 | | | (4.7) | |
Operating margin(1) | 24.6 | % | | 22.6 | % | | 23.9 | % | | | | |
| | | | | | | | | | | | | | | | | | | | | | | | | | | | | |
| | Years Ended December 31 | | % Change |
| | 2023 | | 2022 | | 2021 | | 2023-22 | 2022-21 |
| | (in thousands, except per unit amounts) | | | |
| Net revenues | | $ | 4,155,323 | | | $ | 4,054,290 | | | $ | 4,441,602 | | | 2.5 | % | (8.7 | %) |
| Expenses | | 3,337,653 | | | 3,239,194 | | | 3,225,140 | | | 3.0 | | 0.4 | |
| Operating income | | 817,670 | | | 815,096 | | | 1,216,462 | | | 0.3 | | (33.0) | |
| Income taxes | | 29,051 | | | 39,639 | | | 62,728 | | | (26.7) | | (36.8) | |
| Net income | | 788,619 | | | 775,457 | | | 1,153,734 | | | 1.7 | | (32.8) | |
| Net income (loss) of consolidated entities attributable to non-controlling interests | | 24,009 | | | (56,356) | | | 5,111 | | | n/m | n/m |
| Net income attributable to AB Unitholders | | $ | 764,610 | | | $ | 831,813 | | | $ | 1,148,623 | | | (8.1) | | (27.6) | |
| Diluted net income per AB Unit | | $ | 2.65 | | | $ | 3.01 | | | $ | 4.18 | | | (12.0) | | (28.0) | |
| Distributions per AB Unit | | $ | 3.00 | | | $ | 3.26 | | | $ | 4.19 | | | (8.0) | | (22.2) | |
Operating margin(1) | | 19.1 | % | | 21.5 | % | | 27.3 | % | | | |
(1)Operating income excluding net income (loss) attributable to non-controlling interests as a percentage of net revenues.
Net income attributable to AB Unitholders for the year ended December 31, 2023 decreased $67.2 million from the year ended December 31, 2022. The decrease primarily is due to (in millions):
| | | | | |
| Higher employee compensation and benefits | $ | (102.5) | |
| Higher net gains of consolidated entities attributable to non-controlling interest | (80.4) | |
| Higher interest on borrowings | (36.5) | |
| Lower Bernstein Research Services revenue | (30.1) | |
| Lower distribution revenues | (20.9) | |
| Higher amortization of intangible assets | (20.3) | |
| Higher contingent payment arrangements | (16.3) | |
| Higher investment gains | 116.6 | |
| Lower general and administrative expenses | 60.1 | |
| Higher net dividend and interest income | 35.2 | |
| Lower promotion and servicing expenses | 17.1 | |
| Lower income taxes | 10.6 | |
| Other | 0.2 | |
| $ | (67.2) | |
Net income attributable to AB Unitholders for the year ended December 31, 2020 increased $113.92022 decreased $316.8 million from the year ended December 31, 2019.2021. The increasedecrease primarily iswas due to (in millions):
| | | | | |
HigherLower base advisory fees | $ | 90.4 (123.6) | |
| Higher investment losses | (101.8) | |
| Lower performance-based fees | (99.9) | |
| Higher general and administrative expenses | (86.0) | |
| Lower distribution revenues | 74.7 (45.0) | |
HigherLower Bernstein Research Services revenue | 51.8 (35.7) | |
| Lower promotion and servicing expenses | 60.1 | |
| Higher net loss of consolidated entities attributable to non-controlling interest | 33.861.5 | |
Higher performance-based fees | 33.0 | |
Lower amortization of intangible assets | 7.4 | |
Lower interest on borrowings | 6.9 | |
Higher promotion and servicing expenses | (63.6) | |
Higher investment losses | (55.1) | |
Higher employee compensation and benefits | (51.4)49.4 | |
Lower net dividend and interest income | (11.9) | |
Higher general and administrative expenses (including real estate charges) | (3.0) | |
| Other | 0.94.2 | |
| $ | 113.9 (316.8) | |
Net income attributable to AB Unitholders for the year ended December 31, 2019 decreased $5.5 million from the year ended December 31, 2018. The decrease primarily was due to (in millions):
| | |
|
| Units Outstanding |
| Higher employee compensation and benefits$ | (64.0) | |
Higher promotion and servicing expenses | (51.7) | |
Higher general and administrative expenses (including real estate charges) | (31.9) | |
Lower Bernstein Research Services revenue | (31.5) | |
Lower performance-based fees | (18.5) | |
Higher net income of consolidated entities attributable to non-controlling interest | (7.7) | |
Higher base advisory fees | 128.4 | |
Higher distribution revenues | 36.5 | |
Higher investment gains | 36.0 | |
Other | (1.1) | |
| $ | (5.5) | |
Units Outstanding
Each quarter, we consider whether to implement a plan to repurchase AB Holding Units pursuant to Rules 10b5-1 and 10b-18 under the Securities Exchange Act of 1934, as amended (“Exchange Act”). A plan of this type allows a company to repurchase its shares at times when it otherwise might be prevented from doing so because of self-imposed trading blackout periods or because it possesses material non-public information. Each broker we select has the authority to repurchase AB Holding Units on our behalf in accordance with the terms and limitations specified in the plan. Repurchases are subject to regulations promulgated by the SEC, as well as certain price, market volume and timing constraints specified in the plan. TheThere was no plan adopted during the fourth quarter of 2020 expired at the close of business on February 10, 2021.2023. We may adopt additional plans in the future to engage in open-market purchases of AB Holding Units to help fund anticipated obligations under our incentive compensation award program and for other corporate purposes.
We are required to distribute all of our Available Cash Flow, as defined in the AB Partnership Agreement, to our Unitholders and the General Partner. Available Cash Flow typically is the adjusted diluted net income per unit for the quarter multiplied by the number of general and limited partnership interests at the end of the quarter. In future periods, management anticipates that Available Cash Flow will continue to be based on adjusted diluted net income per unit, unless management determines, with concurrence of the Board of Directors, that one or more adjustments that are made for adjusted net income should not be made with respect to the Available Cash Flow calculation. See Note 2 to our consolidated financial statements contained in Item 8 for a description of Available Cash Flow.
| | |
|
| Management Operating Metrics |
|
We are providing the non-GAAP measures “adjusted net revenues,” “adjusted operating income” and “adjusted operating margin” because they are the principal operating metrics management uses in evaluating and comparing period-to-period operating performance. Management principally uses these metrics in evaluating performance because they present a clearer picture of our operating performance and allow management to see long-term trends without the distortion primarily caused by long-term incentive compensation-related mark-to-market adjustments, real estate chargesacquisition-related expenses, interest expense and other adjustment items. Similarly, we believe that these management operating metrics help investors better understand the underlying trends in our results and, accordingly, provide a valuable perspective for investors.
These non-GAAP measures are provided in addition to, and not as substitutes for, net revenues, operating income and operating margin, and they may not be comparable to non-GAAP measures presented by other companies. Management uses both accounting principles generally accepted in the United States of America ("US GAAP") and non-GAAP measures in evaluating our financial performance. The non-GAAP measures alone may pose limitations because they do not include all of our revenues and expenses.
| | Years Ended December 31 | | | Years Ended December 31 |
| 2023 | | | 2023 | 2022 | 2021 |
| (in thousands) | | | (in thousands) |
| Net revenues, US GAAP basis | |
| Adjustments: | |
| Distribution-related adjustments: | |
| Distribution-related adjustments: | |
| Distribution-related adjustments: | |
| Distribution revenues | |
| Distribution revenues | |
| Distribution revenues | |
| Investment advisory services fees | |
| Pass-through adjustments: | |
| Investment advisory services fees | |
| Investment advisory services fees | |
| Investment advisory services fees | |
| Other revenues | |
| Impact of consolidated company-sponsored funds | |
| Incentive compensation-related items | |
| Write-down of investment | |
| | Adjusted net revenues | |
| Adjusted net revenues | |
| Adjusted net revenues | |
| Operating income, US GAAP basis | |
| Adjustments: | |
| Real estate | |
| Real estate | |
| Real estate | |
| Incentive compensation-related items | |
| EQH award compensation | |
| Write-down of investment | |
| Acquisition-related expenses | |
| | | Years Ended December 31, |
| | 2020 | | 2019 | | 2018 |
| Sub-total of non-GAAP adjustments before interest on borrowings | |
| | (in thousands) |
| Net revenues, US GAAP basis | $ | 3,708,536 | | | $ | 3,518,432 | | | $ | 3,367,361 | |
| Adjustments: | |
| Distribution-related adjustments: | |
| Distribution revenues | (529,781) | | | (455,043) | | | (418,562) | |
| Investment advisory services fees | (66,858) | | | (47,951) | | | (29,967) | |
| Pass through adjustments: | |
| Investment advisory services fees | (18,279) | | | (20,914) | | | (4,395) | |
| Other revenues | (39,333) | | | (35,926) | | | (35,824) | |
| Impact of consolidated company-sponsored funds | 954 | | | (33,044) | | | (38,142) | |
| Long-term incentive compensation-related investment gains and dividend and interest | (6,772) | | | (8,939) | | | 3,509 | |
| Write-down on investment | 859 | | | — | | | 3,733 | |
| Impact of adoption of revenue recognition standard ASC 606 | — | | | — | | | 77,844 | |
| Other | — | | | — | | | 47 | |
| Adjusted net revenues | $ | 3,049,326 | | | $ | 2,916,615 | | | $ | 2,925,604 | |
| | Operating income, US GAAP basis | $ | 907,436 | | | $ | 823,437 | | | $ | 825,314 | |
| Adjustments: | |
| Real estate | 2,880 | | | 2,623 | | | 7,160 | |
| Long-term incentive compensation-related items | (83) | | | 1,217 | | | 3,064 | |
| CEO's EQH award compensation | 802 | | | 1,125 | | | — | |
| Write-down of investment | 859 | | | — | | | 3,733 | |
| Acquisition-related expenses | 3,301 | | | 6,734 | | | 1,924 | |
| Contingent payment arrangements | (1,366) | | | (3,051) | | | (2,429) | |
| Impact of adoption of revenue recognition standard ASC 606 | — | | | — | | | 35,156 | |
| Other | — | | | — | | | 47 | |
| Sub-total of non-GAAP adjustments | 6,393 | | | 8,648 | | | 48,655 | |
| Less: Net (loss) income of consolidated entities attributable to non-controlling interests | (4,169) | | | 29,641 | | | 21,910 | |
| Adjusted operating income | 917,998 | | | 802,444 | | | 852,059 | |
| Adjusted income taxes | 46,176 | | | 40,684 | | | 47,289 | |
| Sub-total of non-GAAP adjustments before interest on borrowings | |
| | Sub-total of non-GAAP adjustments before interest on borrowings | |
Interest on borrowings1 | |
| Subtotal of non-GAAP adjustments | |
| Less: Net income (loss) of consolidated entities attributable to non-controlling interests | |
Adjusted operating income1 | |
| Less: Interest on borrowings | |
| Adjusted pre-tax income | |
| Less: Adjusted income taxes | |
| Adjusted net income | Adjusted net income | $ | 871,822 | | | $ | 761,760 | | | $ | 804,770 | |
| Diluted net income per AB Unit, GAAP basis | Diluted net income per AB Unit, GAAP basis | $ | 3.19 | | | $ | 2.78 | | | $ | 2.78 | |
| Impact of non-GAAP adjustments | Impact of non-GAAP adjustments | 0.02 | | | 0.03 | | | 0.18 | |
| Adjusted diluted net income per AB Unit | Adjusted diluted net income per AB Unit | $ | 3.21 | | | $ | 2.81 | | | $ | 2.96 | |
| | Operating margin, GAAP basis | | Operating margin, GAAP basis | | 19.1 | % | | 21.5 | % | | 27.3 | % |
| Impact of non-GAAP adjustments | |
| Adjusted operating margin | Adjusted operating margin | 30.1 | % | | 27.5 | % | | 29.1 | % | Adjusted operating margin | | 28.2 | % | | 28.9 | % | | 33.8 | % |
Adjusted1During the second quarter of 2023, we revised adjusted operating income for the year ended December 31, 2020 increased $115.6 million, or 14.4%, from the year ended December 31, 2019, primarily due to higher investment advisory base fees of $74.1 million, higher Bernstein Research Services revenue of $51.8 million, lower promotion and servicing expenses of $33.4 million, higher performance-based fees of $33.2 million, lower amortization of intangibles of $7.4 million and lowerexclude interest on borrowings of $6.9 million, partially offset by higher employee compensation expenses (excludingin order to align with our industry peer group. We have recast prior periods presentation to align with the impact of long-term incentive compensation-related items) of $56.1 million, higher net investment losses of $22.8 million, lower net dividend and interest income of $8.5 million and higher general and administrative expenses of $8.2 million.current period presentation.
Adjusted operating income for the year ended December 31, 20192023 decreased $49.6$13.9 million, or 5.8%1.4%, from the year ended December 31, 2018,2022, primarily due to higher employee compensation and benefits expense of $39.3 million, lower Bernstein Research Services revenue of $30.1 million, lower investment advisory base fees of $25.1 million and higher general and administrative expenses of $6.2 million, partially offset by higher net dividend and interest income of $51.6 million and higher performance-based fees of $35.5 million.
Adjusted operating income for the year ended December 31, 2022 decreased $254.4 million, or 20.9%, from the year ended December 31, 2021, primarily due to lower performance-based fees of $99.3$130.9 million, lower investment advisory base fees of $99.1 million, lower Bernstein Research Services revenue of $35.7 million and higher general and administrative expenses of $32.3 million, partially offset by lower employee compensation and benefits expense of $58.4 million.
Part II
revenue of $31.5 million, higher general and administrative expenses of $29.3 million and higher employee compensation expenses (excluding the impact of long-term incentive compensation-related items) of $8.3 million, offset by higher investment advisory base fees of $95.5 million and higher investments gains and losses revenue of $22.4 million.
On January 1, 2018, as a result of our adoption of ASC 606, we recorded a cumulative effect adjustment, net of tax, of $35.0 million to partners’ capital in the consolidated statement of financial condition. This amount represented carried interest distributions of $77.9 million previously received, net of revenue sharing payments to investment team members, of $42.7 million, with respect to which it was probable that significant reversal would not occur. These amounts were included in adjusted net revenues and adjusted operating income in the first quarter of 2018.
Adjusted Net Revenues
Net Revenue, as adjusted, is reduced to exclude all of the company's distribution revenues, which are recorded as a separate line item on the consolidated statement of income, as well as a portion of investment advisory services fees received that is used to pay distribution and servicing costs. For certain products, based on the distinct arrangements, certain distribution fees are collected by us and passed through to third-party client intermediaries, while for certain other products, we collect investment advisory services fees and a portion is passed through to third-party client intermediaries. In both arrangements, the third-party client intermediary owns the relationship with the client and is responsible for performing services and distributing the product to the client on our behalf. We believe offsetting distribution revenues and certain investment advisory services fees is useful for our investors and other users of our financial statements because such presentation appropriately reflects the nature of these costs as pass-through payments to third parties that perform functions on behalf of our sponsored mutual funds and/or shareholders of these funds. Distribution-related adjustments fluctuate each period based on the type of investment products sold, as well as the average AUM over the period. Also, we adjust distribution revenues for the amortization of deferred sales commissions as these costs, over time, will offset such revenues.
We adjust investment advisory and services fees and other revenues for pass through costs, primarily related to our transfer agent and shareholder servicing fees. Also, we adjust for certain performance-based fees passed through to our investment advisors. These fees do not affect operating income, but they do affect our operating margin. Asas such, we exclude these fees from adjusted net revenues.
We adjust for the revenue impact of consolidating company-sponsored investment funds by eliminating the consolidated company-sponsored investment funds' revenues and including AB's fees from such consolidated company-sponsored investment funds and AB's investment gains and losses on its investments in such consolidated company-sponsored investment funds that were eliminated in consolidation.
Also, adjustedAdjusted net revenues exclude investment gains and losses and dividends and interest on employee long-term incentive compensation-related investments. Also, we adjust for certain acquisition-related pass-through performance-based fees and performance related compensation.
During the firstfourth quarter of 2020,2021, we wrote-offwrote down an investment that had been received in exchange forequity method investment; this write-down brought the sale of software technology, bringing theinvestment balance to zero. Previously, we had been excluding the value of this investment from adjusted net revenues.
Lastly, adjusted net revenues include the impact of our adoption of revenue recognition standard ASC 606 during the first quarter of 2018, asdiscussed above.
Adjusted Operating Income
Adjusted operating income represents operating income on a US GAAP basis excluding (1) real estate charges (credits), (2) the impact on net revenues and compensation expense of the investment gains and losses (as well as the dividends and interest) associated with employee long-term incentive compensation-related investments, (3) our CEO'sthe equity compensation paid by EQH award compensation,to certain AB executives, as discussed below, (4) the write-down of an investmentinvestments (discussed immediately above), (5) acquisition-related expenses, (6) adjustments to contingent payment arrangements,interest on borrowings and (7) the impact of consolidated company-sponsored investment funds; provided, however, that adjusted operating income includes the revenues and expenses associated with our implementation of ASC 606 during the first quarter of 2018 discussed above.funds.
Real estate charges (credits) have been excluded because they are not considered part of our core operating results when comparing financial results from period to period and to industry peers. However, beginning inincurred during the fourth quarter of 2019 real estate charges (credits),through the fourth quarter of 2020, while excluded in the period in which the charges (credits) arewere recorded, are included ratably over the remaining applicable lease term.
Prior to 2009, a significant portion of employee compensation was in the form of long-term incentive compensation awards that were notionally invested in AB investment services and generally vested over a period of four years. AB economically hedged
the exposure to market movements by purchasing and holding these investments on its balance sheet. All such investments had vested as of year-end 2012 and the investments have been delivered to the participants, except for those investments with respect to which the participant elected a long-term deferral. Fluctuation in the value of these investments, which also impacts compensation expense, is recorded within investment gains and losses on the income statement. Management believes it is useful to reflect the offset achieved from economically hedging the market exposure of these investments in the calculation of adjusted operating income and adjusted operating margin. The non-GAAP measures exclude gains and losses and dividends and interest on employee long-term incentive compensation-related investments included in revenues and compensation expense.
The board of directors of EQH granted to Seth P. Bernstein, (“CEO”), our President and Chief Executive Officer,CEO, equity awards in connection with EQH's IPOIPO. Additionally, equity awards were granted to Mr. Bernstein and Mr. Bernstein'sother AB executivesfor their membership on the EQH Management Committee. Mr. BernsteinThese individuals may receive additional equity or cash compensation from EQH in the future related to histheir service on the Management Committee. Any awards granted to Mr. Bernsteinthese individuals by EQH are recorded as compensation expense in AB’s consolidated statement of income. The compensation expense associated with these awards has been excluded from our non-GAAP measures because they are non-cash and are based upon EQH's, and not AB's, financial performance.
The write-offwrite-down of the investmentinvestments discussed above in Adjusted Net Revenues hashave been excluded due to itstheir non-recurring nature and because it isthey are not part of our core operating results.
Acquisition-related expenses have been excluded because they are not considered part of our core operating results when comparing financial results from period to period and to industry peers. Acquisition-related expenses include professional fees and the recording of changes in estimates to contingent payment arrangements associated with our acquisitions. Beginning in the first quarter of 2022, acquisition-related expenses also include certain compensation-related expenses, amortization of intangible assets for contracts acquired and accretion expense with respect to contingent payment arrangements. During 2020, these2023, 2022 and 2021, acquisition related expenses included an intangible asset impairment charge of $1.5zero, $5.6 million relatingand $1.0 million, respectively, related to our 2016 acquisition.
The recording of changes in estimates of contingent consideration payable with respect to contingent payment arrangements associated with our acquisitions are not considered part of our core operating results and, accordingly, have been excluded.
Adjusted net During 2023, we recorded an expense of $28.4 million due to a change in estimate related to the contingent consideration associated with the acquisition of Autonomous LLC in 2019. The change in estimate was based upon better than expected revenues include the impact of our adoption of revenue recognition standard ASC 606 during the first quarter2023 performance evaluation period. We recorded $14.1 million as contingent payment arrangement expense and $14.3 million as compensation and benefits expense in the condensed consolidated statement of 2018, as discussed above.income. The charges to compensation and benefits expense are due to certain service conditions and special awards included in the acquisition agreement.
We adjust operating income to exclude interest on borrowings in order to align with our industry peer group.
We adjusted for the operating income impact of consolidating certain company-sponsored investment funds by eliminating the consolidated company-sponsored funds' revenues and expenses and including AB's revenues and expenses that were eliminated in consolidation. We also excluded the limited partner interests we do not own.
Adjusted Net Income and Adjusted Diluted Net Income per AB Unit
As previously discussed, our quarterly distribution is typically our adjusted diluted net income per unit (which is derived from adjusted net income) for the quarter multiplied by the number of general and limited partnership interests at the end of the quarter. Adjusted income taxes, used in calculating adjusted net income, are calculated using the GAAP effective tax rate adjusted for non-GAAP income tax adjustments.
Adjusted Operating Margin
Adjusted operating margin allows us to monitor our financial performance and efficiency from period to period without the volatility noted above in our discussion of adjusted operating income and to compare our performance to industry peers on a basis that better reflects our performance in our core business. Adjusted operating margin is derived by dividing adjusted operating income by adjusted net revenues.
Net Revenues
The components of net revenues are as follows:
| | | | Years Ended December 31, | | % Change | | Years Ended December 31 | | % Change |
| | | 2020 | | 2019 | | 2018 | | 2020-19 | | 2019-18 | | 2023 | 2022 | 2021 | | 2023-22 | 2022-21 |
| | | (in thousands) | | | | | | (in thousands) | | | |
| Investment advisory and services fees: | Investment advisory and services fees: | | | | | Investment advisory and services fees: | | | | | | | | | |
| Institutions: | Institutions: | | | | | Institutions: | | | | | | | | | |
| Base fees | Base fees | $ | 458,449 | | | $ | 451,125 | | | $ | 444,884 | | | 1.6 | % | | 1.4 | % | Base fees | | $ | 612,341 | | | $ | | $ | 581,987 | | | $ | | $ | 540,478 | | | 5.2 | | 5.2 | % | 7.7 | % |
| Performance-based fees | Performance-based fees | 53,351 | | | 27,839 | | | 32,898 | | | 91.6 | | | (15.4) | |
| | | 511,800 | | | 478,964 | | | 477,782 | | | 6.9 | | | 0.2 | |
| Retail: | Retail: | | | | | | |
| Base fees | Base fees | 1,186,560 | | | 1,076,495 | | | 992,037 | | | 10.2 | | | 8.5 | |
| Base fees | |
| Base fees | |
| Performance-based fees | Performance-based fees | 24,412 | | | 22,510 | | | 18,278 | | | 8.4 | | | 23.2 | |
| | | 1,210,972 | | | 1,099,005 | | | 1,010,315 | | | 10.2 | | | 8.8 | |
| Private Wealth Management: | Private Wealth Management: | | | | | | |
| Base fees | Base fees | 817,801 | | | 844,809 | | | 807,147 | | | (3.2) | | | 4.7 | |
| Base fees | |
| Base fees | |
| Performance-based fees | Performance-based fees | 54,863 | | | 49,266 | | | 66,967 | | | 11.4 | | | (26.4) | |
| | | 872,664 | | | 894,075 | | | 874,114 | | | (2.4) | | | 2.3 | |
| Total: | Total: | | | | | | |
| Base fees | |
| Base fees | |
| Base fees | Base fees | 2,462,810 | | | 2,372,429 | | | 2,244,068 | | | 3.8 | | | 5.7 | |
| Performance-based fees | Performance-based fees | 132,626 | | | 99,615 | | | 118,143 | | | 33.1 | | | (15.7) | |
| | | 2,595,436 | | | 2,472,044 | | | 2,362,211 | | | 5.0 | | | 4.6 | |
| Bernstein Research Services | Bernstein Research Services | 459,744 | | | 407,911 | | | 439,432 | | | 12.7 | | | (7.2) | |
| Distribution revenues | Distribution revenues | 529,781 | | | 455,043 | | | 418,562 | | | 16.4 | | | 8.7 | |
| Dividend and interest income | Dividend and interest income | 50,923 | | | 104,421 | | | 98,226 | | | (51.2) | | | 6.3 | | Dividend and interest income | | 199,443 | | | 123,091 | | 123,091 | | | 38,734 | | 38,734 | | | 62.0 | | 62.0 | | n/m | n/m |
| Investment (losses) gains | (16,401) | | | 38,659 | | | 2,653 | | | n/m | | n/m |
| Investment gains (losses) | | Investment gains (losses) | | 14,206 | | | (102,413) | | | (636) | | | n/m | n/m |
| Other revenues | Other revenues | 104,703 | | | 97,559 | | | 98,676 | | | 7.3 | | | (1.1) | |
| Total revenues | Total revenues | 3,724,186 | | | 3,575,637 | | | 3,419,760 | | | 4.2 | | | 4.6 | |
| Less: Interest expense | 15,650 | | | 57,205 | | | 52,399 | | | (72.6) | | | 9.2 | |
| Less: broker-dealer related interest expense | | Less: broker-dealer related interest expense | | 107,541 | | | 66,438 | | | 3,686 | | | 61.9 | | n/m |
| Net revenues | Net revenues | $ | 3,708,536 | | | $ | 3,518,432 | | | $ | 3,367,361 | | | 5.4 | | | 4.5 | | Net revenues | | $ | 4,155,323 | | | $ | | $ | 4,054,290 | | | $ | | $ | 4,441,602 | | | 2.5 | | 2.5 | % | (8.7 | %) |
|
Investment Advisory and Services Fees
Investment advisory and services fees are the largest component of our revenues. These fees generally are calculated as a percentage of the value of AUM as of a specified date, or as a percentage of the value of average AUM for the applicable billing period, and vary with the type of investment service, the size of account and the total amount of assets we manage for a particular client. Accordingly, fee income generally increases or decreases as AUM increase or decrease and is affected by market appreciation or depreciation, the addition of new client accounts or client contributions of additional assets to existing accounts, withdrawals of assets from and termination of client accounts, purchases and redemptions of mutual fund shares, shifts of assets between accounts or products with different fee structures, and acquisitions. Our average basis points realized (investment advisory and services fees divided by average AUM) generally approximate 30 to 110105 basis points for actively-managedactively managed equity services, 10 to 7565 basis points for actively-managed fixed income services and 21 to 2050 basis points for passively-managedpassively managed services. Average basis points realized for other services could range from 43 basis points for certain Institutional third party managed services to over 100190 basis points for certain Retail and Private Wealth Management alternative services. These ranges include all-inclusive fee arrangements (covering investment management, trade execution and other services) for our Private Wealth Management clients.
We calculate AUM using established market-based valuation methods and fair valuation (non-observable market) methods. Market-based valuation methods include: last sale/settle prices from an exchange for actively-traded listed equities, options and futures; evaluated bid prices from recognized pricing vendors for fixed income, asset-backed or mortgage-backed issues; mid prices from recognized pricing vendors and brokers for credit default swaps; and quoted bids or spreads from pricing
vendors and brokers for other derivative products. Fair valuation methods include: discounted cash flow models or any other
methodology that is validated and approved by our Valuation Committee and sub-committee (the "Valuation Committee") (see paragraph immediately below for more information regarding our Valuation Committee). Fair valuation methods are used only where AUM cannot be valued using market-based valuation methods, such as in the case of private equity or illiquid securities.
The Valuation Committee, which consists of senior officers and employees, is responsible for overseeing thewhich oversees a consistent framework of pricing and valuation of all investments held in client and AB portfolios. The Valuation Committee has adopted a Statement of Pricing Policies describing principles and policies that apply to pricing and valuing investments held in these portfolios. We also have a Pricing Group, which reports tois overseen by the Valuation Committee and is responsible for overseeingmanaging the pricing process for all investments.
We sometimes charge our clients performance-based fees. In these situations, we charge a base advisory fee and are eligible to earn an additional performance-based fee or incentive allocation that is calculated as either a percentage of absolute investment results or a percentage of investment results in excess of a stated benchmark over a specified period of time. Some performance-based fees include a high-watermark provision, which generally provides that if a client account underperforms relative to its performance target (whether absolute or relative to a specified benchmark), it must gain back such underperformance before we can collect future performance-based fees. Therefore, if we fail to achieve our performance target for a particular period, we will not earn a performance-based fee for that period and, for accounts with a high-watermark provision, our ability to earn future performance-based fees will be impaired. We are eligible to earn performance-based fees on 6.0%9.3%, 8.5%8.3% and 0.8%0.4% of the assets we manage for institutional clients, private wealth clients and retail clients, respectively (in total, 4.4%5.6% of our AUM).
Our investment advisory and services fees increased by $123.4$4.4 million, or 5.0%0.1%, in 2020,2023, due to a $90.4$4.8 million, or 3.8%0.2%, increase in base fees, andoffset by a $33.0$0.3 million increasedecrease in performance-based fees. The increase in base fees is primarily due to an 7.9% increaseslight shift in average AUM,product mix to alternatives, which generally earn higher fees, partially offset by a lower portfolio fee rate.0.9% decrease in average AUM. Our investment advisory and services fees increaseddecreased by $109.8$223.5 million, or 4.6%7.0%, in 2019,2022, due to a $128.4$123.6 million, or 5.7%4.2%, increasedecrease in base fees which primarily resulted fromand a 5.5% increase in average AUM and the impact of a slight shift in product mix from fixed income to equities, which generally have higher fees. This increase was partially offset by an $18.5$99.9 million decrease in performance-based fees.
Institutional investment advisory and services fees increased $32.8 million, or 6.9%, in 2020, due to an increase in performance-based fees of $25.5 million and an increase in base fees of $7.3 million, or 1.6%. The increase in base fees is primarily due to an 7.7% increase in average AUM, partially offset by a lower portfolio fee rate. Institutional investment advisory and services fees increased $1.2 million, or 0.2%, in 2019, due to an increase in base fees of $6.2 million, or 1.4%, partially offset by a decrease in performance-based fees of $5.0 million. The increase in base fees was primarily due to a 2.8% increase in average AUM, partially offset by the impact of lower fee realization from active equities.
Retail investment advisory and services fees increased $112.0 million, or 10.2%, in 2020, due to an increase in base fees of $110.1 million, or 10.2%, and a $1.9 million increase in performance-based fees. The increase in base fees is primarily due to a 11.4% increase6.1% decrease in average AUM, partially offset by a lowerslight increase in our portfolio fee rate. Retail investment advisory
Performance-based fees decreased $0.3 million, or 0.2%, in 2023, primarily due to lower performance-based fees earned on U.S. Real Estate fund and servicesEmerging Markets Opportunistic Credit fund, partially offset by higher performance-based fees earned on Private Credit fund, Global Opportunistic Credit fund, Global Multi-Strategy fund and Securitized Assets fund. Performance-based fees decreased $99.9 million, or 40.7%, in 2022, primarily due to lower performance-based fees earned on Financial Services Opportunities fund, U.S. Select Equity fund, Arya Partners fund and Private Credit Services fund, partially offset by higher U.S. Real Estate fund fees.
Institutional base fees increased $88.7$30.4 million, or 8.8%5.2%, in 2019, due to an increase in base fees of $84.5 million, or 8.5%, and a $4.2 million increase in base fees. The increase in base fees was2023, primarily due to a 10.7% increase in average AUM, partially offset by the impact of lowerhigher portfolio fee realization from active equities.
Private Wealth Management investment advisory and services fees decreased by $21.4 million, or 2.4%, in 2020, due to a decrease in base fees of $27.0 million, or 3.2%,rate, partially offset by a $5.6 million increase in performance-based fees. The1.2% decrease in average AUM. Retail base fees isdecreased $45.7 million, or 3.5%, in 2023, primarily due to the impact of a lower2.1% decrease in average AUM. Private Wealth base fees increased $20.1 million, or 2.2%, in 2023, primarily due to a 3.0% increase in average AUM. Institutional base fees increased $41.5 million, or 7.7%, in 2022, primarily due to a higher portfolio fee rate, as well as a product mix shift with high fee value equity strategies now representing a lower percentage of our total AUM than in prior periods. Private Wealth Management investment advisory and services fees increased $20.0 million, or 2.3%, in 2019, due to an increase in base fees of $37.7 million, or 4.7%, partially offset by a 5.3% decrease in performance-based fees of $17.7 million. The increase inaverage AUM. Retail base fees wasdecreased $120.5 million, or 8.4%, in 2022, primarily due to an 8.0% decrease in average AUM. Private Wealth base fees decreased $44.6 million, or 4.6%, in 2022, primarily due to a 2.3% increase3.3% decrease in average AUM and the impact of a shift in product mix to alternatives, which generally have higher fees.AUM.
Bernstein Research Services
We earn revenues for providing investment research to, and executing brokerage transactions for, institutional clients. These clients compensate us principally by directing us to execute brokerage transactions on their behalf, for which we earn commissions, and to a lesser extent, but increasingly, by paying us directly for research through commission sharing agreements or cash payments.
Revenues from Bernstein Research Services increased $51.8 million, or 12.7%, in 2020. The increase was due In the fourth quarter of 2022, AB and SocGen, a leading European bank, announced plans to higher market volatility in 2020, particularly between Marchform a joint venture combining their respective cash equities and June 2020, primarily asresearch businesses. As a result, of the COVID-19 pandemic, which ledBRSbusiness has been classified as held for sale. For further discussion, see Note 24 Acquisitions and Divestitures to
higher customer activity and greater global trading volumes. We expect customer activity and trading volumes to gradually decrease our consolidated financial statements in 2021 and to normalize in 2022, as the volatility surrounding COVID-19 begins to decline. Any decreases in customer activity and trading volumes will have a corresponding effect on Bernstein Research services revenue. Furthermore, all of 2020 reflects the inclusion of revenues from our acquisition of Autonomous (which closed on April 1, 2019)Item 8.
Revenues from Bernstein Research Services decreased $31.5$30.1 million, or 7.2%, in 2019.2023. The decrease was due toprimarily driven by significantly lower global customer trading activity due to the prevailing macro-economic environment.
Revenues from Bernstein Research Services decreased $35.7 million, or 7.9%, in 2022. The decrease was driven by significantly lower customer trading activity in Europe and trading commissions, partially offset by the inclusion of revenues from our acquisition of Autonomous (which closed on April 1, 2019).Asia due to local market conditions.
Distribution Revenues
Two of our subsidiaries act as distributors and/or placement agents of company-sponsored mutual funds and receive distribution services fees from certain of those funds as full or partial reimbursement of the distribution expenses they incur. Period-over-period fluctuations of distribution revenues typically are in line with fluctuations of the corresponding average AUM of these mutual funds.
Distribution revenues increased $74.7decreased $20.9 million, or 16.4%3.4%, in 2020,2023, primarily due to a shift in product mix from mutual funds with higher distribution rates to mutual funds with lower distribution rates, as well as a 1.4% decrease in the corresponding average AUM of these mutual funds. Distribution revenues decreased $45.0 million, or 6.9%, in 2022, primarily due to the corresponding average AUM of these mutual funds increasing 13.2%. Distribution revenues increased $36.5 million, or 8.7%decreasing 12.4%, in 2019, primarily due to the corresponding average AUM of these mutual funds increasing 10.0%,partially offset by the impact of a shift in product mix from mutual funds that have higherwith lower distribution rates to mutual funds with lowerhigher distribution rates.
Dividend and Interest Income and Interest Expense
Dividend and interest income consists primarily of investment income and interest earned on customer margin balances and U.S. Treasury Bills as well as dividend and interest income in our consolidated company-sponsored investment funds. Interest expense principally reflects interest accrued on cash balances in customers’ brokerage accounts.
Dividend and interest income decreased $53.5increased $76.4 million, or 51.2%62.0%, in 2020,2023, primarily due to lowerhigher interest earned on customer margin balances and higher interest earned on U.S. Treasury Bills, as well as lower dividend and interest income in our consolidated company-sponsored investment funds.Bills. Interest expense decreased $41.6increased $41.1 million or 72.6%, in 2020,2023, due to lowerhigher interest paid on cash balances in customers' brokerage accounts.
Dividend and interest income increased $6.2$84.4 million or 6.3%, in 2019,2022, primarily due to higher interest earned on customer margin balances, andhigher interest earned on U.S. Treasury Bills offset by loweras well as higher dividend and interest income in our consolidated company-sponsored investment funds. Interest expense increased $4.8$62.8 million, or 9.2%, in 2019,2022, due to higher interest paid on cash balances in customers' brokerage accounts.
Investment Gains (Losses)
Investment gains (losses) consist primarily of realized and unrealized investment gains or losses on: (i) employee long-term incentive compensation-related investments, (ii) U.S. Treasury Bills, (iii) market-making in exchange-traded options and equities, (iv) seed capital investments, (v) derivatives and (vi) investments in our consolidated company-sponsored investment funds. Investment gains (losses) also include equity in earnings of proprietary investments in limited partnership hedge funds that we sponsor and manage.
Investment gains (losses) are as follows:
| | | | Years Ended December 31, | | Years Ended December 31 |
| | | 2020 | | 2019 | | 2018 | | 2023 | 2022 | 2021 |
| | | (in thousands) | | (in thousands) |
| Long-term incentive compensation-related investments: | Long-term incentive compensation-related investments: | |
| Realized gains | Realized gains | $ | 2,655 | | | $ | 1,672 | | | $ | 2,512 | |
| Unrealized gains (losses) | 2,914 | | | 5,859 | | | (8,032) | |
| Realized gains | |
| Realized gains | |
| Unrealized (losses) gains | |
| | | Investments held by consolidated company-sponsored investment funds: | Investments held by consolidated company-sponsored investment funds: | |
| Realized gains (losses) | 3,357 | | | 9,378 | | | (1,134) | |
| Unrealized (losses) gains | (854) | | | 36,150 | | | 14,217 | |
| | Investments held by consolidated company-sponsored investment funds: | |
| | Investments held by consolidated company-sponsored investment funds: | |
| Realized (losses) | |
| Realized (losses) | |
| Realized (losses) | |
| Unrealized gains (losses) | |
| | Seed capital investments: | Seed capital investments: | | |
| Realized gains (losses) | | |
| Seed capital investments: | |
| Seed capital investments: | |
| Realized (losses) gains | |
| Realized (losses) gains | |
| Realized (losses) gains | |
| Seed capital and other | |
| Seed capital and other | |
| Seed capital and other | Seed capital and other | 25,002 | | | 17,301 | | | (943) | |
| Derivatives | Derivatives | (30,343) | | | (30,320) | | | 7,001 | |
| Unrealized (losses) gains | | |
| Unrealized gains (losses) | |
| Seed capital and other | |
| Seed capital and other | |
| Seed capital and other | Seed capital and other | (12,387) | | | 7,510 | | | (15,003) | |
| Derivatives | Derivatives | (5,220) | | | (8,013) | | | 5,384 | |
| | Brokerage-related investments: | Brokerage-related investments: | | |
| Brokerage-related investments: | |
| Brokerage-related investments: | |
| Realized (losses) | |
| Realized (losses) | |
| Realized (losses) | Realized (losses) | (1,188) | | | (1,209) | | | (1,410) | |
| Unrealized (losses) gains | Unrealized (losses) gains | (337) | | | 331 | | | 61 | |
| | | $ | (16,401) | | | $ | 38,659 | | | $ | 2,653 | |
Other Revenues
Other revenues consist of fees earned for transfer agency services provided to company-sponsored mutual funds, fees earned for administration and recordkeeping services provided to company-sponsored mutual funds and the general accountsGeneral Accounts of EQH and its subsidiaries, and other miscellaneous revenues. Other revenues increased $7.1decreased $4.2 million, or 7.3%4.0%, in 2020, primarily due to higher shareholder servicing fees, higher brokerage income and higher mutual fund reimbursements, partially offset by lower investment income related to our consolidated company-sponsored investment funds. Other revenues decreased $1.1 million, or 1.1%, in 2019,2023, primarily due to lower brokerage incomeshareholder servicing fees and lower investmentbrokerage income, related to our consolidated company-sponsored investment funds, partially offset by higher mutual fund reimbursements. Other revenues decreased $2.9 million, or 2.6%, in 2022, primarily due to lower shareholder servicing fees.
Expenses
The components of expenses are as follows:
| | | | Years Ended December 31, | | % Change | | Years Ended December 31 | | % Change |
| | | 2020 | | 2019 | | 2018 | | 2020-19 | | 2019-18 | | 2023 | 2022 | 2021 | | 2023-22 | 2022-21 |
| | | (in thousands) | | | | | | (in thousands) | | | |
| Employee compensation and benefits | Employee compensation and benefits | $ | 1,494,198 | | | $ | 1,442,783 | | | $ | 1,378,811 | | | 3.6 | % | | 4.6 | % | Employee compensation and benefits | | 1,769,153 | | | $ | | $ | 1,666,636 | | | $ | | $ | 1,716,013 | | | 6.2 | | 6.2 | % | (2.9 | %) |
| Promotion and servicing: | Promotion and servicing: | | | | | | | | | | Promotion and servicing: | | | | | |
| Distribution-related payments | Distribution-related payments | 569,283 | | | 487,965 | | | 427,186 | | | 16.7 | | | 14.2 | |
| Amortization of deferred sales commissions | Amortization of deferred sales commissions | 27,355 | | | 15,029 | | | 21,343 | | | 82.0 | | | (29.6) | |
| Trade execution, marketing, T&E and other | Trade execution, marketing, T&E and other | 189,787 | | | 219,860 | | | 222,630 | | | (13.7) | | | (1.2) | |
| | | 786,425 | | | 722,854 | | | 671,159 | | | 8.8 | | | 7.7 | |
| General and administrative: | | | | | | | | | |
| General and administrative | General and administrative | 485,544 | | | 484,750 | | | 448,996 | | | 0.2 | | | 8.0 | |
| Real estate charges | 5,526 | | | 3,324 | | | 7,160 | | | 66.2 | | | (53.6) | |
| | | 491,070 | | | 488,074 | | | 456,156 | | | 0.6 | | | 7.0 | |
| Contingent payment arrangements | |
| Contingent payment arrangements | |
| Contingent payment arrangements | Contingent payment arrangements | 1,855 | | | (510) | | | (2,219) | | | n/m | | (77.0) | |
| Interest on borrowings | Interest on borrowings | 6,180 | | | 13,035 | | | 10,359 | | | (52.6) | | | 25.8 | | Interest on borrowings | | 54,394 | | | 17,906 | | 17,906 | | | 5,145 | | 5,145 | | | n/m | | n/m | n/m |
| Amortization of intangible assets | Amortization of intangible assets | 21,372 | | | 28,759 | | | 27,781 | | | (25.7) | | | 3.5 | | Amortization of intangible assets | | 46,854 | | | 26,564 | | 26,564 | | | 5,697 | | 5,697 | | | 76.4 | | 76.4 | | n/m | n/m |
| Total | Total | $ | 2,801,100 | | | $ | 2,694,995 | | | $ | 2,542,047 | | | 3.9 | | | 6.0 | | Total | | $ | 3,337,653 | | | $ | | $ | 3,239,194 | | | $ | | $ | 3,225,140 | | | 3.0 | | 3.0 | % | 0.4 | % |
Employee Compensation and Benefits
Employee compensation and benefits consist of base compensation (including salaries and severance), annual short-term incentive compensation awards (cash bonuses), annual long-term incentive compensation awards, commissions, fringe benefits and other employment costs (including recruitment, training, temporary help and meals).
Compensation expense as a percentage of net revenues was 40.3%42.6%, 41.0%41.1% and 40.9%38.6% for the years ended December 31, 2020, 20192023, 2022 and 2018,2021, respectively. Compensation expense generally is determined on a discretionary basis and is primarily a function of our firm’s current-year financial performance. The amounts of incentive compensation we award are designed to motivate, reward and retain top talent while aligning our executives' interests with the interests of our Unitholders. Senior management, together with the approval of the Compensation and Workplace Practices Committee of the Board of Directors of AllianceBernstein Corporation (“Compensation Committee”), periodically confirmscontinue to believe that the appropriate metric to consider in determining the amount of incentive compensation is the ratio of adjusted employee compensation and benefits expense to adjusted net revenues. Adjusted net revenues used in the adjusted compensation ratio are the same as the adjusted net revenues presented as a non-GAAP measure (discussed earlier in this Item 7). Adjusted employee compensation and benefits expense is total employee compensation and benefits expense minus other employment costs such as recruitment, training, temporary help and meals (which were 0.9%1.1%, 1.2%1.1% and 1.1%0.9% of adjusted net revenues for 2020, 20192023, 2022 and 2018,2021, respectively), and excludes the impact of mark-to-market vesting expense, as well as dividends and interest expense, associated with employee long-term incentive compensation-related investments and the amortization expense associated with the awards issued by EQH to some of our firm's CEOexecutives relating to his roletheir roles as a membermembers of the EQH Management Committee. Senior management, with the approval of the Compensation Committee, has established as an objective that adjusted employee compensation and benefits expense, excluding the impact of performance-based fees, generally should not exceed 50% of our adjusted net revenues in any year, except in unexpected or unusual circumstances. Our ratios of adjusted compensation expense as a percentage of adjusted net revenues were 47.9%49.0%, 47.9%48.4% and 47.5%46.5%, respectively, for the years ended December 31, 2020, 20192023, 2022 and 2018.2021.
In 2020,2023, employee compensation and benefits expense increased $51.4$102.5 million, or 3.6%, primarily due to higher incentive compensation of $58.8 million and higher base compensation of $13.5 million (primarily higher base salaries), offset by lower fringes of $8.5 million, lower commissions of $6.2 million and lower other employment costs of $6.2 million. In 2019, employee compensation and benefits expense increased $64.0 million, or 4.6%6.2%, primarily due to higher base compensation of $34.1$72.2 million, (primarily higher salaries), higher incentive compensation of $17.4$51.7 million and higher fringes of $15.6$7.8 million, partially offset by lower commissions of $3.2$29.0 million. In 2022, employee compensation and benefits expense decreased $49.4 million, or 2.9%, primarily due to lower incentive compensation of $107.7 million, partially offset by higher base compensation of $39.8 million, higher commissions of $12.7 million and higher other employment costs of $5.3 million.
Promotion and Servicing
Promotion and servicing expenses include distribution-related payments to financial intermediaries for distribution of AB mutual funds and amortization of deferred sales commissions paid to financial intermediaries for the sale of back-end load shares of AB mutual funds. Also included in this expense category are costs related to trade execution and clearance, travel and entertainment, advertising and promotional materials.
Promotion and servicing expenses increased $63.6decreased $17.1 million, or 8.8%1.9%, in 2020.2023. The increase primarilydecrease was due to higherlower distribution-related payments of $81.3 million, higher amortization of deferred sales commissions of $12.3 million, higher trade execution and clearance expenses of $7.9 million and higher transfer fees of $4.8 million, offset by lower travel and entertainment expenses of $34.3 million and lower marketing expenses of $8.4 million. The decrease in travel and entertainment and marketing expense is primarily a result of cost savings associated with the COVID-19 pandemic and we expect these costs to increase in 2021 and further normalize in 2022, as the pandemic recedes. Promotion and servicing expenses increased $51.7 million, or 7.7%, in 2019. The increase primarily was due to higher distribution-related payments of $60.8 million and higher travel and entertainment expenses of $3.2 million, offset by lower amortization of deferred sales commissions of $6.3$19.2 million, lower trade execution and clearance expenses of $3.7$9.0 million and lower marketingtransfer fees of $3.0 million, offset by higher travel and entertainment expenses of $2.5$8.5 million, higher marketing and communication expenses of $3.5 million and higher amortization of deferred sales commissions of $2.1 million. Promotion and servicing expenses decreased $60.1 million, or 6.4%, in 2022. The decrease was primarily due to lower distribution-related payments of $78.5 million, lower transfer fees of $4.9 million and lower trade execution and clearance expenses of $3.1 million, partially offset by higher travel and entertainment expenses of $15.4 million and higher firm meeting expenses of $8.8 million.
General and Administrative
General and administrative expenses include portfolio services expenses,fees, technology expenses,fees, professional fees and office-related expenses (occupancy, communications and similar expenses). General and administrative expenses as a percentage of net revenues were 13.2% (13.1% excluding real estate charges)14.0%, 13.9% (13.8% excluding real estate charges)15.8% and 13.5% (13.3% excluding real estate charges)12.5% for the years ended December 31, 2020, 20192023, 2022 and 2018,2021, respectively. General and administrative expenses increased $3.0decreased $60.1 million, or 0.6%9.4%, during 2020,in 2023. The decrease was primarily due to higher technologylower portfolio services fees of $4.7$43.7 million, higher charitable contributions of $3.9 million, higher portfolio servicelower professional fees of $3.6$18.0 million, higher real estate chargeslower valuation adjustments related to the classification of $2.2Bernstein Research Services as held for sale of $6.0 million and higher other taxesa favorable foreign exchange translation impact of $1.6$5.7 million, partially offset by lower professional fees of $9.1 million and lowerhigher office-related expenses of $3.5$7.4 million. General and administrative expenses increased $31.9$86.0 million, or 7.0%15.5%, during 2019,in 2022. The increase was primarily due to higher portfolio serviceprofessional fees of $11.2$27.3 million, higher portfolio services fees of $21.3 million, higher technology fees of $11.0$19.1 million, a valuation adjustment of $7.4 million associated with the classification of BRS as held for sale, higher office-related expenses of $6.9 million and higher professional feesa $5.6 million impairment of $7.0 million.certain acquisition related intangible assets.
Contingent Payment Arrangements
Contingent payment arrangements reflect changes in estimates of contingent payment liabilities associated with acquisitions in current and previous periods, as well as accretion expense of these liabilities. The expense of $1.9For the years ended December 31, 2023, 2022 and 2021, we recognized $8.8 million, for 2020 reflects$6.6 million and $3.3 million, respectively, in accretion expense of $3.3 million, offset by therelated to our contingent considerations payable. During 2023, we recorded a change in estimate ofrelated to the contingent consideration payable relating to our 2016liability associated with the acquisition of $1.4Autonomous LLC in 2019 of $14.1 million. The credit of $0.5 million for 2019 reflects the change in estimate ofwas based upon better than expected revenues during the 2023 performance evaluation period. There were no changes in our estimates during the year ended December 31, 2022. During 2021, we recorded a change in estimate related to the contingent consideration payable relating to our 2016liability associated with the acquisition of $3.1 million, offset by accretion expensesRamius Alternative Solutions LLC of $2.6$0.6 million. The creditDue to the loss of $2.2 million for 2018 reflectsacquired investment management contracts, the change in estimatecarrying value of the finite-lived intangible assets exceeded the fair value of the contracts. These expenses resulting from changes to expected payments and the accretion of these obligations to their expected payment amounts are reflected within contingent consideration payable relating topayment arrangements in our 2016 acquisitionconsolidated statements of $2.4 million, offset by accretion expenses of $0.2 million.income.
Interest on Borrowings
Interest expense decreased 52.6%increased $36.5 million in 2020,2023, reflecting lowerhigher interest rates partially offset byon borrowings and higher weighted average borrowings. Average daily borrowings for both the EQH facilityfacilities and commercial paper were $554.0$1,014 million at a weighted average interest rate of 0.5%5.1% during 20202023 compared to $436.9$845.5 million and 2.5%1.7% during 2019. 2022.
Interest expense increased 25.8%$12.8 million in 2019,2022, reflecting bothhigher interest rates on borrowings and higher weighted average borrowings and interest rates.borrowings. Average daily borrowings for both the EQH facilityfacilities and commercial paper were $436.9$845.5 million at a weighted average interest rate of 2.5%1.7% during 20192022 compared to $350.3$561.6 million and 2.0% for commercial paper0.2% during 2018.2021.
Amortization of Intangible Assets
Amortization of intangible assets reflects our amortization of costs assigned to acquired investment management contracts with a finite life. These assets are recognized at fair value and generally are amortized on a straight-line basis over their estimated useful life. On July 1, 2022, AB acquired CarVal Investors L.P. ("CarVal"), which resulted in recording of $303.0 million of finite-lived intangible assets primarily relating to investment management contracts and investor relationships with useful lives ranging from 5 to 10 years (see Note 24 Acquisitions and Divestitures to our consolidated financial statements in Item 8). Amortization of intangible assets increased $20.3 million in 2023. The increase was primarily due to the acquired intangible assets associated with the CarVal acquisition. Amortization of intangible assets increased $20.9 million in 2022. The increase was primarily due to the acquired intangible assets associated with the CarVal acquisition.
Income Taxes
AB, a private limited partnership, is not subject to federal or state corporate income taxes. However, AB is subject to a 4.0% New York City unincorporated business tax (“UBT”). Our domestic corporate subsidiaries are subject to federal, state and local income taxes, and generally are included in the filing of a consolidated federal income tax return. Separate state and local income tax returns also are filed. Foreign corporate subsidiaries generally are subject to taxes in the jurisdictions where they are located.
Income tax expense increased $3.9 million, or 9.3%, in 2020 compared to 2019. This increase is due to higher pre-tax book income, offset by a slightly lower effective tax rate in 2020 of 5.0% compared to 5.1% in 2019. The decrease in our effective tax rate was driven by a reduction of one-time discrete items.
Income tax expense decreased $4.1$10.6 million, or 8.9%26.7%, in 20192023 compared to 2018.2022. This decrease is primarily driven by a one time tax benefit of $22.4 million resulting from the release of a valuation allowance on a capital loss tax asset due to a tax planning action identified in the fourth quarter of 2023, due to a future restructuring of certain foreign subsidiaries that would not have a material impact on AB operations. This resulted in a lower effective tax rate in 20192023 of 5.1%3.6% compared to 5.6%4.9% in 2018. The2022.
Income tax expense decreased $23.1 million, or 36.8%, in 2022 compared to 2021. This decrease is due to lower pre-tax book income and one-time discrete items which resulted in oura lower effective tax rate was driven by a more favorable mixin 2022 of earnings across the AB tax filing groups and a reduction of one-time discrete items.4.9% compared to 5.2% in 2021.
Net Income (Loss) of Consolidated Entities Attributable to Non-Controlling Interests
Net income (loss) of consolidated entities attributable to non-controlling interests primarily consists of limited partner interests owned by other investors in our consolidated company-sponsored investment funds. In 2020,2023, we had $4.2$24.0 million of net lossesincome of consolidated entities attributable to non-controlling interests, primarily due to gains on investments held by our consolidated company-sponsored investment funds. In 2022, we had $56.4 million of net loss of consolidated entities attributable to non-controlling interests, primarily due to losses on investments held by our consolidated company-sponsored investment funds. In 2019 and 2018,2021 we had $29.6$5.1 million and $21.9 million, respectively, of net gainsincome of consolidated entities attributable to non-controlling interests, primarily due to gains on investments held by our consolidated company-sponsored investment funds. Fluctuations period-to-period result primarily from the number of consolidated company-sponsored investment funds and their respective market performance.
Capital Resources and Liquidity
Cash flows from operating activities primarily include the receipt of investment advisory and services fees and other revenues offset by the payment of operating expenses incurred in the normal course of business. Our cash flows from operating activities have historically been positive and sufficient in supportingto support our operations. We do not anticipate this to change in the foreseeable future. Cash flows from investing activities generally consist of small capital expenditures and, when applicable, business acquisitions. Cash flows from financing activities primarily consist of issuance and repayment of debt and the repurchase of AB Holding units to fund our long-term deferred compensation plans. We are required to distribute all of our Available Cash Flow to our Unitholders and the General Partner.
During 2020,2023, net cash provided by operating activities was $1.5$0.9 billion, compared to $827.5 million$1.1 billion during 2019.2022. The change primarily was due to net activity of our consolidated company-sponsored investment funds of $468.2 million, an increase in broker-dealer related payables (netfees receivable of receivable and segregated U.S. Treasury Bills activity)$161.1 million, lower earnings of $368.0$159.9 million a decrease in other assets of $92.3 million, an increase in accounts payable and accrued expenses of $67.2 million and an increase in accrued compensation of $54.4 million, partially offset by higher net purchases of broker-dealer investments of $454.1 million.During 2019, net cash provided by operating activities was $827.5 million, compared to $1.3 billion during 2018. The change primarily was due to(after non-cash reconciling items), a decrease in broker-dealer related payables (net of receivable and segregated U.S. Treasury Bills activity) of $754.8$133.3 million and an increase in deferred sales commissions of $59.8 million, partially offset by net activity of our consolidated company-sponsored investment funds of $427.6$166.0 million and an increase in accrued compensation of $127.4 million.During 2022, net cash provided by operating activities was $1.1 billion, compared to $1.3 billion during 2021. The change primarily was due to lower earnings of $265.1 million (after non-cash reconciling items), a decrease in accrued compensation of $200.8 million and a decrease in broker-dealer related payables (net of receivable and segregated U.S. Treasury Bills activity) of $169.2 million, partially offset by lower net purchasesactivity of broker-dealer investmentsour consolidated company-sponsored investment funds of $754.7$252.0 million and an increase in fees receivable of $193.3 million.
During 2020,2023, net cash used in investing activities was $59.1$33.6 million, compared to $23.0$22.0 million during 2019.2022. The change is primarily due to $13.6 millions paid for acquisitions,the acquisition of CarVal, net of cash acquired $4.1of $40.3 million paid for equity method investments and higherin 2022, partially offset by lower purchases of furniture, equipment and leasehold improvements of $13.2$28.7 million. During 2019,2022, net cash used in investing activities was $23.0$22.0 million, compared to $32.8$65.7 million during 2018.2021. The change is primarily due to the acquisition of Autonomous,CarVal, net of cash acquired of $5.3$40.3 million in 2022.
During 2023, net cash used in financing activities was $1.0 billion, compared to $1.1 billion during 2022. The change reflects lower cash distributions to Unitholders of $230.6 million, a decrease in the net purchases of AB Holding Units to fund long-term incentive compensation plans of $66.5 million and the repayment of CarVal debt of $42.7 million, partially offset by higher net purchases of non-controlling interests of consolidated company-sponsored investment funds of $187.1 million and lower net borrowings of debt of $70.7 million.
During 2020,2022, net cash used in financing activities was $1.1 billion, compared to $775.0 million$0.9 billion during 2019.2021. The change reflects higher redemptions of non-controlling interests of consolidated company-sponsored investment funds of $369.1 million and higher distributions to the General Partner and Unitholders of $133.4 million, partially offset by higher net proceeds of debt of $112.9 million and an increase in overdrafts payable of $47.3 million.During 2019, net cash used in financing activities was $775.0 million, compared to $1.6 billion during 2018. The change reflects thelower net purchases of non-controlling interests of consolidated company-sponsored investment funds in 2019 as compared to net redemptions2022 of non-controlling interests$309.9 million, repayment of consolidated company-sponsored investment funds in 2018 (impactCarVal debt of $622.2 million), lower distributions to the General Partner and Unitholders of $154.7$42.7 million and lowera decrease in overdrafts payable of $41.6 million, partially offset by higher net borrowings of debt of $155.0 million and a decrease in the net purchases of AB Holding Units to fund long-term incentive compensation plan awardsplans of $95.5$51.3 million.
As of December 31, 2020,2023, AB had $1.0 billion of cash and cash equivalents (excluding cash and cash equivalents of consolidated company-sponsored investment funds)funds and cash held-for-sale), all of which is available for liquidity but consist primarily of cash on deposit for our broker-dealers related to various customer clearing activities and cash held by foreign subsidiaries of $586.3$585.8 million.
Part II
Debt and Credit Facilities
See Note 12 to our consolidated financial statements in Item 8 for disclosures relating to our debt and credit facilities. We use our debt and credit facilities to seed certain new investment products which may expose us to market risk, credit risk and material gains and losses. To reduce our exposure, we enter into various futures, forwards, options and swaps primarily to economically hedge certain of our seed money investments. While in most cases broad market risks are hedged and are effective in reducing our exposure, our hedgers are imperfect and we may remain exposed to some market risk and credit-related losses in the event of non-performance by counterparties on these derivative instruments.
Our financial condition and access to public and private debt markets should provide adequate liquidity for our general business needs. Management believes that cash flow from operations and the issuance of debt and AB Units or AB Holding Units will provide us with the resources we need to meet our financial obligations. See “Risk Factors” in Item 1A and “Cautions Regarding Forward-Looking Statements” in this Item 7 for a discussion of credit markets and our ability to renew our credit facilities at expiration.
Off-Balance Sheet Arrangements and Aggregate Contractual Obligations
Guarantees
Under various circumstances, AB guarantees the obligations of its consolidated subsidiaries.
AB maintains guaranteesa guarantee in connection with the Credit Facilityan $800 million committed, unsecured senior revolving credit facility (the "Credit Facility") and Revolver (the "Revolver"). If SCB LLC is unable to meet its obligations, AB will pay the obligations when due or on demand. In addition,SCB LLC currently has five uncommitted lines of credit with five financial institutions. Four of these lines of credit permit us to borrow up to an aggregate of approximately $315.0 million, with AB named as an additional borrower, while the other line has no stated limit. AB has guaranteed the obligations of SCB LLC under these lines of credit. AB maintains guarantees totaling $365.0$415.0 million for SCB LLC’s threefive uncommitted lines of credit.
AB maintains a guarantee with a commercial bank, under which we guarantee the obligations in the ordinary course of business of each of SCB LLC, our U.K.-based broker-dealer and our Cayman subsidiary. We also maintain three additional guarantees with other commercial banks under which we guarantee approximately $294.7$270.9 million of obligations for our U.K.-based broker-dealer and $99.0 million of obligations for our India-based broker-dealer. In the event that any of these three entities is unable to meet its obligations, AB will pay the obligations when due or on demand.
We also have two smaller guarantees with a commercial bank totaling approximately $2.1$1.9 million, under which we guarantee certain obligations in the ordinary course of business of one of our foreign subsidiaries.
We have not been required to perform under any of the above agreements and currently have no liability in connection with these agreements.
Aggregate Contractual Obligations
Our contractualWe have various compensation and benefit obligations, including accrued salaries and fringes, commissions, payroll taxes, incentive payments and deferred compensation arrangements. The majority of our compensation and benefits obligations are paid out in less than one year, while the deferred compensation obligations are payable over various periods, with the majority payable over periods of up to three years. Accrued compensation and benefits as of December 31, 2020 are as follows:
| | | | | | | | | | | | | | | | | | | | | | | | | | | | | |
| Payments Due by Period |
| Total | | Less than 1 Year | | 1-3 Years | | 3-5 Years | | More than 5 Years |
| (in millions) |
| EQH credit facility | $ | 675.0 | | | $ | 675.0 | | | $ | — | | | $ | — | | | $ | — | |
| Leases, net of sublease commitments | 851.4 | | | 79.9 | | | 137.2 | | | 107.7 | | | 526.6 | |
| Funding commitments | 9.1 | | | 9.1 | | | — | | | — | | | — | |
| Accrued compensation and benefits | 309.3 | | | 221.7 | | | 63.9 | | | 10.4 | | | 13.3 | |
| FIN 48 reserve | 2.8 | | | — | | | — | | | 2.8 | | | — | |
| Federal transition tax | 14.9 | | | 1.6 | | | 4.6 | | | 8.7 | | | — | |
| Total | $ | 1,862.5 | | | $ | 987.3 | | | $ | 205.7 | | | $ | 129.6 | | | $ | 539.9 | |
During 2010, as general partner of AllianceBernstein U.S. Real Estate L.P. (“Real Estate Fund”), we committed to invest $25.0 million in the Real Estate Fund. As of December 31, 2020, we had funded $22.4 million of this commitment. During 2014, as general partner of AllianceBernstein U.S. Real Estate II L.P. (“Real Estate Fund II”), we committed to invest $27.3 million, as amended in 2020, in the Real Estate Fund II. As of December 31, 2020, we had funded $20.8 million of this commitment.
Accrued compensation and benefits amounts in the table above exclude2023 totaled $354.5 million. This amount excludes our accrued pension obligation. Offsetting our accrued compensation obligations are long-term incentive compensation-related investments and money market investments we funded totaling $67.0$41.1 million, which are included in our consolidated statement of financial condition. Any amounts reflected on the
consolidated statement of financial condition as payables (to broker-dealers, brokerage clients and company-sponsored mutual funds) and accounts payable and accrued expenses (excluding the tax obligations above) are excluded from the table above.aforementioned accrued compensation and benefits obligation amount.
We expect to make contributions to our qualified profit sharing plan of approximately $15$19.0 million in each of the next four years. We do not currently anticipate that we will contribute to the Retirement Plan during 2021.
The 2017 Tax Act (enacted in the U.S. on December 22, 2017) imposed a federal transition tax on mandatory deemed repatriation of certain deferred foreign earnings. Management elected to pay the transition tax in installments over an eight-year period from 2018 to 2025. The federal transition tax obligation as of December 31, 2023 totaled $8.7 million and is recorded to income tax payable on our consolidated statement of financial condition. See Note 2021 to our consolidated financial statements in Item 8 for further discussion of our taxes.
During October 2018, we signed a lease, which commenced in the fourth quarter of 2020, relating to 218,976 square feet of space at our newly constructed Nashville headquarters. Our estimated total base rent obligation (excluding taxes, operating expenses and utilities) over the 15-year initial lease term is $134.0 million. During April 2019, we signed a lease, which commences in 2024, relating to approximately 190,000 square feet of newly constructed space in New York City. Our estimated total base rent obligation (excluding taxes, operating expenses and utilities) over the 20-year lease term is approximately $448.0 million. During the fourth quarter of 2020, we exercised an option to return a half floor of this space, which reduced our square footage from approximately 190,000 to 166,000 square feet and our base rent obligation from $448.0 million to $393.0 million. See Note 13 to our consolidated financial statements in Item 8 for discussion of our leases.
See Note 12 to our consolidated financial statements in Item 8 for a discussion of our debt.
See Note 14 to our consolidated financial statements in Item 8 for a discussion of our commitments and contingencies.
| | |
|
| Critical Accounting Estimates |
|
The preparation of the consolidated financial statements and notes to consolidated financial statements requires management to make estimates and judgments that affect the reported amounts of assets, liabilities, revenues and expenses.
Management believes that the critical accounting policies and estimates discussed below involve significant management judgment due to the sensitivity of the methods and assumptions used.
Goodwill
Our acquisitions are accounted for under the acquisition method of accounting, where the cost of the acquisition is allocated on the basis of the estimated fair value of the assets acquired and the liabilities assumed. The excess of the purchase price over the fair value of identifiable assets acquired, net of liabilities assumed, results in the recognition of goodwill.
As of December 31, 2020,2023, we had goodwill of $3.1$3.6 billion on the consolidated statement of financial condition, which included $666.1 million as a result of the CarVal Investors L.P. ("CarVal") acquisition in the third quarter of 2022, $2.8 billion as a result of the Sanford C. Bernstein Inc. (“Bernstein”) acquisition in 2000 and $291.9 million in regard to various smaller acquisitions. Approximately $159.8 million of goodwill has been classified as assets held for sale on the consolidated statement of financial condition. For further discussion, see Note 24 Acquisitions and Divestitures in Item 8 to these consolidated financial statements.
We have determined that AB has only one reporting segment and reporting unit. We test our goodwill annually, as of September 30, for impairment. As of September 30, 2020, the impairment test indicated that goodwill was not impaired.or if certain events or changes in circumstances occur and trigger an interim impairment test. The carrying value of goodwill is also reviewed if facts and circumstances occur that suggest possible impairment, such as, but not limited to significant transactions including acquisitions or divestitures and significant declines in AUM, revenues, earnings or the price of an AB Holding Unit.
On an annual basis, or when circumstances warrant, goodwill is tested for impairment utilizing the market approach where the fair value of the reporting unit is based on its unadjusted market valuation (AB Units outstanding multiplied by AB Holding's Unit price) and earnings multiples. The price of a publicly-traded AB Holding Unit serves as a reasonable starting point for valuing an AB Unit because each represents the same fractional interest in our underlying business. Our market approach analysis also includes comparable industry earnings multiples applied to our earnings forecast and assumes a control premium (when applicable).
Throughout the year, the carrying value of goodwill is also reviewed for impairment if certain events or changes in circumstances occur, and trigger whether an interim impairment test may be required. Such changes in circumstances may include, but are not limited to, a sustained decrease in the price of an AB Unit or declines in AB’s market capitalization that would suggest that the fair value of the reporting unit is less than the carrying amount; significant and unanticipated declines in AB’s assets under management or revenues; and/or lower than expected earnings per unit. Any of these changes in circumstances could suggest the possibility that goodwill is impaired, but none of these events or circumstances by itself would indicate that it is more likely than not that goodwill is impaired. Instead, they are merely recognized as triggering events for the consideration of impairment and must be viewed in combination with any mitigating or positive factors. A holistic evaluation of all events since the most recent quantitative impairment test must be done to determine whether it is more likely than not that the reporting unit is impaired.
As of January 1, 2020,For our annual impairment test, we adopted ASU 2017-04, Simplifyingutilize the Test for Goodwill Impairment. The guidance removed Step 2market approach where the fair value of the reporting unit is based on its unadjusted market valuation (AB Units outstanding multiplied by AB Holding's Unit price) and earnings multiples. A goodwill impairment test, which had required a hypothetical purchase price allocation. As a result of the revised guidance, a goodwill impairment willwould be the amount by which a reporting unit's carrying value exceeds its fair value, not to exceed the carrying amount of goodwill. Under this guidance, theThe goodwill impairment test no longer includesdoes not include a determination by management of whether a decline in fair value is temporary; however,temporary and it is important to considerthat management's determination of fair value reflect the impact of changing market conditions, including the severity and anticipated duration of any such changes. The price of a publicly traded AB Holding Unit serves as a reasonable starting point for valuing an AB Unit because each represents the same fractional interest in our underlying business. Our market approach analysis also includes comparable industry earnings multiples applied to our earnings forecast and assumes a control premium (when applicable).
Contingent Payment Arrangements
We periodically enter into contingent payment arrangements in connection with our business combinations. In these arrangements, we agree to pay additional consideration to the sellers to the extent that certain performance targets are achieved. We estimate the fair value of these potential future obligations at the time a business combination is consummated and record a liability on a discounted basis on our consolidated statement of financial condition. We then accrete the obligation to its expected payment amount over the measurement period. If our expected payment amount subsequently changes, the obligation is modified in the current period resulting in a gain or loss. Both gains and losses resulting from changes to expected payments and the accretion of these obligations to their expected payment amounts are reflected within contingent payment arrangements in management's determinationour consolidated statements of fair value.income.
For contingent liabilities, we typically use a valuation method that is a form of the income approach, whereby a forecast of future cash flows attributable to the asset are discounted to present value using a risk-adjusted discount rate. We develop a forecast of future cash flows attributable to the performance objectives that are then discounted to present value using a risk-adjusted discount rate. Some of the more significant estimates and assumptions inherent in the income approach include the amount and timing of projected future cash flows, the discount rate selected to measure the risks inherent in the future cash flows.
Loss Contingencies
Management continuously reviews with legal counsel the status of regulatory matters and pending or threatened litigation. We evaluate the likelihood that a loss contingency exists and record a loss contingency if it is both probable and reasonably estimable as of the date of the financial statements. See Note 14 to our consolidated financial statements in Item 8.
Accounting Pronouncements
See Note 2 to our consolidated financial statements in Item 8.
Cautions Regarding Forward-Looking Statements
Certain statements provided by management in this report are “forward-looking statements” within the meaning of the Private Securities Litigation Reform Act of 1995. Such forward-looking statements are subject to risks, uncertainties and other factors that could cause actual results to differ materially from future results expressed or implied by such forward-looking statements. The most significant of these factors include, but are not limited to, the following: the performance of financial markets, the investment performance of sponsored investment products and separately-managedseparately managed accounts, general economic conditions, industry trends, future acquisitions, integration of acquired companies, competitive conditions and government regulations, including changes in tax regulations and rates and the manner in which the earnings of publicly-traded partnerships are taxed. We caution readers to carefully consider such factors. Further, these forward-looking statements speak only as of the date on which such statements are made; we undertake no obligation to update any forward-looking statements to reflect events or circumstances after the date of such statements. For further information regarding these forward-looking statements and the factors that could cause actual results to differ, see “Risk Factors” in Item 1A. Any or all of the forward-looking statements that we make in this Form 10-K, other documents we file with or furnish to the SEC, and any other public statements we issue, may turn out to be wrong. It is important to remember that other factors besidesthose listed in “Risk Factors” and those listed below could also adversely impact our revenues, financial condition, results of operations and business prospects.
The forward-looking statements referred to in the preceding paragraph,, most of which directly affect AB but also affect AB Holding because AB Holding’s principal source of income and cash flow is attributable to its investment in AB, include statements regarding:
•Our belief that the cash flow AB Holding realizes from its investment in AB will provide AB Holding with the resources it needs to meet its financial obligations:AB Holding’s cash flow is dependent on the quarterly cash distributions it receives from AB. Accordingly, AB Holding’s ability to meet its financial obligations is dependent on AB’s cash flow from its operations, which is subject to the performance of the capital markets and other factors beyond our control.
•Our financial condition and ability to access the public and private capital markets providing adequate liquidity for our general business needs: Our financial condition is dependent on our cash flow from operations, which is subject to the performance of the capital markets, our ability to maintain and grow client assets under management and other factors beyond our control. Our ability to access public and private capital markets on reasonable terms may be limited by adverse market conditions, our firm’s credit ratings, our profitability and changes in government regulations, including tax rates and interest rates.
•The outcome of litigation: Litigation is inherently unpredictable, and excessive damage awards do occur. Though we have stated that we do not expect any pending legal proceedings to have a material adverse effect on our results of operations, financial condition or liquidity, any settlement or judgment with respect to a legal proceeding could be significant, and could have such an effect.
•The possibility that we will engage in open market purchases of AB Holding Units to help fund anticipated obligations under our incentive compensation award program: The number of AB Holding Units AB may decide to buy in future periods, if any, to help fund incentive compensation awards depends on various factors, some of which are beyond our control, including the fluctuation in the price of an AB Holding Unit (NYSE: AB) and the availability of cash to make these purchases.
•Our determination that adjusted employee compensation expense, excluding the impact of performance-based fees, generally should not exceed 50% of our adjusted net revenues: revenues on an annual basis:Aggregate employee compensation reflects employee performance and competitive compensation levels. Fluctuations in our revenues and/or changes in competitive compensation levels could result in adjusted employee compensation expense exceeding 50% of our adjusted net revenues.
•Our Relocation Strategy: While many of the expenses, expense savings and EPU impact we expect will result from our Relocation Strategy are presented with numerical specificity, and we believe these figures to be reasonable as of the date of this report, the uncertainties surrounding the assumptions on which our estimates are based create a significant risk that our current estimates may not be realized. These assumptions include:
•the amount and timing of employee relocation costs, severance, and overlapping compensation and occupancy costs we experience; and
•the timing for execution of each phase of our relocation implementation plan.
•The Adverse Impact of COVID-19: The severity of the expected adverse impact on our AUM and revenues of the economic downturn caused by the COVID-19 pandemic will depend on the depth and length of the downturn and its impact on the companies in which we invest. Our conclusions about the possible continuing significant adverse impact on us is based on our assumptions that the recovery will be gradual and that there will be lasting high unemployment and economic damage. We believe that these assumptions are reasonable, but they may not be correct and economic conditions likely will differ from our assumptions.
Item 7A.Quantitative and Qualitative Disclosures about Market Risk
| | |
|
| Market Risk, Risk Management and Derivative Financial Instruments |
|
Our investments consist of trading and other investments. Trading investments include U.S. Treasury Bills, mutual funds, exchange-traded options and various separately-managed portfolios consisting of equity securities. Trading investments are purchased for short-term investment, principally to fund liabilities related to long-term incentive compensation plans and to seed new investment services. Other investments include investments in hedge funds we sponsor and other investment vehicles.
We enter into various futures, forwards, swaps and options primarily to economically hedge our seed capital investments. We do not hold any derivatives designated in a formal hedge relationship under ASC 815-10, Derivatives and Hedging. See Note 7 Derivative Instruments to our consolidated financial statements in Item 8.
Trading and Non-Trading Market Risk Sensitive Instruments
| | |
|
| Investments with Interest Rate Risk—Fair Value |
|
The table below provides our potential exposure with respect to our fixed income investments, measured in terms of fair value, to an immediate 100 basis point increase in interest rates at all maturities from the levels prevailing as of December 31, 20202023 and 2019.2022. Such a fluctuation in interest rates is a hypothetical rate scenario used to calibrate potential risk and does not represent our view of future market movements. While these fair value measurements provide a representation of interest rate sensitivity of our investments in fixed income mutual funds and fixed income hedge funds, they are based on our exposures at a particular point in time and may not be representative of future market results. These exposures will change as a result of ongoing changes in investments in response to our assessment of changing market conditions and available investment opportunities:
| | | As of December 31, |
| | 2020 | | 2019 |
| | Fair Value | | Effect of
+100
Basis Point
Change | | Fair Value | | Effect of
+100
Basis Point
Change |
| | (in thousands) |
| As of December 31 | | | As of December 31 |
| 2023 | | | 2023 | 2022 |
| Fair Value | | | Fair Value | Effect of
+100
Basis Point
Change | Fair Value | Effect of
+100
Basis Point
Change |
| (in thousands) | | | (in thousands) |
| Fixed Income Investments: | Fixed Income Investments: | |
| Trading | Trading | $ | 35,555 | | | $ | (2,457) | | | $ | 36,122 | | | $ | (2,445) | |
| Trading | |
| Trading | |
| | |
|
| Investments with Equity Price Risk—Fair Value |
|
Our investments also include investments in equity securities, mutual funds and hedge funds. The following table provides our potential exposure with respect to our equity investments, measured in terms of fair value, to an immediate 10% dropdecrease in equity prices from those prevailing as of December 31, 20202023 and 2019.2022. A 10% decrease in equity prices is a hypothetical scenario used to calibrate potential risk and does not represent our view of future market movements. While these fair value measurements provide a representation of equity price sensitivity of our investments in equity securities, mutual funds and hedge funds, they are based on our exposures at a particular point in time and may not be representative of future market results. These exposures will change as a result of ongoing portfolio activities in response to our assessment of changing market conditions and available investment opportunities:
| | | As of December 31, |
| | 2020 | | 2019 |
| | Fair Value | | Effect of -10%
Equity Price
Change | | Fair Value | | Effect of -10%
Equity Price
Change |
| | (in thousands) |
| As of December 31 | | | As of December 31 |
| 2023 | | | 2023 | 2022 |
| Fair Value | | | Fair Value | Effect of -10%
Equity Price
Change | Fair Value | Effect of -10%
Equity Price
Change |
| (in thousands) | | | (in thousands) |
| Equity Investments: | Equity Investments: | |
| Trading | Trading | $ | 137,529 | | | $ | (13,753) | | | $ | 151,140 | | | $ | (15,114) | |
| Trading | |
| Trading | |
| Other investments | Other investments | 80,291 | | | (8,029) | | | 79,532 | | | (7,953) | |
Item 8.Financial Statements and Supplementary Data
Report of Independent Registered Public Accounting Firm
To the General Partner and Unitholders of AllianceBernstein L.P.
Opinions on the Financial Statements and Internal Control over Financial Reporting
We have audited the accompanying consolidated statements of financial condition of AllianceBernstein L.P. and its subsidiaries (the “Company”) as of December 31, 20202023 and 2019,2022, and the related consolidated statements of income, of comprehensive income, of changes in partners’ capital and of cash flows for each of the three years in the period ended December 31, 2020,2023, including the related notes and financial statement schedule listed in the index appearing under Item 15(a) (collectively referred to as the “consolidated financial statements”). We also have audited the Company's internal control over financial reporting as of December 31, 2020,2023, based on criteria established in Internal Control - Integrated Framework (2013) issued by the Committee of Sponsoring Organizations of the Treadway Commission (COSO).
In our opinion, the consolidated financial statements referred to above present fairly, in all material respects, the financial position of the Company as of December 31, 20202023 and 2019,2022, and the results of its operations and its cash flows for each of the three years in the period ended December 31, 20202023 in conformity with accounting principles generally accepted in the United States of America. Also in our opinion, the Company maintained, in all material respects, effective internal control over financial reporting as of December 31, 2020,2023, based on criteria established in Internal Control - Integrated Framework (2013) issued by the COSO.
Basis for Opinions
The Company's management is responsible for these consolidated financial statements, for maintaining effective internal control over financial reporting, and for its assessment of the effectiveness of internal control over financial reporting, included in Management’s Report on Internal Control Over Financial Reporting appearing under Item 9A. Our responsibility is to express opinions on the Company’s consolidated financial statements and on the Company's internal control over financial reporting based on our audits. We are a public accounting firm registered with the Public Company Accounting Oversight Board (United States) (PCAOB) and are required to be independent with respect to the Company in accordance with the U.S. federal securities laws and the applicable rules and regulations of the Securities and Exchange Commission and the PCAOB.
We conducted our audits in accordance with the standards of the PCAOB. Those standards require that we plan and perform the audits to obtain reasonable assurance about whether the consolidated financial statements are free of material misstatement, whether due to error or fraud, and whether effective internal control over financial reporting was maintained in all material respects.
Our audits of the consolidated financial statements included performing procedures to assess the risks of material misstatement of the consolidated financial statements, whether due to error or fraud, and performing procedures that respond to those risks. Such procedures included examining, on a test basis, evidence regarding the amounts and disclosures in the consolidated financial statements. Our audits also included evaluating the accounting principles used and significant estimates made by management, as well as evaluating the overall presentation of the consolidated financial statements. Our audit of internal control over financial reporting included obtaining an understanding of internal control over financial reporting, assessing the risk that a material weakness exists, and testing and evaluating the design and operating effectiveness of internal control based on the assessed risk. Our audits also included performing such other procedures as we considered necessary in the circumstances. We believe that our audits provide a reasonable basis for our opinions.
Definition and Limitations of Internal Control over Financial Reporting
A company’s internal control over financial reporting is a process designed to provide reasonable assurance regarding the reliability of financial reporting and the preparation of financial statements for external purposes in accordance with generally accepted accounting principles. A company’s internal control over financial reporting includes those policies and procedures that (i) pertain to the maintenance of records that, in reasonable detail, accurately and fairly reflect the transactions and dispositions of the assets of the company; (ii) provide reasonable assurance that transactions are recorded as necessary to permit preparation of financial statements in accordance with generally accepted accounting principles, and that receipts and expenditures of the company are being made only in accordance with authorizations of management and directors of the company; and (iii) provide reasonable assurance regarding prevention or timely detection of unauthorized acquisition, use, or disposition of the company’s assets that could have a material effect on the financial statements.
Because of its inherent limitations, internal control over financial reporting may not prevent or detect misstatements. Also, projections of any evaluation of effectiveness to future periods are subject to the risk that controls may become inadequate because of changes in conditions, or that the degree of compliance with the policies or procedures may deteriorate.
Critical Audit Matters
The critical audit matter communicated below is a matter arising from the current period audit of the consolidated financial statements that was communicated or required to be communicated to the audit committee and that (i) relates to accounts or disclosures that are material to the consolidated financial statements and (ii) involved our especially challenging, subjective, or complex judgments. The communication of critical audit matters does not alter in any way our opinion on the consolidated financial statements, taken as a whole, and we are not, by communicating the critical audit matter below, providing a separate opinion on the critical audit matter or on the accounts or disclosures to which it relates.
Performance-Based Fees
As described in Notes 2 and 3 to the consolidated financial statements, the Company’s performance-based fees earned were $132.6$144.9 million for the year ended December 31, 2020.2023, which are earned based on the value of the investors’ assets under management (AUM). The transaction price for the asset management performance obligation for certain investment advisory contracts, including those associated with hedge fundfunds and alternative investment advisory contracts,investments, provide for a performance-based fee, in addition to the base advisory fee, which is calculated as either a percentage of absolute investment results or a percentage of investment results in excess of a stated benchmark over a specified period of time. The performance-based fees are forms of variable consideration and are therefore excluded from the transaction price until it becomes probable that there will not be significant reversal of the cumulative revenue recognized. Constraining factors impacting the amount of variable consideration included in the transaction price include the contractual claw-back provisions to which the variable consideration is subject, the length of time to which the uncertainty of the consideration is subject, the number and range of possible consideration amounts, the probability of significant fluctuations in the fund’sAUM market value, and the level at which the fund’sAUM value exceeds the contractual threshold required to earn such a fee. With respect to the constraining factors related to the fund’s market value, management measures assets under management (AUM)Management calculates AUM using established market-based valuation methods and fair valuation (non-observable market) methods. Fair valuation methods, includingwhich include discounted cash flow models and other methods, are used only where AUM cannot be valued using market-based valuation methods, such as in the case of private equity or illiquid securities.
The principal considerations for our determination that performing procedures relating to performance-based fees is a critical audit matter are the significant audit(i) a high degree of auditor effort in performing procedures and evaluating audit evidence related to these fees, including evaluating audit evidence related to the assessment of the constraining factors impacting the amount of variable consideration and the calculation of AUM and (ii) the audit effort also includedinvolved the involvementuse of professionals with specialized skill and knowledge to assist in evaluating management's estimate of the funds' market value where fair valuation methods are used.knowledge.
Addressing the matter involved performing procedures and evaluating audit evidence in connection with forming our overall opinion on the consolidated financial statements. These procedures included testing the effectiveness of controls relating to the Company’smanagement’s revenue recognition process for performance-based fees, including controls over the assessment of the constraining factors and the valuationcalculation of AUM. These procedures also included, among others (i) testing management’s process for determining performance-based fees, including evaluating the appropriateness of the fair valuation methods used testingto calculate AUM; (ii) evaluating, on a sample basis, the reasonableness of the constraining factors related to (a) contractual claw-back provisions to which the variable consideration is subject, and, on a sample basis, evaluating the reasonableness of management’s assumptions related to(b) the length of time to which the uncertainty of the consideration is subject, (c) the number and range of possible consideration amounts, and(d) the probability of significant fluctuations in the funds’AUM market value, and as applicable,(e) the level at which a fund’sthe AUM value exceeded the contractual threshold required to earn such fees. In evaluating management’s estimates of the funds’ market value, procedures included the involvement of professionalsfees, as applicable. Professionals with specialized skill and knowledge were used to assist in evaluating the reasonableness of the AUM by (i) developing an independent range of prices for a sample of securities used in determining the underlying funds’ market valueproducts where fair valuation methods arewere used and comparison(ii) comparing the independent range of prices to management’s estimate of the securities’ fair value to the independently developed ranges.estimate. Developing the independent estimaterange of securities’ fair valueprices involved testing the completeness and accuracy of data provided by management and independently developing the significant assumptionsinputs for the sampled securities.
/s/PricewaterhouseCooperPricewaterhouseCoopers LLP
New York, New York
Nashville, Tennessee
February 11, 2021
We have served as the Company’s auditor since 2006.
| | |
| AllianceBernstein L.P. and Subsidiaries |
|
Consolidated Statements of Financial Condition
| | December 31, |
| 2020 | | 2019 |
| (in thousands,
except unit amounts) |
| Years Ended December 31 | | | Years Ended December 31 |
| 2023 | | | 2023 | 2022 |
| (in thousands,
except unit amounts) | | | (in thousands,
except unit amounts) |
| ASSETS | ASSETS | |
| Cash and cash equivalents | Cash and cash equivalents | $ | 1,037,400 | | | $ | 679,738 | |
| Cash and securities segregated, at fair value (cost $1,752,483 and $1,090,443) | 1,753,478 | | | 1,094,866 | |
| Cash and cash equivalents | |
| Cash and cash equivalents | |
| Cash and securities segregated, at fair value (cost $859,448 and $1,511,916) | |
| Receivables, net: | Receivables, net: | | | | Receivables, net: | | | | |
| Brokers and dealers | Brokers and dealers | 92,638 | | | 97,966 | |
| Brokerage clients | Brokerage clients | 1,713,377 | | | 1,536,674 | |
| AB funds fees | AB funds fees | 325,407 | | | 261,588 | |
| Other fees | Other fees | 148,746 | | | 148,744 | |
| Investments: | Investments: | | | | Investments: | | | | |
| Long-term incentive compensation-related | Long-term incentive compensation-related | 60,114 | | | 50,902 | |
| Other | Other | 193,261 | | | 215,892 | |
| Assets of consolidated company-sponsored investment funds: | Assets of consolidated company-sponsored investment funds: | |
| Cash and cash equivalents | Cash and cash equivalents | 36,506 | | | 11,433 | |
| Cash and cash equivalents | |
| Cash and cash equivalents | |
| Investments | Investments | 302,582 | | | 581,004 | |
| Other assets | Other assets | 12,244 | | | 19,810 | |
| Furniture, equipment and leasehold improvements, net | Furniture, equipment and leasehold improvements, net | 147,874 | | | 145,251 | |
| Goodwill | Goodwill | 3,082,778 | | | 3,076,926 | |
| Intangible assets, net | Intangible assets, net | 44,496 | | | 55,366 | |
| Deferred sales commissions, net | Deferred sales commissions, net | 64,066 | | | 36,296 | |
| Right-of-use assets | Right-of-use assets | 418,455 | | | 362,693 | |
| Assets held for sale | |
| Other assets | Other assets | 264,418 | | | 330,943 | |
| Total assets | Total assets | $ | 9,697,840 | | | $ | 8,706,092 | |
| LIABILITIES, REDEEMABLE NON-CONTROLLING INTEREST AND CAPITAL | | Liabilities: | | | |
| Payables: | | | |
| Brokers and dealers | $ | 216,403 | | | $ | 201,778 | |
| Securities sold not yet purchased | 17,791 | | | 30,157 | |
| Brokerage clients | 3,440,266 | | | 2,531,946 | |
| AB mutual funds | 65,550 | | | 71,142 | |
| Accounts payable and accrued expenses | 197,657 | | | 192,110 | |
| Lease liabilities | 505,549 | | | 468,451 | |
| Liabilities of consolidated company-sponsored investment funds | 30,620 | | | 31,017 | |
| Accrued compensation and benefits | 335,122 | | | 276,829 | |
| | Debt | 675,000 | | | 560,000 | |
| Total liabilities | 5,483,958 | | | 4,363,430 | |
|
AllianceBernstein L.P. and SubsidiariesPart II
| | Years Ended December 31 | | | Years Ended December 31 |
| 2023 | | | 2023 | 2022 |
| (in thousands,
except unit amounts) | | | (in thousands,
except unit amounts) |
| LIABILITIES, REDEEMABLE NON-CONTROLLING INTEREST AND CAPITAL | |
| Liabilities: | |
| Liabilities: | |
| Liabilities: | | | | | |
| Payables: | | Payables: | | | | |
| Brokers and dealers | |
| | December 31, |
| Brokerage clients | |
| Brokerage clients | |
| Brokerage clients | |
| AB mutual funds | |
| Contingent consideration liability | |
| Accounts payable and accrued expenses | |
| Lease liabilities | |
| Liabilities of consolidated company-sponsored investment funds | |
| Accrued compensation and benefits | |
| | 2020 | | 2019 |
| Debt | |
| Debt | |
| Debt | |
| Liabilities held for sale | |
| Total liabilities | |
Commitments and contingencies (See Note 14) | Commitments and contingencies (See Note 14) | 0 | | 0 | Commitments and contingencies (See Note 14) | | | | |
| Redeemable non-controlling interest | 102,359 | | | 325,561 | |
| Redeemable non-controlling interest of consolidated entities | |
| Capital: | Capital: | | | | Capital: | | | | |
| General Partner | General Partner | 41,776 | | | 41,225 | |
| Limited partners: 270,509,658 and 270,380,314 units issued and outstanding | 4,229,485 | | | 4,174,201 | |
| Limited partners: 286,609,212 and 285,979,913 units issued and outstanding | |
| Receivables from affiliates | Receivables from affiliates | (8,316) | | | (9,011) | |
| AB Holding Units held for long-term incentive compensation plans | AB Holding Units held for long-term incentive compensation plans | (57,219) | | | (76,310) | |
| Accumulated other comprehensive loss | Accumulated other comprehensive loss | (94,203) | | | (113,004) | |
| Partners’ capital attributable to AB Unitholders | Partners’ capital attributable to AB Unitholders | 4,111,523 | | | 4,017,101 | |
| | Total liabilities, redeemable non-controlling interest and capital | $ | 9,697,840 | | | $ | 8,706,092 | |
| Non-redeemable non-controlling interests in consolidated entities | |
| Total capital | |
| Total liabilities, non-controlling interest and capital | |
See Accompanying Notes to Consolidated Financial Statements.
AllianceBernstein L.P. and Subsidiaries
| | |
| AllianceBernstein L.P. and Subsidiaries |
|
Consolidated Statements of Income
| | Years Ended December 31, |
| 2020 | | 2019 | | 2018 |
| (in thousands, except per unit amounts) |
| Years Ended December 31 | | | Years Ended December 31 |
| 2023 | | | 2023 | 2022 | 2021 |
| (in thousands, except per unit amounts) | | | (in thousands, except per unit amounts) |
| Revenues: | Revenues: | |
| Investment advisory and services fees | |
| Investment advisory and services fees | |
| Investment advisory and services fees | Investment advisory and services fees | $ | 2,595,436 | | | $ | 2,472,044 | | | $ | 2,362,211 | |
| Bernstein research services | Bernstein research services | 459,744 | | | 407,911 | | | 439,432 | |
| Distribution revenues | Distribution revenues | 529,781 | | | 455,043 | | | 418,562 | |
| Dividend and interest income | Dividend and interest income | 50,923 | | | 104,421 | | | 98,226 | |
| Investment (losses) gains | (16,401) | | | 38,659 | | | 2,653 | |
| Investment gains (losses) | |
| Other revenues | Other revenues | 104,703 | | | 97,559 | | | 98,676 | |
| Total revenues | Total revenues | 3,724,186 | | | 3,575,637 | | | 3,419,760 | |
| Less: Interest expense | 15,650 | | | 57,205 | | | 52,399 | |
| Less: Broker-dealer related interest expense | |
| Net revenues | Net revenues | 3,708,536 | | | 3,518,432 | | | 3,367,361 | |
| | Expenses: | Expenses: | | | | | | Expenses: | | | | |
| Employee compensation and benefits | Employee compensation and benefits | 1,494,198 | | | 1,442,783 | | | 1,378,811 | |
| Promotion and servicing: | Promotion and servicing: | | | | | | Promotion and servicing: | | | | |
| Distribution-related payments | Distribution-related payments | 569,283 | | | 487,965 | | | 427,186 | |
| Amortization of deferred sales commissions | Amortization of deferred sales commissions | 27,355 | | | 15,029 | | | 21,343 | |
| Trade execution, marketing, T&E and other | Trade execution, marketing, T&E and other | 189,787 | | | 219,860 | | | 222,630 | |
| General and administrative: | | | | | |
| General and administrative | General and administrative | 485,544 | | | 484,750 | | | 448,996 | |
| Real estate charges | 5,526 | | | 3,324 | | | 7,160 | |
| | Contingent payment arrangements | |
| | Contingent payment arrangements | |
| | Contingent payment arrangements | Contingent payment arrangements | 1,855 | | | (510) | | | (2,219) | |
| Interest on borrowings | Interest on borrowings | 6,180 | | | 13,035 | | | 10,359 | |
| Amortization of intangible assets | Amortization of intangible assets | 21,372 | | | 28,759 | | | 27,781 | |
| Total expenses | Total expenses | 2,801,100 | | | 2,694,995 | | | 2,542,047 | |
| | Operating income | Operating income | 907,436 | | | 823,437 | | | 825,314 | |
| | Income tax | Income tax | 45,653 | | | 41,754 | | | 45,816 | |
| | Net income | Net income | 861,783 | | | 781,683 | | | 779,498 | |
| | Net (loss) income of consolidated entities attributable to non-controlling interests | (4,169) | | | 29,641 | | | 21,910 | |
| | Net income (loss) income of consolidated entities attributable to non-controlling interests | |
| Net income attributable to AB Unitholders | Net income attributable to AB Unitholders | $ | 865,952 | | | $ | 752,042 | | | $ | 757,588 | |
| | Net income per AB Unit: | Net income per AB Unit: | | | | | | Net income per AB Unit: | | | | |
| Basic | Basic | $ | 3.19 | | | $ | 2.78 | | | $ | 2.79 | |
| Diluted | Diluted | $ | 3.19 | | | $ | 2.78 | | | $ | 2.78 | |
See Accompanying Notes to Consolidated Financial Statements.
AllianceBernstein L.P. and Subsidiaries
| | |
| AllianceBernstein L.P. and Subsidiaries |
|
Consolidated Statements of Comprehensive Income
| | Years Ended December 31, |
| 2020 | | 2019 | | 2018 |
| (in thousands) |
| Years Ended December 31 | | | Years Ended December 31 |
| 2023 | | | 2023 | 2022 | 2021 |
| (in thousands) | | | (in thousands) |
| Net income | Net income | $ | 861,783 | | | $ | 781,683 | | | $ | 779,498 | |
| Other comprehensive income: | Other comprehensive income: | |
| Foreign currency translation adjustments, before reclassification and tax: | Foreign currency translation adjustments, before reclassification and tax: | 23,882 | | | 5,986 | | | (19,337) | |
| Less: reclassification adjustment for losses included in net income upon liquidation | (216) | | | 0 | | | (100) | |
| Foreign currency translation adjustments, before reclassification and tax: | |
| Foreign currency translation adjustments, before reclassification and tax: | |
| Less: reclassification adjustment for (losses) gains included in net income upon liquidation | |
| Foreign currency translation adjustments, before tax | Foreign currency translation adjustments, before tax | 24,098 | | | 5,986 | | | (19,237) | |
| Income tax (expense) benefit | Income tax (expense) benefit | (854) | | | (383) | | | 620 | |
| Foreign currency translation adjustments, net of tax | Foreign currency translation adjustments, net of tax | 23,244 | | | 5,603 | | | (18,617) | |
| | Changes in employee benefit related items: | Changes in employee benefit related items: | | | | | |
| | Changes in employee benefit related items: | |
| | Changes in employee benefit related items: | |
| Amortization of prior service cost | Amortization of prior service cost | 24 | | | 24 | | | 24 | |
| Recognized actuarial (loss) gain | (4,280) | | | (7,891) | | | 1,586 | |
| Amortization of prior service cost | |
| Amortization of prior service cost | |
| Recognized actuarial gain | |
| Changes in employee benefit related items | Changes in employee benefit related items | (4,256) | | | (7,867) | | | 1,610 | |
| Income tax benefit (expense) | (187) | | | 274 | | | (139) | |
| Income tax (expense) | |
| Employee benefit related items, net of tax | Employee benefit related items, net of tax | (4,443) | | | (7,593) | | | 1,471 | |
| Other | 0 | | | 0 | | | 374 | |
| | Other comprehensive gain (loss) | Other comprehensive gain (loss) | 18,801 | | | (1,990) | | | (16,772) | |
| Less: Comprehensive (loss) income in consolidated entities attributable to non-controlling interests | (4,169) | | | 29,788 | | | 21,864 | |
| Other comprehensive gain (loss) | |
| Other comprehensive gain (loss) | |
| Less: Comprehensive income (loss) in consolidated entities attributable to non-controlling interests | |
| Comprehensive income attributable to AB Unitholders | Comprehensive income attributable to AB Unitholders | $ | 884,753 | | | $ | 749,905 | | | $ | 740,862 | |
See Accompanying Notes to Consolidated Financial Statements.
AllianceBernstein L.P. and Subsidiaries
| | |
| AllianceBernstein L.P. and Subsidiaries |
|
Consolidated Statements of Changes in Partners’ Capital
| | Years Ended December 31, |
| 2020 | | 2019 | | 2018 |
| (in thousands) |
| Years Ended December 31 | | | Years Ended December 31 |
| 2023 | | | 2023 | 2022 | 2021 |
| (in thousands) | | | (in thousands) |
| General Partner’s Capital | General Partner’s Capital | |
| Balance, beginning of year | |
| Balance, beginning of year | |
| Balance, beginning of year | Balance, beginning of year | $ | 41,225 | | | $ | 40,240 | | | $ | 41,221 | |
| Net income | Net income | 8,660 | | | 7,521 | | | 7,576 | |
| Cash distributions to General Partner | Cash distributions to General Partner | (8,376) | | | (7,042) | | | (8,608) | |
| Long-term incentive compensation plans activity | Long-term incentive compensation plans activity | (23) | | | 149 | | | (39) | |
| Issuance (retirement) of AB Units, net | Issuance (retirement) of AB Units, net | 290 | | | 357 | | | (256) | |
| Impact of adoption of revenue recognition standard ASC 606 | 0 | | | 0 | | | 349 | |
| Other | 0 | | | 0 | | | (3) | |
| Issuance of AB Units for CarVal acquisition | |
| | Balance, end of year | |
| | Balance, end of year | |
| | Balance, end of year | Balance, end of year | 41,776 | | | 41,225 | | | 40,240 | |
| Limited Partners' Capital | Limited Partners' Capital | | | | | |
| Balance, beginning of year | |
| Balance, beginning of year | |
| Balance, beginning of year | Balance, beginning of year | 4,174,201 | | | 4,075,306 | | | 4,168,841 | |
| Net income | Net income | 857,292 | | | 744,521 | | | 750,012 | |
| Cash distributions to Unitholders | Cash distributions to Unitholders | (828,503) | | | (696,470) | | | (849,585) | |
| Long-term incentive compensation plans activity | Long-term incentive compensation plans activity | (2,147) | | | 14,741 | | | (3,880) | |
| Issuance (retirement) of AB Units, net | Issuance (retirement) of AB Units, net | 28,642 | | | 35,259 | | | (25,486) | |
| Impact of adoption of revenue recognition standard ASC 606 | 0 | | | 0 | | | 34,601 | |
| Other | 0 | | | 844 | | | 803 | |
| Issuance of AB Units for CarVal acquisition | |
| | Balance, end of year | |
| | Balance, end of year | |
| | Balance, end of year | Balance, end of year | 4,229,485 | | | 4,174,201 | | | 4,075,306 | |
| Receivables from Affiliates | Receivables from Affiliates | | | | | |
| Balance, beginning of year | Balance, beginning of year | (9,011) | | | (11,430) | | | (11,494) | |
| Capital contributions from General Partner | 0 | | | 0 | | | 19 | |
| Compensation plan accrual | 0 | | | 0 | | | 352 | |
| Balance, beginning of year | |
| Balance, beginning of year | |
| | Long-term incentive compensation awards expense | Long-term incentive compensation awards expense | 802 | | | 1,125 | | | 0 | |
| Capital contributions from AB Holding | (107) | | | 1,294 | | | (307) | |
| | Long-term incentive compensation awards expense | |
| | Long-term incentive compensation awards expense | |
| Capital contributions (to) from AB Holding | |
| Balance, end of year | Balance, end of year | (8,316) | | | (9,011) | | | (11,430) | |
| AB Holding Units held for Long-term Incentive Compensation Plans | AB Holding Units held for Long-term Incentive Compensation Plans | | | | | |
| Balance, beginning of year | |
| Balance, beginning of year | |
| Balance, beginning of year | Balance, beginning of year | (76,310) | | | (77,990) | | | (42,688) | |
| Purchases of AB Holding Units to fund long-term compensation plans, net | Purchases of AB Holding Units to fund long-term compensation plans, net | (148,624) | | | (171,930) | | | (267,427) | |
| (Issuance) retirement of AB Units, net | (Issuance) retirement of AB Units, net | (28,696) | | | (35,736) | | | 25,589 | |
| Long-term incentive compensation awards expense | Long-term incentive compensation awards expense | 194,840 | | | 207,057 | | | 187,514 | |
| Re-valuation of AB Holding Units held in rabbi trust | Re-valuation of AB Holding Units held in rabbi trust | 1,556 | | | (4,403) | | | 19,022 | |
| Other | Other | 15 | | | 6,692 | | | 0 | |
| Balance, end of year | Balance, end of year | (57,219) | | | (76,310) | | | (77,990) | |
| Accumulated Other Comprehensive Income (Loss) | | | | | |
| | Accumulated Other Comprehensive (Loss) | |
| | Accumulated Other Comprehensive (Loss) | |
| | Accumulated Other Comprehensive (Loss) | |
| Balance, beginning of year | |
| Balance, beginning of year | |
| Balance, beginning of year | Balance, beginning of year | (113,004) | | | (110,866) | | | (94,140) | |
| Foreign currency translation adjustment, net of tax | Foreign currency translation adjustment, net of tax | 23,244 | | | 5,455 | | | (18,571) | |
| Changes in employee benefit related items, net of tax | Changes in employee benefit related items, net of tax | (4,443) | | | (7,593) | | | 1,471 | |
| Unrealized gain on investments, net of tax | 0 | | | 0 | | | 0 | |
| Other | 0 | | | 0 | | | 374 | |
| | Balance, end of year | |
| | Balance, end of year | |
| | Balance, end of year | Balance, end of year | (94,203) | | | (113,004) | | | (110,866) | |
| Total Partners' Capital attributable to AB Unitholders | Total Partners' Capital attributable to AB Unitholders | 4,111,523 | | | 4,017,101 | | | 3,915,260 | |
| Non-redeemable Non-controlling Interests in Consolidated Entities | Non-redeemable Non-controlling Interests in Consolidated Entities | | | | | |
| Balance, beginning of year | Balance, beginning of year | 0 | | | 949 | | | 1,564 | |
| Balance, beginning of year | |
| Balance, beginning of year | |
| CarVal acquisition | |
| Net income | Net income | 0 | | | 91 | | | 69 | |
| Foreign currency translation adjustment | 0 | | | 147 | | | (46) | |
| Purchase of non-controlling interest | 0 | | | (1,187) | | | 0 | |
| Distributions (to) non-controlling interests of our consolidated venture capital fund activities | 0 | | | 0 | | | (638) | |
| | Distributions to non-controlling interests, net | |
| Distributions to non-controlling interests, net | |
| Distributions to non-controlling interests, net | |
| Adjustment | |
| Balance, end of year | Balance, end of year | 0 | | | 0 | | | 949 | |
| Total Capital | Total Capital | $ | 4,111,523 | | | $ | 4,017,101 | | | $ | 3,916,209 | |
See Accompanying Notes to Consolidated Financial Statements.
AllianceBernstein L.P. and Subsidiaries
| | |
| AllianceBernstein L.P. and Subsidiaries |
|
Consolidated Statements of Cash Flows
| | Years Ended December 31, |
| 2020 | | 2019 | | 2018 |
| (in thousands) |
| Years Ended December 31 | | | Years Ended December 31 |
| 2023 | | | 2023 | 2022 | 2021 |
| (in thousands) | | | (in thousands) |
| Cash flows from operating activities: | Cash flows from operating activities: | |
| Net income | |
| Net income | |
| Net income | Net income | $ | 861,783 | | | $ | 781,683 | | | $ | 779,498 | |
| Adjustments to reconcile net income to net cash provided by operating activities: | Adjustments to reconcile net income to net cash provided by operating activities: | |
| Amortization of deferred sales commissions | Amortization of deferred sales commissions | 27,355 | | | 15,029 | | | 21,343 | |
| Amortization of deferred sales commissions | |
| Amortization of deferred sales commissions | |
| Non-cash long-term incentive compensation expense | Non-cash long-term incentive compensation expense | 195,642 | | | 208,182 | | | 187,514 | |
| Depreciation and other amortization | Depreciation and other amortization | 138,240 | | | 166,542 | | | 70,000 | |
| Unrealized losses (gains) on investments | 10,405 | | | (13,431) | | | 23,164 | |
| Unrealized (gains) on investments of consolidated company-sponsored investment funds | (854) | | | (36,150) | | | (14,217) | |
| Unrealized (gains) losses on investments | |
| Unrealized (gains) losses on investments of consolidated company-sponsored investment funds | |
| | | Non-cash lease expense | |
| | Non-cash lease expense | |
| | Non-cash lease expense | |
| (Gain) loss on assets held for sale | |
| Change is estimate of contingent payment arrangements | |
| Other, net | Other, net | (2,914) | | | 10,281 | | | (6,446) | |
| Changes in assets and liabilities: | Changes in assets and liabilities: | |
| | (Increase) decrease in securities, segregated | (658,612) | | | 74,688 | | | (353,204) | |
| (Increase) decrease in receivables | (182,684) | | | 223,137 | | | (207,000) | |
| Decrease (increase) in investments | 7,597 | | | 460,347 | | | (294,383) | |
| Decrease (increase) in securities, segregated | |
| | Decrease (increase) in securities, segregated | |
| | Decrease (increase) in securities, segregated | |
| Decrease (increase) in receivables | |
| (Increase) in investments | |
| Decrease (increase) in investments of consolidated company-sponsored investment funds | Decrease (increase) in investments of consolidated company-sponsored investment funds | 279,276 | | | (193,158) | | | 908,804 | |
| (Increase) in deferred sales commissions | (Increase) in deferred sales commissions | (55,125) | | | (34,177) | | | (8,365) | |
| (Increase) in right-of-use assets | (131,765) | | | (11,141) | | | — | |
| Decrease (increase) in other assets | 69,160 | | | (23,140) | | | (152,726) | |
| Increase (decrease) in other assets and liabilities of consolidated company-sponsored investment funds, net | 7,169 | | | 11,437 | | | (662,934) | |
| Increase (decrease) in payables | 861,502 | | | (641,369) | | | 1,024,317 | |
| Increase (decrease) in lease liabilities | 37,695 | | | (107,276) | | | — | |
| Increase (decrease) in accounts payable and accrued expenses | 10,666 | | | (56,518) | | | (11,225) | |
| Increase (decrease) in accrued compensation and benefits | 46,885 | | | (7,486) | | | 4,341 | |
| (Increase) in other assets | |
| (Increase) decrease in other assets and liabilities of consolidated company-sponsored investment funds, net | |
| (Decrease) increase in payables | |
| | (Decrease) increase in accounts payable and accrued expenses | |
| (Decrease) increase in accounts payable and accrued expenses | |
| (Decrease) increase in accounts payable and accrued expenses | |
| (Decrease) increase in accrued compensation and benefits | |
| Cash payments to relieve operating lease liabilities | |
| Net cash provided by operating activities | Net cash provided by operating activities | 1,521,421 | | | 827,480 | | | 1,308,481 | |
| | Cash flows from investing activities: | Cash flows from investing activities: | |
| Purchases of equity method investments | (4,079) | | | 0 | | | 0 | |
| Cash flows from investing activities: | |
| Cash flows from investing activities: | |
| | Purchases of furniture, equipment and leasehold improvements | |
| | Purchases of furniture, equipment and leasehold improvements | |
| | | Purchases of furniture, equipment and leasehold improvements | Purchases of furniture, equipment and leasehold improvements | (41,504) | | | (28,303) | | | (32,789) | |
| | Acquisition of businesses, net of cash acquired | Acquisition of businesses, net of cash acquired | (13,552) | | | 5,255 | | | 0 | |
| | Acquisition of businesses, net of cash acquired | |
| | Acquisition of businesses, net of cash acquired | |
| Net cash used in investing activities | Net cash used in investing activities | (59,135) | | | (23,048) | | | (32,789) | |
| | | Cash flows from financing activities: | Cash flows from financing activities: | |
| Proceeds (repayment) of debt | 115,000 | | | 2,105 | | | (25,454) | |
| | Cash flows from financing activities: | |
| | Cash flows from financing activities: | |
| Proceeds from debt, net | |
| Proceeds from debt, net | |
| Proceeds from debt, net | |
| (Decrease) increase in overdrafts payable | (Decrease) increase in overdrafts payable | (12,633) | | | (59,924) | | | 3,273 | |
| Distributions to General Partner and Unitholders | Distributions to General Partner and Unitholders | (836,879) | | | (703,512) | | | (858,193) | |
| Capital contributions (to) non-controlling interests in consolidated entities | 0 | | | 0 | | | (638) | |
| | (Redemptions) subscriptions of non-controlling interests of consolidated company-sponsored investment funds, net | |
| (Redemptions) subscriptions of non-controlling interests of consolidated company-sponsored investment funds, net | |
| (Redemptions) subscriptions of non-controlling interests of consolidated company-sponsored investment funds, net | (Redemptions) subscriptions of non-controlling interests of consolidated company-sponsored investment funds, net | (219,033) | | | 150,091 | | | (472,143) | |
| Capital contributions (to) from affiliates | Capital contributions (to) from affiliates | (867) | | | 269 | | | (1,421) | |
| Interest accretion, net of (payments) on contingent payment arrangements | 1,921 | | | (1,991) | | | (1,093) | |
| | Additional investments by AB Holding with proceeds from exercise of compensatory options to buy AB Holding Units | |
| Additional investments by AB Holding with proceeds from exercise of compensatory options to buy AB Holding Units | |
| Additional investments by AB Holding with proceeds from exercise of compensatory options to buy AB Holding Units | Additional investments by AB Holding with proceeds from exercise of compensatory options to buy AB Holding Units | 147 | | | 11,511 | | | 16,589 | |
| Purchases of AB Holding Units to fund long-term incentive compensation plan awards, net | Purchases of AB Holding Units to fund long-term incentive compensation plan awards, net | (148,624) | | | (171,930) | | | (267,427) | |
| Other | (1,615) | | | (1,580) | | | (2,151) | |
| Payment of acquisition-related debt obligation | |
| Other, net | |
| Net cash used in financing activities | Net cash used in financing activities | (1,102,583) | | | (774,961) | | | (1,608,658) | |
| Effect of exchange rate changes on cash and cash equivalents | Effect of exchange rate changes on cash and cash equivalents | 23,032 | | | 8,376 | | | (12,158) | |
| Net increase (decrease) in cash and cash equivalents | 382,735 | | | 37,847 | | | (345,124) | |
| Net (decrease) increase in cash and cash equivalents | |
| Cash and cash equivalents as of beginning of the period | Cash and cash equivalents as of beginning of the period | 691,171 | | | 653,324 | | | 998,448 | |
| Cash and cash equivalents as of end of the period | Cash and cash equivalents as of end of the period | $ | 1,073,906 | | | $ | 691,171 | | | $ | 653,324 | |
| | Cash paid: | Cash paid: | |
| Cash paid: | |
| Cash paid: | |
| Interest paid | |
| Interest paid | |
| Interest paid | Interest paid | $ | 18,858 | | | $ | 66,002 | | | $ | 60,286 | |
| Income taxes paid | Income taxes paid | 59,791 | | | 52,444 | | | 41,946 | |
| | Non-cash investing activities: | Non-cash investing activities: | |
| Fair value of assets acquired (excluding cash acquired of $0.6 million and $11.8 million) | 18,389 | | | 28,966 | | | 0 | |
| Non-cash investing activities: | |
| Non-cash investing activities: | |
| Fair value of assets acquired (excluding cash acquired of zero, $40.8 million and $2.8 million, for 2023, 2022 and 2021, respectively) | |
| Fair value of assets acquired (excluding cash acquired of zero, $40.8 million and $2.8 million, for 2023, 2022 and 2021, respectively) | |
| Fair value of assets acquired (excluding cash acquired of zero, $40.8 million and $2.8 million, for 2023, 2022 and 2021, respectively) | |
| Fair value of deferred tax asset recorded | |
| Fair value of liabilities assumed | Fair value of liabilities assumed | 437 | | | 16,837 | | | 0 | |
| | Fair value of non-redeemable non-controlling interest recorded | |
| Non-cash financing activities: | Non-cash financing activities: | |
| Payables recorded under contingent payment arrangements | Payables recorded under contingent payment arrangements | 4,400 | | | 17,384 | | | 0 | |
| Payables recorded under contingent payment arrangements | |
| Payables recorded under contingent payment arrangements | |
| Equity consideration issued in connection with acquisition | |
See Accompanying Notes to Consolidated Financial Statements.
| | |
| AllianceBernstein L.P. and Subsidiaries |
|
Notes to Consolidated Financial Statements
The words “we” and “our” refer collectively to AllianceBernstein L.P. and its subsidiaries (“AB”), or to their officers and employees. Similarly, the word “company” refers to AB. Cross-references are in italics.
1. Business Description and Organization
We provide diversified investment management, research and related services globally to a broad range of clients. Our principal services include:
•Institutional Services—Services—servicing our institutional clients, including private and public pension plans, foundations and endowments, insurance companies, central banks and governments worldwide, and affiliates such as Equitable Holdings, Inc. ("EQH") and its subsidiaries, by means of separately-managedseparately managed accounts, sub-advisory relationships, structured products, collective investment trusts, mutual funds, hedge funds and other investment vehicles.
•Retail Services—Services—servicing our retail clients, primarily by means of retail mutual funds sponsored by AB or an affiliated company, sub-advisory relationships with mutual funds sponsored by third parties, separately-managedseparately managed account programs sponsored by financial intermediaries worldwide and other investment vehicles.
•Private Wealth Management Services—Services—servicing our private clients, including high-net-worth individuals and families, trusts and estates, charitable foundations, partnerships, private and family corporations, and other entities, by means of separately-managedseparately managed accounts, hedge funds, mutual funds and other investment vehicles.
•Bernstein Research Services—Services—servicing institutional investors, such as pension fund, hedge fund and mutual fund managers, seeking high-quality fundamental research, quantitative services and brokerage-related services in equities and listed options.
We also provide distribution, shareholder servicing, transfer agency services and administrative services to the mutual funds we sponsor.
Our high-quality, in-depth research is the foundation of our business.asset management and private wealth management businesses. Our research disciplines include economic, fundamental equity, fixed income and quantitative research. In addition, we have expertise in multi-asset strategies, wealth management, environmental, social and corporate governance (("ESG"ESG"), and alternative investments.
We provide a broad range of investment services with expertise in:
•Actively-managedActively managed equity strategies withacross global and regional portfolios acrossuniverses, as well as capitalization ranges, concentration ranges and investment strategies, including value, growth and core equities;
•Actively-managedActively managed traditional and unconstrained fixed income strategies, including taxable and tax-exempt strategies;
•AlternativeActively managed alternative investments, including fundamental and systematically-driven hedge funds, fund of hedge funds and direct assets (e.g., direct lending, real estate debt and private equity;equity);
•Multi-asset solutionsservices and services,solutions, including dynamic asset allocation, customized target-date funds and target-risk funds; and
•Some passive management,Passively managed equity and fixed income strategies, including index, ESG index and enhanced index strategies.
During the second quarter of 2018, AXA S.A. ("AXA")completed the sale of a minority stake in EQH through an initial public offering ("IPO"). Since then, AXA has completed additional offerings and taken other steps, most recently during the fourth quarter of 2019. As a result, AXA owned less than 10% of the outstanding common stock of EQH as of December 31, 2020.Organization
As of December 31, 2020,2023, EQH owned approximately 4.1%3.5% of the issued and outstanding units representing assignments of beneficial ownership of limited partnership interests in AllianceBernstein Holding L.P. (“AB Holding Units”). AllianceBernstein Corporation (an indirect wholly-owned subsidiary of EQH, “General Partner”) is the general partner of both AllianceBernstein Holding L.P. (“AB Holding”) and AB. AllianceBernstein Corporation owns 100,000 general partnership units in AB Holding and a 1%1.0% general partnership interest in AB.
As of December 31, 2020,2023, the ownership structure of AB, including limited partnership units outstanding as well as the general partner's 1%1.0% interest, was as follows:
| | | | | |
| EQH and its subsidiaries | 63.359.8 | % |
| AB Holding | 36.039.5 | |
| Unaffiliated holders | 0.7 | |
| 100.0 | % |
Including both the general partnership and limited partnership interests in AB Holding and AB, EQH and its subsidiaries had an approximate 64.8%61.2% economic interest in AB as of December 31, 2020.2023.
2. Summary of Significant Accounting Policies
Basis of Presentation
The consolidated financial statements have been prepared in accordance with accounting principles generally accepted in the United States of America ("US GAAP"). The preparation of the consolidated financial statements requires management to make certain estimates and assumptions that affect the reported amounts of assets and liabilities and disclosure of contingent assets and liabilities at the dates of the consolidated financial statements and the reported amounts of revenues and expenses during the reporting periods. Actual results could differ from those estimates.
PrinciplesDistribution Revenues
Two of Consolidationour subsidiaries act as distributors and/or placement agents of company-sponsored mutual funds and receive distribution services fees from certain of those funds as full or partial reimbursement of the distribution expenses they incur. Period-over-period fluctuations of distribution revenues typically are in line with fluctuations of the corresponding average AUM of these mutual funds.
Distribution revenues decreased $20.9 million, or 3.4%, in 2023, primarily due to a shift in product mix from mutual funds with higher distribution rates to mutual funds with lower distribution rates, as well as a 1.4% decrease in the corresponding average AUM of these mutual funds. Distribution revenues decreased $45.0 million, or 6.9%, in 2022, primarily due to the corresponding average AUM of these mutual funds decreasing 12.4%, partially offset by a shift in product mix from mutual funds with lower distribution rates to mutual funds with higher distribution rates.
Dividend and Interest Income and Interest Expense
Dividend and interest income consists primarily of investment income and interest earned on customer margin balances and U.S. Treasury Bills as well as dividend and interest income in our consolidated company-sponsored investment funds. Interest expense principally reflects interest accrued on cash balances in customers’ brokerage accounts.
Dividend and interest income increased $76.4 million, or 62.0%, in 2023, primarily due to higher interest earned on customer margin balances and higher interest earned on U.S. Treasury Bills. Interest expense increased $41.1 million in 2023, due to higher interest paid on cash balances in customers' brokerage accounts.
Dividend and interest income increased $84.4 million in 2022, primarily due to higher interest earned on customer margin balances, higher interest earned on U.S. Treasury Bills as well as higher dividend and interest income in our consolidated company-sponsored investment funds. Interest expense increased $62.8 million, in 2022, due to higher interest paid on cash balances in customers' brokerage accounts.
Investment Gains (Losses)
Investment gains (losses) consist primarily of realized and unrealized investment gains or losses on: (i) employee long-term incentive compensation-related investments, (ii) U.S. Treasury Bills, (iii) market-making in exchange-traded options and equities, (iv) seed capital investments, (v) derivatives and (vi) investments in our consolidated company-sponsored investment funds. Investment gains (losses) also include equity in earnings of proprietary investments in limited partnership hedge funds that we sponsor and manage.
Investment gains (losses) are as follows:
| | | | | | | | | | | | | | | | | | | | |
| | Years Ended December 31 |
| | 2023 | 2022 | 2021 |
| | (in thousands) |
| Long-term incentive compensation-related investments: | | | | | | |
| Realized gains | | $ | 6,573 | | | $ | 1,345 | | | $ | 2,213 | |
| Unrealized (losses) gains | | (1,707) | | | (10,626) | | | 2,446 | |
| | | | | | |
| | | | | | |
| | | | | | |
| | | | | | |
| | | | | | |
| | | | | | |
| | | | | | |
| | | | | | |
| | | | | | |
| Investments held by consolidated company-sponsored investment funds: | | | | | | |
| Realized (losses) | | (32,125) | | | (46,293) | | | (2,341) | |
| Unrealized gains (losses) | | 48,350 | | | (73,194) | | | (1,882) | |
| | | | | | |
| Seed capital investments: | | | | | | |
| Realized (losses) gains | | | | | | |
| Seed capital and other | | (34) | | | 17,272 | | | 20,263 | |
| Derivatives | | (7,588) | | | 41,236 | | | (22,313) | |
| Unrealized gains (losses) | | | | | | |
| Seed capital and other | | 10,099 | | | (31,261) | | | (6,907) | |
| Derivatives | | (8,717) | | | (177) | | | 8,992 | |
| | | | | | |
| Brokerage-related investments: | | | | | | |
| Realized (losses) | | (203) | | | (1,384) | | | (829) | |
| Unrealized (losses) gains | | (442) | | | 669 | | | (278) | |
| | | $ | 14,206 | | | $ | (102,413) | | | $ | (636) | |
Other Revenues
Other revenues consist of fees earned for transfer agency services provided to company-sponsored mutual funds, fees earned for administration and recordkeeping services provided to company-sponsored mutual funds and the General Accounts of EQH and its subsidiaries, and other miscellaneous revenues. Other revenues decreased $4.2 million, or 4.0%, in 2023, primarily due to lower shareholder servicing fees and lower brokerage income, partially offset by higher mutual fund reimbursements. Other revenues decreased $2.9 million, or 2.6%, in 2022, primarily due to lower shareholder servicing fees.
Expenses
The components of expenses are as follows:
| | | | | | | | | | | | | | | | | | | | | | | | | | | | | |
| | Years Ended December 31 | | % Change |
| | 2023 | 2022 | 2021 | | 2023-22 | 2022-21 |
| | (in thousands) | | | |
| Employee compensation and benefits | | 1,769,153 | | | $ | 1,666,636 | | | $ | 1,716,013 | | | 6.2 | % | (2.9 | %) |
| Promotion and servicing: | | | | | | | | | |
| Distribution-related payments | | 610,368 | | | 629,572 | | | 708,117 | | | (3.1) | | (11.1) | |
| Amortization of deferred sales commissions | | 36,817 | | | 34,762 | | | 34,364 | | | 5.9 | | 1.2 | |
| Trade execution, marketing, T&E and other | | 215,643 | | | 215,556 | | | 197,486 | | | — | | 9.2 | |
| | | 862,828 | | | 879,890 | | | 939,967 | | | (1.9) | | (6.4) | |
| General and administrative | | 581,571 | | | 641,635 | | | 555,608 | | | (9.4) | | 15.5 | |
| | | | | | | | | |
| Contingent payment arrangements | | 22,853 | | | 6,563 | | | 2,710 | | | n/m | 142.2 | |
| Interest on borrowings | | 54,394 | | | 17,906 | | | 5,145 | | | n/m | n/m |
| Amortization of intangible assets | | 46,854 | | | 26,564 | | | 5,697 | | | 76.4 | | n/m |
| Total | | $ | 3,337,653 | | | $ | 3,239,194 | | | $ | 3,225,140 | | | 3.0 | % | 0.4 | % |
Employee Compensation and Benefits
Employee compensation and benefits consist of base compensation (including salaries and severance), annual short-term incentive compensation awards (cash bonuses), annual long-term incentive compensation awards, commissions, fringe benefits and other employment costs (including recruitment, training, temporary help and meals).
Compensation expense as a percentage of net revenues was 42.6%, 41.1% and 38.6% for the years ended December 31, 2023, 2022 and 2021, respectively. Compensation expense generally is determined on a discretionary basis and is primarily a function of our firm’s current-year financial performance. The amounts of incentive compensation we award are designed to motivate, reward and retain top talent while aligning our executives' interests with the interests of our Unitholders. Senior management, together with the Compensation and Workplace Practices Committee of the Board of Directors of AllianceBernstein Corporation (“Compensation Committee”), continue to believe that the appropriate metric to consider in determining the amount of incentive compensation is the ratio of adjusted employee compensation and benefits expense to adjusted net revenues. Adjusted net revenues used in the adjusted compensation ratio are the same as the adjusted net revenues presented as a non-GAAP measure (discussed earlier in this Item 7). Adjusted employee compensation and benefits expense is total employee compensation and benefits expense minus other employment costs such as recruitment, training, temporary help and meals (which were 1.1%, 1.1% and 0.9% of adjusted net revenues for 2023, 2022 and 2021, respectively), and excludes the impact of mark-to-market vesting expense, as well as dividends and interest expense, associated with employee long-term incentive compensation-related investments and the amortization expense associated with the awards issued by EQH to some of our firm's executives relating to their roles as members of the EQH Management Committee. Senior management, with the approval of the Compensation Committee, has established as an objective that adjusted employee compensation and benefits expense, excluding the impact of performance-based fees, generally should not exceed 50% of our adjusted net revenues in any year, except in unexpected or unusual circumstances. Our ratios of adjusted compensation expense as a percentage of adjusted net revenues were 49.0%, 48.4% and 46.5%, respectively, for the years ended December 31, 2023, 2022 and 2021.
In 2023, employee compensation and benefits expense increased $102.5 million, or 6.2%, primarily due to higher base compensation of $72.2 million, higher incentive compensation of $51.7 million and higher fringes of $7.8 million, partially offset by lower commissions of $29.0 million. In 2022, employee compensation and benefits expense decreased $49.4 million, or 2.9%, primarily due to lower incentive compensation of $107.7 million, partially offset by higher base compensation of $39.8 million, higher commissions of $12.7 million and higher other employment costs of $5.3 million.
Promotion and Servicing
Promotion and servicing expenses include distribution-related payments to financial intermediaries for distribution of AB mutual funds and amortization of deferred sales commissions paid to financial intermediaries for the sale of back-end load shares of AB mutual funds. Also included in this expense category are costs related to trade execution and clearance, travel and entertainment, advertising and promotional materials.
Promotion and servicing expenses decreased $17.1 million, or 1.9%, in 2023. The decrease was due to lower distribution-related payments of $19.2 million, lower trade execution and clearance expenses of $9.0 million and lower transfer fees of $3.0 million, offset by higher travel and entertainment expenses of $8.5 million, higher marketing and communication expenses of $3.5 million and higher amortization of deferred sales commissions of $2.1 million. Promotion and servicing expenses decreased $60.1 million, or 6.4%, in 2022. The decrease was primarily due to lower distribution-related payments of $78.5 million, lower transfer fees of $4.9 million and lower trade execution and clearance expenses of $3.1 million, partially offset by higher travel and entertainment expenses of $15.4 million and higher firm meeting expenses of $8.8 million.
General and Administrative
General and administrative expenses include portfolio services fees, technology fees, professional fees and office-related expenses (occupancy, communications and similar expenses). General and administrative expenses as a percentage of net revenues were 14.0%, 15.8% and 12.5% for the years ended December 31, 2023, 2022 and 2021, respectively. General and administrative expenses decreased $60.1 million, or 9.4%, in 2023. The decrease was primarily due to lower portfolio services fees of $43.7 million, lower professional fees of $18.0 million, lower valuation adjustments related to the classification of Bernstein Research Services as held for sale of $6.0 million and a favorable foreign exchange translation impact of $5.7 million, partially offset by higher office-related expenses of $7.4 million. General and administrative expenses increased $86.0 million, or 15.5%, in 2022. The increase was primarily due to higher professional fees of $27.3 million, higher portfolio services fees of $21.3 million, higher technology fees of $19.1 million, a valuation adjustment of $7.4 million associated with the classification of BRS as held for sale, higher office-related expenses of $6.9 million and a $5.6 million impairment of certain acquisition related intangible assets.
Contingent Payment Arrangements
Contingent payment arrangements reflect changes in estimates of contingent payment liabilities associated with acquisitions in current and previous periods, as well as accretion expense of these liabilities. For the years ended December 31, 2023, 2022 and 2021, we recognized $8.8 million, $6.6 million and $3.3 million, respectively, in accretion expense related to our contingent considerations payable. During 2023, we recorded a change in estimate related to the contingent consideration liability associated with the acquisition of Autonomous LLC in 2019 of $14.1 million. The change in estimate was based upon better than expected revenues during the 2023 performance evaluation period. There were no changes in our estimates during the year ended December 31, 2022. During 2021, we recorded a change in estimate related to the contingent consideration liability associated with the acquisition of Ramius Alternative Solutions LLC of $0.6 million. Due to the loss of acquired investment management contracts, the carrying value of the finite-lived intangible assets exceeded the fair value of the contracts. These expenses resulting from changes to expected payments and the accretion of these obligations to their expected payment amounts are reflected within contingent payment arrangements in our consolidated statements of income.
Interest on Borrowings
Interest expense increased $36.5 million in 2023, reflecting higher interest rates on borrowings and higher weighted average borrowings. Average daily borrowings for the EQH facilities and commercial paper were $1,014 million at a weighted average interest rate of 5.1% during 2023 compared to $845.5 million and 1.7% during 2022.
Interest expense increased $12.8 million in 2022, reflecting higher interest rates on borrowings and higher weighted average borrowings. Average daily borrowings for the EQH facilities and commercial paper were $845.5 million at a weighted average interest rate of 1.7% during 2022 compared to $561.6 million and 0.2% during 2021.
Amortization of Intangible Assets
Amortization of intangible assets reflects our amortization of costs assigned to acquired investment management contracts with a finite life. These assets are recognized at fair value and generally are amortized on a straight-line basis over their estimated useful life. On July 1, 2022, AB acquired CarVal Investors L.P. ("CarVal"), which resulted in recording of $303.0 million of finite-lived intangible assets primarily relating to investment management contracts and investor relationships with useful lives ranging from 5 to 10 years (see Note 24 Acquisitions and Divestitures to our consolidated financial statements in Item 8). Amortization of intangible assets increased $20.3 million in 2023. The increase was primarily due to the acquired intangible assets associated with the CarVal acquisition. Amortization of intangible assets increased $20.9 million in 2022. The increase was primarily due to the acquired intangible assets associated with the CarVal acquisition.
Income Taxes
AB, a private limited partnership, is not subject to federal or state corporate income taxes. However, AB is subject to a 4.0% New York City unincorporated business tax (“UBT”). Our domestic corporate subsidiaries are subject to federal, state and local income taxes, and generally are included in the filing of a consolidated federal income tax return. Separate state and local income tax returns also are filed. Foreign corporate subsidiaries generally are subject to taxes in the jurisdictions where they are located.
Income tax expense decreased $10.6 million, or 26.7%, in 2023 compared to 2022. This decrease is primarily driven by a one time tax benefit of $22.4 million resulting from the release of a valuation allowance on a capital loss tax asset due to a tax planning action identified in the fourth quarter of 2023, due to a future restructuring of certain foreign subsidiaries that would not have a material impact on AB operations. This resulted in a lower effective tax rate in 2023 of 3.6% compared to 4.9% in 2022.
Income tax expense decreased $23.1 million, or 36.8%, in 2022 compared to 2021. This decrease is due to lower pre-tax book income and one-time discrete items which resulted in a lower effective tax rate in 2022 of 4.9% compared to 5.2% in 2021.
Net Income (Loss) of Consolidated Entities Attributable to Non-Controlling Interests
Net income (loss) of consolidated entities attributable to non-controlling interests primarily consists of limited partner interests owned by other investors in our consolidated company-sponsored investment funds. In 2023, we had $24.0 million of net income of consolidated entities attributable to non-controlling interests, primarily due to gains on investments held by our consolidated company-sponsored investment funds. In 2022, we had $56.4 million of net loss of consolidated entities attributable to non-controlling interests, primarily due to losses on investments held by our consolidated company-sponsored investment funds. In 2021 we had $5.1 million of net income of consolidated entities attributable to non-controlling interests, primarily due to gains on investments held by our consolidated company-sponsored investment funds.
Capital Resources and Liquidity
Cash flows from operating activities primarily include ABthe receipt of investment advisory and its majority-owned and/or controlled subsidiaries,services fees and other revenues offset by the payment of operating expenses incurred in the normal course of business. Our cash flows from operating activities have historically been positive and sufficient to support our operations. We do not anticipate this to change in the foreseeable future. Cash flows from investing activities generally consist of small capital expenditures and, when applicable, business acquisitions. Cash flows from financing activities primarily consist of issuance and repayment of debt and the repurchase of AB Holding units to fund our long-term deferred compensation plans. We are required to distribute all of our Available Cash Flow to our Unitholders and the General Partner.
During 2023, net cash provided by operating activities was $0.9 billion, compared to $1.1 billion during 2022. The change primarily was due to an increase in fees receivable of $161.1 million, lower earnings of $159.9 million (after non-cash reconciling items), a decrease in broker-dealer related payables (net of receivable and segregated U.S. Treasury Bills activity) of $133.3 million and an increase in deferred sales commissions of $59.8 million, partially offset by net activity of our consolidated entities that are consideredcompany-sponsored investment funds of $166.0 million and an increase in accrued compensation of $127.4 million.During 2022, net cash provided by operating activities was $1.1 billion, compared to be variable interest entities ("VIEs")$1.3 billion during 2021. The change primarily was due to lower earnings of $265.1 million (after non-cash reconciling items), a decrease in accrued compensation of $200.8 million and voting interest entities ("VOEs")a decrease in whichbroker-dealer related payables (net of receivable and segregated U.S. Treasury Bills activity) of $169.2 million, partially offset by net activity of our consolidated company-sponsored investment funds of $252.0 million and an increase in fees receivable of $193.3 million.
During 2023, net cash used in investing activities was $33.6 million, compared to $22.0 million during 2022. The change is due to the acquisition of CarVal, net cash acquired of $40.3 million in 2022, partially offset by lower purchases of furniture, equipment and leasehold improvements of $28.7 million. During 2022, net cash used in investing activities was $22.0 million, compared to $65.7 million during 2021. The change is primarily due to the acquisition of CarVal, net cash acquired of $40.3 million in 2022.
During 2023, net cash used in financing activities was $1.0 billion, compared to $1.1 billion during 2022. The change reflects lower cash distributions to Unitholders of $230.6 million, a decrease in the net purchases of AB has a controlling financial interest. Non-controllingHolding Units to fund long-term incentive compensation plans of $66.5 million and the repayment of CarVal debt of $42.7 million, partially offset by higher net purchases of non-controlling interests on theof consolidated statementscompany-sponsored investment funds of financial condition include the portion$187.1 million and lower net borrowings of debt of $70.7 million. During 2022, net cash used in financing activities was $1.1 billion, compared to $0.9 billion during 2021. The change reflects lower net purchases of non-controlling interests of consolidated company-sponsored investment funds in 2022 of $309.9 million, repayment of CarVal debt of $42.7 million and a decrease in overdrafts payable of $41.6 million, partially offset by higher net borrowings of debt of $155.0 million and a decrease in the net purchases of AB Holding Units to fund long-term incentive compensation plans of $51.3 million.
As of December 31, 2023, AB had $1.0 billion of cash and cash equivalents (excluding cash and cash equivalents of consolidated company-sponsored investment funds and cash held-for-sale), all of which is available for liquidity but consist primarily of cash on deposit for our broker-dealers related to various customer clearing activities and cash held by foreign subsidiaries of $585.8 million.
See Note 12 to our consolidated financial statements in Item 8 for disclosures relating to our debt and credit facilities. We use our debt and credit facilities to seed certain new investment products which may expose us to market risk, credit risk and material gains and losses. To reduce our exposure, we enter into various futures, forwards, options and swaps primarily to economically hedge certain of our seed money investments. While in most cases broad market risks are hedged and are effective in reducing our exposure, our hedgers are imperfect and we may remain exposed to some market risk and credit-related losses in the event of non-performance by counterparties on these derivative instruments.
Our financial condition and access to public and private debt markets should provide adequate liquidity for our general business needs. Management believes that cash flow from operations and the issuance of debt and AB Units or AB Holding Units will provide us with the resources we need to meet our financial obligations. See “Risk Factors” in Item 1A and “Cautions Regarding Forward-Looking Statements” in this Item 7 for a discussion of credit markets and our ability to renew our credit facilities at expiration.
Off-Balance Sheet Arrangements and Aggregate Contractual Obligations
Guarantees
Under various circumstances, AB guarantees the obligations of its consolidated subsidiaries.
AB maintains a guarantee in connection with an $800 million committed, unsecured senior revolving credit facility (the "Credit Facility"). If SCB LLC is unable to meet its obligations, AB will pay the obligations when due or on demand. SCB LLC currently has five uncommitted lines of credit with five financial institutions. Four of these lines of credit permit us to borrow up to an aggregate of approximately $315.0 million, with AB named as an additional borrower, while the other line has no stated limit. AB has guaranteed the obligations of SCB LLC under these lines of credit. AB maintains guarantees totaling $415.0 million for SCB LLC’s five uncommitted lines of credit.
AB maintains a guarantee with a commercial bank, under which we guarantee the obligations in the ordinary course of business of each of SCB LLC, our U.K.-based broker-dealer and our Cayman subsidiary. We also maintain three additional guarantees with other commercial banks under which we guarantee approximately $270.9 million of obligations for our U.K.-based broker-dealer and $99.0 million of obligations for our India-based broker-dealer. In the event that any of these three entities is unable to meet its obligations, AB will pay the obligations when due or on demand.
We also have two smaller guarantees with a commercial bank totaling approximately $1.9 million, under which we guarantee certain obligations in the ordinary course of business of one of our foreign subsidiaries.
We have not been required to perform under any of the above agreements and currently have no liability in connection with these agreements.
Aggregate Contractual Obligations
We have various compensation and benefit obligations, including accrued salaries and fringes, commissions, payroll taxes, incentive payments and deferred compensation arrangements. The majority of our compensation and benefits obligations are paid out in less than one year, while the deferred compensation obligations are payable over various periods, with the majority payable over periods of up to three years. Accrued compensation and benefits as of December 31, 2023 totaled $354.5 million. This amount excludes our accrued pension obligation. Offsetting our accrued compensation obligations are long-term incentive compensation-related investments and money market investments we funded totaling $41.1 million, which are included in our consolidated statement of financial condition. Any amounts reflected on the consolidated statement of financial condition as payables (to broker-dealers, brokerage clients and company-sponsored mutual funds) and accounts payable and accrued expenses are excluded from the aforementioned accrued compensation and benefits obligation amount.
We expect to make contributions to our qualified profit sharing plan of approximately $19.0 million in each of the next four years. We do not have direct equity ownership. All significant inter-company transactionscurrently anticipate that we will contribute to the Retirement Plan during 2024.
The 2017 Tax Act (enacted in the U.S. on December 22, 2017) imposed a federal transition tax on mandatory deemed repatriation of certain deferred foreign earnings. Management elected to pay the transition tax in installments over an eight-year period from 2018 to 2025. The federal transition tax obligation as of December 31, 2023 totaled $8.7 million and balances amongis recorded to income tax payable on our consolidated statement of financial condition. See Note 21 to our consolidated financial statements in Item 8 for further discussion of our taxes.
See Note 13 to our consolidated financial statements in Item 8 for discussion of our leases.
See Note 12 to our consolidated financial statements in Item 8 for a discussion of our debt.
See Note 14 to our consolidated financial statements in Item 8 for a discussion of our commitments and contingencies.
| | |
|
| Critical Accounting Estimates |
|
The preparation of the consolidated entities have been eliminated.
Recently Adopted Accounting Pronouncementsfinancial statements and notes to consolidated financial statements requires management to make estimates and judgments that affect the reported amounts of assets, liabilities, revenues and expenses.
In June 2016,Management believes that the FASB issued ASU 2016-13,critical accounting policies and estimates Financial Instruments - Credit Losses (Topic 326)discussed below. This new guidance related involve significant management judgment due to the sensitivity of the methods and assumptions used.
Goodwill
Our acquisitions are accounted for under the acquisition method of accounting, for credit losseswhere the cost of the acquisition is allocated on financial instrumentsthe basis of the estimated fair value of the assets acquired and introduced an approach basedthe liabilities assumed. The excess of the purchase price over the fair value of identifiable assets acquired, net of liabilities assumed, results in the recognition of goodwill.
As of December 31, 2023, we had goodwill of $3.6 billion on expected losses to estimate credit losses on certain typesthe consolidated statement of financial instruments. It also modifies the impairment model for available-for-sale debt securities and provides for a simplified accounting model for purchased financial assets with credit deterioration since their origination. We adopted this standard prospectively on January 1, 2020. The adoption of this standard did not have a material impact on our financial condition, or results of operations.
In January 2017, the FASB issued ASU 2017-04, Simplifying the Test for Goodwill Impairment. The guidance removed Step 2 of the goodwill impairment test, which had required a hypothetical purchase price allocation. Asincluded $666.1 million as a result of the revised guidance,CarVal Investors L.P. ("CarVal") acquisition in the third quarter of 2022, $2.8 billion as a result of the Sanford C. Bernstein Inc. (“Bernstein”) acquisition in 2000 and $291.9 million in regard to various smaller acquisitions. Approximately $159.8 million of goodwill has been classified as assets held for sale on the consolidated statement of financial condition. For further discussion, see Note 24 Acquisitions and Divestitures in Item 8 to these consolidated financial statements.
We have determined that AB has only one reporting segment and reporting unit. We test our goodwill annually, as of September 30, for impairment or if certain events or changes in circumstances occur and trigger an interim impairment test. The carrying value of goodwill is also reviewed if facts and circumstances occur that suggest possible impairment, such as, but not limited to significant transactions including acquisitions or divestitures and significant declines in AUM, revenues, earnings or the price of an AB Holding Unit. Any of these changes in circumstances could suggest the possibility that goodwill is impaired, but none of these events or circumstances by itself would indicate that it is more likely than not that goodwill is impaired. Instead, they are merely recognized as triggering events for the consideration of impairment and must be viewed in combination with any mitigating or positive factors. A holistic evaluation of all events since the most recent quantitative impairment test must be done to determine whether it is more likely than not that the reporting unit is impaired.
For our annual impairment test, we utilize the market approach where the fair value of the reporting unit is based on its unadjusted market valuation (AB Units outstanding multiplied by AB Holding's Unit price) and earnings multiples. A goodwill impairment willwould be the amount by which a reporting unit's carrying value exceeds its fair value, not to exceed the carrying amount of goodwill. The goodwill impairment test does not include a determination by management of whether a decline in fair value is temporary and it is important that management's determination of fair value reflect the impact of changing market conditions, including the severity and anticipated duration of any such changes. The price of a publicly traded AB Holding Unit serves as a reasonable starting point for valuing an AB Unit because each represents the same fractional interest in our underlying business. Our market approach analysis also includes comparable industry earnings multiples applied to our earnings forecast and assumes a control premium (when applicable).
Contingent Payment Arrangements
We adopted this standard prospectivelyperiodically enter into contingent payment arrangements in connection with our business combinations. In these arrangements, we agree to pay additional consideration to the sellers to the extent that certain performance targets are achieved. We estimate the fair value of these potential future obligations at the time a business combination is consummated and record a liability on January 1, 2020. The adoption of this standard did not have a material impactdiscounted basis on our consolidated statement of financial condition or results of operations.
In August 2018,condition. We then accrete the FASB issued ASU 2018-13, Fair Value Measurement (Topic 820): Disclosure Framework-Changesobligation to its expected payment amount over theDisclosure Requirements for Fair Value Measurement. The amendment measurement period. If our expected payment amount subsequently changes, the obligation is modified in the disclosure requirements for fair value measurements by removing, modifying or adding certain disclosures. We adopted this standard prospectively on January 1, 2020. The adoption of this standard did not have a material impact on our financial condition or results of operations.
In August 2018, the FASB issued ASU 2018-15, Intangibles-Goodwill and Other-Internal-Use Software (Subtopic 350-40): Customer's Accounting for Implementation Costs Incurredcurrent period resulting in a Cloud Computing Arrangement That isgain or loss. Both gains and losses resulting from changes to expected payments and the accretion of these obligations to their expected payment amounts are reflected within contingent payment arrangements in our consolidated statements of income.
For contingent liabilities, we typically use a Service Contract. The amendment aligned the requirements for capitalizing implementation costs incurred in a hosting arrangementvaluation method that is a service contract withform of the requirementsincome approach, whereby a forecast of future cash flows attributable to the asset are discounted to present value using a risk-adjusted discount rate. We develop a forecast of future cash flows attributable to the performance objectives that currently exist in GAAP for capitalizing implementation costs incurredare then discounted to develop or obtain internal-use software. Implementation costs are either capitalized or expensed as incurred depending onpresent value using a risk-adjusted discount rate. Some of the project stage. All costsmore significant estimates and assumptions inherent in the preliminaryincome approach include the amount and post-implementation project stages are expensed as incurred, while certain costs withintiming of projected future cash flows, the application development stage are capitalized. We adopted this standard prospectively on January 1, 2020. The adoption of this standard did not have a material impact on our financial condition or results of operations.
Loss Contingencies
In March 2020, FASB issued ASU 2020-04, Reference Rate Reform (Topic 848): FacilitationManagement continuously reviews with legal counsel the status of regulatory matters and pending or threatened litigation. We evaluate the likelihood that a loss contingency exists and record a loss contingency if it is both probable and reasonably estimable as of the Effectsdate of Reference Ratethe financial statements. See Note 14 to our consolidated financial statements in Item 8.
Accounting Pronouncements
See Note 2 to our consolidated financial statements in Item 8.
Cautions Regarding Forward-Looking Statements
Certain statements provided by management in this report are “forward-looking statements” within the meaning of the Private Securities Litigation Reform Act of 1995. Such forward-looking statements are subject to risks, uncertainties and other factors that could cause actual results to differ materially from future results expressed or implied by such forward-looking statements. The most significant of these factors include, but are not limited to, the following: the performance of financial markets, the investment performance of sponsored investment products and separately managed accounts, general economic conditions, industry trends, future acquisitions, integration of acquired companies, competitive conditions and government regulations, including changes in tax regulations and rates and the manner in which the earnings of publicly-traded partnerships are taxed. We caution readers to carefully consider such factors. Further, these forward-looking statements speak only as of the date on Financial Reportingwhich such statements are made; we undertake no obligation to update any forward-looking statements to reflect events or circumstances after the date of such statements. For further information regarding these forward-looking statements and the factors that could cause actual results to differ, see “Risk Factors” in Item 1A. The amendment was intended to provide temporary optional expedients and exceptionsAny or all of the forward-looking statements that we make in this Form 10-K, other documents we file with or furnish to the SEC, and any other public statements we issue, may turn out to be wrong. It is important to remember that other factors besides those listed in “Risk Factors” and those listed below could also adversely impact our revenues, financial condition, results of operations and business prospects.
The forward-looking statements referred to in the preceding paragraph, most of which directly affect AB but also affect AB Holding because AB Holding’s principal source of income and cash flow is attributable to its investment in AB, include statements regarding:
•Our belief that the cash flow AB Holding realizes from its investment in AB will provide AB Holding with the resources it needs to meet its financial obligations: AB Holding’s cash flow is dependent on the quarterly cash distributions it receives from AB. Accordingly, AB Holding’s ability to meet its financial obligations is dependent on AB’s cash flow from its operations, which is subject to the performance of the capital markets and other factors beyond our control.
•Our financial condition and ability to access the public and private capital markets providing adequate liquidity for our general business needs: Our financial condition is dependent on our cash flow from operations, which is subject to the performance of the capital markets, our ability to maintain and grow client assets under management and other factors beyond our control. Our ability to access public and private capital markets on reasonable terms may be limited by adverse market conditions, our firm’s credit ratings, our profitability and changes in government regulations, including tax rates and interest rates.
•The outcome of litigation: Litigation is inherently unpredictable, and excessive damage awards do occur. Though we have stated that we do not expect any pending legal proceedings to have a material adverse effect on our results of operations, financial condition or liquidity, any settlement or judgment with respect to a legal proceeding could be significant, and could have such an effect.
•The possibility that we will engage in open market purchases of AB Holding Units to help fund anticipated obligations under our incentive compensation award program: The number of AB Holding Units AB may decide to buy in future periods, if any, to help fund incentive compensation awards depends on various factors, some of which are beyond our control, including the fluctuation in the price of an AB Holding Unit (NYSE: AB) and the availability of cash to make these purchases.
•Our determination that adjusted employee compensation expense, excluding the impact of performance-based fees, generally should not exceed 50% of our adjusted net revenues on an annual basis: Aggregate employee compensation reflects employee performance and competitive compensation levels. Fluctuations in our revenues and/or changes in competitive compensation levels could result in adjusted employee compensation expense exceeding 50% of our adjusted net revenues.
•Our Relocation Strategy: While many of the expenses, expense savings and EPU impact we expect will result from our Relocation Strategy are presented with numerical specificity, and we believe these figures to be reasonable as of the date of this report, the uncertainties surrounding the assumptions on which our estimates are based create a significant risk that our current estimates may not be realized. These assumptions include:
•the amount and timing of employee relocation costs, severance, and overlapping compensation and occupancy costs we experience; and
•the timing for execution of each phase of our relocation implementation plan.
Item 7A. Quantitative and Qualitative Disclosures about Market Risk
| | |
|
| Market Risk, Risk Management and Derivative Financial Instruments |
|
Our investments consist of trading and other investments. Trading investments include U.S. GAAP guidanceTreasury Bills, mutual funds, exchange-traded options and various separately-managed portfolios consisting of equity securities. Trading investments are purchased for short-term investment, principally to fund liabilities related to long-term incentive compensation plans and to seed new investment services. Other investments include investments in hedge funds we sponsor and other investment vehicles.
We enter into various futures, forwards, swaps and options primarily to economically hedge our seed capital investments. We do not hold any derivatives designated in a formal hedge relationship under ASC 815-10, Derivatives and Hedging. See Note 7 Derivative Instruments to our consolidated financial statements in Item 8.
Trading and Non-Trading Market Risk Sensitive Instruments
| | |
|
| Investments with Interest Rate Risk—Fair Value |
|
The table below provides our potential exposure with respect to our fixed income investments, measured in terms of fair value, to an immediate 100 basis point increase in interest rates at all maturities from the levels prevailing as of December 31, 2023 and 2022. Such a fluctuation in interest rates is a hypothetical rate scenario used to calibrate potential risk and does not represent our view of future market movements. While these fair value measurements provide a representation of interest rate sensitivity of our investments in fixed income mutual funds and fixed income hedge funds, they are based on contract modificationsour exposures at a particular point in time and may not be representative of future market results. These exposures will change as a result of ongoing changes in investments in response to our assessment of changing market conditions and available investment opportunities:
| | | | | | | | | | | | | | | | | | | | | | | | | | |
| As of December 31 |
| 2023 | 2022 |
| Fair Value | Effect of
+100
Basis Point
Change | Fair Value | Effect of
+100
Basis Point
Change |
| (in thousands) |
| Fixed Income Investments: | | | | | | | | |
| Trading | | $ | 70,750 | | | $ | (4,394) | | | $ | 93,221 | | | $ | (5,789) | |
| | |
|
| Investments with Equity Price Risk—Fair Value |
|
Our investments also include investments in equity securities, mutual funds and hedge accountingfunds. The following table provides our potential exposure with respect to easeour equity investments, measured in terms of fair value, to an immediate 10% decrease in equity prices from those prevailing as of December 31, 2023 and 2022. A 10% decrease in equity prices is a hypothetical scenario used to calibrate potential risk and does not represent our view of future market movements. While these fair value measurements provide a representation of equity price sensitivity of our investments in equity securities, mutual funds and hedge funds, they are based on our exposures at a particular point in time and may not be representative of future market results. These exposures will change as a result of ongoing portfolio activities in response to our assessment of changing market conditions and available investment opportunities:
| | | | | | | | | | | | | | | | | | | | | | | | | | |
| As of December 31 |
| 2023 | 2022 |
| Fair Value | Effect of -10%
Equity Price
Change | Fair Value | Effect of -10%
Equity Price
Change |
| (in thousands) |
| Equity Investments: | | | | | | | | |
| Trading | | $ | 117,434 | | | $ | (11,743) | | | $ | 65,846 | | | $ | (6,585) | |
| Other investments | | $ | 55,371 | | | $ | (5,537) | | | $ | 58,451 | | | $ | (5,845) | |
Item 8. Financial Statements and Supplementary Data
Report of Independent Registered Public Accounting Firm
To the General Partner and Unitholders of AllianceBernstein L.P.
Opinions on the Financial Statements and Internal Control over Financial Reporting
We have audited the accompanying consolidated statements of financial condition of AllianceBernstein L.P. and its subsidiaries (the “Company”) as of December 31, 2023 and 2022, and the related consolidated statements of income, of comprehensive income, of changes in partners’ capital and of cash flows for each of the three years in the period ended December 31, 2023, including the related notes and financial statement schedule listed in the index appearing under Item 15(a) (collectively referred to as the “consolidated financial statements”). We also have audited the Company's internal control over financial reporting as of December 31, 2023, based on criteria established in Internal Control - Integrated Framework (2013) issued by the Committee of Sponsoring Organizations of the Treadway Commission (COSO).
In our opinion, the consolidated financial statements referred to above present fairly, in all material respects, the financial position of the Company as of December 31, 2023 and 2022, and the results of its operations and its cash flows for each of the three years in the period ended December 31, 2023 in conformity with accounting principles generally accepted in the United States of America. Also in our opinion, the Company maintained, in all material respects, effective internal control over financial reporting burdens relatedas of December 31, 2023, based on criteria established in Internal Control - Integrated Framework (2013) issued by the COSO.
Basis for Opinions
The Company's management is responsible for these consolidated financial statements, for maintaining effective internal control over financial reporting, and for its assessment of the effectiveness of internal control over financial reporting, included in Management’s Report on Internal Control Over Financial Reporting appearing under Item 9A. Our responsibility is to express opinions on the Company’s consolidated financial statements and on the Company's internal control over financial reporting based on our audits. We are a public accounting firm registered with the Public Company Accounting Oversight Board (United States) (PCAOB) and are required to be independent with respect to the expected market transition fromCompany in accordance with the London Interbank Offered Rate (LIBOR)U.S. federal securities laws and other interbank offered ratesthe applicable rules and regulations of the Securities and Exchange Commission and the PCAOB.
We conducted our audits in accordance with the standards of the PCAOB. Those standards require that we plan and perform the audits to alternative reference rates. This guidanceobtain reasonable assurance about whether the consolidated financial statements are free of material misstatement, whether due to error or fraud, and whether effective internal control over financial reporting was effective beginningmaintained in all material respects.
Our audits of the consolidated financial statements included performing procedures to assess the risks of material misstatement of the consolidated financial statements, whether due to error or fraud, and performing procedures that respond to those risks. Such procedures included examining, on March 12, 2020,a test basis, evidence regarding the amounts and can be applied to amendments prospectively through December 31, 2022. An entity may elect to applydisclosures in the amendments in this update,consolidated financial statements. Our audits also included evaluating the accounting principles used and significant estimates made by management, as well as amendments include in ASU 2021-01 issued in January 2021, asevaluating the overall presentation of the beginningconsolidated financial statements. Our audit of internal control over financial reporting included obtaining an understanding of internal control over financial reporting, assessing the risk that a material weakness exists, and testing and evaluating the design and operating effectiveness of internal control based on the assessed risk. Our audits also included performing such other procedures as we considered necessary in the circumstances. We believe that our audits provide a reasonable basis for our opinions.
Definition and Limitations of Internal Control over Financial Reporting
A company’s internal control over financial reporting is a process designed to provide reasonable assurance regarding the reliability of financial reporting and the preparation of financial statements for external purposes in accordance with generally accepted accounting principles. A company’s internal control over financial reporting includes those policies and procedures that (i) pertain to the maintenance of records that, in reasonable detail, accurately and fairly reflect the transactions and dispositions of the interim periodassets of the company; (ii) provide reasonable assurance that includes March 12, 2020. We adopted these standards prospectively on January 1, 2020. The adoptiontransactions are recorded as necessary to permit preparation of these standards did notfinancial statements in accordance with generally accepted accounting principles, and that receipts and expenditures of the company are being made only in accordance with authorizations of management and directors of the company; and (iii) provide reasonable assurance regarding prevention or timely detection of unauthorized acquisition, use, or disposition of the company’s assets that could have a material impacteffect on ourthe financial condition or results of operations.statements.
Accounting Pronouncements Not Yet AdoptedBecause of its inherent limitations, internal control over financial reporting may not prevent or detect misstatements. Also, projections of any evaluation of effectiveness to future periods are subject to the risk that controls may become inadequate because of changes in 2020conditions, or that the degree of compliance with the policies or procedures may deteriorate.
Critical Audit Matters
The critical audit matter communicated below is a matter arising from the FASB issued ASU 2018-14, Compensation - Retirement Benefits - Defined Benefit Plans - General (Topic 715-20). The amendment modifiescurrent period audit of the disclosure requirements for employers that sponsor defined benefit pension or other post-retirement plans. The revised guidance is effective forconsolidated financial statements issued for fiscal years beginning after December 15, 2020. The revised guidance will not have a material impact on our financial conditionthat was communicated or results of operations.
In December 2019, the FASB issued ASU 2019-12, Income Taxes (Topic 740): Simplifying the Accounting for Income Taxes. The amendments simplify the accounting for income taxes by removing certain exceptionsrequired to be communicated to the general principles in Topic 740. The amendments also improve consistent application ofaudit committee and simplify US GAAP for other areas of Topic 740 by clarifying and amendingthat (i) relates to accounts or disclosures that are material to the existing guidance. The revised guidance is effective forconsolidated financial statements issued for fiscal years beginning after December 15, 2020.and (ii) involved our especially challenging, subjective, or complex judgments. The revised guidance willcommunication of critical audit matters does not havealter in any way our opinion on the consolidated financial statements, taken as a material impactwhole, and we are not, by communicating the critical audit matter below, providing a separate opinion on our financial conditionthe critical audit matter or results of operations.on the accounts or disclosures to which it relates.
Revenue Recognition
Investment advisoryAs described in Notes 2 and services fees
AB provides asset management services by managing customer assets and seeking to deliver investment returns to investors. Each investment management contract between AB and a customer creates a distinct, separately identifiable performance obligation for each day the customer’s assets are managed as the customer can benefit from each day of service. In accordance with ASC 606, a series of distinct goods and services that are substantially the same and have the same pattern of transfer3 to the customerconsolidated financial statements, the Company’s performance-based fees earned were $144.9 million for the year ended December 31, 2023, which are treated as a single performance obligation. Accordingly, we have determined that our investment and advisory services are performed over time and entitle us to variable consideration earned based on the value of the investors’ assets under management (“AUM”).
We calculate AUM using established market-based valuation methods and fair valuation (non-observable market) methods. Market-based valuation methods include: last sale/settle prices from an exchange for actively-traded listed equities, options and futures; evaluated bid prices from recognized pricing vendors for fixed income, asset-backed or mortgage-backed issues; mid prices from recognized pricing vendors and brokers for credit default swaps; and quoted bids or spreads from pricing vendors and brokers for other derivative products. Fair valuation methods include: discounted cash flow models or any other methodology that is validated and approved by our Valuation Committee (see paragraph immediately below for additional information about our Valuation Committee)(AUM). Fair valuation methods are used only where AUM cannot be valued using market-based valuation methods, such as in the case of private equity or illiquid securities.
The Valuation Committee, which consists of senior officers and employees, is responsible for overseeing the pricing and valuation of all investments held in client and AB portfolios. The Valuation Committee has adopted a Statement of Pricing Policies describing principles and policies that apply to pricing and valuing investments held in these portfolios. We also have a Pricing Group, which reports to the Valuation Committee and is responsible for overseeing the pricing process for all investments.
We record as revenue investment advisory and services base fees, which we generally calculate as a percentage of AUM. At month-end, all the components of the transaction price (i.e., the base fee calculation) are no longer variable and the value of the consideration is determined. These fees are not subject to claw back and there is minimal probability that a significant reversal of the revenue recorded will occur.
The transaction price for the asset management performance obligation for certain investment advisory contracts, including those associated with hedge funds or otherand alternative investments, provide for a performance-based fee, (including carried interest), in addition to athe base advisory fee, which is calculated as either a percentage of absolute investment results or a percentage of investment results in excess of a stated benchmark over a specified period of time. The performance-based fees
are forms of variable consideration and are therefore excluded from the transaction price until it becomes probable that there will not be significant reversal of the cumulative revenue recognized. At each reporting date, we evaluate the constraining factors, discussed below, surrounding the variable consideration to determine the extent to which, if any, revenues associated with the performance-based fee can be recognized.
Constraining factors impacting the amount of variable consideration included in the transaction price include:include the contractual claw-back provisions to which the variable consideration is subject, the length of time to which the uncertainty of the consideration is subject, the number and range of possible consideration amounts, the probability of significant fluctuations in the fund’sAUM market value, and the level at which the fund’sAUM value exceeds the contractual threshold required to earn such a fee,fee. Management calculates AUM using established market-based valuation methods and fair valuation (non-observable market) methods. Fair valuation methods, which include discounted cash flow models and other methods, are used only where AUM cannot be valued using market-based valuation methods, such as in the materialitycase of the amount being evaluated.private equity or illiquid securities.
Bernstein Research ServicesThe principal considerations for our determination that performing procedures relating to performance-based fees is a critical audit matter are (i) a high degree of auditor effort in performing procedures and evaluating audit evidence related to these fees, including evaluating audit evidence related to the assessment of the constraining factors impacting the amount of variable consideration and the calculation of AUM and (ii) the audit effort involved the use of professionals with specialized skill and knowledge.
Bernstein Research Services
Addressing the matter involved performing procedures and evaluating audit evidence in connection with forming our overall opinion on the consolidated financial statements. These procedures included testing the effectiveness of controls relating to management’s revenue consists principallyrecognition process for performance-based fees, including controls over the assessment of commissions received,the constraining factors and the calculation of AUM. These procedures also included, among others (i) testing management’s process for determining performance-based fees, including evaluating the appropriateness of the fair valuation methods used to a lesser but increasing extent, direct payments for trade execution services and providing equity research services to institutional clients. Brokerage commissions for trade execution services and related expenses are recordedcalculate AUM; (ii) evaluating, on a trade-datesample basis, when the performance obligations are satisfied. Generally,reasonableness of the transaction priceconstraining factors related to (a) contractual claw-back provisions to which variable consideration is agreed upon atsubject, (b) the pointlength of each trade and based upontime to which the number of shares traded or the valueuncertainty of the consideration traded. Research revenues are recognized whenis subject, (c) the transaction price is quantified, collectability is assurednumber and range of possible consideration amounts, (d) the probability of significant reversalfluctuations in the AUM market value, and (e) the level at which the AUM value exceeded the contractual threshold required to earn such fees, as applicable. Professionals with specialized skill and knowledge were used to assist in evaluating the reasonableness of such revenue is not probable.the AUM by (i) developing an independent range of prices for a sample of securities in the underlying products where fair valuation methods were used and (ii) comparing the independent range of prices to management’s estimate. Developing the independent range of prices involved testing the completeness and accuracy of data provided by management and independently developing the inputs for the sampled securities.
/s/PricewaterhouseCoopers LLP
Nashville, Tennessee
February 9, 2024
We have served as the Company’s auditor since 2006.
| | |
| AllianceBernstein L.P. and Subsidiaries |
|
Consolidated Statements of Financial Condition
| | | | | | | | | | | | | | |
| Years Ended December 31 |
| 2023 | 2022 |
| (in thousands,
except unit amounts) |
| ASSETS | | | | |
| Cash and cash equivalents | | $ | 1,000,103 | | | $ | 1,130,143 | |
| Cash and securities segregated, at fair value (cost $859,448 and $1,511,916) | | 867,680 | | | 1,522,431 | |
| Receivables, net: | | | | |
| Brokers and dealers | | 53,144 | | | 112,226 | |
| Brokerage clients | | 1,314,656 | | | 1,881,496 | |
| AB funds fees | | 343,334 | | | 314,247 | |
| Other fees | | 125,500 | | | 127,040 | |
| Investments: | | | | |
| Long-term incentive compensation-related | | 40,033 | | | 47,870 | |
| Other | | 203,521 | | | 169,648 | |
| Assets of consolidated company-sponsored investment funds: | | | | |
| Cash and cash equivalents | | 7,739 | | | 19,751 | |
| Investments | | 397,174 | | | 516,536 | |
| Other assets | | 25,299 | | | 44,424 | |
| Furniture, equipment and leasehold improvements, net | | 176,348 | | | 189,258 | |
| Goodwill | | 3,598,591 | | | 3,598,591 | |
| Intangible assets, net | | 264,555 | | | 310,203 | |
| Deferred sales commissions, net | | 87,374 | | | 52,250 | |
| Right-of-use assets | | 323,766 | | | 371,898 | |
| Assets held for sale | | 564,776 | | | 551,351 | |
| Other assets | | 216,213 | | | 179,568 | |
| Total assets | | $ | 9,609,806 | | | $ | 11,138,931 | |
| | | | | | | | | | | | | | |
| Years Ended December 31 |
| 2023 | 2022 |
| (in thousands,
except unit amounts) |
| LIABILITIES, REDEEMABLE NON-CONTROLLING INTEREST AND CAPITAL | | | | |
| Liabilities: | | | | |
| Payables: | | | | |
| Brokers and dealers | | $ | 259,175 | | | $ | 389,828 | |
| | | | |
| Brokerage clients | | 2,200,835 | | | 3,322,903 | |
| AB mutual funds | | 644 | | | 162,291 | |
| Contingent consideration liability | | 252,690 | | | 247,309 | |
| Accounts payable and accrued expenses | | 172,163 | | | 173,466 | |
| Lease liabilities | | 369,017 | | | 427,479 | |
| Liabilities of consolidated company-sponsored investment funds | | 12,537 | | | 55,529 | |
| Accrued compensation and benefits | | 372,305 | | | 415,878 | |
| | | | |
| Debt | | 1,154,316 | | | 990,000 | |
| Liabilities held for sale | | 153,342 | | | 107,952 | |
| Total liabilities | | 4,947,024 | | | 6,292,635 | |
Commitments and contingencies (See Note 14) | | | | |
| Redeemable non-controlling interest of consolidated entities | | 209,420 | | | 368,656 | |
| Capital: | | | | |
| General Partner | | 45,388 | | | 45,985 | |
| Limited partners: 286,609,212 and 285,979,913 units issued and outstanding | | 4,590,619 | | | 4,648,113 | |
| Receivables from affiliates | | (4,490) | | | (4,270) | |
| AB Holding Units held for long-term incentive compensation plans | | (76,363) | | | (95,318) | |
| Accumulated other comprehensive loss | | (106,364) | | | (129,477) | |
| Partners’ capital attributable to AB Unitholders | | 4,448,790 | | | 4,465,033 | |
| Non-redeemable non-controlling interests in consolidated entities | | 4,572 | | | 12,607 | |
| Total capital | | 4,453,362 | | | 4,477,640 | |
| Total liabilities, non-controlling interest and capital | | $ | 9,609,806 | | | $ | 11,138,931 | |
See Accompanying Notes to Consolidated Financial Statements.
| | |
| AllianceBernstein L.P. and Subsidiaries |
|
Consolidated Statements of Income
| | | | | | | | | | | | | | | | | | | | |
| Years Ended December 31 |
| 2023 | 2022 | 2021 |
| (in thousands, except per unit amounts) |
| Revenues: | | | | | | |
| Investment advisory and services fees | | $ | 2,975,468 | | | $ | 2,971,038 | | | $ | 3,194,524 | |
| Bernstein research services | | 386,142 | | | 416,273 | | | 452,017 | |
| Distribution revenues | | 586,263 | | | 607,195 | | | 652,240 | |
| Dividend and interest income | | 199,443 | | | 123,091 | | | 38,734 | |
| Investment gains (losses) | | 14,206 | | | (102,413) | | | (636) | |
| Other revenues | | 101,342 | | | 105,544 | | | 108,409 | |
| Total revenues | | 4,262,864 | | | 4,120,728 | | | 4,445,288 | |
| Less: Broker-dealer related interest expense | | 107,541 | | | 66,438 | | | 3,686 | |
| Net revenues | | 4,155,323 | | | 4,054,290 | | | 4,441,602 | |
| Expenses: | | | | | | |
| Employee compensation and benefits | | 1,769,153 | | | 1,666,636 | | | 1,716,013 | |
| Promotion and servicing: | | | | | | |
| Distribution-related payments | | 610,368 | | | 629,572 | | | 708,117 | |
| Amortization of deferred sales commissions | | 36,817 | | | 34,762 | | | 34,364 | |
| Trade execution, marketing, T&E and other | | 215,643 | | | 215,556 | | | 197,486 | |
| General and administrative | | 581,571 | | | 641,635 | | | 555,608 | |
| | | | | | |
| | | | | | |
| Contingent payment arrangements | | 22,853 | | | 6,563 | | | 2,710 | |
| Interest on borrowings | | 54,394 | | | 17,906 | | | 5,145 | |
| Amortization of intangible assets | | 46,854 | | | 26,564 | | | 5,697 | |
| Total expenses | | 3,337,653 | | | 3,239,194 | | | 3,225,140 | |
| Operating income | | 817,670 | | | 815,096 | | | 1,216,462 | |
| Income tax | | 29,051 | | | 39,639 | | | 62,728 | |
| Net income | | 788,619 | | | 775,457 | | | 1,153,734 | |
| Net income (loss) income of consolidated entities attributable to non-controlling interests | | 24,009 | | | (56,356) | | | 5,111 | |
| Net income attributable to AB Unitholders | | $ | 764,610 | | | $ | 831,813 | | | $ | 1,148,623 | |
| Net income per AB Unit: | | | | | | |
| Basic | | $ | 2.65 | | | $ | 3.01 | | | $ | 4.18 | |
| Diluted | | $ | 2.65 | | | $ | 3.01 | | | $ | 4.18 | |
See Accompanying Notes to Consolidated Financial Statements.
| | |
| AllianceBernstein L.P. and Subsidiaries |
|
Consolidated Statements of Comprehensive Income
| | | | | | | | | | | | | | | | | | | | |
| Years Ended December 31 |
| 2023 | 2022 | 2021 |
| (in thousands) |
| Net income | | $ | 788,619 | | | $ | 775,457 | | | $ | 1,153,734 | |
| Other comprehensive income: | | | | | | |
| Foreign currency translation adjustments, before reclassification and tax: | | 14,262 | | | (47,208) | | | (7,839) | |
| Less: reclassification adjustment for (losses) gains included in net income upon liquidation | | (389) | | | — | | | 4,458 | |
| Foreign currency translation adjustments, before tax | | 14,651 | | | (47,208) | | | (12,297) | |
| Income tax (expense) benefit | | (618) | | | 1,215 | | | 457 | |
| Foreign currency translation adjustments, net of tax | | 14,033 | | | (45,993) | | | (11,840) | |
| | | | | | |
| | | | | | |
| | | | | | |
| | | | | | |
| Changes in employee benefit related items: | | | | | | |
| Amortization of prior service cost | | 24 | | | 24 | | | 24 | |
| Recognized actuarial gain | | 9,135 | | | 6,922 | | | 15,743 | |
| Changes in employee benefit related items | | 9,159 | | | 6,946 | | | 15,767 | |
| Income tax (expense) | | (79) | | | (95) | | | (59) | |
| Employee benefit related items, net of tax | | 9,080 | | | 6,851 | | | 15,708 | |
| | | | | | |
| Other comprehensive gain (loss) | | 23,113 | | | (39,142) | | | 3,868 | |
| Less: Comprehensive income (loss) in consolidated entities attributable to non-controlling interests | | 24,009 | | | (56,356) | | | 5,111 | |
| Comprehensive income attributable to AB Unitholders | | $ | 787,723 | | | $ | 792,671 | | | $ | 1,152,491 | |
See Accompanying Notes to Consolidated Financial Statements.
| | |
| AllianceBernstein L.P. and Subsidiaries |
|
Consolidated Statements of Changes in Partners’ Capital
| | | | | | | | | | | | | | | | | | | | |
| Years Ended December 31 |
| 2023 | 2022 | 2021 |
| (in thousands) |
| General Partner’s Capital | | | | | | |
| Balance, beginning of year | | $ | 45,985 | | | $ | 42,850 | | | $ | 41,776 | |
| Net income | | 7,646 | | | 8,318 | | | 11,486 | |
| Cash distributions to General Partner | | (8,411) | | | (10,715) | | | (10,605) | |
| Long-term incentive compensation plans activity | | (21) | | | 25 | | | 117 | |
| Issuance (retirement) of AB Units, net | | 189 | | | (385) | | | 76 | |
| Issuance of AB Units for CarVal acquisition | | — | | | 5,892 | | | — | |
| | | | | | |
| | | | | | |
| Balance, end of year | | 45,388 | | | 45,985 | | | 42,850 | |
| Limited Partners' Capital | | | | | | |
| Balance, beginning of year | | 4,648,113 | | | 4,336,211 | | | 4,229,485 | |
| Net income | | 756,964 | | | 823,495 | | | 1,137,137 | |
| Cash distributions to Unitholders | | (830,860) | | | (1,059,105) | | | (1,049,287) | |
| Long-term incentive compensation plans activity | | (2,080) | | | 2,521 | | | 11,586 | |
| Issuance (retirement) of AB Units, net | | 18,482 | | | (38,286) | | | 7,290 | |
| Issuance of AB Units for CarVal acquisition | | — | | | 583,277 | | | — | |
| | | | | | |
| | | | | | |
| Balance, end of year | | 4,590,619 | | | 4,648,113 | | | 4,336,211 | |
| Receivables from Affiliates | | | | | | |
| Balance, beginning of year | | (4,270) | | | (8,333) | | | (8,316) | |
| | | | | | |
| | | | | | |
| Long-term incentive compensation awards expense | | 727 | | | 607 | | | 941 | |
| Capital contributions (to) from AB Holding | | (947) | | | 3,456 | | | (958) | |
| Balance, end of year | | (4,490) | | | (4,270) | | | (8,333) | |
| AB Holding Units held for Long-term Incentive Compensation Plans | | | | | | |
| Balance, beginning of year | | (95,318) | | | (119,470) | | | (57,219) | |
| Purchases of AB Holding Units to fund long-term compensation plans, net | | (144,086) | | | (210,568) | | | (261,825) | |
| (Issuance) retirement of AB Units, net | | (17,562) | | | 40,346 | | | (7,348) | |
| Long-term incentive compensation awards expense | | 179,724 | | | 198,783 | | | 215,484 | |
| Re-valuation of AB Holding Units held in rabbi trust | | 879 | | | (4,240) | | | (9,690) | |
| Other | | — | | | (169) | | | 1,128 | |
| Balance, end of year | | (76,363) | | | (95,318) | | | (119,470) | |
| | | | | | |
| | | | | | |
| | | | | | |
| | | | | | |
| | | | | | |
| | | | | | |
| Accumulated Other Comprehensive (Loss) | | | | | | |
| Balance, beginning of year | | (129,477) | | | (90,335) | | | (94,203) | |
| Foreign currency translation adjustment, net of tax | | 14,033 | | | (45,993) | | | (11,840) | |
| Changes in employee benefit related items, net of tax | | 9,080 | | | 6,851 | | | 15,708 | |
| | | | | | |
| | | | | | |
| Balance, end of year | | (106,364) | | | (129,477) | | | (90,335) | |
| Total Partners' Capital attributable to AB Unitholders | | 4,448,790 | | | 4,465,033 | | | 4,160,923 | |
| Non-redeemable Non-controlling Interests in Consolidated Entities | | | | | | |
| Balance, beginning of year | | 12,607 | | | — | | | — | |
| CarVal acquisition | | — | | | 12,607 | | | — | |
| Net income | | 743 | | | — | | | — | |
| | | | | | |
| Distributions to non-controlling interests, net | | (8,514) | | | — | | | — | |
| Adjustment | | (264) | | | — | | | — | |
| Balance, end of year | | 4,572 | | | 12,607 | | | — | |
| Total Capital | | $ | 4,453,362 | | | $ | 4,477,640 | | | $ | 4,160,923 | |
See Accompanying Notes to Consolidated Financial Statements.
| | |
| AllianceBernstein L.P. and Subsidiaries |
|
Consolidated Statements of Cash Flows
| | | | | | | | | | | | | | | | | | | | |
| Years Ended December 31 |
| 2023 | 2022 | 2021 |
| (in thousands) |
| Cash flows from operating activities: | | | | | | |
| Net income | | $ | 788,619 | | | $ | 775,457 | | | $ | 1,153,734 | |
| Adjustments to reconcile net income to net cash provided by operating activities: | | | | | | |
| Amortization of deferred sales commissions | | 36,817 | | | 34,762 | | | 34,364 | |
| Non-cash long-term incentive compensation expense | | 180,451 | | | 199,390 | | | 216,425 | |
| Depreciation and other amortization | | 92,113 | | | 66,617 | | | 44,985 | |
| Unrealized (gains) losses on investments | | (7,810) | | | 40,857 | | | 4,454 | |
| Unrealized (gains) losses on investments of consolidated company-sponsored investment funds | | (48,350) | | | 73,194 | | | 1,882 | |
| | | | | | |
| | | | | | |
| Non-cash lease expense | | 101,761 | | | 99,861 | | | 98,773 | |
| (Gain) loss on assets held for sale | | (800) | | | 7,400 | | | — | |
| Change is estimate of contingent payment arrangements | | 14,050 | | | — | | | — | |
| Other, net | | (4,641) | | | 14,604 | | | 22,580 | |
| Changes in assets and liabilities: | | | | | | |
| | | | | | |
| Decrease (increase) in securities, segregated | | 654,751 | | | (18,474) | | | 249,521 | |
| Decrease (increase) in receivables | | 629,204 | | | 35,410 | | | (360,789) | |
| (Increase) in investments | | (10,656) | | | (10,331) | | | (27,000) | |
| Decrease (increase) in investments of consolidated company-sponsored investment funds | | 167,712 | | | 23,295 | | | (312,325) | |
| (Increase) in deferred sales commissions | | (71,941) | | | (12,113) | | | (45,197) | |
| (Increase) in other assets | | (36,263) | | | (5,487) | | | (6,578) | |
| (Increase) decrease in other assets and liabilities of consolidated company-sponsored investment funds, net | | (23,867) | | | (45,432) | | | 38,161 | |
| (Decrease) increase in payables | | (1,451,280) | | | 110,112 | | | 214,139 | |
| | | | | | |
| (Decrease) increase in accounts payable and accrued expenses | | (6,992) | | | (8,424) | | | 35,877 | |
| (Decrease) increase in accrued compensation and benefits | | (22,848) | | | (150,285) | | | 50,545 | |
| Cash payments to relieve operating lease liabilities | | (107,738) | | | (109,182) | | | (114,769) | |
| Net cash provided by operating activities | | 872,292 | | | 1,121,231 | | | 1,298,782 | |
| | | | | | |
| Cash flows from investing activities: | | | | | | |
| | | | | | |
| | | | | | |
| Purchases of furniture, equipment and leasehold improvements | | (33,627) | | | (62,308) | | | (61,931) | |
| | | | | | |
| | | | | | |
| Acquisition of businesses, net of cash acquired | | — | | | 40,282 | | | (3,793) | |
| Net cash used in investing activities | | (33,627) | | | (22,026) | | | (65,724) | |
| | | | | | |
| | | | | | |
| Cash flows from financing activities: | | | | | | |
| Proceeds from debt, net | | 164,316 | | | 235,000 | | | 80,000 | |
| (Decrease) increase in overdrafts payable | | — | | | (25,411) | | | 16,192 | |
| Distributions to General Partner and Unitholders | | (839,271) | | | (1,069,820) | | | (1,059,892) | |
| | | | | | |
| (Redemptions) subscriptions of non-controlling interests of consolidated company-sponsored investment funds, net | | (183,245) | | | 3,843 | | | 313,699 | |
| Capital contributions (to) from affiliates | | (2,164) | | | 1,590 | | | (2,346) | |
| | | | | | |
| Additional investments by AB Holding with proceeds from exercise of compensatory options to buy AB Holding Units | | — | | | 178 | | | 3,402 | |
| Purchases of AB Holding Units to fund long-term incentive compensation plan awards, net | | (144,086) | | | (210,568) | | | (261,825) | |
| Payment of acquisition-related debt obligation | | — | | | (42,661) | | | — | |
| Other, net | | (4,870) | | | (2,131) | | | (2,186) | |
| Net cash used in financing activities | | (1,009,320) | | | (1,109,980) | | | (912,956) | |
| Effect of exchange rate changes on cash and cash equivalents | | 22,527 | | | (56,234) | | | (17,982) | |
| Net (decrease) increase in cash and cash equivalents | | (148,128) | | | (67,009) | | | 302,120 | |
| Cash and cash equivalents as of beginning of the period | | 1,309,017 | | | 1,376,026 | | | 1,073,906 | |
| Cash and cash equivalents as of end of the period | | $ | 1,160,889 | | | $ | 1,309,017 | | | $ | 1,376,026 | |
| | | | | | |
| Cash paid: | | | | | | |
| Interest paid | | $ | 155,335 | | | $ | 78,434 | | | $ | 5,263 | |
| Income taxes paid | | 57,261 | | | 55,473 | | | 55,656 | |
| | | | | | |
| Non-cash investing activities: | | | | | | |
| Fair value of assets acquired (excluding cash acquired of zero, $40.8 million and $2.8 million, for 2023, 2022 and 2021, respectively) | | — | | | 1,085,141 | | | 13,235 | |
| Fair value of deferred tax asset recorded | | — | | | 5,072 | | | — | |
| Fair value of liabilities assumed | | — | | | 296,750 | | | 1,642 | |
| Fair value of non-redeemable non-controlling interest recorded | | — | | | 13,191 | | | — | |
| Non-cash financing activities: | | | | | | |
| Payables recorded under contingent payment arrangements | | — | | | 231,385 | | | 7,800 | |
| Equity consideration issued in connection with acquisition | | — | | | 589,169 | | | — | |
See Accompanying Notes to Consolidated Financial Statements.
| | |
| AllianceBernstein L.P. and Subsidiaries |
|
Notes to Consolidated Financial Statements
The words “we” and “our” refer collectively to AllianceBernstein L.P. and its subsidiaries (“AB”), or to their officers and employees. Similarly, the word “company” refers to AB. Cross-references are in italics.
1. Business Description and Organization
We provide diversified investment management, research and related services globally to a broad range of clients. Our principal services include:
•Institutional Services—servicing our institutional clients, including private and public pension plans, foundations and endowments, insurance companies, central banks and governments worldwide, and affiliates such as Equitable Holdings, Inc. ("EQH") and its subsidiaries, by means of separately managed accounts, sub-advisory relationships, structured products, collective investment trusts, mutual funds, hedge funds and other investment vehicles.
•Retail Services—servicing our retail clients, primarily by means of retail mutual funds sponsored by AB or an affiliated company, sub-advisory relationships with mutual funds sponsored by third parties, separately managed account programs sponsored by financial intermediaries worldwide and other investment vehicles.
•Private Wealth Management Services—servicing our private clients, including high-net-worth individuals and families, trusts and estates, charitable foundations, partnerships, private and family corporations, and other entities, by means of separately managed accounts, hedge funds, mutual funds and other investment vehicles.
•Bernstein Research Services—servicing institutional investors, such as pension fund, hedge fund and mutual fund managers, seeking high-quality fundamental research, quantitative services and brokerage-related services in equities and listed options.
We also provide distribution, shareholder servicing, transfer agency services and administrative services to the mutual funds we sponsor.
Our high-quality, in-depth research is the foundation of our asset management and private wealth management businesses. Our research disciplines include economic, fundamental equity, fixed income and quantitative research. In addition, we have expertise in multi-asset strategies, wealth management, environmental, social and corporate governance ("ESG"), and alternative investments.
We provide a broad range of investment services with expertise in:
•Actively managed equity strategies across global and regional universes, as well as capitalization ranges, concentration ranges and investment strategies, including value, growth and core equities;
•Actively managed traditional and unconstrained fixed income strategies, including taxable and tax-exempt strategies;
•Actively managed alternative investments, including fundamental and systematically-driven hedge funds, fund of hedge funds and direct assets (e.g., direct lending, real estate debt and private equity);
•Portfolios with Purpose, including Sustainable, Impact and Responsible+ (Climate-Conscious and ESG leaders) equity, fixed income and multi-asset strategies that address our clients' desire to invest their capital with a dedicated ESG focus, while pursuing strong investment returns;
•Multi-asset services and solutions, including dynamic asset allocation, customized target-date funds and target-risk funds; and
•Passively managed equity and fixed income strategies, including index, ESG index and enhanced index strategies.
Organization
As of December 31, 2023, EQH owned approximately 3.5% of the issued and outstanding units representing assignments of beneficial ownership of limited partnership interests in AllianceBernstein Holding L.P. (“AB Holding Units”). AllianceBernstein Corporation (an indirect wholly-owned subsidiary of EQH, “General Partner”) is the general partner of both AllianceBernstein Holding L.P. (“AB Holding”) and AB. AllianceBernstein Corporation owns 100,000 general partnership units in AB Holding and a 1.0% general partnership interest in AB.
As of December 31, 2023, the ownership structure of AB, including limited partnership units outstanding as well as the general partner's 1.0% interest, was as follows:
| | | | | |
| EQH and its subsidiaries | 59.8 | % |
| AB Holding | 39.5 | |
| Unaffiliated holders | 0.7 | |
| 100.0 | % |
Including both the general partnership and limited partnership interests in AB Holding and AB, EQH and its subsidiaries had an approximate 61.2% economic interest in AB as of December 31, 2023.
2. Summary of Significant Accounting Policies
Basis of Presentation
The consolidated financial statements have been prepared in accordance with accounting principles generally accepted in the United States of America ("US GAAP"). The preparation of the consolidated financial statements requires management to make certain estimates and assumptions that affect the reported amounts of assets and liabilities and disclosure of contingent assets and liabilities at the dates of the consolidated financial statements and the reported amounts of revenues and expenses during the reporting periods. Actual results could differ from those estimates.
Distribution Revenues
Two of our subsidiaries act as distributors and/or placement agents of company-sponsored mutual funds and receive distribution services fees from certain of those funds as full or partial reimbursement of the distribution expenses they incur. Period-over-period fluctuations of distribution revenues typically are in line with fluctuations of the corresponding average AUM of these mutual funds.
Distribution revenues decreased $20.9 million, or 3.4%, in 2023, primarily due to a shift in product mix from mutual funds with higher distribution rates to mutual funds with lower distribution rates, as well as a 1.4% decrease in the corresponding average AUM of these mutual funds. Distribution revenues decreased $45.0 million, or 6.9%, in 2022, primarily due to the corresponding average AUM of these mutual funds decreasing 12.4%, partially offset by a shift in product mix from mutual funds with lower distribution rates to mutual funds with higher distribution rates.
Dividend and Interest Income and Interest Expense
Dividend and interest income consists primarily of investment income and interest earned on customer margin balances and U.S. Treasury Bills as well as dividend and interest income in our consolidated company-sponsored investment funds. Interest expense principally reflects interest accrued on cash balances in customers’ brokerage accounts.
Dividend and interest income increased $76.4 million, or 62.0%, in 2023, primarily due to higher interest earned on customer margin balances and higher interest earned on U.S. Treasury Bills. Interest expense increased $41.1 million in 2023, due to higher interest paid on cash balances in customers' brokerage accounts.
Dividend and interest income increased $84.4 million in 2022, primarily due to higher interest earned on customer margin balances, higher interest earned on U.S. Treasury Bills as well as higher dividend and interest income in our consolidated company-sponsored investment funds. Interest expense increased $62.8 million, in 2022, due to higher interest paid on cash balances in customers' brokerage accounts.
Investment Gains (Losses)
Investment gains (losses) consist primarily of realized and unrealized investment gains or losses on: (i) employee long-term incentive compensation-related investments, (ii) U.S. Treasury Bills, (iii) market-making in exchange-traded options and equities, (iv) seed capital investments, (v) derivatives and (vi) investments in our consolidated company-sponsored investment funds. Investment gains (losses) also include equity in earnings of proprietary investments in limited partnership hedge funds that we sponsor and manage.
Investment gains (losses) are as follows:
| | | | | | | | | | | | | | | | | | | | |
| | Years Ended December 31 |
| | 2023 | 2022 | 2021 |
| | (in thousands) |
| Long-term incentive compensation-related investments: | | | | | | |
| Realized gains | | $ | 6,573 | | | $ | 1,345 | | | $ | 2,213 | |
| Unrealized (losses) gains | | (1,707) | | | (10,626) | | | 2,446 | |
| | | | | | |
| | | | | | |
| | | | | | |
| | | | | | |
| | | | | | |
| | | | | | |
| | | | | | |
| | | | | | |
| | | | | | |
| Investments held by consolidated company-sponsored investment funds: | | | | | | |
| Realized (losses) | | (32,125) | | | (46,293) | | | (2,341) | |
| Unrealized gains (losses) | | 48,350 | | | (73,194) | | | (1,882) | |
| | | | | | |
| Seed capital investments: | | | | | | |
| Realized (losses) gains | | | | | | |
| Seed capital and other | | (34) | | | 17,272 | | | 20,263 | |
| Derivatives | | (7,588) | | | 41,236 | | | (22,313) | |
| Unrealized gains (losses) | | | | | | |
| Seed capital and other | | 10,099 | | | (31,261) | | | (6,907) | |
| Derivatives | | (8,717) | | | (177) | | | 8,992 | |
| | | | | | |
| Brokerage-related investments: | | | | | | |
| Realized (losses) | | (203) | | | (1,384) | | | (829) | |
| Unrealized (losses) gains | | (442) | | | 669 | | | (278) | |
| | | $ | 14,206 | | | $ | (102,413) | | | $ | (636) | |
Other Revenues
Other revenues consist of fees earned for transfer agency services provided to company-sponsored mutual funds, fees earned for administration and recordkeeping services provided to company-sponsored mutual funds and the General Accounts of EQH and its subsidiaries, and other miscellaneous revenues. Other revenues decreased $4.2 million, or 4.0%, in 2023, primarily due to lower shareholder servicing fees and lower brokerage income, partially offset by higher mutual fund reimbursements. Other revenues decreased $2.9 million, or 2.6%, in 2022, primarily due to lower shareholder servicing fees.
Expenses
The components of expenses are as follows:
| | | | | | | | | | | | | | | | | | | | | | | | | | | | | |
| | Years Ended December 31 | | % Change |
| | 2023 | 2022 | 2021 | | 2023-22 | 2022-21 |
| | (in thousands) | | | |
| Employee compensation and benefits | | 1,769,153 | | | $ | 1,666,636 | | | $ | 1,716,013 | | | 6.2 | % | (2.9 | %) |
| Promotion and servicing: | | | | | | | | | |
| Distribution-related payments | | 610,368 | | | 629,572 | | | 708,117 | | | (3.1) | | (11.1) | |
| Amortization of deferred sales commissions | | 36,817 | | | 34,762 | | | 34,364 | | | 5.9 | | 1.2 | |
| Trade execution, marketing, T&E and other | | 215,643 | | | 215,556 | | | 197,486 | | | — | | 9.2 | |
| | | 862,828 | | | 879,890 | | | 939,967 | | | (1.9) | | (6.4) | |
| General and administrative | | 581,571 | | | 641,635 | | | 555,608 | | | (9.4) | | 15.5 | |
| | | | | | | | | |
| Contingent payment arrangements | | 22,853 | | | 6,563 | | | 2,710 | | | n/m | 142.2 | |
| Interest on borrowings | | 54,394 | | | 17,906 | | | 5,145 | | | n/m | n/m |
| Amortization of intangible assets | | 46,854 | | | 26,564 | | | 5,697 | | | 76.4 | | n/m |
| Total | | $ | 3,337,653 | | | $ | 3,239,194 | | | $ | 3,225,140 | | | 3.0 | % | 0.4 | % |
Employee Compensation and Benefits
Employee compensation and benefits consist of base compensation (including salaries and severance), annual short-term incentive compensation awards (cash bonuses), annual long-term incentive compensation awards, commissions, fringe benefits and other employment costs (including recruitment, training, temporary help and meals).
Compensation expense as a percentage of net revenues was 42.6%, 41.1% and 38.6% for the years ended December 31, 2023, 2022 and 2021, respectively. Compensation expense generally is determined on a discretionary basis and is primarily a function of our firm’s current-year financial performance. The amounts of incentive compensation we award are designed to motivate, reward and retain top talent while aligning our executives' interests with the interests of our Unitholders. Senior management, together with the Compensation and Workplace Practices Committee of the Board of Directors of AllianceBernstein Corporation (“Compensation Committee”), continue to believe that the appropriate metric to consider in determining the amount of incentive compensation is the ratio of adjusted employee compensation and benefits expense to adjusted net revenues. Adjusted net revenues used in the adjusted compensation ratio are the same as the adjusted net revenues presented as a non-GAAP measure (discussed earlier in this Item 7). Adjusted employee compensation and benefits expense is total employee compensation and benefits expense minus other employment costs such as recruitment, training, temporary help and meals (which were 1.1%, 1.1% and 0.9% of adjusted net revenues for 2023, 2022 and 2021, respectively), and excludes the impact of mark-to-market vesting expense, as well as dividends and interest expense, associated with employee long-term incentive compensation-related investments and the amortization expense associated with the awards issued by EQH to some of our firm's executives relating to their roles as members of the EQH Management Committee. Senior management, with the approval of the Compensation Committee, has established as an objective that adjusted employee compensation and benefits expense, excluding the impact of performance-based fees, generally should not exceed 50% of our adjusted net revenues in any year, except in unexpected or unusual circumstances. Our ratios of adjusted compensation expense as a percentage of adjusted net revenues were 49.0%, 48.4% and 46.5%, respectively, for the years ended December 31, 2023, 2022 and 2021.
In 2023, employee compensation and benefits expense increased $102.5 million, or 6.2%, primarily due to higher base compensation of $72.2 million, higher incentive compensation of $51.7 million and higher fringes of $7.8 million, partially offset by lower commissions of $29.0 million. In 2022, employee compensation and benefits expense decreased $49.4 million, or 2.9%, primarily due to lower incentive compensation of $107.7 million, partially offset by higher base compensation of $39.8 million, higher commissions of $12.7 million and higher other employment costs of $5.3 million.
Promotion and Servicing
Promotion and servicing expenses include distribution-related payments to financial intermediaries for distribution of AB mutual funds and amortization of deferred sales commissions paid to financial intermediaries for the sale of back-end load shares of AB mutual funds. Also included in this expense category are costs related to trade execution and clearance, travel and entertainment, advertising and promotional materials.
Promotion and servicing expenses decreased $17.1 million, or 1.9%, in 2023. The decrease was due to lower distribution-related payments of $19.2 million, lower trade execution and clearance expenses of $9.0 million and lower transfer fees of $3.0 million, offset by higher travel and entertainment expenses of $8.5 million, higher marketing and communication expenses of $3.5 million and higher amortization of deferred sales commissions of $2.1 million. Promotion and servicing expenses decreased $60.1 million, or 6.4%, in 2022. The decrease was primarily due to lower distribution-related payments of $78.5 million, lower transfer fees of $4.9 million and lower trade execution and clearance expenses of $3.1 million, partially offset by higher travel and entertainment expenses of $15.4 million and higher firm meeting expenses of $8.8 million.
General and Administrative
General and administrative expenses include portfolio services fees, technology fees, professional fees and office-related expenses (occupancy, communications and similar expenses). General and administrative expenses as a percentage of net revenues were 14.0%, 15.8% and 12.5% for the years ended December 31, 2023, 2022 and 2021, respectively. General and administrative expenses decreased $60.1 million, or 9.4%, in 2023. The decrease was primarily due to lower portfolio services fees of $43.7 million, lower professional fees of $18.0 million, lower valuation adjustments related to the classification of Bernstein Research Services as held for sale of $6.0 million and a favorable foreign exchange translation impact of $5.7 million, partially offset by higher office-related expenses of $7.4 million. General and administrative expenses increased $86.0 million, or 15.5%, in 2022. The increase was primarily due to higher professional fees of $27.3 million, higher portfolio services fees of $21.3 million, higher technology fees of $19.1 million, a valuation adjustment of $7.4 million associated with the classification of BRS as held for sale, higher office-related expenses of $6.9 million and a $5.6 million impairment of certain acquisition related intangible assets.
Contingent Payment Arrangements
Contingent payment arrangements reflect changes in estimates of contingent payment liabilities associated with acquisitions in current and previous periods, as well as accretion expense of these liabilities. For the years ended December 31, 2023, 2022 and 2021, we recognized $8.8 million, $6.6 million and $3.3 million, respectively, in accretion expense related to our contingent considerations payable. During 2023, we recorded a change in estimate related to the contingent consideration liability associated with the acquisition of Autonomous LLC in 2019 of $14.1 million. The change in estimate was based upon better than expected revenues during the 2023 performance evaluation period. There were no changes in our estimates during the year ended December 31, 2022. During 2021, we recorded a change in estimate related to the contingent consideration liability associated with the acquisition of Ramius Alternative Solutions LLC of $0.6 million. Due to the loss of acquired investment management contracts, the carrying value of the finite-lived intangible assets exceeded the fair value of the contracts. These expenses resulting from changes to expected payments and the accretion of these obligations to their expected payment amounts are reflected within contingent payment arrangements in our consolidated statements of income.
Interest on Borrowings
Interest expense increased $36.5 million in 2023, reflecting higher interest rates on borrowings and higher weighted average borrowings. Average daily borrowings for the EQH facilities and commercial paper were $1,014 million at a weighted average interest rate of 5.1% during 2023 compared to $845.5 million and 1.7% during 2022.
Interest expense increased $12.8 million in 2022, reflecting higher interest rates on borrowings and higher weighted average borrowings. Average daily borrowings for the EQH facilities and commercial paper were $845.5 million at a weighted average interest rate of 1.7% during 2022 compared to $561.6 million and 0.2% during 2021.
Amortization of Intangible Assets
Amortization of intangible assets reflects our amortization of costs assigned to acquired investment management contracts with a finite life. These assets are recognized at fair value and generally are amortized on a straight-line basis over their estimated useful life. On July 1, 2022, AB acquired CarVal Investors L.P. ("CarVal"), which resulted in recording of $303.0 million of finite-lived intangible assets primarily relating to investment management contracts and investor relationships with useful lives ranging from 5 to 10 years (see Note 24 Acquisitions and Divestitures to our consolidated financial statements in Item 8). Amortization of intangible assets increased $20.3 million in 2023. The increase was primarily due to the acquired intangible assets associated with the CarVal acquisition. Amortization of intangible assets increased $20.9 million in 2022. The increase was primarily due to the acquired intangible assets associated with the CarVal acquisition.
Income Taxes
AB, a private limited partnership, is not subject to federal or state corporate income taxes. However, AB is subject to a 4.0% New York City unincorporated business tax (“UBT”). Our domestic corporate subsidiaries are subject to federal, state and local income taxes, and generally are included in the filing of a consolidated federal income tax return. Separate state and local income tax returns also are filed. Foreign corporate subsidiaries generally are subject to taxes in the jurisdictions where they are located.
Income tax expense decreased $10.6 million, or 26.7%, in 2023 compared to 2022. This decrease is primarily driven by a one time tax benefit of $22.4 million resulting from the release of a valuation allowance on a capital loss tax asset due to a tax planning action identified in the fourth quarter of 2023, due to a future restructuring of certain foreign subsidiaries that would not have a material impact on AB operations. This resulted in a lower effective tax rate in 2023 of 3.6% compared to 4.9% in 2022.
Income tax expense decreased $23.1 million, or 36.8%, in 2022 compared to 2021. This decrease is due to lower pre-tax book income and one-time discrete items which resulted in a lower effective tax rate in 2022 of 4.9% compared to 5.2% in 2021.
Net Income (Loss) of Consolidated Entities Attributable to Non-Controlling Interests
Net income (loss) of consolidated entities attributable to non-controlling interests primarily consists of limited partner interests owned by other investors in our consolidated company-sponsored investment funds. In 2023, we had $24.0 million of net income of consolidated entities attributable to non-controlling interests, primarily due to gains on investments held by our consolidated company-sponsored investment funds. In 2022, we had $56.4 million of net loss of consolidated entities attributable to non-controlling interests, primarily due to losses on investments held by our consolidated company-sponsored investment funds. In 2021 we had $5.1 million of net income of consolidated entities attributable to non-controlling interests, primarily due to gains on investments held by our consolidated company-sponsored investment funds.
Capital Resources and Liquidity
Cash flows from operating activities primarily include the receipt of investment advisory and services fees and other revenues offset by the payment of operating expenses incurred in the normal course of business. Our cash flows from operating activities have historically been positive and sufficient to support our operations. We do not anticipate this to change in the foreseeable future. Cash flows from investing activities generally consist of small capital expenditures and, when applicable, business acquisitions. Cash flows from financing activities primarily consist of issuance and repayment of debt and the repurchase of AB Holding units to fund our long-term deferred compensation plans. We are required to distribute all of our Available Cash Flow to our Unitholders and the General Partner.
During 2023, net cash provided by operating activities was $0.9 billion, compared to $1.1 billion during 2022. The change primarily was due to an increase in fees receivable of $161.1 million, lower earnings of $159.9 million (after non-cash reconciling items), a decrease in broker-dealer related payables (net of receivable and segregated U.S. Treasury Bills activity) of $133.3 million and an increase in deferred sales commissions of $59.8 million, partially offset by net activity of our consolidated company-sponsored investment funds of $166.0 million and an increase in accrued compensation of $127.4 million.During 2022, net cash provided by operating activities was $1.1 billion, compared to $1.3 billion during 2021. The change primarily was due to lower earnings of $265.1 million (after non-cash reconciling items), a decrease in accrued compensation of $200.8 million and a decrease in broker-dealer related payables (net of receivable and segregated U.S. Treasury Bills activity) of $169.2 million, partially offset by net activity of our consolidated company-sponsored investment funds of $252.0 million and an increase in fees receivable of $193.3 million.
During 2023, net cash used in investing activities was $33.6 million, compared to $22.0 million during 2022. The change is due to the acquisition of CarVal, net cash acquired of $40.3 million in 2022, partially offset by lower purchases of furniture, equipment and leasehold improvements of $28.7 million. During 2022, net cash used in investing activities was $22.0 million, compared to $65.7 million during 2021. The change is primarily due to the acquisition of CarVal, net cash acquired of $40.3 million in 2022.
During 2023, net cash used in financing activities was $1.0 billion, compared to $1.1 billion during 2022. The change reflects lower cash distributions to Unitholders of $230.6 million, a decrease in the net purchases of AB Holding Units to fund long-term incentive compensation plans of $66.5 million and the repayment of CarVal debt of $42.7 million, partially offset by higher net purchases of non-controlling interests of consolidated company-sponsored investment funds of $187.1 million and lower net borrowings of debt of $70.7 million. During 2022, net cash used in financing activities was $1.1 billion, compared to $0.9 billion during 2021. The change reflects lower net purchases of non-controlling interests of consolidated company-sponsored investment funds in 2022 of $309.9 million, repayment of CarVal debt of $42.7 million and a decrease in overdrafts payable of $41.6 million, partially offset by higher net borrowings of debt of $155.0 million and a decrease in the net purchases of AB Holding Units to fund long-term incentive compensation plans of $51.3 million.
As of December 31, 2023, AB had $1.0 billion of cash and cash equivalents (excluding cash and cash equivalents of consolidated company-sponsored investment funds and cash held-for-sale), all of which is available for liquidity but consist primarily of cash on deposit for our broker-dealers related to various customer clearing activities and cash held by foreign subsidiaries of $585.8 million.
See Note 12 to our consolidated financial statements in Item 8 for disclosures relating to our debt and credit facilities. We use our debt and credit facilities to seed certain new investment products which may expose us to market risk, credit risk and material gains and losses. To reduce our exposure, we enter into various futures, forwards, options and swaps primarily to economically hedge certain of our seed money investments. While in most cases broad market risks are hedged and are effective in reducing our exposure, our hedgers are imperfect and we may remain exposed to some market risk and credit-related losses in the event of non-performance by counterparties on these derivative instruments.
Our financial condition and access to public and private debt markets should provide adequate liquidity for our general business needs. Management believes that cash flow from operations and the issuance of debt and AB Units or AB Holding Units will provide us with the resources we need to meet our financial obligations. See “Risk Factors” in Item 1A and “Cautions Regarding Forward-Looking Statements” in this Item 7 for a discussion of credit markets and our ability to renew our credit facilities at expiration.
Off-Balance Sheet Arrangements and Aggregate Contractual Obligations
Guarantees
Under various circumstances, AB guarantees the obligations of its consolidated subsidiaries.
AB maintains a guarantee in connection with an $800 million committed, unsecured senior revolving credit facility (the "Credit Facility"). If SCB LLC is unable to meet its obligations, AB will pay the obligations when due or on demand. SCB LLC currently has five uncommitted lines of credit with five financial institutions. Four of these lines of credit permit us to borrow up to an aggregate of approximately $315.0 million, with AB named as an additional borrower, while the other line has no stated limit. AB has guaranteed the obligations of SCB LLC under these lines of credit. AB maintains guarantees totaling $415.0 million for SCB LLC’s five uncommitted lines of credit.
AB maintains a guarantee with a commercial bank, under which we guarantee the obligations in the ordinary course of business of each of SCB LLC, our U.K.-based broker-dealer and our Cayman subsidiary. We also maintain three additional guarantees with other commercial banks under which we guarantee approximately $270.9 million of obligations for our U.K.-based broker-dealer and $99.0 million of obligations for our India-based broker-dealer. In the event that any of these three entities is unable to meet its obligations, AB will pay the obligations when due or on demand.
We also have two smaller guarantees with a commercial bank totaling approximately $1.9 million, under which we guarantee certain obligations in the ordinary course of business of one of our foreign subsidiaries.
We have not been required to perform under any of the above agreements and currently have no liability in connection with these agreements.
Aggregate Contractual Obligations
We have various compensation and benefit obligations, including accrued salaries and fringes, commissions, payroll taxes, incentive payments and deferred compensation arrangements. The majority of our compensation and benefits obligations are paid out in less than one year, while the deferred compensation obligations are payable over various periods, with the majority payable over periods of up to three years. Accrued compensation and benefits as of December 31, 2023 totaled $354.5 million. This amount excludes our accrued pension obligation. Offsetting our accrued compensation obligations are long-term incentive compensation-related investments and money market investments we funded totaling $41.1 million, which are included in our consolidated statement of financial condition. Any amounts reflected on the consolidated statement of financial condition as payables (to broker-dealers, brokerage clients and company-sponsored mutual funds) and accounts payable and accrued expenses are excluded from the aforementioned accrued compensation and benefits obligation amount.
We expect to make contributions to our qualified profit sharing plan of approximately $19.0 million in each of the next four years. We do not currently anticipate that we will contribute to the Retirement Plan during 2024.
The 2017 Tax Act (enacted in the U.S. on December 22, 2017) imposed a federal transition tax on mandatory deemed repatriation of certain deferred foreign earnings. Management elected to pay the transition tax in installments over an eight-year period from 2018 to 2025. The federal transition tax obligation as of December 31, 2023 totaled $8.7 million and is recorded to income tax payable on our consolidated statement of financial condition. See Note 21 to our consolidated financial statements in Item 8 for further discussion of our taxes.
See Note 13 to our consolidated financial statements in Item 8 for discussion of our leases.
See Note 12 to our consolidated financial statements in Item 8 for a discussion of our debt.
See Note 14 to our consolidated financial statements in Item 8 for a discussion of our commitments and contingencies.
| | |
|
| Critical Accounting Estimates |
|
The preparation of the consolidated financial statements and notes to consolidated financial statements requires management to make estimates and judgments that affect the reported amounts of assets, liabilities, revenues and expenses.
Management believes that the critical accounting policies and estimates discussed below involve significant management judgment due to the sensitivity of the methods and assumptions used.
Goodwill
Our acquisitions are accounted for under the acquisition method of accounting, where the cost of the acquisition is allocated on the basis of the estimated fair value of the assets acquired and the liabilities assumed. The excess of the purchase price over the fair value of identifiable assets acquired, net of liabilities assumed, results in the recognition of goodwill.
As of December 31, 2023, we had goodwill of $3.6 billion on the consolidated statement of financial condition, which included $666.1 million as a result of the CarVal Investors L.P. ("CarVal") acquisition in the third quarter of 2022, $2.8 billion as a result of the Sanford C. Bernstein Inc. (“Bernstein”) acquisition in 2000 and $291.9 million in regard to various smaller acquisitions. Approximately $159.8 million of goodwill has been classified as assets held for sale on the consolidated statement of financial condition. For further discussion, see Note 24 Acquisitions and Divestitures in Item 8 to these consolidated financial statements.
We have determined that AB has only one reporting segment and reporting unit. We test our goodwill annually, as of September 30, for impairment or if certain events or changes in circumstances occur and trigger an interim impairment test. The carrying value of goodwill is also reviewed if facts and circumstances occur that suggest possible impairment, such as, but not limited to significant transactions including acquisitions or divestitures and significant declines in AUM, revenues, earnings or the price of an AB Holding Unit. Any of these changes in circumstances could suggest the possibility that goodwill is impaired, but none of these events or circumstances by itself would indicate that it is more likely than not that goodwill is impaired. Instead, they are merely recognized as triggering events for the consideration of impairment and must be viewed in combination with any mitigating or positive factors. A holistic evaluation of all events since the most recent quantitative impairment test must be done to determine whether it is more likely than not that the reporting unit is impaired.
For our annual impairment test, we utilize the market approach where the fair value of the reporting unit is based on its unadjusted market valuation (AB Units outstanding multiplied by AB Holding's Unit price) and earnings multiples. A goodwill impairment would be the amount by which a reporting unit's carrying value exceeds its fair value, not to exceed the carrying amount of goodwill. The goodwill impairment test does not include a determination by management of whether a decline in fair value is temporary and it is important that management's determination of fair value reflect the impact of changing market conditions, including the severity and anticipated duration of any such changes. The price of a publicly traded AB Holding Unit serves as a reasonable starting point for valuing an AB Unit because each represents the same fractional interest in our underlying business. Our market approach analysis also includes comparable industry earnings multiples applied to our earnings forecast and assumes a control premium (when applicable).
Contingent Payment Arrangements
We periodically enter into contingent payment arrangements in connection with our business combinations. In these arrangements, we agree to pay additional consideration to the sellers to the extent that certain performance targets are achieved. We estimate the fair value of these potential future obligations at the time a business combination is consummated and record a liability on a discounted basis on our consolidated statement of financial condition. We then accrete the obligation to its expected payment amount over the measurement period. If our expected payment amount subsequently changes, the obligation is modified in the current period resulting in a gain or loss. Both gains and losses resulting from changes to expected payments and the accretion of these obligations to their expected payment amounts are reflected within contingent payment arrangements in our consolidated statements of income.
For contingent liabilities, we typically use a valuation method that is a form of the income approach, whereby a forecast of future cash flows attributable to the asset are discounted to present value using a risk-adjusted discount rate. We develop a forecast of future cash flows attributable to the performance objectives that are then discounted to present value using a risk-adjusted discount rate. Some of the more significant estimates and assumptions inherent in the income approach include the amount and timing of projected future cash flows, the discount rate selected to measure the risks inherent in the future cash flows.
Loss Contingencies
Management continuously reviews with legal counsel the status of regulatory matters and pending or threatened litigation. We evaluate the likelihood that a loss contingency exists and record a loss contingency if it is both probable and reasonably estimable as of the date of the financial statements. See Note 14 to our consolidated financial statements in Item 8.
Accounting Pronouncements
See Note 2 to our consolidated financial statements in Item 8.
Cautions Regarding Forward-Looking Statements
Certain statements provided by management in this report are “forward-looking statements” within the meaning of the Private Securities Litigation Reform Act of 1995. Such forward-looking statements are subject to risks, uncertainties and other factors that could cause actual results to differ materially from future results expressed or implied by such forward-looking statements. The most significant of these factors include, but are not limited to, the following: the performance of financial markets, the investment performance of sponsored investment products and separately managed accounts, general economic conditions, industry trends, future acquisitions, integration of acquired companies, competitive conditions and government regulations, including changes in tax regulations and rates and the manner in which the earnings of publicly-traded partnerships are taxed. We caution readers to carefully consider such factors. Further, these forward-looking statements speak only as of the date on which such statements are made; we undertake no obligation to update any forward-looking statements to reflect events or circumstances after the date of such statements. For further information regarding these forward-looking statements and the factors that could cause actual results to differ, see “Risk Factors” in Item 1A. Any or all of the forward-looking statements that we make in this Form 10-K, other documents we file with or furnish to the SEC, and any other public statements we issue, may turn out to be wrong. It is important to remember that other factors besides those listed in “Risk Factors” and those listed below could also adversely impact our revenues, financial condition, results of operations and business prospects.
The forward-looking statements referred to in the preceding paragraph, most of which directly affect AB but also affect AB Holding because AB Holding’s principal source of income and cash flow is attributable to its investment in AB, include statements regarding:
•Our belief that the cash flow AB Holding realizes from its investment in AB will provide AB Holding with the resources it needs to meet its financial obligations: AB Holding’s cash flow is dependent on the quarterly cash distributions it receives from AB. Accordingly, AB Holding’s ability to meet its financial obligations is dependent on AB’s cash flow from its operations, which is subject to the performance of the capital markets and other factors beyond our control.
•Our financial condition and ability to access the public and private capital markets providing adequate liquidity for our general business needs: Our financial condition is dependent on our cash flow from operations, which is subject to the performance of the capital markets, our ability to maintain and grow client assets under management and other factors beyond our control. Our ability to access public and private capital markets on reasonable terms may be limited by adverse market conditions, our firm’s credit ratings, our profitability and changes in government regulations, including tax rates and interest rates.
•The outcome of litigation: Litigation is inherently unpredictable, and excessive damage awards do occur. Though we have stated that we do not expect any pending legal proceedings to have a material adverse effect on our results of operations, financial condition or liquidity, any settlement or judgment with respect to a legal proceeding could be significant, and could have such an effect.
•The possibility that we will engage in open market purchases of AB Holding Units to help fund anticipated obligations under our incentive compensation award program: The number of AB Holding Units AB may decide to buy in future periods, if any, to help fund incentive compensation awards depends on various factors, some of which are beyond our control, including the fluctuation in the price of an AB Holding Unit (NYSE: AB) and the availability of cash to make these purchases.
•Our determination that adjusted employee compensation expense, excluding the impact of performance-based fees, generally should not exceed 50% of our adjusted net revenues on an annual basis: Aggregate employee compensation reflects employee performance and competitive compensation levels. Fluctuations in our revenues and/or changes in competitive compensation levels could result in adjusted employee compensation expense exceeding 50% of our adjusted net revenues.
•Our Relocation Strategy: While many of the expenses, expense savings and EPU impact we expect will result from our Relocation Strategy are presented with numerical specificity, and we believe these figures to be reasonable as of the date of this report, the uncertainties surrounding the assumptions on which our estimates are based create a significant risk that our current estimates may not be realized. These assumptions include:
•the amount and timing of employee relocation costs, severance, and overlapping compensation and occupancy costs we experience; and
•the timing for execution of each phase of our relocation implementation plan.
Item 7A. Quantitative and Qualitative Disclosures about Market Risk
| | |
|
| Market Risk, Risk Management and Derivative Financial Instruments |
|
Our investments consist of trading and other investments. Trading investments include U.S. Treasury Bills, mutual funds, exchange-traded options and various separately-managed portfolios consisting of equity securities. Trading investments are purchased for short-term investment, principally to fund liabilities related to long-term incentive compensation plans and to seed new investment services. Other investments include investments in hedge funds we sponsor and other investment vehicles.
We enter into various futures, forwards, swaps and options primarily to economically hedge our seed capital investments. We do not hold any derivatives designated in a formal hedge relationship under ASC 815-10, Derivatives and Hedging. See Note 7 Derivative Instruments to our consolidated financial statements in Item 8.
Trading and Non-Trading Market Risk Sensitive Instruments
| | |
|
| Investments with Interest Rate Risk—Fair Value |
|
The table below provides our potential exposure with respect to our fixed income investments, measured in terms of fair value, to an immediate 100 basis point increase in interest rates at all maturities from the levels prevailing as of December 31, 2023 and 2022. Such a fluctuation in interest rates is a hypothetical rate scenario used to calibrate potential risk and does not represent our view of future market movements. While these fair value measurements provide a representation of interest rate sensitivity of our investments in fixed income mutual funds and fixed income hedge funds, they are based on our exposures at a particular point in time and may not be representative of future market results. These exposures will change as a result of ongoing changes in investments in response to our assessment of changing market conditions and available investment opportunities:
| | | | | | | | | | | | | | | | | | | | | | | | | | |
| As of December 31 |
| 2023 | 2022 |
| Fair Value | Effect of
+100
Basis Point
Change | Fair Value | Effect of
+100
Basis Point
Change |
| (in thousands) |
| Fixed Income Investments: | | | | | | | | |
| Trading | | $ | 70,750 | | | $ | (4,394) | | | $ | 93,221 | | | $ | (5,789) | |
| | |
|
| Investments with Equity Price Risk—Fair Value |
|
Our investments also include investments in equity securities, mutual funds and hedge funds. The following table provides our potential exposure with respect to our equity investments, measured in terms of fair value, to an immediate 10% decrease in equity prices from those prevailing as of December 31, 2023 and 2022. A 10% decrease in equity prices is a hypothetical scenario used to calibrate potential risk and does not represent our view of future market movements. While these fair value measurements provide a representation of equity price sensitivity of our investments in equity securities, mutual funds and hedge funds, they are based on our exposures at a particular point in time and may not be representative of future market results. These exposures will change as a result of ongoing portfolio activities in response to our assessment of changing market conditions and available investment opportunities:
| | | | | | | | | | | | | | | | | | | | | | | | | | |
| As of December 31 |
| 2023 | 2022 |
| Fair Value | Effect of -10%
Equity Price
Change | Fair Value | Effect of -10%
Equity Price
Change |
| (in thousands) |
| Equity Investments: | | | | | | | | |
| Trading | | $ | 117,434 | | | $ | (11,743) | | | $ | 65,846 | | | $ | (6,585) | |
| Other investments | | $ | 55,371 | | | $ | (5,537) | | | $ | 58,451 | | | $ | (5,845) | |
Item 8. Financial Statements and Supplementary Data
Report of Independent Registered Public Accounting Firm
To the General Partner and Unitholders of AllianceBernstein L.P.
Opinions on the Financial Statements and Internal Control over Financial Reporting
We have audited the accompanying consolidated statements of financial condition of AllianceBernstein L.P. and its subsidiaries (the “Company”) as of December 31, 2023 and 2022, and the related consolidated statements of income, of comprehensive income, of changes in partners’ capital and of cash flows for each of the three years in the period ended December 31, 2023, including the related notes and financial statement schedule listed in the index appearing under Item 15(a) (collectively referred to as the “consolidated financial statements”). We also have audited the Company's internal control over financial reporting as of December 31, 2023, based on criteria established in Internal Control - Integrated Framework (2013) issued by the Committee of Sponsoring Organizations of the Treadway Commission (COSO).
In our opinion, the consolidated financial statements referred to above present fairly, in all material respects, the financial position of the Company as of December 31, 2023 and 2022, and the results of its operations and its cash flows for each of the three years in the period ended December 31, 2023 in conformity with accounting principles generally accepted in the United States of America. Also in our opinion, the Company maintained, in all material respects, effective internal control over financial reporting as of December 31, 2023, based on criteria established in Internal Control - Integrated Framework (2013) issued by the COSO.
Basis for Opinions
The Company's management is responsible for these consolidated financial statements, for maintaining effective internal control over financial reporting, and for its assessment of the effectiveness of internal control over financial reporting, included in Management’s Report on Internal Control Over Financial Reporting appearing under Item 9A. Our responsibility is to express opinions on the Company’s consolidated financial statements and on the Company's internal control over financial reporting based on our audits. We are a public accounting firm registered with the Public Company Accounting Oversight Board (United States) (PCAOB) and are required to be independent with respect to the Company in accordance with the U.S. federal securities laws and the applicable rules and regulations of the Securities and Exchange Commission and the PCAOB.
We conducted our audits in accordance with the standards of the PCAOB. Those standards require that we plan and perform the audits to obtain reasonable assurance about whether the consolidated financial statements are free of material misstatement, whether due to error or fraud, and whether effective internal control over financial reporting was maintained in all material respects.
Our audits of the consolidated financial statements included performing procedures to assess the risks of material misstatement of the consolidated financial statements, whether due to error or fraud, and performing procedures that respond to those risks. Such procedures included examining, on a test basis, evidence regarding the amounts and disclosures in the consolidated financial statements. Our audits also included evaluating the accounting principles used and significant estimates made by management, as well as evaluating the overall presentation of the consolidated financial statements. Our audit of internal control over financial reporting included obtaining an understanding of internal control over financial reporting, assessing the risk that a material weakness exists, and testing and evaluating the design and operating effectiveness of internal control based on the assessed risk. Our audits also included performing such other procedures as we considered necessary in the circumstances. We believe that our audits provide a reasonable basis for our opinions.
Definition and Limitations of Internal Control over Financial Reporting
A company’s internal control over financial reporting is a process designed to provide reasonable assurance regarding the reliability of financial reporting and the preparation of financial statements for external purposes in accordance with generally accepted accounting principles. A company’s internal control over financial reporting includes those policies and procedures that (i) pertain to the maintenance of records that, in reasonable detail, accurately and fairly reflect the transactions and dispositions of the assets of the company; (ii) provide reasonable assurance that transactions are recorded as necessary to permit preparation of financial statements in accordance with generally accepted accounting principles, and that receipts and expenditures of the company are being made only in accordance with authorizations of management and directors of the company; and (iii) provide reasonable assurance regarding prevention or timely detection of unauthorized acquisition, use, or disposition of the company’s assets that could have a material effect on the financial statements.
Because of its inherent limitations, internal control over financial reporting may not prevent or detect misstatements. Also, projections of any evaluation of effectiveness to future periods are subject to the risk that controls may become inadequate because of changes in conditions, or that the degree of compliance with the policies or procedures may deteriorate.
Critical Audit Matters
The critical audit matter communicated below is a matter arising from the current period audit of the consolidated financial statements that was communicated or required to be communicated to the audit committee and that (i) relates to accounts or disclosures that are material to the consolidated financial statements and (ii) involved our especially challenging, subjective, or complex judgments. The communication of critical audit matters does not alter in any way our opinion on the consolidated financial statements, taken as a whole, and we are not, by communicating the critical audit matter below, providing a separate opinion on the critical audit matter or on the accounts or disclosures to which it relates.
As described in Notes 2 and 3 to the consolidated financial statements, the Company’s performance-based fees earned were $144.9 million for the year ended December 31, 2023, which are earned based on the value of the investors’ assets under management (AUM). The transaction price for the asset management performance obligation for certain investment advisory contracts, including those associated with hedge funds and alternative investments, provide for a performance-based fee, in addition to the base advisory fee, which is calculated as either a percentage of absolute investment results or a percentage of investment results in excess of a stated benchmark over a specified period of time. The performance-based fees are forms of variable consideration and are therefore excluded from the transaction price until it becomes probable that there will not be significant reversal of the cumulative revenue recognized. Constraining factors impacting the amount of variable consideration included in the transaction price include the contractual claw-back provisions to which the variable consideration is subject, the length of time to which the uncertainty of the consideration is subject, the number and range of possible consideration amounts, the probability of significant fluctuations in the AUM market value, and the level at which the AUM value exceeds the contractual threshold required to earn such a fee. Management calculates AUM using established market-based valuation methods and fair valuation (non-observable market) methods. Fair valuation methods, which include discounted cash flow models and other methods, are used only where AUM cannot be valued using market-based valuation methods, such as in the case of private equity or illiquid securities.
The principal considerations for our determination that performing procedures relating to performance-based fees is a critical audit matter are (i) a high degree of auditor effort in performing procedures and evaluating audit evidence related to these fees, including evaluating audit evidence related to the assessment of the constraining factors impacting the amount of variable consideration and the calculation of AUM and (ii) the audit effort involved the use of professionals with specialized skill and knowledge.
Addressing the matter involved performing procedures and evaluating audit evidence in connection with forming our overall opinion on the consolidated financial statements. These procedures included testing the effectiveness of controls relating to management’s revenue recognition process for performance-based fees, including controls over the assessment of the constraining factors and the calculation of AUM. These procedures also included, among others (i) testing management’s process for determining performance-based fees, including evaluating the appropriateness of the fair valuation methods used to calculate AUM; (ii) evaluating, on a sample basis, the reasonableness of the constraining factors related to (a) contractual claw-back provisions to which variable consideration is subject, (b) the length of time to which the uncertainty of the consideration is subject, (c) the number and range of possible consideration amounts, (d) the probability of significant fluctuations in the AUM market value, and (e) the level at which the AUM value exceeded the contractual threshold required to earn such fees, as applicable. Professionals with specialized skill and knowledge were used to assist in evaluating the reasonableness of the AUM by (i) developing an independent range of prices for a sample of securities in the underlying products where fair valuation methods were used and (ii) comparing the independent range of prices to management’s estimate. Developing the independent range of prices involved testing the completeness and accuracy of data provided by management and independently developing the inputs for the sampled securities.
/s/PricewaterhouseCoopers LLP
Nashville, Tennessee
February 9, 2024
We have served as the Company’s auditor since 2006.
| | |
| AllianceBernstein L.P. and Subsidiaries |
|
Consolidated Statements of Financial Condition
| | | | | | | | | | | | | | |
| Years Ended December 31 |
| 2023 | 2022 |
| (in thousands,
except unit amounts) |
| ASSETS | | | | |
| Cash and cash equivalents | | $ | 1,000,103 | | | $ | 1,130,143 | |
| Cash and securities segregated, at fair value (cost $859,448 and $1,511,916) | | 867,680 | | | 1,522,431 | |
| Receivables, net: | | | | |
| Brokers and dealers | | 53,144 | | | 112,226 | |
| Brokerage clients | | 1,314,656 | | | 1,881,496 | |
| AB funds fees | | 343,334 | | | 314,247 | |
| Other fees | | 125,500 | | | 127,040 | |
| Investments: | | | | |
| Long-term incentive compensation-related | | 40,033 | | | 47,870 | |
| Other | | 203,521 | | | 169,648 | |
| Assets of consolidated company-sponsored investment funds: | | | | |
| Cash and cash equivalents | | 7,739 | | | 19,751 | |
| Investments | | 397,174 | | | 516,536 | |
| Other assets | | 25,299 | | | 44,424 | |
| Furniture, equipment and leasehold improvements, net | | 176,348 | | | 189,258 | |
| Goodwill | | 3,598,591 | | | 3,598,591 | |
| Intangible assets, net | | 264,555 | | | 310,203 | |
| Deferred sales commissions, net | | 87,374 | | | 52,250 | |
| Right-of-use assets | | 323,766 | | | 371,898 | |
| Assets held for sale | | 564,776 | | | 551,351 | |
| Other assets | | 216,213 | | | 179,568 | |
| Total assets | | $ | 9,609,806 | | | $ | 11,138,931 | |
| | | | | | | | | | | | | | |
| Years Ended December 31 |
| 2023 | 2022 |
| (in thousands,
except unit amounts) |
| LIABILITIES, REDEEMABLE NON-CONTROLLING INTEREST AND CAPITAL | | | | |
| Liabilities: | | | | |
| Payables: | | | | |
| Brokers and dealers | | $ | 259,175 | | | $ | 389,828 | |
| | | | |
| Brokerage clients | | 2,200,835 | | | 3,322,903 | |
| AB mutual funds | | 644 | | | 162,291 | |
| Contingent consideration liability | | 252,690 | | | 247,309 | |
| Accounts payable and accrued expenses | | 172,163 | | | 173,466 | |
| Lease liabilities | | 369,017 | | | 427,479 | |
| Liabilities of consolidated company-sponsored investment funds | | 12,537 | | | 55,529 | |
| Accrued compensation and benefits | | 372,305 | | | 415,878 | |
| | | | |
| Debt | | 1,154,316 | | | 990,000 | |
| Liabilities held for sale | | 153,342 | | | 107,952 | |
| Total liabilities | | 4,947,024 | | | 6,292,635 | |
Commitments and contingencies (See Note 14) | | | | |
| Redeemable non-controlling interest of consolidated entities | | 209,420 | | | 368,656 | |
| Capital: | | | | |
| General Partner | | 45,388 | | | 45,985 | |
| Limited partners: 286,609,212 and 285,979,913 units issued and outstanding | | 4,590,619 | | | 4,648,113 | |
| Receivables from affiliates | | (4,490) | | | (4,270) | |
| AB Holding Units held for long-term incentive compensation plans | | (76,363) | | | (95,318) | |
| Accumulated other comprehensive loss | | (106,364) | | | (129,477) | |
| Partners’ capital attributable to AB Unitholders | | 4,448,790 | | | 4,465,033 | |
| Non-redeemable non-controlling interests in consolidated entities | | 4,572 | | | 12,607 | |
| Total capital | | 4,453,362 | | | 4,477,640 | |
| Total liabilities, non-controlling interest and capital | | $ | 9,609,806 | | | $ | 11,138,931 | |
See Accompanying Notes to Consolidated Financial Statements.
| | |
| AllianceBernstein L.P. and Subsidiaries |
|
Consolidated Statements of Income
| | | | | | | | | | | | | | | | | | | | |
| Years Ended December 31 |
| 2023 | 2022 | 2021 |
| (in thousands, except per unit amounts) |
| Revenues: | | | | | | |
| Investment advisory and services fees | | $ | 2,975,468 | | | $ | 2,971,038 | | | $ | 3,194,524 | |
| Bernstein research services | | 386,142 | | | 416,273 | | | 452,017 | |
| Distribution revenues | | 586,263 | | | 607,195 | | | 652,240 | |
| Dividend and interest income | | 199,443 | | | 123,091 | | | 38,734 | |
| Investment gains (losses) | | 14,206 | | | (102,413) | | | (636) | |
| Other revenues | | 101,342 | | | 105,544 | | | 108,409 | |
| Total revenues | | 4,262,864 | | | 4,120,728 | | | 4,445,288 | |
| Less: Broker-dealer related interest expense | | 107,541 | | | 66,438 | | | 3,686 | |
| Net revenues | | 4,155,323 | | | 4,054,290 | | | 4,441,602 | |
| Expenses: | | | | | | |
| Employee compensation and benefits | | 1,769,153 | | | 1,666,636 | | | 1,716,013 | |
| Promotion and servicing: | | | | | | |
| Distribution-related payments | | 610,368 | | | 629,572 | | | 708,117 | |
| Amortization of deferred sales commissions | | 36,817 | | | 34,762 | | | 34,364 | |
| Trade execution, marketing, T&E and other | | 215,643 | | | 215,556 | | | 197,486 | |
| General and administrative | | 581,571 | | | 641,635 | | | 555,608 | |
| | | | | | |
| | | | | | |
| Contingent payment arrangements | | 22,853 | | | 6,563 | | | 2,710 | |
| Interest on borrowings | | 54,394 | | | 17,906 | | | 5,145 | |
| Amortization of intangible assets | | 46,854 | | | 26,564 | | | 5,697 | |
| Total expenses | | 3,337,653 | | | 3,239,194 | | | 3,225,140 | |
| Operating income | | 817,670 | | | 815,096 | | | 1,216,462 | |
| Income tax | | 29,051 | | | 39,639 | | | 62,728 | |
| Net income | | 788,619 | | | 775,457 | | | 1,153,734 | |
| Net income (loss) income of consolidated entities attributable to non-controlling interests | | 24,009 | | | (56,356) | | | 5,111 | |
| Net income attributable to AB Unitholders | | $ | 764,610 | | | $ | 831,813 | | | $ | 1,148,623 | |
| Net income per AB Unit: | | | | | | |
| Basic | | $ | 2.65 | | | $ | 3.01 | | | $ | 4.18 | |
| Diluted | | $ | 2.65 | | | $ | 3.01 | | | $ | 4.18 | |
See Accompanying Notes to Consolidated Financial Statements.
| | |
| AllianceBernstein L.P. and Subsidiaries |
|
Consolidated Statements of Comprehensive Income
| | | | | | | | | | | | | | | | | | | | |
| Years Ended December 31 |
| 2023 | 2022 | 2021 |
| (in thousands) |
| Net income | | $ | 788,619 | | | $ | 775,457 | | | $ | 1,153,734 | |
| Other comprehensive income: | | | | | | |
| Foreign currency translation adjustments, before reclassification and tax: | | 14,262 | | | (47,208) | | | (7,839) | |
| Less: reclassification adjustment for (losses) gains included in net income upon liquidation | | (389) | | | — | | | 4,458 | |
| Foreign currency translation adjustments, before tax | | 14,651 | | | (47,208) | | | (12,297) | |
| Income tax (expense) benefit | | (618) | | | 1,215 | | | 457 | |
| Foreign currency translation adjustments, net of tax | | 14,033 | | | (45,993) | | | (11,840) | |
| | | | | | |
| | | | | | |
| | | | | | |
| | | | | | |
| Changes in employee benefit related items: | | | | | | |
| Amortization of prior service cost | | 24 | | | 24 | | | 24 | |
| Recognized actuarial gain | | 9,135 | | | 6,922 | | | 15,743 | |
| Changes in employee benefit related items | | 9,159 | | | 6,946 | | | 15,767 | |
| Income tax (expense) | | (79) | | | (95) | | | (59) | |
| Employee benefit related items, net of tax | | 9,080 | | | 6,851 | | | 15,708 | |
| | | | | | |
| Other comprehensive gain (loss) | | 23,113 | | | (39,142) | | | 3,868 | |
| Less: Comprehensive income (loss) in consolidated entities attributable to non-controlling interests | | 24,009 | | | (56,356) | | | 5,111 | |
| Comprehensive income attributable to AB Unitholders | | $ | 787,723 | | | $ | 792,671 | | | $ | 1,152,491 | |
See Accompanying Notes to Consolidated Financial Statements.
| | |
| AllianceBernstein L.P. and Subsidiaries |
|
Consolidated Statements of Changes in Partners’ Capital
| | | | | | | | | | | | | | | | | | | | |
| Years Ended December 31 |
| 2023 | 2022 | 2021 |
| (in thousands) |
| General Partner’s Capital | | | | | | |
| Balance, beginning of year | | $ | 45,985 | | | $ | 42,850 | | | $ | 41,776 | |
| Net income | | 7,646 | | | 8,318 | | | 11,486 | |
| Cash distributions to General Partner | | (8,411) | | | (10,715) | | | (10,605) | |
| Long-term incentive compensation plans activity | | (21) | | | 25 | | | 117 | |
| Issuance (retirement) of AB Units, net | | 189 | | | (385) | | | 76 | |
| Issuance of AB Units for CarVal acquisition | | — | | | 5,892 | | | — | |
| | | | | | |
| | | | | | |
| Balance, end of year | | 45,388 | | | 45,985 | | | 42,850 | |
| Limited Partners' Capital | | | | | | |
| Balance, beginning of year | | 4,648,113 | | | 4,336,211 | | | 4,229,485 | |
| Net income | | 756,964 | | | 823,495 | | | 1,137,137 | |
| Cash distributions to Unitholders | | (830,860) | | | (1,059,105) | | | (1,049,287) | |
| Long-term incentive compensation plans activity | | (2,080) | | | 2,521 | | | 11,586 | |
| Issuance (retirement) of AB Units, net | | 18,482 | | | (38,286) | | | 7,290 | |
| Issuance of AB Units for CarVal acquisition | | — | | | 583,277 | | | — | |
| | | | | | |
| | | | | | |
| Balance, end of year | | 4,590,619 | | | 4,648,113 | | | 4,336,211 | |
| Receivables from Affiliates | | | | | | |
| Balance, beginning of year | | (4,270) | | | (8,333) | | | (8,316) | |
| | | | | | |
| | | | | | |
| Long-term incentive compensation awards expense | | 727 | | | 607 | | | 941 | |
| Capital contributions (to) from AB Holding | | (947) | | | 3,456 | | | (958) | |
| Balance, end of year | | (4,490) | | | (4,270) | | | (8,333) | |
| AB Holding Units held for Long-term Incentive Compensation Plans | | | | | | |
| Balance, beginning of year | | (95,318) | | | (119,470) | | | (57,219) | |
| Purchases of AB Holding Units to fund long-term compensation plans, net | | (144,086) | | | (210,568) | | | (261,825) | |
| (Issuance) retirement of AB Units, net | | (17,562) | | | 40,346 | | | (7,348) | |
| Long-term incentive compensation awards expense | | 179,724 | | | 198,783 | | | 215,484 | |
| Re-valuation of AB Holding Units held in rabbi trust | | 879 | | | (4,240) | | | (9,690) | |
| Other | | — | | | (169) | | | 1,128 | |
| Balance, end of year | | (76,363) | | | (95,318) | | | (119,470) | |
| | | | | | |
| | | | | | |
| | | | | | |
| | | | | | |
| | | | | | |
| | | | | | |
| Accumulated Other Comprehensive (Loss) | | | | | | |
| Balance, beginning of year | | (129,477) | | | (90,335) | | | (94,203) | |
| Foreign currency translation adjustment, net of tax | | 14,033 | | | (45,993) | | | (11,840) | |
| Changes in employee benefit related items, net of tax | | 9,080 | | | 6,851 | | | 15,708 | |
| | | | | | |
| | | | | | |
| Balance, end of year | | (106,364) | | | (129,477) | | | (90,335) | |
| Total Partners' Capital attributable to AB Unitholders | | 4,448,790 | | | 4,465,033 | | | 4,160,923 | |
| Non-redeemable Non-controlling Interests in Consolidated Entities | | | | | | |
| Balance, beginning of year | | 12,607 | | | — | | | — | |
| CarVal acquisition | | — | | | 12,607 | | | — | |
| Net income | | 743 | | | — | | | — | |
| | | | | | |
| Distributions to non-controlling interests, net | | (8,514) | | | — | | | — | |
| Adjustment | | (264) | | | — | | | — | |
| Balance, end of year | | 4,572 | | | 12,607 | | | — | |
| Total Capital | | $ | 4,453,362 | | | $ | 4,477,640 | | | $ | 4,160,923 | |
See Accompanying Notes to Consolidated Financial Statements.
| | |
| AllianceBernstein L.P. and Subsidiaries |
|
Consolidated Statements of Cash Flows
| | | | | | | | | | | | | | | | | | | | |
| Years Ended December 31 |
| 2023 | 2022 | 2021 |
| (in thousands) |
| Cash flows from operating activities: | | | | | | |
| Net income | | $ | 788,619 | | | $ | 775,457 | | | $ | 1,153,734 | |
| Adjustments to reconcile net income to net cash provided by operating activities: | | | | | | |
| Amortization of deferred sales commissions | | 36,817 | | | 34,762 | | | 34,364 | |
| Non-cash long-term incentive compensation expense | | 180,451 | | | 199,390 | | | 216,425 | |
| Depreciation and other amortization | | 92,113 | | | 66,617 | | | 44,985 | |
| Unrealized (gains) losses on investments | | (7,810) | | | 40,857 | | | 4,454 | |
| Unrealized (gains) losses on investments of consolidated company-sponsored investment funds | | (48,350) | | | 73,194 | | | 1,882 | |
| | | | | | |
| | | | | | |
| Non-cash lease expense | | 101,761 | | | 99,861 | | | 98,773 | |
| (Gain) loss on assets held for sale | | (800) | | | 7,400 | | | — | |
| Change is estimate of contingent payment arrangements | | 14,050 | | | — | | | — | |
| Other, net | | (4,641) | | | 14,604 | | | 22,580 | |
| Changes in assets and liabilities: | | | | | | |
| | | | | | |
| Decrease (increase) in securities, segregated | | 654,751 | | | (18,474) | | | 249,521 | |
| Decrease (increase) in receivables | | 629,204 | | | 35,410 | | | (360,789) | |
| (Increase) in investments | | (10,656) | | | (10,331) | | | (27,000) | |
| Decrease (increase) in investments of consolidated company-sponsored investment funds | | 167,712 | | | 23,295 | | | (312,325) | |
| (Increase) in deferred sales commissions | | (71,941) | | | (12,113) | | | (45,197) | |
| (Increase) in other assets | | (36,263) | | | (5,487) | | | (6,578) | |
| (Increase) decrease in other assets and liabilities of consolidated company-sponsored investment funds, net | | (23,867) | | | (45,432) | | | 38,161 | |
| (Decrease) increase in payables | | (1,451,280) | | | 110,112 | | | 214,139 | |
| | | | | | |
| (Decrease) increase in accounts payable and accrued expenses | | (6,992) | | | (8,424) | | | 35,877 | |
| (Decrease) increase in accrued compensation and benefits | | (22,848) | | | (150,285) | | | 50,545 | |
| Cash payments to relieve operating lease liabilities | | (107,738) | | | (109,182) | | | (114,769) | |
| Net cash provided by operating activities | | 872,292 | | | 1,121,231 | | | 1,298,782 | |
| | | | | | |
| Cash flows from investing activities: | | | | | | |
| | | | | | |
| | | | | | |
| Purchases of furniture, equipment and leasehold improvements | | (33,627) | | | (62,308) | | | (61,931) | |
| | | | | | |
| | | | | | |
| Acquisition of businesses, net of cash acquired | | — | | | 40,282 | | | (3,793) | |
| Net cash used in investing activities | | (33,627) | | | (22,026) | | | (65,724) | |
| | | | | | |
| | | | | | |
| Cash flows from financing activities: | | | | | | |
| Proceeds from debt, net | | 164,316 | | | 235,000 | | | 80,000 | |
| (Decrease) increase in overdrafts payable | | — | | | (25,411) | | | 16,192 | |
| Distributions to General Partner and Unitholders | | (839,271) | | | (1,069,820) | | | (1,059,892) | |
| | | | | | |
| (Redemptions) subscriptions of non-controlling interests of consolidated company-sponsored investment funds, net | | (183,245) | | | 3,843 | | | 313,699 | |
| Capital contributions (to) from affiliates | | (2,164) | | | 1,590 | | | (2,346) | |
| | | | | | |
| Additional investments by AB Holding with proceeds from exercise of compensatory options to buy AB Holding Units | | — | | | 178 | | | 3,402 | |
| Purchases of AB Holding Units to fund long-term incentive compensation plan awards, net | | (144,086) | | | (210,568) | | | (261,825) | |
| Payment of acquisition-related debt obligation | | — | | | (42,661) | | | — | |
| Other, net | | (4,870) | | | (2,131) | | | (2,186) | |
| Net cash used in financing activities | | (1,009,320) | | | (1,109,980) | | | (912,956) | |
| Effect of exchange rate changes on cash and cash equivalents | | 22,527 | | | (56,234) | | | (17,982) | |
| Net (decrease) increase in cash and cash equivalents | | (148,128) | | | (67,009) | | | 302,120 | |
| Cash and cash equivalents as of beginning of the period | | 1,309,017 | | | 1,376,026 | | | 1,073,906 | |
| Cash and cash equivalents as of end of the period | | $ | 1,160,889 | | | $ | 1,309,017 | | | $ | 1,376,026 | |
| | | | | | |
| Cash paid: | | | | | | |
| Interest paid | | $ | 155,335 | | | $ | 78,434 | | | $ | 5,263 | |
| Income taxes paid | | 57,261 | | | 55,473 | | | 55,656 | |
| | | | | | |
| Non-cash investing activities: | | | | | | |
| Fair value of assets acquired (excluding cash acquired of zero, $40.8 million and $2.8 million, for 2023, 2022 and 2021, respectively) | | — | | | 1,085,141 | | | 13,235 | |
| Fair value of deferred tax asset recorded | | — | | | 5,072 | | | — | |
| Fair value of liabilities assumed | | — | | | 296,750 | | | 1,642 | |
| Fair value of non-redeemable non-controlling interest recorded | | — | | | 13,191 | | | — | |
| Non-cash financing activities: | | | | | | |
| Payables recorded under contingent payment arrangements | | — | | | 231,385 | | | 7,800 | |
| Equity consideration issued in connection with acquisition | | — | | | 589,169 | | | — | |
See Accompanying Notes to Consolidated Financial Statements.
| | |
| AllianceBernstein L.P. and Subsidiaries |
|
Notes to Consolidated Financial Statements
The words “we” and “our” refer collectively to AllianceBernstein L.P. and its subsidiaries (“AB”), or to their officers and employees. Similarly, the word “company” refers to AB. Cross-references are in italics.
1. Business Description and Organization
We provide diversified investment management, research and related services globally to a broad range of clients. Our principal services include:
•Institutional Services—servicing our institutional clients, including private and public pension plans, foundations and endowments, insurance companies, central banks and governments worldwide, and affiliates such as Equitable Holdings, Inc. ("EQH") and its subsidiaries, by means of separately managed accounts, sub-advisory relationships, structured products, collective investment trusts, mutual funds, hedge funds and other investment vehicles.
•Retail Services—servicing our retail clients, primarily by means of retail mutual funds sponsored by AB or an affiliated company, sub-advisory relationships with mutual funds sponsored by third parties, separately managed account programs sponsored by financial intermediaries worldwide and other investment vehicles.
•Private Wealth Management Services—servicing our private clients, including high-net-worth individuals and families, trusts and estates, charitable foundations, partnerships, private and family corporations, and other entities, by means of separately managed accounts, hedge funds, mutual funds and other investment vehicles.
•Bernstein Research Services—servicing institutional investors, such as pension fund, hedge fund and mutual fund managers, seeking high-quality fundamental research, quantitative services and brokerage-related services in equities and listed options.
We also provide distribution, shareholder servicing, transfer agency services and administrative services to the mutual funds we sponsor.
Our high-quality, in-depth research is the foundation of our asset management and private wealth management businesses. Our research disciplines include economic, fundamental equity, fixed income and quantitative research. In addition, we have expertise in multi-asset strategies, wealth management, environmental, social and corporate governance ("ESG"), and alternative investments.
We provide a broad range of investment services with expertise in:
•Actively managed equity strategies across global and regional universes, as well as capitalization ranges, concentration ranges and investment strategies, including value, growth and core equities;
•Actively managed traditional and unconstrained fixed income strategies, including taxable and tax-exempt strategies;
•Actively managed alternative investments, including fundamental and systematically-driven hedge funds, fund of hedge funds and direct assets (e.g., direct lending, real estate debt and private equity);
•Portfolios with Purpose, including Sustainable, Impact and Responsible+ (Climate-Conscious and ESG leaders) equity, fixed income and multi-asset strategies that address our clients' desire to invest their capital with a dedicated ESG focus, while pursuing strong investment returns;
•Multi-asset services and solutions, including dynamic asset allocation, customized target-date funds and target-risk funds; and
•Passively managed equity and fixed income strategies, including index, ESG index and enhanced index strategies.
Organization
As of December 31, 2023, EQH owned approximately 3.5% of the issued and outstanding units representing assignments of beneficial ownership of limited partnership interests in AllianceBernstein Holding L.P. (“AB Holding Units”). AllianceBernstein Corporation (an indirect wholly-owned subsidiary of EQH, “General Partner”) is the general partner of both AllianceBernstein Holding L.P. (“AB Holding”) and AB. AllianceBernstein Corporation owns 100,000 general partnership units in AB Holding and a 1.0% general partnership interest in AB.
As of December 31, 2023, the ownership structure of AB, including limited partnership units outstanding as well as the general partner's 1.0% interest, was as follows:
| | | | | |
| EQH and its subsidiaries | 59.8 | % |
| AB Holding | 39.5 | |
| Unaffiliated holders | 0.7 | |
| 100.0 | % |
Including both the general partnership and limited partnership interests in AB Holding and AB, EQH and its subsidiaries had an approximate 61.2% economic interest in AB as of December 31, 2023.
2. Summary of Significant Accounting Policies
Basis of Presentation
The consolidated financial statements have been prepared in accordance with accounting principles generally accepted in the United States of America ("US GAAP"). The preparation of the consolidated financial statements requires management to make certain estimates and assumptions that affect the reported amounts of assets and liabilities and disclosure of contingent assets and liabilities at the dates of the consolidated financial statements and the reported amounts of revenues and expenses during the reporting periods. Actual results could differ from those estimates.
Principles of Consolidation
The consolidated financial statements include AB and its majority-owned and/or controlled subsidiaries, and the consolidated entities that are considered to be variable interest entities ("VIEs") and voting interest entities ("VOEs") in which AB has a controlling financial interest. Non-controlling interests on the consolidated statements of financial condition include the portion of consolidated company-sponsored investment funds in which we do not have direct equity ownership. All significant inter-company transactions and balances among the consolidated entities have been eliminated.
Recently Adopted Accounting Pronouncements or Accounting Pronouncements
Not Yet Adopted
Recently Adopted Accounting Pronouncements
During 2023, there have been no recently adopted accounting pronouncements that have or are expected to have a material impact on our consolidated results of operations.
Accounting Pronouncements Not Yet Adopted
In December 2023, the Financial Accounting Standards Board (“FASB”) issued ASU 2023-09, Income Taxes (Topic 740): Improvements to Income Tax Disclosures. This amendment is expected to enhance the transparency and decision usefulness of income tax disclosures by requiring public business entities, on an annual basis, to disclose specific categories in the rate reconciliation, additional information for reconciling items that meet a quantitative threshold and certain information about income taxes paid. This revised guidance is effective for financial statements issued for fiscal years beginning after December 15, 2024. The revised guidance will not have a material impact on our financial condition or results of operations.
In November 2023, the FASB issued ASU 2023-07, Segment Reporting(Topic 280): Improvements to Reportable Segment Disclosures, which requires disclosure of incremental segment information on an annual and interim basis. This ASU is effective for fiscal years beginning after December 15, 2023, and interim periods within fiscal years beginning after December 15, 2024, and requires retrospective application to all prior periods presented in the financial statements. We are currently evaluating the impacts of the new standard.
Revenue Recognition
| | |
|
| Investment Advisory and Services Fees |
|
AB provides asset management services by managing customer assets and seeking to deliver investment returns to investors. Each investment management contract between AB and a customer creates a distinct, separately identifiable performance obligation for each day the customer’s assets are managed as the customer can benefit from each day of service. In accordance with ASC 606, a series of distinct goods and services that are substantially the same and have the same pattern of transfer to the customer are treated as a single performance obligation. Accordingly, we have determined that our investment and advisory services are performed over time and entitle us to variable consideration earned based on the value of the investors’ assets under management (“AUM”).
We calculate AUM using established market-based valuation methods and fair valuation (non-observable market) methods. Market-based valuation methods include: last sale/settle prices from an exchange for actively-traded listed equities, options and futures; evaluated bid prices from recognized pricing vendors for fixed income, asset-backed or mortgage-backed issues; mid prices from recognized pricing vendors and brokers for credit default swaps; and quoted bids or spreads from pricing vendors and brokers for other derivative products. Fair valuation methods include: discounted cash flow models or any other methodology that is validated and approved by our Valuation Committee (see paragraph immediately below for additional information about our Valuation Committee). Fair valuation methods are used only where AUM cannot be valued using market-based valuation methods, such as in the case of private equity or illiquid securities.
The Valuation Committee, which consists of senior officers and employees, is responsible for overseeing the pricing and valuation of all investments held in client and AB portfolios. The Valuation Committee has adopted a Statement of Pricing Policies describing principles and policies that apply to pricing and valuing investments held in these portfolios. We also have a Pricing Group, which reports to the Valuation Committee and is responsible for overseeing the pricing process for all investments. We record as revenue investment advisory and services base fees, which we generally calculate as a percentage of AUM. At month-end, all the components of the transaction price (i.e., the base fee calculation) are no longer variable and the value of the consideration is determined. These fees are not subject to claw back and there is minimal probability that a significant reversal of the revenue recorded will occur.
The transaction price for the asset management performance obligation for certain investment advisory contracts, including those associated with hedge funds and other alternative investments, provide for a performance-based fee (including carried interest), in addition to a base advisory fee, which is calculated as either a percentage of absolute investment results or a percentage of investment results in excess of a stated benchmark over a specified period of time. The performance-based fees are forms of variable consideration and are therefore excluded from the transaction price until it becomes probable that there will not be significant reversal of the cumulative revenue recognized. At each reporting date, we evaluate the constraining factors, discussed below, surrounding the variable consideration to determine the extent to which, if any, revenues associated with the performance-based fee can be recognized.
Constraining factors impacting the amount of variable consideration included in the transaction price include: the contractual claw-back provisions to which the variable consideration is subject, the length of time to which the uncertainty of the consideration is subject, the number and range of possible consideration amounts, the probability of significant fluctuations in the AUM market value and the level at which the AUM value exceeds the contractual threshold required to earn such a fee.
| | |
|
| Bernstein Research Services |
|
Bernstein Research Services revenue consists principally of commissions received, and to a lesser but increasing extent, direct payments for trade execution services and equity research services provided to institutional clients. Brokerage commissions for trade execution services and related expenses are recorded on a trade-date basis when the performance obligations are satisfied. Generally, the transaction price is agreed upon at the time of each trade and is based upon the number of shares traded or the value of the consideration traded. The transaction price for research revenues is not fixed and is at the customer's discretion. In many cases there is no contract between AB and the customer for research services, so there is no performance obligation present that requires AB to provide the research or for the customer to compensate AB for the research consumed. The customer has the unilateral right to determine the amount it will pay and whether it will continue to receive research. Research revenues are recognized when the transaction price is quantified, collectability is assured and significant reversal of such revenue is not probable.
In the fourth quarter of 2022, AB and Société Générale (EURONEXT: GLE, “SocGen”), a leading European bank, announced plans to form a joint venture combining their respective cash equities and research businesses. As a result, the Bernstein Research Services ("BRS") business has been classified as held for sale. For further discussion, see Note 24 Acquisitions and Divestitures.
Two of our subsidiaries act as distributors and/or placement agents of company-sponsored mutual funds and receive distribution services fees from certain of those funds as full or partial reimbursement of the distribution expenses they incur. The variable consideration can be determined in different ways, as discussed below, as we satisfy the performance obligation depending on the contractual arrangements with the customer and the specific product sold.
Most open-end U.S. funds have adopted a plan under Rule 12b-1 of the Investment Company Act that allows the fund to pay, out of assets of the fund, distribution and service fees for the distribution and sale of its shares (“Rule 12b-1 Feesfees”). The open-end U.S. funds have such agreements with us, and we have selling and distribution agreements pursuant to which we pay sales commissions to the financial intermediaries that distribute our open-end U.S. funds. These agreements are terminable by either party upon notice (generally 30 days) and do not obligate the financial intermediary to sell any specific amount of fund shares.
We record 12b-1 fees monthly based upon a percentage of the net asset value (“NAV”) of the funds. At month-end, the variable consideration of the transaction price is no longer constrained as the NAV can be calculated and the value of consideration is determined. These services are separate and distinct from other asset management services as the customer can benefit from these services independently of other services. We accrue the corresponding 12b-1 fees paid to sub-distributors monthly as the expenses are incurred. We are acting in a principal capacity in these transactions; as such, these revenues and expenses are recorded on a gross basis.
We offer back-end load shares in limited instances and charge the investor a contingent deferred sales charge (“CDSC”) if the investment is redeemed within a certain period. The variable consideration for these contracts is contingent on the timing of the redemption by the investor and the value of the sale proceeds. Due to these constraining factors, we exclude the CDSC fee from the transaction price until the investor redeems the investment. Upon redemption, the cash consideration received for these contractual arrangements are recorded as reductions of unamortized deferred sales commissions.
Our Luxembourg subsidiary, the management company for most of our non-U.S. funds, earns a management fee that is accrued daily and paid monthly, at an annual rate, based on the average daily net assets of the fund. With respect to certain share classes, the management fee may also contain a component that is paid to distributors and other financial intermediaries and service providers to cover shareholder servicing and other administrative expenses (also referred to as an All-in-Fee). As we have concluded that asset management is distinct from distribution, we allocate a portion of the investment and advisory fee to distribution revenues for the servicing component based on standalone selling prices.
Revenues from contracts with customers include a portion of other revenues, which consists primarily of shareholder servicing fees, as well as mutual fund reimbursements and other brokerage income.
We provide shareholder services, which include transfer agency, administrative and recordkeeping services provided to company-sponsored mutual funds. The consideration for these services is based on a percentage of the NAV of the fund or a fixed-feefixed fee based on the number of shareholder accounts being serviced. The revenues are recorded at month-end when the constraining factors involved with determining NAV or the number of shareholders’ accounts are resolved.
Dividend and interest income is accrued as earned. Investment gains and losses on the consolidated statements of income include unrealized gains and losses of trading and private equity investments stated at fair value, equity in earnings of our limited partnership hedge fund investments, and realized gains and losses on investments sold.
| | |
|
| Contract Assets and Liabilities |
|
We use the practical expedient for contracts that have an original duration of one year or less. Accordingly, we do not consider the time value of money and, instead, accrue the incremental costs of obtaining the contract when incurred. As of December 31, 2020,2023, the balances of contract assets and contract liabilities are not considered material and, accordingly, no further disclosures are necessary.
Consolidation of company-sponsored investment fundsCompany-Sponsored Investment Funds
For legal entities (company-sponsored investment funds) evaluated for consolidation, we first determine whether the fees we receive and the interests we hold qualify as a variable interest in the entity, including an evaluation of fees paid to us as a decision maker or service provider to the entity being evaluated. Fees received by us are not variable interests if (i) the fees are compensation for services provided and are commensurate with the level of effort required to provide those services, (ii) the service arrangement includes only terms, conditions or amounts that are customarily present in arrangements for similar services negotiated at arm’s length, and (iii) our other economic interests in the entity held directly and indirectly through our related parties, as well as economic interests held by related parties under common control, would not absorb more than an insignificant amount of the entity’s losses or receive more than an insignificant amount of the entity’s benefits. For purposes of determining whether AB has an equity interest in an entity, the related parties referred to above are those entities under common control that AB has a direct variable interest in and considered a consolidated entity. Our parent company, EQH, regularly invests in our seed program. In this circumstance, EQH is not considered a related party for our consolidation analysis because AB does not have a direct variable interest in EQH.
For those entities in which we have a variable interest, we perform an analysis to determine whether the entity is a VIE by considering whether the entity’s equity investment at risk is insufficient, whether the investors lack decision making rights proportional to their ownership percentage of the entity, and whether the investors lack the obligation to absorb an entity’s expected losses or the right to receive an entity’s expected income.
A VIE must be consolidated by its primary beneficiary, which generally is defined as the party that has a controlling financial interest in the VIE. We are deemed to have a controlling financial interest in a VIE if we have (i) the power to direct the activities of the VIE that most significantly affect the VIE's economic performance and (ii) the obligation to absorb losses of the VIE or the right to receive income from the VIE that could potentially be significant to the VIE. For purposes of evaluating (ii) above, fees paid to us as a decision maker or service provider are excluded if the amount of fees is commensurate with the level of effort required to be performed and the arrangement includes only customary terms, conditions or amounts present in arrangements for similar services negotiated at arm’s length. The primary beneficiary evaluation generally is performed qualitatively based on all facts and circumstances, as well as quantitatively, as appropriate.
If we have a variable interest in an entity that is determined not to be a VIE, the entity is then evaluated for consolidation under the VOE model. For limited partnerships and similar entities, we are deemed to have a controlling financial interest in a VOE, and would be required to consolidate the entity, if we own a majority of the entity’s kick-out rights through voting limited partnership interests and limited partners do not hold substantive participating rights (or other rights that would indicate that we do not control the entity). For entities other than limited partnerships, we are deemed to have a controlling financial interest in a VOE if we own a majority voting interest in the entity.
The analysis performed regarding the determination of variable interests held, whether entities are VIEs or VOEs, and whether we have a controlling financial interest in such entities, requires the exercise of judgment. The analysis is updated continuously as circumstances change or new entities are formed.
Cash and Cash Equivalents
Cash and cash equivalents include cash on hand, demand deposits, money market accounts, overnight commercial paper and highly liquid investments with original maturities of three months or less. Due to the short-term nature of these instruments, the recorded value has been determined to approximate fair value (and considered Level 1 securities in the fair value hierarchy).
Fees Receivable, Net
Fees receivable are shown net of allowances. An allowance for doubtful accounts related to investment advisory and services fees is determined through an analysis of the aging of receivables, assessments of collectability based on historical trends and other qualitative and quantitative factors, including our relationship with the client, the financial health (or ability to pay) of the client, current economic conditions and whether the account is active or closed. The allowance for doubtful accounts is not material to fees receivable.
Brokerage Transactions
Customers’ securities transactions are recorded on a settlement date basis, with related commission income and expenses reported on a trade date basis. Receivables from and payables to clients include amounts due on cash and margin transactions. Securities owned by customers are held as collateral for receivables; such collateral is not reflected in the consolidated financial statements. We have the ability by contract or custom to sell or re-pledge this collateral and have done so at various times. As of December 31, 2020, there were 02023 and 2022, we had $122.4 million and $267.1 million of re-pledged securities.securities, respectively. Principal securities transactions and related expenses are recorded on a trade date basis.
Securities borrowed and securities loaned by our broker-dealer subsidiaries are recorded at the amount of cash collateral advanced or received in connection with the transaction and are included in receivables from and payables to brokers and dealers in the consolidated statements of financial condition. Securities borrowed transactions require us to deposit cash collateral with the lender. With respect to securities loaned, we receive cash collateral from the borrower. See Note 8 Offsetting Assets and Liabilities for securities borrowed and loaned amounts recorded in our consolidated statements of financial condition as of December 31, 20202023 and 2019.2022. The initial collateral advanced or received approximates or is greater than the fair value of securities borrowed or loaned. We monitor the fair value of the securities borrowed and loaned on a daily basis and request additional collateral or return excess collateral, as appropriate. As of December 31, 20202023 and 2019,2022, there is 0no allowance provision required for the collateral advanced. Income or expense is recognized over the life of the transaction.
As of December 31, 2020 and 2019, we had $130.0 million and $204.0 million, respectively, of cashCash on deposit with clearing organizations for trade facilitation purposes which areis reported in other assets in ourheld for sale on the consolidated statementsstatement of financial condition.condition as of December 31, 2023 and December 31, 2022, respectively. As of December 31, 20202023 and 2019,2022, we held 0no U.S. Treasury bills pledged as collateral. These clearing organizations have the ability by contract or custom to sell or re-pledge the collateral, if any.
Current Expected Credit Losses- Receivables from Brokerage clients
Receivables from clients is primarily composedconsists of margin loan balances. The value of the securities owned by clients and held as collateral for these receivables is not reflected in the Consolidated Financial Statementsconsolidated financial statements and the collateral was not repledged or sold as of December 31, 20202023 and 2019.2022. We consider these financing receivables to be of good credit quality due to the fact thatbecause these receivables are primarily collateralized by the related client investments.
To estimate expected credit losses on margin loans, we applied the collateral maintenance practical expedient by comparing the amortized cost basis of the margin loans with the fair value of the collateral at the reporting date. Margin loans are limited to a percentage of the total value of the securities held in the client's account against those loans. AB requires, in the event of a decline in the market value of the securities in a margin account, the client to deposit additional securities or cash so that, at all times, the value of the securities in the account, at a minimum, cover the loan to the client. As such, AB reasonably expects that the borrower will be able to continually replenish collateral securing the financial asset and does not expect the fair value of collateral to fall below the amortized cost basesbasis of the margin loans and, as a result, we consider the credit risk associated with these receivables to be minimal. In circumstances when a loan becomes undercollateralized and the client fails to deposit additional securities or cash, AB reserves the right to liquidate the account.
Current Expected Credit Losses - Receivables from Revenue Contracts with Customers
The majority of our revenue receivables are from investment advisory and service fees, and distribution revenues, that are typically paid out of the client accounts or third-party products consisting of cash and securities. Due to the size of the fees in relation to the value of the cash and securities in accountaccounts or funds, the account value always exceeds the amortized cost basis of the receivables, resulting in a remote risk of loss. These receivables have a short duration, generally due within 30-90 days and there is minimal historical evidence of non-payment or market declines that would cause the fair value of the underlying securities to decline below the amortized cost of the receivables. AB maintains an allowance for credit losses based upon an estimate of the amount of potential credit losses in existing accounts receivable, as determined from a review of aging schedules, past due balances, historical collection experience and other specific account data. Once determined uncollectible, aged balances are written off as credit loss expense. This determination is based on careful analysis of individual receivables and aging schedules, and generally occurs when the receivable becomes over 360 days past due. Our aged receivables and amounts written off related to credit losses in any year are not material.
Furniture, Equipment and Leasehold Improvements, Net
Furniture, equipment and leasehold improvements are stated at cost, less accumulated depreciation and amortization. Depreciation is recognized on a straight-line basis over the estimated useful lives of eight years for furniture and three to six years for equipment and software. Leasehold improvements are amortized on a straight-line basis over the lesser of their estimated useful lives or the terms of the related leases.
Goodwill
In 2000, AB acquired SCB Inc., an investment research and management company formerly known as Sanford C. Bernstein Inc. (“Bernstein”). The Bernstein acquisition wasOur acquisitions are accounted for under the purchaseacquisition method andof accounting, where the cost of the acquisition wasis allocated on the basis of the estimated fair value of the assets acquired and the liabilities assumed. The excess of the purchase price over the fair value of identifiable assets acquired, net of liabilities assumed, resultedresults in the recognition of goodwill of approximately $3.0 billion.goodwill.
As of December 31, 2020,2023, we had goodwill of $3.1$3.6 billion on the consolidated statement of financial condition which included $666.1 million as a result of the CarVal L.P. Investors ("CarVal") acquisitionin the third quarter of 2022 ("CarVal acquisition"), $2.8 billion as a result of the Sanford C. Bernstein Inc. (“Bernstein”) acquisition in 2000 and $282$291.9 million in regard to various smaller acquisitions. We have determined that ABApproximately, $159.8 million of goodwill has only 1 reporting segment and reporting unit.been classified as assets held for sale on the consolidated statement of financial condition.
Goodwill is tested annually, as of September 30, for impairment utilizing the market approach where the fair value of the reporting unit is based on its unadjusted market valuation (AB Units outstanding multiplied by AB Holding's Unit price) and adjusted market valuations assuming a control premium (when applicable). A goodwill impairment would be the amount by which a reporting unit's carrying value exceeds its fair value, not to exceed the carrying amount of goodwill. The goodwill impairment test does not include a determination by management of whether a decline in fair value is temporary and it is important that management's determination of fair value reflect the impact of changing market conditions, including the severity and anticipated duration of any such changes.
As a part of our goodwill impairment evaluation, management uses the price of a publicly-tradedpublicly traded AB Holding Unit serves as a reasonable starting point for valuing an AB Unit because each represents the same fractional interest in our underlying business. Throughout the year, the carrying value of goodwill is also reviewed for impairment if certain events or changes in circumstances occur and trigger whether an interim impairment test may be required. Such changes in circumstances may include, but are not limited to, significant transactions including acquisitions or divestitures; a sustained decrease in the price of an AB Holding Unit or declines in AB’s market capitalization that would suggest that the fair value of the reporting unit is less than the carrying amount; significant and unanticipated declines in AB’s assets under management or revenues; and/or lower than expected earnings per unit. Any of these changes in circumstances could suggest the possibility that goodwill is impaired, but none of these events or circumstances by itself would indicate that it is more likely than not that goodwill is impaired. Instead, they are merely recognized as triggering events for the consideration of impairment and must be viewed in combination with any mitigating or positive factors. A holistic evaluation of all events since the most recent quantitative impairment test must be done to determine whether it is more likely than not that the reporting unit is impaired. As of September 30, 2020,2023, the impairment test indicated that goodwill was not impaired. There
Business Combinations
We account for business combinations using the acquisition method of accounting whereby the identifiable assets and liabilities of the acquired business, as well as any non-controlling interest in the acquired business, are recorded at their estimated fair values as of the date that we obtain control of the acquired business. Any purchase consideration in excess of the estimated fair values of the net assets acquired is recorded as goodwill. Acquisition-related expenses are expensed as incurred.
Often, as part of the business combination, intangible assets are recorded based on their estimated fair value at the time of acquisition and primarily relate to acquired investment management contracts. We periodically review indefinite-lived intangible assets for impairment as events or changes in circumstances indicate that the carrying value may not be recoverable. If the carrying value exceeds fair value, we perform additional impairment tests to measure the amount of the impairment loss, if any. During 2023, 2022 and 2021, these expenses included an intangible asset impairment charge of zero, $5.6 million and $1.0 million, respectively, related to various historical acquisitions.
We periodically enter into contingent payment arrangements in connection with our business combinations. In these arrangements, we agree to pay additional consideration to the sellers to the extent that certain performance targets are achieved. We estimate the fair value of these potential future obligations at the time a business combination is consummated and record a liability on a discounted basis on our consolidated statement of financial condition. We then accrete the obligation to its expected payment amount over the measurement period. If our expected payment amount subsequently changes, the obligation is modified in the current period resulting in a gain or loss. Both gains and losses resulting from changes to expected payments and the accretion of these obligations to their expected payment amounts are reflected within contingent payment arrangements in our consolidated statements of income. The CarVal acquisition resulted in the recording of a contingent consideration payable of $228.9 million if certain performance targets are achieved over a six-year period (see Note 9 Fair Value and Note 24 Acquisitions and Divestitures). As of December 31, 2023 and December 31, 2022, the contingent consideration payable associated with the CarVal acquisition was $238.5 million and $232.1 million, respectively. During 2023, we recorded an expense of $28.4 million due to a change in estimate related to the contingent consideration associated with the acquisition of Autonomous LLC in 2019. The change in estimate was based upon better than expected revenues during the 2023 performance evaluation period. We recorded $14.1 million as contingent payment arrangement expense and $14.3 million as compensation and benefits expense in the condensed consolidated statement of income. The charges to compensation and benefits expense are due to certain service conditions and special awards included in the acquisition agreement. During 2023 and 2022, there were no facts or circumstances occurringimpairments of contingent consideration payable recorded in the consolidated statements of income. During the fourth quarter of 2020 suggesting possible impairment.
As of January 1, 2020,2021, we adopted ASU 2017-04, Simplifying the Test for Goodwill Impairment. The guidance removed Step 2recorded an impairment of the goodwill impairment test, which had requiredcontingent consideration payable related to our 2016 acquisition of Ramius Alternative Solutions LLC. of of $0.6 million.
Several valuation methods may be used to determine the fair value of assets acquired and liabilities assumed. For intangible assets, we typically use a hypothetical purchase price allocation. Asmethod that is a resultform of the revised guidance,income approach, whereby a goodwill impairment will beforecast of future cash flows attributable to the asset are discounted to present value using a risk-adjusted discount rate. Similarly for contingent liabilities, we develop a forecast of future cash flows attributable to the performance objectives that are then discounted to present value using a risk-adjusted discount rate. Some of the more significant estimates and assumptions inherent in the income approach include the amount by which a reporting unit's carrying value exceeds its fair value, notand timing of projected future cash flows and the discount rate selected to exceedmeasure the carrying amountrisks inherent in the future cash flows.
Intangible Assets, Net
Intangible assets consist primarily of costs assigned to acquired investment management contracts based on their estimated fair value at the time of acquisition, less accumulated amortization. Intangible assets are recognized at fair value and generally are amortized on a straight-line basis over their estimated useful life ranging from six years5 to 20 years.
The CarVal acquisition in the third quarter of 2022 resulted in recording of $303.0 million of finite-lived intangible assets primarily relating to investment management contracts and investor relationships with useful lives ranging from 5 to 10 years (see Note 24 Acquisitions and Divestitures).
As of December 31, 2020,2023, intangible assets, net of accumulated amortization, of $44.5$264.6 million on the consolidated statement of financial condition consists of $29.2$249.4 million of finite-lived intangible assets subject to amortization and $15.3$15.2 million of indefinite-lived intangible assets not subject to amortization.
As of December 31, 2019,2022, intangible assets, net of accumulated amortization, of $55.4$310.2 million on the consolidated statement of financial condition consisted of $41.9$295.0 million of finite-lived intangible assets subject to amortization of which $15.5 million related to the Bernstein acquisition (which was fully amortized as of December 31, 2020), and $13.5$15.2 million of indefinite-lived intangible assets not subject to amortization in regard to other acquisitions.
The gross carrying amount of finite-lived intangible assets totaled $65.1$328.4 million as of December 31, 20202023 and $468.9$327.9 million as of December 31, 2019,2022, and accumulated amortization was $35.9$79.0 million as of December 31, 20202023 and $427.0$32.9 million as of December 31, 2019. 2022.
Amortization expense was $21.4$46.9 million for 2020, $28.82023, $26.6 million for 20192022 and $27.8$5.7 million for 2018.2021. Estimated future annual amortization expense for 2021 is approximately $6$46 million $5 millionannually in years twoone through four, then approximately $4three and $25 million in year four and five.
We periodically review indefinite-lived intangible assets for impairment aswhen events or changes in circumstances indicate that the carrying value may not be recoverable. This test is performed at least annually or as triggering events occur. If the carrying value exceeds fair value, we perform additionalan impairment testsassessment to measure the amount of the impairment loss, if any. During the fourth quarter of 2020,2023 we performed an impairment assessment of our intangible assets. The impairment assessment indicated that our intangible assets were not impaired. During the fourth quarters of 2022 and 2021, we recorded an impairmentimpairments of $1.5$5.6 million relatingand $1.0 million, related to our 2014 acquisition of CPH Capital and our 2016 acquisition of Ramius Alternative Solutions LLC.LLC, respectively. Due to the loss of acquired investment management contracts during 2020,each respective year, the carrying value of the finite-lived intangible assets exceeded the fair value of the
contracts. We determined the fair value of the contracts using a discounted cashflowcash flow model. The impairment charge was recorded in general and administrative expenses in the consolidated statements of income.
Deferred Sales Commissions, Net
We pay commissions to financial intermediaries in connection with the sale of shares of open-end company-sponsored mutual funds sold without a front-end sales charge (“back-end load shares”). These commissions are capitalized as deferred sales commissions and amortized over periods not exceeding one year for U.S. fund shares and four years for Non-U.S. Fund shares, the periods of time during which deferred sales commissions generally are recovered. We recover these commissions from distribution services fees received from those funds and from CDSC received from shareholders of those funds upon the redemption of their shares. CDSC cash recoveries are recorded as reductions of unamortized deferred sales commissions when received. Since January 31, 2009, our U.S. mutual funds have not offered back-end load shares to new investors.
We periodically review the deferred sales commission asset for impairment as events or changes in circumstances indicate that the carrying value may not be recoverable. If these factors indicate impairment in value, we compare the carrying value to the undiscounted cash flows expected to be generated by the asset over its remaining life. If we determine the deferred sales commission asset is not fully recoverable, the asset will be deemed impaired and a loss will be recorded in the amount by which the recorded amount of the asset exceeds its estimated fair value. There were 0no impairment charges recorded during 20202023 or 2019.2022.
Leases
We determine if an arrangement is a lease at inception. Both operating and finance leases are included in the right-of-use (“ROU”) assets and lease liabilities in our consolidated statement of financial condition.
ROU assets represent our right to use an underlying asset for the lease term and lease liabilities represent our obligation to make lease payments arising from the lease. ROU assets and lease liabilities are recognized at commencement date based on the present value of lease payments over the lease term. We use our consolidated incremental borrowing rate based on the information available as of the lease commencement date in determining the present value of lease payments. Our lease terms may include options to extend or terminate the lease. These options to extend or terminate are assessed on a lease-by-lease basis, and the ROU assets and lease liabilities are adjusted when it is reasonably certain that an option will be exercised.
When calculating the measurement of ROU assets and lease liabilities, we utilize the fixed payments associated with the lease and do not include other variable contractual obligations, such as operating expenses, real estate taxes, cleaning and employee parking.utilities. These costs are accounted for as period costs and expensed as incurred.
Additionally, we exclude any intangible assets such as software licensing agreements as stated in ASC 842-10-15-1. These arrangements will continue to follow the guidance of ASC 350, Intangibles - Goodwill and Other.
Loss Contingencies
With respect to all significant litigation matters, we consider the likelihood of a negative outcome. If we determine the likelihood of a negative outcome is probable and the amount of the loss can be reasonably estimated, we record an estimated loss for the expected outcome of the litigation. If the likelihood of a negative outcome is reasonably possible andAny such accruals are adjusted thereafter as appropriate to reflect changed circumstances. When we are able to do so, we also determine estimates of reasonably possible losses or ranges of reasonably possible losses for such matters, whether in excess of any related accrued liability or where there is no accrued liability, and we disclose an estimate of the possible loss or range of loss in excess of amounts already accrued, if any, we disclose that fact together with the estimate of the possible loss or range of loss.losses. However, it is often difficult to predict the outcome or estimate a possible loss or range of loss because litigation is subject to inherent uncertainties, particularly when plaintiffs allege substantial or indeterminate damages. Such is alsoparticularly the case when the litigation is in its early stages or when the litigation is highly complex or broad in scope. In these cases, we disclose that we are unable to predict the outcome or estimate a possible loss or range of loss.
Contingent Payment ArrangementsAssets and Liabilities Held for Sale
We periodically enter into contingent payment arrangementsThe Company classifies assets and liabilities to be sold (disposal group) as held for sale in connection with our business combinations. In these arrangements, we agreethe period when all of the applicable criteria are met, including: (i) management commits to pay additional considerationa plan to sell, (ii) the disposal group is available to sell in its present condition, (iii) there is an active program to locate a buyer, (iv) the disposal group is being actively marketed at a reasonable price in relation to its fair value, (v) significant changes to the sellersplan to sell are unlikely, and (vi) the extentsale of the disposal group is generally probable of being completed within one year. Management performs an assessment of held for sale at least quarterly or when events or changes in business circumstances indicate that certain performance targetsa change in classification may be necessary. Assets and liabilities held for sale are achieved. We estimatepresented separately within the fair value of these potential future obligations at the time a business combination is consummated and record a liability on our consolidated statements of financial condition. We then accretecondition with any adjustments necessary to measure the obligationdisposal group at the lower of its carrying value or fair value less costs to its expected payment amount oversell. Depreciation of property, plant and equipment and amortization of intangible and right-of-use assets are not recorded while these assets are classified as held for sale. For each reporting period the measurement period. If our expected payment amount subsequentlydisposal group remains classified as held for sale, the carrying value of the disposal group is adjusted for subsequent changes the obligationin fair value less costs to sell. A loss is modifiedrecognized for any subsequent decrease in the current period resulting infair value less costs to sell, while a gain or loss. Both gains and losses resulting from changesis recognized in any subsequent period for any subsequent increase in fair value less cost to expected payments andsell, but not in excess of the accretioncumulative loss previously recognized. If, in any period, the carrying value of these obligationsthe disposal group exceeds the estimated fair value less costs to their expected payment amounts are reflected within contingent payment arrangements in our consolidated
statements of income. During the fourth quarter of 2020, we recordedsell, a loss is recognized on sale rather than an impairment loss.
Assets and liabilities classified as held for sale on the consolidated statement of the contingent consideration payablefinancial condition as of $1.4December 31, 2023 were $564.8 million relating to our 2016 acquisitionand $153.3 million, respectively. Assets and liabilities classified as held for sale as of Ramius Alternative Solutions LLC.December 31, 2022 were $551.4 million and $108.0 million, respectively.
Mutual Fund Underwriting Activities
Purchases and sales of shares of company-sponsored mutual funds in connection with the underwriting activities of our subsidiaries, including related commission income, are recorded on the trade date. Receivables from brokers and dealers for sale of shares of company-sponsored mutual funds generally are realized within three business days from the trade date, in conjunction with the settlement of the related payables to company-sponsored mutual funds for share purchases. Distribution plan and other promotion and servicing payments are recognized as expense when incurred.
Long-term Incentive Compensation Plans
We maintain several unfunded, non-qualified long-term incentive compensation plans, under which we grant annual awards to employees, generally in the fourth quarter, and to members of the Board of Directors of the General Partner, who are not employed by our company or by any of our affiliates ("Eligible Directors").
Awards granted in December 2020, 20192023, 2022 and 20182021 allowed employee participantsemployees to allocate their awards between restricted AB Holding Units and deferred cash. Participants (except certain members of senior management) generally could allocate up to 50% of their awards to deferred cash, not to exceed a total of $250,000 per award. Each of our employees based outside of the United States (other than expatriates), who received an award of $100,000 or less, could have allocated up to 100% of his or hertheir award to deferred cash. Participants allocated their awards prior to the date on which the Compensation Committee granted awards in December 2020, 2019 and 2018. For these awards, theThe number of AB Holding Units awarded was based on the closing price of an AB Holding Unit on the grant date.date as of which the awards were approved by the Compensation and Workplace Practices Committee (the "Compensation Committee") of the Board of Directors (the "Board"). For awards granted in 2020, 20192023, 2022 and 2018:2021:
•We engageengaged in open-market purchases of AB Holding Units or purchase newly-issuednewly issued AB Holding Units from AB Holding that are awarded to participants and keep them in a consolidated rabbi trust.
•Quarterly distributions on vested and unvested AB Holding Units arewere paid currently to participants, regardless of whether or not a long-term deferral election hashad been made.
•Interest on deferred cash iswas accrued monthly based on our monthly weighted average cost of funds.
We recognize compensation expense related to equity compensation grants in the financial statements using the fair value method. Fair value of restricted AB Holding Unit awards is the closing price of an AB Holding Unit on the grant date; fair value of options is determined using the Black-Scholes option valuation model. Under the fair value method, compensatory expense is measured at the grant date based on the estimated fair value of the award and is recognized over the required service period. For year-end long-term incentive compensation awards, employees who resign or are terminated without cause may retain their awards, subject toprovided the employee remains in compliance with certain agreements and restrictive covenants set forth in the applicable award agreement, including restrictionsthe imposition of forfeiture as a result of post-employment competition, prohibitions on competition and employee and client solicitation, and a potential claw-back for failing to follow existing risk management policies. Because there is no service requirement, we fully expense these awards on the grant date. Most equity replacement, sign-on or similar deferred compensation awards included in separate employment agreements or arrangements include a required service period. Regardless of whether or not the award agreement includes employee service requirements, AB Holding Units are typically are delivered to employees ratably over three years to four years, unless the employee has made a long-term deferral election.
Grants of restricted AB Holding Units can be awarded to Eligible Directors. Generally, these restricted AB Holding Units vest ratably over fourthree years. These restricted AB Holding Units are not forfeitable (except if the Eligible Director is terminated for “Cause,” as that term is defined in the applicable award agreement). We fully expense these awards on grant date, as there is no service requirement.
We fund our restricted AB Holding Unit awards either by purchasing AB Holding Units on the open market or purchasing newly-issued AB Holding Units from AB Holding, and then keeping these AB Holding Units in a consolidated rabbi trust until delivering them or retiring them. In accordance with the Amended and Restated Agreement of Limited Partnership of AB (“AB Partnership Agreement”), when AB purchases newly-issued AB Holding Units from AB Holding, AB Holding is required to use the proceeds it receives from AB to purchase the equivalent number of newly-issuednewly issued AB Units, thus increasing its percentage ownership interest in AB. AB Holding Units held in the consolidated rabbi trust are corporate assets in the name of the trust and are available to the general creditors of AB.
Repurchases of AB Holding Units for the years ended December 31, 20202023 and 20192022 consisted of the following:
| | | | | | | | | | | | | | |
| | Years Ended December 31, |
| | 2020 | | 2019 |
| | (in millions) |
Total amount of AB Holding Units Purchased (1) | | 5.4 | | | 6.0 | |
Total Cash Paid for AB Holding Units Purchased(1) | | $ | 149.0 | | | $ | 172.6 | |
Open Market Purchases of AB Holding Units Purchased (2) | | 3.1 | | | 2.9 | |
Total Cash Paid for Open Market Purchases of AB Holding Units (2) | | $ | 74.0 | | | $ | 82.7 | |
| | | | | | | | | | | | | | |
| Years Ended December 31 |
| 2023 | 2022 |
| (in millions) |
Total amount of AB Holding Units Purchased(1) | | 4.7 | | | 5.2 | |
Total Cash Paid for AB Holding Units Purchased(1) | | $ | 144.4 | | | $ | 211.8 | |
Open Market Purchases of AB Holding Units Purchased(1) | | 2.0 | | | 2.3 | |
Total Cash Paid for Open Market Purchases of AB Holding Units(1) | | $ | 62.6 | | | $ | 92.7 | |
(1)Purchased on a trade date basis.
(2) The remainder related todifference between open-market purchases and units retained reflects the retention of AB Holding Units from employees to fulfill statutory tax withholding requirements at the time of delivery of long-term incentive compensation awards.
Each quarter, we consider whether to implement a plan to repurchase AB Holding Units pursuant to Rules 10b5-1 and 10b-18 under the Securities Exchange Act of 1934, as amended (“Exchange Act”). A plan of this type allows a company to repurchase its shares at times when it otherwise might be prevented from doing so because of self-imposed trading blackout periods or because it possesses material non-public information. Each broker we select has the authority to repurchase AB Holding Units on our behalf in accordance with the terms and limitations specified in the plan. Repurchases are subject to regulations promulgated by the SEC as well as certain price, market volume and timing constraints specified in the plan. TheThere was no plan adopted during the fourth quarter of 2020 expired at the close of business on February 10, 2021.2023. We may adopt additional plans in the future to engage in open-market purchases of AB Holding Units to help fund anticipated obligations under our incentive compensation award program and for other corporate purposes.
During 2020,2023, we granted to employees and Eligible Directors 5.75.6 million restricted AB Holding Units (including 5.0 million granted in December for 20202023 year-end awards to employees). During 2019,2022, we granted to employees and Eligible Directors 7.74.7 million restricted AB Holding Units (including 5.43.8 million granted in December for 20192022 year-end awards to employees). We used AB Holding Units repurchased during the periods and newly-issued AB Holding Units to fund these awards.
During 20202023 and 2019,2022, AB Holding issued 5,182zero and 0.5 million5,774 AB Holding Units, respectively, upon exercise of options to buy AB Holding Units. AB Holding used the proceeds of $0.1 millionzero and $11.5$0.2 million, respectively, received from award recipients as payment in cash for the exercise price to purchase the equivalent number of newly-issuednewly issued AB Units.
Foreign Currency Translation and Transactions
Assets and liabilities of foreign subsidiaries are translated from functional currencies into United States dollars (“US$”) at exchange rates in effect at the balance sheet dates, and related revenues and expenses are translated into US$ at average exchange rates in effect during each period. Net foreign currency gains and losses resulting from the translation of assets and liabilities of foreign operations into US$ are reported as a separate component of other comprehensive income in the consolidated statements of comprehensive income. Net foreign currency transaction losses were $3.3$4.5 million, $2.0$10.2 million and $0.1$8.5 million for 2020, 20192023, 2022 and 2018,2021, respectively, and are reported in general and administrative expenses on the consolidated statements of income.
Cash Distributions
AB is required to distribute all of its Available Cash Flow, as defined in the AB Partnership Agreement, to its Unitholders and to the General Partner. Available Cash Flow can be summarized as the cash flow received by AB from operations minus such amounts as the General Partner determines, in its sole discretion, should be retained by AB for use in its business, or plus such amounts as the General Partner determines, in its sole discretion, should be released from previously retained cash flow.
Typically, Available Cash Flow has been the adjusted diluted net income per unit for the quarter multiplied by the number of general and limited partnership interests at the end of the quarter. In future periods, management anticipates that Available Cash Flow will be based on adjusted diluted net income per unit, unless management determines, with the concurrence of the Board, of Directors, that one or more adjustments that are made for adjusted net income should not be made with respect to the Available Cash Flow calculation.
On February 11, 2021,6, 2024, the General Partner declared a distribution of $1.05$0.85 per AB Unit, representing a distribution of Available Cash Flow for the three months ended December 31, 2020.2023. The General Partner, as a result of its 1%1.0% general partnership interest, is entitled to receive 1%1.0% of each distribution. The distribution is payable on March 4, 202114, 2024 to holders of record on February 22, 2021.
Total cash distributions per Unit paid to the General Partner and Unitholders during 2020, 20192023, 2022 and 20182021 were $3.08, $2.60$2.92, $3.87 and $3.16,$3.86, respectively.
Comprehensive Income
We report all changes in comprehensive income in the consolidated statements of comprehensive income. Comprehensive income includes net income, as well as foreign currency translation adjustments, actuarial gains (losses) and prior service cost. Deferred taxes were not recognized on foreign currency translation adjustments for foreign subsidiaries which had earnings that were considered permanently invested outside the United States.
Subsequent Events
We evaluate subsequent events through the date that these financial statements are filed with the SEC.
We entered into a lease that commenced in January 2024, relating to approximately 166,000 square feet of space in New York City. Our estimated total base rent obligation (excluding taxes, operating expenses and utilities) over the 20-year lease term is approximately $393.0 million.
No other subsequent events were identified through the date these financials statements were filed with the SEC.
3. Revenue Recognition
Revenues for the years ended December 31, 2020, 20192023, 2022 and 20182021 consisted of the following:
| | Year Ended December 31, |
| 2020 | | 2019 | | 2018 |
| (in thousands) |
| Years Ended December 31 | | | Years Ended December 31 |
| 2023 | | | 2023 | 2022 | 2021 |
| (in thousands) | | | (in thousands) |
| Subject to contracts with customers: | Subject to contracts with customers: | |
| Investment advisory and services fees | Investment advisory and services fees | |
| Investment advisory and services fees | |
| Investment advisory and services fees | |
| Base fees | |
| Base fees | |
| Base fees | Base fees | | $ | 2,462,810 | | | $ | 2,372,429 | | | $ | 2,244,068 | |
| Performance-based fees | Performance-based fees | | 132,626 | | | 99,615 | | | 118,143 | |
| Bernstein research services | Bernstein research services | | 459,744 | | | 407,911 | | | 439,432 | |
| Distribution revenues | Distribution revenues | |
| All-in-management fees | All-in-management fees | | 331,268 | | | 291,999 | | | 254,477 | |
| All-in-management fees | |
| All-in-management fees | |
| 12b-1 fees | 12b-1 fees | | 75,973 | | | 80,268 | | | 87,166 | |
| Other | | 122,540 | | | 82,776 | | | 76,919 | |
| Other distribution fees | |
| Other revenues | Other revenues | |
| Shareholder servicing fees | Shareholder servicing fees | | 82,317 | | | 77,394 | | | 75,974 | |
| Shareholder servicing fees | |
| Shareholder servicing fees | |
| Other | Other | | 21,240 | | | 17,924 | | | 19,211 | |
| 3,688,518 | | | 3,430,316 | | | 3,315,390 | |
| | 4,048,736 | |
| Not subject to contracts with customers: | Not subject to contracts with customers: | | | | | | |
| Dividend and interest income, net of interest expense | Dividend and interest income, net of interest expense | | 35,273 | | | 47,216 | | | 45,827 | |
| Investment (losses) gains | | (16,401) | | | 38,659 | | | 2,653 | |
| Dividend and interest income, net of interest expense | |
| Dividend and interest income, net of interest expense | |
| Investment gains (losses) | |
| Other revenues | Other revenues | | 1,146 | | | 2,241 | | | 3,491 | |
| 20,018 | | | 88,116 | | | 51,971 | |
| | 106,587 | |
| Total net revenues | Total net revenues | | $ | 3,708,536 | | | $ | 3,518,432 | | | $ | 3,367,361 | |
Part II
4. Net Income Per Unit
Basic net income per unit is derived by reducing net income for the 1%1.0% general partnership interest and dividing the remaining 99%99.0% by the basic weighted average number of limited partnership units outstanding for each year. Diluted net income per unit is derived by reducing net income for the 1%1.0% general partnership interest and dividing the remaining 99%99.0% by the total of the diluted weighted average number of limited partnership units outstanding for each year.
| | Year Ended December 31, |
| 2020 | | 2019 | | 2018 |
| (in thousands, except per unit amounts) |
| Years Ended December 31 | | | Years Ended December 31 |
| 2023 | | | 2023 | 2022 | 2021 |
| (in thousands, except per unit amounts) | | | (in thousands, except per unit amounts) |
| Net income attributable to AB Unitholders | Net income attributable to AB Unitholders | $ | 865,952 | | | $ | 752,042 | | | $ | 757,588 | |
| | Weighted average units outstanding—basic | Weighted average units outstanding—basic | 269,058 | | | 268,075 | | | 269,236 | |
| Dilutive effect of compensatory options to buy AB Holding Units | Dilutive effect of compensatory options to buy AB Holding Units | 27 | | | 44 | | | 251 | |
| Weighted average units outstanding—diluted | Weighted average units outstanding—diluted | 269,085 | | | 268,119 | | | 269,487 | |
| | Basic net income per AB Unit | Basic net income per AB Unit | $ | 3.19 | | | $ | 2.78 | | | $ | 2.79 | |
| Diluted net income per AB Unit | Diluted net income per AB Unit | $ | 3.19 | | | $ | 2.78 | | | $ | 2.78 | |
| | | | | | | | | | | | | | | | | | | | |
| | Years Ended December 31, |
| | 2020 | | 2019 | | 2018 |
| |
| Anti-dilutive options excluded from diluted net income | | 29,056 | | | 29,056 | | | 49,784 | |
5. Cash and Securities Segregated Under Federal Regulations and Other Requirements
As of December 31, 20202023 and 2019, $1.82022, $0.9 billion and $1.1$1.5 billion, respectively, of U.S. Treasury Bills were segregated in a special reserve bank custody account for the exclusive benefit of our brokerage customers under Rule 15c3-3 of the Exchange Act.
6. Investments
Investments consist of:
| | December 31, |
| 2020 | | 2019 |
| (in thousands) |
| Years Ended December 31 | | | Years Ended December 31 |
| 2023 | | | 2023 | 2022 |
| (in thousands) | | | (in thousands) |
| | Equity securities: | Equity securities: | |
| | Equity securities: | |
| | Equity securities: | |
| Long-term incentive compensation-related | |
| Long-term incentive compensation-related | |
| Long-term incentive compensation-related | Long-term incentive compensation-related | $ | 34,351 | | | $ | 36,665 | |
| Seed capital | Seed capital | 75,766 | | | 70,464 | |
| Other | 55,439 | | | 73,202 | |
| Exchange-traded options | 7,527 | | | 6,931 | |
| | Investments in limited partnership hedge funds: | Investments in limited partnership hedge funds: | |
| | Investments in limited partnership hedge funds: | |
| | Investments in limited partnership hedge funds: | |
| Long-term incentive compensation-related | |
| Long-term incentive compensation-related | |
| Long-term incentive compensation-related | Long-term incentive compensation-related | 25,762 | | | 14,237 | |
| Seed capital | Seed capital | 16,646 | | | 33,124 | |
| | Time deposits | Time deposits | 18,602 | | | 18,281 | |
| Time deposits | |
| Time deposits | |
| Other | Other | 19,282 | | | 13,890 | |
| Total investments | Total investments | $ | 253,375 | | | $ | 266,794 | |
Total investments related to long-term incentive compensation obligations of $60.1$40.0 million and $50.9$47.9 million as of December 31, 20202023 and 2019,2022, respectively, consist of company-sponsored mutual funds and hedge funds. For long-term incentive compensation awards granted before 2009, we typically made investments in company-sponsored mutual funds and
hedge funds that were notionally elected by plan participants and maintained them (and continue to maintain them) in a consolidated rabbi trust or separate custodial account. The rabbi trust and custodial account enable us to hold such investments separate from our other assets for the purpose of settling our obligations to participants. The investments held in the rabbi trust and custodial account remain available to the general creditors of AB.
The underlying investments of hedge funds in which we invest include long and short positions in equity securities, fixed income securities (including various agency and non-agency asset-based securities), currencies, commodities and derivatives (including various swaps and forward contracts). These investments are valued at quoted market prices or, where quoted market prices are not available, are fair valued based on the pricing policies and procedures of the underlying funds.
We allocate seed capital to our investment teams to help develop new products and services for our clients. A portion of our seed capital trading investments are equity and fixed income products, primarily in the form of separately-managedseparately managed account portfolios, U.S. mutual funds, Luxembourg funds, Japanese investment trust management funds or Delaware business trusts. We also may allocate seed capital to investments in private equity funds. In regard toRegarding our seed capital investments, the amounts above reflect those funds in which we are not the primary beneficiary of a VIE or hold a controlling financial interest in a VOE. See Note 15, Consolidated Company-Sponsored Investment Funds, for a description of the seed capital investments that we consolidated. As of December 31, 20202023 and 2019,2022, our total seed capital investments were $310.3$394.2 million and $358.1$309.6 million, respectively. Seed capital investments in unconsolidated company-sponsored investment funds are valued using published net asset values or non-published net asset values if they are not listed on an active exchange but have net asset values that are comparable to funds with published net asset values and have no redemption restrictions.
In addition, we also have long positions in corporate equities and long exchange-traded options traded through our options desk.
The portion of unrealized gains (losses) related to equity securities, as defined by ASC 321-10, held as of December 31, 20202023 and 20192022 were as follows:
| | December 31, |
| 2020 | | 2019 |
| (in thousands) |
| Net gain (losses) recognized during the period | $ | 17,927 | | | $ | 31,890 | |
| Years Ended December 31 | | | Years Ended December 31 |
| 2023 | | | 2023 | 2022 |
| (in thousands) | | | (in thousands) |
| Net gains (losses) recognized during the period | |
| Less: net gains recognized during the period on equity securities sold during the period | Less: net gains recognized during the period on equity securities sold during the period | 27,357 | | | 18,138 | |
| Unrealized gains (losses) recognized during the period on equity securities held | Unrealized gains (losses) recognized during the period on equity securities held | $ | (9,430) | | | $ | 13,752 | |
7. Derivative Instruments
See Note 15 Consolidated Company-Sponsored Investment Funds, for disclosure of derivative instruments held by our consolidated company-sponsored investment funds.
We enter into various futures, forwards, options and swaps to economically hedge certain seed capital investments. Also, we have currency forwards that help us to economically hedge certain balance sheet exposures. In addition, our options desk trades long and short exchange-traded equity options. We do not hold any derivatives designated in a formal hedge relationship under ASC 815-10, Derivatives and Hedging.
The notional value, fair value and gains and losses recognized in investment gains (losses) as of December 31, 20202023 and 20192022 for derivative instruments (excluding derivative instruments relating to our options desk trading activities discussed below) not designated as hedging instruments were as follows:
| | | | | | | | | | | | | | | | | | | | | | | |
| Notional
Value | | Derivative
Assets | | Derivative
Liabilities | | Gains
(Losses) |
| (in thousands) |
| December 31, 2020 | | | | | | | |
| Exchange-traded futures | $ | 142,886 | | | $ | 118 | | | $ | 1,834 | | | $ | (15,743) | |
| Currency forwards | 63,906 | | | 8,576 | | | 8,451 | | | (1,779) | |
| Interest rate swaps | 60,997 | | | 2,043 | | | 2,955 | | | (347) | |
| Credit default swaps | 167,649 | | | 10,910 | | | 13,304 | | | (104) | |
| Total return swaps | 52,061 | | | 94 | | | 1,847 | | | (15,242) | |
| Option swaps | 2,486 | | | 0 | | | 2,146 | | | (2,374) | |
| Total derivatives | $ | 489,985 | | | $ | 21,741 | | | $ | 30,537 | | | $ | (35,589) | |
| December 31, 2019 | | | | | | | |
| Exchange-traded futures | $ | 171,112 | | | $ | 939 | | | $ | 871 | | | $ | (10,840) | |
| Currency forwards | 60,809 | | | 8,545 | | | 8,633 | | | 738 | |
| Interest rate swaps | 92,756 | | | 1,746 | | | 2,254 | | | (616) | |
| Credit default swaps | 168,303 | | | 2,151 | | | 5,611 | | | (6,413) | |
| Total return swaps | 91,201 | | | 110 | | | 1,764 | | | (21,164) | |
| Option swaps | 354 | | | 0 | | | 126 | | | (126) | |
| Total derivatives | $ | 584,535 | | | $ | 13,491 | | | $ | 19,259 | | | $ | (38,421) | |
| | | | | | | | | | | | | | | | | | | | | | | | | | |
| Notional
Value | Derivative
Assets | Derivative
Liabilities | Gains
(Losses) |
| (in thousands) |
| December 31, 2023 | | | | | | | | |
| Exchange-traded futures | | $ | 116,344 | | | $ | 1 | | | $ | 3,511 | | | $ | (2,038) | |
| Currency forwards | | 34,440 | | | 4,951 | | | 5,597 | | | (82) | |
| Interest rate swaps | | 11,345 | | | 294 | | | 349 | | | 110 | |
| Credit default swaps | | 139,607 | | | 9,265 | | | 4,197 | | | (6,850) | |
| Total return swaps | | 95,021 | | | 6 | | | 4,391 | | | (5,443) | |
| Option swaps | | 50,232 | | | 1 | | | 135 | | | (2,107) | |
| Total derivatives | | $ | 446,989 | | | $ | 14,518 | | | $ | 18,180 | | | $ | (16,410) | |
| December 31, 2022 | | | | | | | | |
| Exchange-traded futures | | $ | 154,687 | | | $ | 1,768 | | | $ | 162 | | | $ | 19,994 | |
| Currency forwards | | 34,597 | | | 4,446 | | | 5,047 | | | 1,965 | |
| Interest rate swaps | | 16,847 | | | 386 | | | 262 | | | 70 | |
| Credit default swaps | | 225,671 | | | 17,507 | | | 7,302 | | | (1,000) | |
| Total return swaps | | 28,742 | | | 605 | | | 933 | | | 14,828 | |
| Option swaps | | 50,000 | | | — | | | 6 | | | 5,211 | |
| Total derivatives | | $ | 510,544 | | | $ | 24,712 | | | $ | 13,712 | | | $ | 41,068 | |
As of December 31, 20202023 and 2019,2022, the derivative assets and liabilities are included in both receivables and payables to brokers and dealers on our consolidated statements of financial condition. Gains and losses on derivative instruments are reported in investment gains (losses) on the consolidated statements of income.
We may be exposed to credit-related losses in the event of non-performance by counterparties to derivative financial instruments. We minimize our counterparty exposure through a credit review and approval process. In addition, we have executed various collateral arrangements with counterparties to the over-the-counter derivative transactions that require both pledging and accepting collateral in the form of cash.cash and U.S. Treasuries. As of December 31, 20202023 and 2019,2022, we held $0.4$5.7 million and $0.3$8.4 million, respectively, of cash collateral payable to trade counterparties. This obligation to return cash is reported in payables to brokers and dealers in our consolidated statements of financial condition.
Although notional amount is the most commonly usedtypical measure of volume in the derivatives market, it is not used as a measure of credit risk. Generally, the current credit exposure of our derivative contracts is limited to the net positive estimated fair value of derivative contracts at the reporting date after taking into consideration the existence of netting agreements and any collateral received. A derivative with positive value (a derivative asset) indicates existence of credit risk because the counterparty would owe us if the contract were closed. Alternatively, a derivative contract with negative value (a derivative liability) indicates we would owe money to the counterparty if the contract were closed. Generally, if there is more than one derivative transaction with a single counterparty, a master netting arrangement exists with respect to derivative transactions with that counterparty to provide for aggregate net settlement.
Certain of ourOur standardized contracts for over-the-counter derivative transactions, (“known as ISDA Master Agreements”) contain credit risk related contingent provisions pertaining to each counterparty's credit rating. In some ISDA Master Agreements, if the counterparty’s credit rating, or in somemaster agreements, our AUM, falls below a specified threshold, either a default or a termination event permitting the counterparty to terminate the ISDA Master Agreement would be triggered. In all agreements that provide for collateralization, various levels of collateralization of net liability positions are applicable, depending on the credit rating of the counterparty.collateralization. As of December 31, 20202023 and 2019,2022, we delivered $6.4$7.8 million and $4.3$4.2 million, respectively, of cash collateral into brokerage accounts. We report this cash collateral in cash and cash equivalents in our consolidated statements of financial condition.
As of December 31, 20202023 and 2019, we held $7.5 million2022, long and $6.9 million, respectively, of longshort exchange-traded equity options which are included in other investmentswere classified as held for sale on our consolidated statementsstatement of financial condition. In addition, as of December 31, 2020position. For further discussion, see Note 24 Acquisitions and 2019, we held $12.5 million and $12.3 million, respectively, of short exchange-traded equity options,Divestitures.
which are included in securities sold not yet purchased on our consolidated statements of financial condition. Our options desk provides our clients with equity derivative strategies and execution for exchange-traded options on single stocks, exchange-traded funds and indices. While predominately agency-based, the options desk may commit capital to facilitate a client's transaction. Our options desk hedges the risk associated with this activity by taking offsetting positions in equities. For the yearsyear ended December 31, 20202023 and 20192022, we recognized $11.9$4.9 million and $22.2$22.1 million respectively, of losses on equity options activity.activity, respectively. These losses are recognized in investment gains (losses) in the consolidated statements of income.
8. Offsetting Assets and Liabilities
See Note 15, Consolidated Company-Sponsored Investment Funds, for disclosure of offsetting assets and liabilities of our consolidated company-sponsored investment funds.
Offsetting of assets as of December 31, 20202023 and 20192022 was as follows:
| | Gross
Amounts of
Recognized
Assets | | Gross
Amounts
Offset in the
Statement
of Financial
Condition | | Net
Amounts of
Assets
Presented in
the
Statement of
Financial
Condition | | Financial
Instruments Collateral | | Cash Collateral
Received | | Net
Amount |
| (in thousands) |
| December 31, 2020 | |
| Gross
Amounts of
Recognized
Assets | | | Gross
Amounts of
Recognized
Assets | Gross
Amounts
Offset in the
Statement
of Financial
Condition | Net
Amounts of
Assets
Presented in
the
Statement of
Financial
Condition | Financial
Instruments Collateral | Cash Collateral
Received | Net
Amount |
| (in thousands) | | | (in thousands) |
| December 31, 2023 | |
| Securities borrowed | |
| Securities borrowed | |
| Securities borrowed | Securities borrowed | $ | 7,808 | | | $ | 0 | | | $ | 7,808 | | | $ | (7,344) | | | $ | 0 | | | $ | 464 | |
| Derivatives | Derivatives | $ | 21,741 | | | $ | 0 | | | $ | 21,741 | | | $ | 0 | | | $ | (380) | | | $ | 21,361 | |
| Long exchange-traded options | $ | 7,527 | | | $ | 0 | | | $ | 7,527 | | | $ | 0 | | | $ | 0 | | | $ | 7,527 | |
| December 31, 2019 | |
| | December 31, 2022 | |
| December 31, 2022 | |
| December 31, 2022 | |
| Securities borrowed | |
| Securities borrowed | |
| Securities borrowed | Securities borrowed | $ | 38,993 | | | $ | 0 | | | $ | 38,993 | | | $ | (38,993) | | | $ | 0 | | | $ | 0 | |
| Derivatives | Derivatives | $ | 13,491 | | | $ | 0 | | | $ | 13,491 | | | $ | 0 | | | $ | (251) | | | $ | 13,240 | |
| Long exchange-traded options | $ | 6,931 | | | $ | 0 | | | $ | 6,931 | | | $ | 0 | | | $ | 0 | | | $ | 6,931 | |
|
Offsetting of liabilities as of December 31, 20202023 and 20192022 was as follows:
| | | | | | | | | | | | | | | | | | | | | | | | | | | | | | | | | | | |
| Gross
Amounts of
Recognized
Liabilities | | Gross
Amounts
Offset in the
Statement
of
Financial
Condition | | Net
Amounts
of Liabilities
Presented in
the
Statement
of Financial
Condition | | Financial
Instruments Collateral | | Cash Collateral
Pledged | | Net
Amount |
| (in thousands) |
| December 31, 2020 | | | | | | | | | | | |
| | | | | | | | | | | |
| Derivatives | $ | 30,537 | | | $ | 0 | | | $ | 30,537 | | | $ | 0 | | | $ | (6,374) | | | $ | 24,163 | |
| Short exchange-traded options | $ | 12,486 | | | $ | 0 | | | $ | 12,486 | | | $ | 0 | | | $ | 0 | | | $ | 12,486 | |
| December 31, 2019 | | | | | | | | | | | |
| | | | | | | | | | | |
| Derivatives | $ | 19,259 | | | $ | 0 | | | $ | 19,259 | | | $ | 0 | | | $ | (4,276) | | | $ | 14,983 | |
| Short exchange-traded options | $ | 12,348 | | | $ | 0 | | | $ | 12,348 | | | $ | 0 | | | $ | 0 | | | $ | 12,348 | |
| | | | | | | | | | | | | | | | | | | | | | | | | | | | | | | | | | | | | | |
| Gross
Amounts of
Recognized
Liabilities | Gross
Amounts
Offset in the
Statement
of
Financial
Condition | Net
Amounts
of Liabilities
Presented in
the
Statement
of Financial
Condition | Financial
Instruments Collateral | Cash Collateral
Pledged | Net
Amount |
| (in thousands) |
| December 31, 2023 | | | | | | | | | | | | |
| Securities loaned | | $ | 125,101 | | | $ | — | | | $ | 125,101 | | | $ | (122,369) | | | $ | — | | | $ | 2,732 | |
| Derivatives | | 18,180 | | | — | | | 18,180 | | | — | | | (7,795) | | | 10,385 | |
| | | | | | | | | | | | |
| December 31, 2022 | | | | | | | | | | | | |
| Securities loaned | | $ | 272,580 | | | $ | — | | | $ | 272,580 | | | $ | (267,053) | | | $ | — | | | $ | 5,527 | |
| Derivatives | | 13,712 | | | — | | | 13,712 | | | — | | | (4,158) | | | 9,554 | |
| | | | | | | | | | | | |
Cash collateral, whether pledged or received on derivative instruments, is not considered material and, accordingly, is not disclosed by counterparty.
9. Fair Value
See Note 15, Consolidated Company-Sponsored Investment Funds, for disclosure of fair value of our consolidated company-sponsored investment funds.
Fair value is defined as the price that would be received to sell an asset or paid to transfer a liability (i.e., the “exit price”) in an orderly transaction between market participants at the measurement date. The three broad levels of fair value hierarchy are as follows:
•Level 1—Quoted prices in active markets are available for identical assets or liabilities as of the reported date.
•Level 2—Quoted prices in markets that are not active or other pricing inputs that are either directly or indirectly observable as of the reported date.
•Level 3—Prices or valuation techniques that are both significant to the fair value measurement and unobservable as of the reported date. These financial instruments do not have two-way markets and are measured using management’s best estimate of fair value, where the inputs into the determination of fair value require significant management judgment or estimation.
Assets and Liabilities Measured at Fair Value on a Recurring Basis
Valuation of our financial instruments by pricing observability levels as of December 31, 20202023 and 20192022 was as follows (in thousands):
| | | | | | | | | | | | | | | | | | | | | | | | | | | | | | | | | | | |
| | Level 1 | | Level 2 | | Level 3 | | NAV Expedient(1) | | Other | | Total |
| December 31, 2020: | | | | | | | | | | | |
| Money markets | $ | 130,675 | | | $ | 0 | | | $ | 0 | | | $ | — | | | $ | — | | | $ | 130,675 | |
| Securities segregated (U.S. Treasury Bills) | 0 | | | 1,752,906 | | | 0 | | | — | | | — | | | 1,752,906 | |
| Derivatives | 118 | | | 21,623 | | | 0 | | | — | | | — | | | 21,741 | |
| Investments: | | | | | | | | | | | |
| | | | | | | | | | | |
| Equity securities | 147,705 | | | 17,565 | | | 125 | | | 161 | | | — | | | 165,556 | |
| Long exchange-traded options | 7,527 | | | 0 | | | 0 | | | — | | | — | | | 7,527 | |
Limited partnership hedge funds(2) | — | | | — | | | — | | | — | | | 42,408 | | | 42,408 | |
| | | | | | | | | | | |
Time deposits(3) | — | | | — | | | — | | | — | | | 18,602 | | | 18,602 | |
| | | | | | | | | | | |
| | | | | | | | | | | |
| Other investments | 7,011 | | | — | | | — | | | — | | | 12,271 | | | 19,282 | |
| Total investments | 162,243 | | | 17,565 | | | 125 | | | 161 | | | 73,281 | | | 253,375 | |
| Total assets measured at fair value | $ | 293,036 | | | $ | 1,792,094 | | | $ | 125 | | | $ | 161 | | | $ | 73,281 | | | $ | 2,158,697 | |
| | | | | | | | | | | |
| Securities sold not yet purchased: | | | | | | | | | | | |
| Short equities – corporate | $ | 5,305 | | | $ | 0 | | | $ | 0 | | | $ | — | | | $ | — | | | $ | 5,305 | |
| Short exchange-traded options | 12,486 | | | 0 | | | 0 | | | — | | | — | | | 12,486 | |
| Derivatives | 1,834 | | | 28,703 | | | 0 | | | — | | | — | | | 30,537 | |
| Contingent payment arrangements | 0 | | | 0 | | | 27,750 | | | — | | | — | | | 27,750 | |
| Total liabilities measured at fair value | $ | 19,625 | | | $ | 28,703 | | | $ | 27,750 | | | $ | — | | | $ | — | | | $ | 76,078 | |
| | | | | | | | | | | |
| | | | | | | | | | | |
| | | | Level 1 | | Level 2 | | Level 3 | | NAV Expedient(1) | | Other | | Total | | Level 1 | Level 2 | Level 3 | NAV Expedient(1) | Other | Total |
| | December 31, 2019: | |
| December 31, 2023 | |
| Money markets | |
| Money markets | |
| Money markets | Money markets | $ | 126,401 | | | $ | 0 | | | $ | 0 | | | $ | — | | | $ | — | | | $ | 126,401 | |
| Securities segregated (U.S. Treasury Bills) | Securities segregated (U.S. Treasury Bills) | 0 | | | 1,094,866 | | | 0 | | | — | | | — | | | 1,094,866 | |
| Derivatives | Derivatives | 939 | | | 12,552 | | | 0 | | | — | | | — | | | 13,491 | |
| Investments: | Investments: | |
| | Equity securities | Equity securities | 170,946 | | | 8,952 | | | 119 | | | 314 | | | — | | | 180,331 | |
| Long exchange-traded options | 6,931 | | | 0 | | | 0 | | | — | | | — | | | 6,931 | |
| | Equity securities | |
| | Equity securities | |
| Limited partnership hedge funds(2) | |
Limited partnership hedge funds(2) | |
Limited partnership hedge funds(2) | Limited partnership hedge funds(2) | 0 | | | — | | | — | | | — | | | 47,361 | | | 47,361 | |
| Time deposits(3) | Time deposits(3) | — | | | — | | | — | | | — | | | 18,281 | | | 18,281 | |
Time deposits(3) | |
Time deposits(3) | |
| | | Other investments | |
| | Other investments | |
| | Other investments | Other investments | 5,883 | | | — | | | — | | | — | | | 8,007 | | | 13,890 | |
| Total investments | Total investments | 183,760 | | | 8,952 | | | 119 | | | 314 | | | 73,649 | | | 266,794 | |
| Total assets measured at fair value | Total assets measured at fair value | $ | 311,100 | | | $ | 1,116,370 | | | $ | 119 | | | $ | 314 | | | $ | 73,649 | | | $ | 1,501,552 | |
| | Securities sold not yet purchased: | | | | | | | |
| Short equities – corporate | $ | 17,809 | | | $ | 0 | | | $ | 0 | | | $ | — | | | $ | — | | | $ | 17,809 | |
| Short exchange-traded options | 12,348 | | | 0 | | | 0 | | | — | | | — | | | 12,348 | |
| | Derivatives | |
| | Derivatives | |
| | Derivatives | Derivatives | 871 | | | 18,388 | | | 0 | | | — | | | — | | | 19,259 | |
| Contingent payment arrangements | Contingent payment arrangements | 0 | | | 0 | | | 22,911 | | | — | | | — | | | 22,911 | |
| Total liabilities measured at fair value | Total liabilities measured at fair value | $ | 31,028 | | | $ | 18,388 | | | $ | 22,911 | | | $ | — | | | $ | — | | | $ | 72,327 | |
| | December 31, 2022: | |
| December 31, 2022: | |
| December 31, 2022: | |
| Money markets | |
| Money markets | |
| Money markets | |
| Securities segregated (U.S. Treasury Bills) | |
| Derivatives | |
| Investments: | |
| | Equity securities | |
| | Equity securities | |
| | Equity securities | |
| Limited partnership hedge funds(2) | |
Limited partnership hedge funds(2) | |
Limited partnership hedge funds(2) | |
| Time deposits(3) | |
Time deposits(3) | |
Time deposits(3) | |
| | Other investments | |
| | Other investments | |
| | Other investments | |
| Total investments | |
| Total assets measured at fair value | |
| | Derivatives | |
| | Derivatives | |
| | Derivatives | |
| Contingent payment arrangements | |
| Total liabilities measured at fair value | |
(1)Investments measured at fair value using NAV (or its equivalent) as a practical expedient.
(2)Investments in equity method investees that are not measured at fair value in accordance with GAAP.
(3)Investments carried at amortized cost that are not measured at fair value in accordance with GAAP.
Other investments included in Level 1 of the fair value hierarchy include (i) anour investment in a software publishingmutual fund measured at fair value ($7.9 million and $6.7 million as of December 31, 2023 and 2022, respectively). Other investments not measured at fair value include (i) investment in start-up company that does not have a readily available fair value ($2.1 million and $1.0(this investment was $0.3 million as of December 31, 20202023 and 2019, respectively),2022) and (ii) investments in start-up companies that do not have a readily available fair value (these investments were $0.3 million and $0.9 million as of December 31, 2020 and 2019, respectively), (iii) investments in equity method investees that are not measured at fair value in accordance with GAAP ($6.5 million and $2.9 million as of December 31, 2020 and 2019, respectively), and (iv) broker dealerbroker-dealer exchange memberships that are not measured at fair value in accordance with GAAP ($3.32.4 million and $3.2$1.2 million as of December 31, 20202023 and 2019,2022, respectively).
We provide below a description of the fair value methodologies used for instruments measured at fair value, as well as the general classification of such instruments pursuant to the valuation hierarchy:
•Money markets:We invest excess cash in various money market funds that are valued based on quoted prices in active markets; these are included in Level 1 of the valuation hierarchy.
•Treasury Bills: We hold U.S. Treasury Bills, which are primarily segregated in a special reserve bank custody account as required by Rule 15c3-3 of the Exchange Act. These securities are valued based on quoted yields in secondary markets and are included in Level 2 of the valuation hierarchy.
•Equity securities: Our equity securities consist principally of company-sponsored mutual funds with NAVs and various separately-managedseparately managed portfolios consisting primarily of equity and fixed income mutual funds with quoted prices in active markets, which are included in Level 1 of the valuation hierarchy. In addition, some securities are valued based on observable inputs from recognized pricing vendors, which are included in Level 2 of the valuation hierarchy.
•Derivatives: We hold exchange-traded futures with counterparties that are included in Level 1 of the valuation hierarchy. In addition, we also hold currency forward contracts, interest rate swaps, credit default swaps, option swaps
and total return swaps with counterparties that are valued based on observable inputs from recognized pricing vendors, which are included in Level 2 of the valuation hierarchy.
•Options: We hold exchange-traded options that are included in Level 1 of the valuation hierarchy.
•Securities sold not yet purchased: Securities sold not yet purchased, primarily reflecting short positions in equities and exchange-traded options, are included in Level 1 of the valuation hierarchy.
•Contingent payment arrangements: Contingent payment arrangements relate to contingent payment liabilities associated with various acquisitions. At each reporting date, we estimate the fair values of the contingent consideration expected to be paid upon probability-weighted AUM and revenue projections, using unobservable market data inputs, which are included in Level 3 of the valuation hierarchy.
During the years ended December 31, 20202023 and 2019,2022, there were 0no transfers between Level 2 and Level 3 securities.
The change in carrying value associated with Level 3 financial instruments carried at fair value, classified as equity securities, is as follows:
| | December 31, 2020 | | December 31, 2019 |
| (in thousands) |
| December 31 | | | December 31 |
| 2023 | | | 2023 | 2022 |
| (in thousands) | | | (in thousands) |
| Balance as of beginning of period | Balance as of beginning of period | $ | 119 | | | $ | 142 | |
| Purchases | Purchases | 0 | | | 0 | |
| Sales | Sales | 0 | | | 0 | |
| Realized gains (losses), net | Realized gains (losses), net | 0 | | | 0 | |
| Unrealized (losses) gains, net | Unrealized (losses) gains, net | 6 | | | (23) | |
| Balance as of end of period | Balance as of end of period | $ | 125 | | | $ | 119 | |
Realized and unrealized gains and losses on Level 3 financial instruments are recorded in investment gains and losses in the consolidated statements of income.
Our acquisitions made by the Company, we may enter intoinclude contingent consideration arrangements as part of the purchase price. The change in carrying value associated with Level 3 financial instruments carried at fair value, classified as contingent payment arrangements, is as follows:
| | December 31, 2020 | | December 31, 2019 |
| (in thousands) |
| December 31 | | | December 31 |
| 2023 | | | 2023 | 2022 |
| (in thousands) | | | (in thousands) |
| Balance as of beginning of period | Balance as of beginning of period | $ | 22,911 | | | $ | 7,336 | |
| Addition | Addition | 4,400 | | | 17,384 | |
| Accretion | Accretion | 3,105 | | | 2,542 | |
Changes in estimates | Changes in estimates | (1,366) | | | (3,051) | |
| Payments | Payments | (1,300) | | | (1,300) | |
Held for sale reclassification(1) | |
| Balance as of end of period | Balance as of end of period | $ | 27,750 | | | $ | 22,911 | |
The(1)During 2023, we recorded a $14.1 million change in estimate associated with the acquisition of Autonomous LLC which is included in held for sale liabilities were valued usingon the condensed consolidated statement of financial condition.
As of December 31, 2023, the expected revenue growth rates range from 2.0% to 83.9%, with a weighted average of 10.3%, calculated using cumulative revenues and range of revenue growth rates. The discount rates ranged from 1.9% to 10.4%, with a weighted average of 4.6%, calculated using total contingent liabilities and range of discount rates.
In the third quarter of 2022, we acquired CarVal and recorded a contingent consideration liability of $228.9 million (see Note 24 Acquisitions and Divestitures). The liability, ranging from zero to $650.0 million, is based on CarVal achieving certain performance objectives over a six-year period ending December 31, 2027. The liability was valued using a forecast of future cash flows attributable to the performance objectives that are discounted to present value using a risk-adjusted discount rate. The expected revenue growth rates range from 0.7%3.9% to 50.0%31.5%, with a weighted average of 4.9%14.1%, calculated using cumulative revenues and range of revenue growth rates. The discount rates range from 4.1% to 4.6%, with a weighted average of 4.2%, calculated using total contingent liabilities and range of discount rates.
As of December 31, 2022, including the CarVal acquisition, the expected revenue growth rates range from 2.0% to 83.9%, with a weighted average of 11.5%, calculated using cumulative revenues and range of revenue growth rates (excluding revenue growth from additional AUM contributed from existing clients)in year of acquisition). The discount rates ranged from 1.9% to 10.4%, with a weighted average of 8.0%4.5%, calculated using total contingent liabilities and range of discount rates.
Assets and Liabilities Measured at Fair Value on a Nonrecurring Basis
We did not have any material assets or liabilities that were measured at fair value for impairment on a nonrecurring basis during the years ended December 31, 20202023 or 2019.2022.
10. Furniture, Equipment and Leasehold Improvements, Net
Furniture, equipment and leasehold improvements, net consist of:
| | | | | | | | | | | |
| December 31, |
| 2020 | | 2019 |
| (in thousands) |
| Furniture and equipment | $ | 556,966 | | | $ | 575,378 | |
| Leasehold improvements | 284,080 | | | 266,365 | |
| 841,046 | | | 841,743 | |
| Less: Accumulated depreciation and amortization | (693,172) | | | (696,492) | |
| Furniture, equipment and leasehold improvements, net | $ | 147,874 | | | $ | 145,251 | |
| | | | | | | | | | | | | | |
| Years Ended December 31 |
| 2023 | 2022 |
| (in thousands) |
Furniture and equipment (1) | | $ | 168,415 | | | $ | 605,567 | |
Leasehold improvements (1) | | 326,131 | | | 323,982 | |
Total (1) | | 494,546 | | | 929,549 | |
Less: Accumulated depreciation and amortization (1) | | (318,198) | | | (740,291) | |
Furniture, equipment and leasehold improvements, net (1) | | $ | 176,348 | | | $ | 189,258 | |
(1)During the fourth quarter of 2023 we wrote off approximately $461.7 million in fully depreciated assets.
Depreciation and amortization expense on furniture, equipment and leasehold improvements were $39.2$44.9 million, $38.1$39.7 million and $34.2$38.8 million for the years ended December 31, 2020, 20192023, 2022 and 2018,2021, respectively.
11. Deferred Sales Commissions, Net
The components of deferred sales commissions, net, for the years ended December 31, 20202023 and 20192022 were as follows (excluding amounts related to fully amortized deferred sales commissions):
| | | | | | | | | | | |
| December 31, |
| 2020 | | 2019 |
| (in thousands) |
| Carrying amount of deferred sales commissions | $ | 116,484 | | | $ | 68,371 | |
| Less: Accumulated amortization | (30,001) | | | (19,348) | |
| Cumulative CDSC received | (22,417) | | | (12,727) | |
| Deferred sales commissions, net | $ | 64,066 | | | $ | 36,296 | |
| | | | | | | | | | | | | | |
| Years Ended December 31 |
| 2023 | 2022 |
| (in thousands) |
| Carrying amount of deferred sales commissions | | $ | 187,870 | | | $ | 172,181 | |
| Less: Accumulated amortization | | (66,899) | | | (66,184) | |
| Cumulative CDSC received | | (33,597) | | | (53,747) | |
| Deferred sales commissions, net | | $ | 87,374 | | | $ | 52,250 | |
Amortization expense associated with deferred sales commissions was $27.4$36.8 million, $15.0$34.8 million and $21.3$34.4 million for the years ended December 31, 2020, 20192023, 2022 and 2018,2021, respectively.
Estimated future amortization expense related to the December 31, 20202023 net asset balance, assuming no additional CDSC is received in future periods, is as follows (in thousands):
| | | | | |
| 2021 | $ | 28,980 | |
| 2022 | 23,631 | |
| 2023 | 10,787 | |
| 2024 | 668 | |
| |
| |
| $ | 64,066 | |
| | | | | |
| 2024 | $ | 39,894 | |
| 2025 | 28,979 | |
| 2026 | 16,997 | |
| 2027 | 1,504 | |
| |
| |
| Total | $ | 87,374 | |
12. Debt
Credit Facility
AB has an $800.0 million committed, unsecured senior revolving credit facility (the "Credit Facility") with a group of commercial banks and other lenders, which matures on September 27, 2023.October 13, 2026. The Credit Facility was amended and restated on February 9, 2023, to reflect the transition from US LIBOR, which was retired June 30, 2023, to the term Secured Overnight Financial Rate ("SOFR"). Other than this immaterial change, there were no other significant changes included in the amendment. The Credit Facility provides for possible increases in the principal amount by up to an aggregate incremental amount of $200.0 million; any such increase is subject to the consent of the affected lenders. The Credit Facility is available for AB and Sanford C. Bernstein & Co., LLC ("SCB LLC") business purposes, including the support of AB’s commercial paper program. Both AB and SCB LLC can draw directly under the Credit Facility and management may draw on the Credit Facility from time to time. AB has agreed to guarantee the obligations of SCB LLC under the Credit Facility.
The Credit Facility contains affirmative, negative and financial covenants, which are customary for facilities of this type, including restrictions on dispositions of assets, restrictions on liens, a minimum interest coverage ratio and a maximum leverage ratio. As of December 31, 2020,2023, we were in compliance with these covenants. The Credit Facility also includes customary events of default (with customary grace periods, as applicable), including provisions under which, upon the occurrence of an event of default, all outstanding loans may be accelerated and/or lender’s commitments may be terminated. Also, under such provisions, upon the occurrence of certain insolvency- or bankruptcy-related events of default, all amounts payable under the Credit Facility would automatically become immediately due and payable, and the lender’s commitments automatically would terminate.
Amounts under the Credit Facility may be borrowed, repaid and re-borrowed by us from time to time until the maturity of the facility. Voluntary prepayments and commitment reductions requested by us are permitted at any time without a fee (other than customary breakage costs relating to the prepayment of any drawn loans) upon proper notice and subject to a minimum dollar requirement. Borrowings under the Credit Facility bear interest at a rate per annum, which will be, at our option, a rate equal to an applicable margin, which is subject to adjustment based on the credit ratings of AB, plus one of the following indices: London Interbank Offered Rate;SOFR; a floating basePrime rate; or the Federal Funds rate.
As of December 31, 20202023 and 2019,2022, we had 0no amounts outstanding under the Credit Facility. During 20202023 and 2019,2022, we did 0tnot draw upon the Credit Facility.
EQH Facility
AB also has a $900.0 million committed, unsecured senior credit facility (“EQH Facility”) with EQH. The EQH Facility matures on November 4, 2024 and is available for AB's general business purposes. Borrowings under the EQH Facility generally bear interest at a rate per annum based on prevailing overnight commercial paper rates.
The EQH Facility contains affirmative, negative and financial covenants which are substantially similar to those in AB’s committed bank facilities. As of December 31, 2023, we were in compliance with these covenants. The EQH Facility also includes customary events of default substantially similar to those in AB’s committed bank facilities, including provisions under which, upon the occurrence of an event of default, all outstanding loans may be accelerated and/or the lender’s commitment may be terminated.
Amounts under the EQH Facility may be borrowed, repaid and re-borrowed by us from time to time until the maturity of the facility. AB or EQH may reduce or terminate the commitment at any time without penalty upon proper notice. EQH also may terminate the facility immediately upon a change of control of our general partner.
As of both December 31, 20202023 and 2019,2022, AB had $675.0 million and $560.0$900.0 million outstanding under the EQH Facility with interest rates of approximately 0.2%5.3% and 1.6%4.3%, respectively. Average daily borrowings on the EQH Facility during 20202023 and for the 57 days it was available in 20192022 were $470.8$743.1 million and $358.6$655.2 million, respectively, with weighted average interest rates of approximately 0.5%4.9% and 1.6%1.7%, respectively.
EQH Uncommitted Facility
In addition to the EQH Facility, on September 1, 2020, AB establishedhas a new $300.0 million uncommitted, unsecured senior credit facility (“EQH Uncommitted Facility”) with EQH. The EQH Uncommitted Facility matures on September 1, 2024 and is available for AB's general business purposes. Borrowings under the EQH Unsecured Facility generally bear interest at a rate per annum based on prevailing overnight commercial paper rates. The EQH Uncommitted Facility contains affirmative, negative and financial covenants which are substantially similar to those in the EQH Facility. As of December 31, 2020,2023, we were in compliance with these covenants. As of December 31, 2023, we had 0no amounts outstanding onunder the EQH Uncommitted Facility. As of December 31, 2022, we had $90.0 million outstanding under the EQH Uncommitted Facility with an interest rate of approximately 4.3%. Average daily borrowings on the EQH Facility during 2023 and have 0t drawn on it since its inception.2022 were $3.6 million and $0.7 million, respectively, with weighted average interest rates of approximately 4.6% and 4.3%, respectively.
Commercial Paper
As of both December 31, 2020 and 2019,2023, we had 0$254.3 million of commercial paper outstanding with an interest rate of 5.4%. As of December 31, 2022, we had no commercial paper outstanding. The commercial paper is short term in nature, and as such, recorded value is estimated to approximate fair value (and considered a Level 2 security in the fair value hierarchy). Average daily borrowings of commercial paper for 2020during 2023 and 2022 were $83.2 million with a weighted average interest rate of 0.4%. Average daily borrowings of commercial paper for the 317 days commercial paper was outstanding in 2019 were $438.6 million with a weighted average interest rate of approximately 2.6%.
AB has a $200.0 million committed, unsecured senior revolving credit facility (the "Revolver") with a leading international bank, which matures on November 16, 2021. The Revolver is available for AB's and SCB LLC's business purposes, including the provision of additional liquidity to meet funding requirements primarily related to SCB LLC's operations. Both AB and SCB LLC can draw directly under the Revolver and management expects to draw on the Revolver from time to time. AB has agreed to guarantee the obligations of SCB LLC under the Revolver. The Revolver contains affirmative, negative and financial covenants that are identical to those of the Credit Facility. Borrowings under the Revolver bear interest at a rate per annum, which will be, at our option, a rate equal to an applicable margin, which is subject to adjustment based on the credit ratings of AB, plus one of the following indices: London Interbank Offered Rate; a floating base rate; or the Federal Funds rate. As of both December 31, 2020 and 2019 we had 0 amounts outstanding under the Revolver. Average daily borrowings for 2020 and 2019 were $16.5$267.6 million and $23.5$189.9 million, respectively, with weighted average interest rates of 1.6%approximately 5.2% and 3.2%1.5%, respectively.
In addition, SCB Lines of Credit
SCB LLC currently has 3five uncommitted lines of credit with 3five financial institutions. NaNFour of these lines of credit permit us to borrow up to an aggregate of approximately $165.0$315.0 million, with AB named as an additional borrower, while the other line has no stated limit. AB has agreed to guarantee the obligations on SCB LLC under these lines of credit. As of December 31, 20202023 and 2019,2022, SCB LLC had 0no outstanding balance on these lines of credit. Average daily borrowings on the lines of credit during 20202023 and 20192022 were $0.9$1.1 million and $1.9$1.4 million, respectively, with weighted average interest rates of approximately 1.6%7.8% and 1.9%3.7%, respectively.
13. Leases
We lease office space, office equipment and technology under various operating and financing leases. Our current leases have remaininginitial lease terms of one year to 15 years, some of which include options to extend the leases for up to fiveseven years, and some of which include options to terminate the leases within one year.
Since 2010, we have sub-leased over 1000000 square feet of office space. On January 1, 2019, the previously recorded liability related to our global space consolidation initiatives of $85.8 million was offset as a reduction to our operating right-of-use assets.
Leases included in the consolidated statements of financial condition as of December 31, 20202023 and 20192022 were as follows:
| | Classification | | December 31, 2020 | | December 31, 2019 |
| | | (in thousands) |
| Classification | | | Classification | December 31, 2023 | December 31, 2022 |
| (in thousands) | | | (in thousands) |
| Operating Leases | Operating Leases | |
| Operating lease right-of-use assets | Operating lease right-of-use assets | Right-of-use assets | | $ | 416,007 | | | $ | 360,185 | |
| Operating lease right-of-use assets | |
| Operating lease right-of-use assets | |
| Operating lease liabilities | Operating lease liabilities | Lease liabilities | | 503,174 | | | 465,907 | |
| | Finance Leases | Finance Leases | |
| Property and equipment, gross | |
| Property and equipment, gross | |
| Property and equipment, gross | Property and equipment, gross | Right-of-use assets | | 5,167 | | | 3,825 | |
| Amortization of right-of-use assets | Amortization of right-of-use assets | Right-of-use assets | | (2,719) | | | (1,317) | |
| Property and equipment, net | Property and equipment, net | | 2,448 | | | 2,508 | |
| Finance lease liabilities | Finance lease liabilities | Lease liabilities | | 2,375 | | | 2,544 | |
The components of lease expense included in the consolidated statements of income for the years ended December 31, 20202023 and 20192022 were as follows:
| | Year Ended December 31, | |
| Classification | | 2020 | | 2019 | |
| | | (in thousands) | |
| | | | Years Ended December 31 | |
| | | | Years Ended December 31 | |
| | | | Years Ended December 31 | |
| | Classification | |
| | Classification | |
| | Classification | |
| | | | (in thousands) | |
| | | | (in thousands) | |
| | | | (in thousands) | |
| Operating lease cost | |
| Operating lease cost | |
| Operating lease cost | Operating lease cost | General and administrative | | $ | 90,212 | | | $ | 106,085 | | |
| | Financing lease cost: | Financing lease cost: | | |
| | Financing lease cost: | |
| | Financing lease cost: | |
| Amortization of right-of-use assets | |
| Amortization of right-of-use assets | |
| Amortization of right-of-use assets | Amortization of right-of-use assets | General and administrative | | 1,755 | | | 1,317 | | |
| Interest on lease liabilities | Interest on lease liabilities | Interest expense | | 86 | | | 71 | | |
| Interest on lease liabilities | |
| Interest on lease liabilities | |
| Total finance lease cost | |
| Total finance lease cost | |
| Total finance lease cost | Total finance lease cost | | 1,841 | | | 1,388 | | |
Variable lease cost (1) | Variable lease cost (1) | General and administrative | | 38,208 | | | 40,786 | | |
Variable lease cost (1) | |
Variable lease cost (1) | |
| Sublease income | |
| Sublease income | |
| Sublease income | Sublease income | General and administrative | | (38,622) | | | (55,522) | | |
| Net lease cost | Net lease cost | | $ | 91,639 | | | $ | 92,737 | | |
| Net lease cost | |
| Net lease cost | |
(1)Variable lease expense includes operating expenses, real estate taxes and employee parking.
The sublease income represents all revenues received from sub-tenants. It is primarily fixed base rental payments combined with variable reimbursements such as operating expenses, real estate taxes and employee parking. The vast majority of sub-tenant income is derived from our New York metro sub-tenant agreements. Sub-tenant income related to base rent is recorded on a straight-line basis.
Maturities of lease liabilities are as follows:
| | Operating Leases | | Financing Leases | | Total |
| Operating Leases | | | Operating Leases | Financing Leases | Total |
| Year ending December 31, | Year ending December 31, | (in thousands) | Year ending December 31, | (in thousands) |
| 2021 | $ | 110,046 | | | $ | 1,142 | | | $ | 111,188 | |
| 2022 | 100,631 | | | 757 | | | 101,388 | |
| 2023 | 93,379 | | | 526 | | | 93,905 | |
| 2024 | 2024 | 90,359 | | | 23 | | | 90,382 | |
| 2025 | 2025 | 25,516 | | | 0 | | | 25,516 | |
| 2026 | |
| 2027 | |
| 2028 | |
| Thereafter | Thereafter | 136,759 | | | 0 | | | 136,759 | |
| Total lease payments | Total lease payments | 556,690 | | | 2,448 | | | $ | 559,138 | |
| Less interest | Less interest | (53,516) | | | (73) | | |
| Present value of lease liabilities | Present value of lease liabilities | $ | 503,174 | | | $ | 2,375 | | |
| Present value of lease liabilities | |
| Present value of lease liabilities | |
During October 2018, weWe have signed a lease whichthat commenced in the fourth quarter of 2020, relating to 218,976 square feet of space at our newly constructed Nashville headquarters. Our estimated total base rent obligation (excluding taxes, operating expenses and utilities) over the 15-year initial lease term is $134.0 million. During April 2019, we signed a lease, which commences in 2024, relating to approximately 190,000166,000 square feet of space in New York City. Our estimated total base rent obligation (excluding taxes, operating expenses and utilities) over the 20 year20-year lease term is approximately $448.0 million. During the fourth quarter of 2020, we exercised an option to return a half floor of this space, which reduced our square footage from approximately 190,000 to 166,000 square feet and our base rent obligation from $448.0 million to $393.0 million.
| | | | | |
| Lease term and discount rate: | |
| Weighted average remaining lease term (years): | |
| Operating leases | 7.137.34 |
| Finance leases | 2.462.97 |
| Weighted average discount rate: | |
| Operating leases | 3.122.89 | % |
| Finance leases | 2.643.22 | % |
Supplemental cash flow informationnon-cash activity related to leases are as follows:
| | | | | | | | | | | |
| Year Ended December 31, |
| 2020 | | 2019 |
| (in thousands) |
| Cash paid for amounts included in the measurement of lease liabilities: | | | |
| Operating cash flows from operating leases | $ | 115,684 | | | $ | 132,669 | |
| Operating cash flows from financing leases | 86 | | | 71 | |
| Financing cash flows from finance leases | 1,864 | | | 1,281 | |
Right-of-use assets obtained in exchange for lease obligations(1): | | | |
Operating leases(2) | 135,919 | | | 11,108 | |
| Finance leases | 1,695 | | | 1,469 | |
| | | | | | | | | | | | | | |
| Years Ended December 31 |
| 2023 | 2022 |
| (in thousands) |
| | | | |
| | | | |
| | | | |
| | | | |
Right-of-use assets obtained in exchange for lease obligations(1): | | | | |
| Operating leases | | $ | 32,407 | | | $ | 38,875 | |
| Finance leases | | 4,106 | | | 7,791 | |
(1)Represents non-cash activity and, accordingly, is not reflected in the consolidated statements of cash flows.
(2)Represents net non-cash activity of new lease obligations, extensions and reductions of existing lease obligations.
14. Commitments and Contingencies
Leases
WeAs indicated in Note 13 Leases, we lease office space, office equipment and technology under various leasing arrangements. The future minimum payments under non-cancelable leases, sublease commitments and related payments we are obligated to make, net of sublease commitments of third party lessees to make payments to us, as of December 31, 2020,2023, are as follows:
| | | | | | | | | | | | | | | | | |
| Payments | | Sublease Receipts | | Net Payments |
| (in millions) |
| 2021 | $ | 115.4 | | | $ | 35.5 | | | $ | 79.9 | |
| 2022 | 103.8 | | | 31.8 | | | 72.0 | |
| 2023 | 96.5 | | | 31.3 | | | 65.2 | |
| 2024 | 93.1 | | | 30.8 | | | 62.3 | |
| 2025 | 45.4 | | | 0 | | | 45.4 | |
| 2026 and thereafter | 526.6 | | | 0 | | | 526.6 | |
| Total future minimum payments | $ | 980.8 | | | $ | 129.4 | | | $ | 851.4 | |
| | | | | | | | | | | | | | | | | | | | |
| Payments | Sublease Receipts | Net Payments |
| (in millions) |
| 2024 | | $ | 104.4 | | | $ | (31.0) | | | $ | 73.4 | |
| 2025 | | 64.6 | | | 0.3 | | | 64.9 | |
| 2026 | | 60.9 | | | (0.2) | | | 60.7 | |
| 2027 | | 56.6 | | | — | | | 56.6 | |
| 2028 | | 49.6 | | | — | | | 49.6 | |
| 2029 and thereafter | | 458.9 | | | — | | | 458.9 | |
| Total future minimum payments | | $ | 795.0 | | | $ | (30.9) | | | $ | 764.1 | |
See Note 13 Leases for material lease commitments.
Legal Proceedings
With respect to all significant litigation matters, we consider the likelihood of a negative outcome. If we determine the likelihood of a negative outcome is probable and the amount of the loss can be reasonably estimated, we record an estimated loss for the expected outcome of the litigation. Any such accruals are adjusted thereafter as appropriate to reflect changed circumstances. When we are able to do so, we also determine estimates of reasonably possible losses or ranges of reasonably possible losses for such matters, whether in excess of any related accrued liability or where there is no accrued liability, and we disclose an estimate of the possible loss or range of losses. However, it is often difficult to predict the outcome or estimate a possible loss or range of loss because litigation is subject to inherent uncertainties, particularly when plaintiffs allege substantial or indeterminate damages. Such is particularly the case when the litigation is in its early stages or when the litigation is highly complex or broad in scope. In these cases, we disclose that we are unable to predict the outcome or estimate a possible loss or range of loss. As a result of these types of factors, we are unable, at this time, to estimate the losses that are reasonably possible to be incurred or ranges of such losses with respect to our significant litigation matters.
On December 14, 2022, four individual participants in the Profit Sharing Plan for Employees of AllianceBernstein L.P., (the "Plan") filed a class action complaint (the “Complaint”) in the U.S. District Court for the Southern District of New York against AB, current and former members of the Compensation and Workplace Practices Committee of the Board, and the Investment and Administrative Committees under the Plan. Plaintiffs, who seek to represent a class of all participants in the Plan from December 14, 2016 to the present, allege that defendants violated their fiduciary duties and engaged in prohibited transactions under the Employee Retirement Income Security Act of 1974, as amended ("ERISA") by including proprietary collective investment trusts as investment options offered under the Plan. The Complaint seeks unspecified damages, disgorgement and other equitable relief. AB is prepared to defend itself vigorously against these claims and filed a motion to dismiss on February 24, 2023. While the ultimate outcome of this matter is currently not determinable given the matter remains in its early stages, we do not believe this litigation will have a material adverse effect on our results of operations, financial condition or liquidity.
AB may be involved in various other matters, including regulatory inquires,inquiries, administrative proceedings and litigation, some of which may allege significant damages. It is reasonably possible that weAB could incur losses pertaining to these other matters, but wemanagement cannot currently estimate any such losses.
Management, after consultation with legal counsel, currently believes that the outcome of any individual matter that is pending or threatened, or all of them combined, will not have a material adverse effect on our results of operations, financial condition or liquidity. However, any inquiry, proceeding or litigation has anthe element of uncertainty; management cannot determine whether further developments relating to any individual matter that is pending or threatened, or all of them combined, will have a material adverse effect on our results of operation,operations, financial condition or liquidity in any future reporting period.
Other
During 2010, as general partner of AllianceBernstein U.S. Real Estate L.P. (“Real Estate Fund”), we committed to invest $25.0 million in the Real Estate Fund. As of December 31, 2020, we had funded $22.4 million of this commitment. During 2014, as general partner of AllianceBernstein U.S. Real Estate II L.P. (“Real Estate Fund II”), we committed to invest $27.3 million, as amended in 2020, in the Real Estate Fund II. As of December 31, 2020, we had funded $20.8 million of this commitment.
15. Consolidated Company-Sponsored Investment Funds
We regularly provide seed capital to new company-sponsored investment funds. As such, we may consolidate or de-consolidate a variety of company-sponsored investment funds each quarter. Due to the similarity of risks related to our involvement with each company-sponsored investment fund, disclosures required under the VIE model are aggregated, such as disclosures regarding the carrying amount and classification of assets.
We are not required to provide financial support to company-sponsored investment funds and only the assets of such funds are available to settle each fund's own liabilities. Our exposure to loss in regard toregarding consolidated company-sponsored investment funds is limited to our investment in, and our management fee earned from, such funds. Equity and debt holders of such funds have no recourse to AB’s assets or to the general credit of AB.
The balances of consolidated VIEs and VOEs included in our consolidated statements of financial condition were as follows:
| | December 31, 2023 | |
| December 31, 2023 | |
| December 31, 2023 | | December 31, 2022 |
| (in thousands) | | | (in thousands) |
| | | | | | VIEs | | | | | | | | VIEs | | VOEs | | Total | | | | | | VIEs | | VOEs | | Total |
| | | December 31, 2020 | | December 31, 2019 |
| Cash and cash equivalents | |
| | (in thousands) |
| | Cash and cash equivalents | |
| | VIEs | | VOEs | | Total | | VIEs | | VOEs | | Total |
| Cash and cash equivalents | Cash and cash equivalents | | $ | 36,370 | | | $ | 136 | | | $ | 36,506 | | | $ | 9,623 | | | $ | 1,810 | | | $ | 11,433 | |
| Investments | Investments | | 242,541 | | | 60,041 | | | 302,582 | | | 404,624 | | | 176,380 | | | 581,004 | |
| Other assets | Other assets | | 4,859 | | | 7,385 | | | 12,244 | | | 9,618 | | | 10,192 | | | 19,810 | |
| Total assets | Total assets | | $ | 283,770 | | | $ | 67,562 | | | $ | 351,332 | | | $ | 423,865 | | | $ | 188,382 | | | $ | 612,247 | |
| | Liabilities | Liabilities | | $ | 7,741 | | | $ | 22,879 | | | $ | 30,620 | | | $ | 12,147 | | | $ | 18,870 | | | $ | 31,017 | |
| Redeemable non-controlling interest | Redeemable non-controlling interest | | 82,753 | | | 19,606 | | | 102,359 | | | 273,219 | | | 52,342 | | | 325,561 | |
| Partners' capital attributable to AB Unitholders | Partners' capital attributable to AB Unitholders | | 193,276 | | | 25,077 | | | 218,353 | | | 138,499 | | | 117,170 | | | 255,669 | |
| | Total liabilities, redeemable non-controlling interest and partners' capital | Total liabilities, redeemable non-controlling interest and partners' capital | | $ | 283,770 | | | $ | 67,562 | | | $ | 351,332 | | | $ | 423,865 | | | $ | 188,382 | | | $ | 612,247 | |
| Total liabilities, redeemable non-controlling interest and partners' capital | |
| Total liabilities, redeemable non-controlling interest and partners' capital | |
|
During 2020,2023, we deconsolidated 5five funds in which we had a seed investmentinvestments totaling approximately $77.3 million as of approximately $94.6 millionDecember 31, 2022 due to no longer having a controlling financial interest. These funds had significant consolidated assets and liabilities as of
Changes in the redeemable non-controlling interest balance during the twelve-month period ended December 31, 2019.2023 are as follows (in thousands):
| | | | | |
| Redeemable non-controlling interest as of December 31, 2022 | $ | 368,656 | |
| Deconsolidated funds | (196,277) | |
| Changes in third-party seed investments in consolidated funds | 37,041 | |
| Redeemable non-controlling interest as of December 31, 2023 | $ | 209,420 | |
Fair Value
Cash and cash equivalents include cash on hand, demand deposits, overnight commercial paper and highly liquid investments with original maturities of three months or less. Due to the short-term nature of these instruments, the recorded value has been determined to approximate fair value.
Valuation of consolidated company-sponsored investment funds' financial instruments by pricing observability levels as of December 31, 20202023 and 20192022 was as follows (in thousands):
| | | | | | | | | | | | | | | | | | | | | | | | | |
| | Level 1 | | Level 2 | | Level 3 | | | | Total |
| December 31, 2020: | | | | | | | | | |
| Investments - VIEs | $ | 73,909 | | | $ | 168,114 | | | $ | 518 | | | | | $ | 242,541 | |
| Investments - VOEs | 0 | | | 59,940 | | | 101 | | | | | 60,041 | |
| Derivatives - VIEs | 442 | | | 2,782 | | | 0 | | | | | 3,224 | |
| Derivatives - VOEs | 0 | | | 464 | | | 0 | | | | | 464 | |
| Total assets measured at fair value | $ | 74,351 | | | $ | 231,300 | | | $ | 619 | | | | | $ | 306,270 | |
| | | | | | | | | |
| Derivatives - VIEs | $ | 1,649 | | | $ | 5,244 | | | $ | 0 | | | | | $ | 6,893 | |
| Derivatives - VOEs | 0 | | | 664 | | | 0 | | | | | 664 | |
| Total liabilities measured at fair value | $ | 1,649 | | | $ | 5,908 | | | $ | 0 | | | | | $ | 7,557 | |
| | | | | | | | | |
| December 31, 2019: | | | | | | | | | |
| Investments - VIEs | $ | 28,270 | | | $ | 375,559 | | | $ | 795 | | | | | $ | 404,624 | |
| Investments - VOEs | 104,069 | | | 72,252 | | | 59 | | | | | 176,380 | |
| Derivatives - VIEs | 139 | | | 4,694 | | | 0 | | | | | 4,833 | |
| Derivatives - VOEs | 76 | | | 4,263 | | | 0 | | | | | 4,339 | |
| Total assets measured at fair value | $ | 132,554 | | | $ | 456,768 | | | $ | 854 | | | | | $ | 590,176 | |
| | | | | | | | | |
| | | | | | | | | |
| Derivatives - VIEs | $ | 835 | | | $ | 3,724 | | | $ | 0 | | | | | $ | 4,559 | |
| Derivatives - VOEs | 101 | | | 4,982 | | | 0 | | | | | 5,083 | |
| Total liabilities measured at fair value | $ | 936 | | | $ | 8,706 | | | $ | 0 | | | | | $ | 9,642 | |
| | | | | | | | | | | | | | | | | | | | | | | | | | | | |
| | Level 1 | Level 2 | Level 3 | | | Total |
| December 31, 2023: | | | | | | | | | | |
| Investments - VIEs | | $ | 49,455 | | | $ | 237,164 | | | $ | — | | | | | $ | 286,619 | |
| Investments - VOEs | | 9,036 | | | 101,519 | | | — | | | | | 110,555 | |
| Derivatives - VIEs | | 2,139 | | | 2,763 | | | — | | | | | 4,902 | |
| Derivatives - VOEs | | — | | | 8,775 | | | — | | | | | 8,775 | |
| Total assets measured at fair value | | $ | 60,630 | | | $ | 350,221 | | | $ | — | | | | | $ | 410,851 | |
| Derivatives - VIEs | | $ | 944 | | | $ | 1,587 | | | $ | — | | | | | $ | 2,531 | |
| | | | | | | | | | |
| Total liabilities measured at fair value | | $ | 944 | | | $ | 1,587 | | | $ | — | | | | | $ | 2,531 | |
| December 31, 2022: | | | | | | | | | | |
| Investments - VIEs | | $ | 129,706 | | | $ | 386,830 | | | $ | — | | | | | $ | 516,536 | |
| | | | | | | | | | |
| Derivatives - VIEs | | 1,529 | | | 6,023 | | | — | | | | | 7,552 | |
| | | | | | | | | | |
| Total assets measured at fair value | | $ | 131,235 | | | $ | 392,853 | | | $ | — | | | | | $ | 524,088 | |
| | | | | | | | | | |
| Derivatives - VIEs | | $ | 14,932 | | | $ | 6,608 | | | $ | — | | | | | $ | 21,540 | |
| | | | | | | | | | |
| Total liabilities measured at fair value | | $ | 14,932 | | | $ | 6,608 | | | $ | — | | | | | $ | 21,540 | |
See Note 9 for a description of the fair value methodologies used for instruments measured at fair value, as well as the general classification of such instruments pursuant to the valuation hierarchy.
The change in carrying value associated with Level 3 financial instruments carried at fair value within consolidated company-sponsored investment funds was as follows:
| | | | | | | | | | | | | | |
| | | December 31, |
| | | 2020 | | 2019 |
| | | (in thousands) |
| | | | |
| Balance as of beginning of period | | $ | 854 | | | $ | 8,373 | |
| Deconsolidated funds | | (135) | | | 0 | |
| Transfers (out) in | | 552 | | | (9,445) | |
| Purchases | | 259 | | | 9,213 | |
| Sales | | (571) | | | (7,467) | |
| Realized (losses) gains, net | | (99) | | | 14 | |
| Unrealized (losses) gains, net | | (242) | | | 143 | |
| Accrued discounts | | 1 | | | 23 | |
| Balance as of end of period | | $ | 619 | | | $ | 854 | |
| | | | | | | | | | | | | | |
| | December 31 |
| | 2023 | 2022 |
| | (in thousands) |
| Balance as of beginning of period | | $ | — | | | $ | 3,357 | |
| Deconsolidated funds | | — | | | (3,351) | |
| Transfers (out) | | — | | | (6) | |
| Purchases | | — | | | 248 | |
| Sales | | — | | | (248) | |
| | | | |
| | | | |
| | | | |
| Balance as of end of period | | $ | — | | | $ | — | |
The Level 3 securities primarily consist of corporate bonds that are vendor priced with no ratings available, bank loans, non-agency collateralized mortgage obligations and asset-backed securities.
Transfers into and out of all levels of the fair value hierarchy are reflected at end-of-period fair values. Realized and unrealized gains and losses on Level 3 financial instruments are recorded in investment gains and losses in the consolidated statements of income.
Derivative Instruments
As of December 31, 20202023 and 2019,2022, the VIEs held $3.7$2.4 million and $0.3$14.0 million (net), respectively, of futures, forwards, options and swaps within their portfolios. For the years ended December 31, 20202023 and 2019,2022, we recognized $0.6$0.1 million of lossesgains and $3.3$9.4 million of gains,losses, respectively, on these derivatives. These gains and losses are recognized in investment gains (losses) in the consolidated statements of income.
As of December 31, 20202023 and 2019,2022, the VIEs held $0.5$1.4 million and $1.6$2.7 million, respectively, of cash collateral payable to trade counterparties. This obligation to return cash is reported in the liabilities of consolidated company-sponsored investment funds in our consolidated statements of financial condition.
As of December 31, 20202023 and 2019,2022, the VIEs delivered $4.2$1.4 million and $3.2$5.4 million, respectively, of cash collateral into brokerage accounts. The VIEs report this cash collateral in the consolidated company-sponsored investment funds cash and cash equivalents in our consolidated statements of financial condition.
As of December 31, 2020 and 2019,2023, the VOEs held $0.2$8.8 million and $0.7 million (net), respectively, of futures, forwards, options and swaps within their portfolios. For the yearsyear ended December 31, 2020 and 2019,2023, we recognized $0.2 million and $0.5$0.1 million of gains,losses, respectively, on these derivatives. These gains and losses are recognized in the investment gains (losses) in the consolidated statements of income.
As of December 31, 2020 and 2019,2023, the VOEs held 0 and $0.5 million, respectively, ofno cash collateral payable to trade counterparties. This obligation to return cash is reported in the liabilities of consolidated company-sponsored investment funds in our consolidated statements of financial condition.
As of December 31, 2020 and 2019,2023, the VOEs delivered $0.1 million and $1.2 million, respectively, of cash collateral into brokerage accounts. The VOEs report thisno cash collateral in the consolidated company-sponsored investment funds cash and cash equivalents in our consolidated statements of financial condition.brokerage accounts.
Offsetting Assets and Liabilities
Offsetting of derivative assets of consolidated company-sponsored investment funds as of December 31, 20202023 and 20192022 was as follows:
| | | | | | | | | | | | | | | | | | | | | | | | | | | | | | | | | | | |
| | Gross Amounts of Recognized Assets | | Gross Amounts Offset in the Statement of Financial Condition | | Net Amounts of Assets Presented in the Statement of Financial Condition | | Financial
Instruments | | Cash Collateral
Received | | Net
Amount |
| | (in thousands) |
| December 31, 2020: | | | | | | | | | | | |
| Derivatives - VIEs | $ | 3,224 | | | $ | 0 | | | $ | 3,224 | | | $ | 0 | | | $ | (513) | | | $ | 2,711 | |
| Derivatives - VOEs | $ | 464 | | | $ | 0 | | | $ | 464 | | | $ | 0 | | | $ | 0 | | | $ | 464 | |
| December 31, 2019: | | | | | | | | | | | |
| Derivatives - VIEs | $ | 4,833 | | | $ | 0 | | | $ | 4,833 | | | $ | 0 | | | $ | (1,631) | | | $ | 3,202 | |
| Derivatives - VOEs | $ | 4,339 | | | $ | 0 | | | $ | 4,339 | | | $ | 0 | | | $ | (534) | | | $ | 3,805 | |
| | | | | | | | | | | | | | | | | | | | | | | | | | | | | | | | | | | | | | |
| | Gross Amounts of Recognized Assets | Gross Amounts Offset in the Statement of Financial Condition | Net Amounts of Assets Presented in the Statement of Financial Condition | Financial
Instruments | Cash Collateral
Received | Net
Amount |
| | (in thousands) |
| December 31, 2023: | | | | | | | | | | | | |
| Derivatives - VIEs | | $ | 4,902 | | | $ | — | | | $ | 4,902 | | | $ | — | | | $ | (1,415) | | | $ | 3,487 | |
| | | | | | | | | | | | |
| December 31, 2022: | | | | | | | | | | | | |
| Derivatives - VIEs | | $ | 7,552 | | | $ | — | | | $ | 7,552 | | | $ | — | | | $ | (2,731) | | | $ | 4,821 | |
| | | | | | | | | | | | |
Offsetting of derivative liabilities of consolidated company-sponsored investment funds as of December 31, 20202023 and 20192022 was as follows:
| | | | | | | | | | | | | | | | | | | | | | | | | | | | | | | | | | | |
| | Gross Amounts of Recognized Liabilities | | Gross Amounts Offset in the Statement of Financial Condition | | Net Amounts of Liabilities Presented in the Statement of Financial Condition | | Financial
Instruments | | Cash Collateral
Pledged | | Net Amount |
| | (in thousands) |
| December 31, 2020: | | | | | | | | | | | |
| Derivatives - VIEs | $ | 6,893 | | | $ | 0 | | | $ | 6,893 | | | $ | 0 | | | $ | (4,201) | | | $ | 2,692 | |
| Derivatives - VOEs | $ | 664 | | | $ | 0 | | | $ | 664 | | | $ | 0 | | | $ | (138) | | | $ | 526 | |
| December 31, 2019: | | | | | | | | | | | |
| Derivatives - VIEs | $ | 4,559 | | | $ | 0 | | | $ | 4,559 | | | $ | 0 | | | $ | (3,155) | | | $ | 1,404 | |
| Derivatives - VOEs | $ | 5,083 | | | $ | 0 | | | $ | 5,083 | | | $ | 0 | | | $ | (1,201) | | | $ | 3,882 | |
| | | | | | | | | | | | | | | | | | | | | | | | | | | | | | | | | | | | | | |
| | Gross
Amounts of Recognized Liabilities | Gross Amounts Offset in the Statement of Financial Condition | Net Amounts
of Liabilities Presented in the Statement of Financial Condition | Financial
Instruments | Cash Collateral
Pledged | Net
Amount |
| | (in thousands) |
| December 31, 2023: | | | | | | | | | | | | |
| Derivatives - VIEs | | $ | 2,531 | | | $ | — | | | $ | 2,531 | | | $ | — | | | $ | (1,408) | | | $ | 1,123 | |
| | | | | | | | | | | | |
| December 31, 2022: | | | | | | | | | | | | |
| Derivatives - VIEs | | $ | 21,540 | | | $ | — | | | $ | 21,540 | | | $ | — | | | $ | (5,444) | | | $ | 16,096 | |
| | | | | | | | | | | | |
Cash collateral, whether pledged or received on derivative instruments, is not considered material and, accordingly, is not disclosed by counterparty.
Non-Consolidated VIEs
As of December 31, 2020,2023, the net assets of company-sponsored investment products that are non-consolidated VIEs are approximately $73.4 billion,$54.6 billion; our maximum risk of loss is our investment of $7.1$10.3 million in these VIEs and our advisory fees receivable from these VIEs are $77.6$114.5 million. As of December 31, 2022, the net assets of company-sponsored investment products that were non-consolidated VIEs was approximately $46.4 billion; our maximum risk of loss was our investment of $5.7 million in these VIEs and our advisory fees receivable from these VIEs were $54.2 million.
16. Net Capital
SCB LLC is registered as a broker-dealer under the Exchange Act and is subject to the minimum net capital requirements imposed by the U.S. Securities and Exchange Commission ("SEC"). SCB LLC computes its net capital under the alternative method permitted by the applicable rule, which requires that minimum net capital, as defined, equals the greater of $1$1.0 million or 2two percent of aggregate debit items arising from customer transactions, as defined. As of December 31, 2020,2023, SCB LLC had net capital of $277.0$316.9 million, which was $243.0$289.1 million in excess of the minimum net capital requirement of $34.0$27.8 million. Advances, dividend payments and other equity withdrawals by SCB LLC are restricted by regulations imposed by the SEC, the Financial Industry Regulatory Authority, Inc., and other securities agencies.
Our U.K.-based broker-dealer is a member of the London Stock Exchange. As of December 31, 2020,2023, it was subject to financial resources requirements of $47.5$46.7 million imposed by the Financial Conduct Authority of the United Kingdom and had aggregate regulatory financial resources of $53.4$57.0 million, an excess of $5.9$10.3 million over the required level.
AllianceBernstein Investments, Inc. ("ABI"), another one of our subsidiaries and the distributor and/or underwriter for certain company-sponsored mutual funds, is registered as a broker-dealer under the Exchange Act and is subject to the minimum net capital requirements imposed by the SEC. As of December 31, 2020, it2023, ABI had net capital of $32.1$26.8 million, which was $31.8$26.5 million in excess of its required net capital of $0.3 million.
Many of our subsidiaries around the world are subject to minimum net capital requirements by the local laws and regulations to which they are subject. As of December 31, 2020,2023, each of our subsidiaries subject to a minimum net capital requirement satisfied the applicable requirement.
17. Counterparty Risk
Customer Activities
In the normal course of business, brokerage activities involve the execution, settlement and financing of various customer securities trades, which may expose our broker-dealer operations to off-balance sheet risk by requiring us to purchase or sell securities at prevailing market prices in the event the customer is unable to fulfill its contractual obligations.
Our customer securities activities are transacted on either a cash or margin basis. In margin transactions, we extend credit to the customer, subject to various regulatory and internal margin requirements. These transactions are collateralized by cash or
securities in the customer’s account. In connection with these activities, we may execute and clear customer transactions involving the sale of securities not yet purchased. We seek to control the risks associated with margin transactions by requiring customers to maintain collateral in compliance with the aforementioned regulatory and internal guidelines. We monitor required margin levels daily and, pursuant to such guidelines, require customers to deposit additional collateral, or reduce positions, when necessary. A majority of our customer margin accounts are managed on a discretionary basis whereby we maintain control over the investment activity in the accounts. For these discretionary accounts, our margin deficiency exposure is minimized by our maintaining a diversified portfolio of securities in the accounts, our discretionary authority and our U.S-basedU.S.-based broker-dealer's role as custodian.
In accordance with industry practice, we record customer transactions on a settlement date basis, which generally is two business days after trade date for our U.K. and U.S. operations.basis. We are exposed to risk of loss on these transactions in the event of the customer’s inability to meet the terms of their contracts, in which case we may have to purchase or sell financial instruments at prevailing market prices. The risks we assume in connection with these transactions are not expected to have a material adverse effect on our financial condition or results of operations.
Other Counterparties
We are engaged in various brokerage, futures, forwards, options and swap activities on behalf of clients, in which counterparties primarily include broker-dealers, banks and other financial institutions. In the event these counterparties do not fulfill their obligations, our clients and we may be exposed to loss. The risk of default depends on the creditworthiness of the counterparty or issuer of the instrument.counterparty. It is our policy to review, as necessary, each counterparty’s creditworthiness.
In connection with security borrowing and lending arrangements, we enter into collateralized agreements, which may result in potential loss in the event the counterparty to a transaction is unable to fulfill its contractual obligations. Security borrowing arrangements require us to deposit cash collateral with the lender. With respect to security lending arrangements, we receive collateral in the form of cash in amounts generally in excess of the market value of the securities loaned. We attempt to mitigate credit risk associated with these activities by establishing credit limits for each broker and monitoring these limits on a daily basis. Additionally, security borrowing and lending collateral is marked to market on a daily basis, and additional collateral is deposited by or returned to us as necessary.
We enter into various futures, forwards, options and swaps primarily to economically hedge certain of our seed money investments. We may be exposed to credit losses in the event of nonperformance by counterparties to these derivative financial instruments. See Note 7, Derivative Instruments for further discussion.
18. Qualified Employee Benefit Plans
We maintain a qualified profit sharing plan covering U.S. employees and certain foreign employees. Employer contributions are discretionary and generally limited to the maximum amount deductible for federal income tax purposes. Aggregate contributions were $15.6$19.0 million, $14.4$17.5 million and $15.0$16.5 million for 2020, 20192023, 2022 and 2018,2021, respectively.
We maintain several defined contribution plans for foreign employees working for our subsidiaries in the United Kingdom, Australia, Japan and other locations outside the United States. Employer contributions generally are consistent with regulatory requirements and tax limits. Defined contribution expense for foreign entities was $8.4$11.7 million, $7.7$10.2 million and $7.1$9.8 million in 2020, 20192023, 2022 and 2018,2021, respectively.
We maintain a qualified, noncontributory, defined benefit retirement plan (“(the “Retirement Plan”) covering current and former employees who were employed by AB in the United States prior to October 2, 2000. Benefits are based on years of credited service, average final base salary (as defined in the Retirement Plan) and primary Social Security benefits. Service and compensation after December 31, 2008 are not taken into account in determining participants’ retirement benefits.
Our policy is to satisfy our funding obligation for each year in an amount not less than the minimum required by the Employee Retirement Income Security Act of 1974, as amended,ERISA and not greater than the maximum amount we can deduct for federal income tax purposes. We did 0tnot make a contribution to the Retirement Plan during 2020.2023. We do not currently anticipate that we will contribute to the Retirement Plan during 2021.2024. Contribution estimates, which are subject to change, are based on regulatory requirements, future market conditions and assumptions used for actuarial computations of the Retirement Plan’s obligations and assets. Management, at the present time, has not determined the amount, if any, of additional future contributions that may be required.
The Retirement Plan’s projected benefit obligation, fair value of plan assets and funded status (amounts recognized in the consolidated statements of financial condition) were as follows:
| | Years Ended December 31, |
| 2020 | | 2019 |
| (in thousands) |
| Years Ended December 31 | | | Years Ended December 31 |
| 2023 | | | 2023 | 2022 |
| (in thousands) | | | (in thousands) |
| Change in projected benefit obligation: | Change in projected benefit obligation: | |
| Projected benefit obligation at beginning of year | |
| Projected benefit obligation at beginning of year | |
| Projected benefit obligation at beginning of year | Projected benefit obligation at beginning of year | $ | 136,113 | | | $ | 116,233 | |
| Interest cost | Interest cost | 4,443 | | | 4,944 | |
| | Actuarial loss (gain) | 16,131 | | | 20,411 | |
| Plan settlements | |
| Plan settlements | |
| Plan settlements | |
| Actuarial (gain) | |
| Benefits paid | Benefits paid | (5,563) | | | (5,475) | |
| Projected benefit obligation at end of year | Projected benefit obligation at end of year | 151,124 | | | 136,113 | |
| Change in plan assets: | Change in plan assets: | | | |
| Plan assets at fair value at beginning of year | Plan assets at fair value at beginning of year | 114,080 | | | 98,584 | |
| Plan assets at fair value at beginning of year | |
| Plan assets at fair value at beginning of year | |
| Actual return on plan assets | Actual return on plan assets | 16,505 | | | 16,971 | |
| Employer contribution | 0 | | | 4,000 | |
| | Plan settlements | |
| Plan settlements | |
| Plan settlements | |
| Benefits paid | Benefits paid | (5,563) | | | (5,475) | |
| Plan assets at fair value at end of year | Plan assets at fair value at end of year | 125,022 | | | 114,080 | |
| Funded status | Funded status | $ | (26,102) | | | $ | (22,033) | |
Effective December 31, 2015, the Retirement Plan was amended to change the actuarial basis used for converting a life annuity benefit to optional forms of payment and converting benefits payable at age 65 to earlier commencement dates. This prior service cost will be amortized over future years.
The amounts recognized in other comprehensive income (loss) for the Retirement Plan for 2020, 20192023, 2022 and 20182021 were as follows:
| | | | | | | | | | | | | | | | | |
| 2020 | | 2019 | | 2018 |
| (in thousands) |
| Unrecognized net (loss) gain from experience different from that assumed and effects of changes and assumptions | $ | (4,089) | | | $ | (7,934) | | | $ | 1,870 | |
| Prior service cost | 24 | | | 24 | | | 24 | |
| (4,065) | | | (7,910) | | | 1,894 | |
| Income tax (expense) benefit | (216) | | | 312 | | | (207) | |
| Other comprehensive (loss) income | $ | (4,281) | | | $ | (7,598) | | | $ | 1,687 | |
| | | | | | | | | | | | | | | | | | | | |
| 2023 | 2022 | 2021 |
| (in thousands) |
| Unrecognized net gain (loss) from experience different from that assumed and effects of changes and assumptions | | $ | 8,815 | | | $ | 6,519 | | | $ | 15,858 | |
| Prior service cost | | 24 | | | 24 | | | 24 | |
| | 8,839 | | | 6,543 | | | 15,882 | |
| Income tax (expense) | | (9) | | | (33) | | | (87) | |
| Other comprehensive income | | $ | 8,830 | | | $ | 6,510 | | | $ | 15,795 | |
The lossgain of $4.3$8.8 million recognized in 20202023 was primarily due to actual earnings exceeding expected earnings on plan assets of ($6.9 million), the recognized actuarial loss of ($0.9 million), changes in the discount rate and lump sum interest rates of ($0.5 million) and changes in the census data ($0.5 million).
The gain of $6.5 million recognized in 2022 was primarily due to changes in the discount rate and lump sum interest rates of ($16.738.7 million), settlement loss recognized of ($1.7 million) and the recognized actuarial loss of ($1.0 million), offset by actual earnings less than expected earnings on plan assets of ($34.0 million), changes in the census data ($0.5 million) and changes in adjustments for participants who received their pension as a lump sum ($0.4 million).
The gain of $15.8 million recognized in 2021 was primarily due to actual earnings exceeding expected earnings on plan assets ($10.48.2 million), changes in the mortality assumption ($1.0 million), the recognized actuarial loss ($1.4 million) and changes in the census data ($0.4 million). The loss of $7.6 million recognized in 2019 was primarily due to changes in the discount rate and lump sum interest rates of ($21.75.6 million), offset by actual earnings exceeding expected earnings on plan assetssettlement loss recognized of ($11.32.0 million), changes in the mortality assumption ($1.2 million), and the recognized actuarial loss of ($1.11.5 million) and, offset by changes in the census data ($0.1 million). The gain of $1.7 million recognized in 2018 primarily was due to changes in the discount rate and lump sum interest rates ($9.7 million), the recognized actuarial loss ($1.11.0 million) and changes in the mortality assumption ($0.4 million), offset by actual earnings exceeding expected earnings on plan assets ($9.2 million), and changes in the census data ($0.2 million).
Foreign retirement plans and an individual's retirement plan maintained by AB are not material to AB's consolidated financial statements. As such, disclosure for these plans is not necessary. The reconciliation of the 20202023 amounts recognized in other comprehensive income for the Retirement Plan as compared to the consolidated statement of comprehensive income ((the "OCI Statement") is as follows:
| | Retirement Plan | | Retired Individual Plan | | Foreign Retirement Plans | | OCI Statement |
| (in thousands) |
| Recognized actuarial (loss) gain | $ | (4,089) | | | $ | (56) | | | $ | (135) | | | $ | (4,280) | |
| Retirement
Plan | | | Retirement
Plan | Retired Individual Plan | Foreign Retirement Plans | OCI
Statement |
| (in thousands) | | | (in thousands) |
| Recognized actuarial gain | |
| Amortization of prior service cost | Amortization of prior service cost | 24 | | | 0 | | | 0 | | | 24 | |
| Changes in employee benefit related items | Changes in employee benefit related items | (4,065) | | | (56) | | | (135) | | | (4,256) | |
| Income tax (expense) benefit | (216) | | | (2) | | | 31 | | | (187) | |
| Income tax (expense) | |
| Employee benefit related items, net of tax | Employee benefit related items, net of tax | $ | (4,281) | | | $ | (58) | | | $ | (104) | | | $ | (4,443) | |
The amounts included in accumulated other comprehensive income (loss)loss for the Retirement Plan as of December 31, 20202023 and 20192022 were as follows:
| | 2020 | | 2019 |
| (in thousands) |
| 2023 | | | 2023 | 2022 |
| (in thousands) | | | (in thousands) |
| Unrecognized net loss from experience different from that assumed and effects of changes and assumptions | Unrecognized net loss from experience different from that assumed and effects of changes and assumptions | $ | (59,625) | | | $ | (55,537) | |
| Prior service cost | Prior service cost | (707) | | | (731) | |
| (60,332) | | | (56,268) | |
| | (29,068) | |
| Income tax benefit | Income tax benefit | 296 | | | 513 | |
| Accumulated other comprehensive loss | Accumulated other comprehensive loss | $ | (60,036) | | | $ | (55,755) | |
The amortization period over which we are amortizing the loss for the Retirement Plan from accumulated other comprehensive income is 29.927.2 years. The estimated prior service cost and amortization of loss for the Retirement Plan that will be amortized from accumulated other comprehensive income over the next year are $24 thousand$24,000 and $1.5 million, respectively.$0.7 million.
The accumulated benefit obligation for the plan was $151.1$98.4 million and $136.1$100.5 million as of December 31, 20202023 and 2019,2022, respectively.
The discount rates used to determine benefit obligations as of December 31, 20202023 and 20192022 (measurement dates) were 2.55%5.40% and 3.35%5.50%, respectively.
Benefit payments are expected to be paid as follows (in thousands):
| | | | | |
| 2021 | $ | 7,606 | |
| 2022 | 9,373 | |
| 2023 | 7,782 | |
| 2024 | 7,811 | |
| 2025 | 10,055 | |
| 2026 - 2030 | 45,955 | |
| | | | | |
| 2024 | $ | 10,059 | |
| 2025 | 8,030 | |
| 2026 | 7,856 | |
| 2027 | 8,690 | |
| 2028 | 7,677 | |
| 2029 - 2033 | 37,703 | |
Net expense under the Retirement Plan consisted of:
| | Year Ended December 31, |
| 2020 | | 2019 | | 2018 |
| (in thousands) |
| Years Ended December 31 | | | Years Ended December 31 |
| 2023 | | | 2023 | 2022 | 2021 |
| (in thousands) | | | (in thousands) |
| Interest cost on projected benefit obligations | Interest cost on projected benefit obligations | $ | 4,443 | | | $ | 4,944 | | | $ | 4,771 | |
| Expected return on plan assets | Expected return on plan assets | (6,084) | | | (5,639) | | | (5,893) | |
| Amortization of prior service cost | Amortization of prior service cost | 24 | | | 24 | | | 24 | |
| Settlement loss recognized | |
| Recognized actuarial loss | Recognized actuarial loss | 1,386 | | | 1,146 | | | 1,146 | |
| Net pension expense | Net pension expense | $ | (231) | | | $ | 475 | | | $ | 48 | |
Actuarial computations used to determine net periodic costs were made utilizing the following weighted-average assumptions:
| | Years Ended December 31, |
| 2020 | | 2019 | | 2018 |
| Years Ended December 31 | | | Years Ended December 31 |
| 2023 | | | 2023 | 2022 | 2021 |
| Discount rate on benefit obligations | Discount rate on benefit obligations | 3.35 | % | | 4.40 | % | | 3.90 | % | Discount rate on benefit obligations | 5.50 | % | 2.90 | % | 2.55 | % |
| Expected long-term rate of return on plan assets | Expected long-term rate of return on plan assets | 5.50 | % | | 5.75 | % | | 5.75 | % | Expected long-term rate of return on plan assets | 5.25 | % | 5.25 | % | 5.25 | % |
In developing the expected long-term rate of return on plan assets of 5.50%5.25%, management considered the historical returns and future expectations for returns for each asset category, as well as the target asset allocation of the portfolio. The expected long-term rate of return on assets is based on weighted average expected returns for each asset class.
As of December 31, 2020,2023, the mortality projection assumption has been updated to useused the generational MP-2020MP-2021 improvement scale. Previously, mortality was projected generationally usingscale, which is consistent with the MP-2019 improvements scale.improvement scale used in 2022 and 2021. The base mortality assumption used is the Society of Actuaries Pri-2012PRI-2012 base mortality table for private sector plans, with a white-collar adjustment, using the contingent annuitant table for beneficiaries of deceased participants.
The Internal Revenue Service (“IRS”) recently updated the mortality tables used to determine lump sums. For fiscal year-end 2020,2023, we reflected the most recently published IRSInternal Revenue Service table for lump sums assumed to be paid in 2022.2023. We projected future mortality for lump sums assumed to be paid after 20222023 using the current base mortality tables (RP-2014 backed off to 2006) and projection scale of MP-2020.MP-2021.
The Retirement Plan’s asset allocation percentages consisted of:
| | December 31, |
| 2020 | | 2019 |
| Years Ended December 31 | | | Years Ended December 31 |
| 2023 | | | 2023 | 2022 |
| Equity | Equity | 55 | % | | 47 | % | Equity | 28 | % | 46 | % |
| Debt securities | Debt securities | 36 | | | 41 | |
| Other | Other | 9 | | | 12 | |
| 100 | % | | 100 | % |
| Total | | Total | 100 | % | 100 | % |
The guidelines regarding allocation of assets are formalized in the Investment Policy Statement adopted by the Investment Committee for the Retirement Plan. The objective of the investment program is to enhance the portfolio of the Retirement Plan through total return (capital appreciation and income), thereby promoting the ongoing ability of the planPlan to meet future liabilities and obligations, while minimizing the need for additional contributions.contributions, and managing the Plan's funded status appropriately. The guidelines specify ana target allocation weighting of 62.5% for liability hedging investments and 37.5% for return seeking investments.
Part II
weighting of 10% to 35% for liability hedging investments (target of 20%), 15% to 40% for return seeking investments (target of 27%), 5% to 35% for risk mitigating investments (target of 14%), 10% to 35% for diversifying investments (target of 21%) and 5% to 35% for dynamic asset allocation (target of 18%). Investments in mutual funds, hedge funds (and other alternative investments), and other commingled investment vehicles are permitted under the guidelines. Investments are permitted in overlay portfolios (regulated mutual funds), which are designed to manage short-term portfolio risk and mitigate the effect of extreme outcomes by varying the asset allocation of a portfolio.
See Note 9, Fair Value for a description of how we measure the fair value of our plan assets.
The valuation of our Retirement Plan assets by pricing observability levels as of December 31, 20202023 and 20192022 was as follows (in thousands):
| | Level 1 | | Level 2 | | Level 3 | | Total |
| December 31, 2020 | | | | | | | |
| Level 1 | | | Level 1 | Level 2 | Level 3 | Total |
| December 31, 2023 | |
| Cash | |
| Cash | |
| Cash | Cash | $ | 458 | | | $ | 0 | | | $ | 0 | | | $ | 458 | |
| U.S. Treasury Strips | U.S. Treasury Strips | 0 | | | 26,599 | | | 0 | | | 26,599 | |
| Fixed income mutual funds | Fixed income mutual funds | 17,834 | | | 0 | | | 0 | | | 17,834 | |
| Equity mutual fund | 44,020 | | | 0 | | | 0 | | | 44,020 | |
| Fixed income securities | |
| Equity mutual funds | |
| Equity securities | Equity securities | 14,376 | | | 0 | | | 0 | | | 14,376 | |
| Total assets in the fair value hierarchy | Total assets in the fair value hierarchy | 76,688 | | | 26,599 | | | 0 | | | 103,287 | |
| Investments measured at net assets value | Investments measured at net assets value | — | | | — | | | — | | | 21,735 | |
| Investments at fair value | Investments at fair value | $ | 76,688 | | | $ | 26,599 | | | $ | 0 | | | $ | 125,022 | |
|
| | Level 1 | | Level 2 | | Level 3 | | Total |
| December 31, 2019 | | | | | | | |
| Level 1 | | | Level 1 | Level 2 | Level 3 | Total |
| December 31, 2022 | |
| Cash | |
| Cash | |
| Cash | Cash | $ | 230 | | | $ | 0 | | | $ | 0 | | | $ | 230 | |
| U.S. Treasury Strips | U.S. Treasury Strips | 0 | | | 27,318 | | | 0 | | | 27,318 | |
| Fixed income mutual funds | Fixed income mutual funds | 19,518 | | | 0 | | | 0 | | | 19,518 | |
| Equity mutual fund | 33,875 | | | 0 | | | 0 | | | 33,875 | |
| Fixed income securities | |
| Equity mutual funds | |
| Equity securities | Equity securities | 11,182 | | | 0 | | | 0 | | | 11,182 | |
| Total assets in the fair value hierarchy | Total assets in the fair value hierarchy | 64,805 | | | 27,318 | | | 0 | | | 92,123 | |
| Investments measured at net assets value | Investments measured at net assets value | — | | | — | | | — | | | 21,957 | |
| Investments at fair value | Investments at fair value | $ | 64,805 | | | $ | 27,318 | | | $ | 0 | | | $ | 114,080 | |
During 20202023 and 2019,2022, the Retirement Plan's investments include the following:
•U.S. Treasury strips, (zero-coupon(zero coupon bonds); in 2023 and 2022;
•2 fixed income mutual funds, which seek to generate income consistent with preservation of capital. NaN fund invests in a portfolio of investment-grade securities primarily invested in the U.S. with additional non-U.S. securities. NaN fund invests in inflation-indexed fixed-income securitiesbonds and similar bonds issued by non-U.S. governments and various commodities;included as a level 2 security;
•7one multi asset fund fund in 2023 and 2022, in which the fund pursued an aggressive investment strategy involving a variety of asset classes. This fund seeks inflation protection from investments around the globe, both in developed and emerging market countries;
•six equity mutual funds 4 ofin 2023 and 2022, which focus on both U.S.-based and non-U.S.-based equity securities of various capitalization sizes ranging from small to large capitalizationscapitalization and diversified portfolios within those capitalization ranges; and 3 funds that focus on non-U.S. based equity securities of various capitalization sizes ranging from small to large capitalizations and diversified portfolios therein across non-U.S. regions;
•separate equity and fixed income mutual funds, which seek to moderate the volatility of equity and fixed income orientedone asset allocation over the long term, as part of the overall asset allocation managed by AB;mutual fund in 2022 which was liquidated in 2023;
•a multi-style, multi-cap integratedone separately managed account in 2023, managed against the Bloomberg Long U.S. Corporate index. This portfolio addinginvests in U.S. equity diversificationdollar denominated investment grade fixed income securities with at least 10 years to its value and growth equity selections, designed to deliver a long-term premium to the S&P 500 with greater consistency across a range of market environments; andmaturity;
•one alternative investment in 2022 which was liquidated in 2023;
•investments measured at net asset value, including 3one hedge fund in 2023 and two hedge funds that seekin 2022. The hedge fund included in both 2023 and 2022 seeks to provide attractive risk-adjusted returns over full market cycles with less volatility than thethat of broad equity markets by allocating all or substantially all of
their assets among portfolio managers through portfolio funds that employ a broad range of investment strategies; 1 private investment trust that invests primarilystrategies. The second hedge fund included in equity securities of non-U.S. companies located in emerging market countries;2022 was a long/short equity-focused multi-manager hedge fund investing across industries and 1 collective investment trust that invests in U.S. and non-U.S. equities of various capitalization sizes.geographies.
19. Long-term Incentive Compensation Plans
We maintain an unfunded, non-qualified incentive compensation program known as the AllianceBernstein Incentive Compensation Award Program (“(the “Incentive Compensation Program”), under which annual awards may be granted to eligible employees. See Note 2 "Summary of Significant Accounting Policies – Long-Term Incentive Compensation Plans" for a discussion of the award provisions.
Under the Incentive Compensation Program, we made awards in 2020, 20192023, 2022 and 20182021 aggregating $177.4$170.2 million, $175.5$164.3 million and $183.3$184.1 million, respectively. The amounts charged to employee compensation and benefits expense for the years ended December 31, 2020, 20192023, 2022 and 20182021 were $176.8$183.0 million, $177.2$160.1 million and $161.0$173.4 million, respectively.
Effective as of September 30, 2017, we established the AB 2017 Long Term Incentive Plan (“2017 Plan”), which was adopted at a special meeting of AB Holding Unitholders held on September 29, 2017. The following forms of awards may be granted to employees and Eligible Directors (directors who satisfy applicable independence standards) under the 2017 Plan: (i) restricted AB Holding Units or phantom restricted AB Holding Units (a “phantom” award is a contractual right to receive AB Holding Units at a later date or upon a specified event); (ii) options to buy AB Holding Units; and (iii) other AB Holding Unit-based awards (including, without limitation, AB Holding Unit appreciation rights and performance awards). The purpose of the 2017 Plan is to promote the interest of AB by: (i) attracting and retaining talented officers, employees and directors, (ii) motivating such officers, employees and directors by means of performance-related incentives to achieve longer-range business and operational goals, (iii) enabling such officers, employees and directors to participate in the long-term growth and financial success of AB, and (iv) aligning the interests of such officers, employees and directors with those of AB Holding Unitholders. The 2017 Plan will expire on September 30, 2027, and no awards under the 2017 Plan will be made after that date. Under the 2017 Plan, the aggregate number of AB Holding Units with respect to which awards may be granted is 60 million, including no more than 30 million newly-issued AB Holding Units.
As of December 31, 2020, 02023, no options to buy AB Holding Units had been grantedwere outstanding and 24,444,40632,738,157 AB Holding Units, net of withholding tax requirements, were subject to other AB Holding Unit awards made under the 2017 Plan or the AllianceBernstein 2010 Long Term Incentive Plan, as amended, an equity compensation plan with similar terms that was canceled on September 30, 2017. AB Holding Unit-based awards (including options) in respect of 35,555,59427,261,843 AB Holding Units were available for grant under the 2017 Plan as of December 31, 2020.2023.
As of December 31, 2022, no options to buy AB Holding Units had been granted and 29,795,964 AB Holding Units, net of withholding tax requirements, were subject to other AB Holding Unit awards made under the 2017 Plan or the AllianceBernstein 2010 Long Term Incentive Plan, as amended, an equity compensation plan with similar terms that was canceled on September 30, 2017. AB Holding Unit-based awards (including options) in respect of 30,204,036 AB Holding Units were available for grant under the 2017 Plan as of December 31, 2022.
Clawbacks
The award agreement contained in the Incentive Compensation Program permits AB to clawback the unvested portion of an award if the recipient fails to adhere to our risk management policies. Further, pursuant to Rule 10D-1 of the Securities Exchange Act of 1934 (the "Rule") and Section 303A.14 of the NYSE Listed Company Manual, the Board of Directors (the "Board") has adopted a Compensation Recovery Policy (the "Policy") effective November 15, 2023. Pursuant to the Policy, the Company will promptly recover erroneously awarded incentive-based compensation (as defined by section 10D(b)(1) to include any compensation that is granted, earned or vested wholly or in part upon attainment of a financial reporting measure) from any current or former Executive Officer of the Company as defined by Rule 10D-1 of the Exchange Act as required under the Exchange Act and the NYSE Listed Company Manual. The company does not currently award incentive-based compensation as defined by the Rule. We have filed the Policy as Exhibit 97.01 to this Form 10-K.
The portion of incentive-based compensation received from EQH specific to Seth Bernstein, our Chief Executive Officer, is covered under the Compensation Recovery Policy adopted by our parent EQH and will be applicable to any current or previous incentive-based compensation received directly from our parent company by Mr. Bernstein.
Option Awards
We did not grant any options to buy AB Holding Units during 2020, 20192023, 2022 or 2018.2021. Historically, options granted to employees generally were exercisable at a rate of 20% of the AB Holding Units subject to such options on each of the first five anniversary dates of the date of grant; options granted to Eligible Directors generally were exercisable at a rate of 33.3% of the AB Holding Units subject to such options on each of the first three anniversary dates of the date of grant.
The There was no option-related activity in our equity compensation plans during 2020 is as follows:2023.
| | | | | | | | | | | | | | | | | | | | | | | |
| Options to Buy
AB Holding
Units | | Weighted
Average
Exercise
Price
Per Option | | Weighted
Average
Remaining
Contractual
Term (Years) | | Aggregate
Intrinsic
Value |
| Outstanding as of December 31, 2019 | 159,349 | | | $ | 23.93 | | | 2.1 | | |
| Granted | 0 | | | 0 | | | | | |
| Exercised | (5,182) | | | 28.46 | | | | | |
| Forfeited | 0 | | | 0 | | | | | |
| Expired | (5,182) | | | 28.46 | | | | | |
| Outstanding as of December 31, 2020 | 148,985 | | | 23.61 | | | 1.2 | | $ | 1.5 | |
| Exercisable as of December 31, 2020 | 148,985 | | | 23.61 | | | 1.2 | | 1.5 | |
| Vested or expected to vest as of December 31, 2020 | 148,985 | | | 23.61 | | | 1.2 | | 1.5 | |
The total intrinsic value of options exercised during 2020, 2019 and 20182023, 2022 or 2021 was $32,368, $3.7zero , $0.2 million and $8.9$2.2 million, respectively.
Under the fair value method, compensation expense is measured at the grant date based on the estimated fair value of the options awarded (determined using the Black-Scholes option valuation model) and is recognized over the requisite service period. We recorded 0As we did not grant any option awards in 2023, 2022 or 2021, no compensation expense related to option grants in 2020, 2019 or 2018 as 0 options were granted.was recorded. As of December 31, 2020,2023, there was 0no compensation expense related to unvested option grants not yet recognized in the consolidated statement of income.
Restricted AB Holding Unit Awards
In 2020, 20192023, 2022 and 2018,2021, the Board granted restricted AB Holding Unit awards to Eligible Directors. These AB Holding Units give the Eligible Directors, in most instances, all the rights of other AB Holding Unitholders, subject to such restrictions on transfer as the Board may impose.
We award restricted AB Holding Units to Eligible Directors that vest ratably over three or four years. years (four years for awards granted in 2021). We fully expensed these awards on each grant date, as there is no service requirement. Grant details related to these awards is as follows:
| | | | | | | | | | | | | | | | | |
| 2020 | | 2019 | | 2018 |
| Restricted Units Awarded | 50,232 | | | 45,420 | | | 53,720 | |
Weighted Average Grant Date Fair Value(1) | $ | 23.69 | | | $ | 29.33 | | | $ | 26.90 | |
| Compensation Expense (in millions) | $ | 1.2 | | | $ | 1.3 | | | $ | 1.4 | |
(1) Prior period amounts have been adjusted to conform with current period presentation. | | | | | | | | | | | | | | | | | | | | |
| 2023 | 2022 | 2021 |
| Restricted Units Awarded | | 30,102 | | | 30,870 | | | 35,358 | |
| Weighted Average Grant Date Fair Value | | $ | 33.89 | | | $ | 38.55 | | | $ | 44.29 | |
| Compensation Expense (in millions) | | $ | 1.0 | | | $ | 1.2 | | | $ | 1.6 | |
On April 28, 2017, Seth P. Bernstein was appointed President and Chief Executive Officer ("CEO"). pursuant to an employment agreement, effective May 1, 2017. In connection with the commencement of his employment, Mr. Bernstein was granted restricted AB Holding Units; these Units with a grant date fair valuewere fully amortized as of $3.5 million (164,706 AB Holding Units based on the $21.25 grant date AB Holding Unit price on May 16, 2017) and a four-year service requirement. Mr. Bernstein's restricted AB Holding Units vest ratably on each of the first four anniversaries of his commencement date and will be delivered to Mr. Bernstein as soon as administratively feasible after May 1, 2021, subject to accelerated vesting clauses in his employment agreement. We recorded compensationDecember 31, 2021. Compensation expense relatingrelated to Mr. Bernstein's restricted AB Holding Unit grants of $0.9grant was $0.3 million for each of the yearsyear ended December 31, 2020, 2019 and 2018, respectively.2021.
Under the Incentive Compensation Program, we awarded 5.35.2 million restricted AB Holding Units in 20202023 (which included 5.0 million restricted AB Holding Units in December for the 20202023 year-end awards as well as 0.30.2 million additional restricted AB Holding Units granted earlier during the year relating to the 20192022 year-end awards), with grant date fair values per restricted AB holding unitHolding Unit ranging between $28.75$30.56 to $32.10.$38.84.
We awarded 5.84.2 million restricted AB Holding Units in 20192022 (which included 5.43.8 million restricted AB Holding Units in December for the 20192022 year-end awards as well as 0.4 million additional restricted AB Holding Units granted earlier during the year relating to the 20182021 year-end awards), with grant date fair values per restricted AB holding unitHolding Unit ranging between $26.69$38.84 to $30.01.
We awarded 6.53.5 million restricted AB Holding Units in 20182021 (which included 6.23.3 million restricted AB Holding Units in December for the 20182021 year-end awards as well as 0.30.2 million additional restricted AB Holding Units granted earlier during the year related to the 20172020 year-end awards), with grant date fair values per restricted AB holding unitHolding Unit ranging between $24.95$32.10 to $26.69.$50.94.
Restricted AB Holding Units awarded under the Incentive Compensation Program generally vest in 25%33.3% increments on December 1st of each of the fourthree years immediately following the year in which the award is granted.
We also award restricted AB Holding Units in connection with certain employment and separation agreements, as well as relocation-related performance awards, with vesting schedules generally ranging between two and fiveten years. Grant details related to these awards is as follows:
| | 2020 | | 2019 | | 2018 |
| (in millions excluding share prices) |
| 2023 | | | 2023 | 2022 | 2021 |
| (in millions excluding share prices) | | | (in millions excluding share prices) |
| Restricted Units Awarded | Restricted Units Awarded | 0.4 | | | 1.9 | | | 2.6 | |
| Grant Date Fair Value Range | Grant Date Fair Value Range | $18.80 - $35.42 | | $27.32 - $30.85 | | $25.05 - $30.25 | Grant Date Fair Value Range | $27.86 - $38.58 | $34.86 - $49.90 | $29.06 - $53.86 |
| Compensation Expense | Compensation Expense | $ | 32.1 | | | $ | 36.7 | | | $ | 32.2 | |
The fair value of the restricted AB Holding Units is amortized over the requisite service period as compensation expense.
Changes in unvested restricted AB Holding Units during 20202023 are as follows:
| | AB Holding
Units | | Weighted Average
Grant Date Fair
Value per AB Holding
Unit |
| Unvested as of December 31, 2019 | 19,287,080 | | | $ | 26.88 | |
| AB Holding
Units | | | AB Holding
Units | Weighted Average
Grant Date Fair
Value per AB Holding
Unit |
| Unvested as of December 31, 2022 | |
| Granted | Granted | 5,702,830 | | | 31.66 | |
| Vested | Vested | (5,946,667) | | | 26.07 | |
| Forfeited | Forfeited | (178,669) | | | 26.50 | |
| Unvested as of December 31, 2020 | 18,864,574 | | | 28.58 | |
| Unvested as of December 31, 2023 | |
The total grant date fair value of restricted AB Holding Units that vested was $155.0$235.8 million, $201.4$246.2 million and $169.1$199.0 million during 2020, 20192023, 2022 and 2018,2021, respectively. As of December 31, 2020,2023, the 18,864,57413,447,555 unvested restricted AB Holding Units consist of 13,957,90710,017,189 restricted AB Holding Units that do not have a service requirement and have been fully expensed on the grant date and 4,906,6673,430,366 restricted AB Holding Units that have a service requirement and will be expensed over the required service period. As of December 31, 2020,2023, there was $68.7$91.0 million of compensation expense related to unvested restricted AB Holding Unit awards granted and not yet recognized in the consolidated statement of income. We expect to recognize the expense over a weighted average period of 2.95.9 years.
20. Units Outstanding
Changes in AB Units outstanding for the years ended December 31, 20202023 and 20192022 were as follows:
| | 2020 | | 2019 |
| 2023 | | | 2023 | 2022 |
| Outstanding as of January 1, | Outstanding as of January 1, | 270,380,314 | | | 268,850,276 | |
| Options exercised | Options exercised | 5,182 | | | 511,894 | |
| Units issued | 3,363,132 | | | 4,833,715 | |
Units retired(1) | (3,238,970) | | | (3,815,571) | |
Units issued (1) | |
Units retired(2) | |
| Outstanding as of December 31, | Outstanding as of December 31, | 270,509,658 | | | 270,380,314 | |
(1)Includes 15,321,535 Units issued in 2022 as a result of the CarVal acquisition.
(2)During 20202023 and 2019,2022, we purchased 1,5005,695 and 3,7822,500 AB Units, respectively, in private transactions and retired them.
21. Income Taxes
AB, is a private limited partnership, for federal income tax purposes and, accordingly, is not subject to federal or state corporate income taxes. However, AB is subject to a 4.0% New York City unincorporated business tax (“(“UBT”). DomesticOur domestic corporate subsidiaries of AB, which are subject to federal, state and local income taxes, and generally are included in the filing of a consolidated federal income tax return with separatereturn. Separate state and local income tax returns beingalso are filed. Foreign corporate subsidiaries generally are generally subject to taxes in the foreign jurisdictions where they are located.
In order to preserve AB’s status as a private partnership for federal income tax purposes, AB Units must not be considered publicly traded. The AB Partnership Agreement provides that all transfers of AB Units must be approved by EQH and the General Partner; EQH and the General Partner approve only those transfers permitted pursuant to one or more of the safe harbors contained in the relevant Treasury regulations. If AB Units were considered readily tradable, AB’s net income would be subject to federal and state corporate income tax, significantly reducing its quarterly distributions to AB Holding. Furthermore, should AB enter into a substantial new line of business, AB Holding, by virtue of its ownership of AB, would lose its status as a “grandfathered” publicly-tradedpublicly traded partnership and would become subject to corporate income tax, which would reduce materially AB Holding’s net income and its quarterly distributions to AB Holding Unitholders.
Earnings before income taxes and income tax expense consist of:
| | Years Ended December 31, |
| 2020 | | 2019 | | 2018 |
| (in thousands) |
| Years Ended December 31 | | | Years Ended December 31 |
| 2023 | | | 2023 | 2022 | 2021 |
| (in thousands) | | | (in thousands) |
| Earnings before income taxes: | Earnings before income taxes: | |
| United States | |
| United States | |
| United States | United States | $ | 743,687 | | | $ | 697,501 | | | $ | 672,221 | |
| Foreign | Foreign | 163,749 | | | 125,936 | | | 153,093 | |
| Total | Total | $ | 907,436 | | | $ | 823,437 | | | $ | 825,314 | |
| Income tax expense: | Income tax expense: | | | | | |
| Partnership UBT | Partnership UBT | $ | 3,356 | | | $ | 9,196 | | | $ | 5,251 | |
| Partnership UBT | |
| Partnership UBT | |
| Corporate subsidiaries: | Corporate subsidiaries: | |
| Federal | |
| Federal | |
| Federal | Federal | 1,495 | | | (943) | | | (4,030) | |
| State and local | State and local | 904 | | | 975 | | | 2,888 | |
| Foreign | Foreign | 44,086 | | | 32,290 | | | 36,529 | |
| Current tax expense | Current tax expense | 49,841 | | | 41,518 | | | 40,638 | |
| Deferred tax | Deferred tax | (4,188) | | | 236 | | | 5,178 | |
| Income tax expense | Income tax expense | $ | 45,653 | | | $ | 41,754 | | | $ | 45,816 | |
The principal reasons for the difference between the effective tax rates and the UBT statutory tax rate of 4.0% are as follows:
| | Years Ended December 31, |
| 2020 | | 2019 | | 2018 |
| (in thousands) |
| Years Ended December 31 | | | Years Ended December 31 |
| 2023 | | | 2023 | 2022 | 2021 |
| (in thousands) | | | (in thousands) |
| UBT statutory rate | UBT statutory rate | $ | 36,297 | | | 4.0 | % | | $ | 32,937 | | | 4.0 | % | | $ | 33,012 | | | 4.0 | % | UBT statutory rate | | $ | 32,707 | | | 4.0 | | 4.0 | % | | $ | 32,604 | | | 4.0 | | 4.0 | % | | $ | 48,659 | | | 4.0 | | 4.0 | % |
| Corporate subsidiaries' federal, state, and local | Corporate subsidiaries' federal, state, and local | 2,025 | | | 0.2 | | | 4,000 | | | 0.5 | | | 1,522 | | | 0.2 | |
| Foreign subsidiaries taxed at different rates | Foreign subsidiaries taxed at different rates | 33,969 | | | 3.7 | | | 26,719 | | | 3.3 | | | 30,689 | | | 3.7 | |
| 2017 Tax Act | 0 | | | 0 | | | 0 | | | 0 | | | 1,155 | | | 0.1 | |
| FIN 48 reserve (release) | FIN 48 reserve (release) | (1,886) | | | (0.2) | | | 2,765 | | | 0.3 | | | (5,177) | | | (0.6) | |
| UBT business allocation percentage rate change | UBT business allocation percentage rate change | 8 | | | 0 | | | (79) | | | 0 | | | 2,657 | | | 0.3 | |
| Deferred tax and payable write-offs | Deferred tax and payable write-offs | (887) | | | (0.1) | | | 314 | | | 0 | | | 2,932 | | | 0.4 | |
| Foreign outside basis difference | Foreign outside basis difference | 3 | | | 0 | | | 155 | | | 0 | | | 2,273 | | | 0.3 | |
| Amended 2017 return | (221) | | | 0 | | | (3,853) | | | (0.5) | | | 0 | | | 0 | |
| Valuation allowance reserve (release) | |
| Effect of ASC 740 adjustments, miscellaneous taxes, and other | Effect of ASC 740 adjustments, miscellaneous taxes, and other | 2,654 | | | 0.3 | | | 2,305 | | | 0.3 | | | (2,521) | | | (0.3) | |
| Tax Credits | |
| Income not taxable resulting from use of UBT business apportionment factors and effect of compensation charge | Income not taxable resulting from use of UBT business apportionment factors and effect of compensation charge | (26,309) | | | (2.9) | | | (23,509) | | | (2.8) | | | (20,726) | | | (2.5) | |
| Income tax expense and effective tax rate | Income tax expense and effective tax rate | $ | 45,653 | | | 5.0 | | | $ | 41,754 | | | 5.1 | | | $ | 45,816 | | | 5.6 | | Income tax expense and effective tax rate | | $ | 29,051 | | | 3.6 | | 3.6 | % | | $ | 39,639 | | | 4.9 | | 4.9 | % | | $ | 62,728 | | | 5.2 | | 5.2 | % |
We recognize the effects of a tax position in the financial statements only if, as of the reporting date, it is “more likely than not” to be sustained based on its technical merits and their applicability to the facts and circumstances of the tax position. In making this assessment, we assume that the taxing authority will examine the tax position and have full knowledge of all relevant information.
A reconciliation of the beginning and ending amount of unrecognized tax benefits is as follows:
| | Years Ended December 31, |
| 2020 | | 2019 | | 2018 |
| (in thousands) |
| Years Ended December 31 | | | Years Ended December 31 |
| 2023 | | | 2023 | 2022 | 2021 |
| (in thousands) | | | (in thousands) |
| Balance as of beginning of period | Balance as of beginning of period | $ | 5,706 | | | $ | 3,893 | | | $ | 8,478 | |
| Additions for prior year tax positions | Additions for prior year tax positions | 0 | | | 1,813 | | | 0 | |
| Reductions for prior year tax positions | Reductions for prior year tax positions | 0 | | | 0 | | | 0 | |
| Additions for current year tax positions | Additions for current year tax positions | 0 | | | 0 | | | 0 | |
| Reductions for current year tax positions | Reductions for current year tax positions | 0 | | | 0 | | | 0 | |
| Reductions related to closed years/settlements with tax authorities | Reductions related to closed years/settlements with tax authorities | (2,868) | | | 0 | | | (4,585) | |
| Balance as of end of period | Balance as of end of period | $ | 2,838 | | | $ | 5,706 | | | $ | 3,893 | |
The amount of unrecognized tax benefits as of December 31, 2020, 20192023, 2022, and 2018,2021, when recognized, is recorded as a reduction to income tax expense and reduces the company’s effective tax rate.
Interest and penalties, if any, relating to tax positions are recorded in income tax expense on the consolidated statements of income. The total amount of interest expense recorded in income tax expense (credit) during 2020, 2019 and 2018 was $(0.4) million, $0.7 million and $0.1 million, respectively. As of December 31, 2020,2023, 2022, and 2021, there is 0no accrued interest or penalties recorded on the consolidated statements of financial condition. The total amount of accrued interest recorded on the consolidated statements of financial condition as of December 31, 2019 and 2018 was $1.1 million and $0.3 million, respectively. There were 0 penalties accrued as of December 31, 2020. There was $0.2 million of penalties accrued as of December 31, 2019 and there were 0 accrued penalties as of December 31, 2018.
Generally, the company is no longer subject to U.S. federal, state or local income tax examinations by tax authorities for any year prior to 2016,2019, except as set forth below.
As a result of the settlement of the New York City UBT tax audit for the years 2013 through 2016, the gross unrecognized tax benefit was reduced by approximately $2.9 million. The company also reduced the amount of accrued interest and penalties by $1.3 million.
During the fourththird quarter of 2020,2023, the City of New York notified us of an examination of AB's UBT returns for the years 20172020 through 2019.2021. The examination is ongoing and no provision with respect to this examination has been recorded.
Currently, there are no income tax examinations at our significant non-U.S. subsidiaries. Years that remain open and may be subject to examination vary under local law and range from one to seven years.
At December 31, 2020, it is not reasonably possible that any of our unrecognized tax benefits will change within the next twelve months due to completion of tax authority exams.
Deferred income taxes reflect the net tax effect of temporary differences between the carrying amounts of assets and liabilities for financial reporting purposes and the amounts used for income tax purposes. The tax effect of significant items comprising the net deferred tax asset (liability) is as follows:
| | December 31, |
| 2020 | | 2019 |
| (in thousands) |
| Years Ended December 31 | | | Years Ended December 31 |
| 2023 | | | 2023 | 2022 |
| (in thousands) | | | (in thousands) |
| Deferred tax asset: | Deferred tax asset: | |
| Differences between book and tax basis: | Differences between book and tax basis: | |
| Differences between book and tax basis: | |
| Differences between book and tax basis: | |
| Benefits from net operating loss carryforwards | |
| Benefits from net operating loss carryforwards | |
| Benefits from net operating loss carryforwards | Benefits from net operating loss carryforwards | $ | 7,112 | | | $ | 5,551 | |
| Long-term incentive compensation plans | Long-term incentive compensation plans | 22,363 | | | 20,907 | |
| Investment basis differences | Investment basis differences | 5,256 | | | 4,376 | |
| Depreciation and amortization | Depreciation and amortization | 2,065 | | | 1,554 | |
| Lease liability | Lease liability | 5,994 | | | 6,409 | |
| Investment in foreign subsidiaries | |
| Tax credit carryforward | |
| Other, primarily accrued expenses deductible when paid | Other, primarily accrued expenses deductible when paid | 4,737 | | | 3,106 | |
| 47,527 | | | 41,903 | |
| | 91,924 | |
| Less: valuation allowance | Less: valuation allowance | (3,025) | | | (2,026) | |
| Deferred tax asset | Deferred tax asset | 44,502 | | | 39,877 | |
| Deferred tax liability: | Deferred tax liability: | | | | Deferred tax liability: | | | | |
| Differences between book and tax basis: | Differences between book and tax basis: | | | | Differences between book and tax basis: | | | | |
| Intangible assets | Intangible assets | 7,933 | | | 8,013 | |
| Investment in foreign subsidiaries | 3,048 | | | 2,191 | |
| Right-of-use asset | Right-of-use asset | 4,975 | | | 5,191 | |
| Other | Other | 1,760 | | | 1,672 | |
| Deferred tax liability | Deferred tax liability | 17,716 | | | 17,067 | |
| Net deferred tax asset | Net deferred tax asset | $ | 26,786 | | | $ | 22,810 | |
Valuation allowances of $3.0$28.6 million and $2.0$38.1 million were established as of December 31, 20202023 and 2019,2022, respectively, primarily due to significant negative evidence that net operating loss ("NOL") carryforwardscapital losses anticipated in the held for sale foreign subsidiaries will not be utilized, given the future lossesnature of income expected to be incurred by the applicable subsidiaries. During 2023, we recognized a one-time tax benefit of $22.4 million from the release of a valuation allowance on a capital loss tax asset due to a tax planning action identified in the fourth quarter, due to a future restructuring of certain foreign subsidiaries that would not have a material impact on AB operations. We had NOLnet operating loss carryforwards at December 31, 20202023 and 20192022 of approximately $51.0$44.0 million and $46.2$30.3 million, respectively, in certain foreign locations with an indefinitea five year expiration period.
The deferred tax asset is included in other assets in our consolidated statement of financial condition. Management believes there will be sufficient future taxable income to realize the tax benefits related to the remaining net deferred tax assets recognized that are not subject to valuation allowances.
The company provides income taxes on the unremitted earnings of non-U.S. corporate subsidiaries except to the extent that such earnings are indefinitely reinvested outside the United States. As of December 31, 2020,2023, $29.6 million of undistributed earnings of non-U.S. corporate subsidiaries were indefinitely invested outside the U.S. At existing applicable income tax rates, additional taxes of approximately $6.4$6.2 million would need to be paid if such earnings are remitted.
22. Business Segment Information
Management has assessed the requirements of ASC 280, Segment Reporting, and determined that, because we utilize a consolidated approach to assess performance and allocate resources, we have only 1one operating segment. Enterprise-wide disclosures as of and for the years ended December 31, 2020, 20192023, 2022 and 20182021 were as follows:
Services
Net revenues derived from our investment management, research and related services were as follows:
| | Years Ended December 31, |
| 2020 | | 2019 | | 2018 |
| (in thousands) |
| Years Ended December 31 | | | Years Ended December 31 |
| 2023 | | | 2023 | 2022 | 2021 |
| (in thousands) | | | (in thousands) |
| Institutions | Institutions | $ | 512,914 | | | $ | 480,144 | | | $ | 479,068 | |
| Retail | Retail | 1,811,948 | | | 1,619,832 | | | 1,494,445 | |
| Private Wealth Management | Private Wealth Management | 882,672 | | | 904,505 | | | 883,234 | |
| Bernstein Research Services | Bernstein Research Services | 459,744 | | | 407,911 | | | 439,432 | |
| Other | Other | 56,908 | | | 163,245 | | | 123,581 | |
| Total revenues | Total revenues | 3,724,186 | | | 3,575,637 | | | 3,419,760 | |
| Less: Interest expense | Less: Interest expense | 15,650 | | | 57,205 | | | 52,399 | |
| Net revenues | Net revenues | $ | 3,708,536 | | | $ | 3,518,432 | | | $ | 3,367,361 | |
Our AllianceBernstein Global High Yield Portfolio, an open-endNo individual fund incorporated in Luxembourg (ACATEUH: LX), generated approximately 8%, 9% andaccounted for more than 10% of our investment advisory and service fees and 8%, 9% and 10% of our net revenues during 2020, 20192023, 2022 and 2018, respectively.2021.
Geographic Information
Net revenues and long-lived assets, related to our U.S. and international operations, as of and for the years ended December 31, were as follows:
| | 2020 | | 2019 | | 2018 |
| (in thousands) |
| 2023 | | | 2023 | 2022 | 2021 |
| (in thousands) | | | (in thousands) |
| Net revenues: | Net revenues: | |
| United States | |
| United States | |
| United States | United States | $ | 1,959,528 | | | $ | 1,975,105 | | | $ | 1,940,267 | |
| International | International | 1,749,008 | | | 1,543,327 | | | 1,427,094 | |
| Total | Total | $ | 3,708,536 | | | $ | 3,518,432 | | | $ | 3,367,361 | |
| Long-lived assets: | Long-lived assets: | | | | | | Long-lived assets: | | | | |
| United States | United States | $ | 3,285,761 | | | $ | 3,259,490 | | | |
| International | International | 53,453 | | | 54,349 | | | |
| International | |
| International | |
| Total | Total | $ | 3,339,214 | | | $ | 3,313,839 | | | |
| Total | |
| Total | |
Major Customers
Company-sponsored mutual funds are distributed to individual investors through broker-dealers, insurance sales representatives, banks, registered investment advisers, financial planners and other financial intermediaries. HSBC (not affiliated with AB) was responsible for approximately 6%, 14% and 7% of our open-end mutual fund sales in 2020, 2019 and 2018, respectively. HSBC is not under any obligation to sell a specific amount of AB Fund shares.
EQH and the general and separate accounts of Equitable Financial Life Insurance Company ("Equitable Financial") (including investments by the separate accounts of Equitable Financial in the funding vehicle EQ Advisors Trust) accounted for approximately 3% of our total revenues for each of the years ended December 31, 2020, 2019 and 2018. AXA and its subsidiaries accounted for approximately 2% of our total revenues for each of the years ended December 31, 2020, 2019 and 2018. No single institutionalcustomer or individual client other than EQH, AXA and their respective subsidiaries accounted for more than 1%10% of our total revenues for the years ended December 31, 2020, 20192023, 2022 and 2018.
23. Related Party Transactions
Mutual Funds
We provide investment management, distribution, shareholder, administrative and brokerage services to individual investors by means of retail mutual funds sponsored by our company, our subsidiaries and our affiliated joint venture companies. We provide substantially all of these services under contracts that specify the services to be provided and the fees to be charged. The contracts are subject to annual review and approval by each mutual fund’s board of directors or trustees and, in certain circumstances, by the mutual fund’s shareholders.
Revenues for services provided or related to the mutual funds are as follows:
| | Years Ended December 31, |
| 2020 | | 2019 | | 2018 |
| (in thousands) |
| Years Ended December 31 | | | Years Ended December 31 |
| 2023 | | | 2023 | 2022 | 2021 |
| (in thousands) | | | (in thousands) |
| Investment advisory and services fees | Investment advisory and services fees | $ | 1,368,484 | | | $ | 1,275,677 | | | $ | 1,207,086 | |
| Distribution revenues | Distribution revenues | 516,336 | | | 441,437 | | | 403,965 | |
| Shareholder servicing fees | Shareholder servicing fees | 79,394 | | | 75,122 | | | 74,019 | |
| Other revenues | Other revenues | 8,314 | | | 7,303 | | | 7,262 | |
| Bernstein Research Services | Bernstein Research Services | 3 | | | 2 | | | 33 | |
| $ | 1,972,531 | | | $ | 1,799,541 | | | $ | 1,692,365 | |
| | $ | |
EQH AXA and their respectiveits Subsidiaries
We provide investment management and certain administration services to EQH AXA and their respectiveits subsidiaries. In addition, EQH AXA and their respectiveits subsidiaries distribute company-sponsored mutual funds, for which they receive commissions and distribution payments. Also, we are covered by various insurance policies maintained by EQH and we pay fees for technology and other services provided by EQH AXA and their respectiveits subsidiaries. Additionally, see Note 12 Debt, for disclosures related to our credit facility with EQH.
Aggregate amounts included in the consolidated financial statements for transactions with EQH AXA and their respectiveits subsidiaries, as of and for the years ended December 31, are as follows:
| | EQH | | AXA |
| 2020 | | 2019 | | 2018 | | 2020 | | 2019 | | 2018 |
| (in thousands) |
| Years Ended December 31 | | | Years Ended December 31 |
| 2023 | | | 2023 | 2022 | 2021 |
| (in thousands) | | | (in thousands) |
| Revenues: | Revenues: | |
| Investment advisory and services fees | Investment advisory and services fees | $ | 115,901 | | | $ | 109,316 | | | $ | 104,810 | | | $ | 73,482 | | | $ | 65,086 | | | $ | 64,347 | |
| Bernstein Research Services | 0 | | | 0 | | | 0 | | | 23 | | | 45 | | | 134 | |
| Distribution revenues | 0 | | | 0 | | | 0 | | | 12,925 | | | 12,968 | | | 13,897 | |
| Investment advisory and services fees | |
| Investment advisory and services fees | |
| Other revenues | Other revenues | 1,330 | | | 1,013 | | | 1,104 | | | 353 | | | 482 | | | 625 | |
| $ | 117,231 | | | $ | 110,329 | | | $ | 105,914 | | | $ | 86,783 | | | $ | 78,581 | | | $ | 79,003 | |
| | $ | |
| Expenses: | Expenses: | | | | | | | | | | | | Expenses: | | | | |
| Commissions and distribution payments to financial intermediaries | Commissions and distribution payments to financial intermediaries | $ | 3,952 | | | $ | 3,956 | | | $ | 3,964 | | | $ | 14,848 | | | $ | 16,693 | | | $ | 17,603 | |
| General and administrative | General and administrative | 2,281 | | | 2,466 | | | 2,615 | | | 8,928 | | | 11,501 | | | 12,391 | |
Other(1) | 5,463 | | | 3,644 | | | 1,485 | | | 0 | | | 0 | | | 0 | |
| $ | 11,696 | | | $ | 10,066 | | | $ | 8,064 | | | $ | 23,776 | | | $ | 28,194 | | | $ | 29,994 | |
| Other | |
| | $ | |
| Balance Sheet: | Balance Sheet: | | | | | | | | | | | |
| Institutional investment advisory and services fees receivable | Institutional investment advisory and services fees receivable | $ | 8,343 | | | $ | 8,716 | | | $ | 5,262 | | | $ | 10,842 | | |
| Institutional investment advisory and services fees receivable | |
| Institutional investment advisory and services fees receivable | |
| Prepaid expenses | Prepaid expenses | 404 | | | 238 | | | 0 | | | 0 | | |
| Other due to EQH, AXA and their respective subsidiaries | (1,280) | | | (2,111) | | | (4,703) | | | (5,234) | | |
| Prepaid expenses | |
| Prepaid expenses | |
| Other due to EQH and its subsidiaries | |
| Other due to EQH and its subsidiaries | |
| Other due to EQH and its subsidiaries | |
| EQH Facility | EQH Facility | (675,000) | | | (560,000) | | | 0 | | | 0 | | |
| $ | (667,533) | | | $ | (553,157) | | | $ | 559 | | | $ | 5,608 | | |
| EQH Facility | |
| EQH Facility | |
| | $ | |
| | $ | |
| | $ | |
(1) Table of ContentsPrior period EQH 2019 is now presented to conform to current periods presentation.Part II
Other Related Parties
The consolidated statements of financial condition include a net receivable from AB Holding as a result of cash transactions for fees and expense reimbursements. The net receivable balance included in the consolidated statements of financial condition as of December 31, 20202023 and 20192022 was $10.2$8.7 million and $10.1$7.7 million, respectively.
Related Party Master Repurchase Agreement
24. Divestitures and Acquisitions
Divestitures
On November 22, 2022, AB and SocGen, a leading European bank, announced plans to form a joint venture combining their respective cash equities and research businesses (the "Initial Plan"). In the Initial Plan, AB would own a 49% interest in the joint venture and SocGen would own a 51% interest in the global joint venture, with an option to reach 100% ownership after five years.
During April 2020, we providedthe fourth quarter of 2023, AB and SocGen negotiated a $125 million credit facility, through a Master Repurchase Agreement ("revised plan (the "MRARevised Plan") to form a North American joint venture (the "NA JV") and an International joint venture (the "International JV"). Under the Revised Plan, AB would own a majority economic and voting interest in the NA JV and a 49% economic and voting interest in the International JV. The Revised Plan, as compared to the Initial Plan, will not have a significant impact on our results of operations or financial condition.
SocGen will continue to have an option to reach 100% ownership in the International JV after five years and AB would have an option to sell its share in both joint ventures to SocGen, subject to regulatory approval. The consummation of the joint ventures is subject to customary closing conditions, including regulatory clearances. The closings are expected to occur in the first half of 2024.
The structure of the Board of Directors of the NA JV Holding Company, which will include two independent directors, precludes AB from controlling the Board and therefore from having a controlling financial interest in the entity. Upon review of the consolidation guidance under U.S. GAAP, we have concluded we will not consolidate the NA JV Holding Company and will maintain an equity method investment in both the NA JV and the International JV holding companies. Accordingly, the assets and liabilities of AB's research services business (“the disposal group”) continue to onebe classified as held for sale on the consolidated statement of our sponsored private investment funds,financial condition and recorded at fair value, less cost to sell. As a result of which $30classifying these assets as held for sale, we recognized a non-cash valuation adjustment of $6.6 million was drawn uponin general and administrative expenses on the condensed consolidated statement of income for the twelve months ended December 31, 2023, as well as $7.4 million for the three months ended December 31, 2022, to recognize the net carrying value at lower of cost or fair value, less estimated costs to sell. Approximately $7.2 million in costs to sell have been paid as of April 28, 2020December 31, 2023.
The following table summarizes the assets and repaid in full in May 2020. NaN additional amounts were drawn during the remainder of 2020. The amounts drawn upon the MRA, which were payable on demand, were collateralized by assetsliabilities of the fund, could have been repaid at any time prior to maturity and bore interest based upondisposal group classified as held for sale on the interest rate established at the timeconsolidated statement of each borrowing. This credit facility expired onfinancial condition as of December 31, 2020.
24. Non-controlling Interests | | | | | | | | | | | | | | |
| Years Ended December 31 |
| 2023 | 2022 |
| (in thousands) |
| Cash and cash equivalents | | $ | 153,047 | | | $ | 159,123 | |
| Receivables, net: | | | | |
| Brokers and dealers | | 32,669 | | | 44,717 | |
| Brokerage clients | | 74,351 | | | 29,243 | |
| Other fees | | 15,326 | | | 22,988 | |
| Investments | | 17,029 | | | 24,507 | |
| Furniture and equipment, net | | 5,807 | | | 4,128 | |
| Other assets | | 104,228 | | | 107,764 | |
| Right-of-use assets | | 5,032 | | | 1,552 | |
| Intangible assets | | 4,061 | | | 4,903 | |
| Goodwill | | 159,826 | | | 159,826 | |
| Valuation adjustment (allowance) on disposal group | | (6,600) | | | (7,400) | |
| Total assets held for sale | | $ | 564,776 | | | $ | 551,351 | |
| | | | |
| Payables: | | | | |
| Brokers and dealers | | $ | 39,359 | | | $ | 32,983 | |
| Brokerage clients | | 16,885 | | | 10,232 | |
| Other liabilities | | 67,938 | | | 50,884 | |
| Accrued compensation and benefits | | 29,160 | | | 13,853 | |
| Total liabilities held for sale | | $ | 153,342 | | | $ | 107,952 | |
Non-controlling interest in net income for the years ended December 31, 2020, 2019 and 2018 consisted of the following:
| | | | | | | | | | | | | | | | | |
| 2020 | | 2019 | | 2018 |
| (in thousands) |
| | | | | |
| Non-redeemable non-controlling interests: | | | | | |
| Consolidated company-sponsored investment funds | $ | 0 | | | $ | 0 | | | $ | (119) | |
| Other | 0 | | | 92 | | | 188 | |
| Total non-redeemable non-controlling interest | 0 | | | 92 | | | 69 | |
| Redeemable non-controlling interests: | | | | | |
| Consolidated company-sponsored investment funds | (4,169) | | | 29,549 | | | 21,841 | |
| Total non-controlling interest in net income (loss) | $ | (4,169) | | | $ | 29,641 | | | $ | 21,910 | |
Redeemable non-controlling interest asAs of December 31, 20202023 and 2019 consisted2022, cash and cash equivalents classified as held for sale included in the consolidated statement of cash flows were $153.0 million and $159.1 million, respectively.
We have determined that the exit from the sell-side research business does not represent a strategic shift that had a major effect on our consolidated results of operations. Accordingly, we have not classified the disposal group as discontinued operations. The results of operations of the following:
| | | | | | | | | | | |
| 2020 | | 2019 |
| (in thousands) |
| | | |
| Consolidated company-sponsored investment funds | $ | 102,359 | | | $ | 325,561 | |
| | | |
| Total redeemable non-controlling interest | $ | 102,359 | | | $ | 325,561 | |
On July 1, 2022, AB Holding acquired a 100% ownership interest in CarVal, a global private alternatives investment manager primarily focused on opportunistic and distressed credit, renewable energy, infrastructure, specialty finance and transportation investments that, as of the acquisition date, constituted approximately $12.2 billion in AUM. Also, on July 1, 2022, immediately following the acquisition of CarVal, AB Holding contributed 100% of its equity interests in CarVal to AB in exchange for AB Units. Post-acquisition, CarVal was rebranded AB CarVal Investors (“AB CarVal”).
On the acquisition date, AB Holding issued approximately 3.2 million AB Holding Units (with a fair value of $132.8 million) with the remaining 12.1 million Units (with a fair value of $456.4 million) issued on November 1, 2022. The fair value of the units issued on November 1, 2022 reflect final adjustments to the estimated unit issuance recorded as of acquisition close on July 1, 2022 and as disclosed in the third quarter 2022 Form 10-Q.
25. Quarterly Financial Data (Unaudited) | | | | | | | | | | | | | | | | | | | | | | | |
| Quarters Ended 2020 |
| December 31 | | September 30 | | June 30 | | March 31 |
| (in thousands, except per unit amounts) |
| Net revenues | $ | 1,062,893 | | | $ | 900,038 | | | $ | 871,449 | | | $ | 874,156 | |
| Net income attributable to AB Unitholders | $ | 286,335 | | | $ | 207,976 | | | $ | 177,321 | | | $ | 194,320 | |
Basic net income per AB Unit(1) | $ | 1.06 | | | $ | 0.77 | | | $ | 0.65 | | | $ | 0.71 | |
Diluted net income per AB Unit(1) | $ | 1.06 | | | $ | 0.77 | | | $ | 0.65 | | | $ | 0.71 | |
Cash distributions per AB Unit(2)(3) | $ | 1.05 | | | $ | 0.76 | | | $ | 0.68 | | | $ | 0.71 | |
| | | | | | | | | | | | | | | | | | | | | | | |
| Quarters Ended 2019 |
| December 31 | | September 30 | | June 30 | | March 31 |
| (in thousands, except per unit amounts) |
| Net revenues | $ | 987,304 | | | $ | 877,867 | | | $ | 857,799 | | | $ | 795,462 | |
| Net income attributable to AB Unitholders | $ | 248,865 | | | $ | 187,811 | | | $ | 166,252 | | | $ | 149,114 | |
Basic net income per AB Unit(1) | $ | 0.92 | | | $ | 0.69 | | | $ | 0.61 | | | $ | 0.55 | |
Diluted net income per AB Unit(1) | $ | 0.92 | | | $ | 0.69 | | | $ | 0.61 | | | $ | 0.55 | |
Cash distributions per AB Unit(2)(3) | $ | 0.93 | | | $ | 0.70 | | | $ | 0.63 | | | $ | 0.56 | |
(1)Basic and diluted net income per unit are computed independently for each of the periods presented. Accordingly, the sum of the quarterly net income per unit amounts may not agree to the total for the year.
(2)Declared and paid during the following quarter.
(3)Cash distributions reflect the impact of our non-GAAP adjustments.
The following table summarizes the amounts of identified assets acquired and liabilities assumed at the acquisition date (reflecting acquisition adjustments recorded in the fourth quarter of 2022), as well as the consideration transferred to acquire CarVal (in thousands):
| | | | | |
| Summary of purchase consideration: | |
| Fair value of AB Holding units issued | $ | 589,169 | |
| Fair value of contingent consideration | 228,885 | |
| Total purchase consideration | $ | 818,054 | |
| |
| Purchase price allocation: | |
| Assets acquired: | |
| Cash and cash equivalents | $ | 40,777 | |
| Receivables, net | 82,523 | |
| Investments - other | 947 | |
| Furniture, equipment, and leasehold improvements, net | 2,464 | |
| Right-of-use assets | 16,482 | |
| Other assets | 10,600 | |
| Deferred tax asset | 5,073 | |
| Intangible assets | 303,000 | |
| Goodwill | 666,130 | |
| Total assets acquired | 1,127,996 | |
| |
| Liabilities assumed: | |
| Accounts payable and accrued expenses | (17,793) | |
| Accrued compensation and benefits | (219,726) | |
| Debt | (42,661) | |
| Lease liabilities | (16,571) | |
| Non-redeemable non-controlling interests in consolidated entities | (13,191) | |
| Total liabilities assumed | (309,942) | |
| |
| Net assets acquired | $ | 818,054 | |
The CarVal acquisition did not have a significant impact on our 2022 revenues and earnings. As a result, we have not provided supplemental pro forma financial information.
Item 9.Changes in and Disagreements with Accountants on Accounting and Financial Disclosure
We did not have any changes in or disagreements with accountants in respect of accounting or financial disclosure.
Item 9A.Controls and Procedures
Disclosure Controls and Procedures
Each of AB Holding and AB maintains a system of disclosure controls and procedures that is designed to ensure that information required to be disclosed in our reports under the Exchange Act is (i) recorded, processed, summarized and reported in a timely manner, and (ii) accumulated and communicated to management, including the Chief Executive Officer ("(“CEO"”) and the Interim Chief Financial Officer ("(“CFO"”), to permit timely decisions regarding our disclosure.
As of the end of the period covered by this report, management carried out an evaluation, under the supervision and with the participation of the CEO and the CFO, of the effectiveness of the design and operation of disclosure controls and procedures. Based on this evaluation, the CEO and the CFO concluded that the disclosure controls and procedures are effective.
Management’s Report on Internal Control Over Financial Reporting
Management acknowledges its responsibility for establishing and maintaining adequate internal control over financial reporting for each of AB Holding and AB.
Internal control over financial reporting is a process designed by, or under the supervision of, a company’s CEO and CFO, to provide reasonable assurance regarding the reliability of financial reporting and the preparation of financial statements for external purposes in accordance with accounting principles generally accepted in the United States of America (“US GAAP”) and includes those policies and procedures that:
•Pertain to the maintenance of records that, in reasonable detail, accurately and fairly reflect the transactions and dispositions of the assets of the company;
•Provide reasonable assurance that transactions are recorded as necessary to permit preparation of financial statements in accordance with US GAAP and receipts and expenditures of the company are being made only in accordance with authorizations of management and directors of the company; and
•Provide reasonable assurance regarding prevention or timely detection of unauthorized acquisition, use or disposition of the company’s assets that could have a material effect on the financial statements.
All internal control systems, no matter how well designed, have inherent limitations. Therefore, even those internal control systems determined to be effective can provide only reasonable assurance with respect to the reliability of financial statement preparation and presentation. Because of these inherent limitations, internal control over financial reporting may not prevent or detect misstatements. Projections of any evaluation of effectiveness of internal control to future periods are subject to the risk that controls may become inadequate because of changes in conditions, or that the degree of compliance with the policies or procedures may deteriorate.
Management assessed the effectiveness of AB Holding’s and AB’s internal control over financial reporting as of December 31, 2020.2023. In making its assessment, management used the criteria set forth by the Committee of Sponsoring Organizations of the Treadway Commission in Internal Control-Integrated Framework(2013) (“(the “COSO criteriacriteria””).
Based on its assessment, management concluded that, as of December 31, 2020,2023, each of AB Holding and AB maintained effective internal control over financial reporting based on the COSO criteria.
PricewaterhouseCoopers LLP (PCAOB ID No. 238), the independent registered public accounting firm that audited the 20202023 financial statements included in this Form 10-K, has issued an attestation report on the effectiveness of each of AB Holding’s and AB’s internal control over financial reporting as of December 31, 2020.2023. The report pertaining to AB can be found in Item 8. The reportreports pertaining to AB Holding and AB each can be foundin Item 8 of AB Holding'sthis Form 10-K for the year ended December 31, 2020.10-K.
Changes in Internal Control Over Financial Reporting
No changes in our internal control over financial reporting occurred during the fourth quarter of 20202023 that materially affected, or are reasonably likely to materially affect, our internal control over financial reporting.
Item 9B.Other Information
We reported all information required to be disclosed on Form 8-K during the fourth quarter of 2020.2023.
Pursuant to Item 408(a) of Regulation S-K, there were no directors or officers that had adopted or terminated a 10b5-1 plan or other trading arrangement during the fourth quarter of 2023.
Item 9C. Disclosure Regarding Foreign Jurisdictions that Prevent Inspections
Not applicable.
Item 10. 10. Directors, Executive Officers and Corporate Governance
We use ““Internet SiteSite”” in Items 10 and 11 to refer to our company’s public website, www.alliancebernstein.com.
To contact our company’s Corporate Secretary, you may send an email to corporate_secretary@alliancebernstein.com or write to Corporate Secretary, AllianceBernstein L.P., 1345 Avenue of the Americas, New York, New York 10105.
General Partner
The Partnerships’ activities are managed and controlled by the General Partner. The Board of the General Partner acts as the Board of each of the Partnerships. Neither AB Unitholders nor AB Holding Unitholders have any rights to manage or control the Partnerships or to elect directors of the General Partner. The General Partner is a wholly-ownedwholly owned subsidiary of EQH.
The General Partner does not receive any compensation from the Partnerships for services rendered to them as their general partner. The General Partner holds a 1% general partnership interest in AB and 100,000 units of general partnership interest in AB Holding. Each general partnership unit in AB Holding is entitled to receive distributions equal to those received by each AB Holding Unit.
The General Partner is entitled to reimbursement by AB for any expenses it incurs in carrying out its activities as general partner of the Partnerships, including compensation paid by the General Partner to its directors and officers (to the extent such persons are not compensated directly by AB).
Board of Directors
Our Board consists of 129 directors, including eightfive independent directors (including our ChairmanChair of the Board), our President and CEO, and three senior executives of EQH. While we do not have a formal, written diversity policy in place, we believe that an effective board consists of a diverse group of individuals who collectively possess a variety of complementary skills, personal experiences and perspectives and who will work together to provide a board with the needed leadership and experience to successfully guide our company. As set forth in its charter, the Corporate Governance Committee of the Board (the ““Governance CommitteeCommittee””) assists the Board in identifying and evaluating such candidates, determining Board composition, developing and monitoring a process to assess Board effectiveness, developing and implementing corporate governance guidelines, and reviewing programs relating to matters of corporate responsibility.
As we indicate below, our directors have a combined wealth of leadership experience derived from extensive service leading large, complex organizations in their roles as either senior executives or board members, as well as in government and academia. Each of our directors has the integrity, business judgment, collegiality and commitment that are among the essential characteristics for a member of our Board. Collectively, they have substantive knowledge and skills applicable to our business, including expertise in areas such as asset management; regulation; public accounting and financial reporting; finance; risk management; business development; operations; information technology and security; strategic planning; management development, succession planning and compensation; corporate governance; public policy; and international matters.
As of February 11, 2021, our directors are as follows:
Ramon de Oliveira
Mr. de Oliveira, age 66, was appointed a director of AB in April 2017 and, since April 2019, has served as Chairman of the Board of AB. Since March 2019, he has served as Chairman of the Board of EQH, Equitable Financial and Equitable America. Mr. de Oliveira served as director of EQH from April 2018 until being appointed Chairman in 2019. He also previously served as a director of Equitable Financial and Equitable America from 2011 to 2018. He has been a director of AXA since 2010. Additionally, he serves as Managing Partner of the consulting firm Investment Audit Practice, LLC. Previously, Mr. de Oliveira held several executive positions at J.P. Morgan & Co. over the course of a 24-year tenure, including five years as chairman and Chief Executive Officer of J.P. Morgan Investment Management. He was also a member of J.P. Morgan’s Management Committee from its inception in 1995.
Mr. de Oliveira brings to the Board the extensive buy-side and sell-side financial services experience, key leadership skills and sharp analytical skills he has developed through his executive leadership roles at JPMorgan Chase and Investment Audit Practice.
| | | | | | | | | | | | | | |
| | | | |
| Executive
Committee | Audit and Risk
Committee | Corporate Governance
Committee | Compensation and
Workplace Practices
Committee |
| Joan Lamm-Tennant | | | | |
Seth P. Bernstein | M | | M | |
| Jeffrey Hurd | | | | |
| Daniel Kaye | | | | M |
| Nick Lane | | | | |
| Das Narayandas | | | | |
| Mark Pearson | M | | M | M |
| | | | |
| Charles Stonehill | | | | |
| Todd Walthall | | M | M | |
Mr. Bernstein, age 59, was appointed President and Chief Executive Officer in April 2017 and began serving in this role on May 1, 2017. He also has served as Senior Executive Vice President and Head of Investment Management and Research of EQH since April 2018. Prior to these appointments, Mr. Bernstein had a distinguished 32-year career at JPMorgan Chase, most recently as managing director and global head of Managed Solutions and Strategy at J.P. Morgan Asset Management. In this role, Mr. Bernstein was responsible for the management of all discretionary assets within the Private Banking client segment. Among other roles, he served as Managing Director and Global Head of Fixed Income and Currency for 10 years, concluding in 2012. Prior to that, Mr. Bernstein held the position of Chief Financial Officer at JPMorgan Chase’s Investment Management and Private Banking division. Mr. Bernstein is a member of the Management Committee of EQH and the Board of Managers of Haverford College, Pennsylvania.Mr. Bernstein brings to the Board the diverse financial services experience he developed through his extensive service at JPMorgan Chase and more recent career at AB.
Paul L. Audet
Mr. Audet, age 67, was appointed a director of AB in November 2017. He is the Co-Founder and Managing Member of Symmetrical Ventures LLC, a venture capital firm organized in 2015 and specializing in capital investments in start-ups and development stage companies. The firm evaluates investment opportunities in enterprises that aim to transform traditional business models through disruptive technologies. Previously, Mr. Audet served as a senior managing director at BlackRock, retiring in 2014 after a 35-year career in the financial services industry. During his BlackRock tenure, he held a number of executive leadership roles, including Chief Financial Officer for nine years and head of the company’s U.S. active mutual funds, global real estate and global cash-management businesses. Mr. Audet’s affiliation with BlackRock started in 1994 when, as director of mergers and acquisitions for PNC Financial Services, he led the acquisition of BlackRock. He began his professional career in 1977 at PricewaterhouseCoopers and worked at PaineWebber and First Fidelity Bancorporation before moving on to BlackRock and PNC.
Mr. Audet brings to the Board the extensive financial services experience he has developed through his executive leadership roles at BlackRock.
Nella L. Domenici
Ms. Domenici, age 60, was appointed a director of AB in January 2020. She is currently Chief Financial Officer and member of the Executive Committee at Dataminr, a leading AI company that is late-stage venture backed. In her broad leadership role, which she began in 2020, Ms. Domenici is responsible for various strategic, operational and administrative functions. From 2015 to 2018, Ms. Domenici served as Chief Financial Officer and member of the Operating Committee at Bridgewater Associates, a hedge fund with more than $160 billion in AUM. Prior thereto, Ms. Domenici held various senior managerial, investment banking and strategic positions with firms including Citadel Investment Group, Credit Suisse and The Monitor Consulting Group. In addition, she is a proven entrepreneur, having founded a successful consulting firm that advised many family-owned, private equity, venture-backed and real estate companies.
Ms. Domenici is an active leader for charitable and public health causes. She co-founded the Excellent Schools of New Mexico, a non-profit organization that supports charter schools in underserved communities, and she serves on the board of Regis High School in New York City. Ms. Domenici is a member of the Bipartisan Policy Center Behavioral Health Integration Task Force, where she champions initiatives focused on mental illness. She also serves on the advisory board of the International Folk-Art Market, which focuses on economic opportunities for folk artists worldwide, particularly women in developing countries. Until 2020, Ms. Domenici had served on the board of One World Surgery, which provides access to quality surgical care globally.
Ms. Domenici brings to the Board her seasoned business acumen and her extensive global experience in strategic financial management, corporate strategy and operations.
Jeffrey J. Hurd
Mr. Hurd, age 54, was appointed a director of AB in April 2019. He has served as Senior Executive Vice President and Chief Operating Officer of EQH, and as a member of the EQH Management Committee, since 2018. In this role, Mr. Hurd has strategic oversight for EQH's Human Resources, Information Technology and Communications departments. He also is responsible for EQH's Transformation Office, which encompasses key functional areas, including operations, procurement and corporate real estate. Mr. Hurd also has served as Senior Executive Director and Chief Operating Officer of Equitable Financial since 2018.
| | | | | | | | | | | | | | |
| Female | Male | Non-Binary | Did Not Disclose Gender |
| Gender Diversity | | | | |
| Directors | 1 | 8 | — | | — | |
| Racial/Ethnic/Nationality/Other Forms of Diversity | | | | |
| African American/Black | — | | 1 | — | | — | |
| Alaskan Native/Native American | — | | — | | — | | — | |
| Asian/South Asian | — | | 1 | — | | — | |
| Hispanic/Latinx | — | | — | | — | | — | |
| Native Hawaiian/Pacific Islander | — | | — | | — | | — | |
| White/Caucasian | 1 | 6 | — | | — | |
| LGBTQ+ | — | | — | | — | | — | |
| Directors Born Outside of the US | — | | 3 | — | | — | |
| Did Not Disclose Demographics | — | | — | | — | | — | |
Prior to joining Equitable Financial, Mr. Hurd served as Executive Vice President and Chief Operating Officer at American International Group, Inc. ("AIG"), where he amassed deep financial services industry experience during his 20-year tenure. While at AIG, Mr. Hurd served as Chief Human Resources Officer, Chief Administrative Officer, Deputy General Counsel and Head of Asset Management Restructuring.
Mr. Hurd brings to the Board his extensive experience in financial services and strategic insights as a senior executive at EQH and, formerly, at AIG.
Daniel G. Kaye
Mr. Kaye, age 66, was appointed a director of AB in April 2017. He has been a director of EQH since May 2018 and a director of Equitable Financial and Equitable America since September 2015. Also, since May 2019, Mr. Kaye has been a director of CME Group, Inc. (NASDAQ: CME), where he serves as Chair of the Audit Committee. From January 2013 to May 2014, Mr. Kaye served as interim Chief Financial Officer and Treasurer of HealthEast Care System. He held this post after retiring in 2012 from a 35-year career at Ernst & Young LLP ("E&Y"), including 25 years as an audit partner. During his tenure at E&Y, Mr. Kaye served as the New England Area Managing Partner and the Midwest Area Managing Partner of Assurance. Mr. Kaye is a Certified Public Accountant and a National Association of Corporate Directors Board Leadership Fellow.
Mr. Kaye brings to the Board the extensive financial expertise he developed through his career at E&Y and his directorships at CME, EQH and certain of EQH's subsidiaries. | | | | | | | | | | | | | | | | | | | | |
| | | | | | |
| | | | | | |
Joan Lamm-Tennant Chair of the Board, Equitable Holdings Committees: Executive (Chair) Age: 71 Director Since: 2021 | | Seth Bernstein President and Chief Executive Officer, AllianceBernstein Committees: Executive Governance Age: 62 Director Since: 2017 | | Jeffrey Hurd Chief Operating Officer, Equitable Holdings Committees: None Age: 57 Director Since: 2019 | | Daniel Kaye Director, CME Group (NASDAQ: CME), and Equitable Holdings Committees: Compensation Age: 69 Director Since: 2017 |
| | | | | | |
| | | | | | |
| | | | | | |
Nick Lane President, Equitable Financial Life Insurance Company Committees: None Age: 50 Director Since: 2019 | | Das Narayandas Edsel Bryant Ford Professor of Business Administration, Harvard Business School Committees: Governance (Chair) Age: 63 Director Since: 2017 | | Mark Pearson President and Chief Executive Officer, Equitable Holdings Committees: Executive Governance Compensation Age: 65 Director Since: 2011 | | Charles Stonehill Founding Partner, Green & Blue Advisors; Director, Equitable Holdings Committees: Audit (Chair) Compensation (Chair) Age: 65 Director Since: 2019 |
| | | | | | |
| | | | | | |
| | | | | | |
Todd Walthall Chief Executive for Optum Insight (Payer Market), UnitedHealth Group Committees: Audit Corporate Governance Age: 53 Director Since: 2021 | | | | | | |
As of February 9, 2024, our directors are as follows:
| | | | | | | | | | | | | | |
| | | | |
| | | Background •Ms. Lamm-Tennant was appointed Chair of AB in October 2021. •She has served as Chair of the Board of EQH, Equitable Financial and Equitable America since October 2021, after having joined these boards in January 2020. •Ms. Lamm-Tennant founded Blue Marble Microinsurance and served as its CEO from 2015 to 2020. •She currently is executive advisor of Brewer Lane Ventures, having joined in 2021; she serves on the boards of Ambac Financial Group and Element Fleet Financial Corp; and she joined the board of Africa Specialty Risk in April 2023. •Previously, Ms. Lamm-Tennant was Adjunct Professor, International Business at The Wharton School of the University of Pennsylvania from 2005 to 2016. Prior to or concurrently with her service at The Wharton School, Ms. Lamm-Tennant held various senior positions in the insurance industry, including with Marsh & McLennan Companies, Guy Carpenter and General Reinsurance Corporation. Director Qualifications Ms. Lamm-Tennant brings to the Board significant industry and academic experience, having held global business leadership roles and developed a distinguished career as a professor of finance and economics. | |
| | | |
| Joan Lamm-Tennant Committees: Executive (Chair) Age: 71 Director Since: 2021 | | |
| | | | |
| | | | | | | | | | | | | | |
| | | | |
| | | Background •Mr. Lane, age 47,Bernstein was appointed President and Chief Executive Officer in April 2017 and began serving in this role on May 1, 2017. •He has served as Senior Executive Vice President and Head of Investment Management and Research of EQH since April 2018 and is a member of the Management Committee of EQH. •Previously, Mr. Bernstein had a distinguished 32-year career at JPMorgan Chase, most recently as Managing Director and Global Head of Managed Solutions and Strategy at J.P. Morgan Asset Management. In this role, Mr. Bernstein was responsible for the management of all discretionary assets within the Private Banking client segment. •Among other roles, he served as Managing Director and Global Head of Fixed Income and Currency for 10 years, concluding in 2012. •Mr. Bernstein held the position of Chief Financial Officer at JPMorgan Chase’s Investment Management and Private Banking division. •Mr. Bernstein is a member of the Investment Committee of the Board of Managers of Haverford College, Pennsylvania, a Board of Trustees member of the Brookings Institution and a member of the Council on Foreign Relations. Director Qualifications Mr. Bernstein brings to the Board the diverse financial services experience he developed through his extensive service at JPMorgan Chase and more recent career at AB. | |
| | | |
| Seth Bernstein Committees: Executive, Governance Age: 62 Director Since: 2017 | | |
| | | | |
| | | | | | | | | | | | | | |
| | | | |
| | | Background •Mr. Hurd was appointed a director of AB in April 2019. •He has served as SeniorChief Operating Officer of EQH, and as a member of the EQH Management Committee, since 2018. •In this role, Mr. Hurd has strategic oversight for EQH’s Human Resources, Information Technology, Insurance Operations and Communications departments. •He also is responsible for other key functional areas, including procurement and corporate real estate. •Mr. Hurd also has served as Chief Operating Officer of Equitable Financial since 2018. •Prior to joining Equitable, Mr. Hurd served as Executive Vice President and Chief Operating Officer at American International Group, Inc. (“AIG”), where he amassed deep financial services industry experience during his 20-year tenure. While at AIG, Mr. Hurd served as Chief Human Resources Officer, Chief Administrative Officer, Deputy General Counsel and Head of Asset Management Restructuring. •Mr. Hurd joined the board of the Thurgood Marshall College Fund in May 2023. Director Qualifications Mr. Hurd brings to the Board his extensive experience in financial services and strategic insights as a senior executive at EQH and, formerly, at AIG. | |
| | | |
| Jeffrey Hurd Committees: None Age: 57 Director Since: 2019 | | |
| | | | |
| | | | | | | | | | | | | | |
| | | | |
| | | Background •Mr. Kaye was appointed a director of AB in April 2017. •He has been a director of EQH since May 2018 and a director of Equitable Financial and Equitable America since September 2015. •Also, since May 2019, Mr. Kaye has been a director of CME Group, Inc. (NASDAQ: CME), where he serves as Chair of the Audit Committee and serves on the Executive and Risk Committees. •From January 2013 to May 2014, Mr. Kaye served as interim Chief Financial Officer and Treasurer of HealthEast Care System. He held this post after retiring in 2012 from his career at Ernst & Young LLP (“E&Y”). •He served for 35 years at E&Y, including 25 years as an audit partner. •During his tenure at E&Y, Mr. Kaye served as the New England Area Managing Partner and the Midwest Area Managing Partner of Assurance. •Mr. Kaye is a Certified Public Accountant and a National Association of Corporate Directors Board Leadership Fellow. Director Qualifications Mr. Kaye brings to the Board the extensive financial and regulatory expertise he developed through his career at E&Y and his directorships at CME, EQH and certain of EQH’s subsidiaries. | |
| | | |
| Daniel Kaye Committees: Compensation Age: 69 Director Since: 2017 | | |
| | | | |
| | | | | | | | | | | | | | |
| | | | |
| | | Background •Mr. Lane was appointed a director of AB in April 2019. •He has served as Head of Retirement, Wealth Management & Protection Solutions of EQH, and as a member of the EQH Management Committee, since May 2018. •Also, since February 2019, Mr. Lane has served as President of Equitable Financial, leading that company'scompany’s Retirement, Wealth Management & Protection Solutions businesses and also leading its Marketing and Digital functions. •Mr. Lane held various leadership roles with AXA and Equitable Financial since joining Equitable Financial (then a subsidiary of AXA) in 2005 as Senior Vice President of the Strategic Initiatives Group. •He has served as President and CEO of AXA Japan, Senior Executive Director at Equitable Financial with responsibilities across commercial divisions, and Head of AXA Global Strategy overseeing AXA'sAXA’s five-year strategic plan across 60 countries. •Prior to joining Equitable Financial, Mr. Lane was a consultant for McKinsey & Company and a Captain in the United States Marine Corps. •Mr. Lane joined the board of the American Counsel of Life Insurers ("ACLI") in September 2023. Director Qualifications Mr. Lane brings to the Board the outstanding experience and leadership qualities he has developed in various senior roles at AXA S.A., EQH and various subsidiaries, and as an officer in the United States Marine Corps. | |
| | | |
| Kristi A. Matus
Ms. Matus, age 53, was appointed a director of AB in July 2019. She has been a director and member of various board committees at EQH and Equitable America since March 2019 and at Equitable Financial since September 2015. Ms. Matus joined Buckle, a tech-enabled financial services company, as Chief Financial Officer and Chief Operating Officer in October 2020 and has served as director and Audit Committee Chair of Cerence, Inc., a leading provider of automotive technology, since October 2019. Formerly, Ms. Matus had been Chair of the Compensation Committee at Tru Optik Data Corp., a digital media intelligence company, from September 2016 to October 2020, an executive advisor to Thomas H. Lee Partners L.P., a private equity firm, from October 2017 to October 2020, and a director and the Audit Committee Chair at Nextech Systems, a provider of healthcare technology solutions, from June 2019 to October 2020.Nick Lane
Ms. Matus served as Executive Vice President and Chief Financial & Administrative Officer at athenahealth, Inc. ("aAge: thena") from July 2014 to May 2016. Before joining athena, Ms. Matus served as Executive Vice President of Governance Services at Aetna, Inc. from February 2012 to July 2013. Previously, she held several leadership roles at United Services Automobile Association and USAA.50
| | |
| | | | |
Ms. Matus brings to the Board her extensive experience in finance, risk management, compliance and audit functions, investor relations, human capital, real estate and IT, gained through her leadership roles at technology, healthcare and insurance companies. | | | | | | | | | | | | | | |
| | | | |
| | | Background
Das Narayandas
Mr. Narayandas age 60, was appointed a director of AB in November 2017. •He is the Edsel Bryant Ford Professor of Business Administration at Harvard Business School ("HBS"(“HBS”), where he has been a faculty member since 1994. •Mr. Narayandas also currently serves as the Senior Associate Dean and Chairman of Harvard Business School Publishing, and as the Senior Associate Dean of HBS External Relations. •He previously served as the senior associate dean of HBS Executive Education, and as chair of the HBS Executive Education Advanced Management Program and the Program for Leadership Development, as
well as course head of the required first-year marketing course in the MBA program. •Mr. Narayandas has received the award for teaching excellence from the graduating HBS MBA class on several occasions. Other awards he has received include the Robert F. Greenhill Award for Outstanding Service to the HBS Community, the Charles M. Williams Award for Excellence in Teaching and the Apgar Award for Innovation in Teaching. •His scholarship has focused on market-facing issues in traditional business-to-business marketing and professional service firms, including client management strategies, delivering service excellence, product-line management and channel design.
Mr. Narayandas brings to the Board his wealth of experience at the highest level of academia in the U.S. | |
| | | |
| Mark PearsonDas Narayandas
Committees: Governance (Chair) Age: 63 Director Since: 2017 | | |
| | | | |
| | | | | | | | | | | | | | |
| | | | |
| | | Background •Mr. Pearson age 62, was appointed a director of AB in February 2011. •He has served as director and as President and CEOChief Executive Officer of EQH since May 2018. •Mr. Pearson also serves as a member of EQH'sEQH’s Management Committee. •Additionally, Mr. Pearson serves as CEO of Equitable Financial and Equitable America, and he has been a director of both companies since 2011.
Mr. Pearson joined AXA S.A. in 1995 when AXAit acquired National Mutual Funds Management Limited (presently AXA Asia Pacific Holdings Limited) and was appointed Regional Chief Executive of AXA Asia Life in 2001. •From 2008 to 2011, Mr. Pearson was President and Chief Executive Officer of AXA Japan Holding Co., Ltd. (“AXA Japan”). •AXA Japan”). Prior to joining AXA S.A., Mr. Pearson spent approximately 20 years in the insurance sector, holding several senior management positions at Hill Samuel, Schroders, National Mutual Holdings and Friends Provident. •Mr. Pearson is a Fellow of the Chartered Public Association of Certified Public Accountants and is a director of the American Council of Life Insurers.Accountants.
Mr. Pearson brings to the Board the diverse financial services experience he has developed through his service as an executive, including as Chief Executive Officer, with EQH, AXA Japan and other affiliates of AXA affiliates.S.A. | |
| | | |
| Mark Pearson
Bertram L. Scott
Mr. Scott, age 69, was appointed a director of AB in September 2020. He has been a director and member of various board committees of EQH, Equitable America and Equitable Financial since March 2019. He had previously served as director of Equitable America and Equitable Financial from May 2012 to May 2018. Mr. Scott is currently the 2019-21 Chairman of the Board of the American Heart Association. Mr. Scott retired in May 2019 as Senior Vice President of Population Health Management of Novant Health, Inc. after having served since February 2015. From October 2012 to November 2015, Mr. Scott served as President and Chief Executive Officer at Affinity Health Plan. Prior to joining Affinity, he served as President, U.S. Commercial of CIGNA Corporation from June 2010 to December 2011. Prior to joining CIGNA, Mr. Scott was Executive Vice President and Chief Institutional Development & Sales Officer at TIAA-CREF; he had joined TIAA-CREF in 2000.Age: 65
| | |
| | | | |
Mr. Scott is a director and Audit Committee Chair at Becton, Dickinson and Company (NYSE: BDX), a director and Audit Committee Chair at Lowe's Companies, Inc. (NYSE: LOW) and a director of Tufts Health Plan. | | | | | | | | | | | | | | |
| | | | |
| | | Background
Mr. Scott brings to the Board his audit committee financial expertise and strong strategic and operational experience developed through a variety of executive roles at insurance and financial services companies as well as his service on the boards of other U.S. public companies.
Charles G.T. Stonehill
Mr. Stonehill age 62, was appointed a director of AB in April 2019. •He has been a director and member of various board committees at EQH and Equitable America since March 2019, and at Equitable Financial since November 2017. In January 2021, •Mr. Stonehill has served as a member of the supervisory board of Deutsche Boerse AG, a capital market infrastructure provider, since 2019. Additionally, Mr. Stonehill joined the board of Constellation Acquisition Corp I, a blank check company that targets disruptive innovation across various segments of the global economy. Strangeworks, Inc. in October 2023. •In addition, Mr. Stonehill is the Founding Partner of Green & Blue Advisors LLC, having started this advisory firm that provides financial advice to clean-tech and other environmentally-minded companies in 2011. •He also has served as director and member of the supervisory board of Deutsche Boerse AG,formerly was a capital market company, since 2019, director of Play Magnus AS, a chess app company, sincefrom 2016 to 2021, and non-executive vice chairman of Julius Baer Group Ltd., a global private banking company based in Switzerland, since 2009.from 2009 to 2021.
Mr. Stonehill has over 30 years' experience in energy markets, investment banking and capital markets, including leadership positions at Lazard Freres & Co. LLC, Credit Suisse and Morgan Stanley & Co. •He also served as Chief Financial Officer at Better Place Inc., an electric vehicle start-up, from 2009 to 2011, where he oversaw global financial strategy and capital raising.
Mr. Stonehill brings to the Board his extensive expertise and distinguished track record in the financial services industry and over 30 years' experience in energy markets, investment banking and capital markets. | |
| | | |
| Charles Stonehill
| | |
| | | | |
Executive Officers (other than Mr. Bernstein)
| | | | | | | | | | | | | | |
| | | | |
| | | Background
Kate C. Burke, COO
Ms. Burke, age 49,Mr. Walthall was appointed a director of AB in September 2021.
•He is a senior executive with United Health Group, an American multinational managed healthcare and insurance company, currently serving as our firm's Chief OperatingExecutive Officer in July 2020 after having been appointed Chief Administrative Officer in May 2019. of Clinical Solutions for Optum Insight; formerly as Executive Vice President of Enterprise Growth. •Previously, shehe served as Head of Human Capital and Chief Talent Officer from February 2016 to May 2019. Ms. Burke joined our firm in 2004 as an institutional equity salesperson with Bernstein Research Services and has held various managerial roles since that time. Prior to joining AB, Ms. Burke was a consultant at A.T. Kearney, where she focused on strategy, organizational design and change management.
Laurence E. Cranch, Chief Legal Officer
Mr. Cranch, age 74, has been our Chief Legal Officer (formerly known as General Counsel) since he joined our firm in 2004. Prior to joining AB, Mr. Cranch was a Partner of Clifford Chance, an international law firm. Mr. Cranch joined Clifford Chance in 2000 when Rogers & Wells, a New York law firm of which he was Managing Partner, merged with Clifford Chance.
Ali Dibadj, Head of Finance and Strategy
Mr. Dibadj, age 45, was appointed Head of Finance (and later CFO-designate) and Head of Strategy in April 2020. He co-led the firm's Strategy Committee in 2019, was designated a portfolio manager focusing on improving operations, ESG and capital allocation of companies in 2017, and served as a senior research analyst from 2006 to 2020. During Mr. Dibadj's time as a senior research analyst, he was ranked #1 on 12 occasions and was inducted into the Institutional Investor Hall of Fame. Prior to joining AB, Mr. Dibadj spent approximately a decade consulting with McKinsey & Company and Mercer on topics including strategy, M&A, efficiency and governance. He also worked at Skadden Arps, a global law firm.
John C. Weisenseel, CFO (outgoing)
Mr. Weisenseel, age 61, joined our firm in May 2012 as SeniorExecutive Vice President and Chief Financial Officer. He will retire from AB in September 2021 after transitioning his responsibilities for FinanceOperating Officer at Blue Shield of California.
•Prior to Mr. Dibadj and his responsibilities for administrative services to Ms. Burke in February 2021. From 2004 to April 2012, Mr. Weisenseel worked at The McGraw Hill Companies (“McGraw Hill”), whereBlue Shield, he served initially as Senior Vice President and Corporate Treasurer and, from 2007General Manager of Digital Service Integration at American Express. Before joining AMEX, Mr. Walthall held numerous senior roles with USAA Insurance, having contributed to April 2012, as Chief Financial Officerthe development of the firm’s Standard & Poor’s subsidiary. Prior to joining McGraw Hill, Mr. Weisenseel was Vice President and Corporate Treasurer for Barnes & Noble, Inc. Prior to joining Barnes & Noble, he spent ten years in various derivatives trading and financial positions at Citigroup. A Certified Public Accountant, Mr. Weisenseel also has worked at KPMG LLP.industry's first mobile check-deposit service.
•Mr. Walthall serves on the Executive Leadership Council, a professional organization, and is on the Board of Trustees of Coaching Corps. Director Qualifications Mr. Walthall brings over two decades of leadership experience with growth strategy, operations, product development, and customer service and retention programs through his extensive experience in numerous leadership roles throughout his career. | |
| | | |
| Todd Walthall Committees: Audit, Governance Age: 53 Director Since: 2021 | | |
| | | | |
Executive Officers (other than Mr. Bernstein)
Bill Siemers,Interim CFO
Mr. Siemers, age 63, was appointed as Interim Chief Financial Officer in June 2023. Mr. Siemers joined the firm in 2004 as Director of Financial Reporting. He briefly assumed the position of Interim Chief Financial Officer in March 2022, serving in that capacity until July 2022 when he relinquished the CFO title until he was re-appointed in June 2023. Prior to joining AB, Mr. Siemers held various finance positions at Altria and as an auditor at Deloitte.
Karl Sprules,COO
Mr. Sprules, age 50, was appointed Chief Operating Officer in June 2023, formerly Head of Global Technology & Operations since 2019. In his role as COO, Mr. Sprules oversee's the firm's Global Technology and Operations, Real Estate, Legal & Compliance, Diversity, Equity & Inclusion and Corporate Citizenship, Audit and Risk. He joined AB's technology department in 1998 as a senior systems engineer in the firm's London office. From 2012 to 2020, Mr. Sprules served as AB's chief technology officer, and since 2018 he has led the relocation of AB's Technology & Operations department to the firm's new Nashville headquarters. In 2012, Mr. Sprules became head of Infrastructure Services for Equities, managing investment operations, operational risk and technology teams. From 2005 to 2012, Mr. Sprules led technology for AB's Private Wealth, Institutional and Client groups. Before joining AB, Mr. Sprules held research analyst positions in cellular and defense product development.
Onur Erzan,Head of Global Client Group and Private Wealth
Mr. Erzan, age 48, joined our firm in 2021 as Head of Global Client Group and was named Head of Private Wealth in July 2022. In this role, he oversees AB's entire private wealth management business and third-party institutional and retail franchise, where he is responsible for all client services, sales and marketing, as well as product strategy, management and development worldwide. Prior to joining AB, Mr. Erzan spent over 19 years with McKinsey, most recently as a senior partner and co-leader of its Wealth & Asset Management practice. In addition, Mr. Erzan co-led McKinsey's Banking & Securities Solutions (a portfolio of data, analytics and digital assets and capabilities) globally. He has been active in nonprofit organizations for the last several years and has served on the boards of Graham Windham and Turkish Philanthropy Funds.
Mark Manley,General Counsel and Corporate Secretary
Mr. Manley, age 61, joined the firm in 1984 and currently serves as Senior Vice President, General Counsel and Corporate Secretary. He served as Deputy General Counsel from June 2004 to December 2021 and served as the firm’s Global Head of Compliance from 1988 until November 2023. He chairs AB’s Code of Ethics Oversight Committee and is a member of AB’s Internal Compliance Controls Committee and nearly all of the firm’s senior operating, risk and compliance committees.
Chris Hogbin,Global Head of Investments
Mr. Hogbin, age 50, was appointed Global Head of Investments in January 2024. In this broad leadership role, he oversees all the firm’s investment activities with responsibility for driving investment success across asset classes, fostering collaboration and sharing best practices across investment teams, as well as leveraging a common infrastructure and evaluating opportunities to invest in capabilities that deliver better outcomes for clients. Mr. Hogbin joined AB’s institutional research business in 2005 as a senior analyst covering the European food retail sector, was named to Institutional Investor’s All-Europe Research Team and was ranked as the #1 analyst in his sector. He became European director of research for the Sell Side in 2012 and was given additional responsibility for Asian research in 2016. In 2018, he was appointed COO of Equities for AB. In 2019, Mr. Hogbin was promoted to co-head of Equities, becoming head of Equities in 2020. Prior to joining the firm, he worked as a strategy consultant for the Boston Consulting Group. He is chair of the Caius Foundation and is involved in several nonprofit organizations.
Cathy Spencer,Chief People Officer
Ms. Spencer, age 57, is the Chief People Officer for AB, and leads the teams responsible for advancing the employee experience for all of AB's people. Ms. Spencer’s responsibilities include oversight of the following functions, including benefits, compensation, employee relations, culture, learning and engagement, talent acquisition and management, and onsite excellence. Ms. Spencer’s responsibilities extend throughout the firm's global footprint, serving more than 4,000 staff members. Since 2018 she has overseen the transition of US staff to the firm's new Nashville headquarters as well as the recruiting and onboarding of local hires. Ms. Spencer joined AB in 1997 and has held a variety of roles, from overseeing talent and organizational development to managing employee relations, both globally. She was promoted to senior vice president in 2008, when she assumed the role of Head of Human Resources, a position she held for 10 years.
Kate Burke,Former COO and CFO
Ms. Burke, age 52, resigned as our firm's COO and CFO effective May 31, 2023. She had been appointed Chief Financial Officer in July 2022 while retaining her role as Chief Operating Officer, which she became in July 2020. Ms. Burke served as Head of our firm's Private Wealth channel from February 2021 to June 2022; she was appointed Chief Administrative Officer in May 2019. Previously, she served as Head of Human Capital and Chief Talent Officer from February 2016 to May 2019. Ms. Burke joined our firm in 2004 as an institutional equity salesperson with Bernstein Research Services and has held various managerial roles since that time.
Changes in Directors and Executive Officers
The following changes in our directors and executive officers occurred since we filed our Form 10-K for the year ended December 31, 2019:
Directors
•Mr. Scott joinedNella Domenici departed the Board, effective September 23, 2020.
Executive Officers
•Ms. Burke was appointed Chief Operating Officer,resigned as COO and CFO effective July 1, 2020;
•James M. Gingrich retired as Chief Operating Officer, effective June 30, 2020; andMay 31, 2023.
•Mr. DibadjSiemers was appointed as Interim CFO effective June 1, 2023.
•Mr. Sprules was appointed COO effective June 1, 2023.
•Mr. Hogbin was appointed as Global Head of Finance (and later CFO-designate) and Head of Strategy in April 2020.Investments effective January 1, 2024, a newly created position as an executive officer.
Board Meetings
In 2020,2023, the Board held regular meetings in February, May, September and November. In addition, the Board convened a special meeting in March 2020.
The Board has established a calendar consisting of four regular meetings, which typically are held in February, May, September and November. In addition, the Board holds special meetings or takes action by unanimous written consent as circumstances warrant. The Board has standing Executive, Audit and Risk, Compensation and Workplace Practices, and Governance Committees, each of which is is described in further detail below. Each member of the Board attended 75% or more of the aggregate of all Board and committee meetings that he or she was entitled to attend in 2020.
Committees of the Board
The Executive Committee of the Board (“Executive Committee”) consists of Messrs. de Oliveira (Chair), Bernstein and Pearson.
The Executive Committee exercises all of the powers and authority of the Board (with limited exceptions) when the Board is not in session, or when it is impractical to assemble the full Board. Typically, the Executive Committee determines quarterly unitholder distributions, as applicable. The Executive Committee held four meetings in 2020.
The Audit and Risk Committee of the Board (“Audit Committee”) consists of Mr. Stonehill (Chair), Mr. Audet and Ms. Domenici. The primary purposes of the Audit Committee are to: | | | | | | | | | | | |
| | | |
| | Responsibilities: •Exercises all of the powers and authority of the Board (with limited exceptions) when the Board is not in session, or when it is impractical to assemble the full Board. •Typically, determines quarterly unitholder distributions, as applicable. | |
| Executive Committee Committee Members: Joan Lamm-Tennant (Chair) Seth Bernstein Mark Pearson Meetings in 2023: 4 | |
| | | |
| | | | | | | | | | | |
| | | |
| | Responsibilities: • | assistAssist the Board in its oversight of: |
| • | the integrity of the financial statements of the Partnerships; |
| • | the effectiveness of the Partnerships' internal control over financial reporting and the Partnerships' risk management framework and risk mitigation processes; |
| • | the Partnerships’ status and system of compliance with legal and regulatory requirements and business conduct; |
| • | the independent registered public accounting firm’s qualification and independence; and |
| • | the performance of the Partnerships’ internal audit function; andfunction. |
| | |
• | overseeOversee the appointment, retention, compensation, evaluation and termination of the Partnerships’ independent registered public accounting firm.•Oversee management’s development of a comprehensive set of metrics for evaluating the firm’s ESG objectives and monitor management’s progress in pursing those objectives. •Encourages continuous improvement of, and fosters adherence to, the Partnerships’ policies, procedures and practices at all levels. •Provides an open avenue of communication among the independent registered public accounting firm, senior management, the Internal Audit Department, the Global Head of Compliance, the Chief Risk Officer and the Board. | |
| Audit and Risk Committee Committee Members: Charles Stonehill (Chair)
Todd Walthall Meetings in 2023: 8 | |
| | | |
Consistent with these functions, the Audit Committee encourages continuous improvement of, and fosters adherence to, the Partnerships’ policies, procedures and practices at all levels. With respect to these matters, the Audit Committee provides an open avenue of communication among the independent registered public accounting firm, senior management, the Internal Audit Department, the Chief Compliance Officer, the Chief Risk Officer and the Board. The Audit Committee held eight regular meetings in 2020.
The Compensation and Workplace Practices Committee ("Compensation Committee") consists of Ms. Matus (Chair) and Messrs. Audet, de Oliveira, Kaye, Scott and Pearson. The Compensation Committee held four regular meetings in 2020. For additional information about the Compensation Committee, see “Compensation Discussion and Analysis—Compensation Committee; Process for Determining Executive Compensation” in Item 11.
Also, the Compensation Committee has established the Section 16 Subcommittee to ensure we can utilize the short-swing trading exemption set forth in Section 16b-3 under the Exchange Act. Under this exemption, equity grants to our firm's executive officers are exempt from short-swing trading rules if each such grant is approved by the full Board or a committee of the Board consisting entirely of “non-employee” directors (generally, directors who are not officers of the company or an affiliate). The Section 16 Subcommittee consists of Ms. Matus (Chair) and Messrs. Audet, de Oliveira, Kaye and Scott.
The Governance Committee consists of Ms. Matus (Chair) and Messrs. Bernstein, Narayandas and Pearson. The Governance Committee:
| | | | | | | | | | | |
| | | |
| | Responsibilities: • | assistsAssists the Board and the sole stockholder of the General Partner in: |
| • | identifying and evaluating qualified individuals to become Board members; and |
| • | determining the composition of the Board and its committees, andcommittees. |
| | |
• | assistsAssists the Board in: |
| • | developing and monitoring a process to assess Board effectiveness; |
| • | developing and implementing our Corporate Governance Guidelines; and |
| • | reviewing our policies and programs that relate to matters of corporate responsibility of the General Partner and the Partnerships. | |
| Governance Committee Committee Members: Das Narayandas (Chair) Seth Bernstein Mark Pearson Todd Walthall Meetings in 2023: 1 | |
| | | |
The Governance Committee held one meeting in 2020.
| | | | | | | | | | | |
| | | |
| | For a discussion of the Compensation Committee's responsibilities, please see “Compensation Discussion and Analysis - Compensation Committee; Process for Determining Executive Compensation” in Item 11. | |
| Compensation and Workplace Practices Committee Committee Members: Charles Stonehill(Chair) Daniel Kaye Mark Pearson Meetings in 2023: 5 | |
| | | |
The functions of each of the Board committees discussed above are more fully described in each committee’s charter. The charters are available onin the "Responsibility - Corporate Governance" section of our Internet Site.
Mses. Domenici and Lamm-Tennant and Messrs. Kaye, Narayandas, Stonehill and Walthall is independent. The Board determined, at its February 2023 regular meeting, that each of these directors is independent (each an "Independent Director") within the meaning of the relevant rules. Audit Committee Financial Experts; Financial Literacy
Audit Committee Financial Expertise
In February 2020,2023, the Governance Committee, after reviewing materials prepared by management, recommended that the Board determine that each of Ms.Mses. Domenici and Lamm-Tennant and Messrs. AudetKaye and Stonehill is an “audit committee financial expert” within the meaning of Item 407(d) of Regulation S-K. The Board so determined at its regular meeting held in February 2020.
Financial Literacy
In February 2020,2023, the Governance Committee, after reviewing materials prepared by management, recommended that the Board determine that Ms. Domenici, Mr. Audet and Mr. Stonehill each Independent Director is financially literate and possesses accounting or related financial management expertise, as contemplated by Section 303A.07(a) of the NYSE Listed Company Manual (“Financially Literate”). The Board so determined at its regular meeting held in February 2020.2023.
In September 2020, the Governance Committee, after reviewing materials prepared by management, recommended that the Board determine that Mr. Scott is Financially Literate. The Board so determined at its regular meeting held in September 2020.Part III
Independence of Certain Directors
In February 2020, the Governance Committee, after reviewing material prepared by management, recommended that the Board determine that each of Mses. Domenici and Matus and Messrs. Audet, de Oliveira, Kaye, Narayandas and Stonehill is independent. The Board determined, at its February 2020 regular meeting, that each of these directors is independent within the meaning of the relevant rules.
In September 2020, the Governance Committee, after reviewing material prepared by management, recommended that the Board determine that Mr. Scott is independent. The Board determined, at its September 2020 regular meeting, that Mr. Scott is independent within the meaning of the relevant rules.
Board Leadership Structure and Role in Risk Oversight
Leadership
The Board, together with the Governance Committee, is responsible for reviewing the Board’s leadership structure. In determining the appropriate individuals to serve as our ChairmanChair and our CEO, the Board and the Governance Committee consider, among other things, the composition of the Board, our company’s strong corporate governance practices, and the challenges and opportunities specific to AB.
Contacting our Board
Interested parties wishing to communicate directly with our ChairmanChair or the other members of our Board may send an e-mail, with “confidential” in the subject line, to our Corporate Secretary or address mail to Mr. de OliveiraMs. Lamm-Tennant in care of our Corporate Secretary. Our Corporate Secretary will promptly forward such e-mail or mail to Mr. de Oliveira.Ms. Lamm-Tennant. We have posted this information in the “Corporate Responsibility“Responsibility - Corporate Governance” section of our Internet Site.
Risk Oversight
| | | | | | | | |
| Board of Directors | |
| |
| | |
| The Board, together with the Audit Committee, has oversight for our company’s risk management framework, which includes investment risk, credit and counterparty risk, and operational risk (includes legal/regulatory risk, cyber security risk and climate risk), and is responsible for helping to ensure that these risks are managed in a sound manner. |
| | |
The Board, together with the Audit Committee, has oversight for our company’s risk management framework, which includes investment risk, credit and counterparty risk, and operational risk (includes legal/regulatory risk, cyber security risk and climate risk), and is responsible for helping to ensure that these risks are managed in a sound manner. The Board has delegated to the Audit Committee, which consists entirely of independent directors, the responsibility to consider our company’s policies and practices with respect to investment, credit and counterparty, and operational risk assessment and risk management, including discussing with management the major financial, operational and reputational risk exposures and the steps taken to monitor and control such exposures. Members of the company's risk management team (including our Chief Information Security Officer), who are responsible for identifying, managing and controlling the array of risks inherent in our company’s business and operations, make quarterly reports to the Audit Committee, which address investment, credit and counterparty, and operational risk identification, assessment and monitoring. The Chief Risk Officer makes quarterly presentations to the Audit Committee and has reporting lines to the CEO and the Audit Committee. | | | | | | | | |
| q | |
| Audit Committee | |
| |
| | |
| The Board has delegated to the Audit Committee, which consists entirely of independent directors, the responsibility to consider our company’s policies and practices with respect to investment, credit and counterparty, and operational risk assessment and risk management, including discussing with management the major financial, operational and reputational risk exposures and the steps taken to monitor and control such exposures. |
| | |
| | | | | | | | | | | | | | | | | | | | |
| | | | | p | |
| Risk Management Team | | | | Chief Risk Officer | |
| | | | |
| | | | | | |
| Members of the company's risk management team (including our Chief Security Officer), who are responsible for identifying, managing and controlling the array of risks inherent in our company’s business and operations, make quarterly reports to the Audit Committee, which address investment, credit and counterparty, and operational risk identification, assessment and monitoring. | u | The Chief Risk Officer makes quarterly presentations to the Audit Committee and has reporting lines to the CEO and the Audit Committee. |
| | | | | | |
The Board has determined that its leadership and risk oversight are appropriate for our company. Mr. Bernstein’s in-depth knowledge of financial services and extensive executive experience in the investment management industry make him suitedwell-suited to serve as our President and CEO, while Mr. de Oliveira’sMs. Lamm-Tennant’s in-depth knowledge of investment management, investment bankingindustry and insurance have provedacademic experience are invaluable at enhancing the overall functioning of the Board. The Board believes that the combination of a separate ChairmanChair and CEO, the Audit Committee, a specialized risk management team and significant involvement from our largest Unitholder (EQH) provide the appropriate leadership to help ensure effective risk oversight.
Code of Ethics and Related Policies
Our directors, officers and employees are subject to our Code of Business Conduct and Ethics.Ethics (the "Code of Ethics"). The codeCode of Ethics is intended to comply with Section 303A.10 of the NYSE Listed Company Manual, Rule 204A-1 under the Investment Advisers Act and Rule 17j-1 under the Investment Company Act, as well as with recommendations issued by the Investment Company Institute regarding, among other things, practices and standards with respect to securities transactions of investment professionals. The Code of Business Conduct and Ethics establishes certain guiding principles for all of our employees, including sensitivity to our fiduciary obligations and ensuring that we meet those obligations. In addition, the Code of Ethics, together with our firm's insider trading policy, restricts employees from trading when in possession of material non-public information of any kind, which can include the existence of a significant cybersecurity incident at our firm. Our Code of Business Conduct and Ethics may be found in the “Corporate Responsibility“Responsibility - Corporate Governance” section of our Internet Site.
We have adopted a Code of Ethics for the CEO and Senior Financial Officers, which is intended to comply with Section 406 of the Sarbanes-Oxley Act of 2002 (“(the “Item 406 Code”). The Item 406 Code which may be found in the “Corporate Responsibility“Responsibility - Corporate Governance” section of our Internet Site, was adopted in October 2004 by the Executive Committee.Site. We intend to satisfy the disclosure requirements under Item 5.05 of Form 8-K regarding certain amendments to, or waivers from, provisions of the Item 406 Code that apply to the CEO, the CFO and the Chief Accounting Officer by posting such information on our Internet Site. To date, there have been no such amendments or waivers.
NYSE Governance Matters
Section 303A.00 of the NYSE Listed Company Manual exempts limited partnerships from compliance with the following sections of the Manual, some of which we comply with voluntarily: Section 303A.01 (board must have a majority of independent directors), 303A.04 (corporate governance committee must have only independent directors as its members and must have a charter that addresses, among other things, the committee’s purpose and responsibilities), and 303A.05 (compensation committee must have only independent directors as its members and must have a charter that addresses, among other things, the committee’s purpose and responsibilities).
AB Holding is a limited partnership (as is AB). In addition, because the General Partner is a wholly owned subsidiary of EQH, and the General Partner controls AB Holding (and AB), we believe we also would qualify for the “controlled company” exemption. However, we comply voluntarily with the charter requirements set forth in Sections 303A.04 and 303A.05.
Our Corporate Governance Guidelines (“(the “GuidelinesGuidelines””) promote the effective functioning of the Board and its committees, promote the interests of the Partnerships’ respective Unitholders (with appropriate regard to the Board’s duties to the sole stockholder of the General Partner), and set forth a common set of expectations as to how the Board, its various committees, individual directors and management should perform their functions. The Guidelines may be found in the “Corporate Responsibility“Responsibility - Corporate Governance” section of our Internet Site.
The Governance Committee is responsible for considering any request for a waiver under the Code of Business Conduct and Ethics, the Item 406 Code and the EQH Policy Statement on Ethics from any director or executive officer of the General Partner. No such waiver has been granted to date and, if a waiver is granted in the future, such waiver would be described in the “Corporate Responsibility“Responsibility - Corporate Governance” section of our Internet Site.
We include in the “Corporate Responsibility“Responsibility - Corporate Governance,” section of our Internet site an e-mail address for any interested party, including Unitholders, to communicate with the Board. Our Corporate Secretary reviews e-mails sent to that address and has some discretion in determining how or whether to respond, and in determining to whom such e-mails should be forwarded. In our experience, substantially all of the e-mails received are ordinary client requests for administrative assistance that are best addressed by management, or solicitations of various kinds.
Certifications by our CEO and CFO pursuant to Section 302 of the Sarbanes-Oxley Act of 2002 have been furnished as exhibits to this Form 10-K.
AB Holding Unitholders and AB Unitholders may request a copy of any committee charter, the Guidelines, the Code of Business Conduct and Ethics, and the Item 406 Code by contacting our Corporate Secretary. The charters and memberships of the Executive, Audit, Governance and Compensation Committees may be found in the “Corporate Responsibility“Responsibility - Corporate Governance” section of our Internet Site.
Fiduciary Culture
We maintain a robust fiduciary culture and, as a fiduciary, we place the interests of our clients first and foremost. We are committed to the fair and equitable treatment of all our clients, and to compliance with all applicable rules and regulations and internal policies to which our business is subject. We pursue these goals through education of our employees to promote awareness of our fiduciary obligations, incentives that align employees’ interests with those of our clients, and a range of measures, including active monitoring, to ensure regulatory compliance. Our compliance framework includes:
| | | | | |
| •the Code of Ethics Oversight Committee (the “Ethics Committee”) and the Internal Compliance Controls Committee (the “Compliance Committee”), each of which consists of our executive officers and other senior executives; •an ombudsman office, where employees and others can voice concerns on a confidential basis; •firm-wide compliance and ethics training programs; and • | the Code of Ethics Oversight Committee (“Ethics Committee”) and the Internal Compliance Controls Committee (“Compliance Committee”), each of which consists of our executive officers and other senior executives;
|
• | an ombudsman office, where employees and others can voice concerns on a confidential basis; |
• | firm-wide compliance and ethics training programs; and |
• | a Conflicts Officer and a Conflicts Committee, which help to identify and mitigate conflicts of interest. |
The Ethics Committee oversees all matters relating to issues arising under our Code of Business Conduct and Ethics and meets on a quarterly basis and at such other times as circumstances warrant. The Ethics Committee and its subcommittee, the Personal Trading Subcommittee, have oversight of personal trading by our employees.
The Compliance Committee reviews compliance issues throughout our firm, endeavors to develop solutions to those issues as they may arise from time to time and oversees implementation of those solutions. The Compliance Committee meets on a quarterly basis and at such other times as circumstances warrant.
Section 16(a) Beneficial Ownership Reporting Compliance
Section 16(a) of the Exchange Act requires directors of the General Partner and executive officers of the Partnerships, and persons who own more than 10% of the AB Holding Units or AB Units, to file with the SEC initial reports of ownership and reports of changes in ownership of AB Holding Units or AB Units. To the best of our knowledge, during 2020, we complied with all Section 16(a) filing requirements. Our Section 16 filings can be found under “Investor & Media Relations - Reports & SEC Filings” on our Internet Site.
Item 11.Executive Compensation
Compensation Discussion and Analysis (“CD&A”)
In this CD&A, we provide an overview and analysis of our executive compensation philosophy, address the principal elements used to compensate our executive officers and explain how our executive compensation program aligns with AB’s strategic objectives. Additionally, we discuss 20202023 incentive compensation recommendations and decisions made by our Compensation Committee for our named executive officers (“(“NEOs”). This CD&A should be read together with the compensation tables that follow this section. Our NEOs for 20202023(1) are:
| | | | | | | | |
| | | | | |
| | |
Seth P. Bernstein President and Chief Executive Officer ("CEO"(“CEO“) | John C. WeisenseelBill Siemers
Interim Chief Financial Officer ("CFO"CFO") |
| |
Kate C. Burke Karl Sprules
Chief Operating Officer ("COO"COO") | Ali DibadjHead of Finance and Strategy
|
| | |
| Laurence E. Cranch Chief Legal Officer | |
Onur Erzan Head of Global Client Group and Private Wealth | Mark Manley General Counsel and Corporate Secretary | |
Compensation Philosophy and Goals
The intellectual capital of our employees is collectively the most important asset of our firm. We invest in people – we hire qualified people, train them, encourage them to give their best thinking to the firm and our clients, and compensate them in a manner designed to motivate, reward and retain them while aligning their interests with the interests of our Unitholders and clients.
Furthermore, our compensation practices are structured to help the firm realize its long-term growth strategy (“to Deliver, Diversify and Expand, Responsibly, with Equitable (the “Growth Strategy”), which includes firm-wide initiatives to:
•Deliver superior investment solutions to our clients;
•Develop high-quality differentiated services; and
•Maintain strong incremental margins.
We also are focused on ensuring that our compensation practices are competitive with industry peers and provide sufficient potential for wealth creation for our NEOs and our employees generally, which we believe will enable us to meet the following key compensation goals:
•attract, motivate and retain highly-qualified executive talent;
•reward prior yearprior-year performance;
•incentivize future performance;
•recognize and support outstanding individual performance and behaviors that demonstrate and foster our firm’s primary objective of helping our clients reach their financial goals; and
•align our executives’ long-term interests with those of our Unitholders and clients.
Progress in Advancing our Growth Strategy in 2020
In 2020, the firm’s results demonstrated2023 we continued to show meaningful progress in executing on our Growth Strategy. Below are key metrics related to the three pillars of the Growth Strategy:
Deliver superior investment solutionsSuperior Investment Solutions to our clients:Clients:
Investment Performance
The firm’s investment teams continue to focusremain focused on consistently delivering differentiated return streams to our clients. We believe that, over time, the ability to produce idiosyncratic returns that cannot be easily replicated will be central to sustaining our competitive advantage. In 2020, performance in2023, our Fixed Income suiteperformance strengthened, with 75% of products was mixed, asassets outperforming for the one-year period ended December 31, 2023, 73% outperforming over the three-year period and 77% outperforming for the five-year period. In Equities, performance lagged due to both stock selection and highly concentrated benchmark returns led by a strong recovery in risksmall number of mega-cap technology stocks. Approximately 26% of Equity assets followed a dramatic sell-off in March, with 43% of assetswere in outperforming services for the one-year period, ended December 31, 2020, while our long-term performance remains strong given 62%45% for the three-year period and 79%42% for the five-year period.Our U.S. retail fixed income mutual funds with AUM greater than $1 billion that placed in the top quartile of performance for the three-year period ended December 31, 2020 are: AB Intermediate Diversified Muni, AB High Income Municipal, AB Intermediate New York Municipal, AB Intermediate California Municipal and AB Municipal Bond Inflation Strategies. Our Non-U.S. fixed income funds with AUM greater than $1 billion that placed in the top quartile over the same three-year period are: AB American Income, AB European Income and AB Short Duration High Yield (this2023. (This performance data reflects the percentage of active fixed incomeFixed Income and equityEquity assets in institutional servicesInstitutional Services that outperformed their benchmark,respective benchmarks, gross of fees, and percentage of active fixed incomeFixed Income and equityEquity assets in retailRetail advisor and I share class funds ranked in the top half of their Morningstar category; if no advisor class exists, we used A share class).
In active equity, 41% Additionally, as of December 31, 2023, 60% of U.S. Fund assets and 69% of Non-U.S. Fund assets were in outperforming services for the one-year period, 61% for the three-year periodrated 4- or 5-stars by Morningstar.
The following retail Fixed Income and 53% for the five-year period ended December 31, 2020. Our U.S. retail equityEquity mutual funds with AUM greater than $1 billion that$100 million placed in the top quartile of performance for the three-year period ended December 31, 2020 are: AB Large Cap Growth, AB Discovery Growth, AB Small Cap Growth and AB Sustainable Global Thematic. Our Non-U.S. equity funds with AUM greater than $1 billion that placed in the top quartile over the same period are: AB Global Core Equity, AB International Technology and AB Sustainable Global Thematic (information sourced from Morningstar).2023:
Additionally, at year-end 2020, 68% of U.S. Fund assets and 56% of Non-U.S. Fund assets were rated either 4 or 5-stars by Morningstar.
| | | | | | | | | | | |
| | | |
AB U.S. retail fixed income mutual funds that placed in the top quartile (3-yrs): •AB Municipal Bond Inflation Strategy •AB Short-Duration High Yield •AB Tax-Aware Fixed Income Opportunity | AB Non‑U.S. fixed income funds that placed in the top quartile (3-yrs): •AB Short Duration High Yield | AB U.S. retail equity mutual funds that placed in the top quartile (3-yrs): •AB Equity Income •AB Value | AB Non‑U.S. equity funds that placed in the top quartile (3-yrs): •AB Asia ex-Japan •AB EM Low-Volatility •AB EM Value •AB International
Healthcare •AB Low-Vol Equity •AB US Small and Mid-Cap Equity |
| | | |
Net Flows
Scaling our proven investment services remains a key focus of our firm. In 2020,2023, we generated an active organic growthgrew organically in two of our three distribution channels, Retail and Private Wealth, while Institutions saw net outflows. By asset class, Fixed Income grew organically at 5%, offset by outflows in Active Equity, consistent with trends seen across the industry. AB’s net outflows were $7.0 billion, or 1.1% attrition, a lower rate of 1.0%, or 3.0% excluding low-fee AXA redemptions we had been expecting and previously disclosed.attrition as compared with our public peer group which experienced higher attrition. In our Retail channel, record gross sales of $79rose to $71.1 billion, increased 5% year-over-year, reflectingup 8% versus 2022. The Retail redemption rate rose to 28% in 2023 from 24% in 2022, and full-year net inflows were $3.7 billion, driven by strong growth in the U.S.both taxable and Japan. This growth primarily resulted from Active Equities, which experienced gross sales of $36 billion, or 64% greater than the prior year. Retail redemptions increased from 2019 due to the industry-wide sell-off related to the global onset of COVID-19 during the first quarter. Our Retail Active Equity products grew organically for a fourth consecutive year, generating $5.5 billion in net inflows, or a 7% organic growth rate.non-taxable Fixed Income. In our Institutional channel, gross sales were $30.8of $11.8 billion increasing 81% compared to 2019 and representing the firm's highest level of institutional gross sales in 12 years. The firm generated institutional active equity flows of $7.2declined from $32.2 billion in 2020, or a 16% organic growth rate.2022, the latter of which benefited from $16 billion in funding from two custom target date mandates. Net outflows were $11.8 billion. Our pipeline of $12.2$12.0 billion in AUM compared with $15.1decreased versus $13.2 billion a year ago, reflecting strong funding during the fourth quarter of 2020. Active Equities andslowing institutional activity industry wide; Private Alternatives represented over 80% of the pipeline fee base at year-end. In Private Wealth, gross sales in 20202023 of $14.3$18.6 billion increased 26%were strong, up 6% year-over-year, representing our best production since 2007. And, we continued to expand our useand this channel generated its third straight year of innovative product offerings, including a diverse setnet inflows, or 1.1% organic growth.
Develop high-quality differentiated services:Part III
Diversify Through Developing High-Quality Differentiated Services:
Growing the diversity of our offerings to meet the needs of an evolving, complex global client base remains a key focus. In 2020,2023, new investment strategy launches across our Sustainable Investingglobal platform experienced strong growth, with $16.5 billionincluded: Security of AUM at year-end, up 60% year-over-year. In our Multi-Asset group,the Future, US High Dividend ETF, Disruptors ETF, Corporate Bond ETF, Core Plus Bond ETF, Conservative Buffer ETF, Tax-Aware Intermediate Municipal ETF, Tax-Aware Long Municipal, and Fixed Maturity Portfolio 2026/2027. Additionally, we launched sixmultiple new funds, including Global Macro, Eventvehicles for existing investment strategies in response to customer demand, across a diverse set of geographies.
Expand:
In 2023, we focused on continued growth in our Private Alternatives business, with net inflows led by Secondaries, Renewable Energy, Residential Mortgage Loans and Merger Arbitrage, ESG, China and low-volatility focused products.
Additionally, we continued to successfully develop and raise capital for new Alternatives offerings, which we are offering across our buy-side distribution channels. Launches in 2020 included: a new European Commercial Real Estate DebtDebt. We announced a new NAV (Net Asset Value) lending strategy in our Private Credit business, supported by a commitment from Equitable. AB’s Private Markets platform which we are launching with the key support of EQH; our first Collateralized Loan Obligation fund;is now $61 billion, up 9% year over year, reflecting a Term Asset-Backed Securities Loan Facility offering;diverse and a fund of funds joint venture with Abbott Capital Management, LLC. We also completed
two acquisitions in 2020: Asturias, a long/short equity manager focused on the technology, telecomrelevant offering for Institutional, Retail and media sector; and AnchorPath, a risk-managed solutions provider.
Private Wealth clients. We remain focused on expanding opportunistically, both inside and outside the U.S., to support long-term growth. We have efforts underway to expand our range of servicesreceived approval in China for a wholly owned mutual fund license, and capabilitiesare also focused on growth in China, other Asian nations and select European markets. We continued to invest in our insurance asset management business to grow third party clients. And, we realized strong growth due to the redesign of our Muni investment platform to enable customization and tax optimization at scale in our custom Muni SMAs.
Lastly, in Bernstein Research,We view responsibility as an active pursuit that unites our firm—from the way we work and act, to our community service, and to the investment solutions we deliver to our clients. Internally we continued to improve on a robust corporate governance and compliance framework, including further strengthening our security and business continuity infrastructure. Through our investing activities, we continue to investsupport proposals that encourage companies to strengthen their corporate governance structures, support shareholder rights and strive for greater transparency, in Hong Kongkeeping with the best interest of our clients. Financially, responsibility extends to our expense management, as we maintained non-compensation expense growth below inflation levels in 2023.
With Equitable:
In 2023 Equitable announced an expansion of its program to allocate and India, where investmentsdeploy permanent capital1 to date have comeAB’s illiquid platform. Equitable's goal is to fruition.
Maintain strong incremental margins:Strong Incremental Margins:
We remain focused on managing costs to help ensure that we generate strongtargeted incremental adjusted operating margins.margins in the range of 45-50%, over time. In 2020,2023, we continued to make substantial progress onexecute a key pillar of this strategy which weas initially announced in 2018:2018, which was the relocation of our corporate headquarters from New York NYCity to Nashville, TN. We expect to occupy in 2021 our newly constructed Nashville headquarters building, which will house approximately 1,250 employees over time.Nashville. We continue to seek efficiencies and manage various operating expenses to help ensure that we drive operating leverage on incremental revenues. We also continue to execute on the planned joint venture of Bernstein Research Services with Société Générale (EURONEXT: GLE, “SocGen”), expected to be completed in the first half of 2024. We currently anticipate this action will result in a 200-250 basis point improvement in our annual adjusted operating margin upon deconsolidation of Bernstein Research Services from our consolidated financial statements.
Despite improving financial markets over the course of 2023, our full year average 2023 AUM declined by 1% from 2022 levels, reflecting a lag in average AUM recovering versus the prior year. This resulted in a rolling three-year incremental adjusted operating margin of 8%, below our targeted range. Our adjusted operating margin decreased to 28.2% in 2023, down 70 basis
points as compared to 28.9% in 2022. The decrease resulted from operating expense growth of 2% as compared with adjusted net revenue growth of 1%. Total adjusted compensation and benefits was 47.9% of adjusted revenues, flat compared to 2019. Excluding the impact of higher performance-based fees in 2020, compensation costs as a percentage of revenues declined by 0.6% to 47.3%. Our adjusted operating marginexpense increased by 260 basis points to 30.1% in 2020 compared to 27.5% in 2019. The increase resulted from a 5% increase in adjusted revenues, driven2%, promotion and servicing costs rose by higher base fees, higher performance-based fees2%, and higher Bernstein Research revenues, partially offset by ageneral and administrative costs rose 1% increase in adjusted operating expenses compared to 2019.year-over-year. We provide additional information regarding our adjusted compensation ratio below in this CD&A; see our discussion of “Management Operating Metrics” above in Item 7 for a reconciliation between our results pursuant to U.S. GAAP and our adjusted results.
Our Compensation Discussion & AnalysiPractices are Structured to Help the Firm Realize its Growth Strategy
| | | | | | | | | | | | | | |
| | | | Deliver superior investment solutions to clients |
| Develop, commercialize and scale our suite of services $1.4 Billion Active ETF's 10 New Active ETF’s launched in 2023, including AB Conservative Buffer ETF and AB High Dividend ETF, bringing total to 12 Active ETF’s. $61 Billion Municipals Municipal Platform reflects 11% annualized organic growth led by strong growth in Muni SMA’s. Our Retail Muni platform has grown 11 straight years. China License Obtained AB obtains license for wholly-owned mutual fund business. $61 Billion Private Markets AUM +9% Y/Y driven by growth in Secondaries, Renewable Energy, Mortgage Loans and European Commercial Real Estate Debt. $20 Billion Total Equitable Commitment Additional $10 billion committed capital by Equitable in 2023 to further expand AB's Private Alternative and Private Placements Platforms. | | |
| | | Fixed Income and Equity Performance |
| | | Maintain strong incremental margins(1) |
| | | AB Adjusted Operating Margin (2) |
| | | |
| | | Total Unitholder Return (2019 - 2023; assumes dividend reinvestment) |
| | |
| | |
| | | |
| | | |
Overview
| | | | | | | | | | | |
| Gross Sales | Alts/MAS | Organic Growth | Beneficial Pipeline Mix |
| AB’s Retail channel achieved | Fixed Income Organic Growth | Two of three Channels positive in 2023 | Alternatives represented over |
| $71.1B | 5.5% | 1.9% | 80% |
| in gross sales in 2023, up 8% year-over-year | in 2023 | average annual organic growth per year, over the last 5 years | of institutional pipeline fee base at year-end |
(1)s, and weAB generated a rolling three-year incremental adjusted operating margin of 8%, below the long-term targeted range of 45-50%. We provide additional information aboutregarding our adjusted operating margin in Management's Discussion and Analysis of Financial Condition and Results of OperationsMD&A above in Item 7.
Overview of 20202023 Incentive Compensation Program
When reflecting on 20202023 performance and pay, each of our NEOs (other than Ms. Burke who resigned in May 2023) received a portion of his or her year-end incentive compensation in the form of an annual cash bonus and a portion in the form of long-term incentive compensation awards. The split between the annual cash bonus and long-term incentive compensation varied depending on the NEO's total compensation, with lower-paid executives receiving a greater percentage of their incentive compensation as cash bonuses than more highly-paid executives. (For additional information about these compensatory elements, see “see “CompensationCompensation Elements for NEOs” NEOs” below.) For Mr. Bernstein, his 2020 incentive compensation award was based generally on the terms set forth in the CEO Employment Agreement (as defined below) and review of his
In 2023, we utilized performance during 2020 by the Compensation Committee. As partscorecards for senior leaders of the Committee's evaluationfirm, including our NEOs. These scorecards require our senior leaders to develop and maintain a broad leadership mindset with priorities, such as accelerating ESG initiatives and our firm's alternatives platform, that are aligned with firm-wide goals of Mr. Bernstein's performance, the Committee reviewed AB's financial results and a performancecreating long-term value for all of our stakeholders. The scorecard (the "Scorecard"), whichfor each NEO reflected our Growth Strategy and included actual results relative to target metrics across the following measures:
•financial goals,Financial performance, including peer results, adjusted operating margin, adjusted net revenue growth and operating efficiency targets (see our discussion of “Management Operating Metrics” in Item 7for a reconciliation between our results pursuant to USU.S. GAAP and our adjusted results);
•strategic focus areas,Investment performance, by delivering competitive returns across services and time periods;
•Strategic, aligned with our strategy of delivering core investment solutions, while developing high-quality differentiated services, in faster-growing geographies, responsibly, in partnership with Equitable;
•Organizational, including investment performance, client retentionorganizational effectiveness and demonstrable progress of strategic priorities;efficiency, leadership impact, succession planning, developing talent, innovating and automating, and real estate utilization; and
•organizational leadership,Cultural, including purpose, employee engagement, diversity, retention and leadership transitions.safety.
In 2021 and future years, we expect to utilize a similar Scorecard in assessing the performance of each of the firm's executives. The recent adoption of this tool has initiated a broad and diverse approach to reward and recognition processes at the firm, beginning with Mr. Bernstein in 2020. The Scorecard serves to shift our executives' priorities from a primarily revenue-based model to a broad leadership mindset. Priorities, including progress compared to ESG measures in the Scorecard,scorecards support management and the needs of clients are paralleled with the expectation of creating long-term value for all of our stakeholders and becoming a guiding example for employees while complementing revenue expectations.
We do not utilize quantitative formulas or targets when determining the incentive compensation of our NEOs. Instead, we rely on our assessment ofCompensation Committee in assessing each executive's performance relative to business, operational and cultural goals established at the beginning of the year and reviewed in the context of the current-year financial performance of the firm. The amount of incentive compensation paid to our NEOs continues to be determined on a discretionary basis by the Compensation Committee.
(For additional information, Table of Contentsplease see "Compensation Committee; Process for Determining Executive Compensation" below in this CD&A Additionally, incentive compensation reflects an executive's achievements throughout the year. Amounts are awarded to help us achieve our goal of attracting, motivating and retaining top talent while also helping to ensure that our NEOs' goals are appropriately aligned with the goal of increasing our Unitholders’ return on their investment..)
Mr. Bernstein, and Ms. Burke, with the approval of the Compensation Committee, confirmedcontinue to believe that the appropriate metric to consider in determining the amount of incentive compensation paid to all employees, including our NEOs, in respect of 20202023 performance is the ratio of adjusted employee compensation and benefits expense to adjusted net revenues, which terms are described immediately below:below:
•Adjusted employee compensation and benefits expense is our total employee compensation and benefits expense minus other employment costs such as recruitment, training, temporary help and meals, and excludes the impact of mark-to-market vesting expense, as well as dividends and interest expense, associated with employee long-term incentive compensation-related investments. Also, we adjust for certain performance-based fees passed through to our investment professionals.
•Adjusted net revenues (see our discussion of “Management Operating Metrics” in Item 7 for a reconciliation between our results pursuant to U.S. GAAP and our adjusted results) exclude investment gains and losses and dividends and interest on employee long-term incentive compensation-related investments. In addition, adjusted net revenues offset distribution-related payments to third parties as well as amortization of deferred sales commissions against distribution revenues. We also exclude additional pass-through expenses we incur (primarily through our transfer agent) that are reimbursed and recorded as fees in revenues. Additionally, we adjust for the revenue impact of consolidating company-sponsored investment funds by eliminating the consolidated company-sponsored investment funds’ revenues and including AB’s fees from such funds, and AB’s investment gains and losses on its investment in such funds, that were eliminated in consolidation. We also adjust for certain acquisition-related pass-through performance-based fees and certain other performance-based fees passed through to our investment professionals.
| | | | | |
•130 | Adjusted employee compensation and benefits expenseAllianceBernstein is our total employee compensation and benefits expense minus other employment costs such as recruitment, training, temporary help and meals, and excludes the impact of mark-to-market vesting expense, as well as dividends and interest expense, associated with employee long-term incentive compensation-related investments.
|
• | Adjusted net revenues (see our discussion of “Management Operating Metrics” in Item 7 for a reconciliation between our results pursuant to US GAAP and our adjusted results)exclude investment gains and losses and dividends and interest on employee long-term incentive compensation-related investments. In addition, adjusted net revenues offset distribution-related payments to third parties as well as amortization of deferred sales commissions against distribution revenues. We also exclude additional pass-through expenses we incur (primarily through our transfer agent) that are reimbursed and recorded as fees in revenues. Additionally, we adjust for the revenue impact of consolidating company-sponsored investment funds by eliminating the consolidated company-sponsored investment funds' revenues and including AB's fees from such funds, and AB's investment gains and losses on its investment in such funds, that were eliminated in consolidation.
|
In addition, Mr. Bernstein, and Ms. Burke,along with the approval of the Compensation Committee, determinedcontinue to believe that the firm’s adjusted employee compensation and benefits expense, excluding the impact of performance-based fees, generally should not exceed 50.0% of our adjusted net revenues annually, except in unexpected or unusual circumstances. As the table below indicates, in 2020,2023, adjusted employee compensation and benefits expense amounted to approximately 47.9%49.0% of our adjusted net revenues (in thousands):
| | | | | |
| Net Revenues | $ | 3,708,5364,155,323 | |
Adjustments (see above) | (659,210)(783,374) | |
| Adjusted Net Revenues | $ | 3,049,3263,371,949 | |
| |
| Employee Compensation & Benefits Expense | $1,769,153 | | 1,494,198 |
Adjustments (see above) | (34,889)(115,977) | |
| Adjusted Employee Compensation & Benefits Expense | $ | 1,459,3091,653,176 | |
| Adjusted Compensation Ratio | 47.949.0 | % |
Our 20202023 adjusted compensation ratio of approximately 47.9%49.0% reflects a balancing of the need to keep compensation levels competitive with industry peers in order to attract, motivate and retain highly-qualified talent with the need to maintain strong operating leverage in our business. The Compensation Committee works with management to help ensure both needs are sufficiently addressed.
Compensation Committee; Process for Determining Executive Compensation
The Compensation Committee consists of Ms. Matus (Chair) and Messrs. Audet, de Oliveira, Kaye, Pearson and Scott. The Compensation Committee held four regular meetings in 2020.
As discussed in “NYSE Governance Matters” in Item 10, AB Holding, as a limited partnership, is exempt from NYSE rules that require public companies to have a compensation committee consisting solely of independent directors. EQH owns, directly and through various subsidiaries, an approximate 64.8% economic interest in AB (as of December 31, 2020), and compensation expense is a significant component of our financial results. For these reasons, Mr. Pearson, director and President and CEO of EQH, is a member of the Compensation Committee, and any action taken by the Compensation Committee requires his affirmative vote or consent. Given this structure, the Compensation Committee has established a sub-committee consisting entirely of non-management directors (i.e., Ms. Matus and Messrs. Audet, de Oliveira, Kaye and Scott). This “Section 16 Sub-Committee” approves awards of restricted AB Holding Units to NEOs.
The Compensation Committee has general oversight of compensation and compensation-related matters, including:
| | | | | |
• | determining cash bonuses; |
• | determining contributions and awards under incentive plans or other compensation arrangements (whether qualified or non-qualified) for employees of AB and its subsidiaries, and amending or terminating such plans or arrangements or any welfare benefit plan or arrangement or making recommendations to the Board with respect to adopting any new incentive compensation plan, including equity-based plans; |
• | reviewing and approving the compensation of our CEO, evaluating his performance, and determining and approving his compensation level based on this evaluation; and |
• | reviewing and discussing the CD&A and recommending to the Board its inclusion in each of AB’s and AB Holding’s Form 10-K and, when applicable, proxy statements. |
The Compensation Committee has developed a comprehensive process for:
•reviewing our executive compensation program to ensure it is aligned with our firm’s philosophy and strategic objectives;
•evaluating performance by our NEOs against goals and objectives established at the beginning of the year; and
•setting compensation for the NEOs and other senior executives.
The Compensation Committee’s year-end process generally focuses on the cash bonuses and long-term incentive compensation awards granted to NEOs and other senior executives. Mr. Bernstein, working with Ms. Burke and other senior executives, provides recommendations for individual executive awards to the Compensation Committee for its consideration. As part of this process, Ms. Burke provides the Committee with compensation benchmarking data from one or more compensation consultants. For 2020, we paid $48,150 to McLagan Partners (“McLagan”) for executive compensation benchmarking data and trend forecasting.
Management periodically reviews with the Compensation Committee the firm’s expected adjusted financial and operating results, the firm’s actual results and management’s year-end compensation expectations, as they evolve throughout the year. Management accomplished these reviews during regular meetings of the Compensation Committee held in February, May, September and November 2020. The Compensation Committee then approved the firm's final year-end compensation recommendations during December 2020.
The Compensation Committee did not retain its own consultants in 2020.
Additional information regarding the Compensation Committee’s functions can be found in the Committee's charter, which is available online in the “Corporate Responsibility - Corporate Governance” section of our Internet Site.
Benchmarking Data
In 2020, we engaged McLagan to provide compensation benchmarking data for our NEOs (“2020 Benchmarking Data”). The 2020 Benchmarking Data summarized 2019 compensation levels and 2020 salaries at selected asset management companies comparable to ours in terms of size and business mix (“Comparable Companies”), to assist us in determining the appropriate level of compensation for our NEOs.
The 2020 Benchmarking Data provided ranges of compensation levels at the Comparable Companies for executive positions like those held by our NEOs, including base salary and total compensation.
The Comparable Companies, which management selected with input from McLagan, included:
| | | | | | | | |
Eaton Vance Corp. | Franklin Templeton Investments | Goldman Sachs Asset Management |
Invesco Ltd. | JP Morgan Asset Management | Legg Mason, Inc. |
MFS Investment Management | Morgan Stanley Investment Management | Neuberger Berman LLC |
Nuveen Investments / TIAA | PIMCO LLC | Prudential Investments |
T. Rowe Price, Inc. | The Vanguard Group, Inc. | |
The 2020 Benchmarking Data indicated that the total compensation paid to each of our NEOs in 2020 fell within or below the ranges of total compensation paid to executives at the Comparable Companies.
The Compensation Committee considered this information in concluding that the compensation levels paid in 2020 to our NEOs were appropriate and reasonable.
Other Factors Considered When Determining NEO Compensation
For 2020, Mr. Bernstein and Ms. Burke, and the Compensation Committee, based decisions about the incentive compensation of our NEOs primarily on an assessment of each executive’s leadership, operational performance and potential to enhance investment returns and service for clients, all of which contribute to long-term Unitholder value. Quantitative formulas are not utilized when determining the incentive compensation of our NEOs. Instead, Mr. Bernstein and Ms. Burke, and the Compensation Committee, rely on judgment about each executive’s performance in light of business and operational goals established at the beginning of the year and reviewed in the context of the current-year financial performance of the firm and the firm's progress in advancing its Growth Strategy. Mr. Bernstein and Ms. Burke begin the award determination process, working with other members of senior management, by determining the total incentive compensation amounts available for a particular year (as more fully explained above in “Overview of 2020 Incentive Compensation Program”).
Mr. Bernstein and Ms. Burke, and the Compensation Committee, then consider many key factors for each of the NEOs. Specific factors will vary among business units, among individuals and during different business cycles, so we do not adopt any specific weighting or formula under which these metrics are applied. Key factors are:
| | | | | |
• | the firm’s financial performance in the current year and the executive's contribution to such financial performance; |
• | the firm's progress in advancing its Growth Strategy; |
• | the NEO's performance compared to individual business and operational goals established at the beginning of the year; |
• | total compensation awarded to the NEO in the prior year; |
• | the increase or decrease in the current year’s total incentive compensation amounts available;
|
• | the nature, scope and level of responsibilities of the NEO; |
• | the NEO’s execution of our firm’s culture of Relentless Ingenuity; and |
• | the NEO’s management effectiveness, talent development, focus on diversity and inclusion initiatives, and adherence to risk management and regulatory compliance. |
Mr. Bernstein and Ms. Burke then provided specific incentive compensation recommendations to the Compensation Committee, which recommendations were supported by the factors listed above, each NEO's individual achievements, as listed below and, for Mr. Bernstein, a summary of his performance compared with metrics included in the Scorecard. They also provided the Compensation Committee with the 2020 Benchmarking Data, which was not used in a formulaic or mechanical way to determine NEO compensation levels, but rather, as noted above, provided the Compensation Committee with a reference point for the compensation levels paid to executives at the Comparable Companies. The Compensation Committee then made the final incentive compensation decisions for each NEO.
We have described below each NEO’s individual achievements in 20202023 given each officer’s role, the contents of their respective performance scorecards and the firm's business and operational goals:
Seth P. Bernstein
Role
•Leadership, responsibility and performance as President and CEO.
Individual Achievements
•Led the firm’s efforts in achieving an approximate 5% year-over-year increase in adjusted net revenues, firm-wide client net inflows of $9.2 billion, excluding AXA's redemption of low-fee fixed income mandates, resulting in an active organic growth rate of 3.0%; higher revenues and lower non-compensation related expenses, in part due to COVID-19 pandemic-related travel restrictions, led to an increase in adjusted operating margin of 260 basis points to 30.1%.
•Successfully managed the firm through an unprecedented year via the strength of our leadership team and technology platform, which enabled us to transition working remotely seamlessly, allowing us to support our people and clients.
•Led the continued focus on investment results; while challenged in the short term, longer term investment performance remains competitive. As of December 31, 2020, fixed income services, as a percentage of assets outperforming applicable benchmarks for the one-, three- and five-year periods, achieved 43%, 62% and 79%, respectively, while equities services achieved 41%, 61% and 53%, respectively.
•Drove meaningful progress on key strategic growth initiatives, including build-out of our operation in China and our responsible investment platform, enhancing collaboration with EQH and establishing a comprehensive inorganic growth strategy: AB added four new businesses in 2020.
•Improved engagement metrics in AB’s employee survey and supported the firm’s diversity and inclusion initiatives, including adding diverse perspectives to the firm's Operating Committee and adding two diverse Board members.
•Conducted meetings globally with current and prospective clients to deepen AB’s relationships and appreciation of evolving client priorities.
•Made significant progress in transition of the firm's senior leadership team.
•Advanced our firm's headquarters transition to Nashville, with the relocation and hiring of new staff and the continued construction of our new, state-of-the-art corporate headquarters.
Kate C. Burke
Role
•Leadership, responsibility and performance as COO.
Individual Achievements
•Led AB's response to the COVID-19 pandemic by establishing and quickly mobilizing the firm's Pandemic Response Team, which consists of Technology, Operations, Administrative Services, Human Capital, Risk Management, Security and Corporate Communications, to execute a coordinated global response that enabled the firm to seamlessly provide exceptional client service and investment advice, meet fiduciary obligations and prioritize the health and safety of AB's 3,929 employees as the firm adjusted to working remotely.
•Advanced AB's headquarters transition to Nashville, resulting in 789 employees on the ground as of December 31, 2020; despite the challenges presented by remote working, the firm continued to hire, onboard and train 166 new employees in Nashville in 2020, maintaining the firm's pace to achieve 1,250 employees by 2024. Also, created various engagement strategies to advance AB's culture, community and philanthropic activities in Nashville.
•Led firm-wide cost savings initiatives to drive greater efficiency and automation, managed compensation and headcount, and captured additional savings to improve AB's adjusted operating margin by 260 basis points to 30.1%.
•Reviewed existing and new business initiatives and aligned resources to invest in organic and inorganic growth opportunities, including the build-out of our operation in China, our responsible investment platform, our private wealth capabilities, and our public and private alternatives platforms.
•Championed our firm's diversity and inclusion efforts through a period of civil unrest around racial inequity, supported AB's employees and provided opportunities to share and learn together while also delivering concrete actions resulting in increased diverse representation on the Board and the firm's Operating Committee, and added resources to support the development and retention of AB's diverse talent.
•Supported Mr. Bernstein in the succession planning of critical leadership roles, including the planned retirement of Mr. Weisenseel and the Head of AB's Client Group, and the successful selection and transition of new leaders onto the firm's executive team.
•Completed transition to the role of COO in July 2020 and worked closely with Mr. Weisenseel throughout 2020 to transition administrative services to the office of the COO by February 2021.
•Advanced AB's operating model to increase transparency and accountability around key business and financial metrics, enhanced collaboration within the firm's Operating Committee to support enterprise initiatives around expanding product, distribution and infrastructure capabilities, and supported AB's talent and cultural initiatives.
Ali Dibadj
Role
•Leadership, responsibility and performance as Head of Finance and Strategy, including ensuring a seamless transition to the role of CFO and Head of Strategy. | | | | | | | | | | | |
| | | |
| Seth Bernstein President and Chief Executive Officer Summary of Achievements: As President and CEO, Mr. Bernstein led AB to achieve organic growth in two of three distribution channels. The firm grew revenues while operating expenses grew at a rate below inflation, inclusive of continued investment in strategic growth areas. Mr. Bernstein led the firm through executive leadership changes while advancing a number of strategic priorities, including our fund management company in China, opening our AB India office, and progressing toward the closing of the joint venture for our research and trading business. | Individual Achievements Financial and Investment Performance •Led the firm’s efforts in delivering in growth areas, resulting in lower attrition rates relative to public peers, despite a difficult institutional fundraising environment. AB’s fixed income business grew organically by 5%, outperforming peers, reflecting successful scaling from investments in technology and distribution. Two of the firm’s three distribution channels grew organically. •Earnings per unit (“EPU”) in the fourth quarter were up 9% versus the same period in 2022. Full year 2023 EPU of $2.69 declined by 9% versus 2022, reflecting lower average AUM and base fees, combined with higher interest expense reflecting higher interest rates. •Improved performance meaningfully in fixed income, outperforming applicable peers or benchmarks, while our equities franchise underperformed due to both stock selection as well as strong benchmark returns narrowly led by a small number of mega-cap technology stocks (both measured by the percentage of assets outperforming). Strategic •Grew AB’s active ETF platform to $1.4B in assets with 12 funds, celebrating its one-year anniversary. Our municipal separately managed account platform reached $23B, +36% year-over-year, gaining market share. •Achieved a critical milestone receiving our regulatory license to operate an onshore China fund management company. •Progressed efforts to grow the AB CarVal franchise, by closing on our clean energy fund, three times larger than the first vintage and designing a new $750M residential mortgage mandate in partnership with EQH. Made progress on new product development for the retail channel and created and began execution on integration plans across corporate functions. •Furthered plans to create a joint venture with Société Générale for our Bernstein Research Services business and have managed staff attrition levels well below the agreed upon threshold. Organizational •Managed through an executive leadership transition, appointing a new Chief Operating Officer and identifying a new Chief Financial Officer effective Q1 2024. Created an inaugural Head of Investments role to enhance and optimize the investment business units and reduce span of control. •Established new entity in India now with ~390 staff. Opened state-of-the art new office, identified local leadership, expanded functions across business units, and improved attrition. •Advanced firmwide sustainability goals. Strengthened controls and oversight to minimize risk and advanced our own corporate sustainability. Culture •Continued focus on Diversity, Equity & Inclusion. Improved firmwide voluntary attrition and attrition among our diverse populations. •Maintained strong engagement metrics in AB’s employee survey. Reinforced firmwide purpose and values statements within business units. | |
| | |
| 2023 Compensation | |
| | |
| | |
| | | |
| | | | | | | | | | | |
| | | |
| Bill Siemers Interim Chief Financial Officer effective June 1, 2023 Summary of Achievements: As Interim Chief Financial Officer (CFO), Mr. Siemers oversaw the delivery of complete, accurate and timely financial results both internally and externally (in Forms 10-K and 10-Q and Earnings Releases) and ensured continuity and continuous improvement of a strong Finance function. Mr. Siemers held the role of Controller and Chief Accounting Officer through August 20, 2023. | Individual Achievements Financial •Managed cost reduction and containment initiatives in a restricted revenue growth environment to achieve an adjusted operating margin of 28.2%, exceeding our target. •Improved AB’s financial processes through enhanced accounting, reporting, accounts payable and planning and analysis procedures. Strategic •Supported the Board, Mr. Bernstein, other NEOscontribution of our cash equities and various Headsresearch business into a planned joint venture between AB and Société Générale as AB’s Project Manager of Strategic Business Units to define, articulatethe Finance workstream and execute our Growth Strategy, including: ◦developing new alternatives, responsible investing, equities, multi-asset and fixed income products;
◦evolving our firm's approach to servicing new and existing clients in private wealth, retail and institutional globally; and
◦hiring and retaining colleagues to supportserving as a continuously-improving organization.member of the steering committee overseeing the transaction.
•CollaboratedSuccessfully partnered with colleaguesEquitable on the financial impacts, both actual and forecasted, of our strategic initiatives, including our headquarter office relocation, growing our private alternatives and insurance products and services, and our development of a Fund Management Company in China, to help translate those strategiesoptimize both our results of operations and initiatives into deliverybalance sheet. Organizational •Supported the integration plans and processes of strong 2020 financial results.functions relating to the 2022 CarVal acquisition and served on the joint leadership team providing oversight of integration plans across all corporate functions. •Partnered closely with Mr. Weisenseel to ensureSuccessfully onboarded approximately 25 Finance personnel into AB India. •Seamlessly led the Finance function and executed all CFO responsibilities for the last seven months of the year upon the resignation of the previous CFO. •Executed on succession planning by appointing a new Controller and Chief Accounting Officer from within the Finance talent pool, ensuring a smooth transition of the CFO role, including building relationships within our firm's Finance organization and AB employees more broadly.leadership. •Began building AB's StrategySupported the successful recruitment process to identify and hire a new CFO (starting in the first quarter of 2024). Culture •Maintained strong Finance employee engagement, retention and in-office collaboration and grew diversity within our workforce. •Enhanced Purpose within Finance and engaged in various Town Hall, informal gatherings, and small meeting groups to have employees connect with AB’s purpose and values. | |
| | |
| 2023 Compensation | |
| | |
| | |
| | | |
| | | | | | | | | | | |
| | | |
| Karl Sprules Chief Operating Officer effective May 31, 2023 Summary of Achievements: Mr. Sprules successfully transitioned the role of Global Head of Technology & Corporate Development team, including makingOperations (GTO) to Robert McWilliams June 1, 2023, and assumed the role of Chief Operating Officer (COO), now overseeing Legal and Compliance, GTO, Diversity, Equity and Inclusion, Real Estate Services, Internal Audit, Risk, and the Program Management Office. In 2023 as COO, Mr. Sprules spearheaded the evaluation and prioritization of the firm’s strategic initiatives, improved return to office compliance and drove efforts in expanding our footprint in India and China and the relocation of our NYC office to Hudson Yards. | Individual Achievements Financial •Reduced the GTO budget through thoughtful and targeted expense savings measures. •Drove the prioritization process for funding the firm’s strategic investments and developed an iterative framework for ongoing planning. Strategic •Evolved the Quarterly Business Review process to improve focus on key hiresleadership topics such as business performance, strategic initiatives, errors and establishing processes.incidents, return to office compliance, and cross-functional business involvement. •Co-led project to obtain the firm’s fund management company license in China by removing roadblocks, identifying areas that required additional focus, and providing solutions to meet those needs. •Drove integration of CarVal’s technology functions and processes with AB. As COO, oversaw integration planning across all non-investment functions. Organizational •Increased collaboration across the COO and Chief Administrative Officer roles across the firm by providing a platform to discuss strategic initiatives, emerging issues, resourcing, diversity efforts, and broader topics of importance. •Simplified management by restructuring the GTO department into high-level operating functions focused on Investments, Clients, Funds, Operations, and Technology. •Led inorganic growththe design, build and opening of the firm’s new office in India, reducing turnover, considerably improving staff engagement, and expanding AB India support to other business units beyond GTO. Culture •Co-led the firm’s efforts at AB, which added four new businessesto drive a three-two structure for return to office compliance and rolled out a dashboard to management to better assist in 2020tracking and several other important capabilities.driving compliance. •Conducted competitiveOrganized various employee gatherings throughout the year to foster staff unity and industry analysisengagement among business units. | |
| | |
| 2023 Compensation | |
| | |
| | |
| | | |
| | | | | | | | | | | |
| | | |
| Onur Erzan Global Head of Client Group and Head of Private Wealth Summary of Achievements: As Global Head of Client Group (CG) and Head of Private Wealth (PW), Mr. Erzan achieved solid results across both groups despite a challenging market environment. Under Mr. Erzan’s leadership, the CG grew its active ETF platform, obtained a fund management company license to help guideoperate in China, and focused on building out capabilities in key segments. Additionally, Mr. Erzan added advisors and expanded services and investment solutions offered to our PW clients. As a member of the executive leadership team, Mr. Erzan collaborated with senior leadership across AB and Equitable Holdings on overall business decisions.and sales strategy. | Individual Achievements Financial •Achieved solid results in CG with 2023 gross sales of $83B, including $71B retail and $12B institutional. US Retail, a key strategic growth area, grew sales by 9% year-over-year and achieved a fifth straight year of organic growth. •Led furtheringRealized positive PW net flows (+$1.1B), with 1% annualized net organic growth, the third straight year of intra-firm transparency, teamworkorganic growth. Saw record advisor productivity with strong client retention. Continued growth in private alternatives and efficiencymargin loans were partially offset by improving information management system tools, metrics and processes.impact of deteriorating active equity flows. Strategic •Grew ETF platform, which launched in September 2022, from two to 12 funds, reaching $1.4B in total AUM across multiple client channels. •Established relationships with key external partners, such as clients, consultants, our communities, investors, analystsCo-led effort to obtain regulatory license for AB’s fund management company in China to offer onshore investment products and the media, among others.solutions to local retail clients. •Deepened AB's partnership with EQH, leadingContinued to build out capabilities in key growth segments. In third-party insurance, developed an analytical toolset, onboarded new business opportunitiesrobust client data and a closer operating relationship.reporting solution, and expanded advisor coverage. In defined contribution, continued to develop flexible approaches to delivering insurance-backed guaranteed retirement income. Published foundational research on evaluating diverse retirement-income solutions.
Laurence E. Cranch
Role
•Leadership, responsibilityFurthered build out of our alternative investments platform by adding product development resources and performance as Chief Legal Officer.making meaningful progress in the creation of new innovative offerings to be launched in 2024 for retail clients.
•Launched comprehensive PW client segmentation strategy, including expanding UHNW servicing team, introducing new organizational structure for global families vertical, and piloting fee-for-service with multi and single-family offices. Segmentation strategy will streamline operations, grow brand awareness, expand reach, and provide more services for clients. •Expanded PW investment solutions offering, including first successful CarVal engagement to raise capital for clean energy fund and launch of several fixed income separately managed account strategies. Raised record capital amount for secondary investing partners and our model portfolio platform crossed $20B, an all-time high. Organizational •Focused on attracting and onboarding several senior leadership roles within the CG globally across sales, business development, and product strategy. •Redesigned PW’s organizational structure to focus on new business growth within targeted client segments. (UHNW, Global Families, Family Offices, Women and Diverse Markets). Culture •Fostered a positive, results-driven culture of continuous learning and development across CG and PW. Improved collaboration across both organizations including cross-department partnerships in business management and marketing. •Promoted a customer-centric approach across the organization via segmented client playbooks and client engagement surveys. | |
| | |
| 2023 Compensation | |
| | |
| | |
| | | |
| | | | | | | | | | | |
| | | |
| Mark Manley General Counsel & Corporate Secretary Summary of Achievements: Mr. Manley is responsible for AB’s Legal and Compliance Department, overseeing all legal and regulatory affairs for the firm. In 2023, Mr. Manley counseled management to successfully navigate through a heighted regulatory environment, implemented departmental organizational changes to optimize structure and efficiencies, and supported the firm’s critical strategic initiatives, including the joint venture and establishing businesses in new jurisdictions. | Individual Achievements Financial •Successfully implemented compliance solutionsnavigated the firm through numerous regulatory examinations, inquiries and sweeps without any serious infractions or penalties. Strategic •Provided legal leadership and guidance on the Société Générale joint venture transaction and the development of new business establishments in response to new compliance requirements that became effective in 2020.
•Received favorable feedback from AB business leaders relating to the quality of service of the Legal and Compliance department.
•Ensured no regulatory examination resulted in a material adverse finding or enforcement proceeding.
•Ensured the firm remained free of material litigation, reflectingSpearheaded our pragmatic and aggressive program to avoid situations that are likely to produce disputes and, where disputes do arise, resolve them on favorable terms.
•Successfully completed the relocation of most of the New York-based Legal and Compliance department to Nashville, including the selection and retention of employees relocating, and the recruitment of qualified individuals to fill open positions in the location.
•Successfully controlled outside counsel expenses,Investments Reimagined initiative with respect to ongoing and routine legal matters.
John C. Weisenseel
Role
•Leadership, responsibility and performanceEQH as CFO, including seamless transition of his responsibilities to Ms. Burke and Mr. Dibadj.
Individual Achievements
•Successfully managed the firm's liquidity profile, which enabled the firm to navigate the extreme market volatility experienced during 2020.
•Oversaw the achievementpart of our 30% adjusted operating margin target (actual of 30.1%) by limiting expense growthcollective efforts to maximize operating leverage of the business.
•Successfully completed the relocation of the Finance department to Nashville, achieving expense savings in excess of targetstreamline and improved diversity.
•Provided accounting, taxlegal support and structuringregulatory guidance on several business development opportunities, includingin connection with the launchsuccessful licensing of AB's collateralized loan obligation and European debt real estate businesses.
•Maintained active discussionsWorked closely with AB’s investor communityour US Mutual Fund boards as they made formal plans for a unitary board in 2025. Organizational •Continued to drive innovation and credit rating agencies.
•Successfully transitioned finance responsibilities to Mr. DibadjExecuted on four critical succession plans in Compliance, Mutual Fund Legal, International Legal and administrative services responsibilities to Ms. Burke.Corporate Legal promoting high quality internal talent while creating efficiencies, cost savings and significant leadership development opportunities.
The compensation of each of these NEOs reflected the Compensation Committee’s judgment (and Mr. Bernstein’s judgment, with respect to each executive other than himself) in assessing•Emphasized the importance of the executive's achievements in the context of our firm’s adjusted financial resultsfiduciary culture through compliance and progress in advancing our Growth Strategy.
| |
| | |
| 2023 Compensation | |
| | |
| | |
| | | |
The compensation of each of these NEOs (other than Ms. Burke) reflected the Compensation Committee’s judgment (and Mr. Bernstein’s judgment, with respect to each executive other than himself) in assessing the importance of the executive's achievements in the context of our firm’s adjusted financial results and progress in advancing our Growth Strategy.
Compensation Committee; Process for Determining Executive Compensation
The Compensation Committee consists of Mr. Stonehill (Chair), Mr. Kaye and Mr. Pearson. The Compensation Committee held five regular meetings in 2023.
As discussed in “NYSE Governance Matters” in Item 10, AB Holding, as a limited partnership, is exempt from NYSE rules that require public companies to have a compensation committee consisting solely of independent directors. EQH owns, directly and through various subsidiaries, an approximate 61.2% economic interest in AB (as of December 31, 2023), and compensation expense is a significant component of our financial results. For these reasons, Mr. Pearson, director and President and CEO of EQH, is a member of the Compensation Committee, and any action taken by the Compensation Committee requires his affirmative vote or consent. Given this structure, the Compensation Committee has established a sub-committee consisting entirely of non-management directors (i.e., Mr. Stonehill and Mr. Kaye). This “Section 16 Sub-Committee” approves awards of restricted AB Holding Units to NEOs to ensure we can utilize the short-swing trading exemption set forth in Section 16b-3 under the Exchange Act. Under this exemption, equity grants to our firm's executive officers are exempt from short-swing trading rules if each such grant is approved by the full Board or a committee of the Board consisting entirely of “non-employee” directors (generally, directors who are not officers of the company or an affiliate).
The Compensation Committee has general oversight of compensation and compensation-related matters, including:
•determining cash bonuses;
•determining contributions and awards under incentive plans or other compensation arrangements (whether qualified or non-qualified) for employees of AB and its subsidiaries, and amending or terminating such plans or arrangements or any welfare benefit plan or arrangement or making recommendations to the Board with respect to adopting any new incentive compensation plan, including equity-based plans;
•reviewing and approving the compensation of our CEO, evaluating his performance, and determining and approving his compensation level based on this evaluation; and
•reviewing and discussing the CD&A and recommending to the Board its inclusion in each of AB’s and AB Holding’s Form 10-K and, and when applicable, proxy statements.
The Compensation Committee has developed a comprehensive process for:
•reviewing our executive compensation program to ensure it is aligned with our firm’s philosophy and strategic objectives;
•evaluating performance by our NEOs against goals and objectives established in each executive's performance scorecard at the beginning of the year; and
•setting compensation for the NEOs and other senior executives.
The Compensation Committee’s year-end process generally focuses on the cash bonuses and long-term incentive compensation awards granted to NEOs and other senior executives. Mr. Bernstein, working with the other senior executives, provides recommendations for individual executive awards to the Compensation Committee for its consideration. As part of this process, and as we discuss more fully below in "Compensation Consultant; Benchmarking Data," Ms. Spencer provides the Compensation Committee with competitive market data from one or more compensation consultants.
Management periodically reviews, with the Compensation Committee, the firm’s expected adjusted financial and operating results, the firm’s actual adjusted financial and operating results and management’s year-end compensation expectations, as they evolve throughout the year. Management accomplished these reviews during regular meetings of the Compensation Committee held in February, May, September, October and November 2023. The Compensation Committee approved the firm's final year-end compensation recommendations during its regular meeting held in November 2023.
Additional information regarding the Compensation Committee’s functions can be found in the Committee's charter, which is available online in the “Responsibility - Corporate Governance” section of our Internet Site.
Compensation Consultant; Benchmarking Data
In 2023, we retained McLagan Partners (“McLagan”) as an independent consultant to provide competitive market data and trend forecasting for our NEOs and other senior executives, for which we paid McLagan $60,000 (the "2023 Benchmarking Data"). McLagan has an extensive database on compensation for most asset management companies, including private companies for which information is not otherwise available.
The 2023 Benchmarking Data summarized 2022 compensation levels and 2023 salaries, which helps form a reasonable estimation of compensation levels in the industry for executive positions like those held by our NEOs at selected asset management companies comparable to ours in terms of size and business mix (the “Comparable Companies”) and, in so doing, assists in determining the appropriate level of compensation for our NEOs.
The Comparable Companies, which management selected with input from McLagan, included:
| | | | | | | | |
| | |
| We utilize a variety of compensation elements to achieve the goals Columbia Threadneedle | described aboveFranklin Templeton Investments |
, consisting of base salary, annual short-term incentive compensation awards (cash bonuses), a long-term incentive compensation award program, a defined contribution plan and certain other benefits, each of which we Goldman Sachs Asset Management | discuss in detail belowInvesco | :Janus Henderson Investors |
Base Salaries
| Base salaries comprise a relatively small portion of our NEOs’ total compensation. We consider individual experience, responsibilities and tenure with the firm when determining the narrow range of base salaries paid to our NEOs (MFS Investment Management | please refer toMorgan Stanley Investment Management |
“Neuberger Berman Group | Overview of Mr. Bernstein's Employment Agreement” below Nuveen Investments | for information relating to Mr. Bernstein’s base salary and other compensation elements).Pacific Investment ManagementAnnual Short-Term Incentive Compensation Awards (Cash Bonuses)
We provide our NEOs with annual short-term incentive compensation awards in the form of cash bonuses.
We believe that annual cash bonuses, which generally reflect individual performance and the firm’s current year financial performance, provide a short-term retention mechanism for our NEOs because such bonuses typically are paid during the last week of the year.
|
Annual cash bonuses in respect of 2020 performance for each NEO were determined and paid in December 2020. These bonuses, and the 2020 long-term incentive compensation awards Prudential Global Investment Mgmt. | described immediately belowSchroder Investment Management | , were based on management’s evaluation, subject to the Compensation Committee’s review and approval, of each NEO’s performance during the year, the firm's progress in advancing its Growth Strategy during the year, the performance of the NEO’s business unit or function compared to business and operational goals established at the beginning of the year and the firm’s current-year financial performance. For more information regarding the factors considered when determining cash bonuses for NEOs, T. Rowe Pricesee “Other Factors Considered When Determining NEO Compensation” above.In respect of 2020, Mr. Bernstein received a cash bonus of $4,015,000 in accordance with the terms of the employment agreement into which he entered with the General Partner, AB and AB Holding as of May 1, 2017 (“CEO Employment Agreement”) and after review of Mr. Bernstein's performance during 2020
|
| | |
The 2023 Benchmarking Data indicated that, as a group, our NEOs fall within market range. Please note that we excluded Ms. Burke from this analysis as she resigned from AB in May 2023 and, accordingly, did not receive year-end incentive compensation.
The Compensation Committee considered this information in concluding that the compensation levels paid in 2023 to our NEOs (other than Ms. Burke, who was not considered in this process given her resignation from the Company) were appropriate and reasonable.
Compensation Elements for NEOs
We utilize a variety of compensation elements to achieve the goals described above, consisting of base salary, annual short-term incentive compensation awards (cash bonuses), a long-term incentive compensation award program, a defined contribution plan, a defined benefit plan and certain other benefits, each of which we discuss below:
Base Salaries
Base salaries comprise a relatively small portion of our NEOs’ total compensation. We consider individual experience, responsibilities and tenure with the firm when determining the narrow range of base salaries paid to our NEOs (please refer to “Overview of Mr. Bernstein's Employment Agreement” below for information relating to Mr. Bernstein’s base salary and other compensation elements).
Annual Short-Term Incentive Compensation Awards (Cash Bonuses)
We provide our NEOs with annual short-term incentive compensation awards in the form of cash bonuses.
We believe that annual cash bonuses, which generally reflect individual performance and the firm’s current year adjusted financial performance, provide a short-term retention mechanism for our NEOs because such bonuses typically are paid in December.
Annual cash bonuses in respect of 2023 performance for each NEO were determined in November 2023 and paid in December 2023. These bonuses, and the 2023 long-term incentive compensation awards described immediately below, were based on management’s evaluation, subject to the Compensation Committee’s review and approval, of each NEO’s performance during the year, the firm's progress in advancing its Growth Strategy during the year, the performance of the NEO’s business unit or function compared to business and operational goals established in each NEO's performance scorecard at the beginning of the year, and the firm’s current-year adjusted financial performance.
In respect of 2023, Mr. Bernstein received a cash bonus of $4,515,000 in accordance with the terms of the employment agreement into which he entered with the General Partner, AB and AB Holding as of May 1, 2017 (the “CEO Employment Agreement”) and after review of Mr. Bernstein's performance during 2023 by the Compensation Committee. Please refer to “Overview of Mr. Bernstein's Employment Agreement” below for additional information relating to Mr. Bernstein’s cash bonus and other compensation elements.
Long-Term Incentive Compensation Awards
Long-term incentive compensation awards generally are denominated in restricted AB Holding Units. We utilize this structure to align our NEOs’ long-term interests directly with the interests of our Unitholders and indirectly with the interests of our clients, as strong performance for our clients generally contributes directly to increases in AUM and improved financial performance for the firm.
We believe that annual long-term incentive compensation awards provide a long-term retention mechanism for our NEOs because such awards generally vest ratably over time; awards granted in 2022 and forward generally vest in equal portions over three years, while awards granted prior to 2021 generally vest over four years. We reduced the vesting period to three years for awards in 2021 to help ensure our compensation framework remains highly competitive.
For 20202023 performance, these awards were granted in December 20202023 to each of Ms. Burke and Messrs. Bernstein, Cranch, DibadjSiemers, Sprules, Erzan, and WeisenseelManley pursuant to the AB 20202023 Incentive Compensation Award Program ("(the "ICAP"), an unfunded, non-qualified incentive compensation plan, and the AB 2017 Long Term Incentive Plan, our equity compensation plan (“(the “2017 Plan”). Ms. Burke, who resigned in May 2023, did not receive an award.
Prior to the date on which an award vests, the AB Holding Units underlying an award are restricted and are not permitted to be transferred. Upon vesting, the AB Holding Units underlying an award generally are delivered, unless the award recipient has, in advance, voluntarily elected to defer receipt to future periods or the award is structured with a delayed delivery date. Quarterly cash distributions on vested and unvested restricted AB Holding Units are delivered to award recipients when cash distributions are paid generally to Unitholders.
An award recipient who resigns or is terminated without cause prior to the vesting date is eligible to continue to vest in his or her long-term incentive compensation award subject to compliance with the restrictive covenants set forth in the applicable award agreement, including restrictions on competition, and restrictions on employee and client solicitation. Commencing in 2018,Additionally, the award agreement also provides for continued vesting in the event of an award recipient's retirement, subject to applicable restrictive covenants. To be eligible for retirement, an award recipient must provide notice of retirement, enter into a retirement agreement and satisfy a "Rule of 70," whereby the sum of the recipient's age and full years of service must equal at least 70. The award agreement provided to each recipient of restricted AB Holding Units as part of year-end incentive compensation
in 2018 amended the recipient's prior awards granted under ICAP to provide for this vesting treatment in the event of retirement.
Clawbacks
The award agreement contained in the AB Incentive Compensation Award Program ("ICAP") permits AB to claw-back the unvested portion of an award if the recipient fails to adhere to our risk management policies. As such, for accounting purposes, there is no employee service requirement and awards are fully expensed when granted. As used in this Item 11, “vest” refers to the time at which the awards are no longer subject to forfeiture for breach of these restrictions or risk management policies, which we discuss further below in “Consideration of Risk Matters in Determining Compensation.”
Relocation-related Performance Awards
In April 2018, Ms. Burke, Mr. CranchFurther, pursuant to Rule 10D-1 of the Exchange Act and Mr. Weisenseel each wasSection 303A.14 of the NYSE Listed Company Manual, the Board has adopted a Compensation Recovery Policy (the "Policy") effective November 15, 2023. Pursuant to the Policy, the Company will promptly recover erroneously awarded incentive-based compensation (as defined by section 10D(b)(1) to include any compensation that is granted, earned or vested wholly or in part upon attainment of a special restricted AB Holding Unit award with a grant date fair valuefinancial reporting measure) from any current or former Executive Officer of $4,000,000. Each award vests on December 1, 2022,the Company as defined by Rule 10D-1 of the Exchange Act as required under the Exchange Act and the underlying AB Holding Units are delivered promptly thereafter provided each executive continues to be employed by AB and each executive moves to and establishes his or her principal residence in Nashville, TN. Vesting of each executive’s AB Holding Units also is contingent on an assessmentNYSE Listed Company Manual. The company does not currently award incentive-based compensation as defined by the Compensation Committee, with appropriate inputAct. We have filed the Policy as Exhibit 97.01 to this Form 10-K.
The portion of incentive-based compensation received from EQH specific to Mr. Bernstein as to whether, and the extent to which:
•our firm’s headquarters relocation initiative is executed without significant disruption or reputational damage to AB;
•AB’s targets for cost savings and implementation costs for the relocation have been achieved; and
•the level of workplace talent and diversity in Nashville is satisfactory.
With respect to the above-referenced criteria,covered under the Compensation Committee, with appropriate inputRecovery Policy adopted by our parent EQH and will be applicable to any current or previous incentive-based compensation received directly from our parent company by Mr. Bernstein. See "Summary Compensation Table" EQH for stock awards received by Mr. Bernstein assesses achievement offor which the criteria both within the executive's business unitEQH Compensation Recovery Policy is applicable.
Former COO and with respect to our firm overall. In December 2019 and 2020, Mr. Bernstein, on behalf of the Compensation Committee, advised each executive that his or her performance generally was progressing well with respect to each of the above-referenced criteria. A similar process is expected to be followed in December 2021.CFO Resignation
CFO Retirement Agreement
As announced in a Form 8-K we filed on August 26, 2020, Mr. Weisenseel will retireJune 1, 2023, Ms. Burke resigned from AB effective September 30, 2021 (the "Retirement Date"). He is transitioning his Financeon May 31, 2023. Her responsibilities as COO were promptly transferred to Mr. Dibadj, who will assume the role ofSprules and her responsibilities as CFO and his Administrative Services responsibilitieswere promptly transitioned to Ms. Burke, effectiveMr. Siemers on or about February 12, 2021 (the first business day after we file this 10-K). Mr. Weisenseel will serve in a senior advisory role from February 12, 2021 until his Retirement Date.
The compensatory benefits underMs. Burke forfeited by resigning included (i) unvested portions of prior-year long-term incentive compensation awards, aggregating to approximately $2.9 million in value (based on the retirement agreement to which Mr. Weisenseel is entitled include:
•a lump sum cash paymentclosing price of $250,000 (less applicable tax withholding and other payroll deductions) to be madean AB Holding Unit as of August 29, 2023, her official termination date taking into account the garden leave obligation provided in the first pay period immediately afterICAP award agreement); and (ii) the Retirement Date;
•the vestingunvested portions of restricted stock unit awards and performance share awards (at target) granted to her by EQH in connection with her membership on, and service to, EQH's Management Committee, aggregating to approximately $225,000 (based on the Retirement Date and, per Mr. Weisenseel's election, delivery on March 31, 2027closing price of 113,266 AB Holding Units, which represents a pro rata vesting through the Retirement Datean EQH share as of the restricted AB Holding Units August 29, 2023).
described immediately above in "Relocation-related Performance Awards;" andTable of Contents
•until the Retirement Date and continuing for a period of 26 weeks thereafter, his base salary shall continue to be paid, through regular payroll on regular payroll dates, at the rate of $375,000 (less applicable tax withholding and other payroll deductions.
Defined Contribution Plan
U.S. employees of AB, including each of our NEOs, are eligible to participate in the Profit Sharing Plan for Employees of AB (as amended and restated as of January 1, 2015, and as further amended as of January 1, 2017, and as further amended as of April 1, 2018, and as of June 28, 2022, the “AB Profit Sharing Plan”), a tax-qualified defined contribution retirement plan. The Compensation Committee determines the amount of company contributions (both the level of annual matching by the firm of an employee’s pre-tax salary deferral contributions and the annual company profit sharing contribution, if any).
With respect to 2020,2023, the Compensation Committee determined in December 2020November 2023 that employee deferral contributions would be matched on a dollar-for-dollar basis up to 5% of eligible compensation and that there would be no profit sharing contribution.contribution paid by AB.
Defined Benefit Plan
A participant in the Retirement Plan is eligible for early retirement upon termination of employment if the participant is at least age 55 and the sum of the participant’s age and years of vesting service equals at least 80. As of December 31, 2023, Mr. Sprules has attained age 50 and earned 26 years of vesting service. (For purposes of determining early retirement eligibility, years of service after benefits under the Retirement Plan ceased accruing are included.) Because Mr. Sprules is younger than age 55 and the sum of his age and service is less than 80, he is not eligible for early retirement. As of December 31, 2023, Mr. Manley has attained age 61 and earned 40 years of vesting service. Because the total of Mr. Manley’s age and years of service exceeded 80, he is eligible for early retirement.
The early retirement benefit is “actuarially” reduced for each month that payments begin before age 65. The reduction to the pension is made because it costs more money to provide payments over a longer period of time. In other words, the monthly benefit commencing at the early retirement date has the same value as a monthly benefit beginning at age 65. The actuarial adjustment factors are based on the mortality assumptions specified under Section 417(e) of the Internal Revenue Code, and a 6% interest rate, as specified in the Retirement Plan. For example, a 60 year old participant would receive approximately 66% of the accrued benefit that would have been payable at age 65.
Other Benefits
Change in Control Plan
In December 2020, the Compensation Committee approved the AllianceBernstein Change in Control Plan for Executive Officers (the "CIC Plan"). The purpose of the CiCCIC Plan is to provide certain benefits for each individual designated by our CEO as an executive officer (an "Executive Officer") in the event of a change in control ("CIC") of AB. The CIC Plan contains a change in control provision substantially similar to the change in control provision included in Mr. Bernstein's employment agreement (as described below in "Overview of Mr. Bernstein's Employment Agreement"). The provisions under the CIC Plan also are described in a compensatory table below entitled, “Potential Payments upon Termination or Change in Control.”
The CIC Plan provides that, in the event of a CIC, unless prior to the CIC, any unvested restricted unit awards (including ICAP awards) then held by an Executive Officer are honored or assumed, or new rights are substituted therefore, so that the Executive Officer's rights and entitlements after the CIC are substantially equivalent to or better than the Executives Officer's rights and entitlements under the award, each award will, prior to the CIC, immediately and fully vest and no longer be subject to forfeiture.
In addition, (i) if the Executive Officer's employment is terminated by AB, other than for cause, (ii) the Executive Officer resigns with good reason (as defined in the CIC Plan), or (iii) the Executive Officer dies or becomes disabled, within 12 months following a CIC, the Executive Officer will be entitled to receive the sum of (a) the Executives Officer's annual base salary at the time of his or her termination, and (b) the Executive Officer's most recent annual cash incentive compensation award, multiplied by two.
The CIC Plan defines CIC to include any transaction as a result of which EQH ceases to control AB, or a successor entity that conducts the business of AB. However, there would not be a CIC unless, as a result of the transaction, an entity other than EQH controls AB (or a successor to its business).
Life Insurance
Our firm pays the premiums associated with life insurance policies purchased on behalf of our NEOs.
Consideration of Risk Matters in Determining Compensation
In 2020,2023, we considered whether our compensation practices for employees, including our NEOs, encourage unnecessary or excessive risk-taking and whether any risks arising from our compensation practices are reasonably likely to have a material adverse effect on our firm. For the reasons set forth below, we have determined that our current compensation practices do not create risks that are reasonably likely to have a material adverse effect on our firm.
As described above in “Compensation Elements for NEOs – Long-Term“Long-Term Incentive Compensation Awards,” long-term incentive compensation awards generally are denominated in AB Holding Units that are not distributed until subsequent years, so the ultimate value that the employee derives from the award depends on the long-term performance of the firm. Denominating the award in restricted AB Holding Units and deferring their delivery is intended to sensitize employees to risk outcomes and discourage them from taking excessive risks, whether relating to investments, operations, regulatory compliance and/or cyber security, that could lead to a decrease in the value of the AB Holding Units and/or an adverse effect on the firm's long-term prospects. Furthermore, and as noted above in “Compensation Elements for NEOs – Long-Term“Long-Term Incentive Compensation Awards,” generally all outstanding long-term incentive compensation awards include a provision permitting us to “claw-back” the unvested portion of an employee’s long-term incentive compensation award if the Compensation Committee determines that (i) the employee failed to adhere to existing risk management policies and (ii) as a result of the employee’s failure, there has been or reasonably could be expected to be a material adverse impact on our firm or the employee’s business unit.
Overview of Mr. Bernstein's Employment Agreement
Pursuant to the CEO Employment Agreement, Mr. Bernstein served as our President and CEO for an initial term that commenced on May 1, 2017 and ended on May 1, 2020. The initial term automatically was extended for one additional year on May 1, 2020 and will automatically extendextends each May thereafter, beginning May 1, 2021, unless the CEO Employment Agreement is terminated in accordance with its terms (“(the “Employment Term”).
The terms of the CEO Employment Agreement were the result of arm’s length negotiations between Mr. Bernstein and senior executives at AXA S.A., formerly AB's ultimate parent company ("AXA"), and EQH. The Board then approved the CEO Employment Agreement after having considered, among other things, the compensation package provided to Mr. Bernstein’s predecessor, the 2016 compensation and 2017 expected compensation of AB’s other executive officers and Mr. Bernstein’s compensation at his former employer.
The Compensation Committee, during its regular meeting held onin December 11, 2018, amended the CEO Employment Agreement such that any annual equity award granted to Mr. Bernstein in 2018 and subsequent years during the Employment Term will be granted in all respects in accordance with AB's compensation practices and policies generally applicable to AB's executive officers as in effect from time to time ("(the "SPB First Amendment").
Additionally, the Compensation Committee, during its regular meeting held onin December 10, 2019, further amended the CEO Employment Agreement by:
•increasing Mr. Bernstein’s severance payments if his employment is terminated involuntarily, without cause, from one year’s base salary and bonus to one and a half year’s base salary and bonus;
•excluding from the definition of change in control AB Holding ceasing to be publicly traded;
•removing from the circumstances that give rise to Mr. Bernstein’s ability to terminate the agreement for “good reason” his ceasing to be the CEO of a publicly traded entity; and
•eliminating Mr. Bernstein’s entitlement to a gross-up for any excise tax on his parachute payments, which would have been pertinent only if Mr. Bernstein had been terminated involuntarily prior to December 31, 2019.
Elements of Mr. Bernstein’sBernstein’s Compensation
Base Salary
Mr. Bernstein’s annual base salary under the CEO Employment Agreement has been, and continues to be, $500,000. This amount is consistent with our firm’s policy to keep base salaries of executives and other highly-compensated employees low in relation to total compensation. Any future increase to Mr. Bernstein's base salary is entirely at the discretion of the Compensation Committee.
Cash Bonus
Under the CEO Employment Agreement, Mr. Bernstein wasis entitled to be paid a cash bonus at a target level of $3,000,000 in 2020,each year during the Employment Term, subject to review and increase from time to time by the Compensation Committee, in its sole discretion. As a result of a review of Mr. Bernstein's performance during 20202023 by the Compensation Committee, Mr. Bernstein was paid a cash bonus of $4,015,000.$4,515,000. In determining Mr. Bernstein's cash bonus, the Compensation Committee considered the progress AB made in advancing its Growth Strategy, Mr. Bernstein's performance in light of the target metrics included in the Scorecardhis performance scorecard and Mr. Bernstein's individual achievements during 2020,2023, as described above.
Restricted AB Holding Units
Commencing in 2018 and during the remainder of the Employment Term, Mr. Bernstein is eligible to receive annual equity awards with a grant date fair value equal to $3,500,000, subject to review and increase by the Compensation Committee, in its sole discretion, in accordance with AB’s compensation practices and policies generally applicable to the firm’s executive officers as in effect from time to time. The Compensation Committee approved an equity award to Mr. Bernstein with a grant date fair value equal to $3,835,000$4,165,000 during December 2020.November 2023. The Compensation Committee determined Mr. Bernstein's equity award based on the review process described above. As a result of the SPB First Amendment, the equity award granted to Mr. Bernstein in December 20202023 is subject to the same ICAP-related terms and conditions as awards granted to other executive officers at that time, which terms and conditions are described above in "Compensation Elements for NEOs - Long-Term Incentive Compensation Awards."
Perquisites and Benefits
Under the CEO Employment Agreement, Mr. Bernstein is eligible to participate in all benefit plans available to executive officers and, for his safety and accessibility, a company car and driver for business and personal use.
Severance and Change in Control Benefits
The CEO Employment Agreement includes severance and change-in-control provisions, which are highlighted below. These provisions also are described in a compensatory table below entitled, “Potential Payments upon Termination or Change in Control.” We believe that these severance and change-in-control provisions assist in retaining our CEO and, in the event of a change in control, provide protection to Mr. Bernstein so he is not distracted by personal or financial situations at a time when AB needs him to remain focused on his responsibilities.
If Mr. Bernstein is terminated without “cause” or resigns for “good reason” (as such terms are defined in the CEO Employment Agreement), and he signs and does not revoke a waiver and release of claims, he will receive the following:
| | | | | |
| if Mr. Bernstein resigns for "good reason," a cash payment equal to the sum of (a) his current base salary and (b) his bonus opportunity amount;•A cash payment equal to (a) the sum of his current base salary and his bonus opportunity amount, multiplied by one (1), if Mr. Bernstein resigns for "good reason," or (b) the sum of his current base salary and his bonus opportunity amount, multiplied by one and a half (1.5), if Mr. Bernstein's employment is terminated other than for "cause," or because of his death or disability; |
| if Mr. Bernstein's employment is terminated other than for "cause," or because of his death or disability, a cash payment equal to the sum of (a) his current base salary and (b) his bonus opportunity amount, multiplied by 1.5; |
| a pro rata bonus based on actual performance for the fiscal year in which the termination occurs; |
| immediate vesting of the outstanding portion of the equity award he was granted in May 2017; |
| delivery of AB Holding Units in respect of the equity award he was granted in May 2017 (subject to any withholding requirements); |
| monthly payments equal to the cost of COBRA coverage for the COBRA coverage period; and |
| following the COBRA coverage period, access to participation in AB’s medical plans as in effect from time to time at Mr. Bernstein’s (or his spouse’s) sole expense. |
•a pro rata bonus based on actual performance for the fiscal year in which the termination occurs;
•monthly payments equal to the cost of COBRA coverage for the COBRA coverage period; and
•following the COBRA coverage period, access to participation in AB’s medical plans as in effect from time to time at Mr. Bernstein’s (or his spouse’s) sole expense.
If, during the 12 months following a change in control, Mr. Bernstein is terminated without cause or resigns for good reason, he will receive the amounts described above, except that he will receive a cash payment equal to two (2) times the sum of (a) his current base salary and (b) his bonus opportunity amount.
In the event of a change in control or in the event that Mr. Bernstein’s employment is terminated because the CEO Employment Agreement is not renewed (other than for cause), the equity award he was granted in May 2017 will immediately vest and AB Holding Units in respect of any such award will be delivered by AB to him (subject to any withholding obligations).
In the event any payments constitute “golden parachute payments” within the meaning of Section 280G of the Code and would be subject to an excise tax imposed by Section 4999 of the Code, such payments will be reduced to the maximum amount that does not result in the imposition of such excise tax, but only if such reduction results in Mr. Bernstein receiving a higher net-after tax amount than he would receive absent such reduction.
Mr. Bernstein is subject to a confidentiality provision, in addition to covenants with respect to non-competition during his employment and six months thereafter and non-solicitation of customers and employees for 12 months following his termination of employment.
A change in control is defined as, among other things, EQH and its majority-owned subsidiaries ceasing to control the election of a majority of the Board.
Mr. Bernstein negotiated the severance and change-in-control provisions described immediately above to have the security and flexibility to focus on the business and preserve the value of his long-term incentive compensation. The Board, AXA and EQH determined that these provisions were reasonable and appropriate because they were necessary to recruit and retain Mr. Bernstein and provided Mr. Bernstein with effective incentives for future performance.
The Board, AXA and EQH also concluded that the change-in-control and termination provisions in the CEO Employment Agreement fit within AB’s overall compensation objectives because these provisions, which align with AB’s goal of providing its executives with effective incentives for future performance, also:
136•permitted AB to recruit and retain a highly-qualified CEO;
Table•aligned Mr. Bernstein’s long-term interests with those of ContentsAB’s Unitholders and clients;•were consistent with AXA’s, EQH's and the Board’s expectations with respect to the manner in which AB and AB Holding would be operated during Mr. Bernstein’s tenure; and
| | | | | |
| • | permitted AB to recruit and retain a highly-qualified CEO; |
• | aligned Mr. Bernstein’s long-term interests with those of AB’s Unitholders and clients; |
• | were consistent with AXA’s, EQH's and the Board’s expectations with respect to the manner in which AB and AB Holding would be operated during Mr. Bernstein’s tenure; and |
• | were consistent with the Board’s expectations that Mr. Bernstein would not be terminated without cause and that no steps would be taken that would provide him with the ability to terminate the agreement for good reason. |
Compensation awarded by EQH to Mr. Bernstein,
In 2020, the board of directors ofFebruary 2023, EQH granted to Mr. Bernstein, in connection with his membership on and service to the EQH Management Committee:
•a restricted stock unit award (for EQH common stock) with a grant date fair value of $250,019;
•a performance share award (for EQH common stock) with a grant date fair value of $500,031, approximately half of which can be earned subject to EQH’s performance against specified non-GAAP financial targets and half of$498,025, which can be earned subject to EQH’s total shareholder return relative to its peer group; andgroup.
•a restricted stock optionsunit award (for EQH common stock) with a grant date fair value of $250,003.$40,024; and
Assumptions made in determining the EQH restricted stock unit and performance share figures discussed above are described in footnotes to the compensatory tables below entitled "Summary Compensation Table for 2023" and "Grants of Plan-Based Awards in 2023."
Mr. Bernstein and Mr. Erzan may receive additional equity or cash compensation from EQH in the future related to histheir continued membership on and service onto the EQH Management Committee. Ms. Burke, who resigned as our firm's COO and CFO in May 2023 (and from the EQH Management Committee), forfeited her awards and is ineligible for additional awards.
CEO Pay Ratio
In 2020,2023, the compensation of Mr. Bernstein, our President and CEO, was approximately 6165 times the median pay of our employees, resulting in a 61:65:1 CEO Pay Ratio.
We identified our median employee by examining 20202023 total compensation for all individuals, excluding Mr. Bernstein, who were employed by our firm as of December 31, 2020,2023, the last day of our payroll year. We included all of our employees in this process, whether employed on a full-time or part-time basis. We did not make any assumptions or estimates with respect to total compensation, but we did adjust compensation paid to our non-U.S. employees during our 20202023 fiscal year based on the average monthly exchange rates for the 12-monththree-month period ending September 30, 20202023 (data compiled in fourth quarter) between the local currencies in which such employees are paid and U.SU.S. dollars. We define “total compensation” as the aggregate of base salary (plus overtime, as applicable), commissions (as applicable), cash bonus and the grant date fair value of long-term incentive compensation awards.
After identifying the median employee based on total compensation, we calculated total compensation in 20202023 for such employee using the same methodology we use for our NEOs as set forth below in the Summary Compensation Table for 20202023.
As illustrated in the table below, our 20202023 CEO Pay Ratio is 61:1:65:1:
| | | | | | | | |
| Seth Bernstein | Median Employee |
| Base salary ($) | 500,000 | | 127,750 | |
| Cash bonus ($) | 4,015,000 | | 20,250 | |
Stock awards ($) (1) | 4,835,054 | | — | |
All other compensation ($) (2) | 52,509 | | 5,513 | |
| | |
| Total ($) | 9,402,563 | | 153,513 | |
| | |
| 2020 CEO Pay Ratio | 61:1 | |
_____________________
| | | | | | | | |
| Seth Bernstein | Median Employee |
| Base salary ($) | 500,000 | | 120,000 | |
| Cash bonus ($) | 4,515,000 | | 30,000 | |
Stock awards ($)(1) | 4,995,054 | | — | |
All other compensation ($)(2) | 114,201 | | 5,988 | |
| Total ($) | 10,124,255 | | 155,988 | |
| 2023 CEO Pay Ratio | 65:1 | |
(1)Includes (i) an award granted by AB of restricted AB Holding Units with a grant date fair value of $3,835,000$4,165,000 and (ii) awards granted by EQH with an aggregate grant date fair value of $1,000,053,$830,054, as more fully described above in “Compensation awarded by EQH to Mr. Bernstein.Bernstein, Mr. Erzan and Ms. Burke.”For additional information, please refer to the compensatory tables below in this Item 11.
(2)For a description of Mr. Bernstein’s other compensation, please refer to the Summary Compensation Table for 20202023 below. The median employee's other compensation consists of a $5,513 profit sharing plan contribution.
Other Compensation-Related Matters
AB and AB Holding are, respectively, private and public limited partnerships. They are subject to taxes other than federal and state corporate income tax ((see see “Structure-related“Structure-related Risks” in Item 1A and Note 21 to AB’s consolidated financial statements in Item 8). Accordingly, Section 162(m) of the Code, which limits tax deductions relating to executive compensation otherwise available to an entity taxed as a corporation, is not applicable to either AB or AB Holding for 2020.
Compensation Committee Interlocks and Insider Participation
Mr. Pearson is a director and the President and CEO of EQH, the parent company of the General Partner.
No executive officer of AB serves as (i) a member of a compensation committee or (ii) a director of another entity, an executive officer of which serves as a member of AB’s Compensation Committee.
Compensation Committee Report
The members of the Compensation Committee reviewed and discussed with management the Compensation Discussion and Analysis set forth above and, based on such review and discussion, recommended to the Board its inclusion in this Form 10-K.
| | | | | |
Kristi MatusCharles Stonehill (Chair) | Paul Audet |
Ramon de Oliveira | Daniel Kaye |
| Mark Pearson | |
| | | | | |
| 144 | Bertram ScottAllianceBernstein |
Summary Compensation Table for 2020
| | |
| Summary Compensation Table for 2023 |
|
Total compensation of our NEOs for 2020, 20192023, 2022 and 2018,2021, as applicable, is as follows:
| | | | | | | | | | | | | | | | | | | | | | | | | | | | | | | | | | | | | | | | | | | | |
Name and
Principal Position | | Year | | Salary($) | | Bonus($) | | Stock Awards(1)(2) ($) | | Option Awards(2)(3) ($) | | All Other
Compensation ($) | | Total($) |
Seth P. Bernstein(4)(5) | | 2020 | | 500,000 | | | 4,015,000 | | | 4,585,051 | | | 250,003 | | | 52,509 | | | 9,402,563 | |
| President and CEO | | 2019 | | 500,000 | | | 3,850,000 | | | 4,750,026 | | | 250,004 | | | 94,859 | | | 9,444,889 | |
| | 2018 | | 500,000 | | | 3,500,000 | | | 4,740,000 | | | — | | | 71,623 | | | 8,811,623 | |
| | | | | | | | | | | | | | |
Kate C. Burke(6) | | 2020 | | 300,000 | | | 1,665,000 | | | 1,285,000 | | | — | | | 19,517 | | 19517 | 3,269,517 | |
| Chief Operating Officer | | 2019 | | 300,000 | | | 1,415,000 | | | 1,035,000 | | | — | | | 60,716 | | | 2,810,716 | |
| | 2018 | | 300,000 | | | 785,000 | | | 4,440,009 | | | — | | | 14,200 | | | 5,539,209 | |
| | | | | | | | | | | | | | |
Ali Dibadj(7) | | 2020 | | 400,000 | | | 945,000 | | | 665,000 | | | — | | | 14,880 | | | 2,024,880 | |
| Head of Finance and Strategy | | | | | | | | | | | | | | |
| | | | | | | | | | | | | | |
| | | | | | | | | | | | | | |
Laurence E. Cranch(6) | | 2020 | | 400,000 | | | 940,000 | | | 660,000 | | | — | | | 17,958 | | | 2,017,958 | |
| General Counsel | | 2019 | | 400,000 | | | 940,000 | | | 660,000 | | | — | | | 17,708 | | | 2,017,708 | |
| | 2018 | | 400,000 | | | 940,000 | | | 4,660,009 | | | — | | | 92,276 | | | 6,092,285 | |
| | | | | | | | | | | | | | |
John C. Weisenseel(6) | | 2020 | | 375,000 | | | 1,147,500 | | | 842,500 | | | — | | | 16,824 | | | 2,381,824 | |
| CFO | | 2019 | | 375,000 | | | 1,147,500 | | | 842,500 | | | — | | | 15,677 | | | 2,380,677 | |
| | 2018 | | 375,000 | | | 1,147,500 | | | 4,842,509 | | | — | | | 68,433 | | | 6,433,442 | |
| | | | | | | | | | | | | | | | | | | | | | | | | | |
| Name and Principal Position | Year | Salary
($) | Bonus
($) | Stock Awards(1)(2) ($) | Option Awards
($) | Pension
($) | All Other
Compensation
($) | Total
($) |
Seth Bernstein(3) (4) President and CEO | 2023 | 500,000 | | 4,515,000 | | 4,995,054 | | — | | — | | 114,201 | | 10,124,255 | |
| 2022 | 500,000 | | 4,925,000 | | 5,575,062 | | — | | — | | 277,777 | | 11,277,839 | |
| 2021 | 500,000 | | 5,575,000 | | 6,075,000 | | — | | — | | 142,813 | | 12,292,813 | |
Bill Siemers(6) Interim CFO | 2023 | 300,000 | | 645,000 | | 255,000 | | — | | — | | 17,340 | | 1,217,340 | |
| 2022 | 300,000 | | 525,000 | | 1,175,034 | | — | | — | | 17,340 | | 2,017,374 | |
Karl Sprules COO | 2023 | 400,000 | | 2,025,000 | | 1,575,000 | | — | | 3,018 | | 32,294 | | 4,035,312 | |
| 2022 | 400,000 | | 1,555,000 | | 1,105,000 | | — | | 122,835 | | 17,860 | | 3,200,695 | |
| 2021 | 400,000 | | 1,725,000 | | 1,275,000 | | — | | — | | 42,040 | | 3,442,040 | |
Onur Erzan(5) (6) Head of Global Client Group and Private Wealth | 2023 | 400,000 | | 2,905,851 | | 2,555,887 | | — | | — | | 17,544 | | 5,879,282 | |
| 2022 | 400,000 | | 1,955,851 | | 1,605,886 | | — | | — | | 11,017 | | 3,972,754 | |
Mark Manley(6) General Counsel and Corporate Secretary | 2023 | 300,000 | | 780,000 | | 345,000 | | — | | 22,934 | | 26,898 | | 1,474,832 | |
| 2022 | 300,000 | 780,000 | 345,000 | — | | 482,194 | 26,898 | 1,934,092 |
Kate Burke(5) (7) Former COO and CFO | 2023 | 273,846 | | — | | 100,036 | | — | | — | | 632 | | 374,514 | |
| 2022 | 400,000 | | 2,050,000 | | 1,700,035 | | — | | — | | 16,216 | | 4,166,251 | |
| 2021 | 400,000 | | 2,275,000 | | 1,925,000 | | — | | — | | 15,455 | | 4,615,455 | |
(1)The figures in the “Stock Awards” column provide the aggregate grant date fair value of the awards calculated in accordance with FASB ASC Topic 718. For the assumptions made in determining the AB Holding Unit award values, see Note 19 to AB’s consolidated financial statements in Item 8.8. Assumptions made in determining the EQH restricted stock unit and performance share figures in the "Stock Awards" column are set forth in the EQH 2023 Long-Term Incentive Compensation Program and described in a footnote to the "Grants of Plan-Based Awards in 2023" table below.
(2)See “Grants of Plan-basedPlan-Based Awards in 2020”2023” below for information regarding the 2020 option award granted.
(3)See "Overview of Mr. Bernstein's Employment Agreement" and "Compensation Awarded by EQH to Mr. Bernstein.Bernstein, Mr. Erzan and Ms. Burke" above in CD&A for a description of Mr. Bernstein's compensatory elements. Please be advised that Mr. Bernstein's compensation also is disclosed by EQH.
(4)The "Stock Awards" column for 2023 includes the grant date fair value of the restricted stock award (grant date fair value of $332,029) and the performance share award (grant date fair value of $498,025) Mr. Bernstein received from EQH in February 2023. For 2022, this column includes the grant date fair value of the restricted stock unit award (grant date fair value of $400,033) and the performance share award (grant date fair value of $600,029) Mr. Bernstein received from EQH in February 2022. For 2021, this column includes the grant date fair value of the restricted stock unit award (grant date fair value of $340,000) and the performance share award (grant date fair value of $510,000) Mr. Bernstein received from EQH in February 2021.
(5)The "Stock Awards" column for 2023 includes the grant date fair value of the restricted stock unit award (grant date fair value of $40,024) and the performance share award (grant date fair value of $60,012) Mr. Erzan and Ms. Burke each received from EQH in February 2023. For 2022, this column includes the grant date fair value of the restricted stock unit award (grant date fair value of $40,021) and the performance share award (grant date fair value of $60,014) Mr. Erzan and Ms. Burke each received from EQH in February 2022. For 2021, this column includes the grant date fair value of the restricted stock unit award (grant date fair value of $40,000) and the performance share award (grant date fair value of $60,000) Ms. Burke received from EQH in February 2021.
(6)We have not provided 2021 compensation for Messrs. Siemers, Erzan, or Manley; they were not deemed NEOs in those years.
(7)Ms. Burke resigned as our firm's COO and CFO in May 2023 to become the President at another company. As a result, she forfeited all unvested AB and EQH awards granted to her in the current and previous years.
The “All Other Compensation” column includes the aggregate incremental cost to our company of certain other expenses and perquisites. For 2023, this column includes the following:
| | | | | | | | | | | | | | | | | |
| Name | Personal
Use of Car
and Driver
($) | Contributions
to Profit
Sharing Plan
($) | Life
Insurance
Premiums
($) | Other(2) ($) |
| Seth Bernstein | 94,113 | | (1) | 16,500 | | 3,564 | | 24 | |
| Bill Siemers | — | | | 15,000 | | 1,980 | | 360 | |
| Karl Sprules | — | | | 16,500 | | 4,002 | | 11,792 | |
| Onur Erzan | — | | | 16,500 | | 630 | | 414 | |
| Mark Manley | — | | | 15,000 | | 11,484 | | 414 | |
| Kate Burke | — | | | — | | 632 | | — | |
(1)Mr. Bernstein is entitled to the use of a dedicated car and driver pursuant to his employment agreement for security and business purposes. The amount reflects Mr. Bernstein's personal use for commuting and other non-business use. Car and driver services were contracted through a third party. The cost of providing a car is determined annually and includes, as applicable, the cost of the driver, annual car lease, insurance cost and various miscellaneous expenses such as fuel and car maintenance.
(2)These amounts represent stipends paid to Messrs. Bernstein, Siemers, Erzan, and Manley to help cover the cost of a mobile phone; these stipends are paid to employees generally as well. The amount set forth in the table for Mr. Sprules represents a stipend to help cover a portion of the housing cost in New York while traveling for business.
Grants of Plan-Based Awards in 2023
Grants of awards under the 2017 Plan, our equity compensation plan, during 2023 made to our NEOs are as follows (we also discuss awards issued by EQH to Mr. Bernstein, Mr. Erzan, and Ms. Burke below ):
| | | | | | | | | | | | | | | | | | | | |
| Grant Date | Estimated Future Payouts Under Equity Incentive Plan Awards(3) | All Other
Stock Awards:
Number of Shares
of Stock
or Units
(#) | Grant Date Fair Value of Stock Awards(1) ($) |
| Name | Threshold (#) | Target
(#) | Maximum (#) |
Seth Bernstein(2)(3) | 12/12/2023 | | | | 136,289 | | 4,165,000 | |
| 2/15/2023 | | | | 10,129 | | 332,029 | |
| 2/15/2023 | 3,187 | | 12,747 | | 25,494 | | 12,747 | | 498,025 | |
Bill Siemers(2) | 12/12/2023 | | | | 8,344 | | 255,000 | |
Karl Sprules(2) | 12/12/2023 | | | | 51,538 | | 1,575,000 | |
Onur Erzan(2)(3) | 12/12/2023 | | | | 80,362 | | 2,455,851 | |
| 2/15/2023 | | | | 1,221 | | 40,024 | |
| 2/15/2023 | 384 | | 1,536 | | 3,072 | | 1,536 | | 60,012 | |
Mark Manley(2) | 12/12/2023 | | | | 11,289 | | 345,000 | |
Kate Burke(3)(4) | 2/15/2023 | | | | 1,221 | | 40,024 | |
| 2/15/2023 | | | | 1,536 | | 60,012 | |
(1)This column provides the aggregate grant date fair value of the awards calculated in accordance with FASB ASC Topic 718. For the assumptions made in determining the AB Holding Unit values, see Note 19 to AB's consolidated financial statements in Item 8.
(2)As discussed above in “Overview of 2023 Incentive Compensation Program” and “Compensation Elements for NEOs—Long-Term Incentive Compensation Awards,” long-term incentive compensation awards granted in December 2023 to our NEOs were denominated in restricted AB Holding Units. These awards vest in equal annual increments on each of December 1, 2024, 2025 and 2026. These awards are shown in the “All Other Stock Awards” column of this table, the “Stock Awards” column of the Summary Compensation Table for 2023 and the “AB Holding Unit and/or EQH Awards” columns of the Outstanding Equity Awards at 2023 Fiscal Year-End Table.
(3)In February 2023, EQH granted to each of Mr. Bernstein, Mr. Erzan and Ms. Burke (i) a restricted stock unit award with a grant date fair value of $332,029, $40,024, and $40,024, respectively, and (ii) a performance share award with a grant date fair value of $498,025, $60,012, and $60,012, respectively, which can be earned subject to EQH's total stockholder return ("TSR") relative to its peer group. TSR is the total amount a company returns to investors during a designated period, including both share price appreciation and dividends. The number of performance shares that are earned, which cliff vest on February 28, 2026, subject to continued service, will be determined at the end of the performance period (December 2025) by multiplying the number of unearned performance shares by one of the following performance factors: 200% if EQH's TSR relative to its peers is in the 87.5th percentile or greater; 100% if in the 50th percentile; 25% if in the 30th percentile; and nothing if falls below the 30th percentile. EQH performance shares receive dividend equivalents subject to the same vesting schedule and performance conditions as the performance shares themselves. The restricted stock unit awards, which vest in equal annual increments on each of February 28, 2024, 2025 and 2026, subject to continued service, increase or decrease in value depending on the price of an EQH common share. EQH restricted stock units receive dividend equivalents subject to the same vesting schedule as the restricted stock units themselves.
(4)Ms. Burke forfeited these awards.
In 2023, the number of restricted AB Holding Units comprising year-end long-term incentive compensation awards granted to each NEO was determined based on the closing price of an AB Holding Unit as reported for NYSE composite transactions on December 12, 2023, the date as of which the Compensation Committee approved the awards. At the time of these awards, the Compensation Committee consisted of Mr. Stonehill (Chair) and Messrs. Kaye and Pearson; the Section 16 Subcommittee, which approved awards to our NEOs, consisted of Mr. Stonehill (Chair) and Mr. Kaye. For further information regarding the material terms of such awards, including the vesting terms and the formulas or criteria to be applied in determining the amounts payable, please refer to "Overview of 2023 Incentive Compensation Program" and "Compensation Elements for NEOs" above.
Outstanding Equity Awards at 2023 Fiscal Year-End
Outstanding equity awards held by our NEOs as of December 31, 2023 are as follows:
| | | | | | | | | | | | | | | | | | | | | | | |
| | Option Awards | | AB Holding Unit and/or EQH Awards |
| Name | Number of
Securities
Underlying
Unexercised
Options
Exercisable
(#) | Number of
Securities
Underlying
Unexercised
Options
Unexercisable
(#) | Option
Exercise
Price
($) | Option
Expiration
Date | | Number of
Shares
or Units of
Stock That
Have Not
Vested
(#) | Market Value of Shares or Units of Stock That Have Not Vested(11) ($) |
Seth Bernstein(1)(2)(3)(5) | 65,446 | | — | | 18.74 | | 2/14/2029 | | 278,875 | | 8,653,482 | |
| 57,209 | | — | | 23.18 | | 2/26/2030 | | 22,972 | | 764,964 | |
| — | | — | | — | | — | | | 38,731 | | 1,289,758 | |
Bill Siemers(6) | — | | — | | — | | — | | | 35,289 | | 1,095,017 | |
Karl Sprules(7) | — | | — | | — | | — | | | 87,882 | | 2,726,981 | |
Onur Erzan(4)(5)(8) | — | | — | | — | | — | | | 193,050 | | 5,990,341 | |
| — | | — | | — | | — | | | 2,589 | | 86,202 | |
| — | | — | | — | | — | | | 4,293 | | 142,944 | |
Mark Manley(9) | — | | — | | — | | — | | | 22,235 | | 689,951 | |
Kate Burke(5)(10) | — | | — | | — | | — | | | — | | — | |
(1)Mr. Bernstein was awarded: (i) 136,289 restricted AB Holding Units in December 2023 that are scheduled to vest in equal increments on each December 1, 2024, 2025 and 2026; (ii) 117,791 restricted AB Holding Units in December 2022, one-third of which vested on December 1, 2023, and the remainder of which is scheduled to vest in equal increments on each of December 1, 2024 and 2025; (iii) 102,572 restricted AB Holding Units in December 2021, one-third of which vested on each of December 1, 2022 and 2023, and the remainder of which is scheduled to vest on December 1, 2024; and (iv) 119,471 restricted AB Holding Units in December 2020, of which 25% vested on each of December 1, 2021, 2022 and 2023, and the remainder of which is scheduled to vest on December 1, 2024. For further information, see “Overview of Mr. Bernstein's Employment Agreement” above.
(2)EQH restricted stock unit awards, which are described for Mr. Bernstein in the second line of data in the above table, will vest ratably over their three-year vesting period subject to continued employment during the vesting period. EQH performance share awards, which are described in the third line of data in the above table, cliff vest on the third anniversary of grant date subject to continued employment during the vesting period and meeting the applicable performance criteria. In February 2023, 2022 and 2021, EQH granted to Mr. Bernstein (i) a restricted stock unit award with a grant date fair value of $332,029, $400,033 and $340,000, respectively, and (ii) a performance share award with a grant date fair value of $498,025, $600,029 and $510,000, respectively. The performance share awards granted in 2023, 2022 and 2021 can be earned subject to EQH's TSR relative to its peer group. Please see the table above entitled "Grants of Plan-Based Awards in 2023" for additional information regarding the EQH awards.
(3)The figuresoption awards described in the "Option Awards" column provides the grant date fair values of Mr. Bernstein's awards (whichtable were issued by EQH)EQH and calculated in accordance with FASB ASC Topic 718. The fair value of EQH stock options is calculated by EQH using the Black-Scholes option pricing model. The expected EQH dividend rate is based on market consensus. EQH share price volatility is estimated on the basis of implied volatility, which is checked by EQH against an analysis of historical volatility to ensure consistency. The effect of expected early exercise is accounted for through the use of an expected life assumption based on historical data.
(4)See "Overview of Mr. Bernstein's Employment Agreement" and "Compensation Awarded by EQH to Mr. Bernstein" above for a description of Mr. Bernstein's compensatory elements. Mr. Bernstein's compensation also is disclosed by EQH.
(5)The "Stock Awards" column for 2020 includes the grant date fair value of the restricted stock unit award (grant date fair valueawards, which are described for Mr. Erzan in the second line of $250,019) anddata in the above table, will vest ratably over their three-year vesting period subject to continued employment during the vesting period. EQH performance share award (grant date fair valueawards, which are described in the third line of $500,031) Mr. Bernstein received from EQHdata in February 2020. The "Stock Awards" column for 2019 includes the above table, cliff vest on the third anniversary of grant date fair value ofsubject to continued employment during the restricted stock unit award (grant date fair value of $250,010)vesting period and meeting the applicable performance share award (grant date fair value of $500,016) Mr. Bernstein received from EQH in February 2019. The "Stock Awards" column for 2018 includes the grant date fair value of the transaction incentive award Mr. Bernstein received from EQH in May 2018, which had a grant date fair value of $740,000.
(6)See "Relocation-related Performance Awards" above for a description of the restricted AB Holding Units awards granted to Ms. Burke, Mr. Cranch and Mr. Weisenseel.
(7)We have not provided 2019 or 2018 compensation for Mr. Dibadj as he was not a named executive officer in those years.
The “All Other Compensation” column includes the aggregate incremental cost to our company of certain other expenses and perquisites. For 2020, this column includes the following:
| | | | | | | | | | | | | | | | | | | | | | | | | | | | | | | | |
| Name | | Personal Use of Car and Driver
($) | | Contributions to Profit Sharing Plan ($) | | Life Insurance Premiums
($) | | Relocation and/or Financial Planning Assistance(2) ($) | | Other ($) |
| Seth P. Bernstein | | 11,007 | | (1) | 14,250 | | | 2,322 | | | 24,930 | | | — | |
| Kate C. Burke | | — | | | 14,250 | | | 450 | | | 4,817 | | | — | |
| Ali Dibadj | | — | | | 14,250 | | | 630 | | | — | | | — | |
| Laurence E. Cranch | | — | | | 14,250 | | | 3,708 | | | — | | | — | |
| John C. Weisenseel | | — | | | 14,250 | | | 2,574 | | | — | | | — | |
(1)The amount reflects the incremental cost to us attributable to commuting and other non-business use. We made available to Mr. Bernstein in the first half of 2020 a car and driver for security and business purposes. Car and driver services were contracted through a third party. The cost of providing a car is determined annually and includes, as applicable, driver compensation, annual car lease, insurance cost and various miscellaneous expenses such as fuel and car maintenance.
(2) The amount set forth in the table for Mr. Bernstein relates to financial/tax planning services, while the amount set forth in the table for Ms. Burke relates to our headquarters relocation to Nashville, TN.
Grants of Plan-based Awards in 2020
Grants of awards under the 2017 Plan, our equity compensation plan, during 2020 made to our NEO are as follows (we also discuss awards issued by EQH to Mr. Bernstein):
| | | | | | | | | | | | | | | | | | | | |
| Name | | Grant Date | | All Other Stock Awards:
Number of Shares of Stock
or Units (#) | | Grant Date Fair Value of Stock Awards(1) ($) |
Seth P. Bernstein(2)(3) | | 12/11/2020 | | 119,471 | | | 3,835,000 | |
| | 2/26/2020 | | 10,786 | | | 250,019 | |
| | 2/26/2020 | | 10,452 | | | 250,012 | |
| | 2/26/2020 | | 10,786 | | | 250,019 | |
Kate C. Burke(2) | | 12/11/2020 | | 40,032 | | | 1,285,000 | |
Ali Dibadj(2) | | 12/11/2020 | | 20,717 | | | 665,000 | |
Laurence E. Cranch(2) | | 12/11/2020 | | 20,561 | | | 660,000 | |
John C. Weisenseel(2) | | 12/11/2020 | | 26,247 | | | 842,500 | |
(1)This column provides the aggregate grant date fair value of the awards calculated in accordance with FASB ASC Topic 718. For the assumptions made in determining the AB Holding Unit values, see Note 19 to AB's consolidated financial statements in Item 8.
(2)As discussed above in “Overview of 2020 Incentive Compensation Program” and “Compensation Elements for NEOs—Long-Term Incentive Compensation Awards,” long-term incentive compensation awards granted in 2020 to our NEOs were denominated in restricted AB Holding Units. These awards are shown in the “All Other Stock Awards” column of this table, the “Stock Awards” column of the Summary Compensation Table for 2020 and the “AB Holding Unit Awards” columns of the Outstanding Equity Awards at 2020 Fiscal Year-End Table.
(3) criteria. In February 2020,2023, 2022 and 2021, respectively, EQH granted to Mr. BernsteinErzan (i) a restricted stock unit award with a grant date fair value of $250,019$40,024, $40,021 and $40,000, respectively and (ii) a performance share award with a grant date fair value of $500,031, approximately half of which can be earned subject to EQH's performance against specified non-GAAP financial targets$60,012, $60,014 and half of$60,000, respectively, which can be earned subject to EQH's total shareholder return relative to its peer group.Please see the table above entitled "Grants of Plan-Based Awards in 2023" for additional information regarding the EQH awards.
In 2020, the number of restricted AB Holding Units comprising long-term incentive compensation awards granted to each NEO was determined based on the closing price of an AB Holding Unit as reported for NYSE composite transactions on December 11, 2020, the date as of which the Compensation Committee approved the awards. At the time of these awards, the Compensation Committee consisted of Ms. Matus (Chair) and Messrs. Audet, de Oliveira, Kaye, Pearson and Scott; the Section 16 Subcommittee, which approved awards to our NEOs, consisted of Ms. Matus (Chair) and Messrs. Audet, de Oliveira, Kaye and Scott. For further information regarding the material terms of suchequity awards including the vesting termsgranted to Mr. Bernstein, Mr. Erzan and the formulas or criteria to be applied in determining the amounts payable,Ms. Burke by EQH, please refersee "Compensation awarded by EQH to "Overview of 2020 Incentive CompensationMr. Bernstein, Mr. Erzan and Ms. Burke" above in CD&A.
Part III
Program," "Other Factors Considered When Determining NEO Compensation," and "Compensation Elements for NEOs" above.
Outstanding Equity Awards at 2020 Fiscal Year-End
Outstanding equity awards held by our NEOs as of December 31, 2020 are as follows:
| | | | | | | | | | | | | | | | | | | | | | | | | | | | | | | | | | | | | | |
| | | Option Awards | | AB Holding Unit and/or EQH Awards |
| Name | | Number of Securities
Underlying Unexercised
Options Exercisable (#) | | Number of Securities Underlying Unexercised Options Unexercisable (#) | | Option Exercise Price ($) | | Option Expiration Date | | Number of Shares
or Units of Stock That
Have Not Vested (#) | | Market Value of Shares or Units of Stock That Have Not Vested(8) ($) |
Seth P. Bernstein(1)(2)(3) | | 21,816 | | | 43,630 | | | $18.74 | | 2/14/2029 | | 339,929 | | | 11,479,408 | |
| | — | | | 57,209 | | | 23.18 | | | 2/26/2030 | | 139,719 | | | 3,575,409 | |
Kate C. Burke(4) | | — | | | — | | | — | | | — | | | 231,185 | | | 7,807,123 | |
Ali Dibadj(5) | | — | | | — | | | — | | | — | | | 20,717 | | | 699,597 | |
Laurence E. Cranch(6) | | — | | | — | | | — | | | — | | | 208,559 | | | 7,043,022 | |
John C. Weisenseel(7) | | — | | | — | | | — | | | — | | | 185,139 | | | 6,252,150 | |
(1)(6)Subject to accelerated vesting clauses in the CEO Employment Agreement (e.g., immediate vesting upon a “change in control” of our firm), the award granted to Mr. Bernstein in May 2017 vests ratably on each of the first four anniversaries of May 1, 2017, commencing May 1, 2018, provided, with respect to each installment, Mr. Bernstein continues to be employed by AB on the vesting date. However, Mr. Bernstein elected to delay delivery of all of the restricted AB Holding Units until May 1, 2021, the final vesting date, subject to acceleration upon a “change in control” of our firm and certain qualifying events of termination of employment. Additionally, Mr. BernsteinSiemers was awarded: (i) 119,4718,344 restricted AB Holding Units in December 2020, which2023 that are scheduled to vest in equal increments on each of December 1, 2021, 2022, 20232024, 2025 and 2024;2026; and (ii) 139,1314,506 restricted AB Holding Units in December 2019,2022, of which 25%one-third vested on December 1, 20202023, and the remainder of which is scheduled to vest in equal increments on each of December 1, 2021, 20222024 and 2023;2025; and (iii) 149,86821,873 restricted AB Holding Units in March 2022 that are scheduled to cliff vest in February 2024. The total AB Holding Unit figure set forth in the table includes AB Holding Units granted in years prior to when Mr. Siemers was deemed to be a NEO.
(7)Mr. Sprules was awarded (i) 51,538 restricted AB Holding Units in December 2018, of which 25% vested2023 that are scheduled to vest in equal increments on each of December 1, 20192024, 2025 and 20202026; and (ii) 28,450 restricted AB Holding Units in December 2022, of which one-third vested on December 1, 2023, and the remainder of which is scheduled to vest in equal increments on each of December 1, 2024 and 2025; and (iii) 25,030 restricted AB Holding Units in December 2021, and 2022. For further information, see “Overviewone-third of Mr. Bernstein's Employment Agreement” above.
(2)EQH awarded to Mr. Bernstein: (i) in February 2020, options to buy 57,209 EQH shares, which are scheduled to vest in equal incrementsvested on each of February 26, 2021,December 1, 2022 and 2023; and, in February 2019, options to buy 65,446 EQH shares, of which one-third vested in February 2020December 1, 2023, and the remainder of which is scheduled to vest on December 1, 2024. The total AB Holding Unit figure set forth in equal increments on each of February 14, 2021 and 2022.the table includes AB Holding Units granted in years prior to when Mr. Sprules was deemed to be a NEO.
(3)(8)For further information regarding the equity awards granted to Mr. Bernstein by EQH, please see "Compensation awarded by EQH to Mr. Bernstein" above.
(4)Ms. BurkeErzan was awarded: (i) 40,03280,362 restricted AB Holding Units in December 2020, which2023 that are scheduled to vest in equal increments on each of December 1, 2021, 2022, 20232024, 2025 and 2024;2026; and (ii) 36,00038,771 restricted AB Holding Units in December 2019,2022, of which 25%one-third vested on December 1, 20202023, and the remainder of which is scheduled to vest in equal increments on each of December 1, 2021, 20222024 and 2023; (iii) 16,4862025. The total AB Holding Unit figure set forth in the table includes AB Holding Units granted in a year prior to when Mr. Erzan was deemed to be a NEO.
(9)Mr. Manley was awarded: (i) 11,289 restricted AB Holding Units in December 2018, of which 25% vested2023 that are scheduled to vest in equal increments on each of December 1, 20192024, 2025 and 20202026; and (ii) 8,883 restricted AB Holding Units in December 2022, of which one-third vested on December 1, 2023, and the remainder of which is scheduled to vest in equal increments on each of December 1, 20212024 and 2022; (iv) 151,803 restricted2025. The total AB Holding Unit figure set forth in the table includes AB Holding Units granted in April 2018, which are scheduledyears prior to cliff vest onwhen Mr. Manley was deemed to be a NEO.
(10)Ms. Burke had no outstanding awards as of December 1, 2022; and (v) 16,433 restricted31, 2023, because she forfeited her unvested AB Holding UnitsUnit and EQH share awards as a result of her resignation in December 2017, of which 25% vested on each of December 1, 2018, 2019 and 2020 and the remainder of which is scheduled to vest on December 1, 2021.May 2023.
(5)Mr. Dibadj was awarded 20,717 restricted AB Holding Units in December 2020, which are scheduled to vest in equal increments on each of December 1, 2021, 2022, 2023 and 2024.
(6)Mr. Cranch was awarded: (i) 20,561 restricted AB Holding Units in December 2020, which are scheduled to vest in equal increments on each of December 1, 2021, 2022, 2023 and 2024; (ii) 22,957 restricted AB Holding Units in December 2019, of which 25% vested on December 1, 2020 and the remainder of which is scheduled to vest in equal increments on each of December 1, 2021, 2022 and 2023; (iii) 24,728 restricted AB Holding Units in December 2018, of which 25% vested on each of December 1, 2019 and 2020 and the remainder of which is scheduled to vest in equal increments on each of December 1, 2021 and 2022; (iv) 151,803 restricted AB Holding Units in April 2018, which are scheduled to cliff vest on December 1, 2022; and (v) 26,453 restricted AB Holding Units in December 2017, of which 25% vested on each of December 1, 2018, 2019 and 2020 and the remainder of which is scheduled to vest on December 1, 2021.
(7)Mr. Weisenseel was awarded: (i) 26,247 restricted AB Holding Units in December 2020, which are scheduled to vest in equal increments on each of December 1, 2021, 2022, 2023 and 2024; (ii) 29,305 restricted AB Holding Units in December 2019, of which 25% vested on
December 1, 2020 and the remainder of which is scheduled to vest in equal increments on each of December 1, 2021, 2022 and 2023; (iii) 31,566 restricted AB Holding Units in December 2018, of which 25% vested on each of December 1, 2019 and 2020 and the remainder of which is scheduled to vest in equal increments on each of December 1, 2021 and 2022; (iv) 151,803 restricted AB Holding Units in April 2018, of which 113,266 AB Holding Units shall vest on September 30, 2021 and the remainder of which shall be forfeited as of that date pursuant to Mr. Weisenseel's retirement agreement (filed as an exhibit to Form 8-K filed with the SEC on August 26, 2020), and (v) 31,463 restricted AB Holding Units in December 2017, 25% of which vested on each of December 1, 2018, 2019 and 2020 and the remainder of which is scheduled to vest on December 1, 2021.
(8)(11)The market values of restricted AB Holding Units (rounded to the nearest whole unit) set forth in this column were calculated assuming a price per AB Holding Unit of $33.77,$31.03, which was the closing price on the NYSE of an AB Holding Unit on December 31, 2020,29, 2023, the last trading day of AB's last completed fiscal year. The market values of EQH shares set forth in this column were calculated assuming a price per share of $33.30, which was the closing price on the NYSE of an EQH share on December 29, 2023.
Option Exercises and AB Holding Units and EQH Shares Vested in 2020
AB Holding Units and EQH shares held by our NEOs that vested during 20202023 are as follows:
| | | | | | | | | | | | | | | | | | | | | | | | | | |
| | | AB Holding Option Awards | | AB Holding Unit Awards |
| Name | | Number of AB Holding Units Acquired on Exercise (#) | | Value Realized on Exercise ($) | | Number of AB
Holding
Units Acquired on
Vesting (#) | | Value Realized on
Vesting ($) |
| Seth P. Bernstein | | — | | | — | | | 72,250 | | | 2,355,350 | |
| Kate C. Burke | | — | | | — | | | 20,786 | | | 677,624 | |
| Ali Dibadj | | — | | | — | | | 71,574 | | | 2,333,312 | |
| Laurence E. Cranch | | — | | | — | | | 25,108 | | | 818,521 | |
| John C. Weisenseel | | — | | | — | | | 30,330 | | | 988,758 | |
| | | | | | | | | | | | | | | | | |
| | AB Holding Unit and EQH Option Awards | | AB Holding Unit and EQH Share Awards |
| Name | Number of AB Holding Units or EQH Options Acquired on Exercise
(#) | Value Realized
on Exercise
($) | | Number of AB Holding Units or EQH Shares
Acquired on
Vesting
(#) | Value Realized
on Vesting
($) |
Seth Bernstein (1) | — | | — | | | 177,203 | | 5,243,842 | |
| Bill Siemers | — | | — | | | 4,815 | | 140,071 | |
| Karl Sprules | — | | — | | | 35,861 | | 1,043,190 | |
Onur Erzan (2) | — | | — | | | 25,475 | | 743,185 | |
| Mark Manley | — | | — | | | 10,854 | | 315,754 | |
Kate Burke (2) | — | | — | | | 898 | | 28,245 | |
Pension Benefits
| | | | | | | | | | | | | | |
| Name | Plan Name | Number of Years of Credited Service(2) | Present Value of Accumulated Benefit ($)(3) | Payments During Last Fiscal Year |
Karl Sprules (1) | AB Retirement Plan | 11 | 125,853 | | — | |
Mark Manley(1) | AB Retirement Plan | 25 | 505,128 | | — | |
(1)We have provided information for Messrs. Sprules and Manley; they are the only of our NEOs who participate in the AB Retirement Plan. For additional information regarding the AB Retirement Plan, including actuarial assumptions and potential early retirement benefits, see "Defined Benefit Plan" above in CD&A and Note 18 to AB's consolidated financial statements in Item 8 of this Form 10-K.
Potential Payments upon Termination or Change in Control
Estimated payments and benefits to which our NEOs would have been entitled upon a change in control of AB or the specified qualifying events of termination of employment as of December 31, 20202023 are as follows:
| | | | | | | | | | | |
| Name and Trigger Event | Cash Payments(1) ($) | Acceleration of Restricted AB Holding Unit Awards(2) ($) | Other Benefits(3) ($) |
| Seth Bernstein | | | |
| Change in control | — | | 8,653,482 | | — | |
Termination by Mr. Bernstein for good reason(4) | 3,500,000 | | 8,653,482 | | 19,982 | |
Termination of Mr. Bernstein's employment by AB other than for Cause or due to Death or Disability(5)(6)(7) | 5,250,000 | | 8,653,482 | | 19,982 | |
Change in control + termination by Mr. Bernstein for good reason or termination of Mr. Bernstein's employment without cause(4) | 7,000,000 | | 8,653,482 | | 19,982 | |
Resignation (complies with applicable agreements and restrictive covenants) under ICAP(8) | — | | 8,653,482 | | — | |
Death or disability(7) | — | | 8,653,482 | | 19,982 | |
| Bill Siemers | | | |
| Change in control | — | | 1,095,017 | | — | |
| Change in control + employment terminated by AB other than for cause, termination by Mr. Siemers for good reason, or termination due to death or disability | 1,890,000 | | 1,095,017 | | — | |
Resignation, retirement or termination by AB without cause (complies with applicable agreements and restrictive covenants) under ICAP; death or disability under ICAP; excludes 2022 RSU award)(7)(8) | — | | 416,298 | | — | |
| Termination by AB without cause; death or disability (2022 RSU award) | — | | 621,999 | | — | |
| Karl Sprules | | | |
| Change in control | — | | 2,726,981 | | — | |
| Change in control + employment terminated by AB other than for cause, termination by Mr. Sprules for good reason, or termination due to death or disability | 4,850,000 | | 2,726,981 | | — | |
Resignation, retirement or termination by AB without cause (complies with applicable agreements and restrictive covenants) under ICAP; death or disability under ICAP(7)(8) | — | | 2,726,981 | | — | |
| | | | | | | | | | | | | | | | | | | | |
| Name and Reason for Employment Termination | | Cash Payments(1) ($) | | Acceleration of Restricted AB Holding Unit Awards(2)($) | | Other Benefits (3)($) |
| Seth P. Bernstein | | | | | | |
| Change in control | | — | | | 11,479,408 | | | — | |
Termination by Mr. Bernstein for good reason(4) | | 3,500,000 | | | 11,479,408 | | | 22,631 | |
Termination of Mr. Bernstein's employment by AB other than for Cause or due to Death or Disability (including 2017 Award)(4)(5)(6) | | 5,250,000 | | | 11,479,408 | | | 22,631 | |
Change in control + termination by Mr. Bernstein for good reason or termination of Mr. Bernstein's employment without cause(4) | | 7,000,000 | | | 11,479,408 | | | 22,631 | |
Resignation (complies with applicable agreements and restrictive covenants) under ICAP(2) | | — | | | 10,088,877 | | — | |
Death or disability(7) | | — | | | 11,479,048 | | 22,631 | |
| Kate C. Burke | | | | | | |
| Change in control | | — | | | 7,807,123 | | | — | |
| Change in control + employment terminated by AB other than for cause, termination by Ms. Burke for good reason, or termination due to death or disability | | 3,930,000 | | | 7,807,123 | | | — | |
Resignation, retirement or termination by AB without cause (complies with applicable agreements and restrictive covenants) under ICAP; death or disability under ICAP; excludes 2018 RSU award)(2) | | — | | | 2,680,735 | | | — | |
Termination by AB without cause; death or disability (2018 RSU award)(8) | | — | | | 2,992,932 | | | — | |
| Ali Dibadj | | | | | | |
| Change in control | | — | | | 699,597 | | | — | |
| Change in control + employment terminated by AB other than for cause, termination by Mr. Dibadj for good reason, or termination due to death or disability | | 2,690,000 | | | 699,597 | | | — | |
Resignation, retirement or termination by AB without cause (complies with applicable agreements and restrictive covenants) under ICAP; death or disability under ICAP(2) | | — | | | 699,597 | | | — | |
| Laurence E. Cranch | | | | | | |
| Change in control | | — | | | 7,043,022 | | | — | |
| Change in control + employment terminated by AB other than for cause, termination by Mr. Cranch for good reason, or termination due to death or disability | | 2,680,000 | | | 7,043,022 | | | — | |
Resignation, retirement or termination by AB without cause (complies with applicable agreements and restrictive covenants) under ICAP; death or disability under ICAP; excludes 2018 RSU award(2) | | — | | | 1,916,635 | | | — | |
Termination by AB without cause; death or disability (2018 RSU award)(8) | | — | | | 2,992,932 | | | — | |
John C. Weisenseel(9) | | | | | | |
| Change in control | | — | | | 7,553,544 | | | — | |
| Change in control + employment terminated by AB other than for cause, termination by Mr. Weisenseel for good reason, or termination due to death or disability | | 3,045,000 | | | 7,553,544 | | | — | |
Resignation, retirement or termination by AB without cause (complies with applicable agreements and restrictive covenants) under ICAP; death or disability under ICAP; excludes 2018 RSU award(2) | | — | | | 2,427,157 | | | — | |
Termination by AB without cause; death or disability (2018 RSU award)(8) | | — | | | 2,992,932 | | | — | |
| | | | | | | | | | | |
| Name and Trigger Event | Cash Payments(1) ($) | Acceleration of Restricted AB Holding Unit Awards(2) ($) | Other Benefits(3) ($) |
| Onur Erzan | | | |
| Change in control | — | | 5,990,341 | | — | |
| Change in control + employment terminated by AB other than for cause, termination by Mr. Erzan for good reason, or termination due to death or disability | 6,611,702 | | 5,990,341 | | — | |
Resignation, retirement or termination by AB without cause (complies with applicable agreements and restrictive covenants) under ICAP; death or disability under ICAP; excludes 2021 RSU award)(7)(8) | — | | 3,657,258 | | — | |
| Termination by AB without cause; death or disability (2021 RSU award) | — | | 1,783,738 | | — | |
| Mark Manley | | | |
| Change in control | — | | 689,951 | | — | |
| Change in control + employment terminated by AB other than for cause, termination by Mr. Manley for good reason, or termination due to death or disability | 2,160,000 | | 689,951 | | — | |
Resignation, retirement or termination by AB without cause (complies with applicable agreements and restrictive covenants) under ICAP; death or disability under ICAP)(7)(8) | — | | 689,951 | | — | |
Kate Burke(9) | — | | — | | — | |
(1)It is possible that each NEO could receive a cash severance payment on the termination of his or her employment.employment that is not contemplated in the CIC Plan. The amounts of any such cash severance payments would be determined at the time of such termination (other than for Mr. Bernstein), so we are unable to
estimate such amounts. The amounts shown for Mr. Bernstein are described in the CEO Employment Agreement. The amountamounts shown for Mr. Weisenseel is taken from his retirement agreement, into which he enteredSiemers, Mr. Sprules, Mr. Erzan, and Mr. Manley in August 2020 andthe event of a change in control coupled with respect to which his retirement date has been set as September 30, 2021.termination of employment are described in the CIC Plan.
(2)See Notes 2 and 19 in AB’s consolidated financial statements in Item 8 and “Compensation Elements for NEOs – Long-Term“Long-Term Incentive Compensation Awards” above in CD&A for a discussion of the terms set forth in long-term incentive compensation award agreements relating to termination of employment.employment.
(3)Reflects the value of group medical coverage to which Mr. Bernstein would be entitled.
(4)See "Overview of Mr. Bernstein's Employment Agreement" abovefor a discussion of the terms set forth in the CEO Employment Agreement relating to termination of employment.
(5)The CEO Employment Agreement defines “Disability” as a good faith determination by AB that Mr. Bernstein is physically or mentally incapacitated and has been unable for a period of 180 days in the aggregate during any 12-month period to perform substantially all of the duties for which he is responsible immediately before the commencement of the incapacity.
(6)Under the CEO Employment Agreement, upon termination of Mr. Bernstein’s employment due to death or disability, and after the COBRA period, AB will provide Mr. Bernstein and his spouse with access to participation in AB’s medical plans at Mr. Bernstein’s (or his spouse’s) sole expense based on a reasonably determined fair market value premium rate.
(7)“Disability” is defined in the ICAP award agreements of each NEO as the inability to engage in any substantial gainful activity by reason of any medically determinable physical or mental impairment that can be expected to last for a continuous period of not less than 12 months, as determined by the carrier of the long-term disability insurance program maintained by AB or its affiliate that covers the NEO.
(8)For additional information relating toApplicable agreements and restrictive covenants in the restricted AB Holding UnitICAP award issued to each of Ms. Burke, Mr. Cranchagreement include restrictions on competition and Mr. Weisenseel in April 2018, please refer to "Relocation-related Performance Awards" above.restrictions on employee and client solicitation.
(9)For information relating to Mr. Weisenseel's compensatory benefits under his retirement agreement, which contemplates his retiringMs. Burke resigned as our firm's COO and CFO in May 2023, so she was ineligible for any potential payment or benefit upon a change in control of AB as of September 30, 2021, please refer to "CFO Retirement Agreement" above.December 31, 2023.
Additionally, estimated payments and benefits to which Mr. Bernstein or Mr. Erzan would have been entitled upon a change in control of EQH or the specified qualifying events of termination of employment as of December 31, 20202023 are as follows (these amounts would be payable by EQH):
| | | | | |
| Reason for Employment Termination | Acceleration of EQH Option and Share Awards(5) ($) |
| Seth Bernstein | |
Death Retirement(1)
| 2,891,8361,577,051 | |
Death(2) | 2,361,437 | |
Disability(1)(2) | 2,891,8362,361,437 | |
Involuntary termination (no change in control)(2)(3) | 262,8951,577,051 | |
Change in control (without termination of employment) (3)(4) | 2,282,1651,152,710 | |
| Onur Erzan | |
Death(2) | 265,232 | |
Disability(2) | 265,232 | |
Involuntary termination of employment or termination by Mr. Bernstein for good reason (no change in control)(3) | 2,282,165133,146 | |
Change in control (without termination of employment)(4) | 132,176 | |
Kate Burke(6) | — | |
(1)Reflects, the combined value, as of December 31, 2020, associated with Mr. Bernstein's: (i) transaction incentive award in 2018; (ii)2023, the full value of the restricted stock unit award and performance share award granted to Mr. Bernstein in 2021 and option award in 2019; and (ii)2022. Excludes restricted stock unit award,awards and performance share awardawards granted in 2023 due to minimum vesting requirements.
(2)Reflects, as of December 31, 2023, the full value associated with awards granted by EQH to Mr. Bernstein (since 2021) and option award in 2020.Mr. Erzan (since 2021); restricted stock unit awards (to each officer); and performance share awards (to each officer). For additional information regarding these awards, please see the Summary Compensation Table in 2020, the Grantfor 2023, Grants of Plan-based Awards table in 20202023 and the Outstanding Equity at 20202023 Fiscal Year End table above in this Item 11.
(2)Reflects the value, as of December 31, 2020, associated with Mr. Bernstein's transaction incentive award in 2018.
(3)Reflects, as of December 31, 2020,2023, (i) the full value associated with Mr. Bernstein's option awards in 2019 and 2020, and (ii) pro-rated portions of Mr. Bernstein's transaction incentive award in 2018 and, in 2019 and 2020, histhe restricted stock unit awards and performance share awards basedgranted by EQH to Mr. Bernstein in 2021 and 2022, and (ii) the prorated value of the restricted stock unit awards and performance share awards granted by EQH to Mr. Erzan in 2021 and 2022. Restricted stock unit awards and performance share awards granted to Mr. Bernstein and Mr. Erzan in 2023 are excluded until a minimum of one year of vesting is reached.
(4)Reflects, as of December 31, 2023, (i) the full value of the restricted stock unit awards granted to Mr. Bernstein (in 2021, 2022 and 2023) and to Mr. Erzan (in 2021, 2022 and 2023), and (ii) the prorated value of the performance share awards granted to Mr. Bernstein (in 2021, 2022, and 2023) and to Mr. Erzan (in 2021, 2022 and 2023), with actual and projected performance factors applied for 2021 and 2022 grants.
(5)Acceleration of EQH awards is contingent on the termsaward recipient's compliance with various agreements and conditionsrestrictive covenants set forth in the applicable award agreement under the EQH 2023 Long-Term Incentive Compensation Program, including protection of these awards.confidential information, non-competition, non-solicitation of employees and non-solicitation of customers.
Director Compensation in 2020
During 2020,2023, we compensated our directors, who satisfied applicable NYSE and SEC standards relating to independence (“Independent Directors”), as follows:
| | Name | Name | | Fees Earned or Paid in Cash($) | | Stock Awards(1)(2) ($) | | Total($) | Name | Fees Earned or Paid in Cash
($) | Stock Awards(1)(2) ($) | Total
($) |
| Ramon de Oliveira | | 152,000 | | | 170,000 | | | 322,000 | |
| Paul Audet | | 108,500 | | | 170,000 | | | 278,500 | |
| Nella Domenici | | 102,500 | | | 240,860 | | | 343,360 | |
| Joan Lamm-Tennant | |
Nella Domenici (3) | |
| Daniel Kaye | Daniel Kaye | | 96,000 | | | 170,000 | | | 266,000 | |
| Kristi Matus | Kristi Matus | | 127,000 | | | 170,000 | | | 297,000 | |
| Das Narayandas | Das Narayandas | | 96,000 | | | 170,000 | | | 266,000 | |
| Bertram Scott | | 24,481 | | | 111,860 | | | 136,341 | |
| Charles Stonehill | Charles Stonehill | | 127,500 | | | 170,000 | | | 297,500 | |
| Todd Walthall | |
(1)The aggregate number of restricted AB Holding Units underlying awards outstanding but not yet distributed at December 31, 20202023, was: for:for Ms. Domenici, 9,520 AB Holding Units; Ms. Matus, 10,739Lamm-Tennant, 8,861 AB Holding Units; for each of Messrs. de Oliveira and Kaye, 14,694Ms. Domenici, 12,297 AB Holding Units; for eachMr. Kaye, 11,711 AB Holding Units; for Ms. Matus, zero AB Holding Units as she departed the Board in May of Messrs. Audet and2023; for Mr. Narayandas, 15,45111,711 AB Holding Units; for Mr. Stonehill, 11,711 AB Holding Units; and for Mr. Stonehill, 11,534Walthall, 9,061 AB Holding Units.
(2)Reflects the aggregate grant date fair value of the awards calculated in accordance with FASB ASC Topic 718. For the assumptions made in determining these values, see Note 19 to AB’s consolidated financial statements in Item 8.
Independent Director Compensation
The Board has approved the compensation elements described immediately below for Independent Directors during its regular meeting held in May 2023 and has agreed to re-consider such compensation elements periodically:
•an annual retainer of $85,000$90,000 (paid quarterly after any quarter during which an Independent Director serves on the Board; annual retainers relating to Committee service, as described below,, are paid quarterly in arrears as well);
•a fee of $5,000 for participating in any meeting of the Board, whether in person or by telephone, in excess of the four regularly-scheduled Board meetings each year;
•a fee of $2,000 for participating in any meeting of any duly constituted committee of the Board, whether in person or by telephone, in excess of the number of regularly-scheduled committee meetings each year (i.e., in excess of eight meetings of the Audit Committee and four meetings of each of the Executive Committee, the Compensation Committee and the Governance Committee);
•an annual retainer of $50,000 for acting as Independent Chair of the Board;
•an annual retainer of $25,000$37,500 for acting as Chair of the Audit Committee;
•an annual retainer of $12,500$20,000 for acting as Chair of the Compensation Committee;
•an annual retainer of $12,500$13,500 for acting as Chair of the Governance Committee;
•an annual retainer of $12,500 for serving as a member of the Audit Committee;
•an annual retainer of $6,000 for serving as a member of the Executive Committee;
•an annual retainer of $6,000$9,000 for serving as a member of the Compensation Committee;
•an annual retainer of $6,000$3,000 for serving as a member of the Governance Committee; and
•an annual equity-based grantunder an equity compensation plan consisting of restricted AB Holding Units with a grant date fair value of $170,000.
At the regular meeting of the Board held in May 2020,In 2023, the Board granted to each Independent Director then serving (which included Mses. Domenici and MatusLamm-Tennant and Messrs. Audet, de Oliveira, Kaye, Narayandas, Stonehill and Stonehill) 7,176Walthall) 5,017 restricted AB Holding Units. The number of AB Holding Units granted was determined by dividing the $170,000 grant date fair value noted above by the closing price of an AB Holding Unit on the date of the May 20202023 Board Meeting, or $23.69$33.89 per unit, rounded up to the nearest whole unit. These awards vest ratably on each of the first fourthree anniversaries of the grant date, which generally is consistent with AB employee equity awards.
Additionally, the Board granted to Mr. Scott, who joined the Board as of September 23, 2020, 4,750 restricted AB Holding Units. The number of AB Holding Units granted was determined by dividing the grant date fair value (a pro-rated version of the
$170,000 typically awarded based on the date as of which Mr. Scott joined the Board) by the closing price of an AB Holding Unit on September 23, 2020, or $27.01 per unit. This award vests ratably on each of the first four anniversaries of the grant date.
Also, at the regular meeting of the Board held in November 2019, the Board granted to Ms. Domenici, who joined the Board as of January 1, 2020, 2,344 restricted AB Holding Units. The number of AB Holding Units granted was determined by dividing the grant date fair value (a pro-rated version of the $170,000 typically awarded based on the date as of which Ms. Domenici joined the Board) by the closing price of an AB Holding Unit on January 2, 2020, or $30.23 per unit. This award also vests ratably on each of the first four anniversaries of the grant date.
Further, in order to avoid any perception that our directors’ exercise of their fiduciary duties might be impaired, restricted AB Holding Unit grants to Independent Directors are not forfeitable, except if the director is terminated for “Cause,” as that term is defined in the 2017 Plan or the applicable award agreement. Accordingly, restricted AB Holding Units generally are delivered as soon as administratively feasible following an Independent Director’s resignation from the Board.
Equity grants to Independent Directors generally are made at the May meeting of the Board. The date of the May meeting is set by the Board the previous year.at least a year in advance.
The General Partner may reimburse any director for reasonable expenses incurred in connection with attendance at Board meetings as well as additional Board responsibilities. AB Holding and AB, in turn, reimburse the General Partner for expenses incurred by the General Partner on their behalf, including amounts in respect of directors’ fees and expenses. These reimbursements are subject to any relevant provisions of the AB Holding Partnership Agreement and the AB Partnership Agreement.
Independent Director AB Holding Unit Ownership Guidelines
Each Independent Director, by the later of five years from the initial implementation date of these guidelines (February 2018) and the date as of which the director's tenure on the Board begins, shall accumulate, either through accumulating AB Holding Units awarded by the Board or purchasing Units on the open market, AB Holding Units with a market value equal to five (5) times the director's annual retainer. Each Independent Director must maintain this ownership level for the duration of the director's tenure on the Board.
As of December 31, 2023, each Independent Director then serving either complied with this policy or was on track to do so within the allotted time.
Item 12. 12. Security Ownership of Certain Beneficial Owners and Management and Related Stockholder Matters
Securities Authorized for Issuance under Equity Compensation Plans
AB Holding Units to be issued pursuant to our equity compensation plans as of December 31, 20202023 are as follows:
| | |
|
| Equity Compensation Plan Information |
|
Equity Compensation Plan Information | | | | | | | | | | | | | | |
| Plan Category | Number of
securities to
be issued upon
exercise of
outstanding
options, warrants
and rights | Weighted average
exercise price
of outstanding
options, warrants
and rights | Number of securities remaining available for future issuance(1) |
| Equity compensation plans approved by security holders | — | | | — | | 27,261,843 | |
| Equity compensation plans not approved by security holders | — | | | — | | — | |
| Total | — | | | — | | 27,261,843 | |
| | | | | | | | | | | | | | | | | | | | |
| Plan Category | | Number of securities to be issued upon exercise of outstanding options, warrants and rights | | Weighted average exercise price of outstanding options, warrants and rights | | Number of securities remaining available for future issuance(1) |
| Equity compensation plans approved by security holders | | 148,985 | | | $ | 23.61 | | | 35,555,594 | |
| Equity compensation plans not approved by security holders | | — | | | — | | | — | |
| Total | | 148,985 | | | $ | 23.61 | | | 35,555,594 | |
(1)All AB Holding Units remaining available for future issuance will be issued pursuant to the 2017 Plan, which was approved during a Special Meeting of AB Holding Unitholders held on September 29, 2017.
There are no AB Units to be issued pursuant to an equity compensation plan.
For information about our equity compensation plans, see Note 19 to AB’s consolidated financial statements in Item 8.
Principal Security Holders
As of December 31, 2020,2023, we had no information that any person beneficially owned more than 5% of the outstanding AB Units, except as reported by EQH and certain of its subsidiaries on Schedule 13D/A with the SEC on March 25, 2019 pursuant to the Exchange Act.subsidiaries. We have prepared the following table, and the note that follows, in reliance on such filing:information supplied by EQH:
| | | | | | | | | | | | | | | | | | | | |
| Name and Address of Beneficial Owner | | Amount and Nature of
Beneficial Ownership
Reported on Schedule | | Percent of Class |
Equitable Holdings(1) 1290 Avenue of the Americas New York, NY 10104 | | 170,121,745 | | (1) | | 63.3 | | (1) |
| | | | | | | | | | | | | | |
| Name and Address of Beneficial Owner | Amount and Nature of
Beneficial Ownership
Reported on Schedule | Percent of
Class |
Equitable Holdings(1) 1290 Avenue of the Americas New York, NY 10104 | 177,127,982 | | (1) | 61.2 | % | (1) |
(1)By reason of their relationships, EQH and its subsidiaries that hold AB Units may be deemed to share the power to vote or to direct the vote and to dispose or direct the disposition of all or a portion of the 170,121,745 issued and outstandingthese AB Units. The 63.3%61.2% includes the 1%1.0% general partnership interest held by EQH.
As of December 31, 2020,2023, AB Holding was the record owner of 98,322,942,114,436,091, or 36.3%39.9%, of the issued and outstanding AB Units (or 36.0%39.5% including the 1%1.0% general partnership interest held by EQH).
Management
As of December 31, 2020,2023, the beneficial ownership of AB Holding Units by each director and NEO of the General Partner and by all directors and executive officers as a group is as follows:
| | | | | | | | | | | | | | |
| Name of Beneficial Owner | | Number of AB
Holding Units and
Nature of
Beneficial
Ownership | | Percent of Class |
Ramon de Oliveira(1) | | 26,365 | | | * |
Seth P. Bernstein(1)(2) | | 569,663 | | | * |
| Paul L. Audet | | 22,331 | | | * |
| Nella L. Domenici | | 9,520 | | | * |
Jeffrey J. Hurd(1) | | — | | | * |
Daniel G. Kaye(1) | | 26,365 | | | * |
Nick Lane(1) | | — | | | * |
Kristi A. Matus(1) | | 11,926 | | | * |
| Das Narayandas | | 22,331 | | | * |
Mark Pearson(1) | | — | | | * |
Bertram L. Scott(1) | | 4,142 | | | * |
Charles G.T. Stonehill(1) | | 12,986 | | | * |
Kate C. Burke(1)(3) | | 244,994 | | | * |
Ali Dibadj(1)(4) | | 128,345 | | | * |
Laurence E. Cranch(1)(5) | | 235,857 | | | * |
John C. Weisenseel(1)(6) | | 279,568 | | | * |
All directors and executive officers as a group (16 persons)(7) | | 1,594,393 | | | 1.6 | % |
| | | | | | | | |
| Name of Beneficial Owner | Number of AB
Holding Units and
Nature of Beneficial
Ownership | Percent of Class |
Joan Lamm-Tennant(1) | 11,233 | | * |
Seth Bernstein(1)(2) | 678,934 | | * |
| Nella Domenici | 22,865 | | * |
Jeffrey Hurd(1) | — | | * |
Daniel Kaye(1) | 39,710 | | * |
Nick Lane(1) | — | | * |
| Das Narayandas | 35,676 | | * |
Mark Pearson(1) | — | | * |
Charles Stonehill(1) | 24,931 | | * |
| Todd Walthall | 11,635 | | * |
Onur Erzan(1)(3) | 214,184 | | * |
Karl Sprules(1)(4) | 181,798 | | * |
Mark Manley(1)(5) | 95,535 | | * |
Bill Siemers(1)(6) | 75,311 | | * |
All directors and executive officers as a group (14 persons)(7) | 1,391,812 | | 1.2% |
* Number of AB Holding Units listed represents less than 1% of the Units outstanding.
(1)Excludes AB Holding Units beneficially owned by EQH and its subsidiaries. Ms. MatusLamm-Tennant and Messrs. Bernstein, de Oliveira, Hurd, Kaye, Lane, Pearson Scott and Stonehill, each is a director and/or officer of EQH, Equitable Financial and/or Equitable America. Ms. Burke and Messrs. Bernstein, Dibadj, CranchErzan, Sprules, Manley and WeisenseelSiemers each is a director and/or officer of the General Partner.
(2)Includes 538,392422,300 restricted AB Holding Units that have not yet vested or with respect to which Mr. Bernstein has deferred delivery. See “Overview of Mr. Bernstein's Employment Agreement – Compensation Elements – Restricted AB Holding Units,” “Grants of Plan-based Awards in 2020”2023” and “Outstanding Equity Awards at 20202023 Fiscal Year-End” in Item 11 for additional information.
(3)Includes 231,185193,050 restricted AB Holding Units granted to Mr. Erzan that have not yet vested. For information regarding Ms. Burke'sMr. Erzan's long-term incentive compensation awards, see “Relocation-related Performance Awards,” “Grants"Grants of Plan-based Awards in 2020”2023” and “Outstanding Equity Awards at 20202023 Fiscal Year-End” in Item 11.
(4)Includes 20,71787,882 restricted AB Holding Units awardedgranted to Mr. DibadjSprules that have not yet vested. For information regarding Mr. Dibadj'sSprules's long-term incentive compensation awards, see "Grants“Grants of Plan-based Awards in 2020”2023" and “Outstanding Equity Awards at 20202023 Fiscal Year-End” in Item 11.
(5)Includes 226,70322,235 restricted AB Holding Units granted to Mr. Manley that have not yet vested or with respect to which he has deferred delivery.vested. For information regarding Mr. Cranch'sManley's long-term incentive compensation awards, see “Relocation-related Performance Awards,” “Grants of Plan-based Awards in 2020”2023” and “Outstanding Equity Awards at 20202023 Fiscal Year-End” in Item 11.
(6)Includes 260,83335,289 restricted AB Holding Units granted to Mr. Siemers that have not yet vested or with respect to which he has deferred delivery.vested. For information regarding Mr. Weisenseel’sSiemers's long-term incentive compensation awards, see “Relocation-related Performance Awards,” “Grants of Plan-based Awards in 2020”2023” and “Outstanding Equity Awards at 20202023 Fiscal Year-End” in Item 11.
(7)Includes 1,277,830760,756 restricted AB Holding Units awarded to the executive officers as a group as long-term incentive compensation that have not yet vested and/or with respect to which the executive officer has deferred delivery.
As of December 31, 2020,2023, our directors and executive officers did not beneficially own any AB Units.
As of December 31, 2020,2023, the beneficial ownership of the common stock of EQH by each director and named executive officer of the General Partner and by all directors and executive officers as a group is as follows:
| | | | | | | | | | | | | | |
| Name of Beneficial Owner | | Number of Shares and
Nature of Beneficial
Ownership | | Percent of Class |
Ramon de OliveiraJoan Lamm-Tennant | | 48,82335,574 | | | * |
Seth P. Bernstein(1) | | 86,547224,647 | | | * |
Paul L. Audet | | — | | | * |
Nella L. Domenici | | — | | | * |
Jeffrey J. Hurd(2) | | 305,635355,420 | | | * |
Daniel G. Kaye | | 41,51453,757 | | | * |
Nick Lane(3) | | 171,688276,308 | | | * |
Kristi A. Matus | | 18,682 | | | * |
| Das Narayandas | | 2,000— | | | * |
Mark Pearson(4) | | 929,3991,394,226 | | | * |
Bertram L. Scott | | 21,514 | | | * |
Charles G.T. Stonehill | | 22,51434,758 | | | * |
Kate C. BurkeTodd Walthall | | — | | * |
Onur Erzan(5) | 3,342 | | * |
Ali DibadjKarl Sprules | | — | | | * |
Laurence E. CranchMark Manley | | — | | | * |
John C. WeisenseelBill Siemers | | — | | | * |
All directors and executive officers as a group (16(14 persons)(5)(6) | | 1,648,3162,378,032 | | | * |
*Number of shares listed represents less than 1% of the outstanding EQH common stock.
(1)Includes (i) 62,701122,655 options Mr. Bernstein has the right to exercise within 60 days and (ii) 8,43911,946 restricted stock units that will vest within 60 days and settle in EQH shares.
(2)Includes (i) 214,288209,833 options Mr. Hurd has the right to exercise within 60 days and (ii) 23,37028,332 restricted stock units that will vest within 60 days and settle in EQH shares and (iii) 43,184 EQH performance shares that will be paid out within 60 days.shares.
(3)Includes (i) 121,037109,417 options Mr. Lane has the right to exercise within 60 days and (ii) 27,01231,932 restricted stock units that will vest within 60 days and settle in EQH shares.
(4)Includes (i) 601,308726,400 options Mr. Pearson has the right to exercise within 60 days and (ii) 71,612128,942 restricted stock units that will vest within 60 days and settle in EQH shares.
(5)Includes 1,344 restricted stock units that Mr. Erzan will vest within 60 days and settle in EQH shares.
(6)Includes 1,168,305 options that may be exercised and 202,496 restricted stock units that will vest within 60 days and settle in EQH shares and (iii) 92,365 EQH performance shares that will be paid out within 60 days.
(5)Includes 999,334 options that may be exercised, 130,433 restricted stock units that will vest within 60 days and 135,549 EQH performance shares that will be paid out within 60 days for the directors and executive officers as a group.
Partnership Matters
The General Partner makes all decisions relating to the management of AB and AB Holding. The General Partner has agreed that it will conduct no business other than managing AB and AB Holding, although it may make certain investments for its own account. Conflicts of interest, however, could arise between AB and AB Holding, the General Partner and the Unitholdersof both Partnerships.
Section 17-403(b) of the Delaware Revised Uniform Limited Partnership Act (“(“Delaware Act”) states in substance that, except as provided in the Delaware Act or the applicable partnership agreement, a general partner of a limited partnership has the liabilities of a general partner in a general partnership governed by the Delaware Uniform Partnership Law (as in effect on July 11, 1999) to the partnership and to the other partners. In addition, as discussed below, Sections 17-1101(d) and 17-1101(f) of the Delaware Act generally provide that a partnership agreement may limit or eliminate fiduciary duties a partner may be deemed to owe to the limited partnership or to another partner, and any related liability, provided that the partnership agreement may not limit or eliminate the implied contractual covenant of good faith and fair dealing. Accordingly, while under Delaware
law a general partner of a limited partnership is liable as a fiduciary to the other partners, those fiduciary obligations may be altered by the terms of the applicable partnership agreement. Each of the AB Partnership Agreement and AB Holding Partnership Agreement (each, a “Partnership Agreement” and, together, the “Partnership Agreements”) sets forth limitations on the duties and liabilities of the General Partner. Each Partnership Agreement provides that the General Partner is not liable for monetary damages for errors in judgment or for breach of fiduciary duty (including breach of any duty of care or loyalty), unless it is established (the person asserting such liability having the burden of proof) that the General Partner’s action or failure to act involved an act or omission undertaken with deliberate intent to cause injury, with reckless disregard for the best interests of the Partnerships or with actual bad faith on the part of the General Partner, or constituted actual fraud. Whenever the Partnership Agreements provide that the General Partner is permitted or required to make a decision (i) in its “discretion” or under a grant of similar authority or latitude, the General Partner is entitled to consider only such interests and factors as it desires and has no duty or obligation to consider any interest of or other factors affecting the Partnerships or any Unitholder of AB or AB Holding or (ii) in its “good faith” or under another express standard, the General Partner will act under that express standard and will not be subject to any other or different standard imposed by either Partnership Agreement or applicable law or in equity or otherwise. Each Partnership Agreement further provides that to the extent that, at law or in equity, the General Partner has duties (including fiduciary duties) and liabilities relating thereto to either Partnership or any partner, the General Partner acting under either Partnership Agreement, as applicable, will not be liable to the Partnerships or any partner for its good faith reliance on the provisions of the Partnership Agreement.
In addition, each Partnership Agreement grants broad rights of indemnification to the General Partner and its directors, officers and affiliates and authorizes AB and AB Holding to enter into indemnification agreements with the directors, officers, partners, employees and agents of AB and its affiliates and AB Holding and its affiliates. The Partnerships have granted broad rights of indemnification to officers and employees of AB and AB Holding. The foregoing indemnification provisions are not exclusive, and the Partnerships are authorized to enter into additional indemnification arrangements. AB and AB Holding have obtained directors and officers/errors and omissions liability insurance.
Each Partnership Agreement also allows transactions between AB and AB Holding and the General Partner or its affiliates,as we describe in “Policies and Procedures Regarding Transactions with Related Persons” in Item 13,, so long as such transactions are on an arms-length basis. The Delaware courts have held that provisions in partnership or limited liability company agreements that permit affiliate transactions so long as they are on an arms-length basis operate to establish a contractually-agreed-to fiduciary duty standard of entire fairness on the part of the general partner or manager in connection with the approval of affiliate transactions. Also, each Partnership Agreement expressly permits all affiliates of the General Partner to compete, directly or indirectly, with AB and AB Holding, as we discuss in “Competition” in Item 1.1. The Partnership Agreements further provide that, except to the extent that a decision or action by the General Partner is taken with the specific intent of providing an improper benefit to an affiliate of the General Partner to the detriment of AB or AB Holding, there is no liability or obligation with respect to, and no challenge of, decisions or actions of the General Partner that would otherwise be subject to claims or other challenges as improperly benefiting affiliates of the General Partner to the detriment of the Partnerships or otherwise involving any conflict of interest or breach of a duty of loyalty or similar fiduciary obligation.
Section 17-1101(c) of the Delaware Act provides that it is the policy of the Delaware Act to give maximum effect to the principle of freedom of contract and to the enforceability of partnership agreements. Further, Section 17-1101(d) of the Delaware Act provides in part that to the extent that, at law or in equity, a partner has duties (including fiduciary duties) to a limited partnership or to another partner, those duties may be expanded, restricted, or eliminated by provisions in a partnership agreement (provided that a partnership agreement may not eliminate the implied contractual covenant of good faith and fair dealing). In addition, Section 17-1101(f) of the Delaware Act provides that a partnership agreement may limit or eliminate any or all liability of a partner to a limited partnership or another partner for breach of contract or breach of duties (including fiduciary duties); provided, however, that a partnership agreement may not limit or eliminate liability for any act or omission that constitutes a bad faith violation of the implied contractual covenant of good faith and fair dealing. Decisions of the Delaware courts have recognized the right of parties, under the above provisions of the Delaware Act, to alter by the terms of a partnership agreement otherwise applicable fiduciary duties and liability for breach of duties. However, the Delaware courts
have required that a partnership agreement make clear the intent of the parties to displace otherwise applicable fiduciary duties (the otherwise applicable fiduciary duties often being referred to as “default” fiduciary duties). Judicial inquiry into whether a partnership agreement is sufficiently clear to displace default fiduciary duties is necessarily fact driven and is made on a case by case basis. Accordingly, the effectiveness of displacing default fiduciary obligations and liabilities of general partners continues to be a developing area of the law and it is not certain to what extent the foregoing provisions of the Partnership Agreements are enforceable under Delaware law.
Item 13.Certain Relationships and Related Transactions, and Director Independence
Policies and Procedures Regarding Transactions with Related Persons
Each Partnership Agreement expressly permits EQH and its affiliatessubsidiaries (collectively, “EQH Affiliates”), to provide services to AB and AB Holding if the terms of the transaction are approved by the General Partner in good faith as being comparable to (or more favorable to each such Partnership than) those that would prevail in a transaction with an unaffiliated party. This requirement is conclusively presumed to be satisfied as to any transaction or arrangement that (i) in the reasonable and good faith judgment of the General Partner meets that unaffiliated party standard, or (ii) has been approved by a majority of those directors of the General Partner who are not also directors, officers or employees of an affiliate of the General Partner.
In practice, our management pricing committees review investment advisory agreements with EQH Affiliates, which is the manner in which the General Partner reaches a judgment regarding the appropriateness of the fees. Other transactions with EQH Affiliates are submitted to the Audit Committee for their review and approval. (See “Committees of the Board” in Item 10 for details regarding the Audit Committee.) We are not aware of any transaction during 20202023 between our company and any related person with respect to which these procedures were not followed.
Our relationships with EQH Affiliates also are subject to applicable provisions of the insurance laws and regulations of New York and other states. Under such laws and regulations, the terms of certain investment advisory and other agreements we enter into with EQH Affiliates are required to be fair and equitable and charges or fees for services performed must be reasonable. Also, in some cases, the agreements are subject to regulatory approval.
We have written policies regarding the employment of immediate family members of any of our related persons. Compensation and benefits for all of our employees is established in accordance with our human resourcespeople practices, taking into consideration the defined qualifications, responsibilities and nature of the role.
Financial Arrangements with EQH Affiliates AXA and Certain of its Subsidiaries
The General Partner has, in its reasonable and good faith judgment (based on its knowledge of, and inquiry with respect to, comparable arrangements with or between unaffiliated parties), approved the following arrangements with EQH Affiliates as being comparable to, or more favorable to AB than, those that would prevail in a transaction with an unaffiliated party.
See Note 12 Debt to AB’s consolidated financial statements in Item 8 for disclosures related to our credit facility with EQH. Significant transactions between AB and related persons during 20202023 are as follows (the first table summarizes services we provide to related persons and the second table summarizes services our related persons provide to us):
| | | | | | | | | | | |
Parties(1) | General Description of Relationship(2) | Amounts Received
Accrued for in 20202023 |
| (in thousands) | |
| Equitable Financial | We provide investment management services and ancillary accounting, valuation, reporting, treasury and other services to the general and separate accounts of Equitable Financial and its insurance company subsidiaries. | | $ | 87,388,000134,205 | |
| EQAT and Equitable Premier VIP Trust | We serve as sub-adviser to these open-end mutual funds, each of which is sponsored by a subsidiary of Equitable Holdings. | | $21,466 | | 26,963,000 |
| AXA Life Invest(3)
| We provide investment management, distribution and shareholder servicing-related services. | $ | 16,182,000 |
AXA France(3)
| | $ | 17,394,000 | |
AXA Life Japan Limited(3)
| | $ | 14,942,000 | |
AXA Germany(3)
| | $ | 7,835,000 | |
AXA Switzerland Life(3)
| | $ | 5,979,000 | |
AXA Rosenberg Asia Pacific(3)
| | $ | 5,878,000 | |
AXA Winterthur(3)
| | $ | 3,514,000 | |
AXA Belgium(3)
| | $ | 3,391,000 | |
| | | | | | | | |
Equitable AmericaHoldings | | | $10,694 | | 2,128,000 |
| AXA Hong Kong Life(3)
| | $ | 2,018,000 |
| AXA Insurance UK Non Direct Regulated(3)
| | $ | 1,851,000 |
| XL Group Investments Ltd(3)
| $ | 1,276,000 | |
Architas Multi-Manager UK(3)
| | $ | 1,262,000 | |
AXA Mediterranean(3)
| | $ | 1,589,000 | |
AXA U.K. Group Pension Scheme(3)
| | $ | 837,000 | |
AXA Insurance Ltd(3)
| | $ | 805,000 | |
AXA China(3)
| | $ | 664,000 | |
AXA General Insurance Hong Kong Ltd(3)
| | $ | 458,000 | |
AXA Corporate Solutions | | $ | 455,000 | |
AXA Switzerland Property and Casualty(3)
| | $ | 394,000 | |
AXA Insurance Company(3)
| | $ | 287,000 | |
AXA Spain Property and Casualty(3)
| | $ | 189,000 | |
AXA General Insurance Hong Kong Ltd.(3)
| | $ | 175,000 | |
AXA Life Singapore (3)
| | $ | 156,000 | |
| | |
Parties(1) | General Description of Relationship | Amounts Paid
Accrued for in 20202023 |
| (in thousands) |
| | | |
AXAEquitable Holdings | Distributes certain of our Retail Products andProducts; provides Private Wealth Management referrals. | $ | 14,848,000 | |
Equitable Advisors | Distributes certain of our Retail Products and provides Private Wealth Management referrals. | $ | 3,952,000 | |
AXA Business Services Pvt. Ltd.(3)
| Provides data processing services and support for certain investment operations functions. | $ | 6,799,000 | |
AXA Technology Services India Pvt.(3)
| Provides certain data processing services and functions. | $ | 1,951,000 | |
Equitable Advisors | Sellsreferrals; sells shares of our mutual funds under Distribution Service and educationalEducational Support agreements.agreements; includes us as insured under various insurance policies. | | $ | 5,463,00046,654 | |
| Equitable Holdings | We are covered by various insurance policies maintained by Equitable Holdings. | $ | 2,281,000 |
AXA Group Solutions(3)
| Provides certain data processing services and functions. | $ | 150,000 | |
(1)AB or one of its subsidiaries is a party to each transaction.
(2)We provide investment management services unless otherwise indicated.
(3)This entity is a subsidiary of AXA.
Arrangements with Immediate Family Members of Related Persons
During 2020,2023, we did not have arrangements with immediate family members of our directors and executive officers.
Director Independence
See “Independence of Certain Directors” in Item 10.
Item 14.Principal Accounting Fees and Services
Fees for professional audit services rendered by PricewaterhouseCoopers LLP (“("PwC”") for the audit of AB’s and AB Holding’s annual financial statements for 20202023 and 2019,2022, respectively, and fees for other services rendered by PwC are as follows:
| | 2020 | | 2019 |
| (in thousands) |
| 2023 | | | 2023 | 2022 |
| (in thousands) | | | (in thousands) |
Audit fees(1) | Audit fees(1) | $ | 6,616 | | | $ | 6,263 | |
Audit-related fees(2) | Audit-related fees(2) | 3,188 | | | 3,130 | |
Tax fees(3) | Tax fees(3) | 1,222 | | | 1,320 | |
All other fees(4) | All other fees(4) | 6 | | | 6 | |
| Total | Total | $ | 11,032 | | | $ | 10,719 | |
(1)Includes $61,982$69,702 and $59,313$66,383 paid for audit services to AB Holding in 20202023 and 2019,2022, respectively.
(2)Audit-related fees consist principally of fees for audits of financial statements of certain employee benefit plans, internal control reviews and accounting consultation.
(3)Tax fees consist of fees for tax consultation and tax compliance services.
(4)All other fees in 2020 and 2019 consistedconsist primarily of miscellaneous non-audit services.
The Audit Committee has a policy to pre-approve audit and non-audit service engagements with the independent registered public accounting firm. The independent registered public accounting firm must provide annually a comprehensive and detailed schedule of each proposed audit and non-audit service to be performed. The Audit Committee then affirmatively indicates its approval of the listed engagements. Engagements that are not listed but that are of similar scope and size to those listed and approved may be deemed to be approved, if the fee for such service is less than $100,000. In addition, the Audit Committee has delegated to its chairman the ability to approve any permissible non-audit engagement where the fees are expected to be less than $100,000.
Item 15. Exhibits, Financial Statement Schedules
(a)There is no document filed as part of this Form 10-K.
Financial Statement Schedule.
Attached to this Form 10-K is a schedule describing Valuation and Qualifying Account-Allowance for Doubtful Accounts for the three years ended December 31, 2020, 20192023, 2022 and 2018.
(b)Exhibits.
The following exhibits required to be filed by Item 601 of Regulation S-K are filed herewith or incorporated by reference herein, as indicated:
| | | | | | | | |
| Exhibit | | Description |
| 3.01 | | | |
| 3.02 | | | |
| 3.03 | | | |
| 3.04 | | | |
| 3.05 | | | |
| 3.06 | | | |
| 3.07 | | | |
| 3.08 | | | |
| 4.01 | | | |
| 10.01 | | | |
| 10.02 | | | |
| 10.03 | | | |
| 10.04 | | | |
| 10.05 | | |
|
| 10.06 | | | |
| | | | | |
| Exhibit | Description |
| 10.07 | |
10.07 10.08 | |
| 10.09 | |
10.08 10.10 | |
| 10.11 | |
| 10.12 | |
| 10.13 | |
10.09 | | | |
10.10 | 10.14 | |
10.11 | | 10.15 | |
10.12 | | 10.16 | |
| | | | | | | | |
Exhibit | | Description |
10.13 | | 10.17 |
|
10.14 | | 10.18 | |
10.15 | | | |
10.16 | | 10.19 | |
10.17 | | 10.20 | |
10.18 | | | |
10.19 | | 10.21 | |
10.20 | | 10.22 | |
10.21 | | 10.23 | |
10.22 | | 10.24 | |
10.23 | | 10.25 | |
| | | | | |
10.24 2023 Annual Report | 163 |
| | | | | |
| Exhibit | Description |
| 10.26 | |
10.25 | | 10.27 | Commercial Paper Dealer Agreement 4(a)(2) Program, dated as of JuneNovember 1, 2015,2023, between AllianceBernstein L.P., as Issuer, and Credit Suisse Securities (USA) LLC,Barclays Capital Inc., as Dealer (incorporated by reference to Ex. 10.09 to Form 10-K for the fiscal year ended December 31, 2015, as filed February 11, 2016).Dealer. |
10.26 10.28 | | | Commercial Paper Dealer Agreement 4(a)(2) Program, dated as of June 1, 2015, between AllianceBernstein L.P., as Issuer, and Merrill Lynch, Pierce, Fenner & Smith Incorporated, as Dealer.(incorporatedDealer (incorporated by reference to ExhibitEx. 10.10 to Form 10-K for the fiscal year ended December 31, 2015, as filed February 11, 2016). |
10.27 10.29 | | | |
10.28 10.30 | | | |
| 21.01 | | | |
| 23.01 | | | |
| 31.01 | | | |
| 31.02 | | | |
| 32.01 | | | |
| 32.02 | | | |
101.INS97.01 | |
| 101.INS | XBRL Instance Document - the instance document does not appear in the Interactive Data File because its XBRL tags are embedded within the Inline XBRL document. |
| | | | | | | | |
Exhibit | | Description |
| 101.SCH | | XBRL Taxonomy Extension Schema. |
| 101.CAL | | XBRL Taxonomy Extension Calculation Linkbase. |
| 101.LAB | | XBRL Taxonomy Extension Label Linkbase. |
| 101.PRE | | XBRL Taxonomy Extension Presentation Linkbase. |
| 101.DEF | | XBRL Taxonomy Extension Definition Linkbase. |
| 104 | | | The cover page from the Company's Annual Report on Form 10-K for the year ended December 31, 2020,2023, formatted in Inline XBRL (included in Exhibit 101). |
| * | | Denotes a compensatory plan or arrangement |
Item 16. Form 10-K Summary
None.
| | |
Item 16.Form 10-K Summary
None.
Signatures |
|
Pursuant to the requirements of Section 13 or 15(d) of the Exchange Act, the Registrant has duly caused this report to be signed on its behalf by the undersigned, thereunto duly authorized.
| | | | | | | | |
| | AllianceBernstein L.P. |
| | | |
Date: February 11, 20219, 2024 | By: | /s/ Seth P. Bernstein |
| | | Seth P. Bernstein |
| | | President & Chief Executive Officer |
Pursuant to the requirements of the Exchange Act, this report has been signed by the following persons on behalf of the Registrant and in the capacities and on the dates indicated.
| | | | | | | | |
Date: February 11, 20219, 2024 | | /s/ John C. Weisenseel |
| | John C. Weisenseel |
| | Chief Financial Officer |
| | | | | | | | |
Date: February 11, 2021 | | /s/ William R.Bill Siemers |
| | | William R.Bill Siemers |
| | | Interim Chief Financial Officer |
| | | | | | | | |
| Date: February 9, 2024 | | /s/ Thomas Simeone |
| | Thomas Simeone |
| | Controller and& Chief Accounting Officer |
Directors
| | | | | | | | |
/s/ Seth P. Bernstein | | /s/ Ramon de OliveiraJoan Lamm-Tennant |
Seth P. Bernstein | | Ramon de OliveiraJoan Lamm-Tennant |
President and& Chief Executive Officer | | ChairmanChair of the Board |
| | |
/s/ Paul L. Audet | | /s/ Nella L. Domenici |
Paul L. Audet | | Nella L. Domenici |
Director | | Director |
| | |
/s/ Jeffrey J. Hurd | | /s/ Daniel G. Kaye |
Jeffrey J. Hurd | | Daniel G. Kaye |
| Director | | Director |
| | |
| /s/ Nick Lane | | /s/ Kristi A. MatusDas Narayandas |
| Nick Lane | | Kristi A. MatusDas Narayandas |
| Director | | Director |
| | |
/s/ Das Narayandas | | /s/ Mark Pearson | | /s/ Charles Stonehill |
Das Narayandas | | Mark Pearson |
| Director | Director |
| | |
/s/ Bertram L. Scott | | /s/ Charles G.T. Stonehill |
Bertram L. Scott | | Charles G. T. Stonehill |
| Director | | Director |
| | |
| /s/ Todd Walthall | | |
| Todd Walthall | | |
| Director | | |
| | |
SCHEDULE II
AllianceBernstein L.P.
Valuation and Qualifying Account - Allowance for Doubtful Accounts
For the Three Years Ending December 31, 2020, 20192023, 2022 and 20182021
| | | | | | | | | | | | | | | | | | | | | | | | | | | | | | | | |
| Description | | Balance at Beginning
of Period | | Credited to
Costs and
Expenses | | Deductions | | | | Balance at End
of Period |
| | | (in thousands) |
| For the year ended December 31, 2020 | | $ | 309 | | | $ | 100 | | | $ | 98 | | | (a) | | $ | 311 | |
| | | | | | | | | | |
| For the year ended December 31, 2019 | | $ | 395 | | | $ | 132 | | | $ | 218 | | | (b) | | $ | 309 | |
| | | | | | | | | | |
| For the year ended December 31, 2018 | | $ | 411 | | | $ | 0 | | | $ | 16 | | | (c) | | $ | 395 | |
| | | | | | | | | | | | | | | | | | | | | | | | | | | | | | | | |
| Description | | Balance at Beginning
of Period | | Credited to
Costs and
Expenses | | Deductions | | Balance at End
of Period |
| | | (in thousands) |
| For the year ended December 31, 2023 | | $ | 232 | | | $ | 72 | | | $ | 5 | | | (a) | | $ | 299 | |
| | | | | | | | | | |
| For the year ended December 31, 2022 | | $ | 328 | | | $ | — | | | $ | 96 | | | (b) | | $ | 232 | |
| | | | | | | | | | |
| For the year ended December 31, 2021 | | $ | 311 | | | $ | — | | | $ | (17) | | | (c) | | $ | 328 | |
(a)Includes accounts written-off as uncollectible of $98.$5.
(b)Includes accounts written-off as uncollectible of $218$96.
(c)Includes a net addition to the allowance balance of $28 and accounts written-off as uncollectible of $16.$11.