UNITED STATES
SECURITIES AND EXCHANGE COMMISSION
WASHINGTON, DC 20549
FORM 10-K
(Mark One)
| | | | | |
| ☒ | ANNUAL REPORT PURSUANT TO SECTION 13 OR 15(d) OF THE SECURITIES EXCHANGE ACT OF 1934 |
For the fiscal year ended December 31, 20222023
OR
| | | | | |
| ¨ | TRANSITION REPORT PURSUANT TO SECTION 13 OR 15(d) OF THE SECURITIES EXCHANGE ACT OF 1934 |
ForFor the transition period from ______ to _____
Commission File Number: 001-39965
ON24, INC.
(Exact Namename of Registrantregistrant as Specifiedspecified in its Charter)charter)
| | | | | |
| Delaware | 94-3292599 |
(State or other jurisdiction of
incorporation or organization) | (I.R.S. Employer
Identification No.) |
50 Beale Street, 8th Floor, San Francisco, CA | 94105 |
| (Address of principal executive offices) | (Zip Code) |
Registrant’s telephone number, including area code: (415) 369-8000
Securities registered pursuant to Section 12(b) of the Act:
| | | | | | | | | | | | | | |
| Title of each class | | Trading Symbol(s) | | Name of each exchange on which registered |
| Common Stock, par value $0.0001 per share | | ONTF | | New York Stock Exchange |
Securities registered pursuant to Section 12(g) of the Act: None
Indicate by check mark if the Registrant is a well-known seasoned issuer, as defined in Rule 405 of the Securities Act). Yes ¨ No x.
Indicate by check mark if the Registrant is not required to file reports pursuant to Section 13 or 15(d) of the Act. Yes ¨ No x.
Indicate by check mark whether the registrant (1) has filed all reports required to be filed by Section 13 or 15(d) of the Securities Exchange Act of 1934 during the preceding 12 months (or for such shorter period that the registrant was required to file such reports), and (2) has been subject to such filing requirements for the past 90 days. Yes x No ¨
Indicate by check mark whether the registrant has submitted electronically every Interactive Data File required to be submitted pursuant to Rule 405 of Regulation S-T (§232.405 of this chapter) during the preceding 12 months (or for such shorter period that the registrant was required to submit such files). Yes x No ¨
Indicate by check mark whether the registrant is a large accelerated filer, an accelerated filer, a non-accelerated filer, smaller reporting company, or an emerging growth company. See the definitions of “large accelerated filer,” “accelerated filer,” “smaller reporting company,” and “emerging growth company” in Rule 12b-2 of the Exchange Act.
| | | | | | | | | | | | | | |
| Large accelerated filer | ¨ | | Accelerated filer | x |
| Non-accelerated filer | ¨ | | Smaller reporting company | ¨ |
| | | Emerging growth company | x |
If an emerging growth company, indicate by check mark if the registrant has elected not to use the extended transition period for complying with any new or revised financial accounting standards provided pursuant to Section 13(a) of the Exchange Act. ☐
Indicate by check mark whether the registrant has filed a report on and attestation to its management’s assessment of the effectiveness of its internal control over financial reporting under Section 404(b) of the Sarbanes-Oxley Act (15 U.S.C. 7262(b)) by the registered public accounting firm that prepared or issued its audit report. ☐
If securities are registered pursuant to Section 12(b) of the Act, indicate by check mark whether the financial statements of the registrant included in the filing reflect the correction of an error to previously issued financial statements.statements. ¨
Indicate by check mark whether any of those error corrections are restatements that required a recovery analysis of incentive-based compensation received by any of the registrant’s executive officers during the relevant recovery period pursuant to §240.10D-1(b) ¨
Indicate by check mark whether the registrant is a shell company (as defined in Rule 12b-2 of the Exchange Act). Yes ☐ No x
The aggregate market value of the registrant’s common stock held by non-affiliates of the registrant based upon the closing sale price on the New York Stock Exchange as of June 30, 2022,2023, the last business day of the registrant’s most recently completed second fiscal quarter, was approximately $361 million.$246 million.
As of March 3, 2023,5, 2024, the registrant had 47,430,26441,674,056 shares of common stock outstanding.
DOCUMENTS INCORPORATED BY REFERENCE
Portions of the registrant’s definitive Proxy Statement for the 20222024 Annual Stockholders’ Meeting, which the registrant expects to file with the Securities and Exchange Commission within 120 days of December 31, 2022,2023, are incorporated by reference into Part III (Items 10, 11,12, 13 and 14) of this Annual Report on Form 10-K.
Table of Contents | | | | | | | | |
| | Page |
| |
| | |
| | |
| Item 1. | | |
| Item 1A | | |
| Item 1B | | |
| Item 1C | | |
| Item 2 | | |
| Item 3 | | |
| | |
| | |
| | |
| Item 5 | | |
| Item 6 | | |
| Item 7 | | |
| Item 7A | | |
| Item 8 | | |
| Item 9 | | |
| Item 9A | | |
| Item 9B | | |
| Item 9C | | |
| | |
| | |
| Item 10 | | |
| Item 11. | | |
| Item 12. | | |
| Item 13. | | |
| Item 14. | | |
| | |
| | |
| Item 15. | | |
| Item 16. | | |
| | |
| | |
| | |
SPECIAL NOTE REGARDING FORWARD-LOOKING STATEMENTS
This Annual Report on Form 10-K, or this Report, contains forward-looking statements that are based on our management’s beliefs and assumptions and on information currently available to our management. The forward-looking statements are contained principally in, but not limited to, the sections titled “Risk Factors,” and “Management’s Discussion and Analysis of Financial Condition and Results of Operations.” Forward-looking statements include all statements that are not historical facts and can be identified by terms such as “anticipates,” “believes,” “could,” “seeks,” “estimates,” “expects,” “intends,” “may,” “plans,” “potential,” “predicts”, “projects,” “should,” “will,” “would” or similar expressions and the negatives of those terms. Forward-looking statements include, but are not limited to, statements about:about
•our ability to grow our revenue;
•our ability to attract new customers and expand sales to existing customers.
•fluctuation in our performance, our history of net losses and any increases in our expenses;
•competition and technological development in our markets and any decline in demand for our solutions or generally in our markets;
•adverse general economic and market conditions and spending on sales and marketing technology;
•our ability to expand our sales and marketing capabilities and otherwise manage ourachieve growth;
•the impact of the COVID-19 pandemic and future variantsresumption of the virusin-person marketing activities on our customer growth rate, which has declined in recent periods and may decline in future periods compared to 2022, as the impact of COVID-19 lessens and our customers and their users increasingly resume in-person marketing activities;rate;
•disruptions, interruptions, outages or other issues with our technology or our use of third-party services, data connectors and data centers;
•the impact of the security incident involving ransomware that we experienced or any other cybersecurity-related attack, significant data breach or disruption of the information technology systems or networks on which we rely;
•our sales cycle, our international presence and our timing of revenue recognition from our sales;
•interoperability with other devices, systems and applications;
•compliance with data privacy, import and export controls, customs, sanctions and other laws and regulations;
•intellectual property matters, including any infringements of third-party intellectual property rights by us or infringement of our intellectual property rights by third parties; and
•the market for, trading price of and other matters associated with our common stock.
Forward-looking statements involve known and unknown risks, uncertainties and other factors that may cause our actual results, performance or achievements to be materially different from any future results, performance or achievements expressed or implied by the forward-looking statements. We discuss these risks in greater detail in the section entitled “Risk Factors” and elsewhere in this Report. Given these uncertainties, you should not place undue reliance on these forward-looking statements. Also, forward-looking statements represent our management’s beliefs and assumptions only as of the date of this Report. You should read this Report completely and with the understanding that our actual future results may be materially different from what we expect.
Except as required by law, we assume no obligation to update these forward-looking statements publicly, or to update the reasons actual results could differ materially from those anticipated in these forward-looking statements, even if new information becomes available in the future.
PART I
Item 1. Business.
Overview
Our mission is to transform the way businesses drive revenue and customer engagement through data-rich digital experiences.
We provide a leading, cloud-based intelligent engagement platform for digital engagement that deliverscombines best-in-class experiences with personalization and content, to enable sales and marketing organizations to capture and act on connected insights for revenue growth through interactive webinar experiences, virtual event experiences and multimedia content experiences.at scale. Our platform’s portfolio of interactive personalized and content-richhyper-personalized digital experience products creates and captures actionable, real-time data at scale from millions of professionals every month to provide businesses with buying signals and behavioral insights to efficiently convert prospects into customers.
Similar to what has taken place in the business-to-consumer, or B2C, market, our platform for digitalintelligent engagement empowers business-to-business, or B2B, companies with insights to better personalize their engagement. Large social media platforms have been successful at leveraging experiences and insights of consumers on their platforms to enable B2C companies to effectively understand their potential consumers. While these have been effective in the B2C market, B2B companies often lack deep insights about prospective customers to effectively understand and engage them.
Businesses today primarily use automatedtraditional sales and marketing solutions, such as digital advertising and email, for marketing. While these automatedtraditional solutions reach large numbers of prospective customers, they have generally failed to deepen customer engagement because they were designed with the simple purpose of pushing marketing messages in one direction – from the business to the prospective customer. As a result, marketing at scale has become synonymous with spam, which is often ignored by prospective customers and can even undermine the customer relationship. At the same time, prospective customers prefer to do their own research by accessing digital marketing resources before consulting with a salesperson to make a purchasing decision.
For most businesses to succeed, we believe their sales and marketing strategies must evolve fromhave digital engagement powered by the eralatest technology. With the launch of automation to the era of engagement. Weour intelligent engagement platform that includes our new AI-powered Analytics and Content Engine (“ACE”) in January 2024, we are strategically positioned to help businesses and their sales and marketing organizations make this transition. Our platform provides an innovative way both to scale digital marketing and deepen prospective customer engagement. We believe our opportunity to help businesses convert digital engagement into revenue will continue to grow over time as industries modernize their sales and marketing processes. As our customers create more ON24 content-rich experiences, they gathergain more connected insights through gathering more data directly from prospective customers, which we refer to as first-person data, to help them create a multiplier effect that strengthens their ability to convert prospective customers and generate revenue.
As of December 31, 2022,2023, we had 1,9901,784 customers. No single customer contributed more than 10% of our total revenue for the year ended December 31, 2023, 2022 2021 and 2020.2021.
Industry Trends
B2B sales and marketing has shifted away from traditional approaches, such as “cold calling,” “snail mail,” industry networking events and in-office visits, to more scalable, digital-based approaches. Going forward, B2B sales interactions between suppliers and buyers are expected to increasingly occur in digital channels. As they transition to digital-based approaches, businesses are struggling to achieve deep levels of personalized engagement and interactivity. The most common digital marketing tactics that businesses use to operate sales and marketing programs at scale require them to make suboptimal tradeoffs: either annoy their customers with spam, which is frequently ineffective, or use third-party providers to run more expensive marketing campaigns that still may not be engaging or personalized to a prospective customer’s business needs. This has led to frustration and poor returns from digital sales and marketing investments.
The imperative to optimize digital sales and marketing investments to drive revenue conversion has become more important as businesses accelerate digital transformation and AI innovation initiatives. We believe this digital transformation has fundamentally changed the way businesses engage with their prospective customers, leading to an increased need for innovative methods of B2B engagement at scale and leverage AI to improve sales effectiveness and drive faster revenue growth. The following key trends are impacting sales and marketing strategies today:
•Personalized and interactive digital customer engagement at scale is the new imperative. The ability to engage with large numbers of prospective customers and customers cost-effectivelyin a cost effective manner is crucial. As businesses broadly embrace digital transformation and AI initiatives, they are standardizing onusing cloud-based platforms to transformmodernize their sales and marketing strategies. Increased focus on next-generation digital marketing solutions offers our customers an opportunity to drive personalized and interactive prospective customer engagement at scale by aggregating a significant amount of insights on prospective customers. It also enables our customers to make productivity gains through the assistance of AI. This enables businesses to optimize sales and marketing campaigns and drive revenue growth.
•Democratization of content has led prospective customers to self-educate. Ineffective marketing tactics coupled with broad availability of relevant content across multiple channels have shifted the mindset of B2B prospective customers. Because prospective customers are now self-educating by accessing information on products and brands in advance of purchasing decisions, marketers must adapt by identifying and providing relevant content to their prospective customers earlier in the sales process. We believe this will necessarily shift greater investment into content-rich, interactive platforms for digitalintelligent engagement and away from low-touch marketing automation strategies. We also believe that this increasing need for content to enable prospective customers to self-educate will make it necessary for sales and marketing functions to produce content as efficiently and quickly as possible, therefore increasing the benefit of generative AI.
•Traditional automated marketing approaches are increasingly ineffective. TraditionalautomatedMany traditional marketing tactics have limited effectiveness at engaging prospective customers because they are generic, intrusive and irrelevant. Having a limited understanding of a prospective customer’s intent and interest leads to largely ineffective, impersonal marketing, wasted sales and marketing investment and frustrated prospective customers.
•Data privacy requirements are constraining automated digital marketing. Data privacy has become a fundamental area of focus for regulatory bodies given the digital transformation initiatives taking place and the plethora of spam used today. As privacy laws continue to expand and evolve, this puts pressure on traditionally automated methods of marketing at scale that have traditionally been highly dependent on information obtained from third parties. As a result, we believe there will beis increased focus on engaging with customers directly and driving engagement through first partyfirst-party insights and integrations.
The new norms of digital transformation and targeting self-educating prospective customers have accelerated the need for cloud platforms that deliver personalized and interactive customer engagement at scale to drive revenue.revenue as well as enable AI-assisted efficiencies.
Limitations of Traditional Approaches to Customer Engagement at Scale
BusinessesMany businesses have struggled to adapt their marketing strategies for the era of digital engagement where interactions with prospective customers happen online.customers. Traditional marketing tactics and general-purpose communication platforms suffer from many limitations, including:
•Failure to create content-rich, interactive experiences for prospective customers. As prospective customers increasingly self-educate, creating personalized, content-rich and interactive experiences is critical to generate engagement. Typical online sales and marketing strategies are built upon one-way communication from the marketer to their prospective customers, offering no opportunity for developing a meaningful exchange nor empowering prospective customers to dictate their own buying process.
•Limited opportunity for engagement, resulting in less prospective customer data. Highly engaging and interactive experiences generate valuable signals about prospective customers’ buying intentions that can inform the sales process and improve efficiency. To be able to capture and respond to those buying signals, businesses need the ability to track, record, contextualize and analyze prospective customer behavior in real-time. While in-person events, such as business conferences, can sometimes create engaging experiences, they do not allow for the automated and efficient collection of first-person data and are expensive to organize. General-purpose online meeting tools can enable businesses to reach many people at once, but they lack the engagement, analytics and first-person data that are needed to drive revenue. Meanwhile, traditional marketing automation tools collect only superficial data such as click rates that deliver limited understanding into what prospective customers want, what messages are resonating and how to more deeply engage and inform prospective customers that are seeking to learn more.
•Ineffective insights to convert prospects into customers. Insights about prospective customers are onlyprimarily valuable to businesses to the extent that they help convert prospects into customers. Providing contextualized and easy to access information to sales teams in real-time can materially improve their efficiency and improve revenue conversion. Technologies such as general purpose communicationsgeneral-purpose meeting and collaboration tools have provided convenient alternatives to hosting physical meetingsin-person events but were not designed to easily integrate into the broader sales and marketing systems that businesses use, and thus these tools have limited use in connecting real-time customer interaction with a business’s broader sales and marketing strategies.
•Inability to utilize behavioral insights to dynamically personalize content. By gaining insights into their prospective customers’ behavior and engagement, businesses are able tocan understand and measure the performance of their digital experiences. This understanding provides critical intelligence to optimize the subsequent creation and delivery of other digital experiences.experiences as well as leverage AI. Traditional approaches typically fail to utilize customer behaviors to dynamically adjust content and enable content personalization.
•In-person events are resource intensive and exist in a discrete moment. A business conference exists in a discrete moment in time, is expensive, and cannot be re-created. In these scenarios, businesses only have one opportunity to engage with prospective customers at scale, and their return on investment is limited. Furthermore, the expectation in today’s new market dynamic is that all events have a digital component and that audiences are able to choose how they engage.
Our Platform and Key Differentiators
Our leading cloud-based platform for digitalintelligent engagement enables businesses to convert customer engagement into revenue through interactive webinarby combining best-in-class experiences virtual event experienceswith personalization and multimedia content, experiences that are backed by analyticsto enable sales and an ecosystem of third-party integrations.marketing organizations to capture and act on connected insights at scale.
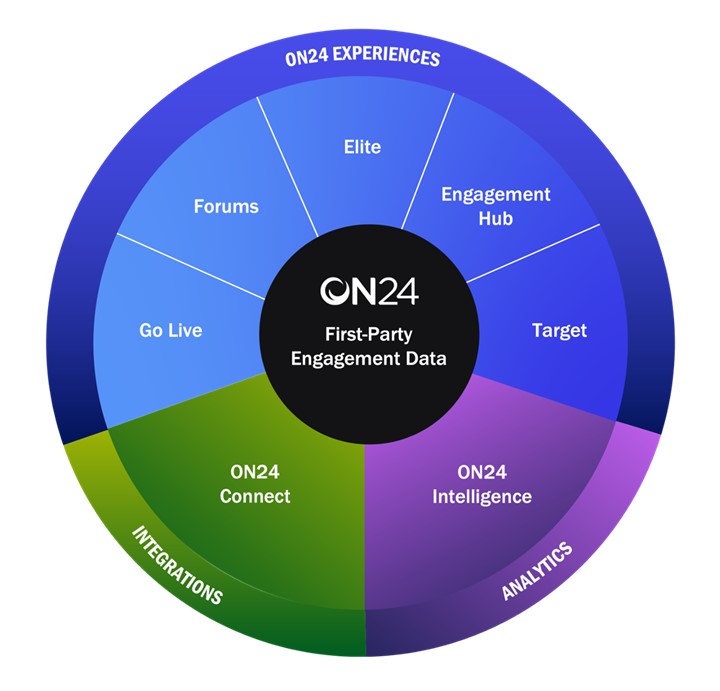
Our portfolio of ON24 Core Platform Experience products include:
•ON24 Elite: live, interactive webinar experience that engages prospective customers in real-time and can also be made available in an on-demand format.
•ON24 Breakouts: live breakout room experience that facilitates networking, collaboration and interactivity between users.
•ON24 Forums: live, interactive experience that facilitates video-to-video interaction between presenters and audiences.
•ON24 Go Live: live, interactive video event experience that enables presenters and attendees to engage face-to-face in real-time and can also be made available in an on-demand format.
•ON24 Engagement Hub: always-on, rich multimedia content experience that prospective customers can engage in anytime, anywhere.
•ON24 Target: personalized and curated, rich landing page experience that engages specific segments of prospective customers to drive a desired action.
Our ON24 Core Platform Experience products are backed by our solutions, including:
•ON24 Intelligence: analytics backbone that captures first-person data to power the insights, benchmarking reporting and artificial intelligence and machine learning, or AI/ML, enginereporting within our platform.
•ON24 AI-powered ACE: enables hyper-personalization at scale across ON24 experiences, uses generative AI to automatically create content and videos to feed ongoing nurture streams and provides an advanced set of intelligent analytics.
•ON24 Connect: ecosystem of third-party application integrations.
•ON24 Services and Platform Support: a portfolio of professional services that provide consulting and support for product and platform adoption.
Our non-Core Platform Experience product includes:is:
•ON24 Virtual Conference: live, large scale, managed virtual event experience that engages prospective customers in real-time and can also be made available in an on-demand format. With the return of large-scale in-person events, we are seeing less demand for this managed-service product. Accordingly, we are deemphasizing this product. As such, we do not consider ON24 Virtual Conference as part of our Core Platform going forward.Platform.
We believe the key differentiators of our platform are:
•Designed to drive interactive, personalized customer experiences. Our platform was built to power a new kind of customer engagement – highly interactive real-time digital experiences that can scale engagement from hundreds to thousands ofengage prospective customers simultaneously.at scale, while delivering a personalized experience to specific audience segments. Unlike spam, which is often ignored, our digital experiences engage prospective customers with tailored content and encourage them to ask questions and learn about a business’sbusiness’ products and offerings more broadly. This real-time interaction is the foundation of our modernintelligent engagement platform and aligns with how B2B prospective customers are seeking to self-educate.
•Interactive customer engagement creates highly valuable customer insight data. Unlike more traditional approaches, creating and measuring customer engagement and interaction is at the center of our platform. Through our products, our customers can create interactive experiences that foster active engagement with their prospective customers and gather data in real time. This enables our customers to obtain rich, valuable insights and predictive analytics as well as integrate the resulting data and insights into their business applications.
•Prospective customer insights drive more efficient conversion of pipeline to revenue. The customer engagement and interaction data gathered through our platform enables businesses to derive deep insights about prospective customer behavior. These insights can drive higher-quality pipeline, provide opportunities to use AI for better performance and resource efficiency and ultimately better revenue conversion for our customers. Through our ecosystem of integrations with third-party marketing automation, customer relationship management, or CRM, and business intelligence, or BI, platforms, our customers can leverage insights derived through our platform to more intelligently engage with prospective customers in real-time.customers.
•Flywheel effect drives continuous optimization. Years of capturing engagement insights have provided us with a deep understanding of how to best design digital experiences that engage prospective customers and generate more impactful revenue conversion. The more of our content-rich experiences that our customers create for their prospective customers to engage with, the more first-person data that our customers are able tocan collect in return.return, creating a flywheel effect. By leveraging AI/ML,AI, especially generative AI, our platform enables businesses to use this data to derive highly relevant and deep insights that fuel AI-drivenAI-generated content generation, personalizedand videos, enable hyper-personalized segmentation at scale, and provide enhanced analytics and reporting and dynamic content recommendations. These AI/ML-drivenAI-driven innovations further strengthen the engagement, levels of experiences,while saving time and resources, enhancing the quality of the interaction data and insights derived through our platform. This combination of rich prospective customer data and AI/ML becomes a flywheel for better content creation, improved customer experiences, greater customer intelligence and enhanced revenue conversion.
•Experiences that can be repurposed and continuously drive engagement to maximize return on investment. Our customers are able tocan continuously drive results because ON24 digitallive experiences remain interactive and can continue to engage their prospective customersgenerate first-party insights well after the initial live event ends. The experiences created through our platformdate on which they are designed with persistent interactivity which givesdelivered. In addition, our customers the ability to engagecan automatically turn their prospective customers in either a live or on-demand experience.experience content into new written and video content using generative AI. This flexibility makes it possible to repurpose and reuse digital experiences many times over with no incremental cost.
Our Competitive Strengths
We believe that we have significant competitive strengths that will enable us to extend our market leadership position, including:
•Category defining platform for customer engagement at scale. We created one of the first cloud platforms for businesses to deliver interactive, data drivendata-driven webinar experiences, virtual event experiences and multimedia content experiences. We believe we have a first-mover advantage because our proprietary and proven platform has enabled our customers to build effective systems for digital engagement that generate high return on investment.
•Cloud-based system of engagement. Our cloud-based platform powersenables our customers with several key marketing capabilities: creating digital experiences, deploying them at scale, collecting numerous data points on their prospective customers, repurposing experiences into AI-generated written and video content and leveraging this data to further personalize subsequent experiences. Consolidating these services onto one platform allows our customers to gather a more cohesive understanding of their prospective customers and take more targeted actions to more effectively convert prospects into customers. As a result, businesses no longer need to rely on a combination of standalone products.
•Broad, rich dataset and AI/MLAI capabilities power valuable insights. Our platform enables highly interactive experiences, giving our customers access to behavioral data that signals buying intent. By leveraging our AI/MLAI capabilities, our customers can derive valuable and actionable insights in order to optimize their sales and marketing strategies. For example, with our AI-powered ACE, we help our customers understand what features of a digital experience drive the most engagement with prospective customers and heatmap key moments of an experience that had the greatest impact on audiences. Based on those key moments, AI-powered ACE can automatically create short-form video clips that feed ongoing nurture streams. Our customers can also use our platform to benchmark themselves against others in their industry to understand where they can improve as well as to synthesize lifetime behavior on our platform into an easy-to-use business interest report. They can also use our AI-driven content generation to automatically create promotional content. In addition, our customers can more effectively reach their prospects and customers by leveraging our AI/ML capabilities to dynamically personalize digital experiences for particular customers based on their prior behavior and interactions on our platform.
•Enterprise grade,Enterprise-grade, highly scalable cloud platform. Our cloud-based platform has been developed to enable enterprise-grade scalability. This includes options and features to enable our customers to make privacy and compliance choices that align to their needs as well as integrations with a broad ecosystem of third-party applications. Our platform is available in over 20 languages and can be utilized seamlessly across multinational sales and marketing organizations. Our customers are able tocan use our platform to engage their prospective customers in multiple regions by supporting different streaming protocols, multilingual translation and closed captioning.
•Broad base of customers across verticals. We have a large and diverse set of customers across a broad set of industries. While our customer base decreased in 2022 compared to 2021, our customer base has grown significantly since 2015, from approximately 760 customers asverticals, including technology, manufacturing, life sciences, financial services and professional services. As of December 31, 2015 to 1,990 customers as of December 31, 2022.2023, we had 1,784 customers. We intend to leverage our land and expand model to further penetrate customers across these verticals.
•Superior, dedicated customer service. Our solutions are designed to be easy to use, featuring drag-and-drop and other similar tools simplifying implementation by our customers. We offer technical support, chat support and live webinar experience emergency support that is available to our customers 24/7. Our platform support and customer success teams are organized into a “follow the sun model” to ensure consistent and reliable service across the globe.
Our Market Opportunity
We estimate the current total addressable market, or TAM, for our solutions is approximately $46$44 billion worldwide annually. We calculate our TAM by initially estimating the total number of companies that our platform and products can support in the United States across separate bands measured by number of employees: Enterprise, which includes companies with more than 2,000 employees, and Commercial, which includes companies with less than 2,000 employees, which we further divide into Mid-Market companies with 200-1,999 employees, and small and midsize, or SMB, companies with 1-199 employees, using data from the U.S. Census Bureau for 2019.2020. We then apply an average annual value to the companies in each band. This value was calculated using internally generated data for annual recurring revenue, or ARR, as of December 31, 20222023 for the top 25% of our customers by ARR that subscribe to two or more of our products, within each of the Enterprise and Mid-Market bands, and the top 25% by ARR of all our customers within the SMB band. We believe these calculations are representative of the current potential spend on our solutions by customers and prospective customers. We multiplied the total number of companies within each band by the calculated annual value for that band. The aggregate calculated value represents the current annual estimated market opportunity in the United States of $23approximately $22 billion. We believe the market opportunity for our solutions outside the United States is at least as large.
Our Growth Strategy
While we are currently operating in a challenging macro-economic environment, we intend to drive the growth of our business over time and the adoption of our solutions by executing the following strategies:
•Drive new customer acquisition. We believe that our market is still relatively underpenetrated and that through scaling our sales force over time and through specialized and aligned sales teams focused on the Enterprise and Commercial markets globally, we can acquire new customers across the substantial Commercial market.customers.
•Expand within existing customers. Our land and expand model is expected to drive expansion of new subscriptions within our existing customer base by selling subscriptions to additional parts of existing customers’ organizations, expanding into new regional divisions and upselling new solutions. In addition to expanding with our customers through use cases in the marketing and sales organizations, we plan to develop newexpand within our customers through use cases for applications for our platform, including partner training and employee recruiting and forms of indirect marketing, such as education,partner enablement and training, healthcare professional engagement in pharma and life sciences; member enrollment and benefits programs.broker enablement in commercial and health insurance; and continuing professional education and certification for professional services.
•Continue to increase attachmentsmultiproduct adoption and develop new solutions for specific use cases. We expect our business to grow both through increasing attachments formultiproduct adoption of existing solutions and selling our existing customers new solutions that we develop in the future. For example, we have developed a differentiated feature set for our customers that use our platform to conduct online continuing education programs and issue accredited certifications. Our ecosystem of third-party integrations includes business applications in specific industries. We plan to continually develop new solutions that are powered with the newest technology such as AI to enhance the functionality of our platform and products, improve our customers’ experiences and drive engagement with their prospective customers.
•Expand into new regions. We believe the expansion of our platform in international markets is a significant opportunity. We plan to continue tomay in the future evaluate expansion opportunities for our solutions internationally, both in countries where we currently operate and countries where we do not yet sell subscriptions to our solutions.
•Identify and pursue inorganic growth opportunities. We plan to opportunistically evaluate and acquire complementary businesses, products, services or technologies that expand our platform, add different categories of experiences and support new use cases for our customers. We believe well-selected acquisitionsinorganic growth opportunities may add significant value to our platform and expand the ability of our customers to gather engagement data to help them convert their prospective customers into revenue.
Our Solutions
Our platform gives businesses the ability to use digital engagementintelligently engage prospects and customers to drive revenue growth through interactivehyper-personalized experiences, data-driven analytics and solutions that integrate into a large number of business systems, predominantly marketing automation, CRM and BI platforms. With digital engagementfirst-party data and insights at the core, our platform’s experience, data and integration layers power a portfolio of experience products and solutions that includeincludes ON24 Elite, ON24 Forums, ON24 Go Live, ON24 Breakouts, ON24 Engagement Hub and ON24 Target,Target. In addition, we offer our customers ON24 Intelligence and ON24 Connect.Connect solutions as well as ON24 AI-powered ACE. We also offer ON24 Virtual Conference, which is not part of our Corea non-Core Platform Experience products suite.product.
The following graphic depicts our platform:
ON24 Experience Products
Our platform’s experience products contain a robust set of capabilities that make it simple for our customers to build, design, manage and scale live, interactive webinar experiences, large-scale virtual event experiences, rich multimedia content hub experiences and personalized content experiences. Any business user can use our platform; no code or technical expertise is required.
We have designed our experiences to be equally easy for our customers’ audiences of prospective customers to access and guide their own self-education process. Our customers’ audiences of prospective customers can choose to engage with multiple points of interaction and content resources within an ON24 Experience and move seamlessly through a variety of ON24 Experiences. To further remove friction, audience members do not need any downloads or plug-ins, can use any web browser and can access experiences from a desktop, mobile or tablet device.
ON24 Core Platform Experience Products
Live Experiences: ON24 Elite
ON24 Elite gives our customers a high-impact, cost-efficient, digitally native way to engage hundreds and thousands of their prospective customers simultaneously.
An ON24 interactive webinar experience is fully customizable and enables our customers to combine a video or audio-based presentation with supporting slide materials, video clips or screen-sharing alongside dynamic interactions including live question and answer messaging, group chats, real-time surveys and polls, and additional content resources. Our customers can drive high-intent calls-to-action for their prospective customers to book a sales meeting or request a demo. Through ON24 AI-powered ACE, our customers can personalize calls-to-action, content and messaging for specific audience segments.

Through ON24 Elite, interactive webinar experiences can be delivered in multiple formats, including a scheduled live experience featuring a livestreamed presentation or pre-recorded presentation, which we refer to as simulive because it is designed to simulate a livestreamed presentation, or an on-demand experience featuring a pre-recorded presentation. No matter the format, all two-way interactivity remains dynamic and continues to drive engagement in real-time. Our platform also provides automated captioning inside interactive webinar experiences that can be transcribed and translated into 10 languages in real-time. That transcription can then be edited and auto-translated in more than 60 languages for pre-recorded, simulive or on-demand presentations.
ON24 Elite’s flexible format and modular composition makes it easy to scale a webinar program, run multiple interactive experiences across different sales and marketing functions or for different audience segments, and repurpose and replay content and syndicate experiences to different regions. To enhance the re-use of content, our platform enables our customers to create templates and clone and edit interactive webinar experiences.
We provide a separate interface for presenters called ON24 Elite Studio, which acts as the production environment for our customers to produce real-time interactive webinar experiences, livestream or record multimedia presentations, and engage with customers in real-time during an ON24 Experience.
Live Experiences: ON24 Breakouts
ON24 Breakouts expanded the functionality and interactivity of webinars built with ON24 Elite. This product enables users to have a face-to-face virtual conversation with their customers during or after the main webinar experience ends, facilitating attendee networking, enabling relationship-building and virtual selling opportunities.
Live Experiences: ON24 Forums
ON24 Forums provides an interactive, video-based experience for smaller moderated discussions bringing two-way, face-to-face networking and audience participation together in a fully branded experience. This product is ideal for executive engagement, expert-led trainings and professional advisory groups, enabling users to create high-touch virtual events at scale, capture interactions and integrate engagement data into business systems. Through AI-powered ACE, our customers can personalize calls-to-action, content and messaging for specific audience segments.
Live Experiences: ON24 Go Live
ON24 Go Live offers an all-in-one, easy-to-use video event experience optimized for networking and audience participation. This product is designed for single or multi-day events enabling users to deliver live keynote presentations, host multiple breakout sessions with video-based discussions, and create exhibit halls and a networking lounge. Optimized for audience networking and participation, this product includes multiple formats for two-way engagement, including event-level chat, in-session chat, polls and video-to-video breakout discussions.
Always-On Experiences: ON24 Engagement Hub
ON24 Engagement Hub is an online resource portal product that our customers use to provide rich content experiences for their prospective customers to find, consume and engage with interactive webinar experiences and other multimedia marketing content, such as videos and whitepapers, in a single online destination.
Through AI-powered ACE, our customers can personalize calls-to-action, content and messaging for specific audience segments. With out-of-the-box features that include branding, search, categorization, website embedding and pre-set content layouts, ON24 Engagement Hub provides a simple and efficient way for our customers to seamlessly publish, curate and promote their interactive webinar experiences alongside other marketing content that they upload and host inside our platform.
Personalized Experiences: ON24 Target
ON24 Target is a personalized marketing product that gives our customers the ability to easily build, curate and disseminate interactive webinar and video experiences and other multimedia content to distributed audience segments with relevant messaging, offerings and calls-to-action.
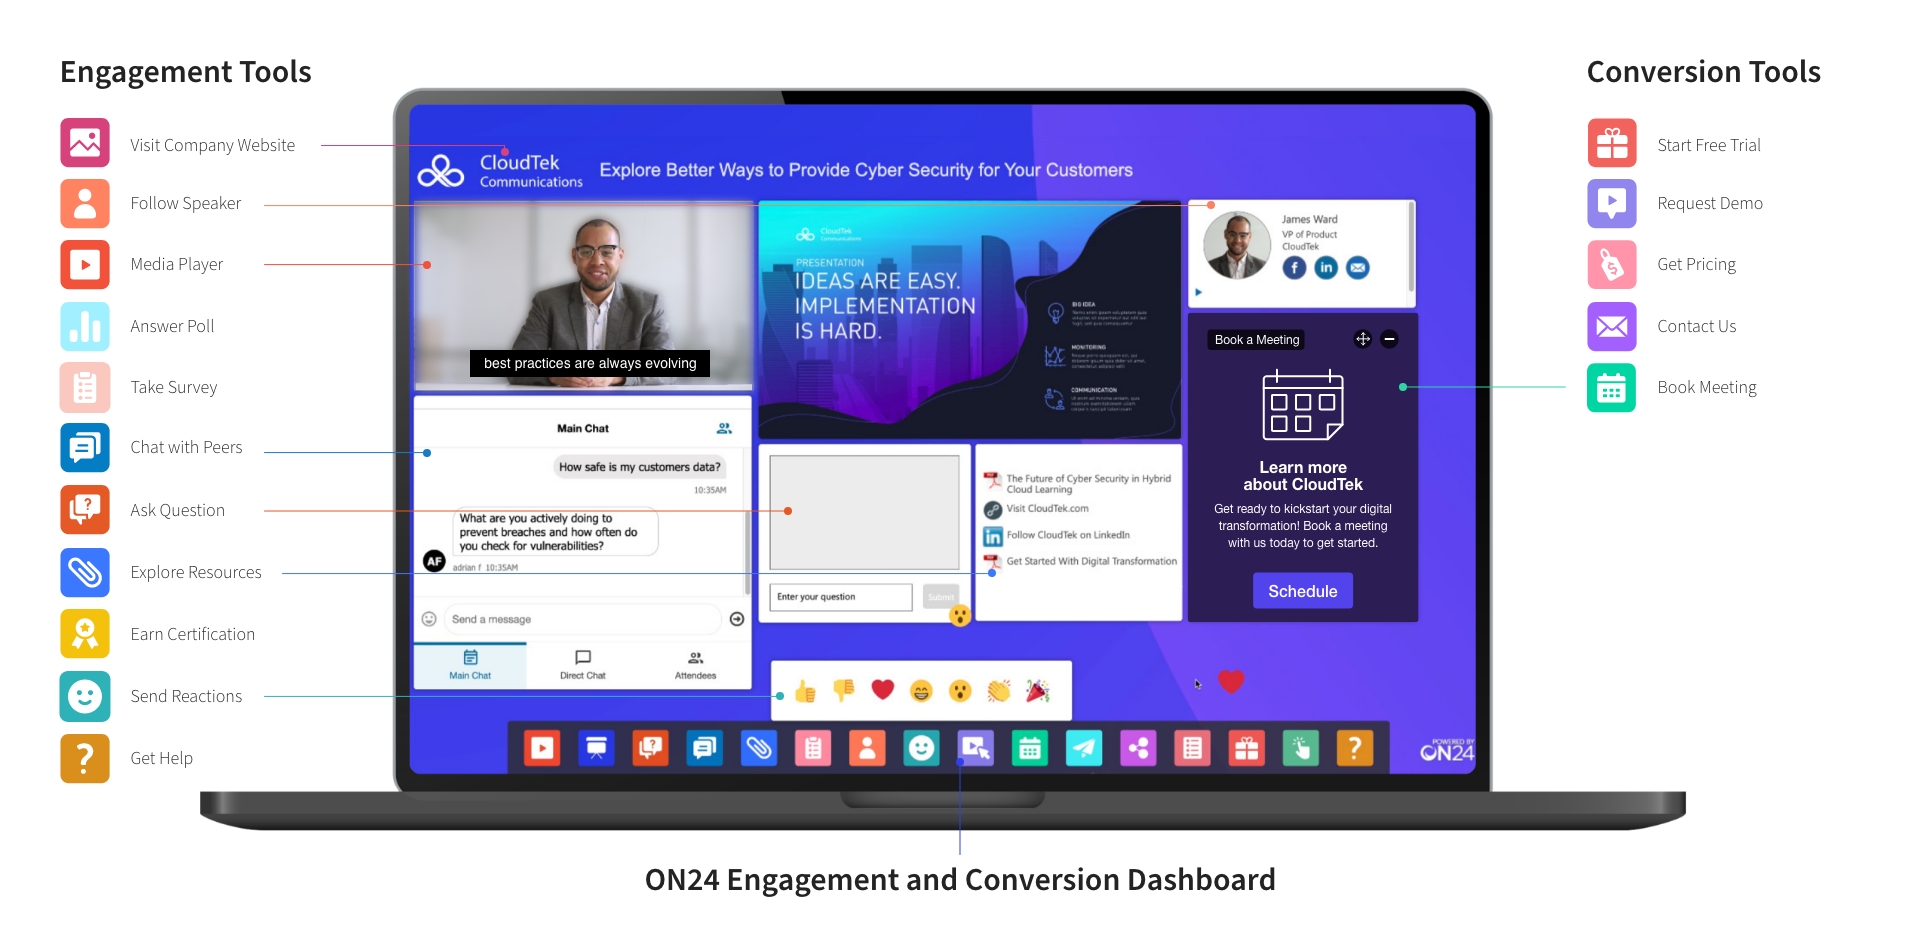
Additional features across our ON24 Core Platform Experience products
Our ON24 Experience products include the following tools to enable our customers to produce professionally designed experiences, drive ongoing engagement and conversion, and host, manage and organize content.
•ON24 Experience Builder: Our customers use our drag-and-drop interface; pre-set layouts, custom templates, and a library of stock images to rapidly produce professionally designed and branded experiences without any need for website or code development.
•ON24 Engagement and Conversion Tools: Our platform contains a library of more than 20 interactivity tools that Through AI-powered ACE, our customers can use to drive ongoing engagementpersonalize calls-to-action, content and conversion with their prospective customers, enabling them to interact with hundreds and thousands of individual prospective customers simultaneously. Examples of ON24 Engagement and Conversion Tools include the ability to book a sales meeting, request a product demo, ask question and answers in real-time, and engage with supplemental resources such as downloadable white papers or external webpages.
•ON24 Media Manager: Our customers use ON24 Media Manager to host, manage and organize all marketing content, including interactive webinar experiences, videos and whitepapers, in a single location.messaging for specific audience segments.
ON24 Intelligence
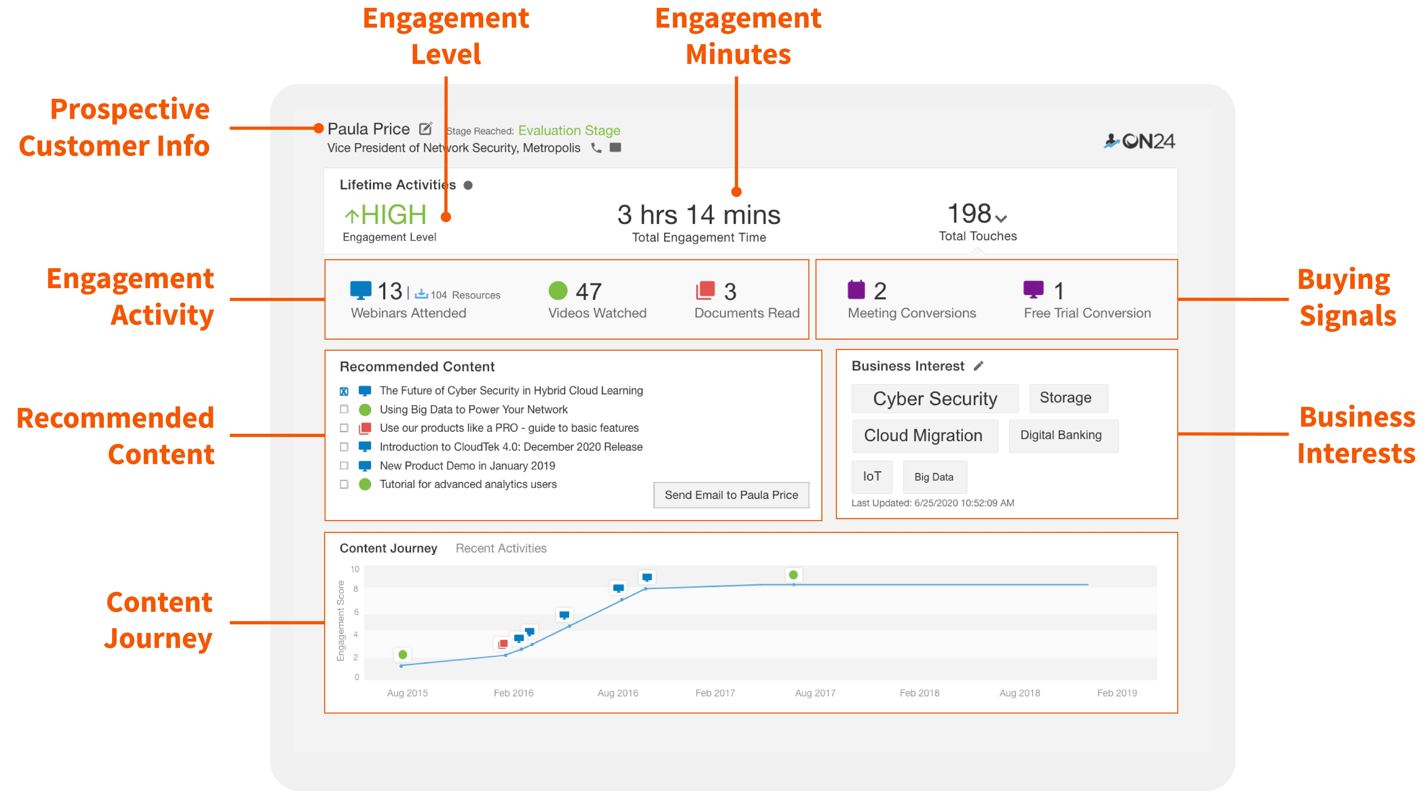
ON24 Intelligence is the analytics backbone that runs across our platform and provides our customers with first-person data, analytics, benchmarking and reporting within our platform. These insights and reports are available to all of our customers and measure analytics at the account-level, for each platform experience, for each hosted content asset and for each prospective customer who engages with an experience on our platform. Our customers are able tocan easily understand the overall performance of their ON24 experiences in a dashboard-level view and make comparisons to industry benchmarks for future improvement. We also include AI capabilities within ON24 Intelligence.
ON24 Engagement and Prospect Analytics
The ON24 engagement and prospect analytics are powered by our proprietary algorithms and our AI/MLAI capabilities. The prospect analytics measure engagement levels of individual prospective customers to enable our customers to report, qualify, prioritize and score their prospective customers’ intent to make a purchase. Our engagement analytics tools provide our customers the ability to report, measure and compare the engagement levels of their ON24 Experiences and multimedia assets hosted on our platform both in aggregate and individually.
10
ON24 Advanced Analytics
ON24 Advanced Analytics provides our customers with an additional set of pre-configured reports that enable customers to understand their most engaged prospective customers, provide a view of where prospective customers are in the sales funnel, and give analysis across poll and survey responses. Our customers are also able to use ON24 Advanced Analytics to run customized reports within our platform.
ON24 AI/ML EngineAI-powered ACE
Our flagship AI product is ON24 AI/ML engine leveragesAI-powered ACE which helps our customers scale their hyper-personalized experiences, automatically create content and videos to feed ongoing nurture streams and provides an advanced set of intelligent analytics.
ON24 AI Capabilities
Our AI capabilities also leverage the data collected by or on behalf of our customers through our platform to enableallow for better prediction of which content will drive the mostaudience engagement for individual prospects and personalization of experiences for customer segments, thus driving further interaction data and creating a continuous network effect of higher customer engagement that leads to the ability to deliver content that is optimized to drive more engagement.segments.
Our platform hasuses AI technologies, including generative AI, natural language processing and machine learning, to enable the following AI/ML-powered capabilities:
•The ability to dynamically deliver personalized content recommendations;
•Embedded generative AI that automatically creates written content and videos to feed ongoing nurture streams;
•Embedded generative AI copywriting assistant tool to scale and optimizehelp with promotional content;
•Enable sales to act on prospects’ unique topical interests with a “Business Interest Cloud” report;
•Surface immediate audience feedback from live experiences with a “Key Moments” report, providing marketers with deep links to promote more targeted experiences;
•Deliver dynamic, personalized content recommendations;a heatmap report of “Key Moments” that identifies the most engaging segments of a live experience and automatically creates snackable video highlights;
•Predictive engagement levels for our customers’ prospective customers;
•Automated transcription of audio and video into text, making it searchable and accessible;
•Automated translation of transcripts into multiple languages for global audience reach;
•Q&A bot, to answer routine support questions in ON24 Elite Studio;during live webinar experiences; and,
•Platform audience and presenter load predictions, to help deploy operational resources and provide oversight.
ON24 Connect
ON24 Connect is an ecosystem of third-party application integrations and APIs that enable the first-person insights generated by ON24 Intelligence to be extracted and leveraged across our customers’ business systems for more intelligent sales and marketing.
APIs
Our broad set of APIs enable our customers, partners and a select set of third-party developers to use ON24 Intelligence in their business applications. We also provide our APIs to a select set of businesses to build applications for our portfolio of ON24 Experience products.
Marketing Automation, CRM and BI Platform Integrations
Through our ecosystem of third-party integrations, our customers can seamlessly integrate their first-person engagement data with other business systems, predominantly marketing automation, CRM and BI platforms, including integrations with Adobe Marketo Engage, Oracle Marketing Cloud (Eloqua), Salesforce CRM, Salesforce Marketing Cloud, (Pardot),Salesforce Pardot, Veeva and HubSpot.
ON24 Non-Core Experience Product
Live Experiences: ON24 Virtual Conference
ON24 Virtual Conference is built to host large-scale online events and provide a single source for measurement and analytics.
Our ON24 Virtual Conference powers multi-session virtual event experiences that can be scheduled as live events and maintained as ongoing on-demand events or in an immersive training content library. Simulating an in-person conference, trade show or training center, ON24 Virtual Conference houses multiple tracks of interactive webinar-based keynotes and breakout sessions powered by ON24 Elite alongside participant networking, virtual breakout meetings and virtual vendor booths.
All interactions across the ON24 Virtual Conference and within the individual ON24 Elite-powered webinar-based sessions are captured and unified, providing a powerful set of event analytics.
With the return of large-scale in-person events, we are seeing less demand for ON24 Virtual Conference and we are deemphasizinghave deemphasized this product. As such, we do not consider ON24 Virtual Conference as part of our Core Platform going forward.Platform.
Our Technology and Infrastructure
Our platform and products have been developed to enable enterprise-grade scalability, performance and reliability, designed to address all the complexities that come with live, interactive engagement with large audiences of prospective customers. Our platform has two main parts: a web application stack, and a streaming infrastructure stack, running on two co-located data centers in the United States and one in the European Union (EU). We also utilize public-cloud providers as part of our infrastructure.
Our web application stack processes requests from web browsers and APIs. Our streaming infrastructure stack processes live signal acquisition from our customers, encodes it, and delivers it to audiences via a redundant set of content delivery networks. The streaming infrastructure stack is designed to accept inputs from our customers on a wide variety of devices, combine them into an online virtual bridge, and to incorporate controls into the ON24 Elite Studio experience for presenters. The bridged signal is then encoded and distributed to diverse global audiences, who can access it as part of an online experience on desktop and mobile devices. This presentation contains video along with other interactive components, all synchronized and controlled by our customers. We continue to transition more of our capabilities to a hybrid cloud infrastructure, which we believe will enhance our platform’s flexibility and scalability.
We built our platform and products to address the robust performance demanded by large, multinational enterprises in the following ways:
•Performance and scalability: Our Cloud and Network Operations team runs this application in three data centers. This configuration has proven both scalable and cost effective. Our application architecture allows us to independently scale the systems that handle heavier loads, with a lightweight load-balancers routing traffic to additional machines as needed. With leading enterprise components, we expect our architecture to scale readily without any significant change as our business expands.
•Privacy and compliance: Our platform includes features and options designed to support compliance with the EU General Data Protection Regulation, or GDPR, the UK GDPR, the California Consumer Privacy Act, or CCPA, the California Privacy Rights Act, or CPRA, and other privacy laws, and provides options and features to enable customers to make privacy and compliance choices that align to their needs and relevant legal requirements. For example, our platform enables customers to implement tailored notice and consent language, customize registration forms and obtain consent for marketing and other processing activities. In addition, our flexible APIs allow businesses to build solutions to automate compliance with certain data subject requests.
•Security: We conduct regular penetration tests, web vulnerability scans, and code reviews to enhance the security of our platform.platform in accordance with our cybersecurity program as discussed in more detail under “Item 1C. Cybersecurity” herein.
Our Customers
Our customer base consists of a diverse set of businesses from fast-growing start-ups to established Fortune 100 enterprises that span a number of industries where B2B sales and marketing is mission critical. As of December 31, 2022,2023, approximately 20%22% of the Fortune 1000500 are ON24 customers. The primary industries we serve include technology, financial services, life sciences, manufacturing and professional services, among others. All of these industries are undergoing a digital transformation, and, as a result, we see opportunities for growth in product adoption, attachments and revenue across all verticals fueling both our customer acquisition and land and expand strategies. No single customer contributed more than 10% of our total revenue for the year ended December 31, 2023, 2022 2021 and 2020.2021.
Sales and Marketing
We primarily sell our products through direct sales, which comprises field and inside sales personnel. Our sales organization is comprised of market-centric teams focusing on Enterprise and Commercial customers segmented by employee headcounts. Our field sales organization is specialized to execute our land and expand strategy and primarily focuses on Enterprise and Commercial customers while our inside sales team specializes in driving further adoption of ON24 products to our existing customers as well as sourcing new customers.
Our-go-to-market strategy consists of four key components, including acquiring and expanding wallet share within large accounts, focusing on the Commercial market, driving increased product attachments through continued customer innovation, and expanding into new geographies to drive continued international growth. We are also building the ON24 Partner Network, an ecosystem of solution and technology partners, to further support growth.
Marketing
We have built an efficient and impactful go-to-market engine by using the ON24 platform as the foundation of our marketing strategy. Due to the deep engagement and actionable data generated by our interactive digital experiences, we are able to quickly qualify leads, provide our sales team with personalized insights and accelerate our highest priority buyers to our sales team.
Our marketing team focuses on inbound and outbound marketing through our industry-leading content and resources and by sharing customer best practices. We use multiple marketing tactics to build brand awareness and generate demand, including media communications, user conferences, digital marketing, partner co-marketing, product marketing and customer marketing. We track and measure our marketing costs and results closely across all channels to support our efforts to optimize marketing channels that drive our sales pipeline.
Customer Success
We believe that our highly responsive and effective support and education are an extension of our brand and are core to building and maintaining user trust. Our global customer success team is closely embedded with our customers and supports their day-to-day usage of our platform, including advising on best practices and providing technical support, services, and training. Our platform support team offers technical support, chat support and live webinar experience emergency support that is available to our customers 24/7. Our portfolio of services provides consulting, support for platform, and product and event adoption as well as support for experience management, monitoring and production. Our training team oversees onboarding, training, certification and a knowledge center.
Our global support team is based in 5 regional offices and is available 24/7 via in-product and presenter chat support. We have a data-driven process and well-established operations in place that proactively monitor our customers’ platform adoption, utilization and success. This approach enables us to efficiently scale our customer success operations as our customer base grows.
Research and Development
Our research and development team are responsible for the design, development, testing, and delivery of new products, platform capabilities, product features and platform integrations, connectors and APIs. We release major platform upgrades once per quarterregularly with minor upgrades released as needed. Research and development employees are locatedbased primarily in our San Francisco headquarters, and we also contract with remote U.S.-based and offshore workers.
Competition
Our industry is highly competitive and fragmented. We compete for customers with a number of different types of companies that offer a variety of products and services, including meeting tools, webinar software, virtual event software, video portal software, content management software, physical events, physical event software and digital marketing tools. Our competitors vary in size and in the breadth and scope of the products and services they offer. Many of our current and potential competitors have larger customer bases, greater brand recognition and significantly greater financial, marketing and other resources than we have. Our solutions face competition. For example, a number ofseveral web-based meeting, webinar, and virtual event software products are offered by companies such as Zoom, LogMeIn, Intrado, Microsoft, Cisco, Cvent, Adobe, RingCentral, Notified and Hopin.Kaltura. Many of these products have significantly lower prices. Although many of these companies do not currently offer products withare limited in their ability to deliver both real-time engagement features that gatherand the types and extent of actionable data that we gather, many of these companies have significantly greater resources and may be able to introduce similar products in the future. Additionally, we operate in a market characterized by an increasingwhich has experienced a rapid increase in the number of new and competitive entrants.entrants in the recent past and may again in the future. As we introduce new solutions, and with the introduction of new technologies, products and market entrants, we expect competition to intensify in the future.intensify.
We believe the principal competitive factors in our markets are:
•functionality in providing rich, interactive digital experiences;
•ability to gather near real-time data insights for marketers;insights;
•breadth of functionality within a single platform;platform, including AI capabilities;
•ease of use and reliability;
•cloud-based architecture;
•scalability;
•security, privacy and compliance;
•integration into leading marketing automation, CRM and BI platforms; and
•global, always available customer service and support.
We believe we compete favorably with respect to each of these factors.
Intellectual Property
We primarily rely, and expect to continue to rely, on a combination of patent, trade secret and domain name protection, trademark and copyright laws, as well as confidentiality and license agreements with our employees, consultants and third parties, to protect our intellectual property and proprietary rights. In the United States and abroad, as of December 31, 2022,2023, we had 1819 issued patents and 2726 pending patent applications, the earliest of which expires in 2027. We pursue the registration of our domain names, trademarks and service marks in the United States and in certain locations outside the United States. Our trademarks and service marks include our name and logo, as well as various marketing slogans. We maintain a policy requiring our employees, contractors, consultants and other third parties to enter into confidentiality and proprietary rights agreements to control access to our proprietary information.
These laws, procedures and restrictions provide only limited protection, and any of our intellectual property rights may be challenged, invalidated, circumvented, infringed or misappropriated.
Regulatory Considerations
The legal environment of Internet-based businesses is evolving rapidly in the United States and elsewhere. The manner in which existing laws and regulations are applied in this environment, and how they will relate to our business in particular, both in the United States and internationally, is often unclear. For example, we sometimes cannot be certain which laws will be deemed applicable to us given the global nature of our business, including with respect to such topics as data privacy and security, pricing, credit card fraud, advertising, taxation, content regulation and intellectual property ownership and infringement.
Businesses use our platform to engage with and market to their prospects and customers. In doing so, these businesses: (a) upload, broadcast, collect and store data and content within our platform, subject to relatively few general restrictions imposed by us, aside from the technical capabilities and limitation inherent in our platform, (b) use tools and reports available in our platform to access analytics and insights about attendees, experiences and content, and (c) personalize content and experiences to prospects and customers. This presents potential compliance challenges to our business and operations because we do not control customer content and information practices within our platform. Thus, we cannot ensure that information collection and processing by or on behalf of customers, within our platform, complies with applicable privacy, data protection and other laws. Similarly, we cannot ensure that customer content and use of our platform does not infringe or violate rights of privacy or intellectual property rights. At the same time, given the developing and varied nature of privacy and intellectual property laws globally, we cannot guarantee that ON24 would never be
subject to potential or actual claims or enforcement actions associated with customer content or use of our platform. Thus, both in the United States and internationally, we must monitor and take steps to respond to a host of legal, compliance and risk issues regarding the data stored and processed by customers on our platform. These include, without limitation, the following:
Privacy, Data Protection and Security
Businesses use our platform to facilitate better engagement with their customers and prospects, derive insights about content and usage, and provide more meaningful and targeted experiences and content. These capabilities rely on collection and processing of information from and about customers and prospects that interact with the business or its content on our platform. As a result, compliance with laws and regulations regarding data privacy, AI, cybersecurity, data protection, data breaches, and the collection, processing, storage, transfer and use of personal data, which we refer to as privacy laws, are critical to our compliance and risk strategy. Globally, numerous jurisdictions have passed or are actively considering new or amended privacy laws. As a result, privacy laws are increasing in number, enforcement, and fines and other penalties. Beyond legislative developments, decisions by courts and regulatory bodies relating to privacy laws can also have a significant impact on us and other businesses that operate across international jurisdictions.
In some cases, privacy laws apply directly to both ON24 and our customers and in other cases our customers pass through compliance obligations and requirements to us contractually. Further, under some privacy laws, ON24 may be considered a “processor” or a “service provider” and our customers a “controller” or “business,” while other privacy laws may not clearly distinguish between such roles. In all cases, however, ON24 must monitor, respond to and address privacy laws and related compliance, whether to ensure its own compliance or enable compliant use of its platform by ON24 customers. In general, our failure to adequately safeguard data adequately, address privacy compliance, or comply with our security and privacy commitments to customers could subject us, not only to contractual liability to customers and direct liability under privacy laws, but also to reputational harm and regulatory investigations or enforcement actions under U.S. (federal and state) and international laws and regulations relating to consumer protection and unfair business practices. More particularly, certain privacy law developments could have significant impacts to our platform and business. For example, privacy laws that restrict the use of personal information for marketing purposes or the tracking of individuals’ online activities (such as the EU’s proposed ePrivacy Regulation and the California Consumer Privacy Act)CCPA), could expose us to additional regulatory burdens or necessitate changes to our platform or certain features. In addition, certain countries have passed or are considering passing laws that impose data localization requirements or cross border data transfer restrictions on certain data. As with most cloud-based solutions, restrictions on the transfer of platform data outside of the originating jurisdiction pose particular challenges that could result in additional costs or otherwise impact platform use.
With the evolving legal landscape, the scope, interpretation and enforcement of privacy laws could change and new or amended laws may take effect. As a result, the associated burdens and compliance costs on us and our platform could increase in the future. Although we continue to monitor and respond to privacy legal developments and have invested in addressing major privacy law developments (such as the GDPR, CCPA and the CCPA)CPRA), it is not possible for us to predict with certainty the effect of these developments on our platform and business.
Copyrights
U.S. and international copyright and trademark laws protect the rights of third parties from infringement of their intellectual property. Our customers and their users can generally use our platform to upload and present a wide variety of content. We maintain a copyright infringement policy and respond to takedown requests by third-party intellectual property right owners that might result from content uploaded to our platform. As our business expands to other countries, we must also respond to regional and country-specific intellectual property considerations, including takedown and cease-and-desist notices in foreign languages, and we must build infrastructure to support these processes. The Digital Millennium Copyright Act, or DMCA, also applies to our business. This statute provides relief for claims of circumvention of copyright-protected technologies but includes a safe harbor that is intended to reduce the liability of online service providers for listing or linking to third-party websites or hosting content that infringes copyrights of others. The copyright infringement policies that we have implemented for our platform are intended to satisfy the DMCA safe harbor.
Employees and Human Capital
As of December 31, 2022,2023, we had 640462 full-time employees. Of these employees, 487366 are based in the United States and 15396 are based in international locations. The members of our management team and our board of directors come from diverse backgrounds, and we seek to attract and recruit diverse, talented, experienced and motivated employees. In order to develop and improve our platform, we must invest in attracting, developing and retaining key talent. We monitor our progress with human capital metrics such as turnover, time to fill open roles and rate of internally developed talent. Our brand, market position, reputation for innovation and culture support our ability to recruit and retain talented employees across our departments.
Corporate Information
ON24, Inc. was incorporated as a Delaware corporation on January 8, 1998 under the name “NewsDirect, Inc.” Our principal executive offices are located at 50 Beale Street, 8th Floor, San Francisco, California 94105, and our telephone number is (415) 369-8000. Our website address is www.on24.com. Information contained on, or that can be accessed through, our website is not part of and is not incorporated by reference into this Report, and you should not consider information on our website to be part of this Report.
We own various U.S. federal trademarks and unregistered trademarks, including our company name, logo and solution names and other trade or service marks. All other trademarks or trade names referred to in this Report are the property of their respective owners. Solely for convenience, the trademarks and trade names in this Report are referred to without the symbols ® and ™, but such references should not be construed as any indicator that their respective owners will not assert, to the fullest extent under applicable law, their rights thereto.
Available Information
We maintain a website at www.on24.com, where we make available, free of charge, our annual reports on Form 10-K, our quarterly reports on Form 10-Q, our current reports on Form 8-K and other reports or documents filed or furnished pursuant to Section 13(a) or 15(d) of the Securities Exchange Act of 1934, as amended, or the Exchange Act, as soon as reasonably practicable after we file them with or furnish them to the Securities and Exchange Commission, or the SEC. Investors and others should note that we announce material financial and other information to our investors using our investor relations website (https://investors.on24.com), SEC filings, press releases, public conferences or conference calls, webcasts and other meetings. We encourage investors, the media and others interested in our company to review this information. We also use social media channels, including those of our Chief Executive Officer, Sharat Sharan, to communicate with our customers and the public generally about our company, our services, the industry and other issues. It is possible that the information we post on social media could be deemed to be material information. Therefore, we encourage investors, the media, and others interested in our company to review the information we post on social media channels.
Item 1A. Risk Factors.
Investing in our common stock involves a high degree of risk. You should carefully consider the risks and uncertainties described below, together with all of the other information in this report, including our consolidated financial statements and related notes, as well as in our other filings with the SEC, in evaluating our business and before investing in our common stock. The occurrence of any of the events or developments described below could materially and adversely affect our business, financial condition, results of operations, and growth prospects. In such an event, the market price of our common stock could decline, and our stockholders may lose all or part of their investment. Additional risks and uncertainties not presently known to us or that we currently deem immaterial may also impair our business operations.
Summary of Risk Factors
Our business is subject to a number of risks and uncertainties, including those risks discussed at-length below. You should read these risks before you invest in our common stock.
•our ability to grow our revenue;
•our ability to attract new customers and expand sales to existing customers;
•fluctuation in our performance, our history of net losses and any increases in our expenses;
•competition and technological development in our markets and any decline in demand for our solutions or generally in our markets;
•adverse general economic and market conditions and spending on sales and marketing technology;
•our ability to expand our sales and marketing capabilities and otherwise manage ourachieve growth;
•the impact of the COVID-19 pandemic and future variantsresumption of the virusin-person marketing activities on our customer growth rate, which has declined in recent periods and may decline in future periods compared to 2022, as the impact of COVID-19 lessens and our customers and their users increasingly resume in-person marketing activities;rate;
•disruptions, interruptions, outages or other issues with our technology or our use of third-party services, data connectors and data centers;
•the impact of the security incident involving ransomware that we experienced or any other cybersecurity-related attack, significant data breach or disruption of the information technology systems or networks on which we rely;
•our sales cycle, our international presence and our timing of revenue recognition from our sales;
•interoperability with other devices, systems and applications;
•compliance with data privacy, import and export controls, customs, sanctions and other laws and regulations;
•intellectual property matters, including any infringements of third-party intellectual property rights by us or infringement of our intellectual property rights by third parties; and
•the market for, trading price of and other matters associated with our common stock.
Risks Related to Our Business and Our Industry
We have not consistently sustained ourOur revenue growth rate has decreased in recent years following a period of rapid growth, and we may not be able to increase our revenue in future periods.
We have grown rapidly in prior periods, particularly in 2021 and 2020. For example, for full years 2021 and 2020, our revenue was $203.6 million and $156.9 million, respectively, representing annual growth of 30% and 76% in 2021 and 2020, respectively. Our revenue growth rate has decreased in these prior periods, particularlyrecent years following a period of rapid growth. Although we experienced significant revenue growth in 2020 was significantly impacted by increased demand forand 2021, including a revenue increase of 30% in 2021 compared to 2020, in subsequent years we have seen declines. In 2022 our platform and products following the onset of the COVID-19 pandemic and resulting precautionary measures. While some of our subscriptions have multi-year terms, most have terms of one year. Customers may not renew their subscriptions at the same rate, may decrease their usage of our solutions or may not purchase subscriptions for additional solutions, if they renew at all. For example, as subscription terms expired throughout 2021 and early 2022 for customers who subscribed during the beginning of the pandemic, many customers did not renew their subscriptions or decreased their usage of our solutions, which we believe reflects the lessening impact of COVID-19 on demand as well as other factors. Our revenue in 2022 decreased 6% compared to 2021.2021 and in 2023 our revenue decreased 14% compared to 2022. The decreases reflect a number of factors including reduced budgets for our customers, the reduced impact of COVID-19 which resulted in customers doing more in-person marketing and competitive dynamics. If our revenue does not increase in future periods, our business, financial condition and results of operations could be harmed. Furthermore, if we cannot attract new customers to our platform or our existing customers do not continue their subscriptions, our business, financial condition and results of operations would be harmed.
As a result of our limited operating history at our current scale, our ability to forecast our future results of operations is limited and subject to a number of uncertainties. You should not rely on our rapid growth in 2021 or 2020, revenue growth rates, or our level of revenue fordecline in 2022 or 2023, or any other prior period, as an indication of our future performance. In future periods, our revenue may decline for a number of reasons, including any reduction in demand for our platform, increased competition, higher market penetration, a contraction of our overall market, our inability to accurately forecast demand for our platform and plan for capacity constraints or our failure, for any reason, to capitalize on growth opportunities. If our revenue does not grow, investors’ perceptions of our business and the trading price of our common stock couldmay continue to be adversely affected.
Our quarterly results may fluctuate significantly and may not fully reflect the underlying performance of our business.
Our quarterly results of operations and financial condition may vary significantly in the future, and period-to-period comparisons may not be meaningful. Accordingly, the results of any one quarter should not be relied upon as an indication of future performance. Our quarterly results of operations and financial condition may fluctuate as a result of a variety of factors, many of which are outside of our control and may not fully reflect the underlying performance of our business. For example, our revenue decreased in every quarter of 20222023 compared to the same periods in 20212022 and we may face similar declines in future periods, as the impact of COVID-19 lessens and our customers and their users resume more in-person marketing activities. Further, because we generally invoice our customers at the beginning of the contractual terms of their subscriptions to our solutions, our financial condition reflects deferred revenue that we recognize ratably as revenue over the contractual term. As the impact of COVID-19 has lessened, we have observed fewer new subscriptions and renewals, and our cash and deferred revenue have decreased. Fluctuation in quarterly results may negatively impact the value of our securities. Factors that may cause fluctuations in our quarterly results of operations include:
•our ability to retain and expand customer usage;
•our ability to attract new customers;
•our ability to hire and retain employees, in particular those responsible for the selling or marketing of our platform and provide sales leadership in areas in which we are expanding our sales and marketing efforts;
•changes in the way we organize and compensate our sales teams;
•the timing of expenses and recognition of revenue;
•the length of sales cycles;
•the amount and timing of operating expenses related to the maintenance and expansion of our business, operations and infrastructure, as well as international expansion and entry into operating leases;
•timing and effectiveness of new sales and marketing initiatives;
•changes in our pricing policies or those of our competitors;
•the timing and success of new products, features and functionality by us or our competitors;
•interruptions or delays in our service, network outages, or actual or perceived privacy or security breaches;
•changes in the competitive dynamics of our industry, including consolidation among competitors;
•changes in laws and regulations that impact our business;
•the timing or amount of any share repurchases, including any impact from the excise tax on stock buybacks created by the Inflation Reduction Act of 2022;
•one or more large indemnification payments to our customers or other third parties;
•the timing of expenses related to any future acquisitions; and
•general economic and market conditions.
Failure to attract new customers or retain, expand the usage of, and upsell our products to existing customers would harm our business and growth prospects.
We derive, and expect to continue to derive, a significant portion of our revenue and cash flows from sales of subscriptions to our products. As such, our business depends upon our ability to attract new customers and to maintain and expand our relationships with our existing customers, including by expanding their usage and upselling additional solutions. Our business is largely subscription-based, and customers are not obligated to and may not renew their subscriptions after their existing subscriptions expire. As a result, customers may not renew their subscriptions at the same rate, increase their usage of our solutions or purchase subscriptions for additional solutions, if they renew at all.
Renewals of subscriptions may decline or fluctuate because of several factors, such as dissatisfaction with our solutions or support, the loss or reduction of available budget, a change in key stakeholders or decision makers, a customer no longer having a need for our solutions or the perception that competitive products provide better or less expensive options. For example, some organizations that purchased our ON24 Virtual Conference product are returning to in-person events and no longer need the large-scale virtual event experience functionality provided by this product. In order to grow our business, we strive to add new customers and replace customers who choose not to continue to use our platform. Any decrease in user satisfaction with our solutions or support may result in negative online customer reviews and decreased word-of-mouth referrals, which would harm our brand and our ability to grow.
In addition to striving to attract new customers to our platform, we seek to expand the usage of our solutions by our existing customers by increasing the number of departments, divisions and teams that use our solutions within each of our customers. If we fail to expand the usage of our solutions by existing customers or if customers fail to purchase other solutions from us, our business, financial condition and results of operations would be harmed.
Competition in our markets is intense, and if we do not compete effectively, our operating results could be harmed.
We compete for customers with a number of different types of companies that offer a variety of products and services, including meeting tools, webinar software, virtual event software, video portal software, content management software, physical events, physical event software, marketing automation software, and digital marketing tools. Our competitors vary in size and in the breadth and scope of the products and services they offer. Many of our current and potential competitors have larger customer bases, greater brand recognition and significantly greater financial, marketing and other resources than we have. Our solutions face competition from a number of web-based meeting, webinar, physical event and marketing software products offered by companies such as Zoom, LogMeIn, Intrado, Microsoft, Cisco, Cvent, Adobe, RingCentral, Notified and Hopin.Kaltura. Many of these products have significantly lower prices. Although many of these companies do not currently offer products with real-time engagement features that gather the types and extent of actionable data that we gather, many of these companies have significantly greater resources and may be able to introduce similar products in the future. Additionally, we operate in a market characterized by an increasingwhich has experienced a rapid increase in the number of new and competitive entrants.entrants in the recent past and may again in the future. Furthermore, this market has seen rapid expansion, which may attract additional entrants.entrants, any of which could be our current business partners. As we introduce new solutions and services, and with the introduction of new technologies and market entrants, we expect competition to intensify in the future.
Many factors, including our pricing and marketing strategies, customer acquisition, and technology costs, as well as the pricing and marketing strategies of our competitors, can significantly affect our pricing strategies. Certain competitors offer, or may in the future offer, lower-priced or free products or services that compete with our entire platform or certain aspects of our platform, and they may offer a broader range of products and services than we do. Even if such competing products do not include all of the features and functionality that our solutions provide, we could face pricing pressure to the extent that customers find such alternative products to be sufficient to meet their needs. Similarly, certain competitors or potential competitors may use marketing strategies that enable them to acquire customers at a lower cost than we can. Moreover, larger organizations, which are a primary focus of our direct sales efforts, may demand substantial price concessions. As a result, we may be required to provide larger organizations with pricing below our targets in the future. As a result, we could lose market share to our competitors or be forced to engage in price-cutting initiatives or other discounts to attract and retain customers, each of which could harm our business, results of operations and financial condition.
Adverse or weakened general economic and market conditions may cause a reduction in spending on sales and marketing technology, which could harm our revenue, results of operations, and cash flows.
Our revenue, results of operations, and cash flows depend on the overall demand for and use of technology for sales and marketing, which depends in part on the amount of spending allocated by our customers or potential customers on sales and marketing technology. This spending depends on worldwide economic and geopolitical conditions. The U.S. and other key international economies have experienced cyclical downturns from time to time in which economic activity was impacted by falling demand for a variety of goods and services, inflation (including wage inflation), labor market constraints, restricted credit, poor liquidity, reduced corporate profitability, volatility in credit, equity, and foreign exchange markets, bankruptcies, pandemics such as COVID-19, and overall economic uncertainty. These economic conditions can arise suddenly, including the recent rise in inflation and the full impact of such conditions often remains uncertain.overall macroeconomic environment, which has negatively impacted our customers’ marketing budgets. In addition, geopolitical developments, such as potential trade wars, and actions or inactions of the U.S. or other major national governments, can increase levels of political and economic unpredictability globally and increase the volatility of global financial markets. In response to general economic uncertainty and over-hiring during COVID-19, many U.S. companies, particularly in the technology sector, have laid off employees in mass job cuts in 2022 and 2023. Since the third quarter of 2022, we have initiated multiple strategic cost reductions, which included a reduction of our global full-time employee headcount by approximately 11% from June 30, 2022 to December 31, 2022, as well as two additionalmultiple reductions in the first quarter2023 that reduced our headcount as of December 31, 2023 by approximately 28% from December 31, 2022 levels, which may impact our ability to operate our business. In the future we may have to consider additional or larger scale reductions in force if economic conditions worsen and harm our business, results of operations and financial condition.
Market volatility, decreased consumer confidence, and diminished growth expectations in the U.S. economy and abroad as a result of the foregoing events could affect the rate of sales and marketing spending and could adversely affect our customers’ ability or willingness to purchase our services, delay prospective customers’ purchasing decisions, reduce the value or duration of their subscription contracts, or affect attrition rates, all of which could adversely affect our future sales and operating results. Some of our customers may view a subscription to our platform as a discretionary purchase, and our customers may reduce their discretionary spending on our platform during an economic downturn. In addition, weak economic conditions, including during times of high inflation and tightening budgets, can result in customers seeking to utilize lower-cost solutions that are available from alternative sources. Prolonged economic slowdowns may result in requests to renegotiate existing contracts on less advantageous terms to us than those currently in place, payment defaults on existing contracts, or non-renewal at the end of a contract term.
A decline in demand for our solutions or for live engagement technologies in general could harm our business.
We derive, and expect to continue to derive, a significant portion of our revenue and cash flows from sales of subscriptions to our solutions. As a result, widespread adoption and use of live engagement technologies, webinars and event software in general, and our platform in particular, are critical to our future growth and success. If this market fails to grow or grows more slowly than we currently anticipate, demand for our platform could be negatively affected. Demand for our platform is affected by a number of factors, many of which are beyond our control. Some of these potential factors include:
•availability of products and services that compete, directly or indirectly, with ours;
•introduction of free or “do-it-yourself” products;
•awareness and adoption of the live engagement technologies category generally as a substitute for in-person events;
•ease of adoption and use;
•features and platform experience;
•reliability of our platform, including frequency of outages;
•performance and user support;
•our brand and reputation;
•security and privacy;
•our pricing and our competitors’ pricing; and
•new modes of live engagement that may be developed in the future.
If we fail to successfully predict and address these factors, meet customer demands or achieve more widespread market adoption of our platform, our business would be harmed.
We have a history of net losses, and we may increase our expenses in the future, which could prevent us from achieving or maintaining profitability.
We had a net loss of $58.2$51.8 million in 2023 and $24.3$58.2 million in 2022, and 2021, respectively, and we may incur net losses in the future. We intend to continue to expend funds on our direct sales force and marketing efforts to attract new customers and increase usage of our platform and products by our existing customers, to develop and enhance our platform and for general corporate purposes. To the extent we are successful in increasing our customer base, we may also incur increased losses because most of the costs associated with acquiring customers (other than sales commissions) are incurred up front, while the related subscription revenue is generally recognized ratably over the applicable subscription term. In addition, we may incur increased losses because most of the costs associated with acquiring customers, including sales commissions, require us to make cash outlays at the time we acquire a customer, and, similarly, the timing of our recognition of subscription revenue and sales commissions may not correspond with our cash position. Our subscriptions typically have terms of one year that automatically renew for successive one-year terms unless terminated. We also have certain customers with subscription terms for up to three years. Our efforts to grow our business may be costlier than we expect, and we may not be able to increase our revenue enough to offset our higher operating expenses and any increase in our cost of sales, including as a result of a shift to a hybrid cloud. If we are unable to achieve and sustain profitability, the value of our business and common stock may significantly decrease. Furthermore, it is difficult to predict the size and growth rate of our market, customer demand for our platform, user adoption and renewal of subscriptions to our platform, and the entry or the success of competitive products and services. As a result, we may not achieve or maintain profitability in future periods.
The failure to effectively develop and expand our marketing and sales capabilities could harm our ability to increase our customer base and achieve broader market acceptance of our platform.
Our ability to increase our customer base, expand the usage of our existing customers and achieve broader market acceptance of our solutions will depend to a significant extent on our ability to effectively manage our sales and marketing operations and activities. We are substantially dependent on our direct sales force and on our marketing efforts in order to obtain new customers. We have in the past expanded and may in the future expand our direct sales force both domestically and internationally. We believe that there is significant competition for experienced sales professionals with the sales skills and technical knowledge that we currently require or may require in the future. Our ability to achieve revenue growth will depend, in part, on our success in recruiting, training and retaining a sufficient number of qualified and experienced sales professionals. New hires require significant training and time before they achieve full productivity, particularly in new industries or geographies. Circumstances relating to the COVID-19 pandemic have altered the way we recruit, onboard, train and integrate our employees, and these processes may not be successful in expanding our sales and marketing capabilities. New hires may not become as productive as quickly as we expect, or at all, and we may be unable to hire or retain sufficient numbers of qualified individuals in the future in the markets and segments where we do business. Our business may be harmed if our sales efforts do not generate a significant increase in revenue.
Our results of operations may be adversely impacted by the COVID-19 pandemic.
The global spread of the COVID-19 pandemic, including the spread of new variants, and related containment efforts have materially affected how we and our customers operate our respective businesses. Although in some ways the COVID-19 pandemic may have accelerated our growth, the longer-term effects on our business and the overall economy remain highly uncertain. In April 2022 we fully reopened our offices for personnel who are comfortable working in an office setting, but a significant number of our personnel continue to work from home. We offer a significant percentage of our employees flexibility in the amount of time they work in an office on a regular basis. While we have learned during the COVID-19 pandemic that we can work effectively remotely, the partial return to in-office work and the transition to permanent remote working arrangements for some employees may present operational and workplace culture challenges and risks, including reduced productivity, lower employee retention, and increased compliance and tax obligations in a number of jurisdictions. Our ongoing efforts to safely keep open our offices may also expose our employees, customers and other third parties to health risks and us to associated liability, and they will involve additional financial burdens. Similarly, many of our customers, vendors and other third parties with which we conduct business are adjusting to permanent remote or hybrid work arrangements and dealing with other challenges, such as supply chain disruptions and revised budgets, that are forcing them to conduct business in different ways. The extent to which these parties suffer inefficiencies or other risks from these different arrangements, and the extent to which these risks may impact us, is impossible to predict.
The continued spread of COVID-19, particularly any future variants that may be more transmissible and have more severe symptoms than current variants, may extend the impact of COVID-19 on our business. The impact of these variants cannot be predicted at this time and could depend on numerous factors, including vaccination rates among the population, the effectiveness of COVID-19 vaccines against emerging variants, and any new measures that may be introduced by governments or other parties in response to an increase in COVID-19 cases. Given the nature of the circumstances, it is difficult to predict the long-term economic impact of the ongoing COVID-19 pandemic on our business. These uncertainties make it challenging to manage our growth, maintain business relationships, price our subscriptions and otherwise operate and plan for our business. Moreover, the economic impacts of COVID-19 have affected and may continue to affect customer and prospective customer spending on technology such as ours, particularly for businesses involving in-person interactions. These customers may experience reduced revenue and revised budgets, which may adversely affect our customers’ ability or willingness to purchase subscriptions to our platform, the timing of subscriptions,
customer retention, andIssues with the valueuse of AI in our platform may result in reputational harm or duration of subscriptions, all of whichliability, or could otherwise adversely affect our operating results. Asbusiness.
We have built and are continuing to build AI-powered capabilities, which includes generative AI, natural language processing and machine learning, into our platform, leveraging the impactdata collected by our customers through our platform to enable better engagement and create enhanced content. While we have incorporated these capabilities into several of COVID-19 has subsided, our products, including our newly launched ACE, and plan to further use AI in our platform, as with many innovations, AI presents risks and challenges that could affect its availability and adoption, including current legal uncertainties around the use of AI and prospective customers,possible new laws and regulations, and therefore our business. We partially rely on third-party providers of AI technology, and those third-party providers may be required to change, suspend, or restrict access to their users, have chosen to do more in-person marketing. The extentservices. AI algorithms may be flawed. Datasets may be insufficient or contain biased information. Generated content may contain copyrighted or infringing materials. Any deficiencies and other failures of the impact of COVID-19 on our business and financial performance may be influenced by a number of factors, many of which we cannot control, including the duration and spread of the COVID-19 pandemic, future spikes of COVID-19 infections and future variants resulting in additional preventative measures, the severity of the economic decline attributable to the COVID-19 pandemic, the timing and nature of a potential economic recovery, the impact on our customers and our sales cycles, and our ability to generate new business leads.
Due to our subscription-based business model, the effect of the COVID-19 pandemic may not be fully reflectedAI-powered capabilities in our results of operations until future periods. In addition, uncertainty regardingplatform could reduce the impact of COVID-19 on our future operating results and financial condition may result in our taking cost-cutting measures, reducing the level of our capital investments and delaying or canceling the implementation of strategic initiatives, any of which may negatively impact our business and reputation. The global macroeconomic effects of the COVID-19 pandemic and related impacts on our customers’ business operations and their demand for our solutionsmarketplace, result in user dissatisfaction and adversely affect our business. Ineffective or inadequate AI development or deployment practices by us or others could also result in incidents that impair the acceptance of AI solutions. These deficiencies and other failures of AI systems could require us to refund fees to customers or subject us to competitive harm, regulatory action, legal liability (including under new proposed legislation regulating AI in jurisdictions such as the US and EU, the application of existing data protection, privacy, intellectual property, and other laws), and brand or reputational harm. Some AI scenarios may persist, even after the COVID-19 pandemic has subsided. In addition, the effectspresent ethical issues. If AI features that we enable or offer are controversial because of the COVID-19 pandemictheir impact on human rights, privacy, employment, or other social, economic, or political issues, we may heighten many of the other risks we face, including those described in this Report.experience brand or reputational harm.
We rely heavily on third parties for parts of our computing, storage, processing, application integration and similar services. Any disruption of or interference with our use of these third-party services could have an adverse effect on our business, financial condition, and operating results.
We have outsourced aspects of our infrastructure to third-party providers, and we currently use these providers to host and stream content and support our platform. For example, our content delivery networks and some of our interactive video functionality and integration services are provided by third parties, and we plan to continue our transition to a hybrid cloud infrastructure in the future. Accordingly, we are vulnerable to service interruptions experienced by these providers, and we expect to experience interruptions, delays, or outages in service availability in the future due to a variety of factors, including infrastructure changes, human, hardware or software errors, hosting disruptions, and capacity constraints. We expect that our transition to a hybrid cloud infrastructure will require significant investment and have a continuing effect on our cost of revenue and may not be effective in improving our capacity or redundancy. Outages and capacity constraints could also arise from a number of causes such as technical failures, natural disasters, fraud, or security attacks. The level of service provided by these providers, or regular or prolonged interruptions in that service, could also affect the use of, and our customers’ satisfaction with, our solutions and could harm our business and reputation. In addition, third-party costs will increase as subscriptions and customer use of our platform grows, which could harm our business if we are unable to grow our revenue faster than the cost of using these services or the services of similar providers.
Furthermore, our providers may change the terms of service and policies pursuant to which they provide services to us, and those actions may be unfavorable to our business operations. Our providers may also take actions beyond our control that could seriously harm our business, including discontinuing or limiting our access to one or more services, increasing pricing terms, terminating or seeking to terminate our contractual relationship altogether, or altering how we are able to process data in a way that is unfavorable or costly to us. For example, some businesses providing data connectors to our products may fail to properly integrate with our platform and third-party sales and marketing systems, stop servicing the data connectors or cease development and support, any of which may limit functionality of our products. In addition, some businesses that provide cloud services and data connectors are or may become our competitors and may take one or more of the foregoing actions in an effort to compete with our platform. Although we expect that we could obtain similar services from other third parties, if our arrangements with our current providers were terminated, we could experience interruptions on our platform and in our ability to make our content available to customers, as well as delays and additional expenses in arranging for alternative cloud infrastructure services.
Any of these factors could cause network disruptions, or even network failure, reduce our revenue, subject us to liability, and cause our customers to decline to renew their subscriptions, any of which could harm our business.
Interruptions, delays or outages in service from the data centers we use for our technology or infrastructure could impair the delivery and the functionality of our solutions, which may harm our business.
Our growth, brand, reputation and ability to attract and retain customers depends in part on the ability of our customers to access our platform at any time and within an acceptable amount of time. We currently use U.S. data centers in Colorado and California. While each of our U.S. data centers provide fully redundant processing, we estimate that failover may require as long as 120 minutes to complete, during which time our platform may not be fully available to customers in the event of catastrophic failure at one of those data centers. In addition, our data center redundancy does not ensure that all platform disruptions can be restored within 120 minutes in the absence of a catastrophic failure at one of these data centers. For example, it is possible that ON24 platform services could be impacted by a cybersecurity incident that cannot be fully resolved by failover to another data center.
To facilitate additional growth in Europe, we opened a data center in the EU in 2021. We have limited experience operating a data center in the EU. Our efforts to further diversify our data centers, including internationally, may not be successful. We intend to add failover redundancy for our EU data center, but we currently do not have it, and it may take longer than we expect to add it. While the data in our EU data center is fully backed up in a different location, restoring from backup may take a meaningful period of time.
We also do not control the operation of the data centers we use, and they are vulnerable to damage or interruption from human error, intentional bad acts, natural disasters, war, terrorist attacks, cyber attacks and other cybersecurity incidents, power losses, hardware failures, systems failures, telecommunications failures and similar events, any of which could disrupt our service. In the event of significant physical damage to one of these data centers, it may take a significant period of time to achieve full resumption of our platform, and our disaster recovery planning may not account for all eventualities.
In addition, our platform is proprietary, and we depend on the expertise and efforts of members of our operations and software development teams for its continued performance. Our ability to retain, attract, hire and train staff in these groups may prove to be a challenge for a variety of factors and could have an adverse impact on the platform. We have experienced, and may in the future experience, service disruptions, outages and other performance problems due to a variety of factors, including infrastructure changes, introductions of new functionality, human or software errors, zero-day vulnerabilities, capacity constraints due to an overwhelming number of users accessing our platform concurrently and denial-of-service attacks, ransomware attacks and other cybersecurity incidents by malicious actors. In some instances, we may not be able to rectify these performance issues within an acceptable period of time.
Our ability to attract and retain customers depends on our ability to provide our customers and their users with a highly reliable platform. If our platform is unavailable or if our customers and their users are unable to access our platform within a reasonable amount of time, or at all, our business, results of operations and financial condition would be adversely affected. Additionally, if the data centers we use are unable to keep up with our increasing need for capacity, our customers may experience delays as we seek to obtain additional capacity, which could harm our business.
Cybersecurity-related attacks, significant data breaches or disruptions of the information technology systems or networks on which we rely could negatively affect our business.
Our operations rely on information technology systems for the use, storage and transmission of sensitive and confidential information with respect to our customers, our customers’ users, third-party technology platforms and our employees. In addition, our solutions gather more information from our customers and their users than many competing products, which may make us an attractive target for a malicious cybersecurity attack, intrusion or disruption, or other breach of our systems. Any such event could lead to unauthorized access to, use of, disclosure of or the loss of sensitive and confidential information, disruption of our platform, and resulting regulatory enforcement actions, litigation, indemnity obligations and other possible liabilities, as well as negative publicity, any of which could damage our reputation, impair sales and harm our business. For example, in June 2021 we were subject to a security incident involving ransomware, which impacted certain internal systems and a limited number of customer events. Some data maintained in our internal systems was also impacted. Promptly upon detecting the incident, we launched an investigation, engaged with law enforcement, and took steps to contain the incident and restore impacted event types. To date, suchSuch security incident has not resulted in any material impact to our operations, ability to provide our services, results of operations or financial position, but the full effects of the security incident may not be known and may still have a material impact on us.position. While we believe we have responded appropriately to date, including with respect to the steps we have taken to contain the security incident in 2021 and our implementation of remedial measures with the goal of preventing security incidents in the future, these remedial measures may not be successful in preventing future security incidents, which may result in adverse impacts to our operations, ability to provide our services, results of operations or financial position. Additionally, as our market presence grows, we may face increased risks of cyber-related attacks or security threats in the future.
Cyberattacks and other malicious internet-based activity continue to increase, and cloud-based providers of products and services have been and are expected to continue to be targeted. In addition to traditional computer “hackers,” malicious code (such as viruses and worms), phishing, ransomware, employee theft or misuse and other insider threats, and denial-of-service attacks, sophisticated nation-state and nation-state supported actors now engage in attacks (including advanced persistent threat intrusions). As we grow, we may face increased risk of any such attacks. Despite efforts to create security barriers to such threats, it is not feasible, as a practical matter, for us to entirely mitigate these risks. If our security measures are compromised as a result of third-party action, employee, customer, or user error, malfeasance, stolen or fraudulently obtained log-in credentials or otherwise, our reputation would be damaged, our data, information or intellectual property, or those of our customers, may be destroyed, stolen or otherwise compromised, our business may be harmed and we could incur significant liability. We may be unable in the future to anticipate or prevent techniques used to obtain unauthorized access to or compromise of our systems because they change frequently and are generally not detected until after an incident has occurred. We may not be able to prevent vulnerabilities in our software or address vulnerabilities that we may become aware of in the future. Further, as we rely on third-party cloud infrastructure, we depend in part on third-party security measures to protect against unauthorized access, cyberattacks and the mishandling of data and information.
Any cybersecurity event including the security incident we experienced in June 2021 or any future vulnerability in our software, cyberattack, intrusion or disruption, could result in significant increases in costs, including costs for remediating the effects of such an event, lost revenue due to network downtime, a decrease in customer and user trust, increases in insurance premiums due to cybersecurity incidents, increased costs to address cybersecurity issues and attempts to prevent future incidents, and harm to our business and our reputation because of any such incident. In addition, such incidents and data breaches can give rise to penalties and fines under data protection and cybersecurity laws, rules and regulations, enforcement actions, contractual damages, class actions, customer audits and other liability.
Many jurisdictions have enacted laws requiring companies to provide notice of data security incidents involving certain types of personal data. Under some of these laws, such as the EU General Data Protection Regulation (“GDPR”), data breach is defined very broadly to include any accidental or unlawful destruction, loss, alteration, unauthorized disclosure of, or access to any personal data, regardless of the sensitivity of such data. In addition, certain platform information may be made available via unique links to publicly accessible webpages, which could be accessed by unauthorized individuals. While the information accessible via these pages is limited, it is possible that a regulator, customer or third party could view this negatively, in particular in light of the broad definition of personal data and data breach under certain laws. In addition, we have contractual obligations to notify our customers of any data breaches involving their personal data processed by us.
Any limitation of liability provisions in our subscription agreements may not be enforceable or adequate or may not otherwise protect us from any such liabilities or damages with respect to any claim related to a cybersecurity incident. Our existing general liability insurance coverage and coverage for errors or omissions may not continue to be available on acceptable terms or may not be available in sufficient amounts to cover one or more large claims. The insurer may deny coverage as to any future claim. The successful assertion of one or more large claims against us that exceed available insurance coverage, or the occurrence of changes in our insurance policies, including premium increases or the imposition of large deductible or co-insurance requirements, would harm our business.
Further, security compromises experienced by our competitors, by our customers or by us may lead to widespread negative publicity. Any security compromise in our industry, whether actual or perceived, could harm our reputation, erode confidence in the effectiveness of our security measures, negatively affect our ability to attract new customers, encourage consumers to restrict the sharing of their personal data with our customers or social media networks, cause existing customers to elect not to renew their subscriptions or subject us to lawsuits, regulatory fines or other action or liability, which could harm our business.
We may not be able to respond to rapid technological changes, extend our platform or develop new features.
The markets in which we compete are characterized by rapid technological change and frequent new product and service introductions. Our ability to attract new customers and retain and expand the usage of existing customers depends on our ability to continue to enhance and improve our platform, to introduce new features and solutions and to interoperate across an increasing range of devices, operating systems and third-party applications. Our customers may require features and capabilities that our current platform does not have. We invest significantlyWhile we are committed to investing in research and development focusingand are focused on improving the quality and range of our product offerings.offerings, we have recently reduced our level of investment in research and development which may impact the rate at which we are able to enhance and improve our platform or introduce new features and solutions. Furthermore, we made significant headcount reductions in 2022 and 2023 to reduce our cost structure. Reductions in our workforce could result in the loss of valuable skills and knowledge and have a negative impact on morale, which can impact our ability to innovate. Our enhancements to our platform and our new product experiences, features or capabilities may not be compelling to our existing or potential customers and may not gain market acceptance. If our research and development investments do not accurately anticipate customer demand, or if we fail to develop our platform in a manner that satisfies customer preferences in a timely and cost-effective manner, we may fail to retain our existing customers or increase demand for our platform.
The introduction of competing products and services or the development of entirely new technologies to replace existing offerings could make our platform obsolete or adversely affect our business, results of operations and financial condition. We may experience difficulties with software development, design or marketing that could delay or prevent our development, introduction, or implementation of new product experiences, features, or capabilities. New product experiences, features or capabilities may not be released according to schedule. Any delays could result in adverse publicity, loss of revenue or market acceptance, or claims by customers brought against us, all of which could harm our business. If customers do not widely adopt our new product experiences, features and capabilities, we may not be able to realize a return on our investment. If we are unable to develop, license or acquire new features and capabilities to our platform on a timely and cost-effective basis, or if such enhancements do not achieve market acceptance, our business would be harmed.
Our sales cycle with Enterprise customers can be long and unpredictable.
A substantial portion of our business is with large Enterprise customers. We define a customer as a unique organization, including its subsidiaries and affiliates, that has entered into an agreement for paid access to our platform. As of December 31, 2022,2023, we had 345325 $100k Customers, which are generally large organizations, representing 66% of our ARR. The timing of our sales with our Enterprise customers and related revenue recognition is difficult to predict because of the length and uncertainty of the sales cycle for these customers. We are often required to spend significant time and resources to educate and familiarize these potential customers with the value proposition of paying for our platform. The length of our sales cycle for these customers, from initial evaluation to payment for our platform, is often around three to six months or more and can vary substantially from customer to customer. As a result, it is difficult to predict whether and when a sale will be completed. An inability to increase our Enterprise customer base could harm our business.
As the impact of COVID-19 has subsided, our current and prospective customers, and their users, have chosen to do more in-person marketing. This has contributed to reduced demand for our platform. Due to our subscription-based business model, the effect of COVID-19 may not be fully reflected in our results of operations until future periods. In addition, uncertainty regarding the impact of COVID-19 on our future operating results and financial condition has contributed to our decisions to pursue cost-cutting measures and reduce the level of our capital investments, and similar concerns may contribute to our delaying or canceling the implementation of strategic initiatives, any of which may negatively impact our business and reputation. The global macroeconomic effects of COVID-19 and related impacts on our customers’ business operations and their demand for our solutions may persist, even after any future spikes of COVID-19. In addition, the effects of COVID-19 may heighten many of the other risks we face, including those described in this Report.
We have significant operations outside the United States, where we may be subject to increased business and economic risks that could harm our business.
We have significant operations outside of the United States. In 2022,2023, we generated 24%23% of our revenue from customers outside of the United States. In prior periods, we have focused on expanding our international operations and we may continue to do so in future periods. For example, in 2020, we established a subsidiary in Japan to support our operations in the Asia-Pacific region and in 2022 we established a subsidiary in Germany to support our operations in the EMEA. Future efforts to expand our current international operations, including entering new markets or countries, may not be effective. For example, we may not be able to expand further in some markets if we are not able to satisfy certain government- and industry-specific requirements. In addition, our ability to manage our business and conduct our operations internationally in the future may require considerable management attention and resources and is subject to the particular challenges of supporting a rapidly growing business in an environment of multiple languages, cultures, customs, legal and regulatory systems and commercial markets. Any future international expansion will require investment of significant funds and other resources. Operating internationally subjects us to special risks, including risks associated with:
•recruiting and retaining talented and capable employees outside the United States and maintaining our company culture across all of our offices;
•providing our platform and operating our business across a significant distance, in different languages and among different cultures, including the potential need to modify our platform and features to ensure that they are culturally appropriate and relevant in different countries;
•determining the appropriate pricing strategy to enable us to compete effectively internationally, which may be different than the pricing strategies that have worked for us in the United States;
•compliance with applicable international laws and regulations, including laws and regulations with respect to privacy, data protection and marketing, and the risk of penalties to us and individual members of management or employees if our practices are deemed to be out of compliance;
•management of an employee base in jurisdictions that may not give us the same employment and retention flexibility as does the United States;
•difficulties in managing and staffing international operations including the proper classification of independent contractors and other contingent workers, differing employer/employee relationships, and local employment laws;
•operating in jurisdictions that do not protect intellectual property rights to the same extent as does the United States and the practical enforcement of such intellectual property rights outside of the United States;
•foreign government interference with our intellectual property that is developed outside of the United States, such as the risk that changes in foreign laws could restrict our ability to use our intellectual property outside of the jurisdiction in which we developed it;
•integration with partners outside of the United States;
•compliance by us and our business partners with anti-corruption laws, import and export control laws, tariffs, trade barriers, economic sanctions and other regulatory limitations on our ability to provide our platform in certain international markets;
•foreign business restrictions, foreign exchange controls and similar laws that might require significant lead time in setting up operations in certain geographic territories and might prevent us from repatriating cash earned outside the United States;
•political and economic instability;
•changes in diplomatic and trade relationships, including the imposition of new trade restrictions, trade protection measures, import or export requirements, trade embargoes and other trade barriers;
•generally longer payment cycles and greater difficulty in collecting accounts receivable;
•double taxation of our international earnings and potentially adverse tax consequences due to changes in the income and other tax laws of the United States or the international jurisdictions in which we operate; and
•higher costs of doing business internationally, including increased accounting, travel, infrastructure and legal compliance costs.
In addition, following Russia’s military invasion of Ukraine in February 2022, NATO deployed additional military forces to Eastern Europe, and the United States, European Union, and other nations announced various sanctions against Russia. The invasion of Ukraine has triggered unprecedented sanctions against Russia by the U.S., NATO, and other countries which has created global security concerns that could result in wider conflict and otherwise have had a lasting impact on regional and global economies, any or all of which could adversely affect our business. In 2022,2023, we experienced a decrease of 15%12% in total revenue from customers in the EMEA region as compared to the same periods in 2021,2022, which we believe was in part driven by the uncertain macroeconomic environment surrounding the Ukraine-Russia war. We are actively monitoring the conflict in Ukraine to assess its ongoing impact on our business, as well as on our customers and other parties with whom we do business.
these ongoing conflicts, which could include further sanctions, embargoes, regional instability, and geopolitical shifts. It is also not possible to predict with certainty these ongoing conflicts and additional adverse effects on existing macroeconomic conditions, consumer spending habits, currency exchange rates, and financial markets. We are actively monitoring these conflicts to assess their ongoing impact on our business, as well as on our customers and other parties with whom we do business. Compliance with laws and regulations applicable to our global operations substantially increases our cost of doing business in international jurisdictions. We may be unable to keep current with changes in laws and regulations in each jurisdiction as they occur. Our policies and procedures designed to support compliance with these laws and regulations may not always result in our compliance or that of our employees, contractors, partners and agents. Any violations could result in enforcement actions, fines, civil and criminal penalties, damages, injunctions or reputational harm. If we are unable to comply with these laws and regulations or manage the complexity of our global operations successfully, we may need to relocate or cease operations in certain foreign jurisdictions.
We recognize revenue from subscriptions to our platform over the terms of the subscriptions. Consequently, increases or decreases in new sales are generally not immediately reflected in our results of operations and may be difficult to discern.
We recognize revenue from subscriptions to our platform over the terms of the subscriptions. As a result, a substantial portion of the revenue we report in each quarter is derived from the recognition of deferred revenue relating to subscriptions entered into during previous quarters. Consequently, a decline in new or renewed subscriptions in any single quarter may have a small impact on the revenue that we recognize for that quarter. However, such a decline will negatively affect our revenue in future quarters. Accordingly, the effect of significant downturns in sales and potential changes in our pricing policies or rate of customer expansion or retention may not be fully reflected in our results of operations until future periods. In addition, a significant portion of our costs are recognized as they are incurred, while revenue is recognized over the term of the subscription. As a result, growth in the number of new customers has in the past and may in the future result in our recognition of higher costs and lower revenue in the earlier periods of such growth. Finally, our subscription-based revenue model also makes it difficult for us to rapidly increase our revenue through additional sales in any period, as revenue from new customers or from existing customers that increase their usage of our product offerings must be recognized over the applicable subscription term.
Our ability to sell subscriptions to our products could be harmed by real or perceived material defects or errors in our platform or by other matters that may interrupt the availability of our platform or cause performance issues.
The software underlying our platform is inherently complex and may contain material defects or errors, particularly when we first introduce new solutions or when we release new features or capabilities. We have from time to time found defects or errors in our platform, and we or our users may detect new defects or errors in our existing or future platform or solutions. Any real or perceived errors, failures, vulnerabilities, or bugs in our platform could result in negative publicity or lead to data security, access, retention or other performance issues, all of which could harm our business. We may incur substantial costs in correcting such defects or errors and such costs could harm our business. Moreover, the harm to our reputation and potential legal liability related to such defects or errors may be substantial and could harm our business.
Our platform also utilizes hardware that we purchase or lease and software and services that we procure from third parties. In some cases, this includes software we license from international companies that may in the future become subject to legal or regulatory limitations on their ability to provide software outside of their jurisdiction. Any defects in, or unavailability of, our third-party hardware, software or services that cause interruptions to the availability of our platform, loss of data or performance issues could, among other things:
•cause a reduction in our revenue or a delay in market acceptance of our platform;
•require us to issue refunds to our customers or expose us to claims for damages;
•cause us to lose existing customers and make it more difficult to attract new customers;
•divert our development resources or require us to make extensive changes to our platform, which would increase our expenses;
•increase our technical support costs; and
•harm our reputation and brand.
The contractual protections, such as warranty disclaimers and limitation of liability provisions, in our customer agreements may not fully or effectively protect us from claims by customers or other third parties. Any insurance coverage we may have may not adequately cover all claims asserted against us or may only cover a portion of such claims. A successful product liability, warranty, or other similar claim against us could have an adverse effect on our business, operating results, and financial condition. In addition, even claims that ultimately are unsuccessful could result in our expenditure of funds in litigation and divert management’s time and other resources.
The experience of our customers and their users depends upon the interoperability of our platform across devices, operating systems and third-party applications that we do not control, and if we are not able to maintain and expand our relationships with third parties in order to integrate our platform with their products, our business may be harmed.
Our products have broad interoperability with a range of diverse devices, operating systems and supported third-party applications. Our platform is accessible from the web and from devices running Windows, Mac OS, iOS and Android. We depend on the accessibility of our platform across these and other third-party operating systems and applications that we do not control. For example, given the broad adoption of Salesforce’s products, it is important that we are able to integrate with its software. Several potential competitors have inherent advantages by being able to develop products and services internally that more tightly integrate with their own software platforms or those of their business partners.
We may not be able to modify our platform or products to maintain their continued compatibility with that of third parties’ products and services that are constantly evolving. In addition, some of our competitors may be able to disrupt the ability of our platform and products to operate with their products or services, or they could exert strong business influence on our ability to, and the terms on which we, operate and provide access to our platform and products. Should any of these third parties modify their products or services in a manner that degrades the functionality of our platform or products, or that gives preferential treatment to their own or competitive products or services, whether to enhance their competitive position or for any other reason, the interoperability of our platform and products with these third-party products and services could decrease and our business could be harmed.
Our business depends on a strong brand, and if we are not able to maintain and enhance our brand, our ability to expand our base of users will be impaired and our business will be harmed.
We believe that our brand identity and awareness have contributed to our success. We believe that the importance of our brand and market awareness of the benefits of our platform and products will increase as competition in our market further intensifies. Successful promotion of our brand will depend on a number of factors, including the effectiveness of our marketing efforts, thought leadership, our ability to provide a high-quality, reliable and cost-effective platform, the perceived value of our platform and products and our ability to provide quality customer success and support experience. Brand promotion activities require us to make substantial investments. The promotion of our brand, however, may not generate customer awareness or increase revenue, and any increase in revenue may not offset the expenses we incur in building and maintaining our brand.
Our estimates of market opportunity and forecasts of market growth may prove to be inaccurate, and even if the market in which we compete achieves the forecasted growth, our business could fail to grow at a similar rate, if at all.
Market opportunity estimates and growth forecasts, including those we have generated ourselves, are subject to significant uncertainty and are based on assumptions and estimates that may not prove to be accurate. Not every organization covered by our market opportunity estimates will necessarily purchase subscriptions for our solutions or similar products or services at all, and some or many of those organizations may choose to continue using products or services offered by our competitors. It is impossible to build every product feature that every customer wants, and our competitors may develop and offer features that our platform does not provide. The variables used in the calculation of our market opportunity are subject to change over time, and there is no guarantee that any particular number or percentage of the organizations covered by our market opportunity estimates will generate any particular level of revenue for us, if any. Even if the market in which we compete meets our size estimates and growth forecasts, our business could fail to grow for a variety of reasons outside of our control, including competition in our industry, customer preferences or the other risks set forth in this Report and other documents we filed with the SEC from time to time. If any of these risks materialize, it could harm our business and prospects.
If we were to lose the services of our Chief Executive Officer or other members of our senior management team, we may not be able to execute our business strategy.
Our success depends in a large part upon the continued service of key members of our senior management team. In particular, our co-founder, President and Chief Executive Officer, Sharat Sharan, is critical to our overall management, as well as the continued development of our solutions, our culture, our strategic direction, our engineering and our operations. All of our executive officers are at-will employees, and we do not maintain any key person life insurance policies. The loss of any member of our senior management team could harm our business.
The failure to attract and retain additional qualified personnel could harm our business and culture and prevent us from executing our business strategy.
To execute our business strategy, we must attract and retain highly qualified personnel. Competition for executives, software developers, sales personnel and other key employees in our industry is intense. In particular, we compete with many other companies for software developers with high levels of experience in designing, developing and managing software for live engagement technologies, as well as for skilled sales and operations professionals. At times, we have experienced, and we may continue to experience, difficulty in hiring and retaining employees with appropriate qualifications, and we may not be able to fill positions. If we fail to attract new personnel or fail to retain and motivate our current personnel, our business could be harmed.
Many of the companies with which we compete for experienced personnel have greater resources than we have, and some of these companies may offer greater compensation packages. Particularly, in the San Francisco Bay Area, job candidates and existing employees carefully consider the value of the equity awards they receive in connection with their employment. If the perceived value of our equity awards declines, or if the mix of equity and cash compensation that we offer is unattractive, it may adversely affect our ability to recruit and retain highly skilled employees. Job candidates may also be threatened with legal action under agreements with their existing employers if we attempt to hire them, which could impact hiring and result in a diversion of our time and resources. Additionally, laws and regulations, such as restrictive immigration laws, may limit our ability to recruit internationally. We must also continue to retain and motivate existing employees through our compensation practices, company culture and career development opportunities. If we fail to attract new personnel or to retain our current personnel, our business would be harmed.
In addition, many of our employees may be able to receive significant proceeds from sales of our equity in the public markets, which may reduce their motivation to continue to work for us. Moreover, these proceeds could create disparities in wealth among our employees, which may harm our culture and relations among employees and our business.
We may not successfully manage our growth or plan for future growth.
The growth and expansion of our business experienced in 2020 and 2021 placed a continuous, significant strain on our management, operational and financial resources. Our information technology systems and our internal controls and procedures may not adequately keep pace with ourfuture growth. In addition, we face challenges of integrating, developing, motivating and retaining an employee base in various countries around the world. Managing ourany future growth willwould also require significant expenditures and allocation of valuable management resources.
Our ability to forecast our future results of operations is subject to a number of uncertainties, including our ability to effectively plan for and model future growth. We have encountered in the past, and may encounter in the future, risks and uncertainties frequently experienced by growing companies in rapidly changing industries. If we fail to achieve the necessary level of efficiency in our organization as it grows, or if we are not able to accurately forecast future growth, our business would be harmed.
If we fail to maintain an effective system of disclosure controls and internal control over financial reporting, our ability to produce timely and accurate financial statements or comply with applicable regulations could be impaired.
As a public company, we are subject to the reporting requirements of the Exchange Act, the Sarbanes-Oxley Act, and the rules and regulations of the applicable listing standards of the NYSE. We expect that the requirements of these rules and regulations will continue to increase our legal, accounting and financial compliance costs, make some activities more difficult, time-consuming and costly and place significant strain on our personnel, systems and resources.
The Sarbanes-Oxley Act requires, among other things, that we maintain effective disclosure controls and procedures and internal control over financial reporting. We are continuing to develop and refine our disclosure controls and other procedures that are designed to ensure that information required to be disclosed by us in the reports that we will file with the Securities and Exchange Commission, or the SEC, is recorded, processed, summarized and reported within the time periods specified in SEC rules and forms and that information required to be disclosed in reports under the Exchange Act is accumulated and communicated to our principal executive and financial officers. We are also continuing to improve our internal control over financial reporting. In order to maintain and improve the effectiveness of our disclosure controls and procedures and internal control over financial reporting, we have expended, and anticipate that we will continue to expend, significant resources, including accounting-related costs and significant management oversight.
Our current controls and any new controls that we develop may become inadequate because of changes in conditions in our business. In addition, changes in accounting principles or interpretations could also challenge our internal controls and require that we establish new business processes, systems and controls to accommodate such changes. We have limited experience with implementing the systems and controls that will be necessary to operate as a public company, as well as adopting changes in accounting principles or interpretations mandated by the relevant regulatory bodies. Additionally, if these new systems, controls or standards and the associated process changes do not give rise to the benefits that we expect or do not operate as intended, it could adversely affect our financial reporting systems and processes, our ability to produce timely and accurate financial reports or the effectiveness of internal control over financial
reporting. Moreover, our business may be harmed if we experience problems with any new systems and controls that result in delays in their implementation or increased costs to correct any post-implementation issues that may arise.
Further, weaknesses in our disclosure controls and internal control over financial reporting may be discovered in the future. Any failure to develop or maintain effective controls or any difficulties encountered in their implementation or improvement could harm our business or cause us to fail to meet our reporting obligations and may result in a restatement of our financial statements for prior periods. Any failure to implement and maintain effective internal control over financial reporting also could adversely affect the results of periodic management evaluations and annual independent registered public accounting firm attestation reports regarding the effectiveness of our internal control over financial reporting that we will eventually be required to include in our periodic reports that will be filed with the SEC. Ineffective disclosure controls and procedures and internal control over financial reporting could also cause investors to lose confidence in our reported financial and other information, which would likely have a negative effect on the trading price of our common stock. In addition, if we are unable to continue to meet these requirements, we may not be able to remain listed on the NYSE.
We are required, pursuant to Section 404 of the Sarbanes-Oxley Act, to furnish a report by management on, among other things, the effectiveness of our internal control over financial reporting for our fiscal year ended December 31, 2021 and each subsequent year. This assessment includes disclosure of any material weaknesses identified by our management in our internal control over financial reporting. Our independent registered public accounting firm is not required to attest to the effectiveness of our internal control over financial reporting until our first annual report required to be filed with the SEC following the later of the date we are deemed to be an "accelerated filer" or a "large accelerated filer," each as defined in the Exchange Act, or the date we are no longer an "emerging growth company," as defined in the JOBS Act. We are required to disclose, to the extent material, changes made in our internal control over financial reporting on a quarterly basis. At such time, our independent registered public accounting firm may issue a report that is adverse in the event it is not satisfied with the level at which our internal control over financial reporting is documented, designed or operating. Any failure to maintain effective disclosure controls and internal control over financial reporting could harm our business and could cause a decline in the trading price of our common stock.
Any failure to offer high-quality support may harm our relationships with our customers and, consequently, our business.
We have designed our platform to be easy to adopt and use with minimal support. However, if we experience increased demand for support, we may face increased support costs. In addition, as we grow our operations and support our global customer base, we must provide efficient support that meets our customers’ needs, including by integrating with or building solutions that allow streamlined support workflows, or by hiring additional support personnel if necessary. Our ability to acquire new customers significantly depends on our business reputation and on positive recommendations from our existing customers. Any failure to maintain, or a market perception that we do not maintain, high-quality support could harm our business.
Our business could be disrupted by catastrophic events.
Occurrence of any catastrophic event, including pandemics and a worsening ofsuch as the COVID-19 pandemic, earthquake, fire, flood, tsunami or other weather event, power loss, telecommunications failure, software or hardware malfunctions, cyberattacks, war or terrorist attacks, could result in lengthy interruptions in our service. In particular, our U.S. headquarters and one of the data centers we utilize are located in the San Francisco Bay Area, a region known for seismic activity, and our insurance coverage may not compensate us for losses that may occur in the event of an earthquake or other significant natural disaster. In addition, acts of terrorism could cause disruptions to the internet, the electric grid or the economy as a whole. Even with our disaster recovery arrangements, our service could be interrupted. If our systems were to fail or be negatively impacted as a result of a natural disaster or other catastrophic event, our ability to deliver our solutions to our customers would be impaired or we could lose critical data. If we are unable to develop adequate plans to ensure that our business functions continue to operate during and after a disaster and to execute successfully on those plans in the event of a disaster or emergency, our business could be harmed.
Our actual or perceived failure to comply with privacy laws could harm our business.
Businesses use our platform to facilitate better engagement with their customers and prospects, derive insights about content and usage, and provide more meaningful and targeted experiences and content. These capabilities rely on collection and processing of personal information through our platform. As a result, compliance with laws and regulations regarding data privacy, cybersecurity, data protection, data breaches, and the collection, processing, storage, transfer and use of personal data, which we collectively refer to as privacy laws, are critical to our business. While we strive to comply with applicable privacy laws and legal obligations, the impact, requirements and enforcement risks associated with privacy laws vary, and in some cases may even conflict, across jurisdictions.
Our roles and obligations under privacy laws, and consequently our potential liability, may vary. In some cases, our customers may pass through privacy law compliance obligations and requirements to us contractually. We have customers in numerous jurisdictions worldwide, and our customers may try to impose broad obligations on us pursuant to all privacy laws applicable to them and may decide not to do business with us if we will not agree to their privacy terms. Certain significant privacy laws (such as the GDPR) impose obligations directly on many of our customers, as “data
controllers,” as well as on us both as a “data processor” for personal data processed on behalf of our customers pursuant to our platform, which we refer to as the platform personal data, and as a “controller” for the personal data we collect related to employees and personnel, our B2B relationships, and our marketing, sales and other activities, which we refer to as the ON24 business data. Under these privacy laws, we typically have fewer direct obligations as a “data processor” or “service provider” than our customers do, with respect to platform personal data. However, we can still be subject to significant liability for noncompliance with such laws, including, for example, under the GDPR, which provides for penalties of up to the greater of €20 million or four percent of worldwide annual revenue. Certain other privacy laws do not clearly distinguish between “controller” and “processor” or similar roles. Where such privacy laws apply, we could be subject to increased risks if our customers fail to comply with notice, consent and other requirements under applicable privacy laws in their use of our platform. While we generally require and rely on our customers to ensure that their use of our platform and associated personal information processing complies with applicable privacy laws, our customers could fail to comply with these requirements, which could expose us to risks under certain privacy laws.
Further, even similar privacy laws may be subject to evolving or differing interpretations and enforcement risks. For example, across the EU, supervisory authorities of EU member states may issue data protection guidance and opinions regarding the GDPR that may vary. Also, under the current ePrivacy Directive and associated EU member state legislation, the rules governing marketing, “cookies” and online advertising vary among EU member states. In addition, across jurisdictions, privacy laws may include varied and inconsistent requirements. As a result, certain features of our platform and products could pose risks or need to be modified for certain jurisdictions, but not for others. Such requirements could reduce demand for our products, require us to take on more onerous obligations in our contracts, restrict our ability to collect, store, transfer and process data or, in some cases, impact our customers’ use of our platform.
Furthermore, general customer and buyer trust as to the responsible use of data may cause business buyers to resist providing the data necessary to allow our customers to use our platform effectively. Even the perception that the privacy and security of personal information are not satisfactorily protected or do not meet regulatory requirements could inhibit sales of our products or services and limit adoption of our products.
Evolving privacy laws may impact use and adoption of our platform and adversely affect our business.
Laws and regulations related to privacy, personal data and the provision of services over the Internet are evolving in the United States and globally, with the adoption of new and amended privacy laws. The impact, requirements and enforcement risks associated with these privacy laws vary, and in some cases may even conflict, across jurisdictions.
In addition, new U.S. and international privacy laws may impose new obligations on us and many of our customers. Both in the United States and globally, numerous jurisdictions have passed or are actively considering new or amended privacy laws. For example, the California Consumer Privacy Act, or CCPA, which took effect in January 2020 and was substantially amended by the California Privacy Rights Act effective January 1, 2023 (as amended, the “CCPA”), applies to us and to many our customers. Under the CCPA, we are both a “business,” as to the ON24 business data, and a “service provider,” as to the platform personal data. The CCPA introduced sweeping definitions and broad individual rights, and imposes
substantial requirements and restrictions on the collection, use and disclosure of personal information. The CCPA also introduced a private right of action for certain data breaches, which gives rise to increased class action risk. Notably, since the CCPA was signed into law, it has been amended multiple times, has been subject to further implementing regulations, and may face further amendment, refinement or replacement.
As the CCPA continues to evolve, several U.S. states have recently adopted new privacy laws and various other U.S. states are also actively introducing and considering so-called “omnibus” privacy legislation. In 2023, omnibus privacy laws took effect in Colorado, Connecticut, Virginia and Utah, and several other states have passed omnibus privacy laws.Similarly, numerous foreign jurisdictions have enacted or are actively considering legislation introducing new or amended laws and regulations addressing data privacy, cybersecurity, marketing, data protection, data localization and personal data. Further, privacy laws such as the EU’s proposed e-Privacy Regulation are increasingly aimed at the use of personal information for marketing purposes and the tracking of individuals’ online activities, which could expose us to additional regulatory burdens, limit our marketing, advertising, business development and sales efforts, and impact features made available to our customers through our platform. In addition, Brexit has also created additional uncertainty with regard to UK privacy laws, as well as the treatment of data transfers to and from the United Kingdom, where we have operations and customers. The ongoing development of privacy laws gives rise to uncertainty regarding the impact of privacy laws on us and our customers, and we and our customers could be exposed to additional burdens.
In addition, decisions by courts and regulatory bodies relating to privacy laws can also have a significant impact on us and other businesses that operate across international jurisdictions. For example, in 2020 both the EU-U.S. and Swiss-EU privacy shield frameworks were invalidated. We and many other companies relied on these privacy shield frameworksinvalidated as an “adequacy” mechanism for the transfer of personal data from the European Economic Area, or the EEA-Switzerland, to the United States in compliance with the GDPR and Swiss data protection laws, respectively. WhileFollowing this, we have takentook measures to implement alternative adequacy mechanisms by using the EU standard contractual clauses for transfers of personal data for processors established in third countries, further steps may be necessary. Underand agreed to, additional safeguards with certain customers. In July 2023, the decision invalidatingUS and the EU-U.S.EU agreed to the EU-US Data Privacy Framework, and the US and Switzerland agreed to the Swiss-US Data Privacy Framework, which frameworks will now replace the previous privacy shield framework, or Schrems II, additional safeguards may be needed. Ourframeworks. In October 2023, the UK extension to the EU-US Data Privacy Framework came into force. While we participate in these new frameworks, certain customers may requestalso require that we continue to agree to alternative adequacy mechanisms, such as the EU standard contractual clauses, and additional safeguards, such as additional security controls and other contractual measures, which mustwill need to be assessed on a case-by-case basis. However, what additional safeguards will be considered adequate remains unclear. We expect continued guidance from applicable authorities, as well as updateslegal challenges to the EU standard contractual clauses.
Other jurisdictions have also instituted specific requirements and restrictions on the cross-border transfer of personal data, and certain countries have passed or are considering passing data localization laws and regulations, which in some cases would require personal data be maintained in the originating jurisdiction and in other cases may prohibit such personal data from being transferred outside of the originating jurisdiction. While our solutions allow customers to receive and store local copies of platform data on their or other third-party servers, we do not maintain local servers to enable customers to maintain personal data only on servers in the originating jurisdiction. As with most cloud-based solutions, restrictions on the transfer of platform data outside of the originating jurisdiction could pose particular challenges and result in additional costs or otherwise impact platform use.
New and proposed marketing, advertising and other privacy laws and guidelines have recently been enacted or proposed that could impose more restrictions and give individuals more rights regarding marketing, targeting, and analytics or “profiling” activities. Some of these regulations seek, among other things, to give consumers greater control over how their personal information is processed for these purposes, or impose prior, affirmative consent obligations on companies related to these activities. For example, in the EU, cookies and similar technologies used for personalization, advertising, and analytics may not be used without affirmative consent and the proposed ePrivacy Regulation may further restrict these activities and technologies and increase restrictions. Further, in the US, privacy litigation claims related to online tracking and cookies are on this rise. These litigation and enforcement developments could require us to change one or more aspects of the way we operate our business, limit our marketing, advertising, business development and sales efforts, impact certain features made available to customers through our platform or require us to introduce changes to our platform or solutions.
Although we monitor the regulatory environment and have invested in addressing these developments, including the GDPR, the EU ePrivacy Directive and the CCPA, the ongoing development of privacy laws means that we cannot predict with certainty the impact of these developments. These evolving privacy laws may require us to make additional changes to our practices and services to enable us or our customers to meet the new legal requirements, and may also increase our potential liability exposure through new or higher potential penalties for non-compliance, including as a result ofnon-compliance. In addition, cyber incidents and data breaches. breaches present potential risks and could have financial, operational and reputational impacts on the Company.In addition, many of our customers and potential customers in the healthcare, financial services and other industries are subject to substantial regulation regarding their collection, use and protection of data and may be the subject of further regulation in the future. These laws or other privacy law developments may change the way these customers do business and may require us to implement additional features or offer additional contractual terms to satisfy customer and regulatory requirements. As a result of these privacy law developments, certain features of our platform and products could pose risks or need to be modified for certain jurisdictions, but not for others. They also could cause the demand for and sales of our platform to decrease and adversely impact our financial results.
The costs of compliance with, and other burdens imposed by, privacy laws may limit the use and adoption of our platform, reduce overall demand for our platform, make it more difficult to meet expectations from or commitments to our customers and their users, require us to implement additional features or offer additional contractual terms to satisfy customer and regulatory requirements, lead to significant fines, penalties or liabilities for noncompliance, impact our reputation, or slow the pace at which we close sales transactions, any of which could harm our business. In addition, these laws raise additional enforcement and liability risks and penalties. For example, statutory damages available through a private right of action for certain data breaches under CCPA, and potentially other U.S. and international laws, may increase our and our customers’ potential liability. In some cases, violations of privacy laws can lead to government enforcement or private litigation and could subject us to civil and criminal sanctions, including both monetary fines and injunctive action that could force us to change our business practices, all of which could adversely affect our financial performance and harm our reputation and our business.
We are subject to export and import controls, customs, sanctions, embargo, and anti-boycott laws and regulations that could seriously impair our ability to compete in international markets due to licensing requirements and subject us to liability if we are not in compliance with applicable laws and regulations.
Our platform and products are subject to various restrictions under U.S. export control and sanctions laws and regulations, including the U.S. Department of Commerce’s Export Administration Regulations, or EAR, and various economic and trade sanctions regulations administered by the U.S. Department of the Treasury’s Office of Foreign Assets Control, or OFAC, as well as other U.S. government agencies. U.S. export control and economic sanctions laws include trade, commerce, and investment restrictions or prohibitions, including those on the sale, supply, import, or export of certain products and services to or from U.S. embargoed or sanctioned countries, governments, persons and entities, and also require authorization for the export of certain encryption and other items. Parties that facilitate transactions that violate or otherwise seek to evade export controls or sanctions can face liability. Also, in certain circumstances, sanctions require U.S. persons to block or freeze the property of sanctioned persons.
U.S. export controls and sanctions are complex and vary according to specific programs administered by relevant government agencies. Each program can be tied to a specific country or policy initiative. In certain cases, parties can request the U.S. government to issue a license to allow certain transactions. However, the scope and substance of those licenses can be fact specific and limited in scope.
The United States currently imposes comprehensive sanctions on Cuba, Iran, North Korea, Syria, and the Crimea, Donetsk People’s Republic (DPR)(“DPR”) and Luhansk People’s Republic (LPR)(“LPR”) regions of Ukraine. In addition, numerous other countries throughout the world are subject to partial or limited sanctions and restrictions imposed by the U.S. government. Sanctions also apply to persons that appear on, or are majority owned by a person that appears on, OFAC’s List of Specially Designated Nationals and Blocked Persons, or the SDN List. The Department of Commerce and the Department of State also maintain their own sanctions and export control lists. The above list of countries that are the subject of U.S. sanctions and export controls can change at any time. In addition, the SDN List as well as other sanctions lists contain thousands of names and are updated on a regular basis. All of those changes can impact our business. The U.S. government generally applies a strict liability standard when it comes to compliance with sanctions, embargoes, and export controls. This means that we can face liability even if we did not intentionally violate those rules.
We are also subject to U.S. restrictions under the EAR and the Internal Revenue Code that prevent us from participating in boycotts imposed by other countries if those boycotts are not approved by the United States. Companies and individuals that violate these anti-boycott restrictions may face criminal consequences. In addition, companies that are asked to comply with such boycotts are obligated to report those requests to the U.S. government, even if they do not agree to abide by such boycotts.
In addition, various countries regulate the import of certain encryption and other technology, including through import permitting and licensing requirements and have enacted or could enact laws that could limit our ability to provide access to our platform. We maintain internal controls and procedures to facilitate compliance with applicable export control requirements, but our company has expanded, has detected past filing issues, and in the future may face material noncompliance that we fail to detect. If any precautions we take fail to prevent our platform and products from being accessed or used in violation of such laws, we may face fines and penalties, reputational harm, loss of access to certain markets, or other harm to our business.
Changes in our platform or changes in export, sanctions and import laws may delay the introduction and sale of subscriptions to our platform in international markets, prevent our customers with international operations from using our platform or, in some cases, prevent the access or use of our platform to and from certain countries, governments, persons or entities altogether. Further, any change in export or import regulations, economic sanctions or related laws, shift in the enforcement or scope of existing regulations, or change in the countries, governments, persons or technologies targeted by such regulations could result in decreased use of our platform or in our decreased ability to export or sell our platform to existing or potential customers with international operations. Any decreased use of our platform or limitation on our ability to export or sell our platform would likely harm our business.
We are subject to a variety of U.S. and non-U.S. laws and regulations, compliance with which could impair our ability to compete in domestic and international markets and non-compliance with which may result in claims, fines, penalties, and other consequences, all of which could adversely impact our operations, business, or performance.
As a service provider, we do not regularly monitor our platform to evaluate the legality of content shared on it by our customers. While to date we have not been subject to legal or administrative actions as a result of this content, the laws in this area are evolving and vary widely between jurisdictions. Accordingly, it may be possible that in the future we and our business partners may be subject to legal actions involving our customers’ content or use of our platform.
Our platform depends on the ability of our customers and their users to access the internet. If we fail to anticipate developments in the law, or we fail for any reason to comply with relevant law, our platform could be blocked or restricted, and we could be exposed to significant liability that could harm our business.
From time to time, we may be involved in disputes or regulatory inquiries that arise in the ordinary course of business involving labor and employment, wage and hour, commercial, securities or investment, intellectual property, data breach and other matters. For example, we were named in a consolidated securities class action as described further in the section titled “Legal Proceedings.” We expect that the number and significance of these potential disputes may increase as our business expands and our company grows larger. Contractual provisions and insurance coverage may not cover potential claims and may not be adequate to indemnify us for all liabilities we may face. Any claims against us, whether meritorious or not, could be time consuming, result in costly litigation, require significant amounts of management time, and result in the diversion of significant operational resources. Litigation is inherently unpredictable, and the results of any claims may have a material adverse effect on our business, financial condition, results of operations, and prospects.
We are an international company and may engage in business in jurisdictions that present material legal compliance risk. We are subject to various U.S. and non-U.S. laws and regulations prohibiting corruption, bribery, kickbacks, money laundering, terrorist financing, fraud and similar matters, such as the U.S. Foreign Corrupt Practices Act of 1977, as amended, or the FCPA, the Uniting and Strengthening America by Providing Appropriate Tools to Restrict, Intercept, and Obstruct Terrorism Act of 2001, the UK Bribery Act 2010, and the UK Proceeds of Crime Act 2002. These laws and regulations are actively enforced and generally prohibit companies and their agents, employees, representatives, business partners, and intermediaries from authorizing, promising, offering, providing, soliciting, or accepting, directly or indirectly, improper payments or benefits to or from government officials and other persons in the public or private sector for improper purposes.
We may engage resellers and other third parties from time to time to sell subscriptions to our solutions, obtain necessary permits, licenses, patent registrations, and other regulatory approvals, or otherwise support our business or operations. Oftentimes, improper payments by these types of third parties can raise anti-corruption and other legal compliance risk for companies in our position. We also have direct and indirect interactions with officials and employees of U.S. and non-U.S. government agencies or government-affiliated organizations. These factors raise our legal risk exposure. There can be cases where enforcement authorities seek to hold us liable for the corrupt or other illegal activities of our employees, agents, contractors, vendors, and other business partners, even if we do not explicitly authorize or have actual knowledge of such activities.
In addition to prohibiting bribery, the FCPA and other laws require us to maintain accurate and complete books and records and a system of internal controls. Enforcement agencies interpret these requirements very broadly and violations can occur if companies or their representatives knowingly or unknowingly conceal bribes or other fraudulent or illegal payments in their records or execute transactions or access company assets without management’s general or specific authorization. These requirements are so broad that in certain cases enforcement agencies may claim that violations are possible even if there is no evidence of bribery or corruption.
To the extent we expand our domestic and international presence, our exposure for violating these laws will increase. If we fail to comply with those legal standards, we may face substantial civil and criminal fines, penalties, profit disgorgement, reputational harm, loss of access to certain markets, disbarment from government business, the loss of export privileges, tax reassessments, breach of contract, fraud and other litigation, reputational harm, and other collateral consequences that could harm our business.
We use open source software and AI/ML-powered capabilities in our platform, which may subject us to litigation or other actions that could harm our business.
We use open source software in our platform, and we may use more open source software in the future. In the past, companies that have incorporated open source software into their products have faced claims challenging the ownership or use of open source software or compliance with open source license terms. Accordingly, we could be subject to suits by parties claiming ownership of what we believe to be open source software or claiming noncompliance with open source licensing terms. Some open source software licenses require users who use, distribute or make available across a network software or services that include open source software to publicly disclose all or part of the source code to such software or make available any derivative works of the open source code on terms unfavorable to the developer or at no cost. Additionally, if a third-party software provider has incorporated open source software into software that we license from such provider, we could be required to disclose any of our source code that incorporates or is a modification of our licensed software. If we were to use open source software subject to such licenses, we could be required to release our proprietary source code, pay damages, re-engineer our platform or solutions, discontinue sales, or take other remedial action, any of which could harm our business. In addition, if the license terms for updated or enhanced versions of the open source software we utilize change, we may be forced to expend substantial time and resources to re-engineer our components of our platform.
In addition, the use of third-party open source software typically exposes us to greater risks than the use of third-party commercial software because open source licensors generally do not provide warranties or controls on the functionality or origin of the software. Use of open source software may also present additional security risks because the public availability of such software may make it easier for hackers and other third parties to determine how to compromise our platform. Any of the foregoing could harm our business and could help our competitors develop products and services that are similar to or better than ours.
We are also building AI/ML-powered capabilities into our platform, leveraging the data collected by or on behalf of our customers through our platform to enable better prediction of which content will drive the most engagement for individual prospects and customer segments. We expect these elements of our business to grow, and we anticipate adding new features in the future. We envision a future in which AI/ML operating in our platform helps our customers drive more meaningful engagement and deliver targeted content. As with many innovations, AI/ML presents risks and challenges that could affect its adoption, and therefore our business. AI/ML algorithms may be flawed. Datasets may be insufficient or contain biased information. Ineffective or inadequate AI/ML development or deployment practices by us or others could result in incidents that impair the acceptance of AI/ML solutions or cause harm to individuals or society. These deficiencies and other failures of AI/ML systems could subject us to competitive harm, regulatory action, legal liability, including under new proposed legislation regulating AI in jurisdictions such as the EU, and brand or reputational harm. Some AI/ML scenarios present ethical issues. If we enable or offer AI/ML features that are controversial because of their impact on human rights, privacy, employment, or other social, economic, or political issues, we may experience brand or reputational harm.
Our business may suffer if it is alleged or determined that our technology infringes the intellectual property rights of others.
The software industry is characterized by the existence of a large number of patents, copyrights, trademarks, trade secrets and other intellectual and proprietary rights. Like other companies operating in the software industry, we have been threatened with, and may in the future become party to, adversarial proceedings or litigation regarding intellectual property rights with respect to our current technology, whether or not we are actually infringing, misappropriating or otherwise violating the rights of third parties. Companies holding patents or other intellectual property rights may bring suits alleging infringement of such rights or otherwise assert their rights and urge us to take licenses. Our applications, software, and our use of AI technologies (both third-party and proprietary) could be found to infringe upon or otherwise violate a third party’s intellectual property rights. Companies in the software industry are often required to defend against litigation claims based on these allegations of infringement or other violations of intellectual property rights. Many of our competitors and other industry participants have been issued patents or have filed patent applications and may assert patent or other intellectual property rights within the industry. Moreover, in recent years, individuals and groups that are non-practicing entities, commonly referred to as “patent trolls,” have purchased patentsreached out to us and numerous other intellectual property assets for the purpose of makingcompanies to make claims of infringement in order to extract licenses or settlements.
We may from time to time in the future become a party to litigation and disputes related to our intellectual property and our platform. Patent litigation is inherently risky and uncertain, and current or future litigation may not result in a favorable outcome for us. The costs of supporting litigation and dispute resolution proceedings are considerable, and a favorable outcome may not be obtained. We may need to settle litigation and disputes on terms that are unfavorable to us, or we may be subject to an unfavorable judgment that may not be reversible upon appeal. The terms of any settlement or judgment may require us to cease some or all of our operations or pay substantial amounts to the other party. Even if we were to prevail in such a litigation or dispute, it could be costly and time consuming, and divert the attention of our management and key personnel from our business operations. Our technologies, including the use of AI in our platform, may not be able to withstand any third-party claims or rights against their use. Claims of intellectual property infringement might require us to redesign our platform, delay releases, enter into costly settlement or license agreements or pay costly damage awards, or face a temporary or permanent injunction prohibiting us from marketing or selling our platform. If we cannot or do not license the infringed technology on reasonable terms or at all, or substitute similar technology from another source, our revenue and operating results could be adversely impacted. Additionally, our customers may not purchase subscriptions to our platform if they are concerned that they may infringe third-party intellectual property rights. The occurrence of any of these events may have a material adverse effect on our business.
In our customer agreements, we agree to defend and hold our customers harmless against claims, demands, suits, or proceedings made or brought against them by a third party alleging that their use of our platform infringes the intellectual property rights of a third party. Any existing limitations of liability provisions in our contracts may not be enforceable or adequate, and they may not otherwise protect us from any such liabilities or damages with respect to any particular claim. Our customers who are accused of intellectual property infringement may in the future seek indemnification from us. If we are required to defend our customers against, or hold them harmless from, infringement or other claims, our business may be disrupted, our management’s attention may be diverted, and our operating results and financial condition may suffer.
Our failure to protect our intellectual property rights and proprietary information could diminish our brand and other intangible assets.
We primarily rely on a combination of patents, trade secrets, domain name protections, trademarks and copyrights, as well as confidentiality, license and subscription agreements with our employees, consultants and third parties, to protect our intellectual property and proprietary rights. In the United States and abroad, as of December 31, 2022,2023, we have 1819 issued patents and 2726 pending patent applications. We make business decisions about when to seek patent protection for a particular technology and when to rely upon copyright or trade secret protection, and the approach we select may ultimately prove to be inadequate. Even in cases where we seek patent protection, the resulting patents may not effectively protect every significant feature of our solutions. For example, we have received a summary judgment ruling that a patent which is immaterial to our business is invalid. It is possible that our efforts to protect our intellectual property rights are unsuccessful.
In addition, we believe that the protection of our trademark rights is an important factor in product recognition, protecting our brand and maintaining goodwill. If we do not adequately protect our rights in our trademarks from infringement and unauthorized use, any goodwill that we have developed in those trademarks could be lost or impaired, which could harm our brand and our business. Third parties may knowingly or unknowingly infringe our proprietary rights, third parties may challenge our proprietary rights, pending and future patent, trademark and copyright applications may not be approved, and we may not be able to prevent infringement without incurring substantial expense.
We have also devoted substantial resources to the development of our proprietary technologies and related processes. In order to protect our proprietary technologies and processes, we rely in part on trade secret laws and confidentiality and invention assignment agreements with our employees, consultants and third parties. These agreements may not effectively protect our proprietary rights. In addition, others may independently discover our trade secrets, in which case we would not be able to assert trade secret rights, or may develop similar technologies and processes. We may not be able to protect our source code from copying if there is an unauthorized disclosure. Source code, the detailed program commands for our operating systems and other software programs, is critical to our business. We take significant measures to protect the secrecy of our source code. If our source code leaks, we might lose future trade secret protection for that code. It may then become easier for third parties to compete with our products by copying functionality, which could adversely affect our revenue and operating margins. Unauthorized disclosure of source code also could increase the security risks described elsewhere in these risk factors. Further, laws in certain jurisdictions may afford little or no trade secret protection, and any changes in, or unexpected interpretations of, the intellectual property laws in any countries in which we operate may compromise our ability to enforce our intellectual property rights. To the extent we expand our international activities, our exposure to unauthorized copying and use of our technology and proprietary information may increase. Costly and time-consuming litigation could be necessary to enforce and determine the scope of our proprietary rights. If the protection of our proprietary rights is inadequate to prevent use or appropriation by third parties, the value of our platform, brand and other intangible assets may be diminished, and competitors may be able to more effectively replicate our platform and its features. Any of these events would harm our business.
Our reported results of operations may be adversely affected by changes in accounting principles generally accepted in the United States.
Generally accepted accounting principles in the United States are subject to interpretation by the Financial Accounting Standards Board, or the FASB, the SEC, and various bodies formed to promulgate and interpret appropriate accounting principles. A change in these principles or interpretations could have a significant effect on our reported results of operations and may even affect the reporting of transactions completed before the announcement or effectiveness of a change. For example, we adopted Accounting Standards Codification, or ASC, Topic 606, Revenue from Contracts with Customers, or Topic 606, utilizing the full retrospective method of adoption and ASC Topic 340, Other Assets and Deferred Costs, or Topic 340. The adoption of Topic 606 and Topic 340 changed the timing and manner in which we report our revenue and expenses, especially with respect to our sales commissions. It is also difficult to predict the impact of future changes to accounting principles or our accounting policies, any of which could harm our business.
We may acquire other companies, products and technologies, which could require significant management attention, disrupt our business or dilute stockholder value.
We may make acquisitions of other companies, products and technologies. We have limited experience in acquisitions. We may not be able to find suitable acquisition candidates and we may not be able to complete acquisitions on favorable terms, if at all. If we do complete acquisitions, we may not ultimately strengthen our competitive position or achieve our goals, and any acquisitions we complete could be viewed negatively by our customers, users, industry analysts or investors. In addition, we may not be able to integrate acquired businesses successfully or effectively manage the combined company following an acquisition. If we fail to successfully integrate our acquisitions, or the people or technologies associated with those acquisitions, into our company, the results of operations of the combined company could be adversely affected. Any integration process will require significant time and resources, require significant attention from management and disrupt the ordinary functioning of our business, and we may not be able to manage the process successfully, which could harm our business. In addition, we may not successfully evaluate or utilize the acquired technology or accurately forecast the financial impact of an acquisition transaction, including accounting charges, operating costs or revenue.
We may have to pay cash, incur debt or issue equity securities to pay for any such acquisition, each of which could affect our financial condition or the value of our capital stock. The sale of equity to finance any such acquisitions could result in dilution to our stockholders. If we incur more debt, it would result in increased fixed obligations and could also subject us to covenants or other restrictions that would impede our ability to flexibly operate our business.
We may need additional capital, which may not be available on favorable terms, or at all.
Historically, we have funded our operations and capital expenditures primarily through equity issuances and cash generated from our operations. Although we currently anticipate that our existing cash and cash equivalents and cash flow from operations will be sufficient to meet our cash needs for the foreseeable future, we may require additional financing. We evaluate financing opportunities from time to time, and our ability to obtain financing will depend, among other things, on our development efforts, business plans, operating performance, levels of indebtedness and condition of the capital markets at the time we seek financing. Additional financing may not be available to us on favorable terms when required, or at all. If we raise additional funds through the issuance of equity, equity-linked or debt securities, those securities may have rights, preferences or privileges senior to the rights of our common stock, including with respect to dividends and other distributions, and our stockholders may experience dilution.
Covenants in our loan agreement governing our revolving line of credit may restrict our operations, and our failure to comply with these covenants may adversely affect our business, results of operations and financial condition.
We are party to a loan and security agreement with Comerica Bank, or the Revolving Credit Facility, which is secured by a security interest on substantially all of our assets and contains various restrictive covenants, including restrictions on our ability to dispose of our assets, merge with or acquire other entities, incur other indebtedness, make investments and engage in transactions with our affiliates. Our Revolving Credit Facility also contains certain financial covenants. Our ability to meet these restrictive and financial covenants can be affected by events beyond our control. Our Revolving Credit Facility provides that our breach or failure to satisfy certain covenants constitutes an event of default thereunder. Upon the occurrence of an event of default, the lender under our Revolving Credit Facility could elect to declare any future amounts outstanding under our Revolving Credit Facility to be immediately due and payable, exercise the remedies of a secured party in respect of the secured interest on substantially all of our assets and terminate all commitments to extend further credit under that facility. If we are unable to repay those amounts, our financial condition could be adversely affected.
We may incur indebtedness, which could adversely affect our business and limit our ability to expand our business or respond to changes, and we may be unable to generate sufficient cash flow to satisfy our debt service obligations.
As of December 31, 20222023 and 2021,2022, we had no outstanding indebtedness under the Revolving Credit Facility. In the first quarter of 2021, we repaid in full the $22.4 million outstanding principal balance on our Revolving Credit Facility. We may incur indebtedness in the future, which may require us to secure such obligations with substantially all of our assets; to comply with various restrictive covenants, including restrictions on our ability to dispose of our assets, merge with or acquire other entities, incur other indebtedness, make investments and engage in transactions with our affiliates; and to meet certain financial covenants. Any substantial indebtedness, and the fact that a substantial portion of our cash flow from operating activities could be needed to make payments on this indebtedness, could restrict our business operations or have other adverse consequences, including the following:
•reducing the availability of our cash flow for our operations, capital expenditures, future business opportunities and other purposes;
•limiting our flexibility in planning for, or reacting to, changes in our business and the industries in which we operate, which could place us at a disadvantage compared to our competitors that may have less debt;
•limiting our ability to borrow additional funds; and
•increasing our vulnerability to general adverse economic and industry conditions.
Our ability to borrow any funds needed to operate and expand our business will depend in part on our ability to generate cash. If our business does not generate sufficient cash flow from operating activities or if future borrowings, under our Revolving Credit Facility or otherwise, are not available to us in amounts sufficient to enable us to fund our liquidity needs, our operating results, financial condition and ability to expand our business may be adversely affected.
Our results of operations, which are reported in U.S. dollars, could be adversely affected if currency exchange rates fluctuate substantially in the future.
We sell to customers globally and have international operations primarily in the United Kingdom, Australia, Singapore and Japan. To the extent we expand our international operations, we will become more exposed to the effects of fluctuations in currency exchange rates. Although the majority of our cash generated from revenue is denominated in U.S. dollars, a small amount is denominated in foreign currencies, and our expenses are generally denominated in the currencies of the jurisdictions in which we conduct our operations. For 2022,2023, 13% of our revenue and 11% of our expenses were denominated in currencies other than U.S. dollars. For 2022,13% of our revenue and 14% of our expenses were denominated in currencies other than U.S. dollars. For 2021, 13% of our revenue and 16% of our expenses were denominated in currencies other than U.S. dollars. For 2020, 11% of our revenue and 20% of our expenses were denominated in currencies other than U.S. dollars. Because we conduct business in currencies other than U.S. dollars but report our results of operations in U.S. dollars, we also face remeasurement exposure to fluctuations in currency exchange rates, which could hinder our ability to predict our future results and earnings and could materially impact our results of operations. We do not currently maintain a program to hedge exposures to non-U.S. dollar currencies.
Our ability to use our net operating loss carryforwards and certain other tax attributes may be limited.
Under legislative changes made in December 2017, U.S. federal net operating losses incurred in 2018 and in future years may be carried forward indefinitely, but the deductibility of such net operating losses is limited. The deductibility of state net operating losses varies by state. As of December 31, 2022,2023, we had $123.5$123.7 million of U.S. federal net operating loss carryforwards available to reduce future taxable income, a portion of which will begin to expire in 20232024 if unused. As a result of the legislative changes in December 2017, $88.2$70.2 million of the federal net operating loss carryovers will carryovercarry over indefinitely and are limited to 80% of taxable income. As of December 31, 2022,2023, we had state net operating loss carryforward of $87.6$91.0 million, which will begin to expire in the year 2025 if unused. It is possible that we will not generate taxable income in time to use these net operating loss carryforwards before their expiration or at all. In addition, the federal and state net operating loss carryforwards and certain tax credits may be subject to significant limitations under Section 382 and Section 383 of the Internal Revenue Code of 1986, as amended, or the Code, respectively, and similar provisions of state law. Under those sections of the Code, if a corporation undergoes an “ownership change,” the corporation’s ability to use its pre-change net operating loss carryforwards and other pre-change attributes, such as research tax credits, to offset its post-change income or tax may be limited. In general, an “ownership change” will occur if there is a cumulative change in our ownership by “5-percent shareholders” that exceeds 50 percentage points over a rolling three-year period. Similar rules may apply under state tax laws. We may experience ownership changes in the future as a result of subsequent shifts in our stock ownership, some of which may be outside of our control. If an ownership change occurs and our ability to use our net operating loss carryforwards and tax credits is materially limited, it would harm our business by effectively increasing our future tax obligations.
We may be subject to liabilities on past sales for taxes, surcharges and fees.
We currently collect and remit applicable sales tax in jurisdictions where we have determined, based on applicable laws and regulations, that sales of our platform are classified as taxable. We do not currently collect and remit other state and local excise, utility user and ad valorem taxes, fees or surcharges that may apply to our customers. We believe that we are not otherwise subject to, or required to collect, any additional taxes, fees or surcharges imposed by state and local jurisdictions because we do not have a sufficient physical presence or “nexus” in the relevant taxing jurisdiction or such taxes, fees, or surcharges do not apply to sales of our platform in the relevant taxing jurisdiction. However, there is uncertainty as to what constitutes sufficient physical presence or nexus for a state or local jurisdiction to levy taxes, fees and surcharges for sales made over the internet, and there is also uncertainty as to whether our characterization of our platform as not taxable in certain jurisdictions will be accepted by state and local taxing authorities. Additionally, we have not historically collected value-added tax, or VAT, or goods and services tax, or GST, on sales of our platform because we make all of our sales through our office in the United States, and we believe, based on information provided to us by our customers, that most of our sales are made to business customers.
Taxing authorities may challenge our position that we do not have sufficient nexus in a taxing jurisdiction or that our platform is not taxable in the jurisdiction and may decide to audit our business and operations with respect to sales, use, telecommunications, VAT, GST and other taxes, which could result in increased tax liabilities for us or our customers, which could harm our business.
The application of indirect taxes (such as sales and use tax, VAT, GST, business tax and gross receipt tax) to businesses that transact online, such as ours, is a complex and evolving area. Following the 2018 U.S. Supreme Court decision in South Dakota v. Wayfair, Inc., states are now free to levy taxes on sales of goods and services based on an “economic nexus,” regardless of whether the seller has a physical presence in the state. As a result, it may be necessary to reevaluate whether our activities give rise to sales, use and other indirect taxes as a result of any nexus in those states in which we are not currently registered to collect and remit taxes. Additionally, we may need to assess our potential tax collection and remittance liabilities based on existing economic nexus laws’ dollar and transaction thresholds. The application of existing, new, or future laws, whether in the U.S. or internationally, could harm our business. There have been, and will continue to be, substantial ongoing costs associated with complying with the various indirect tax requirements in the numerous markets in which we conduct or will conduct business.
We may have exposure to greater than anticipated tax liabilities, which could harm our business.
While to date we have not incurred significant income taxes in operating our business, we are subject to income taxes in the United States and various jurisdictions outside of the United States. Our effective tax rate could fluctuate due to changes in the proportion of our earnings and losses in countries with differing statutory tax rates. Some jurisdictions may seek to impose incremental or new sales, use or other tax collection obligations on us. Our tax expense could also be impacted by changes in non-deductible expenses, changes in excess tax benefits of stock-based compensation, changes in the valuation of, or our ability to use, deferred tax assets and liabilities, the applicability of withholding taxes and effects from acquisitions.
The provision for taxes on our financial statements could also be impacted by changes in accounting principles, changes in U.S. federal, state or international tax laws applicable to corporate multinationals such as the recent legislation enacted in Australia, the United Kingdom and the United States, other fundamental changes in law currently being considered by many countries and changes in taxing jurisdictions’ administrative interpretations, decisions, policies and positions.
We are subject to review and audit by U.S. federal, state, local and foreign tax authorities. Such tax authorities may disagree with tax positions we take, and if any such tax authority were to successfully challenge any such position, our business could be harmed. We may also be subject to additional tax liabilities due to changes in non-income based taxes resulting from changes in federal, state or international tax laws, changes in taxing jurisdictions’ administrative interpretations, decisions, policies and positions, results of tax examinations, settlements or judicial decisions, changes in accounting principles, changes to our business operations, including acquisitions, as well as the evaluation of new information that results in a change to a tax position taken in a prior period.
Risks Related to Ownership of Our Common Stock
Our share repurchase program may not be fully consummated and may not enhance long-term stockholder value, may increase the volatility of our stock prices and, if consummated, would diminish our cash reserves.
Since the fourth quarter of 2021, we have repurchased $41.0 million of our outstanding common stock, and in March 2023 we expanded our previously announced $100.0 million capital return program by an incremental $25.0 million. Under the expanded $125.0 million authorization, we plan to return an aggregate of $50.0 million through a special cash dividend (the “Special Dividend”), which we expect to be payable in the second quarter of 2023. As previously announced, we expect the remaining $75.0 million of capital return to be effected through a combination of an accelerated share repurchase (“ASR”) program and/or open market purchases, to be completed within the next 12 months, with the possibility of an additional special dividend if this $75.0 million threshold is not reached by March 2024 (the “Contingent Dividend”). Accordingly, we expect to engage in share repurchases of our common stock from time to time. Our capital repurchase program does not have an expiration date and does not obligate us to repurchase any specific dollar amount or to acquire any specific number of shares, or to do so in any particular manner. Further, our share repurchases could affect our share trading prices or increase their volatility, and any repurchases will reduce our cash reserves. We are under no legal obligation to repurchase any shares, and if we do not do so or if we commence repurchases and then suspend or terminate them, the trading prices of our stock may decrease and their volatility increase. Even if we complete our capital return program, we may not be successful in our goal of enhancing stockholder value.
The trading price of our common stock may be volatile or may decline steeply and suddenly regardless of our operating performance, and you could lose all or part of your investment.
The trading price of our common stock has been and will likely continue to be volatile and could be subject to fluctuations in response to various factors, some of which are beyond our control. Factors that could cause fluctuations in the trading price of our common stock include the following:
•the COVID-19 pandemic, including recent and any future variants of the virus;
•price and volume fluctuations in the overall stock market from time to time;
•volatility in the trading prices and trading volumes of technology stocks;
•changes in operating performance and stock market valuations of other technology companies generally, or those in our industry in particular;
•sales or purchases of shares of our common stock, or anticipation of such sales, including our repurchases of shares;
•failure of securities analysts to maintain coverage of us, changes in financial estimates by securities analysts who follow our company, or our failure to meet these estimates or the expectations of investors;
•the financial projections we may provide to the public, any changes in those projections, or our failure to meet those projections;
•announcements by us or our competitors of new products, features, or services;
•the public’s reaction to our press releases, other public announcements and filings with the SEC;
•rumors and market speculation involving us or other companies in our industry;
•actual or anticipated changes in our results of operations or fluctuations in our results of operations, including as a result of reduced demand for our solutions;
•actual or anticipated developments in our business, our competitors’ businesses or the competitive landscape generally;
•litigation involving us, our industry, or both, or investigations by regulators into our operations or those of our competitors;
•developments or disputes concerning our intellectual property or other proprietary rights;
•announced or completed acquisitions of businesses, products, services or technologies by us or our competitors;
•new laws or regulations or new interpretations of existing laws or regulations applicable to our business;
•changes in accounting standards, policies, guidelines, interpretations or principles;
•any significant change in our management; and
•general economic conditions, including increased inflation, and slow or negative growth of our markets.
In addition, extreme price and volume fluctuations in the stock markets have affected and continue to affect the stock prices of many companies. Often, their stock prices have fluctuated in ways unrelated or disproportionate to their operating performance. In the past, stockholders have filed securities class action litigation against companies following periods of market volatility. Such securities litigation, if instituted against us, could subject us to substantial costs, divert resources and the attention of management from our business and seriously harm our business.
Substantial future sales of shares of our common stock by existing stockholders, or the perception that those sales may occur, could cause the market price of our common stock to decline.
Sales of a substantial number of shares of our common stock in the public market, or the perception that these sales might occur, could depress the market price of our common stock and could impair our ability to raise capital through the sale of additional equity securities. We are unable to predict the effect that such sales may have on the prevailing market price of our common stock.
Provisions in our organizational documents and certain rules imposed by regulatory authorities may delay or prevent our acquisition by a third party.
Our amended and restated certificate of incorporation, or our Certificate of Incorporation, and our amended and restated bylaws, or our Bylaws, contain several provisions that may make it more difficult or expensive for a third party to acquire control of us without the approval of our board of directors. These provisions, which may delay, prevent or deter a merger, acquisition, tender offer, proxy contest, or other transaction that stockholders may consider favorable, include the following:
•the division of our board of directors into three classes anduntil the election of each class for three-year terms;declassification is completed by 2026;
•advance notice requirements for stockholder proposals and director nominations;
•provisions limiting our stockholders’ ability to call special meetings of stockholders and to take action by written consent;
•restrictions on business combinations with interested stockholders;
•in certain cases, the approval of holders representing at least 66.7% of the total voting power of the shares entitled to vote generally in the election of directors will be required for stockholders to adopt, amend or repeal our Bylaws, or amend or repeal certain provisions of our Certificate of Incorporation, including those relating to who may call special meetings of our stockholders, our stockholders’ ability to act by written consent, our board of directors (including the removal of one or more directors), indemnification of our directors and officers and exculpation of our directors, supermajority voting, amendments to our Bylaws and the exclusive forum for litigating specified matters;
•no cumulative voting;
•the required approval of holders representing at least 66.7% of the total voting power of the shares entitled to vote at an election of the directors to remove directors; and
•the ability of our board of directors to designate the terms of and issue new series of preferred stock without stockholder approval, which could be used, among other things, to institute a rights plan that would have the effect of significantly diluting the stock ownership of a potential hostile acquirer, likely preventing acquisitions that have not been approved by our governing body.
Moreover, because we are incorporated in Delaware and our Certificate of Incorporation does not contain a provision opting out Section 203 of the Delaware General Corporation Law, or Section 203, we are governed by the provisions of Section 203, which prohibit a person, individually or as a group, who owns, or owned in the preceding three years, 15% or more of our outstanding voting stock from merging or combining with us, unless the merger or combination is approved in a prescribed manner.
The terms of our authorized preferred stock selected by our Board at any point could decrease the amount of earnings and assets available for distribution to holders of our common stock or adversely affect the rights and powers, including voting rights, of holders of our common stock without any further vote or action by the stockholders. As a result, the rights of holders of our common stock will be subject to, and may be adversely affected by, the rights of the holders of any preferred stock that may be issued by us in the future, which could have the effect of decreasing the market price of our common stock.
Any provision of our Certificate of Incorporation or Bylaws or Delaware corporate law that has the effect of delaying or deterring a change in control could limit opportunities for our stockholders to receive a premium for their shares of common stock, and could also reduce the price that investors are willing to pay for our common stock.
The provision of our Certificate of Incorporation designating the Court of Chancery in the State of Delaware and the federal district courts of the United States as the exclusive forums for certain types of lawsuits may have the effect of discouraging lawsuits against our directors and officers.
Our Certificate of Incorporation provides that, unless we consent in writing to the selection of an alternative forum, the Court of Chancery of the State of Delaware be the sole and exclusive forum for: (1) any derivative action or proceeding brought on behalf of our company, (2) any action asserting a claim of breach of fiduciary duty owed by any director, officer, agent or other employee or stockholder of our company to us or our stockholders, (3) any action asserting a claim arising pursuant to any provision of the Delaware General Corporation Law, or the DGCL, our Certificate of Incorporation or our Bylaws or as to which the DGCL confers jurisdiction on the Court of Chancery of the State of Delaware, or (4) any action asserting a claim governed by the internal affairs doctrine, in each case subject to such Court of Chancery having personal jurisdiction over the indispensable parties named as defendants therein. Our Certificate of Incorporation further provides that, unless we consent in writing to the selection of an alternative forum, the federal district courts of the United States of America shall, to the fullest extent permitted by law, be the sole and exclusive forum for the resolutions of any complaint asserting a cause of action arising under the Securities Act. The exclusive forum clauses described above shall not apply to suits brought to enforce a duty or liability created by the Exchange Act or any other claim for which the federal courts have exclusive jurisdiction. Any person or entity purchasing or otherwise acquiring any interest in shares of our capital stock will be deemed to have notice of, and consented to, the exclusive forum provisions in our Certificate of Incorporation.
Although we believe these provisions benefit us by providing increased consistency in the application of applicable law in the types of lawsuits to which they apply, the provisions may have the effect of discouraging lawsuits against our directors and officers, which may limit a stockholder’s ability to bring a claim in a judicial forum it finds favorable for disputes with us or our directors, officers or employees or cause stockholders to incur additional costs to bring claims in the forums designated in our Certificate of Incorporation. While the Delaware courts have determined that such choice of forum provisions are facially valid, a stockholder may nevertheless seek to bring a claim in a jurisdiction other than those designated in the exclusive forum provision, and the provision may not be enforced by a court in that jurisdiction. In addition, investors cannot waive compliance with the federal securities laws and the rules and regulations thereunder. It is possible that, in connection with any applicable action brought against us, a court could find the choice of forum provisions contained in our Certificate of Incorporation to be inapplicable or unenforceable in such action. If so, we may incur additional costs associated with resolving such action in other jurisdictions, which could adversely affect our business, financial condition or results of operations.
Our common stock market price and trading volume could decline if securities or industry analysts do not publish research or publish inaccurate or unfavorable research about our business or our market, if they adversely change their recommendations regarding our common stock or if our operating results do not meet their expectations or any financial guidance we may provide.
The trading market for our common stock will depend in part on the research and reports that securities or industry analysts publish about us, our business, our competitors and our market. The analysts’ estimates are based upon their own opinions and are often different from our estimates or expectations. If one or more of the analysts who cover us downgrade our common stock or publish inaccurate or unfavorable research about our business, the price of our securities would likely decline. If few securities analysts commence coverage of us, or if one or more of these analysts cease coverage of us or fail to publish reports on us regularly, demand for our securities could decrease, which might cause the price and trading volume of our common stock to decline. In addition, if we do not meet any financial guidance that we may provide to the public or if we do not meet expectations of securities analysts or investors, the trading price of our common stock could decline significantly.
Actions of activist stockholders could impact the pursuit of our business strategies and adversely affect our results of operations, financial condition and/or share price.
We value constructive input from investors and regularly engage in dialogue with our stockholders regarding strategy and performance. Our board of directors and management team are committed to acting in the best interests of all of our stockholders. The actions taken by our board of directors and management in seeking to maintain constructive engagement with certain stockholders, however, may not be successful.
Campaigns by activist stockholders to effect changes at publicly traded companies are sometimes led by investors seeking to increase short-term stockholder value by means of financial restructuring, increased debt, special dividends, share repurchases, sales of assets or other transactions. Campaigns may also be initiated by activist stockholders advocating for particular governance, environmental or social causes. Activist stockholders who disagree with the composition of a publicly traded company’s board of directors, or with its strategy and/or management seek to involve themselves in the governance and strategic direction of a company through various activities that range from private engagement to publicity campaigns, proxy contests, efforts to force transactions not supported by the company’s board of directors, and in some instances, litigation.
We have been, and may in the future be, subject to activities initiated by activist stockholders. InFor example, in March 2023, we entered into athe Cooperation Agreement (the “Cooperation Agreement”) with Indaba Capital Management L.P. (“Indaba”(the “Cooperation Agreement”). Pursuant to the Cooperation Agreement, we agreed to: (i) increase the size of our board or directors from 7 directors to 9 directors (the “Board Expansion”); (ii) appoint Cynthia Paul (the “Non-Indaba Stockholder Designee”) to serve as a class II director onexpanded our board of directors, with a term expiring at our 2023 annual meeting of stockholders (the “2023 Annual Meeting”)appointed two new directors, and Ronald Mitchell (the “Indaba Designee”) to serve as a class I director ondeclassified our board of directors with a term expiring at our 2025 annual meeting of stockholders (collectively, the “New Director Appointments”); and (iii) seek the approval of our stockholders at the 2023 Annual Meeting of an amendment to our amended and restated certificate of incorporation to declassify the structure of our board of directors (the “Board Declassification”).directors. Partly in response to stockholder requests, since the fourth quarter of 2021, we have repurchased $41.0also returned $125 million ofto stockholders through our outstanding common stock, and in March 2023 we expanded our previously announced $100.0 million capital return program, by an incremental $25.0 million. Under the expanded $125.0including a $49.9 million authorization, we plan to return an aggregate of $50.0special dividend in June 2023 (the “Special Dividend”) and $75 million to investors pursuant to the Special Dividend and the remaining $75.0 million of capital return to be effected through the combination of an ASR program and/orin open market purchases, with the possibility of the Contingent Dividend in 2024.stock repurchases.
Responding to proxy contests and other actions by activist stockholders may be costly and time-consuming, divert the attention of our board of directors and employees from the management of our operations and the pursuit of our business strategies, and result in reduced capital resources to pursue those strategies. Accordingly, activist stockholder campaigns could adversely affect our business, results of operations, financial condition or share price.
We will incur increased costs and impose additional demands upon management as a result of complying with the laws and regulations affecting public companies in the United States, which may harm our business, results of operations and financial condition.
As a public company listed in the United States, we have incurred and will continue to incur significant legal, accounting and other expenses. In addition, changing laws, regulations and standards relating to corporate governance and public disclosure, including regulations implemented by the SEC and the NYSE, may increase legal and financial compliance costs and make some activities more time consuming. These laws, regulations and standards are subject to varying interpretations, and as a result, their application in practice may evolve over time as new guidance is provided by regulatory and governing bodies. We intend to invest resources to comply with evolving laws, regulations and standards, and this investment may result in increased general and administrative expenses and a diversion of management’s time and attention from revenue-generating activities to compliance activities. We will also need to continue developing our investor relations function. If, notwithstanding our efforts, we fail to comply with new laws, regulations and standards, regulatory authorities may initiate legal proceedings against us and our business may be harmed.
Failure to comply with these rules might also make it more difficult for us to obtain certain types of insurance, including director and officer liability insurance, and we might be forced to accept reduced policy limits and coverage or incur substantially higher costs to obtain the same or similar coverage. The impact of these events would also make it more difficult for us to attract and retain qualified persons to serve on our board of directors, on committees of our board of directors or as members of senior management.
We are an “emerging growth company,” and we cannot be certain if the reduced disclosure requirements applicable to emerging growth companies will make our common stock less attractive to investors.
We are an “emerging growth company,” as defined in the JOBS Act, and we intend to take advantage of certain exemptions from various reporting requirements that are applicable to public companies that are not “emerging growth companies,” including not being required to comply with the independent auditor attestation requirements of Section 404 of the Sarbanes-Oxley Act, reduced disclosure obligations regarding executive compensation in our periodic reports and proxy statements, being required to provide fewer years of audited financial statements and exemptions from the requirements of holding a non-binding advisory vote on executive compensation and stockholder approval of any golden parachute payments not previously approved. We intend to take advantage of these provisions until we are no longer an “emerging growth company.” We will cease to be an “emerging growth company” upon the earliest to occur of: (i) the last day of the fiscal year in which we have more than $1.235 billion in annual revenue; (ii) the date we qualify as a large accelerated filer, with at least $700 million of equity securities held by non-affiliates; (iii) the issuance, in any three-year period, by us of more than $1.0 billion in non-convertible debt securities; and (iv) December 31, 2026. We may choose to take advantage of some but not all of these reduced reporting burdens. We have taken advantage of certain reduced reporting burdens in this Annual Report on Form 10-K. Accordingly, the information contained herein may be different than the information you receive from other public companies in which you hold stock.
In addition, the JOBS Act also provides that an “emerging growth company” can take advantage of an extended transition period for complying with new or revised accounting standards. We have elected to take advantage of such extended transition period, and, as a result, we will not be subject to the same new or revised accounting standards as other public companies that are not emerging growth companies or that have opted out of using such extended transition period. Our consolidated financial statements may therefore not be comparable to those of companies that comply with new or revised accounting pronouncements as of the effective dates applicable to public companies.
Investors may find our common stock less attractive because we intend to rely on these exemptions, which may result in a less active trading market, increased volatility, or lower market prices for our common stock.
We do not intend to pay regular dividends for the foreseeable future.
We have never declared or paid any cash dividends on our capital stock. While we have announced our plan to return an aggregate of $50.0 million to our stockholders pursuant to the Special Dividend as part of ourOur prior capital return program with the possibility of the Contingent Dividend,is now complete and we domay not expect that ourreturn additional capital to stockholders.
While we had a $125 million capital return program will include anywhich included a special dividend of $49.9 million paid in June 2023, that program is now completed, and we may not return additional capital to stockholders. Our completed capital return program may not prove to be successful in our goal of enhancing stockholder value, and we now have less cash to fund our operations and pursue other dividend. Other than the Special Dividend and possibly the Contingent Dividend, weopportunities. We currently intend to retain any future earnings for use in the operation and expansion of our business, and webusiness. We do not plan to declare or pay cash dividends in the foreseeable future. In addition, our ability to pay dividends is currently restricted by the terms of our Revolving Credit Facility. As a result, stockholders should assume that sales of their common stock after price appreciation is the only way to realize any future gains on their investment.
Item 1B. Unresolved Staff Comments.
Note applicable.
Item 1C. Cybersecurity.
Cybersecurity is an important component of our overall risk management program. Our cybersecurity policies and practices are integrated into our risk management program and are based on recognized frameworks. ON24 is certified under ISO 27001:2013 and 27701:2019, which sets forth a strict framework for managing security and privacy risks, including the necessary internal process and policies to deal with cybersecurity risks and incidents.
Risk Management and Strategy
Our cybersecurity program focuses on the following key areas:
•Governance: Our Chief Information Officer (“CIO”) leads our cybersecurity risk management program, with oversight from our board of directors. Our CIO closely collaborates with Information Security and Legal/Privacy leaders with the support of other members of management and teams comprised of personnel with a broad range of experience in the technology industry.
•Collaboration: We have implemented a comprehensive, cross-functional approach to identifying, preventing and mitigating cybersecurity threats and incidents.
•Technical Safeguards: We deploy technical safeguards that are designed to protect our information systems from cybersecurity threats, including firewalls, intrusion prevention, data leak prevention and detection systems, anti-malware functionality and access controls.
•Incident Response and Recovery Planning: We have established and maintain comprehensive cybersecurity incident response and recovery plans, including legal obligations to report incidents, which we test and evaluate from time to time.
•Third-Party Risk Management: We maintain a comprehensive, risk-based approach to identifying and overseeing cybersecurity risks presented by third parties, including vendors and customers, that could adversely impact our business in the event of a cybersecurity incident affecting third-party systems.
•Education: We provide regular, mandatory training for staff regarding cybersecurity and privacy awareness.
We periodically assess and test our cybersecurity policies and practices. These efforts include tabletop exercises, vulnerability and penetration tests, and other exercises focused on evaluating the effectiveness of our cybersecurity measures and planning. We also engage third parties to assess our cybersecurity measures.
Governance
Our board of directors oversees cybersecurity as part of its risk oversight function. Our board of directors receives regular presentations and reports on cybersecurity risks, prompt and timely information regarding cybersecurity incidents that meet specified thresholds, and updates on such incidents until they have been addressed.
Our CIO and other leaders work collaboratively across our organization to protect our information systems from cybersecurity threats and to promptly respond to incidents in accordance with our incident response plan, including the necessary steps to ensure remediation. Through ongoing communications, these teams monitor the prevention, detection, mitigation and remediation of cybersecurity threats and incidents in real time and report such threats and incidents to our board of directors when appropriate.
Our CIO has over 20 years of professional experience specializing in business transformation, change management, executive leadership, and IT strategy, and has worked with technology security, banking and media companies. Our head of Information Security also brings over 20 years of security, privacy, and compliance experience from public and private sector roles of which he spent the last ten years specifically leading security programs at late-stage SaaS companies.
Item 2. Properties.
Our corporate headquarters areis located in San Francisco, California, where weCalifornia. We currently lease 28,353 square feet of office space pursuant to leases expiring in October 2025, respectively.of which 9,526 square feet is being actively marketed for sublease. We also lease facilities in Charlotte, London and Sydney pursuant to leases expiring in July 2023,2026, July 2025 and April 2027, respectively. We believe our facilities are suitable to meet our current needs.
Item 3. Legal Proceedings.
We, our Chief Executive Officer, our Chief Financial Officer, certain current and former members of our board of directors, and the underwriters that participated in our initial public offering (IPO)(“IPO”) are named as defendants in a consolidated putative class action, captioned In re ON24, Inc. Securities Litigation, 4:21-cv-08578-YGR (filed in November 2021), that is currently pending in the United States District Court for the Northern District of California. The consolidated complaint purports to assert claims under Sections 11 and 15 of the Securities Act of 1933 on behalf of all persons and entities that purchased, or otherwise acquired, our common stock issued in connection with our IPO. The complaint alleges that our registration statement and prospectus contained untrue statements of material fact and/or omitted material facts about ON24’s growth and customer base. The plaintiff seeks, among other things, an award of damages and attorneys’ fees and costs. DefendantsThe defendants filed a motion to dismiss the complaint in May 2022, which is currently pending.the court granted with leave to amend in July 2023. Plaintiff filed its amended complaint in September 2023, and the defendants filed a motion to dismiss the amended complaint in October 2023. In March 2024, the court granted the defendants’ motion to dismiss with prejudice. We believe that the allegations in the consolidatedamended complaint are without merit.
In June 2022, a shareholder derivative complaint, captioned Banks v. Sharan, et al., Case No. 3:22-cv-03861, was filed by a purported shareholder in the United States District Court for the Northern District of California. The complaint names as defendants our Chief Executive Officer, our Chief Financial Officer, and certain current and former members of our board of directors, and names ON24 as a nominal defendant. The complaint purports to assert claims on ON24’s behalf against the individual defendants for breach of fiduciary duty and alleged violations of Sections 10(b) and 21D of the Securities Exchange Act of 1934. The complaint is based on allegations that are substantially similar to those in the putative class action filed in the United States District Court for the Northern District of California, described above. The complaint seeks, among other things, an award of damages on behalf of ON24, corporate governance reforms, and attorneys’ fees and costs. In September 2022, the plaintiff voluntarily dismissed the complaint without prejudice.
From time to time, we may become involved in legal proceedings or be subject to claims arising in the ordinary course of our business. Except as set forth in the prior paragraph, we are not presently a party to any legal proceedings that we believe, if determined adversely to us, would have a material adverse effect on our business, financial condition, operating results, or cash flows. Regardless of the outcome, litigation can have an adverse impact on us because of defense and settlement costs, diversion of management resources, and other factors.
Item 4. Mine Safety Disclosures.
Not applicable.
PART II
Item 5. Market for Registrant’s Common Equity, Related Stockholder Matters and Issuer Purchases of Equity Securities.
Market Price of Common Stock
Our common stock trades on the New York Stock Exchange under the symbol “ONTF” since February 3, 2021. Prior to that date, there was no public trading market for our common stock.
Holders of Record
As of March 3, 2023,5, 2024, we had 113107 holders of record of our common stock. The actual number of stockholders is greater than this number of record holders, and includes stockholders who are beneficial owners, but whose shares are held in street name by brokers and other nominees. This number of holders of record also does not include stockholders whose shares may be held in trust by other entities.
Stock Performance Graph
The following graph compares the cumulative total stockholder return on our common stock since February 3, 2021, the date our common stock first began trading on the New York Stock Exchange, to two indices: the NASDAQ Computer Index and the Russell 2000 Index. The graph assumes $100 was invested on February 3, 2021 in our common stock and each index and all dividends were reinvested. The historic stock price performance is not necessarily indicative of future stock price performance.
This graph shall not be deemed “soliciting material” or be deemed “filed” for purposes of Section 18 of the Exchange Act, or otherwise subject to the liabilities under that Section, and shall not be deemed to be incorporated by reference into any of our filings under the Securities Act.
Dividend Policy
We have never declared orWhile in 2023 we paid any cash dividends on our capital stock. While we have announced our plan to return an aggregate of $50.0 million to our stockholders pursuant to the Special Dividend as part of our capital return program, with the possibility of the Contingent Dividend, we do not expect that our capital return program will include any other dividend. Other than the Special Dividendhas concluded in February 2024 and possibly the Contingent Dividend, we currently intend to retain any future earnings for use in the operation and expansion of our business, and webusiness. We do not plan to declare or pay cash dividends in the foreseeable future. Any further determination to pay dividends on our capital stock will be at the discretion of our board of directors, subject to applicable laws, and will depend on our financial condition, results of operations, capital requirements, general business conditions, and other factors that our board of directors considers relevant. In addition, our ability to pay dividends is currently restricted by the terms of our revolving credit facility.
Unregistered Sales of Equity Securities
None.
Purchases of Equity Securities by the Issuer and Affiliated Purchasers
On December 1, 2021, our board of directors authorized a $50.0 million share repurchase program. This share repurchase program has been replaced by a new $125.0 million capital return program that was authorized by our board of directors in March 2023, $75.0 million of which we expect to be effected through the combination of an ASR program and/or open market purchases.
The following table sets forth certain information regardingsummarizes the repurchases of our share repurchases duringshares of common stock in the three months ended December 31, 2022:fourth quarter of 2023.
| | | | | | | | | | | | | | | | | | | | | | | | | | |
| Period | | Total number of
shares
purchased | | Average price paid per share(1) | | Total number of
shares purchased
as part of publicly
announced plans or
program | | Maximum number (or approximate dollar value) of shares that may yet be purchased under the plans or programs
(in millions) |
| October 1, 2022 to October 21, 2022 | | — | | | $ | — | | | — | | | $ | 21.0 | |
| November 1, 2022 to November 30, 2022 | | 248.929 | | $ | 7.74 | | | 248.929 | | 19.1 | |
| December 1, 2022 to December 31, 2022 | | 680.223 | | $ | 7.93 | | | 680.223 | | 13.7 | |
| | 929.152 | | | | 929.152 | | |
| | | | | | | | |
| | | | | | | | | | | | | | | | | | | | | | | | | | |
| Period | | Total
number
of
shares
purchased | | Average price paid per shares(1) | | Total number of shares purchased
as part of publicly
announced plans or program | | Maximum number (or approximate dollar value) of shares that may yet be purchased under the plans or programs (in millions)(2) |
| October 1, 2023 to October 31, 2023 | | 1,234,909 | | | $ | 6.33 | | | 1,234,909 | | | $ | 12.8 | |
| November 1, 2023 to November 30, 2023 | | 452,208 | | | $ | 7.10 | | | 452,208 | | | $ | 9.6 | |
| December 1, 2023 to December 31, 2023 | | 558,381 | | | $ | 7.70 | | | 558,381 | | | $ | 5.3 | |
| Total | | 2,245,498 | | | $ | 6.83 | | | 2,245,498 | | | $ | 5.3 | |
(1)Includes commission of $0.02 per share paid to broker.
(2)In March 2023, our board of directors authorized a $125 million capital return program, $75 million of which was to be effected through stock repurchases. This capital return program replaced the prior share repurchase program, and it was completed in February 2024.
Use of Proceeds from our Initial Public Offering of Common Stock
OnIn February 5, 2021, we sold 7,599,928 shares of our common stock in connection withreceived net proceeds from our IPO including 1,284,139 shares sold pursuant toof $347.8 million, after deducting the underwriters’ full exercise of their right to purchase additional shares, at a publicunderwriting discount and estimated offering price of $50.00 per share for an aggregate offering price of $378.0 million. The selling stockholders sold 2,245,141 shares of our common stock at a public offering price of $50.00 per share for an aggregate offering price of $112.3 million.expenses. The offer and sale of the shares in our IPO were registered under the Securities Act pursuant to a registration statement on Form S-1 (File No. 333-251967), which was declared effective by the SEC on February 2, 2021.We received net proceeds from2021. Other than the IPOuse of approximately $347.8$125 million after deducting the underwriting discount of $26.6for our capital return program (which includes $119.7 million used through December 31, 2023 and other estimated offering expenses of $5.6 million. Goldman Sachs & Co. LLC, J.P. Morgan Securities LLC and KeyBanc Capital Markets Inc.$5.3 million used in 2024), acted as lead book-running managers for the offering. None of the expenses associated with the IPO were paid to directors, officers, persons owning 10% or more of any class of equity securities, or to their associates, or to our affiliates, except that we paid $9.8 million of the underwriting discount to Goldman Sachs & Co. LLC, of which an employee serves on our board of directors and which owns 10% or more of our common stock.
Therethere has been no material change in the planned use of proceeds from the IPO from that described in the prospectus filed with the SEC pursuant to Rule 424(b)(4) under the Securities Act on February 4, 2021.IPO prospectus.
Item 6. Reserved
Not applicable.
Item 7. Management’s Discussion and Analysis of Financial Condition and Results of Operations.
You should read the following discussion and analysis of our financial condition and results of operations together with the consolidated financial statements and related notes included elsewhere in this Report. This discussion contains forward-looking statements based upon current expectations that involve risks and uncertainties. Our actual results may differ materially from those anticipated in these forward-looking statements as a result of various factors, including those discussed in the section titled “Risk Factors” and in other parts of this Report.
This section generally discusses 20222023 and 20212022 items and year-to-year comparisons. Similar discussion for 20202021 items and year-to-year comparisons may be found in the "Management's Discussion and Analysis of Financial Condition and Results of Operations" section of our 10-K for the year ended December 31, 2021,2022, filed with the SEC on March 14, 2022.15, 2023.
Overview
We provide a leading, cloud-based intelligent engagement platform for digital engagement that deliverscombines best-in-class experiences with personalization and content, to enable sales and marketing organizations to capture and act on connected insights for revenue growth through interactive webinar experiences, virtual event experiences and multimedia content experiences.at scale. Our platform’s portfolio of interactive personalized and content-richhyper-personalized digital experience products createscreate and capturescapture actionable, real-time data at scale from millions of professionals every month to provide businesses with buying signals and behavioral insights to efficiently convert prospects into customers.
Similar to what has taken place in the business-to-consumer, or B2C, market, our platform for digital engagement empowers business-to-business, or B2B, companies with insights to better personalize their engagement. Large social media platforms have been successful at leveraging experiences and insights of consumers on their platforms to enable B2C companies to effectively understand their potential consumers. While these have been effective in the B2C market, B2B companies often lack deep insights about prospective customers to effectively understand and engage them.
Businesses today primarily use automatedtraditional sales and marketing solutions, such as digital advertising and email, for marketing. While these automatedtraditional solutions reach large numbers of prospective customers, they have generally failed to deepen customer engagement because they were designed with the simple purpose of pushing marketing messages in one direction—direction — from the business to the prospective customer. For most businesses to succeed, we believe their sales and marketing strategies must evolve fromhave digital engagement powered by the era of automation to the era of engagement.latest technology. Our platform provides an innovative way both to scale digital marketing and deepen prospective customer engagement. We believe our opportunity to help businesses convert digital engagement into revenue will continue to grow as industries modernize their sales and marketing processes.
We sell subscriptions to our platform’s experience products that are backed by analytics and our ecosystem of third-party integrations. Before 2013, we offered services and licensed software for managing webinars and virtual events primarily on a per event basis. In 2013, we transitioned to be a software-as-a-service company with the release of ON24 Elite as our self-service cloud-based subscription product. ON24 Virtual Conference, which we are now de-emphasizing,have de-emphasized, was also launched as a managed-service cloud-based subscription product. Substantially all of our customers subscribe to ON24 Elite, which is our Core Platform’s flagship product, and enables customers to seamlessly broadcast video-based content and drive real-time interactivity in a single immersive experience. We have since added 5six other experience products to our Core Platform.
In 2018, we launched two complementary experience products, ON24 Engagement Hub and ON24 Target, to provide our customers with a system for digital engagement, offering customers the ability to curate and disseminate rich, multimedia content experiences. In addition to our products, we also provide professional services such as experience management, monitoring and premium support services, which provide the opportunity for recurring revenue, as well as implementation and other services.
In 2021, we launched ON24 Breakouts, which expanded the functionality and interactivity of webinars built with ON24 Elite. For example, breakouts enable attendees and presenters to network with each other face-to-face, sales teams to
connect immediately with prospects and subject matter experts to offer two-way communication to support customer education and training.
In 2021, we also launched ON24 Go Live, which provides a new self-service virtual event solution for companies to stand up live-streaming video events faster and easier. Organizations can build a complete end-to-end external or internal event ranging from roadshows, customer conferences, virtual pop-ups, town halls, and company meetings, using pre-built templates and an easy-to-use and engaging interface.
In 2022, we launched ON24 Forums that joins our portfolio of experience products and unifies engagement and data. ON24 Forums provides a new way to moderate interactive discussions and drive immediate action with audiences. For example, it enables audiences to participate in face-to-face, two-way video discussions.
In April 2022, we acquired Vibbio AS (Vibbio)(“Vibbio”), a video software company in Norway. The integration of Vibbio’s video capabilities across the ON24 platform is intended to allow customers to produce video content that creates more engagement, generates first-party data, and drives further personalization.
intelligent analytics to our customers. We deliver our platform products as cloud-based subscriptions that are easy to use and purpose-built for sales and marketing professionals. As of December 31, 2022,2023, we had 1,9901,784 customers.
Prior to developing our current cloud-based subscription model, we generated revenue from our Legacy offering, which primarily consisted of fully managed events and associated services. In connection with shifting to our current data-driven, cloud-based subscription model, we stopped selling our Legacy offering to new customers in 2018 and stopped selling it to all customers in 2020.
Our revenue was $163.7 million for 2023, compared to $190.9 million for 2022 and $203.6 million and $156.9 million for 2022, 2021, and 2020, respectively, representing a period-over-period decrease of 6%14% and a period-over-period increase of 30%6%, respectively. We had a net loss of $51.8 million, $58.2 million and $24.3 million for 2023, 2022 and 2021, respectively, and a net income of $20.8 million for 2020.
Recent Developments
In March 2023, our board of directors approved the expansion of our previously announced $100.0 million capital return program by an incremental $25.0 million. Under the expanded $125.0 million authorization, we plan to return an aggregate of $50.0 million to stockholders pursuant to the Special Dividend, which we expect to be payable in the second quarter of 2023. As previously announced, we expect the remaining $75.0 million of capital return to be effected through a combination of an ASR program and/or open market purchases with the possibility of the Contingent Dividend. In March 2023, we also entered into the Cooperation Agreement pursuant to which we agreed to pursue the Board Expansion, Director Appointments and Board Declassification.
COVID-19 Update
With the continued spread of COVID-19, any future variants that may be more transmissible and have more severe symptoms than current variants may extend the impact of COVID-19 on our business. The impact of these variants cannot be predicted at this time and could depend on numerous factors, including vaccination rates among the population, the effectiveness of COVID-19 vaccines against emerging variants, and any new measures that may be introduced by governments or other parties in response to an increase in COVID-19 cases.
During the COVID-19 pandemic, digital became the primary way for people to connect, work, learn and be entertained, and for businesses to engage with customers. The imperative to optimize digital sales and marketing investments to drive revenue conversion has become increasingly important as businesses have accelerated digital transformation initiatives in response to the COVID-19 pandemic, resulting in increased usage of our subscription and other platforms, especially during the height of the COVID-19 pandemic in 2020 and early 2021.
We may not experience in future periods the same level of accelerated growth we experienced in 2020, and to a lesser extent in 2021. For example, our revenue decreased 6% in 2022 compared to 2021. Our revenue growth rate also declined in 2021 compared to 2020. We may continue to face declines in our revenue in future periods as the impact of COVID-19 continues to lessen, and our customers and their users may increasingly resume in-person marketing activities in a way that decreases usage of our platform. The extent of the impact of COVID-19 on our business and financial performance may be influenced by a number of factors, many of which we cannot control, including the emergence of recent and any future variants of the virus, future spikes of COVID-19 infections resulting in additional preventative and mitigative measures, the severity of the economic decline attributable to or influenced by the COVID-19 pandemic, the timing and nature of a potential economic recovery, the impact on our customers and our sales cycles, and our ability to generate new business leads. For additional details, see the section titled “Risk Factors.”respectively.
Key Factors Affecting Our Performance
Cost Management
We executedinitiated a number of cost control measures in the latter part of 2022 to reduce our cost structure and lower our net loss, including voluntary and involuntary global headcount reductions as well as reductions in spending with various vendors. We have continuedpursued additional reductions in our workforce in 2023 to further reduce our global full-time employee workforce through voluntarycost structure and involuntary headcount reductionsmay continue to do so in 2023.2024.
Acquiring New Customers
We are focused on growing the number of customers that use our platform. We define a customer as a unique organization, including its subsidiaries and affiliates, that has entered into an agreement for paid access to our platform. A single customer may have multiple agreements with us for separate divisions, subsidiaries or affiliates. Our operating results and growth prospects will depend in part on our ability to attract new customers. While we believe we have a significant market opportunity that our platform addresses, it is difficult to predict customer adoption rates or the future growth rate and size of the market for our platform. We will need to continue to invest in our sales and marketing functions over time in order to address this opportunity by hiring, developing and retaining talented sales personnel who are able to
achieve desired productivity levels in a reasonable period of time while we actively manage costs given the current macro-economic environment.
We believe our market is still relatively underpenetrated and, as a result, we see significant opportunity to market our solutions globally. We intend to pursue new customers through specialized and aligned sales teams focused on Enterprise customers, which includes companies with more than 2,000 employees, and Commercial customers, which includes companies with less than 2,000 employees, which we further divide into Mid-Market companies with 200-1,999 employees, and small and midsize, or SMB, companies with 1-199 employees.
Retention and Expansion of ON24 Across Existing Customers
We believe we can achieve significant growth in our business by retaining and further penetrating our existing customer base with the addition of new users and new products, and through upsell and cross sell. Our multi-dimensional land and expand model drives onboarding and allows us to acquire customers via free trials, live demos and continuous engagement with an efficient sales and marketing investment. As we continue to drive more actionable revenue generating marketing insights, we believe that we have a significant opportunity to further increase sales among existing customers across different functional and geographic departments within each respective organization. Our ability to pursue this opportunity will require us to retain our customers, scale our sales and marketing organization and otherwise increase our operating expenses, and we may not be successful on the timetable we anticipate, or at all, for any number of reasons, which may cause our results to vary from period to period.
Innovation and Expansion of Our Platform
We plan to continually develop new products that enhance the functionality of our platform, improve our user experiences and drive customer engagement in order to further capitalize on new opportunities.opportunities, which includes building AI-powered capabilities into our product offerings. For example, our new AI-powered ACE became available across our platform starting in January 2024. We intend to sell these new solutions to both existing and new customers, to drivewith the goal of driving an increase in revenue as the breadth and depth of our solutions and use cases expands. We also intend to continue investing in our platform and related infrastructure over time to improve capacity, security and scalability. These development efforts will require significant investments, some of which may be episodic or otherwise cause our expenses to vary from period to period.
International Expansion
We believe the expansion of real-time, revenue-generating marketing intelligence in international markets is a significant opportunity. For 2022, 2021 and 2020,2023, approximately 24%, 26% and 24%23% of our revenue came from outside the United States, respectively.compared to 24% in 2022 and 26% in 2021. We believe there is a compelling opportunity to continue to elevate expansion opportunities for our solutions internationally, both in countries where we currently operate and countries where we do not yet sell subscriptions to our solutions. Expanding our international operations will require considerable management attention and other resources and may present challenges associated with complying with local expectations, customs, laws and regulations, and geopolitical disputes (including the Ukraine-Russia war)war and Gaza-Israel conflict), which may impact our ability to sell subscriptions to our solutions and otherwise cause our results to vary from period to period.
Key Business Metrics
We review the following key business metrics to measure our performance, identify trends, formulate financial projections and make strategic decisions. Our methods for calculating these metrics may differ from similarly titled metrics at other companies, which may hinder comparability with other companies. The following table sets forth our number of customers, our annual recurring revenue (ARR)(“ARR”), our dollar-based net retention rate (NRR)(“NRR”) and our customers contributing at least $100,000 in ARR ($(“$100k Customers)Customers”) as of the dates indicated:indicated (dollars in thousands):
| | | |
| | | | December 31, 2022 | | December 31, 2021 | | December 31, 2020 | |
| Customers | Customers | 1,990 | | 2,122 | | 1,994 | |
ARR(1) (in thousands) | $ | 159,570 | | $ | 171,384 | | $ | 153,362 | |
| Customers | |
| Customers | |
| ARR | |
| ARR | |
| ARR | |
ARR - Core Platform(1) | |
ARR - Core Platform(1) | |
ARR - Core Platform(1) | |
NRR(2) | NRR(2) | 87 | % | | 97 | % | | 149 | % | |
NRR(2) | |
NRR(2) | |
NRR - Core Platform(1) | |
NRR - Core Platform(1) | |
NRR - Core Platform(1) | |
| $100k Customers | $100k Customers | 345 | | 366 | | 302 | |
| $100k Customers | |
| $100k Customers | |
(1)ARR for Core Platform excluding Virtual Conference product as of December 31, 2022, 2021 and 2020 was $152,554, $157,648 and $137,833, respectively.
(2)NRR for Core Platform excludingexclude Virtual Conference product as of December 31, 2022, 2021 and 2020 was 90%, 99% and 140%, respectively.product.
Number of Customers
Increasing awareness of our platform and its broad range of capabilities has enabled us to substantially expand our customer base over the years. We define a customer as a unique organization, including its subsidiaries and affiliates, that has entered into an agreement for paid access to our platform. We serve customers of all sizes, ranging from small businesses to global Fortune 100 organizations across a diverse set of industries, including technology, financial services, healthcare, industrial and manufacturing, professional services and B2B information services companies. OurWe had a diverse customer base has grown from 760of 1,784 customers as of December 31, 2015 to 1,990 customers as of December 31, 2022. Our2023. We have seen a decrease in our customer count in recent quarters, and our net customers decreased by 132206 in 20222023 compared to 20212022, primarily due to customer churn and fewer new customer acquisitions and increased customer churn,customers acquired during the majority of which was in our SMB and Commercial customer base.period. While we believe the change in our net customer numbers reflectreflects the uncertainty ofcurrent budget pressures in marketing departments in some organizations, regarding their own digital marketing strategies, our platform is designed with a long-term view toward our customer relationships and to grow with customers as their needs expand.
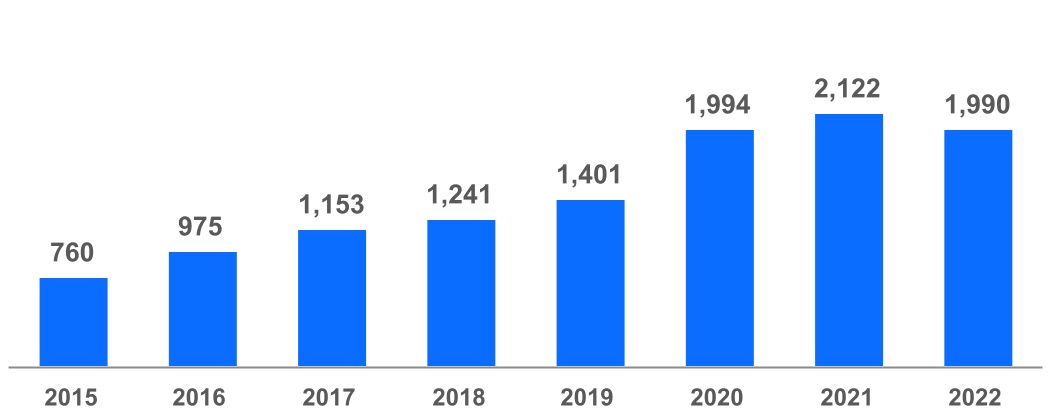
Annual Recurring Revenue
We believe that ARR is a key metric to measure our business because it is driven by our ability to acquire new subscription customers and to maintain and expand our relationship with existing subscription customers. ARR is calculated as the sum of the annualized value of our subscription contracts as of the measurement date, including existing customers with expired contracts that we expect to be renewed. Our ARR amounts exclude professional services, overages from subscription customers and Legacy revenue. As of December 31, 2023, 2022 2021 and 2020,2021, our ARR was $139.7 million, $159.6 million $171.4 million and $153.4$171.4 million, respectively, and our ARR for Core Platform, which excludes Virtual Conference product, was $136.2 million, $152.6 million $157.6 million and $137.8$157.6 million, respectively. The decrease in ARR infrom
December 31, 2022 compared to 2021 was primarily due to rationalizing contractual entitlements, customer churn and downsell from existing customers, partiallydecreased demand for our Virtual Conference product, offset in part by new customer contracts and contract expansions fromwithin existing customers during the period. Our ARR also reflects a decrease in demand for our virtual conference product, primarily due to the return of large-scale, in-person events. A portion of our ARR is denominated in foreign currencies, and the strengthening US dollar also impacted our ARR in the year ended December 31, 2022.customers.
Dollar-Based Net Retention Rate
We believe NRR is an important metric that provides insight into the long-term value of our subscription agreements and our ability to retain and organically grow revenue from our customers. Our NRR as of a specified period end is calculated by dividing current period ARR by prior period ARR. Prior period ARR is the ARR for all engagement platform customers as of twelve months prior to such period end. Current period ARR is the ARR for the same customers as of the specified period end. Our NRR includes the effect of any customer renewals, expansion, contraction and churn but excludes ARR from customers that were acquired in the twelve months prior to the specified period end. Our NRR is subject to adjustment for mergers, acquisitions, dispositions and similar transactions involving our customers. Our NRR was 87%82%, 97%87% and 149%97% as of December 31, 2023, 2022 2021 and 2020,2021, respectively, and our NRR for Core Platform was 90%84%, 99%90% and 140%99%, respectively. The decrease in NRR from 20222023 to 20212022 was primarily driven by elevated churn from existing customers rationalizing their expansions to align to their post-pandemic needs as well as lower expansion opportunities from existing customers given the impact of the macro-economic environment during 2022.2023.
Customers Contributing $100,000 or More to ARR
As of December 31, 2023, 2022 2021 and 2020,2021, we had 325, 345 366 and 302366 $100k Customers, respectively, demonstrating our penetration of larger organizations. The decrease in ARR contribution from theour $100k customers fromsince 2021 to 2022 washas primarily been driven by lesslower value contract renewals and fewer new customer acquisitions in 2022 as well as lower value contract renewals as some customers adjusted to the macro-economic environment.period.
Components of Results of Operations
Revenue
Subscription and Other Platform Revenue
Subscription and other platform revenue primarily consists of subscription fees from customer agreements to access our platform for digital engagement. Our customers do not have the ability to take possession of our software. We recognize subscription revenue on a straight-line basis over the term of the contract beginning on the date access to our platform is granted. Subscription and other platform revenue also includes usage fees from customers who acquire incremental capacity during their contract term. We recognize usage fees on a straight-line basis over the remaining term of the subscription contract, beginning when usage occurs. We expect our subscription revenue to fluctuate from period to period, depending on our ability to attract new customers, retain our existing customers, and increase usage of our platform and products by our existing customers.
Subscription and other platform revenue prior to 2022 contained revenue from our Legacy offering, which consisted of contracts with customers for which we grant customers access to our platform only for the duration of specific contracted events. Our Legacy revenue is primarily recognized at a point in time as events occur. We stopped selling our Legacy offering to new customers in 2018, and substantially all subscription and other platform revenue associated with our Legacy offering ceased after December 2020.
Professional Services Revenue
Professional services revenue primarily consists of fees from customer agreements to provide consulting, support for product and platform adoption as well as support for experience management, monitoring and production. The majority of our professional services consists of experience management and monitoring services, which are prepaid rights to a defined number of managed and monitored experiences. Professional services are generally considered distinct from the access provided to our platform. Professional services are available through hourly rate and fixed fee contracts, as well as one-time and ongoing engagements. We recognize revenue from experience management, monitoring and production services in the period the experience occurs and the services are delivered or, if they are not used by the customer, at the end of the subscription term. We recognize revenue from implementation services upon completion of the services. We recognize revenue from premium support offerings on a ratable basis over the subscription term. We expect our professional services revenue to fluctuate in the future based on customer needs. While more of our customers have elected to be “self-service” and not purchase our professional services, the needs of our customer base have grown more complex which may require more expert services. This fluctuation may also include seasonality, with increased customer utilization of our platform in the fourth quarter and decreased utilization in the first quarter, reflecting the timing of our customers’ marketing initiatives and their internal budget cycles.
Professional services revenue prior to 2022 also contained revenue from our Legacy offering, which consists of event-related services, and is recognized when the event occurs. We stopped selling our Legacy offering to new customers in 2018 and substantially all professional services revenue associated with our Legacy offering ceased after December 2020.
Cost of Revenue
Subscription and Other Platform Cost of Revenue
Subscription and other platform cost of revenue primarily consists of costs related to hosting our platform and providing operating support services to our customers. These costs are related to our co-located data centers, personnel-related costs such as salaries, bonuses, stock-based compensation expense, benefits costs associated with our operations and support personnel, software license fees and allocated overhead. We expect our subscription and other platform cost of revenue to fluctuate based on the changes in subscription revenue.
Subscription and other platform cost
Professional Services Cost of Revenue
Professional services cost of revenue consists primarily of personnel-related costs, including salaries and bonuses, stock-based compensation, third-party consulting services and allocated overhead. We expect our professional services cost of revenue to fluctuate based on customer needs.
Professional services cost of revenue also includes Legacy cost of revenue. We stopped selling our Legacy offering to new customers in 2018 and substantially all of the Legacy component of professional services cost of revenue ceased after December 2020.
Operating Expenses
Sales and Marketing
Sales and marketing expenses primarily consist of personnel-related expenses, including stock-based compensation directly associated with our sales and marketing organization. Other sales and marketing expenses include promotional events to promote our brand, such as awareness programs, digital programs, tradeshowstrade shows and our annual user conference, software license expenses and allocated overhead. Sales commissions that are directly related to acquiring customer contracts, as well as associated payroll taxes, are deferred upon execution of a contract with a customer, and subsequently amortized to sales and marketing expense. Sales commissions paid upon the initial acquisition of a customer contract are amortized over an estimated period of benefit of five years, as we specifically anticipate renewals of the customer contracts and commissions paid on renewal contracts are not commensurate with commissions paid on new customer contracts. Sales commissions paid upon renewal of customer contracts are amortized over the contractual renewal term. Amortization is recognized on a straight-line basis commensurate with the pattern of revenue recognition. Sales commissions paid related to professional services are amortized over the expected service period. We believe it is important to continue investing in sales and marketing to continue to generate revenue growth. Accordingly, we expect sales and marketing expenses to increase in absolute dollars over the long term but may decrease in the near term due to active cost management. We expect such expenses will fluctuate as a percentage of revenue in the near and long term as we continue to support our growth initiatives.
Research and Development
Research and development expenses primarily consist of personnel-related expenses, including stock-based compensation directly associated with our research and development employees, contractor costs related to third-party development and allocated overhead. Research and development costs are expensed as incurred. We believe continued development of our platform and infrastructure is important for our future growth. We expect our research and development expense to increase in absolute dollars in the long term but may decrease in the near term due to active cost management. We expect such expenses will fluctuate as a percentage of revenue in the near and long term.
General and Administrative
General and administrative expenses primarily consist of personnel-related expenses, including stock-based compensation, salaries and benefits for our personnel in executive, finance, legal and human resources organizations. In addition, these expenses include external legal costs, accounting and other consulting services, bad debt expense and allocated overhead. We expect general and administrative expenses to increase in absolute dollars in the long term but may decreasefluctuate in the near term due to active cost management. We expect such expenses will fluctuate as a percentage of revenue in the near and long term.
Interest Expense
Interest expense consists primarily of interest expense incurred on our capital leases and revolving credit facility.
Other (Income) Expense, Net
Other (income) expense, net consists primarily of currency transaction gains or losses, interest income, amortization and accretion on marketable securities, and miscellaneous non-operational income and expense.
Provision for (Benefit from) Income Taxes
Provision for (benefit from) income taxes consists primarily of income taxes related to foreign and state jurisdictions in which we conduct business.
Results of Operations
We manage and operate as one reportable segment. The discussion below summarizes our results of operations for the periods presented, which we derived from the consolidated financial statements included elsewhere in this Report.
The following tables set forth selected consolidated statements of operations data for each of the periods presented:
| | | | Year Ended December 31, | |
| | | Year Ended December 31, | |
| | | Year Ended December 31, | |
| | | | | 2023 | | | | | | | 2023 | | 2022 | | 2021 |
| | | Year Ended December 31, | |
| | 2022 | | 2021 | | 2020 | |
| | | (in thousands) |
| | | | | (in thousands) | |
| | | | | (in thousands) | |
| | | | | (in thousands) | |
| Revenue: | Revenue: | | | | | | |
| Subscription and other platform | |
| Subscription and other platform | |
| Subscription and other platform | Subscription and other platform | | $ | 171,841 | | | $ | 175,876 | | | $ | 122,630 | | |
| Professional services | Professional services | | 19,031 | | | 27,737 | | | 34,311 | | |
| Total revenue | Total revenue | | 190,872 | | | 203,613 | | | 156,941 | | |
| Cost of revenue: | Cost of revenue: | | | |
Subscription and other platform(1)(3) | | 39,241 | | | 33,400 | | | 20,746 | | |
Professional services (1)(3) | | 13,544 | | | 13,965 | | | 12,589 | | |
Subscription and other platform(1)(4) | |
Subscription and other platform(1)(4) | |
Subscription and other platform(1)(4) | |
Professional services (1)(4) | |
| Total cost of revenue | Total cost of revenue | | 52,785 | | | 47,365 | | | 33,335 | | |
| Gross profit | Gross profit | | 138,087 | | | 156,248 | | | 123,606 | | |
| Operating expenses: | Operating expenses: | | | |
Sales and marketing(1)(3) | | 109,599 | | | 104,063 | | | 60,640 | | |
Research and development(1)(2)(3) | | 44,102 | | | 34,835 | | | 19,275 | | |
General and administrative(1)(3) | | 43,969 | | | 40,940 | | | 21,848 | | |
Sales and marketing(1)(4) | |
Sales and marketing(1)(4) | |
Sales and marketing(1)(4) | |
Research and development(1)(2)(4) | |
General and administrative(1)(3)(4) | |
| Total operating expenses | Total operating expenses | | 197,670 | | | 179,838 | | | 101,763 | | |
| Income (loss) from operations | | (59,583) | | | (23,590) | | | 21,843 | | |
| Loss from operations | |
| Interest expense | Interest expense | | 181 | | | 464 | | | 869 | | |
| Other (income) expense, net | Other (income) expense, net | | (2,514) | | | 487 | | | (76) | | |
| Income (loss) before provision for (benefit from) income taxes | | (57,250) | | | (24,541) | | | 21,050 | | |
| Loss before provision for (benefit from) income taxes | |
| Provision for (benefit from) income taxes | Provision for (benefit from) income taxes | | 958 | | | (285) | | | 297 | | |
| Net income (loss) | | $ | (58,208) | | | $ | (24,256) | | | $ | 20,753 | | |
| Net loss | |
|
(1)Includes stock-based compensation as follows:
| | | | Year Ended December 31, | |
| | | Year Ended December 31, | |
| | | Year Ended December 31, | |
| | | | | 2023 | | | | | | | 2023 | | 2022 | | 2021 |
| | | Year Ended December 31, | |
| | 2022 | | 2021 | | 2020 | |
| | | (in thousands) |
| | | | | (in thousands) | |
| | | | | (in thousands) | |
| | | | | (in thousands) | |
| Cost of revenue | Cost of revenue | | | | | | |
| Subscription and other platform | |
| Subscription and other platform | |
| Subscription and other platform | Subscription and other platform | | $ | 3,375 | | | $ | 1,897 | | | $ | 154 | | |
| Professional services | Professional services | | 676 | | | 382 | | | 37 | | |
| Total cost of revenue | Total cost of revenue | | 4,051 | | | 2,279 | | | 191 | | |
| Sales and marketing | Sales and marketing | | 14,304 | | | 8,806 | | | 1,051 | | |
| Research and development | Research and development | | 7,958 | | | 4,402 | | | 360 | | |
| General and administrative | General and administrative | | 12,230 | | | 10,163 | | | 1,327 | | |
| Total stock-based compensation expense | Total stock-based compensation expense | | $ | 38,543 | | | $ | 25,650 | | | $ | 2,929 | | |
|
(2)IncludesResearch and development expense includes amortization of acquired intangible asset of $558 thousand for 2023, $434 thousand for 2022.2022 and nil for 2021.
(3)General and administrative expense for 2023 includes professional advisory expenses associated with activism defense and related costs of $2,656 thousand.
(3)(4)The results of operations for 2022 include restructuring costs, which primarily represent severance and related expense due to restructuring activities, in 2022,and impairment charges on our headquarters lease, as follows. See Note 17 for additional information.
| | | | | | | | | | | | | |
| | | |
| | | | | Year Ended
December 31, 2022 | | | | |
| | | | | | | | | |
| | | | | (in thousands) | | |
Cost of revenue | | | | | | | | | |
Subscription and other platform | | | | | $ | 363 | | | | | |
Professional services | | | | | 27 | | | | | |
Total cost of revenue | | | | | 390 | | | | | |
Sales and marketing | | | | | 1,146 | | | | | |
Research and development | | | | | 86 | | | | | |
General and administrative | | | | | 37 | | | | | |
Total cost of revenue | | | | | $ | 1,659 | | | | | |
| | | | | | | | | |
| | | | | | | | | | | | | | | | | | | | | | | | | | | | | | | | | | | |
| Year ended December 31, 2023 | | Year ended December 31, 2022 |
| Severance and Related Charges(1) | | Lease Impairment Charges | | Total | | Severance and Related Charges | | Lease Impairment Charges | | Total |
| | | | | | | | | | | |
| (in thousands) |
| Cost of revenue | | | | | | | | | | | |
| Subscription and other platform | $ | 2,215 | | | $ | 108 | | | $ | 2,323 | | | $ | 363 | | | $ | — | | | $ | 363 | |
| Professional services | 149 | | | 119 | | | 268 | | | 27 | | | — | | | 27 | |
| Total cost of revenue | 2,364 | | | 227 | | | 2,591 | | | 390 | | | — | | | 390 | |
| Sales and marketing | 2,246 | | | 256 | | | 2,502 | | | 1,146 | | | — | | | 1,146 | |
| Research and development | 1,397 | | | 569 | | | 1,966 | | | 86 | | | — | | | 86 | |
| General and administrative | 391 | | | 409 | | | 800 | | | 37 | | | — | | | 37 | |
| Total restructuring costs | $ | 6,398 | | | $ | 1,461 | | | $ | 7,859 | | | $ | 1,659 | | | $ | — | | | $ | 1,659 | |
| | | | | | | | | | | |
Comparison of the Year Ended Months Ended December 31, 20222023 and 20212022
Revenue
| | | Year Ended December 31, | |
| Year Ended December 31, | |
| Year Ended December 31, | |
| 2023 | | | 2023 | | As a % of
Total Revenue | | 2022 | | As a % of
Total Revenue | | $ Change | | % Change |
| | Year Ended December 31, |
| 2022 | | As a % of
Total Revenue | | 2021 | | As a % of
Total Revenue | | $ Change | | % Change |
| | (in thousands, except percentages) |
| (in thousands, except percentages) | |
| (in thousands, except percentages) | |
| (in thousands, except percentages) | |
| Subscription and other platform | Subscription and other platform | $ | 171,841 | | | 90% | | $ | 175,876 | | | 86% | | $ | (4,035) | | | (2)% | Subscription and other platform | $ | 149,882 | | | 92% | | 92% | | $ | 171,841 | | | 90% | | 90% | | $ | (21,959) | | | (13)% | | (13)% |
| Professional services | Professional services | 19,031 | | | 10% | | 27,737 | | | 14% | | (8,706) | | | (31)% | Professional services | 13,826 | | | 8% | | 8% | | 19,031 | | | 10% | | 10% | | (5,205) | | | (27)% | | (27)% |
| Total revenue | Total revenue | $ | 190,872 | | | 100% | | $ | 203,613 | | | 100% | | $ | (12,741) | | | (6)% | Total revenue | $ | 163,708 | | | 100% | | 100% | | $ | 190,872 | | | 100% | | 100% | | $ | (27,164) | | | (14)% | | (14)% |
|
| | Year Ended December 31, | | | Year Ended December 31, |
| 2023 | | | 2023 | | As a % of
Total Revenue | | 2022 | | As a % of
Total Revenue | | $ Change | | % Change |
| | Year Ended December 31, |
| 2022 | | As a % of
Total Revenue | | 2021 | | As a % of
Total Revenue | | $ Change | | % Change |
| | (in thousands, except percentages) |
| (in thousands, except percentages) | |
| (in thousands, except percentages) | |
| (in thousands, except percentages) | |
| Core Platform | Core Platform | |
| Subscription and other platform | |
| Subscription and other platform | |
| Subscription and other platform | Subscription and other platform | $ | 160,772 | | | 84% | | $ | 160,482 | | 79% | | $ | 290 | | | —% | $ | 145,223 | | | 89% | | 89% | | $ | 160,772 | | 84% | | $ | (15,549) | | | (10)% | | (10)% |
| Professional services | Professional services | 17,029 | | | 9% | | 23,312 | | 11% | | (6,283) | | (27)% | Professional services | 12,876 | | | 8% | | 8% | | 17,029 | | 9% | | (4,153) | | (24)% |
| Total core platform revenue | Total core platform revenue | 177,801 | | | 93% | | 183,794 | | 90% | | (5,993) | | | (3)% | Total core platform revenue | 158,099 | | | 97% | | 97% | | 177,801 | | 93% | | (19,702) | | | (11)% | | (11)% |
| Virtual Conference | Virtual Conference | | | | | | |
| Subscription and other platform | Subscription and other platform | 11,069 | | | 6% | | 15,394 | | 8% | | (4,325) | | | (28)% |
| Subscription and other platform | |
| Subscription and other platform | | 4,659 | | | 3% | | 11,069 | | 6% | | (6,410) | | | (58)% |
| Professional service | Professional service | 2,002 | | | 1% | | 4,425 | | 2% | | (2,423) | | (55)% | Professional service | 950 | | | —% | | —% | | 2,002 | | 1% | | (1,052) | | (53)% |
| Total virtual conference revenue | Total virtual conference revenue | 13,071 | | | 7% | | 19,819 | | | 10% | | (6,748) | | | (34)% | Total virtual conference revenue | 5,609 | | | 3% | | 3% | | 13,071 | | | 7% | | 7% | | (7,462) | | | (57)% | | (57)% |
| Total revenue | Total revenue | $ | 190,872 | | | 100% | | $ | 203,613 | | | 100% | | $ | (12,741) | | | (6)% | Total revenue | $ | 163,708 | | | 100% | | 100% | | $ | 190,872 | | | 100% | | 100% | | $ | (27,164) | | | (14)% | | (14)% |
|
Total revenue decreased $12.7$27.2 million, or 6%14%, in 20222023 compared 2022. Revenue excluding our Virtual Conference product decreased $19.7 million, or 11%, in 2023 compared to 2021. Revenue excluding virtual conference product decreased $6.0 million, or 3%, compared2022. We continue to 2021. With the gradual return of large-scale, in-person events, we hadsee less demand for our virtual conferenceVirtual Conference product and we have deemphasized this product.
Subscription and other platform revenue decreased $4.0$22.0 million in 2022,2023 compared to 2021.2022. Subscription and other platform revenue excluding virtual conferenceour Virtual Conference product remained consistentdecreased $15.5 million in 2023 compared to 2021.
Professional services revenue decreased $8.7 million in 2022 compared to 2021. Professional services revenue excluding virtual conference product decreased $6.3 million compared to 2021, primarily due to more customers electing to be “self-service” and utilize less services in the current macro-economic environment.2022. The decrease in professional services revenue in 2022 also reflected a higher demand for our implementation and deployment services in 2020 that
continued into the first quarter of 2021. The decline in professional services revenue as a percentage of total revenuedecrease was primarily due to lower net customers and reduced ARR as discussed in the section titled “Key Business Metrics.”
Professional services revenue decreased $5.2 million in 2023 compared to 2022. Professional services revenue excluding our Virtual Conference product decreased $4.2 million in 2023 compared to 2022. The decrease was primarily due to more of our customers electing to be “self-service” and not utilize our professional services offerings.
Cost of Revenue and Gross Margin
| | Year Ended December 31, | | | Year Ended December 31, |
| 2023 | | | 2023 | | As a % of
Total Revenue | | 2022 | | As a % of
Total Revenue | | $ Change | | % Change |
| | Year Ended December 31, |
| 2022 | | As a % of
Total Revenue | | 2021 | | As a % of
Total Revenue | | $ Change | | % Change |
| | (in thousands, except percentages) |
| (in thousands, except percentages) | |
| (in thousands, except percentages) | |
| (in thousands, except percentages) | |
| Subscription and other platform | Subscription and other platform | $ | 39,241 | | 21% | | $ | 33,400 | | 16% | | $ | 5,841 | | | 17% | Subscription and other platform | $ | 34,751 | | 21% | | $ | 39,241 | | 21% | | $ | (4,490) | | | (11)% | | (11)% |
| Professional services | Professional services | 13,544 | | 7% | | 13,965 | | 7% | | (421) | | | (3)% | Professional services | 11,512 | | 7% | | 13,544 | | 7% | | (2,032) | | | (15)% | | (15)% |
| Total cost of revenue | Total cost of revenue | $ | 52,785 | | 28% | | $ | 47,365 | | 23% | | $ | 5,420 | | | 11% | Total cost of revenue | $ | 46,263 | | 28% | | $ | 52,785 | | 28% | | (6,522) | | | (12)% | | (12)% |
| Gross profit | Gross profit | $ | 138,087 | | 72% | | $ | 156,248 | | 77% | | $ | (18,161) | | | (12)% | Gross profit | $ | 117,445 | | 72% | | $ | 138,087 | | 72% | | (20,642) | | | (15)% | | (15)% |
| Gross margin | Gross margin | 72 | % | | 77 | % | |
Cost of Revenue
Cost of revenue for 2022 increased $5.4decreased $6.5 million, or 11%12%, in 2023 compared to 2021. The increase was2022, primarily attributable to the increase in subscription and other platform cost of revenue of $5.8 million, due primarily to an increase in personnel-related expenses of $4.2 million. The increase in personnel-related expense for subscription and other platform cost of revenue was mainly driven by the increased stock-based compensation expense of $1.5 million, increased average headcount to support our platform and higher salaries reflecting the impactresult of inflation on compensation. The increaseour active cost management and headcount reduction related to our restructuring activities that began in costthe second half of revenue2022. We anticipate the restructuring activities to continue in 2022 also reflects an increasethe first quarter of $1.7 million in bandwidth and software cost.2024.
Gross Margin
Gross margin for 2022 was 72%2023 remained flat compared to 77% for 2021. The decrease was primarily attributable to an increase in total cost of revenue, which increased 11%, compared to total revenue, which decreased 6%.2022. While we had made cost reductions across our business in 2022, primarilystarting in the latter partsecond half of 2022, we continued to invest in our cloud infrastructure capabilities to enable future growth ofsupport our newer products.business needs.
We expect gross margin for 2024 to decrease modestly in 2023 due to diseconomies of scale from the recent decline in revenue.be relatively consistent with 2023. We also continuehave continued to increase our utilization of the public cloud for our newer product offerings while we actively manage costs given the current macro-economic environment.
Operating Expenses
Sales and Marketing
| | | | | | | | | | | | | | | | | | | | | | | | | | | | | | | | | | | |
| Year Ended December 31, |
| 2022 | | As a % of
Total Revenue | | 2021 | | As a % of
Total Revenue | | $ Change | | % Change |
| | | | | | | | | | | |
| (in thousands, except percentages) |
| Sales and marketing | $ | 109,599 | | | 57% | | $ | 104,063 | | | 51% | | $ | 5,536 | | | 5% |
| | | | | | | | | | | | | | | | | | | | | | | | | | | | | | | | | | | |
| Year Ended December 31, |
| 2023 | | As a % of
Total Revenue | | 2022 | | As a % of
Total Revenue | | $ Change | | % Change |
| | | | | | | | | | | |
| (in thousands, except percentages) |
| Sales and marketing | $ | 89,200 | | | 54% | | $ | 109,599 | | | 57% | | $ | (20,399) | | | (19)% |
Sales and marketing expense increased $5.5decreased $20.4 million, or 5%19%, in 20222023, compared to 2021.2022. The increasedecrease was primarily attributable to an increasea decrease in personnel-related expenses of $7.5$13.1 million which was driven by an increased stock-based compensation expense of $5.5 million, higher salaries reflecting the impact of inflation on compensation and higher sales commissions, partially offset by a decrease in average headcount in 2022 due to headcount reduction related to our restructuring activities that began in the second half of 2022. The increase in sales and marketing expense also reflects an increaseremainder of $1.0 million of travel and other business expenses as we gradually resume in-person marketing activities. These increases were partially offset by the decrease of $3.1 million in marketing and advertising activities due towas primarily driven by our active cost management given the current macro-economic environment. The increase in sales and marketing expense as a percentage of total revenue was primarily driven by our targeted investments in our go-to-market strategy to drive efficient growth, including sales enablement, partner ecosystem and selective sales hires.
We expect our sales and marketing expense to decrease in absolute dollars in 20232024 as we continue to support demand for our digital experiences and the development of the next generation intelligent engagement platform while tightening our sales and marketing spend given the current macro-economic environment.
Research and Development
| | | | | | | | | | | | | | | | | | | | | | | | | | | | | | | | | | | |
| Year Ended December 31, |
| 2022 | | As a % of
Total Revenue | | 2021 | | As a % of
Total Revenue | | $ Change | | % Change |
| | | | | | | | | | | |
| (in thousands, except percentages) |
| Research and development | $ | 44,102 | | | 23% | | $ | 34,835 | | | 17% | | $ | 9,267 | | | 27% |
| | | | | | | | | | | | | | | | | | | | | | | | | | | | | | | | | | | |
| Year Ended December 31, |
| 2023 | | As a % of
Total Revenue | | 2022 | | As a % of
Total Revenue | | $ Change | | % Change |
| | | | | | | | | | | |
| (in thousands, except percentages) |
| Research and development | $ | 41,122 | | | 25% | | $ | 44,102 | | | 23% | | $ | (2,980) | | | (7)% |
Research and development expense increased $9.3decreased $3.0 million, or 27%7%, in 20222023 compared to 2021.2022. The increasedecrease was primarily attributable to an increaseour active cost management and headcount reduction related to our restructuring activities that began in the second half of $5.5 million2022, offset in personnel-related expenses, which was drivenpart by the increased stock basedstock-based compensation expense of $3.6 million as well as by the increased average headcount to support the development of our solutions and higher salaries reflecting the impact of inflation on compensation. The increase in the research and development expense was also driven by an increase of $2.1 million in facilities and other related expenses and an increase in contractor costs of $1.7$1.2 million. We have been applying a disciplined approach to focus our investments on research and development areas that offer the greatest opportunities, including our investments in generative AI capabilities for our product offering such as ACE, as we expand our platform and bring new products to the market.
We expect our research and development expense to decrease moderately in absolute dollars in 20232024 as we focus on further developing our platform and infrastructure while we actively manage costs given the current macro-economic environment.
General and Administrative
| | | | | | | | | | | | | | | | | | | | | | | | | | | | | | | | | | | |
| Year Ended December 31, |
| 2022 | | As a % of
Total Revenue | | 2021 | | As a % of
Total Revenue | | $ Change | | % Change |
| | | | | | | | | | | |
| (in thousands, except percentages) |
| General and administrative | $ | 43,969 | | | 23% | | $ | 40,940 | | | 20% | | $ | 3,029 | | | 7% |
| | | | | | | | | | | | | | | | | | | | | | | | | | | | | | | | | | | |
| Year Ended December 31, |
| 2023 | | As a % of
Total Revenue | | 2022 | | As a % of
Total Revenue | | $ Change | | % Change |
| | | | | | | | | | | |
| (in thousands, except percentages) |
| General and administrative | $ | 49,124 | | | 30% | | $ | 43,969 | | | 23% | | $ | 5,155 | | | 12% |
General and administrative expense increased $3.0$5.2 million, or 7%12%, in 20222023 compared to 2021. The2022. Excluding the $6.3 million increase was attributable to the increase in personnel-related expenses, which was primarily driven by the increasedof stock-based compensation expense, general and administrative expense decreased $1.1 million compared to 2022. The decrease was primarily attributable to our active cost management and headcount reduction related to our restructuring activities that began in the second half of $2.12022. The decrease in general and administrative expense in 2023 was partially offset by the $2.7 million increased average headcount, and higher salaries reflectingprofessional advisory expenses associated with activism defense we incurred in the impactfirst half of inflation on compensation.2023.
We expect our general and administrative expense to decrease modestly in absolute dollars in 20232024 as we enhance our general and administrative function to continue to support the needs of a public company while we actively manage costs given the current macro-economic environment.
Interest Expense
| | | | | | | | | | | | | | | | | | | | | | | | | | | | | | | | | | | |
| Year Ended December 31, |
| 2022 | | As a % of
Total Revenue | | 2021 | | As a % of
Total Revenue | | $ Change | | % Change |
| | | | | | | | | | | |
| (in thousands, except percentages) |
| Interest expense | $ | 181 | | | —% | | $ | 464 | | | —% | | $ | (283) | | | (61%) |
| | | | | | | | | | | | | | | | | | | | | | | | | | | | | | | | | | | |
| Year Ended December 31, |
| 2023 | | As a % of
Total Revenue | | 2022 | | As a % of
Total Revenue | | $ Change | | % Change |
| | | | | | | | | | | |
| (in thousands, except percentages) |
| Interest expense | $ | 93 | | | —% | | $ | 181 | | | —% | | $ | (88) | | | (49%) |
Interest expense for 2022 decreased $0.3 million2023 remained relatively flat in absolute dollars compared to 2021, primarily driven by the decreased borrowings through finance leases and line of credit. We repaid in full in the first quarter of 2021 the $22.4 million aggregate then outstanding principal balance of our line of credit under the revolving credit facility.2022.
Other (Income) Expense,Income, Net
| | | | | | | | | | | | | | | | | | | | | | | | | | | | | | | | | | | |
| Year Ended December 31, |
| 2022 | | As a % of
Total Revenue | | 2021 | | As a % of
Total Revenue | | $ Change | | % Change |
| | | | | | | | | | | |
| (in thousands, except percentages) |
| Other (income) expense, net | $ | (2,514) | | | (1)% | | $ | 487 | | | —% | | $ | 3,001 | | | 616% |
| | | | | | | | | | | | | | | | | | | | | | | | | | | | | | | | | | | |
| Year Ended December 31, |
| 2023 | | As a % of
Total Revenue | | 2022 | | As a % of
Total Revenue | | $ Change | | % Change |
| | | | | | | | | | | |
| (in thousands, except percentages) |
| Other income, net | $ | (11,303) | | | (7)% | | $ | (2,514) | | | (1)% | | $ | 8,789 | | | 350% |
The change in other (income) expense,income, net for 20222023 compared to 20212022 was primarily driven by the increase in investment income offset by the increase in foreign currency losses.income. See Note 13 for additional information.
Provision for (Benefit from) Income Taxes
| | | | | | | | | | | | | | | | | | | | | | | | | | | | | | | | | | | |
| Year Ended December 31, |
| 2022 | | As a % of
Total Revenue | | 2021 | | As a % of
Total Revenue | | $ Change | | % Change |
| | | | | | | | | | | |
| (in thousands, except percentages) |
| Provision for (benefit from) income taxes | $ | 958 | | | 1% | | $ | (285) | | | —% | | $ | 1,243 | | | 436% |
| | | | | | | | | | | | | | | | | | | | | | | | | | | | | | | | | | | |
| Year Ended December 31, |
| 2023 | | As a % of
Total Revenue | | 2022 | | As a % of
Total Revenue | | $ Change | | % Change |
| | | | | | | | | | | |
| (in thousands, except percentages) |
| Provision for income taxes | $ | 995 | | | 1% | | $ | 958 | | | 1% | | $ | 37 | | | 4% |
The change in provisionProvision for income taxes for 2022remained relatively flat in absolute dollars compared to 2021 was primarily driven by the tax impacts associated with stock-based compensation and which resulted in a benefit from income taxes in 2021.2022.
Liquidity and Capital Resources
As of December 31, 2022,2023, we had cash, cash equivalents and marketable securities of $328.1$198.7 million. Our investments generally consist of money market mutual funds, certificates of deposit, U.S. Treasury securities, U.S. Agency securities and debt securities, all of which are available for use in our current operations. Our liquidity requirements arise primarily from our working capital needs, capital expenditures and debt service requirements. We have historically funded our liquidity requirements through sales of convertible preferred stock, cash generated from our operations, borrowings and availability under our revolving credit facility, and most recently through our IPO in February 2021.
In December 2021,the first quarter of 2023, our board of directors authorized a $125 million capital return program which replaced the prior share repurchase program. Pursuant to the capital return program allowing us to periodically repurchase up to $50.0in May 2023, our board of directors declared a one-time special cash dividend of $1.09 per share, which was paid in June 2023 in an aggregate amount of $49.9 million (the “Special Dividend”). The remaining $75 million of our common stock over an 18-month period in thecapital return was effected through open market or in privately negotiated transactions. Weshare repurchases. In 2023, we spent $7.2a total of $74.6 million in 2021, $29.1 million in 2022 and $4.7 million in the first quarter of 2023 through February 3 on share repurchases (including commissions). In March 2023, our boardthe first quarter of directors approved2024 we completed the expansionremainder of our previously announced $100.0 million capital return program by an incremental $25.0 million. Underprogram.
We substantially completed our 2022 cost reduction plan during the expanded $125.0 million authorization, we plan to return an aggregate of $50.0 million to stockholders pursuant to the Special Dividend, which we expect to be payable in the secondfirst quarter of 2023. As previously announced, we expect the remaining $75.0 million of capital returnIn an ongoing effort to be effected through a combination of an ASR program and/or open market purchases with the possibility of Contingent Dividend. We expect to complete this program in the next twelve months.
In April 2022, we acquired Vibbio for approximately $3.0 million in cash.
In the third quarter of 2022, we initiated a strategic cost reduction plan that included voluntary and involuntary headcount reductions, andstreamline our organization, we have continuedpursued additional reductions in our workforce and other charges in 2023 to further reduce our global full-time employee workforce through voluntary and involuntary headcount reductions.cost structure. As of December 31, 2022,2023, our full-time headcount decreased by approximately 11%28% from June 30,December 31, 2022. Additionally, we incurred totalaggregate restructuring costsand other charges of $1.7$7.9 million in the third and fourth quarters of 2022,2023, primarily related to severance and one-time termination benefits.benefits and impairment charges on our headquarters lease. See Note 17 to the consolidated financial statements for further information. We incurredexpect to incur additional restructuring costs of $1.0$0.6 million to $0.9 million in the first quarter of 2023 and expect to incur $2.8 million and $3.3 million more by the end of the first quarter of 20232024 related to suchour ongoing cost reduction efforts and may incur additional costs in future periods for restructuring activities.
Our principal uses of cash in recent periods have been to fund our operations, invest in research and development, purchase investments and to a lesser extent fund share repurchases and strategic transactions.
We believe our existing cash, cash equivalents and marketable securities will be sufficient to meet our needs for at least the next 12 months. Our future capital requirements will depend on many factors including our revenue growth rate, subscription renewal activity, billing frequency, the timing and extent of spending to support further sales and marketing and research and development efforts and the timing and extent of additional capital expenditures to invest in existing office spaces. We may in the future enter into arrangements to acquire or invest in complementary businesses, products, services and technologies, and we may need to seek additional equity or debt financing. In the event that additional financing is needed from outside sources, we may not be able to raise the necessary capital or raise the capital on terms
acceptable to us or at all. If we are unable to raise additional capital when desired, our business, results of operations and financial condition could be materially and adversely affected.
The following table summarizes our cash flows for the periods presented (in thousands):
| | Year Ended December 31, |
| 2022 | | 2021 | | 2020 |
| Year Ended December 31, | | | Year Ended December 31, |
| 2023 | | | 2023 | | 2022 | | 2021 |
| Net cash (used in) provided by operating activities | Net cash (used in) provided by operating activities | $ | (20,461) | | | $ | 5,189 | | | $ | 37,542 | |
| Net cash (used in) provided by investing activities | $ | (88,981) | | | $ | (219,190) | | | $ | 970 | |
| Net cash provided by (used in) investing activities | |
| Net cash (used in) provided by financing activities | Net cash (used in) provided by financing activities | $ | (28,618) | | | $ | 320,514 | | | $ | 804 | |
Operating Activities
Our largest source of operating cash is cash collections from our customers for subscriptions to use our platform. Our primary uses of cash from operating activities are from personnel-related expenditures, costs related to hosting our platform and marketing expenses. Our cash flow from operating activities will continue to be influenced principally by the extent to which we increase spending on our business and our working capital requirements.
Net cash (used in) provided byused in operating activities is primarily impacted by our net loss adjusted for certain non-cash items such as stock-based compensation, depreciation and amortization, amortization of deferred contract acquisition costs, amortization (accretion) on marketable securities, as well as the effect of changes in operating assets and liabilities. Our cash flows from operating activities used net cash of $12.2 million in 2023 compared to $20.5 million forin 2022, compared to provided cash of $5.2 million for 2021, resulting in a decrease of cash inflowoutflow of $25.7$8.3 million. The decrease was primarily attributable to the $34.0$6.4 million increasedecrease in net loss and $5.2$2.3 million increase in non-cash expenses, partially reduced by the $0.5 million unfavorable changes in operating assets and liabilities between the periods, partially reduced by an increase in non-cash expenses of $13.5 million.periods. In addition,2023, we made total restructuring related payments of $6.5 million compared to $1.5 million in severance and related costs in 2022 due to restructuring activities.2022. See Note 17 for additional information.
The total non-cash adjustments for 20222023 was $62.4$64.7 million compared to $48.9$62.4 million for 2021. The $13.52022, reflecting a $2.3 million favorable change of non-cash adjustment was primarily driven by an increase in stock-based compensation expense of $12.9 million.adjustment.
Working capital used cash of $25.2 million in 2023 compared to $24.7 million forin 2022, compared to $19.5 million for 2021, an increase of cash outflow of $5.2$0.5 million. TheThis unfavorable change in working capital in the comparative periods werewas impacted by, among other items, the timing of vendor payments and prepayments,prepayment as well as the timing of cash receipts from customers, and increased business activities.customers.
Investing Activities
Net cash used inprovided by investing activities for 20222023 was $89.0$162.3 million compared to $219.2used cash of $89.0 million for 2021.2022. The decreasefavorable change was primarily driven by an increase in proceeds from maturities paydowns and sales of marketable securities of $194.4$226.1 million partially offset by an increaseand a decrease in purchases of marketable securities of $61.6 million and the cash consideration, net of cash acquired, on our Vibbio acquisition of $2.5$21.2 million.
Our most significant capital expenditures have been investments in our equipment to support ongoing operations. We expect our capital investment to continue in the future.
Financing Activities
Net cash used in financing activities for 20222023 was $28.6$124.2 million compared to provided cash of $320.5$28.6 million for 2021.2022. The decreaseincrease in cash inflowoutflow was primarily driven by the $21.9$49.9 million payment of the one-time special dividend in the second quarter of 2023 and $45.4 million of increased spending on our share repurchases in 2022 andduring the proceeds of $349.7 million, net of underwriting discounts and offering costs, we received from our IPO in 2021, offset in part by a decrease in principal repayments of $22.8 million on our borrowings and finance leases.period.
Debt Obligations
Revolving Credit Facility
In September 2021, we amended our revolving credit facility with Comerica Bank with an effective date of August 31, 2021, which increases our borrowing capacity to a maximum of $50.0 million with a letter of credit sublimit of $4.0 million and a credit card sublimit of $1.0 million. The amendment allows us to borrow up to $50.0 million if we maintain at least $100.0 million on deposit with Comerica Bank. If such deposit is less than $100.0 million, we may borrow up to the lesser of $50.0 million or an amount determined by our trailing five months of recurring revenue, annualized renewal rate and annualized monthly churn rate. The terms of the agreement permit voluntary prepayment without premium or penalty. The revolving credit facility matures in August 2024 and is secured by substantially all of our assets. We are required to pay a quarterly commitment fee of 0.15% per annum on the undrawn portion available under the revolving line of credit. In April 2023, we further amended our revolving line of credit to allow for certain transactions, including payment of dividends and share repurchases from open market purchases or through an accelerated share repurchase program, subject to certain terms and conditions.
Outstanding principal amounts on the revolving credit facility incur interest at a rate equal to Comerica Bank’s prime referenced rate, as defined in the loan agreement. Prior to August 31, 2021, interest on the revolving line of credit was the prime rate, as published by the Wall Street Journal, plus 0.75% effective July 31, 2020. The referenced prime rate was 8.50% as of December 31, 2023 and 7.50% as of December 31, 2022 and 3.25% as of December 31, 2021.2022.
In the first quarter of 2021, we repaid in full the $22.4 million aggregate then outstanding principal balance of our line of credit under the revolving credit facility. As of December 31, 2022,2023, we had not drawn down on our line of credit under the revolving credit facility.
Commitments and Contractual Obligations
The following table summarizes our non-cancelable contractual obligations as of December 31, 20222023 (in thousands):
| | Payments Due By Period |
| Total | | Less than
1 year | | 1-3 years | | 3-5 years | | More than
5 years |
| Payments Due by Period | | | Payments Due by Period |
| Total | | | Total | | 2024 | | 2025 to 2026 | | 2027 to 2028 | | 2029 and Thereafter |
| Operating lease obligations | Operating lease obligations | $ | 8,114 | | | $ | 2,887 | | | $ | 5,091 | | | $ | 136 | | | $ | — | |
| Finance lease obligations | Finance lease obligations | 1,685 | | | 1,605 | | | 80 | | | — | | | — | |
| Equipment loans | Equipment loans | 308 | | | 236 | | | 72 | | | — | | | — | |
Purchase commitments(1) | |
Other (1)(2) | Other (1)(2) | 3,521 | | | 3,189 | | | 332 | | | — | | | — | |
| Total | Total | $ | 13,628 | | | $ | 7,917 | | | $ | 5,575 | | | $ | 136 | | | $ | — | |
|
(1)Amounts primarily represent our commitmentoff-balance sheet commitments under various software license and co-location facilities and services agreements. See Note 10 to consolidated financial statements for additional information.
(2)Amounts represent our recognized commitments under various software license agreements and are included in our accrued liabilities and other long term liabilities on our consolidated balance sheets.
Critical Accounting Policies and Estimates
Critical accounting policies and estimates are those accounting policies and estimates that are both the most important to the portrayal of our net assets and results of operations and require the most difficult, subjective or complex judgments, often as a result of the need to make estimates about the effect of matters that are inherently uncertain. These estimates are developed based on historical experience and various other assumptions that we believe to be reasonable under the circumstances. Critical accounting estimates are accounting estimates where the nature of the estimates is material due to the levels of subjectivity and judgment necessary to account for highly uncertain matters or the susceptibility of such matters to change and the impact of the estimates on financial condition or operating performance is material.
The critical accounting estimates, assumptions and judgments that we believe have the most significant impact on our consolidated financial statements are described below.
Revenue Recognition
We derive our revenue from subscription agreements with customers for access to our platform and related services. We recognize revenue upon the transfer of promised goods or services to customers in an amount that reflects the consideration to which we expect to be entitled in exchange for promised goods or services. We apply the following five-step revenueRevenue recognition model in accountingrequires judgment, especially for our revenue arrangements:
1. Identification of the contract, or contracts with the customer
We determine a contract with a customer to exist when the contract is approved, each party’s rights regarding the services to be transferred can be identified, the payment terms for the services can be identified, the customer has the
ability and intent to pay, and the contract has commercial substance. At contract inception, we will evaluate whether two or more contracts should be combined and accounted for as a single contract and whether the combined or single contract includes more than one performance obligation. We apply judgment in determining the customer’s ability and intent to pay, which is based on a variety of factors, including the customer’s historical payment experience or, in the case of a new customer, credit and financial information pertaining to the customer.
2. Identification of thethat include multiple performance obligations, in the contract
Performance obligations committed in a contract are identified based on the services that will be transferred to the customer that are both capable of being distinct, whereby the customer can benefit from the service either on its own or together with other resources that are readily available from third parties or from us, and are distinct in the context of the contract, whereby the transfer of the services and the products is separately identifiable from other promises in the contract.
Our performance obligations generally consist of access to our digital engagement platform and related support services, which, together, are considered one performance obligation. Our customers do not have the ability to take possession of our software, and through access to our platform we provide a series of distinct software-based services that are satisfied over the term of the subscription. Customers may also purchase incremental capacity to our digital engagement platform. We recognize incremental access as a series of distinct software-based services that are satisfied over the remaining term of the subscription. Our Legacy offering includes performance obligations to provide customers with access to our platform for the duration of specific contracted events, and revenue is recognized primarily as events occur. Amounts related to our digital engagement platform and our Legacy offering are recorded as subscription and other platform revenue in the consolidated statements of operations.
We also provide professional services, which include consulting services,deliverables, such as experience management, monitoring and production services, implementation services and premium support services. Professional services are generally considered distinct from the access to our digital engagement platform. Amounts are recorded as Professional Services revenue in the consolidated statements of operations.
We enter into contracts with customers that regularly include promises to transfer multiple services through access to our platform. platform, and professional services. A performance obligation is a promise in a contract with a customer to transfer products or services that are distinct. Determining whether products and services are distinct performance obligations that should be accounted for separately or combined as one unit of accounting may require judgment.
For arrangementscontracts with multiple platform services, we evaluate whether the individual services qualify as distinct performance obligations. In our assessment of whether a service is a distinct performance obligation, we determine whether the customer can benefit from the service on its own or with other readily available resources and whether the service is separately identifiable from other services in the contract. This evaluation requires us to assess the nature of each individual service offering and how the services are provided in the context of the contract, including whether the services are significantly integrated, highly interrelated or significantly modify each other, which may require judgment based on the facts and circumstances of the contract.
3. DeterminationWe also provide professional services, which include consulting services, such as experience management, monitoring and production services, implementation services and premium support services. In determining whether professional services are distinct, we consider the following factors for each professional services agreement: availability of the transaction price
The transaction price is determined based on the consideration to which we expect to be entitled in exchangedetermination of SSP for transferring services to the customer. Variable consideration is included in the transaction price if, in our judgment, it is probable that a significant future reversal of cumulative revenue recognized under the contract will not occur. We apply the practical expedient in Topic 606 paragraph 10-32-18 and do not adjust the promised amount of consideration for the effects of a significant financing component for contracts that are one year or less, and none of our multi-year contracts contain a significant financing component. Revenue is recognized net of any taxes collected from customers which are subsequently remitted to governmental entities, such as sales and other indirect taxes.
Our digital engagement platform and related support services are typically warranted to perform in a professional manner that will comply with the terms of the subscription agreements. In addition, we include service level commitments to our customers warranting certain levels of uptime reliability and performance and permitting those customers to receive credits in the event that we fail to meet those service levels. These credits represent a form of variable consideration. Historically, we have not experienced any significant incidents affecting the defined levels of reliability and performance as required by the subscription agreements. We have not provided any material refunds related to these agreements in the consolidated financial statements during the periods presented.
4. Allocation of the transaction price to the performance obligations in the contract
Contracts that contain multiple performance obligations require an allocation of the transaction price to each distinct performance obligation based on each performance obligation’s relative standalone selling price, or the SSP.requires judgement. The SSP is the price at which we would sell a promised good or service separately to a customer. In instances where we do not sell or price a product or
service separately, establishing SSP requires significant judgement. Wewe estimate the SSPstandalone selling price by considering available information, such as market conditions, internally approved pricing guidelines and the underlying cost of delivering the performance obligation.
5. Recognition of the revenue when,internal discounting tables. Based on these results, we estimate SSP for each distinct product or as, a performance obligation is satisfied
Revenue is recognized at the time the related performance obligation is satisfied by transferring the control of the promised service delivered to a customer. Revenue is recognized in an amount that reflects the consideration thatcustomers. As our go-to-market strategies evolve, we expect to receive in exchange for those services. We recognize subscription revenue on a straight-line basis over the term of the applicable contract subscription period beginning on the date access tomay modify our platform is granted. We recognize revenue from consulting services related to eventspricing strategies in the period the event occurs and the service is delivered. We recognize revenue from implementation services upon completion of the services. We recognize revenue from premium support offerings on a ratable basis over the applicable subscription term.
Costsfuture, which could result in changes to Obtain a Contract
We capitalize sales commissions and associated payroll taxes paid to internal sales personnel and third-party referral fees that are incremental to the acquisition of customer contracts. These costs are recorded as deferred contract acquisition costs on our consolidated balance sheets. We determine whether costs should be deferred based on our sales compensation plans and if the commissions are incremental and would not have occurred absent the customer contract.
Sales commissions paid upon the initial acquisition of a customer contract are amortized over an estimated period of benefit of five years, as we specifically anticipate renewals of customer contracts and commissions paid on renewal contracts are not commensurate with commissions paid on new customer contracts. Sales commissions paid upon renewal of customer contracts are amortized over the contractual renewal term. Amortization is recognized on a straight-line basis commensurate with the pattern of revenue recognition. Sales commissions paid related to professional services are amortized over the expected service period. We determine the period of benefit for commissions paid for the acquisition of the initial customer contract by taking into consideration the initial estimated customer life and the technological life of our platform and related significant features. Amortization of deferred contract acquisition costs is included in sales and marketing expense in our consolidated statements of operations.SSP.
Stock-Based Compensation
We issue stock-based compensation awards to employees in the form of restricted stock and stock options. We measure stock-based compensation expense related to these awards based on the fair value of the awards on grant date. For time-based awards, we recognize stock-based compensation on a straight-line basis over the requisite service period, which generally equals the vesting period. For market-performance based awards, we recognize stock-based compensation ratably over the requisite service period, which generally equals the performance period. Effective January 1, 2021, we elected toWe account for forfeited awards as they occur. Prior to 2021, we estimated forfeitures at the time of grant and revised those estimates in subsequent periods if actual forfeitures differ from our estimates.
Restricted stock awards we grant to employees generally vest over three to four years. Stock-based compensation expense related to restricted stock awards is based on the closing market value of our common stock on the grant date and is recognized as expense over the requisite service period on a straight-line basis.
The grant date fair value of the market performance-based restricted stock awards is calculated using a Monte Carlo simulation which factors in the number of awards to be earned based on the achievement of the market condition. This model simulates the various movements of our stock price and each constituent company of the benchmark index using certain assumptions, including the stock price of our common stock and those of the constituent companies, stock price volatility, risk-free interest rate and expected dividend yield. Compensation cost is recognized ratably over the requisite service period regardless of whether the market condition is ultimately satisfied.
Stock options we grant to employees generally vest over four years. We have selected the Black-Scholes option pricing model to determine the fair value of stock option awards, which model requires management to apply judgment and make highly subjective assumptions and estimates.
The assumptions and estimates of the Black-Scholes and Monte Carlo valuations are as follows:
•Fair Value of Common Stock. Prior to our IPO, the fair value was determined by our board of directors, with input from management and valuation reports prepared by independent third-party valuation firms. For valuations of option grants made after the closing of our IPO and PSUs, the fair value of each share of common stock was based on the closing price of our common stock on the date of grant, as reported on the New York Stock Exchange.
•Risk-Free Interest Rate. The risk-free interest rate for the expected term wasis based on the U.S. Treasury yield curve in effect at the time of the grant.
•Expected Term. The expected term represents the period of time that an equity award is expected to be outstanding. Our historical stock option exercise experience does not provide a reasonable basis upon which to estimate an expected term due to a lack of sufficient data. For stock options granted to employees, we estimate the expected term by using the simplified method. The simplified method calculates the expected term as the average of the time-to-vesting and the contractual life of the options. For market performance-based restricted stock awards, the expected term represents the longer of the requisite service period or the performance period.
•Expected Volatility. As we do not have a trading history for our common stock prior to the IPO, the expected volatility was estimated by taking the average historic price volatility for industry peers, consisting of several public companies in our industry which are either similar in size, stage of life cycle, or financial leverage or market capitalization, over a period equivalent to the expected term of the awards. For market performance-based restricted stock awards granted insince 2022, the expected volatility is estimated using a weighting of our historical volatility and the historical volatility of a peer group of publicly traded companies.
•Expected Dividend Yield. WeOther than the one-time special dividend in 2023, we have never declared or paid any cash dividends.dividends and have no plan to do so in the foreseeable future. As a result, an expected dividend yield of zero percent was used.
JOBS Act Accounting Election
We are an emerging growth company, as defined in the JOBS Act. Under the JOBS Act, emerging growth companies can delay adopting new or revised accounting standards until such time as those standards apply to private companies. We intend to avail ourselves of this exemption from new or revised accounting standards. Accordingly, we will not be subject to the same new or revised accounting standards as other public companies that are not emerging growth companies or that have opted out of using such extended transition period.
Recent Accounting Pronouncements
See Note 1 to our consolidated financial statements included elsewhere in this Form 10-K for more information.
Item 3.7A. Quantitative and Qualitative Disclosures About Market Risk.
Foreign Currency and Exchange Risk
The vast majority of our cash generated from revenue are denominated in U.S. dollars, with a small amount denominated in foreign currencies. Our expenses are generally denominated in the currencies of the jurisdictions in which we conduct our operations, which are primarily in the United States, the United Kingdom, Australia, Singapore, Japan and Norway. Our results of current and future operations and cash flows are, therefore, subject to fluctuations due to changes in foreign currency exchange rates. The effect of a hypothetical 10% change in foreign currency exchange rates applicable to our business would not have had a material impact on our historical consolidated financial statements for the years ended December 31, 20222023, 20212022 and 2020.2021. We have not entered into derivative or hedging transactions, but we may do so in the future if our exposure to foreign currency becomes more significant.
Interest Rate Risk
Our exposure to changes in interest rates relates primarily to our investment portfolio. Changes in U.S. interest rates affect the interest earned on our cash, cash equivalents and investments and the fair value of those investments.
Our cash equivalents primarily consist of money market mutual funds, which are not significantly exposed to interest rate risk. Our marketable securities are subject to interest rate risk because these securities primarily include a fixed interest rate. As a result, the market values of these securities are affected by changes in prevailing interest rates. We attempt to limit our exposure to interest rate risk and credit risk by investing our investment portfolio in instruments that meet the minimum credit quality, liquidity, diversification and other requirements of our investment policy. Our marketable securities consist of liquid, investment-grade securities. We do not enter into investments for trading or speculative purposes.
The following table presents the hypothetical fair values of our marketable securities assuming immediate parallel shifts in the yield curve of 50 basis points (BPS)(“BPS”), 100 BPS and 150 BPS as of December 31, 20222023 (in thousands):
| | | | | | | | | | | | | | | | | | | | | | | | | | | | | | | | | | | | | | | | | |
| (150 BPS) | | (100 BPS) | | (50 BPS) | | Fair Value as of December 31, 2022 | | 50 BPS | | 100 BPS | | 150 BPS |
| Marketable securities | $ | 302,330 | | | $ | 301,929 | | | $ | 301,527 | | | $ | 301,125 | | | $ | 300,723 | | | $ | 300,322 | | | $ | 299,920 | |
| | | | | | | | | | | | | | | | | | | | | | | | | | | | | | | | | | | | | | | | | |
| (150 BPS) | | (100 BPS) | | (50 BPS) | | Fair Value as of December 31, 2023 | | 50 BPS | | 100 BPS | | 150 BPS |
| Marketable securities | $ | 146,778 | | | $ | 146,351 | | | $ | 145,924 | | | $ | 145,497 | | | $ | 145,070 | | | $ | 144,643 | | | $ | 144,216 | |
Item 1.8. Financial Statements and Supplemental Date.
ON24, Inc.
Index to Consolidated Financial Statements
Report of Independent Registered Public Accounting Firm
To the Stockholders and Board of Directors
ON24, Inc.:
Opinion on the Consolidated Financial Statements
We have audited the accompanying consolidated balance sheets of ON24, Inc. and subsidiaries (the Company) as of December 31, 20222023 and 2021,2022, the related consolidated statements of operations, comprehensive income (loss),loss, convertible preferred stock and stockholders’ deficit,equity (deficit), and cash flows for each of the years in the three-year period ended December 31, 2022,2023, and the related notes (collectively, the consolidated financial statements). In our opinion, the consolidated financial statements present fairly, in all material respects, the financial position of the Company as of December 31, 20222023 and 2021,2022, and the results of its operations and its cash flows for each of the years in the three-year period ended December 31, 2022,2023, in conformity with U.S. generally accepted accounting principles.
Change in Accounting Principle
As discussed in Note 1 to the consolidated financial statements, the Company has changed its method of accounting for leases as of January 1, 2022 due to the adoption of FASB’s Accounting Standards Codification (ASC) Topic 842, Leases.
Basis for Opinion
These consolidated financial statements are the responsibility of the Company’s management. Our responsibility is to express an opinion on these consolidated financial statements based on our audits. We are a public accounting firm registered with the Public Company Accounting Oversight Board (United States) (PCAOB) and are required to be independent with respect to the Company in accordance with the U.S. federal securities laws and the applicable rules and regulations of the Securities and Exchange Commission and the PCAOB.
We conducted our audits in accordance with the standards of the PCAOB. Those standards require that we plan and perform the audit to obtain reasonable assurance about whether the consolidated financial statements are free of material misstatement, whether due to error or fraud. Our audits included performing procedures to assess the risks of material misstatement of the consolidated financial statements, whether due to error or fraud, and performing procedures that respond to those risks. Such procedures included examining, on a test basis, evidence regarding the amounts and disclosures in the consolidated financial statements. Our audits also included evaluating the accounting principles used and significant estimates made by management, as well as evaluating the overall presentation of the consolidated financial statements. We believe that our audits provide a reasonable basis for our opinion.
/s/ KPMG LLP
We have served as the Company's auditor since 2009.
San Francisco, California
March 14, 202313, 2024
ON24, Inc.
Consolidated Balance Sheets
(in thousands, except share and per share data)
| | December 31, 2022 | | December 31, 2021 |
| December 31, 2023 | | | December 31, 2023 | | December 31, 2022 |
| Assets | Assets | | | |
| Current assets | Current assets | |
| Current assets | |
| Current assets | |
| Cash and cash equivalents | |
| Cash and cash equivalents | |
| Cash and cash equivalents | Cash and cash equivalents | $ | 26,996 | | $ | 164,948 | $ | 53,209 | | $ | 26,996 |
| Marketable securities | Marketable securities | 301,125 | | 217,609 | Marketable securities | 145,497 | | 301,125 |
| Accounts receivable, net of allowances and reserves of $2,930 and $2,677 as of December 31, 2022 and December 31, 2021, respectively | 43,757 | | 46,117 |
| Accounts receivable, net of allowances and reserves of $3,621 and $2,930 as of December 31, 2023 and December 31, 2022, respectively | | Accounts receivable, net of allowances and reserves of $3,621 and $2,930 as of December 31, 2023 and December 31, 2022, respectively | 37,939 | | 43,757 |
| Deferred contract acquisition costs, current | Deferred contract acquisition costs, current | 13,136 | | 11,921 | Deferred contract acquisition costs, current | 12,428 | | 13,136 |
| Prepaid expenses and other current assets | Prepaid expenses and other current assets | 6,281 | | 8,467 | Prepaid expenses and other current assets | 4,714 | | 6,281 |
| Total current assets | Total current assets | 391,295 | | | 449,062 | |
| Property and equipment, net | Property and equipment, net | 7,212 | | | 8,780 | |
| Operating right-of-use assets | Operating right-of-use assets | 5,606 | | | — | |
| Intangible asset, net | Intangible asset, net | 1,979 | | | — | |
| Deferred contract acquisition costs, non-current | Deferred contract acquisition costs, non-current | 17,773 | | | 20,887 | |
| Other long-term assets | Other long-term assets | 1,608 | | | 1,760 | |
| Total assets | Total assets | $ | 425,473 | | | $ | 480,489 | |
| Liabilities and Stockholders’ Equity | Liabilities and Stockholders’ Equity | | | |
| Current liabilities | Current liabilities | |
| Current liabilities | |
| Current liabilities | |
| Accounts payable | |
| Accounts payable | |
| Accounts payable | Accounts payable | $ | 4,611 | | | $ | 3,123 | |
| Accrued and other current liabilities | Accrued and other current liabilities | 18,465 | | | 19,011 | |
| Deferred revenue | Deferred revenue | 83,453 | | | 96,225 | |
| Finance lease liabilities, current | Finance lease liabilities, current | 1,554 | | | 1,768 | |
| Operating lease liabilities, current | Operating lease liabilities, current | 2,648 | | | — | |
| Total current liabilities | Total current liabilities | 110,731 | | | 120,127 | |
| Finance lease liabilities, non-current | 91 | | | 1,648 | |
| | Operating lease liabilities, non-current | |
| Operating lease liabilities, non-current | |
| Operating lease liabilities, non-current | Operating lease liabilities, non-current | 5,040 | | | — | |
| Other long-term liabilities | Other long-term liabilities | 1,650 | | | 3,624 | |
| Total liabilities | Total liabilities | 117,512 | | | 125,399 | |
| Commitments and contingencies (See Note 10) | | | |
| Commitments and contingencies (Note 10) | | Commitments and contingencies (Note 10) | | | |
| Stockholders’ equity | Stockholders’ equity | |
| Common stock, $0.0001 par value per share; 500,000,000 shares authorized as of December 31, 2022 and 2021; 47,554,801 and 47,727,346 shares issued and outstanding as of December 31, 2022 and 2021, respectively | 5 | | | 5 | |
| Common stock, $0.0001 par value per share; 500,000,000 shares authorized as of December 31, 2023 and 2022; 41,189,321 and 47,554,801 shares issued and outstanding as of December 31, 2023 and 2022, respectively | |
| Common stock, $0.0001 par value per share; 500,000,000 shares authorized as of December 31, 2023 and 2022; 41,189,321 and 47,554,801 shares issued and outstanding as of December 31, 2023 and 2022, respectively | |
| Common stock, $0.0001 par value per share; 500,000,000 shares authorized as of December 31, 2023 and 2022; 41,189,321 and 47,554,801 shares issued and outstanding as of December 31, 2023 and 2022, respectively | |
| Additional paid-in capital | Additional paid-in capital | 562,555 | | | 550,839 | |
| Accumulated deficit | Accumulated deficit | (253,727) | | | (195,519) | |
| Accumulated other comprehensive loss | (872) | | | (235) | |
| Accumulated other comprehensive income (loss) | |
| Total stockholders’ equity | Total stockholders’ equity | 307,961 | | | 355,090 | |
| Total liabilities and stockholders’ equity | Total liabilities and stockholders’ equity | $ | 425,473 | | | $ | 480,489 | |
|
See accompanying notes to consolidated financial statements.
ON24, Inc.
Consolidated Statements of Operations
(in thousands, except share and per share amounts)
| | | | | Year Ended December 31, | |
| | | Year Ended December 31, |
| | | 2022 | | 2021 | | 2020 |
| | | Year Ended December 31, | |
| | | | Year Ended December 31, | |
| | | | | 2023 | | | | | | | 2023 | | 2022 | | 2021 |
| Revenue | Revenue | | | | | | |
| Subscription and other platform | |
| Subscription and other platform | |
| Subscription and other platform | Subscription and other platform | | $ | 171,841 | | | $ | 175,876 | | | $ | 122,630 | |
| Professional services | Professional services | | 19,031 | | | 27,737 | | | 34,311 | |
| Total revenue | Total revenue | | 190,872 | | | 203,613 | | | 156,941 | |
| Cost of revenue | Cost of revenue | | |
| Subscription and other platform | Subscription and other platform | | 39,241 | | | 33,400 | | | 20,746 | |
| Subscription and other platform | |
| Subscription and other platform | |
| Professional services | Professional services | | 13,544 | | | 13,965 | | | 12,589 | |
| Total cost of revenue | Total cost of revenue | | 52,785 | | | 47,365 | | | 33,335 | |
| Gross profit | Gross profit | | 138,087 | | | 156,248 | | | 123,606 | |
| Operating expenses | Operating expenses | | |
| Sales and marketing | |
| Sales and marketing | |
| Sales and marketing | Sales and marketing | | 109,599 | | | 104,063 | | | 60,640 | |
| Research and development | Research and development | | 44,102 | | | 34,835 | | | 19,275 | |
| General and administrative | General and administrative | | 43,969 | | | 40,940 | | | 21,848 | |
| Total operating expenses | Total operating expenses | | 197,670 | | | 179,838 | | | 101,763 | |
| Loss from operations | Loss from operations | | (59,583) | | | (23,590) | | | 21,843 | |
| Interest expense | Interest expense | | 181 | | | 464 | | | 869 | |
| Other (income) expense, net | Other (income) expense, net | | (2,514) | | | 487 | | | (76) | |
| Income (loss) before provision for (benefit from) income taxes | | (57,250) | | | (24,541) | | | 21,050 | |
| Loss before provision for (benefit from) income taxes | |
| Provision for (benefit from) income taxes | Provision for (benefit from) income taxes | | 958 | | | (285) | | | 297 | |
| Net income (loss) | | (58,208) | | | (24,256) | | | 20,753 | |
| Net loss | |
| Cumulative preferred dividends allocated to preferred stockholders | Cumulative preferred dividends allocated to preferred stockholders | | — | | | (558) | | | (5,685) | |
| Net income (loss) attributable to common stockholders | | $ | (58,208) | | | $ | (24,814) | | | $ | 15,068 | |
| Net income (loss) per share attributable to common stockholders: | | | | | | |
| Basic | | $ | (1.23) | | | $ | (0.57) | | | $ | 0.40 | |
| Diluted | | $ | (1.23) | | | $ | (0.57) | | | $ | 0.35 | |
| Net loss attributable to common stockholders | |
| Net loss per share attributable to common stockholders: | |
| Basic and diluted | |
| Basic and diluted | |
| Basic and diluted | |
| | Weighted-average shares used in computing net loss per share attributable to common stockholders: | Weighted-average shares used in computing net loss per share attributable to common stockholders: | | | | | | |
| Basic | | 47,486,225 | | | 43,562,604 | | | 10,017,574 | |
| Diluted | | 47,486,225 | | | 43,562,604 | | | 16,187,149 | |
| Weighted-average shares used in computing net loss per share attributable to common stockholders: | |
| Weighted-average shares used in computing net loss per share attributable to common stockholders: | |
| Basic and diluted | |
| Basic and diluted | |
| Basic and diluted | |
| |
See accompanying notes to consolidated financial statements.
ON24, Inc.
Consolidated Statements of Comprehensive Income (Loss)Loss
(in thousands)
| | | Year Ended December 31, |
| | 2022 | | 2021 | | 2020 | |
| Net income (loss) | | | $ | (58,208) | | | $ | (24,256) | | | $ | 20,753 | | |
| | | Year Ended December 31, | |
| | | Year Ended December 31, | |
| | | Year Ended December 31, | |
| | | | | 2023 | | | | | | | 2023 | | 2022 | | 2021 |
| Net loss | |
| Other comprehensive income (loss) | Other comprehensive income (loss) | | | | |
| Foreign currency translation adjustment, net of tax | Foreign currency translation adjustment, net of tax | | | (143) | | | 185 | | | 96 | | |
| Unrealized loss on available for sale debt securities, net of tax | | | (494) | | | (514) | | | — | | |
| Foreign currency translation adjustment, net of tax | |
| Foreign currency translation adjustment, net of tax | |
| Unrealized gain (loss) on available for sale debt securities, net of tax | |
| Total other comprehensive income (loss) | Total other comprehensive income (loss) | | | (637) | | | (329) | | | 96 | | |
| Total comprehensive income (loss) | | | $ | (58,845) | | | $ | (24,585) | | | $ | 20,849 | | |
| Total comprehensive loss | |
|
See accompanying notes to consolidated financial statements.
ON24, Inc.
Consolidated Statements of Convertible Preferred Stock and Stockholders’ Equity (Deficit)
(in thousands, except share amounts)
| | Convertible
Preferred Stock | | Redeemable convertible
preferred stock | | Common Stock | | Additional
paid-in
capital | | Accumulated
Deficit | | Accumulated other comprehensive income (loss) | | Total
stockholders'
equity
(deficit) |
| Shares | | Amount | | Shares | | Amount | | Shares | | Amount | |
| Balance as of December 31, 2019 | 21,683,548 | | | $ | 83,857 | | | 5,543,918 | | | $ | 70,000 | | | 8,953,967 | | | $ | 1 | | | $ | 20,809 | | | $ | (192,016) | | | $ | (2) | | | (171,208) | |
| Issuance of common stock upon exercise of stock options | — | | | — | | | — | | | — | | | 1,942,170 | | | — | | | 3,774 | | | — | | | — | | | 3,774 | |
| Stock-based compensation expense | — | | | — | | | — | | | — | | | — | | | — | | | 2,929 | | | — | | | — | | | 2,929 | |
| Other comprehensive income | — | | | — | | | — | | | — | | | — | | | — | | | — | | | — | | | 96 | | | 96 | |
| Net income | — | | | — | | | — | | | — | | | — | | | — | | | — | | | 20,753 | | | — | | | 20,753 | |
| Convertible
Preferred Stock | | | Convertible
Preferred Stock | | Redeemable convertible
preferred stock | | Common Stock | | Additional
Paid-in
Capital | | Accumulated
Deficit | | Accumulated Other Comprehensive Income (Loss) | | Total Stockholders' Equity (Deficit) |
| Shares | |
| Balance as of December 31, 2020 | |
| Balance as of December 31, 2020 | |
| Balance as of December 31, 2020 | Balance as of December 31, 2020 | 21,683,548 | | | $ | 83,857 | | | 5,543,918 | | | $ | 70,000 | | | 10,896,137 | | | $ | 1 | | | $ | 27,512 | | | $ | (171,263) | | | $ | 94 | | | $ | (143,656) | |
| Conversion of convertible preferred stock and redeemable convertible preferred stock to common stock upon initial public offering | Conversion of convertible preferred stock and redeemable convertible preferred stock to common stock upon initial public offering | (21,683,548) | | | (83,857) | | | (5,543,918) | | | (70,000) | | | 27,227,466 | | | 3 | | | 153,854 | | | — | | | — | | | 153,857 | |
| Issuance of common stock upon initial public offering, net of underwriting discounts and other offering costs | Issuance of common stock upon initial public offering, net of underwriting discounts and other offering costs | — | | | — | | | — | | | — | | | 7,599,928 | | | 1 | | | 347,780 | | | — | | | — | | | 347,781 | |
| Repurchase of common stock | Repurchase of common stock | — | | | — | | | — | | | — | | | (428,218) | | | — | | | (7,228) | | | — | | | — | | | (7,228) | |
| Issuance of common stock upon exercise of stock options | Issuance of common stock upon exercise of stock options | — | | | — | | | — | | | — | | | 2,226,932 | | | — | | | 5,825 | | | — | | | — | | | 5,825 | |
| Issuance of common stock upon release of restricted stock units | Issuance of common stock upon release of restricted stock units | — | | | — | | | — | | | — | | | 130,074 | | | — | | | — | | | — | | | — | | | — | |
| Issuance of common stock under Employee Stock Purchase Plan (ESPP) | — | | | — | | | — | | | — | | | 75,027 | | | — | | | 1,054 | | | — | | | — | | | 1,054 | |
| Issuance of common stock under Employee Stock Purchase Plan (“ESPP”) | |
| Payment for employee tax withholding upon net share settlement on equity awards | Payment for employee tax withholding upon net share settlement on equity awards | — | | | — | | | — | | | — | | | — | | | — | | | (3,608) | | | — | | | — | | | (3,608) | |
| Stock-based compensation expense | Stock-based compensation expense | — | | | — | | | — | | | — | | | — | | | — | | | 25,650 | | | — | | | — | | | 25,650 | |
| Other comprehensive loss | Other comprehensive loss | — | | | — | | | — | | | — | | | — | | | — | | | — | | | — | | | (329) | | | (329) | |
| Net loss | Net loss | — | | | — | | | — | | | — | | | — | | | — | | | — | | | (24,256) | | | — | | | (24,256) | |
| Balance as of December 31, 2021 | Balance as of December 31, 2021 | — | | | $ | — | | | — | | | $ | — | | | 47,727,346 | | | $ | 5 | | | $ | 550,839 | | | $ | (195,519) | | | $ | (235) | | | $ | 355,090 | |
| Repurchase of common stock | Repurchase of common stock | — | | | — | | | — | | | — | | | (2,460,361) | | | — | | | (29,127) | | | — | | | — | | | (29,127) | |
| Issuance of common stock upon exercise of stock options | Issuance of common stock upon exercise of stock options | — | | | — | | | — | | | — | | | 1,107,471 | | | — | | | 2,474 | | | — | | | — | | | 2,474 | |
| Issuance of common stock upon release of restricted stock units | Issuance of common stock upon release of restricted stock units | — | | | — | | | — | | | — | | | 980,110 | | | — | | | — | | | — | | | — | | | — | |
| Issuance of common stock under ESPP | Issuance of common stock under ESPP | — | | | — | | | — | | | — | | | 200,235 | | | — | | | 1,582 | | | — | | | — | | | 1,582 | |
| Payment for employee tax withholding upon net share settlement on equity awards | Payment for employee tax withholding upon net share settlement on equity awards | — | | | — | | | — | | | — | | | — | | | — | | | (1,756) | | | — | | | — | | | (1,756) | |
| Stock-based compensation expense | Stock-based compensation expense | — | | | — | | | — | | | — | | | — | | | — | | | 38,543 | | | — | | | — | | | 38,543 | |
| Other comprehensive loss | Other comprehensive loss | — | | | — | | | — | | | — | | | — | | | — | | | — | | | — | | | (637) | | | (637) | |
| Net loss | Net loss | — | | | — | | | — | | | — | | | — | | | — | | | — | | | (58,208) | | | — | | | (58,208) | |
| Balance as of December 31, 2022 | Balance as of December 31, 2022 | — | | | $ | — | | | — | | | $ | — | | | 47,554,801 | | | $ | 5 | | | $ | 562,555 | | | $ | (253,727) | | | $ | (872) | | | $ | 307,961 | |
| Cash dividend declared ($1.09 per share) | |
| Repurchase of common stock | |
| Excise taxes on repurchase of common stock | |
| Issuance of common stock upon exercise of stock options | |
| Issuance of common stock upon release of restricted stock units | |
| Issuance of common stock under ESPP | |
| Stock-based compensation expense | |
| Other comprehensive income | |
| Net loss | |
| Balance as of December 31, 2023 | |
|
See accompanying notes to consolidated financial statements.
ON24, Inc.
Consolidated Statements of Cash Flows
(In thousands)
| | | | | | | | | | | | | | | | | | | |
| Year Ended December 31, |
| 2022 | | 2021 | | 2020 | | |
| Cash flows from operating activities: | | | | | | | |
| Net income (loss) | $ | (58,208) | | | $ | (24,256) | | | $ | 20,753 | | | |
| Adjustments to reconcile net income (loss) to net cash (used in) provided by operating activities: | | | | | | | |
| Depreciation and amortization | 5,416 | | | 4,592 | | | 2,974 | | | |
| Stock-based compensation expense | 38,543 | | | 25,650 | | | 2,929 | | | |
| Amortization of deferred contract acquisition costs | 15,665 | | | 15,248 | | | 11,115 | | | |
| Provision for allowance for doubtful accounts and billing reserve | 1,918 | | | 2,943 | | | 3,009 | | | |
| Non-cash lease expense | 1,962 | | | — | | | — | | | |
| | | | | | | |
| Other | (1,083) | | | 503 | | | — | | | |
| Changes in operating assets and liabilities: | | | | | | | |
| Accounts receivable | 482 | | | (443) | | | (29,024) | | | |
| Deferred contract acquisition costs | (13,766) | | | (18,775) | | | (26,354) | | | |
| Prepaid expenses and other assets | 2,298 | | | (4,617) | | | (2,799) | | | |
| Accounts payable | 1,533 | | | (1,247) | | | 2,032 | | | |
| Accrued liabilities | 30 | | | 2,311 | | | 4,986 | | | |
| Deferred revenue | (12,807) | | | 3,985 | | | 47,799 | | | |
| | | | | | | |
| Other non-current liabilities | (2,444) | | | (705) | | | 122 | | | |
| Net cash (used in) provided by operating activities | (20,461) | | | 5,189 | | | 37,542 | | | |
| Cash flows from investing activities: | | | | | | | |
| Purchase of property and equipment | (3,697) | | | (3,564) | | | (1,030) | | | |
| Acquisition, net of cash acquired | (2,495) | | | — | | | — | | | |
| Purchase of marketable securities | (297,405) | | | (235,805) | | | (5,000) | | | |
| Proceeds from maturities of marketable securities | 194,372 | | | 20,179 | | | 7,000 | | | |
| Proceeds from sale of marketable securities | 20,244 | | | — | | | — | | | |
| Net cash used in investing activities | (88,981) | | | (219,190) | | | 970 | | | |
| Cash flows from financing activities: | | | | | | | |
| Proceeds from initial public offering, net of underwriting discounts | — | | | 353,397 | | | — | | | |
| Proceeds from exercise of stock options | 2,785 | | | 5,514 | | | 3,774 | | | |
| Proceeds from issuance of common stock under ESPP | 1,582 | | | 1,054 | | | — | | | |
| Payment of tax withholding obligations related to net share settlements on equity awards | (1,756) | | | (3,608) | | | — | | | |
| Proceeds from long-term debt | — | | | — | | | 28,381 | | | |
| Payment for repurchase of common stock | (29,127) | | | (7,228) | | | — | | | |
| Repayment of equipment loans and borrowings | (270) | | | (22,597) | | | (28,179) | | | |
| Repayment of finance lease obligations | (1,832) | | | (2,304) | | | (1,270) | | | |
| Payment of offering costs | — | | | (3,714) | | | (1,902) | | | |
| Net cash (used in) provided by financing activities | (28,618) | | | 320,514 | | | 804 | | | |
| Effect of exchange rate changes on cash, cash equivalents and restricted cash | 186 | | | 185 | | | 96 | | | |
| Net (decrease) increase in cash, cash equivalents and restricted cash | (137,874) | | | 106,698 | | | 39,412 | | | |
| Cash, cash equivalents and restricted cash, beginning of period | 165,043 | | | 58,345 | | | 18,933 | | | |
| Cash, cash equivalents and restricted cash, end of period | $ | 27,169 | | | $ | 165,043 | | | $ | 58,345 | | | |
| Reconciliation of cash, cash equivalents, and restricted cash to the consolidated balance sheets: | | | | | | | |
| Cash and cash equivalents | $ | 26,996 | | | $ | 164,948 | | | $ | 58,243 | | | |
| Restricted cash included in other assets, non-current | $ | 173 | | | $ | 95 | | | $ | 102 | | | |
| Total cash, cash equivalent, and restricted cash | $ | 27,169 | | | $ | 165,043 | | | $ | 58,345 | | | |
| Supplemental disclosures of cash flow information: | | | | | | | |
| Cash paid for taxes, net of refunds | $ | 382 | | | $ | 337 | | | $ | 183 | | | |
| Cash paid for interest | $ | 148 | | | $ | 652 | | | $ | 967 | | | |
| Supplemental disclosures of noncash investing and financing activities: | | | | | | | |
| Equipment acquired under capital leases | $ | — | | | $ | 1,586 | | | $ | 5,089 | | | |
| Equipment purchased funded by liabilities | $ | — | | | $ | 391 | | | $ | 179 | | | |
| Property and equipment purchased not yet paid | $ | 163 | | | $ | 419 | | | $ | 402 | | | |
| | | | | | | |
| Conversion of convertible preferred stock and redeemable convertible preferred stock to common stock | $ | — | | | $ | 153,857 | | | $ | — | | | |
| Option exercises not yet settled | $ | — | | | $ | 311 | | | $ | — | | | |
| Deferred offering costs in accounts payable and accrued liabilities | $ | — | | | $ | — | | | $ | 1,318 | | | |
| Non-cash options exercise | $ | 488 | | | $ | — | | | $ | — | | | |
| | | | | | | |
| | | | | | | |
| Holdback liability related to acquisition | $ | 500 | | | $ | — | | | $ | — | | | |
| | | | | | | |
| | | | | | | | | | | | | | | | | |
| Year Ended December 31, |
| 2023 | | 2022 | | 2021 |
| Cash flows from operating activities: | | | | | |
| Net loss | $ | (51,786) | | | $ | (58,208) | | | $ | (24,256) | |
| Adjustments to reconcile net loss to net cash used in operating activities: | | | | | |
| Depreciation and amortization | 5,360 | | | 5,416 | | | 4,592 | |
| Stock-based compensation expense | 45,017 | | | 38,543 | | | 25,650 | |
| Amortization of deferred contract acquisition costs | 15,589 | | | 15,665 | | | 15,248 | |
| Provision for allowance for doubtful accounts and billing reserves | 3,059 | | | 1,918 | | | 2,943 | |
| Non-cash lease expense | 1,710 | | | 1,962 | | | — | |
| Accretion of marketable securities | (7,716) | | | (1,242) | | | 504 | |
| Lease impairment charge | 1,461 | | | — | | | — | |
| Other | 244 | | | 159 | | | (1) | |
| Changes in operating assets and liabilities: | | | | | |
| Accounts receivable | 2,759 | | | 482 | | | (443) | |
| Deferred contract acquisition costs | (12,864) | | | (13,766) | | | (18,775) | |
| Prepaid expenses and other assets | 2,061 | | | 2,298 | | | (4,617) | |
| Accounts payable | (2,897) | | | 1,533 | | | (1,247) | |
| Accrued liabilities | (1,999) | | | 30 | | | 2,311 | |
| Deferred revenue | (9,095) | | | (12,807) | | | 3,985 | |
| | | | | |
| Other liabilities | (3,105) | | | (2,444) | | | (705) | |
| Net cash (used in) provided by operating activities | (12,202) | | | (20,461) | | | 5,189 | |
| Cash flows from investing activities: | | | | | |
| Purchase of property and equipment | (2,183) | | | (3,697) | | | (3,564) | |
| Acquisition, net of cash acquired | — | | | (2,495) | | | — | |
| Purchase of marketable securities | (276,210) | | | (297,405) | | | (235,805) | |
| Proceeds from maturities of marketable securities | 422,969 | | | 194,372 | | | 20,179 | |
| Proceeds from sale of marketable securities | 17,739 | | | 20,244 | | | — | |
| Net cash provided by (used in) investing activities | 162,315 | | | (88,981) | | | (219,190) | |
| Cash flows from financing activities: | | | | | |
| Proceeds from initial public offering, net of underwriting discounts | — | | | — | | | 353,397 | |
| Proceeds from exercise of stock options | 1,422 | | | 2,785 | | | 5,514 | |
| Proceeds from issuance of common stock under ESPP | 1,008 | | | 1,582 | | | 1,054 | |
| Payment of tax withholding obligations related to net share settlements on equity awards | — | | | (1,756) | | | (3,608) | |
| Payment for repurchase of common stock | (74,569) | | | (29,127) | | | (7,228) | |
| Payment of cash dividend | (49,872) | | | — | | | — | |
| Repayment of equipment loans and borrowings | (236) | | | (270) | | | (22,597) | |
| Repayment of finance lease obligations | (1,533) | | | (1,832) | | | (2,304) | |
| Payments of offering costs | — | | | — | | | (3,714) | |
| Acquisition holdback payment | (403) | | | — | | | — | |
| Net cash (used in) provided by financing activities | (124,183) | | | (28,618) | | | 320,514 | |
| Effect of exchange rate changes on cash, cash equivalents and restricted cash | 199 | | | 186 | | | 185 | |
| Net increase (decrease) in cash, cash equivalents and restricted cash | 26,129 | | | (137,874) | | | 106,698 | |
| Cash, cash equivalents and restricted cash, beginning of period | 27,169 | | | 165,043 | | | 58,345 | |
| Cash, cash equivalents and restricted cash, end of period | $ | 53,298 | | | $ | 27,169 | | | $ | 165,043 | |
| Reconciliation of cash, cash equivalents, and restricted cash to the consolidated balance sheets: | | | | | |
| Cash and cash equivalents | $ | 53,209 | | | $ | 26,996 | | | $ | 164,948 | |
| Restricted cash included in other assets, non-current | 89 | | | 173 | | | 95 | |
| Total cash, cash equivalent, and restricted cash | $ | 53,298 | | | $ | 27,169 | | | $ | 165,043 | |
| Supplemental disclosures of cash flow information: | | | | | |
| Cash paid for taxes, net of refunds | $ | 1,231 | | | $ | 382 | | | $ | 337 | |
| Cash paid for interest | $ | 50 | | | $ | 148 | | | $ | 652 | |
| Supplemental disclosures of noncash investing and financing activities: | | | | | |
| Equipment acquired under finance leases | $ | — | | | $ | — | | | $ | 1,586 | |
| Equipment purchased funded by liabilities | $ | — | | | $ | — | | | $ | 391 | |
| Property and equipment purchased not yet paid | $ | 1,241 | | | $ | 163 | | | $ | 419 | |
| | | | | |
| Conversion of convertible preferred stock and redeemable convertible preferred stock to common stock | $ | — | | | $ | — | | | $ | 153,857 | |
| Option exercises not yet settled | $ | 215 | | | $ | — | | | $ | 311 | |
| Non-cash options exercise | $ | — | | | $ | 488 | | | $ | — | |
| Holdback liability related to acquisition | $ | — | | | $ | 500 | | | $ | — | |
| | | | | |
See accompanying notes to consolidated financial statements.
ON24, Inc.
Notes to Consolidated Financial Statements
Note 1.1. Description of Business and Significant Accounting Policies
Description of Business
ON24, Inc. and its subsidiaries (together, ON24 or the Company) provides a leading, cloud-based intelligent engagement platform for digital engagement that deliverscombines best-in-class experiences with personalization and content, to enable sales and marketing organizations to capture and act on connected insights for revenue growth through interactive webinar experiences, virtual event experiences and multimedia content experiences.at scale. The Company’s platformplatform’ offers a portfolio of interactive personalized and content-richhyper-personalized digital experience products that creates and captures actionable, real-time data at scale from millions of professionals every month to provide businesses with buying signals and behavioral insights to efficiently convert prospects into customers.customers The Company was incorporated in the state of Delaware in January 1998 as NewsDirect, Inc. and in December 1998 changed its name to ON24, Inc. The Company is headquartered in San Francisco, California.
Initial Public Offering
On February 5, 2021, the Company closed its initial public offering (IPO)(“IPO”) of 7,599,928 shares of its common stock at a public offering price of $50 per share for net proceeds of approximately $347.8approximately$347.8 million, after deducting the underwriting discount of approximately $26.6$26.6 million and other offering costs of approximately $5.6 million. The shares of common stock sold in the IPO and the net proceeds from the IPO included the full exercise of the underwriters’ option to purchase additional shares.
Upon the closing of the IPO, all of the Company's outstanding shares of Class A-1 and Class A-2 convertible preferred stock and Class B and Class B-1 redeemable convertible preferred stock were automatically converted into an aggregate of 27,227,466 shares of common stock on a one-for-one basis.
Significant Accounting Policies
Basis of Presentation
The accompanying consolidated financial statements include the accounts of ON24 Inc. and its wholly owned subsidiaries and have been prepared in accordance with generally accepted accounting principles in the United States of America (U.S. GAAP) and applicable rules and regulations of the Securities and Exchange Commission (SEC) for annual financial reporting.(“U.S. GAAP”). All intercompany transactions and balances have been eliminated in consolidation.
Certain prior period amounts have been reclassified on the consolidated balance sheets and in Note 5 to conform to the current year's presentation. Prior to the adoption of Accounting Standard Update (ASU) No. 2016-02 Leases (Topic 842) on January 1, 2022 (as further discussed below), capital leases and equipment loans were reported together as long-term debt, current and non-current, on the consolidated balance sheets. Upon the adoption of the new lease standard, capital leases are now presented separately as finance leases, current and non-current, on the consolidated balance sheets. The current and non-current portion of equipment loans have been reclassified to accrued and other current liabilities and other long-term liabilities, respectively, on the consolidated balance sheets.
Use of Estimates
The preparation of consolidated financial statements in conformity with U.S. GAAP requires management to make estimates and assumptions that affect the reported amounts of assets and liabilities and disclosure of contingent assets and liabilities at the date of the consolidated financial statements and the reported amounts of revenue and expenses during the reporting period. Significant items subject to suchSuch estimates and assumptions include, but are not limited to, the estimated expected benefit period for deferred contract acquisition costs, the determination of standalone selling price for the Company’s performance obligations, the expected benefit period for deferred contract acquisition costs, the allowance for doubtful accounts and billing reserve,reserves, the useful lives of long-lived assets and the assumptions used to measure stock-based compensation, the valuation of deferred income tax assets and uncertain tax positions.compensation. Actual results could differ materially from thosethese estimates.
Concentration of Risks
The Company’s financial instruments that are exposed to concentrations of credit risk consist primarily of cash and cash equivalents, restricted cash, marketable securities and accounts receivable. The Company maintains its cash and cash equivalents, restricted cash and marketable securities with high-quality financial institutions with investment-grade ratings. A majority of the cash balances are with banks in the U.S. and are insured to the extent defined by the Federal Deposit Insurance Corporation. For concentration of risks on accounts receivables and revenue, refer to Note 2.
Cash, Cash Equivalents and Restricted Cash
Cash and cash equivalents consist of bank deposits and highly liquid investments, primarily money market mutual funds purchased with an original maturity of three months or less. Restricted cash included in other long-term assets in the consolidated balance sheets consists of term deposits to collateralize our Sydney operating lease.
Marketable Securities
The Company classifies its investments in debt securities as available-for-sale at the time of purchase since it is intended that these investments are available for current operations. These investmentsMarketable securities are included within cash and cash equivalents on the accompanying consolidated balance sheets.
Investments are reportedcarried at fair value and are subject to periodic impairment review. Unrealized gains and losses related to changes in the fair valuevalue.
Fair Value Measurements
The Company categorizes assets and liabilities recorded at fair value on its consolidated balance sheets based on the accounting guidance framework for measuring fair value on either a recurring or nonrecurring basis, whereby inputs used in valuation techniques are assigned a hierarchical level.
Fair value is defined as the exchange price that would be received for an asset or paid to transfer a liability in the principal or most advantageous market for the asset or liability in an orderly transaction between market participants on the measurement date. The Company measures assets and liabilities at fair value at each reporting period using a fair value hierarchy which requires the Company to maximize the use of observable inputs and minimize the use of unobservable inputs when measuring fair value. U.S. GAAP describes a fair value hierarchy based on three levels of inputs, of which the first two are considered observable and the last unobservable, to measure the fair value:
Level 1 – observable inputs for identical assets or liabilities, such as quoted prices in active markets.
Level 2 – directly or indirectly observable Inputs other than Level 1, such as quoted prices for similar assets or liabilities, quoted prices in markets that are not active, or other inputs that are observable or can be corroborated by observable market data for substantially the full term of the assets or liabilities.
Level 3 – Unobservable inputs in which there is little or no market data, which requires the Company to develop its own assumptions.
Financial instruments consist of cash and cash equivalents, restricted cash, marketable securities, accounts receivable and accounts payable. The Company’s investment portfolio consists of money market mutual funds and available for sale debt securities, and certificates of deposit, which are carried at fair value.
Accounts Receivable
See Note 2, Revenue, for the Company’s accounting policy on accounts receivable.
Property and Equipment, Net
Property and equipment, net, are stated at cost, less accumulated depreciation. Depreciation is calculated using the straight-line method over the estimated useful lives of the respective assets, which are generally three years. Leasehold improvements are amortized over the shorter of the remaining lease term or the estimated useful life. Expenditures for maintenance and repairs are expensed as incurred. Significant improvements that substantially enhance the life of an asset are capitalized.
Impairment of Long-Lived Assets
The Company evaluates its long-lived assets or asset groups for impairment whenever events indicate that the carrying value of an asset or asset group may not be recoverable based on expected future cash flows attributable to that asset or asset group. If the carrying amount of an asset or asset group exceeds estimated undiscounted future cash flows, then an impairment charge would be recognized based on the excess of the carrying amount of the asset or asset group over its fair value. Assets to be disposed of are reported at the lower of their carrying amount or fair value less costs to sell. In 2023, the Company recorded impairment charges of $1.5 million, primarily to its operating right-of-use (“ROU”) assets related to its headquarters lease. SeeNote 8 for additional information. There were no impairment charges recognized related to long-lived assets in 2022 2021 and 2020.
Deferred Offering Costs
Deferred offering costs consist primarily of accounting, legal and other fees incremental and directly related to the Company’s IPO. Upon closing of the IPO on February 5, 2021, the deferred offering costs of $5.6 million were reclassified into stockholders' equity (deficit) and recorded against the proceeds from the offering.
Revenue Recognition
Revenue is recognized when a customer obtains control of promised services. The amount of revenue recognized reflects the consideration that the Company expects to receive in exchange for these services. To achieve the core principle of this standard, the Company applies the following five steps:
1. Identification of the contract, or contracts, with the customer
The Company determines a contract with a customer to exist when the contract is approved, each party’s rights regarding the services to be transferred can be identified, the payment terms for the services can be identified, the customer has the ability and intent to pay, and the contract has commercial substance. At contract inception, the Company will evaluate whether two or more contracts should be combined and accounted for as a single contract and whether the combined or single contract includes more than one performance obligation. The Company applies judgment in determining the customer’s ability and intent to pay, which is based on a variety of factors, including the customer’s historical payment experience or, in the case of a new customer, credit and financial information pertaining to the customer.
2. Identification of the performance obligations in the contract
Performance obligations committed to in a contract are identified based on the services that will be transferred to the customer that are both capable of being distinct, whereby the customer can benefit from the service either on its own or together with other resources that are readily available from third parties or from the Company, and are distinct in the context of the contract, whereby the transfer of the services and the products is separately identifiable from other promises in the contract.
The Company’s performance obligations generally consist of access to its digital engagement platform and related support services, which, together, are considered one performance obligation. The Company’s customers do not have the ability to take possession of the Company’s software, and, through access to the Company’s platform, the Company provides a series of distinct software-based services that are satisfied over the term of the applicable subscription. Customers may also purchase incremental capacity to the Company’s digital engagement platform. The Company recognizes incremental access as a series of distinct software-based services that are satisfied over the remaining term of the applicable subscription. The Company’s Legacy offering includes performance obligations to provide customers with access to the Company’s platform for the duration of specific contracted events, and revenue is recognized primarily as events occur. Amounts related to the Company’s digital engagement platform and Legacy offering are recorded as subscription and other platform revenue in the consolidated statements of operations.
The Company also provides professional services, which includes consulting services, such as experience management, monitoring and production services, implementation services and premium support services. Professional services are generally considered distinct from the access to the Company’s digital engagement platform. Amounts are recorded as Professional Services revenue in the consolidated statements of operations.
The Company enters contracts with customers that regularly include promises to transfer multiple services through access to the Company’s platform. For arrangements with multiple services, the Company evaluates whether the individual services qualify as distinct performance obligations. In its assessment of whether a service is a distinct performance obligation, the Company determines whether the customer can benefit from the service on its own or with other readily available resources and whether the service is separately identifiable from other services in the contract. This evaluation requires the Company to assess the nature of each individual service offering and how the services are provided in the context of the contract, including whether the services are significantly integrated, highly interrelated or significantly modify each other, which may require judgment based on the facts and circumstances of the contract.
3. Determination of the transaction price
The transaction price is determined based on the consideration that the Company expects to be entitled in exchange for transferring services to the customer. Variable consideration is included in the transaction price if, in the Company’s judgment, it is probable that a significant future reversal of cumulative revenue recognized under the contract will not occur. The Company applies the practical expedient in paragraph 606-10-32-18 of Topic 606 and does not adjust the promised amount of consideration for the effects of a significant financing component for contracts that are one year or less, and none of our multi-year contracts contain a significant financing component. Revenue is recognized net of any taxes collected from customers (e.g., sales and other indirect taxes), which are subsequently remitted to governmental entities.
The Company’s digital engagement platform and related support services are typically warranted to perform in a professional manner that will comply with the terms of our subscription agreements. In addition, the Company includes service level commitments to its customers warranting certain levels of uptime reliability and performance and permitting those customers to receive credits in the event that the Company fails to meet those service levels. These credits represent a form of variable consideration. Historically, the Company has not experienced any significant incidents affecting the defined levels of reliability and performance as required by its subscription agreements. The Company has not provided any material refunds related to these agreements in the consolidated financial statements during the periods presented.
4. Allocation of the transaction price to the performance obligations in the contract
Contracts that contain multiple performance obligations require an allocation of the transaction price to each performance obligation based on each performance obligation’s relative standalone selling price (SSP). The SSP is the price at which the Company would sell a promised good or service separately to a customer. In instances where the Company does not sell or price a product or service separately, establishing SSP requires significant judgement. The Company estimates the SSP by considering available information, such as market conditions, internally approved pricing guidelines and the underlying cost of delivering the performance obligation.
5. Recognition of the revenue when, or as, a performance obligation is satisfied
Revenue is recognized at the time the related performance obligation is satisfied by transferring the control of the promised service to a customer. Revenue is recognized in an amount that reflects the consideration that the Company expects to receive in exchange for those services. The Company recognizes subscription revenue on a straight-line basis over the term of the applicable contract subscription period beginning on the date access to the Company’s platform is granted. The Company recognizes revenue from consulting services related to events in the period the event occurs and the service is delivered. The Company recognizes revenue from implementation services upon completion of the services.
The Company recognizes revenue from premium support offerings on a ratable basis over the applicable subscription term.
Costs to Obtain a Contract
The Company capitalizes sales commissions and associated payroll taxes paid to internal sales personnel and third-party referral fees that are incremental costs resulting from obtaining a contract with a customer. These costs are recorded as deferred contract acquisition costs on the consolidated balance sheets. The Company determines whether costs should be deferred based on its sales compensation plans and if the commissions are incremental and would not have occurred absent the customer contract.
Sales commissions paid upon the initial acquisition of a customer contract are amortized over an estimated period of benefit of five years as the Company specifically anticipates renewals of customer contracts and commissions paid on renewal contracts are not commensurate with commissions paid on new customer contracts. Sales commissions paid upon renewal of customer contracts are amortized over the contractual renewal term. Amortization is recognized on a straight-line basis commensurate with the pattern of revenue recognition. Sales commissions paid related to professional services are amortized over the expected service period. The Company determines the period of benefit for commissions paid for the acquisition of the initial customer contract by taking into consideration the initial estimated customer life and the technological life of its platform and related significant features. Amortization of deferred contract acquisition costs was $15.6 million, $15.7 million and $15.2 million for 2023, 2022 and $11.1 million for 2022, 2021, and 2020, respectively. Amortization of deferred contract acquisition costs is included in sales and marketing expense in the consolidated statements of operations.
The Company periodically reviews these deferred contract acquisition costs to determine whether events or changes in circumstances have occurred that could impact the period of benefit. The Company had no impairment losses relating to deferred contract acquisition costs during the periods presented.
Cost of Revenue
Subscription and Other Platform Cost of Revenue
Subscription and other platform cost of revenue primarily consists of costs related to hosting the Company’s platform and providing operating support services to its customers. These costs are related to the Company’s co-located data centers, personnel-related costs such as salaries, bonuses, stock-based compensation expense, benefits costs associated with our operations and support personnel, software license fees and allocated overhead.
Professional Services Cost of Revenue
Professional services cost of revenue consists primarily of personnel-related costs, including stock-based compensation, third-party consulting services and allocated overhead.
Research and Development
Research and development expenses primarily consist of personnel-related expenses, including stock-based compensation directly associated with the Company’s research and development employees, contractor costs related to third-party development and allocated overhead. Research and development costs are expensed as incurred.
Advertising Costs
Advertising costs are expensed as incurred in sales and marketing expense in the consolidated statements of operations and amounted to $7.8 million, $14.8 million and $17.3 million for 2023, 2022 and $9.2 million for 2022, 2021, and 2020, respectively.
Leases
The Company determines if an arrangement is a lease at inception. Lease liabilities are recognized at the lease commencement date based on the present value of the future lease payments over the lease term. The Company’s leases do not provide an implicit rate of return; therefore, the Company uses its incremental borrowing rate based on the information available at commencement date in determining the present value of lease payments. Right-of-use (ROU)ROU asset is determined based on the lease liability initially established and reduced for any prepaid lease payments and any lease incentives received. The lease term to calculate the ROU asset and related lease liability may include options to extend or terminate the lease when the Company is reasonably certain that it will exercise the option.
Variable lease payments are expensed as incurred and are not included in the ROU assets and lease liabilities. Leases with an initial term of 12 months or less are not recognized on the balance sheet as ROU assets but expensed on a straight-line basis over the lease term.
Lease expense is recognized on a straight-line basis over the lease term. The Company accounts for lease components and non-lease components as a single lease component for its new or modified office facility operating leases entered into on or after January 1, 2022.
Stock-Based Compensation
Stock-based compensation expense related to stock awards is measured based on the grant date fair value of the awards. For time based stock awards, the Company recognizes stock-based compensation expense on a straight-line basis over the requisite service period, which is generally three to four years for restricted stock unit awards and four years for option awards. For market performance-based stock awards, the Company recognizes stock-based compensation expense ratably over the requisite service period, which is generally three years.
The fair value of each restricted stock unit (RSU)(“RSU”) is based on the fair value of the underlying common stock on the grant date.
The fair value of each market performance-based restricted stock unit (PSU)(“PSU”) is estimated on the grant date using a Monte Carlo simulation which factors in the number of awards to be earned based on the achievement of the market condition. This model simulates the various stock price movements of the Company and the constituent company of the benchmark index using certain assumptions such as stock price volatility, risk-free interest rate and expected dividend yield. Compensation cost is recognized regardless of whether the market condition is ultimately satisfied.
The fair value of each option award and purchase right under the employee share purchase plan (ESPP)(“ESPP”) is estimated on the grant date using the Black-Scholes option pricing model. The Black-Scholes option pricing model requires the input of assumptions, including the risk-free interest rates, the expected term of the option, the expected volatility of the Company’s stock price and the expected dividend yield.
The assumptions used to determine the fair value of the PSU and option awards are highly subjective and represent management’s best estimates. These estimates involve inherent uncertainties and application of management’s judgement.
Effective January 1, 2021, the Company elected to account for forfeited awards as they occur. Prior to 2021, the Company estimated the number of awards expected to be forfeited at the time of grant and revised its estimates in subsequent periods if the actual forfeitures differed from the estimates.
Foreign Currency
The functional currencies of the Company’s foreign subsidiaries are each country’s local currency. Assets and liabilities of the subsidiaries are translated into U.S. dollars at exchange rates in effect at the reporting date. Amounts classified in stockholders’ deficit are translated at historical exchange rates. Revenue and expenses are translated at the average exchange rates during the period. The resulting translation adjustments are recorded in accumulated other comprehensive income (loss). Foreign currency transaction gains or losses, whether realized or unrealized, are reflected in the consolidated statements of operations within other (income) expense, net, and have not been materialnet. See Note 13 for all periods presented.additional information.
Income Taxes
The Company uses the asset and liability method of accounting for income taxes. Under this method, deferred tax assets and liabilities are determined based on the differences between the financial reporting and the tax bases of assets and liabilities and are measured using the enacted tax rates and laws that will be in effect when the differences are expected to reverse. The Company then assess the likelihood that the resulting deferred tax assets will be realized. A valuation allowance is provided when it is more likely than not that a deferred tax asset will not be fully realized. Due to our lack of earnings history, the net deferred tax assets in the U.S. have been fully offset by a valuation allowance.
The Company recognizes benefits of uncertain tax positions if it is more likely than not that such positions will be sustained upon examination based solely on their technical merits at the largest amount of benefit that is more likely than not to be realized upon the ultimate settlement. The Company’s policy is to recognize interest and penalties related to the underpayment of income taxes as a component of provision for income taxes.
Net Income (Loss) Per Share Attributable to Common Stockholders
The Company calculates net income (loss) per share attributable to common stock using the two-class method required for companies with participating securities. The Company considers its convertible preferred stock and unvested common stock to be participating securities as holders of such securities have non-forfeitable dividend rights in the event of the Company’s declaration of a dividend for shares of common stock. In periods when the Company is in a net loss position, the net loss attributable to common stockholders was not allocated to the convertible preferred stock and unvested common stock under the two-class method as these securities do not have a contractual obligation to share in the Company’s losses.
Distributed and undistributed earnings allocated to participating securities are subtracted from net income (loss) in determining net income (loss) attributable to common stockholders. Basic net income (loss) per share is computed by dividing net income (loss) attributable to common stockholders by the weighted-average number of shares of the Company’s common stock outstanding.
The diluted net income (loss) per share attributable to common stockholders is computed by giving effect to all dilutive securities. Diluted net income (loss) per share attributable to common stockholders is computed by dividing the resulting net income (loss) attributable to common stockholders by the weighted-average number of fully diluted shares of common stock outstanding. During the periods when there is a net loss attributable to common stockholders, potentially dilutive common stock equivalents have been excluded from the calculation of diluted net loss per share attributable to common stockholders as their effect is anti-dilutive.
Segment Information
The Company operates in one operating segment and one reportable segment. Operating segments are defined as components of an enterprise about which separate financial information is evaluated regularly by the chief operating decision maker, who is the Company’s Chief Executive Officer,chief executive officer, in deciding how to allocate resources and assessing performance. The Company’s chief operating decision maker allocates resources and assesses performance based upon consolidated financial information.
RecentRecently Adopted Accounting Standards
In October 2021, theJune 2016, Financial Accounting Standards Board (FASB)(“FASB”) issued ASU No. 2021-08, Business Combinations(Topic 805): Accounting for Contract Assets and Contract Liabilities from Contracts with Customers. ASU No. 2021-08 amended Topic 805 to require an acquirer to recognize and measure contract assets and liabilities acquired in a business combination to be in accordance with Topic 606, Revenue from Contracts with Customers. The Company early adopted this ASU on April 1, 2022. The adoption of this standard did not have a material impact on the Company’s consolidated financial statements.
In June 2016, FASB issued ASUStandards Update (ASU) No. 2016-13, Financial Instruments Topic 326: Credit Losses Measurement of Credit Losses on Financial Instruments, as amended, which requires an entity to measure all expected credit losses for financial instruments held at the reporting date based on historical experience, current conditions, and reasonable and supportable
forecasts utilizing a new impairment model known as the current expected credit loss (CECL)(“CECL”) model. This new standard also requires credit losses related to available for sale debt securities to be recorded as an allowance through net income rather than by reducing the carrying amount under the other-than-temporary-impairment model. The new guidance affects loans, debt securities, trade receivables, net investments in leases, off-balance-sheet credit exposures, reinsurance receivables, and any other financial assets not excluded from the scope that have the contractual right to receive cash. For public business entities, excluding entities eligible to be smaller reporting companies as defined by the SEC,Company adopted ASU No. 2016-13 on January 1, 2023 and the impact of the adoption was not material to the Company’s consolidated financial statements and related disclosures.
Recently Issued Accounting Standards
In December 2023, the FASB issued ASU No. 2023-09, Income Taxes (Topic 740): Improvements to Income Tax Disclosures, which expands income tax disclosure to require consistent categories and greater disaggregation of information in the rate reconciliation and income taxes paid. This ASU is effective forwith the annual periods in fiscal years beginning after December 15, 2019, and interim periods therein. For all other entities ASU No. 2016-13, is effective for fiscal years beginning after December 15, 2022, including interim periods within those fiscal year. The Company has elected to use the extended transitionCompany’s 2026 reporting period, that allows the Company to delay adoption of new or revised accounting pronouncements until such pronouncements are made applicable to private companies under the Jumpstart Our Business Startups Act of 2012.with early application permitted. The Company is currently evaluatingassessing the impact of adopting this standardthe requirements and does not expect the adoption of this ASU to have a material impact on its consolidated financial statements.statements and disclosures.
In February 2016,November 2023, the FASB issued ASU No. 2016-02,2023-07, LeasesSegment Reporting (Topic 842), as amended,280): Improvements to supersede existing guidance on accounting for leases in Topic 840, LeasesReportable Segment Disclosures. Topic 842 generally requires lessees to recognize operating and financing lease liabilities and corresponding right-of-use assets on the balance sheet and to provideThis ASU updates reportable segment disclosure requirements, primarily through enhanced disclosures surroundingabout significant segment expenses and information used to assess segment performance. This ASU is effective beginning with the amount, timingCompany’s 2024 annual reporting period. Early adoption is permitted and uncertainty of cash flows arising from leasing arrangements.
the amendments must be applied retrospectively to all prior periods presented. The Company adoptedis currently assessing the new lease standard effective January 1, 2022 on a modified retrospective basis using the effective date transition method, which applied the provisionsimpact of the new guidance at the effective date without adjusting the comparative periods presented. Onrequirements and does not expect the adoption date, the Company recognizedof this ASU to have a material impact on its consolidated balance sheets $7.2 million of additional right-of-use assets, $9.6 million additional lease liabilities,financial statements and derecognized existing deferred rent and lease incentives totaling $2.4 million. The Company’s accounting for finance leases remained substantially unchanged.
The Company elected a number of the practical expedients permitted under the transition guidance within the new standard. This included the election to apply the practical expedient package upon transition, which comprised the following:
•disclosures.The Company did not reassess whether expired or existing contracts are or contain a lease;
•The Company did not reassess the classification of existing leases; and
•The Company did not reassess the accounting treatment for initial direct costs.
The Company also elected to apply the hindsight practical expedient which allows the Company to use hindsight in determining the lease term.
In addition, the Company elected the practical expedient related to short-term leases, which allows the Company not to recognize a ROU asset and lease liability for leases with an initial expected term of 12 months or less. The Company also elected to account for lease and non-lease components as a single lease component for operating facility leases.
Other than described above, the adoption of the new lease standard did not have any other material impacts on the Company’s consolidated financial statements. Additionally, the adoption of ASU 2016-02 has no impact on the Company’s debt-covenant compliance under its current revolving credit facility. See Note 8 for additional disclosure on leases.
Note 2. Revenue
Disaggregation of Revenue
The following table depicts the disaggregation of revenue by geographic region based on the shipping address of customers (in thousands):
| | | | | Year Ended December 31, | |
| | | Year Ended December 31, |
| | | Year Ended December 31, | |
| | | 2022 | | 2021 | | 2020 |
| | | Year Ended December 31, | |
| | | | | 2023 | | | | | | | 2023 | | 2022 | | 2021 |
| United States | United States | | $ | 144,869 | | | $ | 150,579 | | | $ | 119,897 | |
| EMEA | EMEA | | 31,309 | | | 36,788 | | | 26,197 | |
| Other | Other | | 14,694 | | | 16,246 | | | 10,847 | |
| Total revenue | Total revenue | | $ | 190,872 | | | $ | 203,613 | | | $ | 156,941 | |
|
The following table summarizes the foreign countries which contributed 10% or more of the total revenue (in thousands):
| | | | | | | | | | | | | | | | | | | | | |
| | | | | | | | | |
| | | Year Ended December 31, |
| | | | | 2022 | | 2021 | | 2020 |
| United Kingdom | | | | | * | | 10 | % | | * |
| | | | | | | | | | | | | | | | | |
| | | | | |
| Year Ended December 31, |
| 2023 | | 2022 | | 2021 |
| United Kingdom | * | | * | | 10% |
| | | | | | | | | | | |
| * | Represent less than 10% of total revenue |
No single customer accounted for 10% or more of the total revenue during 2023, 2022 2021 and 2020.2021. Additionally, no single customer accounted for 10% or more of accounts receivable as of December 31, 20222023 and 2021.2022.
Contract Balances
Accounts receivable: The Company records accounts receivable when the Company has a contractual right to consideration. In some arrangements, a right to consideration for the Company’s performance under the customer contract may occur before invoicing to the customer, resulting in an unbilled receivable. As of December 31, 20222023 and 2021,2022, unbilled receivables were included within accounts receivable, net of allowance for doubtful accounts and billing reserves on the consolidated balance sheets and were not material.
Contract assets: The Company records a contract asset when the Company has satisfied a performance obligation but does not yet have an unconditional right to consideration. Contract assets are included in prepaid expenses and other current assets in the consolidated balance sheets and were not material as of December 31, 20222023 and 2021.2022.
Contract liabilities: The Company defers its revenue when the Company has the right to invoice in advance of performance under a customer contract. The current portion of deferred revenue balances is recognized during the following 12-month period and the remaining portion is recorded as noncurrent, which is included in other long-term liabilities on the consolidated balance sheet. The amount of revenue recognized in 20222023 that was included in deferred revenue at the beginning of the period was $92.0$78.5 million.
Remaining Performance Obligations
The terms of the Company’s subscription agreements are primarily annual and, to a lesser extent, multi-year. The Company may bill for the full term in advance or on an annual, quarterly or monthly basis, depending on the terms of the agreement. As of December 31, 2022,2023, the aggregate amount of the transaction price allocated to remaining performance obligations was $146.2$134.4 million, which consists of both billed consideration in the amount of $84.2$75.0 million and unbilled consideration in the amount of $62.0$59.4 million that the Company expects to recognize as revenue. As of December 31, 2022,2023, the Company expects to recognize 78%77% of its remaining performance obligations as revenue over the subsequent 12 months and the remainder thereafter.
Note 3. Marketable Securities
Marketable securities consisted of the following as of the periods presented (in thousands):
| | | December 31, 2023 | |
| | December 31, 2022 | |
| December 31, 2023 | |
| | Amortized Cost | | Gross Unrealized Gains | | Gross Unrealized Losses | | Fair Value | |
| December 31, 2023 | |
| Amortized Cost | |
| Amortized Cost | |
| Amortized Cost | |
| | Marketable Securities | | | | | | | | | |
| Marketable securities | |
| | Marketable securities | |
| | Marketable securities | |
| U.S. Treasury securities | |
| U.S. Treasury securities | |
| U.S. Treasury securities | U.S. Treasury securities | | $ | 219,895 | | | $ | 10 | | | $ | (801) | | | $ | 219,104 | | |
| U.S. Agency securities | U.S. Agency securities | | 19,247 | | | 19 | | | (2) | | | 19,264 | | |
| Certificates of deposit | | 26,624 | | | 4 | | | (119) | | | 26,509 | | |
| U.S. Agency securities | |
| U.S. Agency securities | |
| | Corporate debt securities | |
| | Corporate debt securities | |
| | Corporate debt securities | Corporate debt securities | | 13,934 | | | — | | | (86) | | | 13,848 | | |
| Commercial paper | Commercial paper | | 22,433 | | | 10 | | | (43) | | | 22,400 | | |
| | Commercial paper | |
| Commercial paper | |
| Total marketable securities | |
| Total marketable securities | |
| Total marketable securities | Total marketable securities | | $ | 302,133 | | | $ | 43 | | | $ | (1,051) | | | $ | 301,125 | | |
|
| | December 31, 2022 | | | December 31, 2022 |
| Amortized Cost | | | Amortized Cost | | Gross Unrealized Gains | | Gross Unrealized Losses | | Fair Value |
| | December 31, 2021 |
| Amortized Cost | | Gross Unrealized Gains | | Gross Unrealized Losses | | Fair Value |
| | Marketable Securities | | | | | | | | |
| Marketable securities | |
| Marketable securities | |
| Marketable securities | |
| U.S. Treasury securities | U.S. Treasury securities | | $ | 157,681 | | | $ | — | | | $ | (404) | | | $ | 157,277 | |
| U.S. Treasury securities | |
| U.S. Treasury securities | |
| U.S. Agency securities | |
| Certificates of deposit | Certificates of deposit | | 6,495 | | | — | | | (5) | | | 6,490 | |
| Corporate debt securities | Corporate debt securities | | 36,422 | | | — | | | (95) | | | 36,327 | |
| Commercial paper | Commercial paper | | 11,624 | | | 2 | | | (6) | | | 11,620 | |
| Asset-backed securities | | 5,901 | | | 1 | | | (7) | | | 5,895 | |
| Total marketable securities | Total marketable securities | | $ | 218,123 | | | $ | 3 | | | $ | (517) | | | $ | 217,609 | |
|
The Company’s marketable securities have been classified as available for sale. All available for sale debt securities are available for use in current operations. Accordingly, they have been classified as current.
Marketable securities that have been in a continuous unrealized loss position consisted of the following as of the periods presented (in thousands):
| | December 31, 2022 |
| Less Than 12 Months | | 12 Months or More | | Total |
| Fair Value | | Gross Unrealized Loss | | Fair Value | | Gross Unrealized Loss | | Fair Value | | Gross Unrealized Loss |
| December 31, 2023 | | | December 31, 2023 |
| Less Than 12 Months | | | Less Than 12 Months | | 12 Months or More | | Total |
| Fair Value | | | Fair Value | | Gross Unrealized Loss | | Fair Value | | Gross Unrealized Loss | | Fair Value | | Gross Unrealized Loss |
| U.S. Treasury securities | U.S. Treasury securities | | $ | 116,161 | | | $ | (151) | | | $ | 77,173 | | | $ | (650) | | | $ | 193,334 | | | $ | (801) | |
| U.S. Agency securities | U.S. Agency securities | | 3,197 | | | (2) | | | — | | | — | | | 3,197 | | | (2) | |
| Certificates of deposit | | 22,402 | | | (119) | | | — | | | — | | | 22,402 | | | (119) | |
| | Corporate debt securities | |
| Corporate debt securities | |
| Corporate debt securities | Corporate debt securities | | 4,253 | | | (13) | | | 8,345 | | | (73) | | | 12,598 | | | (86) | |
| Commercial paper | Commercial paper | | 12,853 | | | (43) | | | — | | | — | | | 12,853 | | | (43) | |
| | Total | Total | | $ | 158,866 | | | $ | (328) | | | $ | 85,518 | | | $ | (723) | | | $ | 244,384 | | | $ | (1,051) | |
| Total | |
| Total | |
|
| | December 31, 2021 |
| Less Than 12 Months | | 12 Months or More | | Total |
| Fair Value | | Gross Unrealized Loss | | Fair Value | | Gross Unrealized Loss | | Fair Value | | Gross Unrealized Loss |
| December 31, 2022 | | | December 31, 2022 |
| Less Than 12 Months | | | Less Than 12 Months | | 12 Months or More | | Total |
| Fair Value | | | Fair Value | | Gross Unrealized Loss | | Fair Value | | Gross Unrealized Loss | | Fair Value | | Gross Unrealized Loss |
| U.S. Treasury securities | U.S. Treasury securities | | $ | 143,590 | | | $ | (404) | | | $ | — | | | $ | — | | | $ | 143,590 | | | $ | (404) | |
| U.S. Agency securities | |
| Certificates of deposit | Certificates of deposit | | 6,490 | | | (5) | | | — | | | — | | | 6,490 | | | (5) | |
| Corporate debt securities | Corporate debt securities | | 36,327 | | | (95) | | | — | | | — | | | 36,327 | | | (95) | |
| Commercial paper | Commercial paper | | 6,984 | | | (6) | | | — | | | — | | | 6,984 | | | (6) | |
| Asset-backed securities | | 4,967 | | | (7) | | | — | | | — | | | 4,967 | | | (7) | |
| Total | Total | | $ | 198,358 | | | $ | (517) | | | $ | — | | | $ | — | | | $ | 198,358 | | | $ | (517) | |
|
The Company reviews the individual securities that have unrealized losses on a regular basis to evaluateperiodically evaluates whether any security has experienced other-than-temporary declinecredit-related declines in fair value below amortized cost.value. The Company evaluates, among other factors, whether the Company has the intentiondid not recognize any credit loss related to sell any of these marketableits available for sales debt securities and whether it is more likely than not that the Company will be required to sell any securities before recovery of the amortized cost basis. Since the Company has the ability to hold its investments until maturity, and the decline in fair value was not due to any credit-related factor, no decline was deemed to be other-than-temporary.during 2023, 2022.or 2021.
The Company had no realized gains or losses from marketable securities that were reclassified out of accumulated other comprehensive income (loss) in 2021 and 2020. The amount of realized gains or losses from marketable securities that were reclassified out from accumulated other comprehensive lossincome (loss) to other (income) expense, net was based on specific identification and such amount was immaterial in 2022 was immaterial.2023 and 2022. The Company did not have such a transfer in 2021.
The following summarizes the remaining contractual maturities of the Company’s marketable securities as of December 31, 2022 (in2023 (in thousands):
| | | | | |
| Fair Value |
| One year or less | $ | 301,125103,843 | |
Over one year through fivethree years | 41,654 | | — |
| Total marketable securities | $ | 301,125145,497 | |
| |
Note 4. Fair Value Measurement
The following tables summarize the Company’s financial instruments recorded at fair value on a recurring basis by level within the fair value hierarchy as of the periods presented (in thousands):
| | December 31, 2022 |
| Level 1 | | Level 2 | | Level 3 | | Total |
| Cash and cash equivalent | | | | | | | |
| December 31, 2023 | | | December 31, 2023 |
| Level 1 | | | Level 1 | | Level 2 | | Level 3 | | Total |
| Cash and cash equivalents | |
| Cash equivalents - money market mutual funds | |
| Cash equivalents - money market mutual funds | |
| Cash equivalents - money market mutual funds | Cash equivalents - money market mutual funds | $ | 5,608 | | | $ | — | | | $ | — | | | $ | 5,608 | |
| | Marketable Securities | |
| Marketable securities | |
| Marketable securities | |
| Marketable securities | |
| U.S. Treasury securities | |
| U.S. Treasury securities | |
| U.S. Treasury securities | U.S. Treasury securities | — | | | 219,104 | | | — | | | 219,104 | |
| U.S. Agency securities | U.S. Agency securities | — | | | 19,264 | | | — | | | 19,264 | |
| Certificates of deposit | — | | | 26,509 | | | — | | | 26,509 | |
| | Corporate debt securities | |
| Corporate debt securities | |
| Corporate debt securities | Corporate debt securities | — | | | 13,848 | | | — | | | 13,848 | |
| Commercial paper | Commercial paper | — | | | 22,400 | | | — | | | 22,400 | |
| | Total cash equivalents and marketable securities | Total cash equivalents and marketable securities | $ | 5,608 | | | $ | 301,125 | | | $ | — | | | $ | 306,733 | |
| Total cash equivalents and marketable securities | |
| Total cash equivalents and marketable securities | |
|
| | December 31, 2021 |
| Level 1 | | Level 2 | | Level 3 | | Total |
| Cash and cash equivalent | | | | | | | |
| December 31, 2022 | | | December 31, 2022 |
| Level 1 | | | Level 1 | | Level 2 | | Level 3 | | Total |
| Cash and cash equivalents | |
| Cash equivalents - money market mutual funds | Cash equivalents - money market mutual funds | $ | 151,079 | | | $ | — | | | $ | — | | | $ | 151,079 | |
| Marketable Securities | |
| Cash equivalents - money market mutual funds | |
| Cash equivalents - money market mutual funds | |
| Marketable securities | |
| U.S. Treasury securities | U.S. Treasury securities | — | | | 157,277 | | | — | | | 157,277 | |
| U.S. Treasury securities | |
| U.S. Treasury securities | |
| U.S. Agency securities | |
| Certificates of deposit | Certificates of deposit | — | | | 6,490 | | | — | | | 6,490 | |
| Corporate debt securities | Corporate debt securities | — | | | 36,327 | | | — | | | 36,327 | |
| Commercial paper | Commercial paper | — | | | 11,620 | | | — | | | 11,620 | |
| Asset-backed securities | — | | | 5,895 | | | — | | | 5,895 | |
| Total cash equivalents and marketable securities | Total cash equivalents and marketable securities | $ | 151,079 | | | $ | 217,609 | | | $ | — | | | $ | 368,688 | |
|
As of December 31, 20222023 and 2021,2022, the Company classified its cash equivalents within level 1 of the fair value hierarchy because they are valued using quoted market prices. The Company classified its marketable securities within level 2 of the fair value hierarchy because they are valued using inputs other than quoted prices that are directly or indirectly observable in the market, including readily available pricing sources for the identical underlying security, which may not be actively traded.
Note 5. Balance Sheets Components
Allowance for Doubtful AccountAccounts and Billing ReserveReserves
The following table presents the changes in the allowance for doubtful accounts as of the periods presented (in thousands):
| | Year Ended December 31, |
| 2022 | | 2021 | | 2020 |
| Year Ended December 31, | | | Year Ended December 31, |
| 2023 | | | 2023 | | 2022 | | 2021 |
| Balance, beginning of period | Balance, beginning of period | $ | 1,572 | | | $ | 1,139 | | | $ | 514 | |
| Charges to general and administrative expenses | Charges to general and administrative expenses | 1,229 | | | 1,163 | | | 1,087 | |
| Write-offs and other adjustments | Write-offs and other adjustments | (901) | | | (730) | | | (462) | |
| Balance, end of period | Balance, end of period | $ | 1,900 | | | $ | 1,572 | | | $ | 1,139 | |
|
In addition to the allowance for doubtful accounts, the Company maintains a billing reserve which represents potential billing adjustments that is recorded as a reduction of revenue. The Company’s billing reserve is based on known adjustments and an estimate using a percentage of revenue based on historical trends and experience.
The following table presents the changes in billing reserves as of the periods presented (in thousands):
| | Year Ended December 31, |
| 2022 | | 2021 | | 2020 |
| Year Ended December 31, | | | Year Ended December 31, |
| 2023 | | | 2023 | | 2022 | | 2021 |
| Balance, beginning of period | Balance, beginning of period | $ | 1,105 | | | $ | 1,034 | | | $ | 398 | |
| Charges to revenue | Charges to revenue | 689 | | | 1,780 | | | 1,922 | |
| Write-offs and other adjustments | Write-offs and other adjustments | (764) | | | (1,709) | | | (1,286) | |
| Balance, end of period | Balance, end of period | $ | 1,030 | | | $ | 1,105 | | | $ | 1,034 | |
|
Property and Equipment, Net
Property and equipment, net consisted of the following as of the periods presented (in thousands):
| | | | December 31, 2022 | | December 31, 2021 | | December 31, 2023 | | December 31, 2022 |
Computer, equipment and software(1) | Computer, equipment and software(1) | $ | 31,243 | | | $ | 28,227 | |
| Furniture and fixtures | Furniture and fixtures | 1,071 | | | 1,118 | |
| Leasehold improvements | Leasehold improvements | 3,606 | | | 3,776 | |
| Property and equipment, gross | Property and equipment, gross | 35,920 | | | 33,121 | |
Less: Accumulated depreciation and amortization(2) | Less: Accumulated depreciation and amortization(2) | (28,708) | | | (24,341) | |
| Property and equipment, net | Property and equipment, net | $ | 7,212 | | | $ | 8,780 | |
|
(1)IncludesIncludes assets recorded under finance leases of $1.7 million and $5.3 million as of December 31, 20222023 and December 31, 2021.2022, respectively.
(2)IncludesIncludes amount for assets recorded under finance leases of $4.0$1.6 million and $2.2$4.0 million as of December 31, 20222023 and December 31, 2021,2022, respectively.
Depreciation and amortization expense for property and equipment was $4.8 million, $5.0 million and $4.6 million for 2023, 2022 and $3.0 million for 2022, 2021, and 2020, respectively.
The following table presents the property and equipment, net of depreciation and amortization, by geographic region as of the periods presented (in thousands):
| | | | December 31, 2022 | | December 31, 2021 | | December 31, 2023 | | December 31, 2022 |
| United States | United States | $ | 6,449 | | | $ | 7,899 | |
| EMEA | EMEA | 722 | | | 816 | |
| Other | Other | 41 | | | 65 | |
| Total property and equipment, net | Total property and equipment, net | $ | 7,212 | | | $ | 8,780 | |
|
Accrued and Other Current Liabilities
Accrued and other current liabilities consisted of the following as of the periods presented (in thousands):
| | | | December 31, 2022 | | December 31, 2021 | | December 31, 2023 | | December 31, 2022 |
| Accrued compensation and benefits | Accrued compensation and benefits | $ | 5,390 | | | $ | 6,339 | |
| Accrued bonus and commissions | Accrued bonus and commissions | 6,814 | | | 6,555 | |
| Other | Other | 6,261 | | | 6,117 | |
| Accrued and other current liabilities | Accrued and other current liabilities | $ | 18,465 | | | $ | 19,011 | |
|
Note 6.6. Business Combination
In April 2022, the Company acquired Vibbio AS (Vibbio)(“Vibbio”), a privately-held cloud video software company in Norway, for approximately $3.0 million in cash. The integration of Vibbio’s video capabilities across the ON24 platform is intended to allow customers to produce video content that creates more engagement, generates first-party data, and drives further personalization.
The purchase consideration was primarily allocated to developed technology intangible asset with an estimated fair value of $2.7 million at the acquisition date, which was valued using the cost to recreate method. The fair value of the remaining acquired tangible net assets was immaterial. The goodwill that was recorded represents the excess of the purchase consideration over the assets acquired and liabilities assumed relating to the acquisition and is immaterial.
The Company has not separately presented pro forma results reflecting the acquisition of Vibbio as the impacts were not material to the consolidated financial statements.
Note 7.7. Intangible Assets
The Company’s acquired intangible asset subject to amortization as of the periods presented was as follows (in thousands):
| | December 31, 2022 |
| Gross Carrying
Amount | | Accumulated Amortization | | Net Carrying
Amount |
| December 31, 2023 | | | December 31, 2023 |
| Gross Carrying
Amount | | | Gross Carrying
Amount | | Accumulated Amortization | | Net Carrying
Amount |
| Developed technology | Developed technology | | $ | 2,700 | | | $ | (434) | | | $ | 2,266 | |
| Effect of foreign currency translation | Effect of foreign currency translation | | (276) | | | (11) | | | (287) | |
| Total | Total | | $ | 2,424 | | | $ | (445) | | | $ | 1,979 | |
|
As of December 31, 2021, the Company had no intangible assets. | | | | | | | | | | | | | | | | | |
| December 31, 2022 |
| Gross Carrying
Amount | | Accumulated Amortization | | Net Carrying
Amount |
| Developed technology | $ | 2,700 | | | $ | (434) | | | $ | 2,266 | |
| Effect of foreign currency translation | (276) | | | (11) | | | (287) | |
| Total | $ | 2,424 | | | $ | (445) | | | $ | 1,979 | |
| | | | | |
The intangible asset is amortized on a straight-line basis over its useful life of 4 years. As of December 31, 2022,2023, the intangible asset had a remaining amortization period of 3.32.3 years.
The amortization expense for 2022 was $0.6 million, $0.4 million and nil for 2023, 2022 and 2021, respectively. The amortization expense was included in research and development in the consolidated statements of operations as the acquired technology will beis used to enhance our existing product capabilities.
The estimated future amortization expense for the intangible asset is as follows (in thousands):
| | 2023 | | $ | 606 | |
| 2024 | 2024 | | 606 | |
| 2025 | 2025 | | 606 | |
| 2026 | 2026 | | 161 | |
| Total | Total | | $ | 1,979 | |
|
Note 8. Leases
The Company entered into operating leases primarily for office facilities and finance leases primarily for computer and network equipment purchases. These leases have terms generally ranging from 3 years to 12 years. The Company’s lease agreements generally do not contain any material variable lease payments, residual value guarantees or restrictive covenants.
The Company ceased to use a portion of its headquarters space since the second quarter of 2023,and has been actively marketing such space for sublease. In 2023, the Company recorded impairment charges of $1.5 million on its headquarters lease, primarily on the operating ROU assets due to vacating the sublease space. See Note 17 for additional information.
The balance sheet classification of the Company’s right-of-use assets and lease liabilities as of the periodperiods presented was as follows (in thousands):
| | | | | | | | | | | | | | |
Leases | | Classification | | December 31, 2022 |
Non-Current Assets | | | | |
Finance lease assets | | Property, plant and equipment, net | | $ | 1,308 | |
Operating lease assets | | Operating right-of-use asset | | 5,606 | |
Total leased assets | | | | $ | 6,914 | |
| | | | |
Current Liabilities | | | | |
Finance | | Finance lease liabilities, current | | $ | 1,554 | |
Operating | | Operating lease liabilities, current | | 2,648 | |
| | | | |
Non-Current Liabilities | | | | |
Finance | | Finance lease liabilities | | 91 | |
Operating | | Operating lease liabilities | | 5,040 | |
Total leased liabilities | | | | $ | 9,333 | |
| | | | |
| | | | | | | | | | | | | | | | | | | | |
| Leases | | Classification | | December 31, 2023 | | December 31, 2022 |
| Non-Current Assets | | | | | | |
| Finance lease assets | | Property, plant and equipment, net | | $ | 67 | | | $ | 1,308 | |
| Operating lease assets | | Operating right-of-use asset | | 2,981 | | | 5,606 | |
| Total lease assets | | | | $ | 3,048 | | | $ | 6,914 | |
| | | | | | |
| Current Liabilities | | | | | | |
| Finance | | Finance lease liabilities, current | | $ | 127 | | | $ | 1,554 | |
| Operating | | Operating lease liabilities, current | | 2,779 | | | 2,648 | |
| | | | | | |
| Non-Current Liabilities | | | | | | |
| Finance | | Other long-term liabilities | | — | | | 91 | |
| Operating | | Operating lease liabilities | | 2,483 | | | 5,040 | |
| Total lease liabilities | | | | $ | 5,389 | | | $ | 9,333 | |
| | | | | | |
The components of lease cost were as follows (in thousands):
| | | | | | | | | | | | | | | | | | | | | | |
| | | | | | Year Ended December 31, |
| Lease Cost | | Classification | | | | 2023 | | 2022 |
| Finance lease cost | | | | | | | | |
| Amortization of right-of-use assets | | Depreciation and amortization | | | | $ | 547 | | | $ | 1,751 | |
| Interest on finance lease liabilities | | Interest expense | | | | 35 | | | 115 | |
Operating lease cost(1) | | Selling, general and administrative expenses | | | | 1,955 | | | 2,288 | |
| Variable lease cost | | Selling, general and administrative expenses | | | | 483 | | | 380 | |
| Total lease cost | | | | | | $ | 3,020 | | | $ | 4,534 | |
| | | | | | | | |
| | | | | | | | | | | | | | | | |
| Lease Cost | Classification | | | | Year Ended
December 31, 2022 |
Finance lease cost | | | | | | |
Amortization of right-of-use assets | | Depreciation and amortization | | | | $ | 1,751 | |
Interest on finance lease liabilities | | Interest expense | | | | 115 | |
| | | | | | |
Operating lease cost | | Selling, general and administrative expenses | | | | 2,288 | |
Variable lease cost | | Selling, general and administrative expenses | | | | 380 | |
Total lease cost | | | | | | $ | 4,534 | |
| | | | | | |
(1)Operating lease cost does not include the impairment charges of $1.2 million incurred in 2023 on the operating ROU assets related to the Company’s headquarters lease.
The undiscounted future lease payments under the lease liabilities as of December 31, 20222023 were as follows (in thousands):
| | Maturity of Lease Liabilities | Maturity of Lease Liabilities | Finance Lease | | Operating Lease | Maturity of Lease Liabilities | Finance Lease | | Operating Lease |
| 2023 | $ | 1,605 | | | $ | 2,887 | |
| | 2024 | |
| 2024 | |
| 2024 | 2024 | 80 | | | 2,837 | |
| 2025 | 2025 | — | | | 2,254 | |
| 2026 | 2026 | — | | | 101 | |
| 2027 | 2027 | — | | | 35 | |
| | Total lease payments | Total lease payments | 1,685 | | | 8,114 | |
| Total lease payments | |
| Total lease payments | |
| Less imputed interest | Less imputed interest | (40) | | | (426) | |
| Present value of lease liabilities | Present value of lease liabilities | $ | 1,645 | | | $ | 7,688 | |
|
The undiscounted future lease payments as of December 31, 2021 prior to the Company’s adoption of the new lease standard were as follows (in thousands):
| | | | | | | | | | | |
| Finance Lease | | Operating Lease |
| 2022 | $ | 1,888 | | | $ | 2,633 | |
| 2023 | 1,607 | | | 2,844 | |
| 2024 | 80 | | | 2,789 | |
| 2025 | — | | | 2,272 | |
| Total payments | 3,575 | | | 10,538 | |
| Less: Amount representing interest | (159) | | | — | |
| Total payments, net of interest | $ | 3,416 | | | $ | 10,538 | |
| | | |
Under ASC 840, the previous lease standard, rent expense, including common area maintenance charges, related to operating leases was $2.9 million and $2.8 million for 2021and 2020, respectively.
The weighted-average lease term and discount rate as of December 31, 2022the periods presented were as follows:
| | Finance Lease | | Operating Lease |
| | | December 31, 2023 | |
| | | December 31, 2023 | |
| | | December 31, 2023 | |
| | | | | Finance Lease | | | | | | | Finance Lease | | Operating Lease |
| Weighted-average remaining lease term | Weighted-average remaining lease term | 1.0 year | | 2.8 years | Weighted-average remaining lease term | | | | | 0.3 years | | 1.9 years |
| Weighted-average discount rate | Weighted-average discount rate | 4.39 | % | | 3.91 | % | Weighted-average discount rate | | | | | 3.34 | % | | 4.13 | % |
| | | | | | | | | | | | | | | |
| | | December 31, 2022 |
| | | | | Finance Lease | | Operating Lease |
| Weighted-average remaining lease term | | | | | 1.0 year | | 2.8 years |
| Weighted-average discount rate | | | | | 4.39 | % | | 3.91 | % |
Supplemental cash flow information was as follows (in thousands):
| | | | | |
| Year Ended
December 31, 2022 |
Cash paid for amounts included in the measurement of lease liabilities: | |
Operating cash flows used by operating leases | $ | 2,521 | |
Financing cash used by finance leases | 1,832 | |
Right of use assets obtained in exchange for new lease liabilities: | |
Operating leases - adoption | 7,246 | |
Operating leases - year ended December 31, 2022 | 357 | |
Finance leases | — | |
| | | | | | | | | | | |
| Year Ended December 31, |
| 2023 | | 2022 |
| Cash paid for amounts included in the measurement of lease liabilities: | | | |
| Operating cash flows used by operating leases | $ | 2,933 | | | $ | 2,521 | |
| Financing cash used by finance leases | 1,533 | | | 1,832 | |
| Right-of-use assets obtained in exchange for new lease liabilities: | | | |
| Operating leases - adoption | — | | | 7,246 | |
| Operating leases | 224 | | | 357 | |
| Finance leases | — | | | — | |
Note 9.9. Credit Facility
In September 2021, the Company amended its revolving line of credit with a financial institution effective August 2021, which increased the Company's borrowing capacity to a maximum of $50.0 million with a letter of credit sublimit of $4.0 million and a credit card sublimit of $1.0 million. The amendment allows the Company to borrow up to $50.0 million if the Company maintains at least $100.0 million on deposit at the institution. If such deposit is less than $100.0 million, the Company may borrow up to the lesser of $50.0 million or an amount determined by the Company's trailing five months of recurring revenue, annualized renewal rate and annualized monthly churn rate, as defined by the agreement. As of December 31, 2022,2023, the Company had not drawn down on its line of credit and has a borrowing capacity of $50.0 million. The terms of the agreement permit voluntary prepayment without premium or penalty. The revolving credit facility matures in August 2024 and is secured by substantially all of the Company’s assets. The outstanding principal balance on the revolving line of credit, if any, is due at maturity. The Company is required to pay quarterly in arrears a commitment fee of 0.15% per annum on the undrawn portion available under the revolving line of credit. As of December 31, 2022,2023, the Company had an outstanding standby letter of credit of $1.2 million as a guarantee for a leased space.
Interest on the revolving credit facility is payable monthly in arrears at a rate equal to the lender’s prime referenced rate as defined in the agreement. Prior to this amendment, interest on the revolving line of credit was the prime rate, as published by the Wall Street Journal (Prime Rate), plus 0.75% effective July 31, 2020, and Prime Rate plus 0.50% prior to July 31, 2020. The prime referenced rate was 8.50% as of December 31, 2023 and 7.50% as of December 31, 2022 and 3.25% as of December 31, 2021.
The revolving credit facility is subject to certain restrictions and financial covenants, including the requirement of maintaining a minimum debt to EBITDA ratio when the Company’s current portion of the total borrowing exceeds $5.0 million and the Company fails to maintain $100.0 million in deposits. As of December 31, 2023, the Company was not subject to the financial covenant as the Company had not drawn down from its line of credit. In addition, the revolving line of credit agreement restricts the Company from paying dividends without prior approval from the financing institution. TheIn April 2023, the Company was notfurther amended its revolving line of credit to allow for certain transactions including payment of dividends and share repurchases from open market purchases or through an accelerated share repurchase program, subject to the financial covenants ascertain terms and conditions.
Note 10.10. Commitment and Contingencies
Purchase Obligations
TheAs of December 31, 2023, the Company has non-cancelable unrecognized purchase commitments of $3.5 million as of December 31, 2022, primarily related to software license fees and co-location facilities and services as follows (in thousands):
| | | | | | | | |
| Year Ended December 31, | | Purchase Obligations(1) |
| 2024 | | $ | 2,259 | |
| 2025 | | 1,096 | |
| 2026 | | 115 | |
| 2027 | | 115 | |
| Total | | $ | 3,585 | |
| | |
(1)Excludes non-cancelable recognized purchase commitments related to software license fees of which $3.2$0.8 million is expected to be paidthat are included in 2023accrued liabilities and $0.3 millionother long-term liabilities in 2024.the consolidated balance sheets
Contingencies
The Company has agreed to indemnify its directors and executive officers for costs associated with any fees, expenses, judgments, fines, and settlement amounts incurred by any of these persons in any action or proceeding to which any of those persons is, or is threatened to be, made a party by reason of the person’s service as a director or officer, including any action by the Company, arising out of that person’s services as the Company’s director or officer or that person’s services provided to any other company or enterprise at the Company’s request. The Company maintains director and officer insurance coverage that may enable the Company to recover a portion of any future amounts paid.
FASB ASC 450-20, Contingencies, sets forth the rules for accounting for uncertain tax positions for taxes not based on income. When a loss contingency exists, the likelihood of the incurrence of the liability can range from probable to remote. The Company believes it is reasonably possible that a loss will result from the sales and use tax assessments in the range of zero to $0.4 million. The Company has not recorded an accrual as of December 31, 20222023 and 2021.2022.
Legal Proceedings
The Company, its Chief Executive Officer, its Chief Financial Officer, certain current and former members of its Board of Directors and the underwriters that participated in the Company’s IPO are named as defendants in a consolidated putative class action, captioned In re ON24, Inc. Securities Litigation, 4:21-cv-08578-YGR (filed in November 2021), that is currently pending in the United States District Court for the Northern District of California. The consolidated complaint purports to assert claims under Sections 11 and 15 of the Securities Act of 1933 on behalf of all persons and entities that purchased, or otherwise acquired, the Company’s common stock issued in connection with the Company’s IPO. The complaint alleges that the Company’s registration statement and prospectus contained untrue statements of material fact and/or omitted material facts about ON24’s growth and customer base. Plaintiff seeks, among other things, an award of damages and attorneys’ fees and costs. DefendantsThe defendants filed a motion to dismiss the complaint in May 2022, which is currently pending.the court granted with leave to amend in July 2023.Plaintiff filed its amended complaint in September 2023,and the defendants filed a motion to dismiss the amended complaint in October 2023. In March 2024, the court granted the defendants’ motion to dismiss with prejudice. The Company believes the allegations in the consolidatedamended complaint are without merit. The Company is unable to reasonably estimate a possible loss or range of possible loss, if any, arising from this matter at this early stage. Accordingly, no accrued litigation expense has been recorded in the accompanying consolidated financial statements.
In June 2022, a shareholder derivative complaint, captioned Banks v. Sharan, et al., Case No. 3:22-cv-03861, was filed by a purported shareholder in the United States District Court for the Northern District of California. The complaint names as defendants the Company’s Chief Executive Officer, the Company’s Chief Financial Officer, and certain current and former members of the Company’s board of directors, and names the Company as a nominal defendant. The complaint purports to assert claims on the Company’s behalf against the individual defendants for breach of fiduciary duty and alleged violations of Sections 10(b) and 21D of the Securities Exchange Act of 1934. The complaint is based on allegations that are substantially similar to those in the putative class action filed in the United States District Court for the Northern District of California, described above. The complaint seeks, among other things, an award of damages on behalf of the Company, corporate governance reforms, and attorneys’ fees and costs. In September 2022, the plaintiff voluntarily dismissed the complaint without prejudice.
In the ordinary course of business, the Company may be subject from time to time to various proceedings, lawsuits, disputes or claims. Although the Company cannot predict with assurance the outcome of any litigation, the Company does not believe there are currently any actions, other than those described in the prior paragraph, that if resolved unfavorably, would have a material impact on its financial condition, results of operations or cash flows.
Note 11.11. Stockholders’ Equity and Equity Incentive Plan
Preferred Stock
The Company’s amended and restated certificate of incorporation authorized the issuance of 10,000,000 shares of undesignated preferred stock with a par value of $0.0001 per share. The Company’s board of directors is authorized to designate the rights, preferences, privileges and restrictions of the preferred stock from time to time.
Common Stock
The Company’s amended and restated certificate of incorporation authorized the issuance of 500,000,000 shares of common stock, $0.0001 par value per share. Holders of common stock are entitled to one vote per share.
Common Stock Reserved for Future Issuance
As of December 31, 2022,2023, the Company had the following shares of common stock reserved for future issuance under its equity incentive plan and employee share purchase plan:
| | | | | |
| Stock options outstanding | 7,756,6806,974,082 | |
Restricted stock units outstanding | 5,134,9346,583,161 | |
| Remaining shares available for future grant under 2021 Equity Incentive Plan | 5,219,9243,709,039 | |
| Remaining shares available for future issuance under ESPP | 1,502,0111,818,023 | |
Total shares of common stock reserved as of December 31, 20222023 | 19,084,305 | | 19,613,549 |
| |
Equity Incentive Plan
In February 2021 in connection with the IPO, the Company adopted the 2021 Equity Incentive Plan (2021 Plan)(“2021 Plan”), which serves as a successor to and continuation of the 2014 Stock Option Plan (2014 Plan)(“2014 Plan”) and 2000 Stock Option Plan, collectively the “Predecessor Plans.” All shares that remained available for issuance under the Predecessor Plans as of the closing of the IPO, or that may expire or be canceled or forfeited following the closing of the IPO, become available for future issuance under the 2021 Plan.
The 2021 Plan originally reserved 6,400,000 shares of common stock for issuance, plus an additional 1,882,313 shares previously reserved for issuance under the 2014 Plan. In addition, the number of shares reserved for issuance under the 2021 Plan cumulatively increases on January 1, 2022 and on each subsequent January 1 through and including January 1, 2031, by the lesser of (a) 5.0% of the number of shares of stock issued and outstanding on the immediately preceding December 31, or (b) an amount determined by the Company’s board of directors. Pursuant to the automatic annual increase, 2,377,7402,059,466 additional shares were reserved under the 2021 Plan on January 1, 2023.2024. The 2021 Plan provides for the grant of stock options, stock appreciation rights, restricted stock awards, restricted stock units,
performance shares, performance units, cash-based awards and other stock-based awards. The plan administrator determines the term of stock options granted under the 2021 Plan, up to a maximum of 10 years.
Repurchase of Common Stock
In March 2023, the Company’s board of directors authorized a $125 million capital return program, $50 million of which was to be effected through a special dividend and $75 million of which was to be effected through stock repurchases. This capital return program replaced the prior share repurchase program originally announced in December 2021, which ended in March 2023. As of February 15, 2024, the Company has fully completed its capital return program.
When the Company repurchased shares under the program, it reduced the common stock component of stockholder’s equity by the par value of the repurchased shares. The excess of the repurchase price over par value of the shares was charged to additional paid in capital as the Company is in an accumulated deficit position. All repurchased shares were retired and became authorized and unissued shares.
The following table presents certain information regarding shares repurchased during the periods presented:
| | | | | | | | | | | | | | | | | | | | | |
| | | Year Ended December 31, |
| | | | | 2023 | | 2022 | | 2021 |
| Number of shares repurchased | | | | | 9,762,758 | | | 2,460,361 | | | 428,218 | |
| Average price per share, including commissions | | | | | $ | 7.64 | | | $ | 11.84 | | | $ | 16.88 | |
| Total repurchase costs, including commissions (in millions) | | | | | $ | 74.6 | | | $ | 29.1 | | | $ | 7.2 | |
Form January 1, 2024 through the last day of the share repurchase program on February 15, 2024, the Company repurchased an additional 702,620 shares of common stock at an average per share price of $7.50 (including commissions).
Dividend
Pursuant to the capital return program, on May 8, 2023, the Company’s board of directors declared a one-time special cash dividend of $1.09 per share, which was paid on June 15, 2023 in an aggregate amount of $49.9 million, to all stockholders of record as of the close of business on May 22, 2023 (the “Special Dividend”).
Anti-Dilution Adjustment to the Outstanding Awards
Pursuant to the terms of the Company’s 2021 Plan and the Predecessor Plans, participants holding outstanding equity awards are entitled to receive an anti-dilution adjustment in the event of payment of a dividend. In conjunction with the declaration of the Special Dividend on May 8, 2023, the compensation committee of the Company’s board of directors approved an adjustment to outstanding equity awards (both vested and unvested) in the form of exercise price reductions and/or increases in the number of shares issuable upon vesting and settlement of each award. This anti-dilution adjustment was designed to equalize the fair value of the awards before and after the Special Dividend. Accordingly, no incremental compensation cost was recognized.
Grant Activities
Stock Options
A summary of stock option activity under the Company’s equity incentive plans and related information is as follows:
| | | Options Outstanding |
| Number of Shares | | Weighted-
Average
Exercise
Price | | Weighted-
Average
Remaining
Contractual Life
(in years) | | Aggregate
Intrinsic Value
(in thousands) |
| Balance as of December 31, 2021 | 9,341,242 | | | $ | 6.83 | | | | | |
| Options Outstanding | |
| Options Outstanding | |
| Options Outstanding | |
| Number of Shares | | | Number of Shares | | Weighted-
Average
Exercise
Price | | Weighted-
Average
Remaining
Contractual Life
(in years) | | Aggregate
Intrinsic Value
(in thousands) |
| Balance as of December 31, 2022 | |
| Granted | Granted | — | | | — | | |
| Granted | |
| Granted | |
Anti-dilution adjustment(1) | |
Anti-dilution adjustment(1) | |
Anti-dilution adjustment(1) | |
| Exercised | |
| Exercised | |
| Exercised | Exercised | (1,236,801) | | | 2.39 | | | $ | 12,606 | |
| Cancelled and forfeited | Cancelled and forfeited | (347,761) | | | 19.76 | | |
| Balance as of December 31, 2022 | 7,756,680 | | | $ | 6.96 | | | 5.78 | | $ | 34,371 | |
| Balance as of December 31, 2023 | |
| Balance as of December 31, 2023 | |
| Balance as of December 31, 2023 | |
| Vested and exercisable | Vested and exercisable | 6,052,511 | | | $ | 5.22 | | | 5.24 | | $ | 31,209 | |
|
(1)Represents the incremental increase in the number of shares issuable upon vesting of options outstanding prior to the Special Dividend pursuant to the anti-dilution adjustment.
The weighted-average grant date fair value of options granted in 2021 and 2020 was $25.18 and $11.51, respectively.$25.18. The Company did not grant options in 2023 and 2022. The total intrinsic value of options exercised in 2023, 2022 and 2021 and 2020 was $5.2 million, $12.6 million $65.9 million and $5.2$65.9 million, respectively.
Restricted Stock Units
A summary of RSU activity under the Company’s equity incentive plans and related information is as follows:
| | | RSUs Outstanding |
| Number of Shares | | Weighted-Average Grant Date Fair Value |
| Unvested balance as of December 31, 2021 | 3,737,565 | | | $ | 20.01 | |
| RSUs Outstanding | |
| RSUs Outstanding | |
| RSUs Outstanding | |
| Number of Shares | | | Number of Shares | | Weighted-Average Grant Date Fair Value |
| Unvested balance as of December 31, 2022 | |
| Granted | Granted | 3,003,386 | | | 10.49 | |
Anti-dilution adjustment(1) | |
| Vested | Vested | (997,732) | | | 20.71 | |
| Cancelled and forfeited | Cancelled and forfeited | (608,285) | | | 19.55 | |
| Unvested balance as of December 31, 2022 | 5,134,934 | | | $ | 14.37 | |
| Unvested balance as of December 31, 2023 | |
|
(1)Represents the incremental increase in the number of shares issuable upon vesting of RSUs outstanding prior to the Special Dividend pursuant to the anti-dilution adjustment.
The total fair value of RSUs vested in 2022 and 2021 was $32.6 million, $20.7 million and $1.0 million respectively. There was no RSUs granted or vested in 2020.2023, 2022 and 2021, respectively.
Restricted Stock Unit with Performance Conditions (PSUs)(“PSUs”)
In the fourth quarter of 2022, the Company’s board of directors granted 341,404 market performance-based restricted stock units to an executive officer with a grant date fair value of $4.2 million. The PSUs vest following three annual performance periods beginning in 2023, each in an amount equal to one-third of the target number of PSUs multiplied by a percentage determined by comparing the Company’s total stockholder return to a benchmark index during the performance period. The actual payout can range from 0% to 200% of the shares granted under this award, with the maximum earned PSUs capped at 125% for the first two performance periods. The maximum payout for the entire award is capped at 200% of the granted shares. These PSUs additionally are subject to continued service by the award holder through the end of each performance period. In May 2023, an additional 54,167 PSUs were issued in connection with the anti-dilution adjustment. As of December 31, 2022,2023, none of these PSUs have vested.
In the second quarter of 2023, the Company’s board of directors granted 203,000 market performance-based restricted stock units to certain executive officers with a grant date fair value of $2.5 million. The PSUs vest following three annual performance periods beginning in 2023, each in an amount equal to one-third of the target number of PSUs multiplied by a percentage determined by comparing the Company’s total stockholder return to a benchmark index during the performance period. The actual payout can range from 0% to 200% of the shares granted under this award, with the maximum earned PSUs capped at 125% for the first two performance periods. The maximum payout for the entire award is capped at 200% of the granted shares. These PSUs additionally are subject to continued service by the award holder through the end of each performance period. In May 2023, an additional 32,204 PSUs were issued in connection with the anti-dilution adjustment. As of December 31, 2023, none of these PSUs have vested.
In 2014, the Company’s board of directors granted 187,500 performance-based restricted stock units to an executive officer with a grant date fair value of $0.5 million. These PSUs were fully vested upon the satisfaction of a one year service condition and the achievement of the IPO in February 2021. The Company recognized the related stock-based compensation expense of $0.5 million upon the consummation of its IPO.
Employee Stock Purchase Plan
In January 2021, the Company’s board of directors adopted the 2021 Employee Stock Purchase Plan (ESPP)(“ESPP”), which became effective in connection with the Company’s IPO. A total of 1,300,000 shares of common stock were initially reserved for issuance under the ESPP. The number of shares reserved for issuance cumulatively increases automatically on January 1, 2022 and on each subsequent January 1, through and including January 1, 2031, by the lesser of (a) 1% of the number of shares of stock issued and outstanding on the immediately preceding December 31, (b) 1,300,000 shares, or (c) an amount determined by the Company’s board of directors. Pursuant to the automatic annual increaincrease, 411,893se, 475,548 additional shares were reserved under the ESPP Plan on January 1, 2023.2024.
All eligible employees may participate in the ESPP and may contribute up to 20% of their earnings (as defined in the ESPP) for the purchase of the Company’s common stock under the ESPP. Unless otherwise determined by the Company’s board of directors, common stock will be purchased for the accounts of employees participating in the ESPP at a price per share equal to the lesser of (1) 85% of the fair market value of a share of the Company’s common stock on the first date of an offering or (2) 85% of the fair market value of a share of the Company’s common stock on the date of purchase. Offering periods generally start on the first trading day on or after May 16 and November 16 of each year,
except for the first offering period, which commenced on the effective date of the Company’s IPO and ended on November 15, 2021.
In 2023, 2022 and 2021, employees purchased 159,536, 200,235 and 75,027 shares of common stock at a weighted average price of $7.90$6.32, $7.90 and $14.04 perper share under the ESPP, respectively.
Fair Value Determination
The Black-Scholes assumptions used to value the employee options and employee stock purchase rights at the grant dates are as follows. There were no employee options granted in 2022 or employee stock purchase rights granted prior to 2021.2023 and 2022.
Employee Stock Options
| | Year Ended December 31, |
| 2021 | | 2020 |
| Year Ended December 31, 2021 | |
| Year Ended December 31, 2021 | |
| Year Ended December 31, 2021 | |
| Expected term | |
| Expected term | |
| Expected term | Expected term | 5.92 years | - | 6.07 years | | 6.25 years |
| Expected volatility | Expected volatility | 53.82 | % | - | 54.98% | | 41.60 | % | - | 62.00% |
| Expected volatility | |
| Expected volatility | |
| Risk-free interest rate | |
| Risk-free interest rate | |
| Risk-free interest rate | Risk-free interest rate | 0.62 | % | - | 0.96% | | 0.40 | % | - | 1.70% |
| Dividend yield | Dividend yield | —% | | —% |
| Dividend yield | |
| Dividend yield | |
Employee Stock Purchase Rights under ESPP
| | | | | | | | | | | | | | | | | | | | | | | |
| Year Ended December 31, |
| 2022 | | 2021 |
| Expected term | 0.50 years | | 0.13 years | - | 0.63 years |
| Expected volatility | 48.27 | % | - | 54.22% | | 34.08 | % | - | 61.00% |
| Risk-free interest rate | 1.54 | % | - | 4.54% | | 0.06 | % | - | 0.07% |
| Dividend yield | —% | | —% |
| | | | | | | | | | | | | | | | | | | | | | | | | | | | | | | | | | | |
| Year Ended December 31, |
| 2023 | | 2022 | | 2021 |
| Expected term | 0.50 years | | 0.50 years | | 0.13 years | - | 0.63 years |
| Expected volatility | 43.79 | % | - | 49.38% | | 48.27 | % | - | 54.22% | | 34.08 | % | - | 61.00% |
| Risk-free interest rate | 5.26 | % | - | 5.38% | | 1.54 | % | - | 4.54% | | 0.06 | % | - | 0.07% |
| Dividend yield | —% | | —% | | —% |
The Monte Carlo assumptions used to value the market performance-based restricted stock units (PSUs) at the grant dates are as follows. There were no marked performance-based restricted stock units granted in 2021.
PSUs
| | Year Ended December 31, |
| 2022 |
| Year Ended December 31, | | | Year Ended December 31, |
| 2023 | | | 2023 | | 2022 |
| Expected term | Expected term | 3.01 years | Expected term | 2.69 years | | 3.01 years |
| Expected volatility | Expected volatility | 59.00% | Expected volatility | 53.10 | % | | 59.00 | % |
| Risk-free interest rate | Risk-free interest rate | 4.16 | % | - | 4.71% | Risk-free interest rate | 3.98 | % | | 4.16 | % |
| Dividend yield | Dividend yield | —% | Dividend yield | — | % | | — | % |
The assumptions and estimates of Black-Scholes and Monte Carlo valuations were determined as follows:
•Fair Value of Common Stock. The fair value of each share of underlying common stock is based on the closing price of the Company’s common stock as reported on the date of the grant on the New York Stock Exchange.
•Risk-Free Interest Rate. The risk-free interest rate for the expected term is based on the U.S. Treasury yield curve in effect at the time of the grant.
•Expected Term. The expected term of options represents the period of time that options are expected to be outstanding. The Company’s historical stock option exercise experience does not provide a reasonable basis upon which to estimate an expected term due to a lack of sufficient data. For stock options granted to employees, the Company estimates the expected term by using the simplified method. The simplified method calculates the expected term as the average of the time-to-vesting and the contractual life of the options. The expected term of ESPP is the length of purchase period. The expected term of the PSUs is the longer of the requisite service period or the performance period.
•Expected Volatility. For options and ESPP purchase rights granted in and prior to 2021, since the Company has a short trading history for its common stock, the expected volatility is estimated by taking the average historic price volatility for industry peers, consisting of several public companies in its industry that are similar in size, stage of life cycle, financial leverage or market capitalization, over a period equivalent to the expected term of the awards. For ESPP purchase
rights granted after 2021, the expected volatility is equal to our historical volatility over the purchase period. For PSUs granted insince 2022, the expected volatility is estimated using a weighting of our historical volatility and the historical volatility of a peer group of publicly traded companies.
•Expected Dividend Yield.The Other than the one-time special dividend in 2023, the Company has not declared or paid any cash dividends.dividends and has no plan to do so in the foreseeable future. As a result, an expected dividend yield of zero percent was used.
Stock -BasedStock-Based Compensation
The stock-based compensation expense by line item in the accompanying consolidated statements of operations is summarized as follows (in thousands):
| | | | | | | | | | | | | | | | | | | | | | | |
| | | | | | | | | | | |
| | | Year Ended December 31, |
| | | | | 2022 | | 2021 | | 2020 | | |
| Cost of revenue | | | | | | | | | | | |
| Subscription and other platform | | | | | $ | 3,375 | | | $ | 1,897 | | | $ | 154 | | | |
| Professional services | | | | | 676 | | | 382 | | | 37 | | | |
| Total cost of revenue | | | | | 4,051 | | | 2,279 | | | 191 | | | |
| Sales and marketing | | | | | 14,304 | | | 8,806 | | | 1,051 | | | |
| Research and development | | | | | 7,958 | | | 4,402 | | | 360 | | | |
| General and administrative | | | | | 12,230 | | | 10,163 | | | 1,327 | | | |
| Total stock-based compensation expense | | | | | $ | 38,543 | | | $ | 25,650 | | | $ | 2,929 | | | |
| | | | | | | | | | | |
| | | | | | | | | | | | | | | | | | | | | | | |
| | | | | | | | | | | |
| | | Year Ended December 31, |
| | | | | 2023 | | 2022 | | 2021 | | |
| Cost of revenue | | | | | | | | | | | |
| Subscription and other platform | | | | | $ | 2,814 | | | $ | 3,375 | | | $ | 1,897 | | | |
| Professional services | | | | | 545 | | | 676 | | | 382 | | | |
| Total cost of revenue | | | | | 3,359 | | | 4,051 | | | 2,279 | | | |
| Sales and marketing | | | | | 13,974 | | | 14,304 | | | 8,806 | | | |
| Research and development | | | | | 9,126 | | | 7,958 | | | 4,402 | | | |
| General and administrative | | | | | 18,558 | | | 12,230 | | | 10,163 | | | |
| Total stock-based compensation expense | | | | | $ | 45,017 | | | $ | 38,543 | | | $ | 25,650 | | | |
| | | | | | | | | | | |
The following table presents the unrecognized stock-based compensation expense and weighted-average recognition periods as of December 31, 20222023 (in thousands, except years):
| | | | | | | | | | | | | | | | | |
| Stock Option | | Restricted Stock | | ESPP |
| Unrecognized stock-based compensation expense | $ | 25,270 | | | $ | 69,454 | | | $ | 177 | |
| Weighted-average amortization period | 1.92 years | | 2.75 years | | 0.37 years |
Repurchase of Common Stock
In December 2021, the Company’s board of directors authorized a $50.0 million share repurchase program. The timing and number of shares repurchased under the program will depend on a variety of factors, including stock price, trading volume, and general business and market conditions. The share repurchase program may be modified, suspended or discontinued at any time at the Company’s discretion.
When the Company repurchased shares under the program, it reduced the common stock component of stockholder’s equity by the par value of the repurchased shares. The excess of the repurchase price over par value of the shares was charged to additional paid in capital as the Company is in an accumulated deficit position. All repurchased shares were retired and became authorized and unissued shares.
The following table presents certain information regarding shares repurchased under the program during the periods presented:
| | | | | | | | | | | | | | | |
| | | Year Ended December 31, |
| | | 2022 | | 2021 | | |
| Number of shares repurchased | | | 2,460,361 | | | 428,218 | | | |
| Average price per share, including commissions | | | $ | 11.84 | | | $ | 16.88 | | | |
| Total repurchase costs, including commissions (in millions) | | | $ | 29.1 | | | $ | 7.2 | | | |
As of December 31, 2022, the Company had $13.7 million available for future share buybacks under the repurchase program.
The Company repurchased an additional 526,198 shares of common stock at an average per share price of $8.95 (including commissions) from January 1, 2023 through February 3, 2023.
In March 2023, the Company’s board of directors approved the expansion of its previously announced $100.0 million capital return program by an incremental $25.0 million. The new $125.0 million program comprises a special dividend of $50.0 million in the aggregate and an accelerated stock repurchase program and/or open market purchases of approximately $75.0 million. The Company may pay an additional special dividend if this $75.0 million threshold is not reached by March 2024. | | | | | | | | | | | | | | | | | |
| Stock Option | | Restricted Stock | | ESPP |
| Unrecognized stock-based compensation expense | $ | 11,215 | | | $ | 52,554 | | | $ | 106 | |
| Weighted-average amortization period | 1.25 years | | 2.12 years | | 0.37 years |
Note 12. Employees Benefit Plan
The Company maintains a retirement savings plan, or the 401(k) Plan. The 401(k) Plan is intended to qualify under Sections 401 of the Internal Revenue Code. Participants may contribute up to applicable annual Internal Revenue Code limits. The 401(k) Plan provides for automatic salary deferrals of 3% of compensation with a 1% escalator each year.year until the deferral rate reaches 6%. Participants are permitted to waive the automatic deferral and/or the automatic increase provision. All participants’ deferrals, rollovers and matching contributions are 100% vested when contributed. The 401(k) plan allows the Company to make matching contributions and profit-sharing contributions to eligible participants. Effective January 1, 2019, the Company began making contributions of up to $500 per year to eligible participants. The contribution expense was $0.3$0.2 million, $0.3 million and $0.2$0.3 million for the years ended December 31, 2023, 2022 2021 and 2020,2021, respectively.
Note 13. Other (Income) Expense, Net
Other (income) expense, net consisted of the following for the periods presented (in thousands):
| | | Year Ended December 31, |
| | 2022 | | 2021 | | 2020 |
| | | Year Ended December 31, | |
| | | Year Ended December 31, | |
| | | Year Ended December 31, | |
| | | | | 2023 | | | | | | | 2023 | | 2022 | | 2021 |
| Interest income | Interest income | | $ | (1,914) | | | $ | (685) | | | $ | — | |
| Amortization (accretion) on marketable securities | | (1,242) | | | 504 | | | — | |
| Foreign currency losses (gains) | | 910 | | | 768 | | | (10) | |
| (Accretion) amortization on marketable securities | |
| Foreign currency losses | |
| Other | Other | | (268) | | | (100) | | | (66) | |
| Other (income) expense, net | Other (income) expense, net | | $ | (2,514) | | | $ | 487 | | | $ | (76) | |
|
Note 14.14. Income Taxes
The components of income (loss)loss before the provision for (benefit from) income taxes is summarized as follows (in thousands):
| | Year Ended December 31, |
| 2022 | | 2021 | | 2020 |
| Year Ended December 31, 2023 | | | Year Ended December 31, 2023 |
| 2023 | | | 2023 | | 2022 | | 2021 |
| Domestic | Domestic | $ | (59,414) | | | $ | (25,983) | | | $ | 19,663 | |
| Foreign | Foreign | 2,164 | | | 1,442 | | | 1,387 | |
| Ending balance | $ | (57,250) | | | $ | (24,541) | | | $ | 21,050 | |
| Loss before provision for (benefit from) income taxes | |
|
The Company’s provision for (benefit from) income taxes were as follows (in thousands):
| | | | | | | | | | | | | | | | | |
| Year Ended December 31, |
| 2022 | | 2021 | | 2020 |
| Current tax expense | | | | | |
| Federal | $ | — | | | $ | — | | | $ | — | |
| State | 18 | | | 2 | | | 32 | |
| Foreign | 1,201 | | | (10) | | | 265 | |
| Total current tax (benefit) expense | 1,219 | | | (8) | | | 297 | |
| Deferred tax expense: | | | | | |
| Federal | — | | | — | | | — | |
| State | — | | | — | | | — | |
| Foreign | (261) | | | (277) | | | — | |
| Total deferred tax (benefit) expense | (261) | | | (277) | | | — | |
| Provision for (benefit from) income taxes | $ | 958 | | | $ | (285) | | | $ | 297 | |
| | | | | |
| | | | | | | | | | | | | | | | | |
| Year Ended December 31, 2023 |
| 2023 | | 2022 | | 2021 |
| Current tax expense | | | | | |
| Federal | $ | — | | | $ | — | | | $ | — | |
| State | 31 | | | 18 | | | 2 | |
| Foreign | 773 | | | 1,201 | | | (10) | |
| Total current tax (benefit) expense | 804 | | | 1,219 | | | (8) | |
| Deferred tax expense: | | | | | |
| Federal | — | | | — | | | — | |
| State | — | | | — | | | — | |
| Foreign | 191 | | | (261) | | | (277) | |
| Total deferred tax (benefit) expense | 191 | | | (261) | | | (277) | |
| Provision for (benefit from) income taxes | $ | 995 | | | $ | 958 | | | $ | (285) | |
| | | | | |
The provision for (benefit from) income taxes differs from the amount computed by applying the statutory federal tax rate as follows (in thousands):
| | Year Ended December 31, |
| 2022 | | 2021 | | 2020 |
| Year Ended December 31, 2023 | | | Year Ended December 31, 2023 |
| 2023 | | | 2023 | | 2022 | | 2021 |
| Tax benefit at U.S. statutory rate | Tax benefit at U.S. statutory rate | $ | (12,023) | | | $ | (5,154) | | | $ | 4,402 | |
| State income taxes, net of federal benefit | State income taxes, net of federal benefit | 14 | | | 10 | | | 32 | |
| Foreign income and withholding taxes | Foreign income and withholding taxes | 26 | | | 79 | | | 89 | |
| Expenses from resolution of certain tax audits and expiration of statute of limitations | 2 | | | 64 | | | (32) | |
| Change in uncertain tax positions | |
| Stock-based compensation | Stock-based compensation | 2,518 | | | (6,386) | | | 113 | |
| Section 162(m) | Section 162(m) | 1,490 | | | 621 | | | — | |
| Expired attributes | Expired attributes | 953 | | | 3,118 | | | 1,964 | |
| Change in valuation allowance | Change in valuation allowance | 8,148 | | | 6,986 | | | (5,857) | |
| Research and development credits | Research and development credits | (759) | | | (43) | | | (261) | |
| Global Intangible Low-Taxed Income | Global Intangible Low-Taxed Income | 140 | | | — | | | 6 | |
| | Non-deductible transactions costs | |
| Other | Other | 449 | | | 420 | | | (159) | |
| Provision for (benefit from) income taxes | Provision for (benefit from) income taxes | $ | 958 | | | $ | (285) | | | $ | 297 | |
|
As a result of the Tax Cuts and Jobs Act (the Tax Act)“Tax Act”), foreign accumulated earnings that were subject to the mandatory transition tax as of December 31, 2017, can be repatriated to the U.S. without incurring further U.S. federal tax. The Tax Act moves towards a modified territorial tax system through the provision of a 100% dividend received deduction for the foreign-source portions of dividends received from controlled foreign subsidiaries. As a result, the Company continues to evaluate the indefinite reinvestment assertions with regards to unremitted earnings for our foreign subsidiaries. As of December 31, 2023, 2022 2021 and 2020,2021, the total undistributed earnings of the Company’s foreign subsidiaries were approximately $4.9 million, $4.3 million $3.4 million and $3.5$3.4 million, respectively. Historically, the Company has
asserted its intention to indefinitely reinvest the undistributed earnings of foreign subsidiaries. The unrecognized deferred tax liability on the portion of the undistributed earnings considered indefinitely reinvested is not material.
Deferred income taxes result from differences in the recognition of expenses for tax and financial reporting purposes, as well as operating loss and tax credit carryforwards. Significant components of our deferred income tax assets as of the periods presented are as follows (in thousands):
| | | | | | | | | | | |
| December 31, 2022 | | December 31, 2021 |
| Deferred tax assets | | | |
| Accrued expense and others | $ | 3,981 | | | $ | 4,197 | |
| Stock-based compensation | 4,778 | | | 4,605 | |
| Net operating losses | 31,803 | | | 29,092 | |
| Tax credit carryforwards | 7,416 | | | 6,263 | |
| Fixed assets | 83 | | | — | |
| Intangibles and Section 174 costs | 5,298 | | | — | |
| Lease liability | 1,540 | | | — | |
| | | |
| Gross deferred tax assets | $ | 54,899 | | | $ | 44,157 | |
| Valuation allowance | (45,510) | | | (35,080) | |
| Total deferred tax assets | $ | 9,389 | | | $ | 9,077 | |
| Deferred tax liabilities | | | |
| Section 481(a) adjustment | $ | — | | | $ | (461) | |
| Right-of-use Asset | (1,032) | | | — | |
| Deferred commissions | (7,845) | | | (8,339) | |
| Total deferred tax liabilities | $ | (8,877) | | | $ | (8,800) | |
| Net deferred tax assets | $ | 512 | | | $ | 277 | |
| | | |
| | | | | | | | | | | |
| December 31, 2023 | | December 31, 2022 |
| Deferred tax assets | | | |
| Accrued expense and others | $ | 3,816 | | | $ | 3,981 | |
| Stock-based compensation | 5,458 | | | 4,778 | |
| Net operating losses | 31,761 | | | 31,803 | |
| Tax credit carryforwards | 8,404 | | | 7,416 | |
| Fixed assets | 548 | | | 83 | |
| Intangibles and Section 174 costs | 9,054 | | | 5,298 | |
| Lease liability | 1,201 | | | 1,540 | |
| | | |
| Gross deferred tax assets | $ | 60,242 | | | $ | 54,899 | |
| Valuation allowance | (52,151) | | | (45,510) | |
| Total deferred tax assets | $ | 8,091 | | | $ | 9,389 | |
| Deferred tax liabilities | | | |
| | | |
| Right-of-use Asset | (633) | | | (1,032) | |
| Deferred commissions | (7,136) | | | (7,845) | |
| Total deferred tax liabilities | $ | (7,769) | | | $ | (8,877) | |
| Net deferred tax assets | $ | 322 | | | $ | 512 | |
| | | |
The Company assesses the realizability of deferred tax assets based on the available evidence, including a history of taxable income and estimates of future taxable income. In assessing the realizability of deferred tax assets, the Company considers whether it is more likely than not that all or some portion of deferred tax assets will not be realized. Due to the losses the Company generated in prior years, management believes it is more likely than not that the deferred tax assets will not be realized. Accordingly, the Company established a full valuation allowance on its U.S. net deferred tax assets. The valuation allowance increased by $10.4$6.6 million for the year ended December 31, 2022.2023. The Company has not recorded a valuation allowance on its net foreign deferred tax assets as the Company believes it will generate sufficient future taxable income to realize the deferred tax asset in its foreign jurisdictions.
As of December 31, 2022,2023, the Company had net operating loss carryforwards of approximately $123.5$123.7 million for federal income tax purposes, of which a portion will begin to expire in 20232024 if unused. As a result of Tax Act, $88.2$70.2 million of the federal net operating loss carryovers will carryover indefinitely and are limited to 80% of taxable income. The Company had net operating loss carryforwards of approximately $87.6$91.0 million for state income tax purposes, which will begin to expire in the year 2025 if unused.
As of December 31, 2022,2023, the Company has research and development credit carryforwards of approximately $5.4$6.1 million for federal income tax and $5.3$6.0 million for state income tax purposes. The federal research and development tax credit will begin to expire in 2028 if unused. State research and development tax credits carryforwardcarry forward indefinitely.
The federal and state net operating loss carryforwards may be subject to significant limitations under Section 382 and Section 383 of the Internal Revenue Code of 1986, as amended, and similar provisions under state law. The Tax Reform Act of 1986 contains provisions that limit the federal net operating loss carryforwards that may be used in any given year in the event of special occurrences, including significant ownership changes. The Company completed a review of any potential limitation on the use of its net operating losses under Section 382 through December 31, 2022.2023. Based on such review, the Company does not believe Section 382 of the Internal Revenue Code will adversely impact its ability to use its current net operating losses to offset future taxable income, if any,
The Company complies with ASC 740-10, Accounting for Uncertainty in Income Taxes, which prescribes a comprehensive model for the recognition, measurement, presentation and disclosure in financial statements of any uncertain tax positions that have been taken or expected to be taken on a tax return. This pronouncement sets a “more likely than not” criterion for recognizing the tax benefit of uncertain tax positions. There are no tax positions for which it is reasonably possible that the total amounts of unrecognized tax benefits will significantly increase or decreasedecrease within 12 months of the reporting date. If recognized, $0.4$0.5 million would affect the Company’s effective tax rate.
The Company’s policy is toto recognize interest and penalties accrued on any unrecognized tax benefits as a component of income tax expense. The Company recognized anan immaterial amount of interest and penalties associated with unrecognized tax benefits in 2023, 2022 2021 and 2020.2021.
A reconciliation of the beginning and ending balance of total unrecognized tax position is as follows (in thousands):
| | Year Ended December 31, |
| 2022 | | 2021 | | 2020 |
| Year Ended December 31, 2023 | | | Year Ended December 31, 2023 |
| 2023 | | | 2023 | | 2022 | | 2021 |
| Beginning balance | Beginning balance | $ | 2,515 | | | $ | 2,397 | | | $ | 2,206 | |
| Increase (decrease) related to prior year tax provisions | Increase (decrease) related to prior year tax provisions | 44 | | | (151) | | | — | |
| Increase related to current year tax positions | Increase related to current year tax positions | 438 | | | 341 | | | $ | 236 | |
| Decrease due to lapse of applicable statute of limitations | Decrease due to lapse of applicable statute of limitations | (115) | | | (72) | | | $ | (45) | |
| Ending balance | Ending balance | $ | 2,882 | | | $ | 2,515 | | | $ | 2,397 | |
|
The Company files income tax returns in the U.S. federal jurisdiction, various state jurisdictions and various foreign jurisdictions. As of December 31, 2022,2023, all of the years remain open to examination by the federal and state tax authorities for three or four years from the tax year in which net operating losses or tax credits are utilized. There have been no examinations of our income tax returns by any tax authority.
In August 2022, the Inflation Reduction Act of 2022 was signed into the U.S. law, which implements a new alternative minimum tax for some large corporations, an excise tax on stock buybacks, and significant tax incentives for energy and climate initiatives, among other provisions. The Inflation Reduction Act does not have a material impact on the Company’s consolidated financial statements.
Note 15. Net Income (Loss)Loss Per Share Attributable to Common Stockholders
The following tables set forth the computation of basic and diluted net loss per share attributable to common stockholders for the periods presented (in thousands, except share and per share data):
| | | | | | | | | | | | | | | | | | | | | | | |
| | | | | | | | | | | |
| | | Year Ended December 31, |
| Basic net income (loss) per share | | | | | 2022 | | 2021 | | 2020 | | |
| Net income (loss) | | | | | $ | (58,208) | | | $ | (24,256) | | | $ | 20,753 | | | |
| Cumulative preferred dividends allocated to preferred stockholders | | | | | — | | | (558) | | | (5,685) | | | |
| Net income (loss) attributable to common stockholders | | | | | (58,208) | | | (24,814) | | | 15,068 | | | |
| Income available to participating securities | | | | | — | | | — | | | (11,015) | | | |
| Net income (loss) available to common stockholders | | | | | $ | (58,208) | | | $ | (24,814) | | | $ | 4,053 | | | |
| Net income (loss) per share of common stock, basic | | | | | $ | (1.23) | | | $ | (0.57) | | | $ | 0.40 | | | |
| Weighted-average common stock outstanding, basic | | | | | 47,486,225 | | | 43,562,604 | | | 10,017,574 | | | |
| | | | | | | | | | | |
| | | | | | | | | | | | | | | | | | | | | | | |
| | | Year Ended December 31, |
| Diluted net income (loss) per share | | | | | 2022 | | 2021 | | 2020 | | |
| Net income (loss) | | | | | $ | (58,208) | | | $ | (24,256) | | | $ | 20,753 | | | |
| Cumulative preferred dividends allocated to preferred stockholders | | | | | — | | | (558) | | | (5,685) | | | |
| Net income (loss) attributable to common stockholders | | | | | (58,208) | | | (24,814) | | | 15,068 | | | |
| Reallocation of earnings to participating securities considering potentially dilutive securities | | | | | — | | | — | | | (9,450) | | | |
| Net income (loss) available to common stockholders | | | | | $ | (58,208) | | | $ | (24,814) | | | $ | 5,618 | | | |
| Net income (loss) per share of common stock, diluted | | | | | $ | (1.23) | | | $ | (0.57) | | | $ | 0.35 | | | |
| Weighted average common stock outstanding, basic | | | | | 47,486,225 | | | 43,562,604 | | | 10,017,574 | | | |
| Weighted average dilutive effect of stock options and restricted stock | | | | | — | | | — | | | 6,169,575 | | | |
| Weighted-average common stock outstanding, diluted | | | | | 47,486,225 | | | 43,562,604 | | | 16,187,149 | | | |
| | | | | | | | | | | |
| | | | | | | | | | | | | | | | | | | | | | | |
| | | | | | | | | | | |
| | | Year Ended December 31, |
| | | | | 2023 | | 2022 | | 2021 | | |
| Net loss | | | | | $ | (51,786) | | | $ | (58,208) | | | $ | (24,256) | | | |
| Cumulative preferred dividends allocated to preferred stockholders | | | | | — | | | — | | | (558) | | | |
| Net loss attributable to common stockholders | | | | | (51,786) | | | (58,208) | | | (24,814) | | | |
| | | | | | | | | | | |
| | | | | | | | | | | |
| Net loss per share of common stock, basic and diluted | | | | | $ | (1.16) | | | $ | (1.23) | | | $ | (0.57) | | | |
| Weighted-average common stock outstanding, basic and diluted | | | | | 44,644,792 | | | 47,486,225 | | | 43,562,604 | | | |
| | | | | | | | | | | |
The following table sets forth the potential shares of common stock that were excluded from the computation of diluted net loss per share attributable to common stockholders for the periods presented because including them would have been antidilutive:
| | | Year Ended December 31, |
| | 2022 | | 2021 | | 2020 |
| Convertible preferred stock (on an if-converted basis) | | — | | | — | | | 5,543,918 | |
| | | Year Ended December 31, | |
| | | Year Ended December 31, | |
| | | Year Ended December 31, | |
| | | | | 2023 | | | | | | | 2023 | | 2022 | | 2021 |
| Stock options | Stock options | | 7,756,680 | | | 9,341,242 | | | 426,542 | |
| Restricted stock units | Restricted stock units | | 5,134,934 | | | 3,737,565 | | | — | |
| Performance stock units | Performance stock units | | 341,404 | | | — | | | — | |
| ESPP purchase rights | ESPP purchase rights | | 99,235 | | | 88,059 | | | — | |
| Total antidilutive securities | Total antidilutive securities | | 13,332,253 | | | 13,166,866 | | | 5,970,460 | |
Note 16. Related Party Transactions
The Company incurred engineering and quality assurance costs from a third-party vendor in 2023, 2022 2021 and 2020.2021. The chief executive officer of the third-party vendor is considered an immediate family member of the Company’s chief technology officer. The Company recorded $2.7 million, $3.0 million and $2.5 million in 2023, 2022 and $1.7 million in 2022, 2021, and 2020, respectively, in research and development expense relating to this third-party vendor on the consolidated statements of operations. The Company recorded $0.2 million in accounts payable as of December 31, 2023 and $0.7 million in accounts payable and accrued liabilities as of December 31, 2022 and $0.3 million in accounts payable as of December 31, 2021 on the consolidated balance sheets for the amount owed to this third-party vendor.
Note 17. Restructuring
In the third quarter of 2022, the Company initiated a strategic cost reduction plan that includedto reduce its cost structure and lower its net loss, including voluntary and involuntary global headcount reductions and the Company has continued to reduce its global full-time employee headcount through voluntary and involuntary headcount reductions. As of December 31, 2022, the Company’s full-time headcount decreased by approximately 11% from June 30, 2022. Additionally, the Company incurred total restructuring costs of $1.7 millionas well as reductions in the third and fourth quarters of 2022, primarily related to severance and one-time termination benefits. The Company incurred additional restructuring costs of $1.0 millionspending with various vendors. This plan was substantially completed in the first quarter of 2023, and expectsthe Company has pursued additional reductions in its workforce in 2023 to incur $2.8 million to $3.3 million more for such activities by the end of the first quarter of 2023.further reduce its cost structure.
The following table summarizes the restructuring costs and lease impairment charges under both plans in our consolidated statements of operations for the periods presented (in thousands):
| | | | | | | | | | | | | | | | | | | | | | | | | | | | | | | | | | | | | | | | | |
| | | Year Ended December 31, 2023 | | Year Ended December 31, 2022 |
| | | | | | | Severance and Related Charges(1) | | Lease Impairment Charges(2) | | Total | | Severance and Related Charges(1) | | Lease Impairment Charges(2) | | Total |
| Cost of revenue | | | | | | | | | | | | | | | | | |
| Subscription and other platform | | | | | | | $ | 2,215 | | | $ | 108 | | | $ | 2,323 | | | $ | 363 | | | $ | — | | | $ | 363 | |
| Professional services | | | | | | | 149 | | | 119 | | | 268 | | | 27 | | | — | | | 27 | |
| Total cost of revenue | | | | | | | 2,364 | | | 227 | | | 2,591 | | | 390 | | | — | | | 390 | |
| Sales and marketing | | | | | | | 2,246 | | | 256 | | | 2,502 | | | 1,146 | | | — | | | 1,146 | |
| Research and development | | | | | | | 1,397 | | | 569 | | | 1,966 | | | 86 | | | — | | | 86 | |
| General and administrative | | | | | | | 391 | | | 409 | | | 800 | | | 37 | | | — | | | 37 | |
| Total restructuring costs | | | | | | | $ | 6,398 | | | $ | 1,461 | | | $ | 7,859 | | | $ | 1,659 | | | $ | — | | | $ | 1,659 | |
| | | | | | | | | | | | | | | | | |
| | | | | | | |
| | | Year Ended
December 31, 2022 |
Cost of revenue | | | |
Subscription and other platform | | | $ | 363 | |
Professional services | | | 27 | |
Total cost of revenue | | | 390 | |
Sales and marketing | | | 1,146 | |
Research and development | | | 86 | |
General and administrative | | | 37 | |
Total restructuring costs | | | $ | 1,659 | |
| | | |
(1)Severance and related charges primarily include severance and one-time termination benefits.
(2)Lease impairment charge represents the underutilized real estate charge on the Company’s headquarters lease. See Note 8 for additional information.
The Company paid restructuring costs of $6.5 million and $1.5 million during 2022.2023 and 2022, respectively. As of December 31, 2023 and 2022, the restructuring liability was $0.1 million and $0.2 million, respectively, and is included in accrued and other current liabilities on the consolidated balance sheets.
The Company expects to incur additional restructuring costs of $0.6 million to $0.9 million in the first quarter of 2024 and may incur additional costs in future periods for restructuring activities.
Item 9. Changes in and Disagreements with Accountants on Accounting and Financial Disclosure.
None.
Item 4.9A. Controls and Procedures.
Evaluation of Disclosure Controls and Procedures
Under the supervision and with the participation of our management, including our principal executive officer and principal financial officer, we evaluated the effectiveness of the design and operation of our disclosure controls and procedures as defined in Rules 13a-15(e) and 15d-15(e) of the Securities Exchange Act of 1934,as amended (the “Exchange Act”) as of December 31, 2022.2023. Our management recognizes that any controls and procedures, no matter how well designed and operated, can provide only reasonable assurance of achieving their objectives, and management necessarily applies its judgment in evaluating the cost-benefit relationship of possible controls and procedures.
Based upon the evaluation, our Chief Executive Officer and Chief Financial Officer have concluded that, as of December 31, 2022,2023, our disclosure controls and procedures were effective at a reasonable assurance level.
Management's Report on Internal Control Over Financial Reporting
Our management is responsible for establishing and maintaining adequate internal control over financial reporting (as defined in Rule 13a-15(f) and 15d-15(f) under the Exchange Act). Our management conducted an assessment of the effectiveness of our internal control over financial reporting as of December 31, 20222023 based on the criteria set forth in the 2013 Internal Control-Integrated Framework issued by the Committee of Sponsoring Organizations of the Treadway Commission. Based on the assessment, our management has concluded that our internal control over financial reporting was effective as of December 31, 2022.2023.
Changes in Internal Control over Financial Reporting
There were no changes in our internal control over financial reporting (as defined in Rule 13a-15(f) under the Exchange Act) during the three months ended December 31, 2022,2023, that has materially affected, or is reasonably likely to materially affect, our internal control over financial reporting.
Item 9B. Other Information
Rule 10b5-1 Trading Plans
None.
Item 9C. Disclosure Regarding Foreign Jurisdictions that Prevent Inspections
None.
Part III
Item 10. Directors, Executive Officers and Corporate Governance
The information required by this Item 10 will be included in, and is incorporated herein by reference to, our Proxy Statement to be filed with the SEC in connection with the solicitation of proxies for our 20232024 Annual Meeting of Stockholders to be filed with the SEC within 120 days of the year ended December 31, 20222023 (“20232024 Proxy Statement”).
Item 11. Executive Compensation
The information required by this Item 11 will be included in our 20232024 Proxy Statement and is incorporated herein by reference.
Item 12. Security Ownership of Certain Beneficial Owners and Management and Related Stockholder Matters
The information required by this Item 12 will be included in our 20232024 Proxy Statement and is incorporated herein by reference.
Item 13. Certain Relationships and Related Transactions, and Director Independence
The information required by this Item 13 will be included in our 20232024 Proxy Statement and is incorporated herein by reference.
Item 14. Principal Accountant Fees and Services
The information required by this Item 14 will be included in our 20232024 Proxy Statement and is incorporated herein by reference.
Part IV
Item 15. Exhibits and Financial Statement SchedulesSchedules.
(a) We have filed the following documents as part of this Form 10-K:
1.Financial Statements
Information in response to this Item is included in Part II, Item 8 of this report on Form 10‑K.
2.Financial Statement Schedules
All schedules are omitted because they are not required, not applicable or the required information is included in the consolidated financial statements or notes thereto.
3.Exhibits
The following exhibits, as required by Item 601 of Regulation S-K are filed with or incorporated by reference in this report as stated below.
Exhibit Index
| | Incorporated by Reference |
| | | | Incorporated by Reference | | | | | | Incorporated by Reference |
Exhibit
Number | Exhibit
Number | | Exhibit Title | | Form | | File No. | | Exhibit | | Filing
Date | | Filed/
Furnished
with This
Report | Exhibit
Number | | Exhibit Title | | Form | | File No. | | Exhibit | | Filing
Date | | Filed/
Furnished
with This
Report |
| | 3.1 | 3.1 | | | | 8-K | | 001-39965 | | 3.1 | | 2/8/2021 | |
| 3.1 | |
| 3.1 | |
| 3.2 | |
| 3.2 | |
| 3.2 | 3.2 | | | | 8-K | | 001-39965 | | 3.2 | | 2/8/2021 | |
| 4.1 | 4.1 | | | | 10-K | | 001-39965 | | 4.1 | | 3/30/2021 | |
| 4.1 | |
| 4.1 | |
| 10.1 + | |
| 10.1 + | |
| 10.1 + | 10.1 + | | | | S-1 | | 333-251967 | | 10.1 | | 1/8/2021 | |
| 10.2 + | 10.2 + | | | | S-1 | | 333-251967 | | 10.2 | | 1/8/2021 | |
| 10.2 + | |
| 10.2 + | |
| 10.3 + | |
| 10.3 + | |
| 10.3 + | 10.3 + | | | | 10-K | | 001-39965 | | 10.3 | | 3/30/2021 | |
| 10.4 + | 10.4 + | | | | S-1 | | 333-251967 | | 10.4 | | 1/8/2021 | |
| 10.4 + | |
| 10.4 + | |
| 10.5 + | |
| 10.5 + | |
| 10.5 + | 10.5 + | | | | S-1 | | 333-251967 | | 10.5 | | 1/8/2021 | |
| 10.6 + | 10.6 + | | | | S-1 | | 333-251967 | | 10.6 | | 1/8/2021 | |
| 10.6 + | |
| 10.6 + | |
| 10.7 + | |
| 10.7 + | |
| 10.7 + | 10.7 + | | | | S-1 | | 333-251967 | | 10.7 | | 1/8/2021 | |
| 10.8 + | 10.8 + | | | | S-1 | | 333-251967 | | 10.8 | | 1/8/2021 | |
| 10.8 + | |
| 10.8 + | |
| 10.9 | |
| 10.9 | |
| 10.9 | 10.9 | | | | S-1 | | 333-251967 | | 10.9 | | 1/8/2021 | |
| 10.10 | 10.10 | | | | 10-K | | 001-39965 | | 10.10 | | 3/14/2022 | |
| 10.11 * | | | | 10-Q | | 001-39965 | | 10.1 | | 11/12/2021 | |
| 10.12 | | | | S-1 | | 333-251967 | | 10.10 | | 1/8/2021 | |
| 10.10 | |
| 10.10 | |
| 10.11 | |
| 10.11 | |
| 10.11 | |
| 10.12 * | |
| 10.12 * | |
| 10.12 * | |
| 10.13 | |
| 10.13 | |
| 10.13 | 10.13 | | | | S-1 | | 333-251967 | | 10.11 | | 1/8/2021 | |
| 10.14 | 10.14 | | | | S-1 | | 333-251967 | | 10.12 | | 1/8/2021 | |
| 10.15+ | | | | S-1/A | | 333-251967 | | 10.13 | | 1/25/2021 | |
| 10.14 | |
| 10.14 | |
| 10.15 | |
| 10.15 | |
| 10.15 | |
| 10.16+ | 10.16+ | | | | 8-K | | 001-39965 | | 10.1 | | 12/30/2022 | |
10.17¥ | | | | 8-K | | 001-39965 | | 10.1 | | 3/13/2023 | |
| 10.16+ | |
| 10.16+ | |
| 10.17+ | |
| 10.17+ | |
| 10.17+ | |
10.18¥ | |
10.18¥ | |
10.18¥ | |
| 10.19 | |
| 10.19 | |
| 10.19 | |
| 21.1 | |
| 21.1 | |
| 21.1 | 21.1 | | | | X | | | | | | | | | | | | X |
| 23.1 | 23.1 | | | | X | 23.1 | | | | | | | | | | | | X |
| 31.1 | 31.1 | | | | X | 31.1 | | | | | | | | | | | | X |
| 31.2 | 31.2 | | | | | | | | | | | | X | 31.2 | | | | | | X |
| 32.1 | 32.1 | | | | | | | | | | | | X | 32.1 | | | | | | X |
| 32.2 | 32.2 | | | | | | | | | | | | X | 32.2 | | | | | | X |
| 97.1 | | 97.1 | | | | | | | | | | | | X |
| 101.INS | 101.INS | | Inline XBRL Instance Document – the instance document does not appear in the Interactive Data File because XBRL tags are embedded within the Inline XBRL document. | | | | | | | | | | X | 101.INS | | Inline XBRL Instance Document – the instance document does not appear in the Interactive Data File because XBRL tags are embedded within the Inline XBRL document. | | | | X |
| 101.SCH | 101.SCH | | Inline XBRL Taxonomy Extension Schema Document | | | | | | | | | | X | 101.SCH | | Inline XBRL Taxonomy Extension Schema Document with Embedded Linkbase. | | | | X |
| 101.CAL | | Inline XBRL Taxonomy Extension Calculation Linkbase Document | | | | | | | | | | X |
| 101.DEF | | Inline XBRL Taxonomy Extension Definition Linkbase Document | | | | | | | | | | X |
| 101.LAB | | Inline XBRL Taxonomy Extension Label Linkbase Document | | | | | | | | | | X |
| 101.PRE | | Inline XBRL Taxonomy Extension Presentation Linkbase Document | | | | | | | | | | X |
| 104 | 104 | | Cover Page Interactive Data File (embedded within the Inline XBRL document) | | | | | | | | | | X | 104 | | Cover Page Interactive Data File (embedded within the Inline XBRL document) | | | | X |
| | | | | |
| † | Indicates a management contract, compensatory plan or compensatory plan.compensation policy. |
| * | Certain portions of this Exhibit were omitted by means of marking such portions with brackets (“[***]”) because they are not material and they are the type of information that the registrant treats as private or confidential. |
| ¥ | Schedules (and similar attachments) have been omitted from this filing pursuant to Item 601(a)(5) of Regulation S-K. A copy of any omitted schedule will be furnished to the Securities and Exchange Commission upon request. |
Item 16. Form 10-K Summary
None.
SIGNATURES
Pursuant to the requirements of the Securities Exchange Act of 1934, the registrant has duly caused this report to be signed on its behalf by the undersigned thereunto duly authorized.
| | | | | | | | |
| ON24, Inc. |
| | |
Date: March 14, 202313, 2024 | By: | /s/ Sharat Sharan |
| | Sharat Sharan |
| | President and Chief Executive Officer |
| | (Duly Authorized Officer and Principal Executive Officer) |
| | |
Date: March 14, 202313, 2024 | By: | /s/ Steven Vattuone |
| | Steven Vattuone |
| | Chief Financial Officer |
| | (Principal Financial and Accounting Officer) |
POWERPOWER OF ATTORNEY
KNOW ALL PERSONS BY THESE PRESENTS, that each person whose signature appears below constitutes and appoints Sharat Sharan and Steven Vattuone, and each of them, as his true and lawful attorneys-in-fact and agents, each with the full power of substitution, for him and in his name, place or stead, in any and all capacities, to sign any and all amendments to this Annual Report on Form 10‑K, and to file the same, with all exhibits thereto and other documents in connection therewith, with the Securities and Exchange Commission, granting unto said attorneys-in-fact and agents, and each of them, full power and authority to do and perform each and every act and thing requisite and necessary to be done in and about the premises, as fully to all intents and purposes as he might or could do in person, hereby ratifying and confirming all that said attorneys-in-fact and agents, or their or his substitute or substitutes, may lawfully do or cause to be done by virtue hereof.
| | | | | | | | | | | | | | |
| Signature | | Title | | Date |
| | | | |
| s/ Sharat Sharan | | President, Chief Executive Officer and Director | | March 14, 202313, 2024 |
| Sharat Sharan | | (Principal Executive Officer) | | |
| | | | |
| /s/ Steven Vattuone | | Chief Financial Officer | | March 14, 202313, 2024 |
| Steven Vattuone | | (Principal Financial and Accounting Officer) | | |
| | | | |
| /s/ Teresa Anania | | Director | | March 13, 2024 |
| Teresa Anania | | | | |
| | | | |
| /s/ Anil Arora | | Director | | March 14, 202313, 2024 |
| Anil Arora | | | | |
| | | | |
| /s/ Irwin Federman | | Director | | March 14, 202313, 2024 |
| Irwin Federman | | | | |
| | | | |
| /s/ Ronald Mitchell | | Director | | March 13, 2024 |
| Ronald Mitchell | | | | |
| | | | |
| /s/ Cynthia Paul | | Director | | March 13, 2024 |
| Cynthia Paul | | | | |
| | | | |
| /s/ Dominique Trempont | | Director | | March 14, 202313, 2024 |
| Dominique Trempont | | | | |
| | | | |
| /s/ Anthony Zingale | | Director | | March 14, 202313, 2024 |
| Anthony Zingale | | | | |
| | | | |
| /s/ Barry Zwarenstein | | Director | | March 14, 202313, 2024 |
| Barry Zwarenstein | | | | |