UNITED STATES
SECURITIES AND EXCHANGE COMMISSION
Washington, D.C. 20549
Form 10-K
|
| | |
| þ | | ANNUAL REPORT PURSUANT TO SECTION 13 OR 15(d) OF THE SECURITIES EXCHANGE ACT OF 1934 |
For the fiscal year ended January 1,December 30, 2012
or
|
| | |
| o | | TRANSITION REPORT PURSUANT TO SECTION 13 OR 15(d) OF THE SECURITIES EXCHANGE ACT OF 1934 |
| | | For the transition period from to . |
Commission file number: 000-30361001-35406
Illumina, Inc.
(Exact name of registrant as specified in Its charter)
|
| | |
| Delaware | | 33-0804655 |
(State or other jurisdiction of incorporation or organization) | | (I.R.S. Employer Identification No.) |
5200 Illumina Way San Diego, California | | 92122 |
| (Address of principal executive offices) | | (Zip Code) |
Registrant’s telephone number, including area code: (858) 202-4500
Securities registered pursuant to Section 12(b) of the Act:
|
| | |
| Title of each class | | Name of each exchange on which registered |
| Common Stock, $0.01 par value (including associated Preferred Stock Purchase Rights) | | The NASDAQ Global Select Market |
Securities registered pursuant to Section 12(g) of the Act: None
Indicate by check mark if the registrant is a well-known seasoned issuer, as defined in Rule 405 of the Securities Act. Yes þ No o
Indicate by check mark if the registrant is not required to file reports pursuant to Section 13 or Section 15(d) of the Act. Yes o No þ
Indicate by check mark whether the registrant (1) has filed all reports required to be filed by Section 13 or 15(d) of the Securities Exchange Act of 1934 during the preceding 12 months (or for such shorter period that the registrant was required to file such reports), and (2) has been subject to such filing requirements for the past 90 days. Yes þ No o
Indicate by check mark whether the registrant has submitted electronically and posted on its corporate Web site, if any, every Interactive Data File required to be submitted and posted pursuant to Rule 405 of Regulation S-T during the preceding 12 months (or for such shorter period that the registrant was required to submit and post such files). Yes þ No o
Indicate by check mark if disclosure of delinquent filers pursuant to Item 405 of Regulation S-K is not contained herein, and will not be contained, to the best of registrant’s knowledge, in definitive proxy or information statements incorporated by reference in Part III of this Form 10-K or any amendment to this Form 10-K. o
Indicate by check mark whether the registrant is a large accelerated filer, an accelerated filer, a non-accelerated filer, or a smaller reporting company. See the definitions of “large accelerated filer,” “accelerated filer” and “smaller reporting company” in Rule 12b-2 of the Exchange Act. (Check one):
|
| | | |
Large accelerated filer þ | Accelerated filer o | Non-accelerated filer o | Smaller reporting company o |
| | | (Do not check if a smaller reporting company) | |
Indicate by check mark whether the registrant is a shell company (as defined in Rule 12b-2 of the Exchange Act). Yes o No þ
As of January 31, 2012,2013, there were 122,327,021shares124,040,754 shares (excluding 44,674,33946,449,505 shares held in treasury) of the Registrant’s Common Stock outstanding. The aggregate market value of the Common Stock held by non-affiliates of the Registrant as of July 3, 20112, 2012 (the last business day of the registrant’s most recently completed second fiscal quarter), based on the closing price for the Common Stock on The NASDAQ Global Select Market on July 1, 2011June 29, 2012 (the last trading day before July 3, 2011)2, 2012), was $9.3 billion.$3.8 billion. This amount excludes an aggregate of approximately 1.529.3 million shares of Common Stock held by officers and directors and each person known by the registrant to own 10% or more of the outstanding Common Stock. Exclusion of shares held by any person should not be construed to indicate that such person possesses the power, directly or indirectly, to direct or cause the direction of the management or policies of the registrant, or that the registrant is controlled by or under common control with such person.
DOCUMENTS INCORPORATED BY REFERENCE
Portions of the registrant’s definitive proxy statement for the 20122013 annual meeting of stockholders are incorporated by reference into Items 10 through 14 of Part III of this Report.
ILLUMINA, INC.
FORM 10-K
FOR THE FISCAL YEAR ENDED JANUARY 1,December 30, 2012
TABLE OF CONTENTS
Special Note Regarding Forward-Looking Statements
This annual report on Form 10-K contains “forward-looking statements” within the meaning of Section 27A of the Securities Act of 1933, as amended, and Section 21E of the Securities Exchange Act of 1934, as amended. These statements discuss our current expectations concerning future results or events, including our future financial performance. We make these forward-looking statements in reliance on the safe harbor protections provided under the Private Securities Litigation Reform Act of 1995. These statements include, among others:
statements concerning our expectations as to our future financial performance, results of operations, or other operational results or metrics;
statements concerning the benefits that we expect will result from our business activities and certain transactions we have completed, such as product introductions, increased revenue, decreased expenses, and avoided expenses and expenditures; and
statements of our expectations, beliefs, future plans and strategies, anticipated developments (including new products)products and services), and other matters that are not historical facts.
These statements may be made expressly in this document or may be incorporated by reference to other documents we have filed or will file with the Securities and Exchange Commission, or SEC. You can identify many of these statements by looking for words such as “anticipates,” “believes,” “can,” “continue,” “could,” “estimates,” “expects,” “intends,” “may,” “plans,” “potential,” “predicts,” “should,” or “will” or the negative of these terms or other comparable terminology and similar references to future periods. These forward-looking statements are subject to numerous assumptions, risks, and uncertainties that may cause actual results or events to be materially different from any future results or events expressed or implied by us in those statements. Many of the factors that will determine or affect these results or events are beyond our ability to control or project. Specific factors that could cause actual results or events to differ from those in the forward-looking statements include:
our ability to maintain our revenue levels and profitability during periods of research funding reduction or uncertainty and adverse economic and business conditions, including as a result of slowing economic growth in the United States or worldwide;
our ability to further develop and commercialize our sequencing, array, PCR, consumables, and consumablesdiagnostics technologies and to deploy new products, services, and applications, and expand the markets, for our technology platforms;
our ability to manufacture robust instrumentation and consumables;
our ability to successfully identify and integrate acquired technologies, products, or businesses;
our expectations and beliefs regarding future prospects and growth of the business and the markets in which we operate;
the assumptions underlying our critical accounting policies and estimates, including our estimates regarding stock volatility and other assumptions used to estimate the fair value of share-based compensation; the future cash flows used to estimate the cease-use loss upon our exit of certain facilities; and expected future amortization of acquired intangible assets;
our belief that the investments we hold are not other-than-temporarily impaired;
our assessments and estimates that determine our effective tax rate;
our belief that our cash and cash equivalents, investments, and cash generated from operations will be sufficient to meet our working capital, capital expenditures, and other liquidity requirements for at least the next 12 months;
our assessments and beliefs regarding the future outcome of pending legal proceedings and the liability, if any, that we may incur as a result of those proceedings; and
other factors detailed in our filings with the SEC, including the risks, uncertainties, and assumptions described in Item 1A “Risk Factors” below, or in information disclosed in public conference calls, the date and time of which are released beforehand.
Our forward-looking statements speak only as of the date of this annual report. We undertake no obligation, and do not intend, to publicly update or revise forward-looking statements, to review or confirm analysts'analysts’ expectations, or to provide interim reports or updates on the progress of any current financial quarter, whether as a result of new information, future events, or otherwise. All subsequent written and oral forward-looking statements attributable to us or persons acting on our behalf are expressly qualified in their entirety by the cautionary statements contained in this annual report. Given these uncertainties, we caution investors not to unduly rely on our forward-looking statements.
Available Information
Our annual report on Form 10-K, quarterly reports on Form 10-Q, current reports on Form 8-K, and all amendments to those reports are available free of charge on our website, www.illumina.com. The information on our website is not incorporated by reference into this report. Such reports are made available as soon as reasonably practicable after filing with, or furnishing to, the SEC. The SEC also maintains an Internet site at www.sec.gov that contains reports, proxy and information statements, and other information regarding issuers that electronically file with the SEC. Copies of our annual report on Form 10-K will be made available, free of charge, upon written request.
Illumina®, illuminaDx®illuminaDx, BaseSpace®, BaseSpace, BeadArray, BeadXpress®, BlueGnome, cBot, CSPro®, DASL®, DesignStudio, Eco, Epicentre®, GAIIx, Genetic Energy, Genome Analyzer, GenomeStudio®, GoldenGate®, HiScan®, HiSeq®, Infinium®, iSelect®, MiSeq®, MiSeqDx, Nextera®, NuPCR, SeqMonitor, Solexa®, TruSeq®, TruSight, VeraCode®, the pumpkin orange color, and the Genetic Energy streaming bases design are certain of our trademarks. This report also contains brand names, trademarks, or service marks of companies other than Illumina, and these brand names, trademarks, and service marks are the property of their respective holders.
Unless the context requires otherwise, references in this annual report on Form 10-K to “Illumina,” the “Company,” “we,” “us,” and “our” refer to Illumina, Inc. and its subsidiaries.
PART I
ITEM 1. Business
Overview
We are a leading developer, manufacturer, and marketer of life science tools and integrated systems for the analysis of genetic variation and function. We were incorporated in California in April 1998 and reincorporated in Delaware in July 2000. Our principal executive offices are located at 5200 Illumina Way, San Diego, California 92122. Our telephone number is (858) 202-4500.
Using our proprietary technologies, we provide a comprehensive line of genetic analysis solutions, with products and services that serve a broad range of highly interconnected markets, including sequencing, genotyping, and gene expression, and molecular diagnostics.expression. Our customers include leading genomic research centers, academic institutions, government laboratories, and clinical research organizations, as well as pharmaceutical, biotechnology, agrigenomics, and consumer genomics companies.companies, and in vitro fertilization clinics.
Our broad portfolio of systems, consumables, and analysis tools are designed to simplify genetic analysis. This portfolio addresses a range of genomic complexity, price points, and throughputs, enabling researchers to select the best solution for their scientific challenge. In 2007, through our acquisition of Solexa, Inc., we acquired our proprietaryOur leading edge sequencing by synthesis (SBS) technology that is at the heart of our leading-edge sequencing instruments. These systemsinstruments can be used to efficiently perform a range of nucleic acid (DNA, RNA) analyses on large numbers of samples. For more focused studies, our array-based solutions provide ideal tools to perform genome-wide association studies (GWAS) involving single-nucleotide polymorphism genotyping and copy number variation analyses, as well as gene expression profiling, and other DNA, RNA, and protein studies.
In 2012 and early 2013, we took significant steps to support our goal of becoming the leader in genomic-based diagnostics by acquiring BlueGnome Ltd. (BlueGnome) in September 2012 and signing a definitive agreement to acquire Verinata Health, Inc. (Verinata) in January 2013. Our acquisition of BlueGnome, a leading provider of solutions for the screening of genetic abnormalities associated with developmental delay, cancer, and infertility, enhances our ability to establish integrated solutions in reproductive health and cancer. Upon completion of the Verinata acquisition, our focus on reproductive health will be further strengthened by having access to Verinata’s verifi® prenatal test, the broadest non-invasive prenatal test (NIPT) available today for high-risk pregnancies, and what we believe to be the most comprehensive intellectual property portfolio in the NIPT industry. To further enhance our genetic analysis workflows, in January 2011 we acquired Epicentre Technologies Corporation, a leading provider of nucleic acid sample preparation reagents and specialty enzymes for sequencing and microarray applications. In 2010, through our acquisition of Helixis, Inc. (Helixis), we expanded our portfolio to include real-time polymerase chain reaction (PCR), one of the most widely used technologies in life sciences. Our Eco Real-Time PCR System provides researchers with an affordable, full-featured system to perform targeted validation studies.
Industry Background
Genetics Primer
The instruction set for all living cells is encoded in deoxyribonucleic acid, or DNA, with the complete set of DNA for any organism referred to as its genome. DNA contains small regions called genes, which comprise a string of nucleotide bases labeled A, C, G, and T, representing adenine, cytosine, guanine, and thymine, respectively. These nucleotide bases are present in a precise order known as the DNA sequence. When a gene is “expressed,” a partial copy of its DNA sequence - called messenger RNA (mRNA) - is used as a template to direct the synthesis of a particular protein. Proteins, in turn, direct all cellular function. The illustration below is a simplified gene expression schematic.
Variations among organisms are due, in large part, to differences in their DNA sequences. Changes caused by insertions, deletions, inversions, or duplications of nucleotide bases may result in certain genes becoming over-expressed (excessive protein production), under-expressed (reduced protein production), or silenced altogether, sometimes triggering changes in cellular function. These changes can be the result of heredity, but most often they occur at random. The most common form of variation in humans is called a single nucleotide polymorphism (SNP), which is a variation in a single position of a nucleotide base in a DNA sequence. Copy number variations (CNVs) occur when there are fewer or more copies of certain genes, segments of a gene, or stretches of DNA.
In humans, genetic variation accounts for many of the physical differences we see (e.g., height, hair, eye color, etc.). More importantly, these genetic variations can have medical consequences affecting disease susceptibility, including predisposition to complex genetic diseases such as cancer, diabetes, cardiovascular disease, and Alzheimer'sAlzheimer’s disease. They can also impact an individual'sindividual’s response to certain drug treatments, causing them to respond well, not respond at all, or experience adverse side effects - an area of study known as pharmacogenomics.
Scientists are studying these variations and their consequences in humans, as well as a broad range of animals, plants, and microorganisms. Researchers investigating human, viral, and bacterial genetic variation are helping us to better understand the mechanisms of disease, and thereby develop more effective therapeutics and diagnostics. Greater insight into genetic variation in plants (e.g., food and biofuel crops) and animals (e.g., livestock and domestic animals) is enabling scientists to improve crop yields and animal breeding programs.
The methods for studying genetic variation and biological function include sequencing, SNP genotyping, CNV analysis, gene expression profiling, and gene regulation and epigenetic analysis, each of which is addressed by our breadth of products and services.
Life Sciences Research Primer
Life science research encompasses the study of all living things, from humans, animals, and plants, to viruses and bacteria. It is being performed in government, university, pharmaceutical, biotechnology, and agrigenomics laboratories around the world, where scientists are seeking to expand our knowledge of the biological functions essential for life. Beginning at the genetic level, where our tools are used to elucidate the correlation between gene sequence and biological processes, life science research expands to include the study of the cells, tissues, organs, systems, and other components that make up living organisms. This research supports development of new, more effective clinical diagnostics and medicines to improve human health, as well as advances in agriculture and animal husbandry to meet the world'sworld’s growing needs for food and energy.
Molecular Diagnostics Primer
Molecular diagnostic assays (or tests) are designed to identify the biological indicators linked with disease and drug metabolism,response, providing physicians with information to more effectively diagnose, treat, and monitor both acute and chronic disease conditions. They are an integral part of personalized healthcare, where the unique makeup of each individual willcan be taken into account in diagnosing disease and managing treatment through the use of more tailored therapies. Biological indicators that can be measured by these assays include protein or gene expression, methylation levels, copy number variations, and the presence or absence of a specific gene or group of genes.
There are molecular diagnosticdiagnostics assays on the market, including assays for infectious disease, cancer, and heart disease, as well as molecular-based drug metabolism and response assays to help physicians select the most effective therapy with the fewest side effects. Our innovative technologies and products are contributing to the development of a wide range of potential genomic-based molecular diagnosticdiagnostics assays. Our own efforts in this area are currently focused on the identification of certain genetic markers with potential diagnostic and therapeutic utility.
Growing news coverage about the clinical relevance of newly discovered genetic markers has prompted consumer interest in having personal genomes analyzed, sparking the development of the consumer genomics market. We believe there are distinct medical benefits, especially for people with family histories of certain diseases, of knowing yourpotential disease predisposition.predispositions. Several companies, including Illumina, now offer personal sequencing or genotyping services, working with physician groups and genetic counselors to interpret the results for consumers.
We believe the growth in consumer genomics and the use of moleculargenomic-based diagnostic assays will trigger a fundamental shift in the practice of medicine and the economics of the pharmaceutical industry and health care by facilitating an increased emphasis on preventative and predictive molecular medicine, ushering in the era of personalized medicine.
Our Principal Markets
From the company'scompany’s inception, we have believed that the analysis of genetic variation and function will play an increasingly important role in molecular biology, and that by empowering genetic analysis, our tools will advance disease research, drug development, and the creation of molecular diagnostic tests. In addition to developing sequencing- and array-based solutions for life science, applied, and consumer genomics markets, we are making inroads intofacilitating the emerging molecular diagnostics market.transition of sequencing to the clinic, by supporting and carrying out clinical trials to gather data for regulatory submissions in the US and globally, and establishing infrastructure to offer products designed and manufactured in compliance with global quality standards for medical devices.
Life Sciences Research Market
Our core business is in the life sciences research market, which consists of laboratories generally associated with universities, medical research centers, and government institutions, as well as biotechnology and pharmaceutical companies. Researchers at these institutions are using our products and services in a broad spectrum of scientific activities, such as: next-generation sequencing, mid-to-high-complexity genotyping and gene expression (for whole-genome discovery and profiling), and low complexity genotyping and gene expression (for high-throughput targeted screening). DNA sequencing is growing the most rapidly among these three areas due to the creation of next generation sequencing technologies, such as SBS.technologies. It is fueled by private and public funding, new global initiatives to broadly characterize genetic variation, and the migration of legacy genetic applications to sequencing-based technologies.
Applied Markets
We provide products and services for various other markets, which we refer to as “applied markets.” The largest among these is the “AgBio”agricultural market, where government and corporate researchers use our sequencing and array-based tools to accelerate and enhance agricultural research. For example, we currently offer microarrays that contain SNPs for custom and focused genotyping of seeds and crops (such as maize, tomatoes, apples, and peaches)potatoes), livestock (such as cattle, horses, pigs, goats, and sheep), and companion animals (such as dogs). Customers use these tools to perform selective breeding through high-value trait screening methods, thereby accelerating and enhancing the process as compared to traditional methods such as cross-breeding. We have developed a high-growth recurring revenue business in both the livestock and agricultural segments, which represented approximately 12% of our shipments on a dollar basis in 2011. Emergingand emerging opportunities in the applied markets include forensics and pet genomics.
Molecular Diagnostics Market
Molecular diagnostics is the fastest growing segment of the diagnostics market. Genetics and oncology represent the primary areas of growth within molecular diagnostics. At present, this growth is largely driven by infectious disease testing, but molecular diagnostics is rapidly expanding into new areas such as reproductive health (including non-invasive prenatal testingtesting) and cancer management.management - both are areas of focus for our diagnostics business. The increasing efficacy of molecular diagnostics is driven by the continued discovery of genetic markers with proven clinical utility, the increasing adoption of genetic-based diagnostic tests, and the expansion of reimbursement programs to include a greater number of approved molecular diagnostic tests. We believe our sequencing and array instrument platforms are foundational to continued growth in this market,market.
In September 2012 we acquired BlueGnome, a leading provider of solutions for screening genetic abnormalities associated with developmental delay, cancer, and infertility. The combination of BlueGnome’s solutions with our microarray
and sequencing platforms will enable the development of next-generation tools for these markets. In January 2013, we intendsigned a definitive agreement to submitacquire Verinata Health, Inc. Upon completion of the Verinata acquisition, our iScanfocus on reproductive health will be further strengthened by having access to Verinata’s verifi® prenatal test, the broadest non-invasive prenatal test (NIPT) available today for high-risk pregnancies, and what we believe to be the most comprehensive intellectual property portfolio in the NIPT industry.
In December 2012, we submitted a 510(k) application for a version of our MiSeq systemssystem (the MiSeqDx) to the U.S. Food and Drug Administration, or FDA, for clearancemarketing as a cleared device for use with in vitro diagnostic (IVD) products. In connection with our anticipated FDA submission of the MiSeqDx system, we have initiatedsubmitted two cystic fibrosis (CF) assays - a clinical trialdiagnostic assay and a carrier screening assay - to the FDA that, if cleared, would be sold as IVD kits to be run on the MiSeqDx system. The MiSeqDx Cystic Fibrosis Diagnostic Assay is designed for a cytogeneticssimultaneous detection of all mutations and variants within the cystic fibrosis transmembrane conductance regulator (CFTR) gene. The test is intended to be used on our iScan instrument platform as an aid in the postnatal diagnosis of chromosomal abnormalities knownindividuals with suspected CF or congenital bilateral absence of vas deferens (CBAVD). Results of this test are intended to be associated with developmental delayinterpreted by a certified clinical molecular geneticist or equivalent. The MiSeqDx Cystic Fibrosis Carrier Screening Assay is designed for simultaneous detection of clinically relevant variants within the CFTR gene, including those currently recommended for carrier screening purposes by the American College of Medical Genetics (ACMG) and mental retardation. Following completionthe American College of the required clinical trial, we intendObstetricians and Gynecologists (ACOG). The test is intended to seek FDA clearancebe used in general population screening to determine CF carrier status, as an aid in newborn screening for the iScan instrument platformCF, and related reagents. In addition, we have initiated development of clinical diagnostic tests on the MiSeq systemas an initial genetic test to aid in the areasdiagnosis of genetics and infectious disease, and upon completion of the required work we intend to submit these to the FDA for clearance. Our research efforts in the development of cancer diagnostic panels (initially focusing on ovarian, gastric, and colorectal cancers) continues, and we have filed provisional patent applications on our discoveries to date.individuals with suspected CF or CBAVD.
In addition, asAs the molecular diagnostics market continues to evolve and emerge, we believe the translational and consumer genomic market will prove to be another growth opportunity for us. These markets include consumer basedIn September 2012, Illumina introduced TruSight content sets for use by laboratories with next-generation sequencing systems such as the MiSeq. Comprised of oligonucleotide probes targeting genes and gene regions thought to be relevant for specific genetic solutions as well as clinical applicationsdiseases or conditions, TruSeq content sets are designed for use by laboratories in which our technology can be used to offer comprehensivethe development of their own unique targeted sequencing and genotyping service solutions to clinicians and consumers in laboratory settings.tests.
Consumer Genomics Markets
New sequencing and genotyping technologies, such as those developed by Illumina, are driving down the cost of performing thesecomprehensive sequencing and genotyping analyses, which we believe are increasingly valuable inrapidly paving the way to improving diagnosing diseaseof diseases and evaluatingevaluation of disease risk.
Consumer genomics is a nascent market, but one we believe has the potential for high growth as the cost per analysis continues to drop. In June 2009, we launched our Individual Genome Sequencing Service, the first physician-intermediated personal genome sequencing service for consumers. Built around physician-patient consultation, the service requires a physician'sphysician’s order to initiate the process, with genome sequencing performed using our CLIA-certified, CAP-accredited laboratory. We have established collaborations with partners to perform the secondary data analysis of personal genomes (such as calculation of disease risk, ancestry, and information on traits of interest). Some of our partners, as well as other companies in the direct-to-consumer market, use our genotyping technology and products to perform personal genotyping services.
Our Principal Technologies
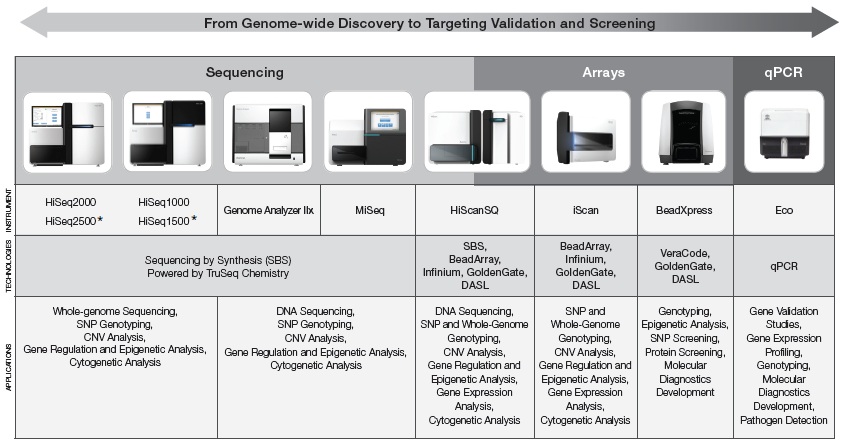
Our unique technology platforms enable the scale of experimentation necessary for genome-wide discovery, target selection, and validation studies (see Figure 1 below). More than 8,000 customer-authored scientific publicationspapers have been published to date using these technologies, representing the efforts of a large and dynamic Illumina user community. Through rapid innovation, we believe we are changing the economics of genetic research, enabling projects oncethat were previously considered unapproachable now to be within reach of more investigators.unapproachable.
Figure 1: Illumina Platform Overview:
* Commercially available in the second half of 2012.
Sequencing Technology
DNA sequencing is the process of determining the order of nucleotide bases (A, C, G, or T) in a DNA sample. Our HiSeq 2500/2000, HiSeq 1500/1000, Genome Analyzer IIx, MiSeq, and HiScanSQ systems represent a family of systems that we believe are setting the standard for productivity, cost-effectiveness, and accuracy among next-generation sequencing technologies. They are used by customers to perform whole-genome, de novo, and targeted re-sequencing of genomes, and to analyze specific gene regions and genes.
Whole-genome sequencing determines an organism'sorganism’s complete DNA sequence. In de novo sequencing, the goal is to sequence a representative sample from a species never before sequenced. In targeted re-sequencing, a sequence of nucleotide bases is compared to a standard or reference sequence from a previously sequenced species to identify changes that reflect genetic variation. Understanding the similarities and differences in DNA sequence between and within species furthers our understanding of the function of the structures encoded in the DNA.
Our DNA sequencing technology is based on our proprietary reversible terminator-based sequencing chemistry, referred to as sequencing by synthesis (SBS) biochemistry. In SBS, single stranded DNA is extended from a priming site, one base at a time, using reversible terminator nucleotides. These are DNA bases that can be added to a growing second strand, but which initially cannot be further extended. This means that at each cycle of the chemistry, only one base can be added. Each base that is added includes a fluorescent label that is specific to the particular base (A, C, G, or T). Following incorporation, the
emitted light can be imaged to determine its color and thus determine the base. Once this is done, an additional step removes both the fluorescence and the blocking group that had prevented further extension of the second strand. This allows another base to be added, and the cycle can then be repeated. Our technology is capable of generating over 600 billion bases of DNA sequence from a single experiment with a single sample preparation. Key aspects of the SBS chemistry are the subject of significant intellectual property owned by us.
In our DNA sequencing systems, we apply the SBS biochemistry on microscopic clusters of DNA. Each cluster starts as a single DNA molecule fragment, typically a few hundred bases long, attached to the inside surface of a flow cell. We then use a proprietary amplification biochemistry to create copies of each starting molecule. As the copies are made, they are covalently linked to the surface so they cannot diffuse away. After a number of cycles of amplification, each cluster might have approximately 1,000 copies of the original starting molecule, but still be only about a micron (one-millionth of a meter) in diameter. By making so many copies, the fluorescent signal from each cluster is significantly increased. Because the clusters are so small, hundreds of millions of clusters can be independently formed inside a single flow cell. This large number of clusters can then be sequenced simultaneously by alternate cycles of SBS biochemistry and fluorescent imaging. Sequence reads are analyzed using specially developed data analysis software.
With the ability to generate over 600 Gb of DNA sequence per run on our highest throughput sequencing instruments, the HiSeq 2500/2000, our SBS sequencing technology provides researchers with the broadesta broad range of applications and the opportunityability to sequence even large mammalian genomes in days rather than weeks or years. Our highest throughput sequencing instrument, the HiSeq 2500, has the ability to generate up to 600 gigabases (Gb) (five human genomes) of DNA sequence in ten days, or up to 120 Gb in approximately one day in rapid run mode. Since the launch of our first Genome Analyzersequencing system in 2007, our systems have reduced the cost of sequencing by more than a factor of 100.
BeadArray Technology
Our BeadArray technology combines microscopic beads and a substrate in a proprietary manufacturing process to produce arrays that can perform many assays simultaneously, enabling large-scale analysis of genetic variation and biological function in a unique high-throughput, cost effective, and flexible manner. The arrays manufactured using BeadArray technology are imaged by our iScan, HiScan, and HiScanSQ systems for a broad range of DNA and RNA analysis applications including SNP discovery, SNP genotyping, CNV analysis, gene expression analysis, and methylation analysis. In the course of six years, we have increased the content capacity on a single array from 100,000 markers to 20 million markers.
Our proprietary BeadArray technology consists of microscopic silica beads, with each bead covered with hundreds of thousands of copies of oligonucleotides, or oligos, that act as the capture sequences in one of our assays. We deploy our BeadArray technology on BeadChips - silicon wafers the size of a microscope slide, with varying numbers of sample sites per slide. BeadChips are chemically etched to create tens of millions of wells for each sample site.
We create unique bead pools, or sensors, for different DNA and RNA analysis applications by affixing thousands to millions8
An experiment is performed by preparing a sample, such as DNA, and introducing it to the array. The molecules in the sample bind to their matching molecules on the coated beads. The molecules in either the sample or on the bead are labeled with fluorescent dye either before or after the binding, which can be detected by shining a laser on the BeadChip. This allows the detection of the molecules resulting in a quantitative analysis of the sample.
Using our BeadArray technology, we achieve high-throughput analysis with a high density of test sites per array, and are able to format arrays in various configurations. We seek to maximize cost effectiveness by reducing consumption of expensive consumables and valuable samples, and through the low manufacturing costs associated with our technologies. Our ability to vary the size, shape, and format of the well patterns and to create specific bead pools for different applications provides the flexibility to address multiple markets and market segments. These features enable our BeadArray technology to be applied to high-growth markets of SNP genotyping and CNV analysis and have allowed us to be a key player in the gene expression
market.
VeraCode Technology
Our proprietary VeraCode technology is a detection method for multiplex assays that require high precision, accuracy, and speed. When deployed on our BeadXpress Reader System, VeraCode technology provides a high-throughput solution for biomarker research and validation, pharmaceutical development, industrial and agriculture testing, clinical research, forensics, and molecular diagnostic assay development.
The VeraCode technology platform leverages the power of digital holographic codes to provide a detection method for multiplex assays. VeraCode enables low-cost multiplexing from 1 to 384-plex in a single well. The VeraCode technology consists of cylindrical glass beads (measuring 240 microns in length by 28 microns in diameter) inscribed with a unique digital holographic code to designate and track the specific analyte or genotype of interest throughout the multiplex reaction. When excited by a laser, each VeraCode bead emits a unique code image, allowing for quick and specific detection by the BeadXpress Reader System.
Depending on the desired multiplex levels, assays are created by pooling microbeads with code diversities from one to several hundred. Unlike traditional microarrays, the VeraCode microbeads are used in solution, which takes advantage of solution-phase kinetics for more rapid hybridization times, dramatically reducing the time to achieve results.
Eco Real-Time PCR Technology
In 2010, we purchased Helixis Inc. and its novel real-time PCR technology and introduced the Eco Real-Time PCR System to the market. Real-Time PCR (also known as quantitative PCR or qPCR) is used to amplify and simultaneously quantify a targeted DNA molecule, with applications in gene expression, viral quantification, array data validation, pathogen detection, and genotyping. The procedure follows the same steps as PCR, whereby thermal cycling (alternately heating and cooling the DNA sample from 20 to 40 times) causes the DNA to self-replicate, resulting in the doubling of DNA product with each cycle. Real-time PCR uses various fluorescent detection chemistries to enable the monitoring of the PCR reaction as it progresses. Data are collected at each cycle rather than at the end of the reaction, providing higher precision, increased sensitivity, increased dynamic range, and higher resolution.
The Eco System combines a proprietary thermal system, four-color multiplex capabilities, and a fine-tuned optical system to deliver accurate qPCR results. Its unique design provides superior thermal uniformity, supporting high-quality PCR performance for demanding applications such as high resolution melt (HRM) curve analysis used for SNP genotyping, DNA fingerprinting, species identification, HLA compatibility typing, allelic prevalence, and DNA methylation analysis. Measuring just over one cubic foot in size, we believe the Eco System'sSystem’s overall performance rivals larger, more expensive systems.
Our Products
Using our proprietary technologies, our products give our customers the ability to analyze the genome at any level of complexity, from whole-genome sequencing to low-multiplex assays, and enable us to serve a number of markets, including research, agriculture, forensics, pharmaceuticals, and genomic-based molecular diagnostics.
The majority of our product sales consist of instruments and consumables (which include reagents, flow cells, and BeadChips) based on our proprietary technologies. For the fiscal years ended December 30, 2012, January 1, 2012, and January 2, 2011 and January 3, 2010,, instrument sales comprised 35%27%, 36%35%, and 34%36%, respectively, of total revenues, and consumable sales represented 56%64%, 56%, and 59%56%, respectively, of total revenues.
Sequencing Platforms
Based on our proprietary SBS technology, our next-generation sequencing platforms are designed to meet the workflow, output, and accuracy demands of a full range of sequencing applications. Designed for high-throughput (upsequencing, the HiSeq 2500 is a fast, easy-to-use instrument that can generate either up to 600 Gb per runof data in high-output mode or up to 80120 Gb in rapid run mode. In the high-output mode, the HiSeq 2500 processes either up to five human genomes (120 Gb per day) sequencing, the HiSeq 2000 is fast, easy-to-use, and cost-effective, generating the sequence of twogenome) in ten days or a single human genomesgenome at 30×30x coverage for less than $5,000 (USD) in consumable cost per genome.approximately one day. Offering the same cost per data output and user experience,flexibility, the HiSeq 10001500 accommodates lower throughput needs, with an easy upgrade path to the HiSeq 2000.2500. Launched in 2011, our MiSeq Personal Sequencing System delivers the fastest time to an answer (as little as 2-3 hours following mid-2012 performance enhancements)hours) and offers a breadth of sequencing applications in a compact and economical instrument to meet the needs of individual researchers. In January 2012, we announced the HiSeq 2500 sequencing system, which will allow customers to sequence an entire human genome in approximately a day (up to 120 Gb in 27 hours or 600 Gb
per run). Commercial shipments of the HiSeq 2500 are expected to commence in the second half of 2012.
Sequencing/Array Combination Platforms
The HiScanSQ combines our SBS sequencing technology and HiScan microarray analysis instrumentation into one system, with a modular design that can evolve with changing research needs. This flexible system allows researchers to use our sequencing and array technologies interactively to bring increased power to their experiments.
Array Platforms
The HiScan and iScan Systems are dedicated array scanners that support the rapid, sensitive, and accurate imaging of our array-based genetic analysis products. They incorporate high-performance lasers, optics, and detection systems, delivering sub-micron resolution and unmatched throughput rates. The HiScan and iScan support our Infinium, GoldenGate, DASL, gene expression, and methylation assays. Our BeadXpress Reader is designed for both small and high-throughput laboratories conducting molecular testing with multiplexed-based assays deployed on our VeraCode bead technology. It supports a wide range
Consumables
We have developed a variety of sample preparation and sequencing kits to simplify workflows and accelerate analysis. Some provide all the necessary consumables needed for analyses, such as our Standard Sequencing Kit (SBS chemistry on our sequencing platforms) and Infinium Assay Kit (array-based genotyping on our array platforms). Others support more discrete analyses, such as our Paired-End Genomic DNA Sample Prep Kit for streamlining library preparation for the generation of 200-500 kb insert paired-end reads for sequencing, gene expression, and epigenetic analysis. Our TruSeq SBS Sequencing Kit enhances sequencing studies with our HiSeq, Genome Analyzer IIx, and MiSeq systems, by enabling researchers to extend the read lengths, achieve higher Gb of mappable data, and deliver the highest yield of perfect reads to maximize the ability to accurately characterize the genome. Through our acquisition of Epicentre Technologies Corporation in 2011, we acquired the proprietary Nextera technology for next-generation sequencing library preparation. This technology has enabled us to offer sequencing library preparation kits with lower sample input requirements that greatly simplify genetic analysis workflows and significantly reduce the time from sample preparation to answer.
Our InfiniumHD Whole-Genome BeadChips represent our most technologically advanced multi-sample DNA analysis microarrays, enabling the interrogation of up to approximately 5 million markers per sample, depending on the BeadChip. The most recent additions to the Omni family, the HumanOmni5-Quad, the HumanOmni2.5, and the HumanOmni1S BeadChips, provide comprehensive coverage of common and rare variants identified by the 1000 Genomes Project for performing rich GWAS projects. This product line also includes agriculturally relevant genome panels such as the BovineHD and MaizeSNP50 BeadChips.
For researchers who want to study focused genomic regions of interest, or are interested in organisms for which there are no standard products, we offer iSelect Custom Genotyping BeadChips. Easily developed to fit any experimental design, these SNP genotyping arrays can be used to investigate from 3,000 to 1,000,000 markers targeting any species.
Through our acquisition of BlueGnome in 2012, we are a leading provider of solutions for the screening of genetic abnormalities associated with developmental delay, cancer, and infertility. BlueGnome supplies to some of the world’s leading in vitro fertilization (IVF) centers a preimplantation genetic screening (PGS) test for counting the chromosomes in a single human cell. Studies have shown that PGS improves IVF success, increasing pregnancy rates for women and reducing miscarriages and multiple births.
Our reproductive health offerings also include CytoChip, a test for the investigation of genetic abnormalities mainly associated with developmental delay or with complex leukemias. CytoChip is used by more than 200 labs across 40 countries worldwide as a first-line cytogenetic test, replacing traditional G-band karyotyping.
Real-time PCR Platforms
The Eco Real-Time PCR System provides fast, accurate qPCR results. Its icon-driven user interface simplifies experimental design and setup, while a straightforward workflow streamlines operation, enabling the system to perform qPCR on 48 samples in less than 40 minutes. As our first entry into the qPCR market, we believe the smaller, lower-cost, full-featured Eco System will enable more scientists to use real-time PCR technology in their research.
Our Services
In addition to the products we supply to customers, we also provide sequencing and genotyping services through our CLIA-certified, CAP-accredited laboratory.
FastTrack Services
One of the ways in which we compete and extend the reach of our systems in the genetic analysis market is to deliver services that leverage our proprietary technologies and the expertise of our scientists to perform genotyping and sequencing
services for our customers. We began offering genotyping services to academic institutions, biotechnology, and pharmaceutical customers in 2002. The in-house molecular geneticists that make up our FastTrack Genotyping team help customers perform GWAS projects, linkage analysis, and fine mapping studies to meet their deadlines, employing a range of our products, including standard and custom GoldenGate, standard Infinium and Infinium HD, and iSelect Infinium assays. These projects range in size from a few hundred to over 10,000 samples.
After five years of building an infrastructure to support genotyping services, we expanded to deliver sequencing services in 2007. We continue to combine the power of our proprietary SBS technology, with the consultative and analytical capabilities of our FastTrack Sequencing team to execute high-value projects such as whole-genome sequencing, targeted resequencing, digital expression profiling, and small RNA discovery. Projects range from small sample sets requiring as little as one run, to large-scale projects such as de novo whole-genome sequencing that demand multiple instruments running in parallel for extended periods of time.
Service Partnership Programs
To complement our own service capabilities, we have developed partnered programs such as our Certified Service Providers (CSPro) and Illumina Genome Network (IGN), to create a world-wide network of Illumina technology-enabled service offerings that broaden our market reach. Illumina CSPro is a collaborative service partnership established between Illumina and leading genome centers and research laboratories to ensure the delivery of high-quality genetic analysis services. It provides a competitive advantage for service providers, while also ensuring that customers will receive Illumina data quality and service. To become a CSPro provider, participating laboratories must complete a three-phased Illumina certification process. There are over 65 Illumina CSPro-certified organizations worldwide providing sequencing, genotyping, and gene expression services using our technologies and products.
Introduced in July 2010, the IGN links researchers interested in conducting large whole genome sequencing projects with leading institutes worldwide that possess our next-generation sequencing technology. The IGN provides a cost-effective and dependable way to complete large sequencing projects. All IGN partners are experienced and well-published using Illumina technology, and each has completed Illumina'sIllumina’s Certified Service Provider (CSPro) certification. Each IGN partner possesses ten or more high-throughput Illumina sequencing systems, (HiSeq 2000 systems and/or Genome Analyzers), providing the scalability to handle even the largest sequencing projects with rapid completion times. Current members include: the Broad Institute, British Columbia Cancer Agency'sAgency’s Genome Science Centre, Cold Spring Harbor Laboratory, University of Washington Department of Genome Sciences, National Center for Genome Resources, Macrogen/Genomic Medicine Institute, and Illumina'sIllumina’s own FastTrack Services.
Individual Genome Sequencing
Introduced inSince June 2009, Illumina's Clinical Services Laboratory has been offering the Individual Genome Sequencing Service providesproviding personal genome sequencing for consumers. It is performed infrom our CLIA-certified, CAP-accredited laboratory using ourIllumina next-generation sequencing technology. We offer a variety of reporting options. The service is built around physician-patient consultation, with a physician's order required to initiate the process. The offering includes sequencing of an individual's DNA to 30-times depth, providing information on SNP variation and other structural characteristics of the genome such as insertions, deletions, and rearrangements. We are collaborating with a number of partners to provide secondary data analysis such as calculation of disease risk, ancestry, and information on traits of interest. The serviceIndividual Genome Sequencing Service requires individuals to follow our physician-mediated process, which involves pre-service consultation patientand informed consent and a seven-day “cooling off” period during whichthat includes review of the patient may withdraw consent.information potentially to be learned in the report. The final genome data is returned to the physician who in turn delivers itthen meets with the patient and discusses implications and possible actions based on the results. If the physician and patient agree, the information can also be downloaded to the consumer.individual's personal iPad® for additional exploration. We are collaborating with a number of partners to provide additional evaluations, such as ancestry, and information on traits of interest.
Intellectual Property
We have an extensive intellectual property portfolio, including, as of February 1, 2012,2013, ownership of, or exclusive licenses to, 235270 issued U.S. patents and 173172 pending U.S. patent applications, including 11 allowed applications that have not yet issued as patents. Our issued patents include those directed to various aspects of our arrays, assays, oligo synthesis, sequencing technology, instruments, and chemical detection technologies, and have terms that expire between 20122013 and 2030. We continue to file new patent applications to protect the full range of our technologies. We have filed or have been granted counterparts for many of these patents and applications in foreign countries.
We also rely upon trade secrets, know-how, copyright, and trademark protection, as well as continuing technological innovation and licensing opportunities to develop and maintain our competitive position. Our success will depend in part on our ability to obtain patent protection for our products and processes, to preserve our trade secrets, to enforce our patents, copyrights and trademarks, to operate without infringing the proprietary rights of third parties, and to acquire licenses related to enabling technology or products.
We are party to various exclusive and non-exclusive license agreements and other arrangements with third parties that grant us rights to use key aspects of our array and sequencing technologies, assay methods, chemical detection methods, reagent kits, and scanning equipment. We have exclusive licenses from Tufts University to patents that are directed to our BeadArray technology. These patents were filed by Dr. David Walt, who is a member of our board of directors, the Chairman of our Scientific Advisory Board, and one of our founders. Our exclusive licenses expire with the termination of the underlying patents, which will occur between 20122013 and 2020. We have additional nonexclusive license agreements with various third
parties for other components of our products. In most cases, the agreements remain in effect over the term of the underlying patents, may be terminated at our request without further obligation, and require that we pay customary royalties while the agreement is in effect.
Research and Development
We have made substantial investments in research and development since our inception. We have assembled a team of skilled scientists and engineers who are specialists in biology, chemistry, informatics, instrumentation, optical systems, software, manufacturing, and other related areas required to complete the development of our products. Our research and development efforts have focused primarily on the tasks required to optimize and support commercialization of the products and services derived from our technologies.
Our research and development expenses for fiscal 2012, 2011 2010,, and 20092010 were$231.0 million, $196.9 million, $177.9 million, and $140.6177.9 million, respectively. We expect research and development expense to increase during 20122013 as a result of the growth of our business and as we continue to expand our research and product development efforts.
Marketing and Distribution
Our current products address the genetic analysis portion of the life sciences market, in particular, experiments involving sequencing, SNP genotyping, and gene expression profiling. These experiments may be involved in many areas of biologic research, including basic human disease research, pharmaceutical drug discovery and development, pharmacogenomics, toxicogenomics, and animal and agricultural research. Our potential customers include leading genomic research centers, academic institutions, government laboratories, and clinical research organizations, as well as pharmaceutical, biotechnology, agri-genomics, and consumer genomics companies. The genetic analysis market is relatively new and emerging and its size and speed of development will ultimately be driven by, among other items:
the ability of the research community to extract medically valuable information from genomics and to apply that knowledge to multiple areas of disease-related research and treatment;
the availability of sufficiently low cost, high-throughput research and analysis tools to enable the large amount of experimentation and analysis required to study genetic variation and biological function; and
the availability of government and private industry funding to perform the research required to extract medically relevant information from genomic analysis.
We market and distribute our products directly to customers in North America, Europe, Latin America, and the Asia-Pacific region. In each of these areas, we have dedicated sales, service, and application support personnel responsible for expanding and managing their respective customer bases. In addition, in certain markets within Europe, the Asia-Pacific region, Latin America, the Middle East, and South Africa we sell our products and provide services to customers through distributors that specialize in life science products. Likewise, in the United States we sell our qPCR portfolio (including the Eco Real-Time PCR System and associated reagents) through a distributor. We expect to continue to increase our sales and distribution resources during 20122013 and beyond as we launch a number of new products and expand the number of customers that can use our products.
Manufacturing
We manufacture sequencing and array platforms, reagent kits, scanning equipment, and oligos. Our manufacturing capacity for consumables and instruments has grown during 20112012 to support increased customer demand. To continue to increase throughput and improve the quality and manufacturing yield as we increase the complexity of our products, we are exploring ways to continue increasing the level of automation in the manufacturing process. We adhere to access and safety standards required by federal, state, and local health ordinances, such as standards for the use, handling, and disposal of hazardous substances.
Raw Materials
Our manufacturing operations require a wide variety of raw materials, electronic and mechanical components, chemical and biochemical materials, and other supplies. We have multiple commercial sources for many of our components and supplies; however, there are some raw materials and components that we obtain from single source suppliers. To mitigate potential risks arising from single source suppliers, we believe that we can redesign our products for alternative components or
use alternative reagents, if required. In addition, while we generally attempt to keep our inventory at minimal levels, we purchase incremental inventory as circumstances warrant to protect our supply chain.
Competition
Although we believe that our products and services provide significant advantages over products and services currently available from other sources, we expect to continue to encounter intense competition from other companies that offer products and services for sequencing, SNP genotyping, gene expression, and molecular diagnostics markets. These include companies such as Affymetrix, Inc.; Agilent Technologies, Inc.; Complete Genomics, Inc.; Helicos BioSciences Corporation; General Electric Company; Life Technologies Corporation; Luminex Corporation; Pacific Biosciences of California, Inc.; QIAGEN N.V.; and Roche Diagnostics Corp., among others. Some of these companies have or will have substantially greater financial, technical, research, and other resources and larger, more established marketing, sales, distribution, and service organizations than we do. In addition, they may have greater name recognition than we do in the markets we address and in some cases a larger installed base of systems. Each of these markets is very competitive and we expect new competitors to emerge and the intensity of competition to increase. In order to effectively compete with these companies, we will need to demonstrate that our products have superior throughput, cost, and accuracy advantages over competing products.
Segment and Geographic Information
In accordance with the authoritative accounting guidance for segment reporting, we have determined that we have two operating segments for purposes of recording and reporting our financial results: Life Sciences and Diagnostics. Our Life Sciences operating segment includes all products and services related to the research market, namely the product lines based on our sequencing, BeadArray, VeraCode,array, and real-time PCR technologies. Our Diagnostics operating segment focuses on the emerging opportunity in molecular diagnostics. During all periods presented, our Diagnostics operating segment had limited activity. Accordingly, our financial results for both operating segments are reported on an aggregate basis as one reportable segment. We will begin reporting in two operating segments once revenues, operating profit or loss, or assets of the Diagnostics operating segment exceed 10% of the consolidated amounts.
We currently sell our products to a number of customers outside the United States, including customers in other areas of North America, Europe, and the Asia-Pacific region. Shipments to customers outside the United States totaled $526.8$580.1 million, or 50%51% of our total revenue, during fiscal 2011,2012, compared to $403.8$526.8 million, or 45%50%, and $319.1$403.8 million, or 48%45%, in fiscal 20102011 and 2009,2010, respectively. SalesThe U.S. dollar has been determined to customers outsidebe the functional currency of the United States were generally denominated in U.S. dollars. In 2008, we reorganized ourCompany’s international structureoperations due to establish more efficient channels among product development, product manufacturing, and sales. The reorganization increased our foreign subsidiaries' anticipated dependence on the U.S. entity for management decisions, financial support, production assets, and inventory thereby making the foreign subsidiaries more of a direct and integral component of the U.S. entity's operations. As a result, we reassessed the primary economic environment of our foreign subsidiaries and determined the subsidiaries are more U.S. dollar based, resulting in a U.S. dollar functional currency determination.subsidiaries. We expect that sales to international customers will continue to be an important and growing source of revenue. See note “15. Segment Information, Geographic Data, and Significant Customers” in Part II, Item 8 of this Form 10-K for further information concerning our foreign and domestic operations.
Backlog
Our backlog was $250.5approximately $260 million and $299.0$251 million at December 30, 2012 and January 1, 2012 and January 2, 2011,, respectively. Generally, our backlog consists of orders believed to be firm as of the balance sheet date; however, we may allow customers to make product substitutions as we launch new products. The timing of shipments depends on several factors, including agreed upon shipping schedules, which may span multiple quarters, and whether the product is catalog or custom. We expect an estimated 90%the majority of the backlog as of January 1,December 30, 2012 to be shipped within the fiscal year ending December 30, 2012.29, 2013. Although we generally recognize revenue upon the transfer of title to a customer, we may be required to defer the recognition of revenue even after title transfer depending on the specific arrangement with a customer and the applicable accounting treatment.
Seasonality
Historically, customer purchasing patterns have not shown significant seasonal variation, although demand for our
products is usually lowest in the first quarter of the calendar year and highest in the third quarter of the calendar year as a result, in part, of U.S. academic customers spending unused budget allocations before the end of the U.S. government'sgovernment’s fiscal year on September 30 of each year. During 2011, however,However, this historical pattern has decreased during the U.S.past two years as a result, in part, of uncertainty concerning government extended the timeframe over which the unused budget allocations could be utilized, which led to purchasing delays from someand academic research funding and reduced usage of our customers.consumable products during the summer vacation season.
Environmental Matters
We are committed to the protection of our employees and the environment. Our operations require the use of hazardous materials that subject us to a variety of federal, state, and local environmental and safety laws and regulations. We believe we are in material compliance with current applicable laws and regulations; however, we could be held liable for damages and fines should contamination of the environment or individual exposures to hazardous substances occur. In addition, we cannot predict how changes in these laws and regulations, or the development of new laws and regulations, will affect our business operations or the cost of compliance.
Government Regulation
Our products are not currently subjectAs we continue to FDA clearance or approval if they are not intended to be used for the diagnosis of disease. However, as we expand our product linelines to encompass products that are intended to be used for the diagnosis of disease, such as molecular diagnostic products, regulation by governmental authorities in the United States and other countries will be a significant factor in the development, testing, production, and marketing of such products. Products that we develop in the molecular diagnostic markets, depending on their intended use, will be regulated as medical devices by the FDA and comparable agencies of other countries and may require either receiving clearance following a pre-market notification process, also known as a 510(k) clearance, or premarket approval (PMA), from the FDA prior to marketing. Obtaining the requisite regulatory approvals can be expensive and may involve considerable delay.
The shorter 510(k) clearance process, which generally takes from three to six months after submission, but can take significantly longer, may be utilized if it is demonstrated that the new product is “substantially equivalent” to a similar product that has already been cleared by the FDA. The longer PMA process is much more costly, uncertain, and generally takes from nine months to two years after filing. Because we cannot be certain that any molecular diagnostic products that we develop will be subject to the shorter 510(k) clearance process, or will ultimately be approved at all, the regulatory approval process for such products may be significantly delayed and may be significantly more expensive than anticipated. If we fail to obtain, or experience significant delays in obtaining, regulatory approvals for molecular diagnostic products that we develop, we may not be able to launch or successfully commercialize such products in a timely manner, or at all.
Changes to the current regulatory framework, including the imposition of additional or new regulations, could arise at any time during the development or marketing of our products, which may negatively affect our ability to obtain or maintain FDA or comparable regulatory approval of our products, if required.
In addition, the regulatory approval or clearance process required to design, manufacture, market, sell, and sellsupport our existing and future products that are intended for, and marketed and labeled as, “Research Use Only,” or RUO, is uncertain if such products are used or could be used, even without our consent, for the diagnosis of disease. If the FDA or other regulatory authorities assert that any of our RUO products are subject to regulatory clearance or approval, our business, financial condition, or results of operations could be adversely affected.
Employees
As of January 1,December 30, 2012, we had a total of approximately 2,2002,400 employees. None of our employees are represented by a labor union. We consider our employee relations to be positive. Our success will depend in large part upon our ability to attract and retain employees. In addition, we employ a number of temporary and contract employees. We face competition in this regard from other companies, research and academic institutions, government entities, and other organizations.
Our business is subject to various risks, including those described below. In addition to the other information included in this Form 10-K, the following issues could adversely affect our operating results or our stock price.
We are subject to a takeover bid that may be disruptive to our business and threatens to adversely affect our business, financial condition, or results of operations.
CKH Acquisition Corp. and Roche Holding Ltd. (together, “Roche”) have commenced an unsolicited hostile cash tender offer to purchase all of our outstanding common stock. The Roche tender offer is subject to numerous conditions, some of which are at the discretion of Roche. Roche also announced that it intends to oppose the re-election of four directors serving on our board of directors whose terms expire at the 2012 annual meeting of stockholders, including the Chairman of the Board and our Chief Executive Officer. In connection with the Roche tender offer, four stockholder class action lawsuits have been filed against us, and we anticipate that additional lawsuits may be filed. Responding to the Roche tender offer, the adverse proxy solicitation, and the lawsuits may be a major distraction for management and may require us to incur significant costs. Moreover, the hostile and unsolicited nature of the offer may disrupt our business by causing uncertainty among current and potential employees, producers, suppliers, customers, and other constituencies important to our success, which could negatively impact our financial results and business initiatives. We believe the future trading price of our common stock is likely to be volatile and could be subject to wide price fluctuations based on many factors, including uncertainty associated with the unsolicited offer by Roche.
Our Certificate of Incorporation and Bylaws include anti-takeover provisions that may make it difficult for another company to acquire control of us or limit the price investors might be willing to pay for our stock.
Certain provisions of our Certificate of Incorporation and Bylaws could delay the removal of incumbent directors and could make it more difficult to successfully complete a merger, tender offer, or proxy contest involving us. These provisions include our Preferred Shares Rights Agreement (“Rights Agreement”), commonly known as a “poison pill” and provisions in our Certificate of Incorporation that give our Board the ability to issue preferred stock and determine the rights and designations of the preferred stock at any time without stockholder approval. The rights of the holders of our common stock will be subject to, and may be adversely affected by, the rights of the holders of any preferred stock that may be issued in the future. The issuance of preferred stock, while providing flexibility in connection with possible acquisitions and other corporate purposes, could have the effect of making it more difficult for a third party to acquire, or of discouraging a third party from acquiring, a majority of our outstanding voting stock. In addition, the staggered terms of our board of directors could have the effect of delaying or deferring a change in control. One of the conditions of the Roche tender offer is the removal or amendment of our Rights Agreement such that Roche’s acquisition of our stock would not trigger the provisions of the Rights Agreement. To date, our board has not agreed to such removal or amendment.
In addition, certain provisions of the Delaware General Corporation Law (“DGCL”), including Section 203 of the DGCL, may have the effect of delaying or preventing changes in the control or management of Illumina. Section 203 of the DGCL provides, with certain exceptions, for waiting periods applicable to business combinations with stockholders owning at least 15% and less than 85% of the voting stock (exclusive of stock held by directors, officers, and employee plans) of a company.
The above factors may have the effect of deterring hostile takeovers or otherwise delaying or preventing changes in the control or management of Illumina, including transactions in which our stockholders might otherwise receive a premium over the fair market value of our common stock.
Reduction or delay in research and development budgets and government funding may adversely affect our revenue.
A substantial portion of our revenue is derived from genomic research centers, academic institutions, government laboratories, and clinical research organizations, as well as pharmaceutical, biotechnology, agrigenomics, and consumer genomics companies, and their capital spending budgets can have a significant effect on the demand for our products and services. These budgets are based on a wide variety of factors, including the allocation of available resources to make purchases, funding from government sources, the spending priorities among various types of research equipment, and policies regarding capital expenditures during recessionary periods. Any decrease in capital spending or change in spending priorities of our customers could significantly reduce our revenue. Moreover, we have no control over the timing and amount of
purchases by our customers, and, as a result, revenue from these sources may vary significantly due to factors that can be difficult to forecast. Any delay or reduction in purchases by our customers or our inability to forecast fluctuations in demand could harm our future operating results.
The timing and amount of revenues from customers that rely on government and academic research funding may vary significantly due to factors that can be difficult to forecast, and there remains significant uncertainty concerning government and academic research funding worldwide as governments in the United States and Europe, in particular, focus on reducing fiscal deficits while at the same time confronting slowing economic growth. Research fundingFunding for life science research has increased more slowly during the past several years compared to previous years and has declined in some countries. Government funding of research and development is subject to the political process, which is inherently fluid and unpredictable. Other programs, such as defense, entitlement programs, or general efforts to reduce budget deficits could be viewed by governments as a higher priority. These budgetary pressures may result in reduced allocations to government
agencies that fund research and development activities, such as the U.S. National Institute of Health, or NIH. For instance, the significance and timing of anticipated reductions to the NIH budget from March 2013 may be significantly impacted by the sequestration provisions of the Budget Control Act of 2011 and whether these provisions remain in effect. Past proposals to reduce budget deficits have included reduced NIH and other research and development allocations. Any shift away from the funding of life sciences research and development or delays surrounding the approval of government budget proposals may cause our customers to delay or forego purchases of our products, which could adversely affect our business, financial condition, or results of operations.
We face intense competition, which could render our products obsolete, result insignificant price reductions, or substantially limit the volume of products that wesell.
We compete with life sciences companies that design, manufacture, and market products for analysis of genetic variation and biological function and other applications using a wide-range of competing technologies. We anticipate that we will continue to face increased competition as existing companies develop new or improved products and as new companies enter the market with new technologies. One or more of our competitors may render our technology obsolete or uneconomical. Some of our competitors have greater financial and personnel resources, broader product lines, a more established customer base, and more experience in research and development than we do. Furthermore, life sciences and pharmaceutical companies, which are our potential customers and strategic partners, could also develop competing products. We believe that customers in our markets display a significant amount of loyalty to their initial supplier of a particular product; therefore, it may be difficult to generate sales to potential customers who have purchased products from competitors. To the extent we are unable to be the first to develop or supply new products, our competitive position may suffer.
The market for molecular diagnostics products is currently limited and highly competitive, with several large companies already having significant market share, intellectual property portfolios, and regulatory expertise. Established diagnostic companies also have an installed base of instruments in several markets, including clinical and reference laboratories, which could deter acceptance of our products. In addition, some of these companies have formed alliances with genomics companies that provide them access to genetic information that may be incorporated into their diagnostic tests.
If we lose our key personnel or are unableOur acquisitions expose us to attract and retain additionalpersonnel, we may be unable to achieve our goals.
We are highly dependent on our management and scientific personnel, including Jay Flatley, our President and Chief Executive Officer. The loss of their servicesrisks that could adversely impact our ability to achieve our business objectives. The hostile and unsolicited nature of the Roche offer coupled with Roche's efforts to oppose the re-election of Mr. Flatley to our board of directors at the 2012 annual meeting of stockholders may adversely affect our business, and wemay not achieve the anticipated benefits of acquisitions of businesses ortechnologies.
As part of our strategy to develop and identify new products, services, and technologies, we have made, and may continue to make, acquisitions of technologies, products, or businesses. Acquisitions involve numerous risks and operational, financial, and managerial challenges, including the following, any of which could adversely affect our business, financial condition, or results of operations:
difficulties in integrating new operations, technologies, products, and personnel;
lack of synergies or the inability to realize expected synergies and cost-savings;
difficulties in managing geographically dispersed operations;
underperformance of any acquired technology, product, or business relative to our expectations and the price we paid;
negative near-term impacts on financial results after an acquisition, including acquisition-related earnings charges;
the potential loss of key employees, customers, and strategic partners of acquired companies;
claims by causing uncertainty among currentterminated employees and potential employees. shareholders of acquired companies or other third parties related to the transaction;
the issuance of dilutive securities, assumption or incurrence of additional debt obligations or expenses, or use of substantial portions of our cash;
diversion of management’s attention and company resources from existing operations of the business;
inconsistencies in standards, controls, procedures, and policies;
the impairment of intangible assets as a result of technological advancements, or worse-than-expected performance of acquired companies; and
assumption of, or exposure to, unknown contingent liabilities or liabilities that are difficult to identify or accurately quantify.
In addition, the continued growthsuccessful integration of our business depends on our ability to hire additional qualified personnel with expertise in molecular biology, chemistry, biologicalacquired businesses requires significant efforts and expense across all operational areas, including sales and marketing, research and development, manufacturing, finance, legal, and information processing, sales, marketing, and technical support. We compete for qualified management and scientific personnel with other life science companies, universities, and research institutions, particularly those focusing on genomics. Competition for these individuals, particularly in the San Diego and San Francisco area, is intense, and the turnover ratetechnologies. There can be high. Failureno assurance that any of the acquisitions we make will be successful or will be, or will remain, profitable. Our failure to attract and retain management and scientific personnel wouldsuccessfully address the above risks may prevent us from pursuing collaborationsachieving the anticipated benefits from any acquisition in a reasonable time frame, or developing our products or technologies. Additionally, integration of acquired companies and businesses can be disruptive, causing key employees of the acquired business to leave. Further, we use stock options and restricted stock units to provide incentives for our key personnel to remain with us and to align their interests with those of the Company by building long-term stockholder value. If our stock price decreases, the value of these equity awards decreases and therefore reduces a key employee's incentive to stay.at all.
Our success depends upon the continued emergence and growth of markets for analysisof genetic variation and biological function.
We design our products primarily for applications in the life sciences, diagnostic, agricultural, and pharmaceutical industries. The usefulness of our technologies depends in part upon the availability of genetic data and its usefulness in identifying or treating disease. We are focusing on markets for analysis of genetic variation and biological function, namely sequencing, genotyping, and gene expression profiling. These markets are new and emerging, and they may not develop as quickly as we anticipate, or reach their full potential. Other methods of analysis of genetic variation and biological function may emerge and displace the methods we are developing. Also, researchers may not be able to successfully analyze raw genetic data or be able to convert raw genetic data into medically valuable information. For instance, demand for our microarray products may be adversely affected if researchers fail to find meaningful correlations between genetic variation, such as SNPs, and disease susceptibility through genome wide association studies. In addition, factors affecting research and development spending generally, such as changes in the regulatory environment affecting life sciences and pharmaceutical companies, and changes in government programs that provide funding to companies and research institutions, could harm our business. If useful genetic data is not available or if our target markets do not develop in a timely manner, demand for our
products may grow at a slower rate than we expect, and we may not be able to sustain profitability.
If the quality of our products does not meet our customers'customers’ expectations, then our reputation could suffer and ultimately our sales and operating earnings could be negatively impacted.
In the course of conducting our business, we must adequately address quality issues associated with our products and services, including defects in our engineering, design, and manufacturing processes, as well as defects in third-party components included in our products. Because our instruments and consumables are highly complex, the occurrence of defects may increase as we continue to introduce new products and services and as we scale up manufacturing to meet increased demand for our products and services. Although we have established internal procedures to minimize risks that may arise from product quality issues, there can be no assurance that we will be able to eliminate or mitigate occurrences of these issues and associated liabilities. In addition, identifying the root cause of quality issues, particularly those affecting reagents and third-party components, may be difficult, which increases the time needed to address quality issues as they arise and increases the risk that similar problems could recur. Finding solutions to quality issues can be expensive, and we may incur significant costs or lost revenue in connection with, for example, shipment holds, product recalls, and warranty or other service obligations. In addition, quality issues can impair our relationships with new or existing customers and adversely affect our brand image, and our reputation as a producer of high quality products could suffer, which could adversely affect our business, financial condition, or results of operations.
Our continued growth is dependent on continuously developing and commercializing new products.
Our target markets are characterized by rapid technological change, evolving industry standards, changes in customer needs, existing and emerging competition, strong price competition, and frequent new product introductions. Accordingly, our continued growth depends on continuously developing and commercializing new products and services, including improving
our existing products and services, in order to address evolving market requirements on a timely basis. If we fail to innovate or adequately invest in new technologies, our products and services will become dated, and we could lose our competitive position in the markets that we serve as customers purchase new products offered by our competitors. We believe that successfully introducing new products and technologies in our target markets on a timely basis provides a significant competitive advantage because customers make an investment of time in selecting and learning to use a new product and may be reluctant to switch once that selection is made.
To the extent that we fail to introduce new and innovative products, or such products are not accepted in the market or suffer significant delays in development, we may lose market share to our competitors, which will be difficult or impossible to regain. An inability, for technological or other reasons, to develop successfully and timely introduce new products could reduce our growth rate or otherwise have an adverse effect on our business. In the past, we have experienced, and are likely to experience in the future, delays in the development and introduction of new products. There can be no assurance that we will keep pace with the rapid rate of change in our markets or that our new products will adequately meet the requirements of the marketplace, achieve market acceptance, or compete successfully with competing technologies. Some of the factors affecting market acceptance of new products and services include:
availability, quality, and price relative to competing products and services;
the functionality and performance of new and existing products and services;
the timing of introduction of new products or services relative to competing products and services;
scientists'scientists’ and customers'customers’ opinions of the utility of new products or services;
citation of new products or services in published research;
regulatory trends and approvals; and
general trends in life sciences research and applied markets.
We may also have to write off excess or obsolete inventory if sales of our products are not consistent with our expectations or the market requirements for our products change due to technical innovations in the marketplace.
If we do not successfully manage the development, manufacturing, and launch of new products or services, including product transitions, our financial results could be adversely affected.
We face risks associated with launching new products and pre-announcing products and services when the products or services have not been fully developed or tested. If our products and services are not able to deliver the performance or results
expected by our target markets or are not delivered on a timely basis, our reputation and credibility may suffer. If we encounter development challenges or discover errors in our products late in our development cycle, we may delay the product launch date. In addition, we may experience difficulty in managing or forecasting customer reactions, purchasing decisions, or transition requirements or programs (such as trade-in programs) with respect to newly launched products (or products in development) relative to our existing products, which could adversely affect sales of our existing products. The expenses or losses associated with unsuccessful product development or launch activities or lack of market acceptance of our new products could adversely affect our business, financial condition, or results of operations.
We depend on third-party manufacturers and suppliers for components and materials used in our products, and if shipments from these manufacturers or suppliers are delayed or interrupted, or if the quality of the components or materials supplied do not meet our requirements, we may not be able to launch, manufacture, or ship our products in a timely manner, or at all.
The complex nature of our products requires customized, precision-manufactured components and materials that currently are available from a limited number of sources, and, in the case of some components and materials, from only a single source. If deliveries from these vendors are delayed or interrupted for any reason, or if we are otherwise unable to secure a sufficient supply, we may not be able to obtain these components or materials on a timely basis or in sufficient quantities or qualities, or at all, in order to meet demand for our products. We may need to enter into contractual relationships with manufacturers for commercial-scale production of some of our products, or develop these capabilities internally, and there can be no assurance that we will be able to do this on a timely basis, in sufficient quantities, or on commercially reasonable terms. In addition, the lead time needed to establish a relationship with a new supplier can be lengthy, and we may experience delays in meeting demand in the event we must switch to a new supplier. The time and effort required to qualify a new supplier could result in additional costs, diversion of resources, or reduced manufacturing yields, any of which would negatively impact our operating results. Accordingly, we may not be able to establish or maintain reliable, high-volume manufacturing at commercially
reasonable costs or at all. In addition, the manufacture or shipment of our products may be delayed or interrupted if the quality of the components or materials supplied by our vendors does not meet our requirements. Current or future social and environmental regulations or critical issues, such as those relating to the sourcing of conflict minerals from the Democratic Republic of the Congo or the need to eliminate environmentally sensitive materials from our products, could restrict the supply of components and materials used in production or increase our costs. Any delay or interruption to our manufacturing process or in shipping our products could result in lost revenue, which would adversely affect our business, financial condition, or results of operations.
If we lose our key personnel or are unable to attract and retain additionalpersonnel, we may be unable to achieve our goals.
We are highly dependent on our management and scientific personnel, including Jay Flatley, our President and Chief Executive Officer. The loss of their services could adversely impact our ability to achieve our business objectives. In addition, the continued growth of our business depends on our ability to hire additional qualified personnel with expertise in molecular biology, chemistry, biological information processing, sales, marketing, and technical support. We compete for qualified management and scientific personnel with other life science companies, universities, and research institutions, particularly those focusing on genomics. Competition for these individuals, particularly in the San Diego and San Francisco area, is intense, and the turnover rate can be high. Failure to attract and retain management and scientific personnel would prevent us from pursuing collaborations or developing our products or technologies. Additionally, integration of acquired companies and businesses can be disruptive, causing key employees of the acquired business to leave. Further, we use stock options and restricted stock units to attract key personnel, incentivize them to remain with us, and align their interests with those of the Company by building long-term stockholder value. If our stock price decreases, the value of these equity awards decreases and therefore reduces a key employee’s incentive to stay.
If we are unable to increase our manufacturing capacity and develop and maintain operation of our manufacturing capability, we may not be able to launch or support our products in a timely manner, or at all.
We continue to rapidly increase our manufacturing capacity to meet the anticipated demand for our products. Although we have significantly increased our manufacturing capacity and we believe we have plans in place sufficient to ensure we have adequate capacity to meet our current business plans, there are uncertainties inherent in expanding our manufacturing capabilities, and we may not be able to sufficiently increase our capacity in a timely manner. For example, manufacturing and product quality issues may arise as we increase production rates at our manufacturing facilities and launch new products. Also, we may not manufacture the right product mix to meet customer demand, especially as we introduce new products. As a result, we may experience difficulties in meeting customer, collaborator, and internal demand, in which case we could lose customers or be required to delay new product introductions, and demand for our products could decline. Additionally, in the past, we have experienced variations in manufacturing conditions and quality control issues that have temporarily reduced or suspended production of certain products. Due to the intricate nature of manufacturing complex instruments, consumables, and products that contain DNA, we may encounter similar or previously unknown manufacturing difficulties in the future that could significantly reduce production yields, impact our ability to launch or sell these products (or to produce them economically), prevent us from achieving expected performance levels, or cause us to set prices that hinder wide adoption by customers.
Additionally, we currently manufacture in a limited number of locations. Our manufacturing facilities are located in San Diego and Hayward, California; Madison, Wisconsin; Singapore; and Little Chesterford,Cambridge, United Kingdom. These areas are subject to natural disasters such as earthquakes, wildfires, or floods. If a natural disaster were to damage one of our facilities significantly or if other events were to cause our operations to fail, we may be unable to manufacture our products, provide our services, or develop new products.
Also, many of our manufacturing processes are automated and are controlled by our custom-designed laboratory information management system (LIMS). Additionally, the decoding process in our array manufacturing requires significant network and storage infrastructure. If either our LIMS system or our networks or storage infrastructure were to fail for an extended period of time, it may adversely impact our ability to manufacture our products on a timely basis and could prevent us
from achieving our expected shipments in any given period.
Our acquisitions expose us to risks that could adversely affect our business, and wemay not achieve the anticipated benefits of acquisitions of businesses ortechnologies.
As part of our strategy to develop and identify new products, services, and technologies, we have made, and may continue to make, acquisitions of technologies, products, or businesses. Acquisitions involve numerous risks and operational, financial, and managerial challenges, including the following, any of which could adversely affect our business, financial condition, or results of operations:
difficulties in integrating new operations, technologies, products, and personnel;
lack of synergies or the inability to realize expected synergies and cost-savings;
difficulties in managing geographically dispersed operations;
underperformance of any acquired technology, product, or business relative to our expectations and the price we paid;
negative near-term impacts on financial results after an acquisition, including acquisition-related earnings charges;
the potential loss of key employees, customers, and strategic partners of acquired companies;
claims by terminated employees and shareholders of acquired companies or other third parties related to the transaction;
the issuance of dilutive securities, assumption or incurrence of additional debt obligations or expenses, or use of substantial portions of our cash;
diversion of management's attention and company resources from existing operations of the business;
inconsistencies in standards, controls, procedures, and policies;
the impairment of intangible assets as a result of technological advancements, or worse-than-expected performance of acquired companies; and
assumption of, or exposure to, unknown contingent liabilities or liabilities that are difficult to identify or accurately quantify.
In addition, the successful integration of acquired businesses requires significant efforts and expense across all operational areas, including sales and marketing, research and development, manufacturing, finance, legal, and information technologies. There can be no assurance that any of the acquisitions we make will be successful or will be, or will remain, profitable. Our failure to successfully address the above risks may prevent us from achieving the anticipated benefits from any acquisition in a reasonable time frame, or at all.
Any inability to effectively protect our proprietary technologies could harm our competitive position.
Our success depends to a large extent on our ability to develop proprietary products and technologies and to obtain patents and maintain adequate protection of our intellectual property in the United States and other countries. If we do not protect our intellectual property adequately, competitors may be able to use our technologies and thereby erode our competitive advantage. The laws of some foreign countries do not protect proprietary rights to the same extent as the laws of the United States, and
many companies have encountered significant challenges in establishing and enforcing their proprietary rights outside of the United States. These challenges can be caused by the absence of rules and methods for the establishment and enforcement of intellectual property rights outside of the United States.
The proprietary positions of companies developing tools for the life sciences, genomics, agricultural, and pharmaceutical industries, including our proprietary position, generally are uncertain and involve complex legal and factual questions. We will be able to protect our proprietary rights from unauthorized use by third parties only to the extent that our proprietary technologies are covered by valid and enforceable patents or are effectively maintained as trade secrets. We intend to apply for patents covering our technologies and products as we deem appropriate. However, our patent applications may be challenged and may not result in issued patents or may be invalidated or narrowed in scope after they are issued. Questions as to inventorship or ownership may also arise. Any finding that our patents or applications are unenforceable could harm our ability to prevent others from practicing the related technology, and a finding that others have inventorship or ownership rights to our patents and applications could require us to obtain certain rights to practice related technologies, which may not be available on
favorable terms, if at all. Furthermore, as issued patents expire, we may lose some competitive advantage as others develop competing products, and, as a result, we may lose revenue.
In addition, our existing patents and any future patents we obtain may not be sufficiently broad to prevent others from practicing our technologies or from developing competing products and may therefore fail to provide us with any competitive advantage. We may need to initiate lawsuits to protect or enforce our patents, or litigate against third party claims, which would be expensive, and, if we lose, may cause us to lose some of our intellectual property rights and reduce our ability to compete in the marketplace. Furthermore, these lawsuits may divert the attention of our management and technical personnel. There is also the risk that others may independently develop similar or alternative technologies or design around our patented technologies. In that regard, certain patent applications in the United States may be maintained in secrecy until the patents issue, and publication of discoveries in the scientific or patent literature tend to lag behind actual discoveries by several months.
We also rely upon trade secrets and proprietary know-how protection for our confidential and proprietary information, and we have taken security measures to protect this information. These measures, however, may not provide adequate protection for our trade secrets, know-how, or other confidential information. Among other things, we seek to protect our trade secrets and confidential information by entering into confidentiality agreements with employees, collaborators, and consultants. There can be no assurance that any confidentiality agreements that we have with our employees, collaborators, and consultants will provide meaningful protection for our trade secrets and confidential information or will provide adequate remedies in the event of unauthorized use or disclosure of such information. Accordingly, there also can be no assurance that our trade secrets will not otherwise become known or be independently developed by competitors.
Litigation, other proceedings, or third party claims of intellectual property infringement could require us to spend significant time and money and could prevent us from selling our products or services.
Our success depends, in part, on our non-infringement of the patents or proprietary rights of third parties. Third parties have asserted and may in the future assert that we are employing their proprietary technology without authorization. As we enter new markets or introduce new products, we expect that competitors will likely claim that our products infringe their intellectual property rights as part of a business strategy to impede our successful competition. In addition, third parties may have obtained and may in the future obtain patents allowing them to claim that the use of our technologies infringes these patents. We could incur substantial costs and divert the attention of our management and technical personnel in defending ourselves against any of these claims. Any adverse ruling or perception of an adverse ruling in defending ourselves against these claims could have an adverse impact on our stock price, which may be disproportionate to the actual import of the ruling itself. Furthermore, parties making claims against us may be able to obtain injunctive or other relief, which effectively could block our ability to develop further, commercialize, or sell products or services, and could result in the award of substantial damages against us. In the event of a successful infringement claim against us, we may be required to pay damages and obtain one or more licenses from third parties, or be prohibited from selling certain products or services. In addition, we may be unable to obtain these licenses at a reasonable cost, if at all. We could therefore incur substantial costs related to royalty payments for licenses obtained from third parties, which could negatively affect our gross margins. In addition, we could encounter delays in product introductions while we attempt to develop alternative methods or products. Defense of any lawsuit or failure to obtain any of these licenses on favorable terms could prevent us from commercializing products, and the prohibition of sale of any of our products or services could adversely affect our ability to grow or maintain profitability.
Our products, if used for the diagnosis of disease, could be subject to government regulation, and the regulatory approval and maintenance process for such products may be expensive, time-consuming, and uncertain both in timing and in outcome.
Products are not currently subject to FDA clearance or approval if they are not intended to be used for the diagnosis of disease. However, as we expand our product line to encompass products that are intended to be used for the diagnosis of disease, certain of our products are likely towill become subject to regulation by the FDA, or comparable agencies of other countries, including requirements for regulatory clearance or approval of such products before they can be marketed. Such regulatory approval processes or clearances may be expensive, time-consuming, and uncertain, and our failure to obtain or comply with such approvals and clearances could have an adverse effect on our business, financial condition, or operating results. In addition, changes to the current regulatory framework, including the imposition of additional or new regulations, could arise at any time during the development or marketing of our products, which may negatively affect our ability to obtain or maintain FDA or comparable regulatory approval of our products, if required.
Molecular diagnostic products, in particular, depending on their intended use, may be regulated as medical devices by the FDA and comparable agencies of other countries and may require either receiving clearance from the FDA following a pre-market notification process or premarket approval from the FDA, in each case prior to marketing. Obtaining the requisite
regulatory approvals can be expensive and may involve considerable delay. If we fail to obtain, or experience significant delays in obtaining, regulatory approvals for molecular diagnostic products that we develop, we may not be able to launch or successfully commercialize such products in a timely manner, or at all.
In addition, the regulatory approval or clearance process required to design, manufacture, market, sell, and sellsupport our existing and future products that are intended for, and marketed and labeled as, “Research Use Only,” or RUO, is uncertain if such products are used or could be used, even without our consent, for the diagnosis of disease. If the FDA or other regulatory authorities assert that any of our RUO products are subject to regulatory clearance or approval, our business, financial condition, or results of operations could be adversely affected.
Doing business internationally creates operational and financial risks for our business.
Conducting and launching operations on an international scale requires close coordination of activities across multiple jurisdictions and time zones and consumes significant management resources. If we fail to coordinate and manage these activities effectively, including the risks noted below, our business, financial condition, or results of operations could be adversely affected. We are focused on expanding our international operations in key markets. We have sales offices located internationally throughout Europe, the Asia-Pacific region, and Brazil, as well as manufacturing facilities in the United Kingdom and Singapore. During 2011,2012, the majority of our sales to international customers andwere denominated in foreign currencies while the majority of our purchases of raw materials from international suppliers were denominated in U.S. dollars. Shipments to customers outside the United States comprised 50%51%, 45%50%, and 48%45% of our total revenue for thefiscal years ended January 1, 2012 January 2, , 2011, and January 3, 2010, respectively. We intend to continue to expand our international presence by selling to customers located outside of the United States and we expect the total amount of non-U.S. sales to continue to grow.
International sales entail a variety of risks, including:
longer payment cycles and difficulties in collecting accounts receivable outside of the United States;
longer sales cycles due to the volume of transactions taking place through public tenders;
currency exchange fluctuations;
challenges in staffing and managing foreign operations;
tariffs and other trade barriers;
unexpected changes in legislative or regulatory requirements of foreign countries into which we sell our products;
difficulties in obtaining export licenses or in overcoming other trade barriers and restrictions resulting in delivery delays; and
significant taxes or other burdens of complying with a variety of foreign laws.
Changes in the value of the relevant currencies may affect the cost of certain items required in our operations. Changes in currency exchange rates may also affect the relative prices at which we are able sell products in the same market. Our revenues from international customers may be negatively impacted as increases in the U.S. dollar relative to our international customers local currency could make our products more expensive, impacting our ability to compete. Our costs of materials from international suppliers may increase if in order to continue doing business with us they raise their prices as the value of the U.S. dollar decreases relative to their local currency. Foreign policies and actions regarding currency valuation could result in actions by the United States and other countries to offset the effects of such fluctuations. The recent global financial downturn
has led to a high level of volatility in foreign currency exchange rates and that level of volatility may continue, which could adversely affect our business, financial condition, or results of operations.
We are subject to risks related to taxation in multiple jurisdictions and thepossible loss of the tax deduction on our outstanding convertible notes.jurisdictions.
We are subject to income taxes in both the United States and numerous foreign jurisdictions. Significant judgments based on interpretations of existing tax laws or regulations are required in determining the provision for income taxes. Our effective income tax rate could be adversely affected by various factors, including, but not limited to, changes in the mix of earnings in tax jurisdictions with different statutory tax rates, changes in the valuation of deferred tax assets and liabilities, changes in existing tax laws or tax rates, changes in the level of non-deductible expenses (including share-based compensation), changes in our future levels of research and development spending, mergers and acquisitions, or the result of examinations by various tax authorities. Although we believe our tax estimates are reasonable, if the IRSU.S. Internal Revenue Service or other taxing authority disagrees with the positions taken by the Company on its tax returns, we could have additional tax liability, including interest and penalties. If
material, payment of such additional amounts upon final adjudication of any disputes could have a material impact on our results of operations and financial position.
In addition, we could lose some or all of the tax deduction for interest expense associated with our outstanding convertible notes if these notes are not subject to the special Treasury Regulations governing contingent payment debt instruments, the notes are converted, or we invest in non-taxable investments.
An inability to manage our growth or the expansion of our operations could adversely affect our business, financial condition, or results of operations.
Our business has grown rapidly, with total revenues increasing from $73.5 million for the year ended January 1, 2006 to $1,055.5 million1.15 billion for the year ended January 1,December 30, 2012 and with the number of employees increasing from 375 to approximately 2,2002,400 during the same period. We expect to continue to experience substantial growth in order to achieve our operating plans. The continued global expansion of our business and addition of new personnel may place a strain on our management and operational systems. Our ability to effectively manage our operations and growth requires us to continue to expend funds to enhance our operational, financial, and management controls, reporting systems, and procedures and to attract and retain sufficient numbers of talented employees on a global basis. If we are unable to scale up and implement improvements to our manufacturing process and control systems in an efficient or timely manner, or if we encounter deficiencies in existing systems and controls, then we will not be able to make available the products required to successfully commercialize our technology. Our future operating results will depend on the ability of our management to continue to implement and improve our research, product development, manufacturing, sales and marketing, and customer support programs, enhance our operational and financial control systems, expand, train, and manage our employee base, integrate acquired businesses, and effectively address new issues related to our growth as they arise. There can be no assurance that we will be able to manage our recent or any future expansion or acquisition successfully, and any inability to do so could adversely affect our business, financial condition, or results of operations.
Our operating results may vary significantly from period to period, and we may not be able to sustain operating profitability.
Our revenue is subject to fluctuations due to the timing of sales of high-value products and services, the effects of new product launches and related promotions, the timing and availability of our customers'customers’ funding, the impact of seasonal spending patterns, the timing and size of research projects our customers perform, changes in overall spending levels in the life sciences industry, and other unpredictable factors that may affect customer ordering patterns. Given the difficulty in predicting the timing and magnitude of sales for our products and services, we may experience quarter-to-quarter fluctuations in revenue resulting in the potential for a sequential decline in quarterly revenue. While we anticipate future growth, there is some uncertainty as to the timing of revenue recognition on a quarterly basis. This is because a substantial portion of our quarterly revenue is typically recognized in the last month of a quarter and because the pattern for revenue generation during that month is normally not linear, with a concentration of orders in the final week of the quarter. In light of that, our revenue cut-off and recognition procedures, together with our manufacturing and shipping operations, may experience increased pressure and demand during the time period shortly before the end of a fiscal quarter.
A large portion of our expenses isare relatively fixed, including expenses for facilities, equipment, and personnel. In addition, we expect operating expenses to continue to increase significantly in absolute dollars, and we expect that our research and development and selling and marketing expenses will increase at a higher rate in the future as a result of the development and launch of new products. Accordingly, our ability to sustain profitability will depend, in part, on the rate of growth, if any, of our revenue and on the level of our expenses, and if revenue does not grow as anticipated, we may not be able to maintain annual or quarterly profitability. Any significant delays in the commercial launch of our products, unfavorable sales trends in our existing product lines, or impacts from the other factors mentioned above, could adversely affect our future revenue growth or cause a sequential decline in quarterly revenue. In addition, non-cash share-based compensation expense and expenses related to prior and future acquisitions are also likely to continue to adversely affect our future profitability. Due to the
possibility of significant fluctuations in our revenue and expenses, particularly from quarter to quarter, we believe that quarterly comparisons of our operating results are not a good indication of our future performance. If our operating results fluctuate or do not meet the expectations of stock market analysts and investors, our stock price could decline.
From time to time, we receive large orders that have a significant effect on our operating results in the period in which the order is recognized as revenue. The timing of such orders is difficult to predict, and the timing of revenue recognition from such orders may affect period to period changes in net sales. As a result, our operating results could vary materially from quarter to quarter based on the receipt of such orders and their ultimate recognition as revenue.
Changes in accounting standards and subjective assumptions, estimates, and judgments by management related to complex accounting matters could significantly affect our financial results or financial condition.
Generally accepted accounting principles and related accounting pronouncements, implementation guidelines, and interpretations with regard to a wide range of matters that are relevant to our business, such as revenue recognition, asset impairment and fair value determinations, inventories, business combinations and intangible asset valuations, and litigation, are highly complex and involve many subjective assumptions, estimates, and judgments. Changes in these rules or their interpretation or changes in underlying assumptions, estimates, or judgments could significantly change our reported or expected financial performance or financial condition.
Ethical, legal, and social concerns related to the use of genetic information could reduce demand for our products or services.
Our products may be used to provide genetic information about humans, agricultural crops, and other living organisms. The information obtained from our products could be used in a variety of applications, which may have underlying ethical, legal, and social concerns regarding privacy and the appropriate uses of the resulting information, including thepreimplantation genetic screening of embryos, prenatal genetic testing, genetic engineering or modification of agricultural products, or testing genetic predisposition for certain medical conditions.conditions, particularly for those that have no known cure. Governmental authorities could, for social or other purposes, call for limits on or regulation of the use of genetic testing or prohibit testing for genetic predisposition to certain conditions, particularly for those that have no known cure. Similarly, such concerns may lead individuals to refuse to use genetics tests even if permissible. These and other ethical, legal, and social concerns about genetic testing may limit market acceptance of our technology for certain applications or reduce the potential markets for our technology, either of which could have an adverse effect on our business, financial condition, or results of operations.
Our strategic equity investments may result in losses.
We periodically make strategic equity investments in various public and private companies with businesses or technologies that may complement our business. The market values of these strategic equity investments may fluctuate due to market conditions and other conditions over which we have no control. Other-than-temporary declines in the market price and valuations of the securities that we hold in other companies would require us to record losses in proportion to our ownership interest. This could result in future charges to our earnings. It is uncertain whether or not we will realize any long-term benefits associated with these strategic investments.
Security breaches and other disruptions could compromise our information and expose us to liability, which would cause our business and reputation to suffer.
In the ordinary course of our business, we collect and store sensitive data, including intellectual property, our proprietary business information, and that of our customers, and personally identifiable information of our customers and employees, in our data centers and on our networks. The secure maintenance of this information is important to our operations and business strategy. Despite our security measures, our information technology and infrastructure may be vulnerable to attacks by hackers or breached due to employee error, malfeasance or other disruptions. Any such breach could compromise our networks and the information stored there could be accessed, publicly disclosed, lost, or stolen. Any such access, disclosure, or other loss of information could result in legal claims or proceedings, liability under laws that protect the privacy of personal information, and damage to our reputation.
Conversion of our outstanding convertible notes may result in losses.
As of January 1,December 30, 2012, we had $40$40 million aggregate principal amount of convertible notes due 2014 and $920$920 million aggregate principal amount of convertible notes due 2016 outstanding. The notes are convertible into cash, and if applicable, shares of our common stock under certain circumstances, including trading price conditions related to our common
stock. If the trading price of our common stock remains significantly above the conversion price of $21.83 per share with respect to convertible notes due 2014 and $83.55 with respect to convertible notes due 2016, we expect that the noteholders will elect to convert the applicable notes. Upon conversion, we are required to record a gain or loss for the difference between the fair value of the notes to be extinguished and their corresponding net carrying value. The fair value of the notes to be extinguished depends on our current incremental borrowing rate. The net carrying value of our notes has an implicit interest rate of 8.3% with respect to convertible notes due 2014 and 4.5% with respect to convertible notes due 2016. If our incremental borrowing rate at the time of conversion is lower than the implied interest rate of the notes, we will record a loss in our consolidated statement of income during the period in which the notes are converted.
Our Certificate of Incorporation and Bylaws include anti-takeover provisions that may make it difficult for another company to acquire control of us or limit the price investors might be willing to pay for our stock.
Certain provisions of our Certificate of Incorporation and Bylaws could delay the removal of incumbent directors and could make it more difficult to successfully complete a merger, tender offer, or proxy contest involving us. These provisions include our Preferred Shares Rights Agreement, commonly known as a “poison pill” and provisions in our Certificate of Incorporation that give our Board the ability to issue preferred stock and determine the rights and designations of the preferred stock at any time without stockholder approval. The rights of the holders of our common stock will be subject to, and may be adversely affected by, the rights of the holders of any preferred stock that may be issued in the future. The issuance of preferred stock, while providing flexibility in connection with possible acquisitions and other corporate purposes, could have the effect of making it more difficult for a third party to acquire, or of discouraging a third party from acquiring, a majority of our outstanding voting stock. In addition, the staggered terms of our board of directors could have the effect of delaying or deferring a change in control.
In addition, certain provisions of the Delaware General Corporation Law (“DGCL”), including Section 203 of the DGCL, may have the effect of delaying or preventing changes in the control or management of Illumina. Section 203 of the DGCL provides, with certain exceptions, for waiting periods applicable to business combinations with stockholders owning at least 15% and less than 85% of the voting stock (exclusive of stock held by directors, officers, and employee plans) of a company.
The above factors may have the effect of deterring hostile takeovers or otherwise delaying or preventing changes in the control or management of Illumina, including transactions in which our stockholders might otherwise receive a premium over the fair market value of our common stock.
| |
| ITEM 1B. | Unresolved Staff Comments. |
None.
The following chart summarizes the facilities we lease as of January 1,December 30, 2012, including the location and size of each principal facility, and their designated use. We believe our facilities are adequate for our current and near-term needs, and that we will be able to locate additional facilities as needed.
|
| | | | | | | |
| | | Approximate | | | | Lease |
| Location | | Square Feet | | Operation | | Expiration Dates |
| San Diego, CA | | 502,000 |
| | R&D, Manufacturing, Warehouse, | | 2015 – 2031 |
| | | |
| | Distribution, and Administrative | | |
| Hayward, CA | | 109,000 |
| | R&D, Manufacturing, and Administrative | | 2013 – 2014 |
| Singapore | | 87,000 |
| | Manufacturing and Administrative | | 2013 – 2015 |
| Eindhoven, the Netherlands | | 42,000 |
| | Distribution and Administrative | | 2015 |
| Cambridge, United Kingdom | | 66,000 |
| | R&D, Manufacturing, and Administrative | | 2021 - 2024 |
| Madison, WI | | 27,000 |
| | R&D, Manufacturing, and Administrative | | 2018 |
| Other | | 19,000 |
| | R&D, Manufacturing, Sales, and Administrative | | 2013 - 2015 |
|
| | | | | | | |
| | | Approximate | | | | Lease |
| Location | | Square Feet | | Operation | | Expiration Dates |
| San Diego, CA | | 670,000* |
| | R&D, Manufacturing, Storage, | | 2012 – 2031 |
| | | |
| | Distribution, and Administrative | | |
| Hayward, CA | | 109,000 |
| | R&D, Manufacturing, and Administrative | | 2013 – 2014 |
| Singapore | | 68,000 |
| | Manufacturing and Administrative | | 2013 – 2015 |
| Eindhoven, the Netherlands | | 42,000 |
| | Distribution and Administrative | | 2015 |
| Little Chesterford, United Kingdom | | 42,000 |
| | R&D, Manufacturing, and Administrative | | 2024 |
| Madison, WI | | 33,000 |
| | R&D, Manufacturing, and Administrative | | 2012 |
| Other | | 35,000 |
| | R&D, Manufacturing, Sales, and Administrative | | 2012 – 2015 |
______________________
*In December 2010, we agreed to lease a facility in San Diego, California to serve as our new corporate headquarters, and we began the relocation process in late 2011. Although we expect to sublease our former corporate headquarters, comprising approximately 200,000 square feet, we have included the square footage in the table above as we will continue to be subject to rent and lease obligations for our former facility through October 2023.
| |
| ITEM 3. | Legal Proceedings. |
The Company isWe are involved in various lawsuits and claims arising in the ordinary course of business, including actions with respect to intellectual property, employment, and contractual matters. In connection with these matters, we assess, on a regular basis, the Company assesses contingencies to determine the degree of probability and range of possible loss for potential accrualbased on the developments in its financial statements. An estimated loss contingencythese matters. A liability is accruedrecorded in the financial statements if it is believed to be probable that a liabilityloss has been incurred and the amount of the loss can be reasonably estimated. We recorded a legal contingency loss of $3.0 million in aggregate within cost of product revenue in 2012. Because litigation is inherently unpredictable and unfavorable resolutions could occur, assessing contingencies is highly subjective and requires judgments about future events. The CompanyWe regularly reviews contingenciesreview outstanding legal matters to determine the adequacy of the accrualsliabilities accrued and related disclosures. The amount of ultimate loss may differ from these estimates. Each matter presents its own unique circumstances, and prior litigation does not necessarily provide a reliable basis on which to predict the outcome, or range of outcomes, in any individual proceeding. Because of the uncertainties related to the occurrence, amount, and range of loss on any pending litigation or claim, management iswe are currently unable to predict their ultimate outcome, and, with respect to determine whether aany pending litigation or claim where no liability has been incurred, oraccrued, to make a meaningful estimate of the reasonably possible loss or range of loss that could result from an unfavorable outcome. The Company believes, however,In the event that the liability, ifopposing litigants in outstanding litigations or claims ultimately succeed at trial and any resulting fromsubsequent appeals on their claims, any potential loss or charges in excess of any established accruals, individually or in the aggregate, amount of losses for any outstanding litigation or claim will notcould have a material adverse effect on the Company’s consolidatedour business, financial position, liquidity, orcondition, results of operations.operations, and/or cash flows in the period in which the unfavorable outcome occurs or becomes probable, and potentially in future periods.
On November 24, 2010, Syntrix Biosystems, Inc. filed suit against us in the United States District Court for the Western District of Washington at Tacoma (Case No. C10-5870-BHS) alleging that we willfully infringed U.S. Patent No. 6,951,682 by selling our BeadChip array products, and that we misappropriated Syntrix’s trade secrets. Fact and expert discovery is complete in the case. In November and December 2012, we filed motions for summary judgment that the patent is not infringed and is invalid, and that Syntrix’s trade secrets claims are barred by various statutes of limitation. Syntrix filed a motion for summary judgment that the patent is valid. On January 30, 2013, the court granted our motion for summary judgment on Syntrix’s trade secret claims, and dismissed those claims from the case. The court denied Syntrix’s motion for summary judgment on validity, and denied our motion for summary judgment for non-infringement and invalidity. A trial is scheduled to begin on February 26, 2013.
We have thoroughly investigated Syntrix’s claims and believe the claims are without merit. While we believe there is no legal basis for the alleged liability, we cannot estimate the possible loss or range of possible loss as there are significant legal and factual issues to be resolved. For example, each party has filed motions seeking to exclude portions of the other party’s expert testimony and to preclude the other party from introducing certain other evidence at trial. In addition to post-trial briefing, the parties would likely engage in appellate motion practice, the result of which is also unpredictable and could significantly affect the outcome of the case.
| |
| ITEM 4. | Mine Safety Disclosures. |
Not applicable.
PART II
| |
| ITEM 5. | Market for Registrant’s Common Equity, Related Stockholder Matters and Issuer Purchases of Equity Securities. |
Market Information
Our common stock has been quoted on The NASDAQ Global Select Market under the symbol “ILMN” since July 28, 2000. Prior to that time, there was no public market for our common stock. The following table sets forth, for the fiscal periods indicated, the quarterly high and low sales prices per share of our common stock as reported on The NASDAQ Global Select Market.
| | | | 2011 | | 2010 | 2012 | | 2011 |
| | High | | Low | | High | | Low | High | | Low | | High | | Low |
| First Quarter | $ | 74.12 |
| | $ | 61.87 |
| | $ | 40.90 |
| | $ | 29.76 |
| $ | 55.39 |
| | $ | 28.72 |
| | $ | 74.12 |
| | $ | 61.87 |
|
| Second Quarter | 76.81 |
| | 65.41 |
| | 45.72 |
| | 36.70 |
| 53.00 |
| | 37.77 |
| | 76.81 |
| | 65.41 |
|
| Third Quarter | 79.40 |
| | 39.82 |
| | 50.93 |
| | 41.15 |
| 49.27 |
| | 38.92 |
| | 79.40 |
| | 39.82 |
|
| Fourth Quarter | 40.53 |
| | 25.57 |
| | 66.59 |
| | 47.70 |
| 57.00 |
| | 44.78 |
| | 40.53 |
| | 25.57 |
|
Stock Performance Graph
The graph below compares the cumulative total stockholder returns on our common stock for the last five fiscal years with the cumulative total stockholder returns on the NASDAQ Composite Index and the NASDAQ Biotechnology Index for the same period. The graph assumes that $100 was invested on December 31, 200630, 2007 in our common stock and in each index and that all dividends were reinvested. No cash dividends have been declared on our common stock. Stockholder returns over the indicated period should not be considered indicative of future stockholder returns.
HoldersCompare 5-Year Cumulative Total Return Among Illumina Inc, NASDAQ Composite Index,
and NASDAQ Biotechnology Index
As of January 31, 2012 we had 231 record holders of our common stock.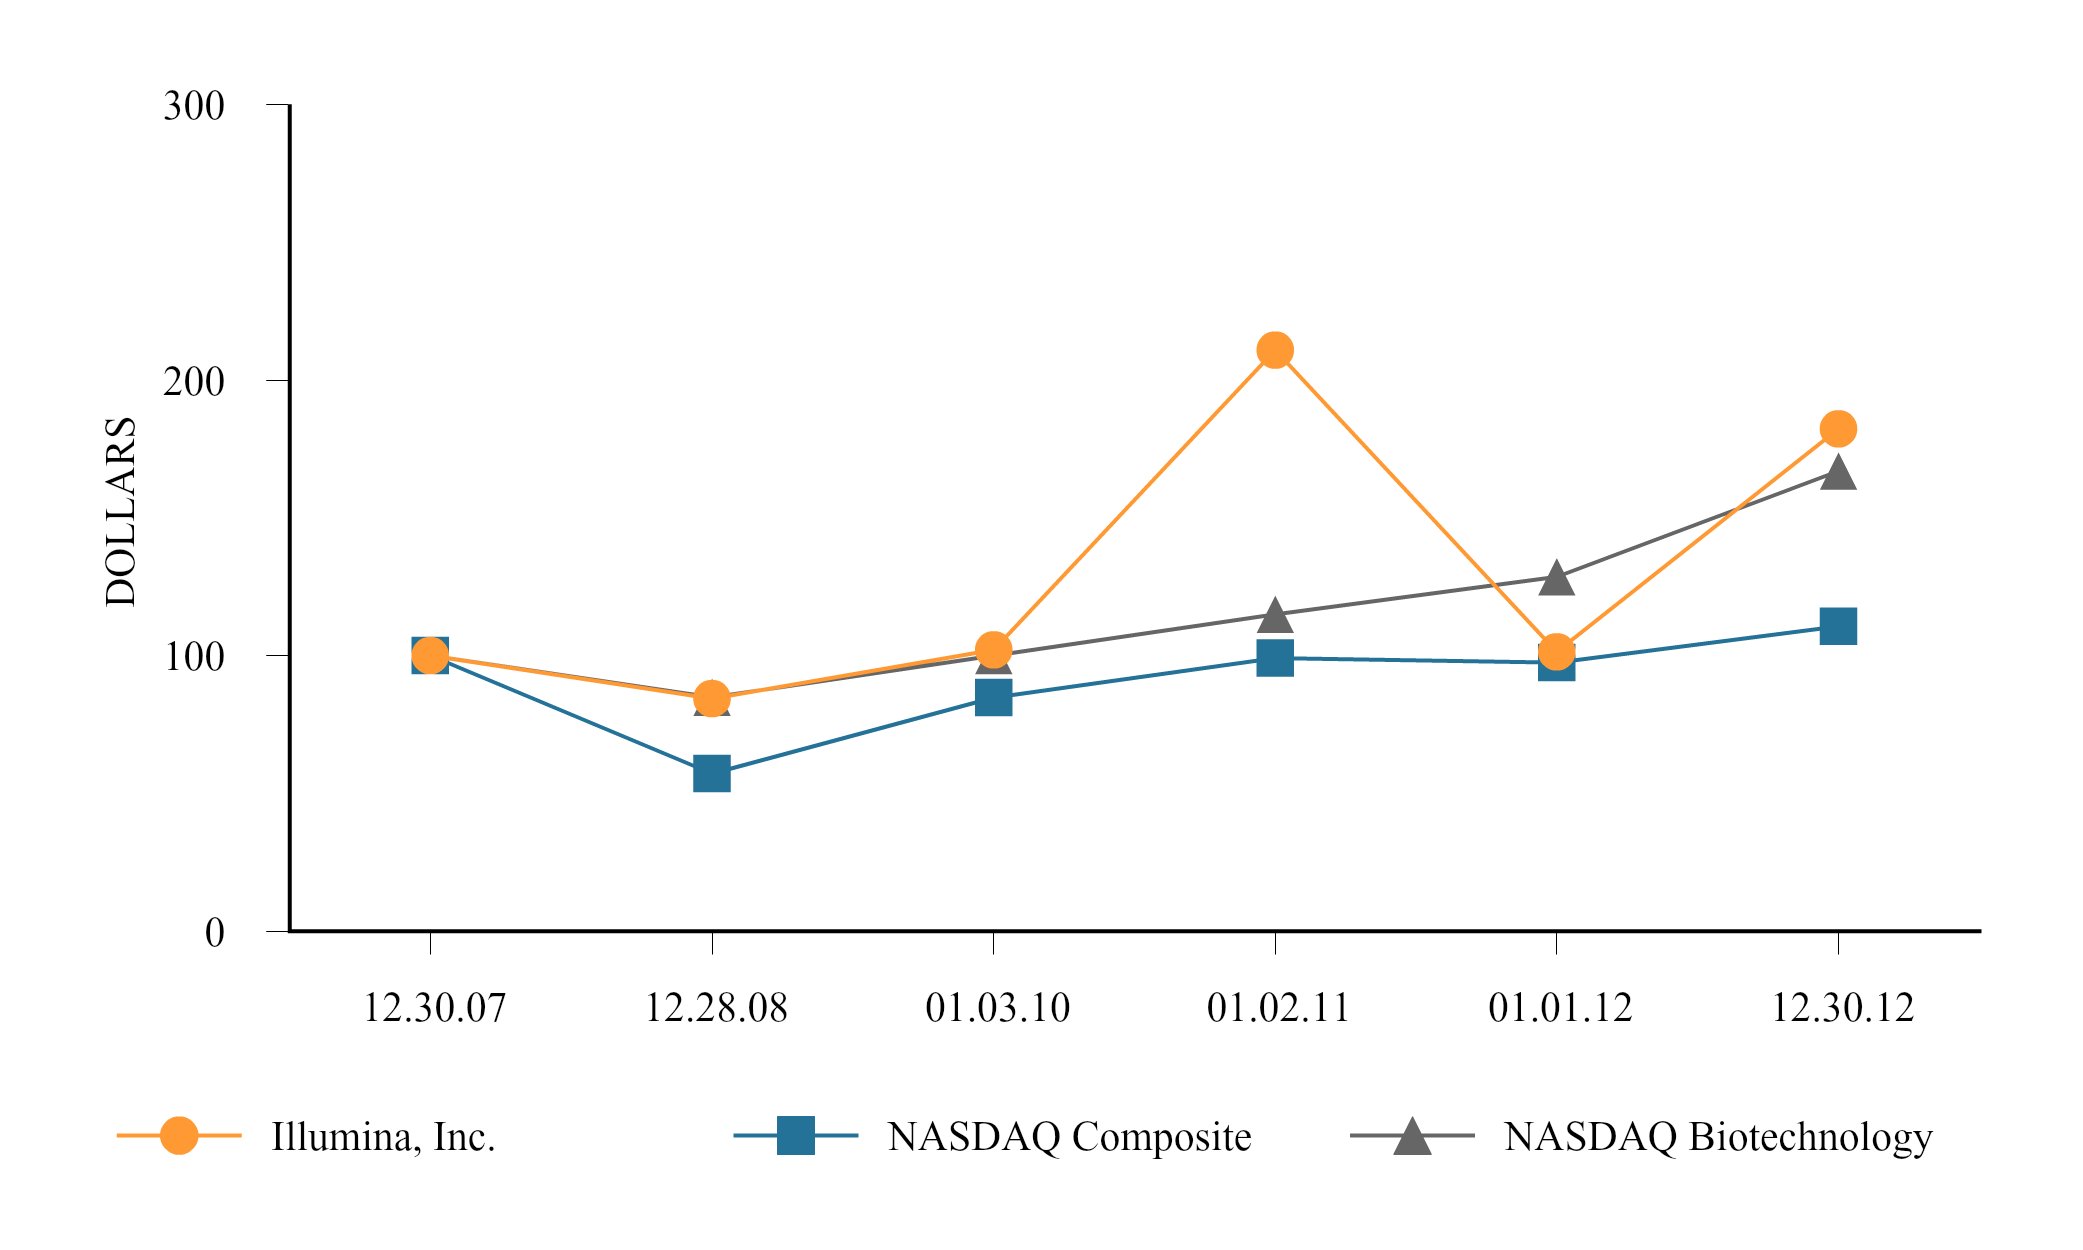
Holders
As of January 31, 2013 we had 224 record holders of our common stock.
Dividends
We have never paid cash dividends and have no present intention to pay cash dividends in the foreseeable future. The indentures for our 0.625% convertible senior notes due 2014 and 0.25% convertible senior notes due 2016, which notes are convertible into cash and, in certain circumstances, shares of our common stock, require us to increase the conversion rate applicable to the notes if we pay any cash dividends.
Purchases of Equity Securities by the Issuer
In August 2011, our boardOn April 18, 2012, the Company’s Board of directorsDirectors authorized a $100 million discretionary repurchase program. In July 2010, our board of directors authorized a $200$250 million stock repurchase program with $100 million allocated to repurchasing our common stock underbe effected via a combination of Rule 10b5-1 plan over a 12 month period and $100 million allocateddiscretionary share repurchase programs. The following table summarizes shares repurchased pursuant to repurchasing our common stock at management’s discretion during open trading windows. Suchthese programs were completed during the first three quarters of the fiscal year ended January 1, 2012, and there were no shares repurchased during the fiscal quarter ended January 1,December 30, 2012.
In addition, concurrently with the issuance of our convertible senior notes due 2016 in March 2011, 4,890,500 shares were repurchased for $314.3 million. |
| | | | | | | | | | | | | |
| Period | Total Number of Shares Purchased (1) | | Average Price Paid per Share | | Total Number of Shares Purchased as Part of Publicly Announced Programs | | Approximate Dollar Value of Shares that May Yet Be Purchased Under the Programs |
| October 1, 2012 - October 28, 2012 | 97,289 |
| | $ | 51.39 |
| | 97,289 |
| | $ | 187,518,994 |
|
| October 29, 2012 - November 25, 2012 | 207,558 |
| | 48.18 |
| | 207,558 |
| | 177,519,092 |
|
| November 26, 2012 - December 30, 2012 | 190,921 |
| | 52.38 |
| | 190,921 |
| | 167,519,168 |
|
| Total | 495,768 |
| | $ | 50.43 |
| | 495,768 |
| | $ | 167,519,168 |
|
____________
| |
| (1) | All shares purchased during the fiscal quarter ended December 30, 2012 were made in open-market transactions. |
Sales of Unregistered Securities
None during the fiscal quarter ended January 1,December 30, 2012.
| |
| ITEM 6. | Selected Financial Data. |
The following table sets forth selected historical consolidated financial data for each of our last five fiscal years during the period ended January 1,December 30, 2012.
Statement of Operations Data
| | | | Years Ended | Years Ended |
| | January 1, 2012 (52 weeks) | | January 2,
2011
(52 weeks) | | January 3,
2010
(53 weeks) | | December 28,
2008
(52 weeks) | | December 30,
2007 (52 weeks) | December 30, 2012 (52 weeks) | | January 1, 2012 (52 weeks) | | January 2,
2011
(52 weeks) | | January 3,
2010
(53 weeks) | | December 28,
2008
(52 weeks) |
| | (In thousands, except per share data) | (In thousands, except per share data) |
| Total revenue | $ | 1,055,535 |
| | $ | 902,741 |
| | $ | 666,324 |
| | $ | 573,225 |
| | $ | 366,799 |
| $ | 1,148,516 |
| | $ | 1,055,535 |
| | $ | 902,741 |
| | $ | 666,324 |
| | $ | 573,225 |
|
| Income (loss) from operations(1),(2) | 199,461 |
| | 211,654 |
| | 125,597 |
| | 80,457 |
| | (301,201 | ) | |
| Net income (loss) | 86,628 |
| | 124,891 |
| | 72,281 |
| | 39,416 |
| | (287,305 | ) | |
| Net income (loss) per share: | | | |
| | |
| | |
| | |
| |
| Income from operations | | 200,752 |
| | 199,461 |
| | 211,654 |
| | 125,597 |
| | 80,457 |
|
| Net income | | 151,254 |
| | 86,628 |
| | 124,891 |
| | 72,281 |
| | 39,416 |
|
| Net income per share: | | | | |
| | |
| | |
| | |
|
| Basic | $ | 0.70 |
| | $ | 1.01 |
| | $ | 0.59 |
| | $ | 0.34 |
| | $ | (2.65 | ) | $ | 1.23 |
| | $ | 0.70 |
| | $ | 1.01 |
| | $ | 0.59 |
| | $ | 0.34 |
|
| Diluted | $ | 0.62 |
| | $ | 0.87 |
| | $ | 0.53 |
| | $ | 0.30 |
| | $ | (2.65 | ) | $ | 1.13 |
| | $ | 0.62 |
| | $ | 0.87 |
| | $ | 0.53 |
| | $ | 0.30 |
|
| Shares used in calculating net income (loss) per share: | |
| | |
| | |
| | |
| | |
| |
| Shares used in calculating net income per share: | | |
| | |
| | |
| | |
| | |
|
| Basic | 123,399 |
| | 123,581 |
| | 123,154 |
| | 116,855 |
| | 108,308 |
| 122,999 |
| | 123,399 |
| | 123,581 |
| | 123,154 |
| | 116,855 |
|
| Diluted | 138,937 |
| | 143,433 |
| | 137,096 |
| | 133,607 |
| | 108,308 |
| 133,693 |
| | 138,937 |
| | 143,433 |
| | 137,096 |
| | 133,607 |
|
Balance Sheet Data
| | | | January 1,
2012 | | January 2,
2011 | | January 3,
2010 | | December 28,
2008 | | December 30,
2007 | December 30,
2012 | | January 1,
2012 | | January 2,
2011 | | January 3,
2010 | | December 28,
2008 |
| | (In thousands) | (In thousands) |
| Cash, cash equivalents and short-term investments(2),(3),(4),(5) | $ | 1,189,568 |
| | $ | 894,289 |
| | $ | 693,527 |
| | $ | 640,075 |
| | $ | 386,082 |
| |
| Cash, cash equivalents and short-term investments(1),(2),(3) | | $ | 1,350,204 |
| | $ | 1,189,568 |
| | $ | 894,289 |
| | $ | 693,527 |
| | $ | 640,075 |
|
| Working capital | 1,307,039 |
| | 723,881 |
| | 540,354 |
| | 483,113 |
| | 397,040 |
| 1,482,477 |
| | 1,317,698 |
| | 723,881 |
| | 540,354 |
| | 483,113 |
|
| Total assets | 2,195,840 |
| | 1,839,113 |
| | 1,429,937 |
| | 1,327,171 |
| | 929,981 |
| 2,566,085 |
| | 2,195,840 |
| | 1,839,113 |
| | 1,429,937 |
| | 1,327,171 |
|
Long-term debt, current portion(5)(1) | — |
| | 311,609 |
| | 290,202 |
| | 276,889 |
| | 16 |
| 36,967 |
| | — |
| | 311,609 |
| | 290,202 |
| | 276,889 |
|
Long-term debt, less current portion(5)(1) | 807,369 |
| | — |
| | — |
| | — |
| | 258,007 |
| 805,406 |
| | 807,369 |
| | — |
| | — |
| | — |
|
| Total stockholders’ equity(1),(2),(3),(4) | 1,075,215 |
| | 1,197,675 |
| | 864,248 |
| | 798,667 |
| | 353,927 |
| |
| Total stockholders’ equity(2),(3) | | 1,318,581 |
| | 1,075,215 |
| | 1,197,675 |
| | 864,248 |
| | 798,667 |
|
In addition to the following notes, see Item 7, “Management’s Discussion and Analysis of Financial Condition and Results of Operations,” and Item 8, “Financial Statements and Supplementary Data,” for further information regarding our consolidated results of operations and financial position for periods reported therein and for known factors that will impact comparability of future results.
| |
| (1) | The consolidated financial statements include resultsDuring 2011, we issued $920.0 million principal amount of operations0.25% Convertible Senior Notes due 2016, which was classified as long-term liability as of acquired companies commencing on their respective acquisition dates. As a resultDecember 30, 2012 and January 1, 2012. In February 2007, we issued $400.0 million principal amount of prior acquisitions, we recorded charges0.625% Convertible Senior Notes due 2014. Due to write-off acquired in-process research and development, or IPR&D, of $5.4 million, $1.3 million, $11.3 million, $24.7 million, and $303.4 million,the 0.625% Convertible Senior Notes due 2014 being convertible during the fiscal years ended January 1,December 30, 2012, January 2, 2011, January 3, 2010, and December 28, 2008, we classified the outstanding principal amount of these notes as current in our consolidated balance sheet in the respective periods. As of January 1, 2012, the outstanding principal amount of the 0.625% Convertible Senior Notes was not convertible and December 30, 2007, respectively.was therefore reclassified to long-term liability. See note “4. Acquisitions”“7. Convertible Senior Notes” in Part II, Item 8, Notes to Consolidated Financial Statements, for further information. |
| |
| (2) | For the fiscal yearyears ended December 30, 2007,2012, January 1, 2012, January 2, 2011, January 3, 2010, and December 28, 2008, we recorded a $54.0repurchased 1.9 million charge, 9.2 million, 0.8 million, 6.1 million, and 3.1 million shares, respectively, of common stock for the settlement of a litigation. In January 2008, we paid $90.0$82.5 million related, $570.3 million, $44.0 million, $175.1 million, and $70.8 million, respectively. See note “10. Stockholders’ Equity” in Part II, Item 8, Notes to the settlement.Consolidated Financial Statements. |
| |
| (3) | In August 2008, a total of 8,050,000 shares were sold to the public at a public offering price of $43.75 per share, raising net proceeds to us of $342.7 million. |
| |
(4) | For the fiscal years ended January 1, 2012, January 2, 2011, January 3, 2010, December 28, 2008, and December 30, 2007, we repurchased 9.2 million, 0.8 million, 6.1 million, 3.1 million, and 14.8 million shares, respectively, of common stock for $570.3 million, $44.0 million, $175.1 million, $70.8 million, and $251.6 million, respectively. See note “11. Stockholders’ Equity” in Part II, Item 8, Notes to Consolidated Financial Statements.
|
| |
(5) | During 2011, we issued $920.0 million principal amount of 0.25% Convertible Senior Notes due 2016, which was classified as long-term liability as of January 1, 2012. In February 2007, we issued $400.0 million principal amount of 0.625% Convertible Senior Notes due 2014. Due to the 0.625% Convertible Senior Notes due 2014 being convertible during the fiscal years ended January 2, 2011, January 3, 2010, and December 28, 2008, we classified the outstanding principal amount of these notes as current in our consolidated balance sheet in the respective periods. As of January 1, 2012, the remaining $40.1 million principal amount of the 0.625% Convertible Senior Notes was not convertible and was therefore reclassified to long-term liability. See note “8. Convertible Senior Notes” in Part II, Item 8, Notes to Consolidated Financial Statements, for further information.
|
| |
| ITEM 7. | Management’s Discussion and Analysis of Financial Condition and Results of Operations. |
Our Management'sManagement’s Discussion and Analysis of Financial Condition and Results of Operations (MD&A) is provided in addition to the accompanying consolidated financial statements and notes to assist readers in understanding our results of operations, financial condition, and cash flows. This MD&A is organized as follows:
Business Overview and Outlook. High level discussion of our operating results and significant known trends that affect our business.
Results of Operations. Detailed discussion of our revenues and expenses.
Liquidity and Capital Resources. Discussion of key aspects of our statements of cash flows, changes in our financial position, and our financial commitments.
Off-Balance Sheet Arrangements. We have no significant off-balance sheet arrangements.
Contractual Obligations. Tabular disclosure of known contractual obligations as of January 1, 2012.December 30, 2012.
Critical Accounting Policies and Estimates. Discussion of significant changes since our most recent Annual Report on Form 10-K that we believe are important to understanding the assumptions and judgments underlying
our financial statements.
This MD&A discussion contains forward-looking statements that involve risks and uncertainties. Please see “Special Note Regarding Forward-Looking Statements” for additional factors relating to such statements, and see “Risk Factors” in Item 1A of this report for a discussion of certain risk factors applicable to our business, financial condition, and results of operations. Operating results are not necessarily indicative of results that may occur in future periods.
Business Overview and Outlook
This overview and outlook provides a high level discussion of our operating results and significant known trends that affect our business. We believe that an understanding of these trends is important to understanding our financial results for the periods being reported herein as well as our future financial performance. This summary is not intended to be exhaustive, nor is it intended to be a substitute for the detailed discussion and analysis provided elsewhere in this Annual Report on Form 10-K.
About Illumina
We are a leading developer, manufacturer, and marketer of life science tools and integrated systems for the analysis of genetic variation and function. Using our proprietary technologies, we provide a comprehensive line of genetic analysis solutions, with products and services that address a broad range of highly interconnected markets, including sequencing, genotyping, gene expression, and moleculargenomic-based diagnostics. Our customers include leading genomic research centers, academic institutions, government laboratories, and clinical research organizations, as well as pharmaceutical, biotechnology, agrigenomics, and consumer genomics companies.companies, and in vitro fertilization clinics.
Our broad portfolio of instruments, consumables, and analysis tools are designed to simplify and accelerate genetic analysis. This portfolio addresses the full range of genomic complexity, price points, and throughputs, enabling researchers to select the best solution for their scientific challenge. In 2007, through our acquisition of Solexa, Inc., we acquired our proprietary sequencing by synthesis (SBS) technology that is at the heart of our leading-edge sequencing instruments. These systems can be used to efficiently perform a range of nucleic acid (DNA, RNA) analyses on large numbers of samples. For more focused studies, our array-based solutions provide ideal tools to perform genome-wide association studies (GWAS) involving single-nucleotide polymorphism (SNP) genotyping and copy number variation (CNV) analyses, as well as gene expression profiling and other DNA, RNA, and protein studies.
In 2012 and early 2013, we took significant steps to support our goal to be the leader in genomic-based diagnostics by acquiring BlueGnome Ltd. (BlueGnome) in September 2012 and signing a definitive agreement to acquire Verinata Health, Inc. (Verinata) in January 2013. BlueGnome is a leading provider of solutions for the screening of genetic abnormalities associated with developmental delay, cancer, and infertility, and BlueGnome’s offerings enhance our ability to establish integrated solutions in reproductive health and cancer. Upon completion of the Verinata acquisition, we will further strengthen our diagnostic focus on reproductive health by having access to Verinata’s verifi® prenatal test, the broadest non-invasive prenatal test (NIPT) available today for high-risk pregnancies, and what we believe to be the most comprehensive intellectual propert
y portfolio in the NIPT industry. To further enhance our genetic analysis workflows, in January 2011 we acquired Epicentre Technologies Corporation (Epicentre), a leading provider of nucleic acid sample preparation reagents and specialty enzymes for sequencing and microarray applications. In 2010, through our acquisition of Helixis, Inc., we expanded our instrument portfolio to include real-time polymerase chain reaction (PCR), one of the most widely used technologies in life sciences. Our Eco Real-Time PCR System provides researchers with an affordable, full-featured system to perform targeted validation studies.
Our financial results have been, and will continue to be, impacted by several significant trends, which are described below. While these trends are important to understanding and evaluating our financial results, this discussion should be read in conjunction with our condensed consolidated financial statements and the notes thereto in Item 1, Part I of this report, and the other transactions, events, and trends discussed in “Risk Factors” in Item 1A, Part I of this report.
Funding Environment
Many of our customers receive funding from government agencies to purchase our instruments, products, and services. There remains significant uncertainty concerning government and academic research funding worldwide as governments in the United States and Europe, in particular, focus on reducing fiscal deficits while at the same time confronting slowingslow economic growth. We believe this uncertainty will continue in 2013, which could lead to purchasing delays and could negatively impact our business.
While many of our customers receive funding from government agencies to purchase our products or services, we are increasingly less dependent on government funding. In fiscal 2012, approximately 30% of our total revenue came from commercial customers who are not reliant on government agencies for funding, and it is our strategy to diversify our customer base to increase further the portion of our revenue from commercial customers over time. However, we estimate that approximately one-third of our total revenue iscontinues to be derived, directly or indirectly, from funding provided by the U.S. National Institute of Health (NIH). After growing steadily through 2010, the NIH budget experienced an approximate 1% reduction in fiscal 2011, which ended on September 30, 2011, compared to fiscal 2010. Based on the fiscal year 2012 Congressional budget, the adjustedIn fiscal 2012, the NIH budget increased 1% as compared to fiscal 2011 levels. NIH funding for the first quarter of 2013 will be subject to the continuing resolution that was signed into law by President Obama and funds the NIH at 90% of budget. The significance and timing of any reductions to the NIH budget beyond fiscal 2012 willfrom March 2013 may be significantly impacted by the sequestration provisions of the Budget Control Act of 2011, which was enacted on August 2, 2011 and by whether these provisions remain in effect. In addition, the U.S. Department of Health and Human Services (HHS), of which the NIH is a part, has the ability to reallocate funds within its budget to spare the NIH from the full effect of HHS budget reductions. We continue tofurther believe that allocations within the NIH budget will continue to favor genetic analysis tools generally and, in particular, research programs that utilize next-generation sequencing.
We believe the uncertainty surrounding the levels of government and academic research funding in the United States and Europe will continue in 2012, which could lead to purchasing delays and could negatively impact our business.
Next-Generation Sequencing
Next-generation sequencing has become a core technology for modern life science research.research and is increasingly being used in the applied, molecular diagnostics, and translational markets. Over the next several years, expansion of the sequencing market, including an increase in the number of samples available and enhancements in our product portfolio will continue to drive demand for our next-generation sequencing technologies. In 2011,Our sequencing instrument installed base continued to expand in 2012. As a result, we launched new, higher-throughputbelieve that our sequencing consumable kits that enable our customersrevenue will continue to sequence a greater number of samplesgrow in a single instrument run. We believe that this increased throughput created excess capacity that customers were unable to fully utilize due to a short-term lack of available samples, which resulted in lower consumable sales per instrument and negatively affectedfuture periods.
Our sequencing instrument sales inportfolio primarily includes the second half of 2011.HiSeq product family and MiSeq. We believe that this excess capacity will diminish as customers scale and gain access to greater numbers of samples.
With respect to sequencing instruments, we began full commercial shipments in the thirdfourth quarter of 20112012 of our previously announced HiSeq 2500 sequencing system, which allows customers to sequence an entire human genome in approximately a day. Our MiSeq sequencing system is a low-cost personal sequencing system that we believe will provide individual researchers a platform with rapid turnaround time, high accuracy, and streamlined workflow. We believe our MiSeq systems will expand our presencecontinue to be a competitive offering in the lower throughput sequencing market. In January 2012, we announced the HiSeq 2500 sequencing system, which will allow customers to sequence an entire human genomemarket and help us expand our presence in approximately a day (up to 120 Gb in 27 hours or 600 Gb per run). Full commercial shipments of the HiSeq 2500 are expected to commence in the second half of 2012.
With respect to sequencing consumables, we experienced an overall increase in sequencing consumable sales despite a decrease in the consumable revenue per instrument in 2011 compared to 2010. The increase in total sequencing consumable sales was driven by the growth of our sequencing installed base. We believe the decrease in consumable revenue per instrument was driven, in part, by funding uncertainty and the excess capacity created from the higher throughput of our new sequencing kits. As we continue to make improvements that reduce the cost of sequencing, we believe that more customers will use the HiSeq platform, which generates more revenue per instrument time than the Genome Analyzer, and that the increased capacity from our higher throughput sequencing kits will be more fully utilized as additional samples become increasingly available over the next few quarters. We believe that our sequencing consumable revenue will grow in future periods with the launch of MiSeq and the growth in our HiSeq installed base.this emerging market segment.
MicroArrays
As a complement to next-generation sequencing, we believe microarrays offer a less expensive, faster, and highly accurate technology for use when genetic content is already known. The information content of microarrays is fixed and reproducible. As such, microarrays provide repeatable, standardized assays for certain subsets of nucleotide bases within the overall genome. We believe that focused studies will drive future microarray sales growth; however, asAs the per genome cost of sequencing continues to decrease, we believe that life science researchers will migrate certain whole genome array studies to sequencing at some pointover the next few years; however, we expect this decline to be offset by demand from customers in the future. In mid-2011, we began shipments of the Omni5 BeadChip, a four-sample microarray featuring more than 4.3 million markers per sample with flexibility to include up to 500,000 custom markers. This product includes a majority of the rare variant content from the 1000 genomes project, an international research effort launched in 2008 to establish the most detailed catalog of human genetic variation. Although the orderapplied and revenue level of microarray products fluctuated during 2011, we received record microarray orders, driven by Infinium Exome array products, in the fourth quarter of 2011.translational markets.
Financial Overview
Financial highlights for 20112012 include the following:
Net revenue grewincreased by 17%9% during 20112012 compared to 2010.2011. The increase in revenue was primarily driven by an increase in consumable sales and instrument service contract revenue as our installed base increasedcontinued to expand in 2011, the launch of MiSeq2012. We believe our revenue will continue to grow in the third quarter of 2011, and increased HiSeq instrument revenue.2013.
Gross profit as a percentage of revenue (gross margin) was 67.4% in 2012, an increase from 67.2% in 2011, an increase from 66.6%2011 in 2010. The increase primarily resulted from improvements in instrument and consumable gross margins. Instrument gross. Gross margin improved duringin 2012 due in large part to the period due to higher average selling prices and consumable gross margin improved due to a shift in sales mix from microarray consumablesinstruments to sequencing consumables, which have a higher gross margin than microarray consumables.instruments. We believe our gross margin in future periods will depend on several factors, including market conditions that may impact our pricing power, product mix changes between consumable, instrument, and instrumentservice sales, product mix changes between established products and new products in new markets, our cost structure for manufacturing operations, and our ability to create innovative and high premium products that meet or stimulate customer demand.
Income from operations decreased 6%increased slightly by $1.3 million in 20112012 compared to 2010 primarily due to2011. This was a 31% increase in total
operating expenses,higher gross profit, which was primarily driven by headquarter relocation expenseincreased revenue, being mostly offset by higher operating expenses. In 2012, our research and restructuring charges recordeddevelopment expenses increased by $34.1 million and our selling, general and administrative expenses increased by $24.1 million as we continue to grow our business. We anticipate that the dollar amount of these expenses will increase as we continue to invest in 2011.our technology, people, and infrastructure to support our growth.
In 2011,2012, we relocatedcompleted the relocation of our headquarters to another facilitythat started in San Diego, California2011 and incurred $41.826.3 million in headquarter relocation expense, which primarily included a cease-use loss upon vacating our prior headquarters, accelerated depreciation of certain property and equipment, and double rent expense during the transition to the new facility.facility, and the accretion of interest expense on the related lease exit liability. We do not expect to incur significant additional headquarter relocation expense duringother than the first halfaccretion of 2012.interest expense on lease exit liability.
On October 25, 2011,In 2012, we announced restructuring plans to reduce our global workforce by approximately 200 employees, or approximately 8%, and to consolidate certain facilities. As a result of the restructuring effort, we recorded a restructuring charge ofalso incurred $8.123.1 million duringin expenses associated with the fourth quarterunsolicited tender offer for shares of 2011, comprised primarily of severance pay and other employee separation costs. We expect to incur additional restructuring charges related to this effort through the second quarter of 2012.
In addition, on January 27, 2012,our common stock commenced by CKH Acquisition Corp. and Roche Holding Ltd. (together, “Roche”) made an unsolicited tender offer to purchase all outstanding shares of our common stock for $44.50 per share. Roche also announced that it intends to oppose the re-election of four directors serving on our board of directors whose terms expire at the 2012 annual meeting of stockholders, including the Chairman of the Board and our Chief Executive Officer. In connection with the Roche tender offer, four stockholder class action lawsuits have been filed against us, and we anticipate that additional lawsuits may be filed. As a result, we expect our selling, general and administrative expenses to increase during 2012, as wein early 2012. We anticipate incurring significant legal,additional advisory proxy solicitation, and other costs as a result of this tender offer.expenses through mid-2013.
Our effective tax rate was 34.9%32.1% in 2011,2012, as compared to 32.6%34.9% in 2010.2011. The provision for income taxes is dependent on the mix of earnings in tax jurisdictions with different statutory tax rates and the other factors discussed in the risk factor “We are subject to risks related to taxation in multiple jurisdictions and the possible loss of the tax deduction on our outstanding convertible notes”jurisdictions” in Item 1A of this report. For 20122013 and beyond, we anticipate the provision for income taxes to increase in absolute dollars but the effective tax rate to trend lower than the U.S. federal statutory rate as the portion of our earnings subject to lower statutory tax rates increases.
The American Taxpayer Relief Act of 2012, which was signed into law on January 2, 2013, included the retroactive reinstatement of the federal research and development credit from January 1, 2012, through December 31, 2013. Our provision for income taxes for the year ended December 30, 2012, did not include the impact of the federal research credit generated in 2012 since the law was enacted subsequent to our reporting period. Had the legislation been enacted in 2012, the provision for income taxes for the year ended December 30, 2012, would have been reduced by approximately $2.0 million. Our provision for income taxes in the first quarter of 2013 will include the tax benefit as a result of the retroactive reinstatement of the federal research credit for 2012.
We ended 20112012 with cash, cash equivalents, and short-term investments totaling $1.21.35 billion. In 2011, we generated $358.1 million in cash from operations, an $85.6 million, or 31.4%, increase from 2010. During 2011, we also generated $903.5 million in net proceeds from the issuance of our 0.25% Convertible Senior Notes due 2016 and used $314.3 million of such proceeds to repurchase shares of our common stock concurrently with the issuance and also used part of the net proceeds for the extinguishment upon conversion of $349.9 million principal amount of our existing 0.625% convertible senior notes due 2014.
Results of Operations
To enhance comparability, the following table sets forth audited consolidated statement of operations data for the years ended January 1,December 30, 2012, January 2, 20111, 2012, and January 3, 20102, 2011 stated as a percentage of total revenue.
| | | | 2011 | | 2010 | | 2009 | 2012 | | 2011 | | 2010 |
| Revenue: | |
| | |
| | |
| |
| | |
| | |
|
| Product revenue | 93.5 | % | | 93.3 | % | | 94.1 | % | 91.9 | % | | 93.5 | % | | 93.3 | % |
| Service and other revenue | 6.5 |
| | 6.7 |
| | 5.9 |
| 8.1 |
| | 6.5 |
| | 6.7 |
|
| Total revenue | 100.0 |
| | 100.0 |
| | 100.0 |
| 100.0 |
| | 100.0 |
| | 100.0 |
|
| Cost of revenue: | |
| | |
| | |
| | | |
| | |
|
| Cost of product revenue | 29.2 |
| | 30.1 |
| | 28.6 |
| 27.6 |
| | 29.2 |
| | 30.1 |
|
| Cost of service and other revenue | 2.5 |
| | 2.4 |
| | 2.3 |
| 3.8 |
| | 2.5 |
| | 2.4 |
|
| Amortization of acquired intangible assets | 1.1 |
| | 0.9 |
| | 1.0 |
| 1.2 |
| | 1.1 |
| | 0.9 |
|
| Total cost of revenue | 32.8 |
| | 33.4 |
| | 31.9 |
| 32.6 |
| | 32.8 |
| | 33.4 |
|
| Gross profit | 67.2 |
| | 66.6 |
| | 68.1 |
| 67.4 |
| | 67.2 |
| | 66.6 |
|
| Operating expense: | |
| | |
| | |
| |
| | |
| | |
|
| Research and development | 18.7 |
| | 19.7 |
| | 21.1 |
| 20.1 |
| | 18.7 |
| | 19.7 |
|
| Selling, general and administrative | 24.8 |
| | 24.4 |
| | 26.5 |
| 24.9 |
| | 24.8 |
| | 24.4 |
|
| Headquarter relocation expense | 4.0 |
| | — |
| | — |
| 2.3 |
| | 4.0 |
| | — |
|
| Unsolicited tender offer related expense | | 2.0 |
| | — |
| | — |
|
| Restructuring charges | 0.8 |
| | — |
| | — |
| 0.4 |
| | 0.8 |
| | — |
|
| Acquisition related expense (gain), net | 0.1 |
| | (0.9 | ) | | 1.7 |
| 0.2 |
| | 0.1 |
| | (0.9 | ) |
| Total operating expense | 48.4 |
| | 43.2 |
| | 49.3 |
| 49.9 |
| | 48.4 |
| | 43.2 |
|
| Income from operations | 18.8 |
| | 23.4 |
| | 18.8 |
| 17.5 |
| | 18.8 |
| | 23.4 |
|
| Other income (expense): | |
| | |
| | |
| |
| | |
| | |
|
| Cost-method investment related gain (loss), net | | 4.0 |
| | — |
| | (1.1 | ) |
| Interest income | 0.7 |
| | 0.9 |
| | 1.7 |
| 1.4 |
| | 0.7 |
| | 0.9 |
|
| Interest expense | (3.3 | ) | | (2.7 | ) | | (3.6 | ) | (3.3 | ) | | (3.3 | ) | | (2.7 | ) |
| Other (expense) income, net | (3.7 | ) | | (1.1 | ) | | 0.2 |
| (0.2 | ) | | (3.7 | ) | | — |
|
| Total other expense, net | (6.3 | ) | | (2.9 | ) | | (1.7 | ) | |
| Total other income (expense), net | | 1.9 |
| | (6.3 | ) | | (2.9 | ) |
| Income before income taxes | 12.5 |
| | 20.5 |
| | 17.1 |
| 19.4 |
| | 12.5 |
| | 20.5 |
|
| Provision for income taxes | 4.4 |
| | 6.7 |
| | 6.3 |
| 6.2 |
| | 4.4 |
| | 6.7 |
|
| Net income | 8.1 | % | | 13.8 | % | | 10.8 | % | 13.2 | % | | 8.1 | % | | 13.8 | % |
Our fiscal year is the 52 or 53 weeks ending the Sunday closest to December 31, with quarters of 13 or 14 weeks ending the Sunday closest to March 31, June 30, September 30, and December 31. The years ended January 1,December 30, 2012, January 2, 20111, 2012, and January 3, 20102, 2011 were 52 52, and 53 weeks, respectively.
Revenue
| | | | 2011 - 2010 | | 2010 - 2009 | 2012 - 2011 | | 2011 - 2010 |
| (Dollars in thousands) | 2011 | | 2010 | | Change | | % Change | | 2009 | | Change | | % Change | 2012 | | 2011 | | Change | | % Change | | 2010 | | Change | | % Change |
| Product revenue | $ | 987,280 |
| | $ | 842,510 |
| | $ | 144,770 |
| | 17 | % | | $ | 627,240 |
| | $ | 215,270 |
| | 34 | % | $ | 1,055,826 |
| | $ | 987,280 |
| | $ | 68,546 |
| | 7 | % | | $ | 842,510 |
| | $ | 144,770 |
| | 17 | % |
| Service and other revenue | 68,255 |
| | 60,231 |
| | 8,024 |
| | 13 |
| | 39,084 |
| | 21,147 |
| | 54 |
| 92,690 |
| | 68,255 |
| | 24,435 |
| | 36 |
| | 60,231 |
| | 8,024 |
| | 13 |
|
| Total revenue | $ | 1,055,535 |
| | $ | 902,741 |
| | $ | 152,794 |
| | 17 | % | | $ | 666,324 |
| | $ | 236,417 |
| | 35 | % | $ | 1,148,516 |
| | $ | 1,055,535 |
| | $ | 92,981 |
| | 9 | % | | $ | 902,741 |
| | $ | 152,794 |
| | 17 | % |
Product revenue consists primarily of revenue from the sale of consumables and instruments. Services and other revenue consists primarily of instrument service contract revenue as well as sequencing and genotyping service revenue.
2012 Compared to 2011
Consumables revenue increased$133.5 million, or 22%, to $729.3 million in 2012 compared to $595.8 million in 2011. The increase was primarily attributable to increased sales of sequencing consumables, driven by higher consumable sales per HiSeq instrument and the growth in both the HiSeq and MiSeq installed base.
Instrument revenue decreased$58.8 million, or 16%, to $314.3 million in 2012 compared to $373.1 million in 2011, driven by a decrease in HiSeq shipments, partially offset by a full year of MiSeq shipments in 2012 as compared to less than two quarters of shipments in 2011.
Revenue in 2011 reflects the impact of discounts provided to customers under our Genome Analyzer trade-in program. The estimated incremental sales incentive provided under this trade-in program was approximately $11.1 million, based on the total discount provided from list price in excess of our average discount on HiSeq 2000 sales during the period. The Genome Analyzer trade-in program was completed in Q4 2011. See “Revenue Recognition” in note “1. Summary of Significant Accounting Policies” in Part II, Item 8, of this Form 10-K for additional information on the Genome Analyzer trade-in program.
The increase in service and other revenue in 2012 compared to 2011 was driven by an increase in our instrument service contract revenue as a result of our growing installed base as well as an increase in our genotyping and sequencing service revenue.
2011 Compared to 2010
Consumables revenue increased $90.8 million, or 18%, to $595.8 million in 2011 compared to $505.0 million in 2010. The increase was primarily attributable to increased sales of sequencing consumables, which accounted for more than half of our consumables revenue in 2011, driven by growth in the installed base of our sequencing systems, partially offset by a decrease in the consumable revenue per sequencing instrument.
Instrument revenue increased $48.5 million, or 15%, to $373.1 million in 2011 compared to $324.6 million in 2010. The increase was primarily attributable to the launch of MiSeq in the third quarter of 2011 and higher HiSeq revenue primarily
driven by increased average selling price following completion of the Genome Analyzer trade-in program during the first half of 2011. These increases in instrument revenue were partially offset by a decrease in sales of our Genome Analyzer from 2010 to 2011, as our Genome Analyzer customers upgraded to HiSeq 2000.
Revenue from HiSeq 2000 sales in 2011 and 2010 was impacted by discounts provided to customers under our Genome Analyzer trade-in program. The estimated incremental sales incentive provided under this trade-in program was approximately $11.1 million and $47.8 million in 2011 and 2010, respectively. See “Revenue Recognition” in note “1. Organization and Summary of Significant Accounting Policies” in Part II, Item 8, of this Form 10-K for additional information on the Genome Analyzer trade-in program.
The increase in service and other revenue in 2011 compared to 2010 was primarily driven by an increase in our instrument service contract revenue resulting from our expanded installed base and an increase in sequencing services.
2010 Compared to 2009
Consumable revenue increased $113.7 million, or 29%, to $505.0 million for 2010 compared to $391.3 million for 2009. Microarray consumable revenue, which constituted more than half of our total consumable revenue in 2010 and 2009, increased $28.3 million primarily attributable to growth in sales of our Infinium BeadChips, which constituted a majority of our microarray consumable sales. Sales volume of our Infinium BeadChip products increased on a per sample basis during 2010 compared to 2009. The average selling price per sample, however, declined due to a change in product mix primarily attributable to growth in sales of our focused content arrays and a number of large sample volume purchase orders that incurred higher discounts. Revenue from sequencing consumables increased $85.4 million due to growth in the installed base of our sequencing systems.
Revenue from sales of instruments increased $98.9 million, or 44%, to $324.6 million for 2010 compared to $225.7 million for 2009. Sequencing instrument revenue increased $85.7 million. We experienced increases in both the number of units sold and average selling prices per unit for our sequencing systems during 2010 compared to 2009. Unit growth was due to increased demand for next-generation sequencing systems. The increase in average selling prices was primarily attributable to the launch of the HiSeq 2000 in Q1 2010. Microarray instrument revenue increased $13.2 million primarily attributable to strong demand for our HiScanSQ instrument launched in 2010. The launch of this system resulted in increases in both the number of units sold and average selling prices per unit for our microarray instruments during 2010 compared to 2009.
The increase in service and other revenue was primarily attributable to an increase in instrument service contract revenue for our growing installed base of sequencing systems.
Gross Margin
| | | | 2011 - 2010 | | 2010 - 2009 | 2012 - 2011 | | 2011 - 2010 |
| (Dollars in thousands) | 2011 | | 2010 | | Change | | % Change | | 2009 | | Change | | % Change | 2012 | | 2011 | | Change | | % Change | | 2010 | | Change | | % Change |
| Total gross profit | $ | 709,098 |
| | $ | 601,540 |
| | $ | 107,558 |
| | 18 | % | | $ | 453,875 |
| | $ | 147,665 |
| | 33 | % | $ | 773,528 |
| | $ | 709,098 |
| | $ | 64,430 |
| | 9 | % | | $ | 601,540 |
| | $ | 107,558 |
| | 18 | % |
| Total gross margin | 67.2 | % | | 66.6 | % | |
| |
| | 68.1 | % | |
| |
| 67.4 | % | | 67.2 | % | | | | | | 66.6 | % | | | | |
2012 Compared to 2011
Gross profit in 2012 increased in comparison to 2011 primarily due to higher sales. Gross margin improved in 2012 due in large part to the shift in sales mix from instruments to consumables, which have a higher margin than instruments. This improvement was partially offset by a legal settlement charge recorded to cost of sales in 2012. In addition, instrument sales in 2011 were affected by promotional discounts provided to customers on HiSeq 2000 sales, including the Genome Analyzer trade-in program. Based on the estimated amount of incremental sales incentive provided, the Genome Analyzer trade-in
program negatively impacted our gross margin by approximately 1.1% in 2011. This trade-in program was completed in Q4 2011.
2011 Compared to 2010
Gross margin increased in 2011 compared to 2010. During the period, the gross margin of our instrument sales improved, primarily driven by an increase in average selling price per instrument as our Genome Analyzer trade-in program was substantially completed in the first half of 2011. The Genome Analyzer trade-in program negatively impacted our gross margin by approximately 1.1% and 5.3% in 2011 and 2010, respectively, based on the estimated amount of incremental sales incentive provided. The gross margin of our consumable sales also increased as we experienced a shift in sales mix from lower gross margin microarray consumables to higher gross margin sequencing consumables, primarily due to the expansion of our sequencing instrument installed base. The improvements in gross margins were partially offset by the negative impact from higher stock compensation expense and higher amortization expense of acquired intangible assets included in cost of revenue.
Operating Expense
|
| | | | | | | | | | | | | | | | | | | | | | | | | |
| | 2012 - 2011 | | 2011 - 2010 |
| (Dollars in thousands) | 2012 | | 2011 | | Change | | % Change | | 2010 | | Change | | % Change |
| Research and development | $ | 231,025 |
| | $ | 196,913 |
| | $ | 34,112 |
| | 17 | % | | $ | 177,947 |
| | $ | 18,966 |
| | 11 | % |
| Selling, general and administrative | 285,991 |
| | 261,843 |
| | 24,148 |
| | 9 |
| | 220,454 |
| | 41,389 |
| | 19 |
|
| Headquarter relocation expense | 26,328 |
| | 41,826 |
| | (15,498 | ) | | (37 | ) | | — |
| | 41,826 |
| | 100 |
|
| Unsolicited tender offer related expense | 23,136 |
| | — |
| | 23,136 |
| | 100 |
| | — |
| | — |
| | — |
|
| Restructuring charges | 3,522 |
| | 8,136 |
| | (4,614 | ) | | (57 | ) | | — |
| | 8,136 |
| | 100 |
|
| Acquisition related expense (gain), net | 2,774 |
| | 919 |
| | 1,855 |
| | 202 |
| | (8,515 | ) | | 9,434 |
| | (111 | ) |
| Total operating expense | $ | 572,776 |
| | $ | 509,637 |
| | $ | 63,139 |
| | 12 | % | | $ | 389,886 |
| | $ | 119,751 |
| | 31 | % |
20102012 Compared to 20092011
Research and development expense increased by $34.1 million, or 17%, in 2012 from 2011, primarily due to a $21.4 million impairment loss recognized for IPR&D recorded as a result of a prior acquisition and increased personnel expenses as we continue to increase our investment in projects to develop and commercialize new products. In addition, we incurred increased facilities expenses in 2012 as the rental fees for our current headquarters are higher than our prior facility.
Selling, general and administrative expense increased by $24.1 million in 2012 from 2011. The increase is primarily driven by a $15.8 million increase in personnel expenses associated with increased headcount, and a $9.5 million increase in legal and other consulting fees. Personnel expenses included salaries, share-based compensation, and benefits. These increases in expense were partially offset by a $2.3 million decrease in gross marginbad debt expense, as certain customer bankruptcies impacted us in 2010 compared2011. In addition, we had the benefit of a $2.3 million legal settlement gain recorded in selling, general and administrative expenses in 2011.
In Q3 2012, we completed the relocation of our headquarters that started in 2011. During 2012, we incurred $26.3 million in additional headquarter relocation expense, primarily consisting of cease-use loss associated with vacating our prior headquarters, double rent expense during the transition to 2009 was primarily attributable to the effectour new facility, and accretion of discounts provided to customersinterest expense on the saleslease exit liability. Headquarter relocation expense recorded in 2011 consisted of HiSeq 2000 associated with promotional programs, includingaccelerated depreciation and rent expense on the Genome Analyzer trade-in program,new facility during the transition period of occupying both the current and new facility.
During Q1 2012, CKH Acquisition Corporation and Roche Holding Ltd. (together, “Roche”) made an unsolicited tender offer to purchase all outstanding shares of our common stock for up to $51.00 per share. During 2012, we recorded $23.1 million of expenses incurred in relation to Roche’s unsolicited tender offer, consisting primarily of legal, advisory, and other professional fees.
In late 2011, we announced restructuring plans to reduce our global workforce and to consolidate certain facilities. As a result of the restructuring effort, we recorded additional restructuring charges of $3.5 million during 2012, comprised primarily of separation and other employee costs.
Acquisition related expense (gain), net in 2012 consisted of acquisition transaction costs of $0.8 million and lower margins on our newer products, such as the HiSeq 2000. Based on the estimated amountchanges in fair value of incremental sales incentive provided, the Genome Analyzer trade-in program negatively impacted our gross margin by approximately 5.3%contingent consideration of $2.0 million. Acquisition related expense (gain), net in 2010. See “Revenue Recognition”2011 consisted of gains related to changes in note “1. Organization and Summaryfair value of Significant Accounting Policies” in Part II, Item 8, of this Form 10-K for additional information on the Genome Analyzer trade-in program. The impact of the promotional programs was partiallycontingent consideration offset by improved margins on sequencing consumables primarily attributableacquired in-process research and development of $5.4 million related to improved overhead absorption from increased volumes and the benefit of decreased costs associated with chemistry improvements.a milestone payment for a prior acquisition.
Operating Expense
|
| | | | | | | | | | | | | | | | | | | | | | | | | |
| | 2011 - 2010 | | 2010 - 2009 |
| (Dollars in thousands) | 2011 | | 2010 | | Change | | % Change | | 2009 | | Change | | % Change |
| Research and development | $ | 196,913 |
| | $ | 177,947 |
| | $ | 18,966 |
| | 11 | % | | $ | 140,616 |
| | $ | 37,331 |
| | 27 | % |
| Selling, general and administrative | 261,843 |
| | 220,454 |
| | 41,389 |
| | 19 |
| | 176,337 |
| | 44,117 |
| | 25 |
|
| Headquarter relocation expense | 41,826 |
| | — |
| | 41,826 |
| | 100 |
| | — |
| | — |
| | — |
|
| Restructuring charges | 8,136 |
| | — |
| | 8,136 |
| | 100 |
| | — |
| | — |
| | — |
|
| Acquisition related expense (gain), net | 919 |
| | (8,515 | ) | | 9,434 |
| | (111 | ) | | 11,325 |
| | (19,840 | ) | | (175 | ) |
| Total operating expense | $ | 509,637 |
| | $ | 389,886 |
| | $ | 119,751 |
| | 31 | % | | $ | 328,278 |
| | $ | 61,608 |
| | 19 | % |
2011 Compared to 2010
The increase in research and development expense in 2011 from 2010 was primarily attributable to an increase in personnel expenses of $17.5 million associated with increased average headcount during 2011 and an increase of $2.9 million in research and development supplies. Personnel expenses included salaries, share-based compensation, and benefits.
The increase in selling, general and administrative expense in 2011 from 2010 was primarily attributable to an increase in personnel expenses of $33.5 million associated with the growth of our business during the period. The remaining increase was primarily driven by a $4.0 million increase in bad debt expenses as a result of customer bankruptcies, and a $3.7 million increase in supplies, repairs, and maintenance expenses. These increases were partially offset by a legal settlement gain of $2.3 million, representing the payment we received to settle an outstanding commercial dispute.
In 2011, we relocated our headquarters to another facility in San Diego, California and incurred $41.8$41.8 million in headquarter relocation expense, which included a cease-use loss upon vacating our prior headquarters, accelerated depreciation of certain property and equipment, and double rent expense during the transition to the new facility.
In Q4 2011, we announced a restructuring plan to reduce our global workforce by approximately 200 employees, or approximately 8%, and to consolidate certain facilities. As a result of the restructuring effort, we recorded a restructuring charge of $8.1$8.1 million during Q4 2011, comprised primarily of severance pay and other employee separation costs.
Acquisition related expense, net, in 2011 included a $5.4 million charge of acquired in-process research and development related to a milestone payment for a prior acquisition partially offset by $4.5 million gains related to changes in fair value of contingent consideration. Acquisition related gain, net, in 2010 included a gain of $10.4 million from a change in the fair value of contingent consideration related to an acquisition, partially offset by an acquired in-process research and development charge of $1.3 million related to a milestone payment made related to a prior acquisition.
Other Income (Expense), Net
|
| | | | | | | | | | | | | | | | | | | | | | | | | |
| | 2012 - 2011 | | 2011 - 2010 |
| (Dollars in thousands) | 2012 | | 2011 | | Change | | % Change | | 2010 | | Change | | % Change |
| Cost-method investment related gain (loss), net | $ | 45,911 |
| | $ | — |
| | $ | 45,911 |
| | 100 | % | | $ | (10,309 | ) | | $ | 10,309 |
| | (100 | )% |
| Interest income | 16,208 |
| | 7,052 |
| | 9,156 |
| | 130 |
| | 8,378 |
| | (1,326 | ) | | (16 | ) |
| Interest expense | (37,779 | ) | | (34,790 | ) | | (2,989 | ) | | 9 |
| | (24,598 | ) | | (10,192 | ) | | 41 |
|
| Other (expense) income, net | (2,484 | ) | | (38,678 | ) | | 36,194 |
| | (94 | ) | | 254 |
| | (38,932 | ) | | (15,328 | ) |
| Total other income (expense), net | $ | 21,856 |
| | $ | (66,416 | ) | | $ | 88,272 |
| | (133 | )% | | $ | (26,275 | ) | | $ | (40,141 | ) | | 153 | % |
20102012 Compared to 20092011
The increaseDuring the fourth quarter of 2012, we recognized a gain of $48.6 million on the sale of our minority ownership interest in research and development expensesdeCODE Genetics, a cost-method investment. We also recorded an impairment loss of $2.7 million on another cost-method investment that was determined to be other-than-temporarily impaired.
Interest income increased in 2012 primarily attributabledue to a $25.9$6.0 million increase in personnel expenses, including salaries, non-cash share-based compensation, and benefits, recovery of a previously impaired note receivable and an increase in other non-personnelrealized gains from our investment portfolio. Interest expenses in both 2012 and 2011 are primarily comprised of $13.3 million comprised mostlyaccretion of lab and production supplies expenses. These increases were primarily attributable to investments in new product development and commercialization along with projects to sustain and optimizethe discount on our existing product portfolio.convertible senior notes.
The increaseOther (expense) income, net, in selling, general and administrative expenses was2012 primarily attributable toconsisted of foreign exchange losses. Other (expense) income, net, in 2011 primarily consisted of a $31.8$37.6 million increase in personnel expenses, including salaries, non-cash share-based compensation, and benefits, associated withloss on the growthextinguishment of debt recorded on conversions of our business, and an increase in outside service expenses of $9.7 million comprised mostly of legal and marketing expenses.0.625% convertible senior notes due 2014.
During 2009, acquisition related expense (gain), net, included acquired in-process research and development charges of $11.3 million related to milestone payments made to the former shareholders of the company we acquired prior to 2009.
Other Expense, Net
|
| | | | | | | | | | | | | | | | | | | | | | | | | |
| | 2011 - 2010 | | 2010 - 2009 |
| (Dollars in thousands) | 2011 | | 2010 | | Change | | % Change | | 2009 | | Change | | % Change |
| Interest income | $ | 7,052 |
| | $ | 8,378 |
| | $ | (1,326 | ) | | (16 | )% | | $ | 11,029 |
| | $ | (2,651 | ) | | (24 | )% |
| Interest expense | (34,790 | ) | | (24,598 | ) | | (10,192 | ) | | 41 |
| | (23,718 | ) | | (880 | ) | | 4 |
|
| Other (expense) income, net | (38,678 | ) | | (10,055 | ) | | (28,623 | ) | | 285 |
| | 1,217 |
| | (11,272 | ) | | (926 | ) |
| Total other expense, net | $ | (66,416 | ) | | $ | (26,275 | ) | | $ | (40,141 | ) | | 153 | % | | $ | (11,472 | ) | | $ | (14,803 | ) | | 129 | % |
2011 Compared to 2010
The decrease in interest income in 2011 compared to 2010 was primarily driven by lower interest rates, despite the increase in our cash, cash equivalents and short-term investment balance during the period. Interest expense increased during the period primarily due to the accretion of discount on our $920.0 million 0.25% convertible senior notes due 2016 issued in the first half of 2011, partially offset by the decrease in interest expense associated with the repayment of $349.9$349.9 million in principal for the 0.625% convertible senior notes due 2014 during 2011.
Other (expense) income, net, in 2011 primarily consisted of a loss of $37.6 million on the extinguishment of debt recorded on conversions of our 0.625% convertible senior notes due 2014 and a $1.1 million foreign exchange loss recorded during the period. The loss on extinguishment of debt was calculated as the difference between the carrying amount of the converted notes and their fair value as of the settlement dates. Other (expense) income, net, in 2010 primarily consisted of a $13.2 million impairment charge related to a cost-method investment and a related note receivable, partially offset by a $2.9 million gain on acquisition recorded for the difference between the carrying value of a cost method investment prior to the acquisition and the fair value of that investment at the time of acquisition, and foreign exchange gains.
2010 Compared to 2009
Interest income decreased despite an increase in our average cash andCost-method investment balance due to an overall decline in interest rates during 2010 compared to 2009. The increase in interest expense was due to the accretion of discount on our 0.625% convertible senior notes due 2014. The change in other (expense) income,related gain (loss), net, in 2009 primarily2010 consisted of a $13.2 million impairment charge recorded on a cost-method investment and a related note receivable, partially offset by a $2.9 million gain on acquisition of $0.8 million on the conversion of $10.0 million of our 0.625% convertible senior notes due 2014, and foreign exchange gains realized during the period.a previous investee.
Provision for Income Taxes
| | | | 2011 - 2010 | | 2010 - 2009 | 2012 - 2011 | | 2011 - 2010 |
| (Dollars in thousands) | 2011 | | 2010 | | Change | | % Change | | 2009 | | Change | | % Change | 2012 | | 2011 | | Change | | % Change | | 2010 | | Change | | % Change |
| Income before income taxes | $ | 133,045 |
| | $ | 185,379 |
| | $ | (52,334 | ) | | (28 | )% | | $ | 114,125 |
| | $ | 71,254 |
| | 62 | % | $ | 222,608 |
| | $ | 133,045 |
| | $ | 89,563 |
| | 67 | % | | $ | 185,379 |
| | $ | (52,334 | ) | | (28 | )% |
| Provision for income taxes | 46,417 |
| | 60,488 |
| | (14,071 | ) | | (23 | ) | | 41,844 |
| | 18,644 |
| | 45 |
| 71,354 |
| | 46,417 |
| | 24,937 |
| | 54 |
| | 60,488 |
| | (14,071 | ) | | (23 | ) |
| Net income | $ | 86,628 |
| | $ | 124,891 |
| | $ | (38,263 | ) | | (31 | )% | | $ | 72,281 |
| | $ | 52,610 |
| | 73 | % | $ | 151,254 |
| | $ | 86,628 |
| | $ | 64,626 |
| | 75 | % | | $ | 124,891 |
| | $ | (38,263 | ) | | (31 | )% |
| Effective tax rate | 34.9 | % | | 32.6 | % | | | | | | 36.7 | % | | | | | 32.1 | % | | 34.9 | % | | | | | | 32.6 | % | | | | |
2012 Compared to 2011
Our effective tax rate was 32.1% for 2012. The variance from the U.S. statutory rate of 35% was primarily attributable to the change in the mix of earnings in tax jurisdictions with different statutory rates. Our future effective tax rate may vary from the U.S statutory tax rate due to the change in the mix of earnings in tax jurisdictions with different statutory rates, benefits related to tax credits, and the tax impact of non-deductible expenses and other permanent differences between income before income taxes and taxable income. The effective tax rate in 2011 closely approximated the U.S. statutory rate because a significant portion of our earnings were subject to U.S. taxation.
2011 Compared to 2010
The effective tax rate in 2011 closely approximated the U.S. statutory rate because a significant portion of our earnings werewas subject to U.S. taxation. The increase in the effective tax rate in 2011 from 2010 was primarily attributable to lower non-taxable gains recorded on the changes in fair value of contingent consideration related to prior acquisitions and higher nondeductible acquired IPR&D charges recorded in 2011.
2010 Compared to 2009
The decrease in the effective tax rate in 2010 compared to 2009 was primarily attributable to the gain recorded on the change in the fair value of contingent consideration related to an acquisition that is excluded from taxable income and a decrease in nondeductible acquired IPR&D recognized for financial reporting purposes in 2010 as compared to 2009.
Liquidity and Capital Resources
Cash flow summary
|
| | | | | | | | | | | |
| | 2011 | | 2010 | | 2009 |
| | (In thousands) |
| Net cash provided by operating activities | $ | 358,140 |
| | $ | 272,573 |
| | $ | 172,191 |
|
| Net cash used in investing activities | (400,999 | ) | | (285,053 | ) | | (256,569 | ) |
| Net cash provided by (used in) financing activities | 97,016 |
| | 116,474 |
| | (98,862 | ) |
| Effect of exchange rate changes on cash and cash equivalents | (126 | ) | | 320 |
| | 849 |
|
| Net increase (decrease) in cash and cash equivalents | $ | 54,031 |
| | $ | 104,314 |
| | $ | (182,391 | ) |
Operating Activities
Cash provided by operating activities in 2011 consisted of net income ofAt December 30, 2012, we had approximately $86.6434.0 million plus net non-cash adjustments of $234.5 millionin cash and changes in net operating assets of $37.0 million. The primary non-cash expenses added back to net income included share-based compensation of $92.1 million, depreciation and amortization expenses related to property and equipment and acquired intangible assets of $68.3 million, debt extinguishment loss of $37.6 million, and the accretion of the debt discount of $32.2 million. These non-cash add-backs were partially offset by the $46.4 million incremental tax benefit related to stock options exercised. The main drivers in the change in net operating assets included increases in accrued liabilities, and decreases in inventory and accounts payable.
Cash provided by operating activities in 2010 consisted of net income of $124.9 million plus net non-cash adjustments of $149.8 million andcash equivalents, a $2.1131.0 million decrease in net operating assets. The primary non-cash expenses added backincrease from last year, due to net income included share based compensation of $71.6 million, depreciation and amortization expenses related to property and equipment and intangible assets of $42.0 million, and accretion of the debt discount on our convertible notes totaling $21.4 million. These non-cash add-backs were partially offset by the $42.4 million incremental tax benefit related to stock options exercised. The main driversfactors described in the change in net operating assets included increases in accounts receivable, inventory, accounts payable and accrued liabilities. These increases were primarily related to the growth of our business.
Investing Activities
Cash used in investing activities totaled $401.0 million in 2011. We purchased $1.3 billion of available-for-sale securities, and $1.1 billion of our available-for-sale securities matured or were sold during 2011. We used $58.3 million, net of cash acquired, in an acquisition and $13.8 million in the purchase of strategic investments. We also incurred $77.8 million in capital expenditures primarily associated with the purchase of manufacturing, R&D, and servicing equipment, leasehold improvements, and information technology equipment and systems.
Cash used in investing activities totaled $285.1 million in 2010. During the year we purchased $846.2 million of available-for-sale securities, and $688.6 million of our available-for-sale securities matured or were sold. We also paid net cash of $98.2 million for acquisitions, sold trading securities totaling $54.9 million, used $49.8 million for capital expenditures primarily associated with the purchase of manufacturing equipment and infrastructure for additional production capacity and rental and loaner instruments, and made strategic investments totaling $27.7 million.
Financing Activities
Cash provided by financing activities totaled $97.0 million in 2011. We received $903.5 million in proceeds from the issuance of $920.0 million of our 0.25% convertible senior notes due 2016, net of issuance discounts, of which $349.9 million was used to repay the principal amount of our 0.625% convertible senior notes due 2014 upon conversions in 2011. Total cash of $570.4 million was used in repurchases of our common stock. We also received $67.5 million in proceeds from the issuance of our common stock through the exercise of stock options and warrants and the sale of shares under our employee stock purchase plan. In addition, we received $46.4 million in incremental tax benefit related to stock options exercised.
Cash provided by financing activities totaled $116.5 million in 2010. We received $118.0 million in proceeds from the issuance of our common stock through the exercise of stock options and warrants and sales of shares under our employee stock purchase plan. We also received $42.4 million in incremental tax benefit related to stock options exercised. These increases were partially offset by common stock repurchases of $44.0 million.
Liquidity
We manage our business to maximize operating cash flows as the“Cash Flow Summary” below. Our primary source of our liquidity.liquidity has been cash flows from operations. Our ability to generate cash from operations provides us with the financial flexibility we need to meet operating, investing, and financing needs. Historically, we have issued debt and equity securities to finance our requirements to the extent that cash provided by operating activities was not sufficient to fund our needs.
At January 1, 2012, we had approximately $1.2 billion in cash, cash equivalents, and short-term investments. Our short-term investments include marketable securities consisting of debt securities in government sponsored entities, corporate debt securities, and U.S. treasury notes. Cash and cash equivalents held by our foreign subsidiaries at January 1,December 30, 2012 were approximately $178.1 million.$265.5 million. It is the Company'sour intention to indefinitely reinvest all current and future foreign earnings in foreign subsidiaries.
During the first halfHistorically, we have liquidated our short-term investments and/or issued debt and equity securities to finance our business needs as a supplement to cash provided by operating activities. At December 30, 2012, we have $916.2 million in
short-term investments. Our short-term investments include marketable securities consisting of debt securities in government-sponsored entities, corporate debt securities, and U.S. Treasury notes.
In 2011, we issued $920.0 million in principal amount of convertible senior notes that mature on March 15, 2016.2016 (2016 notes). We pay 0.25% interest per annum on the principal amount of the 2016 notes payable semi-annually in arrears in cash on March 15 and September 15 of each year. In 2007, we issued $400.0 million in principal of convertible senior notes that mature on February 15, 2014.2014 (2014 notes). We pay 0.625% interest per annum on the principal amount of the 2014 notes payable semi-annually in arrears in cash on February 15 and August 15 of each year. Additional information about the convertible notes, including their conversion features, is described in note “8.“7. Convertible Senior Notes” in Part I,II, Item 1,8, of this Form 10-K. As of January 1,December 30, 2012, the principal amounts of our 0.25% convertible senior2016 notes due 2016 and our 0.625% convertible senior2014 notes due 2014 were $920.0 million and $40.1 million, respectively.
During 2011, we used part Our commitment of the net proceeds from the issuance of our 0.25% convertible seniorinterest payment on these outstanding notes due 2016 for the extinguishment ofis $349.98.4 million principal amount of our existing 0.625% convertible senior notes due 2014 upon conversion. We will continue to use the net proceeds from the issuance of our 0.25% convertible senior notes due 2016 for future debt extinguishment. In addition, we usedon an additional $314.3 million of the net proceeds to purchase 4.9 million shares of our common stock in privately negotiated transactions concurrently with the issuance. We intend to use the remaining net proceeds for other general corporate purposes, which may include acquisitions and additional purchases of our common stock.annual basis.
Our primary short-term needs for capital, which are subject to change, include expenditures related to:
potential strategic acquisitions and investments;
support of commercialization efforts related to our current and future products, including expansion of our direct sales force and field support resources both in the United States and abroad;
repurchases of our outstanding common stock;
the continued advancement of research and development efforts;
acquisitions of equipment and other fixed assets for use in our current and future manufacturing and research and development facilities;
repurchases of our outstanding common stock;
the continued advancement of research and development efforts;
potential strategic acquisitions and investments; and
the expansion needs of our facilities, including costs of leasing additional facilities.
In 2012, we acquired BlueGnome for total cash and other consideration of $95.5 million, which included $7.5 million in fair value of contingent cash consideration. In 2011, we acquired Epicentre for total cash and other consideration of $71.4 million, which included $4.6 million in the fair value of contingent consideration settled in stock and $7.4 million in the fair value of contingent cash consideration.
Our Board of Directors has authorized several common stock repurchase programs. In 2012, we used $82.5 million to repurchase our outstanding shares under these programs. As of December 30, 2012, we had authorization from our Board of Directors to repurchase to an additional $167.5 million of our common stock.
During 2011, we used $314.3 million of the net proceeds from the issuance of our 2016 notes to purchase 4.9 million shares of our common stock in privately negotiated transactions concurrently with the issuance. We also used part of the net proceeds for the extinguishment of $349.9 million principal amount of our 2014 notes upon conversion. We used the remaining net proceeds for other general corporate purposes, which included acquisitions and purchases of our common stock.
We expect that our revenue and the resulting operating income, as well as the status of each of our new product development programs, will significantly impact our cash management decisions.
We anticipate that our current cash, and cash equivalents and short-term investments, together with cash provided by operating activities will be sufficient to fund our near term capital and operating needs for at least the next 12 months, barring unforeseen circumstances.including the pending acquisition of Verinata. Operating needs include the planned costs to operate our business, including amounts required to fund working capital and capital expenditures. At the present time, we have no material commitments for capital expenditures. Our future capital requirements and the adequacy of our available funds will depend on many factors, including:
our ability to successfully commercialize and further develop our technologies and create innovative products in our markets;
scientific progress in our research and development programs and the magnitude of those programs;
competing technological and market developments; and
the need to enter into collaborations with other companies or acquire other companies or technologies to enhance or complement our product and service offerings.
Cash flow Summary
|
| | | | | | | | | | | |
| (In thousands) | 2012 | | 2011 | | 2010 |
| Net cash provided by operating activities | $ | 291,873 |
| | $ | 358,140 |
| | $ | 272,573 |
|
| Net cash used in investing activities | (150,012 | ) | | (400,999 | ) | | (285,053 | ) |
| Net cash (used in) provided by financing activities | (10,755 | ) | | 97,016 |
| | 116,474 |
|
| Effect of exchange rate changes on cash and cash equivalents | (103 | ) | | (126 | ) | | 320 |
|
| Net increase in cash and cash equivalents | $ | 131,003 |
| | $ | 54,031 |
| | $ | 104,314 |
|
Operating Activities
Cash provided by operating activities in 2012 consisted of net income of $151.3 million plus net adjustments to net income of $158.6 million, offset by a change in net operating assets of $18.0 million. The primary non-cash expenses added back to net income included share-based compensation of $94.3 million, depreciation and amortization expenses related to property and equipment and acquired intangible assets of $63.8 million, impairment of IPR&D of $21.4 million, and the accretion of the debt discount of $35.0 million. The adjustments to net income also included $20.8 million in incremental tax benefit related to share-based compensation, $45.9 million in net cost-method investment related gain, and $6.0 million in recovery of a previously impaired note receivable. The main drivers in the change in net operating assets included increases in accounts receivable, inventory, accounts payable, and accrued liabilities.
Cash provided by operating activities in 2011 consisted of net income of $86.6 million plus net adjustments to net income of $236.5 million and changes in net operating assets of $35.0 million. The primary non-cash expenses added back to net income included share-based compensation of $92.1 million, depreciation and amortization expenses related to property and equipment and acquired intangible assets of $68.3 million, debt extinguishment loss of $37.6 million, and the accretion of the debt discount of $32.2 million. The adjustments to net income also included $46.4 million in incremental tax benefit related to share-based compensation. The main drivers in the change in net operating assets included increases in accrued liabilities, and decreases in inventory and accounts payable.
Cash provided by operating activities in 2010 consisted of net income of $124.9 million plus net adjustments to net income of $150.1 million, offset by a $2.4 million decrease in net operating assets. The primary non-cash expenses added back to net income included share based compensation of $71.6 million, depreciation and amortization expenses related to property and equipment and intangible assets of $42.0 million, and accretion of the debt discount on our convertible notes totaling $21.4 million. The adjustments to net income also included $42.4 million in incremental tax benefit related to share-based compensation. The main drivers in the change in net operating assets included increases in accounts receivable, inventory, accounts payable and accrued liabilities.
Investing Activities
Cash used in investing activities totaled $150.0 million in 2012. We purchased $925.5 million of available-for-sale securities and $898.8 million of our available-for-sale securities matured or were sold during the period. We used $15.9 million for purchases of strategic investments and $12.2 million for purchases of intangible assets. We also paid net cash of $83.2 million for acquisitions, and invested $68.8 million in capital expenditures primarily associated with the purchase of manufacturing and servicing equipment, leasehold improvements, and information technology equipment and systems. We received $50.8 million in proceeds from a sale of a cost-method investment as well as $6.0 million from the recovery of a note receivable previously impaired.
Cash used in investing activities totaled $401.0 million in 2011. We purchased $1.3 billion of available-for-sale securities, and $1.1 billion of our available-for-sale securities matured or were sold during 2011. We used $58.3 million, net of cash acquired, in an acquisition and $13.8 million in the purchases of strategic investments. We also incurred $77.8 million in capital expenditures primarily associated with the purchase of manufacturing, R&D, and servicing equipment, leasehold improvements, and information technology equipment and systems.
Cash used in investing activities totaled $285.1 million in 2010. During the year we purchased $846.2 million of available-for-sale securities, and $688.6 million of our available-for-sale securities matured or were sold. We also paid net cash of $98.2 million for acquisitions, sold trading securities totaling $54.9 million, used $49.8 million for capital expenditures
primarily associated with the purchase of manufacturing equipment and infrastructure for additional production capacity and rental and loaner instruments, and made strategic investments totaling $27.7 million.
Financing Activities
Cash used in financing activities totaled $10.8 million in 2012. We received $54.4 million in proceeds from the issuance of common stock through the exercise of stock options and warrants and under our employee stock purchase plan. We used $82.5 million to repurchase our common stock in 2012. In addition, we received $20.8 million in incremental tax benefit related to share-based compensation.
Cash provided by financing activities totaled $97.0 million in 2011. We received $903.5 million in proceeds from the issuance of $920.0 million of our 0.25% convertible senior notes due 2016, net of issuance discounts, of which $349.9 million was used to repay the principal amount of our 0.625% convertible senior notes due 2014 upon conversions in 2011. We used $570.4 million in repurchases of our common stock. We also received $67.5 million in proceeds from the issuance of our common stock through the exercise of stock options and warrants and under our employee stock purchase plan. In addition, we received $46.4 million in incremental tax benefit related to share-based compensation.
Cash provided by financing activities totaled $116.5 million in 2010. We received $118.0 million in proceeds from the issuance of our common stock through the exercise of stock options and warrants and under our employee stock purchase plan. We also received $42.4 million in incremental tax benefit related to share-based compensation. Cash provided by these activities was partially offset by common stock repurchases of $44.0 million.
Off-Balance Sheet Arrangements
We do not participate in any transactions that generate relationships with unconsolidated entities or financial partnerships, such as entities often referred to as structured finance or special purpose entities, which would have been established for the purpose of facilitating off-balance sheet arrangements or other contractually narrow or limited purposes. During the fiscal year ended January 1,December 30, 2012, we were not involved in any “off-balance sheet arrangements” within the meaning of the rules of the SEC.Securities and Exchange Commission.
Contractual Obligations
Contractual obligations represent future cash commitments and liabilities under agreements with third parties, and exclude orders for goods and services entered into in the normal course of business that are not enforceable or legally binding. The following table represents our contractual obligations as of January 1,December 30, 2012, aggregated by type (amounts in thousands):
| | | | | Payments Due by Period(1) | | Payments Due by Period(1) |
| | | | | Less Than | | | | | | More Than | | | | Less Than | | | | | | More Than |
| Contractual Obligation | | Total | | 1 Year | | 1 – 3 Years | | 3 – 5 Years | | 5 Years | | Total | | 1 Year | | 1 – 3 Years | | 3 – 5 Years | | 5 Years |
| Debt obligations(2) | | $ | 971,102 |
| | $ | 2,551 |
| | $ | 45,101 |
| | $ | 923,450 |
| | $ | — |
| | $ | 968,551 |
| | $ | 2,551 |
| | $ | 44,850 |
| | $ | 921,150 |
| | $ | — |
|
| Operating leases | | 487,267 |
| | 16,336 |
| | 43,949 |
| | 41,207 |
| | 385,775 |
| | 515,207 |
| | 27,676 |
| | 47,167 |
| | 47,276 |
| | 393,088 |
|
| Purchase obligations | | 6,571 |
| | 6,571 |
| | — |
| | — |
| | — |
| | 12,276 |
| | 8,908 |
| | 3,368 |
| | — |
| | — |
|
| Amounts due under executive deferred compensation plan | | 8,970 |
| | 8,970 |
| | — |
| | — |
| | — |
| | 12,071 |
| | 12,071 |
| | — |
| | — |
| | — |
|
| Total | | $ | 1,467,346 |
| | $ | 27,864 |
| | $ | 89,050 |
| | $ | 964,657 |
| | $ | 385,775 |
| | $ | 1,508,105 |
| | $ | 51,206 |
| | $ | 95,385 |
| | $ | 968,426 |
| | $ | 393,088 |
|
| |
| (1) | The table excludes $28.4$37.6 million of uncertain tax benefits. We have not included this amount in the table because we cannot make a reasonably reliable estimate regarding the timing of settlements with taxing authorities, if any. See note “13. Income Taxes” in Part II, Item 8 of this Form 10-K for further discussion of our uncertain tax positions. The table also excludes $15.0$35.0 million in potential contingent consideration payments related to acquisitions. We have not included this amount in the table because we cannot make a reasonably reliable estimate regarding whether the milestones required for these payments will be achieved. See note “4. Acquisitions” in Part II, Item 8 of this Form 10-K for further discussion of our contingent consideration. |
| |
| (2) | Debt obligations include the principal amount of our convertible senior notes due 2016 and 2014, as well as interest payments to be made under the notes. Although these notes mature in 2016 and 2014 respectively, they can be converted into cash and shares of our common stock prior to maturity if certain conditions are met. Any conversion prior to maturity can result in repayments of the principal amounts sooner than the scheduled repayments as indicated in the table. See note “8. Convertible Senior Notes” in Part II, Item 8 of this Form 10-K for further discussion of the terms of the convertible senior notes. |
maturity can result in repayments of the principal amounts sooner than the scheduled repayments as indicated in the table. See note “7. Convertible Senior Notes” in Part II, Item 8 of this Form 10-K for further discussion of the terms of the convertible senior notes.
Critical Accounting Policies and Estimates
The preparation of financial statements in accordance with U.S. generally accepted accounting principles requires management to make estimates and assumptions that affect the amounts reported in our consolidated financial statements and accompanying notes. Management bases its estimates on historical experience, market and other conditions, and various other assumptions it believes to be reasonable. Although these estimates are based on management’s best knowledge of current events and actions that may impact us in the future, the estimation process is, by its nature, uncertain given that estimates depend on events over which we may not have control. If market and other conditions change from those that we anticipate, our consolidated financial statements may be materially affected. In addition, if our assumptions change, we may need to revise our estimates, or take other corrective actions, either of which may also have a material effect on our consolidated financial statements.
We believe that the following critical accounting policies and estimates have a higher degree of inherent uncertainty and require our most significant judgments. In addition, had we used estimates different from any of these, our consolidated financial statements could have been materially different from those presented. Members of our senior management have discussed the development and selection of our critical accounting policies and estimates, and our disclosure regarding them, with the audit committee of our board of directors. Our accounting policies are more fully described in note “1. Organization and Significant Accounting Policies” in Part II, Item 8 of this Form 10-K.
Revenue Recognition
Our revenue is generated primarily from the sale of products and services. Product revenue primarily consists of sales of instruments and consumables used in genetic analysis. Service and other revenue primarily consists of revenue received for performingfrom instrument service contract sales, genotyping and sequencing services, instrument service contract sales, and amounts earned under research agreements with government grants, which are recognized in the period during which the related costs are incurred. The timing of revenue recognition and the amount of revenue actually recognized in each case depends upon a variety of factors, including the specific terms of each arrangement and the nature of our deliverables and obligations. Determination of the appropriate amount of revenue recognized involves significant judgments and estimates and actual results may differ from our estimates.
We recognize revenue when persuasive evidence of an arrangement exists, delivery has occurred or services have been rendered, the seller’s price to the buyer is fixed or determinable, and collectibility is reasonably assured. In instances where final acceptance of the product or system is required, revenue is deferred until all the acceptance criteria have been met. All revenue is recorded net of any discounts.
Revenue for product sales is recognized generally upon transfer of title to the customer, provided that no significant obligations remain and collection of the receivable is reasonably assured. Revenue forfrom instrument service contracts is recognized as the services are rendered, typically evenly over the contract term. Revenue from genotyping and sequencing services is recognized when earned, which is generally at the time the genotyping or sequencing analysis data is made available to the customer or agreed upon milestones are reached.
In order to assess whether the price is fixed or determinable, we evaluate whether refund rights exist. If there are refund rights or payment terms based on future performance, we defer revenue recognition until the price becomes fixed or determinable. We assess collectibility based on a number of factors, including past transaction history with the customer and the creditworthiness of the customer. If we determine that collection of a payment is not reasonably assured, revenue recognition is deferred until receipt of payment.
We regularly enter into contracts where revenue is derived from multiple deliverables including any mix of products or services. These products or services are generally delivered within a short time frame, approximately three to six months, of the contract execution date. Revenue recognition for contracts with multiple deliverables is based on the individual units of accounting determined to exist in the contract. A delivered item is considered a separate unit of accounting when the delivered item has value to the customer on a stand-alone basis. Items are considered to have stand-alone value when they are sold separately by any vendor or when the customer could resell the item on a stand-alone basis.
For transactions with multiple deliverables, consideration is allocated at the inception of the contract to all deliverables based on their relative selling price. The relative selling price for each deliverable is determined using vendor specific objective
evidence (VSOE) of selling price or third-party evidence of selling price if VSOE does not exist. If neither VSOE nor third-party evidence exists, we use best estimate of the selling price for the deliverable.
In order to establish VSOE of selling price, we must regularly sell the product or service on a standalone basis with a substantial majority priced within a relatively narrow range. VSOE of selling price is usually the midpoint of that range. If there are not a sufficient number of standalone sales and VSOE of selling price cannot be determined, then we consider whether third party evidence can be used to establish selling price. Due to the lack of similar products and services sold by other companies within the industry, we have rarely established selling price using third-party evidence. If neither VSOE nor third party evidence of selling price exists, we determine our best estimate of selling price using average selling prices over a rolling 12-month period coupled with an assessment of current market conditions. If the product or service has no history of sales or if the sales volume is not sufficient, we rely upon prices set by our pricing committee adjusted for applicable discounts. We recognize revenue for delivered elements only when we determine there are no uncertainties regarding customer acceptance.
In the first quarter of 2010, we offered an incentive with the launch of the HiSeq 2000 that enabled existing Genome Analyzer customers to trade in their Genome Analyzer and receive a discount on the purchase of a HiSeq 2000. The incentive was limited to customers who had purchased a Genome Analyzer as of the date of the announcement and was the first significant trade-in program we have offered. The Genome Analyzer trade-in program was completed in 2011. We accounted for HiSeq 2000 discounts related to the Genome Analyzer trade-in program as reductions to revenue upon recognition of the HiSeq 2000 sales revenue, which is later than the date the trade-in program was launched.
In certain markets, within Europe, the Asia-Pacific region, Latin America, the Middle East, and South Africa, the Company sells products and provides services to customers through distributors that specialize in life science products. In most sales through distributors, the product is delivered directly to customers. In cases where the product is delivered to a distributor, revenue
recognition is deferred until acceptance is received from the distributor, and/or the end-user, if required by the applicable sales contract. The terms of sales transactions through distributors are consistent with the terms of direct sales to customers. These transactions are accounted for in accordance with the Company'sCompany’s revenue recognition policy described herein.
Investments
We invest in various types of securities, including debt securities in government sponsoredgovernment-sponsored entities, corporate debt securities, and U.S. treasury securities. As of January 1,December 30, 2012, we have $886.6916.2 million in short-term investments. In accordance with the accounting standard for fair value measurements, we classify our investments as Level 1, 2, or 3 within the fair value hierarchy. Fair values determined by Level 1 inputs utilize quoted prices (unadjusted) in active markets for identical assets that we have the ability to access. Fair values determined by Level 2 inputs utilize data points that are observable such as quoted prices, interest rates and yield curves. Fair values determined by Level 3 inputs utilize unobservable data points for the asset.
As noteddiscussed in note "6.“6. Fair Value Measurements"Measurements” in Part II, Item 8 of this Form 10-K, a majority of our security holdings have been classified as Level 2. These securities have been initially valued at the transaction price and subsequently valued utilizing a third party service provider who assesses the fair value using inputs other than quoted prices that are observable either directly or indirectly, such as yield curve, volatility factors, credit spreads, default rates, loss severity, current market and contractual prices for the underlying instruments or debt, broker and dealer quotes, as well as other relevant economic measures. We perform certain procedures to corroborate the fair value of these holdings, and in the process, we apply judgments and estimates that if changed, could significantly affect our results of operations.
Allowance for Doubtful Accounts
We maintain an allowance for doubtful accounts for estimated losses resulting from the inability of our customers to make required payments. We evaluate the collectibility of our accounts receivable based on a combination of factors. We regularly analyze customer accounts, review the length of time receivables are outstanding, review historical loss rates and assess current economic trends that may impact the level of credit losses in the future. Our gross trade accounts receivables totaled $177.9219.3 million and the allowance for doubtful accounts was $4.04.3 million at January 1, 2012.December 30, 2012. Our allowance for doubtful accounts has generally been adequate to cover our actual credit losses. However, since we cannot reliably predict future changes in the financial stability of our customers, we may need to increase our reserves if the financial conditions of our customers deteriorate.
Inventory Valuation
Inventories are stated at lower of cost or market. We record adjustments to inventory for potentially excess, obsolete, or impaired goods in order to state inventory at net realizable value. We must make assumptions about future demand, market conditions, and the release of new products that will supersede old ones. We regularly review inventory for excess and obsolete products and components, taking into account product life cycles, quality issues, historical experience, and usage forecasts. Our gross inventory totaled $143.3$178.6 million and the cumulative adjustment for potentially excess and obsolete inventory was $14.5$19.9 million at January 1, 2012.December 30, 2012. Historically, our inventory adjustment has been adequate to cover our losses. However, if actual market conditions are less favorable than anticipated, additional inventory adjustments could be required.
Contingencies
We are subject to legal proceedings primarily relatedinvolved in various lawsuits and claims arising in the ordinary course of business, including actions with respect to intellectual property, employment, and contractual matters. We routinely assess the likelihood of adverse judgments or outcomes toIn connection with these matters, as well as rangeswe assess, on a regular basis, the probability and range of possible loss based on the developments in these matters. A liability is recorded in the financial statements if it is believed to be probable losses, to the extent losses are reasonably estimable. If losses are probable and reasonably estimable, we will recordthat a liability and an expense for the estimated loss. Disclosure for specific legal contingencies will be provided if the likelihood of occurrence is probable, or reasonably possible,loss has been incurred and the exposureamount of the loss can be reasonably estimated. Because litigation is considered materialinherently unpredictable and unfavorable resolutions could occur, assessing contingencies is highly subjective and requires judgments about future events. We regularly review outstanding legal matters to our consolidated financial statements. Management considersdetermine the adequacy of the liabilities accrued and related disclosures in consideration of many factors, in making determinations of likely outcomes of litigation matters. These factorswhich include, but are not limited to, past history, scientific and other evidence, and the specifics and status of each matter. We may change our estimates if our assessment of the various factors changes whichand the amount of ultimate loss may result in the recording of an accrual or a changediffer from our estimates, resulting in a previously recorded accrual. Predicting the outcomematerial effect on our business, financial condition, results of claims and litigation, and estimating related costs and exposure involves substantial uncertainties that could cause actual costs to vary materially from estimates and accruals.operations, and/or cash flows.
Business Combinations
Under the acquisition method of accounting, we allocate the fair value of the total consideration transferred to the tangible and identifiable intangible assets acquired and liabilities assumed based on their estimated fair values on the date of
acquisition. The fair values assigned, defined as the price that would be received to sell an asset or paid to transfer a liability in an orderly transaction between willing market participants, are based on estimates and assumptions determined by management. We record the excess consideration over the aggregate fair value of tangible and intangible assets, net of liabilities assumed, as goodwill. These valuations require us to make significant estimates and assumptions, especially with respect to intangible assets.
In connection with certain of our acquisitions, additional contingent consideration is earned by the sellers upon completion of certain future performance milestones. In these cases, a liability is recorded on the acquisition date for an estimate of the acquisition date fair value of the contingent consideration by applying the income approach utilizing variable factorsinputs such as anticipated future cash flows, risk-free adjusted discount rates, and nonperformance risk. Any change in the fair value of the contingent consideration subsequent to the acquisition date is recognized in acquisition related expense (gain) expense,, net, a component of operating expenses, in our consolidated statements of income. This method requires significant management judgment, including the probability of achieving certain future milestones and discount rates. Future changes in our estimates could result in expenses or gains.
Management typically uses athe discounted cash flow method to value our acquired intangible assets. This method requires significant management judgment to forecast future operating results and establish residual growth rates and discount factors. The estimates we use to value and amortize intangible assets are consistent with the plans and estimates that we use to manage our business and are based on available historical information and industry estimates and averages. If the subsequent actual results and updated projections of the underlying business activity change compared with the assumptions and projections used to develop these values, we could experience impairment charges. In addition, we have estimated the economic lives of certain acquired assets and these lives are used to calculate depreciation and amortization expense. If our estimates of the economic lives change, depreciation or amortization expenses could be accelerated or slowed.
Intangible Assets and Other Long-Lived Assets — Impairment Assessments
We regularly perform reviews to determine if the carrying values of our long-lived assets are impaired. A review of identifiable intangible assets that have finite useful lives and other long-lived assets is performed when an event occurs indicating the potential for impairment. If indicators of impairment exist, we assess the recoverability of the affected long-lived assets by determining whetherand compare their fair values to the respective carrying amount of such assets exceeds the undiscounted expected future cash flows associated with such assets.amounts.
In order to estimate the fair value of purchasedidentifiable intangible assets and other long-lived assets, that have finite useful lives, we estimate the present value of future cash flows from those assets. The key assumptions that we use in our discounted cash flow model are the amount and timing of estimated future cash flows to be generated by the asset over an extended period of time and a rate of return that considers the relative risk of achieving the cash flows, the time value of money, and other factors that a willing market participant would consider. Significant judgment is required to estimate the amount and timing of future cash flows and the relative risk of achieving those cash flows.
Assumptions and estimates about future values and remaining useful lives are complex and often subjective. They can be affected by a variety of factors, including external factors such as industry and economic trends, and internal factors such as changes in our business strategy and our internal forecasts. For example, if our future operating results do not meet current forecasts or if we experience a sustained decline in our market capitalization that is determined to be indicative of a reduction in fair value of one or more of our reporting units, we may be required to record future impairment charges for purchased intangible assets. Impairment charges could materially decrease our future net income and result in lower asset values on our balance sheet.
Share-Based Compensation
We are required to measure and recognize compensation expense for all share-based payments made to employees and directors based on estimated fair value. We estimate the fair value of stock options granted and stock purchases under our employee stock purchase plan using the Black-Scholes-Merton (BSM) option-pricing model. The fair value of our restricted stock units is based on the market price of our common stock on the date of grant.
The determination of fair value of share-based awards using the BSM model requires the use of certain estimates and highly judgmental assumptions that affect the amount of share-based compensation expense recognized in our consolidated statements of income. These include estimates of the expected volatility of our stock price, expected life of an award, expected dividends, and the risk-free interest rate. We determine the volatility of our stock price by equally weighing the historical and implied volatility of our common stock. The historical volatility of our common stock over the most recent period is generally
commensurate with the estimated expected life of our stock awards, adjusted for the impact of unusual fluctuations not reasonably expected to recur, and other relevant factors. Implied volatility is calculated from the implied market volatility of exchange-traded call options on our common stock. The expected life of an award is based on historical forfeiture experience, exercise activity, and on the terms and conditions of the stock awards. We determined expected dividend yield to be 0% given we have never declared or paid any cash dividends on our common stock and we currently do not anticipate paying such cash dividends. The risk-free interest rate is based upon U.S. Treasury securities with remaining terms similar to the expected term of the share-based awards. We amortize the fair value of share-based compensation on a straight-line basis over the requisite service periods of the awards. If any of the assumptions used in the BSM model change significantly, share-based compensation expense may differ materially from what we have recorded in the current period.
Warranties
We generally provide a one-year warranty on instruments. Additionally, we provide a warranty on consumables through the expiration date, which generally ranges from six to twelve months after the manufacture date. We establish an accrual for estimated warranty expenses based on historical experience as well as anticipated product performance. We periodically review the adequacy of our warranty reserve, and adjust, if necessary, the warranty percentage and accrual based on actual experience and estimated costs to be incurred. If our estimates of warranty obligation change or if actual product performance is below our expectations we may incur additional warranty expense.
Cease-Use Loss upon Exit of Facility
In 2011,2012, we relocatedcompleted the relocation of our headquarters to a new facility in San Diego, California, and recorded headquarter relocation expense of $41.826.3 million, the majority of which includedwas attributable to a cease-use loss of $23.6 millionrecorded upon vacating certain buildings of our prior headquarter facility. The lease on our prior headquarter facility expires in 2023. The cease-use loss is calculated as the present value of the remaining lease obligation offset by estimated sublease rental receipts during the remaining lease period, adjusted for deferred items and leasehold improvements. In calculating the cease-use loss, management is required to make significant judgments to estimate the present value of future cash flows from the assumed sublease. The key assumptions that we use in our discounted cash flow model include the amount and timing of estimated sublease rental receipts, and the risk-adjusted discount rate. These assumptions are subjective in nature and the actual future cash flows could differ from our estimates, resulting in significant adjustments to the cease-use loss recorded or to be recorded.
Income Taxes
Our provision for income taxes, deferred tax assets and liabilities, and reserves for unrecognized tax benefits reflect our best assessment of estimated future taxes to be paid. Significant judgments and estimates based on interpretations of existing tax laws or regulations in the United States and the numerous foreign jurisdictions where we are subject to income tax are required in determining our provision for income taxes. Changes in tax laws, statutory tax rates, and estimates of the company’s future taxable income could impact the deferred tax assets and liabilities provided for in the consolidated financial statements and would require an adjustment to the provision for income taxes.
Deferred tax assets are regularly assessed to determine the likelihood they will be recovered from future taxable income. A valuation allowance is established when we believe it is more likely than not the future realization of all or some of a deferred tax asset will not be achieved. In evaluating our ability to recover deferred tax assets within the jurisdiction which they arise, we consider all available positive and negative evidence. Factors reviewed include the cumulative pre-tax book income for the past three years, scheduled reversals of deferred tax liabilities, our history of earnings and reliability of our forecasts, projections of pre-tax book income over the foreseeable future, and the impact of any feasible and prudent tax planning strategies. Based on the available evidence as of January 1,December 30, 2012, we were not able to conclude it is more likely than not certain U.S. deferred tax assets will be realized. Therefore, we recorded a valuation allowance of $1.8$1.8 million against certain U.S. deferred tax assets.
We recognize the impact of a tax position in our financial statements only if that position is more likely than not of being sustained upon examination by taxing authorities, based on the technical merits of the position. Tax authorities regularly examine our returns in the jurisdictions in which we do business and we regularly assess the tax risk of the company’s return filing positions. Due to the complexity of some of the uncertainties, the ultimate resolution may result in payments that are materially different from our current estimate of the tax liability. These differences, as well as any interest and penalties, will be reflected in the provision for income taxes in the period in which they are determined.
| |
| ITEM 7A. | Quantitative and Qualitative Disclosures about Market Risk. |
Interest Rate Sensitivity
Our investment portfolio is exposed to market risk from changes in interest rates. The fair market value of fixed rate securities may be adversely impacted by fluctuations in interest rates while income earned on floating rate securities may decline as a result of decreases in interest rates. Under our current policies, we do not use interest rate derivative instruments to manage exposure to interest rate changes. We attempt to ensure the safety and preservation of our invested principal funds by limiting default risk, market risk, and reinvestment risk. We mitigate default risk by investing in investment grade securities. We have historically maintained a relatively short average maturity for our investment portfolio, and we believe a hypothetical 100 basis point adverse move in interest rates along the entire interest rate yield curve would not materially affect the fair value of our interest sensitive financial instruments. In addition, if a 100 basis point change in overall interest rates were to occur in 2012,2013, our interest income would change by approximately $11.913.5 million in relation to amounts we would expect to earn, based on our cash, cash equivalents, and short-term investments as of January 2, 2011.December 30, 2012.
Changes in interest rates may also impact gains or losses from the conversion of our outstanding convertible senior notes. During 2011, we issued $920 million in aggregate principal amount of our 0.25% convertible senior notes due 2016. At our election, the notes are convertible into cash, shares of our common stock, or a combination of cash and shares of our common stock in each case under certain circumstances, including trading price conditions related to our common stock. If the trading price of our common stock reaches a price for a sustained period at 130% above the conversion price of $83.55,$83.55, the notes will become convertible. Upon conversion, we are required to record a gain or loss for the difference between the fair value of the debt to be extinguished and its corresponding net carrying value. The fair value of the debt to be extinguished depends on our then-current incremental borrowing rate. If our incremental borrowing rate at the time of conversion is higher or lower than the implied interest rate of the notes, we will record a gain or loss in our consolidated statement of income during the period in which the notes are converted. The implicit interest rate for the notes is 4.5%. An incremental borrowing rate that is a hypothetical 100 basis points lower than the implicit interest rate upon conversion of $100 million aggregate principal amount of the notes would result in a loss of approximately $4.0 million.$3.0 million.
Market Price Sensitive Instruments
In order to reduce potential equity dilution, in connection with the issuance (and potential conversion) of our 0.625% convertible senior notes due 2014, we entered into convertible note hedge transactions, entitling us to purchase up to 18,322,32018,322,000 shares of our common stock at a strike price of $21.83 per share, subject to adjustment. In addition, we sold to the hedge transaction counterparties warrants exercisable on a net-share basis, for up to 18,322,32018,322,000 shares of our common stock at a strike price of $31.435 per share, subject to adjustment. The anti-dilutive effect of the note hedge transactions, if any, could be partially or fully offset to the extent the trading price of our common stock exceeds the strike price of the warrants on the exercise dates of the warrants, which occur during 2014, assuming the warrants are exercised.
Foreign Currency Exchange Risk
We conduct a portion of our business in currencies other than the company'scompany’s U.S. dollar functional currency. These transactions give rise to monetary assets and liabilities that are denominated in currencies other than the U.S. dollar. The value of these monetary assets and liabilities are subject to changes in currency exchange rates from the time the transactions are originated until settlement in cash. Our foreign currency exposures are primarily concentrated in the Euro, Yen, British pound sterling, Australian dollar, and Singapore dollar. Both realized and unrealized gains or losses on the value of these monetary assets and liabilities are included in the determination of net income. We recorded an immateriala $3.7 million net currency exchange loss for the fiscal year ended January 1,December 30, 2012, and a gain of $1.0 million for the fiscal year ended January 2, 2011 on business transactions, net of hedging transactions, which are included in other (expense) income, net, in our consolidated statements of income.
We use forward exchange contracts to manage a portion of the foreign currency exposure risk for foreign subsidiaries with monetary assets and liabilities denominated in currencies other than the U.S. dollar. We only use derivative financial instruments to reduce foreign currency exchange rate risks; we do not hold any derivative financial instruments for trading or speculative purposes. We primarily use forward exchange contracts to hedge foreign currency exposures, and they generally have terms of one month or less. Realized and unrealized gains or losses on the value of financial contracts entered into to hedge the exchange rate exposure of these monetary assets and liabilities are also included in the determination of net income, as they have not been designated for hedge accounting. These contracts, which settle monthly, effectively fix the exchange rate at which these specific monetary assets and liabilities will be settled, so that gains or losses on the forward contracts offset the losses or gains from changes in the value of the underlying monetary assets and liabilities. AtAs of January 1,December 30, 2012, we hadthe total notional amount of outstanding forward contracts in place for foreign currency purchases was approximately $25.551.2 million of foreign currency forward contracts outstanding to hedge foreign currency risk..
| |
| ITEM 8. | Financial Statements and Supplementary Data. |
INDEX TO CONSOLIDATED FINANCIAL STATEMENTS
REPORT OF INDEPENDENT REGISTERED PUBLIC ACCOUNTING FIRM
The Board of Directors and Stockholders of
Illumina, Inc.
We have audited the accompanying consolidated balance sheets of Illumina, Inc. as of January 1,December 30, 2012 and January 2, 20111, 2012, and the related consolidated statements of income, comprehensive income, stockholders’ equity, and cash flows for each of the three fiscal years in the period ended January 1,December 30, 2012. Our audits also included the financial statement schedule listed in the Index at Item 15. These financial statements and schedule are the responsibility of the Company’s management. Our responsibility is to express an opinion on these financial statements and schedule based on our audits.
We conducted our audits in accordance with the standards of the Public Company Accounting Oversight Board (United States). Those standards require that we plan and perform the audit to obtain reasonable assurance about whether the financial statements are free of material misstatement. An audit includes examining, on a test basis, evidence supporting the amounts and disclosures in the financial statements. An audit also includes assessing the accounting principles used and significant estimates made by management, as well as evaluating the overall financial statement presentation. We believe that our audits provide a reasonable basis for our opinion.
In our opinion, the financial statements referred to above present fairly, in all material respects, the consolidated financial position of Illumina, Inc. at January 1,December 30, 2012 and January 2, 20111, 2012, and the consolidated results of its operations and its cash flows for each of the three fiscal years in the period ended January 1,December 30, 2012, in conformity with U.S. generally accepted accounting principles. Also, in our opinion, the related financial statement schedule, when considered in relation to the basic financial statements taken as a whole, presents fairly in all material respects the information set forth therein.
We also have audited, in accordance with the standards of the Public Company Accounting Oversight Board (United States), Illumina, Inc.’s internal control over financial reporting as of January 1,December 30, 2012, based on criteria established in Internal Control-Integrated Framework issued by the Committee of Sponsoring Organizations of the Treadway Commission and our report dated February 23, 201215, 2013 expressed an unqualified opinion thereon.
/s/ ERNST & YOUNG LLP
San Diego, California
February 23, 201215, 2013
ILLUMINA, INC.
CONSOLIDATED BALANCE SHEETS
(in thousands, except par value)
| | | | January 1,
2012 | | January 2,
2011 | | | | | |
| | (In thousands) | December 30,
2012 | | January 1,
2012 |
ASSETS | | Current assets: | |
| | |
| |
| | |
|
| Cash and cash equivalents | $ | 302,978 |
| | $ | 248,947 |
| $ | 433,981 |
| | $ | 302,978 |
|
| Short-term investments | 886,590 |
| | 645,342 |
| 916,223 |
| | 886,590 |
|
| Accounts receivable, net | 173,886 |
| | 165,598 |
| 214,975 |
| | 173,886 |
|
| Inventory, net | 128,781 |
| | 142,211 |
| |
| Inventory | | 158,718 |
| | 128,781 |
|
| Deferred tax assets, current portion | 23,188 |
| | 19,378 |
| 30,451 |
| | 23,188 |
|
| Prepaid expenses and other current assets | 29,196 |
| | 36,922 |
| 32,700 |
| | 29,196 |
|
| Total current assets | 1,544,619 |
| | 1,258,398 |
| 1,787,048 |
| | 1,544,619 |
|
| Property and equipment, net | 143,483 |
| | 129,874 |
| 166,167 |
| | 143,483 |
|
| Goodwill | 321,853 |
| | 278,206 |
| 369,327 |
| | 321,853 |
|
| Intangible assets, net | 106,475 |
| | 91,462 |
| 130,196 |
| | 106,475 |
|
| Deferred tax assets, long-term portion | 19,675 |
| | 39,497 |
| 40,183 |
| | 19,675 |
|
| Other assets | 59,735 |
| | 41,676 |
| 73,164 |
| | 59,735 |
|
| Total assets | $ | 2,195,840 |
| | $ | 1,839,113 |
| $ | 2,566,085 |
| | $ | 2,195,840 |
|
LIABILITIES AND STOCKHOLDERS’ EQUITY | | Current liabilities: | |
| | |
| |
| | |
|
| Accounts payable | $ | 49,806 |
| | $ | 66,744 |
| $ | 65,727 |
| | $ | 49,806 |
|
| Accrued liabilities | 187,774 |
| | 156,164 |
| 201,877 |
| | 177,115 |
|
| Long-term debt, current portion | — |
| | 311,609 |
| 36,967 |
| | — |
|
| Total current liabilities | 237,580 |
| | 534,517 |
| 304,571 |
| | 226,921 |
|
| Long-term debt | 807,369 |
| | — |
| 805,406 |
| | 807,369 |
|
| Other long-term liabilities | 69,954 |
| | 28,531 |
| 134,369 |
| | 80,613 |
|
| Commitments and contingencies |
|
| |
|
|
|
| |
|
|
| Conversion option subject to cash settlement | 5,722 |
| | 78,390 |
| 3,158 |
| | 5,722 |
|
| Stockholders’ equity: | |
| | |
| |
| | |
| Preferred stock, $0.01 par value, 10,000,000 shares authorized, no shares issued at January 1, 2012 and January 2, 2011 | — |
| | — |
| |
| Common stock, $0.01 par value, 320,000,000 shares authorized, 166,707,208 shares issued at January 1, 2012, 151,512,837 shares issued at January 2, 2011 | 1,668 |
| | 1,516 |
| |
| Preferred stock, $0.01 par value, 10,000 shares authorized, no shares issued and outstanding at December 30, 2012 and January 1, 2012 | | — |
| | — |
|
| Common stock, $0.01 par value: 320,000 shares authorized; 170,171 shares issued and 123,943 outstanding at December 30, 2012; 166,707 shares issued and 122,041 outstanding at January 1, 2012 | | 1,703 |
| | 1,668 |
|
| Additional paid-in capital | 2,249,900 |
| | 1,891,288 |
| 2,419,831 |
| | 2,249,900 |
|
| Accumulated other comprehensive income | 2,117 |
| | 1,765 |
| 2,123 |
| | 2,117 |
|
| Accumulated deficit | (68,707 | ) | | (155,335 | ) | |
| Treasury stock, at cost (44,664,972 shares at January 1, 2012 and 24,904,564 shares at January 2, 2011) | (1,109,763 | ) | | (541,559 | ) | |
| Retained earnings (accumulated deficit) | | 82,547 |
| | (68,707 | ) |
| Treasury stock, 46,228 shares and 44,665 shares at cost at December 30, 2012 and January 1, 2012, respectively | | (1,187,623 | ) | | (1,109,763 | ) |
| Total stockholders’ equity | 1,075,215 |
| | 1,197,675 |
| 1,318,581 |
| | 1,075,215 |
|
| Total liabilities and stockholders’ equity | $ | 2,195,840 |
| | $ | 1,839,113 |
| $ | 2,566,085 |
| | $ | 2,195,840 |
|
See accompanying notes to consolidated financial statements
ILLUMINA, INC.
CONSOLIDATED STATEMENTS OF INCOME
(In thousands, except per share amounts)
| | | | Years Ended | | | | | | | |
| | January 1,
2012 | | January 2,
2011 | | January 3,
2010 | Years Ended |
| | (In thousands, except per share amounts) | December 30,
2012 | | January 1,
2012 | | January 2,
2011 |
| Revenue: | |
| | |
| | |
| |
| | |
| | |
|
| Product revenue | $ | 987,280 |
| | $ | 842,510 |
| | $ | 627,240 |
| $ | 1,055,826 |
| | $ | 987,280 |
| | $ | 842,510 |
|
| Service and other revenue | 68,255 |
| | 60,231 |
| | 39,084 |
| 92,690 |
| | 68,255 |
| | 60,231 |
|
| Total revenue | 1,055,535 |
| | 902,741 |
| | 666,324 |
| 1,148,516 |
| | 1,055,535 |
| | 902,741 |
|
| Cost of revenue: | |
| | |
| | |
| |
| | |
| | |
|
| Cost of product revenue | 308,228 |
| | 271,997 |
| | 190,714 |
| 317,283 |
| | 308,228 |
| | 271,997 |
|
| Cost of service and other revenue | 26,118 |
| | 21,399 |
| | 15,055 |
| 43,552 |
| | 26,118 |
| | 21,399 |
|
| Amortization of acquired intangible assets | 12,091 |
| | 7,805 |
| | 6,680 |
| 14,153 |
| | 12,091 |
| | 7,805 |
|
| Total cost of revenue | 346,437 |
| | 301,201 |
| | 212,449 |
| 374,988 |
| | 346,437 |
| | 301,201 |
|
| Gross profit | 709,098 |
| | 601,540 |
| | 453,875 |
| 773,528 |
| | 709,098 |
| | 601,540 |
|
| Operating expense: | |
| | |
| | |
| |
| | |
| | |
|
| Research and development | 196,913 |
| | 177,947 |
| | 140,616 |
| 231,025 |
| | 196,913 |
| | 177,947 |
|
| Selling, general and administrative | 261,843 |
| | 220,454 |
| | 176,337 |
| 285,991 |
| | 261,843 |
| | 220,454 |
|
| Headquarter relocation expense | 41,826 |
| | — |
| | — |
| 26,328 |
| | 41,826 |
| | — |
|
| Unsolicited tender offer related expense | | 23,136 |
| | — |
| | — |
|
| Restructuring charges | 8,136 |
| | — |
| | — |
| 3,522 |
| | 8,136 |
| | — |
|
| Acquisition related expense (gain), net | 919 |
| | (8,515 | ) | | 11,325 |
| 2,774 |
| | 919 |
| | (8,515 | ) |
| Total operating expense | 509,637 |
| | 389,886 |
| | 328,278 |
| 572,776 |
| | 509,637 |
| | 389,886 |
|
| Income from operations | 199,461 |
| | 211,654 |
| | 125,597 |
| 200,752 |
| | 199,461 |
| | 211,654 |
|
| Other income (expense): | |
| | |
| | |
| |
| | |
| | |
|
| Cost-method investment related gain (loss), net | | 45,911 |
| | — |
| | (10,309 | ) |
| Interest income | 7,052 |
| | 8,378 |
| | 11,029 |
| 16,208 |
| | 7,052 |
| | 8,378 |
|
| Interest expense | (34,790 | ) | | (24,598 | ) | | (23,718 | ) | (37,779 | ) | | (34,790 | ) | | (24,598 | ) |
| Other (expense) income, net | (38,678 | ) | | (10,055 | ) | | 1,217 |
| (2,484 | ) | | (38,678 | ) | | 254 |
|
| Total other expense, net | (66,416 | ) | | (26,275 | ) | | (11,472 | ) | |
| Total other income (expense), net | | 21,856 |
| | (66,416 | ) | | (26,275 | ) |
| Income before income taxes | 133,045 |
| | 185,379 |
| | 114,125 |
| 222,608 |
| | 133,045 |
| | 185,379 |
|
| Provision for income taxes | 46,417 |
| | 60,488 |
| | 41,844 |
| 71,354 |
| | 46,417 |
| | 60,488 |
|
| Net income | $ | 86,628 |
| | $ | 124,891 |
| | $ | 72,281 |
| $ | 151,254 |
| | $ | 86,628 |
| | $ | 124,891 |
|
| Net income per basic share | $ | 0.70 |
| | $ | 1.01 |
| | $ | 0.59 |
| $ | 1.23 |
| | $ | 0.70 |
| | $ | 1.01 |
|
| Net income per diluted share | $ | 0.62 |
| | $ | 0.87 |
| | $ | 0.53 |
| $ | 1.13 |
| | $ | 0.62 |
| | $ | 0.87 |
|
| Shares used in calculating basic net income per share | 123,399 |
| | 123,581 |
| | 123,154 |
| 122,999 |
| | 123,399 |
| | 123,581 |
|
| Shares used in calculating diluted net income per share | 138,937 |
| | 143,433 |
| | 137,096 |
| 133,693 |
| | 138,937 |
| | 143,433 |
|
See accompanying notes to consolidated financial statements
ILLUMINA, INC.
CONSOLIDATED STATEMENTS OF COMPREHENSIVE INCOME
(In thousands)
|
| | | | | | | | | | | | |
| | | Years Ended |
| | | December 30,
2012 | | January 1,
2012 | | January 2,
2011 |
| Net income | | $ | 151,254 |
| | $ | 86,628 |
| | $ | 124,891 |
|
| Unrealized gain (loss) on available-for-sale securities, net of deferred tax | | 6 |
| | 352 |
| | (1,065 | ) |
| Total comprehensive income | | $ | 151,260 |
| | $ | 86,980 |
| | $ | 123,826 |
|
See accompanying notes to the consolidated financial statements.
ILLUMINA, INC.
CONSOLIDATED STATEMENTS OF STOCKHOLDERS’ EQUITY | | | | | | | | Additional | | Accumulated Other | | | | | | | | Total | | | | | Additional | | Accumulated Other | | Retained Earnings | | | | | | Total |
| | Common Stock | | Paid-In | | Comprehensive | | Accumulated | | Treasury Stock | | Stockholders’ | Common Stock | | Paid-In | | Comprehensive | | (Accumulated | | Treasury Stock | | Stockholders’ |
| | Shares | | Amount | | Capital | | Income | | Deficit | | Shares | | Amount | | Equity | Shares | | Amount | | Capital | | Income | | Deficit) | | Shares | | Amount | | Equity |
| | (In thousands) | (In thousands) |
| Balance as of December 28, 2008 | 138,937 |
| | $ | 1,389 |
| | $ | 1,469,770 |
| | $ | 2,422 |
| | $ | (352,507 | ) | | (17,928 | ) | | $ | (322,407 | ) | | $ | 798,667 |
| |
| Components of comprehensive income: |
|
| |
|
| |
|
| |
|
| |
|
| |
|
| |
|
| | |
| |
| Balance as of January 3, 2010 | | 143,544 |
| | 1,436 |
| | 1,637,751 |
| | 2,830 |
| | (280,226 | ) | | (24,068 | ) | | (497,543 | ) | | 864,248 |
|
| Net income | | — |
| | — |
| | — |
| | — |
| | 124,891 |
| | — |
| | — |
| | 124,891 |
|
| Unrealized loss on available-for-sale securities, net of deferred tax | | — |
| | — |
| | — |
| | (1,065 | ) | | — |
| | — |
| | — |
| | (1,065 | ) |
| Issuance of common stock, net of repurchases | | 7,969 |
| | 80 |
| | 117,965 |
| | — |
| | — |
| | (836 | ) | | (44,016 | ) | | 74,029 |
|
| Share-based compensation | | — |
| | — |
| | 71,725 |
| | — |
| | — |
| | — |
| | — |
| | 71,725 |
|
| Incremental tax benefit related to share-based compensation | | — |
| | — |
| | 42,445 |
| | — |
| | — |
| | — |
| | — |
| | 42,445 |
|
| Reclassification of conversion option subject to cash settlement | | — |
| | — |
| | 21,402 |
| | — |
| | — |
| | — |
| | — |
| | 21,402 |
|
| Balance as of January 2, 2011 | | 151,513 |
| | 1,516 |
| | 1,891,288 |
| | 1,765 |
| | (155,335 | ) | | (24,904 | ) | | (541,559 | ) | | 1,197,675 |
|
| Net income | — |
| | — |
| | — |
| | — |
| | 72,281 |
| | — |
| | — |
| | 72,281 |
| — |
| | — |
| | — |
| | — |
| | 86,628 |
| | — |
| | — |
| | 86,628 |
|
| Unrealized gain on available-for-sale securities, net of deferred tax | — |
| | — |
| | — |
| | 408 |
| | — |
| | — |
| | — |
| | 408 |
| — |
| | — |
| | — |
| | 352 |
| | — |
| | — |
| | — |
| | 352 |
|
| Comprehensive income |
|
| |
|
| |
|
| |
|
| |
|
| |
|
| |
|
| | 72,689 |
| |
| Issuance of common stock, net of repurchases | 4,523 |
| | 46 |
| | 46,909 |
| | — |
| | — |
| | (6,140 | ) | | (175,136 | ) | | (128,181 | ) | |
| Share-based compensation | — |
| | — |
| | 60,813 |
| | — |
| | — |
| | — |
| | — |
| | 60,813 |
| |
| Incremental tax benefit related to stock options exercised | — |
| | — |
| | 39,319 |
| | — |
| | — |
| | — |
| | — |
| | 39,319 |
| |
| Remeasurement of convertible debt | 84 |
| | 1 |
| | 20,940 |
| | — |
| | — |
| | — |
| | — |
| | 20,941 |
| |
| Balance as of January 3, 2010 | 143,544 |
| | 1,436 |
| | 1,637,751 |
| | 2,830 |
| | (280,226 | ) | | (24,068 | ) | | (497,543 | ) | | 864,248 |
| |
| Components of comprehensive income: | |
| | |
| | |
| | |
| | |
| | |
| | |
| | |
| |
| Net income | — |
| | — |
| | — |
| | — |
| | 124,891 |
| | — |
| | — |
| | 124,891 |
| |
| Unrealized loss on available-for-sale securities, net of deferred tax | — |
| | — |
| | — |
| | (1,065 | ) | | — |
| | — |
| | — |
| | (1,065 | ) | |
| Comprehensive income |
|
| |
|
| |
|
| |
|
| |
|
| |
|
| |
|
| | 123,826 |
| |
| Issuance of common stock, net of repurchases | 7,969 |
| | 80 |
| | 117,965 |
| | — |
| | — |
| | (836 | ) | | (44,016 | ) | | 74,029 |
| |
| Share-based compensation | — |
| | — |
| | 71,725 |
| | — |
| | — |
| | — |
| | — |
| | 71,725 |
| |
| Incremental tax benefit related to stock options exercised | — |
| | — |
| | 42,445 |
| | — |
| | — |
| | — |
| | — |
| | 42,445 |
| |
| Reclassification of conversion option subject to cash settlement | — |
| | — |
| | 21,402 |
| | — |
| | — |
| | — |
| | — |
| | 21,402 |
| |
| Balance as of January 2, 2011 | 151,513 |
| | 1,516 |
| | 1,891,288 |
| | 1,765 |
| | (155,335 | ) | | (24,904 | ) | | (541,559 | ) | | 1,197,675 |
| |
| Components of comprehensive income: | |
| | |
| | |
| | |
| | |
| | |
| | |
| | |
| |
| Net income | — |
| | — |
| | — |
| | — |
| | 86,628 |
| | — |
| | — |
| | 86,628 |
| |
| Unrealized gain on available-for-sale securities, net of deferred tax | — |
| | — |
| | — |
| | 352 |
| | — |
| | — |
| | — |
| | 352 |
| |
| Comprehensive income |
|
| |
|
| |
|
| |
|
| |
|
| |
|
| |
|
| | 86,980 |
| |
| Issuance of common stock, net of repurchases | 15,194 |
| | 152 |
| | 104,268 |
| | — |
| | — |
| | (19,990 | ) | | (572,207 | ) | | (467,787 | ) | 15,194 |
| | 152 |
| | 104,268 |
| | — |
| | — |
| | (19,990 | ) | | (572,207 | ) | | (467,787 | ) |
| Convertible note, equity portion, net of tax and issuance costs | — |
| | — |
| | 155,366 |
| | — |
| | — |
| | — |
| | — |
| | 155,366 |
| — |
| | — |
| | 155,366 |
| | — |
| | — |
| | — |
| | — |
| | 155,366 |
|
| Tax impact from the issuance of convertible debt | — |
| | — |
| | (59,427 | ) | | — |
| | — |
| | — |
| | — |
| | (59,427 | ) | — |
| | — |
| | (59,427 | ) | | — |
| | — |
| | — |
| | — |
| | (59,427 | ) |
| Tax benefit related to conversions of convertible debt | — |
| | — |
| | 11,409 |
| | — |
| | — |
| | — |
| | — |
| | 11,409 |
| — |
| | — |
| | 11,409 |
| | — |
| | — |
| | — |
| | — |
| | 11,409 |
|
| Reclassification of conversion option subject to cash settlement | — |
| | — |
| | 7,667 |
| | — |
| | — |
| | — |
| | — |
| | 7,667 |
| — |
| | — |
| | 7,667 |
| | — |
| | — |
| | — |
| | — |
| | 7,667 |
|
| Share-based compensation | — |
| | — |
| | 92,153 |
| | — |
| | — |
| | — |
| | — |
| | 92,153 |
| — |
| | — |
| | 92,153 |
| | — |
| | — |
| | — |
| | — |
| | 92,153 |
|
| Net incremental tax benefit related to stock options exercised | — |
| | — |
| | 43,122 |
| | — |
| | — |
| | — |
| | — |
| | 43,122 |
| |
| Net incremental tax benefit related to share-based compensation | | — |
| | — |
| | 43,122 |
| | — |
| | — |
| | — |
| | — |
| | 43,122 |
|
| Equity based contingent compensation | — |
| | — |
| | 3,457 |
| | — |
| | — |
| | — |
| | — |
| | 3,457 |
| — |
| | — |
| | 3,457 |
| | — |
| | — |
| | — |
| | — |
| | 3,457 |
|
| Issuance of treasury stock | — |
| | — |
| | 597 |
| | — |
| | — |
| | 229 |
| | 4,003 |
| | 4,600 |
| — |
| | — |
| | 597 |
| | — |
| | — |
| | 229 |
| | 4,003 |
| | 4,600 |
|
| Balance as of January 1, 2012 | 166,707 |
| | $ | 1,668 |
| | $ | 2,249,900 |
| | $ | 2,117 |
| | $ | (68,707 | ) | | (44,665 | ) | | $ | (1,109,763 | ) | | $ | 1,075,215 |
| 166,707 |
| | $ | 1,668 |
| | $ | 2,249,900 |
| | $ | 2,117 |
| | $ | (68,707 | ) | | (44,665 | ) | | $ | (1,109,763 | ) | | $ | 1,075,215 |
|
| Net income | | — |
| | — |
| | — |
| | — |
| | 151,254 |
| | — |
| | — |
| | 151,254 |
|
| Unrealized gain on available-for-sale securities, net of deferred tax | | — |
| | — |
| | — |
| | 6 |
| | — |
| | — |
| | — |
| | 6 |
|
| Issuance of common stock, net of repurchases | | 3,464 |
| | 35 |
| | 55,106 |
| | — |
| | — |
| | (1,875 | ) | | (83,306 | ) | | (28,165 | ) |
| Reclassification of conversion option subject to cash settlement | | — |
| | — |
| | 2,565 |
| | — |
| | — |
| | — |
| | — |
| | 2,565 |
|
| Share-based compensation | | — |
| | — |
| | 94,385 |
| | — |
| | — |
| | — |
| | — |
| | 94,385 |
|
| Net incremental tax benefit related to share-based compensation | | — |
| | — |
| | 17,015 |
| | — |
| | — |
| | — |
| | — |
| | 17,015 |
|
| Equity based contingent compensation | | — |
| | — |
| | 6,306 |
| | — |
| | — |
| | — |
| | — |
| | 6,306 |
|
| Issuance of treasury stock | | — |
| | — |
| | (5,446 | ) | | — |
| | — |
| | 312 |
| | 5,446 |
| | — |
|
| Balance as of December 30, 2012 | | 170,171 |
| | $ | 1,703 |
| | $ | 2,419,831 |
| | $ | 2,123 |
| | $ | 82,547 |
| | (46,228 | ) | | $ | (1,187,623 | ) | | $ | 1,318,581 |
|
See accompanying notes to consolidated financial statements
ILLUMINA, INC.
CONSOLIDATED STATEMENTS OF CASH FLOWS
| | ILLUMINA, INC. CONSOLIDATED STATEMENTS OF CASH FLOWS (In thousands) | | ILLUMINA, INC. CONSOLIDATED STATEMENTS OF CASH FLOWS (In thousands) |
| | Years Ended | | | | | | | |
| | January 1,
2012 | | January 2,
2011 | | January 3,
2010 | Years Ended |
| | (In thousands) | December 30,
2012 | | January 1,
2012 | | January 2,
2011 |
| Cash flows from operating activities: | |
| | |
| | |
| |
| | |
| | |
|
| Net income | $ | 86,628 |
| | $ | 124,891 |
| | $ | 72,281 |
| $ | 151,254 |
| | $ | 86,628 |
| | $ | 124,891 |
|
Adjustments to reconcile net income to net cash provided by operating activities: | | Depreciation expense | 55,575 |
| | 34,204 |
| | 24,504 |
| 48,249 |
| | 55,575 |
| | 34,204 |
|
| Amortization of acquired intangible assets | 12,689 |
| | 7,805 |
| | 6,680 |
| 15,541 |
| | 12,689 |
| | 7,805 |
|
| Share-based compensation expense | 92,092 |
| | 71,645 |
| | 60,811 |
| 94,324 |
| | 92,092 |
| | 71,645 |
|
| Accretion of debt discount | 32,173 |
| | 21,407 |
| | 20,286 |
| 35,004 |
| | 32,173 |
| | 21,407 |
|
| Loss on extinguishment of debt | 37,611 |
| | — |
| | — |
| |
| Cease-use loss | 23,638 |
| | — |
| | — |
| 22,367 |
| | 23,638 |
| | — |
|
| Contingent compensation expense | 3,457 |
| | — |
| | — |
| 6,306 |
| | 3,457 |
| | — |
|
| Incremental tax benefit related to stock options exercised | (46,354 | ) | | (42,445 | ) | | (39,319 | ) | |
| Incremental tax benefit related to share-based compensation | | (20,783 | ) | | (46,354 | ) | | (42,445 | ) |
| Deferred income taxes | 19,227 |
| | 48,696 |
| | 29,704 |
| (21,698 | ) | | 19,227 |
| | 48,696 |
|
| Change in fair value of contingent consideration | (4,500 | ) | | (10,376 | ) | | — |
| 1,975 |
| | (4,500 | ) | | (10,376 | ) |
| Impairment of cost-method investment | — |
| | 13,223 |
| | — |
| |
| Acquired in-process research and development | — |
| | 1,325 |
| | 11,325 |
| |
| Other non-cash adjustments | 8,872 |
| | 4,325 |
| | 1,721 |
| |
| Cost-method investment related (gain) loss, net | | (45,911 | ) | | — |
| | 10,309 |
|
| Recovery of previously impaired note receivable | | (6,000 | ) | | — |
| | — |
|
| Impairment of in-process research and development | | 21,438 |
| | — |
| | — |
|
| Loss on extinguishment of debt | | — |
| | 37,611 |
| | — |
|
| Other | | 7,780 |
| | 10,877 |
| | 8,811 |
|
| Changes in operating assets and liabilities: |
|
| |
|
| |
|
| | | | | |
| Accounts receivable | (7,011 | ) | | (7,844 | ) | | (18,578 | ) | (34,441 | ) | | (7,011 | ) | | (7,844 | ) |
| Inventory | 22,152 |
| | (48,583 | ) | | (20,557 | ) | (23,707 | ) | | 22,152 |
| | (48,583 | ) |
| Prepaid expenses and other current assets | (2,016 | ) | | 2,554 |
| | (3,429 | ) | (3,062 | ) | | (2,016 | ) | | 2,554 |
|
| Other assets | (4,004 | ) | | (3,566 | ) | | (2,670 | ) | (2,903 | ) | | (4,004 | ) | | (3,566 | ) |
| Accounts payable | (21,097 | ) | | 23,150 |
| | 11,778 |
| 15,112 |
| | (21,097 | ) | | 23,150 |
|
| Accrued liabilities | 42,955 |
| | 32,028 |
| | 19,997 |
| 24,388 |
| | 38,945 |
| | 32,028 |
|
| Other long-term liabilities | 8,058 |
| | (113 | ) | | 814 |
| 6,640 |
| | 8,058 |
| | (113 | ) |
| Unrealized gain (loss) on foreign exchange | (2,005 | ) | | 247 |
| | (3,157 | ) | |
| Net cash provided by operating activities | 358,140 |
| | 272,573 |
| | 172,191 |
| 291,873 |
| | 358,140 |
| | 272,573 |
|
| Cash flows from investing activities: | |
| | |
| | |
| |
| | |
| | |
|
| Purchases of available-for-sale securities | (1,310,269 | ) | | (846,208 | ) | | (694,487 | ) | (925,478 | ) | | (1,310,269 | ) | | (846,208 | ) |
| Sales of available-for-sale securities | 900,884 |
| | 539,161 |
| | 310,226 |
| 733,326 |
| | 900,884 |
| | 539,161 |
|
| Maturities of available-for-sale securities | 160,007 |
| | 149,450 |
| | 203,990 |
| 165,424 |
| | 160,007 |
| | 149,450 |
|
| Sales and maturities of trading securities | — |
| | 54,900 |
| | 1,000 |
| — |
| | — |
| | 54,900 |
|
| Net cash paid for acquisitions | (58,302 | ) | | (98,211 | ) | | (1,325 | ) | (83,156 | ) | | (58,302 | ) | | (98,211 | ) |
| Purchases of strategic investments | (13,769 | ) | | (27,677 | ) | | (19,900 | ) | (15,938 | ) | | (13,769 | ) | | (27,677 | ) |
| Purchases of property and equipment | (77,800 | ) | | (49,818 | ) | | (52,673 | ) | (68,781 | ) | | (77,800 | ) | | (49,818 | ) |
| Cash paid for intangible assets | (1,750 | ) | | (6,650 | ) | | (3,400 | ) | (12,228 | ) | | (1,750 | ) | | (6,650 | ) |
| Proceeds from sale of strategic investment | | 50,819 |
| | — |
| | — |
|
| Recovery of previously impaired note receivable | | 6,000 |
| | — |
| | — |
|
| Net cash used in investing activities | (400,999 | ) | | (285,053 | ) | | (256,569 | ) | (150,012 | ) | | (400,999 | ) | | (285,053 | ) |
| Cash flows from financing activities: | |
| | |
| | |
| |
| | |
| | |
|
| Payments on current portion of long-term debt | (349,874 | ) | | — |
| | (10,000 | ) | — |
| | (349,874 | ) | | — |
|
| Payments on acquisition related contingent consideration liability | | (3,374 | ) | | — |
| | — |
|
| Proceeds from issuance of convertible notes | 903,492 |
| | — |
| | — |
| — |
| | 903,492 |
| | — |
|
| Incremental tax benefit related to stock options exercised | 46,354 |
| | 42,445 |
| | 39,319 |
| |
| Incremental tax benefit related to share-based compensation | | 20,783 |
| | 46,354 |
| | 42,445 |
|
| Common stock repurchases | (570,406 | ) | | (44,016 | ) | | (175,136 | ) | (82,522 | ) | | (570,406 | ) | | (44,016 | ) |
| Proceeds from the exercise of warrants | 5,512 |
| | 16,029 |
| | 7,576 |
| — |
| | 5,512 |
| | 16,029 |
|
| Proceeds from issuance of common stock | 61,938 |
| | 102,016 |
| | 39,379 |
| 54,358 |
| | 61,938 |
| | 102,016 |
|
| Net cash provided by (used in) financing activities | 97,016 |
| | 116,474 |
| | (98,862 | ) | |
| Net cash (used in) provided by financing activities | | (10,755 | ) | | 97,016 |
| | 116,474 |
|
| Effect of exchange rate changes on cash and cash equivalents | (126 | ) | | 320 |
| | 849 |
| (103 | ) | | (126 | ) | | 320 |
|
| Net increase (decrease) in cash and cash equivalents | 54,031 |
| | 104,314 |
| | (182,391 | ) | |
| Net increase in cash and cash equivalents | | 131,003 |
| | 54,031 |
| | 104,314 |
|
| Cash and cash equivalents at beginning of year | 248,947 |
| | 144,633 |
| | 327,024 |
| 302,978 |
| | 248,947 |
| | 144,633 |
|
| Cash and cash equivalents at end of year | $ | 302,978 |
| | $ | 248,947 |
| | $ | 144,633 |
| $ | 433,981 |
| | $ | 302,978 |
| | $ | 248,947 |
|
| Supplemental disclosures of cash flow information: | |
| | |
| | |
| |
| Cash paid for interest | $ | 2,481 |
| | $ | 2,437 |
| | $ | 2,437 |
| |
| Cash paid for income taxes | $ | 9,806 |
| | $ | 31,566 |
| | $ | 10,361 |
| |
| | | | | | | |
| | | | | | | |
ILLUMINA, INC. CONSOLIDATED STATEMENTS OF CASH FLOWS — (Continued) (In thousands) |
| | | | | | | | | | | |
| | Years Ended |
| | December 30,
2012 | | January 1,
2012 | | January 2,
2011 |
| Supplemental cash flow information: | |
| | |
| | |
|
| Cash paid for interest | $ | 2,551 |
| | $ | 2,481 |
| | $ | 2,437 |
|
| Cash paid for income taxes | $ | 74,037 |
| | $ | 9,806 |
| | $ | 31,566 |
|
| Unsettled short-term investments purchase | $ | 9,154 |
| | $ | — |
| | $ | — |
|
See accompanying notes to consolidated financial statements
ILLUMINA, INC.
NOTES TO CONSOLIDATED FINANCIAL STATEMENTS
Unless the context requires otherwise, references in this report to “Illumina,” “we,” “us,” the “Company,” and “our” refer to Illumina, Inc. and its consolidated subsidiaries.
| |
| 1. | Organization and Summary of Significant Accounting Policies |
Organization and Business
Illumina, Inc. (the Company) is a leading developer, manufacturer, and marketer of life science tools and integrated systems for the analysis of genetic variation and biological function. Using the Company’sits proprietary technologies, Illumina provides a comprehensive line of genetic analysis solutions, with products and services that serveaddress a broad range of highly interconnected markets, including sequencing, genotyping, gene expression, and moleculargenomic-based diagnostics. The Company’s customers include leading genomic research centers, academic institutions, government laboratories, and clinical research organizations, as well as pharmaceutical, biotechnology, agrigenomics, and consumer genomics companies.companies, and in vitro fertilization clinics.
Basis of Presentation
The consolidated financial statements of the Company have been prepared in conformity with U.S. generally accepted accounting principles and include the accounts of the Company and its wholly-owned subsidiaries. All intercompany transactions and balances have been eliminated in consolidation.
Fiscal Year
The Company'sCompany’s fiscal year is 52 or 53 weeks ending the Sunday closest to December 31, with quarters of 13 or 14 weeks ending the Sunday closest to March 31, June 30, September 30, and December 31. The years ended January 1,December 30, 2012, January 2, 20111, 2012, and January 3, 20102, 2011 were 52, 52 and 53 weeks, respectively.
Use of Estimates
The preparation of financial statements requires that management make estimates and assumptions that affect the reported amounts of assets, liabilities, revenue, expenses, and related disclosuredisclosures of contingent assets and liabilities. Actual results could differ from those estimates.
Reclassifications
Certain prior period amounts have been reclassified to conform to the current period presentation.
Segment Information
The Company is organized in two operating segments for purposes of recording and reporting our financial results: Life Sciences and Diagnostics. The Life Sciences operating segment includes all products and services related to the research market, namely the product lines based on the Company’s sequencing, BeadArray, VeraCode, and real-time polymerase chain reaction (PCR) technologies. The Diagnostics operating segment focuses on the emerging opportunity in molecular diagnostics.clinical and personalized application of our products and services for such uses as diagnosing disease, identifying genetic abnormalities, and identifying effective treatment therapies, with an initial emphasis on reproductive health and cancer. During all periods presented, the Diagnostics operating segment had limited activity.been immaterial to the financial statements as a whole. Accordingly, the Company’s operating results for both segments are reported on an aggregate basis as one reportable segment. The Company will begin reporting in two reportable segments once revenues,revenue, operating profit or loss, or assetsasset of the Diagnostics operating segment exceeds 10% of the consolidated amounts.
Acquisitions
The Company measures all assets acquired and liabilities assumed, including contingent considerations and all contractual contingencies, at fair value as of the acquisition date. Contingent purchase considerations settled in cash are remeasured to estimated fair value at each reporting period with the change in fair value recorded in acquisition related expense (gain), net, a component of operating expenses. In addition, the Company capitalizes in-process research and development (IPR&D) and either amortizes it over the life of the product upon commercialization, or writes it off if the project is abandoned
ILLUMINA, INC.
NOTES TO CONSOLIDATED FINANCIAL STATEMENTS — (Continued)
or impaired. Post-acquisition adjustments related to business combination deferred tax asset valuation allowances and liabilities for uncertain tax positions are recorded in current period income tax expense. Contingent purchase considerations are remeasured to estimated fair value at each reporting period with the change in fair value recorded in acquisition related (gain) expense, net, a component of operating expenses.
Cash Equivalents and Short-Term Investments
Cash equivalents are comprised of short-term, highly liquid investments with maturities of 90 days or less at the date of purchase.
ILLUMINA, INC.
NOTES TO CONSOLIDATED FINANCIAL STATEMENTS — (Continued)
purchase.
Short-term investments consist of U.S. Treasury,treasury securities, debt securities in U.S. government agency securities,government-sponsored entities, and corporate debt securities. Management classifies short-term investments as available-for-sale at the time of purchase and reevaluatesevaluates such classification as of each balance sheet date. All short-term investments are recorded at estimated fair value. Unrealized gains and losses for available-for-sale securities are included in accumulated other comprehensive income, a component of stockholders’ equity. The Company evaluates its investments to assess whether those with unrealized loss positions are other than temporarily impaired. Impairments are considered to be other than temporary if they are related to deterioration in credit risk or if it is likely that the Company will sell the securities before the recovery of their cost basis. Realized gains and losses and declines in value judged to be other than temporary are determined based on the specific identification method and are reported in other (expense) income, net in the consolidated statements of income.
Fair Value Measurements
The Company determines the fair value of its assets and liabilities based on the exchange price that would be received for an asset or paid to transfer a liability (an exit price) in the principal or most advantageous market for the asset or liability in an orderly transaction between market participants on the measurement date. Valuation techniques used to measure fair value maximize the use of observable inputs and minimize the use of unobservable inputs. The Company uses a fair value hierarchy with three levels of inputs, of which the first two are considered observable and the last unobservable, to measure fair value:
Level 1 — Quoted prices in active markets for identical assets or liabilities.
Level 2 — Inputs, other than Level 1, that are observable, either directly or indirectly, such as quoted prices for similar assets or liabilities; quoted prices in markets that are not active; or other inputs that are observable or can be corroborated by observable market data for substantially the full term of the assets or liabilities.
Level 3 — Unobservable inputs that are supported by little or no market activity and that are significant to the fair value of the assets or liabilities.
The carrying amounts of financial instruments such as cash and cash equivalents, accounts receivable, prepaid expenses and other current assets, accounts payable, and accrued liabilities, excluding acquisition related contingent consideration liabilities, approximate the related fair values due to the short-term maturities of these instruments.
Accounts Receivable
Trade accounts receivable are recorded at the net invoice value and are not interest bearing. The Company considers receivables past due based on the contractual payment terms. The Company reviews its exposure to accounts receivable and reserves specific amountsreceivables if collectibility is no longer reasonably assured. The Company also reserves a percentage of its trade receivable balance based on collection history and current economic trends that might impact the level of future credit losses. The Company re-evaluates such reserves on a regular basis and adjusts its reserves as needed.
Concentrations of Risk
The Company operates in markets that are highly competitive and rapidly changing. Significant technological changes, shifting customer needs, the emergence of competitive products or services with new capabilities, and other factors could negatively impact the Company’s operating results. A significant portion of the Company'sCompany’s customers consist of university and research institutions that management believes are, to some degree, directly or indirectly supported by the United States Government. A significant change in current research funding, particularly with respect to the National Institutes of Health, could have a material adverse impact on the Company’s future revenues and results of operations.
The Company is also subject to risks related to its financial instruments including its cash and cash equivalents, investments, and accounts receivable. Most of the Company’s cash and cash equivalents as of January 1,December 30, 2012 were deposited with U.S. financial institutions, in the United States.either domestically or with their foreign branches. The Company’s investment policy
ILLUMINA, INC.
NOTES TO CONSOLIDATED FINANCIAL STATEMENTS — (Continued)
restricts the amount of credit exposure to any one issuer to 5% of the portfolio at the time of purchase and to any one industry sector, as defined by Bloomberg classifications, to 25% of the portfolio at the time of purchase. There is no limit to the percentage of the portfolio that may be maintained in U.S. treasury obligations,securities, debt securities in U.S. government agency securities,government-sponsored entities, and money market funds.
The Company’s products require customized components that currently are available from a limited number of sources. The Company obtains certain key components included in its products from single vendors.
ILLUMINA, INC.
NOTES TO CONSOLIDATED FINANCIAL STATEMENTS — (Continued)
The Company performs a regular review of customer activity and associated credit risks and dodoes not require collateral or enter into netting arrangements. Shipments to customers outside the United States comprised 50%51%, 45%50%, and 48%45% of the Company'sCompany’s revenue for the years ended January 1,December 30, 2012, January 2, 20111, 2012, and January 3, 20102, 2011, respectively. Customers outside the United States represented 52%54% and 59%52% of the Company'sCompany’s gross trade accounts receivable balance as of January 1,December 30, 2012 and January 2, 20111, 2012, respectively. Sales to territories outside of the United States may be denominated in U.S. dollars or in the local currency.
International sales entail a variety of risks, including currency exchange fluctuations, longer payment cycles, and greater difficulty in accounts receivable collection. The Company is also subject to general geopolitical risks, such as political, social and economic instability, and changes in diplomatic and trade relations. The risks of international sales are mitigated in part by the extent to which sales are geographically distributed. The Company has historically not experienced significant credit losses from investments and accounts receivable. Approximately 20%18% of the Company'sCompany’s revenue is derived from European countries other than the United Kingdom. As the credit and economic conditions in certain southern European countries continue to deteriorate, the Company regularly reviews its accounts receivable outstanding in these countries and assesses the allowance for doubtful accounts accordingly. As of January 1,December 30, 2012 non-current, outstanding accounts receivables beyond standard payment terms from these countries accounted for approximately 3%5% of the Company'sCompany’s accounts receivable balance, and the Company has not experienced significant difficulties in collecting on the accounts receivable outstanding in these countries.
Inventory
Inventory is stated at the lower of cost (on a first in, first out basis) or market. Inventory includes raw materials and finished goods that may be used in the research and development process and such items are expensed as consumed or expired. Provisions for slow moving, excess, and obsolete inventories are estimated based on product life cycles, quality issues, historical experience, and usage forecasts.
Property and Equipment
Property and equipment are stated at cost, subject to review of impairment, and depreciated over the estimated useful lives of the assets (generally three to seven years years)) using the straight-line method. Amortization of leasehold improvements is computedrecorded over the shorter of the lease term or the estimated useful life of the related assets. Maintenance and repairs are charged to operations as incurred. When assets are sold, or otherwise disposed of, the cost and related accumulated depreciation are removed from the accounts and any gain or loss is included in operating expense.
Goodwill, Intangible Assets and Other Long-Lived Assets
Goodwill, which has an indefinite useful life, represents the excess of cost over fair value of net assets acquired. The change in the carrying value of goodwill during the year ended January 1,December 30, 2012 was due to goodwill recorded in connection with the Company's acquisition of Epicentre Technologies Corporation (Epicentre) in January 2011.
The Company's identifiable intangible assets are comprised primarily of IPR&D, licensed technology, acquired core technologies, customer relationships, trade names, and license agreements. Except IPR&D, the cost of all identifiable intangible assetsBlueGnome acquisition. Goodwill is amortized on a straight-line basis over their respective useful lives. The Company regularly performs reviews to determine if the carrying values of its long-lived assets are impaired. A review of intangible assets that have finite useful lives and other long-lived assets is performed when an event occurs indicating the potential for impairment. If indicators of impairment exist, the Company assesses the recoverability of the affected long-lived assets by determining whether the carrying amount of such assets exceeds the undiscounted expected future cash flows associated with such assets. If impairment is indicated, the Company compares the carrying amount to the estimated fair value of the affected assets and adjusts the value of such assets accordingly. Factors that would indicate potential impairment include a significant decline in the Company's stock price and market capitalization compared to its net book value, significant changes in the ability of a particular asset to generate positive cash flows, and significant changes in the Company's strategic business objectives and utilization of a particular asset. The Company performed quarterly reviews of its long-lived assets and noted no indications of impairment for the year ended January 1, 2012.
Goodwill and IPR&D, which have indefinite useful lives, are reviewed for impairment at least annually during the second fiscal quarter, or more frequently if an event occurs indicating the potential for impairment. During its goodwill impairment review, the Company may assess qualitative factors to determine whether it is more likely than not that the fair value of its single reporting unit is less than its carrying amount, including goodwill. The qualitative factors include, but are not limited to, macroeconomic conditions, industry and market considerations, and the overall financial performance of the Company. If, after assessing the totality of these qualitative factors, the Company determines that it is not more likely than not that the fair value of its reporting unit is less than its carrying amount, then no more assessment is deemed necessary. Otherwise, the Company proceeds to perform the two-step test for goodwill impairment test is a two-step process.impairment. The first step of the impairment test involves comparing the estimated fair value of the
ILLUMINA, INC.
NOTES TO CONSOLIDATED FINANCIAL STATEMENTS — (Continued)
reporting unit with its carrying value, including goodwill. If the carrying amount of the reporting unit exceeds its fair value, the Company performs the second step of the goodwill impairment test to determine the amount of loss, which involves comparing the implied fair value of the goodwill withto the carrying value of the goodwill. The Company may also elect to bypass the qualitative assessment in a period and elect to proceed to perform the first step of the goodwill impairment test. The Company performed its annual assessment for goodwill impairment test of goodwill in the second fiscal quarter of 2011,2012, noting no impairment. In its
ILLUMINA, INC.
NOTES TO CONSOLIDATED FINANCIAL STATEMENTS — (Continued)
The Company’s identifiable intangible assets are typically comprised of acquired core technologies, licensed technologies, IPR&D, customer relationships, and trade names. The cost of all identifiable intangible assets with finite lives is amortized on a straight-line basis over the assets’ respective estimated useful lives.
IPR&D, which also has an indefinite useful life, is reviewed for impairment test,at least annually, or more frequently if an event occurs indicating the Company concluded that it has a single reporting unit and that its fair value exceeded its book value, using market capitalization as a referencepotential for the Company's fair value. Therefore, the first step recoverability test was passed and the second step analysis was not required.
impairment. The IPR&D impairment test requires the Company to assess the fair value of the asset as compared to its carrying value and record an impairment charge if the carrying value exceeds the fair value, record an impairment charge.value. The Company performed its annual impairment test of its IPR&D in the second fiscal quarter of 2012 and recorded 2011, noting no$21.4 million impairment. In addition, in connection of our restructuring plan executedimpairment charges within research and development expenses in the fourth quarterconsolidated statements of 2011,income. Resources previously assigned to the research project were re-directed with no plans for additional investments to be made to the project in the foreseeable future.
The Company regularly performs reviews to determine if any event has occurred that may indicate its intangible assets with finite useful lives and other long-lived assets are potentially impaired. If indicators of impairment exist, the Company identified certain impairment indicators related to its IPR&D asset, and performed anotherperforms an impairment test asto assess the recoverability of January 1, 2012, noting no impairment. In its impairment test,the affected assets by determining whether the carrying amount of such assets exceeds the undiscounted expected future cash flows. If the affected assets are not recoverable, the Company assessedestimates the fair value of IPR&D usingthe assets and records an income approach, taking into consideration various factors such as future revenue contributions, additional researchimpairment loss if the carrying value of the assets exceeds the fair value. Factors that would indicate potential impairment include a significant decline in the Company’s stock price and development costsmarket capitalization compared to be incurred, and contributoryits net book value, significant changes in the ability of a particular asset charges. The rate used to discount net futuregenerate positive cash flows, to their present values was based onand significant changes in the Company’s strategic business objectives and utilization of a risk-adjusted rateparticular asset. The Company performed quarterly reviews of return.its intangible assets with finite useful lives and other long-lived assets and noted no indications of impairment for the year ended December 30, 2012.
Reserve for Product Warranties
The Company generally provides a one-yearone-year warranty on instruments. Additionally, the Company provides a warranty on its consumables through the expiration date, which generally ranges from six to twelve months after the manufacture date. TheAt the time revenue is recognized, the Company establishes an accrual for estimated warranty expenses based on historical experience as well as anticipated product performance. The Company periodically reviews the adequacy of its warranty reserve and adjusts, if necessary, the warranty percentage and accrual based on actual experience and estimated costs to be incurred. Warranty expense is recorded as a component of cost of product revenue. Warranty expenses associated with extended maintenance contracts for systems are recorded as cost of service and other revenue as incurred.
Revenue Recognition
The Company’s revenue is generated primarily from the sale of products and services. Product revenue primarily consists of sales of instrumentation and consumables used in genetic analysis. Service and other revenue primarily consists of revenue received for performing genotyping and sequencing services, instrument service contract sales, and amounts earned under research agreements with government grants, which are recognized in the period during which the related costs are incurred.
The Company recognizes revenue when persuasive evidence of an arrangement exists, delivery has occurred or services have been rendered, the seller’s price to the buyer is fixed or determinable, and collectibility is reasonably assured. In instances where final acceptance of the product or system is required, revenue is deferred until all the acceptance criteria have been met. All revenue is recorded net of any discounts.
Revenue forfrom product sales is recognized generally upon transfer of title to the customer, provided that no significant obligations remain and collection of the receivable is reasonably assured. Revenue forfrom instrument service contracts is recognized as the services are rendered, typically evenly over the contract term. Revenue from genotyping and sequencing services is recognized when earned, which is generally at the time the genotyping or sequencing analysis data is made available to the customer or agreed upon milestones are reached.
In order to assess whether the price is fixed or determinable, the Company evaluates whether refund rights exist. If there are refund rights or payment terms based on future performance, the Company defers revenue recognition until the price becomes fixed or determinable. The Company assesses collectibility based on a number of factors, including past transaction history with the customer and the creditworthiness of the customer. If the Company determines that collection of a payment is not reasonably assured, revenue recognition is deferred until receipt of payment.
ILLUMINA, INC.
NOTES TO CONSOLIDATED FINANCIAL STATEMENTS — (Continued)
The Company regularly enters into contracts where revenue is derived from multiple deliverables including any mix of products or services. These products or services are generally delivered within a short time frame, approximately three to six months months, of, after the contract execution date. Revenue recognition for contracts with multiple deliverables is based on the individual units of accounting determined to exist in the contract. A delivered item is considered a separate unit of accounting when the delivered item has value to the customer on a stand-alone basis. Items are considered to have stand-alone value when they are sold separately by any vendor or when the customer could resell the item on a stand-alone basis. Consideration is allocated at the inception of the contract to all deliverables based on their relative selling price. The relative selling price for each deliverable is determined using vendor specific objective evidence (VSOE) of selling price or third-party evidence of selling price if VSOE does not exist. If neither VSOE nor third-party evidence exists, the Company uses its best estimate of the selling
ILLUMINA, INC.
NOTES TO CONSOLIDATED FINANCIAL STATEMENTS — (Continued)
price for the deliverable.
In order to establish VSOE of selling price, the Company must regularly sell the product or service on a standalone basis with a substantial majority priced within a relatively narrow range. VSOE of selling price is usually the midpoint of that range. If there are not a sufficient number of standalone sales and VSOE of selling price cannot be determined, then the Company considers whether third party evidence can be used to establish selling price. Due to the lack of similar products and services sold by other companies within the industry, the Company has rarely established selling price using third-party evidence. If neither VSOE nor third party evidence of selling price exists, the Company determines its best estimate of selling price using average selling prices over a rolling 12-month period coupled with an assessment of current market conditions. If the product or service has no history of sales or if the sales volume is not sufficient, the Company relies upon prices set by the Company’s pricing committee adjusted for applicable discounts. The Company recognizes revenue for delivered elements only when it determines there are no uncertainties regarding customer acceptance.
InDuring the first quarter of 2010,fiscal year ended January 1, 2012, the Company offered an incentive with the launch of the HiSeq 2000completed its Genome Analyzer trade-in program that enabled existingcertain Genome Analyzer customers to trade in their Genome Analyzer and receive a discount on the purchase of a HiSeq 2000. The incentive was limited to customers who had purchased a Genome Analyzer asprior to the beginning of the date of the announcementincentive program in early 2010 and was the firstonly significant trade-in program offered by the Company. The Genome Analyzer trade-in program was completed in 2011.Company to date. The Company accounted for HiSeq 2000 discounts related to the Genome Analyzer trade-in program as reductions to revenue upon recognition of the HiSeq 2000 sales revenue, which is later than the date the trade-in program was launched.
In certain markets, within Europe, the Asia-Pacific region, Latin America, the Middle East, and South Africa the Company sells products and provides services to customers through distributors that specialize in life science products. In most sales through distributors, the product is delivered directly to customers. In cases where the product is delivered to a distributor, revenue recognition is deferred until acceptance is received from the distributor, and/or the end-user, if required by the applicable sales contract. The terms of sales transactions through distributors are consistent with the terms of direct sales to customers. These transactions are accounted for in accordance with the Company'sCompany’s revenue recognition policy described herein.
Shipping and Handling Expenses
Shipping and handling expenses are included in cost of product revenue.
Research and Development
Research and development expenses consist of costs incurred for internal and grant-sponsored research and development. Research and development expenses include personnel expenses, contractor fees, license fees, facilities costs, and utilities. Expenditures relating to research and development are expensed in the period incurred.
Advertising Costs
The Company expenses advertising costs as incurred. Advertising costs were $6.87.3 million, $6.96.8 million, and $4.26.9 million for the years ended January 1,December 30, 2012, January 2, 20111, 2012, and January 3, 20102, 2011, respectively.
Leases
Leases are reviewed and classified as capital or operating at their inception. For leases that contain rent escalations, the Company records rent expense on a straight-line basis over the term of the lease, which includes the construction build-out period and lease extension periods, if appropriate. The difference between rent payments and straight-line rent expense is recorded as deferred rent in accrued liabilities and other long-term liabilities. Landlord allowances are amortized on a straight-linestraight-
ILLUMINA, INC.
NOTES TO CONSOLIDATED FINANCIAL STATEMENTS — (Continued)
line basis over the lease term as a reduction to rent expense. The Company capitalizes leasehold improvements and amortizes them over the shorter of the lease term or their expected useful lives.
During the year endedIn January 1, 2012, the Company substantially movedcompleted the relocation of its headquarters to another facility in San Diego, California,California. Headquarter relocation expenses recorded in years ended December 30, 2012 and recorded headquarter relocation expense of $41.8 million, whichJanuary 1, 2012 primarily consisted of accelerated depreciation expense, impairment of assets, additional rent expense during the transition period when both the new and former headquarter facilities are occupied, moving expenses, and a cease-use loss.losses. The Company recorded accelerated depreciation expense for leasehold improvements at its former headquarter facility based on the reassessed useful lives of less than a year. The Company recorded the cease-use losslosses and athe corresponding facility exit obligation upon vacating certain buildings of its
ILLUMINA, INC.
NOTES TO CONSOLIDATED FINANCIAL STATEMENTS — (Continued)
former headquarters, calculated as the present value of the remaining lease obligation offset by estimated sublease rental receipts during the remaining lease period, adjusted for deferred items and estimated lease incentives. The key assumptions used in the calculation include the amount and timing of estimated sublease rental receipts, and the risk-adjusted discount rate. Over the course of the remaining lease term of the former facility, the Company will record additional headquarter relocation expenses due to additional cease-use loss to be recorded upon exit of additional buildings, the accretion on the facility exit obligation and adjustments that may arise from change in estimates for the sublease rental receipts.
Restructuring Charges
During the fourth quarter of the year ended January 1, 2012, the Company announced and executed a restructuring plan, to reduce the Company'sCompany’s workforce and to consolidate certain facilities. The Company measured and accrued the liabilities associated with employee separation costs at fair value as of the date the plan was announced and terminations arewere communicated to employees, which primarily included severance pay and other separation costs such as outplacement services and benefits. The Company will measure and accrue the facilities exit costs at fair value upon its exit. Facilities exit costs will primarily consist of cease-use losses to be recorded upon vacating the facilities, asset impairment, and accelerated depreciation expenses.
The fair value measurement of restructuring related liabilities requires certain assumptions and estimates to be made by the Company, such as the retention period of certain employees, the timing and amount of sublease income on properties to be vacated, and the operating costs to be paid until lease termination. It is the Company'sCompany’s policy to use the best estimates based on facts and circumstances available at the time of measurement, review the assumptions and estimates periodically, and adjust the liabilities when necessary.
Income Taxes
The provision for income taxes is computed using the asset and liability method, under which deferred tax assets and liabilities are recognized for the expected future tax consequences of temporary differences between the financial reporting and tax bases of assets and liabilities, and for the expected future tax benefit to be derived from tax loss and credit carryforwards. Deferred tax assets and liabilities are determined using the enacted tax rates in effect for the years in which those tax assets are expected to be realized. The effect of a change in tax rates on deferred tax assets and liabilities is recognized in the provision for income taxes in the period that includes the enactment date.
Deferred tax assets are regularly assessed to determine the likelihood they will be recovered from future taxable income. A valuation allowance is established when the Company believes it is more likely than not the future realization of all or some of a deferred tax asset will not be achieved. In evaluating the ability to recover deferred tax assets within the jurisdiction which they arise the Company considers all available positive and negative evidence. Factors reviewed include the cumulative pre-tax book income for the past three years, scheduled reversals of deferred tax liabilities, history of earnings and reliable forecasting, projections of pre-tax book income over the foreseeable future, and the impact of any feasible and prudent tax planning strategies.
The Company recognizes excess tax benefits associated with share-based compensation to stockholders’ equity only when realized. When assessing whether excess tax benefits relating to share-based compensation have been realized, the Company follows the with-and-without approach excluding any indirect effects of the excess tax deductions. Under this approach, excess tax benefits related to share-based compensation are not deemed to be realized until after the utilization of all other tax benefits available to the Company.
The Company recognizes the impact of a tax position in the financial statements only if that position is more likely than not of being sustained upon examination by taxing authorities, based on the technical merits of the position. Any interest and penalties related to uncertain tax positions will be reflected in income tax expense.
ILLUMINA, INC.
NOTES TO CONSOLIDATED FINANCIAL STATEMENTS — (Continued)
Functional Currency
The U.S. dollar has been determined to beis the functional currency of the Company'sCompany’s international operations. The Company remeasures its foreign subsidiaries’ assets and liabilities and revenue and expense accounts related to monetary assets and liabilities to the U.S. dollar and records the net gains or losses resulting from remeasurement in other (expense) income, net in the consolidated statements of income. The remeasurement resulted in an immaterial loss inDuring the yearyears endedDecember 30, 2012 and January 1, 2012, anthe Company recorded $2.2 million net gain and $2.0 million net loss from remeasurement, respectively. Gains and losses related to remeasurement were immaterial gain infor the year ended January 2, 2011, and a loss of .$2.3 million for the year ended January 3, 2010,
ILLUMINA, INC.
NOTES TO CONSOLIDATED FINANCIAL STATEMENTS — (Continued)
respectively.
Derivatives
The Company is exposed to foreign exchange rate risks in the normal course of business. To manage a portion of the accounting exposure resulting from changes in foreign currency exchange rates, the Company enters into foreign exchange contracts to hedge monetary assets and liabilities that are denominated in currencies other than the U.S. dollar. These foreign exchange contracts are carried at fair value and are not designated as hedging instruments. Changes in the value of the derivativederivatives are recognized in other (expense) income, net, in the consolidated statements of income forin the current period,respective periods, along with an offsetting remeasurement gain or loss on the underlying foreign currency denominated assets or liabilities.
As of January 1,December 30, 2012, the Company had foreign exchange forward contracts in place to hedge exposures in the euro, Japanese yen, and Australian dollar. As of December 30, 2012 and January 1, 2012 and January 2, 2011,, the total notional amount of outstanding forward contracts in place for foreign currency purchases was $25.551.2 million and $20.025.5 million, respectively. Gains and losses related to the non-designatedNon-designated foreign exchange forward contractscontract related gain was $1.2 million for the year ended December 30, 2012 and immaterial for the years ended January 1, 2012, and January 2, 2011, and January 3, 2010 were immaterial..
Share-Based Compensation
The Company uses the Black-Scholes-Merton option-pricing model to estimate the fair value of stock options granted and stock purchases under the Employee Stock Purchase Plan (ESPP). This model incorporates various assumptions including expected volatility, expected term of an award, expected dividends, and the risk-free interest rates. The Company determines the expected volatility by equally weighing the historical and implied volatility of the Company’s common stock. The historical volatility of the Company’s common stock over the most recent period is generally commensurate with the estimated expected term of the Company’s stock awards, adjusted for the impact of unusual fluctuations not reasonably expected to recur and other relevant factors. The implied volatility is calculated from the implied market volatility of exchange-traded call options on the Company’s common stock. The expected term of an award is based on historical forfeiture experience, exercise activity, and on the terms and conditions of the stock awards. The expected dividend yield is determined to be 0% given that the Company has never declared or paid cash dividends on its common stock and does not anticipate paying such cash dividends. The risk-free interest rate is based upon U.S. Treasury securities with remaining terms similar to the expected term of the share-based awards. The fair value of restricted stock units granted is based on the market price of ourthe Company’s common stock on the date of grant. The Company recognizes the fair value of share-based compensation on a straight-line basis over the requisite service periods of the awards.
Net Income per Share
Basic net income per share is computed by dividing net income by the weighted average number of common shares outstanding during the reporting period. Diluted net income per share is computed by dividing net income by the weighted average number of common shares outstanding during the reporting period increased to include dilutive potential common shares calculated using the treasury stock method. Diluted net income per share reflects the potential dilution from outstanding stock options, restricted stock units, ESPP, warrants, shares subject to forfeiture, and convertible senior notes. Under the treasury stock method, convertible senior notes will have a dilutive impact when the average market price of the Company'sCompany’s common stock is above the applicable conversion price of the respective notes. In addition, the following amounts are assumed to be used to repurchase shares: the amount that must be paid to exercise stock options and warrants and purchase shares under the ESPP; the average amount of compensation expense for future services that the Company has not yet recognized for stock options, restricted stock units, ESPP, and shares subject to forfeiture; and the amount of tax benefits that will be recorded in additional paid-in capital when the expenses related to respective awards become deductible.
ILLUMINA, INC.
NOTES TO CONSOLIDATED FINANCIAL STATEMENTS — (Continued)
The following table presents the calculation of weighted average shares used to calculate basic and diluted net income per share (in thousands):
ILLUMINA, INC.
NOTES TO CONSOLIDATED FINANCIAL STATEMENTS — (Continued)
|
| | | | | | | | |
| | Years Ended |
| | January 1,
2012 | | January 2,
2011 | | January 3,
2010 |
| Weighted average shares outstanding | 123,399 |
| | 123,581 |
| | 123,154 |
|
| Effect of dilutive Convertible Senior Notes | 3,783 |
| | 9,058 |
| | 6,497 |
|
| Effect of dilutive equity awards | 4,703 |
| | 4,674 |
| | 4,335 |
|
| Effect of dilutive warrants sold in connection with the Convertible Senior Notes | 7,052 |
| | 5,317 |
| | 1,566 |
|
| Effect of dilutive warrants assumed in a prior acquisition | — |
| | 803 |
| | 1,544 |
|
| Weighted-average shares used in calculating diluted net income per share | 138,937 |
| | 143,433 |
| | 137,096 |
|
| Weighted average shares excluded from calculation due to anti-dilutive effect | 2,418 |
| | 1,934 |
| | 924 |
|
|
| | | | | | | | |
| | Years Ended |
| | December 30,
2012 | | January 1,
2012 | | January 2,
2011 |
| Weighted average shares outstanding | 122,999 |
| | 123,399 |
| | 123,581 |
|
| Effect of dilutive potential common shares from: | | | | | |
| Convertible senior notes | 967 |
| | 3,783 |
| | 9,058 |
|
| Equity awards | 3,906 |
| | 4,703 |
| | 4,674 |
|
| Warrants sold in connection with convertible senior notes | 5,821 |
| | 7,052 |
| | 5,317 |
|
| Warrants assumed in a prior acquisition | — |
| | — |
| | 803 |
|
| Weighted average shares used in calculating diluted net income per share | 133,693 |
| | 138,937 |
| | 143,433 |
|
| Potentially dilutive shares excluded from calculation due to anti-dilutive effect | 2,556 |
| | 2,418 |
| | 1,934 |
|
Accumulated Other Comprehensive Income
Comprehensive income is comprised of net income and other comprehensive income. The Company has disclosed comprehensive income as a component of stockholders' equity. Accumulated other comprehensive income on the consolidated balance sheets at January 1,December 30, 2012 and January 2, 20111, 2012 includes accumulated foreign currency translation adjustments and unrealized gains and losses on the Company'sCompany’s available-for-sale securities.
The components of accumulated other comprehensive income are as follows (in thousands):
| | | | January 1,
2012 | | January 2,
2011 | December 30,
2012 | | January 1,
2012 |
| Foreign currency translation adjustments | $ | 1,289 |
| | $ | 1,338 |
| $ | 1,289 |
| | $ | 1,289 |
|
| Unrealized gain on available-for-sale securities, net of deferred tax | 828 |
| | 427 |
| 834 |
| | 828 |
|
| Total accumulated other comprehensive income | $ | 2,117 |
| | $ | 1,765 |
| $ | 2,123 |
| | $ | 2,117 |
|
| |
| 2. | Balance Sheet Account Details |
Investments
The following is a summary of short-term investments (in thousands):
| | | | January 1, 2012 | | January 2, 2011 | December 30, 2012 | | January 1, 2012 |
| | Amortized Cost | | Gross Unrealized Gains | | Gross Unrealized Losses | | Estimated Fair Value | | Amortized Cost | | Gross Unrealized Gains | | Gross Unrealized Losses | | Estimated Fair Value | Amortized Cost | | Gross Unrealized Gains | | Gross Unrealized Losses | | Estimated Fair Value | | Amortized Cost | | Gross Unrealized Gains | | Gross Unrealized Losses | | Estimated Fair Value |
Available-for-sale securities: | | Debt securities in government sponsored entities | $ | 393,759 |
| | $ | 428 |
| | $ | (148 | ) | | $ | 394,039 |
| | $ | 261,890 |
| | $ | 106 |
| | $ | (299 | ) | | $ | 261,697 |
| |
| Debt securities in government-sponsored entities | | $ | 314,638 |
| | $ | 251 |
| | $ | (16 | ) | | $ | 314,873 |
| | $ | 393,759 |
| | $ | 428 |
| | $ | (148 | ) | | $ | 394,039 |
|
| Corporate debt securities | 432,550 |
| | 1,293 |
| | (461 | ) | | 433,382 |
| | 329,823 |
| | 1,170 |
| | (235 | ) | | 330,758 |
| 471,989 |
| | 1,059 |
| | (187 | ) | | 472,861 |
| | 432,550 |
| | 1,293 |
| | (461 | ) | | 433,382 |
|
| U.S. treasury securities | 58,955 |
| | 214 |
| | — |
| | 59,169 |
| | 52,938 |
| | 70 |
| | (121 | ) | | 52,887 |
| 128,256 |
| | 233 |
| | — |
| | 128,489 |
| | 58,955 |
| | 214 |
| | — |
| | 59,169 |
|
| Total available-for-sale securities | $ | 885,264 |
| | $ | 1,935 |
| | $ | (609 | ) | | $ | 886,590 |
| | $ | 644,651 |
| | $ | 1,346 |
| | $ | (655 | ) | | $ | 645,342 |
| $ | 914,883 |
| | $ | 1,543 |
| | $ | (203 | ) | | $ | 916,223 |
| | $ | 885,264 |
| | $ | 1,935 |
| | $ | (609 | ) | | $ | 886,590 |
|
ILLUMINA, INC.
NOTES TO CONSOLIDATED FINANCIAL STATEMENTS — (Continued)
Available-For-Sale Securities
As of January 1,December 30, 2012 the Company had 10759 available-for-sale securities in a gross unrealized loss position, all of which had been in such position for less than twelve months.months. There were no impairments considered other-than-temporary as it is more likely than not the Company will hold the securities until maturity or a recovery of the cost basis. The following table shows the fair values and the gross unrealized losses of the Company'sCompany’s available-for- sale securities that were in an unrealized loss position as of January 1,December 30, 2012 and January 2, 20111, 2012 aggregated by investment category (in thousands):
ILLUMINA, INC.
NOTES TO CONSOLIDATED FINANCIAL STATEMENTS — (Continued)
| | | | January 1, 2012 | | January 2, 2011 | December 30, 2012 | | January 1, 2012 |
| | Fair Value | | Gross Unrealized Losses | | Fair Value | | Gross Unrealized Losses | Fair Value | | Gross Unrealized Losses | | Fair Value | | Gross Unrealized Losses |
| Debt securities in government sponsored entities | $ | 133,904 |
| | $ | (148 | ) | | $ | 127,756 |
| | $ | (299 | ) | |
| Debt securities in government-sponsored entities | | $ | 28,176 |
| | $ | (16 | ) | | $ | 133,904 |
| | $ | (148 | ) |
| Corporate debt securities | 138,326 |
| | (461 | ) | | 92,199 |
| | (235 | ) | 130,224 |
| | (187 | ) | | 138,326 |
| | (461 | ) |
| U.S. treasury securities | — |
| | — |
| | 13,490 |
| | (121 | ) | |
| Total | $ | 272,230 |
| | $ | (609 | ) | | $ | 233,445 |
| | $ | (655 | ) | $ | 158,400 |
| | $ | (203 | ) | | $ | 272,230 |
| | $ | (609 | ) |
Realized gains and losses are determined based on the specific identification method and are reported in interest income in the consolidated statements of income. ForGross realized gains on sales of available-for-sale securities for the yearyears endedDecember 30, 2012, January 1, 2012, gross realized gains on sales of available-for sale securitiesand January 2, 2011 were$1.6 million, $1.4 million, and gross realized losses were immaterial.$1.7 million, respectively. Gross realized gains and losses on sales of available-for-sale securities were immaterial for each of the years ended December 30, 2012, January 1, 2012, and January 3, 20102, 2011. were immaterial.
Contractual maturities of available-for-sale debt securities as of January 1,December 30, 2012 were as follows (in thousands):
| | | | Estimated Fair Value | Estimated Fair Value |
| Due within one year | $ | 268,355 |
| $ | 328,991 |
|
| After one but within five years | 618,235 |
| 587,232 |
|
| Total | $ | 886,590 |
| $ | 916,223 |
|
Cost-Method Investments
As of January 1,December 30, 2012 and January 2, 20111, 2012, the aggregate carrying amounts of the Company’s cost-method investments in non-publicly traded companies were $45.356.3 million and $32.045.3 million, respectively. The Company’s cost-method investments are assessed for impairment quarterly. The Company does not estimate the fair value of cost-method investments if there are no identified events or changes in circumstances that may have a significant adverse effect on the fair value of the investments. The Company includes cost-method investments in other long term assets in the consolidated balance sheets.
During the fourth quarter of 2012, the Company sold its minority ownership interest in deCODE Genetics, Inc., an Icelandic company that focuses on the genetic studies of human disease, to Amgen Inc., a biotechnology medicines company based in the U.S. Gross proceeds received were $50.8 million, resulting in a gain of $48.6 million. Also during the fourth quarter of 2012, the Company received $6.0 million from an investee in principal payment of a loan that was previously impaired, and recorded the recovered funds in interest income in the consolidated statements of income.
As a result of its impairment analysis performed in the fourth quarter of 2012, the Company determined that a cost-method investment was other-than-temporarily impaired and recorded an impairment loss of $2.7 million. This determination was based upon operational performance trends coupled with uncertainty regarding the entity’s ability to obtain additional funding in a required timeframe for the entity to continue operations.
No impairment losses were recorded during the year ended January 1, 2012. In 2010,the year ended January 2, 2011, the Company determined that a $6.0 million cost-method investment and a related $6.8 million note receivable with interest receivable of $0.4 million were below carrying value and the impairment was other-than-temporary. This determination was based upon continued shortfalls from revenue plans coupled with events at the time of assessment that created uncertainty regarding the entity's ability to obtain additional funding in a required timeframe for the entity to continue operations. As a result, the Company recorded an impairment charge of $13.2 million in other (expense) income,cost-method investment gain (loss), net in the consolidated statements of income for the year ended January 2, 20112011..
Accounts Receivable
Accounts receivable consist of the following (in thousands):
|
| | | | | | | |
| | January 1,
2012 | | January 2,
2011 |
| Accounts receivable from product and service sales | $ | 175,226 |
| | $ | 165,117 |
|
| Other receivables | 2,657 |
| | 2,167 |
|
| Total accounts receivable, gross | 177,883 |
| | 167,284 |
|
| Allowance for doubtful accounts | (3,997 | ) | | (1,686 | ) |
| Total accounts receivable, net | $ | 173,886 |
| | $ | 165,598 |
|
Inventory
Inventory, net, consists of the following (in thousands):
ILLUMINA, INC.
NOTES TO CONSOLIDATED FINANCIAL STATEMENTS — (Continued)
Accounts Receivable
Accounts receivable consist of the following (in thousands):
|
| | | | | | | |
| | January 1,
2012 | | January 2,
2011 |
| Raw materials | $ | 58,340 |
| | $ | 54,762 |
|
| Work in process | 53,412 |
| | 64,862 |
|
| Finished goods | 17,029 |
| | 22,587 |
|
| Total inventory, net | $ | 128,781 |
| | $ | 142,211 |
|
|
| | | | | | | |
| | December 30,
2012 | | January 1,
2012 |
| Accounts receivable from product and service sales | $ | 217,369 |
| | $ | 175,226 |
|
| Other receivables | 1,886 |
| | 2,657 |
|
| Total accounts receivable, gross | 219,255 |
| | 177,883 |
|
| Allowance for doubtful accounts | (4,280 | ) | | (3,997 | ) |
| Total accounts receivable, net | $ | 214,975 |
| | $ | 173,886 |
|
Inventory
Inventory consists of the following (in thousands):
|
| | | | | | | |
| | December��30,
2012 | | January 1,
2012 |
| Raw materials | $ | 61,665 |
| | $ | 58,340 |
|
| Work in process | 75,675 |
| | 53,412 |
|
| Finished goods | 21,378 |
| | 17,029 |
|
| Total inventory | $ | 158,718 |
| | $ | 128,781 |
|
Property and Equipment
Property and equipment, net consists of the following (in thousands):
| | | | January 1,
2012 | | January 2,
2011 | December 30,
2012 | | January 1,
2012 |
| Leasehold improvements | $ | 63,406 |
| | $ | 55,681 |
| $ | 87,734 |
| | $ | 63,406 |
|
| Manufacturing and laboratory equipment | 137,805 |
| | 114,108 |
| |
| Computer equipment and software | 54,826 |
| | 41,500 |
| |
| Machinery and equipment | | 158,112 |
| | 143,816 |
|
| Computer hardware and software | | 58,313 |
| | 54,826 |
|
| Furniture and fixtures | 9,274 |
| | 6,732 |
| 8,022 |
| | 8,095 |
|
| Leased equipment | 14,854 |
| | 15,475 |
| |
| Construction in progress | | 7,390 |
| | 10,022 |
|
| Total property and equipment, gross | 280,165 |
| | 233,496 |
| 319,571 |
| | 280,165 |
|
| Accumulated depreciation | (136,682 | ) | | (103,622 | ) | (153,404 | ) | | (136,682 | ) |
| Total property and equipment, net | $ | 143,483 |
| | $ | 129,874 |
| $ | 166,167 |
| | $ | 143,483 |
|
Depreciation expense was $55.648.2 million, $34.255.6 million and $24.534.2 million for the years ended January 1,December 30, 2012, January 2, 20111, 2012, and January 3, 20102, 2011, respectively. Capital expenditures included accrued expenditures of $5.91.6 million, $1.85.9 million, and $2.31.8 million in the years ended January 1,December 30, 2012, January 2, 20111, 2012, and January 3, 20102, 2011, respectively. These amounts have been excluded from the Consolidated Statements of Cash Flows for the respective periods as they represent non-cash investing activities.periods.
ILLUMINA, INC.
NOTES TO CONSOLIDATED FINANCIAL STATEMENTS — (Continued)
Accrued Liabilities
Accrued liabilities consist of the following (in thousands):
| | | | January 1,
2012 | | January 2,
2011 | December 30,
2012 | | January 1,
2012 |
| Accrued compensation expenses | | $ | 59,864 |
| | $ | 52,035 |
|
| Deferred revenue, current portion | $ | 52,573 |
| | $ | 45,863 |
| 55,817 |
| | 52,573 |
|
| Accrued compensation expenses | 52,035 |
| | 49,368 |
| |
| Accrued taxes payable | 19,339 |
| | 13,277 |
| 23,021 |
| | 19,339 |
|
| Customer deposits | 17,958 |
| | 14,900 |
| 13,765 |
| | 17,958 |
|
| Reserve for product warranties | 11,966 |
| | 16,761 |
| 10,136 |
| | 11,966 |
|
| Deferred rent, current portion | 11,042 |
| | — |
| |
| Acquisition related contingent consideration liability, current portion | | 9,490 |
| | 2,335 |
|
| Unsettled short-term investment purchase | | 9,154 |
| | — |
|
| Facility exit obligation, current portion | | 8,063 |
| | 4,408 |
|
| Accrued royalties | 5,682 |
| | 2,781 |
| 2,836 |
| | 5,682 |
|
| Facility exit obligation, current portion | 4,408 |
| | — |
| |
| Acquisition related contingent consideration liability | 2,335 |
| | 3,738 |
| |
| Other accrued expenses | 10,436 |
| | 9,476 |
| 9,731 |
| | 10,819 |
|
| Total accrued liabilities | $ | 187,774 |
| | $ | 156,164 |
| $ | 201,877 |
| | $ | 177,115 |
|
| |
| 3. | Restructuring Activities |
During the fourth quarter ofIn late 2011, the Company implemented a cost reduction initiative that included workforce reductions and the consolidation of certain facilities. In total, the Company notified approximately 200 employees of their involuntary termination.
A summary of the pre-tax charges and estimated total costs associated with the initiative is as follows (in thousands):
|
| | | | | | | | | | | | | | | |
| | Employee Separation costs | | Facilities Exit Costs | | Other Costs | | Total |
| Amount recorded in accrued liabilities as of January 1, 2012 | $ | 3,496 |
| | $ | — |
| | $ | 30 |
| | $ | 3,526 |
|
| Additional expenses | 2,780 |
| | 221 |
| | 521 |
| | 3,522 |
|
| Cash payments | (6,276 | ) | | (221 | ) | | (551 | ) | | (7,048 | ) |
| Amount recorded in accrued liabilities as of December 30, 2012 | $ | — |
| | $ | — |
| | $ | — |
| | $ | — |
|
| | | | | | | | |
| Cumulative expense recorded since inception in restructuring expense | $ | 10,463 |
| | $ | 221 |
| | $ | 974 |
| | $ | 11,658 |
|
| Estimated total restructuring costs to be incurred | $ | 10,463 |
| | $ | 221 |
| | $ | 974 |
| | $ | 11,658 |
|
BlueGnome
On September 19, 2012, the Company announced the acquisition of BlueGnome Ltd. (BlueGnome), a provider of cytogenetics and in vitro fertilization screening products. Total consideration for the acquisition was $95.5 million, which included $88.0 million in initial cash payments and $7.5 million in fair value of contingent cash consideration of up to $20.0 million based on the achievement of certain revenue based milestones by December 28, 2014.
The Company estimated the fair value of contingent cash consideration using a probability weighted discounted cash flow approach, a Level 3 measurement based on unobservable inputs that are supported by little or no market activity and reflect the Company’s own assumptions in measuring fair value. The Company used a discount rate of 30% in the assessment of the acquisition date fair value for the contingent cash consideration. Future changes in significant inputs such as the discount rate and estimated probabilities of milestone achievements could have a significant effect on the fair value of the contingent consideration.
ILLUMINA, INC.
NOTES TO CONSOLIDATED FINANCIAL STATEMENTS — (Continued)
involuntary termination.
In conjunction with the purchase transaction, the Company also agreed to pay up to $20.0 million to BlueGnome shareholders contingent upon the retention of certain key employees and certain other criteria. Such contingent payments are recognized as contingent compensation expense over the retention period through December 28, 2014.
In 2011,The Company allocated approximately $11.2 million of the total consideration to tangible assets, net of liabilities, and $48.9 million to identified intangible assets, including additional developed technologies of $25.0 million, customer relationships of $16.8 million, and a trade name of $7.1 million with average useful lives of seven, five, and ten years, respectively. The Company also recorded a $12.1 million deferred tax liability to reflect the tax impact of certain identified intangible assets, the amortization expenses for which are not tax deductible. The Company recorded a pre-tax restructuring chargethe excess consideration of approximately $8.147.5 million, primarily related to severance pay and other employee separation costs. A summary of the pre-tax charge and estimated total costs associated with the initiative is as follows (in thousands):goodwill.
|
| | | | | | | | | | | | | | | |
| | Employee Separation costs | | Facilities Exit Costs | | Other Costs | | Total |
| Expense recorded in the year ended January 1, 2012 | $ | 7,683 |
| | $ | — |
| | $ | 453 |
| | $ | 8,136 |
|
| Cash paid during the year ended January 1, 2012 | 4,187 |
| | — |
| | 423 |
| | 4,610 |
|
| Amount recorded in accrued liabilities as of January 1, 2012 | $ | 3,496 |
| | $ | — |
| | $ | 30 |
| | $ | 3,526 |
|
| | | | | | | | |
| Estimated total restructuring costs to be incurred | $ | 10,932 |
| | $ | 1,600 |
| | $ | 1,303 |
| | $ | 13,835 |
|
It is expected that the accrued employee related restructuring charges will be substantially paid and the restructuring project substantially completed by the end of second quarter of 2012.
EpicentrePrior Acquisitions
On January 10, 2011, the Company acquired Epicentre Technologies Corporation (Epicentre), a provider of nucleic acid sample preparation reagents and specialty enzymes used in sequencing and microarray applications. Total consideration for the acquisition was $71.4 million, which included $59.4 million in net cash payments, made at closing, $4.6 million in the fair value of contingent consideration settled in stock that is subject to forfeiture if certain non-revenue based milestones are not met, and $7.4 million in the fair value of contingent cash consideration of up to $1515.0 million based on the achievement of certain revenue based milestones by January 10, 2013.
The Company estimated the fair value of contingent stock consideration based on the closing price of its common stock as of the acquisition date. Approximately 229,000 shares of common stock were issued to Epicentre shareholders in connection with the acquisition, which shares are subject to forfeiture if certain non-revenue-based milestones are not met. One third of these shares issued with an assessed fair value of $4.6 million were determined to be part of the purchase price. The remaining shares with an assessed fair value of $10.1 million were determined to be compensation for post-acquisition service, the cost of which will be recognized as contingent compensation expense over a period of 2two years in research and development expense orand selling, general and administrative expense.
The Company estimated the fair value of contingent cash consideration using a probability weighted discounted cash flow approach, a Level 3 measurement based on unobservable inputs that are supported by little or no market activity and reflectreflects the Company'sCompany’s own assumptions in measuring fair value. The Company used a discount rate of 21% in the assessment of the acquisition date fair value for the contingent cash consideration. Future changes in significant inputs such as the discount rate and estimated probabilities of milestone achievements could have a significant effect on the fair value of the contingent consideration.
The Company allocated $0.9 million of the total consideration to tangible assets, net of liabilities, and $26.9 million to identified intangible assets, including additional developed technologies of $23.3 million, customer relationships of $1.1 million, and a trade name of $2.5 million, and customer relationships of $1.1 million, with weighted average useful lives of approximately nine, threeten, and tenthree years years,, respectively. The Company recorded the excess consideration of $43.6 million as goodwill.
Prior Acquisitions
On April 30, 2010, the Company completed the acquisition of Helixis, a company developing a high-performance, low-cost, real time PCR system used for nucleic acid analysis. Total consideration for the acquisition at the closing date was approximately $86.7 million, including $70.0 million in net cash payments and $14.1 million for the fair value of contingent consideration payments that could range from $0 to $35 million based on the achievement of certain revenue-based milestones by December 31, 2011. Using information available at the close of the acquisition, the Company allocated approximately $2.3 million of the
ILLUMINA, INC.
NOTES TO CONSOLIDATED FINANCIAL STATEMENTS — (Continued)
consideration to tangible assets, net of liabilities, and approximately $28.0 million to identified intangible assets that will be amortized over a useful life of 10 years. The Company also recorded a $10.7 million deferred tax liability to reflect the tax impact of the identified intangible assets that will not generate tax deductible amortization expense and an $8.7 million deferred tax asset which primarily relates to acquired net operating loss carryforwards. The Company recorded the excess consideration of approximately $58.4 million as goodwill.
Prior to the acquisition, the Company had an equity interest in Helixis with a cost basis of $2.0 million that was accounted for under the cost method of accounting. The Company recognized a gain of $2.9 million, which was included in other (expense) income, net, in its consolidated statement of income as a result of revaluing the Company's equity interest in Helixis on the acquisition date.
On July 28, 2010, the Company completed an acquisition of another privately-held, development stage entity. Total consideration for the acquisition was $22.0 million. As a result of this transaction, the Company recorded an in-process research and development (IPR&D)IPR&D asset of $21.4 million in intangible assets. In determining the fair value of the IPR&D, various factors were considered, such as future revenue contributions, additional research and development costs to be incurred, and contributory asset charges. The fair value of the IPR&D was calculated using an income approach, and the rate used to discount net future cash flows to their present values was based on a risk-adjusted rate of return of approximately 28%. Significant factors considered in the calculation of the rate of return include the weighted average cost of capital, the weighted average return on assets, the internal rate of return, as well as the risks inherent in the development process for development-stage entities of similar sizes.
In addition,On April 30, 2010, the Company completed the acquisition of Helixis, Inc. (Helixis), a development-stage company developing a high-performance, low-cost, real time PCR system used for nucleic acid analysis. Total consideration for the acquisition was $86.7 million, including $70.0 millionin 2008,net cash payments and$14.1 million for the fair value of contingent consideration payments that could range from $0 to $35 million based on the achievement of certain revenue-based milestones by December 31, 2011. The Company allocated $2.3 million of the consideration to tangible assets, net of liabilities, and $28.0 million to identified intangible assets that will be amortized over a useful life of ten years. The Company also recorded a $10.7 million deferred tax liability to reflect the tax impact of the identified intangible assets, the amortization expenses for which are not tax deductible and an $8.7 million deferred tax asset which primarily relates to acquired net operating loss carryforwards. The Company recorded the excess consideration of $58.4 million as goodwill.
ILLUMINA, INC.
NOTES TO CONSOLIDATED FINANCIAL STATEMENTS — (Continued)
Prior to the acquisition, the Company had an equity interest in Helixis with a cost basis of $2.0 million that was accounted for under the cost-method of accounting. The Company recognized a gain of $2.9 million, which was included in other (expense) income, net, in its consolidated statement of income as a result of revaluing the Company’s equity interest in Helixis on the acquisition date.
In addition, the Company agreed to pay the former shareholders of the entity up to an additional $35.0 millionanother development stage company acquired in 2008 a certain amount of contingent cash consideration based on the achievement of certain product-related and employment-related milestones. In accordance with the applicable accounting guidance effective at thatthe time, when the contingency is resolved beyond a reasonable doubt and the additionalsuch consideration is issued or becomes issuable, the additional considerations arewas accounted for as an additional elementelements of the cost of acquisition, resulting in additional IPR&D charges in the periods presented. All employment-related contingent compensation expense is recorded in operating expense.years ended January 1, 2012 and January 2, 2011 when the contingencies were resolved beyond a reasonable doubt and the considerations were issued or became issuable.
AsSummary of January 1, 2012, the Company's remaining gross milestone obligations related to these prior year acquisitions consisted of potential employment-related milestone payments of $1.4 million. Contingent Compensation Expenses and IPR&D Charges
Contingent compensation expenses and IPR&D charges as a result of acquisitions consist of the following (in thousands):
| | | | Years Ended | Years Ended |
| | January 1,
2012 | | January 2,
2011 | | January 3,
2010 | December 30,
2012 | | January 1,
2012 | | January 2,
2011 |
| Contingent compensation expense, included in research and development expense | $ | 4,799 |
| | $ | 3,675 |
| | $ | 3,675 |
| $ | 3,419 |
| | $ | 4,799 |
| | $ | 3,675 |
|
| Contingent compensation expense, included in selling, general and administrative expense | 1,258 |
| | — |
| | — |
| 5,732 |
| | 1,258 |
| | — |
|
| Total contingent compensation expense | $ | 6,057 |
| | $ | 3,675 |
| | $ | 3,675 |
| $ | 9,151 |
| | $ | 6,057 |
| | $ | 3,675 |
|
| IPR&D, included in acquisition related (gain) expense, net | $ | 5,425 |
| | $ | 1,325 |
| | $ | 11,325 |
| |
| IPR&D, included in acquisition related expense (gain), net | | $ | — |
| | $ | 5,425 |
| | $ | 1,325 |
|
The Company’s intangible assets, excluding goodwill, are comprised primarily ofinclude acquired core technology,and licensed technology from a settlement, IPR&D,technologies, license agreements, trade name, and customer relationships. Amortization for the intangible assets that have finite useful lives is generally recorded on a straight-line basis over their useful lives.
The following is a summary of the Company’s identifiable intangible assets as of the respective balance sheet dates (in thousands):
|
| | | | | | | | | | | | | | | | | | | | | | | | | | | |
| | December 30, 2012 | | January 1, 2012 |
| | Weighted Average Useful Life (years) | | Gross Carrying Amount | | Accumulated Amortization | | Intangibles, Net | | Weighted Average Useful Life (years) | | Gross Carrying Amount | | Accumulated Amortization | | Intangibles, Net |
| Intangible assets with finite useful lives: |
| Licensed technologies | 6.6 | | $ | 46,904 |
| | $ | (25,271 | ) | | $ | 21,633 |
| | 8.0 | | $ | 36,000 |
| | $ | (20,000 | ) | | $ | 16,000 |
|
| Core technologies | 8.8 | | 99,800 |
| | (27,427 | ) | | 72,373 |
| | 9.7 | | 74,800 |
| | (18,544 | ) | | 56,256 |
|
| Customer relationships | 5.0 | | 18,780 |
| | (2,214 | ) | | 16,566 |
| | 3.0 | | 1,980 |
| | (1,253 | ) | | 727 |
|
| License agreements | 7.8 | | 14,829 |
| | (4,133 | ) | | 10,696 |
| | 8.9 | | 12,404 |
| | (2,605 | ) | | 9,799 |
|
| Trade name | 10.0 | | 9,600 |
| | (672 | ) | | 8,928 |
| | 10.0 | | 2,500 |
| | (245 | ) | | 2,255 |
|
| Indefinitely-lived Intangible Asset: |
| In-process research & development |
| | — |
| | — |
| | — |
| |
| | 21,438 |
| | — |
| | 21,438 |
|
| Total intangible assets, net | | | $ | 189,913 |
| | $ | (59,717 | ) | | $ | 130,196 |
| | | | $ | 149,122 |
| | $ | (42,647 | ) | | $ | 106,475 |
|
Additions to intangible assets in the current year are primarily due to the BlueGnome acquisition and technology license agreements entered into during the year. As discussed in note “1. Organization and Summary of Significant Accounting Policies,” IPR&D was impaired during the year ended December 30, 2012. Amortization expense associated with intangible assets was $17.1 million for the year ended December 30, 2012, $15.5 million of which related to acquired intangible assets.
ILLUMINA, INC.
NOTES TO CONSOLIDATED FINANCIAL STATEMENTS — (Continued)
|
| | | | | | | | | | | | | | | | | | | | | | | | | | | | | |
| | January 1, 2012 | | January 2, 2011 |
| | Weighted Average Useful Life | | Gross Carrying Amount | | Accumulated Amortization | | Intangibles, Net | | Weighted Average Useful Life | | Gross Carrying Amount | | Accumulated Amortization | | Intangibles, Net |
| Finite-lived Intangible assets: |
| Licensed technology | 8.0 |
| | $ | 36,000 |
| | $ | (20,000 | ) | | $ | 16,000 |
| | 8.0 |
| | $ | 36,000 |
| | $ | (15,849 | ) | | $ | 20,151 |
|
| Core technology | 9.7 |
| | 74,800 |
| | (18,544 | ) | | 56,256 |
| | 10.0 |
| | 51,500 |
| | (10,604 | ) | | 40,896 |
|
| Customer relationships | 3.0 |
| | 1,980 |
| | (1,253 | ) | | 727 |
| | 3.0 |
| | 900 |
| | (900 | ) | | — |
|
| License agreements | 8.9 |
| | 12,404 |
| | (2,605 | ) | | 9,799 |
| | 8.9 |
| | 10,654 |
| | (1,677 | ) | | 8,977 |
|
| Trade name | 10.0 |
| | 2,500 |
| | (245 | ) | | 2,255 |
| | — |
| | — |
| | — |
| | — |
|
| Infinite-lived Intangible Asset: |
| In-process research & development | — |
| | 21,438 |
| | — |
| | 21,438 |
| | — |
| | 21,438 |
| | — |
| | 21,438 |
|
| Total intangible assets, net | |
| | $ | 149,122 |
| | $ | (42,647 | ) | | $ | 106,475 |
| | |
| | $ | 120,492 |
| | $ | (29,030 | ) | | $ | 91,462 |
|
Additions to intangible assets in the current year are a result of the Epicentre acquisition. Amortization expense associated with intangible assets was $13.6 millionfor the yearyears ended January 1, 2012, $12.7 million of which related to acquired intangible assets. Amortization expense associated with intangible assets was $7.8 million and$6.7 million for the years ended January 2, 2011 were $13.6 millionand January 3, 2010$7.8 million, respectively.
The estimated annual amortization of intangible assets for the next five years is shown in the following table (in thousands). Actual amortization expense to be reported in future periods could differ from these estimates as a result of acquisitions, divestitures, asset impairments, andamong other factors.
| | | 2012 | $ | 14,247 |
| |
| 2013 | 14,332 |
| $ | 24,644 |
|
| 2014 | 13,548 |
| 23,860 |
|
| 2015 | 13,102 |
| 23,414 |
|
| 2016 | 8,426 |
| 18,715 |
|
| 2017 | | 14,612 |
|
| Thereafter | 21,382 |
| 24,951 |
|
| Total | $ | 85,037 |
| $ | 130,196 |
|
| |
| 6. | Fair Value Measurements |
The following table presents the Company'sCompany’s fair value hierarchy for assets and liabilityliabilities measured at fair value on a recurring basis as of January 1,December 30, 2012 and January 2, 20111, 2012 respectively (in thousands):
| | | | January 1, 2012 | | January 2, 2011 | December 30, 2012 | | January 1, 2012 |
| | Level 1 | | Level 2 | | Level 3 | | Total | | Level 1 | | Level 2 | | Level 3 | | Total | Level 1 | | Level 2 | | Level 3 | | Total | | Level 1 | | Level 2 | | Level 3 | | Total |
| Assets: | | | | | | | | | | | | | | | | | | | | | | | | | | | | | | |
| Money market funds (cash equivalent) | $ | 166,898 |
| | $ | — |
| | $ | — |
| | $ | 166,898 |
| | $ | 148,822 |
| | $ | — |
| | $ | — |
| | $ | 148,822 |
| $ | 252,126 |
| | $ | — |
| | $ | — |
| | $ | 252,126 |
| | $ | 166,898 |
| | $ | — |
| | $ | — |
| | $ | 166,898 |
|
| Debt securities in government sponsored entities | — |
| | 394,039 |
| | — |
| | 394,039 |
| | — |
| | 261,697 |
| | — |
| | 261,697 |
| |
| Debt securities in government-sponsored entities | | — |
| | 314,873 |
| | — |
| | 314,873 |
| | — |
| | 394,039 |
| | — |
| | 394,039 |
|
| Corporate debt securities | — |
| | 433,382 |
| | — |
| | 433,382 |
| | — |
| | 330,758 |
| | — |
| | 330,758 |
| — |
| | 472,861 |
| | — |
| | 472,861 |
| | — |
| | 433,382 |
| | — |
| | 433,382 |
|
| U.S. Treasury securities | 59,169 |
| | — |
| | — |
| | 59,169 |
| | 52,887 |
| | — |
| | — |
| | 52,887 |
| 128,489 |
| | — |
| | — |
| | 128,489 |
| | 59,169 |
| | — |
| | — |
| | 59,169 |
|
| Deferred compensation plan assets | — |
| | 10,800 |
| | — |
| | 10,800 |
| | — |
| | 6,449 |
| | — |
| | 6,449 |
| — |
| | 13,626 |
| | — |
| | 13,626 |
| | — |
| | 10,800 |
| | — |
| | 10,800 |
|
| Total assets measured at fair value | $ | 226,067 |
| | $ | 838,221 |
| | $ | — |
| | $ | 1,064,288 |
| | $ | 201,709 |
| | $ | 598,904 |
| | $ | — |
| | $ | 800,613 |
| $ | 380,615 |
| | $ | 801,360 |
| | $ | — |
| | $ | 1,181,975 |
| | $ | 226,067 |
| | $ | 838,221 |
| | $ | — |
| | $ | 1,064,288 |
|
| Liabilities: |
| |
| |
| |
| |
| |
| |
| |
| | | | | | | | | | | | | | | |
| Acquisition related contingent consideration liability | $ | — |
| | $ | — |
| | $ | 6,638 |
| | $ | 6,638 |
| | $ | — |
| | $ | — |
| | $ | 3,738 |
| | $ | 3,738 |
| |
| Acquisition related contingent consideration liabilities | | $ | — |
| | $ | — |
| | $ | 12,519 |
| | $ | 12,519 |
| | $ | — |
| | $ | — |
| | $ | 6,638 |
| | $ | 6,638 |
|
| Deferred compensation liability | — |
| | 8,970 |
| | — |
| | 8,970 |
| | — |
| | 5,272 |
| | — |
| | 5,272 |
| — |
| | 12,071 |
| | — |
| | 12,071 |
| | — |
| | 8,970 |
| | — |
| | 8,970 |
|
| Total liabilities measured at fair value | $ | — |
| | $ | 8,970 |
| | $ | 6,638 |
| | $ | 15,608 |
| | $ | — |
| | $ | 5,272 |
| | $ | 3,738 |
| | $ | 9,010 |
| $ | — |
| | $ | 12,071 |
| | $ | 12,519 |
| | $ | 24,590 |
| | $ | — |
| | $ | 8,970 |
| | $ | 6,638 |
| | $ | 15,608 |
|
The Company holds available-for-sale securities that consist of highly liquid, investment grade debt securities. The Company determines the fair value of its debt security holdings based on pricing from a service provider. The service provider values the securities based on "consensus“consensus pricing,"” using market prices from a variety of industry-standard independent data providers. Such market prices may be quoted prices in active markets for identical assets or liabilities (Level 1 inputs) or pricing determined using inputs other than quoted prices that are observable either directly or indirectly (Level 2 inputs), such as quoted prices for similar assets or liabilities, yield curve, volatility factors, credit spreads, default rates, loss severity, current market and contractual prices for the underlying instruments or debt, broker and dealer quotes, as well as other relevant economic measures. The Company’s deferred compensation plan assets consist primarily of mutual funds. See note “14. Employee Benefit Plans” for additional information about our deferred compensation plan. The Company performs certain procedures to corroborate the fair value of its holdings, including comparing prices obtained from the service providerproviders to prices obtained from other reliable sources.
The Company's deferred compensation plan assets consist primarily of mutual funds. See footnote "14. Employee Benefit Plans" for additional information about our deferred compensation plan.
At January 1, 2012, the Company reassessedreassesses the fair value of the contingent consideration to be settled in cash related to acquisitions on a quarterly basis using the income approach. These fair value measurements areThis is a Level 3 measurements.measurement. Significant assumptions used in the measurement include probabilities of achieving the remaining milestones and the discount rates, which dependsdepend on the milestone risk profiles. Due to changes in the estimated probabilities to achieve the relevant milestonespayments and a shorter discounting period, the fair value of the contingent consideration
ILLUMINA, INC.
NOTES TO CONSOLIDATED FINANCIAL STATEMENTS — (Continued)
liabilities changed, resulting in a gain of $4.52.0 million expense recorded in acquisition related expense (gain) expense,, net in the consolidated statements of income during the year ended January 1,December 30, 2012, respectively..
Changes in estimated fair value of contingent consideration liabilities from January 3, 2010 through January 1,December 30, 2012 are as follows (in thousands):
|
| | | |
| | Contingent Consideration Liability (Level 3 Measurement) |
| Balance as of January 3, 2010 | $ | — |
|
| Acquisition of Helixis | 14,114 |
|
| Gain recorded in acquisition related (gain) expense, net | (10,376 | ) |
| Balance as of January 2, 2011 | $ | 3,738 |
|
| Acquisition of Epicentre | 7,400 |
|
| Gain recorded in acquisition related (gain) expense, net | (4,500 | ) |
| Balance as of January 1, 2012 | $ | 6,638 |
|
.. |
| | | |
| | Contingent Consideration Liability (Level 3 Measurement) |
| Balance as of January 3, 2010 | $ | — |
|
| Acquisition of Helixis | 14,114 |
|
| Gain recorded in acquisition related expense (gain), net | (10,376 | ) |
| Balance as of January 2, 2011 | $ | 3,738 |
|
| Acquisition of Epicentre | 7,400 |
|
| Gain recorded in acquisition related expense (gain), net | (4,500 | ) |
| Balance as of January 1, 2012 | $ | 6,638 |
|
| Acquisition of BlueGnome | 7,500 |
|
| Expense recorded in acquisition related expense (gain), net | 1,975 |
|
| Cash payments | (3,594 | ) |
| Balance as of December 30, 2012 | $ | 12,519 |
|
ILLUMINA, INC.
NOTES TO CONSOLIDATED FINANCIAL STATEMENTS — (Continued)
The Company generally provides a one-year warranty on instruments. Additionally, the Company provides a warranty on its consumables through the expiration date, which generally ranges from six to twelve months after the manufacture date. At the time revenue is recognized, the Company establishes an accrual for estimated warranty expenses based on historical experience as well as anticipated product performance. The Company periodically reviews the adequacy of our warranty reserve, and adjusts, if necessary, the warranty percentage and accrual based on actual experience and estimated costs to be incurred. Warranty expense is recorded as a component of cost of product revenue. Estimated warranty expenses associated with extended maintenance contracts for systems are recorded as a cost of service and other revenue as incurred.
Changes in the Company’s reserve for product warranties from December 28, 2008 through January 1, 2012 are as follows (in thousands):
|
| | | |
| Balance as of December 28, 2008 | $ | 8,203 |
|
| Additions charged to cost of revenue | 14,613 |
|
| Repairs and replacements | (12,601 | ) |
| Balance as of January 3, 2010 | 10,215 |
|
| Additions charged to cost of revenue | 25,146 |
|
| Repairs and replacements | (18,600 | ) |
| Balance as of January 2, 2011 | 16,761 |
|
| Additions charged to cost of revenue | 17,913 |
|
| Repairs and replacements | (22,708 | ) |
| Balance as of January 1, 2012 | $ | 11,966 |
|
| |
8. | Convertible Senior Notes |
0.25% Convertible Senior Notes due 2016
In March 2011, the Company issued $800920.0 million aggregate principal amount of 0.25% convertible senior notes due 2016 (the 2016(2016 Notes) in an offering conducted in accordance with Rule 144A under the Securities Act of 1933, as amended. The 2016 Notes were issued at 98.25% of par value. Debt issuance costs of approximately $0.4 million were primarily comprised of legal, accounting, and other professional fees, the majority of which were recorded in other noncurrent assets and are being amortized to interest expense over the five-yearfive-year term of the 2016 Notes. The Company issued an additional $120 million aggregate principal amount of 2016 Notes in April 2011. The net proceeds from the initial issuance and subsequent issuance, after deducting the initial purchasers' discount and the estimated offering expenses payable by the Company, were $785.6 million and $117.9 million, respectively.
The 2016 Notes will be convertible into cash, shares of common stock, or a combination of cash and shares of common stock, at the Company'sCompany’s election, based on an initial conversion rate, subject to adjustment, of 11.9687 shares per $1,000$1,000 principal amount of the 2016 Notes (which represents an initial conversion price of approximately $83.55+ per share), only in the following circumstances and to the following extent: (1) during the five business-day period after any 10 consecutive trading day period (the “measurement period”) in which the trading price per 2016 Note for each day of such measurement period was less than 98% of the product of the last reported sale price of the Company's common stock and the conversion rate on each such day; (2) during any calendar quarter (and only during that quarter) after the calendar quarter ending March 31, 2011, if the last reported sale price of the Company's common stock for 20 or more trading days in the period of 30 consecutive trading days ending on the last trading day of the immediately preceding calendar quarter exceeds 130% of the applicable conversion price in effect on the last trading day of the immediately preceding calendar quarter; (3) upon the occurrence of specified events described in the indenture for the 2016 Notes; and (4) at any time on or after December 15, 2015 through the second scheduled trading day immediately preceding the maturity date.
As noted in the indenture for the 2016 Notes, it is the Company'sCompany’s intent and policy to settle conversions through combination settlement, which essentially involves repayment of an amount of cash equal to the “principal portion” and delivery of the “share amount” in excess of the conversion value over the principal portion in shares of common stock. In general, for each $1,000$1,000 in principal, the “principal portion” of cash upon settlement is defined as the lesser of $1,000, and the conversion value during the 20-day20-day observation period as described in the indenture for the 2016 Notes. The conversion value
is the sum of the daily conversion value which is the product of the effective conversion rate divided by 20 days and the daily volume weighted average price (“VWAP”) of the Company'sCompany’s common stock. The “share amount” is the cumulative “daily share amount” during the observation period, which is calculated by dividing the daily VWAP into the difference between the daily conversion value (i.e., conversion rate x daily VWAP) and $1,000.
ILLUMINA, INC.
NOTES TO CONSOLIDATED FINANCIAL STATEMENTS — (Continued)
The Company pays 0.25% interest per annum on the principal amount of the 2016 Notes payable semiannually in arrears in cash on March 15 and September 15 of each year, which began on September 15, 2011.year. The Company made an interest payment ofpaid $1.12.3 million in September 2011.interest payments during the year ended December 30, 2012. The 2016 Notes mature on March 15, 2016. If a designated event, as defined in the indenture for the 2016 Notes, such as an acquisition, merger, or liquidation, occurs prior to the maturity date, subject to certain limitations, holders of the 2016 Notes may require the Company to repurchase all or a portion of their 2016 Notes for cash at a repurchase price equal to 100% of the principal amount of the 2016 Notes to be repurchased, plus any accrued and unpaid interest to, but excluding, the repurchase date.
The Company accounts separately for the liability and equity components of the 2016 Notes in accordance with authoritative guidance for convertible debt instruments that may be settled in cash upon conversion. The guidance requires the carrying amount of the liability component to be estimated by measuring the fair value of a similar liability that does not have an associated conversion feature. Because the Company has no outstanding non-convertible public debt, the Company determined that senior, unsecured corporate bonds traded on the market represent a similar liability to the convertible senior notes without the conversion option. Based on market data available for publicly traded, senior, unsecured corporate bonds issued by companies in the same industry and with similar maturity, the Company estimated the implied interest rate of its 2016 Notes to be 4.5%, assuming no conversion option. Assumptions used in the estimate represent what market participants would use in pricing the liability component, including market interest rates, credit standing, and yield curves, all of which are defined as Level 2 observable inputs. The estimated implied interest rate was applied to the 2016 Notes, which resulted in a fair value of the liability component of $748.5 million upon issuance, calculated as the present value of implied future payments based on the $920.0 million aggregate principal amount. The $155.4 million difference between the cash proceeds of $903.9 million and the estimated fair value of the liability component was recorded in additional paid-in capital as the 2016 Notes are not considered currently redeemable at the balance sheet date.
If the 2016 Notes were converted as of January 1,December 30, 2012, the if-converted value would not exceed the principal amount. As a policy election under applicable guidance related to the calculation of diluted net income per share, the Company elected the combination settlement method as its stated settlement policy and applied the treasury stock method in the calculation of dilutive impact of themethod. The 2016 Notes which washad an anti-dilutive effect for the yearyears ended January 1,December 30, 2012.
The Company used $314.3 million of the net proceeds to purchase 4,890,500 shares of its common stock in privately negotiated transactions concurrently with the issuance. The Company also used part of the net proceeds for the extinguishment of $349.9 million principal amount of its outstanding 0.625% convertible senior notes due 2014 upon conversions during the year ended and January 1, 2012.
0.625% Convertible Senior Notes due 2014
In February 2007, the Company issued $400.0 million principal amount of 0.625% convertible senior notes due 2014 (the 2014(2014 Notes). The Company pays 0.625% interest per annum on the principal amount of the 2014 Notes, payable semi-annually in arrears in cash on February 15 and August 15 of each year. The Company made an interest payment of $1.2 million in February 2011. Interest payment in August 2011 was immaterial due to conversions prior to the payment date. The 2014 Notes mature on February 15, 2014. The effective interest rate of the liability component was estimated to be 8.3%.
The Company entered into hedge transactions concurrently with the issuance of the 2014 Notes under which the Company is entitled to purchase up to approximately 18,322,000 shares of the Company'sCompany’s common stock at a strike price of approximately $21.83 per share, subject to adjustment. The convertible note hedge transactions had the effect of reducing dilution to the Company'sCompany’s stockholders upon conversion of the 2014 Notes. Also concurrently with the issuance of the 2014 Notes, the Company sold to the hedge counterparties warrants exercisable, on a cashless basis, for up to approximately 18,322,000 shares of the Company'sCompany’s common stock at a strike price of $31.435 per share, subject to adjustment. The proceeds from these warrants partially offset the cost to the Company of the convertible note hedge transactions.
The 2014 Notes became convertible into cash and shares of the Company'sCompany’s common stock in various prior periods and werebecame convertible again from April 1, 2012 through, and including, December 31, 2011. As30, 2012. There were no conversions of January 1, 2012, the conditions to permit conversion were no longer satisfied and, as a result, the 2014 Notes were classified in long-term liabilities.during the year ended December 30, 2012. During the year ended January 1,
2012, the principal amount of all 2014 Notes converted was repaid with cash and the excess of the conversion value over the principal amount was paid in shares of common stock. The equity dilution resulting from the issuance of common stock related to the conversion of the 2014 Notes was offset by repurchase of the same amount of shares under the convertible note hedge transactions, which were automatically exercised in accordance with their terms at the time of each such conversion. The balance of the convertible note hedge transactions with respect to approximately $40.1 million principal amount of the 2014 Notes (which are convertible into up to 1,837,9581,838,000 shares of the Company'sCompany’s common stock) remained in place as of January 1, 2012.December 30, 2012. The warrants were not affected by the early conversions of the 2014 Notes and, as a result, warrants covering up to approximately 18,322,000 shares of common stock remained outstanding as of January 1, 2012.December 30, 2012.
ILLUMINA, INC.
NOTES TO CONSOLIDATED FINANCIAL STATEMENTS — (Continued)
As a result of the conversions during the year ended January 1, 2012, the Company recorded losses on extinguishment of debt calculated as the difference between the estimated fair value of the debt and the carrying value of the notes as of the settlement dates. To measure the fair value of the converted notes as of the settlement dates, the applicable interest rates were estimated using Level 2 observable inputs and applied to the converted notes using the same methodology as in the issuance date valuation. If the 2014 Notes were converted as of January 1,December 30, 2012, the if-converted value would exceed the principal amount by $15.960.0 million.
The following table summarizes information about the conversions of the 2014 Notes during the year ended January 1, 2012 (in thousands, except percentages):
|
| | | | |
| | | January 1,
2012 |
| Cash paid for principal of notes converted | | $ | 349,874 |
|
| Conversion value over principal amount paid in shares of common stock | | $ | 727,618 |
|
| Number of shares of common stock issued upon conversion | | 10,733 |
|
| Loss on extinguishment of debt | | $ | 37,611 |
|
| Effective interest rates used to measure fair value of converted notes upon conversion | | 3.5% - 4.3% |
|
The following table summarizes information about the equity and liability components of the 2014 and 2016 Notes (dollars in thousands). The fair values of the respective notes outstanding were measured based on quoted market prices.
| | | | | January 1, 2012 | | January 2, 2011 | | December 30, 2012 | | January 1, 2012 |
| | | 0.25% Convertible Senior Notes due 2016 | | 0.625% Convertible Senior Notes due 2014 | | 0.625% Convertible Senior Notes due 2014 | | 2016 Notes | | 2014 Notes | | 2016 Notes | | 2014 Notes |
| Principal amount of convertible notes outstanding | | $ | 920,000 |
| | $ | 40,125 |
| | $ | 389,999 |
| | $ | 920,000 |
| | $ | 40,125 |
| | $ | 920,000 |
| | $ | 40,125 |
|
| Unamortized discount of liability component | | (147,034 | ) | | (5,722 | ) | | (78,390 | ) | | (114,594 | ) | | (3,158 | ) | | (147,034 | ) | | (5,722 | ) |
| Net carrying amount of liability component | | 772,966 |
| | 34,403 |
| | 311,609 |
| | 805,406 |
| | 36,967 |
| | 772,966 |
| | 34,403 |
|
| Less: current portion | | — |
| | — |
| | (311,609 | ) | | — |
| | (36,967 | ) | | — |
| | — |
|
| Long-term debt | | $ | 772,966 |
| | $ | 34,403 |
| | $ | — |
| | $ | 805,406 |
| | $ | — |
| | $ | 772,966 |
| | $ | 34,403 |
|
| Conversion option subject to cash settlement | | $ | — |
| | $ | 5,722 |
| | $ | 78,390 |
| | $ | — |
| | $ | 3,158 |
| | $ | — |
| | $ | 5,722 |
|
| Carrying value of equity component, net of issuance costs | | $ | 155,366 |
| | $ | 114,035 |
| | $ | 71,199 |
| | $ | 155,366 |
| | $ | 111,470 |
| | $ | 155,366 |
| | $ | 114,035 |
|
| Fair value of outstanding notes | | $ | 725,632 |
| | $ | 60,122 |
| | $ | 1,157,450 |
| | $ | 892,446 |
| | $ | 101,470 |
| | $ | 725,632 |
| | $ | 60,122 |
|
| Remaining amortization period of discount on the liability component | | 4.2 years |
| | 2.1 years |
| | 3.1 years |
| | 3.2 years |
| | 1.1 years |
| | 4.2 years |
| | 2.1 years |
|
| Effective interest rate of liability component | | 4.5 | % | | 8.3 | % | | 8.3 | % | |
| Contractual coupon interest expense | | $ | 1,871 |
| | $ | 414 |
| | $ | 2,390 |
| |
| Accretion of discount on the liability component | | $ | 24,502 |
| | $ | 7,671 |
| | $ | 21,407 |
| |
Contractual coupon interest expense and accretion of discount on the liability component recorded for the convertible senior notes were as follows (in thousands):
|
| | | | | | | | | | | | |
| | | Years Ended |
| | | December 30,
2012 | | January 1,
2012 | | January 2,
2011 |
| Contractual coupon interest expense | | $ | 2,472 |
| | $ | 2,285 |
| | $ | 2,390 |
|
| Accretion of discount on the liability component | | $ | 35,004 |
| | $ | 32,173 |
| | $ | 21,407 |
|
Operating Leases
The Company leases office and manufacturing facilities under various noncancellable operating lease agreements. Facility leases generally provide for periodic rent increases, and many contain escalation clauses and renewal options. Certain leases require the Company to pay property taxes and routine maintenance. The Company is headquartered in San Diego, California and leases facilities in San Diego, California; Hayward, California; Branford, Connecticut;Fairfax, Virginia; Madison, Wisconsin; the United Kingdom; the Netherlands; Japan; Singapore; Australia; Brazil; Canada; and China.
ILLUMINA, INC.
NOTES TO CONSOLIDATED FINANCIAL STATEMENTS — (Continued)
Annual future minimum payments under these operating leases as of January 1,December 30, 2012 were as follows (in thousands):
| | | 2012 | $ | 16,336 |
| |
| 2013 | 22,598 |
| $ | 27,676 |
|
| 2014 | 21,351 |
| 23,970 |
|
| 2015 | 20,355 |
| 23,197 |
|
| 2016 | 20,852 |
| 23,416 |
|
| 2017 | | 23,860 |
|
| Thereafter | 385,775 |
| 393,088 |
|
| Total | $ | 487,267 |
| $ | 515,207 |
|
Rent expense wasexpenses were $21.4 million, $17.4 million, $14.7 million, and $13.614.7 million for the years ended December 30, 2012, January 1, 2012, and January 2, 2011, and January 3, 2010, respectively.
In 2010, the Company entered into the lease agreement for its current corporate headquarters facility located in San Diego, California. The lease commenced on November 1, 2011 and has an initial term of 20 years with four five-year options to extend. There is a one-time option to terminate the lease after 15 years in exchange for an early termination fee. The lease includes two existing office buildings and a central plant building with approximately 346,600 square feet. The Company has also agreed to lease a third office building to be built at this facility containing approximately 123,400 rentable square feet. The Company has the right to further expand the premises and lease one or more of three additional office buildings that may be built at this facility. Total minimum lease payments during the initial term of the lease is expected to be $355.9 million, excluding further expansion beyond the third building, and taking no consideration of tenant improvement allowances totaling $21.9 million. The Company capitalizes the leasehold improvements and amortizes them over the shorter of the lease term or their expected useful life. The leasehold improvement allowances reduce rent expense over the initial lease term.
Lease commitments of $100.0 million related to the lease for the Company’s former headquarters are also included in the table above. Upon vacating certain buildings of its former headquarters in late 2011, the Company recorded a cease-use loss of $23.6 million and a corresponding facility exit obligation of $25.0 million, as the Company is further obligated for certain ongoing operating costs prior to any sublease that may be obtained.
The Company recorded facility exit obligations upon vacating its former headquarters during the years ended December 30, 2012 and January 1, 2012. Changes in the facility exit obligation as offrom January 1, 2012 isthrough December 30, 2012 are as follows (in thousands):
|
| | | |
| | January 1,
2012 |
| Facility exit obligation, current portion | $ | 4,408 |
|
| Facility exit obligation, non-current | 20,641 |
|
| Total facility exit obligation | $ | 25,049 |
|
|
| | | |
| Balance as of January 1, 2012: | $ | 25,049 |
|
| Additional facility exit obligation recorded | 24,878 |
|
| Accretion of interest expense | 2,129 |
|
| Cash payments | (6,704 | ) |
| Balance as of December 30, 2012 | $ | 45,352 |
|
Warranties
Changes in the Company’s reserve for product warranties from January 3, 2010 through December 30, 2012 are as follows (in thousands):
|
| | | |
| Balance as of January 3, 2010 | $ | 10,215 |
|
| Additions charged to cost of revenue | 25,146 |
|
| Repairs and replacements | (18,600 | ) |
| Balance as of January 2, 2011 | 16,761 |
|
| Additions charged to cost of revenue | 17,913 |
|
| Repairs and replacements | (22,708 | ) |
| Balance as of January 1, 2012 | 11,966 |
|
| Additions charged to cost of revenue | 17,279 |
|
| Repairs and replacements | (19,109 | ) |
| Balance as of December 30, 2012 | $ | 10,136 |
|
ILLUMINA, INC.
NOTES TO CONSOLIDATED FINANCIAL STATEMENTS — (Continued)
| |
10.9. | Share-based Compensation Expense |
Total share-based compensation expense for all stock awards consists of the following (in thousands):
| | | | Years Ended | Years Ended |
| | January 1,
2012 | | January 2,
2011 | | January 3,
2010 | December 30,
2012 | | January 1,
2012 | | January 2,
2011 |
| Cost of product revenue | $ | 6,951 |
| | $ | 5,378 |
| | $ | 4,776 |
| $ | 7,575 |
| | $ | 6,951 |
| | $ | 5,378 |
|
| Cost of service and other revenue | 695 |
| | 470 |
| | 514 |
| 461 |
| | 695 |
| | 470 |
|
| Research and development | 32,105 |
| | 25,428 |
| | 19,960 |
| 30,879 |
| | 32,105 |
| | 25,428 |
|
| Selling, general and administrative | 52,341 |
| | 40,369 |
| | 35,561 |
| 55,409 |
| | 52,341 |
| | 40,369 |
|
| Share-based compensation expense before taxes | 92,092 |
| | 71,645 |
| | 60,811 |
| 94,324 |
| | 92,092 |
| | 71,645 |
|
| Related income tax benefits | (32,168 | ) | | (25,231 | ) | | (20,121 | ) | (30,759 | ) | | (32,168 | ) | | (25,231 | ) |
| Share-based compensation expense, net of taxes | $ | 59,924 |
| | $ | 46,414 |
| | $ | 40,690 |
| $ | 63,565 |
| | $ | 59,924 |
| | $ | 46,414 |
|
The assumptions used for the specified reporting periods and the resulting estimates of weighted-average fair value per share of options granted and for stock purchased under the ESPP during those periods are as follows:
|
| | | | | | | | |
| Years Ended |
| January 1,
2012 | | January 2,
2011 | | January 3,
2010 |
Stock options granted: | | | | | |
Risk-free interest rate | 0.85 - 2.23% |
| | 2.05 - 2.73% |
| | 1.69 - 1.97% |
|
Expected volatility | 41 - 53% |
| | 46 - 48% |
| | 55 - 58% |
|
Expected term | 4.7 - 5.5 years |
| | 6.0 years |
| | 5.2 years |
|
Expected dividends | — |
| | — |
| | — |
|
| | | | | |
Stock purchased under the ESPP: | | | | | |
Risk-free interest rate | 0.16 - 0.30% |
| | 0.17 - 0.48% |
| | 0.28 - 2.90% |
|
Expected volatility | 43 - 48% |
| | 46 - 48% |
| | 48 - 58% |
|
Expected term | 0.5 - 1.0 years |
| | 0.5 - 1.0 years |
| | 0.5 - 1.0 years |
|
Expected dividends | — |
| | — |
| | — |
|
|
| | | | | | | | | | | |
| | Years Ended |
| | December 30,
2012 | | January 1,
2012 | | January 2,
2011 |
| Stock options granted: | | | | | |
| Risk-free interest rate | 0.56 - 0.93% |
| | 0.85 - 2.23% |
| | 2.05 - 2.73% |
|
| Expected volatility | 41 - 48% |
| | 41 - 53% |
| | 46 - 48% |
|
| Expected term | 4.0 - 6.6 years |
| | 4.7 - 5.5 years |
| | 6.0 years |
|
| Expected dividends | — |
| | — |
| | — |
|
| Weighted average fair value per share | $ | 15.47 |
| | $ | 27.47 |
| | $ | 18.82 |
|
| | | | | | |
| Stock purchased under the ESPP: | | | | | |
| Risk-free interest rate | 0.09 - 0.17% |
| | 0.16 - 0.30% |
| | 0.17 - 0.48% |
|
| Expected volatility | 33 - 64% |
| | 43 - 48% |
| | 46 - 48% |
|
| Expected term | 0.5 - 1.0 year |
| | 0.5 - 1.0 year |
| | 0.5 - 1.0 year |
|
| Expected dividends | — |
| | — |
| | — |
|
| Weighted average fair value per share | $ | 16.45 |
| | $ | 20.08 |
| | $ | 11.10 |
|
As of January 1,December 30, 2012, approximately $158.9177.8 million of total unrecognized compensation cost related to stock options, restricted stock units, and ESPP shares issued to date is expected to be recognized over a weighted-average period of approximately 2.42.3 years years..
| |
11.10. | Stockholders’ Equity |
Common Stock
On January 1, 2012 and January 2, 2011, the Company had 122,041,000 and 126,607,000 shares of common stock outstanding, respectively, excluding treasury shares.
Stock Options
On January 1, 2012, the Company had three active stock plans: theThe Company’s 2005 Stock and Incentive Plan (the 2005 Stock Plan), the 2005 Solexa Equity Incentive Plan (the 2005 Solexa Equity Plan), and the New Hire Stock and Incentive Plan.Plan allow for the issuance of stock options, restricted stock units and awards, and performance stock units. As of January 1,December 30, 2012, options to purchaseapproximately 5,220,0003,065,000 shares remained available for future grantgrants under the 2005 Stock Plan and the 2005 Solexa Equity Plan. There is no set number of shares reserved for issuance under the New Hire Stock and Incentive Plan.
Stock Options
Stock options granted at the time of hire primarily vest over a four or five-year period, with 20% or 25% of options vesting on the first anniversary of the grant date and the remaining options vesting monthly over the remaining vesting period. Stock options granted subsequent to hiring primarily vest monthly over a four or five-year period.Each grant of options has a
ILLUMINA, INC.
NOTES TO CONSOLIDATED FINANCIAL STATEMENTS — (Continued)
maximum term of ten years, measured from the applicable grant date, subject to earlier termination if the optionee'soptionee’s service with us ceases. Vesting in all cases is subject to the individual'sindividual’s continued service to us through the vesting date. The Company satisfies option exercises through the issuance of new shares.
ILLUMINA, INC.
NOTES TO CONSOLIDATED FINANCIAL STATEMENTS — (Continued)
The Company'sCompany’s stock option activity under all stock option plans from December 28, 2008January 3, 2010 through January 1,December 30, 2012 is as follows:
| | | | Options (in thousands) | | Weighted- Average Exercise Price | | Weighted Average Grant-Date Fair Value per Share | Options (in thousands) | | Weighted- Average Exercise Price |
| Outstanding at December 28, 2008 | 18,134 |
| | $ | 16.26 |
| | | |
| Granted | 1,560 |
| | 28.86 |
| | $ | 14.74 |
| |
| Exercised | (2,966 | ) | | 10.56 |
| | | |
| Cancelled | (639 | ) | | 14.88 |
| | | |
| Outstanding at January 3, 2010 | 16,089 |
| | 18.59 |
| | | 16,089 |
| | $ | 18.59 |
|
| Granted | 2,045 |
| | 39.11 |
| | 18.82 |
| 2,045 |
| | 39.11 |
|
| Exercised | (5,541 | ) | | 16.65 |
| | | (5,541 | ) | | 16.65 |
|
| Cancelled | (711 | ) | | 21.76 |
| | | (711 | ) | | 21.76 |
|
| Outstanding at January 2, 2011 | 11,882 |
| | 22.83 |
| | | 11,882 |
| | 22.83 |
|
| Granted | 1,399 |
| | 64.98 |
| | $ | 27.47 |
| 1,399 |
| | 64.98 |
|
| Exercised | (2,784 | ) | | 17.98 |
| | | (2,784 | ) | | 17.98 |
|
| Cancelled | (119 | ) | | 33.49 |
| | | (119 | ) | | 33.49 |
|
| Outstanding at January 1, 2012 | 10,378 |
| | $ | 29.69 |
| | | 10,378 |
| | 29.69 |
|
| Granted | | 251 |
| | 40.79 |
|
| Exercised | | (2,071 | ) | | 20.34 |
|
| Cancelled | | (207 | ) | | 39.18 |
|
| Outstanding at December 30, 2012 | | 8,351 |
| | $ | 32.10 |
|
At January 1,December 30, 2012, outstanding options to purchase approximately 7,126,0006,725,000 shares were exercisable with a weighted average per share exercise price of $23.5828.49. The weighted average remaining life of options outstanding and exercisable is 6.15.5 years years and 5.45.0 years years,, respectively, as of January 1,December 30, 2012.
The aggregate intrinsic value of options outstanding and options exercisable as of January 1,December 30, 2012 was $78.3207.0 million and $71.2185.9 million, respectively. Aggregate intrinsic value represents the product of the number of options outstanding multiplied by the difference between the Company'sCompany’s closing stock price per share on the last trading day of the fiscal period, which was $30.4854.75 as of December 30, 201128, 2012, and the exercise price multiplied by the number of options outstanding.price. Total intrinsic value of options exercised was $136.560.6 million, $156.9136.5 million, and $73.4156.9 million for the years ended January 1,December 30, 2012, January 2, 20111, 2012, and January 3, 20102, 2011, respectively. Total fair value of options vested was $49.531.9 million, $47.349.5 million, and $52.247.3 million for the years ended December 30, 2012, January 1, 2012, and January 2, 2011, respectively.
Restricted Stock
The Company issues restricted stock units (RSUs) and restricted stock awards (RSAs). The Company grants RSUs pursuant to its 2005 Stock and Incentive Plan. RSUs are share awards that, upon vesting, will deliver to the holder shares of the Company’s common stock. For grants to new hires prior to July 2011 and for grants to existing employees, RSUs generally vest 15% on the first anniversary of the grant date, 20% on the second anniversary of the grant date, 30% on the third anniversary of the grant date, and 35% on the fourth anniversary of the grant date. For grants to new hires subsequent to July 2011, RSUs generally vest over a four-year period with equal vesting on anniversaries of the grant date. The Company satisfies RSU vesting through the issuance of new shares. The Company also issues RSAs that are released based on service related vesting conditions. RSAs may be issued from the Company’s treasury stock or granted pursuant to the Company’s 2005 Stock and Incentive Plan.
ILLUMINA, INC.
NOTES TO CONSOLIDATED FINANCIAL STATEMENTS — (Continued)
A summary of the Company’s restricted stock activity and related information from January 3, 2010 through December 30, 2012 is as follows:
|
| | | | | | |
| | Restricted Stock (in thousands) | | Weighted Average Grant-Date Fair Value per Share |
| Outstanding at January 3, 2010 | 2,509 |
| | $ | 32.45 |
|
| Awarded | 1,353 |
| | 50.74 |
|
| Vested | (510 | ) | | 32.10 |
|
| Cancelled | (243 | ) | | 33.36 |
|
| Outstanding at January 2, 2011 | 3,109 |
| | 40.39 |
|
| Awarded | 1,780 |
| | 45.10 |
|
| Vested | (827 | ) | | 36.47 |
|
| Cancelled | (356 | ) | | 42.15 |
|
| Outstanding at January 1, 2012 | 3,706 |
| | 43.36 |
|
| Awarded | 1,952 |
| | 48.42 |
|
| Vested | (1,139 | ) | | 40.33 |
|
| Cancelled | (394 | ) | | 45.05 |
|
| Outstanding at December 30, 2012 | 4,125 |
| | $ | 46.43 |
|
Based on the closing price per share of the Company’s common stock of $54.75 and $30.48 on December 28, 2012 and December 30, 2011, respectively, the total pre-tax intrinsic value of all outstanding restricted stock as of December 30, 2012 and January 1, 2012 was $225.8 million and $112.9 million, respectively. Total fair value of restricted stock vested was $45.9 million, $30.2 million, and $16.4 million for the years ended December 30, 2012, January 1, 2012, and January 2, 2011, respectively.
Performance Stock Units
In March 2012, the Company’s Compensation Committee of the Company’s Board of Directors approved changes to the Company’s long-term equity incentive program for executive officers and approved the issuance of certain performance stock units at the end of a three-year performance period. The number of shares issuable will range from 50% and 150% of the shares approved in the award based on the Company’s performance relative to specified earnings per share targets at the end of the three-year performance period. A total of 587,000 shares were outstanding as of December 30, 2012 with a weighted-average grant-date fair value of $49.64, which represents the fair market value of one share of the Company’s common stock on the grant date.
Employee Stock Purchase Plan
A total of 15,467,000 shares of the Company'sCompany’s common stock have been reserved for issuance under its 2000 Employee Stock Purchase Plan, or ESPP. The ESPP permits eligible employees to purchase common stock at a discount, but only through payroll deductions, during defined offering periods. The price at which stock is purchased under the ESPP is equal to 85% of the fair market value of the common stock on the first or last day of the offering period, whichever is lower. The initial offering period commenced in July 2000.2000.
The ESPP provides for annual increases of shares available for issuance by the lesser of 3% of the number of outstanding shares of the Company'sCompany’s common stock on the last day of the immediately preceding fiscal year, 3,000,000 shares, or such lesser amount as determined by the Company'sCompany’s board of directors. Shares totaling approximately 328,000, 373,000328,000, and 360,000373,000 were issued under the ESPP during the years ended January 1,December 30, 2012, January 2, 2011, and January 3, 2010, respectively. The weighted average subscription date fair values of shares under the ESPP during the same periods were $20.08, $11.10, and $9.24, respectively. As of January 1, 2012, and January 2, 2011, respectively. As of December 30, 2012 and January 1, 2012, there were approximately 15,734,00015,406,000 shares and 16,062,00015,734,000 shares available for issuance under the ESPP, respectively.
Restricted Stock Units
The Company grants restricted stock units (RSUs) pursuant to its 2005 Stock and Incentive Plan as part of its periodic employee equity compensation review program. RSUs are share awards that, upon vesting, will deliver to the holder shares of
ILLUMINA, INC.
NOTES TO CONSOLIDATED FINANCIAL STATEMENTS — (Continued)
the Company's common stock. For grants to new hires prior to July 2011, RSUs generally vest 15% on the first anniversary of the grant date, 20% on the second anniversary of the grant date, 30% on the third anniversary of the grant date, and 35% on the fourth anniversary of the grant date. For grants to new hires subsequent to July 2011, RSUs generally vest over a four-year period with equal vesting on anniversaries of the grant date. For grants to existing employees, RSUs generally vest over a four-year period with 15% vesting on the first anniversary of the grant date, 20% vesting on the second anniversary of the grant date, 30% vesting on the third anniversary of the grant date, and 35% vesting on the fourth anniversary of the grant date. The Company satisfies RSU vesting through the issuance of new shares.
A summary of the Company's RSU activity and related information from December 28, 2008 through January 1, 2012 is as follows:
|
| | | | | | |
| | Restricted Stock Units (in thousands)(1) | | Weighted Average Grant-Date Fair Value per Share |
| Outstanding at December 28, 2008 | 1,579 |
| | $ | 32.68 |
|
| Awarded | 1,293 |
| | 32.25 |
|
| Vested | (246 | ) | | 32.33 |
|
| Cancelled | (117 | ) | | 33.19 |
|
| Outstanding at January 3, 2010 | 2,509 |
| | 32.45 |
|
| Awarded | 1,353 |
| | 50.74 |
|
| Vested | (510 | ) | | 32.10 |
|
| Cancelled | (243 | ) | | 33.36 |
|
| Outstanding at January 2, 2011 | 3,109 |
| | 40.39 |
|
| Awarded | 1,550 |
| | 42.02 |
|
| Vested | (827 | ) | | 36.47 |
|
| Cancelled | (356 | ) | | 42.15 |
|
| Outstanding at January 1, 2012 | 3,476 |
| | $ | 41.87 |
|
| |
(1) | Each RSU represents the fair market value of one share of common stock. |
Based on the closing price per share of the Company's common stock of $30.48 and $63.34 on December 30, 2011 and December 31, 2010, respectively, the total pretax intrinsic value of all outstanding RSUs as of January 1, 2012 and January 2, 2011 was $145.5 million and $125.6 million, respectively. Total fair value of RSUs vested was $30.2 million, $16.4 million, and $8.0 million for the years ended January 1, 2012, January 2, 2011, and January 3, 2010, respectively.
Warrants
During the year ended January 1, 2012, the remaining warrants assumed by the Company in a prior acquisition to purchase approximately 505,000 shares of the Company's common stock were exercised, resulting in cash proceeds to the Company of approximately $5.5 million. As of January 1,December 30, 2012, warrants exercisable, on a cashless basis, for up to approximately 18,322,000 shares of common stock were outstanding with an exercise price of $31.435. These warrants were sold to counterparties to the Company'sCompany’s convertible note hedge transactions in connection with the offering of the Company'sCompany’s 2014 Notes, with the proceeds of such warrants used by the Company to partially offset the cost of such hedging transactions. All outstanding warrants expire in equal installments during the 40 consecutive scheduled trading days beginning on May 16, 2014.
During the year ended January 1, 2012, the remaining warrants assumed by the Company in a prior acquisition to purchase approximately 505,000 shares of the Company’s common stock were exercised, resulting in cash proceeds to the Company of approximately $5.5 million.
Share Repurchases
On April 18, 2012, the Company’s Board of Directors authorized a $250 million stock repurchase program to be effected via a combination of Rule 10b5-1 and discretionary share repurchase programs. During the year ended December 30, 2012, the Company repurchased approximately 1,860,000 shares for $82.5 million.
In August 2011, the Company'sCompany’s board of directors authorized a $100 million discretionary repurchase program. During the year ended January 1, 2012,, the Company utilized the authorized amount in its entirety and repurchased approximately 1,894,000 shares under this program.
Concurrently with the issuance of the Company'sCompany’s 2016 Notes in March 2011, approximately 4,890,5004,891,000 shares were repurchased for
ILLUMINA, INC.
NOTES TO CONSOLIDATED FINANCIAL STATEMENTS — (Continued)
$314.3 million.
In July 2010, the Company'sCompany’s board of directors authorized a $200 million stock repurchase program, with $100 million allocated to repurchasing Company common stock under a 10b5-1 plan over a 12twelve month period and $100 million allocated to repurchasing Company common stock at management'smanagement’s discretion during open trading windows. During the year ended January 1, 2012,, the Company repurchased approximately 2,438,000 shares for $156.0 million. The authorized repurchase amount had been utilized completely as of January 1, 2012.
In November 2009, upon the completion of the $75.0 million repurchase program authorized by the Company's board of directors in July 2009, our board of directors authorized an additional $100.0 million stock repurchase program. In fiscal 2009, the Company repurchased a total of 6.1 million shares for $175.1 million, under both programs in open-market transactions or through privately negotiated transactions in compliance with Rule 10b-18 under the Securities Exchange Act of 1934. This program expired at the end of 2009.2012.
Stockholder Rights Plan
In connection with the unsolicited tender offer by Roche (refer to note “12. Unsolicited Tender Offer”), on January 25, 2012, the Company’s Board of Directors declared a dividend of one preferred share purchase right (Right) for each outstanding share of the Company’s common stock. Each Right entitles the registered holder to purchase from the Company one one-thousandth of a share of the Company’s Series A Junior Participating Preferred Stock, par value $0.01 per share (Preferred Shares), at a price of $275.00 per one thousandth of a Preferred Share, subject to adjustment. The Rights will not be exercisable until such time, if ever, that the Board of Directors determines to eliminate its deferral of the date on which separate Rights certificates are issued and the Rights trade separately from the Company’s common stock (Distribution Date). If a person or group (triggering party) acquires 15% or more of the Company’s outstanding common stock, each Right will entitle holders other than the triggering party to purchase, at the exercise price of the Right, a number of shares of common stock having a market value of two times the exercise price of the Right. If the Company is acquired in a merger or other business combination transaction after a person acquires 15% or more of the Company’s common stock, each Right will entitle holders other than the triggering party to purchase, at the Right’s then-current exercise price, a number of common shares of the acquiring company that at the time of such transaction have a market value of two times the exercise price of the Right. The Board of Directors will be entitled to redeem the Rights at a price of $0.001 per Right at any time before the Distribution Date. The Board of Directors will also be entitled to exchange the Rights at an exchange ratio per Right of one share of common stock after any person acquires beneficial ownership of 15% or more of the Company’s outstanding common stock, and prior to the acquisition of 50% or more of the Company’s outstanding common stock. The Rights will expire on January 26, 2017.
On May 3, 2001, the board of directors of the Company declared a dividend of one preferred share purchase right (a Right)(Right) for each outstanding share of common stock of the Company. The dividend was payable on May 14, 2001 to the stockholders of record on that date. Each Right entitles the registered holder to purchase from the Company one unit consisting of one thousandth of a share of its Series A Junior Participating Preferred Stock at a price of $100 per unit. The Rights will be exercisable if a person or group hereafter acquires beneficial ownership of 15% or more of the outstanding common stock of the Company or announces an offer for 15% or more of the outstanding common stock. If a person or group acquires 15% or
ILLUMINA, INC.
NOTES TO CONSOLIDATED FINANCIAL STATEMENTS — (Continued)
more of the outstanding common stock of the Company, each Right will entitle its holder to purchase, at the exercise price of the Right, a number of shares of common stock having a market value of two times the exercise price of the Right. If the Company is acquired in a merger or other business combination transaction after a person acquires 15% or more of the Company’s common stock, each Right will entitle its holder to purchase, at the Right’s then-current exercise price, a number of common shares of the acquiring company which at the time of such transaction have a market value of two times the exercise price of the Right. The board of directors will be entitled to redeem the Rights at a price of $0.01 per Right at any time before any such person acquires beneficial ownership of 15% or more of the outstanding common stock. The Rights expired on May 14, 2011.
On January 25, 2012, the board of directors of the Company declared a dividend of one preferred share purchase right (a Right) for each outstanding share of common stock of the Company. Each Right entitles the registered holder to purchase from the Company one one-thousandth of a share of Series A Junior Participating Preferred Stock of the Company, par value $0.01 per share (the Preferred Shares), at a price of $275.00 per one one thousandth of a Preferred Share, subject to adjustment. The Rights will not be exercisable until such time, if ever, that the board of directors determines to eliminate its deferral of the date on which separate Rights certificates are issued and the Rights trade separately from the Company's common stock (the Distribution Date). If a person or group acquires 15% or more of the outstanding common stock of the Company, each Right will entitle its holder to purchase, at the exercise price of the Right, a number of shares of common stock having a market value of two times the exercise price of the Right. If the Company is acquired in a merger or other business combination transaction after a person acquires 15% or more of the Company’s common stock, each Right will entitle its holder to purchase, at the Right’s then-current exercise price, a number of common shares of the acquiring company which at the time of such transaction have a market value of two times the exercise price of the Right. The board of directors will be entitled to redeem the Rights at a price of $0.001 per Right at any time before the Distribution Date. The board of directors will also be entitled to exchange the Rights at an exchange ratio per Right of one share of common stock after any person acquires beneficial ownership of 15% or more of the outstanding common stock of the Company, and prior to the acquisition of 50% or more of the outstanding common stock of the Company. The Rights will expire on January 26, 2017.
The Company is involved in various lawsuits and claims arising in the ordinary course of business, including actions with respect to intellectual property, employment, and contractual matters. In connection with these matters, the Company assesses, contingencies to determineon a regular basis, the degree of probability and range of possible loss for potential accrualbased on the developments in its financial statements. An estimated loss contingencythese matters. A liability is accruedrecorded in the financial statements if it is believed to be probable that a liabilityloss has been incurred and the amount of the loss can be reasonably estimated. During the year ended December 30, 2012, the Company recorded a legal contingency loss of $3.0 million in aggregate within cost of product revenue. Because litigation is inherently unpredictable and unfavorable resolutions could occur, assessing contingencies is highly subjective and requires judgments about future events. The Company regularly
reviews contingenciesits outstanding legal matters to determine the adequacy of the accrualsliabilities accrued and related disclosures. The amount of ultimate loss may differ from these estimates. Each matter presents its own unique circumstances, and prior litigation does not necessarily provide a reliable basis on which to predict the outcome, or range of outcomes, in any individual proceeding. Because of the uncertainties related to the occurrence, amount, and range of loss on any pending litigation or claim, management is currently unable to predict their ultimate outcome, and, with respect to determine whether aany pending litigation or claim where no liability has been incurred, oraccrued, to make a meaningful estimate of the reasonably possible loss or range of loss that could result from an unfavorable outcome. The Company believes, however,In the event that the liability, ifopposing litigants in outstanding litigations or claims ultimately succeed at trial and any resulting fromsubsequent appeals on their claims, any potential loss or charges in excess of any established accruals, individually or in the aggregate, amount of losses for any outstanding litigation or claim will notcould have a material adverse effect on the Company’s consolidatedbusiness, financial position, liquidity, orcondition, results of operations.operations, and/or cash flows in the period in which the unfavorable outcome occurs or becomes probable, and potentially in future periods.
On November 24, 2010, Syntrix Biosystems, Inc. filed suit against the Company in the United States District Court for the Western District of Washington at Tacoma (Case No. C10-5870-BHS) alleging that the Company willfully infringed U.S. Patent No. 6,951,682 by selling its BeadChip array products, and that the Company misappropriated Syntrix’s trade secrets. Fact and expert discovery is complete in the case. In November and December 2012, the Company filed motions for summary judgment that the patent is not infringed and is invalid, and that Syntrix’s trade secrets claims are barred by various statutes of limitation. Syntrix filed a motion for summary judgment that the patent is valid. On January 30, 2013, the court granted the Company’s motion for summary judgment on Syntrix’s trade secret claims, and dismissed those claims from the case. The court denied Syntrix’s motion for summary judgment on validity, and denied the Company’s motion for summary judgment for non-infringement and invalidity. A trial is scheduled to begin on February 26, 2013.
The Company has thoroughly investigated Syntrix’s claims and believes the claims are without merit. While the Company believes there is no legal basis for its alleged liability, the Company cannot estimate the possible loss or range of possible loss as there are significant legal and factual issues to be resolved. For example, each party has filed motions seeking to exclude portions of the other party’s expert testimony and to preclude the other party from introducing certain other evidence at trial. In addition to post-trial briefing, the parties would likely engage in appellate motion practice, the result of which is also unpredictable and could significantly affect the outcome of the case.
| |
| 12. | Unsolicited Tender Offer |
On January 27, 2012, CKH Acquisition Corporation and Roche Holding Ltd. (together, “Roche”) commenced an unsolicited tender offer (Offer) to purchase all outstanding shares of the Company’s common stock for $44.50 per share. As more fully described in the Company’s Solicitation/Recommendation on Schedule 14D-9 filed with the SEC on February 7, 2012 in response to the Offer, the Company’s Board of Directors unanimously recommended that the Company’s stockholders reject the Offer and not tender their shares to Roche for purchase.
On March 28, 2012, Roche revised the Offer to purchase all outstanding shares of the Company’s common stock for $51.00 per share. As more fully described in the Amendment No. 11 to Solicitation/Recommendation on Schedule 14D-9 filed
ILLUMINA, INC.
NOTES TO CONSOLIDATED FINANCIAL STATEMENTS — (Continued)
with the SEC on April 2, 2012 in response to the revised Offer, the Company’s Board of Directors unanimously recommended that the Company’s stockholders reject the Roche offer and not tender their shares to Roche for purchase. The Offer expired, without being extended, on April 20, 2012.
During the year ended December 30, 2012, the Company recorded $23.1 million in expenses in relation to the Offer, such expenses consisting primarily of legal, advisory, proxy solicitation, and other professional services fees.
The income (loss) before income taxes summarized by region is as follows (in thousands):
| | | | Years Ended | Years Ended |
| | January 1,
2012 | | January 2,
2011 | | January 3,
2010 | December 30,
2012 | | January 1,
2012 | | January 2,
2011 |
| United States | $ | (7,100 | ) | | $ | 109,068 |
| | $ | 65,081 |
| $ | 102,296 |
| | $ | (7,100 | ) | | $ | 109,068 |
|
| Foreign | 140,145 |
| | 76,311 |
| | 49,044 |
| 120,312 |
| | 140,145 |
| | 76,311 |
|
| Total income before income taxes | $ | 133,045 |
| | $ | 185,379 |
| | $ | 114,125 |
| $ | 222,608 |
| | $ | 133,045 |
| | $ | 185,379 |
|
The provision for income taxes consists of the following (in thousands):
| | | | Years Ended | Years Ended |
| | January 1,
2012 | | January 2,
2011 | | January 3,
2010 | December 30,
2012 | | January 1,
2012 | | January 2,
2011 |
| Current: | |
| | |
| | |
| |
| | |
| | |
|
| Federal | $ | 43,161 |
| | $ | 39,476 |
| | $ | 43,565 |
| $ | 57,285 |
| | $ | 43,161 |
| | $ | 39,476 |
|
| State | 3,958 |
| | 8,607 |
| | 2,511 |
| 10,121 |
| | 3,958 |
| | 8,607 |
|
| Foreign | 24,154 |
| | 6,330 |
| | 6,204 |
| 31,504 |
| | 24,154 |
| | 6,330 |
|
| Total current provision | 71,273 |
| | 54,413 |
| | 52,280 |
| 98,910 |
| | 71,273 |
| | 54,413 |
|
| Deferred: | |
| | |
| | |
| |
| | |
| | |
|
| Federal | (22,738 | ) | | 6,557 |
| | (14,607 | ) | (7,724 | ) | | (22,738 | ) | | 6,557 |
|
| State | (8,050 | ) | | (6,808 | ) | | 5,184 |
| (7,708 | ) | | (8,050 | ) | | (6,808 | ) |
| Foreign | 5,932 |
| | 6,326 |
| | (1,013 | ) | (12,124 | ) | | 5,932 |
| | 6,326 |
|
| Total deferred provision (benefit) | (24,856 | ) | | 6,075 |
| | (10,436 | ) | |
| Total deferred (benefit) provision | | (27,556 | ) | | (24,856 | ) | | 6,075 |
|
| Total tax provision | $ | 46,417 |
| | $ | 60,488 |
| | $ | 41,844 |
| $ | 71,354 |
| | $ | 46,417 |
| | $ | 60,488 |
|
The provision for income taxes reconciles to the amount computed by applying the federal statutory rate to income before taxes as follows (in thousands):
ILLUMINA, INC.
NOTES TO CONSOLIDATED FINANCIAL STATEMENTS — (Continued)
| | | | Years Ended | Years Ended |
| | January 1,
2012 | | January 2,
2011 | | January 3,
2010 | December 30,
2012 | | January 1,
2012 | | January 2,
2011 |
| Tax at federal statutory rate | $ | 46,566 |
| | $ | 64,881 |
| | $ | 39,944 |
| $ | 77,913 |
| | $ | 46,566 |
| | $ | 64,881 |
|
| State, net of federal benefit | (49 | ) | | 6,231 |
| | 4,275 |
| 4,056 |
| | (49 | ) | | 6,231 |
|
| Research and other credits | (6,774 | ) | | (5,859 | ) | | (4,050 | ) | (2,766 | ) | | (6,774 | ) | | (5,859 | ) |
| Acquired in-process research & development | 1,989 |
| | 517 |
| | 4,386 |
| 137 |
| | 1,989 |
| | 517 |
|
| Change in valuation allowance | (688 | ) | | (9,497 | ) | | (1,967 | ) | (37 | ) | | (688 | ) | | (9,497 | ) |
| Permanent differences | 1,668 |
| | 1,397 |
| | 2,093 |
| 2,380 |
| | 1,668 |
| | 1,397 |
|
| Change in fair value of contingent consideration | (1,311 | ) | | (3,632 | ) | | — |
| — |
| | (1,311 | ) | | (3,632 | ) |
| Impact of foreign operations | 5,579 |
| | 7,597 |
| | (5,400 | ) | (10,644 | ) | | 5,579 |
| | 7,597 |
|
| Other | (563 | ) | | (1,147 | ) | | 2,563 |
| 315 |
| | (563 | ) | | (1,147 | ) |
| Total tax provision | $ | 46,417 |
| | $ | 60,488 |
| | $ | 41,844 |
| $ | 71,354 |
| | $ | 46,417 |
| | $ | 60,488 |
|
Significant components of the Company’s deferred tax assets and liabilities are as follows (in thousands):
| | | | January 1,
2012 | | January 2,
2011 | December 30,
2012 | | January 1,
2012 |
| Deferred tax assets: | |
| | |
| |
| | |
|
| Net operating losses | $ | 4,981 |
| | $ | 11,898 |
| $ | 2,564 |
| | $ | 4,981 |
|
| Tax credits | 16,647 |
| | 18,329 |
| 16,447 |
| | 16,647 |
|
| Other accruals and reserves | 22,411 |
| | 17,616 |
| 47,306 |
| | 22,411 |
|
| Stock compensation | 33,811 |
| | 23,829 |
| 39,175 |
| | 33,811 |
|
| Inventory adjustments | 16,469 |
| | 5,573 |
| 8,977 |
| | 16,469 |
|
| Impairment of cost-method investment | 4,972 |
| | 5,058 |
| 1,406 |
| | 4,972 |
|
| Other amortization | 4,521 |
| | 4,893 |
| 5,195 |
| | 4,521 |
|
| Other | 8,861 |
| | 3,588 |
| 13,469 |
| | 8,861 |
|
| Total gross deferred tax assets | 112,673 |
| | 90,784 |
| 134,539 |
| | 112,673 |
|
| Valuation allowance on deferred tax assets | (1,799 | ) | | (4,986 | ) | (1,756 | ) | | (1,799 | ) |
| Total deferred tax assets | 110,874 |
| | 85,798 |
| 132,783 |
| | 110,874 |
|
| Deferred tax liabilities: | |
| | |
| |
| | |
|
| Purchased intangible amortization | (19,760 | ) | | (22,605 | ) | (20,116 | ) | | (19,760 | ) |
| Convertible debt | (49,404 | ) | | (3,191 | ) | (38,910 | ) | | (49,404 | ) |
| Property and equipment | | (10,867 | ) | | (4,369 | ) |
| Other | (12,322 | ) | | (7,137 | ) | (6,682 | ) | | (7,953 | ) |
| Total deferred tax liabilities | (81,486 | ) | | (32,933 | ) | (76,575 | ) | | (81,486 | ) |
| Net deferred tax assets | $ | 29,388 |
| | $ | 52,865 |
| $ | 56,208 |
| | $ | 29,388 |
|
A valuation allowance is established when it is more likely than not the future realization of all or some of the deferred tax assets will not be achieved. The evaluation of the need for a valuation allowance is performed on a jurisdiction-by-jurisdiction basis, and includes a review of all available positive and negative evidence. During the year ended January 1, 2012, the valuation allowance decreased by $3.2 million primarily due to the dissolution of a dormant foreign subsidiary that was finalized during the fourth quarter. Based on the available evidence as of January 1,December 30, 2012, the Company was not able to conclude it is more likely than not certain U.S. and foreign deferred tax assets will be realized. Therefore, the Company recorded a valuation allowance of $1.8 million against certain U.S. deferred tax assets.
As of January 1,December 30, 2012, the Company had net operating loss carryforwards for federal and state tax purposes of $25.216.8 million and $162.0117.8 million, respectively, which will begin to expire in 2020 and 2013, respectively, unless utilized prior.2015, respectively. In addition, the Company also had U.S. federal and state research and development tax credit carryforwards of $11.0 million and $34.339.7 million, respectively, which will begin to expire in 2028 and 2019 respectively, unless utilized prior..
ILLUMINA, INC.
NOTES TO CONSOLIDATED FINANCIAL STATEMENTS — (Continued)
Pursuant to Section 382 and 383 of the Internal Revenue Code, utilization of the Company’s net operating loss and credits may be subject to annual limitations in the event of any significant future changes in its ownership structure. These annual limitations may result in the expiration of net operating losses and credits prior to utilization. The deferred tax assets as of January 1,December 30, 2012 are net of any previous limitations due to Section 382 and 383.
The Company recognizes excess tax benefits associated with share-based compensation to stockholders’ equity only when realized. When assessing whether excess tax benefits relating to share-based compensation have been realized, the Company follows the with-and-without approach excluding any indirect effects of the excess tax deductions. Under this approach, excess tax benefits related to share-based compensation are not deemed to be realized until after the utilization of all other tax benefits available to the Company. During the year ended January 1,December 30, 2012, the Company realized $43.117.0 million of such excess tax benefits, and accordingly recorded a corresponding credit to additional paid in capital. As of January 1,December 30, 2012, the Company has $12.89.8 million of unrealized excess tax benefits associated with share-based compensation. These tax benefits will be accounted for as a credit to additional paid-in capital, if and when realized, rather than a reduction of the provision for income taxes.
The Company’s manufacturing operations in Singapore operate under various tax holidays and incentives that begin to expire in 2018. For the year ended January 1,December 30, 2012, these tax holidays and incentives resulted in an approximate $4.410.2 million decrease to the provision for income taxes and an increase to net income per diluted share of $0.030.08.
It is the Company'sCompany’s intention to indefinitely reinvest all current and future foreign earnings in order to ensure sufficient working capital and expand existing operations outside the United States. Accordingly, residual U.S. income taxes have not been provided on $102.8185.6 million of undistributed earnings of foreign subsidiaries as of January 1,December 30, 2012. In the event the Company was required to repatriate funds from outside of the United States, such repatriation would be subject to local laws, customs, and tax consequences.
The following table summarizes the gross amount of the Company’s uncertain tax positions (in thousands):
| | | | January 1,
2012 | | January 2,
2011 | | January 3,
2010 | December 30,
2012 | | January 1,
2012 | | January 2,
2011 |
| Balance at beginning of year | $ | 22,729 |
| | $ | 11,760 |
| | $ | 9,402 |
| $ | 28,396 |
| | $ | 22,729 |
| | $ | 11,760 |
|
| Increases related to prior year tax positions | 875 |
| | 5,066 |
| | — |
| 2,573 |
| | 875 |
| | 5,066 |
|
| Decreases related to prior year tax positions | (382 | ) | | — |
| | — |
| (69 | ) | | (382 | ) | | — |
|
| Increases related to current year tax positions | 5,174 |
| | 5,903 |
| | 2,358 |
| 6,685 |
| | 5,174 |
| | 5,903 |
|
| Balance at end of year | $ | 28,396 |
| | $ | 22,729 |
| | $ | 11,760 |
| $ | 37,585 |
| | $ | 28,396 |
| | $ | 22,729 |
|
Included in the balance of uncertain tax positions as of December 30, 2012, and January 1, 2012 and January 2, 2011 are $23.429.9 million and $18.323.4 million, respectively, of net unrecognized tax benefits that, if recognized, would reduce the Company'sCompany’s effective income tax rate in future periods.
The Company does not expect its uncertain tax positions to change significantly over the next 12 months. Any interest and penalties related to uncertain tax positions are reflected in the provision for income tax expense. During 2011, thetaxes. The Company recognized expenses of$0.8 million and $1.1 million related to potential interest and penalties on uncertain tax positions.positions during the years ended December 30, 2012 and January 1, 2012, respectively. A minimal amount was recognized in 2010 for potential interest and penalties on uncertain tax positions. The Company recorded a liability for potential interest and penalties of $2.1 million and $1.2 million as of December 30, 2012 and January 1, 2012 and the liability was minimal as of January 2, 2011., respectively. Tax years 1997 to 20112012 remain subject to future examination by the major tax jurisdictions in which the Company is subject to tax.
| |
| 14. | Employee Benefit Plans |
Retirement Plan
The Company has a 401(k) savings plan covering substantially all of its employees.employees in the United States. Company contributions to the plan are discretionary. During the years ended January 1,December 30, 2012, January 2, 20111, 2012, and January 3, 20102, 2011, the Company made matching contributions of $5.5 million, $5.3 million, and $4.2 million, and $3.3 million, respectively.
Deferred Compensation Plan
ILLUMINA, INC.
NOTES TO CONSOLIDATED FINANCIAL STATEMENTS — (Continued)
Deferred Compensation Plan
The Company adopted the Illumina, Inc. Deferred Compensation Plan (the Plan) that became effective January 1, 2008. Eligible participants, which include the Company’s senior level employees and members of the board of directors, can contribute up to 80% of their base salary and 100% of all other forms of compensation into the Plan, including bonus, equity awards, commission, and director fees. The Company has agreed to credit the participants’ contributions with earnings that reflect the performance of certain independent investment funds. On a discretionary basis, the Company may also make employer contributions to participant accounts in any amount determined by the Company. The vesting schedules of employer contributions are at the sole discretion of the Compensation Committee. However, all employer contributions shall become 100% vested upon the occurrence of the participant’s disability, death or retirement or a change in control of the Company. The benefits under this plan are unsecured. Participants are generally eligible to receive payment of their vested benefit at the end of their elected deferral period or after termination of their employment with the Company for any reason or at a later date to comply with the restrictions of Section 409A. As of January 1,December 30, 2012, no employer contributions were made to the Plan.
In January 2008, the Company also established a rabbi trust for the benefit of the participants under the Plan. In accordance with authoritative guidance related to consolidation of variable interest entities and accounting for deferred compensation arrangements where amounts earned are held in a rabbi trust and invested, the Company has included the assets of the rabbi trust in its consolidated balance sheet since the trust’s inception. As of January 1,December 30, 2012 and January 2, 20111, 2012, the assets of the trust were $10.813.6 million and $6.410.8 million, respectively, and liabilities of the Company were $9.012.1 million and $5.39.0 million, respectively. The assets and liabilities are classified as other assets and accrued liabilities, respectively, on the Company’s consolidated balance sheets. Changes in the values of the assets held by the rabbi trust are recorded in other (expense) income, net in the consolidated statement of income, and changes in the values of the deferred compensation liabilities are recorded in selling, general and administrativecost of sales or operating expenses.
| |
| 15. | Segment Information, Geographic Data, and Significant Customers |
The Company is organized in two operating segments: Life Sciences and Diagnostics. Life Sciences operating segment includes all products and services related to the research market, namely the product lines based on the Company’s sequencing, BeadArray, VeraCode, and real-time PCR technologies. The Diagnostics operating segment focuses on the emerging opportunity in molecular diagnostics. During all periods presented, the Diagnostics operating segment had limited activity. Accordingly, the Company’s operating results for both units were reported on an aggregate basis as one reportable segment. The Company will begin reporting in two segments once revenues, operating profit or loss, or assets of the Diagnostics operating segment exceeds 10% of the consolidated amounts.
The Company had revenue in the following regions for the years ended January 1,December 30, 2012, January 2, 20111, 2012, and January 3, 20102, 2011 (in thousands):
| | | | Years Ended | Years Ended |
| | January 1,
2012 | | January 2,
2011 | | January 3,
2010 | December 30,
2012 | | January 1,
2012 | | January 2,
2011 |
| United States | $ | 528,723 |
| | $ | 498,981 |
| | $ | 347,195 |
| $ | 568,443 |
| | $ | 528,723 |
| | $ | 498,981 |
|
| United Kingdom | 67,578 |
| | 60,521 |
| | 55,854 |
| 81,678 |
| | 67,578 |
| | 60,521 |
|
| Other European countries | 210,393 |
| | 163,062 |
| | 140,931 |
| 209,726 |
| | 210,393 |
| | 163,062 |
|
| Asia-Pacific | 197,005 |
| | 143,441 |
| | 96,396 |
| 232,498 |
| | 197,005 |
| | 143,441 |
|
| Other markets | 51,836 |
| | 36,736 |
| | 25,948 |
| 56,171 |
| | 51,836 |
| | 36,736 |
|
| Total | $ | 1,055,535 |
| | $ | 902,741 |
| | $ | 666,324 |
| $ | 1,148,516 |
| | $ | 1,055,535 |
| | $ | 902,741 |
|
Net revenues are attributable to geographic areas based on the region of destination.
The majority of our product sales consist of consumables and instruments. For the years ended December 30, 2012, January 1, 2012, and January 2, 2011, and January 3, 2010, consumable sales represented 56%64%, 56%, and 59%56%, respectively, of total revenues and instrument sales comprised 35%27%, 36%35%, and 34%36%, respectively, of total revenues. The Company’s customers include leading genomic research centers, academic institutions, government laboratories, and clinical research organizations, as well as pharmaceutical, biotechnology, agrigenomics, and consumer genomics companies.companies, and in vitro fertilization clinics. The
ILLUMINA, INC.
NOTES TO CONSOLIDATED FINANCIAL STATEMENTS — (Continued)
Company had no customers that provided more than 10% of total revenue in the years ended January 1,December 30, 2012, January 2, 20111, 2012, and January 3, 20102, 2011.
ILLUMINA, INC.
NOTES TO CONSOLIDATED FINANCIAL STATEMENTS — (Continued)
Net long-lived assets exclude goodwill and other intangible assets since they are not allocated on a geographic basis. The Company had net long-lived assets consisting of property and equipment in the following regions as of January 1,December 30, 2012 and January 2, 20111, 2012 (in thousands):
| | | | January 1,
2012 | | January 2,
2011 | December 30,
2012 | | January 1,
2012 |
| United States | $ | 94,624 |
| | $ | 75,050 |
| $ | 126,749 |
| | $ | 94,624 |
|
| United Kingdom | 22,642 |
| | 26,578 |
| 21,740 |
| | 22,642 |
|
| Singapore | 14,673 |
| | 14,739 |
| 12,504 |
| | 14,673 |
|
| Other countries | 11,544 |
| | 13,507 |
| 5,174 |
| | 11,544 |
|
| Total | $ | 143,483 |
| | $ | 129,874 |
| $ | 166,167 |
| | $ | 143,483 |
|
| |
| 16. | Quarterly Financial Information (unaudited) |
The following financial information reflects all normal recurring adjustments, except as noted below, which are, in the opinion of management, necessary for a fair statement of the results and cash flows of interim periods. All quarters for fiscal years 20112012 and 20102011 endedDecember 30, 2012 and January 1, 2012 and January 2, 2011, respectively were 13 weeks. Summarized quarterly data for fiscal years 20112012 and 20102011 are as follows (in thousands except per share data):
| | | | First Quarter | | Second Quarter | | Third Quarter | | Fourth Quarter | First Quarter | | Second Quarter | | Third Quarter | | Fourth Quarter |
| 2012: | | |
| | |
| | |
| | |
|
| Total revenue | | $ | 272,770 |
| | $ | 280,607 |
| | $ | 285,874 |
| | $ | 309,265 |
|
| Gross profit | | 181,011 |
| | 192,997 |
| | 195,873 |
| | 203,647 |
|
| Net income | | 26,202 |
| | 23,401 |
| | 29,748 |
| | 71,903 |
|
| Net income per share, basic | | 0.21 |
| | 0.19 |
| | 0.24 |
| | 0.58 |
|
| Net income per share, diluted | | 0.20 |
| | 0.18 |
| | 0.22 |
| | 0.53 |
|
| 2011: | |
| | |
| | |
| | |
| | | | | | | |
| Total revenue | $ | 282,515 |
| | $ | 287,450 |
| | $ | 235,499 |
| | $ | 250,071 |
| $ | 282,515 |
| | $ | 287,450 |
| | $ | 235,499 |
| | $ | 250,071 |
|
| Gross profit | 188,041 |
| | 193,356 |
| | 157,115 |
| | 170,586 |
| 188,041 |
| | 193,356 |
| | 157,115 |
| | 170,586 |
|
| Net income | 24,137 |
| | 30,620 |
| | 20,151 |
| | 11,720 |
| 24,137 |
| | 30,620 |
| | 20,151 |
| | 11,720 |
|
| Net income per share, basic | 0.19 |
| | 0.25 |
| | 0.17 |
| | 0.10 |
| 0.19 |
| | 0.25 |
| | 0.17 |
| | 0.10 |
|
| Net income per share, diluted | 0.16 |
| | 0.22 |
| | 0.15 |
| | 0.09 |
| 0.16 |
| | 0.22 |
| | 0.15 |
| | 0.09 |
|
| 2010: | | | | | | | | |
| Total revenue | $ | 192,131 |
| | $ | 212,003 |
| | $ | 237,309 |
| | $ | 261,298 |
| |
| Gross profit | 132,178 |
| | 146,091 |
| | 157,145 |
| | 166,126 |
| |
| Net income | 21,208 |
| | 29,796 |
| | 35,447 |
| | 38,440 |
| |
| Net income per share, basic | 0.18 |
| | 0.24 |
| | 0.28 |
| | 0.31 |
| |
| Net income per share, diluted | 0.16 |
| | 0.21 |
| | 0.24 |
| | 0.25 |
| |
On January 27, 2012, CKH Acquisition Corporation,6, 2013, the Company entered into a Delaware corporationdefinitive agreement to acquire Verinata Health, Inc. (Verinata), a leading provider of non-invasive tests for the early identification of fetal chromosomal abnormalities, for consideration of $350 million in cash and up to $100 million in milestone payments through 2015. In connection with the intended acquisition, the Company also agreed to provide bridge financing to Verinata for up to an indirect wholly-owned subsidiaryaggregate amount of Roche Holding Ltd, a joint stock company organized under$45 million in exchange for the lawsissuance of Switzerland (together, “Roche”), commenced an unsolicited tender offer (the "Offer") to purchase allsubordinated convertible promissory notes from Verinata. Any subordinated notes outstanding shares of common stockas of the consummation of the acquisition, net of Verinata’s cash on hand, will reduce the total cash payments to be made by the Company for $44.50 per share. As more fully described in the Company's Solicitation/Recommendation on Schedule 14D-9 filed with the SEC on February 7, 2012 in response to the Offer, the Board of Directors unanimously recommended that the Company's stockholders reject the Roche offer and not tender their shares to Roche for purchase.at closing.
ITEM 9. Changes In and Disagreements with Accountants on Accounting and Financial Disclosure.
None.
| |
| ITEM 9A. | Controls and Procedures. |
We design our internal controls to provide reasonable assurance that (1) our transactions are properly authorized; (2) our assets are safeguarded against unauthorized or improper use; and (3) our transactions are properly recorded and reported in conformity with U.S. generally accepted accounting principles. We also maintain internal controls and procedures to ensure that we comply with applicable laws and our established financial policies.
Based on management’s evaluation (under the supervision and with the participation of our chief executive officer (CEO) and chief financial officer (CFO)), as of the end of the period covered by this report, our CEO and CFO concluded that our disclosure controls and procedures (as defined in Rules 13a-15(e) and 15d-15(e) under the Securities Exchange Act of 1934, as amended (the Exchange Act)), are effective to provide reasonable assurance that information required to be disclosed by us in reports that we file or submit under the Exchange Act is recorded, processed, summarized, and reported within the time periods specified in SEC rules and forms, and is accumulated and communicated to management, including our principal executive officer and principal financial officer, as appropriate, to allow timely decisions regarding required disclosure.
During the fourth quarter of 2011,2012, there were no changes in our internal control over financial reporting (as defined in Rules 13a-15(f) and 15d-15(f) of the Exchange Act) that materially affected or are reasonably likely to materially affect internal control over financial reporting.
An evaluation was also performed under the supervision and with the participation of our management, including our chief executive officer and chief financial officer, of any change in our internal control over financial reporting that occurred during the fourth quarter of 20112012 and that has materially affected, or is reasonably likely to materially affect, our internal control over financial reporting. The evaluation did not identify any such change.
MANAGEMENT’S REPORT ON INTERNAL CONTROL OVER FINANCIAL REPORTING
Our management is responsible for establishing and maintaining adequate internal control over financial reporting, as such term is defined in Exchange Act Rules 13a-15(f). Because of its inherent limitations, internal control over financial reporting may not prevent or detect all misstatements. Therefore, even those systems determined to be effective can provide only reasonable assurance with respect to financial statement preparation and presentation.
We conducted an evaluation of the effectiveness of our internal control over financial reporting based on the framework in Internal Control — Integrated Framework issued by the Committee of Sponsoring Organizations of the Treadway Commission. Based on our evaluation under the framework in Internal Control — Integrated Framework, our management concluded that our internal control over financial reporting was effective as of January 1,December 30, 2012. The effectiveness of our internal control over financial reporting as of January 1,December 30, 2012 has been audited by Ernst & Young LLP, an independent registered public accounting firm, as stated in their report which is included herein.
REPORT OF INDEPENDENT REGISTERED PUBLIC ACCOUNTING FIRM
The Board of Directors and Stockholders of
Illumina, Inc.
We have audited Illumina, Inc.’s internal control over financial reporting as of January 1,December 30, 2012, based on criteria established in Internal Control — Integrated Framework issued by the Committee of Sponsoring Organizations of the Treadway Commission (the COSO criteria). Illumina, Inc.’s management is responsible for maintaining effective internal control over financial reporting, and for its assessment of the effectiveness of internal control over financial reporting included in the accompanying Management’s Report on Internal Control over Financial Reporting. Our responsibility is to express an opinion on the company’s internal control over financial reporting based on our audit.
We conducted our audit in accordance with the standards of the Public Company Accounting Oversight Board (United States). Those standards require that we plan and perform the audit to obtain reasonable assurance about whether effective internal control over financial reporting was maintained in all material respects. Our audit included obtaining an understanding of internal control over financial reporting, assessing the risk that a material weakness exists, testing and evaluating the design and operating effectiveness of internal control based on the assessed risk, and performing such other procedures as we considered necessary in the circumstances. We believe that our audit provides a reasonable basis for our opinion.
A company’s internal control over financial reporting is a process designed to provide reasonable assurance regarding the reliability of financial reporting and the preparation of financial statements for external purposes in accordance with generally accepted accounting principles. A company’s internal control over financial reporting includes those policies and procedures that (1) pertain to the maintenance of records that, in reasonable detail, accurately and fairly reflect the transactions and dispositions of the assets of the company; (2) provide reasonable assurance that transactions are recorded as necessary to permit preparation of financial statements in accordance with generally accepted accounting principles, and that receipts and expenditures of the company are being made only in accordance with authorizations of management and directors of the company; and (3) provide reasonable assurance regarding prevention or timely detection of unauthorized acquisition, use or disposition of the company’s assets that could have a material effect on the financial statements.
Because of its inherent limitations, internal control over financial reporting may not prevent or detect misstatements. Also, projections of any evaluation of effectiveness to future periods are subject to the risk that controls may become inadequate because of changes in conditions, or that the degree of compliance with the policies or procedures may deteriorate.
In our opinion, Illumina, Inc. maintained, in all material respects, effective internal control over financial reporting as of January 1,December 30, 2012, based on the COSO criteria.
We also have audited, in accordance with the standards of the Public Company Accounting Oversight Board (United States), the accompanying consolidated balance sheets of Illumina, Inc. as of January 1,December 30, 2012 and January 2, 20111, 2012, and the related consolidated statements of income, comprehensive income, stockholders’ equity, and cash flows for each of the three fiscal years in the period ended January 1,December 30, 2012 of Illumina, Inc. and our report dated February 23, 201215, 2013 expressed an unqualified opinion thereon.
/s/ ERNST & YOUNG LLP
San Diego, California
February 23, 201215, 2013
| |
| ITEM 9B. | Other Information. |
None.
PART III
| |
| ITEM 10. | Directors, Executive Officers, and Corporate Governance. |
(a) Identification of Directors. Information concerning our directors is incorporated by reference from the section entitled “Proposal One: Election of Directors,” “Information About Directors,” “Director Compensation,” and “Board of Directors and Corporate Governance” to be contained in our definitive Proxy Statement with respect to our 20122013 Annual Meeting of Stockholders to be filed with the SEC no later than April 30, 2012.29, 2013.
(b) Identification of Executive Officers. Information concerning our executive officers is incorporated by reference from the section entitled “Executive Officers” to be contained in our definitive Proxy Statement with respect to our 20122013 Annual Meeting of Stockholders to be filed with the SEC no later than April 30, 2012.29, 2013.
(c) Compliance with Section 16(a) of the Exchange Act. Information concerning compliance with Section 16(a) of the Securities Exchange Act of 1934 is incorporated by reference from the section entitled “Section 16(a) Beneficial Ownership Reporting Compliance” to be contained in our definitive Proxy Statement with respect to our 20122013 Annual Meeting of Stockholders to be filed with the SEC no later than April 30, 2012.29, 2013.
(d) Information concerning the audit committee financial expert as defined by the SEC rules adopted pursuant to the Sarbanes-Oxley Act of 2002 is incorporated by reference from the section entitled “Board of Directors and Corporate Governance” to be contained in our definitive Proxy Statement with respect to our 20122013 Annual Meeting of Stockholders to be filed with the SEC no later than April 30, 2012.29, 2013.
Code of Ethics
We have adopted a code of ethics for our directors, officers, and employees, which is available on our website at www.illumina.com in the Corporate Governance portal of the Investor Relations section under “Company.” A copy of the Code of Ethics is available in print free of charge to any stockholder who requests a copy. Interested parties may address a written request for a printed copy of the Code of Ethics to: Corporate Secretary, Illumina, Inc., 5200 Illumina Way, San Diego, California 92122. We intend to satisfy the disclosure requirement regarding any amendment to, or a waiver from, a provision of the Code of Ethics for our principal executive officer, principal financial officer, principal accounting officer or controller, or persons performing similar functions, by posting such information on our website. The information on, or that can be accessed from, our website is not incorporated by reference into this report.
| |
| ITEM 11. | Executive Compensation. |
Information concerning executive compensation is incorporated by reference from the sections entitled “Compensation Discussion and Analysis,” “Director Compensation,” and “Executive Compensation” to be contained in our definitive Proxy Statement with respect to our 20122013 Annual Meeting of Stockholders to be filed with the SEC no later than April 30, 2012.29, 2013.
| |
| ITEM 12. | Security Ownership of Certain Beneficial Owners and Management and Related Stockholder Matters. |
Information concerning the security ownership of certain beneficial owners and management and information covering securities authorized for issuance under equity compensation plans is incorporated by reference from the sections entitled “Stock Ownership of Principal Stockholders and Management,” “Executive Compensation,” and “Equity Compensation Plan Information” to be contained in our definitive Proxy Statement with respect to our 20122013 Annual Meeting of Stockholders to be filed with the SEC no later than April 30, 2012.29, 2013.
| |
| ITEM 13. | Certain Relationships and Related Transactions, and Director Independence. |
Information concerning certain relationships and related transactions, and director independence is incorporated by reference from the sections entitled “Proposal One: Election of Directors,” “Information About Directors,” “Director Compensation,” “Executive Compensation,” and “Certain Relationships and Related Party Transactions” to be contained in our definitive Proxy Statement with respect to our 20122013 Annual Meeting of Stockholders to be filed with the SEC no later than April 30, 2012.29, 2013.
| |
| ITEM 14. | Principal Accountant Fees and Services. |
Information concerning principal accountant fees and services is incorporated by reference from the sections entitled “Proposal Two: Ratification of Appointment of Independent Registered Public Accounting Firm” and “Independent Registered Public Accountants” to be contained in our definitive Proxy Statement with respect to our 20122013 Annual Meeting of Stockholders to be filed with the SEC no later than April 30, 2012.29, 2013.
PART IV
| |
| ITEM 15. | Exhibits, Financial Statement Schedules. |
1. Financial Statements: See “Index to Consolidated Financial Statements” in Part II, Item 8 of this Form 10-K.
2. Financial Statement Schedule: See “Schedule II — Valuation and Qualifying Accounts and Reserves” in this section of this Form 10-K.
3. Exhibits: The exhibits listed in the accompanying index to exhibits are filed or incorporated by reference as part of this Form 10-K.
SCHEDULE II — VALUATION AND QUALIFYING ACCOUNTS AND RESERVES
| | | | Balance at Beginning of Period | | Additions Charged to Expense/ Revenue(1) | | Deductions(2) | | Balance at End of Period | Balance at Beginning of Period | | Additions Charged to Expense/ Revenue(1) | | Deductions(2) | | Balance at End of Period |
| | (In thousands) | (In thousands) |
| Year ended December 30, 2012 | | | | | | | | |
| Allowance for doubtful accounts | | $ | 3,997 |
| | 2,191 |
| | (1,908 | ) | | $ | 4,280 |
|
| Year ended January 1, 2012 | | | | | | | | |
| | |
| | |
| | |
|
| Allowance for doubtful accounts | $ | 1,686 |
| | 4,201 |
| | (1,890 | ) | | $ | 3,997 |
| $ | 1,686 |
| | 4,201 |
| | (1,890 | ) | | $ | 3,997 |
|
| Reserve for inventory | 12,273 |
| | 14,160 |
| | (11,935 | ) | | 14,498 |
| |
| Year ended January 2, 2011 | |
| | |
| | |
| | |
| |
| | |
| | |
| | |
|
| Allowance for doubtful accounts | $ | 1,398 |
| | 341 |
| | (53 | ) | | $ | 1,686 |
| $ | 1,398 |
| | 341 |
| | (53 | ) | | $ | 1,686 |
|
| Reserve for inventory | 10,597 |
| | 9,559 |
| | (7,883 | ) | | 12,273 |
| |
| Year ended January 3, 2010 | |
| | |
| | |
| | |
| |
| Allowance for doubtful accounts | $ | 1,138 |
| | 828 |
| | (568 | ) | | $ | 1,398 |
| |
| Reserve for inventory | 6,431 |
| | 8,403 |
| | (4,237 | ) | | 10,597 |
| |
| |
| (1) | Additions to the allowance for doubtful accounts and reserve for inventory are charged to selling, general and administrative expense and cost of product revenue respectively.expense. |
| |
| (2) | Deductions for allowance for doubtful accounts and reserve for inventory are for accounts receivable written off and disposal of obsolete inventory.off. |
INDEX TO EXHIBITS
|
| | | | | | | | | | | | | |
| | | | | Incorporated by Reference | | |
| Exhibit | | | | | | | | | | Filing | | Filed |
| Number | | Exhibit Description | | Form | | File Number | | Exhibit | | Date | | Herewith |
| 3.1 | | Amended and Restated Certificate of Incorporation | | 8-K | | 000-30361 | | 3.1 |
| | 9/23/2008 | | |
| 3.2 | | Amended and Restated Bylaws | | 8-K | | 000-30361 | | 3.2 |
| | 4/27/2010 | | |
| 3.3 | | Certificate of Designations of Series A Junior Participating Preferred Stock, as filed with the Secretary of State of the State of Delaware on January 26, 2012
| | 8-K | | 000-30361 | | 3.1 |
| | 1/26/2012 | | |
| 4.1 | | Specimen Common Stock Certificate | | S-1/A | | 333-33922 | | 4.1 |
| | 7/3/2000 | | |
| 4.2 | | Rights Agreement, dated as of January 26, 2012, between Illumina, Inc. and Computershare Trust Company, N.A., as Rights Agent
| | 8-K | | 000-30361 | | 4.1 |
| | 1/26/2012 | | |
| 4.3 | | Indenture related to the 0.625% Convertible Senior Notes due 2014, dated as of February 16, 2007, between Illumina and The Bank of New York, as trustee | | 8-K | | 000-30361 | | 4.1 |
| | 2/16/2007 | | |
| 4.4 | | Indenture related to the 0.25% Convertible Senior Notes due 2016, dated as of March 18, 2011, between Illumina and The Bank of New York Mellon Trust Company, N.A., as trustee | | 10-Q | | 000-30361 | | 4.1 |
| | 5/4/2011 | | |
| +10.1 | | Form of Indemnification Agreement between Illumina and each of its directors and executive officers | | 10-Q | | 000-30361 | | 10.55 |
| | 7/25/2008 | | |
| +10.2 | | Amended and Restated Change in Control Severance Agreement between Illumina and Jay T Flatley, dated October 22, 2008 | | 10-K | | 000-30361 | | 10.33 |
| | 2/26/2009 | | |
| +10.3 | | Form of Change in Control Severance Agreement between Illumina and each of its executive officers | | 10-K | | 000-30361 | | 10.34 |
| | 2/26/2009 | | |
| +10.4 | | 2000 Employee Stock Purchase Plan, as amended and restated through February 2, 2012 | | | | | | | | | | X |
| +10.5 | | 2005 Stock and Incentive Plan, as amended and restated through April 22, 2010 | | S-8 | | 333-168393 | | 4.5 |
| | 7/29/2010 | | |
| +10.6 | | Form of Restricted Stock Unit Agreement for Non-Employee Directors under 2005 Stock and Incentive Plan | | | | | | | | | | X |
| +10.7 | | Form of Stock Option Agreement for Non-Employee Directors under 2005 Stock and Incentive Plan | | | | | | | | | | X |
| +10.8 | | Form of Restricted Stock Unit Agreement for Employees under 2005 Stock and Incentive Plan | | | | | | | | | | X |
| +10.9 | | Form of Stock Option Agreement for Employees under 2005 Stock and Incentive Plan | | | | | | | | | | X |
| +10.10 | | New Hire Stock and Incentive Plan, as amended and restated through October 28, 2009 | | 10-K | | 000-30361 | | 10.7 |
| | 2/26/2010 | | |
|
| | | | | | | | | | | | | |
| 10.11 | | License Agreement, effective as of May 6, 1998, between Tufts University and Illumina | | 10-Q | | 000-30361 | | 10.5 |
| | 5/3/2007 | | |
| +10.12 | | The Solexa Unapproved Company Share Option Plan | | 8-K | | 000-30361 | | 99.3 |
| | 11/26/2007 | | |
| +10.13 | | The Solexa Share Option Plan for Consultants | | 8-K | | 000-30361 | | 99.4 |
| | 11/26/2007 | | |
| +10.14 | | Solexa Limited Enterprise Management Incentive Plan | | 8-K | | 000-30361 | | 99.5 |
| | 11/26/2007 | | |
| +10.15 | | Amended and Restated Solexa 2005 Equity Incentive Plan | | 10-K | | 000-30361 | | 10.25 |
| | 2/26/2009 | | |
| +10.16 | | Amended and Restated Solexa 1992 Stock Option Plan | | 10-K | | 000-30361 | | 10.26 |
| | 2/26/2009 | | |
| 10.17 | | License Agreement, dated June 24, 2002, between Dade Behring Marburg GmbH and Illumina (with certain confidential portions omitted) | | S-3/A | | 333-111496 | | 10.23 |
| | 3/2/2004 | | |
| 10.18 | | Non-exclusive License Agreement, dated January 24, 2002, between Amersham Biosciences Corp. and Illumina (with certain confidential portions omitted) | | S-3/A | | 333-111496 | | 10.24 |
| | 3/2/2004 | | |
| 10.19 | | Amended and Restated Lease between BMR-9885 Towne Centre Drive LLC and Illumina for the 9885 Towne Centre Drive property, dated January 26, 2007 | | 10-Q | | 000-30361 | | 10.41 |
| | 5/3/2007 | | |
| 10.20 | | Settlement and Cross License Agreement dated August 18, 2004 between Applera Corporation and Illumina (with certain confidential portions omitted) | | 10-Q | | 000-30361 | | 10.27 |
| | 11/12/2004 | | |
| 10.21 | | Collaboration Agreement, dated December 17, 2004, between Invitrogen Corporation and Illumina (with certain confidential portions omitted) | | 10-K | | 000-30361 | | 10.28 |
| | 3/8/2005 | | |
| 10.22 | | Joint Development and Licensing Agreement, dated May 15, 2006, between deCODE genetics, ehf. and Illumina (with certain confidential portions omitted) | | 10-Q | | 000-30361 | | 10.32 |
| | 8/2/2006 | | |
| 10.23 | | Lease between BMR-9885 Towne Centre Drive LLC and Illumina for the 9865 Towne Centre Drive property, dated January 26, 2007 | | 10-Q | | 000-30361 | | 10.42 |
| | 5/3/2007 | | |
| 10.24 | | Settlement and Release Agreement between Affymetrix, Inc. and Illumina, dated January 9, 2008 | | 10-K | | 000-30361 | | 10.44 |
| | 2/26/2008 | | |
| 10.25 | | Confirmation of Convertible Bond Hedge Transaction, dated February 12, 2007, by and between Illumina and Goldman, Sachs & Co. | | 8-K | | 000-30361 | | 10.1 |
| | 2/16/2007 | | |
| 10.26 | | Confirmation of Convertible Bond Hedge Transaction, dated February 12, 2007, by and between Illumina and Deutsche Bank AG London | | 8-K | | 000-30361 | | 10.2 |
| | 2/16/2007 | | |
| 10.27 | | Confirmation Issuer Warrant Transaction, dated February 12, 2007, by and between Illumina and Goldman, Sachs & Co. | | 8-K | | 000-30361 | | 10.3 |
| | 2/16/2007 | | |
| 10.28 | | Confirmation Issuer Warrant Transaction, dated February 12, 2007, by and between Illumina and Deutsche Bank AG London | | 8-K | | 000-30361 | | 10.4 |
| | 2/16/2007 | | |
| INDEX TO EXHIBITS |
| | | | | | | | | | | | | |
| | | | | Incorporated by Reference | | |
| Exhibit | | | | | | | | | | Filing | | Filed |
| Number | | Exhibit Description | | Form | | File Number | | Exhibit | | Date | | Herewith |
| 2.1 | | Agreement and Plan of Merger by and among Illumina, Inc., TP Corporation, Verinata Health, Inc. and Shareholder Representative Services LLC (as the Stockholder Representative), dated as of January 6, 2013 | | | | | | | | | | X |
| 3.1 | | Amended and Restated Certificate of Incorporation | | 8-K | | 000-30361 | | 3.1 |
| | 9/23/2008 | | |
| 3.2 | | Amended and Restated Bylaws | | 8-K | | 000-30361 | | 3.2 |
| | 4/27/2010 | | |
| 3.3 | | Certificate of Designations of Series A Junior Participating Preferred Stock, as filed with the Secretary of State of the State of Delaware on January 26, 2012
| | 8-K | | 000-30361 | | 3.1 |
| | 1/26/2012 | | |
| 4.1 | | Specimen Common Stock Certificate | | S-1/A | | 333-33922 | | 4.1 |
| | 7/3/2000 | | |
| 4.2 | | Rights Agreement, dated as of January 26, 2012, between Illumina, Inc. and Computershare Trust Company, N.A., as Rights Agent
| | 8-K | | 000-30361 | | 4.1 |
| | 1/26/2012 | | |
| 4.3 | | Indenture related to the 0.625% Convertible Senior Notes due 2014, dated as of February 16, 2007, between Illumina and The Bank of New York, as trustee | | 8-K | | 000-30361 | | 4.1 |
| | 2/16/2007 | | |
| 4.4 | | Indenture related to the 0.25% Convertible Senior Notes due 2016, dated as of March 18, 2011, between Illumina and The Bank of New York Mellon Trust Company, N.A., as trustee | | 10-Q | | 000-30361 | | 4.1 |
| | 5/4/2011 | | |
| +10.1 | | Form of Indemnification Agreement between Illumina and each of its directors and executive officers | | 10-Q | | 000-30361 | | 10.55 |
| | 7/25/2008 | | |
| +10.2 | | Amended and Restated Change in Control Severance Agreement between Illumina and Jay T Flatley, dated October 22, 2008 | | 10-K | | 000-30361 | | 10.33 |
| | 2/26/2009 | | |
| +10.3 | | Form of Change in Control Severance Agreement between Illumina and each of its executive officers | | 10-K | | 000-30361 | | 10.34 |
| | 2/26/2009 | | |
| +10.4 | | 2000 Employee Stock Purchase Plan, as amended and restated through February 2, 2012 | | 10-K | | 000-30361 | | 10.4 |
| | 2/24/2012 | | |
| +10.5 | | 2005 Stock and Incentive Plan, as amended and restated through April 22, 2010 | | S-8 | | 333-168393 | | 4.5 |
| | 7/29/2010 | | |
| +10.6 | | Form of Restricted Stock Unit Agreement for Non-Employee Directors under 2005 Stock and Incentive Plan | | 10-K | | 000-30361 | | 10.6 |
| | 2/24/2012 | | |
| +10.7 | | Form of Stock Option Agreement for Non-Employee Directors under 2005 Stock and Incentive Plan | | 10-K | | 000-30361 | | 10.7 |
| | 2/24/2012 | | |
| +10.8 | | Form of Restricted Stock Unit Agreement for Employees under 2005 Stock and Incentive Plan | | 10-K | | 000-30361 | | 10.8 |
| | 2/24/2012 | | |
|
| | | | | | | | | | | | | |
| 10.29 | | Amendment to the Confirmation of Issuer Warrant Transaction, dated February 13, 2007, by and between Illumina and Goldman, Sachs & Co. | | 8-K | | 000-30361 | | 10.5 |
| | 2/16/2007 | | |
| 10.30 | | Amendment to the Confirmation of Issuer Warrant Transaction, dated February 13, 2007, by and between Illumina and Deutsche Bank AG London | | 8-K | | 000-30361 | | 10.6 |
| | 2/16/2007 | | |
| 10.31 | | Lease Agreement, dated December 30, 2010, between ARE-SD Region No. 32, LLC and Illumina | | 10-K | | 000-30361 | | 10.35 |
| | 2/28/2011 | | |
| +10.32 | | Deferred Compensation Plan, effective December 1, 2007 | | 14D-9 | | 005-60457 | | 99(e)(6) |
| | 2/7/2012 | | |
| 21.1 | | Subsidiaries of Illumina | | | | | | |
| | | | X |
| 23.1 | | Consent of Independent Registered Public Accounting Firm | | | | | | |
| | | | X |
| 24.1 | | Power of Attorney (included on the signature page) | | | | | | |
| | | | X |
| 31.1 | | Certification of Jay T. Flatley pursuant to Section 302 of the Sarbanes-Oxley Act of 2002 | | | | | | |
| | | | X |
| 31.2 | | Certification of Marc A. Stapley pursuant to Section 302 of the Sarbanes-Oxley Act of 2002 | | | | | | |
| | | | X |
| 32.1 | | Certification of Jay T. Flatley pursuant to 18 U.S.C. Section 1350, as adopted pursuant to Section 906 of the Sarbanes-Oxley Act of 2002 | | | | | | |
| | | | X |
| 32.2 | | Certification of Marc A. Stapley pursuant to 18 U.S.C. Section 1350, as adopted pursuant to Section 906 of the Sarbanes-Oxley Act of 2002 | | | | | | |
| | | | X |
| 101.INS | | XBRL Instance Document | | | | | | | | | | X |
| 101.SCH | | XBRL Taxonomy Extension Schema | | | | | | | | | | X |
| 101.CAL | | XBRL Taxonomy Extension Calculation Linkbase | | | | | | | | | | X |
| 101.LAB | | XBRL Taxonomy Extension Label Linkbase | | | | | | | | | | X |
| 101.PRE | | XBRL Taxonomy Extension Presentation Linkbase | | | | | | | | | | X |
| 101.DEF | | XBRL Taxonomy Extension Definition Linkbase | | | | | | | | | | X |
| INDEX TO EXHIBITS — (Continued) |
| | | | | | | | | | | | | |
| +10.9 | | Form of Stock Option Agreement for Employees under 2005 Stock and Incentive Plan | | 10-K | | 000-30361 | | 10.9 |
| | 2/24/2012 | | |
| +10.10 | | New Hire Stock and Incentive Plan, as amended and restated through October 28, 2009 | | 10-K | | 000-30361 | | 10.7 |
| | 2/26/2010 | | |
| 10.11 | | License Agreement, effective as of May 6, 1998, between Tufts University and Illumina | | 10-Q | | 000-30361 | | 10.5 |
| | 5/3/2007 | | |
| +10.12 | | The Solexa Unapproved Company Share Option Plan | | 8-K | | 000-30361 | | 99.3 |
| | 11/26/2007 | | |
| +10.13 | | The Solexa Share Option Plan for Consultants | | 8-K | | 000-30361 | | 99.4 |
| | 11/26/2007 | | |
| +10.14 | | Solexa Limited Enterprise Management Incentive Plan | | 8-K | | 000-30361 | | 99.5 |
| | 11/26/2007 | | |
| +10.15 | | Amended and Restated Solexa 2005 Equity Incentive Plan | | 10-K | | 000-30361 | | 10.25 |
| | 2/26/2009 | | |
| +10.16 | | Amended and Restated Solexa 1992 Stock Option Plan | | 10-K | | 000-30361 | | 10.26 |
| | 2/26/2009 | | |
| 10.17 | | License Agreement, dated June 24, 2002, between Dade Behring Marburg GmbH and Illumina (with certain confidential portions omitted) | | S-3/A | | 333-111496 | | 10.23 |
| | 3/2/2004 | | |
| 10.18 | | Non-exclusive License Agreement, dated January 24, 2002, between Amersham Biosciences Corp. and Illumina (with certain confidential portions omitted) | | S-3/A | | 333-111496 | | 10.24 |
| | 3/2/2004 | | |
| 10.19 | | Amended and Restated Lease between BMR-9885 Towne Centre Drive LLC and Illumina for the 9885 Towne Centre Drive property, dated January 26, 2007 | | 10-Q | | 000-30361 | | 10.41 |
| | 5/3/2007 | | |
| 10.20 | | Settlement and Cross License Agreement dated August 18, 2004 between Applera Corporation and Illumina (with certain confidential portions omitted) | | 10-Q | | 000-30361 | | 10.27 |
| | 11/12/2004 | | |
| 10.21 | | Collaboration Agreement, dated December 17, 2004, between Invitrogen Corporation and Illumina (with certain confidential portions omitted) | | 10-K | | 000-30361 | | 10.28 |
| | 3/8/2005 | | |
| 10.22 | | Joint Development and Licensing Agreement, dated May 15, 2006, between deCODE genetics, ehf. and Illumina (with certain confidential portions omitted) | | 10-Q | | 000-30361 | | 10.32 |
| | 8/2/2006 | | |
| 10.23 | | Lease between BMR-9885 Towne Centre Drive LLC and Illumina for the 9865 Towne Centre Drive property, dated January 26, 2007 | | 10-Q | | 000-30361 | | 10.42 |
| | 5/3/2007 | | |
| 10.24 | | Settlement and Release Agreement between Affymetrix, Inc. and Illumina, dated January 9, 2008 | | 10-K | | 000-30361 | | 10.44 |
| | 2/26/2008 | | |
| 10.25 | | Confirmation of Convertible Bond Hedge Transaction, dated February 12, 2007, by and between Illumina and Goldman, Sachs & Co. | | 8-K | | 000-30361 | | 10.1 |
| | 2/16/2007 | | |
| 10.26 | | Confirmation of Convertible Bond Hedge Transaction, dated February 12, 2007, by and between Illumina and Deutsche Bank AG London | | 8-K | | 000-30361 | | 10.2 |
| | 2/16/2007 | | |
| INDEX TO EXHIBITS — (Continued) |
| | | | | | | | | | | | | |
| 10.27 | | Confirmation Issuer Warrant Transaction, dated February 12, 2007, by and between Illumina and Goldman, Sachs & Co. | | 8-K | | 000-30361 | | 10.3 |
| | 2/16/2007 | | |
| 10.28 | | Confirmation Issuer Warrant Transaction, dated February 12, 2007, by and between Illumina and Deutsche Bank AG London | | 8-K | | 000-30361 | | 10.4 |
| | 2/16/2007 | | |
| 10.29 | | Amendment to the Confirmation of Issuer Warrant Transaction, dated February 13, 2007, by and between Illumina and Goldman, Sachs & Co. | | 8-K | | 000-30361 | | 10.5 |
| | 2/16/2007 | | |
| 10.30 | | Amendment to the Confirmation of Issuer Warrant Transaction, dated February 13, 2007, by and between Illumina and Deutsche Bank AG London | | 8-K | | 000-30361 | | 10.6 |
| | 2/16/2007 | | |
| 10.31 | | Amended and Restated Lease Agreement, dated March 27, 2012, between ARE-SD Region No. 32, LLC and Illumina | | 10-Q | | 000-30361 | | 10.1 |
| | 5/3/2012 | | |
| +10.32 | | Deferred Compensation Plan, effective December 1, 2007 | | 14D-9 | | 005-60457 | | 99(e)(6) |
| | 2/7/2012 | | |
| 21.1 | | Subsidiaries of Illumina | | | | | | |
| | | | X |
| 23.1 | | Consent of Independent Registered Public Accounting Firm | | | | | | |
| | | | X |
| 24.1 | | Power of Attorney (included on the signature page) | | | | | | |
| | | | X |
| 31.1 | | Certification of Jay T. Flatley pursuant to Section 302 of the Sarbanes-Oxley Act of 2002 | | | | | | |
| | | | X |
| 31.2 | | Certification of Marc A. Stapley pursuant to Section 302 of the Sarbanes-Oxley Act of 2002 | | | | | | |
| | | | X |
| 32.1 | | Certification of Jay T. Flatley pursuant to 18 U.S.C. Section 1350, as adopted pursuant to Section 906 of the Sarbanes-Oxley Act of 2002 | | | | | | |
| | | | X |
| 32.2 | | Certification of Marc A. Stapley pursuant to 18 U.S.C. Section 1350, as adopted pursuant to Section 906 of the Sarbanes-Oxley Act of 2002 | | | | | | |
| | | | X |
| 101.INS | | XBRL Instance Document | | | | | | | | | | X |
| 101.SCH | | XBRL Taxonomy Extension Schema | | | | | | | | | | X |
| 101.CAL | | XBRL Taxonomy Extension Calculation Linkbase | | | | | | | | | | X |
| 101.LAB | | XBRL Taxonomy Extension Label Linkbase | | | | | | | | | | X |
| 101.PRE | | XBRL Taxonomy Extension Presentation Linkbase | | | | | | | | | | X |
| 101.DEF | | XBRL Taxonomy Extension Definition Linkbase | | | | | | | | | | X |
|
| | |
| + | | Management contract or corporate plan or arrangement |
Supplemental Information
No Annual Report to stockholders or proxy materials has been sent to stockholders as of the date of this report. The Annual Report to stockholders and proxy material will be furnished to our stockholders subsequent to the filing of this Annual Report on Form 10-K and we will furnish such material to the SEC at that time.
SIGNATURES
Pursuant to the requirements of the Section 13 or 15(d) of the Securities Exchange Act of 1934, the Registrant has duly caused this Report to be signed on its behalf by the undersigned, thereunto duly authorized, on February 23, 201215, 2013.
|
| | |
| | ILLUMINA, INC. |
| | | |
| | By | /s/ JAY T. FLATLEY |
| | | Jay T. Flatley President and Chief Executive Officer |
February 23, 201215, 2013
POWER OF ATTORNEY
KNOW ALL PERSONS BY THESE PRESENT, that each person whose signature appears below constitutes and appoints Jay T. Flatley and Marc A. Stapley, and each or any one of them, his or her true and lawful attorney-in-fact and agent, with full power of substitution and resubstitution, for him and in his or her name, place and stead, in any and all capacities, to sign any and all amendments to this Annual Report on Form 10-K, and to file the same, with all exhibits thereto, and other documents in connection therewith, with the Securities and Exchange Commission, granting unto said attorneys-in-fact and agents, and each of them, full power and authority to do and perform each and every act and thing requisite and necessary to be done in connection therewith, as fully to all intents and purposes as he might or could do in person, hereby ratifying and confirming all that said attorneys-in-fact and agents, or any of them, or their, his, or hisher substitutes or substitute, may lawfully do or cause to be done by virtue hereof.
Pursuant to the requirements of the Securities Exchange Act of 1934, this Annual Report on Form 10-K has been signed below by the following persons on behalf of the registrant and in the capacities and on the dates indicated.
|
| | | | |
/s/ JAY T. FLATLEY | | President, Chief Executive Officer and Director (Principal Executive Officer) | | February 23, 201215, 2013 |
| Jay T. Flatley | | | | |
| | | | | |
/s/ MarcMARC A. StapleySTAPLEY | | Senior Vice President and Chief Financial Officer (Principal Financial and Accounting Officer) | | February 23, 201215, 2013 |
| Marc A. Stapley | | | | |
| | | | |
/s/ MICHEL BOUCHARD | | Vice President and Chief Accounting Officer (Principal Accounting Officer) | | February 15, 2013 |
| Michel Bouchard | | | | |
| | | | | |
/s/ WILLIAM H. RASTETTER | | Chairman of the Board of Directors | | February 23, 201215, 2013 |
| William H. Rastetter | | | | |
| | | | | |
/s/ A. BLAINE BOWMAN | | Director | | February 23, 201215, 2013 |
| A. Blaine Bowman | | | | |
| | | | | |
/s/ DANIEL M. BRADBURY | | Director | | February 23, 201215, 2013 |
| Daniel M. Bradbury | | | | |
| | | | | |
/s/ KARIN EASTHAM | | Director | | February 23, 201215, 2013 |
| Karin Eastham | | | | |
| | | | |
/s/ ROBERT S. EPSTEIN | | Director | | February 15, 2013 |
| Robert S. Epstein | | | | |
| | | | | |
/s/ PAUL GRINT | | Director | | February 23, 201215, 2013 |
| Paul Grint | | | | |
| | | | | |
/s/ Gerald Möller | | Director | | February 23, 2012 |
| Gerald Möller | | | | |
| | | | | |
/s/ DAVID R. WALT | | Director | | February 23, 201215, 2013 |
| David R. Walt | | | | |
| | | | | |
/s/ ROY WHITFIELD | | Director | | February 23, 201215, 2013 |
| Roy Whitfield | | | | |