UNITED STATES
SECURITIES AND EXCHANGE COMMISSION
Washington, D.C. 20549
_____________________________________
FORM 10-K
_____________________________________
ANNUAL REPORT PURSUANT TO SECTION 13 or 15(d)
OF THE SECURITIES EXCHANGE ACT OF 1934
For The Fiscal Year Ended January 3, 2014December 30, 2016
Commission File Number 1-16137
_____________________________________
GREATBATCH, INC.INTEGER HOLDINGS CORPORATION
(Exact name of Registrant as specified in its charter)
_____________________________________
|
| | |
| Delaware | | 16-1531026 |
(State of Incorporation) | | (I.R.S. Employer Identification No.) |
2595 Dallas Parkway
Suite 310
Frisco, Texas 75034
(Address of principal executive offices)
(716) 759-5600(214) 618-5243
(Registrant’s telephone number, including area code)
Securities Registered Pursuant to Section 12(b) of the Act:
|
| | |
| Title of Each Class: | | Name of Each Exchange on Which Registered: |
| Common Stock, Par Value $0.001 Per Share | | New York Stock Exchange |
Securities Registered Pursuant to Section 12(g) of the Act: None
Indicate by check mark if the registrant is a well-known seasoned issuer, as defined in Rule 405 of the Securities Act. Yes ¨x No x¨
Indicate by check mark if the registrant is not required to file reports pursuant to Section 13 or Section 15(d) of the Act. Yes ¨ No x
Indicate by check mark whether the registrant (1) has filed all reports required to be filed by Section 13 or 15(d) of the Securities Exchange Act of 1934 during the preceding 12 months (or for such shorter period that the registrant was required to file such reports), and (2) has been subject to such filing requirements for the past 90 days. Yes x No ¨
Indicate by checkmark whether the registrant has submitted electronically and posted on its corporate Web site, if any, every Interactive Data File required to be submitted and posted pursuant to Rule 405 of Regulation S-T (§232.405 of this chapter) during the preceding 12 months (or for such shorter period that the registrant was required to submit and post such files). Yes x No ¨
Indicate by check mark if disclosure of delinquent filers pursuant to Item 405 of Regulation S-K (§229.405 of this chapter) is not contained herein, and will not be contained, to the best of registrant’s knowledge, in definitive proxy or information statements incorporated by reference in Part III of this Form 10-K or any amendment to this Form 10-K. ¨
Indicate by check mark whether the registrant is a large accelerated filer, an accelerated filer, a non-accelerated filer, or a smaller reporting company. See the definitions of “large accelerated filer,” “accelerated filer” and “smaller reporting company” in Rule 12b-2 of the Exchange Act.
|
| | | | |
| Large accelerated filer | x | | Accelerated filer | ¨ |
| | | | | |
| Non-accelerated filer | ¨ | | Smaller reporting company | ¨ |
Indicate by check mark whether the registrant is a shell company (as defined in Rule 12b-2 of the Act). Yes ¨ No x
The aggregate market value of common stock held by non-affiliates as of June 28, 2013July 1, 2016 (the last business day of the registrant’s most recently completed second fiscal quarter), based on the last sale price of $32.79,$32.00, as reported on the New York Stock Exchange: $771.2Exchange on that date: $967 million. Solely for the purpose of this calculation, shares held by directors and officers and 10 percent shareholdersstockholders of the registrant have been excluded. SuchThis exclusion should not be deemed a determination by or an admission by the registrant that these individuals are, in fact, affiliates of the registrant.
Shares of common stock outstanding as of March 4, 2014: 24,649,884February 24, 2017: 30,998,920
DOCUMENTS INCORPORATED BY REFERENCE
Portions of the following document are specifically incorporated by reference into the indicated parts of this report:
|
| | |
| Document | | Part |
Proxy Statement for the 20142017 Annual Meeting of Stockholders | | Part III, Item 10 “Directors, Executive Officers and Corporate Governance” |
| | |
| | | Part III, Item 11 “Executive Compensation” |
| | |
| | | Part III, Item 12 “Security Ownership of Certain Beneficial Owners and Management and Related Stockholder Matters” |
| | |
| | | Part III, Item 13 “Certain Relationships and Related Transactions, and Director Independence” |
| | |
| | | Part III, Item 14 “Principal Accountant Fees and Services” |
TABLE OF CONTENTS
|
| | |
ITEM
NUMBER
| PAGE
NUMBER
|
| PAGE |
| | |
| Item 1. | 1 Business..................................................................................................................................................................... | |
| | | |
| Item 1A. | 1A Risk Factors............................................................................................................................................................... | |
| | | |
| Item 1B. | 1B Unresolved Staff Comments...................................................................................................................................... | |
| | | |
| Item 2. | 2 Properties................................................................................................................................................................... | |
| | | |
| Item 3. | 3 Legal Proceedings..................................................................................................................................................... | |
| | | |
| Item 4. | 4 Mine Safety Disclosures............................................................................................................................................ | |
| | |
| | |
| | |
| Item 5. | | |
| | | |
| Item 6. | 6 Selected Financial Data............................................................................................................................................. | |
| | | |
| Item 7. | | |
| | | |
| Item 7A. | | |
| | | |
| Item 8. | | |
| | | |
| Item 9. | | |
| | | |
| Item 9A. | 9A Controls and Procedures............................................................................................................................................ | |
| | | |
| Item 9B. | 9B Other Information...................................................................................................................................................... | |
| | | |
| | |
| | | |
| Item 10. | | |
| | | |
| Item 11. | 11 Executive Compensation........................................................................................................................................... | |
| | | |
| Item 12. | | |
| | | |
| Item 13. | | |
| | | |
| Item 14. | | |
| | | |
| | |
| | | |
| Item 15. | | |
| | | |
| Item 16. | Form 10-K Summary................................................................................................................................................. | |
| | |
| Signatures........................................................................................................................................................... | |
PART I
ITEM 1. BUSINESS
OVERVIEW
Greatbatch, Inc. was foundedInteger Holdings Corporation, headquartered in 1970Frisco, Texas, is among the world’s largest medical device outsource manufacturing companies, serving the cardiac, neuromodulation, orthopedics, vascular and is a Delaware corporation incorporatedadvanced surgical markets. We also serve the non-medical power solutions market. We provide innovative, high quality medical technologies that enhance the lives of patients worldwide. In addition, we develop batteries for high-end niche applications in 1997.energy, military, and environmental markets. Our brands include GreatbatchTM Medical, Lake Region MedicalTM and ElectrochemTM. Our primary customers include large, multi-national original equipment manufacturers (“OEMs”) and their affiliated subsidiaries. When used in this report, the terms “Greatbatch,“Integer,” “we,” “us,” “our” and the “Company” mean Greatbatch, Inc.Integer Holdings Corporation and its subsidiaries.
On October 27, 2015, we completed the acquisition of Lake Region Medical, headquartered in Wilmington, MA, in a cash and stock transaction for a total purchase price including debt assumed of approximately $1.77 billion. Lake Region Medical was primarily a manufacturer of interventional and diagnostic wire-formed medical devices and components specializing in minimally invasive devices for cardiovascular, endovascular, and neurovascular applications. The Company conducted its initial public offering in 2000.acquisition of Lake Region Medical added scale and diversity to our legacy operations, which has enhanced customer access and experience by providing a more comprehensive portfolio of technologies.
In connection withOn March 14, 2016, we completed the realignmentspin-off of a portion of our operating structureformer QiG segment through a tax-free distribution of all of the shares of our QiG Group, LLC subsidiary to Integer’s stockholders of record as of the close of business on March 7, 2016 (the “Spin-off”). Immediately prior to completion of the Spin-off, QiG Group, LLC was converted into a corporation incorporated under the laws of Delaware and changed its name to Nuvectra Corporation (“Nuvectra”). Each Integer stockholder received one share of Nuvectra common stock for every three shares of Integer common stock held as of the record date. As a result, Nuvectra became an independent, publicly traded company listed on the NASDAQ stock exchange. Integer retains no ownership interest in 2013Nuvectra.
Refer to optimize profitable growth, which included changingNote 2 “Divestiture and Acquisitions” of the Notes to the Consolidated Financial Statements contained in Item 8 of this report for further description of these transactions.
Effective June 30, 2016, we changed our name from Greatbatch, Inc. to Integer Holdings Corporation. Integer, as in whole or complete, is the union of the Greatbatch Medical, Lake Region Medical and Electrochem brands. Integer signifies the Company’s more comprehensive products and service offerings, and a new dimension in its combined capabilities.
SEGMENT INFORMATION
As a result of the Lake Region Medical acquisition and the Spin-off, we reorganized our operations including our internal management and financial reporting structure during 2016. As a result, we reevaluatedrevised our operating and reporting segments. Beginning inreportable business segments during the fourth quarter of 2013, we have2016 and now disclose two reportable segments: Greatbatch Medical and QiG Group (“QiG”). As required, prior year amountssegments. We have been reclassifiedrecast the segment information included in this report to reflect the new reportable segment structure in order to conform them to the current year presentation. Greatbatch Medical designs and manufactures products where Greatbatch either owns the intellectual property or has unique manufacturing and assembly expertise. TheOur reportable business segments are described in more detail below; for financial results of Greatbatch Medical include the former Implantable Medical and Electrochem Solutions (“Electrochem”)information about our segments, excluding QiG. These products include medical devices and components for the cardiac, neuromodulation, orthopaedics, portable medical, vascular and energy markets among others. The Greatbatch Medical segment also offers value-added assembly and design engineering services for medical devices that utilize its component products.
QiG focuses on developing medical device systems for some of healthcare’s most pressing challenges and reflects Greatbatch’s strategic evolution of its product offerings in order to raise the growth and profitability profile of the Company. Through the research and development professionals in QiG, the Company is now investing in three areas - new medical device systems commercialization, collaborative programs with OEM customers, and strategic equity positions in start-up companies - to grow a diversified and distinctive portfolio. The medical device systems developed by QiG are manufactured by Greatbatch Medical.
The Company's customers include large multi-national original equipment manufacturers (“OEMs”).
Since Greatbatch, Inc. was incorporated, it has completed the following acquisitions either directly or indirectly through one of its subsidiaries:
|
| | | |
Acquisition Date | Acquired Company | | Business at Time of Acquisition |
July 1997 | Wilson Greatbatch Ltd. | | Founded in 1970, designed and manufactured batteries for implantable medical and commercial applications. |
| | | |
August 1998 | Hittman Materials and Medical Components, Inc. | | Founded in 1962, designed and manufactured ceramic and glass feedthroughs and specialized porous coatings for electrodes used in implantable medical devices (“IMDs”). |
| | | |
August 2000 | Battery Engineering, Inc. | | Founded in 1983, designed and manufactured high-energy density batteries for industrial, commercial, military and medical applications. |
|
| | | |
June 2001 | Sierra-KD Components division of Maxwell Technologies, Inc. | | Founded in 1986, designed and manufactured ceramic electromagnetic filtering capacitors and integrated them with wire feedthroughs for use in IMDs as well as military, aerospace and commercial applications. |
| | | |
July 2002 | Globe Tool and Manufacturing Company, Inc. | | Founded in 1954, designed and manufactured precision enclosures used in IMDs and commercial products used in the aerospace, electronics and automotive sectors. |
| | | |
March 2004 | NanoGram Devices Corporation | | Founded in 1996, developed nanoscale materials for battery and medical device applications. |
| | | |
April 2007 | BIOMEC, Inc. | | Established in 1998, provided medical device design and component integration to early-stage and established customers. |
|
| | | |
Acquisition Date | Acquired Company | | Business at Time of Acquisition |
| | | |
June 2007 | Enpath Medical, Inc. | | Founded in 1981, designed, developed, and manufactured venous introducers and dilators, implantable leadwires, steerable sheaths and steerable catheters. |
| | | |
October 2007 | IntelliSensing LLC | | Founded in 2005, designed and manufactured battery-powered wireless sensing solutions for commercial applications. |
| | | |
November 2007 | Quan Emerteq LLC | | Founded in 1998, designed, developed, and manufactured catheters, stimulation leadwires, microcomponents and assemblies. |
| | | |
November 2007 | Engineered Assemblies Corporation | | Founded in 1984, designed and integrated custom battery solutions and electronics focused on rechargeable systems for industrial, commercial, military and portable medical applications. |
| | | |
January 2008 | P Medical Holding SA | | Founded in 1994, designed, manufactured and supplied delivery systems, instruments and implants for the orthopaedics industry. |
| | | |
February 2008 | DePuy Orthopaedics’ Chaumont, France manufacturing facility | | Manufactured hip and shoulder implants for DePuy Orthopaedics. |
| | | |
December 2011 | Micro Power Electronics, Inc. (“Micro Power”) | | Founded in 1990, designed custom battery packs, smart chargers and power supplies for industrial, military and portable medical applications. |
| | | |
February 2012 | NeuroNexus Technologies, Inc.
(“NeuroNexus”)
| | Founded in 2004, medical device design firm specializing in developing neural interface technology, components and systems. |
FINANCIAL STATEMENT YEAR END
We utilize a fifty-two, fifty-three week fiscal year ending on the Friday nearest December 31st. Fiscal years 2013, 2012 and 2011 ended on January 3, 2014, December 28, 2012 and December 30, 2011, respectively. Fiscal year 2013 contained fifty-three weeks and fiscal years 2012 and 2011 contained fifty-two weeks.
SEGMENT INFORMATION
In connection with the realignment of our operating structure in 2013, which included changing our management and reporting structure, we reevaluated our operating and reporting segments. Beginning in the fourth quarter of 2013, we have two reportable segments: Greatbatch Medical and QiG. Segment information including sales from external customers, profit or loss, and assets by segment as well as salesrevenue from external customers and long-livedtotal assets by geographic area are set forth atsegment, refer to Note 19 “Business Segment, Geographic and Concentration Risk Information” of the Notes to the Consolidated Financial Statements contained in Item 8 of this report.
Greatbatch Our operating segments, along with their related product lines, are as follows:
Medical
Greatbatch Medical'sAdvanced Surgical, Orthopedics & Portable Medical
Cardio & Vascular
Cardiac & Neuromodulation
Non-Medical
Electrochem
MEDICAL
Advanced Surgical, Orthopedics & Portable Medical
The Advanced Surgical, Orthopedics & Portable Medical (“AS&O”) product line offers a broad range of products and services across the many businesses it serves. In partnership with customers, AS&O offers advanced development, engineering and program management, which provides us with an in-depth understanding of our customers’ market drivers and end-user needs.
The following are the principal products and services offered by our AS&O product line:
Arthroscopic Devices & Components. Our arthroscopic devices & components products include devices used for minimally invasive surgery in the joint space, also referred to as “sports medicine.” Our products include shaver blades and burrs, ablation probes, and suture anchors, which are used in procedures such as arthroscopic ACL reconstruction, arthroscopic repair, rotator cuff repair, and hip labrum repair.
Laparoscopic & General Surgery. Our laparoscopic & general surgeryproducts include devices used primarily for minimally invasive procedures in the abdominal space, but may also be used in open or general surgery. Customers of our laparoscopy and general surgery products require energy-based devices and endomechanical devices that are efficient and reliable. Our products include trocars, endoscopes and laparoscopes, closure devices, harmonic scalpels, bipolar energy delivery devices, radio frequency probes, thermal tumor ablation devices and ophthalmic surgery devices.
Biopsy & Drug Delivery. Biopsy and drug delivery products include biopsy and grasping forceps, breast biopsy devices, auto injection systems, cannula-based delivery systems, implantable brachytherapy seeds, tubes, catheters, infusion and IV connectors, and wearable patient constant or variable delivery systems.
Orthopedic.Our orthopedic products include hip and shoulder joint reconstruction implants, plates, screws and spinal devices, as well as instruments and delivery systems used in hip and knee replacement, trauma fixation, extremity and spine surgeries. Orthopedic implants are used in reconstructive surgeries to replace or repair hips, knees and other joints, such as shoulders, ankles and elbows that have deteriorated as a result of disease or injury. Trauma implant systems are used primarily to reattach or stabilize damaged bone or tissue while the body heals. Spinal implant systems are used by orthopedic surgeons and neurosurgeons in the treatment of degenerative diseases, deformities and injuries in various regions of the spine.
Each implant system typically has an associated instrument set that is used specifically in the surgical implant procedure. Instruments included in a set vary by implant system. Orthopedic trays have generally been designed to allow for sterilization and re-use after an implant or other surgical procedure is performed. Recently, the industry trend is moving towards single use instrumentation. Cases are used to store, transport and arrange implant systems and other medical devices and componentsrelated surgical instruments. The majority of cases are tailored for a specific implant procedure so that the instruments, implants, and other devices are arranged to match the order of use in the procedure and are securely held in clearly labeled, custom-formed pockets or brackets.
Power Solutions. We have a legacy in the development of batteries for implantable devices. Our comprehensive capabilities include expertise in a range of cell technologies. Today, our batteries power over 100 external medical devices. We provide complete mission critical batteries and other power solutions through the combined efforts of innovative research, product development, manufacturing and customer partnerships to advance the way healthcare is powered. Our offerings include state of the art customized rechargeable batteries and chargers, non-rechargeable batteries and wireless charging systems. We design and develop basic and “smart” chargers and docking stations of varying complexities to safely and reliably maximize the efficiency of the rechargeable batteries. We develop batteries, and the attendant chargers, for patient monitoring, portable defibrillators, and portable ultrasound, X-Ray machines, hearing devices and other devices. We collaborate with our customers on product development opportunities incorporating our power solutions into Class 1, 2 or 3 medical devices.
Cardio & Vascular
The Cardio & Vascular product line offers a full range of products and services from our global facilities for the development of diagnostic and interventional cardiac neuromodulation, orthopaedics, portable medical,and endovascular devices. Our comprehensive design and development services produce components, subassemblies and finished devices for a range of cardiac and endovascular procedures.
The following are the principal products and services offered by our Cardio & Vascular product line:
Cardiovascular and Structural Heart. Cardiovascular and structural heart products include products used for vascular, cardiac surgery and structural heart disease. Within this product line, we produce guidewire and catheter components, subassemblies and completed devices for cardiovascular, cardiac surgery and structural heart disease applications.For vascular procedures, product applications include introducers, steerable sheaths, guidewires, guide catheters, microcatheters, ultrasound catheters, and delivery systems, balloon expandable delivery systems, stents, atherectomy devices, embolic protection devices, catheter design and assembly, sterile packaging, catheter shafts, radiopaque marker bands, molded hubs, fabricated hypotube assembly, and wire stent frames. For cardiac surgery and structural heart disease procedures, product applications are comprised of access and delivery systems for patient foramen ovale closure devices, vessel harvesting systems, beating heart surgery systems, transcatheter heart valves, heart valves and leaflets, and anastomosis devices.
Peripheral Vascular, Neurovascular, Urology and Oncology. Our peripheral vascular, neurovascular, urology and oncology products are primarily focused on the design and manufacturing of devices used during the treatment of peripheral arterial disease, peripheral transcatheter embolization and occlusion, aortic aneurysm repair, arteriovenous malformations and endoscopic retrograde cholangiopancreatography. Within this product line, we design and manufacture guidewire and catheter components, subassemblies and completed devices for the various applications.
The primary neurovascular applications for these products are cerebrovascular aneurysms, while the urology and oncology applications are stone retrieval, thermal tumor ablation, transarterial chemoembolization and radio frequency probes. Our products within this area include peripheral vascular and energy markets among others. A brief descriptionurology guidewires, neurovascular and oncology micro-guidewires, angiographic and diagnostic guidewires, guiding catheters, support and crossing catheters, embolic protection devices, micro-catheters, and delivery systems.
Electrophysiology, Infusion Therapy & Hemodialysis. Our electrophysiology and infusion therapy products include devices that are used in the electrophysiology ablation catheter and cardiac rhythm systems. Within this product line, we produce guidewire and catheter components, subassemblies and completed devices for the various electrophysiology applications, as well as components and assemblies for cardiac and neurostimulation leads and implantable pulse generators (“IPG”).
Electrophysiology atrial fibrillation ablation catheters, which deliver therapy to the heart and eliminate tissue paths for irregular electrical impulses, and electrophysiology catheters, which diagnose irregular electrical impulses in the heart’s electrical system, are the focal points of these productsour electrophysiology offering. For stimulation therapy applications, cardiac rhythm management (“CRM”) devices, such as pacemakers, implantable cardioverter defibrillator, cardiac leads and markets follows:neurostimulation devices for spinal cord and deep brain stimulation, are the primary applications of focus.
Cardiac & Neuromodulation
The Cardiac & Neuromodulation product line offers a comprehensive collection of technologies and capabilities. Our complete spectrum of design, development, and manufacturing expertise provides our customers with a superior quality solution in an efficient, cost-effective and consistent manner.
Cardiac & Neuromodulation.Cardiac and neuromodulation – Products products include batteries, capacitors, filtered and unfiltered feedthroughs, engineered components, implantable stimulation leads and enclosures used in IMDs.Implantable Medical Devices (“IMD”). Additionally, we offer value-added assembly for these IMDs. An IMD is an instrument that is surgically inserted into the body to provide diagnosis and/or therapy. One sector of the IMD market is cardiac, which is comprised ofcomprising devices such as implantable pacemakers, implantable cardioverter defibrillators (“ICD”), cardiac resynchronization therapy (“CRT”) devices, and cardiac resynchronization therapy with backup defibrillation devices (“CRT-D”)., insertable cardiac monitors (“ICM”), and ventricular assist devices. Another sector of the IMD market is neuromodulation, which is comprised of pacemaker-type devices that stimulate nerves for the treatment of various conditions. Beyond established therapies offor pain control, incontinence, and movement disorders (Parkinson’s disease, essential tremor and epilepsy),dystonia) and epilepsy, nerve stimulation for the treatment of other disabilities such as sleep apnea, heart failure, migraines, obesity and depression has shown promising results.
The following table sets forthare the main categories of battery-powered IMDs and the principal illness or symptoms treated by each device:
|
| | | | |
Device | | Market Size (in billions)Device | | Principal Illness or Symptom | |
Pacemakers | | $4.0Pacemakers | | Abnormally slow heartbeat (Bradycardia) | |
ICDs | | $3.7ICDs | | Rapid and irregular heartbeat (Tachycardia) | |
CRT/CRT-Ds | | $3.0CRT/CRT-Ds | | Congestive heart failure | |
Neurostimulators | ICMs | | $2.6Unexplained fainting or risk or cardiac arrhythmias | |
| Neurostimulators | | Chronic pain, incontinence, movement disorders, epilepsy, obesity or depression | |
| Cochlear hearing devices | | $0.8Hearing loss | | Hearing loss |
IMD systems generally include an implantable pulse generator (“IPG”)IPG and one or more stimulation leads. An IPG is a battery powered device that produces electrical pulses. TheA lead then carries this electrical pulse from the IPG to the heart, spinal cord or other location in the body. Our portfolio of proprietary technologies, products, and capabilities has been built to provide our cardiac and neuromodulation customers with a single source for the vast majority of the components and subassemblies required to manufacture an IPG or lead, to includeincluding complete lead systems. Our investments in research and development hashave generated proprietary products such as the QHRQHR®, QMRQMR®, and QCapacitorQCAPS®TM primary battery and capacitor lines, which have enabled our OEM partners to make improvements in their system offerings in terms of device reliability, size, longevity and power. Our XcellionTM line of Lithium-Ion rechargeable batteries leverages decades of implantable battery research, development and manufacturing expertise. This line of battery cells now includes the optional CoreGuardTM feature, which enables batteries to discharge to zero volts without performance degradation.
The following are the principal products and services offered by our Cardiac & Neuromodulation product line:
Cardiac Rhythm Management.We believe that theprovide a broad range of products and services to enable next generation CRM medical devices to address heart disease and heart rhythm disorders through such systems as: pacemakers, implantable cardiac defibrillators, cardiac resynchronization therapy devices, implantable cardiac monitors and neuromodulation markets continue to exhibit fundamentals that position this product lineother novel implantable devices. Our battery and capacitor technologies provide a reliable and safe power source for growth. Factors that are impacting these markets are as follows:
Growing patient population – Implantable pacemakersour customer’s CRM system, based on decades of research, development and ICDs remain primary therapies formanufacturing experience. As a numberleading supplier of critical clinical conditions, mostlow-polarization specialty-coated electrodes and lead components, we provide a full range of which are non-elective in nature. As the prevalence of many of these clinical conditions increase with age, underlying population demographics in developed countries will provide an engine for procedure growth.
Focus on emerging markets – OEM’s have increased their focustherapy delivery development and investment to expand physicians' awareness of these life changing therapies, which we believe will result in increased utilization to improve quality of life for more patients globally. These growth initiatives will drive increased utilization of existing cardiac technologies and provide an avenue for new device and technology development as device manufacturers look to develop unique products for these markets.
Trends in device features – IMD evolution continues to favor the development of smaller, longer lasting devices with increased functionality and more physiologic shapes. Innovative battery, capacitor, enclosure, and filtering solutions such as those provided by Greatbatch Medical are critical to the realization of these market needs.
Growth within neuromodulation – Neuromodulation applications continue to grow at a faster pace than traditional markets, and are expected to continue to expand as new therapeutic applications are identified. There continues to be growth in clinical data supporting new applications and a growing focus and excitement from clinicians looking for treatment alternatives for challenging patient conditions. Additionally, core neuromodulation markets—like spinal cord stimulation—that rely significantly on patients for co-pays, are positioned to see stronger growth as global economic markets strengthen. Many cardiac OEM companiesmanufacturing solutions. We are also OEMs in the neuromodulation market, which positions us to capitalize on both driversa leading supplier of market growth.medical stamped components, and shallow and deep draw casings and assemblies.
Disruptive TechnologiesNeuromodulation. - Two disruptive device technologies, sub-cutaneous ICDsWe offer a wide range of products and leadless pacemakers, gained significant visibility in 2013. Our portfolio of technologies andservices for our customers’ next generation neuromodulation medical devices. Examples include implantable medical devices that address chronic pain, hearing loss, incontinence, movement disorders, psychiatric disorders and sleep disorders.
We help our customers develop and manufacture unique neuromodulation solutions, including IPGs, programmer systems, battery chargers, and patient controllers. We offer a full range of therapy delivery development efforts are vital to& manufacturing solutions for low-polarization specialty-coated electrodes, lead components and fully finished lead systems.
NON-MEDICAL
Electrochem
Our power solutions enable the success and advancement of these new therapy platforms.
Orthopaedics – Products include hip and shoulder joint reconstruction implants, bone plates and spinal devices, and instruments and delivery systems used in hip and knee replacement, trauma fixation, extremity and spine surgeries. Orthopaedic implants are used in reconstructive surgeries to replace or repair hips, knees and other joints, such as shoulders, ankles and elbows that have deteriorated as a result of disease or injury. Trauma implant systems are used primarily to reattach or stabilize damaged bone or tissue while the body heals. Spinal implant systems are used by orthopaedic surgeons and neurosurgeons in the treatment of degenerative diseases, deformities and injuries in various regions of the spine.
Each implant system typically has an associated instrument set that is used in the surgical procedure to insert that specific implant system. Instruments included in a set vary by implant system. Usually, instrument sets are sterilized after each use and then reused, however, recent trends are moving towards single use instrumentation. Casesour customers’ critical non-medical applications. Whether our custom battery packs are used to store, transport and arrange implant systems and other medical devices and related surgical instruments. Orthopaedic trays are generally designed to allow for sterilization and re-use after an implant or other surgical procedure is performed. The majority of cases are tailored for
specific implant procedures so that the instruments, implants and other devices are arranged to match the order of use in the procedure and are securely held in clearly labeled, custom-formed pockets or brackets.
Many of the factors affecting the orthopaedics market segment are similar to the cardiac and neuromodulation markets and include:
Aging population in developed markets - Conditions like osteoarthritis and spine degeneration are underlying drivers of a diverse spectrum of reconstructive therapies, and increase significantly with age. Continued growth in the 65+ population, along with an increased desire to remain active, will provide a driver for procedural growth.
Rates of obesity—Rates of obesity globally have continued to rise, and are expected to do so for the foreseeable future. Excess weight carriage exacerbates wear on joints and will drive the need for replacement and revision procedures.
New implant and surgical technology - The orthopaedic market continues to see a growing focus on minimally invasive procedures across a number of sectors including joint reconstruction and spinal fusion, potentially expanding the use of these therapeutic approaches.
Growth in emerging markets—Growing affluence in emerging markets has provided an opportunity for global growth of a number of orthopaedic procedures. Patient populations outside of developed markets continue to be underpenetrated, and investment from large device manufacturers in these markets will provide for procedural growth of established therapies.
We estimate that the orthopaedics market represents a $3 billion market opportunity for Greatbatch Medical.
Vascular – Products include introducers, steerable sheaths and catheters that deliver minimally invasive therapies for many end-user markets including coronary and neurovascular disease, peripheral vascular disease, interventional radiology, vascular access, atrial fibrillation, and interventional cardiology, as well as products for medical imaging and drug and pharmaceutical delivery. Most of these markets are expected to experience significant global procedural growth over the next few years. Introducers enable physicians to create a conduit through which they can insert infusion catheters, implantable ports, pacemaker leads and other therapeutic devices into a blood vessel. A catheter is a tube that can be inserted into a blood vessel to deliver a therapeutic device or allow drainage, injection of fluids, or access by surgical instruments.
Our products seek to capitalizemonitor potential environmental catastrophes, support troops on the growth inbattle field or explore geologic formations below the cardiac and vascular markets, especially since many of the large cardiac OEMs are also in the vascular markets. This gives usearth’s surface, one thing is constant - failure is not an opportunity to develop close strategic partnerships that can be leveraged across markets, an opportunity that will grow in significance as OEMs continue to consolidate their operating divisions. In addition to those factors that are driving the cardiac and neuromodulation markets, increased demand is also being driven by continued focus on minimally invasive procedures. Patients, healthcare providers, and payors are looking for minimally invasive technologies to treat disease, expanding the use of catheter based procedures and associated vascular therapies. We also continue to see strong growth in the vascular markets because of the increased prevalence and treatment of peripheral artery disease as well as new indications for tissue extraction or ablation.option.
We believe that the vascular market represents a $1.3 billion market opportunity for Greatbatch Medical.
Portable Medical, Energy, Military and Environmental - Greatbatch Medical alsoElectrochem provides customized battery power and management systems, charging and docking stations, and power supplies.supplies to markets where safety, reliability, quality and durability are critical. We design customized primary (non-rechargeable) and secondary (rechargeable) battery solutions, which are used in the portable medical, energy, military and environmental markets. Our primary and secondary power solutions are used where failure is not an option.
Greatbatch Medical'sElectrochem’s primary lithium power solutions, which include high, moderate and low rate non-rechargeable cell solutions, are utilized in extreme conditions and can withstand exceptionally high and low temperatures, sterilization, and high shock and vibration. OurElectrochem’s product designs incorporate protective circuitry, glass-to-metal hermetic seals, fuses and diodes to help ensure safe, durable and reliable power as devices are subjected to these harsh conditions. Our primary batteries are often used in remote and demanding environments, including down hole drilling tools, military communication devices, and oceanographic buoys and more.survey vessels buoys.
In addition to primary power solutions, Greatbatch MedicalElectrochem offers customized secondary or rechargeable battery packs, in a diverse range of chemistries for critical applications requiring rechargeable solutions. Rechargeable chemistries include lithium ion, lithium ion polymer, nickel metal hydride, nickel cadmium, lithium iron phosphate and sealed lead acid. Greatbatch Medical’sElectrochem’s rechargeable battery packs include advanced electronics, smart charging and battery management systems and are used in critical military and life-saving applications, including automated external defibrillators, ventilators, powered surgical instruments and portable oxygen concentrators, among others.industrial applications.
The portable medical market trends continue to be favorable with an aging population and the shift from clinical to home settings for portable equipment to monitor and provide therapy. This market represents a strong opportunity despite cost pressure from healthcare reform. New product development in this market is vibrant as our customers continue to invest in the
future to position for growth. We estimate that the portable medical market represents a $1.0 billion market opportunity for Greatbatch Medical.OTHER FACTORS IMPACTING OUR OPERATIONS
The following table summarizes information about our Greatbatch Medical products:
|
| | | |
Product | Description | | Principal Product Attributes |
Batteries | Lithium iodine (“Li Iodine”)
Lithium silver vanadium oxide (“Li SVO”)
Lithium carbon monoflouride (“Li CFx”)
Lithium ion rechargeable (“Li Ion”)
Lithium SVO/CFx (“QHR” & “QMR”)
| | High reliability and predictability;
Long service life;
Customized configuration;
Light weight;
High energy density, small size
|
|
| | | |
Capacitors | Storage for energy generated by a battery before delivery to the heart. Used in ICDs and CRT-Ds. | | Stores more energy per unit volume (energy density) than other existing technologies; Customized configuration |
| | | |
EMI filters | Filters electromagnetic interference to limit undesirable response, malfunctioning or degradation in the performance of electronic equipment | | High reliability attenuation of EMI RF over wide frequency ranges; Customized design |
| | | |
Feedthroughs | Allow electrical signals to be brought from inside hermetically sealed IMD to an electrode | | Ceramic to metal seal is substantially more durable than traditional seals; Multifunctional |
| | | |
Coated electrodes | Deliver electric signal from the feedthrough to a body part undergoing stimulation | | High quality coated surface; Flexible in utilizing any combination of biocompatible coating surfaces; Customized offering of surfaces and tips |
| | | |
Precision components | Machined
Molded and over molded products
| | High level of manufacturing precision;
Broad manufacturing flexibility
|
| | | |
Enclosures and related components | Titanium
Stainless steel
| | Precision manufacturing, flexibility in configurations and materials |
| | | |
Value-added assemblies | Combination of multiple components in a single package/unit | | Leveraging products and capabilities to provide subassemblies and assemblies;
Provides synergies in component technology and procurement systems
|
| | | |
Stimulation leads | Cardiac, neuromodulation and hearing restoration stimulation leads | | Custom and unique configurations that increase therapy effectiveness, provide finished device design and manufacturing |
| | | |
Introducers | Creates a conduit to insert infusion catheters, guidewires, implantable ports, pacemaker leads and other therapeutic devices into a blood vessel | | Variety of sizes and materials that facilitate problem-free access in a variety of clinical applications |
| | | |
Catheters | Delivers therapeutic devices to specific sites in the body | | Enable safe and effective delivery of therapeutic and diagnostic devices, providing the right balance of steerability, trackability and crossability to reach the intended location |
| | | |
Cases and trays | Delivery systems for cleaning and sterilizing orthopaedic instruments and implants | | High degree of customization;
Short, predictable development and production timelines
|
|
| | | |
Product | Description | | Principal Product Attributes |
Implants | Orthopaedic implants for large joint, spine, extremity and trauma procedures | | Precision manufacturing, leveraging capabilities and product processes including sterile packaging and coatings |
| | | |
Instruments | Reusable and single use orthopaedic instruments for large joint, spine, extremity and trauma procedures | | Designed to improve surgical techniques, reduce surgery time, and increase surgical precision |
| | | |
Primary cells | Low-rate
Moderate-rate
High rate (spiral) Wide Range
| | Optimized rate capability, shock and vibration resistant, high and low temperature tolerant, high energy density; Ability to operate in low and high temp applications |
| | | |
Primary and secondary battery packs | Highly-customized pack solutions | | Diverse portfolio of cells in various sizes, temperature ranges and rate capabilities, custom-engineered and designed, value-add charging and battery management systems for secondary packs |
A majority of the components and devices Greatbatch Medical sells incorporate proprietary technologies. These proprietary technologies provide an entry barrier for new competitors, and further limit existing competitors from duplicating our products. In addition to these proprietary technologies, our proprietary “know-how” in the manufacture of these products provides further barriers to competition.
QiG GROUP
QiG focuses on developing medical device systems for some of healthcare’s most pressing challenges and reflects Greatbatch’s strategic evolution of its product offerings in order to raise the growth and profitability profile of the Company. QiG encompasses 120 research and development professionals across the U.S. working on a portfolio of new and innovative product opportunities. QiG has established relationships with highly specialized physicians across the U.S. and Europe that help support the design of medical device systems with unique benefits to improve clinical outcomes. QiG provides differentiated medical devices to OEM customers by accelerating the velocity of innovation while delivering optimized supply chain and cost efficiencies. We are utilizing our market research to drive our intellectual property portfolio with a goal of improved return on investment.
QiG utilizes a disciplined and diversified portfolio approach with three investment modes: new medical device systems commercialization, collaborative programs with OEM customers, and strategic equity positions in start-up companies. The development of certain new medical device systems are facilitated through the establishment of limited liability corporations (“LLC”). These LLCs do not own, but have the exclusive right to use the technology of Greatbatch Medical in certain, specifically designed fields of use and have an exclusive manufacturing agreement with Greatbatch Medical. QiG currently owns 89% - 100% of three LLCs. The minority interest of these LLCs was granted to key opinion leaders, clinicians and strategic partners at or near the time the LLC was established. Under the LLC agreement, QiG is liable for 100% of the expenses incurred by the LLC. However, no income is distributed to the minority holders of the LLC until QiG is reimbursed for all expenses paid. Once QiG has been fully reimbursed, all future net income is distributed based upon the respective LLCs ownership percentages. One of the LLCs established by QiG is for our spinal cord stimulator to treat chronic intractable pain of the trunk and/or limbs. This product was submitted for Food and Drug Administration (“FDA”) and CE Mark approval near the end of 2013. Another medical device system being developed by QiG is an implantable loop recorder for cardiac arrhythmia diagnostics. QiG is in the early stages of development of two additional medical device systems, which are targeting approved and emerging indications. Additionally, based upon the technology acquired from NeuroNexus, QiG is developing a platform of thin-film electrodes for neuromodulation leads, sub-systems and components.
Current QiG revenue includes sales of neural interface technology, components and systems to the neuroscience and clinical markets. Future income of QiG is expected to come from various sources including investment gains from the sales of LLC ownership interests, technology licensing fees, royalty revenue, and/or the sales of medical device systems to OEM customers.
RESEARCH AND DEVELOPMENTCustomers
Our position as a leading developerproducts are designed to provide reliable, long-lasting solutions that meet the evolving requirements and manufacturer of medical devices and components is largely the resultneeds of our long history of technological innovation. We invest substantial resources in research, development and engineering. Our scientists, engineers and technicians focus on improving existing products, expanding the use of our products and developing new products. In addition to our internal technology and product development efforts, we also engage outside research institutions
for unique technology projects. In order to facilitate the development of new and improved medical devices, in 2008 we significantly increased our investments in research and development. Net investments in medical device systems (including gross profit and SG&A), which are being facilitated through QiG, totaled $30.5 million, $32.6 million and $27.3 million for 2013, 2012 and 2011, respectively. Further information regarding our research and development activities can be found in the “Product Development” section of Item 7 of this report.
PATENTS AND PROPRIETARY TECHNOLOGY
We rely on a combination of patents, licenses, trade secrets and know-how to establish and protect our proprietary rights to our technologies and products. Often, several patents covering various aspects of the design protect a single product. We believe this provides broad protection of the inventions employed.
As of January 3, 2014, we have 625 active U.S. patents and 344 active foreign patents. We also have 279 U.S. and 241 foreign pending patent applications at various stages of approval. During the past three years, we have been granted 189 new U.S. patents, 55 of which were granted in 2013. As a result of QiG’s development of complete medical device systems, the amount of intellectual property being generated by the Company has accelerated. Of the 1,489 patents and patents pending, approximately 537 of these relate to our medical device systems.
We are also a party to several license agreements with third parties under which we have obtained, on varying terms, exclusive or non-exclusive rights to patents held by them. An example of these agreements is the license of basic technology used in our wet tantalum capacitors, filtered feedthroughs, biomimetic coatings, safety needles and MRI compatible lead systems. We have also granted rights to our patents to others under license agreements.
It is our policy to require our management and technical employees, consultants and other parties having access to our confidential information to execute confidentiality agreements. These agreements prohibit disclosure of confidential information to third parties except in specified circumstances. In the case of employees and consultants, the agreements generally provide that all confidential information relating to our business is the exclusive property of Greatbatch.
MANUFACTURING AND QUALITY CONTROL
We leverage our strength as an innovative designer and manufacturer of finished devices and components to the medical device industry. Our manufacturing and engineering services include: design, testing, component production, and device assembly. We have integrated our proprietary technologies in our own products and those of our customers throughout the medical device industry. Our flexible, high productivity manufacturing capabilities span sites in Tijuana, Mexico, Beaverton, OR, Plymouth, MN, Minneapolis, MN, Ft. Wayne, IN, Indianapolis, IN, Alden, NY, Clarence, NY, Raynham, MA, and Chaumont, France.
Due to the highly regulated nature of the products we produce, we have implemented strong quality systems which are harmonized across our enterprise. The quality systems at our sites are compliant with and certified to various recognized international standards, requirements, and directives. Each site quality system is certified under an applicable International Organization for Standardization (“ISO”) quality system standard, such as ISO 13485 or ISO 9001. This certification requires, among other things, an implemented quality system that applies (where applicable) to the design and manufacture of components, assemblies and finished medical devices, including component quality and supplier control. Maintenance of these certifications for each facility requires periodic re-examination from an independent notified body.
Along with ISO 13485, the facilities producing finished medical devices are subject to extensive and rigorous regulation by numerous government bodies, including the FDA and comparable international regulatory agencies in order to ship product worldwide. For these facilities, we maintain FDA registration and compliance to all applicable domestic and international regulations. Compliance with applicable regulatory requirements is subject to continual review and is monitored through periodic inspections by FDA and other international regulatory bodies.
SALES AND MARKETING
We sell our products directly to our customers. In 2013, approximately 49% of our products were sold in the U.S. Sales outside the U.S. are primarily to customers whose corporate offices are located and headquartered in the U.S. Information regarding our sales by geographic area is set forth at Note 19 “Business Segment, Geographic and Concentration Risk Information” of the Notes to Consolidated Financial Statements contained in Item 8 of this report.
Although the majority of our customers contract with us to develop custom components and assemblies to fit their product specifications, we also provide system and device solutions ready for market distribution by OEMs. As a result, we have established close working relationships between our internal program managers and our customers. We market our products and technologies at industry meetings and trade shows domestically and internationally.
Internal account executives support all activity and involve engineers and technology professionals in the sales process to address customer requests appropriately. For system and device solutions, we partner with our customers’ research, marketing, and clinical groups to jointly develop technology platforms in alignment with their product roadmaps and therapy needs.
We leverage our account executives with support from engineering to design and sell product solutions into our targeted markets. Our account executives are trained to assist our customers in selecting appropriate chemistries and configurations. We market our products and services through well-defined selling strategies and marketing campaigns that are customized for each of the industries we target.
Over the last several years we have significantly enhanced our sales and marketing capabilities. This has included moving account executives closer to our major customers, upgrading our sales force with new sales talent, enhancing our sales commission programs, and intensifying our market research. Additionally, we have placed additional emphasis on reaching long-term agreements with our OEM customers in order to secure our revenue base. At times, we have provided our customers with price concessions in exchange for entering into long-term agreements and certain volume commitments. We estimate that approximately 70 percent of our revenue is generated from long-term (three- to seven-year) agreements.
Firm backlog orders at January 3, 2014 and December 28, 2012 were approximately $170 million and $160 million, respectively. The majority of the orders outstanding at January 3, 2014 are expected to be shipped within one year.
CUSTOMERS
Our Greatbatch Medical customers include large multi-national OEMs and their affiliated subsidiaries such as, in alphabetical order here and throughout this report, Biotronik, Boston Scientific, Halliburton Company, Johnson & Johnson, Medtronic, Philips Healthcare, Smith & Nephew, Sorin Group, St. Jude Medical, Stryker, and Zimmer. During 2013, 2012, and 2011, Johnson & Johnson, Medtronic and St. Jude Medical collectively accounted for 49%, 46% and 51% of our total sales, respectively. We have been successful in leveraging our diversified product line to further penetrate these customers and selling into more of their operating divisions, which cover the cardiac, neuromodulation, vascular and orthopaedic markets. QiG customers include numerous scientists, hospitals and universities throughout the world who perform research for the neuroscience and clinical markets.
The nature and extent of our selling relationshipcommercial relationships with each OEMof our customer isare different in terms of breadth of products purchased, selling prices,purchased product volumes, length of contractual commitment, ordering patterns, inventory management, and inventory management.selling prices. For customers with long-term contracts, we have generally negotiated fixedtiered pricing arrangements forbased on pre-determined volume levels with pricing fixed at each level.levels. In general, the higher the volume level, the lower the pricing. We have pricing arrangements with our customers that at times do not specify minimum order quantities. During new contract negotiations, price level decreases (concessions) for future sales may be offered to customers in exchange for volume and/or long-term commitments. Once new contracts are signed, these prices are fixed and determinable for all future sales. We recognize revenue when it is realized or realizable and earned. This occurs when persuasive evidence of an arrangement exists, delivery has occurred, the price is fixed or determinable, the buyer is obligated to pay us (i.e. payment is not contingent on a future event), the risk of loss is transferred, there is no obligation of future performance, collectability is reasonably assured and the amount of future returns can reasonably be estimated. Those criteria are met when title passes, generally at the timepoint of shipment when title passes.shipment.
Our visibility tointo customer ordering patternsforecasted purchases is only over a relatively short period of time.time into the future. Our customers may have inventory management programs, vertical integration plans and/or alternate supply arrangements which we are unaware of.that may not be communicated to or shared with us. Additionally, the relative market share among the OEM manufacturers changes periodically. Consequently, these and other factors can significantly impact our sales in any given period. Our customers may initiate field actions with respect to market-released products. These actions may include product recalls or communications with a significant number of physicians about a product or labeling issue. The scope of such actions can range from very minor issues affecting a small number of units to more significant actions. There are a number of factors, both short-term and long-term, related to these field actions that may impact our results. In the short-term, if a product has to be replaced, or customer inventory levels have to be restored, demand will increase. Also, changing customer order patterns due to market share shifts or accelerated device replacements may also have a positive or negative impact on our sales results in the near-term. These same factors may have longer-term implications as well. Customer inventory levels may ultimately have to be rebalanced to match new demand.
SUPPLIERS AND RAW MATERIALSOur Medical customers include large multi-national medical device OEMs and their subsidiaries such as Abbott Labs, Biotronik, Boehringer Ingelheim, Boston Scientific, Cardinal Health, Johnson & Johnson, LivaNova, Medtronic, Nevro Corp., Philips Healthcare, Smith & Nephew, St. Jude Medical, Stryker, and Zimmer Biomet. During 2016, Boston Scientific, Johnson & Johnson, Medtronic, and St. Jude Medical collectively accounted for 56% of our total sales. We believe that the diversification of our sales among the various subsidiaries and market segments with those four customers reduces our exposure to negative developments with any one customer. The loss of a significant amount of business from any of these four customers or a further consolidation of such customers could have a material adverse effect on our financial condition and results of operations, as further explained in Item 1A “Risk Factors” of this report.
Our Non-Medical customers include large multi-national OEMs and their subsidiaries serving the energy, military and environmental services markets such as Halliburton, Teledyne Technologies and Weatherford International.
Competition
The medical device outsourced manufacturing industry has traditionally been highly fragmented with several thousand companies, many of which we believe have limited manufacturing capabilities and limited sales and marketing expertise. We believe that very few companies offer the scope of manufacturing capabilities and services that we provide to medical device companies, however, we may compete in the future against other companies that provide broad manufacturing capabilities and related services. We compete against different companies depending on the type of product or service offered or the geographic area served. We also face competition from existing and prospective customers that employ in-house capabilities to produce some of the products we provide.
Our existing or potential competitors include suppliers with different subsets of our manufacturing capabilities, suppliers that concentrate in niche markets, and suppliers that have, are developing, or may in the future develop, broad manufacturing capabilities and related services. We compete for new business at all phases of the product lifecycle, which includes development of new products, the redesign of existing products and transfer of mature product lines to outsourced manufacturers. Competition is generally based on reputation, quality, delivery, responsiveness, breadth of capabilities, including design and engineering support, price, customer relationships and increasingly the ability to provide complete supply chain solutions rather than only producing and providing individual components.
Many of our customers, if they so choose to undertake vertical integration initiatives, also have the capability to manufacture similar products, in house, to those that we currently supply to them.
Divestitures, Acquisitions and Investments
One facet of our growth strategy is to make acquisitions that complement our core competencies in technology and manufacturing to enable us to manufacture and sell additional products to our existing customers and to expand our business into related markets.
The rapid pace of technological development in the medical industry and the specialized expertise required in different areas of medicine make it difficult for one company alone to develop an all-encompassing portfolio of technological solutions. In addition to internally generated growth through our research and development (“R&D”) efforts, we have relied, and expect to continue to rely, upon acquisitions, investments, and alliances to provide access to new technologies both in areas served by our existing businesses as well as in new areas and markets. This strategy also aligns with our customers’ expectations on increasing the speed to market of critical solutions.
We expect to make future investments or acquisitions where we believe that we can stimulate the development of, or acquire new technologies and products to further our strategic objectives, and strengthen our existing businesses. With the acquisition of Lake Region Medical, our main strategic priorities over the next two years include, among others, the integration of both legacy companies, driving integration synergies, and the paying down our outstanding debt. Our acquisition focus, if any, will be primarily directed at smaller “bolt-on” or adjacent acquisition opportunities that have a strategic fit with our existing core businesses, particularly opportunities that support our enterprise strategy and enhance the value proposition of our product offerings. For additional information, refer to Note 2 “Divestiture and Acquisitions” of the Notes to the Consolidated Financial Statements contained in Item 8 of this report and “Risks Related to Our Industries” under Item 1A “Risk Factors” of this report.
Research and Development
Our position as a leading developer and manufacturer of medical devices and components is largely the result of our long history of technological innovation. We invest substantial resources in research, development and engineering. Our scientists, engineers and technicians focus on developing new products, improving and enhancing existing products, and expanding the use of our products in new or tangential applications. In addition to our internal technology and product development efforts, we also engage outside research institutions for unique technology projects. During fiscal years 2016, 2015, and 2014, we invested $55.0 million, $53.0 million, and $49.8 million on R&D, respectively.
Product Development
Medical. Our core business is well positioned because our OEM customers leverage our portfolio of intellectual property. We continue to build a healthy pipeline of diverse medical technology opportunities. The combination of Greatbatch and Lake Region Medical brought together two highly complementary organizations that now provide a new level of industry leading capabilities and services to our OEM customers across the full range of medical device products and services continuum. Through this transformative deal, we are at the forefront of innovating technologies and products that help change the face of healthcare, enabling us to provide our customers with a distinct advantage as they bring complete medical systems and solutions to market. In turn, our customers are able to accelerate patient access to life enhancing therapies. The integrated company offers our customers a substantially more comprehensive portfolio comprising the best technologies, providing a single point of support, and driving optimal outcomes. Some of the more significant product development opportunities our Medical segment is pursuing are as follows:
|
| | | | |
| Product Line | | Product Development Opportunities | |
| AS&O | | Developing a portfolio of products including single use instruments and coated products for the orthopedics market, instruments for the robotics market, and wireless products for the portable medical and orthopedic markets. | |
| Cardio & Vascular | | Developing a portfolio of catheter, introducer, wire-based, sensor and coating products for the cardio and vascular markets. | |
| Cardiac & Neuromodulation | | Developing next generation technology programs for our batteries, filtered feedthroughs, high voltage capacitors and lead solutions to reduce the size and cost, while increasing performance for cardiac and neuromodulation devices. | |
Non-Medical. Some of the more significant product development opportunities our Non-Medical segment is pursuing include developing the next generation medium-rate and high rate batteries, as well as products with extended performance such as higher power pulsing capabilities and increased operating temperature range.
Patents and Proprietary Technology
We rely on a combination of patents, licenses, trade secrets and know-how to establish and protect our proprietary rights to our technologies and products. Often, several patents covering various aspects of the design protect a single product. We believe this provides broad protection of the inventions employed.
As of December 30, 2016, we have 1,019 issued patents. We also have 245 pending patent applications at various stages of approval. During 2016, there were 85 patent applications filed and 79 patents issued.
We are a party to several license agreements with third parties under which we have obtained, on varying terms, exclusive or non-exclusive rights to patents held by them. Examples of these agreements are the licenses of the basic technologies used in our wet tantalum capacitors, filtered feedthroughs, wireless charging technology, and MRI compatible lead systems. We have also granted rights to our patents to others under license agreements.
It is our policy to require our management and technical employees, consultants and other parties having access to our confidential information to execute confidentiality agreements. These agreements prohibit disclosure of confidential information to third parties, except in specified circumstances. In the case of employees and consultants, the agreements generally provide that all confidential information relating to our business is the exclusive property of Integer.
Manufacturing and Quality Control
We leverage our strength as an innovative designer and manufacturer of finished devices and components to the medical device industry. Our manufacturing and engineering services include: design, testing, component production, and device assembly. We have integrated our proprietary technologies in our own products and those of our customers. Our flexible, high productivity manufacturing capabilities span sites across the United States, Mexico, Uruguay, Europe, and Asia.
Due to the highly regulated nature of the products we produce, we have implemented strong quality systems across all sites. The quality systems at our sites are compliant with and certified to various recognized international standards, requirements, and directives. Each site’s quality system is certified under an applicable International Organization for Standardization (“ISO”) quality system standard, such as ISO 13485 or ISO 9001. This certification requires, among other things, an implemented quality system that applies (where applicable) to the design and manufacture of components, assemblies and finished medical devices, including component quality and supplier control. Maintenance of these certifications for each facility requires periodic re-examination from an independent notified body.
Along with ISO 13485, the facilities producing finished medical devices are subject to extensive and rigorous regulation by numerous government bodies, including the U.S. Food and Drug Administration ("FDA") and comparable international regulatory agencies in order to ship product worldwide. For these facilities, we maintain FDA registration and compliance to all applicable domestic and international regulations. Compliance with applicable regulatory requirements is subject to continual review and is monitored through periodic inspections by the FDA and other international regulatory bodies.
Sales and Marketing
We sell our products directly to our customers. In 2016, approximately 58% of our products were sold in the U.S. Sales outside the U.S. are primarily to customers whose corporate offices are located and headquartered in the U.S. Information regarding our sales by geographic area is set forth in Note 19 “Business Segment, Geographic and Concentration Risk Information” of the Notes to Consolidated Financial Statements contained in Item 8 of this report.
Although the majority of our customers contract with us to develop custom components and assemblies to fit their product specifications, we also provide system and device solutions ready for market distribution by OEMs. We have established close working relationships between our internal program managers and our customers. We market our products and technologies at industry meetings and trade shows domestically and internationally.
Internal account executives support all sales activity and involve engineers and technology professionals in the sales process to address customer requests across all product lines. For system and device solutions, we partner with our customers’ research, marketing, and clinical groups to jointly develop technology platforms in alignment with their product roadmaps and therapy needs.
We leverage our account executives with support from our engineers to design and sell product solutions into our targeted markets. Our account executives are trained to assist our customers in selecting appropriate chemistries and configurations. We market our products and services through well-defined selling strategies and marketing campaigns that are customized for each of the industries we target.
We have placed additional emphasis on reaching long-term agreements with our OEM customers in order to secure our revenue base. At times, we have provided our customers with price concessions in exchange for entering into long-term agreements and certain volume commitments.
Firm backlog orders at December 30, 2016 and January 1, 2016 were approximately $407 million and $355 million, respectively. The majority of the orders outstanding at December 30, 2016 are expected to be shipped within one year.
Suppliers and Raw Materials
We purchase certain critical raw materials from a limited number of suppliers due to the technically challenging requirements of the supplied product and/or the lengthy process required to qualify these materials both internally and with our customers. We cannot quickly establish additional or replacement suppliers for these materials because of these rigid requirements. For these critical raw materials, we maintain minimum safety stock levels and contractually partner with suppliers through contract to help ensure the continuity of supply. Historically, we have not experienced any significant interruptions or delays in obtaining critical raw materials.
Many of the raw materials that are used in our products are subject to fluctuations in market price. In particular, the prices of stainless steel, titanium and precious metals, such as platinum, have historically fluctuated, and the prices that we pay for these materials, and, in some cases, their availability, are dependent upon general market conditions. In most cases, we have pass-through pricing arrangements with our customers that purchase components containing precious metals or have established firm-pricing agreements with our suppliers that are designed to minimize our exposure to market fluctuations.
For non-critical raw material purchases, we utilize competitive pricing methods such as bulk purchases, precious metal pool buys, blanket orders, and long-term contracts to secure supply. We believe that there are alternative suppliers or substitute products available at competitive prices for all of these non-critical raw materials.
As discussed more fully in Item 1A “Risk Factors,”Factors” of this report, our business depends on a continuous supply of raw materials from a limited number of suppliers. If an unforeseen interruption of supply were to occur, we may be unable to obtain substitute
sources for these raw materials on a timely basis, or on terms acceptable to us or at all, which could harm our ability to manufacture our products profitably or on time. Additionally, we may be unable to quickly establish additional or replacement suppliers for these materials as there are a limited number of worldwide suppliers.
COMPETITIONWorking Capital Practices
Our existinggoal is to carry sufficient levels of inventory to ensure adequate supply of raw materials from suppliers and potential competitors include leading IMD manufacturers such as Biotronik, Boston Scientific, Johnson & Johnson, Medtronic, Smith & Nephew, Sorin Group, St. Jude Medical, Stryker and Zimmer that currently have vertically integrated operations and may expand their vertical integration capabilitymeet the product delivery needs of our customers. We also provide payment terms to customers in the future. Competitors also include independent suppliers who typically specializenormal course of business and rights to return product under warranty to meet the operational demands of our customers. One of our key strategic priorities over the next year will be to reduce working capital levels in order to improve our operating cash flow and pay down outstanding debt.
Government Regulation
Medical Device Regulation
The development, manufacture and sale of our products is subject to regulation by numerous agencies and legislative bodies, including the FDA and comparable foreign counterparts. In the U.S., these regulations were enacted under the Medical Device Amendments of 1976 to the Federal Food, Drug and Cosmetic Act and its subsequent amendments, and the regulations issued or proposed thereunder. These regulatory requirements subject our products and our business to numerous risks that are specifically discussed within “Risks Related to Our Industries” under Item 1A “Risk Factors” of this report. A summary of critical aspects of our regulatory environment is included below.
The FDA’s Quality System Regulations set forth requirements for our product design and manufacturing processes, require the maintenance of certain records, provide for on-site inspection of our facilities and continuing review by the FDA. Authorization to commercially market our non-exempt products in the U.S. is granted by the FDA under procedures referred to as 510(k) pre-market notification or pre-market approval (“PMA”). These processes require us to notify the FDA of the new product and obtain FDA clearance or approval before marketing the device.
The FDA classifies medical devices based on the risks associated with the device. Devices are classified into one type of component. Our known non-vertically integrated competitors includethree categories - Class I, Class II, or Class III. Class I devices are deemed to be low risk and are therefore subject to the following:
|
| |
Product Line | Competitors |
Medical batteries | Eagle-Picher
Quallion
|
| |
Capacitors | Critical Medical Components |
| |
Feedthroughs | Alberox (subsidiary of The Morgan Crucible Co. PLC) |
| |
EMI filtering | AVX (subsidiary of Kyocera)
Eurofarad
|
| |
Enclosures | Heraeus
Hudson
National
|
| |
Machined and molded components | Numerous |
| |
Value added assembly | Numerous |
| |
Catheters | Creganna
Teleflex
Vention medical
|
|
| |
Introducers | Pressure Products
Theragenics (Galt)
Merit Medical
|
| |
Stimulation leads | Oscor |
| |
Orthopaedic trays, instruments and implants | Accelent
Avalign Technologies
IMDS
Micropulse, Inc.
Juno
Orchid
Sandvik
Symmetry
Paragon
Tecomet
|
| |
Primary Power Solutions | Tracer Technologies
Engineered Power
Saft
Ultralife
|
| |
Secondary Power Solutions | Totex
Palladium
ICC/Nexergy
BMZ
Ultralife
Saft
|
least regulatory controls. Class II devices are higher risk devices than Class I and require greater regulatory controls, generally a 501(k), to provide reasonable assurance of the device’s safety and effectiveness as well as substantial equivalence to a previously cleared device, as demonstrated by data. Class III devices are generally the highest risk devices and are therefore subject to the highest level of regulatory control, requiring a PMA by the FDA before they are marketed.
We market our products in numerous foreign countries and therefore are subject to regulations affecting, among other things, product standards, sterilization, packaging requirements, labeling requirements, import laws and onsite inspection by independent bodies with the authority to issue or not issue certifications we may require to be able to sell products in certain countries. Many of the regulations applicable to our devices and products in these countries are similar to those of the FDA. The member countries of the European Union (“EU”) have adopted the European Medical Device Directives, which create a single set of medical device regulations for all member countries. These regulations require companies that wish to manufacture and distribute medical devices in the EU to maintain quality system certifications through EU recognized Notified Bodies. These Notified Bodies authorize the use of the CE Mark, which allows for free movement of our products throughout the member countries. Requirements pertaining to our products vary widely from country to country, ranging from simple product registrations to detailed submissions such as those required by the FDA.
GOVERNMENT REGULATIONIn the U.S., our introducer, guidewire, and delivery catheter products are considered Class II devices and generally the 510(k) process applies. Orthopedic instruments are considered Class I exempt, while pacing leads are subject to the Class III PMA process. In Europe, these devices are considered either Class I, Class IIa, Class III, or AIMD, under European Medical Device Directives. These Directives require companies that wish to manufacture and distribute medical devices in EU member countries to obtain a CE Mark for those products, which indicate that the products meet minimum standards of performance, essential requirements, safety conformity assessment and quality.
As described below,We believe that our business isquality controls, development, testing, manufacturing, labeling, marketing and distribution of our medical devices conform to the requirements of all pertinent regulations.
Environmental Health and Safety Laws
We are subject to direct governmental regulation, including the laws and regulations generally applicable to all businesses in the jurisdictions in which we operate. We are subject to federal, state and local environmental laws and regulations governing the emission, discharge, use, storage and disposal of hazardous materials and the remediation of contamination associated with the release of these materials at our facilities and at off-site disposal locations. Our manufacturing and research, development and engineering activities may involve the controlled use of small amounts of hazardous materials. Liabilities associated with hazardous material releases arise principally under the Federal Comprehensive Environmental Response, Compensation and Liability Act and analogous state laws that impose strict, joint and several liabilitiesliability on owners and operators of contaminated facilities and parties that arrange for the off-site disposal of hazardous materials. WeExcept as described below, we are not aware of any material noncompliance with the environmental laws currently applicable to our business and we are not subject to any material claim for liability with respect to contamination at any of our facilities or any off-site location. We may, however, become subject to these environmental liabilities in the future as a result of our historic or current operations.
Our productsCollegeville, PA facility, which was acquired as part of the Lake Region Medical acquisition, is subject to an administrative consent order entered into with the U.S. Environmental Protection Agency (the “EPA”), which requires ongoing groundwater treatment and monitoring at the site as a result of historic leaks from underground storage tanks. Upon approval by the EPA of our proposed post remediation care plan, which requires a continuation of the groundwater treatment and monitoring process at the site, we expect that the consent order will be terminated. We expect a decision from the EPA on whether our post remediation care plan has been approved in early 2017. The groundwater treatment process at the Collegeville facility consists of a groundwater extraction and treatment system and the performance of annual sampling of a defined set of groundwater wells as a means to monitor containment within approved boundaries.
Conflict Minerals and Supply Chain
We are subject to regulationSecurities and Exchange Commission (“SEC”) rules adopted pursuant to the Dodd-Frank Wall Street Reform and Consumer Protection Act concerning “conflict minerals” (generally tin, tantalum, tungsten and gold) and similar rules are under consideration by numerous government agencies, including the FDA and comparable foreign agencies. For someEU. Certain of our component technology, we have “master files” on record with the FDA. Master files may be used to provide proprietary and confidential detailed information about technology, facilities, processes, or articlesthese conflict minerals are used in the manufacturing, processing, packaging and storingmanufacture of one or more medical device components. These master files may be used by device manufacturers to supportour products. Although the rules are being challenged in court, in their premarket approval application (“PMA”), investigational device exemption application (“IDE”) or premarket notification (“510(k)”).
In the U.S., our introducer and delivery catheter products are considered Class II devices. The 510(k) process requirespresent form they require us to demonstrate thatinvestigate the source of any conflict minerals necessary to the production or functionality of our new medical devices are substantially equivalent to a legally marketed medical device. In order to support a substantial equivalence claim,products. If any such conflict minerals originated in the Democratic Republic of the Congo or adjoining countries (the “DRC region”), we must submit supporting data. In Europe,undertake comprehensive due diligence to determine whether such minerals financed or benefited armed groups in the DRC region. Since our supply chain is complex, our ongoing compliance with these devices are considered Class IIarules could affect the pricing, sourcing and Class III, respectively, under European Medical Device Directives. These Directives require companies that wish toavailability of conflict minerals used in the manufacture and distribute medical devices in European Union member countries to obtain a CE Marking for those products, which indicate that the products meet minimum standards of performance, essential requirements, safety conformity assessment and quality.
The PMA process is a more rigorous process that is required to demonstrate that a new medical device is safe and effective. This is demonstrated by generating data regarding the design, manufacturing processes, materials, bench testing, and animal testing and typically requiring human clinical data. Some of our products that we are developing are Class III medical devices that require a PMA or, in the European Union, premarket approval through submission of a Design Dossier.products.
As a manufacturer of medical devices and components that go into medical devices, weWe are also subject to periodic inspection bydisclosure requirements regarding abusive labor practices in portions of our supply chain under the FDA for compliance with the FDA’s Quality System RequirementsCalifornia Transparency in Supply Chains Act and the applicable notified body in the European Union to ensure conformity to the Medical Device DirectivesUK Modern Slavery Act.
Other Laws and Active Implantable Medical Device Directives. We believe that our quality controls, development, testing, manufacturing, labeling, marketing and distribution of our medical devices conform to the requirements of all pertinent regulations.Regulations
Our sales and marketing practices are subject to regulation by the U.S. Department of Health and Human Services pursuant to federal anti-kickback laws, and are also subject to similar state laws.
We
Employees
As of December 30, 2016, we employed approximately 9,400 persons, of whom approximately 4,825 are also subject to various other environmental, transportation and labor laws as well as various other directives and regulations bothlocated in the U.S., 2,487 are located in Mexico, 1,656 are located in Europe, 249 are located in South America, and abroad. We believe that compliance with these laws will not have a material impact on our capital expenditures, earnings or competitive position. Given the scope and nature of these laws, however, they may have a material impact on our operational results183 are located in the future.
The Patient Protection and Affordable Care Act and the Health Care and Education Affordability Reconciliation Act (collectively “Health Care Reform”) legislated broad-based changes to the U.S. healthcare system that could significantly impact our business operations and financial results, including higher or lower revenue, as well as higher employee medical costs and taxes. Health Care Reform imposes significant new taxes on medical device OEMs, which will result in a significant increase in the tax burden on our industry and which could have a material negative impact on our financial condition, results of operations and our cash flows. Other elements of Health Care Reform such as comparative effectiveness research, an independent payment advisory board, payment system reforms including shared savings pilots and other provisions could meaningfully change the way healthcare is developed and delivered, and may materially impact numerous aspects of our business, results of operations and financial condition. Many significant parts of Health Care Reform will be phased in over the next several years and require further guidance and clarification in the form of regulations. The new medical device tax, which was effective in 2013, increased our cost of sales by $0.5 million.
On August 22, 2012, the U.S. Securities and Exchange Commission (“SEC”) issued a rule under Section 1502 of the Dodd-Frank Wall Street Reform and Consumer Protection Act requiring companies to publicly disclose their use of conflict minerals that originated in the Democratic Republic of the Congo (“DRC”) or an adjoining country. Under the rule, issuers are required
to conduct a reasonable due diligence process to ascertain the source of conflict minerals, defined as tantalum, tin, gold or tungsten, that are necessary to the functionality or production of their manufactured or contracted to be manufactured products. Companies are required to provide this disclosure on a new form to be filed with the SEC called Form SD. Companies are required to file Form SD by May 31, 2014 for the 2013 calendar period and annually by May 31 every year thereafter. We anticipate additional, new compliance costs to be incurred since we utilize all of the minerals specified in the rule. We are unable to quantify the cost of implementing this new regulation at this time.
RECRUITING AND TRAINING
We invest substantial resources in our recruiting efforts to focus on a quality workforce that will support our business objectives. Our goal is to provide our associates with growth opportunities by attempting to fill many of our open employment positions internally. We further meet our hiring needs through outside sources, as required. We have an active talent review process including a comprehensive development program in place for senior management in order to ensure we are able to implement our strategic plan.
We provide training for our associates designed to educate them on safety, quality, business strategy, and our culture. Our safety training programs educate associates on basic industrial safety practices while emphasizing the importance of knowing emergency response procedures. Our training programs focus on the methodologies and technical competencies required to support current and future business needs with a strong focus on quality and continuous improvement.
Supporting our commitment to learning, we offer our associates tuition reimbursement and encourage them to continue their education at accredited colleges and universities. We have established a number of programs designed to challenge and motivate our associates specifically encouraging continuous improvement, supervisory and leadership skills. We believe ongoing development is necessary to ensure our associates utilize best practices, and share a common understanding of work practices and performance expectations.
EMPLOYEES
The following table provides a breakdown of our employees:
|
| | |
Manufacturing – U.S. | 1,746 |
|
General and administrative – U.S. | 147 |
|
Sales and marketing – U.S. | 72 |
|
Research, development and engineering – U.S. | 253 |
|
Chaumont, France facility | 247 |
|
Switzerland facility | 5 |
|
Tijuana, Mexico facility | 915 |
|
Total | 3,385 |
|
Southeast Asia. We also employ a number ofapproximately 400 temporary employees worldwide to assist us with various projects and service functions and address peaks in staff requirements. Our employees at our Chaumont, France, and Tijuana, Mexico, and Aura, Germany facilities are represented by a union. Nearly all of the positions at our Chaumont, France and Tijuana, Mexico facilities are manufacturing related. We believe that we have a good relationship with our employees.
Seasonality
Our quarterly net sales are influenced by many factors, including new product introductions, acquisitions, regulatory approvals, patient and physician holiday schedules and other factors. Net sales in the third quarter are typically lower than other quarters of the year as a result of patient tendencies to defer, if possible, procedures during the summer months and from the seasonality of the U.S. and European markets, where summer vacation schedules normally result in fewer procedures.
Inflation
We utilize certain critical raw materials (including precious metals) in our products. Our results may be negatively impacted by an increase in the price of these critical raw materials. This risk is partially mitigated as many of the supply agreements with our customers allow us to partially adjust prices for the impact of any raw material price increases and the supply agreements with our vendors have final one-time buy clauses to meet a long-term need. Historically, raw material price increases have not materially impacted our net results of operations.
Available Information
The SEC maintains a website that contains reports, proxy and information statements, and other information regarding issuers, including the Company, that file electronically with the SEC. The public can obtain any documents that we file with the SEC at http://www.sec.gov. We file annual reports, quarterly reports, proxy statements, and other documents with the SEC under the Securities Exchange Act of 1934. The public may read and copy any materials that we file with the SEC at the SEC’s Public Reference Room at 100 F Street, N.E., Room 1580, Washington, D.C. 20549. Please call the SEC at 1-800-SEC-0330 for further information on the operation of the public reference facilities.
We also make available free of charge through our Internet website our annual report on Form 10-K, quarterly reports on Form 10-Q, current reports on Form 8-K and amendments to those reports filed or furnished pursuant to Section 13(a) or 15(d) of the Securities Exchange Act of 1934 as soon as reasonably practicable after we electronically file those reports with, or furnish them to, the SEC. Our Internet address is www.integer.net. The information contained on our website is not incorporated by reference in this annual report on Form 10-K and should not be considered a part of this report.
EXECUTIVE OFFICERS OF THE COMPANY
Information concerning our executive officers is presented below as of March 4, 2014.February 28, 2017. The officers’ terms of office run from year to year until the first meeting of the Board of Directors occurring immediately following our Annual Meeting of Stockholders, and until their successors are elected and qualified, except in the case of earlier death, retirement, resignation or removal.
Mauricio ArellanoJennifer M. Bolt, age 47,48, is Executive Vice President, for Global OperationsElectrochem, and has served in that office since October 2015. From June 2013. From December 20102013 to October 2015 she was Vice President, Supply Chain and Operational Excellence for Greatbatch. Ms. Bolt held the position of Vice President, Operations for Electrochem from May 2012 to June 2013, he was President of Greatbatch Medical. Mr. Arellanoand prior to that served as Senior Vice President and Business LeaderDirector of Operations of our Cardiac and Neurology GroupRaynham, MA facility from October 2008 until December 2010, Senior Vice President and Business Leader of our CRM and Neuromodulation Group from January 2008September 2007 to October 2008, Senior Vice President and Business Leader of our Medical Solutions Group from November 2006 to January 2008, and as Vice President of Greatbatch Mexico from January 2005 to November 2006. Mr. ArellanoMay 2012. Ms. Bolt joined our Company in October 2003May 2005 as the PlantManufacturing Engineering Manager offor our former Carson City, NVAlden, NY facility. Prior to joining our Company, heshe served in a variety of human resourcesengineering and operational roles with Tyco Healthcare - Especialidades Medicas Kenmexat General Motors/Delphi and with Sony de Tijuana Este.
George M. Cintra, age 52, is Senior Vice President & Chief Technology Officer, and has served in that role since June 2013. Mr. Cintra had previously served as Vice President of Research, Development & Engineering of our Electrochem Solutions business since joining Greatbatch in August 2010. Prior to joining Greatbatch, he was Section Head & Technical Manager, Research & Development with Procter & Gamble from January 2007 to July 2010. Mr. Cintra previously held positions with Gillette Co, Duracell, W.R. Grace and Alcoa.Eastman Kodak.
Michael Dinkins, age 59,62, is Executive Vice President & Chief Financial Officer, and has served in that office since joining our Company in May 2012. As previously announced, Michael Dinkins plans to retire from the Company in early March 2017. From 2008 until May 2012, he was Executive Vice President and Chief Financial Officer of USI Insurance Services, an insurance intermediary company. From 2005 until 2008, he was Executive Vice President and Chief Financial Officer of Hilb Rogal & Hobbs Co., an insurance and risk management services company. Prior to that, Mr. Dinkins held senior positions at Guidant Corporation, Access Worldwide Communications, Cadmus Communications Group and General Electric Company.
Michelle GrahamJeremy Friedman, age 47,63, is Executive Vice President & Chief Operating Officer and has served in that role since October of 2016. Following the Company’s acquisition of Lake Region Medical in October 2015 until appointed to his current role, he was President, Cardio & Vascular. Prior to that acquisition, he was Executive Vice President of Lake Region Medical and President and Chief Operating Officer of Lake Region Medical’s Cardio & Vascular Division from August 2013 to October 2015. From September 2007 to August 2013, he was Executive Vice President and Chief Financial Officer of Accellent, Inc. From January 2001 until September 2007, Mr. Friedman held a number of leadership positions at Flextronics, a global contract manufacturing services firm, including Chief Operating Officer of Flextronics Network Services in Stockholm, Sweden and Senior Vice President for Human Resources,of Finance and Operations, Components Division. From June 1994 until January 2001, he was President and Chief Operating Officer of We’re Entertainment, Inc., a specialty retailer of apparel and hard goods. Prior to 1994, Mr. Friedman held a number of finance and operations positions with Phillips-Van Heusen Corporation and KPMG.
Antonio Gonzalez, age 43, is President, CRM & Neuromodulation, and has served in that office since October 2015. From October 2014 to October 2015, he served as Vice President, Operations, Greatbatch Medical Mexico. Previously, Mr. Gonzalez served as Executive Director, Operations Mexico between November 2011 and October 2014, Director of Global Supply Chain from November 2007 to November 2011, Director of Strategic Projects from March 2006 to November 2007, and Supply Chain Manager for Greatbatch Tecnologías de Mexico from January 2005 to March 2006. Prior to joining our Company, in December 2010. From 2005 until December 2010, she held a number of senior human resources positions at Bausch & Lomb, most recently as Vice President of Human Resources for its Global Vision Care division.
Andrew P. Holman, age 46, is Executive Vice President, Global Sales & Marketing, and hashe served in that role since June 2013. He joined Greatbatch in April 2012 as Vice Presidenta variety of Salesfinance, operations, supply chain and Marketing for Greatbatch Medical. From September 2009 to October 2011, Mr. Holman served as Executive Vice President, Sales & Marketing for DJO Global, Inc.,customer management roles with Sanmina-SCI, BellSouth Telecommunications, HSBC and from October 2005 to June 2009, he served as President of the Americas for the Orthopaedics business unit of Smith & Nephew, Inc. Mr. Holman previously held various sales and marketing leadership positions at Johnson & Johnson, Inc., Boston Scientific Corporation and Xerox Corporation.ING Bank.
Thomas J. Hook, age 51,54, has served as our President & Chief Executive Officer since August 2006. Prior to August 2006, he was our Chief Operating Officer, a position he assumed upon joining our Company in September 2004. From August 2002 until September 2004, Mr. Hook was employed by CTI Molecular Imaging where he had served as President, CTI Solutions Group.
Timothy G. McEvoy, age 56,59, is Senior Vice President, General Counsel & Secretary, and has served in that office since joining our Company in February 2007. From 1992 until January 2007, he was employed in a variety of legal roles by Manufacturers and Traders Trust Company.
AVAILABLE INFORMATIONDeclan Smyth, age 46, is President, Advanced Surgical & Orthopedics, having served in that office since the Company’s acquisition of Lake Region Medical in October 2015. From January 2013 until the Company’s acquisition of Lake Region Medical in October 2015, he was President of Lake Region Medical’s Advanced Surgical business. From January 2012 to January 2013, he was Strategic Product Leader of Surgical Devices and Diagnostics at Accellent, Inc. and prior to that served as Senior Director of Engineering at Accellent, Inc. from August 2009 to January 2012.
We make available free of charge through our Internet website our annual report on Form 10-K, quarterly reports on Form 10-Q, current reports on Form 8-KKristin Trecker, age 51, is Executive Vice President and amendmentsChief Human Resources Officer. Prior to those reports filed or furnished pursuantjoining the Company in November 2015, she served as Senior Vice President and Chief Human Resources Officer for MTS Systems in Minneapolis, Minnesota from February 2012 until October 2015. From April 2006 to Section 13(a) or 15(d) of the Securities Exchange Act of 1934 as soon as reasonably practicable after we electronically file those reports with, or furnish them to, the SEC. Our Internet address is July 2011, she was Senior Vice President Human Resources at Lawson Software.www.greatbatch.com. The information contained on our website is not incorporated by reference in this annual report on Form 10-K and should not be considered a part of this report. These items may also be obtained free of charge by written request made to Christopher J. Thome, Assistant Corporate Controller – Reporting and Shared Services, Greatbatch, Inc., 10000 Wehrle Drive, Clarence, New York 14031.
CAUTIONARY FACTORS THAT MAY AFFECT FUTURE RESULTS
Some of the statements contained in this annual report on Form 10-K and other written and oral statements made from time to time by us and our representatives are not statements of historical or current fact. As such, they are “forward-looking statements” within the meaning of Section 27A of the Securities Act of 1933, as amended, and Section 21E of the Securities Exchange Act of 1934, as amended. We have based these forward-looking statements on our current expectations, and these statements are subject to known and unknown risks, uncertainties and assumptions. Forward-looking statements include statements relating to:
future sales, expenses and profitability;
future development and expected growth of our business and industry;
our ability to execute our business model and our business strategy;
our ability to identify trends within our industries and to offer products and services that meet the changing needs of those markets; and
projected capital expenditures.
You can identify forward-looking statements by terminology such as “may,” “will,” “should,” “could,” “expects,” “intends,” “plans,” “anticipates,” “believes,” “estimates,” “predicts,” “potential” or “continue” or “variations” or the negative of these terms or other comparable terminology. These statements are only predictions. Actual events or results may differ materially from those stated or implied by these forward-looking statements. In evaluating these statements and our prospects, you should carefully consider the factors set forth below. All forward-looking statements attributable to us or persons acting on our behalf are expressly qualified in their entirety by these cautionary factors and to others contained throughout this report. We are under
no duty to update any of the forward-looking statements after the date of this report or to conform these statements to actual results.
Although it is not possible to create a comprehensive list of all factors that may cause actual results to differ from the results expressed or implied by our forward-looking statements or that may affect our future results, some of these factors include the following: our high level of indebtedness, our inability to pay principal and interest on this high level of outstanding indebtedness or to remain in compliance with financial and other covenants under our senior secured credit facilities, and the risk that this high level of indebtedness limits our ability to invest in our business and overall financial flexibility; our dependence upon a limited number of customers; customer ordering patterns; product obsolescence; our inability to market current or future products; pricing pressure from our customers; our ability to timely and successfully implement cost reductionsavings and plant consolidation initiatives; our reliance on third party suppliers for raw materials, products and subcomponents; fluctuating operating results; our inability to maintain high quality standards for our products; challenges to our intellectual property rights; product liability claims; product field actions or recalls; our inability to successfully consummate and integrate acquisitions and to realize synergies and to operate these acquired businesses, including Lake Region Medical, in accordance with expectations; our unsuccessful expansion into new markets; our failure to develop new products including medicalsystem and device systems;products; the timing, progress and ultimate success of pending regulatory actions and approvals; our inability to obtain licenses to key technology; regulatory changes, including health care reform, or consolidation in the healthcare industry; global economic factors including currency exchange rates and interest rates; the resolution of various legal actions brought against the Company; and other risks and uncertainties that arise from time to time and are described in Item 1A “Risk Factors” of this report.
ITEM 1A. RISK FACTORS
Our business faces many risks. Any of the risks discussed below, or elsewhere in this report or in our other SEC filings, could have a material impact on our business, financial condition or results of operations.
Risks Related To Our Business
We depend heavily on a limited number of customers, and if we lose any of them or they reduce their business with us, we would lose a substantial portion of our revenues.
In 2013,2016, Boston Scientific, Johnson & Johnson, Medtronic, and St. Jude Medical collectively accounted for approximately 49%56% of our revenues. Our supply agreements with these customers may not be renewed. Furthermore, many of our supply agreements do not contain minimum purchase level requirements and therefore there is no guaranteed source of revenue that we can depend upon under these agreements. The loss of any large customer, or a reduction of business with that customer, for any reasonor a delay or failure by that customer to make payments due to us, would harm our business, financial condition and results of operations.
If we do not respond to changes in technology, our products may become obsolete and we may experience a loss of customers and lower revenues.
We sell our products to customers in several industries that experience rapid technological changes, new product introductions and evolving industry standards. Without the timely introduction of new products and enhancements, our products and services will likely become technologically obsolete over time and we may lose or see a reduction on business from a significant number of our customers. In addition, other new products introduced by our customers may require fewer of our components. We dedicate a significant amount of resources to the development of our products and technologiestechnologies. Our product development efforts may be affected by a number of factors, including our ability to anticipate customer needs, develop new products, secure intellectual property protection for our products, and wemanufacture products in a cost effective manner. We would be harmed if we did not meet customer requirements and expectations. Our inability, for technological or other reasons, to successfully develop and introduce new and innovative products and enhancements could result in a loss of customers and lower revenues.
We may face competition that could harm our business and we may be unable to compete successfully against new entrants and established companies with greater resources.
Competition in connection with the manufacturing of our medical products has intensified in recent years and may continue to intensify in the future. One or more of our medical customers may undertake additional vertical integration and/or supplier diversification initiatives and begin to manufacture or dual-source some or all of their components that we currently supply to them, which could cause our operating results to suffer. The market for commercial power sources is competitive, fragmented and subject to rapid technological change. Many other commercial power source suppliers are larger and have greater financial, operational, economies of scale, personnel, sales, technical and marketing resources than us. These and other companies may develop products that are superior, technologically or otherwise, or more cost effective to ours, which could result in lower revenues and operating results.
If we are unable to successfully market our current or future products, our business will be harmed and our revenues and operating results will be adversely affected.
The markets for our products have been growingchanging in recent years. If the markets for our products do not grow as forecasted by industry experts, our revenues could be less than expected. In addition,Furthermore, it is difficult to predict the rate at which the markets for our products will grow or at whichif new and increased competition will result in market saturation. Slower growth in the cardiac, and neuromodulation, orthopaedic,advanced surgical, orthopedic, portable medical, cardio and vascular, environmental, military or energy markets in particular would negatively impact our revenues. In addition, we face the risk that our products will lose widespread market acceptance. Our customers may not continue to utilize the products we offer and a market may not develop for our future products.
We may at times determine that it is not technically or economically feasible for us to continue to manufacture certain products and we may not be successful in developing or marketing them. Additionally, new technologies that we develop may not be rapidly accepted because of industry-specific factors, including the need for regulatory clearance, entrenched patterns of clinical practice and uncertainty over third party reimbursement. If this occurs, our business will be harmed and our revenues and operating results will be negativelyadversely affected.
We intend to develop new products and expand into new markets, which may not be successful and could harm our operating results.
We intend to expand into new markets and develop new and modified products based on our existing technologies and engineering capabilities, including the development of complete medical device systems. These efforts have required and will continue to require us to make substantial investments, including significant research, development and engineering expenditures and capital expenditures for new, expanded or improved manufacturing facilities. Additionally, many of the new products we are working on and developing take longer and more resources to develop and commercialize, including obtaining regulatory approval.
Specific risks in connection with expanding into new products and markets include: longer product development cycles, the inability to transfer our quality standards and technology into new products, the failure to receive or delay in receipt of regulatory approval for new products or modifications to existing products, and the failure of our customers to accept the new or modified products. Our inability to develop new products or expand into new markets, as currently intended, could hard our business, financial condition and results of operations.
We may never realize the full value of our intangible assets, which represent a significant portion of our total assets.
At December 30, 2016, we had $1.9 billion of intangible assets, representing 67% of our total assets. These intangible assets consist primarily of goodwill, trademarks, tradenames, customer lists and patented technology arising from our acquisitions. Goodwill and other intangible assets with indefinite lives are not amortized, but are tested annually or upon the occurrence of certain events that indicate that the assets may be impaired. Definite lived intangible assets are amortized over their estimated useful lives and are tested for impairment upon the occurrence of certain events that indicate that the assets may be impaired. We may not receive the recorded value for our intangible assets if we sell or liquidate our business or assets. In addition, this significant amount of intangible assets increases the risk of a large charge to earnings in the event that the recoverability of these intangible assets is impaired. In the event of such a charge to earnings, the market price of our common stock could be negatively affected. In addition, intangible assets with definite lives, which represent $849.8 million of our net intangible assets at December 30, 2016, will continue to be amortized. We incurred total amortization expenses relating to these intangible assets of $37.9 million in 2016. These expenses will reduce our future earnings or increase our future losses.
We are subject to pricing pressures from customers, which could harm our operating results.
We have made price concessions to some of our larger customers in recent years and we expect customer pressure for price concessions will continue. Price concessions or reductions may cause our operating results to suffer. In addition, any delay or failure by a large customer to make payments due to us would harm our operating results and financial condition.
We rely on third party suppliers for raw materials, key products and subcomponents, and if we are unable to obtain these materials, products andand/or subcomponents on a timely basis or on terms acceptable to us, our ability to manufacture products will suffer.
Our business depends on a continuous supply of raw materials. The principal raw materials used in our business include lithium, iodine, gold, CFx, palladium, stainless steel, aluminum, cobalt chrome, tantalum, platinum, ruthenium, gallium trichloride, tantalum pellets, vanadium pentoxide,oxide, iridium, titanium and titanium.plastics. The supply and price of these raw materials are susceptible to fluctuations due to transportation issues, government regulations, price controls, foreign civil unrest, tariffs, worldwide economic climateconditions or other unforeseen circumstances. Increasing global demand for these raw materials has caused prices of these materials to increase significantly.increase. In addition, there are a limited number of worldwide suppliers of several raw materials needed to manufacture our products. WeFor reasons of quality, cost effectiveness or availability, we obtain some raw materials from a single supplier. Although we work closely with our suppliers to ensure continuity of supply, we may not be able to continue to procure raw materials critical to our business at all or to procure them at acceptable price levels.
In addition, we rely on third party manufacturers to supply many of ourthe products and subcomponents.subcomponents that are incorporated into our own products and components. Manufacturing problems may occur with these and other outside sources, as a supplier may fail to develop and supply products and subcomponents to us on a timely basis, or may supply us with products and subcomponents that do not meet our quality, quantity and cost requirements. If any of these problems occur, we may be unable to obtain substitute sources for these products and subcomponents on a timely basis or on terms acceptable to us, which could harm our ability to manufacture our own products and components profitably or on time. In addition, to the extent the processes our suppliers use to manufacture products and subcomponents are proprietary, we may be unable to obtain comparable products and subcomponents from alternative suppliers.
We may never realize the full value of our intangible assets, which represent a significant portion of our total assets.
At January 3, 2014, we had $443.1 million of intangible assets, representing 50% of our total assets. These intangible assets consist primarily of goodwill, trademarks, tradenames, customer lists and patented technology arising from our acquisitions. Goodwill and other intangible assets with indefinite lives are not amortized, but are tested annually or upon the occurrence of certain events which indicate that the assets may be impaired. Definite lived intangible assets are amortized over their estimated useful lives and are tested for impairment upon the occurrence of certain events which indicate that the assets may be impaired. We may not receive the recorded value for our intangible assets if we sell or liquidate our business or assets. In addition, the significant amount of intangible assets increases the risk of a large charge to earnings in the event that the recoverability of these intangible assets is impaired. In the event of such a charge to earnings, the market price of our common stock could be affected. In addition, intangible assets with definite lives, which represent $76.1 million of our net intangible assets at January 3, 2014, will continue to be amortized. We incurred total amortization expenses relating to these intangible assets of $13.2 million in 2013. These expenses will reduce our future earnings or increase our future losses.
Quality problems with our products could harm our reputation and erode our competitive advantage.
OurQuality is important to us and our customers, and our products, given their intended uses, are held to high quality and performance standards. In the event our products fail to meet these standards, our reputation could be harmed, which could damageerode our competitive advantage causeover competitors, causing us to lose or see a reduction in business from customers and resultresulting in lower revenues.
Quality problems with our products could result in warranty claims and additional costs.
We generally allow customers to return defective or damaged products for credit, replacement or exchange.repair. We generally warrant that our products will meet customer specifications and will be free from defects in materials and workmanship. Additionally, we carry a safety stock of inventory for our customers whichthat may be impacted by warranty claims. We reserve for our exposure to warranty claims based upon recent historical experience and other specific information as it becomes available. However, these reserves may not be adequate to cover future warranty claims andclaims. If these reserves are inadequate, additional warranty costs or inventory write-offs may need to be incurred in the future, which could harm our operating results.
Regulatory issues resulting from product complaints, or recalls, or regulatory audits could harm our ability to produce and supply products or bring new products to market.
Our products are designed, manufactured and distributed globally in compliance with all applicable regulations and standards. However, a product complaint, recall or negative regulatory audit may cause our products to be removed from the market and harm
our operating results or financial condition. In addition, during the period in which corrective action is being taken by us to remedy a complaint, recall or negative audit, regulators may not allow our new products to be cleared for marketing and sale.
If we become subject to product liability claims, our operating results and financial condition could suffer.
The manufacturing and sale of our products exposeOur business exposes us to potential product liability claims that are inherent in the design, manufacture and product recalls,sales of our products. Product failures, including those that arise from the failure to meet product specifications, misuse or malfunction, or design flaws, or the use of our products with components or systems not manufactured or sold by us.us could result in product liability claims or a recall. Many of our products are components and function in interaction with our customers’ medical devices. For example, our batteries are produced to meet electrical performance, longevity and other specifications, but the actual performance of those products is dependent on how they are utilized as part of theour customers’ devices over the lifetime of thetheir products. Product performance and device interaction from time to time have been, and may in the future be, different than expected for a number of reasons. Consequently, it is possible that customers may experience problems with their medical devices that could require device recall or other corrective action, where our batteries met the specification at delivery, and for reasons that are not related primarily or at all to any failure by our product to perform in accordance with specifications. It is possible that our customers (or end-users) may in the future assert that our products caused or contributed to device failure. Even if these assertions do not lead to product liability or contract claims, they could harm our reputation and our customer relationships.
Provisions contained in our agreements with key customers attempting to limit our damages, including provisions to limit damages to liability for negligence, may not be enforceable in all instances or may otherwise fail to adequately protect us from liability for damages. Product liability claims or product recalls, regardless of their ultimate outcome, could require us to spend significant time and money in litigation and require us to pay significant damages. The occurrence of product liability claims or product recalls could affect our operating results and financial condition.
We carry product liability insurance with coverage that is limited in scope and amount. We may not be able to maintain this insurance at a reasonable cost or on reasonable terms, or at all. This insurance may not be adequate to protect us against a product liability claim that arises in the future.
Our operating results may fluctuate, which may make it difficult to forecast our future performance and may result in volatility in our stock price.
Our operating results have fluctuated in the past and are likely to continue to fluctuate significantly from quarter to quarter, making forecasting future performance difficult and resulting in volatility in our stock price. These fluctuations are due to a variety of factors, including the following:
a substantial percentage of our costs are fixed in nature, which results in our operations being particularly sensitive to fluctuations in production volumes;
changes in the mix of our revenue represented by our various products and customers could result in reductions in our profits if the mix of our revenue represented by lower margin products increases;
timing of orders placed by our principal customers who account for a significant portion of our revenues; and
increased costs of raw materials or supplies.
If we are unable to protect our intellectual property and proprietary rights, our business could be affected.harmed.
We rely on a combination of patents, licenses, trade secrets and know-how to establish and protect our rights to our technologies and products. As of January 3, 2014,December 30, 2016, we held 625have 1,019 active U.S. patents and 344 active foreign patents.filed. However, the steps we have taken and will take in the future to protect the intellectual property rights to our rightstechnologies and products may not be adequate to deter misappropriation of our intellectual property. In addition to seeking formal patent protection whenever possible, we attempt to protect our proprietary rights and trade secrets by entering into confidentiality and non-compete agreements with employees, consultants and third parties with which we do business. However, these agreements may be breached and, if breached, there may be no adequate remedy available to us and we may be unable to prevent the unauthorized disclosure or use of our technical knowledge, practices and/or procedures. If our trade secrets become known, we may lose our competitive advantages. Additionally, as patents and other intellectual property protection expire, we may lose our competitive advantage.
If third parties infringe or misappropriate our patents or other proprietary rights, our business could be seriously harmed. We may be required to spend significant resources to monitor our intellectual property rights, or we may not be able to detect infringement of these rights and may lose our competitive advantages associated with our intellectual property rights before we do so. In addition, competitors may design around our technology or develop competing technologies that do not infringe on our proprietary rights.
We may be subject to intellectual property claims, which could be costly and time consuming and could divert our management from our business operations.
In producing our products, third parties may claim that we are infringing on their intellectual property rights, and we may be found to have infringed on those intellectual property rights. We may be unaware of intellectual property rights of others that may be used in our technology and products. In addition, third parties may claim that our patents have been improperly granted and may seek to invalidate our existing or future patents. If any claim for invalidation prevailed, third parties may manufacture and sell products that compete with our products and our revenues from any related license agreements would decrease accordingly. We also typically do not receive significant indemnification from parties that license technology to us against third party claims of intellectual property infringement.
Any litigation or other challenges regarding our patents or other intellectual property could be costly and time consuming and could divert the attention of our management and key personnel from our business operations. The complexity of the technology involved in producing our products, and the uncertainty of intellectual property litigation increases these risks. Claims of intellectual property infringement may also require us to enter into costly royalty or license agreements. However, we may not be able to obtain royalty or license agreements on terms acceptable to us, or at all. We also may be made subject to significant damages or injunctions against development and sale of our products.
We may not be able to attract, train and retain a sufficient number of qualified employees to maintain and grow our business.
Our success will depend in large part upon our ability to attract, train, retain and motivate highly skilled employees. There is currently aggressive competition for employees who have experience in technology and engineering. We compete intensely with other companies to recruit and hire from this limited pool. The industries in which we compete for employees are characterized by high levels of employee attrition. Although we believe we offer competitive salaries and benefits, we may have to increase spending in order to attract, train and retain personnel.
We are dependent upon our senior management team and key personnel and the loss of any of them could significantly harm us.
Our future performance depends to a significant degree upon the continued contributions of our senior management team and key technical personnel. Our products are highly technical in nature. In general, only highly qualified and trained scientists have the necessary skills to develop our products. The loss or unavailability to us of any member of our senior management team or a key technical employee could significantly harm us. We face intense competition for these professionals from our competitors, customers and companies operating in our industry. To the extent that the services of members of our senior management team and key technical personnel would be unavailable to us for any reason, we would be required to hire other personnel to manage and operate our Company and to develop our products and technology. We may not be able to locate or employ such qualified personnel on acceptable terms.
We may not realize the expected benefits from our cost savings and consolidation initiatives or those initiatives may have unintended consequences, which may harm our business or results of operations.
We have incurred significant charges related to various cost savings and consolidation efforts. These initiatives were undertaken to improve our operational effectiveness, efficiencies and profitability. Additional information regarding these initiatives is discussed in the “Cost Savings and Consolidation Efforts” section of Item 7 to this report. Cost reduction efforts under these initiatives include various cost and efficiency improvement measures such as, headcount reductions, the relocation of certain resources as well as administrative and functional activities, the closure of certain facilities, the transfer of certain production lines, the sale of certain non-strategic assets and other efforts to streamline our business, among other actions. These measures could yield unintended consequences, such as distraction of our management and employees, business disruption, disputes with customers, attrition beyond our planned reduction in workforce and reduced employee productivity. If any of these unintended consequences were to occur, they could negatively affect our business, sales, financial condition and results of operations. In addition, headcount reductions and customer disputes may subject us to the risk of litigation, which could result in substantial cost. Moreover, our expense reduction programs result in charges and expenses that impact our operating results. We cannot guarantee that these measures, or other expense reduction measures we take in the future, will result in the expected cost savings.
We may make acquisitions that could subject us to a number of operational risks and we may not be successful in integrating companies we acquire into our existing operations.
We have made and expect to make in the future acquisitions that complement our core competencies in technology and manufacturing to enable us to manufacture and sell additional products to our existing customers and to expand our business into related markets. Implementation of our acquisition strategy entails a number of risks, including:
inaccurate assessments of potential liabilities associated with the acquired businesses;
the existence of unknown or undisclosed liabilities associated with the acquired businesses;
diversion of our management’s attention from our core businesses;
potential loss of key employees or customers of the acquired businesses;
difficulties in integrating the operations and products of an acquired business or in realizing projected revenue growth, efficiencies and cost savings; and
increases in indebtedness and limitation in our ability to access capital if needed.
Our acquisitions have increased the size and scope of our operations, and may place a strain on our managerial, operational and financial resources and systems. Any failure by us to manage this growth and successfully integrate these acquisitions could harm our business and our financial condition and results.
If we are not successful in making acquisitions to expand and develop our business, our operating results may suffer.
One facet of our growth strategy is to make acquisitions that complement our core competencies in technology and manufacturing to enable us to manufacture and sell additional products to our existing customers and to expand our business into related markets. Our continued growth may depend on our ability to identify and acquire companies that complement or enhance our business on acceptable terms. We may not be able to identify or complete future acquisitions. Some of the risks that we may encounter include expenses associated with and difficulties in identifying potential targets, the costs associated with unsuccessful acquisitions, and higher prices for acquired companies because of competition for attractive acquisition targets.
Accidents at any of our facilities could delay production and affect our operations.
Our business involves complex manufacturing processes and hazardous materials that can be dangerous to our employees. Although we employ safety procedures in the design and operation of our facilities, there is a risk that an accident or death could occur. Any accident, such as a chemical spill or fire, could result in significant manufacturing delays or claims for damages resulting from injuries, which would harm our operations and financial condition. The potential liability resulting from any such accident or death, to the extent not covered by insurance, could harm our financial condition or operating results. Any disruption of operations at any of our facilities, and in particular our larger facilities, could harm our business.
We may face competition that could harm our business and we may be unable to compete successfully against new entrants and established companies with greater resources.
Competition in connection with the manufacturing of our medical products may intensify in the future. One or more of our medical customers may undertake additional vertical integration initiatives and begin to manufacture some or all of their components that we currently supply them which could cause our operating results to suffer. The market for commercial power sources is competitive, fragmented and subject to rapid technological change. Many other commercial power source suppliers are larger and have greater financial, operational, personnel, sales, technical and marketing resources than us. These and other companies may develop products that are superior to ours, which could result in lower revenues and operating results.
We intend to develop new products and expand into new markets, which may not be successful and could harm our operating results.
We intend to expand into new markets and develop new and modified products based on our existing technologies and engineering capabilities, including the development of complete medical device systems. These efforts have required and will continue to require us to make substantial investments, including significant research, development and engineering expenditures and capital expenditures for new, expanded or improved manufacturing facilities. Additionally, many of the new products we are working on take longer and more resources to develop and commercialize, including obtaining regulatory approval.
Specific risks in connection with expanding into new products and markets include: longer product development cycles, the inability to transfer our quality standards and technology into new products, the failure to receive or delay in receipt of regulatory approval for new products or modifications to existing products, and the failure of our customers to accept the new or modified products.
Our failure to obtain licenses from third parties for new technologies or the loss of these licenses could impair our ability to design and manufacture new products and reduce our revenues.
We occasionally license technologies from third parties rather than depending exclusively on our own proprietary technology and developments. Our ability to license new technologies from third parties is and will continue to be critical to our ability to offer new and improved products. We may not be able to continue to identify new technologies developed by others and even if we are able to identify new technologies, we may not be able to negotiate licenses on favorable terms, or at all. Additionally, we could lose rights granted under licenses for reasons beyond our control.
We may not be able to attract, train and retain a sufficient number of qualified employees to maintain and grow our business.
We monitor the markets in which we compete and assess opportunities to better align expenses with revenues, while preserving our ability to make needed investments in research and development projects, capital and our people that we believe are critical to our long-term success. Our success will depend in large part upon our ability to attract, train, retain and motivate highly skilled employees. There is currently aggressive competition for employees who have experience in technology and engineering. We compete intensely with other companies to recruit and hire from this limited pool. The industries in which we compete for employees are characterized by high levels of employee attrition. Although we believe we offer competitive salaries and benefits, we may have to increase spending in order to attract, train and retain qualified personnel.
We are dependent upon our senior management team and key technical personnel and the loss of any of them could significantly harm us.
Our future performance depends to a significant degree upon the continued contributions of our senior management team and key technical personnel. In general, only highly qualified and trained scientists have the necessary skills to develop our products, which are often highly technical in nature. The loss or unavailability to us of any member of our senior management team or a key technical employee could significantly harm us. We face intense competition for these professionals from our competitors, customers and companies operating in our industry. To the extent that the services of members of our senior management team and key technical personnel would be unavailable to us for any reason, we would be required to hire other personnel to manage and operate our Company and to develop our products and technology, which could negatively impact our business. We may not be able to locate or employ these qualified personnel on acceptable terms or may need to increase spending in order to attract these qualified personnel.
We may not realize the expected benefits from our cost savings and consolidation initiatives or those initiatives may have unintended consequences, which may harm our business.
We have incurred significant charges related to various cost savings and consolidation initiatives. These initiatives were undertaken to improve our operational effectiveness, efficiencies and profitability. Information regarding some of these initiatives is discussed in Note 13 “Other Operating Expenses, Net” of the Notes to Consolidated Financial Statements contained in Item 8 of this report. Cost reduction efforts under these initiatives include various cost and efficiency improvement measures, such as headcount reductions, the relocation of resources and administrative and functional activities, the closure of facilities, the transfer of production lines, the sale of non-strategic assets and other efforts to streamline our business, among other actions. These measures could yield unintended consequences, such as distraction of our management and employees, business disruption, disputes with customers, attrition beyond our planned reduction in workforce and reduced employee productivity. If any of these unintended consequences were to occur, they could negatively affect our business, financial condition and results of operations. In addition, headcount reductions and customer disputes may subject us to the risk of litigation, which could result in substantial cost. Moreover, our cost reduction efforts result in charges and expenses that impact our operating results. Our cost savings and consolidation initiatives, or other expense reduction measures we take in the future, may not result in the expected cost savings.
We have significant indebtedness that could affect our operations and financial condition, and our failure to meet certain financial covenants required by our debt agreements may materially and adversely affect our assets, financial position and cash flows.
At December 30, 2016, our total indebtedness was $1.7 billion. We incurred substantial additional indebtedness in connection with the Lake Region Medical acquisition. We funded the cash portion of the Lake Region Medical acquisition consideration, the pay-off of certain outstanding indebtedness of ours and of Lake Region Medical and the payment of transaction-related expenses through a combination of available cash-on-hand and proceeds from debt financings, which financings consisted of the issuance of $360 million of 9.125% senior notes due 2023 and borrowings of $1.4 billion under our Senior Secured Credit Facility. As of December 30, 2016, our debt service obligations, comprised of principal and interest, during the following 12 months are estimated to be approximately $133 million. The outstanding indebtedness and the terms and covenants of the agreements under which this debt was incurred, could, among other things:
require us to dedicate a large portion of our cash flow from operations to the servicing and repayment of our outstanding indebtedness, thereby reducing funds available for working capital, capital expenditures, research and development expenditures and other general corporate requirements;
limit our ability to obtain additional financing to fund future working capital, capital expenditures, research and development expenditures and other general corporate requirements in the future;
limit our flexibility in planning for, or reacting to, changes in our business and the industry in which we operate;
restrict our ability to make strategic acquisitions or dispositions or to exploit business opportunities;
place us at a competitive disadvantage compared to our competitors that have less outstanding indebtedness; and
adversely affect the market price of our common stock.
We incurred substantial expenses related to the acquisition of Lake Region Medical and expect to continue to incur substantial expenses related to its integration.
We have incurred substantial expenses in connection with the acquisition of Lake Region Medical and expect to continue to incur substantial expenses in connection with its integration. As of December 30, 2016, we have incurred approximately $61 million in acquisition and integration costs related to the Lake Region Medical acquisition. Since our acquisition of Lake Region Medical, we achieved approximately $34 million in cumulative annual run-rate synergies, which exceeded our $25 million target. These net synergies are expected to increase to $60 million by 2018. We expect the investment necessary to achieve these synergies to consist of $20 million to $25 million in capital expenditures and $40 million to $50 million of operating expenses. However, many of the expenses that will be incurred are, by their nature, difficult to estimate accurately. These expenses could, particularly in the near term, exceed the savings that we expect to achieve from elimination of duplicative expenses and the realization of economies of scale and cost savings. Although we expect that the realization of efficiencies related to the integration of Lake Region Medical’s business will offset incremental transaction, acquisition-related and restructuring costs over time, this net benefit may not be achieved in the near term, or at all.
Successful integration of Lake Region Medical and anticipated benefits of the Lake Region Medical acquisition cannot be assured and integration matters could divert attention of management away from operations. The Lake Region Medical acquisition could have an adverse effect on our business relationships.
There can be no assurance that the Company will be able to maintain and grow its Lake Region Medical business and operations. In addition, the market segments in which Lake Region Medical operates may experience declines in customer demand and/or the entrance of new competitors. Customers, suppliers and other third parties with business relationships with us may decide not to renew or may decide to seek to terminate, change or renegotiate their relationships with us as a result of the Lake Region Medical acquisition, whether pursuant to the terms of their existing agreements with us or otherwise.
Our ability to realize the anticipated benefits of the Lake Region Medical acquisition will depend, to a large extent, on our ability to integrate the legacy businesses. Integrating and coordinating aspects of the operations and personnel of Lake Region Medical with legacy businesses involves complex operational, technological and personnel-related challenges. This process is time-consuming and expensive, disrupts the businesses of both companies and may not result in the full benefits expected by us, including cost synergies expected to arise from supply chain efficiencies and overlapping general and administrative functions.
The potential difficulties, and resulting costs and delays, include:
managing a larger combined company;
consolidating corporate and administrative infrastructures;
issues in integrating manufacturing, warehouse and distribution facilities, research and development and sales forces;
difficulties attracting and retaining key personnel;
loss of customers and suppliers and inability to attract new customers and suppliers;
unanticipated issues in integrating information technology, communications and other systems;
incompatibility of purchasing, logistics, marketing, administration and other systems and processes; and
unforeseen and unexpected liabilities related to the acquisition or Lake Region Medical’s business.
Additionally, the integration of our legacy businesses and Lake Region Medical’s operations, products and personnel may place a significant burden on management and other internal resources. The attention of our management may be directed towards integration considerations and may be diverted from our day-to-day business operations, and matters related to the integration may require commitments of time and resources that could otherwise have been devoted to other opportunities that might have been beneficial to us and our business. The diversion of management’s attention, and any difficulties encountered in the transition and integration process, could harm our business, financial condition and operating results.
Even if our businesses are successfully integrated, we may not realize the full benefits of the Lake Region Medical acquisition, including anticipated synergies, cost savings or growth opportunities, within the expected timeframe or at all. In addition, we expect to incur significant integration and restructuring expenses to realize synergies. However, many of the expenses that will be incurred are, by their nature, difficult to estimate accurately. These expenses could, particularly in the near term, exceed the savings that we expect to achieve from elimination of duplicative expenses and the realization of economies of scale and cost savings. Although we expect that the realization of efficiencies related to the integration of the businesses may offset incremental transaction, acquisition-related and restructuring costs over time, we cannot give any assurance that this net benefit will be achieved in the near term, or at all.
Any of the matters described above could adversely affect our business or harm our financial condition, results of operations or business prospects.
We may experience significant variability in our quarterly and annual effective tax rate and may not be able to use our net operating loss carryforwards and tax credit carryforwards which would affect our reported net income.
We have a complex tax profile due to the global nature of our operations, which encompass multiple taxing jurisdictions. Variability in the mix and profitability of domestic and international activities, identification and resolution of various tax uncertainties, changes in tax laws and rates, and the extent to which we are able to realize net operating loss and other carryforwards included in deferred tax assets and avoid potential adverse outcomes included in deferred tax liabilities, among other matters, may significantly affect our effective income tax rate in the future.
Changes in U.S. or international tax laws could materially affect our financial position and results of operations. The U.S. is actively considering changes to existing tax laws including lower corporate tax rates and changes to the taxability of imports and exports. In addition, many countries in the European Union, as well as a number of other countries and organizations such as the Organization for Economic Cooperation and Development, are actively considering changes to existing tax laws. If tax laws and related regulations change, our financial results could be materially impacted. Given the unpredictability of these possible changes and their potential interdependency, it is possible such changes could adversely impact our financial results.
Our effective income tax rate is the result of the income tax rates in the various countries in which we do business. Our mix of income and losses in these jurisdictions affects our effective tax rate. For example, relatively more income in higher tax rate jurisdictions would increase our effective tax rate and thus lower our net income. Similarly, if we generate losses in tax jurisdictions for which no benefits are available, our effective income tax rate will increase. Our effective income tax rate may also be impacted by the recognition of discrete income tax items, such as required adjustments to our liabilities for uncertain tax positions or our deferred tax asset valuation allowance. A significant increase in our effective income tax rate could have a material adverse impact on our earnings.
We have recorded deferred tax assets based on our assessment that we will be able to realize the benefits of our net operating losses and other favorable tax attributes. Realization of deferred tax assets involve significant judgments and estimates which are subject to change and ultimately depends on generating sufficient taxable income of the appropriate character during the appropriate periods. Changes in circumstances may affect the likelihood of such realization, which in turn may trigger a write-down of our deferred tax assets, the amount of which would depend on a number of factors. A write-down would reduce our reported net income, which may adversely impact our financial condition or results of operations or cash flows. In addition, we are potentially subject to ongoing and periodic tax examinations and audits in various jurisdictions, including with respect to the amount of our net operating losses and any limitation thereon. An adjustment to such net operating loss carryforwards, including an adjustment from a taxing authority, could result in higher tax costs, penalties and interest, thereby adversely impacting our financial condition, results of operations or cash flows.
If we are not successful in making acquisitions to expand and develop our business, our operating results may suffer.
One facet of our growth strategy is to make acquisitions that complement our core competencies in technology and manufacturing to enable us to manufacture and sell additional products to our existing customers and to expand our business into related markets. Our continued growth may depend on our ability to identify and acquire companies that complement or enhance our business on acceptable terms. We may not be able to identify or complete future acquisitions. In addition, even if we are able to identify future acquisitions, we may not be able to effect such acquisitions under the terms of the Indenture governing our 9.125% senior notes due 2023 or our Senior Secured Credit Facility. Some of the risks that we may encounter include expenses associated with and difficulties in identifying potential targets, the costs associated with unsuccessful acquisitions, and higher prices for acquired companies because of competition for attractive acquisition targets.
Interruptions of our manufacturing operations could delay production and affect our operations.
Our products are designed and manufactured in facilities located around the world. In most cases, the manufacturing of specific product lines is concentrated in one or a few locations. Our business involves complex manufacturing processes and hazardous materials that can be dangerous to our employees. Although we employ safety procedures in the design and operation of our facilities, there is a risk that an accident or death could occur. Any accident, such as a chemical spill or fire, could result in significant manufacturing delays or claims for damages resulting from injuries, which would harm our operations and financial condition. The potential liability resulting from any such accident or death, to the extent not covered by insurance, could harm our financial condition or operating results. Any disruption of operations at any of our facilities, and in particular our larger facilities, could result in production delays, which could affect our operations and harm our business.
Our international sales and operations are subject to a variety of market and financial risks and costs that could affect our profitability and operating results.
Our sales outside the U.S., which accounted for 51%42% of sales for 2013,2016, and our operations in Mexico, SwitzerlandEurope, Asia, and France,Central and South America are and will continue to be subject to a number of risks and potential costs, including:
changes in foreign economic conditions and/or regulatory requirements;
changes in foreign currency exchange rates;
local product preferences and product requirements;
longer-termoutstanding accounts receivables that take longer to collect than areis typical in the U.S.;
difficulties in enforcing agreements through foreign legal systems;
less protection of intellectual property in some countries outside of the U.S.;
trade protection measures and import and export licensing requirements;
work force instability;
political and economic instability; and
complex tax and cash management issues.
Moreover, there have been recent public announcements by members of the U.S. Congress and President Trump and his administration regarding their plans to make substantial changes in the taxation of U.S. companies and their foreign operations, including the possible implementation of a border tax, tariff or increase in custom duties on products manufactured outside of, and imported into, the U.S., as well as the renegotiation of U.S. trade agreements, including the North American Free Trade Agreement. As some of our manufacturing facilities are located in Mexico, Ireland and Malaysia, the importation of a border tax, tariff or higher customs duties on our products imported into the U.S., or any potential corresponding actions by other countries in which we do business, could negatively impact our business or results of operations.
We earn revenue and incur expenses related to our foreign sales and operations that are denominated in a foreign currency. Additionally, to the extent that monetary assets and liabilities, including short-term and long-term intercompany loans, are recorded in a currency other than the functional currency of our foreign subsidiaries, these amounts are remeasured each period, with the resulting gain or loss being recorded in Other Income, Net. We may buy hedges in certain currencies to reduce or offset our exposure to currency exchange fluctuations; however, these transactions may not be adequate or effective to protect us from the exposure for which they are purchased. Historically, foreign currency fluctuations have not had a material effect on our consolidatednet financial statements.results. However, fluctuations in foreign currency exchange rates could have a significant impact, positive or negative, impact on our profitability and operating results.financial results in the future.
The current economic environmentEconomic and credit market uncertainty could interrupt our access to capital markets, borrowings, or financial transactions to hedge certain risks, which could adversely affect our financial condition.
To date, we have been able to access debt and equity financing that has allowed us to complete acquisitions, make investments in growth opportunities and fund working capital requirements. In addition, we enter into financial transactions to hedge certain risks, including foreign exchange and interest rate risk. Our continued access to capital markets, the stability of our lenders under our Senior Secured Credit Facility and their willingness to support our needs, and the stability of the parties to our financial transactions that hedge risks are essential for us to meet our current and long-term obligations, fund operations, and fund our strategic initiatives. An interruption in our access to external financing or financial transactions to hedge risk could affect our business prospects and financial condition.
The failure of our information technology systems to perform as anticipated could disrupt our business and affect our financial condition.
The efficient operation of our business is dependent on our information technology (“IT”) systems. Accordingly, we rely upon the capacity, reliability and security of our IT hardware and software infrastructure and our ability to expand and update this infrastructure in response to our changing needs. Despite our implementation of security measures, our systems are vulnerable to damages from computer viruses, natural disasters, incursions by intruders or hackers, failures in hardware or software, power fluctuations, cyber terrorists and other similar disruptions. The failure of our IT systems to perform as anticipated for any reason or any significant breach of security could disrupt our business and result in numerous consequences, including reduced effectiveness and efficiency of operations, inappropriate disclosure of confidential information, increased overhead costs and loss of important information, which could have a material effect on our business and results of operations. In addition, we may be required to incur significant costs to protect against damage caused by these disruptions or security breaches in the future.
Risks Related To Our Industries
The healthcare industry is highly regulated and subject to various political, economic and regulatory changes that could increase our compliance costs and force us to modify how we develop and price our products.
The healthcare industry is highly regulated and is influenced by changing political, economic and regulatory factors. Several of our product lines are subject to international, federal, state and local health and safety, packaging and product content regulations. In addition, medical devices are subject to regulation by the FDA and similar governmental agencies. These regulations cover a wide variety of product activities from design and development to labeling, manufacturing, promotion, sales
and distribution. Compliance with these regulations may be time consuming, burdensome and expensive and could negatively affect our ability to sell products. This may result in higher than anticipated costs or lower than anticipated revenues.
Furthermore, healthcare industry regulations are complex, change frequently and have tended to become more stringent over time. Federal and state legislatures have periodically considered and implemented programs to reform or amend the U.S. healthcare system at both the federal and state levels. In addition, these regulations may contain proposals to increase governmental involvement in healthcare, lower reimbursement rates or otherwise change the environment in which healthcare industry participants operate. We may be required to incur significant expenses to comply with these regulations or remedy past violations of these regulations. Our failure to comply with applicable government regulations could also result in cessation of portions or all of our operations, impositions of fines and restrictions on our ability to carry on or expand our operations. In addition, because many of our products are sold into regulated industries, we must comply with additional regulations in marketing our products.
In response to perceived increases in healthcare costs in recent years, there have been and continue to be proposals by the Obama administration,Presidential administrations, members of Congress, state governments, regulators and third-party payors to control these costs and, more generally, to reform the U.S. healthcare system.system, including by repealing or replacing the Patient Protection and Affordable Care Act. Health Care Reform imposesimposed significant new taxes on medical device manufacturers whichthrough the end of 2015. Although this medical device excise tax was suspended beginning on January 1, 2016 until December 31, 2017, if this suspension is not continued or made permanent thereafter, the medical device excise tax will be automatically reinstated starting on January 1, 2018 and would result in a significant increase in the tax burden on our industry, and which could have a material negative impact on our financial condition, results of operations and our cash flows. Other elements of Health Care Reform such as comparative effectiveness research, an independent payment advisory board, payment system reforms including shared savings pilots and other provisions could meaningfully change the way healthcare is developed and delivered, and may materially adversely impact numerous aspects of our business, results of operations and financial condition. The new medical device tax, which was effective in 2013, increased our cost of sales by $0.5 million.
Many significant parts of Health Care Reform will be phased in over time and require further guidance and clarification in the form of regulations. As a result, many of the impacts of Health Care Reform and any future legislative changes to Health Care Reform will not be known until those regulations are enacted, which we expect to occur over the next several years.
Our business is subject to environmental regulations that could be costly to comply with.
Federal, state and local regulations impose various environmental controls on the manufacturing, transportation, storage, use and disposal of batteries and hazardous chemicals and other materials used in, and hazardous waste produced by the manufacturing of our products. Conditions relating to our historical operations may require expenditures for clean-up in the future and changes in environmental laws and regulations may impose costly compliance requirements on us or otherwise subject us to future liabilities. Additional or modified regulations relating to the manufacture, transportation, storage, use and disposal of materials used to manufacture our products or restricting disposal or transportation of batteries may be imposed that may result in higher costs or lower operating results. In addition, we cannot predict the effect that additional or modified environmental regulations may have on us or our customers.
Our international operations expose us to legal and regulatory risks, which could have a material effect on our business.
Our profitability and international operations are, and will continue to be, subject to risks relating to changes in foreign legal and regulatory requirements. In addition, our international operations are governed by various U.S. laws and regulations, including the Foreign Corrupt Practices Act (“FCPA”) and other similar laws that prohibit us and our business partners from making improper payments or offers of payment to foreign governments and their officials and political parties for the purpose of obtaining or retaining business. Any alleged or actual violations of these regulations may subject us to government scrutiny, severe criminal or civil sanctions and other liabilities and could negatively affect our business, reputation, operating results, and financial condition.
Consolidation in the healthcare industry could result in greater competition and reduce our revenues and harm our business.
Many healthcare industry companies are consolidating to create new companies with greater market power. As the healthcare industry consolidates, competition to provide products and services to industry participants will become more intense. These industry participants may try to use their market power to negotiate price concessions or reductions for our products. If we are forced to reduce our prices, our revenues would decrease and our operating results would suffer.
Our business is indirectly subject to healthcare industry cost containment measures that could result in reduced sales of our products.
Several of our customers rely on third party payors, such as government programs and private health insurance plans, to reimburse some or all of the cost of the procedures in which our products are used. The continuing efforts of government,governments, insurance companies and other payors of healthcare costs to contain or reduce those costs could lead to patients being unable to obtain approval for payment from these third party payors.payors for procedures in which our products are used. If that occurred, sales of medical devices may decline significantly and our customers may reduce or eliminate purchases of our products. The cost containment measures that healthcare payors are instituting, both in the U.S. and internationally, could reduce our revenues and harm our operating results.
Our energy market revenues are dependent on conditions in the oil and natural gas industry, which historically have been volatile.
Sales of our products into the energy market products dependdepends upon the condition of the oil and gas industry. In the past,Currently, oil and natural gas prices have been volatilesubject to significant fluctuation and the oil and gas exploration and production industry has historically been cyclical, and it is likely that oil and natural gas prices will continue to fluctuate in the future. The current and anticipated prices of oil and natural gas influence the oil and
gas exploration and production business and are affected by a variety of political and economic factors, including worldwide demand for oil and natural gas, worldwide and domestic supplies of oil and natural gas, the ability of the Organization of Petroleum Exporting Countries (“OPEC”) to set and maintain production levels and pricing, the level of production of non-OPEC countries, the price and availability of alternative fuels, political stability in oil producing regions and the policies of the various governments regarding exploration and development of their oil and natural gas reserves. A change in the oil and gas exploration and production industry or a reduction in the exploration and production expenditures of oil and gas companies, such as has occurred over the last few years, could cause our energy market revenues to decline.
|
| | |
ITEM 1B. | | UNRESOLVED STAFF COMMENTS |
None.
The following table sets forth information about our principal facilities as of January 3, 2014:
|
| | | | | | |
Location | Sq. Ft. | | Own/Lease | | Principal Use |
Alden, NY | 125,000 |
| | Own | | Medical battery and capacitor manufacturing |
Ann Arbor, MI | 9,970 |
| | Lease | | Office and lab space for design engineering team |
Beaverton, OR | 62,200 |
| | Lease | | Commercial battery manufacturing |
Blaine, MN | 32,400 |
| | Own | | Medical device engineering |
Chaumont, France | 59,200 |
| | Own | | Manufacturing of orthopaedic implants |
Clarence, NY | 117,800 |
| | Own | | Corporate offices and RD&E |
Clarence, NY | 20,800 |
| | Own | | Machining and assembly of components |
Clarence, NY | 18,600 |
| | Lease | | Machining and assembly of components |
Cleveland, OH | 16,900 |
| | Lease | | Office and lab space for design engineering team |
Fort Wayne, IN | 81,000 |
| | Own | | Manufacturing of orthopaedic instruments |
Frisco, TX | 9,200 |
| | Lease | | Global headquarters – principal executive office |
Indianapolis, IN | 82,600 |
| | Own | | Manufacturing of orthopaedic cases and trays |
Minneapolis, MN | 72,000 |
| | Own | | Enclosure manufacturing and engineering |
Orvin, Switzerland | 40,400 |
| | Own | | European corporate offices |
Plymouth, MN | 122,800 |
| | Lease | | Introducers, catheters and leads manufacturing |
Raynham, MA | 81,000 |
| | Own | | Commercial battery manufacturing and RD&E |
Tijuana, Mexico | 190,800 |
| | Lease | | Feedthrough, catheters and orthopaedic instrument manufacturing and value-added assembly |
Warsaw, IN | 3,000 |
| | Lease | | Orthopaedic rapid prototyping design center |
In 2012, the Company completed construction of an orthopaedic manufacturing facility in Fort Wayne, IN and transferred manufacturing operations being performed at its Columbia City, IN location into this new facility. During 2012, the Company also transferred most major functions previously performed at its facilities in Orvin and Corgemont, Switzerland into its Fort Wayne, IN and Tijuana, Mexico facilities. Additionally, during 2012, the Company relocated its global headquarters to Frisco, TX. In the first quarter of 2013, the Company’s Corgemont, Switzerland facility lease was assumed by a third party in connection with its purchase of certain non-core orthopaedic product lines. These initiatives were completed in 2013. During 2013, we began a project to expand its Chaumont, France facility in order to enhance our capabilities and fulfill larger volume customer supply agreements. This initiative is expected to be completed over the next three years.ITEM 1B. UNRESOLVED STAFF COMMENTS
Near the end of 2011, the Company initiated plans to upgrade and expand its manufacturing infrastructure in order to support its medical device strategy. This includes the transfer of certain product lines to create additional capacity for the manufacture of medical devices, expansion of its Plymouth, MN and Tijuana, Mexico facilities, as well as the purchase of equipment to enable the production of medical devices. These initiatives are expected to be completed over the next year. Total capital investment under these initiatives is expected to be between $15 million to $20 million of which approximately $12.4 million has been expended to date.
None.
|
ITEM 3. |
| | LEGAL PROCEEDINGS |
OnITEM 2. PROPERTIES
Our principal executive office and headquarters is located in Frisco, Texas, in a leased facility. As of December 21, 2012,30, 2016, we operated 34 facilities in the U.S., six in Europe, three in Mexico, one in South America, and one in Southeast Asia. Of these facilities, 30 were leased and 15 were owned. We occupy approximately 2.4 million square feet of manufacturing and research, development, and engineering space worldwide. We believe the facilities we operate and their equipment are effectively utilized, well maintained, generally are in good condition, and will be able to accommodate our capacity needs to meet current levels of demand. We continuously review our anticipated requirements for facilities and, on the basis of that review, may from time to time acquire additional facilities and/or dispose of existing facilities. The acquisition of Lake Region Medical significantly expanded our global manufacturing footprint. This increased scope and scale presents opportunities to rationalize our manufacturing footprint across both the legacy Greatbatch and legacy Lake Region Medical facilities to achieve our cost savings and synergies.
ITEM 3. LEGAL PROCEEDINGS
In April 2013, the Company commenced an action against AVX Corporation and several other unaffiliated parties were named as defendantsAVX Filters Corporation (collectively “AVX”) alleging that AVX had infringed the Company’s patents by manufacturing and selling filtered feedthrough assemblies used in implantable pacemakers and cardioverter defibrillators that incorporate the Company’s patented technology. On January 26, 2016, a personal injury and wrongful death action filedjury in the 113th JudicialUnited States District Court for the District of Harris County, Texas.Delaware returned a verdict finding that AVX infringed two Greatbatch patents and awarded the Company $37.5 million in damages. The complaint seeks damages alleging marketingfinding is subject to post-trial proceedings, currently scheduled to be held in August 2017, including a possible appeal by AVX.
The Company’s Collegeville, PA facility, which was acquired as part of the Lake Region Medical acquisition, is subject to an administrative consent order entered into with the U.S. Environmental Protection Agency (the “EPA”), which requires ongoing groundwater treatment and product defectsmonitoring at the site as a result of historic leaks from underground storage tanks. Upon approval by the EPA of the Company’s proposed post remediation care plan, which requires a continuation of the groundwater treatment and failuremonitoring process at the site, the Company expects that the consent order will be terminated. The Company expects a decision from the EPA on whether the Company’s post remediation care plan has been approved in early 2017. The groundwater treatment process at the Collegeville facility consists of a groundwater extraction and treatment system and the performance of annual sampling of a defined set of groundwater wells as a means to warn, negligence and gross negligence relatingmonitor containment within approved boundaries.
In January 2015, Lake Region Medical was notified by the New Jersey Department of Environmental Protection (“NJDEP”) of the NJDEP’s intent to revoke a no further action determination made by the NJDEP in favor of Lake Region Medical in 2002 pertaining to a product we manufacturedproperty on which a subsidiary of Lake Region Medical operated a manufacturing facility in South Plainfield, New Jersey beginning in 1971. Lake Region Medical sold the property in 2004 and soldvacated the facility in 2007. In response to the NJDEP’s notice, the Company further investigated the matter and submitted a customer, onetechnical report to the NJDEP in August of 2015 that concluded that the NJDEP’s notice of intent to revoke was unwarranted. After reviewing the Company’s technical report, the NJDEP issued a draft response in May 2016, stating that the NJDEP would not revoke the no further action determination at that time, but would require some additional site investigation to support the Company’s conclusion. The Company is cooperating with the NJDEP and has met with NJDEP representatives to discuss the appropriate scope of the other named defendants. Our customer, in turn, incorporated our product into its own product which it sold to its customer, another named defendant. This matter is currently scheduled for trial in the second half of 2014. We are indemnified by our customer against any loss in this matter, including costs of defense, which obligation is supported by our customer's product liability insurance coverage. We also have our own product liability insurance coverage. The Company has meritorious defenses and is vigorously defending the matter.requested additional investigation.
We are party to various other legal actions arising in the normal course of business. A description of pending legal actions against the Company is set forth atin Note 15 “Commitments and Contingencies” of the Notes to Consolidated Financial Statements contained in Item 8 of this report. WeOther than as discussed in Note 15, we do not believe that the ultimate resolution of any pending legal actions will have a material effect on our consolidated results of operations, financial position or cash flows. However, litigation is subject to inherent uncertainties and there can be no assurance that any pending legal action, which we currently believe to be immaterial, does not become material in the future.
ITEM 4. MINE SAFETY DISCLOSURES
|
ITEM 4. |
| | MINE SAFETY DISCLOSURES |
Not applicable.
PART II
ITEM 5. MARKET FOR REGISTRANT’S COMMON EQUITY, RELATED STOCKHOLDER MATTERS AND
ISSUER PURCHASES OF EQUITY SECURITIES
|
ITEM 5. |
| | MARKET FOR REGISTRANT’S COMMON EQUITY, RELATED STOCKHOLDER MATTERS AND ISSUER PURCHASES OF EQUITY SECURITIES. |
The Company’s common stock trades on the New York Stock Exchange (“NYSE”) under the symbol “GB.“ITGR.” The following table sets forth information on the prices of our common stock as reported by the NYSE:
|
| | | | | | | | | | | |
| | High | | Low | | Close |
| 2012 | | | | | |
| First Quarter | $ | 27.22 |
| | $ | 21.35 |
| | $ | 24.52 |
|
| Second Quarter | 24.82 |
| | 20.29 |
| | 22.71 |
|
| Third Quarter | 25.64 |
| | 22.05 |
| | 24.33 |
|
| Fourth Quarter | 25.33 |
| | 21.08 |
| | 22.89 |
|
| 2013 | | | | | |
| First Quarter | $ | 30.64 |
| | $ | 22.70 |
| | $ | 29.87 |
|
| Second Quarter | 34.41 |
| | 27.03 |
| | 32.79 |
|
| Third Quarter | 38.36 |
| | 32.70 |
| | 33.69 |
|
| Fourth Quarter | 45.02 |
| | 33.24 |
| | 43.80 |
|
|
| | | | | | | | | | | | | | | |
| | Fourth Quarter | | Third Quarter | | Second Quarter | | First Quarter |
| 2016 | | | | | | | |
| High | $ | 31.45 |
| | $ | 33.19 |
| | $ | 39.45 |
| | $ | 52.40 |
|
| Low | 18.10 |
| | 20.62 |
| | 28.55 |
| | 30.95 |
|
| Close | 29.45 |
| | 21.69 |
| | 32.00 |
| | 34.92 |
|
| | | | | | | | |
| 2015 | | | | | | | |
| High | $ | 61.06 |
| | $ | 63.19 |
| | $ | 56.86 |
| | $ | 58.18 |
|
| Low | 49.00 |
| | 47.85 |
| | 50.57 |
| | 47.36 |
|
| Close | 52.50 |
| | 58.43 |
| | 53.50 |
| | 56.72 |
|
As of March 4, 2014, there were approximately 118 record holders of the Company’s common stock. The Company stock account included in our 401(k) plan is considered one record holder for the purposes of this calculation. There is approximately 2,219 active and former employees’ holding Company stock in the 401(k) plan.
We have not paid cash dividends and currently intend to retain any earnings to further developreinvest in our business or pay down outstanding debt. In addition, the term of our Senior Secured Credit Facility and growthe Indenture governing our business.9.125% senior notes due 2023 limits the amount of dividends that we may pay. As of February 24, 2017, there were approximately 130 record holders of the Company’s common stock.
PERFORMANCE GRAPH
The following graph compares, for the five year period ended January 3, 2014,December 30, 2016, the cumulative total stockholder return for Greatbatch, Inc.,Integer Holdings Corporation, the S&P SmallCap 600 Index, and the Hemscott Peer Group Index. The Hemscott Peer Group Index includes approximately 115120 comparable companies included in the Hemscott Industry Group 520 Medical Instruments & Supplies and 521 Medical Appliances & Equipment. The graph assumes that $100 was invested on January 2, 2009December 30, 2011 and assumes reinvestment of dividends. The stock price performance shown on the following graph is not necessarily indicative of future price performance:performance.
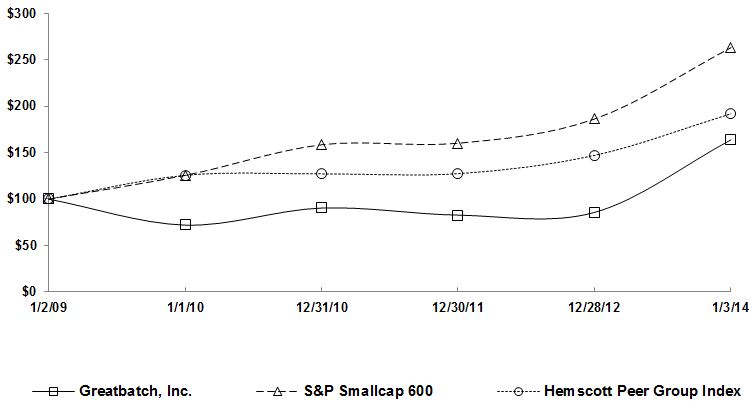
|
| | | | | | | | | | | | | | | | | | | |
| Company/Index | | 12/30/11 | 12/28/12 | 01/03/14 | 01/02/15 | 01/01/16 | 12/30/16 |
| | | | | | | | |
| Integer Holdings Corporation | | $ | 100.00 |
| $ | 103.57 |
| $ | 198.19 |
| $ | 220.18 |
| $ | 237.56 |
| $ | 133.26 |
|
| S&P Smallcap 600 | | 100.00 |
| 116.33 |
| 164.38 |
| 173.84 |
| 170.41 |
| 215.67 |
|
| Hemscott Peer Group Index | | 100.00 |
| 114.61 |
| 150.77 |
| 181.80 |
| 194.22 |
| 207.22 |
|
ITEM 6. SELECTED FINANCIAL DATA
|
ITEM 6. |
| | SELECTED FINANCIAL DATA |
The following table provides selected financialFive-Year Summary Financial Data
(in thousands, except per share amounts)
This data for the periods indicated. You should be read this data along with Item 7 “Management’s Discussion and Analysis of Financial Condition and Results of Operations,”Operations” and Item 8 “Financial Statements and Supplementary Data” appearing elsewhere in this report. The consolidated statementFiscal year 2013 consisted of operations data and the consolidated balance sheet data for the53 weeks. All other fiscal years indicated have been derived from our consolidated financial statements and related notes (in thousands, except per share amounts):consisted of 52 weeks.
|
| | | | | | | | | | | | | | | | | | | |
| | 2016 (1)(2) | | 2015 (1)(2) | | 2014 (1)(2) | | 2013 (1) | | 2012 (1)(2) |
| Summary of Operations for the Fiscal Year: | | | | | | | | | |
| Sales | $ | 1,386,778 |
| | $ | 800,414 |
| | $ | 687,787 |
| | $ | 663,945 |
| | $ | 646,177 |
|
| Net income (loss) | 5,961 |
| | (7,594 | ) | | 55,458 |
| | 36,267 |
| | (4,799 | ) |
| Earnings (loss) per share | | | | | | | | | |
| Basic | $ | 0.19 |
| | $ | (0.29 | ) | | $ | 2.23 |
| | $ | 1.51 |
| | $ | (0.20 | ) |
| Diluted | 0.19 |
| | (0.29 | ) | | 2.14 |
| | 1.43 |
| | (0.20 | ) |
| Financial Position at Year End: | | | | | | | | | |
| Working capital | $ | 332,087 |
| | $ | 360,764 |
| | $ | 242,022 |
| | $ | 190,731 |
| | $ | 176,376 |
|
| Total assets | 2,832,543 |
| | 2,982,136 |
| | 955,122 |
| | 889,629 |
| | 889,611 |
|
| Long-term obligations | 1,922,084 |
| | 1,917,671 |
| | 233,099 |
| | 255,772 |
| | 316,994 |
|
|
| | | | | | | | | | | | | | | | | | | |
| | Years Ended |
| | Jan. 3 2014 (1) | | Dec. 28 2012 (1)(2) | | Dec. 30, 2011 (1)(2) | | Dec. 31, 2010 (1)(3) | | Jan. 1, 2010 (1)(3) |
| Statement of Operations Data: | | | | | | | | | |
| Sales | $ | 663,945 |
| | $ | 646,177 |
| | $ | 568,822 |
| | $ | 533,425 |
| | $ | 521,821 |
|
| Net income (loss) | 36,267 |
| | (4,799 | ) | | 33,122 |
| | 33,138 |
| | (9,001 | ) |
| Earnings (loss) per share | | | | | | | | | |
| Basic | $ | 1.51 |
| | $ | (0.20 | ) | | $ | 1.42 |
| | $ | 1.44 |
| | $ | (0.39 | ) |
| Diluted | 1.43 |
| | (0.20 | ) | | 1.40 |
| | 1.40 |
| | (0.39 | ) |
| Balance Sheet Data: | | | | | | | | | |
| Working capital | $ | 190,731 |
| | $ | 176,376 |
| | $ | 170,907 |
| | $ | 150,922 |
| | $ | 119,926 |
|
| Total assets | 890,703 |
| | 889,875 |
| | 881,347 |
| | 776,976 |
| | 830,543 |
|
| Long-term obligations | 256,846 |
| | 317,258 |
| | 320,015 |
| | 289,560 |
| | 317,575 |
|
| |
| (1) | From 20092012 to 2013,2016, we recorded material charges in Other Operating Expenses, Net, primarily related to our cost savings and consolidation initiatives.initiatives and our acquisitions. Additional information is set forth in Note 13 “Other Operating Expenses, Net” of the Notes to Consolidated Financial Statements contained in Item 8 of this report. |
| |
| (2) | On October 27, 2015, August 12, 2014 and February 16, 2012, and on December 15, 2011, we acquired Lake Region Medical Holdings, Inc., Centro de Construcción de Cardioestimuladores del Uruguay, and NeuroNexus Technologies, Inc., and Micro Power Electronics, Inc., respectively. On March 14, 2016, we spun-off a portion of our former QiG segment, which is now an independent publicly traded company known as Nuvectra Corporation. This data includes the results of operations of these acquired companies subsequent to their acquisition.acquisition and does not include the result of operations of Nuvectra Corporation subsequent to its divestiture. Additional information is set forth in Note 2 “Acquisitions”“Divestiture and Acquisitions” of the Notes to Consolidated Financial Statements contained in Item 8 of this report. In 2011,Additionally, in connection with our acquisition of Lake Region Medical we issued approximately $1.8 billion of long-term debt. Additional information is set forth in Note 9 “Debt” of the Company sold its cost method investmentNotes to Consolidated Financial Statements contained in IntElect Medical, Inc. This transaction resulted in a pre-tax gainItem 8 of $4.5 million. |
| |
(3) | In 2009, we recorded a $34.5 million litigation charge and a $15.9 million write-down of trademarks and tradenames. In 2010, we settled the litigation which resulted in a $9.5 million gain.this report. |
|
| | |
ITEM 7. | | MANAGEMENT’S DISCUSSION AND ANALYSIS OF FINANCIAL CONDITION AND RESULTS OF OPERATIONS |
YOU SHOULD READ THE FOLLOWINGITEM 7. MANAGEMENT’S DISCUSSION AND ANALYSIS OF OUR FINANCIAL CONDITION AND RESULTS OF
OPERATIONS IN CONJUNCTION WITH OUR FINANCIAL STATEMENTS AND RELATED NOTES INCLUDED ELSEWHERE IN THIS REPORT.
The following discussion and analysis of our financial condition and results of operations should be read together with our selected financial data and our consolidated financial statements and the related notes appearing elsewhere in this report.
This discussion and analysis contains forward-looking statements that involve risks, uncertainties and assumptions. Our actual results may differ materially from those anticipated in these forward-looking statements as a result of many factors, including but not limited to those under the heading “Risk Factors” in Item 1A of this report.
Our Business
Our business
Our acquisitions
Our customers
Use of non-GAAP financial information
Strategic and financial overview
2014 financial guidanceFinancial overview
Business outlook
Cost savings and consolidation efforts
Product development
Government regulation
Our Critical Accounting Estimates
Valuation ofIntangible assets and goodwill and other identifiable intangible assets
Stock-based compensation
Inventories
Tangible long-lived assets
Provision for incomeIncome taxes
Our Financial Results
Fiscal 20132016 compared with fiscal 2012
2015Fiscal 20122015 compared with fiscal 20112014
Liquidity and capital resources
Off-balance sheet arrangements
Litigation
Contractual obligations
Inflation
Impact of recently issued accounting standards
We utilize a fifty-two, fifty-three week fiscal year ending on the Friday nearest December 31. Fiscal years 2016, 2015 and 2014 each consisted of fifty-two weeks and ended on December 30, 2016, January 1, 2016 and January 2, 2015, respectively.
Our Business
In connection withInteger Holdings Corporation is one of the realignment of our operating structure in 2013 to optimize profitable growth, which included changing our management and reporting structure, we reevaluated our operating and reporting segments. Beginninglargest medical device outsource (“MDO”) manufacturers in the fourth quarter of 2013, we have two reportable segments: Greatbatch Medical and QiG Group (“QiG”). As required, prior year amounts have been reclassified in order to conform them to the current year presentation. Greatbatch Medical designs and manufactures products where Greatbatch either owns the intellectual property or has unique manufacturing and assembly expertise. The financial results of Greatbatch Medical include the former Implantable Medical and Electrochem Solutions (“Electrochem”) segments, excluding QiG. These products include medical devices and components forworld serving the cardiac, neuromodulation, orthopaedics, portable medical,orthopedics, vascular and advanced surgical markets. We also serve the non-medical power solutions market. We provide innovative, high-quality medical technologies that enhance the lives of patients worldwide. In addition, we develop batteries for high-end niche applications in the energy, markets among others. The Greatbatch Medical segment also offers value-added assemblymilitary, and design engineering services for medical devices that utilize its component products.
QiG focuses on developing medical device systems for some of healthcare’s most pressing challenges and reflects Greatbatch’s strategic evolution of its product offerings in order to raise the growth and profitability profile of the Company. Through the research and development professionals in QiG, the Company is now investing in three areas - new medical device systems commercialization, collaborative programs with OEM customers, and strategic equity positions in start-up companies - to grow a diversified and distinctive portfolio. The medical device systems developed by QiG are manufactured by Greatbatch Medical.
The Company's customers include large multi-national original equipment manufacturers (“OEMs”).
Our Acquisitionsenvironmental markets.
On December 15, 2011,October 27, 2015, we acquired all of the outstanding common stock of Micro Power Electronics,Lake Region Medical Holdings, Inc. (“Micro Power”Lake Region Medical”). On March 14, 2016, we spun-off a portion of our former QiG segment (the “Spin-off”), which is now an independent publicly traded company known as Nuvectra Corporation (“Nuvectra”). As a result of the Lake Region Medical acquisition and Spin-off, during 2016 we reorganized our operations including our internal management and financial reporting structure. As a result, we reevaluated and revised our reportable business segments during the fourth quarter of 2016 and are now disclosing two reportable segments: (1) Medical and (2) Non-Medical. Our Medical segment includes the operations of our former Lake Region Medical segment, the remaining operations of our former QiG segment after the Spin-off, and the portion of the previously reported Greatbatch Medical segment not included in our Non-Medical segment. Our Non-Medical segment includes our Electrochem business, which was previously included in our Greatbatch Medical segment. Prior period amounts throughout this Annual Report on Form 10-K have been reclassified to conform to the new segment reporting presentation. We continue to refine the way we classify product line sales, which may impact the way future product line sales are reported, but will not change total sales. Refer to Note 2 “Divestiture and Acquisitions” of the Notes to the Consolidated Financial Statements contained in Item 8 of this report for further description of the Lake Region Medical acquisition and Spin-off and Note 15 “Business Segment, Geographic and Concentration Risk Information” for further information on our product lines and business segments.
MANAGEMENT’S DISCUSSION AND ANALYSIS
Effective June 30, 2016, we changed our name from Greatbatch, Inc. (“Greatbatch”) to Integer Holdings Corporation. The new name represents the union of the Greatbatch Medical, Lake Region Medical and Electrochem brands. Integer, meaning whole or complete, signifies our more comprehensive products and service offerings, and a new dimension in our combined capabilities. When used in this report, the terms “Integer,” “we,” “us,” “our” and the “Company” mean Integer Holdings Corporation and its subsidiaries.
Our Acquisitions
On October 27, 2015, we acquired all of the outstanding common stock of Lake Region Medical, headquartered in Beaverton, OR. Micro PowerWilmington, MA. Lake Region Medical is a leading suppliermanufacturer of custom battery solutions, serving the portableinterventional and diagnostic wire-formed medical militarydevices and handheld automatic identificationcomponents specializing in minimally invasive devices for cardiovascular, endovascular, and data collection markets. Micro Power’s commercialneurovascular applications. This acquisition has added scale and diversification to enhance customer access and experience by providing a comprehensive portfolio is highly complementary to the products and services offered by Greatbatch Medical.of technologies. The operating results of Micro PowerLake Region Medical were included in our Greatbatch Medical segment from the date of acquisition. The aggregate purchase price of Micro PowerLake Region Medical including debt assumed was $71.8 million,$1.77 billion, which wewas funded with cash on handprimarily through a new senior secured credit facility and $45 million borrowed under our revolving credit facility.the issuance of senior notes. Total assets acquired from Micro PowerLake Region Medical were $88.2 million.$2.1 billion. Total liabilities assumed from Micro PowerLake Region Medical were $16.4$1.3 billion. For 2016, Lake Region Medical had $802.4 million of revenue and $32.8 million of net income. For 2015, Lake Region Medical had $138.6 million of revenue and a net loss of approximately $17.4 million. For 2012, Micro Power added approximately $82.4 million to our revenue.
On February 16, 2012,August 12, 2014, we purchased all of the outstanding common stock of NeuroNexus Technologies, Inc.Centro de Construcción de Cardioestimuladores del Uruguay (“NeuroNexus”CCC”), headquartered in Ann Arbor, MI. NeuroNexusMontevideo, Uruguay. CCC is an active implantable neuromodulation medical device design firm specializing in developingsystems developer and commercializing neural interface technology, components and systems for neuroscience and clinical markets. NeuroNexus has an extensive intellectual property portfolio, core technologies and capabilities to support the development and manufacturing of innovative neural interface devices acrossmanufacturer that produces a wide range of functionsmedical devices including neuromodulation, sensing, optical stimulationimplantable pulse generators, programmer systems, battery chargers, patient wands and targeted drug delivery applications.leads. This acquisition allows us to more broadly partner with medical device companies, complements our core discrete technology offerings, and enhances our medical device innovation efforts. The operating results of NeuroNexusCCC were included in our QiGMedical segment from the date of acquisition. The aggregate purchase price of NeuroNexusCCC was $13.2$19.8 million, which we funded with cash on hand and $10 million borrowed under our revolving credit facility.hand. Total assets acquired from NeuroNexusCCC were $14.6$26.2 million. Total liabilities assumed from NeuroNexusCCC were $1.4$6.4 million. For 2012, NeuroNexus added approximately $2.52014, CCC had $5.8 million toof revenue and net income of $1.2 million.
With the acquisition of Lake Region Medical, our revenue.
Going forward, wemain strategic priorities over the next two years include, among others, the integration of both legacy companies, driving integration synergies, and the paying down our outstanding debt. Our acquisition focus, if any, will continue to pursue acquisitions to enhance our top and bottom line growth trajectory,be primarily directed at smaller “bolt-on” or adjacent acquisition opportunities that have a strategic fit with a focus on innovative solutions. Our strategic criteria for these acquisitions is that they should be complementary to our existing business model, drive expansion in core markets, allow us to enter adjacent growth markets, are focused on proprietary technology, can be tightly integrated intobusinesses, particularly opportunities that support our operating base,enterprise strategy and will enhance our return on invested capital performance.
Our Customers
Our products are designed to provide reliable, long-lasting solutions that meet the evolving requirements and needsvalue proposition of our customers. The nature and extent of our selling relationships with each customer are different in terms of breadth of products purchased, purchased product volumes, length of contractual commitment, ordering patterns, inventory management and selling prices.offerings.
Our Greatbatch Medical customers include large multi-national OEMs, such as Biotronik, Boston Scientific, Halliburton Company, Johnson & Johnson, Medtronic, Philips Healthcare, Smith & Nephew, Sorin Group, St. Jude Medical, Stryker, and Zimmer. During 2013, Johnson & Johnson, Medtronic and St. Jude Medical collectively accounted for 49% of our total sales.
QiG customers include numerous scientists, hospitals and universities throughout the world who perform research for the neuroscience and clinical markets.
Use of Non-GAAP Financial Information
We prepare our consolidated financial statements in accordance with generally accepted accounting principles in the United States of America (“GAAP”). Additionally, we consistently report and discuss in our quarterly earnings releases and investor presentations adjusted operating income and margin, adjusted net income, adjusted earnings per diluted share (“adjusted diluted EPS”), earnings before interest, taxes, depreciation, and amortization (“EBITDA”), adjusted EBITDA and organic constant currency sales growth rates. These
Adjusted net income and adjusted amounts, other than organic constant currency growth rates,diluted EPS consist of GAAP amounts excludingadjusted for the following adjustments to the extent occurring during the period: (i) acquisition-related charges, (ii) amortization of intangible assets, (iii) facility consolidation, optimization, manufacturing transfer and system integration charges, (iii)(iv) asset write-down and disposition charges, (iv) severance(v) charges in connection with corporate realignments or a reduction in force, (v)(vi) certain litigation expenses, charges and gains, (vi) the impact of certain non-cash charges to interest expense, (vii) unusual or infrequently occurring items, (viii) certain R&D expenditures (such as medical device DVT expenses in connection with developing our neuromodulation platform), (ix) gain/loss on the sale ofcost and equity method investments, (x)(ix) the income tax (benefit) related to these adjustments and (xi)(x) certain tax charges related toitems that are outside the consolidation of our Swiss Orthopaedic facility.normal provision for the period. Adjusted earnings per diluted share wereEPS is calculated by dividing adjusted net income by diluted weighted average shares outstanding.
Adjusted EBITDA consists of GAAP net income (loss) plus (i) the same adjustments as listed above except for items (ix), and (x), (ii) GAAP stock-based compensation, interest expense, and depreciation, (iii) GAAP provision (benefit) for income taxes and (iv) cash gains received from cost and equity method investments during the period. To calculate organic constant currency sales growth rates, thatwhich exclude the impact of changes in foreign currency exchange rates, as well as the impact of any acquisitions or divestitures of product lines on sales growth rates, we convert current period sales from local currency to U.S. dollars using the previous periodsperiods’ foreign currency exchange rates and exclude the amount of sales acquired/divested during the period from the current/previous period amounts, respectively.
MANAGEMENT’S DISCUSSION AND ANALYSIS
We believe that the presentation of adjusted operating income and margin, adjusted net income, adjusted diluted earnings per share,EPS, EBITDA, adjusted EBITDA, and organic constant currency sales growth rates provides important supplemental information to management and investors seeking to understand the financial and business trends relating to our financial condition and results of operations.operations, including compliance with our bank covenant calculations. Additionally, incentive compensation targets for our executives and associates are based upon these adjusted measures.
Strategic and Financial Overview
Our current strategy is centered around fourThe last two years have been transformational for Integer. In 2015, we merged with Lake Region Medical to form one of the largest MDO manufacturers in the world. In 2016, we spun-off our QiG Group, LLC subsidiary and its neuromodulation medical device business, known as Nuvectra, to allow both companies to capitalize on their respective growth opportunities and focus on their respective strategic imperatives: 1) Organic Growth; 2) Margin Expansion; 3) Medical Device Systems;plans. In mid-2016, our transformation culminated with the unification of the combined companies under one name - “Integer” - signifying the full portfolio of product offerings we can provide our customers from discrete component technologies to full active implantable medical devices.
During 2016, we made significant progress towards integrating our two legacy companies and 4) Targeted Acquisitions.remain ahead of our original expectations with regards to deal synergies. This, strategy was clearly exhibited in our 2013 results, illustrating not only our continuing momentum, but also the effective measures we are deploying to create an even brighter future.
2013 results include an additional week of operations in comparison to 2012 and 2011 as we utilize a fifty-two, fifty-three week fiscal year, which ends on the Friday nearest December 31st. Although this additional week of operations may have impacted certain financial statement line items, management believes that when combined with the additional holiday and weather related shutdowns, this additional week did not materially impact our net operating results.
Organic Growth - Over the last several yearssteps we have significantly enhancedtaken to stabilize our salesbusiness throughout the year, establishes a strong foundation from which to grow. For 2017, one of our main strategic priorities will be to continue to invest in our business to drive growth with our customers across the full spectrum of portfolio opportunities we offer. Additionally, we are focused on delivering stockholder returns through growth in profitability and marketing capabilities. This has included moving account executives closercash generation in order to pay down debt. With our majorexpanded capabilities, increased scale and experienced management team, we believe we are well positioned to drive sustainable growth and profitability, which increases our confidence as we move into 2017.
We believe Integer is well-positioned within the medical technology and medical device outsource manufacturing market and that there is a robust funnel of opportunities to pursue. It is contingent upon us to capitalize on these. We have expanded our medical device capabilities and are excited about opportunities to partner with customers upgradingto drive innovation. We believe we have the scale and global presence, supported by world-class manufacturing and quality capabilities to capture these opportunities. We are confident in our sales forceabilities as one of the largest medical device outsource manufacturers, with new sales talent,a long history of successfully integrating companies, driving down cost and growing revenues over the long-term. Ultimately, our strategic vision is to drive shareholder value by enhancing the lives of patients worldwide and by being our sales commission programs,customers’ partner of choice for innovative medical technologies and intensifying our market research. These initiatives contributed to our record sales for 2013 of $663.9 million, which represented a 3% increase over 2012services.
Financial Overview
Fiscal year 2016 sales of $646.2$1.39 billion increased $586 million despiteor 73% in comparison to 2015. During 2016, incremental sales contributed by Lake Region Medical were approximately $650 million. Sales for 2016 also include the divestiture of $15 million of certain non-core orthopaedic product lines during the first quarter of 2013. After adjusting for the impact of these divestitures, as well as the $2 million positive impact of foreign currency exchange rates, sales increased 5% in 2013 due to strong organic constant currency growth from our cardiac/neuromodulation (6%) and orthopaedic (20%) product lines due to market share gains, customer product launches, the additional week of sales and the release of backlog stemming from our Swiss consolidation in 2012. Partially offsetting these increases were declines in our vascular and portable medical product lines due to the previously communicated voluntary recall of two vascular medical devices in 2012 and our increased pricing discipline, which resulted in the loss of low-margin portable medical business.
Sales growth for 2012 of 14% included the benefit from our acquisitions of $84.8 million, as well as the negative impact of foreign currency exchange rate fluctuations, which reduced legacy Greatbatch Medical sales by approximately $1 million in comparison to the prior year due to the strengthening dollar versus the Euro. Foreign currency exchange rate fluctuations are expected to have a more material impact on our sales in 2017 due to the 7% strengthening of $6 million.the U.S. dollar in comparison to the Euro during the fourth quarter of 2016. Excluding the impact of these items, as well as the divestiture of $1 million of revenue earned by Nuvectra prior to the Spin-off, organic constant currency sales decreased 8% in comparison to the prior year. This decrease was primarily due to 1) the reduction of shipments in a limited number of cardiac rhythm management (“CRM”) customer programs; 2) the 30% decline in Non-Medical sales caused by the slowdown in the energy markets; and 3) contractual price reductions given in exchange for longer-term volume commitments from customers. These decreases were partially offset by growth in sales to our neuromodulation customers during 2016.
Fiscal year 2015 sales of $800.4 million increased 16% in comparison to 2014. 2015 revenue includes two months of operations from Lake Region Medical, which added approximately $139 million to sales. Additionally, sales for the year were impacted by foreign currency exchange rate fluctuations, which reduced sales by approximately $14 million compared to the prior year. On an organic constant currency basis, which excludes2015 sales decreased 2% over the impact of foreign currency exchange rates and acquired sales, sales for 2012 were consistent with 2011 as organic growth was offset by lower orthopaedic salesprior year primarily due to price concessions provided to customers and operational issues ata 27% decline in Non-Medical sales caused by the slowdown in the energy markets.
During 2016, our Swiss orthopaedic facilities, which were aggressively addressed in 2012.
For 2014, we expect revenue to organically grow 3-6%, which is in line with our long-term organic growth goal objectives.
Margin Expansion - We have a longstanding history of operational excellence, which is one of our core competencies. This, when combined with our organic sales growth, is expected to continue to drive both gross and operating margin expansion. This core competency was evident in our 2013 results as gross profit as a percentage of sales (“Gross Margin”) increased 180decreased 210 basis points to 33.0%.27.3% in comparison to 2015. This increasedecrease was primarily resulted fromdriven by the increased operational leverage gained from our higher sales volumes and productivity initiatives,Lake Region Medical acquisition, which historically had lower Gross Margins than Greatbatch Medical (310 basis points), as well as contractual price reductions given in exchange for longer-term volume commitments from customers (210 basis points). 2015 cost of sales includes $23.0 million of inventory step-up amortization recorded as a favorable mixresult of higher margin products. Ourthe Lake Region Medical acquisition, which was fully amortized at the end of 2015 (290 basis points).
During 2015, our Gross Margin for 2012 decreased 50420 basis points to 29.4% in comparison to 2011 as increased operational leverage2014. This decrease was primarily driven by the Lake Region Medical acquisition and inventory step-up amortization (510 basis points), partially offset by the operational issues atlower performance-based compensation.
MANAGEMENT’S DISCUSSION AND ANALYSIS
During 2016, our Swiss orthopaedic facilities and a higher mixoperating income increased $95.1 million to $108.3 million in comparison to 2015. Approximately $117 million of lower margin products. Our increased sales volume, combined with thethis increase in Gross Margin for 2013 resulted in an increase to our gross profit of 9% and 12% for 2013 and 2012, respectively.
Partially offsetting these increases in gross profit were increases in our selling, general and administrative expenses (“SG&A”) and research, development and engineering costs, net (“RD&E”). SG&A expenses increased 9% and 12% for 2013 and 2012, respectively. The 2013 increase in SG&A expense was primarily due to the additional investments in sales and marketing resources, higher performance-based compensation expense andacquisition of Lake Region Medical, which includes the additional weekbenefit of payroll expense in 2013acquisition synergies. Since the acquisition of Lake Region Medical, we achieved approximately $34 million of cumulative annual run-rate synergies, which exceeded our $25 million target. Our 2016 operating income also benefited from the Spin-off of Nuvectra, which increased operating income approximately $19 million in comparison to 2012. The 2012 increase in SG&A expense was primarily due to our acquisitions which added $9.6 million to SG&A in comparison to 2011. RD&E expenses increased 3% and 15% for 2013 and 2012, respectively. The 2013 increase in RD&E was primarily due to lower customer cost reimbursements and the additional week of operations compared to the prior year.2015. These increases were partially offset by the initiative launched in the second half of 2012 to more fully optimize our research and development efforts. This included the reallocation of research and development resources to higher priority projects, the postponement of some research and development projects, and the decision to pursue various alternatives to monetize our existing non-core intellectual property and entering into more co-development arrangements with our customers. The 2012 increase in RD&E expense was primarilylower gross profit due to our acquisitions, which added $2.6 million of expenses,contractual price reductions as well as our additional investment in the development of complete medical device systems.discussed above.
Since 2007, we have invested substantial resources in integrating our acquisitions and streamlining our operations. As we move forward, investing in our operations will continue to be critical to the success of our strategic imperative to drive margin expansion. This strategy continued during 2013 and 2012 as we realignedDuring 2015, our operating structureincome decreased $62.5 million, or 83%, in ordercomparison to optimize our profitable growth, continued to consolidate our orthopaedic footprint, expanded our manufacturing infrastructure to support the commercialization of our medical devices and upgraded our global ERP system in order to support our future growth. As a result of these initiatives, our other operating expense totaled $15.8 million, $42.3 million and $0.6 million for 2013, 2012 and 2011, respectively. The significant increase in other operating expenses, net for 2012 related to the consolidation of our Swiss orthopaedic facilities, which was completed in the first quarter of 2013. We continually evaluate our operating structure in order
to maximize efficiencies and drive margin expansion. Future other operating expenses are expected to be lower than the 2013 levels, but could be impacted if new consolidation and optimization initiatives are undertaken.
GAAP operating income for 2013 was $61.3 million compared to $25.8 million for 2012 and $61.7 million for 2011. The significant2014. This decrease in 2012 was primarily due to the acquisition of Lake Region Medical, which decreased our operating income by approximately $16 million. Additionally, our operating income declined due to $42 million of additional other operating expenses, net (“OOE”) incurred primarily due to costs incurred in connection with the acquisition of Lake Region Medical, the Spin-off and our consolidation initiatives.
During 2016 and productivity initiatives discussed above. Adjusted operating income, which excludes these items, was $82.92015, we incurred $77.8 million for 2013, comparedand $29.2 million, respectively, of additional interest expense primarily due to $73.9 million for 2012 and $67.6 million for 2011. Adjusted operating income as a percentagethe $1.8 billion of sales (“Adjusted Operating Margin”) for 2013 was 12.5% compared to 11.4% for 2012 and 11.9% for 2011 and reflects the success the Company has had in leveraging its operating infrastructure and driving margin expansion. We expect these improvements to continue in 2014 as Adjusted Operating Margin is expected to be 13.0% - 13.3% of sales.
A reconciliation of GAAP operating income (loss) to adjusted amounts is as follows (dollars in thousands):
|
| | | | | | | | | | | | | | | | | | | | | | | | | | | | | | | |
| | Greatbatch Medical | | QiG | | Unallocated | | Total |
| | Jan 3,
2014 | | Dec 28,
2012 | | Jan 3,
2014 | | Dec 28,
2012 | | Jan 3,
2014 | | Dec 28,
2012 | | Jan 3,
2014 | | Dec 28,
2012 |
| Total sales | $ | 660,902 |
| | $ | 643,722 |
| | $ | 3,043 |
| | $ | 2,455 |
| | $ | — |
| | $ | — |
| | $ | 663,945 |
| | $ | 646,177 |
|
| | | | | | | | | | | | | | | | |
| Operating income (loss) as reported | $ | 111,805 |
| | $ | 79,093 |
| | $ | (30,484 | ) | | $ | (32,554 | ) | | $ | (19,982 | ) | | $ | (20,718 | ) | | $ | 61,339 |
| | $ | 25,821 |
|
| Adjustments: | |
| | |
| | |
| | |
| | |
| | |
| | |
| | |
| Inventory step-up amortization (COS) | — |
| | 532 |
| | — |
| | — |
| | — |
| | — |
| | — |
| | 532 |
|
| Medical device DVT expenses (RD&E) | — |
| | — |
| | 5,793 |
| | 5,190 |
| | — |
| | — |
| | 5,793 |
| | 5,190 |
|
| Consolidation and optimization costs | 13,388 |
| | 34,372 |
| | 86 |
| | 6 |
| | 1,284 |
| | 4,670 |
| | 14,758 |
| | 39,048 |
|
| Acquisition and integration (income) expenses | 187 |
| | 1,287 |
| | (690 | ) | | 167 |
| | 1 |
| | 6 |
| | (502 | ) | | 1,460 |
|
| Asset dispositions, severance and other | 1,187 |
| | 1,073 |
| | 540 |
| | 57 |
| | (193 | ) | | 708 |
| | 1,534 |
| | 1,838 |
|
| Adjusted operating income (loss) | $ | 126,567 |
| | $ | 116,357 |
| | $ | (24,755 | ) | | $ | (27,134 | ) | | $ | (18,890 | ) | | $ | (15,334 | ) | | $ | 82,922 |
| | $ | 73,889 |
|
| Adjusted operating margin | 19.2 | % | | 18.1 | % | | N/A |
| | N/A |
| | N/A |
| | N/A |
| | 12.5 | % | | 11.4 | % |
|
| | | | | | | | | | | | | | | | | | | | | | | | | | | | | | | |
| | Greatbatch Medical | | QiG | | Unallocated | | Total |
| | Dec 28,
2012 | | Dec 30,
2011 | | Dec 28,
2012 | | Dec 30,
2011 | | Dec 28,
2012 | | Dec 30,
2011 | | Dec 28,
2012 | | Dec 30,
2011 |
| Total sales | $ | 643,722 |
| | $ | 568,822 |
| | $ | 2,455 |
| | $ | — |
| | $ | — |
| | $ | — |
| | $ | 646,177 |
| | $ | 568,822 |
|
| | | | | | | | | | | | | | | | |
| Operating income (loss) as reported | $ | 79,093 |
| | $ | 104,703 |
| | $ | (32,554 | ) | | $ | (27,277 | ) | | $ | (20,718 | ) | | $ | (15,727 | ) | | $ | 25,821 |
| | $ | 61,699 |
|
| Adjustments: | |
| | |
| | |
| | |
| | |
| | |
| | | | |
| Inventory step-up amortization (COS) | 532 |
| | 177 |
| | — |
| | — |
| | — |
| | — |
| | 532 |
| | 177 |
|
| Medical device DVT expenses (RD&E) | — |
| | — |
| | 5,190 |
| | 5,133 |
| | — |
| | — |
| | 5,190 |
| | 5,133 |
|
| Consolidation and optimization costs | 34,372 |
| | 361 |
| | 6 |
| | 64 |
| | 4,670 |
| | — |
| | 39,048 |
| | 425 |
|
| Acquisition and integration expenses | 1,287 |
| | — |
| | 167 |
| | — |
| | 6 |
| | — |
| | 1,460 |
| | — |
|
| Asset dispositions, severance and other | 1,073 |
| | 168 |
| | 57 |
| | — |
| | 708 |
| | — |
| | 1,838 |
| | 168 |
|
| Adjusted operating income (loss) | $ | 116,357 |
| | $ | 105,409 |
| | $ | (27,134 | ) | | $ | (22,080 | ) | | $ | (15,334 | ) | | $ | (15,727 | ) | | $ | 73,889 |
| | $ | 67,602 |
|
| Adjusted operating margin | 18.1 | % | | 18.5 | % | | N/A |
| | NA |
| | N/A |
| | N/A |
| | 11.4 | % | | 11.9 | % |
Medical Device Systems - In 2008, we began evolving our product offerings to include the development of complete medical device systems in order to raise the growth and profitability profile of the Company. This medical device systems strategy is being facilitated through QiG and leverages the component technology of Greatbatch Medical. More specifically, this strategy includes the development of a neuromodulation platform that can be used to support several devices most notably of which is our spinal cord stimulator to treat chronic intractable pain of the trunk and/or limbs, which we made a PMA filing and CE Mark submission near the end of 2013. In total, net medical device costs incurred by QiG were $30.5 million for 2013 compared to $32.6 million for 2012 and $27.3 million for 2011. QiG results for 2013 include $5.8 million of design verification testing (“DVT”) costs incurreddebt issued in connection with our developmentthe Lake Region Medical acquisition. In addition to the debt incurred, we issued 5.0 million shares to the former owners of Lake Region Medical as part of the consideration paid, which increased weighted average diluted shares outstanding.
The net result of the above is that GAAP net income was $6.0 million, a neuromodulation platform compared to $5.2loss of $7.6 million and $55.5 million, for 2012fiscal year 2016, 2015 and $5.1 million2014, respectively, and GAAP diluted earnings per share (“EPS”) were $0.19, a loss of $0.29 and $2.14 per share for 2011.
fiscal year 2016, 2015 and 2014, respectively.
We consistently report and discuss in our earnings releases and investor presentations adjusted diluted EPS and adjusted EBITDA. These amounts consist of GAAP amounts adjusted for unusual or infrequently occurring items and specific items related to our acquisition and consolidation initiatives. We believe that the presentation of adjusted diluted earnings per share and adjusted EBITDA provides important supplemental information to management and investors seeking to understand the financial and business trends relating to our financial condition and results of operations, including compliance with our bank covenant calculations. Refer to “Use of Non-GAAP Financial Information” above for a further description of these items.
A reconciliation of GAAP net income (loss) and diluted earnings (loss) per share (“EPS”)EPS to adjusted amounts for fiscal years 2016, 2015 and 2014 is as follows (in thousands, except per share amounts):
|
| | | | | | | | | | | | | | | | | | | | | | | |
| | Year Ended |
| | January 3,
2014 | | December 28,
2012 | | December 30,
2011 |
| | Net Income (Loss) | | Impact Per Diluted Share | | Net Income (Loss) | | Impact Per Diluted Share | | Net Income (Loss) | | Impact Per Diluted Share |
| Net income (loss) as reported | $ | 36,267 |
| | $ | 1.43 |
| | $ | (4,799 | ) | | $ | (0.20 | ) | | $ | 33,122 |
| | $ | 1.40 |
|
| Adjustments: | | | | | | | | | | | |
Inventory step-up amortization (COS)(a) | — |
| | — |
| | 346 |
| | 0.01 |
| | 115 |
| | — |
|
Medical device DVT expenses (RD&E)(a) | 3,765 |
| | 0.15 |
| | 3,374 |
| | 0.14 |
| | 3,336 |
| | 0.14 |
|
Consolidation and optimization costs(a) | 10,602 |
| | 0.42 |
| | 28,934 |
| | 1.21 |
| | 276 |
| | 0.01 |
|
Acquisition and integration (income) expenses(a) | (326 | ) | | (0.01 | ) | | 949 |
| | 0.04 |
| | — |
| | — |
|
Asset dispositions, severance and other(a) | 997 |
| | 0.04 |
| | 1,186 |
| | 0.05 |
| | 109 |
| | — |
|
Loss (gain) on cost and equity method investments, net(a)(b) | 451 |
| | 0.02 |
| | 69 |
| | — |
| | (2,751 | ) | | (0.12 | ) |
CSN conversion option discount and deferred fee acceleration amortization(a)(c) | 3,007 |
| | 0.12 |
| | 6,234 |
| | 0.26 |
| | 5,515 |
| | 0.23 |
|
2012 R&D tax credit(d) | (1,600 | ) | | (0.06 | ) | | — |
| | — |
| | — |
| | — |
|
Swiss tax impact(e) | — |
| | — |
| | 6,190 |
| | 0.26 |
| | — |
| | — |
|
Adjusted net income and diluted EPS(f) | $ | 53,163 |
| | $ | 2.10 |
| | $ | 42,483 |
| | $ | 1.77 |
| | $ | 39,722 |
| | $ | 1.68 |
|
Adjusted diluted weighted average shares(g) | 25,323 |
| | | | 23,947 |
| | | | 23,636 |
| | |
|
| | | | | | | | | | | | | | | | | | | | | | | | | | | | | | | | | | | |
| | 2016 | | 2015 | | 2014 |
| | Pre-Tax | | Net Income | | Per Diluted Share | | Pre-Tax | | Net Income (Loss) | | Per Diluted Share | | Pre-Tax | | Net Income | | Per Diluted Share |
| As reported (GAAP) | $ | 1,185 |
| | $ | 5,961 |
| | $ | 0.19 |
| | $ | (15,700 | ) | | $ | (7,594 | ) | | $ | 0.29 |
| | $ | 76,579 |
| | $ | 55,458 |
| | $ | 2.14 |
|
| Adjustments: | | | | | | | | | | | | | | | | | |
Amortization of intangibles(a) | 37,862 |
| | 26,771 |
| | 0.86 |
| | 17,496 |
| | 12,273 |
| | 0.45 |
| | 13,877 |
| | 9,637 |
| | 0.37 |
|
Acquisition related inventory step-up amortization (COS)(a) | — |
| | — |
| | — |
| | 22,986 |
| | 15,605 |
| | 0.57 |
| | 260 |
| | 195 |
| | 0.01 |
|
IP related litigation (SG&A)(a)(b) | 3,040 |
| | 1,976 |
| | 0.06 |
| | 4,417 |
| | 2,871 |
| | 0.11 |
| | 2,502 |
| | 1,626 |
| | 0.06 |
|
Other operating expenses, net (a): | | | | | | | | | | | | | | | | | |
Consolidation and optimization(c) | 26,490 |
| | 21,582 |
| | 0.69 |
| | 26,393 |
| | 21,158 |
| | 0.77 |
| | 11,188 |
| | 6,567 |
| | 0.25 |
|
Acquisition and integration(d) | 28,316 |
| | 18,554 |
| | 0.59 |
| | 33,449 |
| | 25,885 |
| | 0.95 |
| | 3 |
| | 61 |
| | — |
|
Asset dispositions, severance and other(e) | 6,931 |
| | 5,760 |
| | 0.18 |
| | 6,622 |
| | 5,099 |
| | 0.19 |
| | 4,106 |
| | 3,463 |
| | 0.13 |
|
Acquisition transaction costs(a)(f) | — |
| | — |
| | — |
| | 9,463 |
| | 6,151 |
| | 0.23 |
| | — |
| | — |
| | — |
|
(Gain) loss on cost and equity method investments, net(a) | 833 |
| | 541 |
| | 0.02 |
| | (3,350 | ) | | (2,177 | ) | | (0.08 | ) | | (4,370 | ) | | (2,841 | ) | | (0.11 | ) |
Tax adjustments(g) | — |
| | (154 | ) | | — |
| | — |
| | — |
| | — |
| | — |
| | — |
| | — |
|
Taxes(a) | (23,666 | ) | | — |
| | — |
| | (22,505 | ) | | — |
| | — |
| | (29,979 | ) | | — |
| | — |
|
| Adjusted (Non-GAAP) |
|
| | $ | 80,991 |
| | $ | 2.59 |
| |
|
| | $ | 79,271 |
| | $ | 2.90 |
| |
|
| | $ | 74,166 |
| | $ | 2.86 |
|
Adjusted diluted weighted average shares(h) | | | 31,222 |
| | | | | | 27,304 |
| | | | | | 25,975 |
| | |
MANAGEMENT’S DISCUSSION AND ANALYSIS
| |
| (a) | The difference between pre-tax and net income (loss) amounts is the estimated tax impact related to the respective adjustment. Net of taxincome amounts are computed using a 35% U.S., Mexico, Germany, and France statutory tax rates for the 2013, 2012 and 2011 periodsrate, a 0% Swiss tax rate, a 20% Netherlands statutory tax rate, a 25% Uruguay statutory tax rate, and a 0%, 22.5% and 22.5% Switzerland12.5% Ireland statutory tax raterate. Expenses that are not deductible for the 2013, 2012 and 2011 periods, respectively.tax purposes (i.e. permanent tax differences) are added back at 100%. |
| |
| (b) | Pre-tax amount is a lossIn 2013, we filed suit against AVX Corporation alleging they were infringing on our intellectual property (“IP”). Given the complexity and significant costs incurred pursuing this litigation, we are excluding these litigation expenses from adjusted amounts. Refer to Note 15 “Commitments and Contingencies” of $0.7 million, lossthe Notes to Consolidated Financial Statements contained in Item 8 of $0.1 million and a gain of $4.2 millionthis report for 2013, 2012 and 2011, respectively.additional information regarding this litigation. |
| |
| (c) | Pre-tax amount is $4.6 million, $9.6 millionRefer to the “Cost Savings and $8.5 millionConsolidation Efforts” section of this Item and Note 13 “Other Operating Expenses, Net” of the Notes to Consolidated Financial Statements contained in Item 8 of this report for 2013, 2012 and 2011, respectively.additional information regarding these initiatives. |
| |
| (d) | RelatesDuring 2016 and 2015, we incurred acquisition and integration costs related to the 2012 portionacquisition of the R&D tax creditLake Region Medical, which was reinstatedacquired in the first quarter of 2013 retroactive backOctober 2015. During 2015 and 2014, we incurred costs related to the beginningintegration of 2012. As required, the impact of the R&D tax credit relating to 2012CCC, which was recognizedacquired in 2013.August 2014. |
| |
| (e) | Relates2016 and 2015 amounts primarily include legal and professional fees incurred in connection with the Spin-off. 2014 amounts primarily include costs in connection with our business reorganization to the loss ofrealign our Swiss tax holiday due to our decision to transfercontract manufacturing out of Switzerland, as well as the establishment of a valuation allowance on our Swiss deferred tax assets as it is more likely than not that they will not be fully realized.operations. |
| |
| (f) | The per share dataDuring 2015, we recorded transaction costs (i.e. debt commitment fees, interest rate swap termination costs, debt extinguishment charges) in this table has been rounded to the nearest $0.01connection with our acquisition of Lake Region Medical. These expenses are included as a component of interest expense in our Consolidated Statement of Operations and therefore may not sum to the total.Comprehensive Income (Loss). |
| |
| (g) | Tax adjustments for 2016 include a $2.8 million tax benefit related to certain transaction costs of the Lake Region Medical acquisition and the Spin-off and a $2.6 million tax charge recorded in connection with the enactment of regulations under §987 of the Internal Revenue Code, which resulted in an adjustment to our deferred tax assets. |
| |
| (h) | Adjusted diluted weighted average shares for 2012fiscal year 2016 and 2015 includes 363,000249,000 and 941,000, respectively, of potentially dilutive shares not included in the computation of dilution related to outstanding stock incentive awards that were not dilutiveGAAP diluted weighted average shares because their effect would have been anti-dilutive for GAAP EPS purposes. |
For 2016, adjusted diluted EPS decreased 11% to $2.59 per share in comparison to 2015 primarily due to the decline in gross profit as discussed above. Note that the results of Nuvectra prior to the Spin-off decreased 2016 adjusted net income by $2.6 million and adjusted EPS by $0.08 per share.
For 2015, adjusted diluted EPS increased 1% to $2.90 per share in comparison to 2014. We estimate that the Lake Region Medical acquisition was approximately 2% dilutive to 2015 adjusted diluted EPS, and that excluding this impact, adjusted diluted EPS would have increased approximately 3% in comparison to 2014.
A reconciliation of GAAP net income (loss) to EBITDA and diluted EPS includeadjusted EBITDA for fiscal years 2016, 2015 and 2014 is as follows: |
| | | | | | | | | | | |
| (dollars in thousands) | 2016 | | 2015 | | 2014 |
| Net income (loss) as reported (GAAP) | $ | 5,961 |
| | $ | (7,594 | ) | | $ | 55,458 |
|
| | | | | | |
| Interest expense | 111,270 |
| | 33,513 |
| | 4,252 |
|
| Provision (benefit) for income taxes | (4,776 | ) | | (8,106 | ) | | 21,121 |
|
| Depreciation | 52,662 |
| | 27,136 |
| | 23,320 |
|
| Amortization | 37,862 |
| | 17,496 |
| | 13,877 |
|
| EBITDA (Non-GAAP) | 202,979 |
| | 62,445 |
| | 118,028 |
|
| | | | | | |
| Acquisition related inventory step-up amortization | — |
| | 22,986 |
| | 260 |
|
| IP related litigation | 3,040 |
| | 4,417 |
| | 2,502 |
|
| Stock-based compensation expense excluding OOE | 6,933 |
| | 9,287 |
| | 12,893 |
|
| Consolidation and optimization expenses | 26,490 |
| | 26,393 |
| | 11,188 |
|
| Acquisition and integration expenses | 28,316 |
| | 33,449 |
| | 3 |
|
| Asset dispositions, severance and other | 6,931 |
| | 6,622 |
| | 4,106 |
|
| Noncash (gain) loss on cost and equity method investments | 1,495 |
| | 275 |
| | (1,190 | ) |
| Adjusted EBITDA (Non-GAAP) | $ | 276,184 |
| | $ | 165,874 |
| | $ | 147,790 |
|
The changes in adjusted EBITDA for fiscal year 2016 versus fiscal year 2015 and 2014 are the impactresult of costs incurredthe same factors that drove the changes in connection with our consolidation and productivity initiatives discussed above, as well as certain tax charges/credits and certain non-cash charges to interest expense. Excluding these items, adjusted diluted EPS increased 19%as discussed above.
MANAGEMENT’S DISCUSSION AND ANALYSIS
Business Outlook
Our current full-year 2017 outlook is as follows (in millions, except for per share amounts):
|
| | | | | | | |
| | GAAP | | Adjusted Basis |
| | High | | Low | | High | | Low |
| Revenue | $1,430 | | $1,390 | | $1,430 | | $1,390 |
| Earnings per Diluted Share | $1.50 | | $1.10 | | $3.10 | | $2.70 |
Except as described below, further reconciliations by line item to the closest corresponding GAAP financial measures for adjusted basis earnings per diluted share, included in 2013 and 5% in 2012. We expect to achieve adjusted diluted EPS growth of 7-12% for 2014.
Targeted Acquisitions - The results for 2013, 2012 and 2011 include the impact of our acquisition of Micro Power on December 15, 2011 and NeuroNexus on February 16, 2012. Going forward, we will continue to pursue acquisitions to enhance our top and bottom line growth trajectory, with a focus on innovative solutions. Our strategic criteria for these acquisitions is that they should be complementary to our existing business model, drive expansion in core markets, allow us to enter adjacent growth markets,“Business Outlook” above, are focused on proprietary technology, can be tightly integrated into our operating base, and will enhance our return on invested capital performance.
We expect our 2014 performance to remainnot available without unreasonable efforts on a positive growth trajectory. Our guidance is illustrative of a multi-year strategy based on market knowledge, a relentless passionforward-looking basis due to evolve our business to capitalize on market trends,the high variability, complexity and the acquisition, development and retention of somevisibility of the brightest and hardest working minds in the world.
2014 Financial Guidance
For 2014, we have provided the followingcharges excluded from this non-GAAP financial guidance:
Sales $685 - $705 million
GAAP Operating Income as a % of Sales 11.0% - 11.5%measure.
Adjusted Operating Income as a % of Sales 13.0% - 13.3%
Capital Expenditures $25 - $35 million
GAAP Effective Tax Rate 34% - 35%
GAAP Diluted EPS $1.94 - $1.99
Adjusted Diluted EPS $2.25 - $2.35
Adjusted operating incomebasis earnings per diluted share for 20142017 is expected to consist of GAAP operating incomeNet Income and EPS, excluding items such as intangible amortization, IP related litigation costs, and consolidation, acquisition, consolidation, integration, and asset disposition/write-down charges totaling approximately $12 million to $15$72 million. The after taxafter-tax impact of these adjustmentsitems is estimated to be $7.5 million to $10approximately $50 million, or $0.31 to $0.35approximately $1.60 per diluted share. The current expected GAAP effective tax rate for 2014 does not include the benefit of the U.S. R&D tax credit, which expired at the end of 2013. If reinstated, our 2014 GAAP effective tax rate could be lowered to 32% to 33%.
Cost Savings and Consolidation Efforts
In 2013, 20122016, 2015 and 2011,2014, we recorded charges in Other Operating Expenses, NetOOE related to various cost savings and consolidation efforts.initiatives. These initiatives were undertaken to improve our operational efficiencies and profitability. Additional information regardingprofitability, the timing, cash flow impact and amountmost significant of future expenditures is set forthwhich are as follows (dollars in Note 13 “Other Operating Expenses, Net” ofmillions):
|
| | | | | | | | |
| Initiative | | Expected Expense | | Expected Capital | | Expected Annual Cost Savings(a) | | Expected Completion Date |
| 2014 investments in capacity and capabilities | | $50 - $55 | | $24 - $25 | | > $20 | | 2017 |
| Orthopedic facilities optimization | | $45 - $48 | | $31 - $35 | | $15 - $20 | | 2017 |
| Lake Region Medical consolidations | | $20 - $25 | | $5 - $6 | | $12 - $13 | | 2018 |
(a) Represents the Notesannual benefit to the Consolidated Financial Statements contained in Item 8 of this report, as well as the “Liquidity and Capital Resources” section of this Item.
In 2013, we initiated a plan to realign our operating structure in order to optimize our continued focus on profitable growth. As part of this initiative, the sales and marketing and operations groups of our former Implantable Medical and Electrochem segments were combined into one sales and marketing and one operations group serving the entire Company. Total restructuring chargesincome expected to be incurredrealized from these initiatives through cost savings and/or increased capacity. These benefits will be phased in connection with this realignmentover time as the various initiatives are between $6.5 million to $7.0 million,completed, some of which $5.6 million have been incurred to date. Expenses related to this initiative will be recorded within the applicable segment and corporate cost centers to which the expenditures relate. When fully implemented, this plan is expected to resultare already included in annual savings of approximately $7.0 to $7.7 million. This initiative is expected to be completed over the next six months.
Over the last three years, we have been implementing a multi-faceted plan to further enhance, optimize and leverage our orthopaedics operations. This plan included the construction of an orthopaedic manufacturing facility in Fort Wayne, IN, updating our Indianapolis, IN facility, the transfer of most major functions previously performed at our facilities in Orvin and Corgemont, Switzerland into our Fort Wayne, IN and Tijuana, Mexico facilities, and the expansion of our Chaumont, France facility in order to enhance our capabilities and fulfill larger customer supply agreements. The total capital investment expected for these initiatives is between $30 million and $35 million, of which $22 million has been expended to date. Total expense expected to be incurred for these initiatives is between $45 million and $50 million, of which $41.2 million has been incurred to date.current period results.
Near the end of 2011, we initiated plans to optimize and expand our manufacturing infrastructure in order to support our medical device strategy. This included the transfer of certain product lines to lower cost facilities, expansion of two of our existing facilities, as well as the purchase of equipment to create additional capacity for the manufacture of medical devices and create additional cost savings. Total capital investment under these initiatives is expected to be between $15 million to $20 million, of which approximately $12.4 million has been expended to date. Total expenses expected to be incurred on these projects is between $2 million to $3 million, of which $1.8 million has been incurred to date.
These orthopaedic and medical device initiatives are expected to be completed over the next three years and are expected to generate approximately $10 million to $15 million of annual cost savings and increase our capacity in order to support our growth and the manufacturing of complete medical devices.
In 2011, we initiated plans to upgrade our existing global ERP system. This initiative is expected to be completed over the next three months. Total capital investment under this initiative is expected to be approximately $4 million to $4.5 million, of which approximately $3.9 million has been expended to date. Total expenses expected to be incurred on this initiative is between $6 million to $7 million, of which $5.8 million has been incurred to date.
We continually evaluate our operating structure in order to maximize efficiencies and drive margin expansion. Future other operating expensescharges are expected to be lower thanincurred as a result of the 2013 levels, but could be impacted if new consolidation and optimization initiatives are undertaken.
Product Development
of the combined Greatbatch Medical
Our core business is well positioned because our OEM customers leverage our portfolio of intellectual property, and we continueLake Region Medical businesses. We seek to build a healthy pipeline of diverse medical technology opportunities. We continue to deepen our relationships with our OEM customers and continue to seecreate an increased pace of product development opportunities. These product development opportunities, when combined withoptimized manufacturing footprint, leveraging our increased salesscale and marketing resources,product capabilities while also supporting the needs of our customers. Our efforts will include:
potential manufacturing consolidations;
continuous improvement;
productivity initiatives;
direct material and indirect expense savings opportunities; and
the establishment of centers of excellence around the world.
Since the acquisition of Lake Region Medical, we achieved approximately $34 million of cumulative annual run-rate synergies, which exceeded our $25 million target. These net synergies are expected to allow usincrease to continue$60 million by 2018. We expect the total investment necessary to grow faster than our underlying markets. Someachieve these synergies to consist of $20 million to $25 million in capital expenditures and $40 million to $50 million of operating expenses. Refer to Note 13 “Other Operating Expenses, Net” of the product development opportunities Greatbatch Medical is pursuing are as follows:Notes to Consolidated Financial Statements contained in Item 8 of this report for additional information about the timing, cash flow impact, and amount of future expenditures for our cost savings and consolidation initiatives.
MANAGEMENT’S DISCUSSION AND ANALYSIS
|
| | |
Product Line | | Product Development Opportunities |
Cardiac/ Neuromodulation | | Developing next generation technology programs including Gen 2 QHR battery, next generation filtered feedthroughs, and high voltage capacitors.
|
| | |
Orthopaedic | | Developing single use instruments and a suite of reusable bone preparation instruments with an emphasis on increased efficacy and longer life. |
| | |
Portable Medical | | Developing wireless power solutions for the surgical tool marketplace. |
| | |
Vascular | | Developing a full line of arterial introducers, expanding our existing non-valved peelable introducer portfolio, and expanding our existing OptiSeal portfolio for the dialysis market. |
| | |
Energy/Other | | Developing wide range temperature battery packs. |
QiG
Through QiG, we provide our Greatbatch Medical customers with complete medical device systems. This medical device strategy includes strategic equity investments and medical devices developed independently, as well as in conjunction with our OEM partners. While we do not intend to discuss each of these projects individually, we will discuss significant milestones as they occur.
Our spinal cord stimulator to treat chronic intractable pain of the trunk and/or limbs, was designed to target unmet clinical needs with a focus on safety and product differentiation for all user groups. The FDA submission and Europe CE Mark submission for this device was made near the end of 2013. Collaboration continues with our investment bankers who are assisting us in identifying commercial partners.
CardiomoniX is an implantable loop recorder for cardiac arrhythmia diagnostics that is being designed to address the unmet needs of remote patient monitoring and data quality.
QiG is in the early stages of development of two additional medical device systems, which are targeting approved and emerging indications. Additionally, based upon the technology acquired from NeuroNexus, QiG is developing a platform of thin-film electrodes for neuromodulation leads, sub-systems and components.
Government Regulation
The Patient Protection and Affordable Care Act and the Health Care and Education Affordability Reconciliation Act (collectively “Health Care Reform”) legislated broad-based changes to the U.S. healthcare system that could significantly impact our business operations and financial results, including higher or lower revenue, as well as higher employee medical costs and taxes. Health Care Reform imposes significant new taxes on medical device OEMs, which will result in a significant increase in the tax burden on our industry and which could have a material negative impact on our financial condition, results of operations and our cash flows. Other elements of Health Care Reform such as comparative effectiveness research, an independent payment advisory board, payment system reforms including shared savings pilots and other provisions could meaningfully change the way healthcare is developed and delivered, and may materially impact numerous aspects of our business, results of operations and financial condition. Many significant parts of Health Care Reform will be phased in over the next several years and require further guidance and clarification in the form of regulations. The new medical device tax, which was effective in 2013, increased our cost of sales by $0.5 million.
On August 22, 2012, the U.S. Securities and Exchange Commission (“SEC”) issued a rule under Section 1502 of the Dodd-Frank Wall Street Reform and Consumer Protection Act requiring companies to publicly disclose their use of conflict minerals that originated in the Democratic Republic of the Congo (“DRC”) or an adjoining country. Under the rule, issuers are required to conduct a reasonable due diligence process to ascertain the source of conflict minerals, defined as tantalum, tin, gold or tungsten, that are necessary to the functionality or production of their manufactured or contracted to be manufactured products. Companies are required to provide this disclosure on a new form to be filed with the SEC called Form SD. Companies are required to file Form SD on May 31, 2014 for the 2013 calendar period and annually on May 31 every year thereafter. We anticipate additional, new compliance costs to be incurred since we utilize all of the minerals specified in the rule. We are unable to quantify the cost of implementing this new regulation at this time.
Our Critical Accounting EstimatesCRITICAL ACCOUNTING ESTIMATES
The preparation of our consolidated financial statements in accordance with GAAP requires us to make estimates and assumptions that affect reported amounts and related disclosures. The methods, estimates and judgments we use in applying our accounting policies have a significant impact on the results we report in our consolidated financial statements. Management considers an accounting estimate to be critical if (1) it requires assumptions to be made that were uncertain at the time the estimate was made; and (2) changes in the estimate or different estimates that could have been selected could have a material impact on our consolidated results of operations, financial position or cash flows. Our most critical accounting estimates are described below. We also have other policies that we consider key accounting policies, such as our policies for revenue recognition;recognition policy; however, these policies do not meet the definition of critical accounting estimates, because they do not generally require us to make estimates or judgments that are difficult or subjective.
ValuationIntangible Assets and Goodwill
We account for business combinations using the acquisition method of goodwill and other identifiable intangible assets
When weaccounting, which requires that the cost to acquire a company we allocate the purchase priceis allocated to the tangible and intangible assets we acquireacquired and liabilities we assumeassumed based on estimates of their respective fair valuevalues at the date of acquisition. Goodwill is recorded whenOur more significant intangible assets, other than goodwill, include tradenames, trademarks, patents, technology, and customer lists. Any excess of the purchase price paid for an acquisition exceedsover the estimated fair valuevalues of the net identified tangible and intangible assets acquired. In additionacquired is recorded as goodwill. Determining the estimated fair value assigned to goodwill, someeach class of assets acquired and liabilities assumed, as well as asset lives, requires us to make significant estimates and judgments, which can materially impact our results of operations.
Definite-lived intangible assets are considered non-amortizingamortized over the expected life of the asset and are tested for impairment when events or circumstances indicate that their carrying value may not be recoverable. Indefinite lived intangible assets, as they are expected to generate cash flows indefinitely. Goodwillwhich include goodwill, tradenames and indefinite-lived intangiblestrademarks, are not amortized but are required to be assessedtested for impairment on an annual basis or more frequentfrequently if certain indicators are present. Definite-lived intangible assets are amortized overan event or change in circumstance occurs that would indicate that their estimated useful lives and are assessed for impairment if certain indicators are present. As discussed in Note 7 “Intangible Assets” of the Notes to Consolidated Financial Statements contained in Item 8 of this report, in connection with the realignment of the Company's operating structure in 2013, the Company reevaluated its operating and reporting segments. Beginning in the fourth quarter of 2013, the Company determined that it has two operating segments: Greatbatch Medical and QiG, and, as required, reassigned goodwill to each of these reporting units based upon their relative fair values. Fair values for the reporting units were determined using the assumptions and approach discussed below.carrying amount may be impaired.
Assumptions/Assumptions / Approach Used
We base theThe fair value of identifiable tangible and intangible assets, on detailed valuations that use informationincluding goodwill, is based upon management’s assumptions and assumptions provided by management. The fair values of intangible assets areis determined using one of three valuation approaches: market, income or cost. The selection of a particular method depends on the reliability of available data and the nature of the asset. The market approach values the asset based onutilizes available market pricing for comparable assets. The income approach values the assetis based onupon the present value of risk adjusted cash flows projected to be generated by thatthe asset. The projected cash flows for each asset considers multipleconsider several factors from the perspective of a marketplacemarket participant, including current revenue expectations from existing customers, attrition trends, pricing, reasonable contract renewal assumptions, new product launches, cost synergies, royalty rates and expected profit margins, giving consideration to historical and expected margins. The cost approach valuesis based upon the asset by determiningcost to replace the current cost of replacing that asset with another of equivalent economic utility. The cost to replace the asset reflects the estimated reproduction or replacement cost less an allowance for loss in value due to depreciation or obsolescence, with specific consideration given to economic obsolescence, if indicated.
We perform an annual reviewOur indefinite-lived intangible assets, other than goodwill, consist of the Greatbatch and Lake Region tradenames and were tested for impairment on the last day of eachour fiscal year using a form of the income approach referred to as the relief from royalty method. The key assumptions in the analysis performed as of December 30, 2016 include projected future revenues consistent with those discussed in the Business Outlook section of this Item, a discount rate of 11.0%, royalty rates ranging from 1.0% to 2.0%, a tax rate of 38% and a terminal growth rate of 3.00%. The assumptions used also incorporated the forward-looking statements made throughout this Management’s Discussion and Analysis of Financial Condition and Results of Operations section of this Item.
We do not believe that the Greatbatch tradename is at risk of failing future impairment analysis unless there is a significant decline in future revenues, as the results of the current year impairment analysis indicated that the fair value of the Greatbatch tradename was in excess of its carrying value by over 300%. The Lake Region tradename may be subject to future impairment if projected future revenues are not achieved or if there is a change to the underlying assumptions discussed above.
MANAGEMENT’S DISCUSSION AND ANALYSIS
Goodwill is required to be tested for impairment on the last day of the fiscal year or more frequently if indicators of potentialan event or change in circumstance occurs that would indicate that its carrying amount may be impaired. Goodwill is tested for impairment exist, to determine ifat the recorded goodwill and other indefinite-lived intangible assets are impaired. We assess goodwill for impairmentreporting unit level, which is defined as an operating segment or one level below, by comparing the fair value of oureach reporting unitsunit to theirits carrying valuevalue. When evaluating goodwill for impairment, we may elect to first perform an assessment of qualitative factors, referred to as the “step-zero” approach, to determine if there is potential impairment. If the fair value of athe reporting unit is more-likely-than-not greater than its carrying amount. Based on the review of the qualitative factors, if we determine it is more-likely-than-not that the fair value of the reporting unit is greater than its carrying value, the two-step quantitative impairment test can by bypassed. If we determine that it is more-likely-than not that the fair value of the reporting unit is less than its carrying value, anor if we chose to bypass the qualitative assessment altogether, we are required to test goodwill for impairment lossunder the two-step quantitative approach. The first step of the quantitative approach is recorded to calculate the extent thatestimated fair value of each reporting unit and compare it to its carrying value. If the implied fair value of the reporting unit is greater than its carrying value, then goodwill withinis not considered impaired. If the fair value of the reporting unit is less than its carrying value. Fair valuesvalue, we must complete the second step of the quantitative approach and compute an impairment loss.
As a result of the Spin-off in March 2016, we performed a step-zero goodwill impairment analysis for our QiG reporting unit. Based upon our review of the qualitative factors under the step-zero approach, we determined that it was more-likely-than-not that the fair value of QiG was greater than its carrying value, thus the two-step quantitative approach was not required. The qualitative factors considered included, but were not limited to, macroeconomic conditions, share price, competitive environment, industry and market data, cost factors, the overall financial performance of each of the reporting units, arethe results of the last impairment test, and other entity and reporting unit specific events.
As a result of the Lake Region acquisition in October 2015 and the Spin-off in March 2016, we reorganized our operations including our internal management and financial reporting structure, which was completed in the fourth quarter of 2016. As a result, we reevaluated and revised our reportable operating segments from Greatbatch Medical, QiG and Lake Region Medical to Medical and Non-Medical. As required, we reallocated goodwill to each of the new reportable operating segments based upon their relative fair values, as determined based onusing a combination of the income and market approaches. Indefinite-lived intangible assets are evaluatedThis change in reportable operating segments also triggered us to perform a step-zero goodwill impairment analysis for the previous reporting units immediately prior to the change. Based upon our review of the qualitative factors under the step-zero approach, we determined that it was more-likely-than-not that the fair value of Greatbatch Medical, QiG and Lake Region Medical were greater than their carrying value, thus the two-step quantitative approach was not required. The qualitative factors considered included, but were not limited to, macroeconomic conditions, share price, competitive environment, industry and market data, cost factors, the overall financial performance of each of the reporting units, the results of the last impairment test, and other entity and reporting unit specific events.
For our annual impairment test on December 30, 2016, we chose to bypass the step-zero qualitative assessment and tested goodwill for impairment by using the two-step quantitative approach. The fair value of each reporting unit, Medical and Non-Medical, was determined using a combination of the income approach. Definite-lived intangible assets are reviewed at least quarterlyand market approaches. The present value of the risk adjusted cash flows computed under the income approach for the Medical reporting unit were calculated using projected future revenues consistent with those discussed in the Business Outlook section of this Item, a discount rate of 9.0%, a tax rate of 28%, and a long-term terminal growth rate of 3.0%. The market approach used for the Medical reporting unit considered EBITDA multiples based upon comparable public companies ranging from 8.5x to determine if any conditions exist or9.5x and recent market transactions ranging from 10.5x to 12.5x. The present value of the risk adjusted cash flows computed under the income approach for the Non-Medical reporting unit were calculated using a changediscount rate of 10.0%, a tax rate of 38%, and a long-term terminal growth rate of 3.0%. The market approach used for the non-medical reporting unit considered EBITDA multiples based upon comparable public companies of 9.5x and recent market transactions ranging from 11.0x to 13.5x. The assumptions used in circumstances has occurredour 2016 impairment analysis for the Medical and Non-Medical reporting units also incorporated the forward-looking statements made throughout this Management’s Discussion and Analysis of Financial Condition and Results of Operations section of this Item.
Based upon our step one quantitative assessment, it was determined that would indicate impairment or a change inthe fair value of both the Medical and Non-Medical reporting units exceeded their remaining useful life.carrying value and that the second step of the quantitative approach was not required.
We do not believe that the indefinite-lived intangible assets or goodwill allocated to our Greatbatchthe Medical or QiG segments arereporting unit is at risk of failing step one of future annual impairment testsanalysis unless operating conditions significantly deteriorate, givenas the significant amountresults of our current year impairment analysis indicated that our estimatedthe fair value for these assetsof the Medical reporting unit was in excess of their respective book values as of January 3, 2014.its carrying value by over 50%. Examples of a significant deterioration in operating conditions for Greatbatch Medical and QiG could include the following: Greatbatch Medical - the loss of one or more significant customers, technology obsolescence, product liability claims or significant manufacturing disruption, among others. QiG - regulatory non-approvalamongst other factors. The goodwill allocated to the Non-Medical reporting unit may be subject to future impairment if actual operating results continue to deteriorate consistent with the previous two fiscal years, which was driven by the downturn in the energy markets. Based upon our quantitative assessment, it was determined that the fair value of new medical device systems, lackthe Non-Medical reporting unit was in excess of market acceptance, discontinuation of significant development projects, technology obsolescence or failure of technology, among others.its carrying value by approximately 15%.
MANAGEMENT’S DISCUSSION AND ANALYSIS
Effect of Variation of Key Assumptions Used
The use of alternative valuation assumptions, including estimated cash flows and discount rates, and alternative estimated useful life assumptions could result in significant changes to our intangible asset fair value estimates. These changes in fair value estimates could impact the amount and timing of future intangible asset amortization expense and/or result in impairment losses.
We make certain estimates and assumptions that affect the expected future cash flows and fair value of our reporting units forwithin our quantitative goodwill impairment testing.analysis. These include discount rates, tax rates, terminal values andgrowth rates, projections of future revenues and expenses.expenses and EBITDA multiples, among others. Significant changes in these estimates and assumptions could create future impairment losses to our goodwill. The assumptions used in our 2013 impairment test incorporate the information disclosed in “2014 Financial Guidance” of this section as well as other forward-looking statements made in this Management's Discussion and Analysis of Financial Condition and Results of Operations section.
For our indefinite-lived intangible assets, we make estimates of royalty rates, tax rates, terminal growth rates, future revenues, and discount rates. Significant changes in these estimates could create future impairments of these assets.
Estimation of the useful lives of indefinite-indefinite and definite-liveddefinite lived intangible assets is based upon the estimated cash flows of the respective intangible asset and requires significant management judgment. Events could occur that would materially affect our estimates of the useful lives. Significant changes in these estimates and assumptions could change the amount of future amortization expense or could create future impairmentsimpairment of these intangible assets.
The way the Company’s management allocates resources and evaluates its businesses determines the reporting unit level which goodwill is tested for impairment. Significant changes to these reporting units could create future impairments of goodwill.
As of January 3, 2014,December 30, 2016, we have $443.1 million$1.9 billion of intangible assets recorded on our consolidated balance sheet, representing 50%approximately 67% of total assets. This includes $76.1$849.8 million of amortizing intangible assets, $20.3$90.3 million of indefinite-lived intangible assets and $346.7$967.3 million of goodwill. A 1% changeincrease in the amortization of our intangible assets would change 2013decrease our 2016 net income by approximately $0.09$0.25 million, or less than $0.01 per diluted share. A 1% impairment of our intangible assets would decrease our 2016 net income by approximately $12.4 million, or approximately $0.003$0.40 per diluted share.
Stock-based compensationCompensation
We record compensation costs related to our stock-based awards, which include stock options, restricted stock and restricted stock units. We measure stock-based compensation cost at the grant date based on the fair value of the award.
Compensation cost for service-based awards is recognized ratably over the applicable vesting period. Compensation cost for performance awards based on Company financial metrics is reassessed each period and recognized based upon the probability that the performance targets will be achieved. Compensation cost for performance awards based on market metrics, (suchsuch as total shareholder return)return, is expensed each period whether the performance metrics are achieved or not. The amount of stock-based compensation expense recognized during a period is based on the portion of the awards that are ultimately expected to vest as well asdue to the employee meeting the service element of the award, including market and nonmarket performance award considerations.awards. The total expense recognized over the vesting period will only be for those awards that ultimately vest as well as marketfor service-based and nonmarketnonmarket-based performance award considerations.awards. The total expense recognized over the vesting period for market-based performance awards will only be for those awards where the service requirements were met.
Assumptions/Assumptions / Approach Used
We utilize the Black-Scholes Option Pricing Model to determine the fair value of stock options. We are required to make certain assumptions with respect to selected Black-Scholes model inputs, including expected volatility, expected life, expected dividend yield and the risk-free interest rate. Expected volatility is based on the historical volatility of our stock over the most recent period commensurate with the estimated expected life of the stock options. The expected life of stock options granted, which represents the period of time that the stock options are expected to be outstanding, is based primarily on historical data. The expected dividend yield is based on our history and expectation of dividend payouts. The risk-free interest rate is based on the U.S. Treasury yield curve in effect at the time of grant for a period commensurate with the estimated expected life.
The fair value of time-based as well asand nonmarket-based performance restricted stock and restricted stock unit awards is equal to the fair value of the Company’s stock on the date of grant.grant date. The fair value of market-based performance restricted stock unit awards is determined by utilizing a Monte Carlo simulation model, which projects the value of GreatbatchInteger stock versus our peer group under numerous scenarios and determines the value of the award based upon the present value of these projected outcomes.
Compensation cost for nonmarket-based performance awards is reassessed each period and recognized based upon the probability that the performance targets will be achieved. That assessment is based uponachieved considering actual and expected future performance.
Stock-based compensation expense is recorded for those awards that arewhere the service period is expected to vest, as well asbe met by the associate, including market and nonmarket performance award considerations.awards. Forfeiture estimates for determining appropriate stock-based compensation expense are estimatedmade at the time of grant date based on historical experience and demographic characteristics. Revisions are made to those estimates in subsequent periods if actual forfeitures differ from estimated forfeitures.
MANAGEMENT’S DISCUSSION AND ANALYSIS
Effect of Variation of Key Assumptions Used
Option pricing models were developed for use in estimating the fair value of traded options that have no vesting restrictions and are fully transferable. BecauseAs our share-based payments have characteristics significantly different from those of freely traded options, and because changes in the subjective input assumptions can materially affect our estimates, of fair values, existing valuation models may not provide reliable measures of the fair values of our share-basedshared-based compensation. Consequently, there is a risk that our estimates of the fair values of our share-based compensation awards may bear little resemblance to the actual values realized upon the exercise, expiration or forfeiture of those share-based payments in the future. Stock options may expire worthless or otherwise result in zero intrinsic value as compared to the fair values originally estimated on the grant date and reported in our consolidated financial statements. Alternatively, value may be realized from these instruments that areis significantly in excess of the fair values originally estimated on the grant date and reported in our consolidated financial statements. There are significant differences among valuation models. Thismodels, which may result in a lack of comparability with other companies that use different models, methods and assumptions.
There is a high degree of subjectivity involved in selecting the assumptions to be utilized to determine fair value and forfeiture assumptions.rates. If factors change, and resultresulting in the use of different assumptions in future periods, the expense that we record for future grants may differ significantly from what we have recorded in the current period. Additionally, changes in performance of the Company and its stock price will affect the likelihood that performance-basednon-market-based performance targets are achieved and could materially impact the amount of stock-based compensation expense recognized.
A 1% changeincrease in our stock-based compensation expense would change 2013decrease our 2016 net income by approximately $0.06$0.1 million, or approximately $0.002less than $0.01 per diluted share.
As discussed in Note 1 “Summary of Significant Accounting Policies” of the Notes to Consolidated Financial Statements contained in Item 8 of this report, we will be adopting Accounting Standards Update (“ASU”) No. 2016-09, “Compensation-Stock Compensation (Topic 718): Improvements to Employee Share-Based Payment Accounting” in the first quarter of fiscal year 2017. This new guidance changes how companies account for certain aspects of share-based payment awards to employees, including the accounting for income taxes, forfeitures and statutory tax withholding requirements, as well as classification in the statement of cash flows. The adoption of this ASU is not expected to have a material impact on our Consolidated Financial Statements.
Inventories
Inventories are stated at the lower of cost, determined using the first-in, first-out method, or market.
Assumptions/Assumptions / Approach Used
Inventory costing requires complex calculations that include assumptions for overhead absorption, scrap, sample calculations, manufacturing yield estimates, costs to sell, and the determination of which costs may be capitalized. The valuation of inventory requires us to estimate obsolete or excess inventory, as well as inventory that is not of saleable quality.
Effect of Variation of Key Assumptions Used
Variations in methods or assumptions could have a material impact on our results. If our demand forecast for specific products is greater than actual demand and we fail to reduce manufacturing output accordingly, we could be required to record additional inventory write-downswrite-down or expense a greater amount of overhead costs, which would have a negativenegatively impact on our net income.
As of January 3, 2014,December 30, 2016, we have $118.4$225.2 million of inventory recorded on our consolidated balance sheet, representing 13%approximately 8% of total assets. A 1% write-down of our inventory would change 2013decrease our 2016 net income by approximately $0.8$1.5 million, or approximately $0.03$0.05 per diluted share.
As discussed in Note 1 “Summary of Significant Accounting Policies” of the Notes to Consolidated Financial Statements contained in Item 8 of this report, we will be adopting ASU No. 2015-11, “Simplifying the Measurement of Inventory,” which requires inventory to be measured at the lower of cost or net realizable value, on a prospective basis in the first quarter of fiscal 2017. We intend to adopt this guidance in the first quarter of fiscal year 2017 on a prospective basis and are currently assessing the impact of adopting this ASU on our Consolidated Financial Statements.
MANAGEMENT’S DISCUSSION AND ANALYSIS
Tangible long-lived assetsLong-Lived Assets
Property, plant and equipment and other tangible long-lived assets are carried at cost. The cost of property, plant and equipment is charged to depreciation expense over the estimated life of the operating assets, primarily usingon a straight-line rates.basis. Tangible long-lived assets are subject to impairment assessment if certain indicators are present.
Assumptions/Assumptions / Approach Used
We assess the impairment of tangible long-lived assets for impairment when events occur or changes in circumstances change that would indicate that the carrying value of the asset (asset group) may not be recoverable. Factors that we consider in deciding when to perform an impairment review include, but are not limited to: a significant decrease in the market price of the asset (asset group); a significant change in the extent or manner in which a long-livedthe asset (asset group) is being used or in its physical condition; a significant change in legal factors or in the business climate that could affect the value of a long-lived asset (asset group), including an action or assessment by a regulator; an accumulation of costs significantly in excess of the amount originally expected for the construction;acquisition or construction of a long-lived asset (asset group); a current-period operating or cash flow loss combined with a history of operating or cash flow losses or a projection or forecast that demonstrates continuing losses associated with the use of a long-lived asset (asset group); orand a current expectation that it is more likely than not that a long-lived asset (asset group) will be sold or otherwise disposed of significantly before the end of its previously estimated useful life.
Recoverability potential is measured by comparing the carrying amount of the asset (asset group) to the related total undiscounted future undiscounted cash flows. The projected cash flows for each asset (asset group) considers multiple factors, including current revenue from existing customers, proceeds from the sale of the asset (asset group), reasonable contractcontractual renewal assumptions and expected profit margins, giving consideration tobased on historical and expected future margins. If an asset’s (assets(asset group’s) carrying value is not recoverable through related undiscounted future cash flows, the asset (asset group) is considered to be impaired. Impairment is measured by comparing the asset’s (asset group’s) carrying amount to its fair value.
When it is determined that the useful liveslife of assets arean asset (asset group) is shorter than originally estimated, and there are sufficient cash flows to supportsupporting the carrying value of the assets,asset (asset group), we accelerate the rate of depreciation in order to fully depreciate the assetsasset over theirits shorter useful lives.life.
Effect of Variation of Key Assumptions Used
Estimation of the cash flows and useful lives of tangible long-lived assets that are long-lived requires significant management judgment. Events could occur that would materially affect our estimates and assumptions. Unforeseen changes in operationssuch as loss of one or more significant customers, technology obsolescence, or significant manufacturing disruption, amongst other factors, could substantially alter the assumptions regarding the ability to realize the return of our investment in long-lived assets or thetheir estimated useful lives. Also, as we make manufacturing process conversions and other facility consolidation decisions, we must make subjective judgments regarding the remaining cash flows and useful lives of our assets, primarily manufacturing equipment and buildings. Significant changes in these estimates and assumptions could change the amount of future depreciation expense or could create future impairments of these long-lived assets (asset groups).
As of January 3, 2014December 30, 2016, we have $145.8$372.0 million of tangible long-lived assets recorded on our consolidated balance sheet, representing 16%approximately 13% of total assets. A 1% write-down in our tangible long-lived assets would change 2013decrease our 2016 net income by approximately $0.9$2.4 million, or approximately $0.04$0.08 per diluted share.
Provision for income taxesIncome Taxes
Our consolidated financial statements have been prepared using the asset and liability approach in accounting for income taxes, which requires the recognition of deferred income taxes for the expected future tax consequences of net operating losses, credits and temporary differences between the financial statement carrying amounts and the tax bases of assets and liabilities. A valuation allowance is provided on deferred tax assets if it is determined that it is more likely than not that the asset will not be realized.
Assumptions/Assumptions / Approach Used
In recording the provision for income taxes, management must estimate the future tax rates applicable to the reversal of temporary differences based upon the timing of the expected reversal. Also, estimates are made as to whether taxable operating income in future periods will be sufficient to fully recognize any gross deferred tax assets. If recovery is not likely, we must increase our provision for income taxes by recording a valuation allowance against the deferred tax assets that we estimate will not ultimately be recoverable. Alternatively, we may make estimates about the potential usage of deferred tax assets that decrease our valuation allowances.
MANAGEMENT’S DISCUSSION AND ANALYSIS
The calculation of our tax liabilities involves dealing with uncertainties in the application of complex tax regulations. Significant judgment is required in evaluating our tax positions and determining our provision for income taxes. During the ordinary course of business, there are many transactions and calculations for which the ultimate tax determination is uncertain. We establish reserves for uncertain tax positions when we believe that certainthose tax positions do not meet the more likely than not threshold. We adjust these reserves in light of changing facts and circumstances, such as the outcome of a tax audit or the lapse of statutes of limitations. The provision for income taxes includes the impact of reserve provisions and changes to the reserves that are considered appropriate.
Effect of Variation of Key Assumptions Used
Changes could occur that would materially affect our estimates and assumptions regarding deferred taxes. Changes in current tax laws and tax rates could affect the valuation of deferred tax assets and liabilities, thereby changing the income tax provision. Also, significant declines in taxable income could materially impact the realizable value of deferred tax assets.
At January 3, 2014,December 30, 2016, we had $34.1$204.2 million of gross deferred tax assets on our consolidated balance sheet and a valuation allowance of $11.7$35.4 million has been established for certain deferred tax assets, as it is more likely than not that they will not be realized. As of December 30, 2016, the Company has federal net operating loss (“NOL”) carryforwards of approximately $388.6 million expiring at various dates through 2034. If not utilized, these carryforwards will begin to expire in 2019. In assessing the realizability of the deferred tax asset associated with the NOLs, management relied on the reversal of deferred tax liabilities within the U.S. taxing jurisdictions of approximately $861.7 million.
As of December 30, 2016, we had unrecognized tax positions of $10.6 million. Within the next twelve months, it is reasonably possible that approximately $0.6 million of the total uncertain tax positions recorded will reverse, primarily due to the expiration of statutes of limitation in various jurisdictions and/or audit settlements. Approximately $9.8 million would favorably impact the effective rate once settled.
A 1% changedecrease in the effective tax rate would impactdecrease the current year provisionbenefit for incomeincomes taxes by $0.5less than $0.01 million and 20132016 diluted earnings per share by $0.02less than $0.01 per diluted share. An increase in the valuation allowance representing 1% of our gross deferred tax assets would decrease our 2016 net income by approximately $2.0 million, or $0.07 per diluted share.
MANAGEMENT’S DISCUSSION AND ANALYSIS
Our Financial Results
We utilize a fifty-two, fifty-three week fiscal year ending on the Friday nearest December 31st. Fiscal years 2013, 2012 and 2011 ended on January 3, 2014, December 28, 2012 and December 30, 2011, respectively. Fiscal year 2013 contained fifty-three weeks. Fiscal years 2012 and 2011 each contained fifty-two weeks.
| | | | Year Ended | | 2013 vs. 2012 | | 2012 vs. 2011 | | | 2016 vs. 2015 | | 2015 vs. 2014 |
| | January 3,
2014 | | December 28,
2012 | | December 30,
2011 | | $ Change | | % Change | | $ Change | | % Change | 2016 | | 2015 | | 2014 | | $ Change | | % Change | | $ Change | | % Change |
| Dollars in thousands, except per share data | Dollars in thousands, except per share data | | | | | | | | | | | Dollars in thousands, except per share data | | | | | | | | | | | | |
| Greatbatch Medical Sales | | | | | | | | | | | |
| Cardiac/ Neuromodulation | $ | 325,412 |
| | $ | 306,669 |
| | $ | 303,690 |
| | $ | 18,743 |
| | 6 | % | | $ | 2,979 |
| | 1 | % | |
| Orthopaedics | 130,247 |
| | 122,061 |
| | 140,277 |
| | 8,186 |
| | 7 | % | | (18,216 | ) | | (13 | )% | |
| Portable Medical | 78,743 |
| | 81,659 |
| | 9,609 |
| | (2,916 | ) | | (4 | )% | | 72,050 |
| | N/A |
| |
| Vascular | 48,357 |
| | 51,980 |
| | 45,098 |
| | (3,623 | ) | | (7 | )% | | 6,882 |
| | 15 | % | |
| Energy | 52,488 |
| | 54,066 |
| | 48,100 |
| | (1,578 | ) | | (3 | )% | | 5,966 |
| | 12 | % | |
| Other | 25,655 |
| | 27,287 |
| | 22,048 |
| | (1,632 | ) | | (6 | )% | | 5,239 |
| | 24 | % | |
| Total Greatbatch Medical | 660,902 |
| | 643,722 |
| | 568,822 |
| | 17,180 |
| | 3 | % | | 74,900 |
| | 13 | % | |
| QiG | 3,043 |
| | 2,455 |
| | — |
| | 588 |
| | 24 | % | | 2,455 |
| | NA |
| |
| Medical Sales: | | | | | | | | | | | | | | |
| Cardio & Vascular | | $ | 568,510 |
| | $ | 143,260 |
| | $ | 58,770 |
| | $ | 425,250 |
| | 297 | % | | $ | 84,490 |
| | 144 | % |
| Cardiac & Neuromodulation | | 389,403 |
| | 356,064 |
| | 330,921 |
| | 33,339 |
| | 9 | % | | 25,143 |
| | 8 | % |
| Advanced Surgical, Orthopedics & Portable Medical | | 392,778 |
| | 243,385 |
| | 216,339 |
| | 149,393 |
| | 61 | % | | 27,046 |
| | 13 | % |
| Elimination of interproduct line sales | | (5,592 | ) | | (1,744 | ) | | — |
| | (3,848 | ) | | N/A |
| | (1,744 | ) | | NA |
|
| Total Medical Sales | | 1,345,099 |
| | 740,965 |
| | 606,030 |
| | 604,134 |
| | 82 | % | | 134,935 |
| | 22 | % |
| Non-Medical | | 41,679 |
| | 59,449 |
| | 81,757 |
| | (17,770 | ) | | (30 | )% | | (22,308 | ) | | (27 | )% |
| Total sales | 663,945 |
| | 646,177 |
| | 568,822 |
| | 17,768 |
| | 3 | % | | 77,355 |
| | 14 | % | 1,386,778 |
| | 800,414 |
| | 687,787 |
| | 586,364 |
| | 73 | % | | 112,627 |
| | 16 | % |
| Cost of sales | 444,632 |
| | 444,528 |
| | 388,469 |
| | 104 |
| | — | % | | 56,059 |
| | 14 | % | 1,008,479 |
| | 565,279 |
| | 456,389 |
| | 443,200 |
| | 78 | % | | 108,890 |
| | 24 | % |
| Gross profit | 219,313 |
| | 201,649 |
| | 180,353 |
| | 17,664 |
| | 9 | % | | 21,296 |
| | 12 | % | 378,299 |
| | 235,135 |
| | 231,398 |
| | 143,164 |
| | 61 | % | | 3,737 |
| | 2 | % |
| Gross profit as a % of sales | 33.0 | % | | 31.2 | % | | 31.7 | % | | | | | | | | | 27.3 | % | | 29.4 | % | | 33.6 | % | | | | | | | | |
| Selling, general and administrative expenses (SG&A) | 88,107 |
| | 80,992 |
| | 72,548 |
| | 7,115 |
| | 9 | % | | 8,444 |
| | 12 | % | 153,291 |
| | 102,530 |
| | 90,602 |
| | 50,761 |
| | 50 | % | | 11,928 |
| | 13 | % |
| SG&A as a % of sales | 13.3 | % | | 12.5 | % | | 12.8 | % | | | | | | | | | 11.1 | % | | 12.8 | % | | 13.2 | % | | | | | | | | |
| Research, development and engineering costs, net (RD&E) | 54,077 |
| | 52,490 |
| | 45,513 |
| | 1,587 |
| | 3 | % | | 6,977 |
| | 15 | % | 55,001 |
| | 52,995 |
| | 49,845 |
| | 2,006 |
| | 4 | % | | 3,150 |
| | 6 | % |
| RD&E as a % of sales | 8.1 | % | | 8.1 | % | | 8.0 | % | | | | | | | | | 4.0 | % | | 6.6 | % | | 7.2 | % | | | | | | | | |
| Other operating expenses, net | 15,790 |
| | 42,346 |
| | 593 |
| | (26,556 | ) | | (63 | )% | | 41,753 |
| | NA |
| 61,737 |
| | 66,464 |
| | 15,297 |
| | (4,727 | ) | | (7 | )% | | 51,167 |
| | 334 | % |
| Operating income | 61,339 |
| | 25,821 |
| | 61,699 |
| | 35,518 |
| | 138 | % | | (35,878 | ) | | (58 | )% | 108,270 |
| | 13,146 |
| | 75,654 |
| | 95,124 |
| | 724 | % | | (62,508 | ) | | (83 | )% |
| Operating margin | 9.2 | % | | 4.0 | % | | 10.8 | % | | | | | | | | | 7.8 | % | | 1.6 | % | | 11.0 | % | | | | | | | | |
| Interest expense | 11,261 |
| | 18,055 |
| | 16,928 |
| | (6,794 | ) | | (38 | )% | | 1,127 |
| | 7 | % | 111,270 |
| | 33,513 |
| | 4,252 |
| | 77,757 |
| | 232 | % | | 29,261 |
| | 688 | % |
| Interest income | — |
| | (1 | ) | | (21 | ) | | 1 |
| | (100 | )% | | 20 |
| | (95 | )% | |
| (Gain) loss on cost and equity method investments, net | 694 |
| | 106 |
| | (4,232 | ) | | 588 |
| | NA |
| | 4,338 |
| | NA |
| 833 |
| | (3,350 | ) | | (4,370 | ) | | 4,183 |
| | N/A |
| | 1,020 |
| | N/A |
|
| Other expense, net | 546 |
| | 931 |
| | 632 |
| | (385 | ) | | (41 | )% | | 299 |
| | 47 | % | |
| Provision for income taxes | 12,571 |
| | 11,529 |
| | 15,270 |
| | 1,042 |
| | 9 | % | | (3,741 | ) | | (24 | )% | |
| Other income, net | | (5,018 | ) | | (1,317 | ) | | (807 | ) | | (3,701 | ) | | 281% | | (510 | ) | | 63 | % |
| Income (loss) before provision (benefit) for income taxes | | 1,185 |
| | (15,700 | ) | | 76,579 |
| | 16,885 |
| | | | (92,279 | ) | | |
| Provision (benefit) for income taxes | | (4,776 | ) | | (8,106 | ) | | 21,121 |
| | 3,330 |
| | (41)% | | (29,227 | ) | | N/A |
|
| Effective tax rate | 25.7 | % | | 171.3 | % | | 31.6 | % | | | | | | | | | (403.0 | )% | | 51.6 | % | | 27.6 | % | | | | | | | | |
| Net income (loss) | $ | 36,267 |
| | $ | (4,799 | ) | | $ | 33,122 |
| | $ | 41,066 |
| | NA |
| | $ | (37,921 | ) | | (114 | )% | $ | 5,961 |
| | $ | (7,594 | ) | | $ | 55,458 |
| | $ | 13,555 |
| | N/A |
| | $ | (63,052 | ) | | (114)% |
| Net margin | 5.5 | % | | (0.7 | )% | | 5.8 | % | | | | | | | | | 0.4 | % | | (0.9 | )% | | 8.1 | % | | | |
|
| | | | |
| Diluted earnings (loss) per share | $ | 1.43 |
| | $ | (0.20 | ) | | $ | 1.40 |
| | $ | 1.63 |
| | NA |
| | $ | (1.60 | ) | | (114 | )% | $ | 0.19 |
| | $ | (0.29 | ) | | $ | 2.14 |
| | $ | 0.48 |
| | N/A |
|
| $ | (2.43 | ) | | (114)% |
MANAGEMENT’S DISCUSSION AND ANALYSIS
Fiscal 20132016 Compared with Fiscal 20122015
Sales
Changes to sales by major product lines for fiscal years 2016 and 2015 were as follows (dollars in thousands):
|
| | | | | | | | | | | | | | |
| | Year Ended | | 2013 vs. 2012 |
| | January 3, 2014 | | December 28,
2012 | | $ Change | | % Change |
| Sales: | | | | | | | |
| Greatbatch Medical | | | | | | | |
| Cardiac/Neuromodulation | $ | 325,412 |
| | $ | 306,669 |
| | $ | 18,743 |
| | 6 | % |
| Orthopaedics | 130,247 |
| | 122,061 |
| | 8,186 |
| | 7 | % |
| Portable Medical | 78,743 |
| | 81,659 |
| | (2,916 | ) | | (4 | )% |
| Vascular | 48,357 |
| | 51,980 |
| | (3,623 | ) | | (7 | )% |
| Energy | 52,488 |
| | 54,066 |
| | (1,578 | ) | | (3 | )% |
| Other | 25,655 |
| | 27,287 |
| | (1,632 | ) | | (6 | )% |
| Total Greatbatch Medical | 660,902 |
| | 643,722 |
| | 17,180 |
| | 3 | % |
| QiG | 3,043 |
| | 2,455 |
| | 588 |
| | 24 | % |
| Total sales | $ | 663,945 |
|
| $ | 646,177 |
|
| $ | 17,768 |
|
| 3 | % |
Greatbatch Medical Sales Highlights |
| | | | | | | | | | | | | | |
| | | | 2016 vs. 2015 |
| | 2016 | | 2015 | | $ Change | | % Change |
| Sales: | | | | | | | |
| Cardio & Vascular | $ | 568,510 |
| | $ | 143,260 |
| | $ | 425,250 |
| | 297 | % |
| Cardiac & Neuromodulation | 389,403 |
| | 356,064 |
| | 33,339 |
| | 9 | % |
| Advanced Surgical, Orthopedics & Portable Medical | 392,778 |
| | 243,385 |
| | 149,393 |
| | 61 | % |
| Elimination of interproduct line sales | (5,592 | ) | | (1,744 | ) | | (3,848 | ) | | N/A |
|
| Total Medical Sales | 1,345,099 |
| | 740,965 |
| | 604,134 |
| | 82 | % |
| Non-Medical | 41,679 |
| | 59,449 |
| | (17,770 | ) | | (30 | )% |
| Total sales | $ | 1,386,778 |
|
| $ | 800,414 |
|
| $ | 586,364 |
|
| 73 | % |
Total 20132016 sales for Greatbatch Medical increased 3%73% to $660.9 million.$1.39 billion in comparison to 2015. The most significant drivers of this increase were as follows:
For 2013, our cardiac/neuromodulationMedical
Our 2016 Cardio & Vascular sales increased $425.3 million in comparison to 2015 and includes approximately $421 million of incremental sales from Lake Region Medical. On an organic constant currency basis, our Cardio & Vascular sales increased 3% in comparison to 2015 primarily due to normal market growth.
Our 2016 Cardiac & Neuromodulation sales increased $33.3 million in comparison to 2015. Current year sales includes approximately $57 million of incremental sales from Lake Region Medical and reflects approximately $3 million less in sales due to the Spin-off. On an organic constant currency basis, our Cardiac & Neuromodulation sales decreased 6% in comparison to $325.42015 primarily due to reduced shipments in a limited number of CRM customer programs and approximately $8 million which exceeded our expectations. During 2013, cardiacof contractual price reductions given in exchange for longer-term volume commitments. The reduced shipments were driven by both internal and neuromodulation sales benefited from strongerexternal delays in product launches, customer clinical market performanceshare changes, customers lowering inventory levels, and continued deepening relationships with our OEM partners. More specifically, we experienced strongorder disruption due to acquisition-related influences in the medical technology markets. These factors were partially offset by growth in batteries, capacitors, leads,sales to neuromodulation customers in 2016.
Our 2016 Advanced Surgical, Orthopedics & Portable Medical sales increased $149.4 million in comparison to 2015 and assembly revenue. We continue to see an increased paceincludes approximately $176 million of product development opportunitiesincremental sales from our cardiac customers. We believe that these opportunities, combined with our increased sales and marketing resources, will allow the Company to continue to growLake Region Medical. During 2016, foreign currency exchange rate fluctuations reduced this product line faster than the underlying market.
Orthopaedic product lineline’s sales for 2013 increased 7% compared to the same period of 2012. During the first quarter of 2013, the Company divested certain non-core orthopaedic product lines, which reduced 2013 orthopaedic revenue by approximately $15$1 million in comparison to the prior year. Additionally, foreignyear due to the strengthening dollar versus the Euro. Foreign currency exchange rate fluctuations benefited orthopaedic revenue by approximately $2 millionare expected to have a more material impact on our sales in comparison2017 due to the prior year.strengthening dollar in the fourth quarter of 2016. On an organic constant currency basis, orthopaedic product lineour Advanced Surgical, Orthopedics & Portable Medical sales increased 20%decreased 10% in comparison to 2012. This organic constant currency improvement was across all orthopaedic products and was above market growth rates2015 primarily due to our increased sales and marketing efforts, customer market share gains, customer product launches, as well as the release of backlog built up as a result of our Swiss orthopaedic facility consolidation near the end of 2012.
During 2013 portable medical sales decreased $2.9 million or 4% compared to 2012. During the second half of 2013, this product line was impacted by our increased pricing discipline, which resulted in the loss of two lower margin portable medical programs accounting for approximately $9 million of revenues in 2013. We expect these factors to continue to impact the year over year comparisons for this product line for the next three quarters. We believe that we can return this product line back to historical growth once we are past this period of difficult comparisons.
For 2013, our vascular product line sales decreased $3.6 million or 7% as a result of the previously communicated voluntary recall of two vascular medical devicescustomers building safety stock in the fourth quarter of 2012. We began reshipping2015 in anticipation of our product line transfers, thus lowering orders in 2016, a backlog in shipments to one of these products in the fourth quarter of 2013.
QiG-QiG revenue includes sales of neural interface technology, components and systemsspecific Portable Medical customer due to the neuroscienceproduct line transfer, and clinical markets. The 24% revenue growthapproximately $5 million of contractual price reductions given in exchange for 2013longer-term volume commitments. Additionally, 2016 was a slower customer product launch year when compared to 2015.
Non-Medical
Our 2016 Non-Medical sales declined 30% in comparison to 20122015. This decrease was primarily due to havingthe slowdown in the energy markets, which has caused customers to reduce drilling and exploration volumes. Our Non-Medical product line continues to trend with the oil and gas market. Although we have seen revenue declines throughout 2016, our customers are indicating they believe the market has bottomed out and there are signs of a full year of sales from NeuroNexus, which was acquiredslow recovery. Volumes with our military and environmental customers remain stable. As the market has contracted, we have been able to advance our competitive position with key strategic customers resulting in February 2012, as well asmulti-year supply agreements and the higher growth characteristics of the neuroscienceopportunity to quote on significant new business opportunities. Additionally, we are actively pursuing new customer and clinical markets.market opportunities, developing new product solutions and investing in research and development to advance our technology. As we manage our Non-Medical product line through this challenging revenue period, we are rationalizing our cost structure and maintaining inventory at appropriate levels to improve our return on invested capital.
MANAGEMENT’S DISCUSSION AND ANALYSIS
Gross Profit
Changes to gross profit as a percentage of salesour Gross Margin were primarily due to the following:
|
| | |
| | 2013-20122016-2015
% Point Change |
Impact of Swiss consolidationLake Region Medical acquisition(a) | (3.1 | )% |
Price(b) | (2.1 | )% |
Production efficiencies, volume and mix(c) | 0.1 | % |
Performance-based compensation(d) | 0.4 | % |
Performance-based compensationWarranty reserves and obsolescence write-offs(b)(e)
| (0.50.3 | )% |
Cost savings and production efficienciesInventory step-up amortization(c)(f)
| 2.02.9 | % |
Other | (0.1 | )% |
| Total percentage point change to gross profit as a percentage of sales | 1.8(2.1 | )% |
(a) OurAmount represents the impact to our Gross Margin benefited approximately $2.8 million from the consolidation of our Swiss orthopaedic facilities into other existing Greatbatch facilitiesrelated to Lake Region Medical, which was acquired in the first quarter of 2013. The 2012 gross profit percentage includes the negative impact of production inefficiencies at those facilities.October 2015 and historically had lower Gross Margins than Greatbatch.
| |
| (b) | Amount represents higher performance-based compensation versus the prior year of approximately $3.4 million and is recorded based upon actual results achieved. Performance-based compensation is accrued based upon the level of performance achieved relative to targets set at the beginning of the year.Our Gross Margin for 2016 was negatively impacted by contractual price reductions given in exchange for longer-term volume commitments. |
| |
| (c) | Our Gross Margin percentage benefited from production efficiencies gained at our manufacturing facilities as a result of our various lean, and supply chain, and integration initiatives, as well aswhich were offset by a higher production volumes due to increased sales mix of lower margin products and inventory levels. |
Over the long-term, we expect to see Gross Margin improvements as we leverage our organic growth across our manufacturing footprint and due to the various productivity improvement initiatives that are being implemented (See “Cost Savings and Consolidation Efforts” section of this Item). Additionally, we expect our Gross Margin to improve as more system and device level products are introduced, which typically earn a higher margin.
SG&A Expenses
Changes to SG&A expenses were primarily due to the following (in thousands):
|
| | | |
| | 2013-2012 $ Change |
Selling and marketing(a) | $ | 3,848 |
|
Performance-based compensation(b) | 2,680 |
|
Swiss consolidation(c) | (1,359 | ) |
Other(d) | 1,946 |
|
| Net increase in SG&A | $ | 7,115 |
|
| |
(a) | Amount represents the incremental SG&A expenses related to our decision near the end of 2012 to increase selling and marketing resources to drive core business growth and sustain a pipeline, in order to achieve our 5% or better organic revenue growth performance goal.lower sales volumes. |
| |
(b)(d) | Amount represents the impact to our Gross Margin from the change in performance-based compensation versus the prior year period and is recorded based upon the actual results achieved. Performance-based compensation is accrued based upon |
| |
| (e) | Current year cost of sales includes the levelimpact of performance achieved relativevarious warranty reserves and obsolescence write-offs, including reserves related to targets setvarious customer returns and field actions that were higher than normal in 2016. Warranty and obsolescence reserves are judgmental in nature and can fluctuate significantly from period to period. |
| |
| (f) | Amount represents the impact to our Gross Margin in comparison to 2015 related to the $23.0 million of inventory step-up amortization recorded in 2015 as a result of the Lake Region Medical acquisition, which was fully amortized at the beginningend of 2015. |
Since the acquisition of Lake Region Medical, we achieved approximately $11 million of cumulative annual run-rate synergies in gross profit. Over the long-term, we expect our Gross Margin to improve as we rationalize the manufacturing footprint across both the legacy Greatbatch and legacy Lake Region Medical facilities and continue to recognize supply chain synergies. However, we also expect our Gross Margin to continue to be impacted by pricing pressures from our customers. If the manufacturing efficiencies and synergies realized are not enough to offset these pricing pressures, we could see a further deterioration in our Gross Margin.
MANAGEMENT’S DISCUSSION AND ANALYSIS
SG&A Expenses
Changes to SG&A expenses were primarily due to the following (in thousands): |
| | | |
| | 2016-2015 $ Change |
Impact of Lake Region Medical acquisition(a) | $ | 56,885 |
|
Nuvectra SG&A(b) | (8,628 | ) |
Legal fees(c) | (1,553 | ) |
Other(d) | 4,057 |
|
| Net increase in SG&A | $ | 50,761 |
|
| |
| (a) | Amount represents the year.incremental SG&A expenses from Lake Region Medical, which was acquired in October 2015. Note that 2016 expense amount is approximately $20 million below the 2015 Lake Region Medical expense amount on a pro forma basis reflecting the synergies realized in connection with the acquisition. Since the acquisition, we achieved approximately $23 million of cumulative annual run-rate synergies in SG&A. |
| |
| (b) | Amount represents the net decrease in SG&A costs attributable to Nuvectra, which was spun-off in March 2016. |
| |
| (c) | Amount represents the estimated impactchange in legal costs in comparison to SG&A2015 and includes IP related defense costs, as well as other corporate initiatives. In 2013, we filed suit against one of our Cardiac & Neuromodulation competitors alleging they were infringing on our IP. In January 2016, a resultjury returned a verdict finding in favor of Integer and awarded us $37.5 million in damages. The finding is subject to post-trial proceedings, including a possible appeal by our competitor. We have not recorded any gains in connection with this litigation as no cash has been received. Costs associated with this litigation accounted for approximately $1.4 million of the consolidation of our Swiss orthopaedic facilities into other existing Greatbatch facilities, which was completeddecrease in SG&A expenses from 2015 to 2016 as the trial for this litigation concluded in the first quarter of 2013.2016. |
| |
| (d) | Amount represents the net impact of various costincreases and decreases to SG&A costs and include the impact of normal increases in SG&A expensesoperating costs, as well as increased costs associated with operating a Company that occurred during 2013 including an additional weekis nearly double the size of operations in comparison to 2012 as the Company utilizes a fifty-two, fifty-three week fiscal year which ends on the Friday nearest December 31st.ago. |
RD&E Expenses, Net
NetChanges to RD&E costsExpenses, Net were as followsprimarily due to the following (in thousands):
|
| | | | | | | | | | | |
| | Year Ended | | |
| | January 3,
2014 | | December 28,
2012 | | Change |
| Research and development costs | $ | 17,953 |
| | $ | 24,071 |
| | $ | (6,118 | ) |
| Engineering costs | 44,699 |
| | 38,777 |
| | 5,922 |
|
| Less cost reimbursements | (8,575 | ) | | (10,358 | ) | | 1,783 |
|
| Total RD&E, net | $ | 54,077 |
| | $ | 52,490 |
| | $ | 1,587 |
|
|
| | | |
| | 2016-2015 $ Change |
Impact of Lake Region Medical acquisition(a) | $ | 10,889 |
|
Nuvectra RD&E(b) | (12,600 | ) |
Customer cost reimbursements(c) | 598 |
|
Other(d) | 3,119 |
|
| Net increase in RD&E | $ | 2,006 |
|
| |
| (a) | Amount represents the incremental RD&E expenses from Lake Region Medical, which was acquired in October 2015. |
| |
| (b) | Amount represents the net decrease in RD&E costs attributable to Nuvectra, which was spun-off in March 2016. |
| |
| (c) | Amount represents the change in customer cost reimbursements from the prior year. Customer cost reimbursements vary from period to period depending on the timing of achievement of project milestones. |
| |
| (d) | Amount represents the net impact of various increases and decreases to RD&E costs and includes the impact of normal increases in operating costs, as well as our continued investment in developing our core and new technologies to drive future growth. |
Net RD&E for 2013 increased $1.6 million to $54.1 million. This increase was attributable to a decrease of $1.8 million in customer cost reimbursements compared to the prior year due to the timing of achievement of milestones on various projects. During the second half of 2012, we began to implement an initiative to optimize our RD&E investment. This included the reallocation of RD&E resources to higher priority projects, the postponement of some RD&E projects, as well as the decision to pursue various alternatives to monetize some of our existing intellectual property that are outside our core business. Additionally, our Swiss orthopaedic facility consolidation contributed to a reduction in RD&E expenses of $3.1 million. The benefit that was realized in 2013 from these initiatives was offset by an increase in performance-based compensation ($1.4 million), a higher level of DVT costs ($0.6 million), as well as the additional week of payroll expense incurred during 2013.MANAGEMENT’S DISCUSSION AND ANALYSIS
In total, net costs incurred by our QiG segment (including gross profit and SG&A), which is responsible for the development of our medical device systems, were $30.5 million for 2013 compared to $32.6 million for 2012. 2013 QiG results include $5.8 million of DVT costs incurred in connection with our development of a neuromodulation platform compared to $5.2 million for 2012. QiG’s medical device technology investment is primarily focused on successfully commercializing Algostim, which was submitted for PMA approval in December 2013.
Other Operating Expenses, Net
Other operating expenses, net wereOOE was comprised of the following for fiscal years 2016 and 2015 (in thousands): |
| | | | | | | | | | | |
| | 2016 | | 2015 | | Change |
2014 investments in capacity and capabilities(a) | $ | 17,159 |
| | $ | 23,037 |
| | $ | (5,878 | ) |
Orthopedic facility optimization(a) | 747 |
| | 1,395 |
| | (648 | ) |
Lake Region Medical consolidations(a) | 8,584 |
| | 1,961 |
| | 6,623 |
|
Acquisition and integration costs(b) | 28,316 |
| | 33,449 |
| | (5,133 | ) |
Asset dispositions, severance and other(c) | 6,931 |
| | 6,622 |
| | 309 |
|
| Total other operating expenses, net | $ | 61,737 |
| | $ | 66,464 |
| | $ | (4,727 | ) |
|
| | | | | | | | | | | |
| | Year Ended | | |
| | January 3,
2014 | | December 28,
2012 | | Change |
2013 operating unit realignment(a) | $ | 5,625 |
| | $ | — |
| | $ | 5,625 |
|
Orthopaedic facility optimization(a) | 8,038 |
| | 32,482 |
| | (24,444 | ) |
Medical device facility optimization(a) | 312 |
| | 1,525 |
| | (1,213 | ) |
ERP system upgrade(a) | 783 |
| | 5,041 |
| | (4,258 | ) |
Acquisition and integration (income) costs(b) | (502 | ) | | 1,460 |
| | (1,962 | ) |
Asset dispositions, severance and other(c) | 1,534 |
| | 1,838 |
| | (304 | ) |
| Total other operating expenses, net | $ | 15,790 |
| | $ | 42,346 |
| | $ | (26,556 | ) |
| |
| (a) | Refer to the “Cost Savings and Consolidation Efforts” section of this Item and Note 13 “Other Operating Expenses, Net” of the Notes to Consolidated Financial Statements contained in Item 8 of this report for disclosures related to the timing and level of remaining expenditures for these initiatives. |
| |
| (b) | During 20132016 and 2012,2015, we incurred $28.3 million and $33.1 million, respectively, in acquisition and integration costs (income) related to the acquisition of Lake Region Medical, consisting primarily of transaction costs and integration of Micro Powercosts. Transaction costs primarily relate to change-in-control payments to former Lake Region Medical executives, as well as professional and NeuroNexus. These expenses wereconsulting fees. Integration costs primarily forinclude professional, consulting, severance, retention, bonuses,relocation, and travel costs in connection with integration efforts, training, severance and the change in fair value of the contingent consideration recorded in connection with these acquisitions.costs. |
| |
| (c) | During 20132016 and 2012,2015, we recorded losses in connection with various asset disposals and/or write-downs. Additionally, during 2013, we recorded a $0.9 million write-off related to our wireless sensing product line2016 and a $0.5 million write-off of NeuroNexus IPR&D. During 2012,2015, we incurred $1.2legal and professional costs in connection with the Spin-off of $4.4 million of costs related to the relocation of our global headquarters to Frisco, Texas.and $6.0 million, respectively. |
We continually evaluate our operating structure in order to maximize efficiencies and drive margin expansion. FutureFor 2017, other operating expenses, net are expected to be lower thanapproximately $18 million to $22 million, as we continue to invest in our consolidation initiatives and the 2013 levels, but could be impacted if new consolidationintegration of Lake Region Medical. Refer to “Cost Savings and optimization initiatives are undertaken.Consolidation Efforts” contained in this Item for further details on these initiatives.
Interest Expense and Interest Income
Interest expense for 2013 decreased $6.82016 increased $77.8 million over 2012in comparison to 2015. This increase was primarily due to lower discountthe $1.8 billion of debt issued in connection with the Lake Region Medical acquisition in October 2015, which caused our average debt balance to increase from $446 million in 2015 to $1.786 billion in 2016, and our average rate paid on our debt to increase from 4.95% in 2015 to 5.79%. Additionally, our reported interest expense for 2016 and 2015 included $7.3 million and $1.8 million, respectively, of non-cash amortization as a result of debt issuance costs. In connection with the repaymentissuance of our convertible subordinated notes duringdebt in 2015 for the first quarterpurchase of 2013. Additionally,Lake Region Medical, we incurred $9.5 million in transaction costs (i.e. debt commitment fees, interest expense decreased duerate swap termination costs, debt extinguishment charges), which was recorded in interest expense. Refer to lower outstanding debt balances, and lower interest rates paid on outstanding debt. During 2013, we made net repayments of $33.3 million on long-term debt. See Note 9 “Debt” of the Notes to Consolidated Financial Statements contained in Item 8 of this report. Interest incomereport for 2013 was relatively consistent with 2012.further details regarding these transactions.
(Gain) Loss on Cost and Equity Method Investments, Net
During 20132016, we recognized an impairment charge related to one of our cost method investments of $1.6 million and 2012,received a cash distribution and recorded a gain of $0.7 million from another cost method investment. During 2015, we incurred losses onrecognized a $4.7 million gain and received a $3.6 million cash distribution from our equity method investment. During 2015, we recognized an impairment charge related to one of our cost method investments of $1.4 million. As of December 30, 2016 and January 1, 2016, we held $22.8 million and $20.6 million, respectively, of cost and equity method investments. The total carrying value of these investments is reviewed quarterly for changes in circumstance or the occurrence of events that suggest our investment may not be recoverable. These investments are in start-up research and development companies whose fair value is highly subjective in nature and subject to significant fluctuations in the future fluctuations, whichthat could be significant. Our recorded investmentresult in cost and equity method investments was $12.3 million at January 3, 2014.material gains or losses. Refer to Note 18 “Fair Value Measurements” of the Notes to Consolidated Financial Statements contained in Item 8 of this report for further details regarding these investments.
MANAGEMENT’S DISCUSSION AND ANALYSIS
Other Expense,Income, Net
Other expense,income, net primarily includes the impact of foreign currency exchange rate fluctuations on transactions denominated in foreign currencies. We generally do not expectrecognized foreign currency transaction gains of $4.9 million in 2016 and $1.3 million in 2015, primarily related to the remeasurement of intercompany loans and the strengthening of the U.S. dollar relative to the Euro. We continually reevaluate our foreign currency exposures and take steps to mitigate these risks. However, fluctuations in foreign currency exchange rate fluctuations torates could have a materialsignificant impact, positive or negative, on our financial results of operations.in the future.
ProvisionBenefit for Income Taxes
The effective tax rateDuring 2016 and 2015, our benefit for the year ended January 3, 2014income taxes was 25.7%, versus 171.3% for 2012.$4.8 million and $8.1 million, respectively. The stand-alone U.S. component of the effective tax rate for the year ended January 3, 2014 was 30.0% versus 33.1% for 2012. This decrease was primarily attributable to $6.22016 reflected a $13.8 million benefit on $52.4 million of tax charges recorded in 2012 relating to our Swiss Orthopaedic consolidation. These charges related to the losspre-tax book losses (26.3%) versus a $13.1 million benefit on $42.1 million of our Swiss tax holiday, due to our decision in 2012 to discontinue manufacturing in Switzerland and the valuation allowance established on our Swiss deferred tax assets, as it was more likely than not that they will not be fully realized.pre-tax book losses (31.2%) for 2015. The reinstatementstand-alone International component of the R&D tax credit in 2013, as well as higher income in lowereffective tax rate jurisdictions also contributed to the more favorablefor 2016 reflected tax rate in 2013.expense of $9.0 million on $53.6 million of pre-tax book income (16.8%) versus a tax expense of $5.0 million on $26.5 million of pre-tax book income (19.0%) for 2015. The (benefit) provision for income taxes for 20132016 differs from the U.S. statutory rate due to the following (dollars in thousands):
| | | | U.S. | | International | | Combined | U.S. | | International | | Combined |
| | $ | | % | | $ | | % | | $ | | % | $ | | % | | $ | | % | | $ | | % |
| Income before provision for income taxes | $ | 42,392 |
| | | | $ | 6,446 |
| | | | $ | 48,838 |
| | | |
| Income (loss) before provision for income taxes | | $ | (52,446 | ) | | | | $ | 53,631 |
| | | | $ | 1,185 |
| | |
| | | | | | | | | | | | | | | | | | | | | | | |
| Provision at statutory rate | $ | 14,837 |
| | 35.0 | % | | $ | 2,256 |
| | 35.0 | % | | $ | 17,093 |
| | 35.0 | % | |
| Provision (benefit) at statutory rate | | $ | (18,356 | ) | | 35.0 | % | | $ | 18,771 |
| | 35.0 | % | | $ | 415 |
| | 35.0 | % |
Federal tax credits(a) | (3,651 | ) | | (8.6 | ) | | — |
| | — |
| | (3,651 | ) | | (7.5 | ) | (1,750 | ) | | 3.3 |
| | (42 | ) | | (0.1 | ) | | (1,792 | ) | | (151.2 | ) |
| Foreign rate differential | — |
| | — |
| | (348 | ) | | (5.4 | ) | | (348 | ) | | (0.7 | ) | 3,192 |
| | (6.1 | ) | | (10,278 | ) | | (19.2 | ) | | (7,086 | ) | | (598.0 | ) |
| Uncertain tax positions | 831 |
| | 2.0 |
| | — |
| | — |
| | 831 |
| | 1.7 |
| 1,464 |
| | (2.8 | ) | | 260 |
| | 0.5 |
| | 1,724 |
| | 145.5 |
|
| State taxes, net of federal benefit | 1,147 |
| | 2.7 |
| | — |
| | — |
| | 1,147 |
| | 2.3 |
| (1,068 | ) | | 2.0 |
| | — |
| | — |
| | (1,068 | ) | | (90.1 | ) |
Change in foreign tax rates(b) | — |
| | — |
| | (1,807 | ) | | (28.0 | ) | | (1,807 | ) | | (3.7 | ) | — |
| | — |
| | (270 | ) | | (0.5 | ) | | (270 | ) | | (22.8 | ) |
| Non-deductible transaction costs | | 1,012 |
| | (1.9 | ) | | — |
| | — |
| | 1,012 |
| | 85.4 |
|
| Valuation allowance | 176 |
| | 0.4 |
| | 10 |
| | 0.2 |
| | 186 |
| | 0.4 |
| 811 |
| | (1.5 | ) | | 529 |
| | 1.0 |
| | 1,340 |
| | 113.1 |
|
| Change in Tax law | | 2,630 |
| | (5.0 | ) | | — |
| | — |
| | 2,630 |
| | 221.9 |
|
| Other | (634 | ) | | (1.5 | ) | | (246 | ) | | (3.8 | ) | | (880 | ) | | (1.8 | ) | (1,703 | ) | | 3.2 |
| | 22 |
| | — |
| | (1,681 | ) | | (141.8 | ) |
| Provision for income taxes/effective tax rate | $ | 12,706 |
| | 30.0 | % | | $ | (135 | ) | | (2.0 | )% | | $ | 12,571 |
| | 25.7 | % | |
| Provision (benefit) for income taxes | | $ | (13,768 | ) | | 26.3 | % | | $ | 8,992 |
| | 16.8 | % | | $ | (4,776 | ) | | (403.0 | )% |
| |
(a) | Amounts relate to the retroactive reinstatement of the U.S. R&D tax credit. On January 2, 2013, the President signed into law the American Taxpayer Relief Act of 2012 (the “Act”), which included a retroactive extension of the section 41 R&D tax credit that had expired on December 31, 2011. Under the Act, the R&D credit is extended for two years retroactively from January 1, 2012 through December 31, 2013. As the Act was signed into law on January 2, 2013, the effects of the change in the tax law were recognized as a financial statement event in the financial statement period that includes the date of enactment. As such, we recorded a benefit for the R&D credits earned in 2012 and 2013 through the fiscal 2013 effective tax rate. |
(b) Amounts relateRefer to the taxProvision (Benefit) for Income Taxes section of the “Fiscal 2015 Compared with Fiscal 2014” discussion of this Item for the reconciliation of the U.S. and International components of the 2015 benefit recorded in 2013 relating to Mexican Tax Reform Packagefor income taxes.
The 2015 and a favorable Swiss tax ruling. On December 12, 2013,2016 U.S. component of the 2014 Mexican Tax Reform Package took effect. This tax reform repealed the previous Mexican income tax law, including the flat tax regime and tax consolidation. The Mexican corporate incomeeffective tax rate reflects the impact of 30% will be maintained. As such, for U.S. GAAP purposes,non-deductible transaction costs related to the deferred tax items, historically carried atacquisition of Lake Region Medical and the 17% flat tax rate, were adjusted to reflect a carrying value of 30%. Since our Mexican subsidiary was in an overall deferred tax asset position
as of the enactment date the adjustment to 30% resulted in an overall deferred tax benefitSpin-off, which was recorded in 2013. In addition, during 2013, our Swiss subsidiary filed for a tax ruling requesting a reduced income tax rate in Switzerland. We received an approved ruling in December 2013 effectively reducing the Swiss tax rate from 22.6% to approximately 9.3% depending on jurisdictional mix of revenues and expenditures. As such, the carrying value of the deferred taxes, which reflected a net deferred tax liability position as of the date of enactment, have been adjusted to reflect the rate reduction. The adjusted carrying value resulted in a reduction in the overall U.S. benefit of 1.9% in 2016 and 11.5% in 2015. Additionally, during 2016 we recorded a $2.6 million tax charge in connection with the enactment of regulations under §987 of the Internal Revenue Code, which resulted in an adjustment to theour deferred tax liability and a corresponding deferredassets. The International component of the rate, which decreased from 2015 to 2016, reflects an increase in the foreign rate differential due to an increase of taxable profits in lower tax benefit.jurisdictions. Refer to Note 14 “Income Taxes” of the Notes to Consolidated Financial Statements contained in Item 8 of this report for additional information regarding our income tax accounts.
There is a prospective potential for volatility of the effective tax rate due to several factors, including changes in the mix of pre-tax income and the jurisdictions to which it relates, business acquisitions, settlements with taxing authorities, changes in tax rates, and foreign currency exchange rate fluctuations. In addition, we continue to explore tax planning opportunities that may have a material impact on our effective tax rate.
We believe it is reasonably possible that a reduction of up to $0.1approximately $0.6 million of the balance of our unrecognized tax benefits may occur within the next twelve months as a result of the expirationlapse of applicable statutesthe statute of limitation and potentiallimitations and/or audit settlements, which would positively impact the effective tax rate in the period of reduction. As of January 1, 2016, approximately $9.8 million of unrecognized tax benefits would favorably impact the effect tax rate (net of federal impact on state issues), if recognized.
MANAGEMENT’S DISCUSSION AND ANALYSIS
Fiscal 20122015 Compared with Fiscal 20112014
Sales
Changes to sales by major product lines for fiscal years 2015 and 2014 were as follows (dollars in thousands):
|
| | | | | | | | | | | | | | |
| | Year Ended | | 2012 vs. 2011 |
| | December 28,
2012 | | December 30,
2011 | | $ Change | | % Change |
| Sales: | | | | | | | |
| Greatbatch Medical | | | | | | | |
| Cardiac/Neuromodulation | $ | 306,669 |
| | $ | 303,690 |
| | $ | 2,979 |
| | 1 | % |
| Orthopaedics | 122,061 |
| | 140,277 |
| | (18,216 | ) | | (13 | )% |
| Portable Medical | 81,659 |
| | 9,609 |
| | 72,050 |
| | N/A |
|
| Vascular | 51,980 |
| | 45,098 |
| | 6,882 |
| | 15 | % |
| Energy | 54,066 |
| | 48,100 |
| | 5,966 |
| | 12 | % |
| Other | 27,287 |
| | 22,048 |
| | 5,239 |
| | 24 | % |
| Total Greatbatch Medical | 643,722 |
| | 568,822 |
| | 74,900 |
| | 13 | % |
| QiG | 2,455 |
| | — |
| | 2,455 |
| | N/A |
|
| Total sales | $ | 646,177 |
|
| $ | 568,822 |
|
| $ | 77,355 |
| | 14 | % |
Greatbatch Medical Sales Highlights |
| | | | | | | | | | | | | | |
| | | | 2015 vs. 2014 |
| | 2015 | | 2014 | | $ Change | | % Change |
| Sales: | | | | | | | |
| Cardio & Vascular | $ | 143,260 |
| | $ | 58,770 |
| | $ | 84,490 |
| | 144 | % |
| Cardiac & Neuromodulation | 356,064 |
| | 330,921 |
| | 25,143 |
| | 8 | % |
| Advanced Surgical, Orthopedics & Portable Medical | 243,385 |
| | 216,339 |
| | 27,046 |
| | 13 | % |
| Elimination of interproduct line sales | (1,744 | ) | | — |
| | (1,744 | ) | | N/A |
|
| Total Medical Sales | 740,965 |
| | 606,030 |
| | 134,935 |
| | 22 | % |
| Non - Medical | 59,449 |
| | 81,757 |
| | (22,308 | ) | | (27 | )% |
| Total sales | $ | 800,414 |
|
| $ | 687,787 |
|
| $ | 112,627 |
| | 16 | % |
Total 20122015 sales for Greatbatch Medical increased 13%16% to $643.7$800.4 million. The most significant drivers of this increase were as follows:
For 2012,Medical
During 2015, our cardiac/neuromodulationCardio & Vascular sales increased 1%$84.5 million in comparison to $306.7 million. During 2012, cardiacthe prior year and neuromodulationincludes $88.8 million of sales benefited from further adoptionLake Region Medical since the date of acquisition. On an organic constant currency basis, our Cardio & Vascular sales decreased 7% in comparison to 2014 due to the end of life on some legacy products. This decrease was partially offset during the fourth quarter of 2015, as our customers built safety stock in anticipation of our Q series batteriesproduct line transfers to our Tijuana, Mexico facility in the first quarter of 2016.
For 2015, our Cardiac & Neuromodulation sales increased $25.1 million, or 8%, in comparison to 2014 and includes $13.7 million of sales from Lake Region Medical since the date of acquisition. On an organic constant currency basis, our Cardiac & Neuromodulation sales increased 2% in comparison to the prior year primarily due to a neuromodulation customer product launch, which was partially offset by the timingrunoff of customer inventory builds and product launches between 2011 and 2012.end of life products from our legacy cardiac customers.
Orthopaedic product lineFiscal year 2015 Advanced Surgical, Orthopedics & Portable Medical sales for 2012 declinedincreased 13% compared to the same period of 2011.2014 and includes $37.9 million of sales from Lake Region Medical since the date of acquisition. During 2015, this product line continued to be negatively impacted by the weakening Euro, which reduced sales by approximately $14 million in comparison to the prior year. On an organic constant currency basis, orthopaedicour Advanced Surgical, Orthopedics & Portable Medical sales increased 2% in comparison to 2014 primarily due to orthopedics market growth and new customer wins partially offset by lower portable medical sales due to our refocusing this product line’s product offerings to products that have higher profitability.
Non-Medical
Full year 2015 Non-Medical sales declined 8% for 2012 as foreign currency exchange rate fluctuations decreased orthopaedic revenue by approximately $6 million. The remaining decline27% in 2012 orthopaedic salescomparison to 2014. This decrease was a result of price concessions provided to customers, as well as fewer customer product launches and development opportunitiesprimarily due to operational issues at our Swiss orthopaedic facilities,the slowdown in the energy markets, which were aggressively addressed in 2012. In additionhas caused customers to the consolidation of manufacturing, during 2012, we also streamlined our Swiss orthopaedic product line offerings. This included the sale of several non-core product lines to an independent third party near the end of the year, which closed in early 2013.
The portable medical, energyreduce drilling and other 2012 sales increased $83.3 million to $163.0 million. These sales included $82.4 million of incremental revenue related to the acquisition of Micro Power in December 2011. On an organic basis, revenue from these product lines were consistent with the prior year. During 2012, the Micro Power acquisition benefited from successful product launches into the portable medical market.exploration volumes.
MANAGEMENT’S DISCUSSION AND ANALYSIS
For 2012, our vascular product line sales increased 15% to $52.0 million. This increase was primarily attributable to growth in the underlying market and market share gains. Additionally, vascular revenue for the year included $6.6 million from sales of medical devices that were developed under the Greatbatch name compared to $4.5 million for 2011, an increase of 47%.
QiG -2012 revenue includes sales from NeuroNexus Technologies, Inc., which was acquired in February 2012.
Gross Profit
Changes to gross profit as a percentage of salesGross Margin were primarily due to the following:
|
| | |
| | 2012-20112015-2014
% Point Change |
Impact of acquisitionsPerformance-based compensation(a)
| (1.2 | )% |
Excess capacity & Swiss production inefficiencies(b)
| (1.6 | )% |
Volume and productivity(c)
| 2.20.9 | % |
Performance-based compensationProduction efficiencies, volume and mix(d)(b)
| 0.40.1 | % |
Selling priceImpact of Lake Region acquisition(e)(c)
| (0.55.1 | )% |
| Other | 0.2(0.1 | )% |
| Total percentage point change to gross profit as a percentage of sales | (0.54.2 | )% |
(a) Amount represents the change in performance-based compensation versus the prior year period and is recorded based upon the actual results achieved.
| |
(a) | Our gross profit percentage was impacted by the acquisition of Micro Power in December 2011, which had a lower gross margin percentage due to its higher percentage of material costs in comparison to our legacy businesses. Additionally, during 2012 we recognized $0.5 million of inventory step-up amortization in connection with this acquisition. |
| |
| (b) | Our gross profit percentage was negatively impacted during 2012 due to production inefficiencies at our Swiss orthopaedic facilities. Additionally, as a result of the addition of our Fort Wayne facility in the second quarter of 2012, we experienced excess capacity costs in comparison to 2011. In accordance with our inventory accounting policy, excess capacity costs are expensed in the period they occur. |
| |
(c) | Our gross profitGross Margin percentage benefited from higher sales volumes, primarily cardiac and vascular, as well as production efficiencies gained at our manufacturing facilities as a result of our various lean and supply chain initiatives.initiatives, which was partially offset by a higher sales mix of lower margin products. |
| |
(d)(c) | Amount represents the impact to our gross profit percentage related to the acquisition of Lake Region Medical in October 2015 and includes $23.0 million of inventory step-up amortization. |
SG&A Expenses
Changes to SG&A expenses were primarily due to the following (in thousands):
|
| | | |
| | 2015-2014 $ Change |
Performance-based compensation(a) | (4,051 | ) |
Legal fees(b) | 1,569 |
|
Impact of Lake Region Medical and CCC acquisitions(c) | 14,823 |
|
| Other | (413 | ) |
| Net increase in SG&A | $ | 11,928 |
|
| |
| (a) | Amount represents the change in performance-based compensation versus the prior year and is recorded based upon the actual results achieved. Performance-based compensation is accrued based upon the level of performance achieved relative to targets set at the beginning of the year. |
| |
(e)(b) | Our gross profit percentage has been negatively impactedAmount represents an increase in legal costs in comparison to 2014 and includes higher IP related defense costs. In 2013, we filed suit against one of our Cardiac & Neuromodulation competitors alleging they were infringing on our IP. Costs associated with this litigation accounted for $1.9 million of the prior year by price concessions givenincrease in SG&A expenses from 2014 to our larger OEM customers2015. |
| |
| (c) | Amount represents the incremental SG&A expenses related to the acquisition of Lake Region Medical in exchange for long-term contracts.October 2015 and CCC acquired in August 2014. |
SG&A
MANAGEMENT’S DISCUSSION AND ANALYSIS
RD&E Expenses, Net
Changes to SG&Anet RD&E expenses for fiscal years 2015 and 2014 were primarily dueas follows (in thousands):
|
| | | |
| | 2015-2014 $ Change |
Impact of Lake Region Medical acquisition(a) | $ | 1,838 |
|
Performance-based compensation(b) | (2,501 | ) |
Customer cost reimbursements(c) | 2,357 |
|
| Other | 1,456 |
|
| Net increase in RD&E | $ | 3,150 |
|
| |
| (a) | Amount represents the incremental RD&E expenses from Lake Region Medical, which was acquired in October 2015. |
| |
| (b) | Amount represents the change in performance-based compensation versus in comparison to 2014 and is recorded based upon the actual results achieved. |
| |
| (c) | The decrease in customer cost reimbursements relates to the expiration of certain government grants, which we were not eligible to renew, as well as the timing of achievement of customer milestones. |
Other Operating Expenses, Net
OOE was comprised of the following for fiscal years 2015 and 2014 (in thousands):
|
| | | |
| | 2012-2011 $ Change |
Impact of acquisitions(a) | $ | 9,552 |
|
Professional and consulting expense(b) | 743 |
|
Medical device strategy communication(c) | (501 | ) |
Other(d) | (1,350 | ) |
| Net increase in SG&A | $ | 8,444 |
|
(a) Amount represents the incremental SG&A expenses in 2012 related to the acquisition of Micro Power and NeuroNexus.
(b) Amount represents the change in professional and consulting expense from 2011 and reflects a higher level of costs incurred in connection with our medical device strategy and our increased investment in sales and marketing to drive core business growth.
(c) Amount represents the costs incurred during 2011 in connection with the communication of our medical device strategy to shareholders, customers and associates including costs incurred for our Investor Day held in the first quarter of 2011, which did not recur in 2012.
(d) Amount represents various decreases in SG&A expenses during 2012 and reflects the cost control initiatives being implemented by the Company including cost reductions in connection with our Swiss orthopaedic consolidations.
RD&E Expenses, Net
Net RD&E costs were as follows (in thousands):
|
| | | | | | | | | | | |
| | Year Ended | | |
| | December 28,
2012 | | December 30,
2011 | | Change |
| Research and development costs | $ | 24,071 |
| | $ | 19,014 |
| | $ | 5,057 |
|
| Engineering costs | 38,777 |
| | 35,472 |
| | 3,305 |
|
| Less cost reimbursements | (10,358 | ) | | (8,973 | ) | | (1,385 | ) |
| Total RD&E, net | $ | 52,490 |
| | $ | 45,513 |
| | $ | 6,977 |
|
Net RD&E for 2012 increased $7.0 million to $52.5 million. Approximately $2.6 million of this increase was a result of the operations from our recent acquisitions. Additionally, $3.2 million of this increase can be attributed to the RD&E investment in the development of complete medical devices, which totaled $24.8 million for 2012 compared to $21.6 million for 2011. In total, net medical device costs incurred by our QiG segment (including gross profit and SG&A) were $32.6 million for 2012 compared to $27.3 million for 2011. 2012 QiG results include $5.2 million of DVT costs incurred in connection with our development of a neuromodulation platform compared to $5.1 million for 2011.
During the second half of 2012, we began to implement an initiative to optimize our RD&E investment. This included the reallocation of RD&E resources to higher priority projects, the postponement of some RD&E projects, as well as the decision to pursue various alternatives to monetize some of our existing intellectual property that are outside our core business. As a result of this initiative, RD&E for the second half of 2012 was $3.7 million lower than the first half of 2012.
The increase in cost reimbursements in 2012 was a result of our NeuroNexus acquisition. These cost reimbursements can vary significantly from year to year due to the timing of the achievement of milestones on development projects.
Other Operating Expenses, Net
Other operating expenses, net were comprised of the following (in thousands):
| | | | Year Ended | | | 2015 | | 2014 | | Change |
| | December 28,
2012 | | December 30,
2011 | | Change | |
Orthopaedic facility optimization(a) | $ | 32,482 |
| | $ | 425 |
| | $ | 32,057 |
| |
Medical device facility optimization(a) | 1,525 |
| | — |
| | 1,525 |
| |
ERP system upgrade(a) | 5,041 |
| | — |
| | 5,041 |
| |
2014 investments in capacity and capabilities(a) | | $ | 23,037 |
| | $ | 8,925 |
| | $ | 14,112 |
|
Orthopedic facilities optimization(a) | | 1,395 |
| | 1,317 |
| | 78 |
|
2013 operating unit realignment(a) | | — |
| | 1,017 |
| | (1,017 | ) |
Lake Region Medical consolidations(a) | | 1,961 |
| | — |
| | 1,961 |
|
Other consolidation and optimization income(a) | | — |
| | (71 | ) | | 71 |
|
Acquisition and integration costs(b) | 1,460 |
| | — |
| | 1,460 |
| 33,449 |
| | 3 |
| | 33,446 |
|
Asset dispositions, severance and other(c) | 1,838 |
| | 168 |
| | 1,670 |
| 6,622 |
| | 4,106 |
| | 2,516 |
|
| Total other operating expenses, net | $ | 42,346 |
| | $ | 593 |
| | $ | 41,753 |
| $ | 66,464 |
| | $ | 15,297 |
| | $ | 51,167 |
|
| |
| (a) | Refer to the “Cost Savings and Consolidation Efforts” section of this Item and Note 13 “Other Operating Expenses, Net” of the Notes to Consolidated Financial Statements contained in Item 8 of this report for disclosures related to the timing and level of remaining expenditures for these initiatives. |
| |
| (b) | During 2012,2015, we incurred $33.1 million in acquisition and integration costs related to the acquisition of Lake Region Medical, consisting primarily of transaction costs and integration of Micro Powercosts. Transaction costs primarily relate to change-in-control payments to former Lake Region Medical executives, as well as professional and NeuroNexus. These expenses wereconsulting fees. Integration costs primarily forinclude professional, consulting, severance, retention, bonuses,relocation, and travel costs in connection with integration efforts, and severance.costs. |
| |
(c)(b) | During 20122015 and 2011,2014, we recorded write-downslosses in connection with various asset disposals net of insurance proceeds received, if any. Additionally, during 2012,and write-downs. During 2015, we incurred $1.2$6.0 million of costs related to the relocation of our global headquarters to Frisco, Texas. During 2011, we incurred $0.6 million of acquisition relatedin legal and professional costs in connection with the Spin-off of Nuvectra. During 2014, we incurred $0.9 million of expense related to the separation of our purchase of Micro Power.Senior Vice President, Human Resources. Additionally, during 2014, we recorded charges in connection with our business reorganization to align our contract manufacturing operations. Costs incurred primarily related to consulting and IT development. |
Interest Expense and Interest Income
Interest expense for 20122015 increased $1.1$29.3 million over 2011in comparison to 2014. This increase was primarily due to the increased discount amortization$1.8 billion of debt incurred in connection with the Lake Region Medical acquisition, as well as $9.5 million in transaction costs (i.e. debt commitment fees, interest rate swap termination costs, debt extinguishment charges) incurred in connection with our acquisition of Lake Region Medical. Additionally, the weighted average interest rate on our Senior Secured Credit Facility at the end of 2015 was 5.69% compared to 1.79% for 2014.
MANAGEMENT’S DISCUSSION AND ANALYSIS
Gain on Cost and Equity Method Investments
During 2015, we recognized a $4.7 million gain and received a $3.6 million cash distribution from our equity method investment. During 2014, we sold one of our cost method investments, which resulted in a pre-tax gain of $3.2 million. Our cost and equity method investments are in start-up research and development companies whose fair value is highly subjective in nature and are subject to significant fluctuations.
Other Income, Net
Other income, net primarily includes the impact of foreign currency exchange rate fluctuations on transactions denominated in foreign currencies. We recognized a gain of $1.3 million in 2015 and a gain of $1.3 million in 2014, primarily due to the strengthening of the U.S. dollar relative to the Euro.
Provision (Benefit) for Income Taxes
The effective tax rate for fiscal year 2015 was 51.6% compared to 27.6% for fiscal year 2014. The stand-alone U.S. component of the effective tax rate for 2015 reflected a $13.1 million benefit on $42.1 million of pre-tax book loss (31.2%) versus $18.5 million tax expense on $56.8 million of pre-tax book income (32.6%) for 2014. The foreign source income carries a lower overall effective tax rate than U.S. income. The stand-alone International component of the effective tax rate for 2015 reflected a tax expense of $5.0 million on $26.5 million of pre-tax book income (19.0%) versus a tax expense of $2.6 million on $19.8 million of pre-tax book income (13.3%) for 2014.
The (benefit) provision for income taxes for 2015 differs from the U.S. statutory rate due to the following (dollars in thousands):
|
| | | | | | | | | | | | | | | | | | | | |
| | U.S. | | International | | Combined |
| | $ | | % | | $ | | % | | $ | | % |
| Income (loss) before provision for income taxes | $ | (42,166 | ) | | | | $ | 26,466 |
| | | | $ | (15,700 | ) | | |
| | | | | | | | | | | | |
| Provision (benefit) at statutory rate | $ | (14,758 | ) | | 35.0 | % | | $ | 9,263 |
| | 35.0 | % | | $ | (5,495 | ) | | 35.0 | % |
| Federal tax credits | (1,850 | ) | | 4.4 |
| | — |
| | — |
| | (1,850 | ) | | 11.8 |
|
| Foreign rate differential | (331 | ) | | 0.8 |
| | (2,849 | ) | | (10.8 | ) | | (3,180 | ) | | 20.2 |
|
| Uncertain tax positions | (531 | ) | | 1.3 |
| | — |
| | — |
| | (531 | ) | | 3.4 |
|
| State taxes, net of federal benefit | (1,490 | ) | | 3.5 |
| | — |
| | — |
| | (1,490 | ) | | 9.5 |
|
| Change in foreign tax rates | — |
| | — |
| | (91 | ) | | (0.3 | ) | | (91 | ) | | 0.6 |
|
| Non-deductible transaction costs | 4,867 |
| | (11.5 | ) | | | | | | 4,867 |
| | (31.0 | ) |
| Valuation allowance | 943 |
| | (2.2 | ) | | (317 | ) | | (1.2 | ) | | 626 |
| | (4.0 | ) |
| Other | 6 |
| | — |
| | (968 | ) | | (3.7 | ) | | (962 | ) | | 6.1 |
|
| Provision (benefit) for income taxes | $ | (13,144 | ) | | 31.2 | % | | $ | 5,038 |
| | 19.0 | % | | $ | (8,106 | ) | | 51.6 | % |
The U.S. component of the rate reflects the impact of non-deductible transaction costs related to our convertible notes,the acquisition of Lake Region Medical and the Spin-off, which resulted in a reduction in the overall U.S. benefit of 11.5%. The International component of the rate, which increased from 2014 to 2015, reflects a reduction in the foreign rate differential due to a decrease of taxable profits in lower tax jurisdictions as a result of additional costs incurred for ongoing expansion efforts.
MANAGEMENT’S DISCUSSION AND ANALYSIS
Liquidity and Capital Resources
|
| | | | | | | |
| (dollars in thousands) | December 30, 2016 | | January 1, 2016 |
| Cash and cash equivalents | $ | 52,116 |
| | $ | 82,478 |
|
| Working capital | $ | 332,087 |
| | $ | 360,764 |
|
| Current ratio | 2.79 |
| | 2.69 |
|
The decrease in cash and cash equivalents from the end of fiscal year 2015 was primarily due to the $76.3 million of cash divested with the Spin-off, which was funded with cash on hand, as well as $55.0 million of borrowings on our revolving line of credit. Additionally, cash flows from operating activities for 2016 were $105.5 million, which were used to fund property, plant and equipment purchases of $58.6 million, as well as the repayment of $46.0 million on our outstanding debt. The decrease in working capital from the end of fiscal year 2015 was primarily driven by our key strategic priority to reduce inventory levels in order to improve our cash conversion cycle, generate cash, and to pay down debt. Of the $52.1 million of cash and cash equivalents on hand as of December 30, 2016, $21.9 million is being amortized utilizingheld at our foreign subsidiaries and is considered permanently reinvested.
Credit Facilities - As of December 30, 2016, we had senior secured credit facilities (the “Senior Secured Credit Facilities”) that consist of (i) a $200 million revolving credit facility (the “Revolving Credit Facility”), which had $40 million drawn as of December 30, 2016, (ii) a $356 million term loan A facility (the “TLA Facility”), and (iii) a $1,015 million term loan B facility (the “TLB Facility”). Additionally, as of December 30, 2016, we had $360 million aggregate principal amount of 9.125% senior notes due on November 1, 2023 (the “Senior Notes”) outstanding. The Revolving Credit Facility will mature on October 27, 2020, the effectiveTLA Facility will mature on October 27, 2021 and the TLB Facility will mature on October 27, 2022. The Senior Secured Credit Facilities include a mandatory prepayment provision customary for credit facilities of its nature.
The Revolving Credit Facility and TLA Facility contain financial covenants, which were amended in the fourth quarter of 2016. Pursuant to the amendment, the maximum total net leverage ratio stepped down to 6.25:1.0 beginning in the fourth fiscal quarter of 2016 until and including the fourth fiscal quarter for 2017, and will gradually decline to 4.0:1.0 by the second fiscal quarter of 2020. Additionally, pursuant to the amendment, the minimum interest method. Seecoverage ratio dropped to 2.5:1.0 beginning in the fourth fiscal quarter of 2016 until and including the fourth fiscal quarter of 2017. For fiscal quarters in 2018 and 2019, the interest coverage ratio will rise to 2.75:1.0 and 3.0:1.0, respectively. As of December 30, 2016, our total net leverage ratio, calculated in accordance with our credit agreement, was approximately 5.84 to 1.00. For the twelve month period ended December 30, 2016, our ratio of adjusted EBITDA to interest expense, calculated in accordance with our credit agreement, was approximately 2.85 to 1.00.
Failure to comply with these financial covenants would result in an event of default as defined under the Revolving Credit Facility and TLA Facility unless waived by the lenders. An event of default may result in the acceleration of our indebtedness. As a result, management believes that compliance with these covenants is material to us. As of December 30, 2016, we were in full compliance with the financial covenants described above. However, a significant increase in the LIBOR interest rate (i.e. above 1%) and/or a continued decline in our operating performance, and in particular our sales and/or adjusted EBITDA, could result in our inability to meet these financial covenants and lead to an event of default if a waiver or amendment could not be obtained from our lenders. As of December 30, 2016, our adjusted EBITDA would have to decline by more than $19 million, or approximately 7%, in order for us to not be in compliance with our financial covenants.
The Revolving Credit Facility is supported by a consortium of thirteen lenders with no lender controlling more than 27% of the facility. As of December 30, 2016, the banks supporting 88% of the Revolving Credit Facility each had an S&P credit rating of at least BBB+ or better, which is considered investment grade. The banks which support the remaining 12% of the Revolving Credit Facility are not currently being rated.
Refer to Note 9 “Debt” of the Notes to Consolidated Financial Statements contained in Item 8 of this report. Interest incomereport for 2012 was relatively consistent with 2011.further description of our outstanding debt.
(Gain) Loss on Cost and Equity Method Investments
In 2011, we sold our cost method investment in IntElect Medical, Inc. (“IntElect”) in conjunction with Boston Scientific’s acquisitionMANAGEMENT’S DISCUSSION AND ANALYSIS
Summary of IntElect. We obtained our ownership interest in IntElect through our acquisition of BIOMEC, Inc. in 2007 and two subsequent additional investments. This transaction resulted in a pre-tax gain of $4.5 million. During 2012 and 2011, we recognized impairment charges related to our cost and equity method investments of $0.1 million and $0.3 million, respectively.
Other Expense, Net
Other expense, net primarily includes the impact of foreign currency exchange rate fluctuations on transactions denominated in foreign currencies.
Provision for Income TaxesCash Flow
The effective tax ratefollowing is a summary of cash flow information (in thousands) for 2012 was 171.3% versus 31.6% for 2011. The stand-alone U.S. component of the effective tax rate for the year ended December 28, 2012 was 33.1% versus 31.5% for 2011. The fluctuation between the overall rate between 2012fiscal years 2016 and 2011 is primarily attributable to approximately $6.2 million of tax charges (approximately 92% increase in our effective tax rate) recorded in connection with our Swiss orthopaedic restructuring. These charges relate to the loss of our Swiss tax holiday, due to our 2012 decision to transfer manufacturing out of Switzerland, as well as the establishment of a valuation allowance on a portion of our Swiss deferred tax assets as it is more likely than not that they will not be fully realized. Additionally, our 2012 effective tax rate reflects the impact of approximately $31.3 million of losses resulting from our Swiss restructuring, the benefit of which are recorded at the lower Swiss effective tax rate, thus giving rise to an approximate 57% increase in the overall effective tax rate of the Company. See Note 14 “Income Taxes” of the Notes to the Consolidated Financial Statements contained in Item 8 of this report for a reconciliation of the U.S. statutory rate to our effective tax rate.
Liquidity and Capital Resources2015:
|
| | | | | | | |
| | At |
| (Dollars in thousands) | January 3, 2014 | | December 28, 2012 |
| Cash and cash equivalents | $ | 35,465 |
| | $ | 20,284 |
|
| Working capital | $ | 190,731 |
| | $ | 176,376 |
|
| Current ratio | 3.08 |
| | 2.92 |
|
|
| | | | | |
| | 2016 | | 2015 |
| Cash provided by (used in): | | | |
| Operating activities | 105,532 |
| | 12,479 |
|
| Investing activities | (63,300 | ) | | (473,559 | ) |
| Financing activities | (72,146 | ) | | 467,910 |
|
| Effect of foreign currency exchange rates on cash and cash equivalents | (448 | ) | | (1,176 | ) |
| Net change in cash and cash equivalents | (30,362 | ) | | 5,654 |
|
Operating Activities - The $93.1 million increase in cash provided was due to a $53.3 million increase in cash flow provided by working capital and a $39.7 million increase in cash net income. The increase in cash andflow from working capital accounts primarily related to a $47.9 increase in cash equivalentsflow from December 28, 2012 is due primarily to operating income earned during 2013. Excluding estimated tax payments madeinventory in 2013 of $28.8 million relatingcomparison to the retirementprior year. One of our convertible subordinated notes,key strategic priorities is to reduce our working capital levels, and in particular inventory levels, to improve our cash conversion cycle. Additionally, we generated $85.5have successfully extended payment terms with many key supply chain partners, which should also improve our cash conversion cycle.
Investing Activities - The $63.3 million in net cash used in 2016 consisted primarily of $58.6 million for the purchase of property, plant, and equipment. The $473.6 million in net cash used in 2015 primarily related to the acquisition of Lake Region Medical ($423.4 million) and the purchase of property, plant, and equipment ($44.6 million). Our current expectation is that capital spending for 2017 will be in the range of $50 million to $60 million, of which approximately half is discretionary in nature. We anticipate that cash on hand, cash flows from operations as comparedand available borrowing capacity under our Revolving Credit Facility will be sufficient to $64.8fund these capital expenditures.
Financing Activities - The $72.1 million in 2012. These increases were partially offset by maintenance level property, plant and equipment purchasesnet cash used in 2016 consisted primarily of $18.6 million, as well as net repayments made on our long-term debt of $33.3 million. This increase in cash, as well as our increased working capital levels in anticipation of higher sales and critical raw material purchases, were the primary drivers behind our current ratio increase. Of the $35.5$76.3 million of cash on hand as of January 3, 2014, $5.6that was divested with the Spin-off, which was funded with $57 million is being held atborrowed under our foreign subsidiaries and is considered permanently reinvested.
Revolving Line of Credit – In September 2013, we amended and extended our credit facility (the “Credit Facility”), which consists of a $300 million revolving line of credit (the “Revolving Credit Facility”), a $200 million term loan (the “Term Loan”), a $15 million letter of credit subfacility, and a $15 million swingline subfacility. The Credit Facility can be increased by $200 million upon the Company's request and approval by the lenders. The Revolving Credit Facility has a maturity dateand cash on hand. During 2016, we repaid $46.0 million on our outstanding borrowings, which was $17 million above the minimum payments. The $467.9 million of September 20, 2018, which may be extendednet cash provided in 2015 primarily related to September 20, 2019 upon notice by usthe net debt borrowed and subject to certain conditions. The principalrepaid in connection with the Lake Region Medical acquisition, including debt issuance costs of the Term Loan is payable in quarterly installments as specified in the Credit Facility until its maturity date of September 20, 2019 when the unpaid balance is due in full.$471.6 million.
The Credit Facility is supported by a consortium of fifteen banks with no bank controlling more than 18% of the facility.Capital Structure - As of January 3, 2014, each bank supporting theDecember 30, 2016, our capital structure consists of $1.77 billion of principal outstanding under our Senior Secured Credit Facility has an S&P credit ratingFacilities and Senior Notes and 30.9 million shares of at least BBB or better, which is considered investment grade.
The Credit Facility requires uscommon stock outstanding. If necessary, we currently have access to maintain a rolling four quarter ratio of adjusted EBITDA to interest expense of at least 3.0 to 1.0. For the twelve month period ended January 3, 2014,$151.1 million under our ratio of adjusted EBITDA to interest expense, calculated in accordance with our credit agreement, was 22.4 to 1.00, well above the required limit. The Credit Facility also requires us to maintain a total leverage ratio of not greater than 4.5 to 1.0 and not greater than 4.25 to 1.0 after January 2, 2016. As of January 3, 2014, our total leverage ratio, calculated in accordance with our credit agreement, was 1.53 to 1.00, well below the required limit.
The Credit Facility contains customary events of default. Upon the occurrence and during the continuance of an event of default, a majority of the lenders may declare the outstanding advances and all other obligations under the Credit Facility immediately due and payable. See Note 9 “Debt” of the Notes to Consolidated Financial Statements contained in Item 8 of this report.
As of January 3, 2014, we had $300 million of borrowing capacity available under theRevolving Credit Facility. This amount may vary from period to period based upon our debt and EBITDA levels, which impacts the covenant calculations discussed above. We believe that our cash flow from operations and the Credit Facility provide adequate liquidity to meet our short- and long-term funding needs.
Operating activities – Cash flows from operating activities for 2013 were $56.8 million compared to $64.8 million for 2012. During 2013, we made estimated tax payments related to the retirement of our convertible subordinated notes of $28.8 million. Refer to Note 9 “Debt” contained in Item 8 of this report for further discussion. Excluding these tax payments, cash flow from operations totaled $85.5 million. This increase in adjusted cash flow from operations as compared to 2012 is a result of a higher level of cash operating income partially offset by higher working capital levels in anticipation of higher sales and critical raw material purchases. During 2013, we reduced our receivable balances by $7.2 million and continue to remain focused on cash flow generation.
Investing activities – Net cash used in investing activities for 2013 was $18.3 million compared to $59.8 million for 2012. This was net of $4.7 million of proceeds received from the sale of our Swiss orthopaedic product lines, which closed during the first quarter of 2013. The decrease in cash used in investing activities from 2012 primarily relates to a decline in capital expenditures of $22.5 million from 2012 due to the completion of various consolidation and optimization initiatives discussed in the “Cost Savings and Consolidation Efforts” section of this Item (primarily the construction of our Fort Wayne facility which was completed in 2012). Additionally, the Company made $17.2 million of cash payments in 2012 related to its acquisitions. Our current expectation is that capital spending for 2014 will be in the range of $25 million to $35 million, of which approximately half is discretionary in nature. We anticipate that cash on hand, cash flows from operations and availability under our Credit Facility will be sufficient to fund these capital expenditures. As part of our growth strategy, we have and will continue to consider targeted and opportunistic acquisitions.
Financing activities – Net cash used in financing activities for 2013 was $23.4 million compared to $21.5 million for the prior year period. During 2013, we made $33.3 million of net long-term debt repayments as compared to $22.0 million in 2012 as cash flows from operations was significantly higher than our cash used in investing activities. These net repayments were partially offset by $12.8 million of cash received from the issuance of common stock under our stock-based compensation plans (i.e. exercise of stock options) versus $1.3 million in 2012 due to our higher stock price in 2013.
Capital Structure – As of January 3, 2014, our capital structure consisted of $197.5 million of debt outstanding on our term loan and 24.4 million shares of common stock outstanding. Additionally, we had $35.5 million in cash and cash equivalents, which we believe is sufficient to meet our short-term operating cash needs. If necessary, we have available borrowing capacity under our Credit Facility and are also authorized to issue 100 million shares of common stock and 100 million shares of preferred stock. We believe that if neededAs of December 30, 2016, our debt service obligations for 2017, consisting of principal and interest on our outstanding debt, are estimated to be approximately $133 million.
Based on current expectations, we can access public markets to raise additional capital. We believe that our capital structure provides adequate fundingprojected cash flows provided by operations, available cash and cash equivalents and potential borrowings under the Revolving Credit Facility are sufficient to meet our growth objectives.working capital, debt service and capital expenditure requirements for the next twelve months. If our future financing needs increase, we may need to arrange additional debt or equity financing. Accordingly, we evaluate and consider from time to time various financing alternatives to supplement our financial resources. However, we cannot be assured that we will be able to enter into any such arrangements on acceptable terms or at all. We continuously evaluate our capital structure as it relatesbelieve we have clear line of sight to our anticipated long-term funding needs. Changesdebt reduction initiatives, with an ultimate goal of de-levering the Company to 3.5X to 3X adjusted EBITDA.
Non-Guarantor Information – For the year ended December 30, 2016, after giving pro forma effect to the completion of the Lake Region Medical acquisition and Spin-off, the non-Guarantors of our capital structure may occurcredit facilities represented approximately 30% and 41% of our revenue and EBITDA, respectively. In addition, as a result of this analysis, or changes in market conditions. Going forward, we expect excess cash flow from operations to be used to fundDecember 30, 2016, the non-Guarantors of our remaining consolidation initiatives, potential acquisitionscredit facilities held approximately 26% of our total tangible assets and to pay down outstanding debt.3% of our total tangible liabilities. Tangible assets consist of total assets less intangible assets, intercompany receivables, and deferred taxes. Tangible liabilities consist of total liabilities less intercompany payables and deferred taxes.
Off-Balance Sheet Arrangements
We have no off-balance sheet arrangements within the meaning of Item 303(a)(4) of Regulation S-K.
MANAGEMENT’S DISCUSSION AND ANALYSIS
LitigationContractual Obligations
We are partyPresented below is a summary of contractual obligations and other minimum commitments as of December 30, 2016. Refer to various legal actions arising in the normal course of business. A description of pending legal actions against the Company is set forth at Note 15 “Commitments and Contingencies” of the Notes to Consolidated Financial Statements contained atin Item 8 of this report. We doreport for additional information regarding self-insurance liabilities, which are not believe that the ultimate resolution of any individual pending legal action will have a material effect on our consolidated results of operations, financial position or cash flows. However, litigation is subject to inherent uncertainties and there can be no assurance that any pending legal action, which we currently believe to be immaterial, does not become materialreflected in the future.
Contractual Obligations
The following table summarizes our contractual obligations at January 3, 2014:below.
|
| | | | | | | | | | | | | | | | | | | |
| | Payments due by period |
| | Total | | Less than 1 year | | 1-3 years | | 3-5 years | | More than 5 years |
| Total debt obligations | $ | 1,771,000 |
| | $ | 31,344 |
| | $ | 88,469 |
| | $ | 327,687 |
| | $ | 1,323,500 |
|
Interest on debt(a) | 606,765 |
| | 101,990 |
| | 198,820 |
| | 189,671 |
| | 116,284 |
|
Operating lease obligations(b) | 77,300 |
| | 13,486 |
| | 23,340 |
| | 16,636 |
| | 23,838 |
|
Foreign currency contracts(b) | 24,654 |
| | 24,654 |
| | — |
| | — |
| | — |
|
Defined benefit plan obligations(c) | 3,073 |
| | 261 |
| | 457 |
| | 467 |
| | 1,888 |
|
Other(d) | 49,982 |
| | 47,092 |
| | 2,870 |
| | 20 |
| | — |
|
| Total | $ | 2,532,774 |
| | $ | 218,827 |
| | $ | 313,956 |
| | $ | 534,481 |
| | $ | 1,465,510 |
|
|
| | | | | | | | | | | | | | | | | | | |
| | Payments due by period |
| CONTRACTUAL OBLIGATIONS | Total | | Less than 1 year | | 1-3 years | | 3-5 years | | More than 5 years |
Debt obligations(a) | $ | 221,466 |
| | $ | 14,928 |
| | $ | 36,772 |
| | $ | 48,083 |
| | $ | 121,683 |
|
Operating lease obligations(b) | 17,347 |
| | 5,268 |
| | 8,688 |
| | 2,455 |
| | 936 |
|
Purchase obligations(b) | 24,427 |
| | 17,118 |
| | 4,109 |
| | 3,140 |
| | 60 |
|
Foreign currency contracts(b) | 14,000 |
| | 14,000 |
| | — |
| | — |
| | — |
|
Defined benefit plan obligations(c) | 1,657 |
| | 381 |
| | 127 |
| | 239 |
| | 910 |
|
| Total contractual obligations | $ | 278,897 |
| | $ | 51,695 |
| | $ | 49,696 |
| | $ | 53,917 |
| | $ | 123,589 |
|
| |
| (a) | IncludesInterest payments in the annualtable above reflect the contractual interest expense on the $197.5 million outstandingpayments on our Term Loanoutstanding debt based upon the period end weighted averagebalance outstanding and applicable interest rate of 1.87%, which includesrates at December 30, 2016, and exclude the impact of ourthe debt discount amortization and impact of interest rate swap agreement. Also includes $6.2 million of deferred federal and state taxes on our convertible subordinated notes that will be due between 2014 and 2018. Seeagreements. Refer to Note 9 “Debt” of the Notes to Consolidated Financial Statements contained in Item 8 of this report.report for additional information regarding long-term debt. |
| |
| (b) | SeeRefer to Note 15 “Commitments and Contingencies” of the Notes to Consolidated Financial Statements contained in Item 8 of this report for additional information about our operating leases, purchaselease obligations and foreign currency contracts. |
| |
| (c) | SeeRefer to Note 10 “Defined Benefit“Benefit Plans” of the Notes to Consolidated Financial Statements contained in Item 8 of this report for additional information about our defined benefit plan obligations. Plan assets |
| |
| (d) | We have included inventory purchase commitments which are expected to be sufficient to cover plan liabilities.legally binding and specify minimum purchase quantities. These commitments do not include open purchase orders. |
This table does not reflect $1.9$10.6 million of unrecognized tax benefits, as we are uncertain as to if or when such amounts may be settled. Refer to Note 14 “Income Taxes” of the Notes to Consolidated Financial Statements in Item 8 of this report for additional information about these unrecognized tax benefits.
We self-fund the medical insurance coverage provided to our U.S. based employees. We limit our risk through the use of stop loss insurance. As of January 3, 2014, we had $1.6 million accrued related to our self-insurance obligations under our medical plan. This accrual is recorded in Accrued Expenses in the Consolidated Balance Sheet, and is primarily based upon claim history. For 2014, we have specific stop loss coverage per associate for claims in the year exceeding $225 thousand per associate with no annual maximum aggregate stop loss coverage. This table does not reflect any potential future payments for self-insured medical claims.
We were a member of a group self-insurance trust that provided workers’ compensation benefits to our employees in Western New York (the “Trust”). During 2011, we were notified by the Trust of its intention to cease operations and were assessed $0.6 million as an estimate of our pro-rata share of future costs related to the Trust. This amount was accrued and paid in 2011. In 2013 and 2012 we utilized traditional insurance to provide workers’ compensation benefits to our employees. Based on actual experience, we could receive a refund or be assessed additional contributions for workers’ compensation claims as each participating organization has joint and several liability for Trust obligations if the assets of the Trust are not sufficient to cover those obligations.
Inflation
We utilize certain critical raw materials (including precious metals) in our products that we obtain from a limited number of suppliers due to the technically challenging requirements of the supplied product and/or the lengthy process required to qualify these materials with our customers. We cannot quickly establish additional or replacement suppliers for these materials because of these requirements. Our results may be negatively impacted by an increase in the price of these critical raw materials. This risk is partially mitigated as many of the supply agreements with our customers allow us to partially adjust prices for the impact of any raw material price increases and the supply agreements with our vendors have final one-time buy clauses to meet a long-term need. Historically, raw material price increases have not materially impacted our results of operations.
Impact of Recently Issued Accounting Standards
In the normal course of business, we evaluate all new accounting pronouncements issued by the Financial Accounting Standards Board (“FASB”), SEC, Emerging Issues Task ForceSecurities and Exchange Commission (“EITF”SEC”), American Institute of Certified Public Accountants (“AICPA”) or other authoritative accounting bodies to determine the potential impact they may have on our Consolidated Financial Statements. SeeRefer to Note 1 “Summary of Significant Accounting Policies” of the Notes to Consolidated Financial Statements contained in Item 8 of this report for additional information about these recently issued accounting standards and their potential impact on our financial condition or results of operations.
ITEM 7A. QUANTITATIVE AND QUALITATIVE DISCLOSURES ABOUT MARKET RISK
|
ITEM 7A. |
| | QUANTITATIVE AND QUALITATIVE DISCLOSURES ABOUT MARKET RISK |
MARKET RISK
In the normal course of business, we are exposed to market risk primarily due to changes in foreign currency exchange rates and interest rates. Changes in these rates could result in fluctuations in our earnings and cash flows. We regularly assess these risks and have established policies and business practices to help protect against the adverse effects of these and other potential exposures. However, fluctuations in foreign currency exchange rates and interest rates could have a significant impact, positive or negative, on our financial results in the future.
Foreign Currency –Exchange Rate Risk
We have foreign operations in Ireland, Germany, France, Switzerland, Mexico, Uruguay, and Switzerland,Malaysia which expose the Companyus to foreign currency exchange rate fluctuations due to transactions denominated in Euros, Swiss francs, Mexican pesos, Uruguayan pesos, and Swiss francs, respectively.Malaysian ringgits. We continuously evaluate our foreign currency risk, and will take action from time to time in order to best mitigate these risks, which includes thewe use of various derivative instruments suchoperational hedges, as well as forward currency exchange rate contracts.contracts, to manage the impact of currency exchange rate fluctuations on earnings and cash flows. We do not enter into currency exchange rate derivative instruments for speculative purposes. A hypothetical 10% change in the value of the U.S. dollar in relation to our most significant foreign currency exposures would have had an impact of approximately $8$12 million on our 2016 annual sales. This amount is not indicative of the hypothetical net earnings impact due to the partially offsetting impacts on cost of sales and operating expenses in those currencies. We estimate that foreign currency exchange rate fluctuations during 2013 increased2016 decreased sales in comparison to 20122015 by approximately $2$1 million.
In 2013, weWe have historically entered into a forward contracts to purchase 8.4 million and 7.0 million Mexican pesos per month beginning in January 2014 through December 2014 at an exchange rate of $0.0767 per peso and $0.0752 per peso, respectively. These contracts were entered into in order to hedge the risk of peso-denominated payments associated with a portion of theour operations at our Tijuana, Mexico facility for 2014 andin Mexico. These forward contracts are being accounted for as cash flow hedges.
The amount recorded during 2016 related to our forward contracts was an increase in Cost of Sales of $3.5 million. As of January 3, 2014, these contracts hadDecember 30, 2016, this contract has a negative fair value of $0.1 million, which is$2.1 million. Refer to Note 15 “Commitments and Contingencies�� to the Consolidated Financial Statements contained in Item 8 of this report for additional information regarding our outstanding forward contracts.
To the extent that our monetary assets and liabilities, including short-term and long-term intercompany loans, are recorded within Accrued Expensesin a currency other than the functional currency of the subsidiary, these amounts are remeasured each period at the period-end exchange rate, with the resulting gain or loss being recorded in Other Income, Net in the Consolidated Balance Sheet. The amount recorded asStatements of Operations and Comprehensive Income (Loss). Net foreign currency transaction gains and losses included in Other Income, Net amounted to a reductiongain of Cost of Sales during 2013$4.9 million for 2016 and primarily related to these forward contracts was $1.2 million. No portionthe remeasurement of intercompany loans and the strengthening of the U.S. dollar relative to the Euro. A hypothetical 10% change in fairthe value of the U.S. dollar in relation to our most significant foreign currency contracts during 2013 was considered ineffective.monetary assets and liabilities would have had an impact of approximately $4 million on our Other Income, Net for 2016.
We translate all assets and liabilities of our foreign operations where the U.S. dollar is not the functional currency at the period-end exchange rate and translate sales and expenses at the average exchange rates in effect during the period. The net effect of these translation adjustments is recorded in the Consolidated Financial Statements as Comprehensive Income (Loss). The translation adjustment for 20132016 was a $1.5$19.3 million gain.loss and primarily related to the strengthening of the U.S. dollar relative to the Euro. Translation adjustments are not adjusted for income taxes as they relate to permanent investments in our foreign subsidiaries. Net foreign currency transaction gains and losses included in Other Expense, Net amounted to a loss of $0.1 million for 2013. A hypothetical 10% change in the value of the U.S. dollar in relation to our most significant foreign currency net assets would have had an impact of approximately $8.4$46 million on our foreign net assets as of January 3, 2014.December 30, 2016.
Interest Rates –Rate Risk
We regularly monitor interest rate risk attributable to both our outstanding or forecasted debt obligations as well as our offsetting hedge positions and may take steps to mitigate these exposures as appropriate. From time to time, we enter into interest rate swap agreements in order to hedge against potential changes in cash flows on our outstanding variable rate debt.
During 2016, we entered into a one year $250 million interest rate swap and a three year $200 million interest rate swap to hedge against potential changes in cash flows on our outstanding variable rate debt, which are indexed to the one-month LIBOR rate. The variable rate received on the interest rate swaps and the variable rate paid on the variable rate debt will have the same rate of interest, excluding the credit spread, and will reset and pay interest on the same day. The swaps are being accounted for as cash flow hedges. The amount recorded during 2016 related to our interest rate swaps was an increase to Interest Expense of $0.1 million. As of December 30, 2016, these swaps have a positive fair value of $3.5 million.
As of December 30, 2016, we had $1.77 billion in principal amount outstanding on our debt. Interest rates on our Revolving Credit Facility, TLA Facility and TLB Facility, reset, at our option, based upon the prime rate or LIBOR rate, thus subjecting us to interest rate risk. To help offset this risk, from time to time, we enter into receive floating-pay fixedOur TLB Facility has a 1.00% LIBOR floor, thus is only variable when LIBOR interest rate swaps indexed to the same applicable index rate as the debt it is hedging. In October 2012 we entered into a three-year $150 million interest rate swap, which amortizes $50 million per year beginning in 2014 and became effective during the first quarter of 2013. Under terms of the contract, we receive a floating interest rate indexed to the one-month LIBOR rate and payrates are above 1.00%. Our Senior Notes have a fixed interest rate of 0.573%. This swap was entered into in orderrate. Refer to hedge against potential changes in cash flows on our outstanding variable-rate debt, which is also indexed to the one-month LIBOR rate. The receive variable leg of the interest rate swap and the variable rate paid on the debt is expected to have the same rate of interest, excluding the credit spread, and reset and pay interest on the same dates. This swap is accounted for as a cash flow hedge.
As of January 3, 2014, we had $197.5 million outstanding on our Credit Facility, of which $150 million is currently being hedged. See Note 9 “Debt” of the Notes to the Consolidated Financial Statements in Item 8 of this report for additional information about our outstanding debt. A hypothetical one percentage point (100 basis points) changeincrease in the LIBOR rate on the $47.5 million$1.2 billion of unhedged floatingvariable rate debt outstanding at January 3, 2014December 30, 2016 would have an impact of approximately $0.5 million onincrease our interest expense.expense by approximately $9 million.
ITEM 8. FINANCIAL STATEMENTS AND SUPPLEMENTARY DATA
INTEGER HOLDINGS CORPORATION
Index to Consolidated Financial Statements
|
| | |
ITEM 8. | | FINANCIAL STATEMENTS AND SUPPLEMENTARY DATA |
The following are set forth below:
|
| Page |
| |
| | |
| |
| | |
| 1, 2016........................................................................ | |
| | |
| 2016, January 1, 2016 and January 2, 2015...................................................................................................................................... | |
| | |
| 2016 and January 2, 2015.... | |
| | |
| 2016 and January 2, 2015....................................................................................................................................................................... | |
| | |
| |
MANAGEMENT’S REPORT ON INTERNAL CONTROL OVER FINANCIAL REPORTING
The Company’s certifying officers are responsible for establishing and maintaining adequate internal control over financial reporting. The Company’s internal control over financial reporting is designed and maintained under the supervision of its certifying officers to provide reasonable assurance regarding the reliability of financial reporting and the preparation of the Company’s consolidated financial statements for external reporting purposes in accordance with accounting principles generally accepted in the United States of America.
As of January 3, 2014,December 30, 2016, management conducted an assessment of the effectiveness of the Company’s internal control over financial reporting based on the framework established in Internal Control – Integrated Framework (1992)(2013) issued by the Committee of Sponsoring Organizations of the Treadway Commission. Based on this assessment, management has determined that the Company’s internal control over financial reporting as of January 3, 2014December 30, 2016 is effective.
The effectiveness of internal control over financial reporting as of January 3, 2014December 30, 2016 has been audited by Deloitte & Touche LLP, the Company’s independent registered public accounting firm.
Dated: March 4, 2014February 28, 2017
|
| | |
| /s/ Thomas J. Hook | | /s/ Michael Dinkins |
| Thomas J. Hook | | Michael Dinkins |
| President & Chief Executive Officer | | Executive Vice President & Chief Financial Officer |
REPORT OF INDEPENDENT REGISTERED PUBLIC ACCOUNTING FIRM
To the Board of Directors and Stockholders of
Greatbatch, Inc.Integer Holdings Corporation
Frisco, Texas
We have audited the internal control over financial reporting of Greatbatch, Inc.Integer Holdings Corporation and subsidiarysubsidiaries (the “Company”) as of January 3, 2014,December 30, 2016, based on criteria established in Internal Control - Integrated Framework (1992)(2013) issued by the Committee of Sponsoring Organizations of the Treadway Commission. The Company'sCompany’s management is responsible for maintaining effective internal control over financial reporting and for its assessment of the effectiveness of internal control over financial reporting, included in the accompanying Management’s Report on Internal Control Over Financial Reporting. Our responsibility is to express an opinion on the Company'sCompany’s internal control over financial reporting based on our audit.
We conducted our audit in accordance with the standards of the Public Company Accounting Oversight Board (United States). Those standards require that we plan and perform the audit to obtain reasonable assurance about whether effective internal control over financial reporting was maintained in all material respects. Our audit included obtaining an understanding of internal control over financial reporting, assessing the risk that a material weakness exists, testing and evaluating the design and operating effectiveness of internal control based on the assessed risk, and performing such other procedures as we considered necessary in the circumstances. We believe that our audit provides a reasonable basis for our opinion.
A company'scompany’s internal control over financial reporting is a process designed by, or under the supervision of, the company'scompany’s principal executive and principal financial officers, or persons performing similar functions, and effected by the company'scompany’s board of directors, management, and other personnel to provide reasonable assurance regarding the reliability of financial reporting and the preparation of financial statements for external purposes in accordance with generally accepted accounting principles. A company'scompany’s internal control over financial reporting includes those policies and procedures that (1) pertain to the maintenance of records that, in reasonable detail, accurately and fairly reflect the transactions and dispositions of the assets of the company; (2) provide reasonable assurance that transactions are recorded as necessary to permit preparation of financial statements in accordance with generally accepted accounting principles, and that receipts and expenditures of the company are being made only in accordance with authorizations of management and directors of the company; and (3) provide reasonable assurance regarding prevention or timely detection of unauthorized acquisition, use, or disposition of the company'scompany’s assets that could have a material effect on the financial statements.
Because of the inherent limitations of internal control over financial reporting, including the possibility of collusion or improper management override of controls, material misstatements due to error or fraud may not be prevented or detected on a timely basis. Also, projections of any evaluation of the effectiveness of the internal control over financial reporting to future periods are subject to the risk that the controls may become inadequate because of changes in conditions, or that the degree of compliance with the policies or procedures may deteriorate.
In our opinion, the Company maintained, in all material respects, effective internal control over financial reporting as of January 3, 2014,December 30, 2016, based on the criteria established in Internal Control - Integrated Framework (1992)(2013) issued by the Committee of Sponsoring Organizations of the Treadway Commission.
We have also audited, in accordance with the standards of the Public Company Accounting Oversight Board (United States), the consolidated financial statements and consolidated financial statement schedule as of and for the year ended January 3, 2014December 30, 2016 of the Company and our report dated March 4, 2014February 28, 2017 expressed an unqualified opinion on those consolidated financial statements and consolidated financial statement schedule.
/s/ Deloitte & Touche LLP
Williamsville, New York
March 4, 2014February 28, 2017
REPORT OF INDEPENDENT REGISTERED PUBLIC ACCOUNTING FIRM
To the Board of Directors and Stockholders of
Greatbatch, Inc.Integer Holdings Corporation
Frisco, Texas
We have audited the accompanying consolidated balance sheets of Greatbatch, Inc.Integer Holdings Corporation and subsidiarysubsidiaries (the “Company”) as of December 30, 2016 and January 3, 2014 and December 28, 2012,1, 2016, and the related consolidated statements of operations and comprehensive income (loss), cash flows, and stockholders'stockholders’ equity for each of the three years in the period ended January 3, 2014.December 30, 2016. Our audits also included the consolidated financial statement schedule listed in the Index at Item 15. These consolidated financial statements and consolidated financial statement schedule are the responsibility of the Company'sCompany’s management. Our responsibility is to express an opinion on the consolidated financial statements and consolidated financial statement schedule based on our audits.
We conducted our audits in accordance with the standards of the Public Company Accounting Oversight Board (United States). Those standards require that we plan and perform the auditaudits to obtain reasonable assurance about whether the consolidated financial statements are free of material misstatement. An audit includes examining, on a test basis, evidence supporting the amounts and disclosures in the consolidated financial statements. An audit also includes assessing the accounting principles used and significant estimates made by management, as well as evaluating the overall financial statement presentation. We believe that our audits provide a reasonable basis for our opinion.
In our opinion, such consolidated financial statements present fairly, in all material respects, the financial position of the Company as of December 30, 2016 and January 3, 2014 and December 28, 2012,1, 2016, and the results of theirits operations and theirits cash flows for each of the three years in the period ended January 3, 2014,December 30, 2016, in conformity with accounting principles generally accepted in the United States of America. Also, in our opinion, such consolidated financial statement schedule, when considered in relation to the basic consolidated financial statements taken as a whole, presents fairly, in all material respects, the information set forth therein.
We have also audited, in accordance with the standards of the Public Company Accounting Oversight Board (United States), the Company'sCompany’s internal control over financial reporting as of January 3, 2014,December 30, 2016, based on the criteria established in Internal Control - Integrated Framework (1992)(2013) issued by the Committee of Sponsoring Organizations of the Treadway Commission and our report dated March 4, 2014February 28, 2017 expressed an unqualified opinion on the Company'sCompany’s internal control over financial reporting.
/s/ Deloitte & Touche LLP
Williamsville, New York
March 4, 2014February 28, 2017
GREATBATCH, INC.INTEGER HOLDINGS CORPORATION
CONSOLIDATED BALANCE SHEETS
| | | | At | | | | | |
| (in thousands except share and per share data) | January 3,
2014 | | December 28,
2012 | December 30,
2016 | | January 1,
2016 |
| ASSETS | | | | | | |
| Current assets: | | | | | | |
| Cash and cash equivalents | $ | 35,465 |
| | $ | 20,284 |
| $ | 52,116 |
| | $ | 82,478 |
|
| Accounts receivable, net of allowance for doubtful accounts of $2.0 million in 2013 and $2.4 million in 2012 | 113,679 |
| | 120,923 |
| |
| Accounts receivable, net of allowance for doubtful accounts of $0.7 million and $1.0 million, respectively | | 204,626 |
| | 207,342 |
|
| Inventories | 118,358 |
| | 106,612 |
| 225,151 |
| | 252,166 |
|
| Refundable income taxes | 2,306 |
| | — |
| 13,388 |
| | 11,730 |
|
| Deferred income taxes | 6,008 |
| | 7,678 |
| |
| Prepaid expenses and other current assets | 6,717 |
| | 12,636 |
| 22,026 |
| | 20,888 |
|
| Total current assets | 282,533 |
| | 268,133 |
| 517,307 |
| | 574,604 |
|
| Property, plant and equipment, net | 145,773 |
| | 150,893 |
| 372,042 |
| | 379,492 |
|
| Amortizing intangible assets, net | 76,122 |
| | 87,345 |
| 849,772 |
| | 893,977 |
|
| Indefinite-lived intangible assets | 20,288 |
| | 20,828 |
| 90,288 |
| | 90,288 |
|
| Goodwill | 346,656 |
| | 349,035 |
| 967,326 |
| | 1,013,570 |
|
| Deferred income taxes | 2,933 |
| | 2,534 |
| 3,970 |
| | 3,587 |
|
| Other assets | 16,398 |
| | 11,107 |
| 31,838 |
| | 26,618 |
|
| Total assets | $ | 890,703 |
| | $ | 889,875 |
| $ | 2,832,543 |
| | $ | 2,982,136 |
|
| LIABILITIES AND STOCKHOLDERS’ EQUITY | | | | | | |
| Current liabilities: | | | | | | |
| Current portion of long-term debt | | $ | 31,344 |
| | $ | 29,000 |
|
| Accounts payable | $ | 46,508 |
| | $ | 45,274 |
| 77,896 |
| | 84,362 |
|
| Income taxes payable | — |
| | 94 |
| 3,699 |
| | 3,221 |
|
| Deferred income taxes | 613 |
| | 874 |
| |
| Accrued expenses | 44,681 |
| | 45,515 |
| 72,281 |
| | 97,257 |
|
| Total current liabilities | 91,802 |
| | 91,757 |
| 185,220 |
| | 213,840 |
|
| Long-term debt | 197,500 |
| | 225,414 |
| 1,698,819 |
| | 1,685,053 |
|
| Deferred income taxes | 52,012 |
| | 82,462 |
| 208,579 |
| | 221,804 |
|
| Other long-term liabilities | 7,334 |
| | 9,382 |
| 14,686 |
| | 10,814 |
|
| Total liabilities | 348,648 |
| | 409,015 |
| 2,107,304 |
| | 2,131,511 |
|
| Commitments and contingencies (Note 15) | | | |
| |
|
| Stockholders’ equity: | | | | | | |
| Preferred stock, $0.001 par value, authorized 100,000,000 shares; no shares issued or outstanding in 2013 or 2012 | — |
| | — |
| |
| Common stock, $0.001 par value, authorized 100,000,000 shares; 24,459,153 shares issued and 24,422,555 shares outstanding in 2013; 23,731,570 shares issued and 23,711,838 shares outstanding in 2012 | 24 |
| | 24 |
| |
| Preferred stock, $0.001 par value, authorized 100,000,000 shares; no shares issued or outstanding | | — |
| | — |
|
| Common stock, $0.001 par value; 100,000,000 shares authorized; 31,059,038 and 30,664,119 shares issued, respectively; 30,925,496 and 30,601,167 shares outstanding, respectively | | 31 |
| | 31 |
|
| Additional paid-in capital | 344,915 |
| | 320,618 |
| 637,955 |
| | 620,470 |
|
| Treasury stock, at cost, 36,598 shares in 2013 and 19,732 shares in 2012 | (1,232 | ) | | (452 | ) | |
| Treasury stock, at cost, 133,542 and 62,952 shares, respectively | | (5,834 | ) | | (3,100 | ) |
| Retained earnings | 183,990 |
| | 147,723 |
| 109,087 |
| | 231,854 |
|
| Accumulated other comprehensive income | 14,358 |
| | 12,947 |
| |
| Accumulated other comprehensive income (loss) | | (16,000 | ) | | 1,370 |
|
| Total stockholders’ equity | 542,055 |
| | 480,860 |
| 725,239 |
| | 850,625 |
|
| Total liabilities and stockholders’ equity | $ | 890,703 |
| | $ | 889,875 |
| $ | 2,832,543 |
| | $ | 2,982,136 |
|
The accompanying notes are an integral part of these consolidated financial statements.
INTEGER HOLDINGS CORPORATION
CONSOLIDATED STATEMENTS OF OPERATIONS
AND COMPREHENSIVE INCOME (LOSS)
|
| | | | | | | | | | | |
| | Fiscal Year Ended |
| (in thousands except per share data) | December 30,
2016 | | January 1,
2016 | | January 2,
2015 |
| Sales | $ | 1,386,778 |
| | $ | 800,414 |
| | $ | 687,787 |
|
| Cost of sales | 1,008,479 |
| | 565,279 |
| | 456,389 |
|
| Gross profit | 378,299 |
| | 235,135 |
| | 231,398 |
|
| Operating expenses: | | | | | |
| Selling, general and administrative expenses | 153,291 |
| | 102,530 |
| | 90,602 |
|
| Research, development and engineering costs, net | 55,001 |
| | 52,995 |
| | 49,845 |
|
| Other operating expenses, net | 61,737 |
| | 66,464 |
| | 15,297 |
|
| Total operating expenses | 270,029 |
| | 221,989 |
| | 155,744 |
|
| Operating income | 108,270 |
| | 13,146 |
| | 75,654 |
|
| Interest expense | 111,270 |
| | 33,513 |
| | 4,252 |
|
| (Gain) loss on cost and equity method investments, net | 833 |
| | (3,350 | ) | | (4,370 | ) |
| Other income, net | (5,018 | ) | | (1,317 | ) | | (807 | ) |
| Income (loss) before provision (benefit) for income taxes | 1,185 |
| | (15,700 | ) | | 76,579 |
|
| Provision (benefit) for income taxes | (4,776 | ) | | (8,106 | ) | | 21,121 |
|
| Net income (loss) | $ | 5,961 |
| | $ | (7,594 | ) | | $ | 55,458 |
|
| Earnings (loss) per share: | | | | | |
| Basic | $ | 0.19 |
| | $ | (0.29 | ) | | $ | 2.23 |
|
| Diluted | $ | 0.19 |
| | $ | (0.29 | ) | | $ | 2.14 |
|
| Weighted average shares outstanding: | | | | | |
| Basic | 30,778 |
| | 26,363 |
| | 24,825 |
|
| Diluted | 30,973 |
| | 26,363 |
| | 25,975 |
|
| | | | | | |
| Comprehensive Income (Loss) | | | | | |
| Net income (loss) | $ | 5,961 |
| | $ | (7,594 | ) | | $ | 55,458 |
|
| Other comprehensive loss: | | | | | |
| Foreign currency translation loss | (19,269 | ) | | (7,841 | ) | | (3,502 | ) |
| Net change in cash flow hedges, net of tax | 2,478 |
| | 108 |
| | (1,359 | ) |
| Defined benefit plan liability adjustment, net of tax | (579 | ) | | (20 | ) | | (374 | ) |
| Other comprehensive loss, net | (17,370 | ) | | (7,753 | ) | | (5,235 | ) |
| Comprehensive income (loss) | $ | (11,409 | ) | | $ | (15,347 | ) | | $ | 50,223 |
|
The accompanying notes are an integral part of these consolidated financial statements.
GREATBATCH, INC.INTEGER HOLDINGS CORPORATION
CONSOLIDATED STATEMENTS OF OPERATIONS
AND COMPREHENSIVE INCOME (LOSS)CASH FLOWS
|
| | | | | | | | | | | |
| | Year Ended |
| (in thousands except per share data) | January 3,
2014 | | December 28,
2012 | | December 30,
2011 |
| Sales | $ | 663,945 |
| | $ | 646,177 |
| | $ | 568,822 |
|
| Cost of sales | 444,632 |
| | 444,528 |
| | 388,469 |
|
| Gross profit | 219,313 |
| | 201,649 |
| | 180,353 |
|
| Operating expenses: | | | | | |
| Selling, general and administrative expenses | 88,107 |
| | 80,992 |
| | 72,548 |
|
| Research, development and engineering costs, net | 54,077 |
| | 52,490 |
| | 45,513 |
|
| Other operating expenses, net | 15,790 |
| | 42,346 |
| | 593 |
|
| Total operating expenses | 157,974 |
| | 175,828 |
| | 118,654 |
|
| Operating income | 61,339 |
| | 25,821 |
| | 61,699 |
|
| Interest expense | 11,261 |
| | 18,055 |
| | 16,928 |
|
| Interest income | — |
| | (1 | ) | | (21 | ) |
| Loss (gain) on cost and equity method investments, net | 694 |
| | 106 |
| | (4,232 | ) |
| Other expense, net | 546 |
| | 931 |
| | 632 |
|
| Income before provision for income taxes | 48,838 |
| | 6,730 |
| | 48,392 |
|
| Provision for income taxes | 12,571 |
| | 11,529 |
| | 15,270 |
|
| Net income (loss) | $ | 36,267 |
| | $ | (4,799 | ) | | $ | 33,122 |
|
| Earnings (loss) per share: | | | | | |
| Basic | $ | 1.51 |
| | $ | (0.20 | ) | | $ | 1.42 |
|
| Diluted | $ | 1.43 |
| | $ | (0.20 | ) | | $ | 1.40 |
|
| Weighted average shares outstanding: | | | | | |
| Basic | 23,991 |
| | 23,584 |
| | 23,258 |
|
| Diluted | 25,323 |
| | 23,584 |
| | 23,636 |
|
| Comprehensive Income (Loss) | | | | | |
| Net income (loss) | $ | 36,267 |
| | $ | (4,799 | ) | | $ | 33,122 |
|
| Other comprehensive income (loss): | | | | | |
| Foreign currency translation gain (loss) | 1,521 |
| | 1,905 |
| | (704 | ) |
| Net change in cash flow hedges, net of tax | (382 | ) | | 428 |
| | (271 | ) |
| Defined benefit plan liability adjustment, net of tax | 272 |
| | 1,685 |
| | (566 | ) |
| Other comprehensive income (loss) | 1,411 |
| | 4,018 |
| | (1,541 | ) |
| Comprehensive income (loss) | $ | 37,678 |
| | $ | (781 | ) | | $ | 31,581 |
|
|
| | | | | | | | | | | |
| | Fiscal Year Ended |
| (in thousands) | December 30, 2016 | | January 1, 2016 | | January 2, 2015 |
| Cash flows from operating activities: | | | | | |
| Net income (loss) | $ | 5,961 |
| | $ | (7,594 | ) | | $ | 55,458 |
|
| Adjustments to reconcile net income (loss) to net cash provided by operating activities: | | | | | |
| Depreciation and amortization | 90,524 |
| | 44,632 |
| | 37,197 |
|
| Debt related charges included in interest expense | 7,278 |
| | 11,320 |
| | 773 |
|
| Inventory step-up amortization | — |
| | 22,986 |
| | 260 |
|
| Stock-based compensation | 8,408 |
| | 9,376 |
| | 13,186 |
|
| Non-cash (gain) loss on cost and equity method investments | 1,495 |
| | 275 |
| | (4,370 | ) |
| Other non-cash (gains) losses | 5,216 |
| | 1,093 |
| | (3,214 | ) |
| Deferred income taxes | (7,350 | ) | | (10,298 | ) | | 531 |
|
| Changes in operating assets and liabilities, net of acquisitions: | | | | | |
| Accounts receivable | (2,169 | ) | | 3,684 |
| | (11,731 | ) |
| Inventories | 22,170 |
| | (25,752 | ) | | (6,726 | ) |
| Prepaid expenses and other assets | (3,846 | ) | | (1,861 | ) | | (3,281 | ) |
| Accounts payable | (1,127 | ) | | 3,129 |
| | (970 | ) |
| Accrued expenses | (13,935 | ) | | (28,605 | ) | | 1,214 |
|
| Income taxes payable | (7,093 | ) | | (9,906 | ) | | 2,949 |
|
| Net cash provided by operating activities | 105,532 |
| | 12,479 |
| | 81,276 |
|
| Cash flows from investing activities: | | | | | |
| Acquisition of property, plant and equipment | (58,632 | ) | | (44,616 | ) | | (24,827 | ) |
| Proceeds from sale of property, plant and equipment | 347 |
| | 746 |
| | 4 |
|
| Proceeds from sale (purchase of) cost and equity method investments | (3,015 | ) | | (6,300 | ) | | 2,248 |
|
| Acquisitions, net of cash acquired | — |
| | (423,389 | ) | | (16,002 | ) |
| Other investing activities | (2,000 | ) | | — |
| | 2,655 |
|
| Net cash used in investing activities | (63,300 | ) | | (473,559 | ) | | (35,922 | ) |
| Cash flows from financing activities: | | | | | |
| Principal payments of long-term debt | (46,000 | ) | | (1,232,175 | ) | | (10,000 | ) |
| Proceeds from issuance of long-term debt | 57,000 |
| | 1,749,750 |
| | — |
|
| Issuance of common stock | 2,821 |
| | 6,583 |
| | 8,278 |
|
| Payment of debt issuance costs | (1,177 | ) | | (45,933 | ) | | — |
|
| Distribution of cash and cash equivalents to Nuvectra Corporation | (76,256 | ) | | — |
| | — |
|
| Purchase of non-controlling interests | (6,818 | ) | | (9,875 | ) | | — |
|
| Other financing activities | (1,716 | ) | | (440 | ) | | (655 | ) |
| Net cash provided by (used in) financing activities | (72,146 | ) | | 467,910 |
| | (2,377 | ) |
| Effect of foreign currency exchange rates on cash and cash equivalents | (448 | ) | | (1,176 | ) | | (1,618 | ) |
| Net increase (decrease) in cash and cash equivalents | (30,362 | ) | | 5,654 |
| | 41,359 |
|
| Cash and cash equivalents, beginning of year | 82,478 |
| | 76,824 |
| | 35,465 |
|
| Cash and cash equivalents, end of year | $ | 52,116 |
| | $ | 82,478 |
| | $ | 76,824 |
|
The accompanying notes are an integral part of these consolidated financial statements.
GREATBATCH, INC.INTEGER HOLDINGS CORPORATION
CONSOLIDATED STATEMENTS OF CASH FLOWS
STOCKHOLDERS’ EQUITY
|
| | | | | | | | | | | |
| | Year Ended |
| (in thousands) | January 3, 2014 | | December 28, 2012 | | December 30, 2011 |
| Cash flows from operating activities: | | | | | |
| Net income (loss) | $ | 36,267 |
| | $ | (4,799 | ) | | $ | 33,122 |
|
| Adjustments to reconcile net income (loss) to net cash provided by operating activities: | | | | | |
| Depreciation and amortization | 35,966 |
| | 46,368 |
| | 36,306 |
|
| Debt related amortization included in interest expense | 6,366 |
| | 12,557 |
| | 11,389 |
|
| Stock-based compensation | 14,101 |
| | 10,904 |
| | 12,082 |
|
| (Gain) loss on cost and equity method investments, net | 694 |
| | 106 |
| | (4,232 | ) |
| Other non-cash (gains) losses, net | 255 |
| | 10,788 |
| | (676 | ) |
| Deferred income taxes | (29,856 | ) | | 5,733 |
| | 8,776 |
|
| Changes in operating assets and liabilities, net of acquisitions: | | | | | |
| Accounts receivable | 7,379 |
| | (18,834 | ) | | (13,477 | ) |
| Inventories | (11,508 | ) | | (7,481 | ) | | (2,139 | ) |
| Prepaid expenses and other assets | (353 | ) | | 1,253 |
| | (590 | ) |
| Accounts payable | 1,307 |
| | 5,757 |
| | 4,236 |
|
| Accrued expenses | (1,176 | ) | | 1,459 |
| | 3,678 |
|
| Income taxes payable | (2,687 | ) | | 1,020 |
| | 1,446 |
|
| Net cash provided by operating activities | 56,755 |
| | 64,831 |
| | 89,921 |
|
| Cash flows from investing activities: | | | | | |
| Proceeds from sale of orthopaedic product lines | 4,746 |
| | — |
| | — |
|
| Acquisition of property, plant and equipment | (18,558 | ) | | (41,069 | ) | | (22,489 | ) |
| Proceeds from sale of property, plant and equipment | 310 |
| | 396 |
| | 212 |
|
| Proceeds from (purchase of) cost and equity method investments, net | (3,732 | ) | | (1,887 | ) | | 10,315 |
|
| Acquisitions, net of cash acquired | — |
| | (17,224 | ) | | (66,493 | ) |
| Other investing activities, net | (1,050 | ) | | (3 | ) | | (1,934 | ) |
| Net cash used in investing activities | (18,284 | ) | | (59,787 | ) | | (80,389 | ) |
| Cash flows from financing activities: | | | | | |
| Principal payments of long-term debt | (458,282 | ) | | (32,000 | ) | | (40,000 | ) |
| Proceeds from issuance of long-term debt | 425,000 |
| | 10,000 |
| | 45,000 |
|
| Issuance of common stock | 12,807 |
| | 1,263 |
| | 2,401 |
|
| Payment of debt issuance costs | (2,802 | ) | | — |
| | (2,213 | ) |
| Other financing activities, net | (81 | ) | | (717 | ) | | (1,500 | ) |
| Net cash provided by (used in) financing activities | (23,358 | ) | | (21,454 | ) | | 3,688 |
|
| Effect of foreign currency exchange rates on cash and cash equivalents | 68 |
| | 186 |
| | 405 |
|
| Net increase (decrease) in cash and cash equivalents | 15,181 |
| | (16,224 | ) | | 13,625 |
|
| Cash and cash equivalents, beginning of year | 20,284 |
| | 36,508 |
| | 22,883 |
|
| Cash and cash equivalents, end of year | $ | 35,465 |
| | $ | 20,284 |
| | $ | 36,508 |
|
|
| | | | | | | | | | | | | | | | | | | | | | | | | | | | | |
| | Common Stock | | Additional
Paid-In Capital | | Treasury Stock | | Retained Earnings | | Accumulated
Other
Comprehensive Income (Loss) | | Total
Stockholders’ Equity |
| (in thousands) | Shares | | Amount | | | Shares | | Amount | | | |
| Balance at January 3, 2014 | 24,459 |
| | $ | 24 |
| | $ | 344,915 |
| | (37 | ) | | $ | (1,232 | ) | | $ | 183,990 |
| | $ | 14,358 |
| | $ | 542,055 |
|
| Comprehensive income: | | | | | | | | | | | | | | | |
| Net income | — |
| | — |
| | — |
| | — |
| | — |
| | 55,458 |
| | — |
| | 55,458 |
|
| Other comprehensive loss, net | — |
| | — |
| | — |
| | — |
| | — |
| | — |
| | (5,235 | ) | | (5,235 | ) |
| Share-based compensation plans: | | | | | | | | | | | | | | | |
| Stock-based compensation | — |
| | — |
| | 8,921 |
| | — |
| | — |
| | — |
| | — |
| | 8,921 |
|
| Net shares issued (acquired) | 640 |
| | 1 |
| | 7,754 |
| | (86 | ) | | (4,290 | ) | | — |
| | — |
| | 3,465 |
|
| Excess tax benefit on share-based compensation | — |
| | — |
| | 4,357 |
| | — |
| | — |
| | — |
| | — |
| | 4,357 |
|
| Shares contributed to 401(k) Plan | — |
| | — |
| | 126 |
| | 95 |
| | 4,215 |
| | — |
| | — |
| | 4,341 |
|
| Balance at January 2, 2015 | 25,099 |
| | 25 |
| | 366,073 |
| | (28 | ) | | (1,307 | ) | | 239,448 |
| | 9,123 |
| | 613,362 |
|
| Comprehensive loss: | | | | | | | | | | | | | | | |
| Net loss | — |
| | — |
| | — |
| | — |
| | — |
| | (7,594 | ) | | — |
| | (7,594 | ) |
| Other comprehensive loss, net | — |
| | — |
| | — |
| | — |
| | — |
| | — |
| | (7,753 | ) | | (7,753 | ) |
| Share-based compensation plans: | | | | | | | | | | | | | | | |
| Stock-based compensation | — |
| | — |
| | 9,364 |
| | — |
| | — |
| | — |
| | — |
| | 9,364 |
|
| Net shares issued (acquired) | 585 |
| | 1 |
| | 5,764 |
| | (107 | ) | | (5,261 | ) | | — |
| | — |
| | 504 |
|
| Excess tax benefit on share-based compensation | — |
| | — |
| | 5,639 |
| | — |
| | — |
| | — |
| | — |
| | 5,639 |
|
| Shares contributed to 401(k) Plan | — |
| | — |
| | 452 |
| | 72 |
| | 3,468 |
| | — |
| | — |
| | 3,920 |
|
| Shares issued in connection with acquisition | 4,980 |
| | 5 |
| | 245,363 |
| | — |
| | — |
| | — |
| | — |
| | 245,368 |
|
| Roll-over options issued in connection with acquisition | — |
| | — |
| | 4,508 |
| | — |
| | — |
| | — |
| | — |
| | 4,508 |
|
| Purchase of non-controlling interests in subsidiaries | — |
| | — |
| | (16,693 | ) | | — |
| | — |
| | — |
| | — |
| | (16,693 | ) |
| Balance at January 1, 2016 | 30,664 |
| | 31 |
| | 620,470 |
| | (63 | ) | | (3,100 | ) | | 231,854 |
| | 1,370 |
| | 850,625 |
|
| Comprehensive loss: | | | | |
|
| | | | | | | | | |
|
|
| Net income | — |
| | — |
| | — |
| | — |
| | — |
| | 5,961 |
| | — |
| | 5,961 |
|
| Other comprehensive loss, net | — |
| | — |
| | — |
| | — |
| | — |
| | — |
| | (17,370 | ) | | (17,370 | ) |
| Share-based compensation plans: | | | | | | | | | | | | | | | |
| Stock-based compensation | — |
| | — |
| | 8,408 |
| | — |
| | — |
| | — |
| | — |
| | 8,408 |
|
| Net shares issued (acquired) | 395 |
| | — |
| | 1,570 |
| | (71 | ) | | (2,734 | ) | | — |
| | — |
| | (1,164 | ) |
| Excess tax benefit on share-based compensation | — |
| | — |
| | 2,266 |
| | — |
| | — |
| | — |
| | — |
| | 2,266 |
|
| Spin-off of Nuvectra Corporation | — |
| | — |
| | 5,241 |
| | — |
| | — |
| | (128,728 | ) | | — |
| | (123,487 | ) |
| Balance at December 30, 2016 | 31,059 |
| | $ | 31 |
| | $ | 637,955 |
| | (134 | ) | | $ | (5,834 | ) | | $ | 109,087 |
| | $ | (16,000 | ) | | $ | 725,239 |
|
The accompanying notes are an integral part of these consolidated financial statements.
GREATBATCH, INC.
CONSOLIDATED STATEMENTS OF STOCKHOLDERS’ EQUITY
|
| | | | | | | | | | | | | | | | | | | | | | | | | | | | | |
| | Common Stock | | Additional
Paid-In Capital | | Treasury Stock | | Retained Earnings | | Accumulated
Other
Comprehensive Income (Loss) | | Total
Stockholders’ Equity |
| (in thousands) | Shares | | Amount | | | Shares | | Amount | | | |
| At December 31, 2010 | 23,319 |
| | $ | 23 |
| | $ | 298,405 |
| | (63 | ) | | $ | (1,469 | ) | | $ | 119,400 |
| | $ | 10,470 |
| | $ | 426,829 |
|
| Stock-based compensation | — |
| | — |
| | 7,037 |
| | — |
| | — |
| | — |
| | — |
| | 7,037 |
|
| Net shares issued under stock incentive plans | 147 |
| | — |
| | 1,891 |
| | 3 |
| | 82 |
| | — |
| | — |
| | 1,973 |
|
| Income tax liability from stock options, restricted stock and restricted stock units | — |
| | — |
| | (137 | ) | | — |
| | — |
| | — |
| | — |
| | (137 | ) |
| Net income | — |
| | — |
| | — |
| | — |
| | — |
| | 33,122 |
| | — |
| | 33,122 |
|
| Total other comprehensive loss, net | — |
| | — |
| | — |
| | — |
| | — |
| | — |
| | (1,541 | ) | | (1,541 | ) |
| At December 30, 2011 | 23,466 |
| | 23 |
| | 307,196 |
| | (60 | ) | | (1,387 | ) | | 152,522 |
| | 8,929 |
| | 467,283 |
|
| Stock-based compensation | — |
| | — |
| | 9,019 |
| | — |
| | — |
| | — |
| | — |
| | 9,019 |
|
| Net shares issued under stock incentive plans | 103 |
| | — |
| | 663 |
| | 1 |
| | 24 |
| | — |
| | — |
| | 687 |
|
| Income tax liability from stock options, restricted stock and restricted stock units | — |
| | — |
| | (141 | ) | | — |
| | — |
| | — |
| | — |
| | (141 | ) |
| Shares contributed to 401(k) Plan | 163 |
| | 1 |
| | 3,881 |
| | 39 |
| | 911 |
| | — |
| | — |
| | 4,793 |
|
| Net loss | — |
| | — |
| | — |
| | — |
| | — |
| | (4,799 | ) | | — |
| | (4,799 | ) |
| Total other comprehensive income, net | — |
| | — |
| | — |
| | — |
| | — |
| | — |
| | 4,018 |
| | 4,018 |
|
| At December 28, 2012 | 23,732 |
| | 24 |
| | 320,618 |
| | (20 | ) | | (452 | ) | | 147,723 |
| | 12,947 |
| | 480,860 |
|
| Stock-based compensation | — |
| | — |
| | 9,333 |
| | — |
| | — |
| | — |
| | — |
| | 9,333 |
|
| Net shares issued (acquired) under stock incentive plans | 636 |
| | — |
| | 12,245 |
| | (17 | ) | | (780 | ) | | — |
| | — |
| | 11,465 |
|
| Income tax benefit from stock options, restricted stock and restricted stock units | — |
| | — |
| | 242 |
| | — |
| | — |
| | — |
| | — |
| | 242 |
|
| Shares contributed to 401(k) Plan | 91 |
| | — |
| | 2,477 |
| | — |
| | — |
| | — |
| | — |
| | 2,477 |
|
| Net income | — |
| | — |
| | — |
| | — |
| | — |
| | 36,267 |
| | — |
| | 36,267 |
|
| Total other comprehensive income, net | — |
| | — |
| | — |
| | — |
| | — |
| | — |
| | 1,411 |
| | 1,411 |
|
| At January 3, 2014 | 24,459 |
| | $ | 24 |
| | $ | 344,915 |
| | (37 | ) | | $ | (1,232 | ) | | $ | 183,990 |
| | $ | 14,358 |
| | $ | 542,055 |
|
The accompanying notes are an integral part of these consolidated financial statements.
GREATBATCH, INC.INTEGER HOLDINGS CORPORATION
NOTES TO CONSOLIDATED FINANCIAL STATEMENTS
|
| | |
1. | | SUMMARY OF SIGNIFICANT ACCOUNTING POLICIES |
(1.)SUMMARY OF SIGNIFICANT ACCOUNTING POLICIES
Integer Holdings Corporation (together with its consolidated subsidiaries, “Integer” or the “Company”) is a publicly traded corporation listed on the New York Stock Exchange under the symbol “ITGR.” Integer is one of the largest medical device outsource manufacturers in the world serving the cardiac, neuromodulation, orthopedics, vascular, advanced surgical and portable medical markets. The Company provides innovative, high-quality medical technologies that enhance the lives of patients worldwide. In addition, it develops batteries for high-end niche applications in the energy, military, and environmental markets. The Company’s customers include large multi-national original equipment manufacturers (“OEMs”) and their affiliated subsidiaries.
On October 27, 2015, the Company acquired all of the outstanding common stock of Lake Region Medical Holdings, Inc. (“Lake Region Medical”). On March 14, 2016, the Company completed the spin-off of a portion of its former QiG segment through a tax-free distribution of all of the shares of its QiG Group, LLC subsidiary to the stockholders of Integer on a pro rata basis (the “Spin-off”). Refer to Note 2 “Divestiture and Acquisitions” for further details of these transactions.
Effective June 30, 2016, the Company changed its name from Greatbatch, Inc. (“Greatbatch”) to Integer Holdings Corporation. The new name represents the union of the Greatbatch Medical, Lake Region Medical and Electrochem brands. Integer, as in whole or complete, signifies the Company’s more comprehensive products and service offerings, and a new dimension in its combined capabilities.
Basis of Presentation and Principles of Consolidation – The consolidated financial statements have been prepared in conformity with accounting principles generally accepted in the United States of America (“GAAP”) and include the accounts of Greatbatch, Inc.Integer Holdings Corporation and its wholly owned subsidiary Greatbatch Ltd. (collectively, the “Company” or “Greatbatch”).subsidiaries. All intercompany balances and transactions have been eliminated in consolidation.
NatureSubsequent to the Lake Region Medical acquisition and Spin-off, the Company operated as three reportable segments: Greatbatch Medical, QiG Group (“QiG”), and Lake Region Medical. The determination of Operations – In connection withthree reportable segments was deemed to be temporary while the realignmentCompany reorganized its operations including its internal management and financial reporting structure. As a result of this reorganization, the Company reevaluated and revised its reportable business segments during the fourth quarter of 2016. The Company’s reportable segments are: (1) Medical, which includes the previously reported Lake Region Medical segment, the remaining operations of QiG, and the portion of the Company'spreviously reported Greatbatch Medical segment not included in the new Non-Medical segment; and (2) Non-Medical, which includes the Company’s Electrochem business, which was previously included in the Company’s Greatbatch Medical segment.
This segment structure reflects the financial information and reports used by the Company’s management, specifically its Chief Operating Decision Maker (“CODM”), to make decisions regarding the Company’s business, including resource allocations and performance assessments. This segment structure reflects the Company’s current operating structurefocus in 2013 to optimize profitable growth, which included changingcompliance with Accounting Standards Codification (“ASC”) 280, Segment Reporting. As a result of the Company's management andnew segment reporting structure, the Company reevaluated its operating and reporting segments. Beginning in the fourth quarter of 2013, the Company determined that it has two reportable segments: Greatbatch Medical and QiG Group (“QiG”). As required, the Company reclassified certain prior year amounts to conform them to the current year presentation. The revised segment structure and the related presentation including goodwill, segment operatingchanges did not impact consolidated net income (loss), segment depreciation and amortization, segmentearnings (loss) per share, total current assets, and sales categorizations. See Note 13 “Other Operating Expenses, Net” andtotal assets or total stockholders’ equity. Refer to Note 19, “Business Segment, Geographic and Concentration Risk Information”Information,” for further discussion on these changes. Greatbatch Medical designs and manufactures products where Greatbatch either ownsregarding the intellectual property or has unique manufacturing and assembly expertise and includesCompany’s reportable segments.
The Company’s results include the financial and operating results of QiG until the former ImplantableSpin-off on March 14, 2016. The Company’s results include the financial and operating results of Lake Region Medical since the date of acquisition on October 27, 2015. Results for periods prior to October 27, 2015 do not include the financial and Electrochem Solutions (“Electrochem”) segments, excluding QiG. These products include medical devices and components for the cardiac, neuromodulation, orthopaedics, portable medical, vascular and energy markets among others. The Greatbatch Medical segment also offers value-added assembly and design engineering services for medical devices that utilize its component products.
QiG focuses on developing medical device systems for someoperating results of healthcare’s most pressing challenges and reflects Greatbatch’s strategic evolution of its product offerings in order to raise the growth and profitability profile of the Company. Through the research and development professionals in QiG, the Company is now investing in three areas - new medical device systems commercialization, collaborative programs with OEM customers, and strategic equity positions in start-up companies - to grow a diversified and distinctive portfolio. These medical device systems developed by QiG are manufactured by GreatbatchLake Region Medical.
The Company's customers include large multi-national original equipment manufacturers (“OEMs”).
Fiscal Year End – The Company utilizes a fifty-two, fifty-three week fiscal year ending on the Friday nearest December 31st.31. Fiscal years 2013, 20122016, 2015 and 20112014 consisted of fifty-two weeks and ended on January 3, 2014, December 28, 2012 and December 30, 2011,2016, January 1, 2016 and January 2, 2015, respectively. Fiscal
Use of Estimates – The preparation of financial statements in conformity with GAAP requires management to make estimates and assumptions that affect the reported amounts of assets and liabilities and disclosure of contingent assets and liabilities at the date of the financial statements and reported amounts of sales and expenses during the reporting periods. Actual results could differ materially from those estimates.
Reclassifications–Certain prior period amounts have been reclassified to conform to the current segment structure. Refer to Note 19 “Business Segment, Geographic and Concentration Risk Information,” for a description of the changes made to reflect the current year 2013 contained fifty-three weeks. Fiscal years 2012segment presentation.
INTEGER HOLDINGS CORPORATION
NOTES TO CONSOLIDATED FINANCIAL STATEMENTS
(1.)SUMMARY OF SIGNIFICANT ACCOUNTING POLICIES (Continued)
Cash and 2011 each contained fifty-two weeks.Cash Equivalents – Cash and cash equivalents consist of cash and highly liquid, short-term investments with maturities at the time of purchase of three months or less.
Concentration of Credit Risk – Financial instruments that potentially subject the Company to concentration of credit risk consist principally of accounts receivable. A significant portion of the Company’s sales and/or accounts receivable are to four customers, all in the medical device industry, and, as such, the Company is directly affected by the condition of those customers and that industry. However, the credit risk associated with trade receivables is partially mitigated due to the stability of those customers. The Company performs on-going credit evaluations of its customers. Note 19 “Business Segment, Geographic and Concentration Risk Information” contains information on sales and accounts receivable for these customers. The Company maintains cash deposits with major banks, which from time to time may exceed insured limits. The Company performs on-going credit evaluations of its banks.
Trade Accounts Receivable and Allowance for Doubtful Accounts – The Company provides credit, in the normal course of business, to its customers in the form of trade receivables. Credit is extended based on evaluation of a customer’s financial condition and collateral is not required. The Company maintains an allowance for those customer receivables that it does not expect to collect. The Company accrues its estimated losses from uncollectable accounts receivable to the allowance based upon recent historical experience, the length of time the receivable has been outstanding and other specific information as it becomes available. Provisions to the allowance for doubtful accounts are charged to current operating expenses. Actual losses are charged against this allowance when incurred.
Inventories – Inventories are stated at the lower of cost, determined using the first-in first-out method, or market. Write-downs for excess, obsolete or expired inventory are based primarily on how long the inventory has been held as well as estimates of forecasted net sales of that product. A significant change in the timing or level of demand for products may result in recording additional write-downs for excess, obsolete or expired inventory in the future. Note 4 “Inventories” contains additional information on the Company’s inventory.
Property, Plant and Equipment (“PP&E”) – PP&E is carried at cost less accumulated depreciation. Depreciation is computed by the straight-line method over the estimated useful lives of the assets, as follows: buildings and building improvements 12-30 years; machinery and equipment 3-10 years; office equipment 3-10 years; and leasehold improvements over the remaining lives of the improvements or the lease term, if less. The cost of repairs and maintenance are expensed as incurred; renewals and betterments are capitalized. Upon retirement or sale of an asset, its cost and related accumulated depreciation or amortization is removed from the accounts and any gain or loss is recorded in operating income or expense. Note 6 “Property, Plant and Equipment, Net” contains additional information on the Company’s PP&E.
Fair Value Measurements – Fair value is defined as the price that would be received to sell an asset or paid to transfer a liability (i.e. the “exit price”) in an orderly transaction between market participants at the measurement date. Accounting Standards Codification (“ASC”)ASC820, Fair Value Measurements, establishes a hierarchy for inputs used in measuring fair value that maximizes the use of observable inputs and minimizes the use of unobservable inputs by requiring that the most observable inputs be used when available. Observable inputs are inputs that market participants would use in pricing the asset or liability developed based on market data obtained from sources independent of the Company. Unobservable inputs are inputs that reflect the Company’s assumptions about the assumptions market participants would use in pricing the asset or liability developed based on the best information available in the circumstances. The hierarchy is broken down into three levels based on the reliability of inputs as follows:
Level 1 —– Valuation is based on quoted prices in active markets for identical assets or liabilities that the Company has the ability to access. Level 1 valuations do not entail a significant degree of judgment.
Level 2 —– Valuation is determined from quoted prices for similar assets or liabilities in active markets, quoted prices for identical instruments in markets that are not active or by model-based techniques in which all significant inputs are observable in the market.
Level 3 —– Valuation is based on unobservable inputs that are significant to the overall fair value measurement. The degree of judgment in determining fair value is greatest for Level 3 valuations.
The availability of observable inputs can vary and is affected by a wide variety of factors, including, the type of asset/liability, whether the asset/liability is established in the marketplace, and other characteristics particular to the valuation. To the extent that a valuation is based on models or inputs that are less observable or unobservable in the market, the determination of fair value requires more judgment. In certain cases, the inputs used to measure fair value may fall into different levels of the fair value hierarchy. In such cases, for disclosure purposes the level in the fair value hierarchy within which the fair value measurement in its entirety falls is determined based on the lowest level input that is significant to the fair value measurement in its entirety.
GREATBATCH, INC.INTEGER HOLDINGS CORPORATION
NOTES TO CONSOLIDATED FINANCIAL STATEMENTS
(1.)SUMMARY OF SIGNIFICANT ACCOUNTING POLICIES (Continued)
Fair value is a market-based measure considered from the perspective of a market participant rather than an entity-specific measure. Therefore, even when market assumptions are not readily available, assumptions are required to reflect those that market participants would use in pricing the asset or liability at the measurement date. Note 18 “Fair Value Measurements” contains additional information on assets and liabilities recorded at fair value in the consolidated financial statements.
Cash and Cash Equivalents – Cash and cash equivalents consist of cash and highly liquid, short-term investments with maturities at the time of purchase of three months or less. The carrying amount of cash and cash equivalents approximated their fair value as of January 3, 2014 and December 28, 2012 based upon the short-term nature of these instruments.
Concentration of Credit Risk – Financial instruments that potentially subject the Company to concentration of credit risk consist principally of accounts receivable. A significant portion of the Company’s sales are to three customers, all in the medical device industry, and, as such, the Company is directly affected by the condition of those customers and that industry. However, the credit risk associated with trade receivables is partially mitigated due to the stability of those customers. The Company performs on-going credit evaluations of its customers. Note 19 “Business Segment, Geographic and Concentration Risk Information” contains information on sales and accounts receivable for these customers. The Company maintains cash deposits with major banks, which from time to time may exceed insured limits. The Company performs on-going credit evaluations of its banks.
Allowance for Doubtful Accounts – The Company provides credit, in the normal course of business, to its customers in the form of trade receivables. Credit is extended based on evaluation of a customer’s financial condition and collateral is not required. The Company maintains an allowance for those customer receivables that it does not expect to collect. The Company accrues its estimated losses from uncollectable accounts receivable to the allowance based upon recent historical experience, the length of time the receivable has been outstanding and other specific information as it becomes available. Provisions to the allowance for doubtful accounts are charged to current operating expenses. Actual losses are charged against this allowance when incurred. The carrying amount of trade receivables approximated their fair value as of January 3, 2014 based upon the short-term nature of these assets.
Inventories – Inventories are stated at the lower of cost, determined using the first-in first-out method, or market. Write-downs for excess, obsolete or expired inventory are based primarily on how long the inventory has been held as well as estimates of forecasted net sales of that product. A significant change in the timing or level of demand for products may result in recording additional write-downs for excess, obsolete or expired inventory in the future. Note 4 “Inventories” contains additional information on the Company’s inventory.
Property, Plant and Equipment (“PP&E”) – PP&E is carried at cost less accumulated depreciation. Depreciation is computed by the straight-line method over the estimated useful lives of the assets, as follows: buildings and building improvements 7-40 years; machinery and equipment 3-8 years; office equipment 3-10 years; and leasehold improvements over the remaining lives of the improvements or the lease term, if less. The cost of repairs and maintenance are expensed as incurred; renewals and betterments are capitalized. Upon retirement or sale of an asset, its cost and related accumulated depreciation or amortization is removed from the accounts and any gain or loss is recorded in operating income or expense. Note 6 “Property, Plant and Equipment, Net” contains additional information on the Company’s PP&E.
Business Combinations – The Company records its business combinations under the acquisition method of accounting. Under the acquisition method of accounting, the Company allocates the purchase price of each acquisition to the tangible and identifiable intangible assets acquired and liabilities assumed based on their respective fair values at the date of acquisition. The fair value of identifiable intangible assets is based upon detailed valuations that use various assumptions made by management. management using one of three valuation approaches: market, income or cost. The selection of a particular method for a given asset depends on the reliability of available data and the nature of the asset, among other considerations.
The market approach estimates the value for a subject asset based on available market pricing for comparable assets. The income approach estimates the value for a subject asset based on the present value of cash flows projected to be generated by the asset. The projected cash flows are discounted at a required rate of return that reflects the relative risk of the asset and the time value of money. The projected cash flows for each asset considers multiple factors from the perspective of a marketplace participant including revenue projections from existing customers, attrition trends, technology life-cycle assumptions, marginal tax rates and expected profit margins giving consideration to historical and expected margins. The cost approach estimates the value for a subject asset based on the cost to replace the asset and reflects the estimated reproduction or replacement cost for the asset, less an allowance for loss in value due to depreciation or obsolescence, with specific consideration given to economic obsolescence if indicated. These fair value measurement approaches are based on significant unobservable inputs, including management estimates and assumptions.
Any excess of the purchase price over the fair value of net tangible and identifiable intangible assets acquired is allocated to goodwill. All direct acquisition-related costs are expensed as incurred.
In circumstances where an acquisition involves a contingent consideration arrangement, the Company recognizes a liability equal to the fair value of the contingent payments it expects to make as of the acquisition date. The Company re-measures this liability each reporting period and records changes in the fair value through Other Operating Expenses, Net. Increases or decreases in the fair value of the contingent consideration liability can result from changes in discount periods and rates, as well as changes in the timing, amount of, or the likelihood of achieving the applicable contingent consideration. See Note 18 “Fair Value Measurements” for additional information. Note 2 “Acquisitions” contains additional information on the Company’s acquisitions.
Amortizing Intangible Assets – Amortizing intangible assets consists primarily of purchased technology and patents, and customer lists. The Company amortizes its definite-lived intangible assets over their estimated useful lives utilizing an accelerated or straight-line method of amortization, which approximates the projected distribution of cash flows used to fair value those intangible assets at the time of acquisition. When the straight-line method of amortization is utilized, the estimated useful life of the intangible asset is shortened to assure that recognition of amortization expense corresponds
GREATBATCH, INC.
NOTES TO CONSOLIDATED FINANCIAL STATEMENTS
with the distribution of expected cash flows. The amortization period for the Company’s amortizing intangible assets are as follows: purchased technology and patents 5-155-15 years; customer lists 7-207-20 years and other intangible assets 1-101-10 years. Refer to Note 7 “Intangible Assets” containsfor additional information on the Company’s amortizing intangible assets.
Impairment of Long-Lived Assets – The Company assesses the impairment of definite-lived long-lived assets or asset groups when events or changes in circumstances indicate that the carrying value may not be recoverable. Factors that are considered in deciding when to perform an impairment review include: a significant decrease in the market price of the asset or asset group; a significant change in the extent or manner in which a long-lived asset or asset group is being used or in its physical condition; a significant change in legal factors or in the business climate that could affect the value of a long-lived asset (asset group),or asset group, including an action or assessment by a regulator; an accumulation of costs significantly in excess of the amount originally expected for the acquisition or construction; a current-period operating or cash flow loss combined with a history of operating or cash flow losses or a projection or forecast that demonstrates continuing losses associated with the use of a long-lived asset or asset group; or a current expectation that, more likely than not, a long-lived asset or asset group will be sold or otherwise disposed of significantly before the end of its previously estimated useful life. The term more likely than not refers to a level of likelihood that is more than 50 percent.percent.
Potential recoverability is measured by comparing the carrying amount of the asset or asset group to its related total future undiscounted cash flows. If the carrying value is not recoverable, the asset or asset group is considered to be impaired. Impairment is measured by comparing the asset or asset group’s carrying amount to its fair value. When it is determined that useful lives of assets are shorter than originally estimated, and no impairment is present, the rate of depreciation is accelerated in order to fully depreciate the assets over their new shorter useful lives.
INTEGER HOLDINGS CORPORATION
NOTES TO CONSOLIDATED FINANCIAL STATEMENTS
(1.)SUMMARY OF SIGNIFICANT ACCOUNTING POLICIES (Continued)
Goodwill and other indefinite lived intangible assets recorded are not amortized but are periodically tested for impairment. The Company assesses goodwill for impairment by comparing the fair value of its reporting units to their carrying amounts on the last day of each fiscal year, or more frequently if certain events occur as described above. Goodwill is evaluated for impairment through the comparison of the fair value of the reporting units to their carrying values. When evaluating goodwill for impairment, the Company may first perform an assessment of qualitative factors to determine if the fair value of the reporting unit is more-likely-than-not greater than its carrying amount. This qualitative assessment is referred to as a “step zero” approach. If, based on the review of the qualitative factors, the Company determines it is more-likely-than-not that the fair value of the reporting unit is greater than its carrying value, the required two-step impairment test can be bypassed. If the Company does not perform a step zero assessment or if the fair value of the reporting unit is more-likely-than-not less than its carrying value, the Company must perform a two-step impairment test, and calculate the estimated fair value of the reporting unit. If, based upon the two-step impairment test, it is determined that the fair value of a reporting unit is less than its carrying value, an impairment loss is recorded to the extent that the implied fair value of the goodwill within the reporting unit is less than its carrying value. FairUnder the two-step approach, fair values for reporting units are determined based on a combination of discounted cash flows and market multiples.
Other indefinite lived intangible assets are assessed for impairment on the last day of each fiscal year, or more frequently if certain events occur as described above, by comparing the fair value of the intangible asset to its carrying value. The fair value is determined by using the income approach. Note 7 “Intangible Assets” contains additional information on the Company’s long-lived intangible assets.
Other Long-Term AssetsCost and Equity Method Investments – Other long-term assets includes deferred financing fees incurred in connection withCertain of the Company’s issuance of its convertible subordinated notes and credit facility. These fees are amortized to Interest Expense using the effective interest method over the period from the date of issuance to the put option date (if applicable) or the maturity date, whichever is earlier. The amortization of deferred fees is included in Debt Related Amortization Included in Interest Expense in the Consolidated Statements of Cash Flows. Note 9 “Debt” contains additional information on the Company’s deferred financing fees.
Other long-term assets also include investments in equity and other securities of entitiesare long-term, strategic investments in companies that are not publicly traded and which do not have readily determinable fair values. We accountin varied stages of development. These investments are included in Other Assets on the Consolidated Balance Sheets. The Company accounts for investments in these entities under the cost or equity method depending on the type of ownership interest, as well as the Company’s ability to exercise influence over these entities. EquityInvestments accounted for under the cost method investments are initially recorded at the amount of the Company’s investment and carried at that cost until a security is deemed impaired or is sold. Equity securities accounted for under the equity method are initially recorded at the amount of the Company’s investment and are subsequently adjusted to reflecteach period for the Company’s share of earningsthe investee’s income or losses ofloss and dividends paid.
Equity securities accounted for under both the investee. Cost method investments are recorded at cost. Each reporting period, management evaluates these cost and equity method investments to determine if theremethods are anyreviewed quarterly for changes in circumstance or the occurrence of events or circumstances that are likely to have a significant effect onsuggest the fair value of the investment.Company’s investment may not be recoverable. Examples of such impairment indicators include, but are not limited to: a recent sale or offering of similar shares of the investment at a price below the Company’s cost basis; a significant deterioration in earnings performance; a significant change in the regulatory, economic or technological environment of the investee; or a significant doubt about an investee’s ability to continue as a going concern. If an impairment indicator is identified, management will estimate the fair value of the investment and compare it to its carrying value. The estimation of fair value considers all available financial information related to the investee, including, but not limited to, valuations based on recent third-party equity investments in the investee. If the fair value of the investment is less than its carrying value, the investment is impaired and a determination as to whether the impairment is other-than-temporary is made. Impairment is deemed to be other-than-temporary unless the Company has the ability and intent to hold the investment for a period sufficient for a market recovery up to the carrying value of the investment. Further, evidence must indicate that the carrying value of the investment is recoverable within a reasonable period. For other-than-temporary impairments, an impairment loss is recognized equal to the difference between the investment’s carrying value and its fair value. value and is recognized in Other Income, Net in the Consolidated Statements of Operations and Comprehensive Income (Loss) in the period the determination is made.
The Company has determined that these investments are not considered variable interest entities. The Company’s exposure related to these entities is limited to its recorded investment. These investments are in
GREATBATCH, INC.
NOTES TO CONSOLIDATED FINANCIAL STATEMENTS
start-up research and development companies whose fair value is highly subjective in nature and subject to future fluctuations, which could be significant. Refer to Note 18 “Fair Value Measurements” for further discussion of the Company’s Cost and Equity Method Investments.
Debt Issuance Costs and Discounts – Debt issuance costs and discounts associated with the issuance of debt by the Company are deferred and amortized over the lives of the related debt. Debt issuance costs incurred in connection with the Company’s issuance of its revolving credit facility are classified within Other Assets and amortized to Interest Expense on a straight-line basis over the contractual term of the credit facility. Debt issuance costs and discounts related to the Company’s term-debt are recorded as a reduction of the carrying value of the related debt and are amortized to Interest Expense using the effective interest method over the period from the date of issuance to the put option date (if applicable) or the maturity date, whichever is earlier. The amortization of debt issuance costs and discounts are included in Debt Related Charges Included in Interest Expense in the Consolidated Statements of Cash Flows. Upon prepayment of the related debt, the Company accelerates the recognition of an appropriate amount of the costs as refinancing or extinguishment of debt. Note 9 “Debt” contains additional information on the Company’s debt issuance costs and discounts.
INTEGER HOLDINGS CORPORATION
NOTES TO CONSOLIDATED FINANCIAL STATEMENTS
(1.)SUMMARY OF SIGNIFICANT ACCOUNTING POLICIES (Continued)
Income Taxes – The consolidated financial statements of the Company have been prepared using the asset and liability approach in accounting for income taxes, which requires the recognition of deferred income taxes for the expected future tax consequences of net operating losses, credits, and temporary differences between the financial statement carrying amounts and the tax bases of assets and liabilities. A valuation allowance is provided on deferred tax assets if it is determined, within each taxing jurisdiction, that it is more likely than not that the asset will not be realized.
The Company accounts for uncertain tax positions using a more likely than not recognition threshold. The evaluation of uncertain tax positions is based on factors including, but not limited to, changes in tax law, the measurement of tax positions taken or expected to be taken in tax returns, the effective settlement of matters subject to audit, new audit activity and changes in facts or circumstances related to a tax position. These tax positions are evaluated on a quarterly basis. The Company recognizes interest expense related to uncertain tax positions as Provision (Benefit) for Income Taxes. Penalties, if incurred, are recognized as a component of Selling, General and Administrative Expenses (“SG&A”).
The Company and its subsidiarysubsidiaries file a consolidated U.S. federal income tax return. State tax returns are filed on a combined or separate basis depending on the applicable laws in the jurisdictions where the tax returns are filed. The Company also files foreign tax returns on a separate company basis in the countries in which it operates. See Note 14 “Income Taxes” for additional information.
Convertible Subordinated Notes (“CSN”) – For convertible debt instruments that may be settled in cash upon conversion, the Company accounts for the liability and equity components of those instruments in a manner that will reflect the entity’s nonconvertible debt borrowing rate when interest cost is recognized in subsequent periods.
Upon issuance, the Company determined the carrying amount of the liability component of CSN by measuring the fair value of a similar liability that does not have the associated conversion option. The carrying amount of the conversion option was then determined by deducting the fair value of the liability component from the initial proceeds received from the issuance of CSN.
The carrying amount of the conversion option was recorded in Additional Paid-In Capital with an offset to Long-Term Debt and was amortized using the effective interest method over the period from the date of issuance to the maturity date. Deferred financing fees incurred in connection with the issuance of CSN, were allocated proportionally to the proceeds of the liability and equity components. The deferred financing fees allocated to the debt component were amortized using the effective interest method over the period from the date of issuance to the maturity date. The deferred financing fees allocated to the equity component were recorded as an offset to Additional Paid-In Capital. The amortization of discount and deferred fees related to the Company’s convertible debt instruments is included in Debt Related Amortization Included in Interest Expense in the Consolidated Statements of Cash Flows. See Note 9 “Debt” for additional information.
Derivative Financial Instruments – The Company recognizes all derivative financial instruments in its consolidated financial statements at fair value. Changes in the fair value of derivative instruments are recorded in earnings unless hedge accounting criteria are met. The Company designatesdesignated its interest rate swap (Seeswaps (Refer to Note 9 “Debt”) and foreign currency contracts (See(Refer to Note 15 “Commitments and Contingencies”) entered into as cash flow hedges. The effective portion of the changes in fair value of these cash flow hedges is recorded each period, net of tax, in Accumulated Other Comprehensive Income (Loss) until the related hedged transaction occurs. Any ineffective portion of the changes in fair value of these cash flow hedges is recorded in earnings. In the event the hedged cash flow for forecasted transactions does not occur, or it becomes probable that they will not occur, the Company would reclassifyreclassifies the amount of any gain or loss on the related cash flow hedge to income (expense) at that time. Cash flows related to these derivative financial instruments are included in cash flows from operating activities. The cash flows from the termination of interest rate swap agreements are reported as operating activities in the consolidated statements of cash flows.
Revenue Recognition – The Company recognizes revenue when it is realized or realizable and earned. This occurs when persuasive evidence of an arrangement exists, delivery has occurred, the price is fixed or determinable (including any price concessions under long-term agreements), the buyer is obligated to pay us (i.e., not contingent on a future event), the risk of loss is transferred, there is no obligation of future performance, collectability is reasonably assured and the amount of future returns can reasonably be estimated. With regards to the Company’s customers (including distributors), those criteria are met when title passes, generally at the timepoint of shipment when title passes.shipment. Currently, the revenue recognition policy is the same for the Company’s Medical and Non-Medical segments. In general, for customers with long-term contracts, we have negotiated fixed pricing arrangements. During new contract negotiations, price level decreases (concessions) for future sales may be offered to customers in exchange for volume and/or long-term commitments. Once the new contracts are signed, these prices are fixed and determinable for all future sales. The Company includes shipping and handling fees billed to customers in Sales. Shipping and handling costs associated with inbound and outbound freight are recorded in Cost of Sales. In certain instances the Company obtains component parts for sub-assemblies from its customers that are included in the final product sold back to the same customer. These amounts are excluded from Sales and Cost of Sales recognized by the Company. The cost of these customer supplied component parts amounted to $45.3$35.8 million,, $32.6 $44.3 million and $27.9$48.1 million in 2013, 2012fiscal years 2016, 2015 and 2011,2014, respectively.
- 61 -Environmental Costs – Environmental expenditures that relate to an existing condition caused by past operations and that do not provide future benefits are expensed as incurred. Liabilities are recorded when environmental assessments are made, the requirement for remedial efforts is probable and the amount of the liability can be reasonably estimated. Liabilities are recorded generally no later than the completion of feasibility studies. The Company has an ongoing monitoring and identification process to assess how the activities, with respect to known exposures, are progressing against the recorded liabilities, as well as to identify other potential remediation sites that are presently unknown.
GREATBATCH, INC.INTEGER HOLDINGS CORPORATION
NOTES TO CONSOLIDATED FINANCIAL STATEMENTS
(1.)SUMMARY OF SIGNIFICANT ACCOUNTING POLICIES (Continued)
Restructuring –The Company continually evaluates alternatives to align the business with the changing needs of its customers and to lower operating costs. This includes the realignment of its existing manufacturing capacity, facility closures, or similar actions, either in the normal course of business or pursuant to significant restructuring programs. These actions may result in employees receiving voluntary or involuntary employee termination benefits, which may be pursuant to contractual agreements. Voluntary termination benefits are accrued when an employee accepts the related offer. Involuntary termination benefits are accrued upon the commitment to a termination plan and the benefit arrangement is communicated to affected employees, or when liabilities are determined to be probable and estimable, depending on the existence of a substantive plan for severance or termination. All other exit costs are expensed as incurred. Refer to Note 13 “Other Operating Expenses, Net” for additional information.
Product Warranties – The Company allows customers to return defective or damaged products for credit, replacement, or exchange.repair. The Company warrants that its products will meet customer specifications and will be free from defects in materials and workmanship. The Company accrues its estimated exposure to warranty claims, through Cost of Sales, based upon recent historical experience and other specific information as it becomes available. Note 15 “Commitments and Contingencies” contains additional information on the Company’s product warranties.
Research, Development and Engineering Costs, Net (“RD&E”) – RD&E costs are expensed as incurred. The primary costs are salary and benefits for personnel, material costs used in development projects and subcontracting costs. Cost reimbursements for certain engineering services from customers for whom the Company designs products are recorded as an offset to engineering costs upon achieving development milestones specified in the contracts. These reimbursements do not cover the complete cost of the development projects. Additionally, the technology developed under these cost reimbursement projects is owned by the Company and is utilized for future products developed for other customers.
In-process research and development (“IPR&D”) represents research projects acquired in a business combination which are expected to generate cash flows but have not yet reached technological feasibility. The primary basis for determining the technological feasibility of these projects is whether or not regulatory approval has been obtained. The Company classifies IPR&D acquired in a business combination as an indefinite-lived intangible asset until the completion or abandonment of the associated projects. Upon completion, the Company would determine the useful life of the IPR&D and begin amortizing the assets to reflect their use over their remaining lives. Upon permanent abandonment, the remaining carrying amount of the associated IPR&D would be written-off. The Company tests the IPR&D acquired for impairment at least annually, and more frequently if events or changes in circumstances indicate that the assets may be impaired. The impairment test consists of a comparison of the fair value of the intangible assets with their carrying amount. If the carrying amount exceeds its fair value, the Company would record an impairment loss in an amount equal to the excess.
Note 12 “Research, Development and Engineering Costs, Net” and Note 7 “Intangible Assets” contains additional information on the Company’s RD&E activities.
Stock-Based Compensation – The Company recordsrecognizes stock-based compensation costsexpense for its related to stock-based awards granted to employees based upon their estimatedcompensation plans, which include stock options, restricted stock units and restricted stock awards. The fair value onof the stock-based compensation is determined at the grant date. Compensation cost for service-based awards is recognized ratably over the applicable vesting period. Compensation cost for nonmarket-based performance awards is reassessed each period and recognized based upon the probability that the performance targets will be achieved. Compensation cost for market-based performance awards is expensed ratably over the applicable vesting period and is recognized each period whether the performance metrics are achieved or not.
The amount of stock-based compensation expense recognized is based on the portion of the awards that are ultimately expected to vest. The Company utilizesestimates pre-vesting forfeitures at the time of grant by analyzing historical data and revises those estimates in subsequent periods if actual forfeitures differ from those estimates. The total expense recognized over the vesting period will only be for those awards that ultimately vest, excluding market and nonmarket performance award considerations.
All stock option awards granted under the Company’s compensation plans have an exercise price equal to the closing stock price on the date of grant, a ten-year contractual life and generally, vest annually over a three-year vesting term. The Company uses the Black-Scholes standard option pricing model (“Black-Scholes model”) to estimatedetermine the fair value of stock options granted.options. In addition to the closing stock price on the date of grant, the determination of the fair value of the awards using the Black-Scholes model is also affected by other assumptions, including projected employee stock option exercise behaviors, risk-free interest rates, expected volatility of the Company's stock price in future periods and expected dividend yield, discussed in further detail:
Expected Term - The Company analyzes historical employee exercise and termination data to estimate the expected term assumption.
Risk-free Interest Rate - The rate is based on the U.S. Treasury yield curve in effect on the grant date for a maturity equal to or approximating the expected term of the options.
Expected Volatility - The Company calculates expected volatility using historical volatility based on the daily closing prices of the Company's common stock over a period equal to the expected term of the option.
Dividend Yield - The Company's dividend yield assumption is based on the Company’s history and the expected annual dividend yield on the grant date.
Restricted stock unit awards granted under the Company’s plans typically vest in equal annual installments over a three or four year period. Restricted stock awards are typically issued to members of the Company’s Board of Directors as a portion of their annual retainer and vest quarterly over a one-year vesting term. For service-based and nonmarket-based performance restricted stock and restricted stock unit awards, the fair market value of the award is determined based upon the closing value of the Company’s stock price on the grant date. For market-based performance restricted stock unit awards, the fair market value of the award is determined utilizing a Monte Carlo simulation model, which projects the value of the Company’s stock under numerous scenarios and determines the value of the award based upon the present value of those projected outcomes.
INTEGER HOLDINGS CORPORATION
NOTES TO CONSOLIDATED FINANCIAL STATEMENTS
(1.) SUMMARY OF SIGNIFICANT ACCOUNTING POLICIES (Continued)
The Company records deferred tax assets for awards that result in deductions on the Company's income tax returns, based on the amount of stock-based compensation expense recognized is basedand the statutory tax rate in the jurisdiction in which it will receive a deduction. Differences between the deferred tax assets recognized for financial reporting purposes and the actual tax deduction reported on the portionincome tax return are recorded in additional paid-in capital (if the tax deduction exceeds the deferred tax asset) or in the Consolidated Statements of Operations and Comprehensive Income (Loss) (if the awards that are ultimately expected to vest. The Company estimates pre-vesting forfeitures atdeferred tax asset exceeds the time of grant by analyzing historical datatax deduction and revises those estimates in subsequent periods if actual forfeitures differno additional paid-in capital exists from those estimates. The total expense recognized over the vesting period will only be for those awards that ultimately vest, excluding market and nonmarket performance award considerations.previous awards). Note 11 “Stock-Based Compensation” contains additional information on the Company’s stock-based compensation.
Foreign Currency Translation and Remeasurement – The Company translates all assets and liabilities of its foreign subsidiaries, where the U.S. dollar is not the functional currency, at the period-end exchange rate and translates income and expenses at the average exchange rates in effect during the period. The net effect of this translation is recorded in the consolidated financial statements as Accumulated Other Comprehensive Income.Income (Loss). Translation adjustments are not adjusted for income taxes as they relate to permanent investments in the Company’s foreign subsidiaries.
The Company has foreign operations in Ireland, Germany, France, Switzerland, Mexico, Uruguay, and Malaysia, which expose the Company to foreign currency exchange rate fluctuations due to transactions denominated in Euros, Swiss francs, Mexican pesos, Uruguayan pesos, and Malaysian ringgits. To the extent that monetary assets and liabilities, including short-term and long-term intercompany loans, are recorded in a currency other than the functional currency of the subsidiary, these amounts are remeasured each period at the period-end exchange rate, with the resulting gain or loss being recorded in Other Income, Net in the Consolidated Statements of Operations and Comprehensive Income (Loss). Net foreign currency transaction gains and losses are included in Other Expense,Income, Net and amounted to a loss$4.9 million for 2016, and $1.3 million for 2015 and 2014 and primarily related to the remeasurement of $0.1 million for 2013, a lossintercompany loans and the strengthening of $0.3 million for 2012 and a loss of $0.1 million for 2011.the U.S. dollar relative to the Euro.
Defined Benefit Plans – The Company recognizes in its balance sheet as an asset or liability the overfunded or underfunded status of its defined benefit plans provided to its employees located in Mexico, Switzerland, France and France.Germany. This asset or liability is measured as the difference between the fair value of plan assets, if any, and the benefit obligation of those plans. For these plans, the benefit obligation is the projected benefit obligation, which is calculated based on actuarial computations of current and future benefits for employees. Actuarial gains or losses and prior service costs or credits that
GREATBATCH, INC.
NOTES TO CONSOLIDATED FINANCIAL STATEMENTS
arise during the period, but are not included as components of net periodic benefit expense, are recognized as a component of Accumulated Other Comprehensive Income.Income (Loss). Defined benefit expenses are charged to Cost of Sales, SG&A and RD&E expenses as applicable. Note 10 “Defined Benefit“Benefit Plans” contains additional information on these costs.
Earnings (Loss) Per Share (“EPS”) – Basic EPS is calculated by dividing Net Income (Loss) by the weighted average number of shares outstanding during the period. Diluted EPS is calculated by adjusting the weighted average number of shares outstanding for potential common shares whichif dilutive to the EPS calculation and consist of stock options, unvested restricted stock and restricted stock units and, if applicable, contingently convertible instruments such as convertible debt. Note 16 “Earnings (Loss) Per Share” contains additional information on the computation of the Company’s EPS.
Comprehensive Income (Loss) – The Company’s comprehensive income (loss) as reported in the Consolidated Statements of Operations and Comprehensive Income (Loss) includes net income (loss), foreign currency translation adjustments, the net change in cash flow hedges, and defined benefit plan liability adjustments. The Consolidated Statements of Operations and Comprehensive Income (Loss) and Note 17 “Accumulated Other Comprehensive Income”Income (Loss)” contains additional information on the computation of the Company’s comprehensive income (loss).
Use of Estimates – The preparation of financial statements in conformity with accounting principles generally accepted in the United States of America requires management to make estimates and assumptions that affect the reported amounts of assets and liabilities and disclosure of contingent assets and liabilities at the date of the financial statements and reported amounts of sales and expenses during the reporting period. Actual results could differ materially from those estimates.
Recently IssuedRecent Accounting Pronouncements– In the normal course of business, management evaluates all new accounting pronouncements issued by the Financial Accounting Standards Board (“FASB”), Securities and Exchange Commission (“SEC”), Emerging Issues Task Force (“EITF”), American Institute of Certified Public Accountants (“AICPA”) or other authoritative accounting bodies to determine the potential impact they may have on the Company’s Consolidated Financial Statements. Based upon this review, except as noted below, management does not expect any of the recently issued accounting pronouncements, which have not already been adopted, to have a material impact on the Company’s Consolidated Financial Statements.
INTEGER HOLDINGS CORPORATION
NOTES TO CONSOLIDATED FINANCIAL STATEMENTS
(1.)SUMMARY OF SIGNIFICANT ACCOUNTING POLICIES (Continued)
Recently Adopted
In February 2013,August 2014, the FASB issued Accounting Standards Update (“ASU”) 2013-02, “Comprehensive Income (Topic 220): Reporting2014-15, “Presentation of Amounts Reclassified OutFinancial Statements - Going Concern (Subtopic 205-40) - Disclosure of Accumulated Other Comprehensive Income.Uncertainties about an Entity’s Ability to Continue as a Going Concern,” Thiswhich requires the Company to assess their ability to continue as a going concern each interim and annual reporting period. Certain disclosures are required if there is substantial doubt about the Company’s ability to continue as a going concern, including management’s plan to alleviate any such substantial doubt. ASU added new disclosure requirements regarding the effect of significant amounts reclassified from each component of accumulated other comprehensive income (“AOCI”) based on its source2014-15 is effective for annual periods ending after December 15, 2016, and the income statement line items affected by the reclassification. Thisinterim periods thereafter. The Company adopted this ASU gave companies the flexibility to present the information either in the notesfourth quarter of 2016, which did not impact the Consolidated Financial Statements or parenthetically on the facedisclosures therein.
Not Yet Adopted
In January 2017, the FASB issued ASU 2017-04, “Simplifying the Test for Goodwill Impairment (Topic 350)” to simplify the accounting for goodwill impairment. The guidance removes Step 2 of the financial statements providedgoodwill impairment test. A goodwill impairment will now be measured as the amount by which a reporting unit’s carrying value exceeds its fair value, limited to the amount of goodwill allocated to that all of the required informationreporting unit. ASU 2017-04 is presented in a single location. This ASU was effective prospectively for annualinterim and interim reportingannual periods beginning after December 15, 2012. This ASU was2019, with early adoption permitted for any impairment tests performed after January 1, 2017. The Company adopted the new guidance on a prospective basis during the first quarter of 2013 and did not have a material impact on the Company’s Consolidated Financial Statements as it only changed the disclosures surrounding AOCI.
In July 2012, the FASB issued ASU No. 2012-02, “Intangibles-Goodwill and Other (Topic 350): Testing Indefinite-Lived Intangible Assets for Impairment.” This ASU simplified the guidance for testing the decline in the realizable value (impairment)2017. The adoption of indefinite-lived intangible assets other than goodwill. The amendment allowed an organization the option to first assess qualitative factors to determine whether it is necessary to perform the quantitative impairment test. An organization electing to perform a qualitative assessment is no longer required to calculate the fair value of an indefinite-lived intangible asset unless the organization determines, based on a qualitative assessment, that it is “more likely than not” that the asset is impaired. The amendments in this ASU were effective for annual and interim impairment tests performed for fiscal years beginning after September 15, 2012. This ASU did not have a material impact on the Company’s Consolidated Financial Statements as it only impacted the timing of when the Company was required to perform the two-step impairment test of its indefinite-lived intangible assets other than goodwill.Statements.
In December 2011,January 2017, the FASB issued ASU No. 2011-11 “Balance Sheet2017-01, “Business Combinations (Topic 210)805): Disclosures about OffsettingClarifying the Definition of a Business,” which outlines new minimum requirements for a set of assets to be considered a business. The intent of this ASU is to sharpen the distinction between the purchase or disposal of a business versus the purchase or disposal of assets. ASU 2017-01 is effective for the Company in the first quarter of 2018, with early adoption permitted, and prospective application required. The Company does not believe the adoption of this guidance will have a material impact on its Consolidated Financial Statements.
In October 2016, the FASB issued ASU 2016-16, “Income Taxes (Topic 740): Intra-entity Transfers of Assets and Liabilities.Other Than Inventory,” which requires entities to recognize the income tax consequences of intra-entity transfers of assets other than inventory when the transfers occur. This ASU requires companiesis effective for the Company for fiscal years beginning after December 15, 2017, including interim periods within those fiscal years. The Company is currently evaluating the impact the adoption of this ASU will have on its Consolidated Financial Statements.
In August 2016, the FASB issued ASU 2016-15 “Statement of Cash Flows (Topic 230): Classification of Certain Cash Receipts and Cash Payments: A Consensus of the FASB Emerging Issues Task Force.” ASU 2016-15 makes targeted changes to provide expanded disclosures about tradinghow cash receipts and cash payments are presented in financialthe statement of cash flows. The areas specifically addressed include debt prepayment and debt extinguishment costs, the settlement of zero-coupon debt instruments, contingent consideration payments made after a business combination, proceeds from the settlement of insurance claims, cash premiums paid for and related derivatives,proceeds from corporate-owned life insurance policies, distributions received from equity method investees and creates new disclosure requirements aboutcash receipts from payments on transferor’s beneficial interest on securitized trade receivables. Additionally, the amendment states that, in the absence of other prevailing guidance, cash receipts and payments that have characteristics of more than one class of cash flows should have each separately identifiable source or use of cash presented within the most predominant class of cash flows based on the nature of the underlying cash flows. These amendments are effective for the Company in annual and interim reporting periods beginning after December 15, 2017, with early adoption permitted. The Company is currently evaluating this ASU, but does not believe the adoption of this guidance will have a material impact on its Consolidated Financial Statements.
In June 2016, the FASB issued ASU 2016-13, “Financial Instruments - Credit Losses (Topic 326): Measurement of Credit Losses on Financial Instruments,” which amends the guidance on reporting credit losses for assets held at amortized cost and available-for-sale debt securities. For assets held at amortized cost, the ASU eliminates the probable initial recognition threshold and requires an entity’s rightsentity to reflect a current estimate of offsetall expected credit losses, such that the net amount expected to be collected is presented. For available-for-sale debt securities, the ASU requires credit losses to be presented as an allowance versus a write-down. These amendments are effective for the Company in annual and related arrangements associatedinterim reporting periods beginning after December 15, 2019, with early adoption permitted in annual and interim reporting periods beginning after December 15, 2018. The Company is currently evaluating the impact that the adoption of this ASU will have on its financial instrumentsConsolidated Financial Statements.
INTEGER HOLDINGS CORPORATION
NOTES TO CONSOLIDATED FINANCIAL STATEMENTS
(1.)SUMMARY OF SIGNIFICANT ACCOUNTING POLICIES (Continued)
In March 2016, the FASB issued ASU 2016-09, “Compensation-Stock Compensation (Topic 718): Improvements to Employee Share-Based Payment Accounting.” ASU 2016-09 changes how companies account for certain aspects of share-based payment awards to employees, including the accounting for income taxes, forfeitures and derivative instruments.statutory tax withholding requirements, as well as classification in the statement of cash flows. The disclosure requirements arenew standard is effective for annual reporting periods beginning on or after January 1, 2013,December 15, 2016, and interim periods therein,within those years, with early adoption permitted. The standard requires an entity to recognize all excess tax benefits and tax deficiencies as income tax benefit or expense in the income statement as discrete items in the reporting period in which they occur, and such tax benefits and tax deficiencies are not included in the estimate of an entity’s annual effective tax rate, applied on a prospective basis. Further, the standard eliminates the requirement to defer the recognition of excess tax benefits until the benefit is realized through a reduction to taxes payable. All excess tax benefits previously unrecognized, along with any valuation allowance, should be recognized on a modified retrospective application required. Thisbasis as a cumulative adjustment to retained earnings as of the date of adoption. Under ASU did2016-09, an entity that applies the treasury stock method in calculating diluted earnings per share is required to exclude excess tax benefits and deficiencies from the calculation of assumed proceeds since such amounts are recognized in the income statement. Excess tax benefits should also be classified as operating activities in the same manner as other cash flows related to income taxes on the statement of cash flows, as such excess tax benefits no longer represent financing activities since they are recognized in the income statement, and should be applied prospectively or retrospectively to all periods presented. The Company intends to adopt this guidance in the first quarter of fiscal year 2017. The new standard will result in the recognition of excess tax benefits in the Provision (Benefit) for Income Taxes rather than Additional Paid-In Capital, prospectively, which is expected to increase volatility in the Company’s results of operations. The Company intends to apply the presentation requirements for cash flows related to excess tax benefits on a prospective basis. ASU 2016-09 also allows an entity to elect as an accounting policy either to continue to estimate the total number of awards for which the requisite service period will not be rendered or to account for forfeitures for service based awards as they occur. An entity that elects to account for forfeitures as they occur should apply the accounting change on a modified retrospective basis as a cumulative effect adjustment to retained earnings as of the date of adoption. The Company intends to account for forfeitures as they occur. The adoption of this ASU is not expected to have a material impact on the Company’s Consolidated Financial Statements as it only changesStatements.
In February 2016, the disclosures surroundingFASB issued ASU 2016-02, “Leases (Topic 842),” which requires companies to recognize a lease liability that represents the Company’s offsettingdiscounted obligation to make future minimum lease payments, and a corresponding right-of-use asset on the balance sheet for most leases. This ASU retains a distinction between finance leases and operating leases, and the classification criteria for distinguishing between finance leases and operating leases are substantially similar to the classification criteria for distinguishing between capital leases and operating leases in the current accounting literature. The result of retaining a distinction between finance leases and operating leases is that under the lessee accounting model in Topic 842, the effect of leases in a consolidated statement of comprehensive income and a consolidated statement of cash flows is largely unchanged from previous GAAP. The amendments in this ASU are effective for fiscal years beginning after December 15, 2018, including interim periods within those fiscal years, and are required to be applied on a modified retrospective basis. Earlier application is permitted. The Company expects the adoption of ASU 2016-02 will result in a material increase in the assets and liabilities.liabilities on its Consolidated Balance Sheets. The Company is currently evaluating the impact that the adoption of this ASU will have on its Consolidated Statements of Operations and Other Comprehensive Income (Loss).
In January 2016, the FASB issued ASU 2016-01, “Financial Instruments - 63 -Overall (Subtopic 825-10): Recognition and Measurement of Financial Assets and Financial Liabilities.” This ASU requires equity investments (except those accounted for under the equity method of accounting, or those that result in consolidation of the investee) to be measured at fair value with changes in fair value recognized in net income; requires entities to use the exit price notion when measuring the fair value of financial instruments for disclosure purposes; requires separate presentation of financial assets and financial liabilities by measurement category and form of financial asset and requires entities to present separately in other comprehensive income the portion of the total change in the fair value of a liability resulting from a change in the instrument-specific credit risk (also referred to as “own credit”) when the organization has elected to measure the liability at fair value in accordance with the fair value option. The new ASU is effective for public companies for fiscal years beginning after December 15, 2017. Early adoption of the own credit provision is permitted. The Company is currently evaluating the impact that the adoption of this ASU will have on its Consolidated Financial Statements.
GREATBATCH, INC.INTEGER HOLDINGS CORPORATION
NOTES TO CONSOLIDATED FINANCIAL STATEMENTS
(1.)SUMMARY OF SIGNIFICANT ACCOUNTING POLICIES (Continued)
In July 2015, the FASB issued ASU 2015-11, “Simplifying the Measurement of Inventory,” which simplifies the subsequent measurement of inventory by requiring inventory to be measured at the lower of cost and net realizable value. Net realizable value is the estimated selling prices in the ordinary course of business, less reasonably predictable costs of completion, disposal, and transportation. This ASU is effective for public business entities for fiscal years beginning after December 15, 2016, and interim periods within those fiscal years. The Company intends to adopt this guidance in the first quarter of fiscal year 2017 on a prospective basis and is currently assessing the impact of adopting this ASU on its Consolidated Financial Statements.
In May 2014, the FASB issued ASU 2014-09, “Revenue from Contracts with Customers.” The core principle behind ASU 2014-09 is that an entity should recognize revenue in an amount that reflects the consideration to which the entity expects to be entitled in exchange for delivering goods and services. This model involves a five-step process that includes identifying the contract with the customer, identifying the performance obligations in the contract, determining the transaction price, allocating the transaction price to the performance obligations in the contract and recognizing revenue when the entity satisfies the performance obligations. This ASU allows two methods of adoption; (1) a full retrospective approach where historical financial information is presented in accordance with the new standard, and (2) a modified retrospective approach where this ASU is applied to the most current period presented in the financial statements. Additionally, the guidance requires enhanced disclosures, including revenue recognition policies to identify performance obligations to customers and significant judgments in measurement and recognition. In August 2015, the FASB issued ASU No 2015-14 which deferred the effective date of ASU 2014-09 to annual reporting periods beginning after December 15, 2017, with earlier application permitted as of annual reporting periods beginning after December 15, 2016. In March, April and May of 2016, respectively, the FASB issued ASU 2016-08, which clarifies the implementation guidance on principal versus agent considerations, ASU 2016-10, which clarifies the implementation guidance on identifying performance obligations and licensing and ASU 2016-12, which provides improvements to the guidance on collectability, non-cash consideration, and completed contracts at transition, a practical expedient for contract modifications at transition and an accounting policy election related to the presentation of sales taxes and other similar taxes collected from customers. These amendments may be applied retrospectively to each prior period presented or retrospectively with the cumulative effect recognized as of the date of initial application. The Company plans to adopt the requirements of these standards in the first quarter of fiscal year 2018 on a modified retrospective basis. The Company is currently evaluating the requirements of these new standards and has not yet determined the impact of adoption on its Consolidated Financial Statements. The method of adoption is subject to change as the Company progresses through its assessment.
(2.) DIVESTITURE AND ACQUISITIONS
Spin-off of Nuvectra Corporation
On March 14, 2016, Integer completed the spin-off of a portion of its former QiG segment through a tax-free distribution of all of the shares of its QiG Group, LLC subsidiary to the stockholders of Integer on a pro rata basis. Immediately prior to completion of the Spin-off, QiG Group, LLC was converted into a corporation organized under the laws of Delaware and changed its name to Nuvectra Corporation (“Nuvectra”). On March 14, 2016, each of the Company’s stockholders of record as of the close of business on March 7, 2016 (the “Record Date”) received one share of Nuvectra common stock for every three shares of Integer common stock held as of the Record Date. Upon completion of the Spin-off, Nuvectra became an independent publicly traded company whose common stock is listed on the NASDAQ stock exchange under the symbol “NVTR.”
The portion of the former QiG segment spun-off consisted of QiG Group, LLC and its subsidiaries: (i) Algostim, LLC (“Algostim”), (ii) PelviStim LLC (“PelviStim”), and (iii) the Company’s NeuroNexus Technologies (“NeuroNexus”) subsidiary. The operations of Centro de Construcción de Cardioestimuladores del Uruguay (“CCC”) and certain other existing QiG research and development capabilities were retained by the Company and not included as part of the Spin-off. As the Company continues to focus on the design and development of complete medical device systems and components, and more specifically on medical device systems and components in the neuromodulation market, the Spin-off was not considered a strategic shift that had a major effect on the Company’s operations and financial results. Accordingly, the Spin-off is not presented as a discontinued operation in the Company’s Consolidated Financial Statements. The results of Nuvectra are included in the Consolidated Statements of Operations and Comprehensive Income (Loss) through the date of the Spin-off.
INTEGER HOLDINGS CORPORATION
NOTES TO CONSOLIDATED FINANCIAL STATEMENTS
(2.)DIVESTITURE AND ACQUISITIONS (Continued)
In connection with the Spin-off, during the first quarter of 2016, the Company made a cash capital contribution of $75 million to Nuvectra and divested the following assets and liabilities (in thousands):
|
| | | |
| Assets divested | |
| Cash and cash equivalents | $ | 76,256 |
|
| Other current assets | 977 |
|
| Property, plant and equipment, net | 4,407 |
|
| Amortizing intangible assets, net | 1,931 |
|
| Goodwill | 40,830 |
|
| Deferred income taxes | 6,446 |
|
| Total assets divested | 130,847 |
|
| Liabilities transferred | |
| Current liabilities | 2,119 |
|
| Net assets divested | $ | 128,728 |
|
NeuroNexus Technologies,For fiscal year 2016, Nuvectra contributed a pre-tax loss of $5.2 million to the Company’s results of operations. Nuvectra contributed a pre-tax loss of $24.4 million and $21.4 million to the Company’s results of operations for the fiscal years ended January 1, 2016 and January 2, 2015, respectively.
In connection with the Spin-off, on March 14, 2016, Integer entered into several agreements with Nuvectra that govern its post Spin-off relationship with Nuvectra, including a Separation and Distribution Agreement, Tax Matters Agreement, Employee Matters Agreement and Transition Services Agreement. These agreements contain customary mutual indemnification provisions. Amounts earned by Integer under the Transition Services Agreement were immaterial for the year ended December 30, 2016. Accounts Receivable, Net within the Consolidated Balance Sheet at December 30, 2016 includes $9.9 million due from Nuvectra for payments made by the Company on Nuvectra’s behalf.
Acquisition of Lake Region Medical Holdings, Inc.
On February 16, 2012,October 27, 2015, the Company purchasedacquired all of the outstanding common stock of NeuroNexus Technologies,Lake Region Medical Holdings, Inc. (“NeuroNexus”) headquarteredfor a total purchase price including debt assumed of approximately $1.77 billion. Lake Region Medical specializes in Ann Arbor, MI. NeuroNexus is an active implantable medical devicethe design, firm specializing in developing and commercializing neural interface technology, components and systems for neuroscience and clinical markets. NeuroNexus has an extensive intellectual property portfolio, core technologies and capabilities to support the development, and manufacturing of neural interface devicesproducts across the medical component and device spectrum primarily serving the cardio, vascular and advanced surgical markets.
Fair Value of Consideration Transferred
The aggregate consideration paid by the Company to the stockholders of Lake Region Medical consisted of the following (in thousands):
|
| | | |
| Cash | $ | 478,490 |
|
| Fair value of Integer common stock | 245,368 |
|
| Replacement stock options attributable to pre-acquisition service | 4,508 |
|
| Total purchase consideration | $ | 728,366 |
|
The fair value of the Integer common stock issued as part of the consideration was determined based upon the closing stock price of Integer’s shares as of the acquisition date. The fair value of the Integer stock options issued as part of the consideration was determined utilizing a wide rangeBlack-Scholes option pricing model as of applications including neuromodulation, sensing, optical stimulationthe acquisition date. Concurrent with the closing of the acquisition, the Company repaid all of the outstanding debt of Lake Region Medical of approximately $1.0 billion. The cash portion of the purchase price and targeted drug delivery.the repayment of Lake Region Medical’s debt was primarily funded through a new senior secured credit facility and the issuance of senior notes. Refer to Note 9 “Debt” for additional information regarding the Company’s debt.
INTEGER HOLDINGS CORPORATION
NOTES TO CONSOLIDATED FINANCIAL STATEMENTS
(2.)DIVESTITURE AND ACQUISITIONS (Continued)
Fair Value of Assets Acquired and Liabilities Assumed
This transaction was accounted for under the acquisition method of accounting. Accordingly, the cost of the acquisition was allocated to the Lake Region Medical assets acquired and liabilities assumed based on their fair values as of the closing date of the acquisition, with the amount exceeding the fair value of the net assets acquired recorded as goodwill. The fair value of assets acquired and liabilities assumed was finalized during the third quarter of fiscal year 2016. Measurement-period adjustments made during 2016 were an increase to current liabilities of $1.5 million, and reductions to goodwill of $1.1 million and deferred tax liabilities of $2.6 million These adjustments did not impact the Company’s Consolidated Statements of Operations and Comprehensive Income (Loss). The measurement period for this acquisition is closed and no further purchase price adjustments will be made.
The fair values of the assets acquired and liabilities assumed are as follows (in thousands):
|
| | | |
| Assets acquired | |
| Current assets | $ | 269,815 |
|
| Property, plant and equipment | 216,473 |
|
| Amortizing intangible assets | 849,000 |
|
| Indefinite-lived intangible assets | 70,000 |
|
| Goodwill | 660,670 |
|
| Other non-current assets | 1,629 |
|
| Total assets acquired | 2,067,587 |
|
| Liabilities assumed | |
| Current liabilities | 103,986 |
|
| Debt assumed | 1,044,675 |
|
| Other long-term liabilities | 190,560 |
|
| Total liabilities assumed | 1,339,221 |
|
| Net assets acquired | $ | 728,366 |
|
The goodwill acquired in connection with the acquisition was allocated to the Medical segment and is not deductible for tax purposes. Various factors contributed to the establishment of goodwill, including the value of Lake Region Medical’s highly trained assembled work force and management team, the incremental value resulting from Lake Region Medical’s industry leading capabilities and services to OEMs, enhanced synergies, and the expected revenue growth over time that is attributable to increased market penetration from future products and customers. In connection with the acquisition, the Company recognized a $70 million trademarks and tradenames indefinite-lived intangible asset, $160 million of purchased technology definite-lived intangible assets that have an estimated weighted average amortization period of 7 years and $689 million of customer lists definite-lived intangible assets that have an estimated weighted average amortization period of 14 years. In connection with the acquisition, the Company also recorded the inventory acquired at fair value resulting in an increase in inventory of$23.0 million. This step-up in the fair value of inventory was amortized as the inventory to which the step-up relates was sold and was fully amortized as of January 1, 2016.
The operating results of NeuroNexusLake Region Medical have been included in the Company's QiG segment fromCompany’s consolidated results since the date of acquisition. For 2012, NeuroNexus added approximately the fiscal year ended December 30, 2016, Lake Region Medical had $802.4 million of revenue and $32.8 million of net income. For the fiscal year ended January 1, 2016, Lake Region Medical had $138.6 million of revenue and a net loss of $17.4 million.
INTEGER HOLDINGS CORPORATION
NOTES TO CONSOLIDATED FINANCIAL STATEMENTS
(2$2.5 million.)DIVESTITURE AND ACQUISITIONS (Continued)
Acquisition of Centro de Construcción de Cardioestimuladores del Uruguay
On August 12, 2014, the Company purchased all of the outstanding common stock of Centro de Construcción de Cardioestimuladores del Uruguay, headquartered in Montevideo, Uruguay. CCC is an active implantable neuromodulation medical device systems developer and manufacturer that produces a range of medical devices including implantable pulse generators, programmer systems, battery chargers, patient wands and leads. This acquisition allows the Company to more broadly partner with medical device companies, complements the Company’s revenuecore discrete technology offerings and decreasedenhances the Company’s net loss by $0.2 million. The purchase pricemedical device innovation efforts.
Fair Value of NeuroNexus consisted of cash payments of $11.7 millionAssets Acquired and potential future payments of up to an additional $2 million. These future payments are contingent upon the achievement of certain financial and development-based milestones and had an estimated fair value of $1.5 million as ofLiabilities Assumed
This transaction was accounted for under the acquisition date.
method of accounting. The cost of the acquisition was allocated to the assets acquired and liabilities assumed from NeuroNexusCCC based on their fair values as of the closeclosing date of the acquisition, with the amount exceeding the fair value of the net assets acquired being recorded as goodwill. The valuation of the assets acquired and liabilities assumed from NeuroNexusCCC was finalized during 20132015 and did not result in a material adjustment to the original valuation of net assets acquired, including goodwill and therefore haswas not been reflected as a retrospective adjustment ofto the historical financial statements.
The following table summarizes the allocation of the NeuroNexus purchase price to the assets acquired and liabilities assumed as of the acquisition date (in thousands):
|
| | | |
| Assets acquired |
| Current assets | $ | 618 |
|
| Property, plant and equipment | 35 |
|
| Amortizing intangible assets | 2,927 |
|
| Indefinite-lived intangible assets | 540 |
|
| Goodwill | 8,924 |
|
| Other assets | 1,576 |
|
| Total assets acquired | 14,620 |
|
| Liabilities assumed | |
| Current liabilities | 420 |
|
| Deferred income taxes | 989 |
|
| Total liabilities assumed | 1,409 |
|
| | $ | 13,211 |
|
The fair values of the assets acquired were determined using one of three valuation approaches: market, income and cost. The selection of a particular method for a given asset depended on the reliability of available data and the nature of the asset, among other considerations.
The market approach estimates the value for a subject asset based on available market pricing for comparable assets. The income approach estimates the value for a subject asset based on the present value of cash flows projected to be generated by the asset. The projected cash flows were discounted at a required rate of return that reflects the relative risk of the asset and the time value of money. The projected cash flows for each asset considered multiple factors from the perspective of a marketplace participant including revenue projections from existing customers, attrition trends, product life-cycle assumptions, marginal tax rates and expected profit margins giving consideration to historical and expected margins. The cost approach estimates the value for a subject asset based on the cost to replace the asset and reflects the estimated reproduction or replacement cost for the asset, less an allowance for loss in value due to depreciation or obsolescence, with specific consideration given to economic obsolescence if indicated. These fair value measurement approaches are based on significant unobservable inputs, including management estimates and assumptions.
Current assets and liabilities - The fair value of current assets and liabilities was assumed to approximate their carrying valueare as offollows (in thousands): |
| | | |
| Assets acquired | |
| Current assets | $ | 10,670 |
|
| Property, plant and equipment | 1,131 |
|
| Amortizing intangible assets | 6,100 |
|
| Goodwill | 8,296 |
|
| Total assets acquired | 26,197 |
|
| Liabilities assumed | |
| Current liabilities | 4,842 |
|
| Deferred income taxes | 1,590 |
|
| Total liabilities assumed | 6,432 |
|
| Net assets acquired | $ | 19,765 |
|
The goodwill acquired in connection with the CCC acquisition date due to the short-term nature of these assets and liabilities.
GREATBATCH, INC.
NOTES TO CONSOLIDATED FINANCIAL STATEMENTS
Intangible assets - The purchase price was allocated to identifiable intangible assets as follows (dollars in thousands):
|
| | | | | | | | | | |
| | Fair Value Assigned | | Weighted Average Amortization Period (Years) | | Estimated Useful Life (Years) | | Weighted Average Discount Rate |
| Amortizing Intangible Assets | | | | | | | |
| Technology and patents | $ | 1,058 |
| | 6 | | 10 | | 14 | % |
| Customer lists | 1,869 |
| | 7 | | 15 | | 13 | % |
| | 2,927 |
| | 7 | | 13 | | 13 | % |
| Indefinite-lived Intangible Assets | | | | | | | |
| In-process research and development | 540 |
| | N/A | | 12 | | 26 | % |
The weighted average amortization periodthe Medical segment and is less than the estimated useful life due to the Company using an accelerated amortization method, which approximates the projected cash flows used to determine the fair value of those intangible assets.
Technology and patents - Technology and patents consists of technical processes, patented and unpatented technology, manufacturing know-how, trade secrets and the understanding with respect to products or processes that have been developed by NeuroNexus and that will be leveraged in current and future products. The fair value of technology and patents acquired was determined utilizing the relief from royalty method, a form of the income approach, with royalty rates that ranged from 2% to 6%. The estimated useful life of the technology and patents is based upon management’s estimate of the product life cycle associated with technology and patents before they will be replaced by new technologies.
Customer lists – Customer lists represent the estimated fair value of non-contractual customer relationships NeuroNexus has as of the acquisition date. The primary customers of NeuroNexus include numerous scientists and researchers from various geographic locations around the world. These relationships were valued separately from goodwill at the amount which an independent third party would be willing to paynot deductible for these relationships. The fair value of customer lists was determined using the multi-period excess-earnings method, a form of the income approach. The estimated useful life of the existing customer list was based upon historical customer attrition as well as management’s understanding of the industry and product life cycles.
IPR&D – IPR&D represents research projects which are expected to generate cash flows but have not yet reached technological feasibility. The Company used the income approach to determine the fair value of the IPR&D acquired. In arriving at the value of the IPR&D, management considered, among other factors: the projects’ stage of completion; the complexity of the work to be completed as of the acquisition date; the projected costs to complete the projects; the contribution of other acquired assets; and the estimated useful life of the technology. The Company applied a market-participant risk-adjusted discount rate to arrive at a present value as of the date of acquisition. The value assigned to IPR&D related to the development of micro-electrodes for deep brain mapping and electrocorticography. For purposes of valuing the IPR&D, the Company estimated total costs to complete the projects to be approximately $1.5 million.
Goodwill - The excess of the purchase price over the fair value of net tangible and intangible assets acquired and liabilities assumed was allocated to goodwill.tax purposes. Various factors contributed to the establishment of goodwill, including: the value of NeuroNexus’sCCC’s highly trained assembled work force and management team; the incremental value that NeuroNexus’sCCC’s technology will bring to the Company’s neuromodulation platform currently in development;medical devices; and the expected revenue growth over time that is attributable to increased market penetration from future products and customers. The goodwill acquired inIn connection with the NeuroNexus acquisition, was allocated to the QiG business segment and is not deductible for tax purposes.
Micro Power Electronics, Inc.
On December 15, 2011, the Company acquired allrecognized definite-lived intangible assets of $0.1 million for trademarks and tradenames, $1.4 million for purchased technology and $4.6 million for customer lists, which had estimated weighted average amortization periods of 2, 10 and 10 years, respectively.
The operating results of CCC have been included in the outstanding capital stockCompany’s consolidated results since the date of Micro Power Electronics, Inc. (“Micro Power”) headquartered in Beaverton, OR. Micro Power is a leading supplieracquisition. For the fiscal year ended January 2, 2015, CCC had $5.8 million of custom battery solutions, serving the portable medical, militaryrevenue and handheld automatic identification and data collection markets.net income of $1.2 million. The aggregate purchase price consisted of the amount paid to Micro Power shareholders ($57.6$19.8 million), payments to Micro Power’s creditors at closing ($6.6 million) and certain Micro Power transaction-related expenses ($7.6 million). The Company financed this acquisition was funded with cash on hand and borrowed $45 million under its revolving credit facility. As of December 30, 2011, the Company had accrued $5.7 million of Micro Power transaction-related expenses, which were paid during 2012. During 2012, the Company completed the valuation and made adjustments to the Micro Power opening balance sheet based uponhand.
GREATBATCH, INC.INTEGER HOLDINGS CORPORATION
NOTES TO CONSOLIDATED FINANCIAL STATEMENTS
the receipt of information that was needed in order to complete the valuation of certain assets and liabilities. As a result, the Company reduced the fair value recorded for the Micro Power amortizing intangible assets acquired by $0.4 million and increased the amount of goodwill recorded by $0.4 million. The impact of these adjustments, individually and in the aggregate, was not considered material and therefore has not been reflected as a retrospective adjustment of the historical financial statements.
This transaction was accounted for under the acquisition method of accounting. Accordingly, the operating results of Micro Power have been included in the Company’s Greatbatch Medical segment from the date of acquisition. The cost of the acquisition was allocated to the assets acquired and liabilities assumed based on their fair values as of the close of the acquisition, with the amount exceeding the fair value of net assets acquired being recorded as goodwill. For 2011, the Micro Power acquisition added approximately $2.5 million to revenue and was neutral to net income.
The following table summarizes the allocation of the Micro Power purchase price to the assets acquired and liabilities assumed as of the acquisition date (in thousands):(2.) |
| | | |
| Assets acquired |
| Current assets | $ | 25,620 |
|
| Property, plant and equipment | 1,650 |
|
| Amortizing intangible assets | 28,914 |
|
| Goodwill | 31,891 |
|
| Other assets | 94 |
|
| Total assets acquired | 88,169 |
|
| Liabilities assumed | |
| Current liabilities | 13,679 |
|
| Long-term liabilities | 2,688 |
|
| Total liabilities assumed | 16,367 |
|
| | $ | 71,802 |
|
Current assets and liabilities - The fair value of current assets (excluding inventory) and current liabilities was assumed to approximate their carrying value as of the acquisition date due to the short-term nature of these assets and liabilities. The fair value of in-process and finished goods inventory acquired was estimated by applying a version of the market approach called the comparable sales method. This approach estimates the fair value of the assets by calculating the potential revenue generated from selling the inventory and subtracting from it the costs related to the completion and sale of that inventory and a reasonable profit allowance. Based upon this methodology, the Company recorded the inventory acquired at fair value resulting in an increase in inventory of $0.7 million.DIVESTITURE AND ACQUISITIONS (Continued)
Intangible assets – The purchase price was allocated to specific intangible assets as follows (dollars in thousands):
|
| | | | | | | | | | |
| | Fair Value | | Weighted Average Amortization | | Estimated Useful | | Weighted Average Discount |
| Amortizing Intangible Assets | Assigned | | Period (Years) | | Life (Years) | | Rate |
| Technology and patents | $ | 8,051 |
| | 4 | | 10 | | 14 | % |
| Customer lists | 19,569 |
| | 5 | | 14 | | 12 | % |
| Noncompete agreement | 915 |
| | 4 | | 8 | | 14 | % |
| Trademarks and tradenames | 379 |
| | 2 | | 2 | | 13 | % |
| | $ | 28,914 |
| | 4 | | 13 | | 13 | % |
The weighted average amortization period is less than the estimated useful life due to the Company using an accelerated amortization method, which approximates the projected cash flows used to determine the fair value of those intangible assets.
Technology and patents - Technology and patents consists of technical processes, patented and unpatented technology, manufacturing know-how, trade secrets and the understanding with respect to products or processes that have been developed by Micro Power and that will be leveraged in current and future products. The fair value of technology and patents acquired was determined utilizing the relief from royalty method, a form of the income approach, with royalty rates that ranged from 2% to 4%. The estimated useful life of the technology and patents was based upon management’s
GREATBATCH, INC.
NOTES TO CONSOLIDATED FINANCIAL STATEMENTS
estimate of the product life cycle associated with technology and patents before they will be replaced by new technologies.
Customer lists – Customer lists represent the estimated fair value of both the contractual and non-contractual customer relationships Micro Power has as of the acquisition date. These relationships were valued separately from goodwill at the amount which an independent third party would be willing to pay for these relationships. The fair value of customer lists was determined using the multi-period excess-earnings method, a form of the income approach. The estimated useful life of the existing customer list was based upon historical customer attrition as well as management’s understanding of the industry and product life cycles.
Trademarks and tradenames – Trademarks and tradenames represent the estimated fair value of corporate and product names acquired from Micro Power. These tradenames were valued separately from goodwill at the amount which an independent third party would be willing to pay for use of these names. The fair value of the trademarks and tradenames was determined by utilizing the relief from royalty method, a form of the income approach, with a 0.5% royalty rate.
Goodwill - The excess of the purchase price over the fair value of net tangible and intangible assets acquired was allocated to goodwill. Various factors contributed to the establishment of goodwill, including: the value of Micro Power’s highly trained assembled work force and management team; the expected revenue growth over time that is attributable to increased market penetration from future products and customers; and the incremental value to the Company’s business from expanding and diversifying its revenues. The goodwill acquired in connection with the Micro Power acquisition was allocated to the Greatbatch Medical business segment and is not deductible for tax purposes.
Unaudited Pro Forma Results (Unaudited)Financial Information
- The following unaudited pro forma information presentssummarizes the consolidated results of operations of the Company, NeuroNexus,Lake Region Medical, and Micro PowerCCC for fiscal years 2015 and 2014 as if those acquisitions occurred as of the beginning of fiscal years 2011 (Neuro Nexus)2014 (Lake Region Medical) and 2010 (Micro Power)2013 (CCC) (in thousands, except per share amounts):
| | | | Year Ended | | | | | |
| | December 28,
2012 | | December 30,
2011 | 2015 | | 2014 |
| Sales | $ | 646,617 |
| | $ | 636,502 |
| $ | 1,445,689 |
| | $ | 1,441,782 |
|
| Net income (loss) | (4,973 | ) | | 32,306 |
| 2,405 |
| | (25,865 | ) |
| Earnings (loss) per share: | | | | | | |
| Basic | $ | (0.21 | ) | | $ | 1.39 |
| $ | 0.08 |
| | $ | (0.87 | ) |
| Diluted | $ | (0.21 | ) | | $ | 1.37 |
| $ | 0.08 |
| | $ | (0.87 | ) |
The unaudited pro forma information presents the combined operating results of Greatbatch, NeuroNexus,Integer, Lake Region Medical, and Micro Power,CCC, with the results prior to the acquisition date adjusted to include the pro forma impact of the amortization of acquired intangible assets, the adjustment to interest expense reflecting the amount borrowed in connection with the acquisitions at Greatbatch’sInteger’s interest rate, and the impact of income taxes on the pro forma adjustments utilizing the applicable statutory tax rate. Fiscal year 2015 pro forma earnings were adjusted to exclude $32.3 million of acquisition-related costs (change-in-control payments, investment banking fees, professional fees), $9.5 million of debt related charges (commitment fees, swap termination fees, debt extinguishment fees) and $23.0 million of nonrecurring amortization expense related to the fair value step-up of inventory incurred in 2015 as a result of the acquisition of Lake Region Medical. Fiscal year 2014 supplemental pro forma earnings were adjusted to include these charges. The unaudited pro forma consolidated basic and diluted earnings (loss) per share calculations are based on the consolidated basic and diluted weighted average shares of Greatbatch.Integer. The unaudited pro forma results are presented for illustrative purposes only and do not reflect the realization of potential cost savings, and any related integration costs. Certain costsCosts savings may result from the acquisition; however, there can be no assurance that these cost savings will be achieved. These pro forma results do not purport to be indicative of the results that would have been obtained by the combined company, or to be a projection of results that may be obtained in the future.future by the combined company.
(3.)SUPPLEMENTAL CASH FLOW INFORMATION
The following represents supplemental cash flow information (in thousands) for fiscal years 2016, 2015 and 2014:
|
| | | | | | | | | | | |
| | 2016 | | 2015 | | 2014 |
| Noncash investing and financing activities: | | | | | |
| Common stock contributed to 401(k) Plan | $ | — |
| | $ | 3,920 |
| | $ | 4,341 |
|
| Property, plant and equipment purchases included in accounts payable | 3,499 |
| | 7,401 |
| | 2,926 |
|
| Common stock issued in connection with Lake Region Medical acquisition | — |
| | 245,368 |
| | — |
|
| Replacement stock options issued in connection with Lake Region Medical acquisition | — |
| | 4,508 |
| | — |
|
| Purchase of non-controlling interests in subsidiaries included in accrued expenses | — |
| | 6,818 |
| | — |
|
| Cash paid during the year for: | | | | | |
| Interest | 106,475 |
| | 13,057 |
| | 3,521 |
|
| Income taxes | 7,263 |
| | 6,312 |
| | 13,565 |
|
| Acquisition of noncash assets | — |
| | 2,013,604 |
| | 22,434 |
|
| Liabilities assumed | — |
| | 1,340,339 |
| | 6,432 |
|
GREATBATCH, INC.INTEGER HOLDINGS CORPORATION
NOTES TO CONSOLIDATED FINANCIAL STATEMENTS
|
| | |
3. | | SUPPLEMENTAL CASH FLOW INFORMATION |
|
| | | | | | | | | | | |
| | Year Ended |
| | January 3,
2014 | | December 28,
2012 | | December 30,
2011 |
| (in thousands) | | | | | |
| Noncash investing and financing activities: | | | | | |
| Common stock contributed to 401(k) Plan | $ | 2,477 |
| | $ | 4,793 |
| | $ | — |
|
| Property, plant and equipment purchases included in accounts payable | 2,103 |
| | 2,522 |
| | 4,455 |
|
| Cash paid during the year for: | | | | | |
| Interest | 4,989 |
| | 6,230 |
| | 6,148 |
|
| Income taxes | 44,165 |
| | 4,909 |
| | 5,259 |
|
| Acquisition of noncash assets | — |
| | 14,396 |
| | 87,766 |
|
| Liabilities assumed | — |
| | 1,244 |
| | 16,483 |
|
Inventories are comprised of the following (in thousands):
| | | | At | | | | | |
| | January 3,
2014 | | December 28,
2012 | December 30,
2016 | | January 1,
2016 |
| Raw materials | $ | 67,939 |
| | $ | 58,204 |
| $ | 100,738 |
| | $ | 107,296 |
|
| Work-in-process | 36,670 |
| | 30,022 |
| 89,224 |
| | 93,729 |
|
| Finished goods | 13,749 |
| | 18,386 |
| 35,189 |
| | 51,141 |
|
| Total | $ | 118,358 |
| | $ | 106,612 |
| $ | 225,151 |
| | $ | 252,166 |
|
| | | | | |
Assets held for sale which are included in Prepaid Expenses and Other Current Assets, is comprised of the following (in thousands): |
| | | | | | | | | | | | |
| | | | | | | At |
| Asset | | Disposal Group | | Business Segment | | January 3,
2014 | | December 28,
2012 |
| Inventory | | Wireless sensing | | Greatbatch Medical | | $ | — |
| | $ | 288 |
|
| Technology | | Wireless sensing | | Greatbatch Medical | | — |
| | 655 |
|
| Inventory | | Swiss orthopaedic product line | | Greatbatch Medical | | — |
| | 2,552 |
|
| PP&E | | Swiss orthopaedic product line | | Greatbatch Medical | | — |
| | 1,471 |
|
| Technology | | Swiss orthopaedic product line | | Greatbatch Medical | | — |
| | 476 |
|
| | | | | | | $ | — |
| | $ | 5,442 |
|
|
| | | | | | | | | | |
| Asset | | Business Segment | | December 30,
2016 | | January 1,
2016 |
| Building and building improvements | | Medical | | $ | 794 |
| | $ | 996 |
|
During 2012,2014, the Company transferred inventory and technology related$2.1 million of assets relating to Greatbatch Medical's wireless sensing product linethe Company’s Orvin, Switzerland property to assets held for sale. These assets were subsequently written off in 2013 to Other Operating Expenses, Net as a sales agreement could not be reached with interested buyers.
In connection with the sale of certain non-core Swiss orthopaedic product lines to an independent third party in 2013, during 2012, the Company transferred certain inventory, PP&EDuring 2016 and technology to held for sale. As the disposal group was considered a business, $2.8 million of goodwill was allocated to the disposal group during 2013 when the transaction closed. In connection with the transfer of these orthopaedic product lines to held for sale,2014 the Company recognized a $3.6 million lossimpairment charges, recorded in Other Operating Expenses, Net, in 2012 based upon the contractual sales priceof $0.2 million and $0.4 million, respectively, related to the third party. As this disposal group did not have cash flows that were clearly distinguishable, both operationally andits assets held for financial reporting
GREATBATCH, INC.
NOTES TO CONSOLIDATED FINANCIAL STATEMENTS
purposes, from the rest ofsale. During 2015, the Company they were not considered discontinued operations in accordancesold $0.6 million of these assets held for sale with ASC 205. This transaction closed in the first quarter of 2013. During 2013, the Company received payments totaling $4.7 million in connection with this transaction and the third party assumed $2.4 million of severance liabilities. The purchase agreement provides the Company with an earn out payment based upon the amount of inventory consumed by the purchaser within one year after the close of the transaction. As a result of this earn out, we expect ano additional gain of approximately or loss recognized.
(6.)$2.3 million will be recorded in the first quarter of 2014 in Other Operating Expenses, Net. See Note 13 “Other Operating Expenses, Net,” for additional information regarding this transaction.PROPERTY, PLANT AND EQUIPMENT, NET
|
| | |
6. | | PROPERTY, PLANT AND EQUIPMENT, NET |
Property, plant and equipment arePP&E is comprised of the following (in thousands):
| | | | At | | | | | |
| | January 3,
2014 | | December 28,
2012 | December 30, 2016 | | January 1,
2016 |
| Manufacturing machinery and equipment | $ | 159,542 |
| | $ | 150,344 |
| $ | 332,886 |
| | $ | 285,068 |
|
| Buildings and building improvements | 87,359 |
| | 87,357 |
| 132,277 |
| | 130,184 |
|
| Information technology hardware and software | 28,010 |
| | 29,823 |
| 52,467 |
| | 43,947 |
|
| Leasehold improvements | 31,522 |
| | 20,520 |
| 59,292 |
| | 36,745 |
|
| Furniture and fixtures | 13,889 |
| | 13,414 |
| 18,989 |
| | 16,243 |
|
| Land and land improvements | 13,016 |
| | 12,499 |
| 20,046 |
| | 21,774 |
|
| Construction work in process | 7,886 |
| | 15,441 |
| 32,252 |
| | 76,835 |
|
| Other | 633 |
| | 676 |
| 1,062 |
| | 852 |
|
| | 341,857 |
| | 330,074 |
| 649,271 |
| | 611,648 |
|
| Accumulated depreciation | (196,084 | ) | | (179,181 | ) | (277,229 | ) | | (232,156 | ) |
| Total | $ | 145,773 |
| | $ | 150,893 |
| $ | 372,042 |
| | $ | 379,492 |
|
Depreciation expense for property, plant and equipment was as follows for fiscal years 2016, 2015 and 2014 (in thousands):
|
| | | | | | | | | | | |
| | Year Ended |
| | January 3,
2014 | | December 28,
2012 | | December 30,
2011 |
| Depreciation expense | $ | 22,799 |
| | $ | 31,575 |
| | $ | 25,672 |
|
|
| | | | | | | | | | | |
| | 2016 | | 2015 | | 2014 |
| Depreciation expense | $ | 52,662 |
| | $ | 27,136 |
| | $ | 23,320 |
|
Construction work in process at December 30, 2016 and January 3,1, 2016 includes asset purchases related to the Company’s 2014 primarilyinvestment in capacity and capabilities initiatives. Additionally, construction work in process also relates to routine purchases of machinery, equipment, and information technology assets to support normal recurring operations. Construction work in process at December 28, 2012 primarily relatesRefer to the transfer of the Company’s orthopaedic operations previously performed at its Orvin and Corgemont, Switzerland facilities to existing facilities located in Fort Wayne, IN and Tijuana, Mexico; the expansion of the Company’s manufacturing infrastructure in order to support its medical device strategy; and the relocation of the Company’s global headquarters to Frisco, Texas. These projects were completed during 2013. See Note 13 “Other Operating Expenses, Net” for a description of the Company’s significant capital investment projects.
GREATBATCH, INC.INTEGER HOLDINGS CORPORATION
NOTES TO CONSOLIDATED FINANCIAL STATEMENTS
Amortizing intangible assets, net are comprised of the following (in thousands):
| | | | Gross Carrying Amount | | Accumulated Amortization | | Foreign Currency Translation | | Net Carrying Amount | Gross Carrying Amount | | Accumulated Amortization | | Foreign Currency Translation | | Net Carrying Amount |
| At January 3, 2014 | | | | | | | | |
| December 30, 2016 | | | | | | | | |
| Purchased technology and patents | $ | 97,376 |
| | $ | (69,026 | ) | | $ | 1,980 |
| | $ | 30,330 |
| $ | 256,719 |
| | $ | (100,719 | ) | | $ | 333 |
| | $ | 156,333 |
|
| Customer lists | 68,257 |
| | (24,671 | ) | | 1,367 |
| | 44,953 |
| 759,987 |
| | (60,474 | ) | | (6,269 | ) | | 693,244 |
|
| Other | 4,434 |
| | (4,399 | ) | | 804 |
| | 839 |
| 4,534 |
| | (5,142 | ) | | 803 |
| | 195 |
|
| Total amortizing intangible assets | $ | 170,067 |
| | $ | (98,096 | ) | | $ | 4,151 |
| | $ | 76,122 |
| $ | 1,021,240 |
| | $ | (166,335 | ) | | $ | (5,133 | ) | | $ | 849,772 |
|
| At December 28, 2012 | | | | | | | | |
| | | | | | | | | |
| January 1, 2016 | | | | | | | | |
| Purchased technology and patents | $ | 95,576 |
| | $ | (61,659 | ) | | $ | 1,932 |
| | $ | 35,849 |
| $ | 255,776 |
| | $ | (83,708 | ) | | $ | 1,444 |
| | $ | 173,512 |
|
| Customer lists | 68,257 |
| | (18,929 | ) | | 1,270 |
| | 50,598 |
| 761,857 |
| | (40,815 | ) | | (986 | ) | | 720,056 |
|
| Other | 4,434 |
| | (4,341 | ) | | 805 |
| | 898 |
| 4,534 |
| | (4,946 | ) | | 821 |
| | 409 |
|
| Total amortizing intangible assets | $ | 168,267 |
| | $ | (84,929 | ) | | $ | 4,007 |
| | $ | 87,345 |
| $ | 1,022,167 |
| | $ | (129,469 | ) | | $ | 1,279 |
| | $ | 893,977 |
|
Aggregate intangible asset amortization expense is comprised of the following for fiscal years 2016, 2015 and 2014 (in thousands):
| | | | Year Ended | | | | | | | |
| | January 3,
2014 | | December 28,
2012 | | December 30,
2011 | 2016 | | 2015 | | 2014 |
| Cost of sales | $ | 6,822 |
| | $ | 7,489 |
| | $ | 6,163 |
| $ | 16,769 |
| | $ | 7,403 |
| | $ | 6,201 |
|
| SG&A | 5,800 |
| | 6,227 |
| | 3,926 |
| 20,581 |
| | 9,681 |
| | 7,009 |
|
| RD&E | 545 |
| | 545 |
| | 367 |
| 512 |
| | 412 |
| | 667 |
|
| Total intangible asset amortization expense | $ | 13,167 |
| | $ | 14,261 |
| | $ | 10,456 |
| $ | 37,862 |
| | $ | 17,496 |
| | $ | 13,877 |
|
Estimated future intangible asset amortization expense based upon the current carrying value as of December 30, 2016 is as follows (in thousands):
|
| | | |
| | Estimated Amortization Expense |
| 2014 | $ | 13,695 |
|
| 2015 | 12,644 |
|
| 2016 | 10,350 |
|
| 2017 | 9,227 |
|
| 2018 | 6,938 |
|
| Thereafter | 23,268 |
|
| Total estimated amortization expense | $ | 76,122 |
|
|
| | | | | | | | | | | | | | | | | | |
| | 2017 | | 2018 | | 2019 | | 2020 | | 2021 | | After 2021 |
| Amortization Expense | $ | 43,562 |
| | 44,426 |
| | 44,483 |
| | 45,066 |
| | 43,957 |
| | 628,278 |
|
During 2013,Indefinite-lived intangible assets were comprised of the Company made an asset purchase of technology totaling $1.8 million, which is being amortized over a weighted average period of approximately 7 years. In connection with this and other technology purchases in previous years,following as of December 30, 2016 and January 3, 2014 the Company has recorded $4.0 million of contingent liabilities, which will only be paid if certain performance targets are achieved. These contingent liabilities are classified in Other Long-Term Liabilities.
GREATBATCH, INC.
NOTES TO CONSOLIDATED FINANCIAL STATEMENTS
The change in indefinite-lived assets during 2013 is as follows1, 2016 (in thousands):
|
| | | | | | | | | | | |
| | Trademarks and Tradenames | | IPR&D | | Total |
| At December 28, 2012 | $ | 20,288 |
| | $ | 540 |
| | $ | 20,828 |
|
| Indefinite-lived assets written-off (Note 18) | — |
| | (540 | ) | | (540 | ) |
| At January 3, 2014 | $ | 20,288 |
| | $ | — |
| | $ | 20,288 |
|
During 2013, the Company wrote off its IPR&D assets as these projects were discontinued prior to reaching technological feasibility. |
| | | |
| | Trademarks and Tradenames |
| January 1, 2016 | $ | 90,288 |
|
| December 30, 2016 | $ | 90,288 |
|
As discussed further in Note 13 “Other Operating Expenses, Net”1 “Summary of Significant Accounting Policies” and Note 19 “Business Segment, Geographic and Concentration Risk Information,” inas a result of the Lake Region Medical acquisition and the Spin-off, during 2016 the Company restructured its operations including its internal management and financial reporting structure. In connection with thethis realignment, of the Company's operating structure in 2013, the Company reevaluated its operating and reporting segments. Beginning in the fourth quarter of 2013, the Companysegments and determined that it has two operating segments: Greatbatch Medical and QiG, and, asNon-Medical. As required, the Company reassigned goodwill to each of theseits reporting units based upon their relative fair values and reclassified prior year amounts to conform them to the current year presentation. Additionally, the Company evaluated the goodwill of all of its reporting units utilizing the step-zero approach immediately prior to the change in segments and immediately after the Spin-off for its former QiG reporting unit and concluded in both cases that it was more likely than not that there was no impairment present. The Company also performed its annual goodwill impairment test utilizing the two-step method as of December 30, 2016 and concluded there was no impairment present.
INTEGER HOLDINGS CORPORATION
NOTES TO CONSOLIDATED FINANCIAL STATEMENTS
(7.) INTANGIBLE ASSETS (Continued)
The change in goodwill during 2013fiscal year 2016 is as follows (in thousands):
|
| | | | | | | | | | | |
| | Greatbatch Medical | | QiG | | Total |
| At December 28, 2012 | $ | 307,235 |
| | $ | 41,800 |
| | $ | 349,035 |
|
| Goodwill disposed (Note 5) | (2,771 | ) | | — |
| | (2,771 | ) |
| Foreign currency translation | 392 |
| | — |
| | 392 |
|
| At January 3, 2014 | $ | 304,856 |
| | $ | 41,800 |
| | $ | 346,656 |
|
|
| | | | | | | | | | | |
| | Medical | | Non- Medical | | Total |
| January 1, 2016 | $ | 996,570 |
| | $ | 17,000 |
| | $ | 1,013,570 |
|
| Goodwill divested (Note 2) | (40,830 | ) | | — |
| | (40,830 | ) |
| Purchase accounting adjustments (Note 2) | (1,118 | ) | | — |
| | (1,118 | ) |
| Foreign currency translation | (4,296 | ) | | — |
| | (4,296 | ) |
| December 30, 2016 | $ | 950,326 |
| | $ | 17,000 |
| | $ | 967,326 |
|
As of January 3, 2014, December 30, 2016, no accumulated impairment loss has been recognized for the goodwill allocated to the Company’s Greatbatch Medical or QiGNon-Medical segments.
(8.) ACCRUED EXPENSES
Accrued expenses are comprised of the following (in thousands):
| | | | At | | | | | |
| | January 3,
2014 | | December 28,
2012 | December 30, 2016 | | January 1,
2016 |
| Salaries and benefits | $ | 16,311 |
| | $ | 12,704 |
| $ | 30,199 |
| | $ | 37,579 |
|
| Profit sharing and bonuses | 19,808 |
| | 12,488 |
| 3,054 |
| | 6,781 |
|
| Warranty | 1,819 |
| | 2,626 |
| |
| Swiss orthopaedic consolidation severance | — |
| | 9,567 |
| |
| Accrued interest | | 6,838 |
| | 9,378 |
|
| Purchase of non-controlling interest in subsidiaries | | — |
| | 6,818 |
|
| Severance, retention and change in control payments | | 6,296 |
| | 11,969 |
|
| Warranty and customer rebates | | 8,146 |
| | 7,205 |
|
| Other | 6,743 |
| | 8,130 |
| 17,748 |
| | 17,527 |
|
| Total | $ | 44,681 |
| | $ | 45,515 |
| $ | 72,281 |
| | $ | 97,257 |
|
Long-term debt is comprised of the following (in thousands): |
| | | | | | | |
| | At |
| | January 3,
2014 | | December 28, 2012 |
| Revolving line of credit | $ | — |
| | $ | 33,000 |
|
| Variable rate term loan | 197,500 |
| | — |
|
| 2.25% convertible subordinated notes | — |
| | 197,782 |
|
| Unamortized discount | — |
| | (5,368 | ) |
| Total long-term debt | $ | 197,500 |
| | $ | 225,414 |
|
|
| | | | | | | |
| | December 30, 2016 | | January 1,
2016 |
| Senior secured term loan A | $ | 356,250 |
| | $ | 375,000 |
|
| Senior secured term loan B | 1,014,750 |
| | 1,025,000 |
|
| 9.125% senior notes due 2023 | 360,000 |
| | 360,000 |
|
| Revolving line of credit | 40,000 |
| | — |
|
| Less unamortized discount on term loan B and debt issuance costs | (40,837 | ) | | (45,947 | ) |
| Total debt | 1,730,163 |
| | 1,714,053 |
|
| Less current portion of long-term debt | 31,344 |
| | 29,000 |
|
| Total long-term debt | $ | 1,698,819 |
| | $ | 1,685,053 |
|
GREATBATCH, INC.Senior Secured Credit Facilities
NOTES TO CONSOLIDATED FINANCIAL STATEMENTS
Credit Facility – In September 2013,connection with the Lake Region Medical acquisition, on October 27, 2015, the Company amended and extendedreplaced its existing credit facility with new senior secured credit facilities (the “Credit Facility”). The new“Senior Secured Credit Facility providesFacilities”) consisting of (i) a $300$200 million revolving credit facility (the “Revolving Credit Facility”), (ii) a $200$375 million term loan A facility (the “Term Loan”“TLA Facility”), and (iii) a $15$1,025 million letter of credit subfacility,term loan B facility (the “TLB Facility”). The TLA Facility and TLB Facility are collectively referred to as the “Term Loan Facilities.” The TLB facility was issued at a $15 million swingline subfacility. The1% discount.
INTEGER HOLDINGS CORPORATION
NOTES TO CONSOLIDATED FINANCIAL STATEMENTS
(9.)DEBT (Continued)
Revolving Credit Facility can be increased by $200 million upon the Company’s request and approval by the lenders.
The Revolving Credit Facility hasmatures on October 27, 2020 and includes a maturity date$15 million sublimit for swingline loans and a $25 million sublimit for standby letters of September 20, 2018,credit. The Company is required to pay a commitment fee on the unused portion of the Revolving Credit Facility, which will range between 0.175% and 0.25%, depending on the Company’s total net leverage ratio, as defined in the Senior Secured Credit Facilities agreement. As of December 30, 2016, the Company had $40 million of outstanding borrowings on the Revolving Credit Facility and an available borrowing capacity of $151.1 million after giving effect to$8.9 million of outstanding standby letters of credit. As of December 30, 2016, the weighted average interest rate on outstanding borrowings under the Revolving Credit Facility was 3.95%.
Subject to certain conditions, commitments under the Revolving Credit Facility may be extended to September 20, 2019 upon notice byincreased through an incremental revolving facility so long as, on a pro forma basis, the Company and subject to certain conditions.Company’s first lien net leverage ratio does not exceed 4.25:1.00. The principaloutstanding amount of the Revolving Credit Facility approximated its fair value as of December 30, 2016 based upon the debt being variable rate and short-term in nature.
Term Loan is payable in quarterly installments as specified in the Credit Facility until its maturity date of September 20, 2019 when the unpaid balance is due in full.Facilities
The Company has pledged its non-realty assets including cash, accounts receivableTLA Facility and inventories as collateral against the outstanding debtTLB Facility mature on the Credit Facility.October 27, 2021 and October 27, 2022, respectively. Interest rates on the revolving and term loans underTLA Facility, as well as the Revolving Credit Facility, are at the Company’s option, either at: (i) the prime rate plus the applicable margin, which rangeswill range between 0.0%0.75% and 0.75%2.25%, based on the Company’s total net leverage ratio, as defined in the Senior Secured Credit Facilities agreement or (ii) the applicable LIBOR rate plus the applicable margin, which rangeswill range between 1.375%1.75% and 2.75%3.25%, based on the Company’s total net leverage ratio. Loans underInterest rates on the swingline subfacility will bear interestTLB Facility are, at the Company’s option, either at: (i) the prime rate plus 3.25% or (ii) the applicable margin, which ranges between 0.0%LIBOR rate plus 4.25%, with LIBOR subject to a 1.00% floor. As of December 30, 2016, the interest rate on the TLA Facility and 0.75%TLB Facility were 4.01% and 5.25%, respectively.
Subject to certain conditions, one or more incremental term loan facilities may be added to the Term Loan Facilities so long as, on apro forma basis, the Company’s first lien net leverage ratio does not exceed 4.25:1.00.
As of December 30, 2016, the estimated fair value of TLA and TLB were approximately $349 million and $1,022 million, respectively, based on quoted market prices for the Company’s total leverage ratio. The Companydebt, recent sales prices for the debt and consideration of comparable debt instruments with similar interest rates and trading frequency, among other factors, and is also required to pay a commitment fee, which varies between 0.175% and 0.25% depending onclassified as Level 2 measurements within the Company’s total leverage ratio.fair value hierarchy.
Covenants
The Revolving Credit Facility contains limitations onand the incurrence of indebtedness, liens and licensing of intellectual property, investments and certain payments. The CreditTLA Facility permits the Company to engage in the following activities up to an aggregate amount of $300 million: 1) engage in permitted acquisitions in the aggregate not to exceed $250 million; 2) make other investments in the aggregate not to exceed $100 million; 3) make stock repurchases and declare dividends not to exceed $150 million in the aggregate; and 4) make investments in foreign subsidiaries not to exceed $20 million in the aggregate. At any time that thecontain covenants requiring (A) a maximum total net leverage ratio of the Company for the two most recently ended fiscal quarters is less than 2.756.25:1.0, subject to 1.0, the Company may make an election to reset each of the amounts specified above. Additionally, these limitations can be waived upon the Company’s requeststep downs and approval of(B) a majority of the lenders. As of January 3, 2014, the Company had available to it 100% of the above limits except for the aggregate limit and other investments limit which are now $298 million and $98 million, respectively.
The Credit Facility requires the Company to maintain a rolling four quarterminimum interest coverage ratio of adjusted EBITDA (as defined in the Senior Secured Credit Facilities) to interest expense of at least 3.0not less than 2.50:1.0, subject to step ups. The TLB Facility does not contain any financial maintenance covenants. During the fourth quarter of 2016, the Company amended the Senior Secured Credit Facilities. The amendment modified certain covenants covering the Revolving Credit Facility and the TLA Facility. Pursuant to the amendment, the maximum total net leverage ratio stepped down to 6.25:1.0 beginning in the fourth fiscal quarter of 2016 until and including the fourth fiscal quarter for 2017, and will gradually decline to 4.0:1.0 by the second fiscal quarter of 2020. Additionally, pursuant to the amendment, the minimum interest coverage ratio dropped to 2.50:1.0 beginning in the fourth fiscal quarter of 2016 until and including the fourth fiscal quarter of 2017. For fiscal quarters in 2018 and 2019, the interest coverage ratio will rise to 2.75:1.0 and 3.0:1.0, respectively.
The Senior Secured Credit Facilities also contain negative covenants that restrict the Company’s ability to (i) incur additional indebtedness; (ii) create certain liens; (iii) consolidate or merge; (iv) sell assets, including capital stock of the Company’s subsidiaries; (v) engage in transactions with the Company’s affiliates; (vi) create restrictions on the payment of dividends or other amounts from the Company’s restricted subsidiaries; (vii) pay dividends on capital stock or redeem, repurchase or retire capital stock; (viii) pay, prepay, repurchase or retire certain subordinated indebtedness; (ix) make investments, loans, advances and acquisitions; (x) make certain amendments or modifications to the organizational documents of the Company or its subsidiaries or the documentation governing other senior indebtedness of the Company; and (xi) change the Company’s type of business. These negative covenants are subject to a total leverage rationumber of not greater than 4.5 to 1.0limitations and a total leverage ratio not greater than 4.25 to 1.0 after January 2, 2016. The calculation of adjusted EBITDA and total leverage ratio excludes non-cash charges, extraordinary, unusual, or non-recurring expenses or losses, non-cash stock-based compensation, and non-recurring expenses or charges incurredexceptions that are described in connection with permitted acquisitions.the Senior Secured Credit Facilities agreement. As of January 3, 2014,December 30, 2016, the Company was in compliance with all financial and negative covenants under the Senior Secured Credit Facility.Facilities.
INTEGER HOLDINGS CORPORATION
NOTES TO CONSOLIDATED FINANCIAL STATEMENTS
(9.)DEBT (Continued)
The Senior Secured Credit Facility containsFacilities provide for customary events of default. Upon the occurrence and during the continuance of an event of default, a majority of the lenders may declare the outstanding advances and all other obligations under the Senior Secured Credit FacilityFacilities become immediately due and payable. The Senior Secured Credit Facilities are guaranteed by Integer Holdings Corporation, as a parent guarantor, and all of the Company’s present and future direct and indirect wholly-owned domestic subsidiaries (other than Greatbatch Ltd. (which is the borrower under the Senior Secured Credit Facilities), non-wholly owned joint ventures, and certain other excluded subsidiaries). The Senior Secured Credit Facilities are secured, subject to certain exceptions, by a first priority security interest in; i) the present and future shares of capital stock of (or other ownership or profit interests in) Greatbatch Ltd. and each guarantor (except Integer Holdings Corporation); ii) sixty-six percent (66%) of all present and future shares of voting capital stock of each specified first-tier foreign subsidiary; iii) substantially all of the Company’s, Greatbatch Ltd.’s and each other guarantor’s other personal property; and iv) all proceeds and products of the property and assets of the Company, Greatbatch Ltd. and the other guarantors.
9.125% Senior Notes due 2023
On October 27, 2015, the Company completed a private offering of $360 million aggregate principal amount of 9.125% senior notes due on November 1, 2023 (the “Senior Notes”). All the Senior Notes are outstanding as of December 30, 2016.
Interest on the Senior Notes is payable on May 1 and November 1 of each year. The Company may redeem the Senior Notes, in whole or in part, prior to November 1, 2018 at a price equal to 100% of the principal amount thereof plus a “make-whole” premium. Prior to November 1, 2018, the Company may redeem up to 40% of the aggregate principal amount of the Senior Notes using the proceeds from certain equity offerings at a redemption price equal to 109.125% of the aggregate principal amount of the Senior Notes. On or after November 1, 2018, the Company may redeem the Senior Notes, in whole or in part, pursuant to a customary schedule of declining redemption prices. As of December 30, 2016, the estimated fair value of the Senior Notes was approximately $359 million, based on quoted market prices of these notes, recent sales prices for the notes and consideration of comparable debt instruments with similar interest rates and trading frequency, among other factors, and is classified as Level 2 measurements within the fair value hierarchy.
The Senior Notes are senior unsecured obligations of the Company. The Senior Notes contain restrictive covenants that, among other things, limit the ability of the Company to: (i) incur or guarantee additional indebtedness or issue certain disqualified stock or preferred stock; (ii) create certain liens; (iii) pay dividends or make distributions in respect of capital stock; (iv) make certain other restricted payments; (v) enter into agreements that restrict certain dividends or other payments; (vi) enter into sale-leaseback agreements; (vii) engage in certain transactions with affiliates; and (viii) consolidate or merge with, or sell substantially all of their assets to, another person. These covenants are subject to a number of limitations and exceptions that are described in the indenture for the Senior Notes. The Senior Notes provide for customary events of default, subject in certain cases to customary cure periods, in which the Senior Notes and any unpaid interest would become due and payable. As of December 30, 2016, the Company was in compliance with all restrictive covenants under the indenture governing the Senior Notes.
As of January 3, 2014,December 30, 2016, the weighted average interest rate on all outstanding borrowings under the Credit Facility, which does not take into account the impactis 5.76%.
Contractual maturities of the Company’s interest rate swap, was 1.56%. Asdebt facilities for the next five years and thereafter, excluding any discounts or premiums, as of January 3, 2014,December 30, 2016 are as follows (in thousands):
|
| | | | | | | | | | | | | | | | | | |
| | 2017 | | 2018 | | 2019 | | 2020 | | 2021 | | After 2021 |
| Future minimum principal payments | $ | 31,344 |
| | 40,719 |
| | 47,750 |
| | 87,750 |
| | 239,937 |
| | 1,323,500 |
|
INTEGER HOLDINGS CORPORATION
NOTES TO CONSOLIDATED FINANCIAL STATEMENTS
(9.)DEBT (Continued)
Debt Issuance Costs and Discounts
The Company incurred debt issuance costs in conjunction with the issuance of the Senior Secured Credit Facilities and the Senior Notes. The change in deferred debt issuance costs related to the Company’s Revolving Credit Facility is as follows (in thousands):
|
| | | |
| January 2, 2015 | $ | 2,200 |
|
| Financing costs deferred | 4,152 |
|
| Write-off during the period | (907 | ) |
| Amortization during the period | (654 | ) |
| January 1, 2016 | 4,791 |
|
| Amortization during the period | (991 | ) |
| December 30, 2016 | $ | 3,800 |
|
The change in unamortized discount and debt issuance costs related to the Term Loan Facilities and Senior Notes is as follows (in thousands):
|
| | | | | | | | | | | |
| | Debt Issuance Costs | | Unamortized Discount on TLB Facility | | Total |
| January 2, 2015 | $ | 887 |
| | $ | — |
| | $ | 887 |
|
| Financing costs incurred | 41,781 |
| | 10,250 |
| | 52,031 |
|
| Write-off during the period | (732 | ) | | — |
| | (732 | ) |
| Amortization during the period | (6,028 | ) | | (211 | ) | | (6,239 | ) |
| January 1, 2016 | 35,908 |
| | 10,039 |
| | 45,947 |
|
| Financing costs incurred | 1,177 |
| | — |
| | 1,177 |
|
| Amortization during the period | (4,989 | ) | | (1,298 | ) | | (6,287 | ) |
| December 30, 2016 | $ | 32,096 |
| | $ | 8,741 |
| | $ | 40,837 |
|
During fiscal year 2015, the Company had $300wrote off $1.6 million of borrowing capacity available underdebt issuance costs in connection with the Credit Facility. This borrowing capacity may vary from period to period based uponextinguishment and modification of its term loan and revolving line of credit, respectively, which is included in Interest Expense on the debtConsolidated Statements of Operations and EBITDA levels of the Company, which impacts the covenant calculations described above.Comprehensive Income (Loss).
INTEGER HOLDINGS CORPORATION
NOTES TO CONSOLIDATED FINANCIAL STATEMENTS
(9.)DEBT (Continued)
Interest Rate Swap – Swaps
From time to time, the Company enters into interest rate swap agreements in order to hedge against potential changes in cash flows on its outstanding variable rate debt. During 2016, the Company entered into a one year $250 million interest rate swap and a three year $200 million interest rate swap to hedge against potential changes in cash flows on its outstanding borrowings onvariable rate debt, which are indexed to the Credit Facility.one-month LIBOR rate. The variable rate received on the interest rate swaps and the variable rate paid on the variable rate debt will have the same rate of interest, excluding the credit spread, and resetswill reset and payspay interest on the same date. During 2012, the Company entered into a three-year $150 million interest rate swap, which amortizes $50 million per year. This swap was entered into in order to hedge against potential changes in cash flows on the outstanding Credit Facility borrowings, whichday. The swaps are also indexed to the one-month LIBOR rate. This swap is being accounted for as a cash flow hedge. hedges.
In connection with the Lake Region Medical acquisition, the Company terminated its then outstanding interest rate swap agreements as the forecasted cash flows that the interest rate swaps were hedging were no longer expected to occur. As a result, during the fourth quarter of 2015, the Company made a $2.8 million payment to the interest rate swap counterparty and recognized a $2.8 million charge to Interest Expense.
Information regarding the Company’s outstanding interest rate swapswaps designated as cash flow hedges as of January 3, 2014December 30, 2016 is as follows (dollars in thousands): |
| | | | | | | | | | | | | | | | | | | | | |
| Instrument | Type of Hedge | | Notional Amount | | Start Date | | End Date | | Pay Fixed Rate | | Current Receive Floating Rate | | Fair Value January 3, 2014 | | Balance Sheet Location |
| Interest rate swap | Cash flow | | $ | 150,000 |
| | Feb-13 | | Feb-16 | | 0.573 | % | | 0.167 | % | | $ | (328 | ) | | Other Long-Term Liabilities |
|
| | | | | | | | | | | | | | | | | | |
| Notional Amount | | Start Date | | End Date | | Pay Fixed Rate | | Receive Current Floating Rate | | Fair Value | | Balance Sheet Location |
| $ | 250,000 |
| | Jul-16 | | Jun-17 | | 0.615 | % | | 0.7561 | % | | $ | 267 |
| | Prepaid Expenses and Other Current Assets |
| $ | 200,000 |
| | Jun-17 | | Jun-20 | | 1.1325 | % | | N/A | | $ | 3,215 |
| | Other Assets |
GREATBATCH, INC.
NOTES TO CONSOLIDATED FINANCIAL STATEMENTS
The estimated fair value of the interest rate swap agreementagreements represents the amount the Company expects to receive (pay) to terminate the contract. No portion of the change in fair value of the Company’s interest rate swapswaps during 2013, 2012,2016, 2015, or 2011 was2014 were considered ineffective. The amount recorded as Interest Expense during 2013, 2012,2016, 2015, and 20112014 related to the Company’s interest rate swaps was $0.5$0.1 million, $0.0$3.5 million and $0.4$0.5 million, respectively.
Convertible Subordinated Notes –(10. In March 2007, the Company issued $197.8 million of convertible subordinated notes (“CSN”) at a 5% discount. CSN accrued interest at 2.25% per annum. The effective interest rate of CSN, which took into consideration the amortization of the discount and deferred fees related to the issuance of these notes, was 8.5%. On February 20, 2013, the Company redeemed all outstanding CSN. The contractual interest and discount amortization for CSN were as follows (in thousands):BENEFIT PLANS |
| | | | | | | | | | | |
| | Year Ended |
| | January 3,
2014 | | December 28,
2012 | | December 30,
2011 |
| Contractual interest | $ | 634 |
| | $ | 4,450 |
| | $ | 4,450 |
|
| Discount amortization | 5,368 |
| | 11,464 |
| | 10,320 |
|
The expected future minimum principal payments under the Credit Facility as of January 3, 2014 is as follows (in thousands):
|
| | | |
| 2014 | $ | 10,000 |
|
| 2015 | 11,250 |
|
| 2016 | 16,250 |
|
| 2017 | 20,000 |
|
| 2018 | 20,000 |
|
| Thereafter | 120,000 |
|
| Total | $ | 197,500 |
|
The Company has the ability and intent to use availability under the Revolving Credit Facility to fund principal payments on the Term Loan.
Deferred Financing Fees - The change in deferred financing fees is as follows (in thousands): |
| | | |
| At December 30, 2011 | $ | 3,149 |
|
| Amortization during the period | (1,093 | ) |
| At December 28, 2012 | 2,056 |
|
| Financing costs deferred | 2,802 |
|
| Write-off during the period | (156 | ) |
| Amortization during the period | (842 | ) |
| At January 3, 2014 | $ | 3,860 |
|
Savings Plan –
The Company sponsors a defined contribution 401(k) plan which covers substantially all of(the “Company plan”), for its U.S. based employees. The plan provides for the deferral of employee compensation under Section 401(k) and a discretionary Company match. In 2013, 2012,2016, 2015, and 2011,2014, this match was 35% per dollar of participant deferral, up to 6% of the total compensation for each participant.legacy Greatbatch associates. Net costs related to this defined contribution plan were $2.0$2.0 million in 20132016, $2.3 million in 2015, and 2012, and $1.6$2.2 million in 2011.2014.
In addition to the above, under the terms of the 401(k) plan document there is an annual discretionary defined contribution of up to 4% of each legacy Greatbatch employee’s eligible compensation based upon the achievement of certain performance targets. This amount is contributed to the 401(k) plan in the form of Company stock. The Company did not make a discretionary stock contribution in 2016 or 2015. Compensation cost recognized related to the defined contribution plan was $4.8 million, $1.9 million, $5.1$4.2 million in 2013, 2012, and 2011, respectively.2014. As of January 3, 2014,December 30, 2016, certain participants in the 401(k) Plan held, 607,287on an aggregate basis, approximately 334,000 shares of Company stock.
Subsequent to the Lake Region Medical acquisition, the Company continued the 401(k) plan previously provided to legacy Lake Region Medical employees. This plan is available to most Lake Region employees whereby employees are allowed to contribute up to, subject to compliance with federal 401(k) plan contribution limits, 50% of gross salary. The Company matches 50% of an employee’s contributions for the first 6% of the employee’s gross salary at a maximum contribution rate per employee of 3% of the employee’s gross salary. The employee’s contributions vest immediately, while the Company’s contributions vest over a five-year period. Net costs related to this defined contribution plan were $4.4 million in 2016 and $0.8 million from the date of acquisition through the fiscal year end in 2015.
In January 2017, the Lake Region Medical plan was merged into the Company plan. Beginning in fiscal year 2017, the Company will match $0.50 per dollar of participant deferral, up to 6% of the base salary for each participant.
GREATBATCH, INC.INTEGER HOLDINGS CORPORATION
NOTES TO CONSOLIDATED FINANCIAL STATEMENTS
Education Assistance Program – The Company reimburses tuition, textbooks and laboratory fees for college or other job related programs for all of its U.S. based employees. The Company also reimburses college tuition for the dependent children of certain full-time U.S. based employees hired prior to 2012, which vests on a straight-line basis over ten years, up to the applicable local state university tuition rate. For certain employees and executives, the dependent children benefit is not limited. Minimum academic achievement is required in order to receive reimbursement under both programs. Aggregate expenses under the programs were $2.0 million, $2.2 million and $1.5 million in 2013, 2012 and 2011, respectively.
(10.) BENEFIT PLANS (Continued)
Defined Benefit Plans –
The Company is required to provide its employees located in Switzerland, Mexico, France, and FranceGermany certain statutorily mandated defined benefits. Under these plans, benefits accrue to employees based upon years of service, position, age and compensation. The defined benefit pension plan provided to the Company’s employees located in Switzerland is a funded contributory plan, while the plans that provide benefits to the Company’s employees located in Mexico, France, and FranceGermany are unfunded and noncontributory. The liability and corresponding expense related to these benefit plans is based on actuarial computations of current and future benefits for employees.
During 2012, the Company transferred most major functions performed at its facilities in Switzerland into other existing facilities. As a result, the Companyfacilities and curtailed its defined benefit plan provided to employees at those Swiss facilities during 2012. In accordance with ASC 715, this gain was recognized in Other Operating Expenses, Net as the related employees were terminated. Since Swiss plan assets were sufficient to cover all plan liabilities, during 2012 the plan assets were transferred into cash.facilities. During 2013, the plan assets that remained after settlement payments were made were transferred to an AA- rated insurance carrier who bears the pension risk and longevity risk, and will be used to cover the pension liability for the remaining retirees of the Swiss plan, as well as the remaining employees at that location.
The Company’s fiscal year end dates are the measurement dates for its defined benefit plans. Information relating to the funding position of the Company’s defined benefit plans as of the plans measurement date of January 3, 2014for fiscal years 2016 and December 28, 20122015 were as follows (in thousands):
| | | | Year Ended | | | | | |
| | January 3,
2014 | | December 28,
2012 | 2016 | | 2015 |
| Change in projected benefit obligation: | | | | | | |
| Projected benefit obligation at beginning of year | $ | 16,215 |
| | $ | 17,053 |
| $ | 7,992 |
| | $ | 2,843 |
|
| Projected benefit obligation acquired | | — |
| | 4,316 |
|
| Service cost | 236 |
| | 1,115 |
| 431 |
| | 439 |
|
| Interest cost | 138 |
| | 409 |
| 174 |
| | 165 |
|
| Prior service cost and plan amendments | (45 | ) | | — |
| |
| Plan participants’ contribution | 134 |
| | 976 |
| 75 |
| | 61 |
|
| Actuarial (gain) loss | (2 | ) | | 958 |
| |
| Benefits paid | 434 |
| | 229 |
| |
| Settlement/curtailment gain | (14,539 | ) | | (4,934 | ) | |
| Actuarial loss | | 341 |
| | 235 |
|
| Benefits transferred in, net | | 84 |
| | 258 |
|
| Foreign currency translation | (149 | ) | | 409 |
| (369 | ) | | (325 | ) |
| Projected benefit obligation at end of year | 2,422 |
| | 16,215 |
| 8,728 |
| | 7,992 |
|
| Change in fair value of plan assets: | | | | | | |
| Fair value of plan assets at beginning of year | 12,269 |
| | 11,484 |
| 871 |
| | 437 |
|
| Employer contributions | 150 |
| | 1,050 |
| 36 |
| | 69 |
|
| Plan participants’ contributions | 134 |
| | 976 |
| 75 |
| | 61 |
|
| Actual gain (loss) on plan assets | (26 | ) | | 644 |
| |
| Benefits paid | 138 |
| | 229 |
| |
| Settlements | (11,780 | ) | | (2,424 | ) | |
| Actual loss on plan assets | | (9 | ) | | (39 | ) |
| Benefits transferred in, net | | 224 |
| | 362 |
|
| Foreign currency translation | (154 | ) | | 310 |
| (25 | ) | | (19 | ) |
| Fair value of plan assets at end of year | 731 |
| | 12,269 |
| 1,172 |
| | 871 |
|
| Projected benefit obligation in excess of plan assets at end of year | $ | 1,691 |
| | $ | 3,946 |
| $ | 7,556 |
| | $ | 7,121 |
|
| Defined benefit liability classified as other current liabilities | $ | 25 |
| | $ | 23 |
| $ | 109 |
| | $ | 46 |
|
| Defined benefit liability classified as long-term liabilities | $ | 1,666 |
| | $ | 3,923 |
| $ | 7,447 |
| | $ | 7,075 |
|
| Accumulated benefit obligation at end of year | $ | 1,684 |
| | $ | 14,606 |
| $ | 7,115 |
| | $ | 6,299 |
|
GREATBATCH, INC.INTEGER HOLDINGS CORPORATION
NOTES TO CONSOLIDATED FINANCIAL STATEMENTS
(10.) BENEFIT PLANS (Continued)
Amounts recognized in Accumulated Other Comprehensive Income (Loss) for fiscal years 2016 and 2015 are as follows (in thousands):
| | | | Year Ended | | | | | |
| | January 3,
2014 | | December 28,
2012 | 2016 | | 2015 |
| Net loss occurring during the year | $ | 25 |
| | $ | 740 |
| $ | 368 |
| | $ | 164 |
|
| Amortization of losses | (722 | ) | | (3,064 | ) | (62 | ) | | (156 | ) |
| Prior service cost | 150 |
| | 342 |
| 1 |
| | (1 | ) |
| Amortization of prior service cost | 33 |
| | (10 | ) | (11 | ) | | (9 | ) |
| Foreign currency translation | 224 |
| | 294 |
| |
| Pre-tax adjustment | (290 | ) | | (1,698 | ) | |
| Pre-tax adjustment (gain) loss | | 296 |
| | (2 | ) |
| Taxes | 18 |
| | 13 |
| 283 |
| | 22 |
|
| Net gain | $ | (272 | ) | | $ | (1,685 | ) | |
| Net loss | | $ | 579 |
| | $ | 20 |
|
The amortization of amounts in Accumulated Other Comprehensive Income (Loss) expected to be recognized as components of net periodic benefit expense during 2014fiscal year 2017 are as follows (in thousands): | | | | | | | |
| Amortization of net prior service cost | $ | 7 |
| $ | 9 |
|
| Amortization of net loss | 12 |
| 61 |
|
Net pension (income) cost for fiscal years 2016 and 2015 is comprised of the following (in thousands):
| | | | Year Ended | | | | | |
| | January 3, 2014 | | December 28, 2012 | 2016 | | 2015 |
| Service cost | $ | 236 |
| | $ | 1,115 |
| $ | 431 |
| | $ | 439 |
|
| Interest cost | 138 |
| | 409 |
| 174 |
| | 165 |
|
| Expected return on assets | — |
| | (425 | ) | (18 | ) | | (11 | ) |
| Recognized net actuarial (gain) loss | (1,929 | ) | | 222 |
| |
| Net pension (income) cost | $ | (1,555 | ) | | $ | 1,321 |
| |
| Recognized net actuarial loss | | 72 |
| | 164 |
|
| Net pension cost | | $ | 659 |
| | $ | 757 |
|
The weighted-average rates used in the actuarial valuations to determine the net pension cost for fiscal years 2016, 2015 and 2014 were as follows:
| | | | Projected Benefit Obligation | | Net Pension Cost | | | | | | |
| | January 3,
2014 | | December 28,
2012 | | 2013 | | 2012 | | 2011 | 2016 | | 2015 | | 2014 |
| Discount rate | 3.4 | % | | 2.1 | % | | 2.1 | % | | 2.5 | % | | 2.9 | % | 2.2 | % | | 2.3 | % | | 3.4 | % |
| Salary growth | 3.1 | % | | 2.4 | % | | 2.4 | % | | 2.3 | % | | 2.5 | % | 2.9 | % | | 3.0 | % | | 3.1 | % |
| Expected rate of return on assets | 2.5 | % | | — | % | | — | % | | 3.5 | % | | 3.8 | % | 2.0 | % | | 2.3 | % | | 2.5 | % |
The weighted-average rates used in the actuarial valuations to determine the projected benefit obligation for fiscal years 2016, 2015 and 2014 were as follows: |
| | | | | | | | |
| | 2016 | | 2015 | | 2014 |
| Discount rate | 1.9 | % | | 2.2 | % | | 2.3 | % |
| Salary growth | 2.9 | % | | 2.9 | % | | 3.0 | % |
| Expected rate of return on assets | 1.5 | % | | 2.0 | % | | 2.3 | % |
The discount rate used is based on the yields of AA bonds with a duration matching the duration of the liabilities plus approximately 50 basis points to reflect the risk of investing in corporate bonds. The expected rate of return on plan assets reflects earnings expectations on existing plan assets.
GREATBATCH, INC.INTEGER HOLDINGS CORPORATION
NOTES TO CONSOLIDATED FINANCIAL STATEMENTS
Plan assets were comprised of the following (in thousands):
|
| | | | | | | | | | | | | | | |
| | | | Fair Value Measurements Using |
| | January 3, 2014 | | Quoted Prices in Active Markets for Identical Assets (Level 1) | | Significant Other Observable Inputs (Level 2) | | Significant Unobservable Inputs (Level 3) |
| Insurance contract | $ | 731 |
| | $ | — |
| | $ | 731 |
| | $ | — |
|
| Total | $ | 731 |
| | $ | — |
| | $ | 731 |
| | $ | — |
|
|
| | | | | | | | | | | | | | | |
| | | | Fair Value Measurements Using |
| | December 28,
2012 | | Quoted Prices in Active Markets for Identical Assets (Level 1) | | Significant Other Observable Inputs (Level 2) | | Significant Unobservable Inputs (Level 3) |
| Cash | $ | 12,269 |
| | $ | 12,269 |
| | $ | — |
| | $ | — |
|
| Total | $ | 12,269 |
| | $ | 12,269 |
| | $ | — |
| | $ | — |
|
(10.) BENEFIT PLANS (Continued)
The following table provides information by level for the defined benefit plan assets that are measured at fair value as of LevelDecember 30, 2016 and January 1, plan assets are obtained by reference to the last quoted price of the identical security on the active market which it trades. 2016 (in thousands). |
| | | | | | | | | | | | | | | |
| | Fair Value | | Quoted Prices in Active Markets (Level 1) | | Significant Other Observable Inputs (Level 2) | | Significant Unobservable Inputs (Level 3) |
| December 30, 2016 | | | | | | | |
| Insurance contract | $ | 1,172 |
| | $ | — |
| | $ | 1,172 |
| | $ | — |
|
| January 1, 2016 | | | | | | | |
| Insurance contract | $ | 871 |
| | $ | — |
| | $ | 871 |
| | $ | — |
|
The fair value of Level 2 plan assets are obtained from quoted market prices in inactive markets or valuation models with observable market data inputs to estimate fair value. These observable market data inputs include benchmark yields, reported trades, broker/dealer quotes, issuer spreads, benchmark securities, bids, offers and reference data. Refer to Note 1 “Summary of Significant Accounting Policies” for discussion of the fair value measurement terms of Levels 1, 2, and 3.
Estimated benefit payments over for the next ten years as of December 30, 2016 are as follows (in thousands):
|
| | | |
| 2014 | $ | 381 |
|
| 2015 | 39 |
|
| 2016 | 88 |
|
| 2017 | 132 |
|
| 2018 | 107 |
|
| 2019-2023 | 910 |
|
|
| | | | | | | | | | | | | | | | | | |
| | 2017 | | 2018 | | 2019 | | 2020 | | 2021 | | 2022-2026 |
| Estimated benefit payments | $ | 261 |
| | 191 |
| | 266 |
| | 216 |
| | 251 |
| | 1,888 |
|
GREATBATCH, INC.
NOTES TO CONSOLIDATED FINANCIAL STATEMENTS
|
| | |
11. | | STOCK-BASED COMPENSATION |
The components and classification of stock-based compensation expense were as follows (in thousands):(11.) STOCK-BASED COMPENSATION
|
| | | | | | | | | | | |
| | Year Ended |
| | January 3,
2014 | | December 28,
2012 | | December 30,
2011 |
| Stock options | $ | 3,490 |
| | $ | 2,786 |
| | $ | 2,511 |
|
| Restricted stock and units | 5,843 |
| | 6,233 |
| | 4,526 |
|
| 401(k) stock contribution | 4,768 |
| | 1,885 |
| | 5,045 |
|
| Total stock-based compensation expense | $ | 14,101 |
| | $ | 10,904 |
| | $ | 12,082 |
|
| | | | | | |
| Cost of sales | $ | 3,864 |
| | $ | 2,620 |
| | $ | 4,184 |
|
| Selling, general and administrative expenses | 7,907 |
| | 7,684 |
| | 6,630 |
|
| Research, development and engineering costs, net | 1,194 |
| | 600 |
| | 1,268 |
|
| Other operating expenses, net (Note 13) | 1,136 |
| | — |
| | — |
|
| Total stock-based compensation expense | $ | 14,101 |
| | $ | 10,904 |
| | $ | 12,082 |
|
During 2013, the Company recorded within Other Operating Expenses, Net stock compensation modification expense related to the 2013 operating unit realignment, which is discussed in Note 13 “Other Operating Expenses, Net.”
Summary ofStock-based Compensation Plans
At the 2016 Annual Meeting of Stockholders held on May 24, 2016, the Company’s stockholders approved the Company’s 2016 Stock Incentive Plan (the “2016 Plan”). The 2016 Plan provides for the granting of stock options, shares of restricted stock, restricted stock units, stock appreciation rights and stock bonuses to employees, non-employee directors, consultants, and service providers. The 2016 Plan supplements the Company’s 1998existing 2009 Stock OptionIncentive Plan (“2009 Plan”), as amended, and Non-Employee Directors2011 Stock Incentive Plan have(“2011 Plan”), as amended.
Stock options remain outstanding under the 2005 Stock Incentive Plan, but the plan has been frozen to any new award issuances. Stock options remain outstanding under these plans.
The Company’s 2005 Stock Incentive2009 Plan (“2005 Plan”), as amended, authorizes the issuance of up to 2,450,000 shares of equity incentive awards including nonqualified and incentive stock options, restricted stock, restricted stock units, stock bonuses and stock appreciation rights subject to the terms of the 2005 Plan. The 2005 Plan limits the amount of restricted stock, restricted stock units and stock bonuses that may be awarded in the aggregate to 850,000 shares of the 2,450,000 shares authorized by the 2005 Plan.
The Company’s 2009 Stock Incentive Plan (“2009 Plan”) authorizes the issuance of up to 1,350,000 shares of equity incentive awards including nonqualified and incentive stock options, restricted stock, restricted stock units, stock bonuses and stock appreciation rights subject to the terms of the 2009 Plan. The 2009 Plan limits the amount of restricted stock, restricted stock units and stock bonuses that may be awarded in the aggregate to 200,000 shares of the 1,350,000 shares authorized.
The Company’s 2011 Stock Incentive Plan (“2011 Plan”) authorizes the issuance of up to 1,000,0001,350,000 shares of equity incentive awards including nonqualified and incentive stock options, restricted stock, restricted stock units, stock bonuses and stock appreciation rights, subject to the terms of the 2011 Plan. The 2011 Plan does not limit the amount of restricted stock, restricted stock units or stock bonuses that may be awarded.
The 2016 Plan authorizes the issuance of up to 1,450,000 shares of equity incentive awards including nonqualified and incentive stock options, restricted stock, restricted stock units, stock bonuses and stock appreciation rights, subject to the terms of the 2016 Plan.
As of January 3, 2014,December 30, 2016, there were 219,722, 517,3561,316,690, 120,676 and 187,09865,910 shares available for future grants under the 2016 Plan, 2011 Plan 2009 Plan and 20052009 Plan, respectively. Due to plan sub-limits, of the shares available for grant, only 58,510 shares and 189,21810,261 shares may be awarded under the 2009 Plan and the 2005 Plan, respectively, in the form of restricted stock, restricted stock units or stock bonuses.
Stock Options
Stock options granted generally vest over a three or four year period, expire 10 years from the date of grant, and are granted at exercise prices equal to or greater than the fair value of the Company’s common stock on the date of grant. Performance-based stock options only vest if certain performance metrics are achieved. The performance metrics generally cover a three-year performance period beginning in the year of grant and include the achievement of revenue, adjusted operating earnings and adjusted operating cash flow targets. In 2010, the Company began issuing all performance stock-based awards in the form of restricted stock units.
The Company utilizes the Black-Scholes option pricing model to determine the fair value of stock options. Management is required to make certain assumptions with respect to selected model inputs. Expected volatility is based on the historical volatility of the Company’s stock over the most recent period commensurate with the estimated expected life
GREATBATCH, INC.INTEGER HOLDINGS CORPORATION
NOTES TO CONSOLIDATED FINANCIAL STATEMENTS
(11.)STOCK-BASED COMPENSATION (Continued)
In connection with the Spin-off, under the provisions of the stock options. The expected life of2009 Plan and 2011 Plan, employee stock options, restricted stock awards, and restricted stock unit awards were adjusted to preserve the fair value of the awards immediately before and after the Spin-off. As such, the Company did not record any modification expense related to the conversion of the awards. Certain awards granted to employees who transferred to Nuvectra in connection with the Spin-off were canceled. As required, the Company accelerated the remaining expense related to these canceled awards of $0.5 million during the first quarter of 2016, which representswas classified as Other Operating Expenses, Net. The stock awards held as of March 14, 2016 were modified as follows:
Stock options: Holders of the period of time that theCompany’s stock option awards continued to hold stock options are expected to be outstanding, is based on historical data.purchase the same number of shares of Integer common stock at an adjusted exercise price and one new Nuvectra stock option for every three Integer stock options held as of the Record Date, which, in the aggregate, preserved the fair value of the overall awards granted. The expected dividend yield is based onadjusted exercise price for Integer stock options was equal to approximately 93% of the original exercise price. The stock option awards will continue to vest over their original vesting period.
Restricted stock and restricted stock units: Holders of the Company’s historyrestricted stock and expectationrestricted stock unit awards received one new share of future dividend payouts. The risk-free interest rate is based onNuvectra restricted stock and restricted stock unit awards for every three Integer restricted stock and restricted stock unit awards held as of the U.S. Treasury yield curveRecord Date. Integer restricted stock and restricted stock unit awards will continue to vest in effect at the time of grant for a period commensurateaccordance with the estimated expected life. If factors changetheir original performance metrics and result in different assumptions, the stock option expense that the Company records for future grants may differ significantly from whatover their original vesting period.
During 2014, the Company recorded stock modification expense related to employee separation costs incurred during 2014 in the current period. Stock-based compensationconnection with realignment initiatives. This modification expense is only recordedwas included within Other Operating Expenses, Net. Refer to Note 13 “Other Operating Expenses, Net” for those awards that are expected to vest. Pre-vesting forfeiture estimates for determining appropriatefurther discussion of these initiatives.
The components and classification of stock-based compensation expense are estimated at the time of grant based on historical experience. Revisions are made to those estimates in subsequent periods if actual forfeitures differ from estimated forfeitures.for fiscal years 2016, 2015 and 2014 were as follows (in thousands):
The weighted-average fair value and assumptions used are as follows: |
| | | | | | | | | | | |
| | Year Ended |
| | January 3,
2014 | | December 28,
2012 | | December 30,
2011 |
| Weighted average grant date fair value | $ | 8.38 |
| | $ | 8.20 |
| | $ | 9.37 |
|
| Risk-free interest rate | 0.73 | % | | 0.83 | % | | 2.02 | % |
| Expected volatility | 39 | % | | 40 | % | | 40 | % |
| Expected life (in years) | 5.3 |
| | 5.3 |
| | 5.3 |
|
| Expected dividend yield | 0 | % | | 0 | % | | 0 | % |
| Annual prevesting forfeiture rate | 9 | % | | 9 | % | | 9 | % |
|
| | | | | | | | | | | |
| | 2016 | | 2015 | | 2014 |
| Stock options | $ | 2,499 |
| | $ | 2,708 |
| | $ | 2,523 |
|
| Restricted stock and units | 5,909 |
| | 6,668 |
| | 6,417 |
|
| 401(k) stock contribution | — |
| | — |
| | 4,246 |
|
| Total stock-based compensation expense | $ | 8,408 |
| | $ | 9,376 |
| | $ | 13,186 |
|
| | | | | | |
| Cost of sales | $ | 332 |
| | $ | 795 |
| | $ | 3,530 |
|
| Selling, general and administrative expenses | 6,246 |
| | 7,510 |
| | 7,923 |
|
| Research, development and engineering costs, net | 355 |
| | 982 |
| | 1,440 |
|
| Other operating expenses, net (Note 13) | 1,475 |
| | 89 |
| | 293 |
|
| Total stock-based compensation expense | $ | 8,408 |
| | $ | 9,376 |
| | $ | 13,186 |
|
Weighted Average Fair Values and Black-Scholes Valuation Assumptions
The following table summarizes time-vestedprovides the weighted average grant date fair values of the Company's restricted stock option activity:awards, restricted stock units and performance-based restricted stock units during fiscal years 2016, 2015 and 2014:
|
| | | | | | | | | | | | |
| | Number of Time-Vested Stock Options | | Weighted Average Exercise Price | | Weighted Average Remaining Contractual Life (In Years) | | Aggregate Intrinsic Value (In Millions) |
| Outstanding at December 31, 2010 | 1,463,556 |
| | $ | 23.46 |
| | | | |
| Granted | 306,449 |
| | 23.98 |
| | | | |
| Exercised | (84,237 | ) | | 21.41 |
| | | | |
| Forfeited or expired | (126,997 | ) | | 26.47 |
| | | | |
| Outstanding at December 30, 2011 | 1,558,771 |
| | 23.42 |
| | | | |
| Granted | 395,978 |
| | 22.19 |
| | | | |
| Exercised | (52,683 | ) | | 20.77 |
| | | | |
| Forfeited or expired | (126,219 | ) | | 24.21 |
| | | | |
| Outstanding at December 28, 2012 | 1,775,847 |
| | 23.17 |
| | | | |
| Granted | 372,676 |
| | 23.33 |
| | | | |
| Exercised | (443,428 | ) | | 23.24 |
| | | | |
| Forfeited or expired | (88,686 | ) | | 28.05 |
| | | | |
| Outstanding at January 3, 2014 | 1,616,409 |
| | $ | 22.92 |
| | 6.4 | | $ | 33.7 |
|
| Expected to vest at January 3, 2014 | 1,593,861 |
| | $ | 22.92 |
| | 6.3 | | $ | 33.3 |
|
| Exercisable at January 3, 2014 | 1,342,675 |
| | $ | 22.92 |
| | 5.9 | | $ | 28.0 |
|
|
| | | | | | | | | | | |
| | 2016 | | 2015 | | 2014 |
| Weighted average grant date fair values: | | | | | |
| Restricted stock and restricted stock units | $ | 47.95 |
| | $ | 49.84 |
| | $ | 44.78 |
|
| Performance-based restricted stock units | 30.83 |
| | 32.92 |
| | 31.33 |
|
GREATBATCH, INC.INTEGER HOLDINGS CORPORATION
NOTES TO CONSOLIDATED FINANCIAL STATEMENTS
(11.)STOCK-BASED COMPENSATION (Continued)
The following table includes the weighted average grant date fair value of stock options granted to employees during fiscal years 2016, 2015 and 2014 and the related weighted average assumptions used in the Black-Scholes model:
|
| | | | | | | | | | | |
| | 2016 | | 2015 | | 2014 |
| Fair value of options granted: | $ | 8.52 |
| | $ | 12.18 |
| | $ | 16.43 |
|
| Assumptions: | | | | | |
| Expected life of option from grant date (in years) | 4.7 |
| | 4.7 |
| | 5.3 |
|
| Risk-free interest rate | 1.49 | % | | 1.55 | % | | 1.73 | % |
| Expected volatility | 27 | % | | 26 | % | | 39 | % |
| Expected dividend yield | 0 | % | | 0 | % | | 0 | % |
Stock-Based Compensation Activity
The following table summarizes performance-vested stock option activity:activity under all stock-based compensation plans during the fiscal year ended December 30, 2016:
| | | | Number of Performance- Vested Stock Options | | Weighted Average Exercise Price | | Weighted Average Remaining Contractual Life (In Years) | | Aggregate Intrinsic Value (In Millions) | Number of Stock Options | | Weighted Average Exercise Price | | Weighted Average Remaining Contractual Term (in years) | | Aggregate Intrinsic Value (in millions) |
| Outstanding at December 31, 2010 | 744,523 |
| | $ | 23.68 |
| | | | | |
| Outstanding at January 1, 2016 | | 1,678,900 |
| | $ | 28.32 |
| | |
| Granted | | 316,678 |
| | 42.82 |
| | |
| Exercised | (26,478 | ) | | 22.53 |
| | | (130,459 | ) | | 21.61 |
| | |
| Forfeited or expired | (239,681 | ) | | 22.29 |
| | | (125,147 | ) | | 44.76 |
| | |
| Outstanding at December 30, 2011 | 478,364 |
| | 24.44 |
| | | |
| Exercised | (7,657 | ) | | 22.04 |
| | | |
| Forfeited or expired | (185,782 | ) | | 26.35 |
| | | |
| Outstanding at December 28, 2012 | 284,925 |
| | 23.26 |
| | | |
| Exercised | (107,664 | ) | | 23.23 |
| | | |
| Forfeited or expired | — |
| | — |
| | | |
| Outstanding at January 3, 2014 | 177,261 |
| | $ | 23.27 |
| | 3.4 | | $ | 3.6 |
| |
| Expected to vest at January 3, 2014 | 177,261 |
| | $ | 23.27 |
| | 3.4 | | $ | 3.6 |
| |
| Exercisable at January 3, 2014 | 177,261 |
| | $ | 23.27 |
| | 3.4 | | $ | 3.6 |
| |
| Adjustment due to Spin-off | | — |
| | (2.02 | ) | | |
| Outstanding at December 30, 2016 | | 1,739,972 |
| | $ | 28.26 |
| | 5.7 | | $ | 11.0 |
|
| Vested and expected to vest at December 30, 2016 | | 1,723,137 |
| | $ | 28.07 |
| | 5.7 | | $ | 11.0 |
|
| Exercisable at December 30, 2016 | | 1,484,481 |
| | $ | 26.26 |
| | 5.7 | | $ | 10.3 |
|
Intrinsic value is calculated for in-the-money options (exercise price less than market price) outstanding and/or exercisable as the difference between the market price of the Company’s common shares as of January 3, 2014 ($43.80)December 30, 2016 ($29.45) and the weighted average exercise price of the underlying stock options, multiplied by the number of options outstanding and/or exercisable. As of January 3, 2014, $2.1December 30, 2016, $1.4 million of unrecognized compensation cost related to non-vested stock options is expected to be recognized over a weighted-average period of approximately 21.4 years. Shares are distributed from the Company’s authorized but unissued reserve upon the exercise of stock options or treasury stock if available. The Company does not intend to purchase treasury shares to fund the future exercises of stock options.
Proceeds from the exercise of stock options are credited to common stock at par value and the excess is credited to additional paid-in capital. A portion of the options outstanding qualify as incentive stock options (“ISO”) for income tax purposes. As such, a tax benefit is not recorded at the time the compensation cost related to the stock options is recorded for book purposes due to the fact that an ISO does not ordinarily result in a tax benefit unless there is a disqualifying disposition. Stock option grants of non-qualified stock options result in the creation of a deferred tax asset, which is a temporary difference, until the time that the option is exercised.
The following table provides certain information relating to the exercise of stock options during fiscal years 2016, 2015 and 2014 (in thousands):
| | | | Year Ended | | | | | | | |
| | January 3,
2014 | | December 28,
2012 | | December 30,
2011 | 2016 | | 2015 | | 2014 |
| Intrinsic value | $ | 6,807 |
| | $ | 148 |
| | $ | 501 |
| $ | 690 |
| | $ | 8,231 |
| | $ | 7,997 |
|
| Cash received | 12,807 |
| | 1,263 |
| | 2,401 |
| 2,821 |
| | 6,583 |
| | 8,278 |
|
| Tax benefit (expense) realized | 727 |
| | (132 | ) | | (146 | ) | |
| Tax benefit realized | | — |
| | 1,954 |
| | 1,704 |
|
GREATBATCH, INC.INTEGER HOLDINGS CORPORATION
NOTES TO CONSOLIDATED FINANCIAL STATEMENTS
(11.)STOCK-BASED COMPENSATION (Continued)
Restricted Stock and Restricted Stock Units
Time-vested restricted stock and restricted stock unit awards granted typically vest in equal annual installments over a three or four year period. The fair value of time-based as well as nonmarket-based performance restricted stock and restricted stock unit awards is equal to the fair value of the Company’s stock on the date of grant. The following table summarizes time-vested restricted stock and restricted stock unit activity:activity under all stock-based compensation plans during the fiscal year ended December 30, 2016: | | | | Time-Vested Activity | | Weighted Average Fair Value | Time-Vested Restricted Stock Units and Awards | | Weighted Average Grant Date Fair Value |
| Nonvested at December 31, 2010 | 123,386 |
| | $ | 22.57 |
| |
| Nonvested at January 1, 2016 | | 39,235 |
| | $ | 47.40 |
|
| Granted | 31,625 |
| | 23.49 |
| 52,697 |
| | 47.95 |
|
| Vested | (80,825 | ) | | 22.80 |
| (40,304 | ) | | 49.64 |
|
| Forfeited | (4,244 | ) | | 22.98 |
| (12,234 | ) | | 48.46 |
|
| Nonvested at December 30, 2011 | 69,942 |
| | 22.69 |
| |
| Granted | 92,265 |
| | 23.49 |
| |
| Vested | (74,901 | ) | | 22.83 |
| |
| Forfeited | (7,037 | ) | | 22.56 |
| |
| Nonvested at December 28, 2012 | 80,269 |
| | 23.48 |
| |
| Granted | 67,230 |
| | 26.76 |
| |
| Vested | (74,062 | ) | | 23.93 |
| |
| Forfeited | (5,862 | ) | | 22.26 |
| |
| Nonvested at January 3, 2014 | 67,575 |
| | $ | 26.37 |
| |
| Nonvested at December 30, 2016 | | 39,394 |
| | $ | 45.51 |
|
Performance-vestedThe following table summarizes performance-vested restricted stock granted prior to 2010 vests uponand restricted stock unit activity under all stock-based compensation plans during the achievement of certain annual diluted EPS targets by the Company, or the seventh anniversary date of the award.fiscal year ended December 30, 2016:
|
| | | | | | |
| | Performance- Vested Restricted Stock Units and Awards | | Weighted Average Grant Date Fair Value |
| Nonvested at January 1, 2016 | 577,825 |
| | $ | 25.11 |
|
| Granted | 163,651 |
| | 30.83 |
|
| Vested | (254,340 | ) | | 16.19 |
|
| Forfeited | (130,550 | ) | | 31.16 |
|
| Nonvested at December 30, 2016 | 356,586 |
| | $ | 31.87 |
|
Performance-based restricted stock units granted only vest if certain market-based performance metrics are achieved. The amount of shares that ultimately vest range from 0 shares to 779,678356,586 shares based upon the total shareholder return of the Company relative to the Company’s compensation peer group over a three yearthree-year performance period beginning in the year of grant. The fair value of the restricted stock units waswere determined by utilizing a Monte Carlo simulation model, which projects the value of Greatbatchthe Company’s stock versus the peer group under numerous scenarios and determines the value of the award based upon the present value of these projected outcomes. The following table summarizes performance-vested restricted stock and stock unit activity related to the Company’s plans:
|
| | | | | | |
| | Performance- Vested Activity | | Weighted Average Fair Value |
| Nonvested at December 31, 2010 | 283,797 |
| | $ | 15.10 |
|
| Granted | 279,415 |
| | 18.21 |
|
| Vested | (6,600 | ) | | 17.94 |
|
| Forfeited | (26,869 | ) | | 15.85 |
|
| Nonvested at December 30, 2011 | 529,743 |
| | 16.68 |
|
| Granted | 332,918 |
| | 15.30 |
|
| Vested | (15,500 | ) | | 24.64 |
|
| Forfeited | (64,715 | ) | | 15.72 |
|
| Nonvested at December 28, 2012 | 782,446 |
| | 16.02 |
|
| Granted | 318,169 |
| | 15.86 |
|
| Vested | (49,139 | ) | | 14.68 |
|
| Forfeited | (271,798 | ) | | 14.94 |
|
| Nonvested at January 3, 2014 | 779,678 |
| | $ | 16.41 |
|
GREATBATCH, INC.
NOTES TO CONSOLIDATED FINANCIAL STATEMENTS
The realized tax benefit (expense) from the vesting of restricted stock and restricted stock units was $(0.4)$2.3 million,, $(0.02) $3.4 million and $0.008$2.3 million for 2013, 20122016, 2015 and 2011,2014, respectively. As of January 3, 2014,December 30, 2016, there was $10.5$4.6 million of total unrecognized compensation cost related to the restricted stock and restricted stock unit awards. That cost is expected to be recognized over a weighted-average period of approximately 21.4 years. The fair value of shares vested in 2013, 20122016, 2015 and 20112014 was $4.0$11.8 million,, $1.5 $16.1 million and $1.9$12.5 million,, respectively.
|
| | |
12. | | RESEARCH, DEVELOPMENT AND ENGINEERING COSTS, NET |
Research, Development(12.)RESEARCH, DEVELOPMENT AND ENGINEERING COSTS, NET
RD&E costs for fiscal years 2016, 2015 and Engineering Costs, Net2014 are comprised of the following (in thousands): | | | | Year Ended | 2016 | | 2015 | | 2014 |
| | January 3,
2014 | | December 28,
2012 | | December 30,
2011 | |
| Research and development costs | $ | 17,953 |
| | $ | 24,071 |
| | $ | 19,014 |
| |
| Engineering costs | 44,699 |
| | 38,777 |
| | 35,472 |
| |
| Research, development and engineering costs | | $ | 61,175 |
| | $ | 59,767 |
| | $ | 58,974 |
|
| Less: cost reimbursements | (8,575 | ) | | (10,358 | ) | | (8,973 | ) | (6,174 | ) | | (6,772 | ) | | (9,129 | ) |
| Total research, development and engineering costs, net | $ | 54,077 |
| | $ | 52,490 |
| | $ | 45,513 |
| $ | 55,001 |
| | $ | 52,995 |
| | $ | 49,845 |
|
| | | | | | | |
INTEGER HOLDINGS CORPORATION
NOTES TO CONSOLIDATED FINANCIAL STATEMENTS
|
| | |
13. | | OTHER OPERATING EXPENSES, NET |
(13.)OTHER OPERATING EXPENSES, NET
Other Operating Expenses, Net for fiscal years 2016, 2015 and 2014 is comprised of the following (in thousands): |
| | | | | | | | | | | |
| | Year Ended |
| | January 3,
2014 | | December 28,
2012 | | December 30,
2011 |
| 2013 operating unit realignment | $ | 5,625 |
| | $ | — |
| | $ | — |
|
| Orthopaedic facility optimization | 8,038 |
| | 32,482 |
| | 425 |
|
| Medical device facility optimization | 312 |
| | 1,525 |
| | — |
|
| ERP system upgrade | 783 |
| | 5,041 |
| | — |
|
| Acquisition and integration (income) costs | (502 | ) | | 1,460 |
| | — |
|
| Asset dispositions, severance and other | 1,534 |
| | 1,838 |
| | 168 |
|
| Total other operating expenses, net | $ | 15,790 |
| | $ | 42,346 |
| | $ | 593 |
|
| | | | | | |
|
| | | | | | | | | | | |
| | 2016 | | 2015 | | 2014 |
| 2014 investments in capacity and capabilities | $ | 17,159 |
| | $ | 23,037 |
| | $ | 8,925 |
|
| Orthopedic facilities optimization | 747 |
| | 1,395 |
| | 1,317 |
|
| Lake Region Medical consolidations | 8,584 |
| | 1,961 |
| | — |
|
| Acquisition and integration costs | 28,316 |
| | 33,449 |
| | 3 |
|
| Asset dispositions, severance and other | 6,931 |
| | 6,622 |
| | 4,106 |
|
| 2013 operating unit realignment | — |
| | — |
| | 1,017 |
|
| Other consolidation and optimization income | — |
| | — |
| | (71 | ) |
| Total other operating expenses, net | $ | 61,737 |
| | $ | 66,464 |
| | $ | 15,297 |
|
2013 operating unit realignment. 2014 Investments in Capacity and Capabilities
In 2013,2014, the Company initiated a planannounced several initiatives to realigninvest in capacity and capabilities and to better align its operating structureresources to meet its customers’ needs and drive organic growth and profitability. These included the following:
Functions performed at the Company’s facility in orderPlymouth, MN to optimize its continued focus on profitable growth. As part of this initiative,manufacture catheters and introducers will transfer into the sales and marketing and operations groups of its former Implantable Medical and Electrochem reportable segments were combined into one sales and marketing and one operations group serving the entire Company.Company’s existing facility in Tijuana, Mexico. This initiative is expected to be substantially completed overby the next six months.first half of 2017 and is dependent upon the Company’s customers’ validation and qualification of the transferred products as well as regulatory approvals worldwide.
Functions performed at the Company’s facilities in Beaverton, OR and Raynham, MA to manufacture products for the portable medical market transferred to a new facility in Tijuana, Mexico. Products manufactured at the Beaverton facility, which do not serve the portable medical market, were transferred to the Company’s Raynham facility. This initiative was substantially completed during the first half of 2016. The final closure of the Beaverton, OR site occurred in the fourth quarter of 2016.
The design engineering responsibilities previously performed at the Company’s Cleveland, OH facility were transferred to the Company’s facilities in Minnesota in 2015.
The realignment of the Company’s commercial sales operations was completed in 2015.
The total capital investment expected for these initiatives is between $24.0 million and $25.0 million, of which $23.3 million has been expended through December 30, 2016. Total restructuring charges expected to be incurred in connection with this realignment are between $6.5$50.0 million and $7.0$55.0 million, of which $5.6$49.1 million havehas been incurred to date.through December 30, 2016. Expenses related to this initiative will bewere primarily recorded within the applicableMedical segment that the expenditures relate to and include the following:
Severance and retention: $5.0$6.0 million - $5.2$7.0 million;
Accelerated depreciation and asset write-offs: $3.0 million - $3.0 million; and
Other: $1.5$41.0 million - $1.8 million.$45.0 million
Other costsexpenses primarily consist of relocation, recruitmentcosts to relocate certain equipment and personnel, duplicate personnel costs, excess overhead, disposal, and travel expenditures. All expenses are cash expenditures except accelerated depreciation and asset write-offs. The change in accrued liabilities related to the 2013 operating unit realignment2014 investments in capacity and capabilities is as follows (in thousands): |
| | | | | | | | | | | |
| | Severance and Retention | | Other | | Total |
| At December 28, 2012 | $ | — |
| | $ | — |
| | $ | — |
|
| Restructuring charges | 4,153 |
| | 1,472 |
| | 5,625 |
|
| Non-cash settlement (modification expense - Note 11) | (1,136 | ) | | — |
| | (1,136 | ) |
| Cash payments | (2,552 | ) | | (726 | ) | | (3,278 | ) |
| At January 3, 2014 | $ | 465 |
| | $ | 746 |
| | $ | 1,211 |
|
|
| | | | | | | | | | | | | | | |
| | Severance and Retention | | Accelerated Depreciation/ Asset Write-offs | | Other | | Total |
| January 1, 2016 | $ | 1,429 |
| | $ | — |
| | $ | 1,595 |
| | $ | 3,024 |
|
| Restructuring charges | 397 |
| | 2,451 |
| | 14,311 |
| | 17,159 |
|
| Write-offs | — |
| | (2,451 | ) | | — |
| | (2,451 | ) |
| Cash payments | (1,760 | ) | | — |
| | (15,906 | ) | | (17,666 | ) |
| December 30, 2016 | $ | 66 |
| | $ | — |
| | $ | — |
| | $ | 66 |
|
GREATBATCH, INC.INTEGER HOLDINGS CORPORATION
NOTES TO CONSOLIDATED FINANCIAL STATEMENTS
Orthopaedic facility optimization.(13.)OTHER OPERATING EXPENSES, NET (Continued)
Orthopedic Facilities Optimization
In 2010, the Company began updating its Indianapolis, IN facility to streamline operations, consolidate two buildings, increase capacity, further expand capabilities and reduce dependence on outside suppliers. This initiative was completed in 2011.
In 2011, the Company began construction onof an orthopaedicorthopedic manufacturing facility in Fort Wayne, IN and transferred manufacturing operations being performed at its Columbia City, IN location into this new facility. This initiative was completed in 2012.
During 2012, the Company transferred most major functions previouslymanufacturing and development operations performed at its facilities in Orvin and Corgemont, Switzerland into existing facilities in Fort Wayne, IN and Tijuana, Mexico. This initiative was completed in 2013.
In connection with this consolidation, in 2012,2013, the Company entered into an agreementsold assets related to sell certain non-core Swiss orthopaedicorthopedic product lines to an independent third party includingparty. The purchase agreement provided the Company with an earn out payment based upon the amount of inventory PP&Econsumed by the purchaser within one year after the close of the transaction. As a result of this earn out, a gain of $2.7 million was recorded in Other Operating Expenses, Net and technology on hand relatedthe cash was received during 2014. During 2014, the Company transferred $2.1 million of assets relating to the Company’s Orvin, Switzerland property to held for sale and recognized a $0.4 million impairment charge. During 2015, the Company sold $0.6 million of these product lines. Seeassets held for sale with no additional gain or loss recognized. Refer to Note 5 “Assets Held for Sale,”For Sale” for additional information regarding this transaction.information.
During 2013, the Company began a project to expand its Chaumont, France facility in order to enhance its capabilities and fulfill larger volume customer supply agreements. This initiative is expected to be completed over the next three years.in 2017.
The total capital investment expected to be incurred for these initiatives is between $30$31.0 million and $35$35.0 million,, of which $22$30.0 million has been expended to date.through December 30, 2016. Total expense expected to be incurred for these initiatives is between $45$45.0 million and $50$48.0 million,, of which $41.2$44.6 million has been incurred to date.through December 30, 2016. All expenses have been and will be recorded within the Greatbatch Medical segment and are expected to include the following:
•Severance and retention: $11 million;approximately $11.0 million;
•Accelerated depreciation and asset write-offs: $15approximately $13.0 million; and
Other: $21.0 million; - $24.0 million
•Other: $19 million - $24 million.
Other expenses include production inefficiencies, moving, revalidation, personnel, training, consulting, and travel costs associated with these consolidation projects. All expenses are cash expenditures except accelerated depreciation and asset write-offs. The change in accrued liabilities related to the Orthopaedic facilityorthopedic facilities optimizations is as follows (in thousands):
| | | | Severance and Retention | | Accelerated Depreciation/ Asset Write-offs | | Other | | Total | Severance and Retention | | Accelerated Depreciation/ Asset Write-offs | | Other | | Total |
| At December 28, 2012 | $ | 9,567 |
| | $ | — |
| | $ | — |
| | $ | 9,567 |
| |
| January 1, 2016 | | $ | — |
| | $ | — |
| | $ | — |
| | $ | — |
|
| Restructuring charges | 624 |
| | 507 |
| | 6,907 |
| | 8,038 |
| — |
| | 202 |
| | 545 |
| | 747 |
|
| Write-offs | — |
| | (507 | ) | | — |
| | (507 | ) | — |
| | (202 | ) | | — |
| | (202 | ) |
| Liability assumed by third party (Note 5) | (2,398 | ) | | — |
| | — |
| | (2,398 | ) | |
| Cash payments | (7,793 | ) | | — |
| | (6,050 | ) | | (13,843 | ) | — |
| | — |
| | (545 | ) | | (545 | ) |
| At January 3, 2014 | $ | — |
| | $ | — |
| | $ | 857 |
| | $ | 857 |
| |
| December 30, 2016 | | $ | — |
| | $ | — |
| | $ | — |
| | $ | — |
|
Lake Region Medical Consolidations
In 2014, Lake Region Medical deviceinitiated plans to close its Arvada, CO site, consolidate its two Galway, Ireland sites into one facility, optimization. Nearand other restructuring actions that will result in a reduction in staff across manufacturing and administrative functions at certain locations. This initiative was substantially completed by the end of 2011,2016.
During the third quarter of 2016, the Company initiated plans to upgrade and expandannounced the planned closure of its manufacturing infrastructure in order to support its medical device strategy. This includes the transfer of certainClarence, NY facility. The machined component product lines manufactured in this facility will be transferred to create additional capacity forother Integer locations in the manufacture of medical devices, expansion of two existing facilities, as well as the purchase of equipment to enable the production of medical devices. These initiatives areU.S. This project is expected to be completed overby the next year. Total capital investment under these initiatives is expected to be between $15 million to $20 millionfirst quarter of which approximately $12.4 million has been expended to date. Total expenses expected to be incurred on these projects is between $2 million to $3 million of which $1.8 million has been incurred to date. All expenses have been and will be recorded within the Greatbatch Medical segment and are expected to include the following:2018.
•Production inefficiencies, moving and revalidation: $0.5 million—$1 million;
•Personnel: $1 million—$1.5 million; and
•Other: $1.0 million.
GREATBATCH, INC.INTEGER HOLDINGS CORPORATION
NOTES TO CONSOLIDATED FINANCIAL STATEMENTS
The change in accrued liabilities related to the medical device facility optimization is as follows (in thousands):
|
| | | | | | | | | | | | | | | |
| | Production Inefficiencies, Moving and Revalidation | | Personnel | | Other | | Total |
| At December 28, 2012 | $ | — |
| | $ | — |
| | $ | — |
| | $ | — |
|
| Restructuring charges | 19 |
| | 2 |
| | 291 |
| | 312 |
|
| Cash payments | (19 | ) | | (2 | ) | | (291 | ) | | (312 | ) |
| At January 3, 2014 | $ | — |
| | $ | — |
| | $ | — |
| | $ | — |
|
ERP system upgrade.(13.) In 2011, the Company initiated plans to upgrade its existing global ERP system. This initiative is expected to be completed over the next three months. TotalOTHER OPERATING EXPENSES, NET (Continued)
The total capital investment underexpected for this initiative since the acquisition date is expected to be between $4$5.0 million to $4.5 and $6.0 million, of which approximately $3.9$2.2 million has been expended to date.through December 30, 2016. Total expensesexpense expected to be incurred on this initiative isfor these initiatives are between $6$20.0 million to $7 and $25.0 million, of which $5.8$10.5 million has been incurred through December 30, 2016. Expenses related to date.this initiative were primarily recorded within the Medical segment and include the following:
Severance and retention: $8.0 million - $10.0 million;
Accelerated depreciation and asset write offs: approximately $1.0 million - $2.0 million; and
Other: $11.0 million - $13.0 million
Other expenses primarily consist of production inefficiencies, moving, revalidation, personnel, training, consulting, and travel costs associated with these consolidation projects. All expenses are cash expenditures except accelerated depreciation and asset write-offs. Expenses related to this initiative are recorded within the corporate cost center and include the following:
•Training and consulting costs: $4 million—$4.5 million; and
•Accelerated depreciation and asset write-offs: $2 million – $2.5 million.
The change in accrued liabilities related to the ERP system upgradeLake Region Medical consolidation initiatives is as follows (in thousands):
|
| | | | | | | | | | | |
| | Training & Consulting Costs | | Accelerated Depreciation/ Asset Write-offs | | Total |
| At December 28, 2012 | $ | 169 |
| | $ | — |
| | $ | 169 |
|
| Charges | 436 |
| | 347 |
| | 783 |
|
| Write-offs | — |
| | (347 | ) | | (347 | ) |
| Cash payments | (605 | ) | | — |
| | (605 | ) |
| At January 3, 2014 | $ | — |
| | $ | — |
| | $ | — |
|
|
| | | | | | | | | | | | | | | |
| | Severance and Retention | | Accelerated
Depreciation/
Asset Write-offs | | Other | | Total |
| January 1, 2016 | $ | 3,667 |
| | $ | — |
| | $ | 596 |
| | $ | 4,263 |
|
| Restructuring charges | 740 |
| | 1,398 |
| | 6,446 |
| | 8,584 |
|
| Write-offs | — |
| | (1,398 | ) | | — |
| | (1,398 | ) |
| Cash payments | (3,678 | ) | | — |
| | (6,640 | ) | | (10,318 | ) |
| December 30, 2016 | $ | 729 |
| | $ | — |
| | $ | 402 |
| | $ | 1,131 |
|
Acquisition and integration (income) costs.costs
During 20132016 and 2012,2015, the Company incurred $28.3 million and $33.1 million, respectively, in acquisition and integration costs (income) related to the acquisition of Lake Region Medical, consisting primarily of transaction costs and integration costs. Transaction costs primarily relate to change-in-control payments to former Lake Region Medical executives, as well as professional and consulting fees. Integration costs primarily include professional, consulting, severance, retention, relocation, and travel costs. As of Micro PowerDecember 30, 2016 and NeuroNexus, whichJanuary 1, 2016, $4.5 million and $6.2 million, respectively, of acquisition and integration costs related to the Lake Region Medical acquisition were acquired in December 2011 and February 2012, respectively. These expenses were primarily for retention bonuses, travel costaccrued.
Total integration expense expected to be incurred in connection with integration efforts, trainingthe Lake Region Medical acquisition is between $40.0 million and severance,$50.0 million of which $32.5 million was incurred through December 30, 2016. Total capital expenditures for this initiative are expected to be between $20.0 million and the change in fair value$25.0 million of the contingent consideration recorded in connection with these acquisitions. See Note 18 “Fair Value Measurements.”which $8.2 million was incurred through December 30, 2016.
Asset dispositions, severance and other.other
During 2013, 20122016, 2015 and 2011,2014, the Company recorded losses in connection with various asset disposals and/or write-downs. Additionally,In addition, during 2013, Greatbatch Medical recorded a $0.9 million write-off related to its wireless sensing product line (Note 5)2016 and QiG recorded a $0.5 million write-off of IPR&D (Note 7). During 2012,2015, the Company incurred $1.2 million of costs related to the relocation of its global headquarters to Frisco, Texas. During 2011, the Company incurred $0.6 million of due diligence relatedlegal and professional costs in connection with its purchasethe Spin-off of Micro Power.$4.4 million and $6.0 million, respectively. Total transaction related costs incurred for the Spin-off since inception were $10.4 million. Expenses related to the Spin-off were primarily recorded within the corporate unallocated and the Medical segment. Refer to Note 2 “Divestiture and Acquisitions” for additional information on the Spin-off.
INTEGER HOLDINGS CORPORATION
NOTES TO CONSOLIDATED FINANCIAL STATEMENTS
(14.)INCOME TAXES
The U.S. and international components of income (loss) before provision for income taxes for fiscal years 2016, 2015 and 2014 were as follows (in thousands):
| | | | Year Ended | | | | | | | |
| | January 3,
2014 | | December 28,
2012 | | December 30,
2011 | 2016 | | 2015 | | 2014 |
| U.S. | $ | 42,392 |
| | $ | 36,057 |
| | $ | 43,610 |
| $ | (52,446 | ) | | $ | (42,166 | ) | | $ | 56,801 |
|
| International | 6,446 |
| | (29,327 | ) | | 4,782 |
| 53,631 |
| | 26,466 |
| | 19,778 |
|
| Total income before provision for income taxes | $ | 48,838 |
| | $ | 6,730 |
| | $ | 48,392 |
| |
| Total income (loss) before provision (benefit) for income taxes | | $ | 1,185 |
| | $ | (15,700 | ) | | $ | 76,579 |
|
GREATBATCH, INC.
NOTES TO CONSOLIDATED FINANCIAL STATEMENTS
The provision (benefit) for income taxes for fiscal years 2016, 2015 and 2014 was comprised of the following (in thousands):
| | | | Year Ended | | | | | | | |
| | January 3,
2014 | | December 28,
2012 | | December 30,
2011 | 2016 | | 2015 | | 2014 |
| Current: | | | | | | | | | | |
| Federal | $ | 39,353 |
| | $ | 4,747 |
| | $ | 5,150 |
| $ | (8,327 | ) | | $ | (3,753 | ) | | $ | 16,293 |
|
| State | 1,604 |
| | 381 |
| | (40 | ) | 149 |
| | (367 | ) | | 1,299 |
|
| International | 1,470 |
| | 668 |
| | 1,384 |
| 10,752 |
| | 6,312 |
| | 2,998 |
|
| | 42,427 |
| | 5,796 |
| | 6,494 |
| 2,574 |
| | 2,192 |
| | 20,590 |
|
| Deferred: | | | | | | | | | | |
| Federal | (28,678 | ) | | 6,615 |
| | 8,028 |
| (4,952 | ) | | (8,144 | ) | | 1,211 |
|
| State | 427 |
| | 175 |
| | 599 |
| (638 | ) | | (880 | ) | | (310 | ) |
| International | (1,605 | ) | | (1,057 | ) | | 149 |
| (1,760 | ) | | (1,274 | ) | | (370 | ) |
| | (29,856 | ) | | 5,733 |
| | 8,776 |
| (7,350 | ) | | (10,298 | ) | | 531 |
|
| Total provision for income taxes | $ | 12,571 |
| | $ | 11,529 |
| | $ | 15,270 |
| |
| Total provision (benefit) for income taxes | | $ | (4,776 | ) | | $ | (8,106 | ) | | $ | 21,121 |
|
The provision (benefit) for income taxes differs from the U.S. statutory rate for fiscal years 2016, 2015 and 2014 due to the following:
| | | | Year Ended | | | | | | | | | | | | | |
| | January 3,
2014 | | December 28,
2012 | | December 30,
2011 | 2016 | | 2015 | | 2014 |
| Statutory rate | 35.0 | % | | 35.0 | % | | 35.0 | % | $ | 415 |
| 35.0 | % | | $ | (5,495 | ) | 35.0 | % | | $ | 26,803 |
| 35.0 | % |
| Federal tax credits | (7.5 | ) | | — |
| | (3.7 | ) | (1,792 | ) | (151.2 | ) | | (1,850 | ) | 11.8 |
| | (1,600 | ) | (2.1 | ) |
| Foreign rate differential | (0.7 | ) | | 50.7 |
| | 0.3 |
| (7,086 | ) | (598.0 | ) | | (3,180 | ) | 20.2 |
| | (3,276 | ) | (4.3 | ) |
| Uncertain tax positions | 1.7 |
| | (10.1 | ) | | (1.3 | ) | 1,724 |
| 145.5 |
| | (531 | ) | 3.4 |
| | 412 |
| 0.6 |
|
| State taxes, net of federal benefit | 2.3 |
| | 4.9 |
| | 0.3 |
| (1,068 | ) | (90.1 | ) | | (1,490 | ) | 9.5 |
| | 507 |
| 0.7 |
|
| Change in tax rate - loss of Swiss tax holiday | — |
| | 25.6 |
| | — |
| |
| Change in foreign tax rates | (3.7 | ) | | — |
| | — |
| (270 | ) | (22.8 | ) | | (91 | ) | 0.6 |
| | (446 | ) | (0.6 | ) |
| Non-deductible transaction costs | | 1,012 |
| 85.4 |
| | 4,867 |
| (31.0 | ) | | — |
| — |
|
| Valuation allowance | 0.4 |
| | 67.6 |
| | 0.1 |
| 1,340 |
| 113.1 |
| | 626 |
| (4.0 | ) | | (299 | ) | (0.4 | ) |
| Change in tax law (Internal Revenue Code §987) | | 2,630 |
| 221.9 |
| | — |
| — |
| | — |
| — |
|
| Other | (1.8 | ) | | (2.4 | ) | | 0.9 |
| (1,681 | ) | (141.8 | ) | | (962 | ) | 6.1 |
| | (980 | ) | (1.3 | ) |
| Effective tax rate | 25.7 | % | | 171.3 | % | | 31.6 | % | $ | (4,776 | ) | 403.0 | % | | $ | (8,106 | ) | 51.6 | % | | $ | 21,121 |
| 27.6 | % |
GREATBATCH, INC.INTEGER HOLDINGS CORPORATION
NOTES TO CONSOLIDATED FINANCIAL STATEMENTS
(14.)INCOME TAXES (Continued)
Deferred tax assets (liabilities) consist of the following (in thousands): |
| | | | | | | |
| | At |
| | January 3,
2014 | | December 28,
2012 |
| Tax credits | $ | 6,624 |
| | $ | 6,884 |
|
| Net operating loss carryforwards | 9,161 |
| | 14,637 |
|
| Inventories | 4,202 |
| | 3,911 |
|
| Accrued expenses | 4,303 |
| | 4,129 |
|
| Stock-based compensation | 9,194 |
| | 8,502 |
|
| Other | 573 |
| | 465 |
|
| Gross deferred tax assets | 34,057 |
| | 38,528 |
|
| Less valuation allowance | (11,661 | ) | | (12,768 | ) |
| Net deferred tax assets | 22,396 |
| | 25,760 |
|
| Property, plant and equipment | (2,254 | ) | | (2,648 | ) |
| Intangible assets | (57,648 | ) | | (59,774 | ) |
| Convertible subordinated notes | (6,178 | ) | | (36,462 | ) |
| Gross deferred tax liabilities | (66,080 | ) | | (98,884 | ) |
| Net deferred tax liability | $ | (43,684 | ) | | $ | (73,124 | ) |
| Presented as follows: | | | |
| Current deferred tax asset | $ | 6,008 |
| | $ | 7,678 |
|
| Current deferred tax liability | (613 | ) | | (874 | ) |
| Noncurrent deferred tax asset | 2,933 |
| | 2,534 |
|
| Noncurrent deferred tax liability | (52,012 | ) | | (82,462 | ) |
| Net deferred tax liability | $ | (43,684 | ) | | $ | (73,124 | ) |
As a result of the repayment of CSN during 2013, the Company reclassified $30.3 million of Long-Term Deferred Income Taxes to Income Taxes Payable of which approximately $28.8 million was paid in 2013. |
| | | | | | | |
| | December 30,
2016 | | January 1,
2016 |
| Net operating loss carryforwards | $ | 154,706 |
| | $ | 153,949 |
|
| Tax credit carryforwards | 24,646 |
| | 22,196 |
|
| Inventories | 7,524 |
| | 6,543 |
|
| Accrued expenses | 5,724 |
| | 13,138 |
|
| Stock-based compensation | 10,614 |
| | 9,512 |
|
| Other | 936 |
| | 38 |
|
| Gross deferred tax assets | 204,150 |
| | 205,376 |
|
| Less valuation allowance | (35,391 | ) | | (39,171 | ) |
| Net deferred tax assets | 168,759 |
| | 166,205 |
|
| Property, plant and equipment | (33,069 | ) | | (32,772 | ) |
| Intangible assets | (337,722 | ) | | (347,896 | ) |
| Convertible subordinated notes | (2,577 | ) | | (3,754 | ) |
| Gross deferred tax liabilities | (373,368 | ) | | (384,422 | ) |
| Net deferred tax liability | $ | (204,609 | ) | | $ | (218,217 | ) |
| Presented as follows: | | | |
| Noncurrent deferred tax asset | $ | 3,970 |
| | $ | 3,587 |
|
| Noncurrent deferred tax liability | (208,579 | ) | | (221,804 | ) |
| Net deferred tax liability | $ | (204,609 | ) | | $ | (218,217 | ) |
As of January 3, 2014,December 30, 2016, the Company has the following carryforwards available: | | | Jurisdiction | Tax Attribute | | Amount (in millions) | | | Begin to Expire | | Tax Attribute | | Amount (in millions) | | Begin to Expire |
| U.S. | Net Operating Loss | | $ | 3.8 |
| (1) | | 2031 | |
| Federal | | | Net Operating Loss | | $ | 388.6 |
| | 2019 |
| International | Net Operating Loss | | 56.2 |
| (1) | | 2014 | | Net Operating Loss | | 43.0 |
| | 2017 |
| State | Net Operating Loss | | 34.4 |
| (1) | | Various | | Net Operating Loss | | 276.4 |
| | 2017 |
| Federal | | | Foreign Tax Credit | | 17.0 |
| | 2019 |
| U.S. and State | R&D Tax Credit | | 1.4 |
| (1) | | Various | | R&D Tax Credit | | 4.9 |
| | 2018 |
| State | Investment Tax Credit | | 5.4 |
| | | Various | | Investment Tax Credit | | 6.0 |
| | 2016 |
(1) TheCertain U.S. tax attributes are subject to limitations of Internal Revenue Code §382, which in general provides that utilization of certain net operating losses and credits is subject to an annual limitation under Internal Revenue Code Section 382.if an ownership change results from transactions increasing the ownership of certain shareholders or public groups in stock of a corporation by more than 50 percentage points over a three- year period. Such an ownership change occurred upon the consummation of the acquisition of Lake Region Medical. The Company does not anticipate that these limitations will affect utilization of these carryforwards prior to their expiration.
CertainThe Company’s federal net operating loss carryforward and certain other federal tax credits reported on filedits income tax returns included uncertain tax positions taken in prior years. Due to the application of the accounting for uncertain tax positions, the actual tax attributes are larger than the tax creditsamounts for which a deferred tax asset is recognized for financial statement purposes.
In assessing the realizability of deferred tax assets, management considers, within each taxing jurisdiction, whether it is more likely than not that some portion or all of the deferred tax assets will not be realized. Management considers the scheduled reversal of deferred tax liabilities, projected future taxable income and tax planning strategies in making this assessment. Based on the consideration of the weight of both positive and negative evidence, management has determined that a portion of the deferred tax assets as of December 30, 2016 and January 3, 2014 and December 28, 20121, 2016 related to certain foreign tax credits, state investment tax credits, and foreign and state net operating losses will not be realized.
INTEGER HOLDINGS CORPORATION
NOTES TO CONSOLIDATED FINANCIAL STATEMENTS
(14.)INCOME TAXES (Continued)
On December 7, 2016, the U.S. Treasury and the Internal Revenue Service (“IRS”) issued final and temporary regulations under Internal Revenue Code §987 (the “Regulations”). These Regulations address the taxation of foreign currency translation gains or losses arising from qualified business units (“QBUs”) (such as branches and certain other flow-through entities) that operate in a currency other than the currency of their owner. The Company has measured the impact of the regulations by applying the “Fresh Start Transition Method” as prescribed by the Regulations, and adjusted the carrying value of its deferred tax accounts accordingly. The adjustment to the carrying value of the deferred tax accounts was recorded as a component of Provision (Benefit) for Income Taxes attributable to continuing operations in the current year.
The Company files annual income tax returns in the U.S., various state and local jurisdictions, and in various foreign jurisdictions. A number of years may elapse before an uncertain tax position, for which the Company has unrecognized
GREATBATCH, INC.
NOTES TO CONSOLIDATED FINANCIAL STATEMENTS
tax benefits, is examined and finally settled. While it is often difficult to predict the final outcome or the timing of resolution of any particular uncertain tax position, the Company believes that its unrecognized tax benefits reflect the most probable outcome. The Company adjusts these unrecognized tax benefits, as well as the related interest, in light of changing facts and circumstances. The resolution of a matter couldan uncertain tax position, if recognized, would be recognizedrecorded as an adjustment to the Provision (Benefit) for Income Taxes and the effective tax rate in the period of resolution.
Below is a summary of changes to the unrecognized tax benefit for fiscal years 2016, 2015 and 2014 (in thousands): | | | | Year Ended | | | | | | | |
| | January 3,
2014 | | December 28,
2012 | | December 30,
2011 | 2016 | | 2015 | | 2014 |
| Balance, beginning of year | $ | 970 |
| | $ | 1,580 |
| | $ | 2,756 |
| $ | 9,271 |
| | $ | 2,411 |
| | $ | 1,858 |
|
| Reductions (additions) relating to business combinations | | (400 | ) | | 7,443 |
| | — |
|
| Additions based upon tax positions related to the current year | 325 |
| | — |
| | 300 |
| 1,450 |
| | 274 |
| | 268 |
|
| Additions recorded as part of business combinations | — |
| | — |
| | 260 |
| |
| Additions related to prior period tax positions | 651 |
| | 210 |
| | — |
| 240 |
| | 163 |
| | 510 |
|
| Reductions relating to settlements with tax authorities | (88 | ) | | (522 | ) | | — |
| — |
| | (550 | ) | | (225 | ) |
| Reductions as a result of a lapse of applicable statute of limitations | — |
| | (298 | ) | | (1,736 | ) | — |
| | (470 | ) | | — |
|
| Balance, end of year | $ | 1,858 |
| | $ | 970 |
| | $ | 1,580 |
| $ | 10,561 |
| | $ | 9,271 |
| | $ | 2,411 |
|
Integer and its subsidiaries file income tax returns in the U.S. federal jurisdiction and various state and foreign jurisdictions. The tax years that remain open and subject to tax audits varies depending on the tax jurisdiction. AnThe Internal Revenue Service finalized an audit of the consolidated federal 20092012 and 20102013 U.S. Federal income tax returns were completed during 2012. of the Company in the first quarter of 2015. The impact to the income tax expense was not material. The U.S. subsidiaries of the former Lake Region Medical Group are still subject to U.S. federal, state, and local examinations for the taxable years 2006 to 2014.
It is reasonably possible that a reduction of approximately $0.1$0.6 million of the balance of unrecognized tax benefits may occur within the next 12twelve months as a result of the lapse of the statute of limitations and potentialand/or audit settlements. As of January 3, 2014,December 30, 2016, approximately $1.7$9.8 million of unrecognized tax benefits would favorably impact the effective tax rate (net of federal impact on state issues), if recognized.
The American Taxpayer Relief ActCompany recognizes interest related to unrecognized tax benefits as a component of 2012 (the “Act”) was signed into lawProvision (Benefit) for Income Taxes on January 2, 2013. The Act retroactively restored several expired business tax provisions, including the Section 41 researchConsolidated Statements of Operations and experimentation credit that had expired on December 31, 2011. Under the American Taxpayer Relief Act of 2012, the section 41 research tax credit is extended for two years retroactively from January 1, 2012 through December 31, 2013. As the Act was signed into law on January 2, 2013, Greatbatch recognized the benefit for the section 41 research tax credits earned in 2012 through the fiscal 2013 effective rate.
In September 2013, the United States issued final regulations addressing the acquisition, productionComprehensive Income (Loss). During 2016, 2015 and improvement of tangible property and proposed regulations addressing the disposition of property. These regulations provide rules as to whether the cost of tangible units of property are capitalizable and recovered through allowances for depreciation or are more appropriately deducted for tax purposes in the year incurred. These regulations replace previously issued temporary regulations and are effective for tax years starting January 1, 2014, with optional adoption in 2013. To account for the 2014 adoption of these regulations, for the year ended January 3, 2014, the Company recorded an increaseamounts for interest and penalties, respectively, were not significant.
As of December 30, 2016, no taxes have been provided on the undistributed earnings of certain foreign subsidiaries amounting to current deferred tax liabilities, with an offsetting increase to non-current deferred tax assets of $0.2 million.
|
| | |
15. | | COMMITMENTS AND CONTINGENCIES |
Litigation– On December 21, 2012, the Company and several other unaffiliated parties were named as defendants in a personal injury and wrongful death action filed in the 113th Judicial District Court of Harris County, Texas. The complaint seeks damages alleging marketing and product defects and failure to warn, negligence and gross negligence relating to a product the Company manufactured and sold to a customer, one of the other named defendants. The Company's customer, in turn, incorporated the Greatbatch product into its own product which it sold to its customer, another named defendant. This matter is currently scheduled for trial in 2014.
The Company is indemnified by its customer against any loss in this matter, including costs of defense, which obligation is supported by its customer's product liability insurance coverage in the amount of $5$102.3 million. The Company also has its own product liability insurance coverage, subjectintends to a $10 million retention. The Company has meritorious defenses and is vigorously defending the matter. In the event of an adverse judgment, however, the Company could have liability to the extentpermanently reinvest these earnings. Quantification of the amount of any award its customer is unable to satisfy. To date, the Company has not recorded a reserve in connectiondeferred tax liability associated with this matter since any potential lossthese undistributed earnings is not currently probable and the range of loss is not reasonably estimable at this time.practicable.
GREATBATCH, INC.INTEGER HOLDINGS CORPORATION
NOTES TO CONSOLIDATED FINANCIAL STATEMENTS
(15.)COMMITMENTS AND CONTINGENCIES
Litigation
In April 2013, the Company commenced an action against AVX Corporation and AVX Filters Corporation (collectively “AVX”) alleging that AVX had infringed on the Company’s patents by manufacturing and selling filtered feedthrough assemblies used in implantable pacemakers and cardioverter defibrillators that incorporate the Company’s patented technology. On January 26, 2016, a jury in the U.S. District Court for the District of Delaware returned a verdict finding that AVX infringed on two of the Company’s patents and awarded the Company $37.5 million in damages. The finding is subject to post-trial proceedings currently scheduled to be held in August 2017, as well as a possible appeal by AVX. The Company has recorded no gains in connection with this litigation as no cash has been received.
The Company is a party to various other legal actions arising in the normal course of business. While theThe Company does not expect that the ultimate resolution of any of theseother pending legal actions will have a material effect on its consolidated results of operations, financial position, or cash flows,flows. However, litigation is subject to inherent uncertainties. However, as litigation is subject to inherent uncertainties,As such, there can be no assurance that any pending legal action, which the Company currently believes to be immaterial, doeswill not become material in the future.
Environmental Matters
The Company’s Collegeville, PA facility, which was acquired as part of the Lake Region Medical acquisition, is subject to one administrative consent order entered into with the U.S. Environmental Protection Agency (the “EPA”), which require ongoing groundwater treatment and monitoring at the site as a result of leaks from underground storage tanks. Upon approval by the EPA of the Company’s proposed post remediation care plan, which requires a continuation of the groundwater treatment and monitoring process at the site, the Company expects that the consent orders will be terminated. The Company expects a decision from the EPA on whether the Company’s post remediation care plan has been approved in early 2017. The groundwater treatment process at the Collegeville facility consists of a groundwater extraction and treatment system and the performance of annual sampling of a defined set of groundwater wells as a means to monitor containment within approved boundaries. The Company does not expect this environmental matter will have a material effect on its consolidated results of operations, financial position or cash flows.
In January 2015, Lake Region Medical was notified by the New Jersey Department of Environmental Protection (“NJDEP”) of the NJDEP’s intent to revoke a no further action determination made by the NJDEP in favor of Lake Region Medical in 2002 pertaining to a property on which a subsidiary of Lake Region Medical operated a manufacturing facility in South Plainfield, New Jersey beginning in 1971. Lake Region Medical sold the property in 2004 and vacated the facility in 2007. In response to the NJDEP’s notice, the Company further investigated the matter and submitted a technical report to the NJDEP in August of 2015 that concluded that the NJDEP’s notice of intent to revoke was unwarranted. After reviewing the Company’s technical report, the NJDEP issued a draft response in May 2016, stating that the NJDEP would not revoke the no further action determination at that time, but would require some additional site investigation to support the Company’s conclusion. The Company is cooperating with the NJDEP and has met with NJDEP representatives to discuss the appropriate scope of the requested additional investigation. The Company does not expect this environmental matter will have a material effect on its consolidated results of operations, financial position or cash flows.
As of December 30, 2016 and January 1, 2016, there was $1.0 million and $1.1 million, respectively, recorded in Other Long-Term Liabilities in the Consolidated Balance Sheets in connection with these environmental matters.
License agreements–Agreements
The Company is a party to various license agreements for technology that is utilized in certain of its products. The most significant of these agreements are the licenses for basic technology used in the production of wet tantalum capacitors, filtered feedthroughs and MRI compatible lead systems. Expenses related to license agreements were $3.5$2.0 million,, $3.1 $2.4 million, and $2.8$3.3 million,, for 2013, 20122016, 2015 and 2011,2014, respectively, and are primarily included in Cost of Sales.
INTEGER HOLDINGS CORPORATION
NOTES TO CONSOLIDATED FINANCIAL STATEMENTS
(15.)COMMITMENTS AND CONTINGENCIES (Continued)
Product Warranties –
The Company generally warrants that its products will meet customer specifications and will be free from defects in materials and workmanship. The change in product warranty liability for fiscal years 2016 and 2015 was comprised of the following (in thousands):
| | | | Year Ended | | | | | |
| | January 3,
2014 | | December 28,
2012 | 2016 | | 2015 |
| Beginning balance | $ | 2,626 |
| | $ | 2,013 |
| $ | 3,316 |
| | $ | 660 |
|
| Additions to warranty reserve | 1,624 |
| | 1,681 |
| |
| Provision for warranty reserve | | 3,238 |
| | 1,274 |
|
| Liabilities assumed from acquisition | | — |
| | 2,521 |
|
| Warranty claims paid | (2,431 | ) | | (1,068 | ) | (2,643 | ) | | (1,139 | ) |
| Ending balance | $ | 1,819 |
| | $ | 2,626 |
| $ | 3,911 |
| | $ | 3,316 |
|
Operating Leases
Operating Leases–The Company is a party to various operating lease agreements for buildings, machinery, equipment and software. The Company primarily leases buildings, which accounts for the majority of the future lease payments. Lease expense includes the effect of escalation clauses and leasehold improvement incentives which are accounted for ratably over the lease term. Operating lease expense for fiscal years 2016, 2015 and 2014 was as follows (in thousands): |
| | | | | | | | | | | |
| | Year Ended |
| | January 3,
2014 | | December 28,
2012 | | December 30,
2011 |
| Operating lease expense | $ | 4,379 |
| | $ | 4,024 |
| | $ | 2,704 |
|
|
| | | | | | | | | | | |
| | 2016 | | 2015 | | 2014 |
| Operating lease expense | $ | 15,357 |
| | $ | 6,516 |
| | $ | 4,281 |
|
MinimumAt December 30, 2016, the Company had the following future estimated annualminimum lease payments under non-cancelable operating lease expenses are as followsleases (in thousands):
|
| | | |
| 2014 | $ | 5,268 |
|
| 2015 | 4,646 |
|
| 2016 | 4,042 |
|
| 2017 | 1,452 |
|
| 2018 | 1,003 |
|
| Thereafter | 936 |
|
| Total estimated operating lease expense | $ | 17,347 |
|
|
| | | | | | | | | | | | | | | | | | |
| | 2017 | | 2018 | | 2019 | | 2020 | | 2021 | | After 2021 |
| Future minimum lease payments | $ | 13,486 |
| | 12,235 |
| | 11,105 |
| | 8,810 |
| | 7,826 |
| | 23,838 |
|
Self-Insured Medical Plan– TheSelf-Insurance Liabilities
As of December 30, 2016, and at various times in the past, the Company self-funds theself-funded its workers' compensation and employee medical insurance coverage provided to its U.S. based employees.and dental expenses. The Company has specific stop loss coverage per associateestablished reserves to cover these self-insured liabilities and also maintains stop-loss insurance to limit its exposures under these programs. Claims reserves represent accruals for the estimated uninsured portion of reported claims, including adverse development of reported claims, as well as estimates of incurred but not reported claims. Claims incurred but not reported are estimated based on the Company’s historical experience, which is continually monitored, and accruals are adjusted when warranted by changes in facts and circumstances. The Company’s actual experience may be different than its estimates, sometimes significantly. Changes in assumptions, as well as changes in actual experience could cause these estimates to change. Insurance and claims expense will vary from period to period based on the severity and frequency of claims incurred during the year exceeding $225 thousand per associate with no annual maximum aggregate stop loss coverage. Asin a given period. The Company’s self-insurance reserves totaled $7.7 million and $7.9 million as of December 30, 2016 and January 3, 2014 and December 28, 2012, the Company had $1.6 million and $1.4 million accrued related to the self-insurance of its medical plan,1, 2016, respectively. This accrual isThese accruals are recorded in Accrued Expenses and Other Long-Term Liabilities in the Consolidated Balance Sheet, and is primarily based upon claim history.Sheets.
Purchase Commitments – Contractual obligations for purchase of goods or services are defined as agreements that are enforceable and legally binding on the Company and that specify all significant terms, including: fixed or minimum quantities to be purchased; fixed, minimum or variable price provisions; and the approximate timing of the transaction. The Company’s purchase orders are normally based on its current manufacturing needs and are fulfilled by its vendors within short time horizons. The Company enters into blanket orders with vendors that have preferred pricing and terms, however these orders are normally cancelable by us without penalty. As of January 3, 2014, the total contractual obligation related to such expenditures is approximately $24.4 million and will primarily be financed by existing cash and cash equivalents, cash generated from operations, or the Credit Facility. The Company also enters into contracts for
GREATBATCH, INC.
NOTES TO CONSOLIDATED FINANCIAL STATEMENTS
outsourced services; however, the obligations under these contracts were not significant and the contracts generally contain clauses allowing for cancellation without significant penalty.
Foreign Currency Contracts – The
Historically, the Company has entered into forward contracts to purchase Mexican pesos in order to hedge the risk of peso-denominated payments associated with its operations in Mexico. In connection with the operations atLake Region Medical acquisition, the Company terminated its Tijuana, Mexico facility. outstanding forward contracts resulting in a $2.4 million payment to the foreign currency contract counterparty during 2015. As of the date the contracts were terminated, the Company had $1.6 million recorded in Accumulated Other Comprehensive Income (Loss) related to these contracts. This amount was fully amortized to Cost of Sales during 2016 as the inventory, which the contracts were hedging the cash flows to produce, was sold.
INTEGER HOLDINGS CORPORATION
NOTES TO CONSOLIDATED FINANCIAL STATEMENTS
(15.)COMMITMENTS AND CONTINGENCIES (Continued)
The impact to the Company’s results of operations from theseits forward contracts for fiscal years 2016, 2015 and 2014 was as follows (in thousands):
| | | | Year Ended | 2016 | | 2015 | | 2014 |
| | January 3,
2014 | | December 28,
2012 | | December 30,
2011 | |
| Reduction in Cost of Sales | $ | (1,154 | ) | | $ | (79 | ) | | $ | (556 | ) | |
| Increase (reduction) in Cost of Sales | | $ | 3,516 |
| | $ | 1,948 |
| | $ | (168 | ) |
| Ineffective portion of change in fair value | — |
| | — |
| | — |
| — |
| | — |
| | — |
|
Information regarding outstanding foreign currency contracts designated as cash flow hedges as of January 3, 2014December 30, 2016 is as follows (dollars in thousands):
|
| | | | | | | | | | | | | | | | | |
| Instrument | Type of Hedge | | Aggregate
Notional Amount | | Start Date | | End Date | | $/Peso | | Fair Value | | Balance Sheet Location |
| FX Contract | Cash flow | | 7,700 |
| | Jan-14 | | Dec-14 | | 0.0767 |
| | $ | (143 | ) | | Accrued Expenses |
| FX Contract | Cash flow | | 6,300 |
| | Jan-14 | | Dec-14 | | 0.0752 |
| | 3 |
| | Accrued Expenses |
| | | | | | | | | | | | $ | (140 | ) | | |
|
| | | | | | | | | | | | | | | |
Aggregate
Notional Amount | | Start Date | | End Date | | $/Peso | | Fair Value | | Balance Sheet Location |
| $ | 24,654 |
| | Jan 2017 | | Dec 2017 | | 0.0514 |
| | $ | (2,063 | ) | | Accrued Expenses |
Workers’ Compensation Trust(16.) –EARNINGS (LOSS) PER SHARE The Company was a member of a group self-insurance trust that provided workers’ compensation benefits to employees of the Company in Western New York (the “Trust”). Under the Trust agreement, each participating organization has joint and several liability for Trust obligations if the assets of the Trust are not sufficient to cover those obligations. During 2011, the Company was notified by the Trust of its intentions to cease operations at the end of 2011 and was assessed $0.6 million as an estimate of its pro-rata share of future costs related to the Trust. This amount was accrued and paid in 2011. Based on actual experience, the Company could receive a refund or be assessed additional contributions for workers’ compensation claims. During 2012 and 2013, the Company utilized traditional insurance to provide workers’ compensation benefits.
|
| | |
16. | | EARNINGS (LOSS) PER SHARE |
The following table illustrates the calculation of Basic and Diluted EPS for fiscal years 2016, 2015 and 2014 (in thousands, except per share amounts):
| | | | Year Ended | 2016 | | 2015 | | 2014 |
| | January 3,
2014 | | December 28,
2012 | | December 30,
2011 | |
| Numerator for basic EPS: | | | | | | |
| Numerator: | | | | | | |
| Net income (loss) | $ | 36,267 |
| | $ | (4,799 | ) | | $ | 33,122 |
| $ | 5,961 |
| | $ | (7,594 | ) | | $ | 55,458 |
|
| Denominator for basic EPS: | | | | | | | | | | |
| Weighted average shares outstanding | 23,991 |
| | 23,584 |
| | 23,258 |
| 30,778 |
| | 26,363 |
| | 24,825 |
|
| Effect of dilutive securities: | | | | | | | | | | |
| Stock options, restricted stock and restricted stock units | 1,332 |
| | — |
| | 378 |
| 195 |
| | — |
| | 1,150 |
|
| Denominator for diluted EPS | 25,323 |
| | 23,584 |
| | 23,636 |
| 30,973 |
| | 26,363 |
| | 25,975 |
|
| Basic EPS | $ | 1.51 |
| | $ | (0.20 | ) | | $ | 1.42 |
| $ | 0.19 |
| | $ | (0.29 | ) | | $ | 2.23 |
|
| Diluted EPS | $ | 1.43 |
| | $ | (0.20 | ) | | $ | 1.40 |
| $ | 0.19 |
| | $ | (0.29 | ) | | $ | 2.14 |
|
The diluted weighted average share calculations do not include the following securities for fiscal years 2016, 2015 and 2014, which are not dilutive to the EPS calculations or the performance criteria have not been met:met (in thousands): | | | | Year Ended | | | | | | |
| | January 3,
2014 | | December 28,
2012 | | December 30,
2011 | 2016 | | 2015 | | 2014 |
| Time-vested stock options, restricted stock and restricted stock units | 18,480 |
| | 2,142,000 |
| | 909,000 |
| 657 |
| | 1,718 |
| | 176 |
|
| Performance-vested stock options and restricted stock units | — |
| | 781,000 |
| | 649,000 |
| 357 |
| | 578 |
| | — |
|
GREATBATCH, INC.INTEGER HOLDINGS CORPORATION
NOTES TO CONSOLIDATED FINANCIAL STATEMENTS
For all periods presented, no shares related to CSN were included in the diluted EPS calculations as the average share price of the Company’s common stock for those periods did not exceed CSN’s conversion price per share.
|
| | |
17. | | ACCUMULATED OTHER COMPREHENSIVE INCOME |
(17.)ACCUMULATED OTHER COMPREHENSIVE INCOME (LOSS)Accumulated Other Comprehensive Income (Loss) is comprised of the following (in thousands):
|
| | | | | | | | | | | | | | | | | | | | | | | |
| | Defined Benefit Plan Liability | | Cash Flow Hedges | | Foreign Currency Translation Adjustment | | Total Pre-Tax Amount | | Tax | | Net-of-Tax Amount |
| At December 28, 2012 | $ | (962 | ) | | $ | 120 |
| | $ | 13,431 |
| | $ | 12,589 |
| | $ | 358 |
| | $ | 12,947 |
|
| Unrealized gain on cash flow hedges | — |
| | 58 |
| | — |
| | 58 |
| | (20 | ) | | 38 |
|
| Realized gain on foreign currency hedges | — |
| | (1,154 | ) | | — |
| | (1,154 | ) | | 404 |
| | (750 | ) |
| Realized loss on interest rate swap hedges | — |
| | 508 |
| | — |
| | 508 |
| | (178 | ) | | 330 |
|
| Net defined benefit plan liability adjustments | 290 |
| | — |
| | — |
| | 290 |
| | (18 | ) | | 272 |
|
| Foreign currency translation gain | — |
| | — |
| | 1,521 |
| | 1,521 |
| | — |
| | 1,521 |
|
| At January 3, 2014 | $ | (672 | ) | | $ | (468 | ) | | $ | 14,952 |
| | $ | 13,812 |
| | $ | 546 |
| | $ | 14,358 |
|
|
| | | | | | | | | | | | | | | | | | | | | | | |
| | Defined Benefit Plan Liability | | Cash Flow Hedges | | Foreign Currency Translation Adjustment | | Total Pre-Tax Amount | | Tax | | Net-of-Tax Amount |
| January 1, 2016 | $ | (1,179 | ) | | $ | (2,392 | ) | | $ | 3,609 |
| | $ | 38 |
| | $ | 1,332 |
| | $ | 1,370 |
|
| Unrealized gain on cash flow hedges | — |
| | 210 |
| | — |
| | 210 |
| | (73 | ) | | 137 |
|
| Realized loss on foreign currency hedges | — |
| | 3,516 |
| | — |
| | 3,516 |
| | (1,231 | ) | | 2,285 |
|
| Realized loss on interest rate swap hedges | — |
| | 86 |
| | — |
| | 86 |
| | (30 | ) | | 56 |
|
| Net defined benefit plan liability adjustments | (296 | ) | | — |
| | — |
| | (296 | ) | | (283 | ) | | (579 | ) |
| Foreign currency translation loss | — |
| | — |
| | (19,269 | ) | | (19,269 | ) | | — |
| | (19,269 | ) |
| December 30, 2016 | $ | (1,475 | ) | | $ | 1,420 |
| | $ | (15,660 | ) | | $ | (15,715 | ) | | $ | (285 | ) | | $ | (16,000 | ) |
|
| | | | | | | | | | | | | | | | | | | | | | | |
| | Defined Benefit Plan Liability | | Cash Flow Hedges | | Foreign Currency Translation Adjustment | | Total Pre-Tax Amount | | Tax | | Net-of-Tax Amount |
| January 2, 2015 | $ | (1,181 | ) | | $ | (2,558 | ) | | $ | 11,450 |
| | $ | 7,711 |
| | $ | 1,412 |
| | $ | 9,123 |
|
| Unrealized loss on cash flow hedges | — |
| | (4,413 | ) | | — |
| | (4,413 | ) | | 1,545 |
| | (2,868 | ) |
| Realized loss on foreign currency hedges | — |
| | 1,948 |
| | — |
| | 1,948 |
| | (682 | ) | | 1,266 |
|
| Realized loss on interest rate swap hedges | — |
| | 2,631 |
| | — |
| | 2,631 |
| | (921 | ) | | 1,710 |
|
| Net defined benefit plan liability adjustments | 2 |
| | — |
| | — |
| | 2 |
| | (22 | ) | | (20 | ) |
| Foreign currency translation loss | — |
| | — |
| | (7,841 | ) | | (7,841 | ) | | — |
| | (7,841 | ) |
| January 1, 2016 | $ | (1,179 | ) | | $ | (2,392 | ) | | $ | 3,609 |
| | $ | 38 |
| | $ | 1,332 |
| | $ | 1,370 |
|
The realized (gain) loss relating to the Company’s foreign currency and interest rate swap hedges were reclassified from Accumulated Other Comprehensive Income (Loss) and included in Cost of Sales and Interest Expense, respectively, in the Consolidated Statements of Operations. SeeOperations and Comprehensive Income (Loss). Refer to Note 10 “Defined Benefit“Benefit Plans” for details on the change in net defined benefit plan liability adjustments.
INTEGER HOLDINGS CORPORATION
NOTES TO CONSOLIDATED FINANCIAL STATEMENTS
|
| | |
18. | | FAIR VALUE MEASUREMENTS |
(18.)FAIR VALUE MEASUREMENTS
Assets and Liabilities Measured at Fair Value on a Recurring Basis
Fair value measurement standards apply to certain financial assets and liabilities that are measured at fair value on a recurring basis (each reporting period). For the Company, these financial assets and liabilities include its derivative instruments and accrued contingent consideration.instruments. The Company does not have any nonfinancial assets or liabilities that are measured at fair value on a recurring basis.
Foreign currency contracts - Currency Contracts
The fair value of foreign currency contracts are determined through the use of cash flow models that utilize observable market data inputs to estimate fair value. These observable market data inputs include foreign exchange rate and credit spread curves. In addition to the above, the Company received fair value estimates from the foreign currency contract counterparty to verify the reasonableness of the Company’s estimates. The Company’s foreign currency contracts are categorized in Level 2 of the fair value hierarchy. The fair value of the Company’s foreign currency contracts will be realized as Cost of Sales as the inventory, which the contracts are hedging the cash flows to produce, is sold, of which approximately $0.1sold. Approximately $2.1 million is expected to be realized withinas additional Cost of Sales over the next twelve months.
Interest Rate Swaps
Interest rate swap - The fair value of the Company’s interest rate swapswaps outstanding at January 3, 2014December 30, 2016 was determined through the use of a cash flow model that utilizesutilized observable market data inputs. These observable market data inputs includeincluded LIBOR, swap rates, and credit spread curves. In addition to the above, the Company received a fair value estimate from the interest rate swap counterparty to verify the reasonableness of the Company’s estimate. This fair value calculation was categorized in Level 2 of the fair value hierarchy.
Accrued contingent consideration – The fair value of accrued contingent consideration recorded by the Company represents the estimated fair value of the contingent consideration the Company expects to pay to the former shareholders of NeuroNexus based upon the achievement of certain financial and development-based milestones. The fair value of the contingent consideration liability was estimated by discounting to present value,Company’s interest rate swaps will be realized as a component of Interest Expense as interest on the probability weighted contingent payments expected to be made. The Company used risk-adjusted discount rates to derive the fair value of the expected obligations as of the acquisition date, which the Company believes are representative of market participant assumptions. The maximum amount of future contingent consideration (undiscounted) that the Company could be required to paycorresponding borrowings is $2.0 million.
GREATBATCH, INC.
NOTES TO CONSOLIDATED FINANCIAL STATEMENTS
The Company’s accrued contingent consideration is categorized in Level 3 of the fair value hierarchy. Changes in accrued contingent consideration were as follows (in thousands):
|
| | | |
| At December 30, 2011 | $ | — |
|
| Contingent consideration liability acquired | 1,500 |
|
| Fair value adjustments | 30 |
|
| At December 28, 2012 | 1,530 |
|
| Fair value adjustments | (690 | ) |
| At January 3, 2014 | $ | 840 |
|
The recurring Level 3 fair value measurements of the Company’s contingent consideration liability include the following significant unobservable inputs (dollars in thousands):
|
| | | | | | | | | | | |
| Contingent Consideration Liability | Fair Value at January 3,
2014 | | Valuation Technique | | Unobservable Inputs |
| Financial milestones | $ | 200 |
| | Discounted cash flow | | Discount rate | | 12 | % |
| | | | | | Projected year of payment | | 2014 |
|
| | | | | | Probability weighted payment amount | | $ | 200 |
|
| Development milestones | $ | 640 |
| | Discounted cash flow | | Discount rate | | 20 | % |
| | | | | | Projected year of payment | | 2016 |
|
| | | | | | Probability weighted payment amount | | $ | 1,000 |
|
accrued. The following tables provide information regarding assets and liabilities recorded at fair value on a recurring basis (in thousands):
|
| | | | | | | | | | | | | | | |
| | Fair Value Measurements Using |
| Description | At January 3, 2014 | | Quoted Prices in Active Markets for Identical
Assets (Level 1) | | Significant Other Observable Inputs (Level 2) | | Significant Unobservable Inputs (Level 3) |
| Liabilities | | | | | | | |
| Foreign currency contracts (Note 15) | $ | 140 |
| | $ | — |
| | $ | 140 |
| | $ | — |
|
| Accrued contingent consideration | 840 |
| | — |
| | — |
| | 840 |
|
| Interest rate swap (Note 9) | 328 |
| | — |
| | 328 |
| | — |
|
|
| | | | | | | | | | | | | | | |
| Fair Value | | Quoted Prices in Active Markets (Level 1) | | Significant Other Observable Inputs (Level 2) | | Significant Unobservable Inputs (Level 3) |
| December 30, 2016 | | | | | | | |
| Assets | | | | | | | |
| Interest rate swaps (Note 9) | $ | 3,482 |
| | $ | — |
| | $ | 3,482 |
| | $ | — |
|
| Liabilities | | | | | | | |
| Foreign currency contracts (Note 15) | $ | 2,063 |
| | $ | — |
| | $ | 2,063 |
| | $ | — |
|
| | | | | | | | |
| January 1, 2016 | | | | | | | |
| Liabilities | | | | | | | |
| Foreign currency contracts | $ | 307 |
| | $ | — |
| | $ | 307 |
| | $ | — |
|
|
| | | | | | | | | | | | | | | |
| | Fair Value Measurements Using |
| Description | At December 28,
2012 | | Quoted
Prices in
Active Markets
for Identical
Assets
(Level 1) | | Significant
Other
Observable
Inputs
(Level 2) | | Significant
Unobservable
Inputs
(Level 3) |
| Assets | | | | | | | |
| Foreign currency contracts | $ | 757 |
| | $ | — |
| | $ | 757 |
| | $ | — |
|
| Liabilities | | | | | | | |
| Accrued contingent consideration | $ | 1,530 |
| | $ | — |
| | $ | — |
| | $ | 1,530 |
|
| Interest rate swap | 638 |
| | — |
| | 638 |
| | — |
|
GREATBATCH, INC.
NOTES TO CONSOLIDATED FINANCIAL STATEMENTS
Assets and Liabilities Measured at Fair Value on a Nonrecurring Basis
Fair value standards also apply to certain assets and liabilities that are measured at fair value on a nonrecurring basis. The carrying amounts of cash, accounts receivable, accounts payable and accrued expenses approximate fair value due to the short-term nature of these items. Refer to Note 9 “Debt” for further discussion regarding the fair value of the Company’s Senior Secured Credit Facilities and Senior Notes.
INTEGER HOLDINGS CORPORATION
NOTES TO CONSOLIDATED FINANCIAL STATEMENTS
(18.)FAIR VALUE MEASUREMENTS (Continued)
The following table provides information regarding assets recorded at fair value on a nonrecurring basis (in thousands):
|
| | | | | | | | | | | | | | | |
| | Fair Value | | Quoted Prices in Active Markets (Level 1) | | Significant Other Observable Inputs (Level 2) | | Significant Unobservable Inputs (Level 3) |
| December 30, 2016 | | | | | | | |
| Assets | | | | | | | |
| Cost method investment | $ | 430 |
| | $ | — |
| | $ | 430 |
| | $ | — |
|
| Assets Held for Sale (Note 5) | 794 |
| | — |
| | 794 |
| | — |
|
| | | | | | | | |
| January 1, 2016 | | | | | | | |
| Assets | | | | | | | |
| Cost method investment | $ | 1,100 |
| | $ | — |
| | $ | 1,100 |
| | $ | — |
|
A summary of the valuation methodologies for assets and liabilities measured on a nonrecurring basis is as follows:
Cost and equity method investments—Equity Method Investments
The Company holds investments in equity and other securities that are accounted for as either cost or equity method investments, which are classified as Other Assets. The total carrying value of these investments is reviewed quarterly for changes in circumstance or the occurrence of events that suggest the Company’s investment may not be recoverable. The fair value of cost or equity method investments is not adjusted if there are no identified events or changes in circumstances that may have a material effect on the fair value of the investments. Gains and losses realized on cost and equity method investments are recorded in Other Expense, Net, unless separately stated. The aggregate recorded amount of cost and equity method investments at December 30, 2016 and January 3,1, 2016 was $22.8 million and $20.6 million, respectively. The Company’s equity method investment is in a Chinese venture capital fund focused on investing in life sciences companies. As of December 30, 2016 and January 1, 2016, the Company’s recorded amount of this equity method investment was $10.7 million and $9.8 million, respectively. This fund accounts for its investments at fair value with the unrealized change in fair value of these investments recorded as income or loss to the fund in the period of change. As of December 30, 2016, the Company owned 7.0% of this fund.
During 2016, 2015 and 2014, and December 28, 2012 was $12.3 million and $9.1 million, respectively.
During 2013, 2012 and 2011, the Company recognized impairment charges related to its cost and equity method investments of $0.5$1.6 million,, $0.1 $1.4 million and $0.3$0.0 million,, respectively. The fair value of these investments waswere determined by reference to recent sales data of similar shares to independent parties in an inactive market. This fair value calculation wasis categorized in Level 2 of the fair value hierarchy. On January 5, 2011,During 2016, 2015 and 2014, the Company soldrecognized net gains on equity method investments of $0.1 million, $4.7 million, and $1.2 million, respectively. During 2015, the Company recorded a gain and received a $3.6 million cash distribution from its cost method investment in IntElect Medical, Inc. (“IntElect”) in conjunction with Boston Scientific’s acquisition of IntElect. This transaction resulted in a pre-tax gain of $4.5 million in 2011 and an additional $0.4 million during 2012. Cost and equity method investment, impairment charges, gains and losses are included in Loss (Gain) on Cost and Equity Method Investments, Netwhich was classified as a cash flow from operating activities in the Consolidated Statements of Operations.Cash Flows as it represented a return on investment. During 2014, the Company sold one of its cost method investments, which resulted in pre-tax gains of $0.7 million in 2016 and $3.2 million in 2014.
Long-lived assets – Long-Lived Assets
The Company reviews the carrying amount of its long-lived assets to be held and used for potential impairment whenever certain indicators are present as described in Note 1 “Summary of Significant Accounting Policies.” In connection with the sale of certain orthopaedicDuring 2016 and wireless sensing product lines, during 2012,2014, the Company transferred long-lived assets to held for sale. In connection with these transfers, the Company recognizedrecorded in Other Operating Expenses, Net impairment charges of $1.0 million and $0.4 million related to its long-lived assets. There were no impairment charges recorded during 2013 and 2012. Refer2015 related to Note 5 “Assets Held for Sale” for further discussion.the Company’s long-lived assets. The fair value of these asset groupsassets were determined based upon therecent sales price or offers for the long-liveddata of similar assets and discussions with potential buyers, and was categorized in Level 2 of the fair value hierarchy. During 2013, the Company wrote off its IPR&D assets as these projects were discontinued priorRefer to reaching technological feasibility. See Note 7 “Intangible Assets.”
The following table provides information regarding assets5 “Assets Held for Sale” and liabilities recorded at fair value on a nonrecurring basis. There were no such assets or liabilities as of January 3, 2014 (in thousands):
|
| | | | | | | | | | | | | | | |
| | Fair Value Measurements Using |
| Description | At December 28,
2012 | | Quoted
Prices in
Active Markets
for Identical
Assets
(Level 1) | | Significant
Other
Observable
Inputs
(Level 2) | | Significant
Unobservable
Inputs
(Level 3) |
| Assets | | | | | | | |
| Assets Held for Sale—Swiss orthopaedic disposal group (Note 5) | $ | 4,499 |
| | $ | — |
| | $ | 4,499 |
| | $ | — |
|
| Cost method investment | 86 |
| | — |
| | 86 |
| | — |
|
Fair Value of Other Financial Instruments
Pension plan assets – Plan Assets
The fair value of the Company’s pension plan assets disclosed in Note 10 “Defined Benefit“Benefit Plans” are determined based upon quoted market prices in inactive markets or valuation models with observable market data inputs to estimate fair value. These observable market data inputs include benchmark yields, reported trades, broker/dealer quotes, issuer spreads, benchmark securities, bids, offers and reference data. The Company’s pension plan assets are categorized in Level 1 or Level 2 of the fair value hierarchy.
GREATBATCH, INC.INTEGER HOLDINGS CORPORATION
NOTES TO CONSOLIDATED FINANCIAL STATEMENTS
(19.)BUSINESS SEGMENT, GEOGRAPHIC AND CONCENTRATION RISK INFORMATION |
| | |
19. | | BUSINESS SEGMENT, GEOGRAPHIC AND CONCENTRATION RISK INFORMATION |
In connection with the realignmentAs a result of the Company's operating structure in 2013 to optimize profitable growth, which included changingLake Region Medical acquisition and Spin-off, during 2016 the Company'sCompany reorganized its operations including its internal management and financial reporting structure,structure. As a result of this reorganization, the Company reevaluated and revised its operating and reporting segments. Beginning inreportable business segments during the fourth quarter of 2013, the Company determined that it has2016 and began to disclose two reportable segments: Greatbatch(1) Medical and QiG. As required, the Company reclassified certain prior year amounts to conform them to the current year presentation, including goodwill, segment operating income (loss), segment depreciation and amortization, segment assets and sales categorizations.(2) Non-Medical. The two reportable segments, along with their related product lines, are described below:
Greatbatch Medical designs and manufactures medical devices and components where Greatbatch either owns the intellectual property or has unique manufacturing and assembly expertise and - includes the financial results of the former Implantable Medical and Electrochem segments, excluding QiG. Greatbatch Medical provides medical devices and components to the following markets:
Cardiac/Neuromodulation: Products include batteries, capacitors, filtered and unfiltered feed-throughs, engineered components, implantable stimulation leads, and enclosures used in implantable medical devices.
Orthopaedics: Products include hip and shoulder joint reconstruction implants, bone plates and spinal devices, and instruments and delivery systems used in hip and knee replacement, trauma fixation, and spinal surgeries.
Portable Medical: Products include life-saving and life-enhancing applications comprising automated external defibrillators, portable oxygen concentrators, ventilators, and powered surgical tools.
Vascular: Products include(i) Cardio & Vascular product line, which includes introducers, medical coatings, steerable sheaths, guidewires, catheters, and cathetersstimulation therapy components, subassemblies and finished devices that deliver therapies for various markets such as coronary and neurovascular disease, peripheral vascular disease, interventional radiology, vascular access, atrial fibrillation, and interventional cardiology, plus products for medical imaging and pharmaceutical delivery.delivery; (ii) Cardiac & Neuromodulation product line, which includes batteries, capacitors, filtered and unfiltered feed-throughs, engineered components, implantable stimulation leads, and enclosures used in implantable medical devices; and (iii) Advanced Surgical, Orthopedics & Portable Medical product line, which includes components, sub-assemblies, finished devices, implants, instruments and delivery systems for a range of surgical technologies to the advanced surgical market, including laparoscopy, orthopedics and general surgery, biopsy and drug delivery, joint preservation and reconstruction, arthroscopy, and engineered tubing solutions. Products also include life-saving and life-enhancing applications comprising of automated external defibrillators, portable oxygen concentrators, ventilators, and powered surgical tools.
Energy: Non-MedicalProducts include - includes primary (lithium) cells, and primary and rechargeable batteries andsecondary battery packs for demanding applications suchin the energy, military and environmental markets.
The Company defines segment income from operations as down hole drilling tools.
Greatbatch Medicalsales less cost of sales including amortization and expenses attributable to segment-specific selling, general, administrative, research, development, engineering and other operating activities. Segment income also offers value-added assemblyincludes a portion of non-segment specific selling, general, and design engineering services for medical devices that utilize its component products.
QiG focusesadministrative expenses based on developing medical device systems for some of healthcare’s most pressing challenges and reflects Greatbatch’s strategic evolution of its product offerings in order to raise the growth and profitability profile of the Company. QiG utilizes a disciplined and diversified portfolio approach with three investment modes: new medical device systems commercialization, collaborative programs with OEM customers, and strategic equity positions in start-up companies. The development of certain new medical device systems are facilitated through the establishment of limited liability corporations (“LLC”). These LLCs do not own, but have the exclusive right to use the technology of Greatbatch Medical in certain, specifically designed fields of use and have an exclusive manufacturing agreement with Greatbatch Medical. QiG currently owns 89% - 100% of three LLCs. The minority interest of these LLCs was granted to key opinion leaders, clinicians and strategic partners at or near the time the LLC was established. Under the LLC agreement, QiG is liable for 100% of the expenses incurred by the LLC. However, no income is distributedallocations appropriate to the minority holders ofexpense categories. The remaining unallocated operating and other expenses are primarily administrative corporate headquarter expenses and capital costs that are not allocated to reportable segments. Transactions between the LLC until QiG is reimbursed for all expenses paid. Once QiG has been fully reimbursed, all future net income is distributed based upon the respective LLCs ownership percentages. One of the LLCs established by QiG is for the Company's spinal cord stimulator to treat chronic intractable pain of the trunk and/or limbs. This product was submitted for Food and Drug Administration (“FDA”) and CE Mark approval near the end of 2013. Another medical device system being developed by QiG is an implantable loop recorder for cardiac arrhythmia diagnostics.two segments are not significant.
Current QiG revenue includes sales of neural interface technology, components and systems to the neuroscience and clinical markets. Future income of QiG is expected to come from various sources including investment gains from the sales of LLC ownership interests, technology licensing fees, royalty revenue, and/or the sales of medical device systems to OEM customers.
Historical results reflecting the new business segments for previously reported periods are shown below. An analysis and reconciliation of the Company’s business segment,segments, product linelines and geographic information to the respective information in the Consolidated Financial Statements follows. Prior period amounts have been reclassified to conform to the new segment reporting presentation. Sales by geographic area for fiscal years 2016, 2015 and 2014 are presented by allocating sales from external customers based on where the products are shipped to (in thousands):
|
| | | | | | | | | | | |
| | 2016 | | 2015 | | 2014 |
| Segment sales by product line: | | | | | |
| Medical | | | | | |
| Cardio & Vascular | $ | 568,510 |
| | $ | 143,260 |
| | $ | 58,770 |
|
| Cardiac & Neuromodulation | 389,403 |
| | 356,064 |
| | 330,921 |
|
| Advanced Surgical, Orthopedics & Portable Medical | 392,778 |
| | 243,385 |
| | 216,339 |
|
| Elimination of interproduct line sales | (5,592 | ) | | (1,744 | ) | | — |
|
| Total Medical | 1,345,099 |
| | 740,965 |
| | 606,030 |
|
| Non-Medical | 41,679 |
| | 59,449 |
| | 81,757 |
|
| Total sales | $ | 1,386,778 |
| | $ | 800,414 |
| | $ | 687,787 |
|
|
| | | | | | | | | | | |
| | 2016 | | 2015 | | 2014 |
| Segment income from operations: | | | | | |
| Medical | $ | 185,448 |
| | $ | 83,784 |
| | $ | 91,677 |
|
| Non-Medical | 1,513 |
| | 7,289 |
| | 20,799 |
|
| Total segment income from operations | 186,961 |
| | 91,073 |
| | 112,476 |
|
| Unallocated operating expenses | (78,691 | ) | | (77,927 | ) | | (36,822 | ) |
| Operating income | 108,270 |
| | 13,146 |
| | 75,654 |
|
| Unallocated expenses, net | (107,085 | ) | | (28,846 | ) | | 925 |
|
| Income (loss) before provision (benefit) for income taxes | $ | 1,185 |
| | $ | (15,700 | ) | | $ | 76,579 |
|
GREATBATCH, INC.INTEGER HOLDINGS CORPORATION
NOTES TO CONSOLIDATED FINANCIAL STATEMENTS
|
| | | | | | | | | | | |
| | Year Ended |
| Sales: | January 3,
2014 | | December 28,
2012 | | December 30,
2011 |
| Greatbatch Medical | | | | | |
| Cardiac/Neuromodulation | $ | 325,412 |
| | $ | 306,669 |
| | $ | 303,690 |
|
| Orthopaedics | 130,247 |
| | 122,061 |
| | 140,277 |
|
| Portable Medical | 78,743 |
| | 81,659 |
| | 9,609 |
|
| Vascular | 48,357 |
| | 51,980 |
| | 45,098 |
|
| Energy | 52,488 |
| | 54,066 |
| | 48,100 |
|
| Other | 25,655 |
| | 27,287 |
| | 22,048 |
|
| Total Greatbatch Medical | 660,902 |
| | 643,722 |
| | 568,822 |
|
| QiG | 3,043 |
| | 2,455 |
| | — |
|
| Total sales | $ | 663,945 |
| | $ | 646,177 |
| | $ | 568,822 |
|
|
| | | | | | | | | | | |
| | Year Ended |
| | January 3,
2014 | | December 28,
2012 | | December 30,
2011 |
| Segment income (loss) from operations: | | | | | |
| Greatbatch Medical | $ | 111,805 |
| | $ | 79,093 |
| | $ | 104,703 |
|
| QiG | (30,484 | ) | | (32,554 | ) | | (27,277 | ) |
| Total segment income from operations | 81,321 |
| | 46,539 |
| | 77,426 |
|
| Unallocated operating expenses | (19,982 | ) | | (20,718 | ) | | (15,727 | ) |
| Operating income as reported | 61,339 |
| | 25,821 |
| | 61,699 |
|
| Unallocated other expense | (12,501 | ) | | (19,091 | ) | | (13,307 | ) |
| Income before provision for income taxes as reported | $ | 48,838 |
| | $ | 6,730 |
| | $ | 48,392 |
|
(19.)BUSINESS SEGMENT, GEOGRAPHIC AND CONCENTRATION RISK INFORMATION (Continued)
| | | | Year Ended | 2016 | | 2015 | | 2014 |
| | January 3,
2014 | | December 28,
2012 | | December 30,
2011 | |
| Depreciation and Amortization: | | | | | | |
| Greatbatch Medical | $ | 31,112 |
| | $ | 39,820 |
| | $ | 31,247 |
| |
| QiG | 1,539 |
| | 630 |
| | 289 |
| |
| Segment depreciation and amortization: | | | | | | |
| Medical | | $ | 83,184 |
| | $ | 61,618 |
| | $ | 31,346 |
|
| Non-Medical | | 2,346 |
| | 2,503 |
| | 2,661 |
|
| Total depreciation and amortization included in segment income from operations | 32,651 |
| | 40,450 |
| | 31,536 |
| 85,530 |
| | 64,121 |
| | 34,007 |
|
| Unallocated depreciation and amortization | 9,681 |
| | 18,475 |
| | 16,159 |
| 4,994 |
| | 3,497 |
| | 3,450 |
|
| Total depreciation and amortization | $ | 42,332 |
| | $ | 58,925 |
| | $ | 47,695 |
| $ | 90,524 |
| | $ | 67,618 |
| | $ | 37,457 |
|
| | | | Year Ended | | | | | | | |
| | January 3,
2014 | | December 28,
2012 | | December 30,
2011 | 2016 | | 2015 | | 2014 |
| Expenditures for tangible long-lived assets, excluding acquisitions: | | | | | | | | | | |
| Greatbatch Medical | $ | 13,242 |
| | $ | 33,249 |
| | $ | 22,692 |
| |
| QiG | 2,134 |
| | 3,208 |
| | 889 |
| |
| Medical | | $ | 44,670 |
| | $ | 40,931 |
| | $ | 19,838 |
|
| Non-Medical | | 1,451 |
| | 600 |
| | 621 |
|
| Total reportable segments | 15,376 |
| | 36,457 |
| | 23,581 |
| 46,121 |
| | 41,531 |
| | 20,459 |
|
| Unallocated long-lived tangible assets | 2,798 |
| | 4,709 |
| | 741 |
| 8,251 |
| | 6,523 |
| | 5,187 |
|
| Total expenditures | $ | 18,174 |
| | $ | 41,166 |
| | $ | 24,322 |
| $ | 54,372 |
| | $ | 48,054 |
| | $ | 25,646 |
|
|
| | | | | | | | | | | |
| | 2016 | | 2015 | | 2014 |
| Sales by geographic area: | | | | | |
| United States | $ | 805,742 |
| | $ | 401,380 |
| | $ | 312,539 |
|
| Non-Domestic locations: | | | | | |
| Puerto Rico | 159,243 |
| | 136,898 |
| | 127,702 |
|
| Belgium | 69,149 |
| | 62,546 |
| | 65,308 |
|
| Rest of world | 352,644 |
| | 199,590 |
| | 182,238 |
|
| Total sales | $ | 1,386,778 |
| | $ | 800,414 |
| | $ | 687,787 |
|
|
| | | | | | | | | | | |
| | December 30,
2016 | | January 1,
2016 | | January 2,
2015 |
| Identifiable assets: | | | | | |
| Medical | $ | 2,638,180 |
| | $ | 2,766,421 |
| | $ | 763,905 |
|
| Non-Medical | 60,988 |
| | 66,492 |
| | 73,849 |
|
| Total reportable segments | 2,699,168 |
| | 2,832,913 |
| | 837,754 |
|
| Unallocated assets | 133,375 |
| | 149,223 |
| | 117,368 |
|
| Total assets | $ | 2,832,543 |
| | $ | 2,982,136 |
| | $ | 955,122 |
|
|
| | | | | | | | | | | |
| | December 30,
2016 | | January 1,
2016 | | January 2,
2015 |
| Long-lived tangible assets by geographic area: | | | | | |
| United States | $ | 258,899 |
| | $ | 264,556 |
| | $ | 113,851 |
|
| Rest of world | 113,143 |
| | 114,936 |
| | 31,074 |
|
| Total | $ | 372,042 |
| | $ | 379,492 |
| | $ | 144,925 |
|
GREATBATCH, INC.INTEGER HOLDINGS CORPORATION
NOTES TO CONSOLIDATED FINANCIAL STATEMENTS
|
| | | | | | | | | | |
| | At |
| | January 3,
2014 | | December 28,
2012 | December 30,
2011 |
| Identifiable assets: | | | | |
| Greatbatch Medical | $ | 758,369 |
| | $ | 779,890 |
| $ | 766,125 |
|
| QiG | 56,245 |
| | 57,750 |
| 49,407 |
|
| Total reportable segments | 814,614 |
| | 837,640 |
| 815,532 |
|
| Unallocated assets | 76,089 |
| | 52,235 |
| 65,815 |
|
| Total assets | $ | 890,703 |
| | $ | 889,875 |
| $ | 881,347 |
|
|
| | | | | | | | | | | |
| | Year Ended |
| | January 3,
2014 | | December 28,
2012 | | December 30,
2011 |
| Sales by geographic area: | | | | | |
| United States | $ | 325,090 |
| | $ | 330,537 |
| | $ | 256,987 |
|
| Non-Domestic locations: | | | | | |
| Puerto Rico | 117,961 |
| | 105,731 |
| | 94,059 |
|
| Belgium | 67,155 |
| | 58,043 |
| | 62,978 |
|
| United Kingdom & Ireland | 39,972 |
| | 43,938 |
| | 54,029 |
|
| Rest of world | 113,767 |
| | 107,928 |
| | 100,769 |
|
| Total sales | $ | 663,945 |
| | $ | 646,177 |
| | $ | 568,822 |
|
|
| | | | | | | | | | | |
| | At |
| | January 3,
2014 | | December 28,
2012 | | December 30,
2011 |
| Long-lived tangible assets: | | | | | |
| United States | $ | 116,484 |
| | $ | 123,104 |
| | $ | 113,693 |
|
| Rest of world | 29,289 |
| | 27,789 |
| | 32,113 |
|
| Total | $ | 145,773 |
| | $ | 150,893 |
| | $ | 145,806 |
|
(19.)BUSINESS SEGMENT, GEOGRAPHIC AND CONCENTRATION RISK INFORMATION (Continued)
A significant portion of the Company’s sales for fiscal years 2016, 2015 and 2014 and accounts receivable at December 30, 2016 and January 1, 2016 were to threefour customers as follows:
| | | | Sales | | Accounts Receivable | | | | | | | | | | | |
| | Year Ended | | At | Sales | | Accounts Receivable |
| | January 3,
2014 | | December 28,
2012 | | December 30,
2011 | | January 3,
2014 | | December 28,
2012 | 2016 | | 2015 | | 2014 | | December 30,
2016 | | January 1,
2016 |
| Customer A | 20 | % | | 19 | % | | 19 | % | | 8 | % | | 7 | % | 18 | % | | 17 | % | | 18 | % | | 7 | % | | 8 | % |
| Customer B | 16 | % | | 16 | % | | 19 | % | | 19 | % | | 21 | % | 17 | % | | 18 | % | | 18 | % | | 20 | % | | 23 | % |
| Customer C | 13 | % | | 11 | % | | 13 | % | | 8 | % | | 6 | % | 12 | % | | 12 | % | | 12 | % | | 4 | % | | 6 | % |
| Customer D | | 9 | % | | 5 | % | | 5 | % | | 14 | % | | 7 | % |
| | 49 | % | | 46 | % | | 51 | % | | 35 | % | | 34 | % | 56 | % | | 52 | % | | 53 | % | | 45 | % | | 44 | % |
(20.)QUARTERLY SALES AND EARNINGS DATA—UNAUDITED
|
| | | | | | | | | | | | | | | |
| (in thousands, except per share data) | Fourth Quarter | | Third Quarter | | Second Quarter | | First Quarter |
| Fiscal Year 2016 | | | | | | | |
| Sales | $ | 359,591 |
| | $ | 346,567 |
| | $ | 348,382 |
| | $ | 332,238 |
|
| Gross profit | 92,891 |
| | 97,909 |
| | 96,031 |
| | 91,468 |
|
| Net income (loss) | 7,933 |
| | 11,458 |
| | (770 | ) | | (12,660 | ) |
| EPS—basic | 0.26 |
| | 0.37 |
| | (0.03 | ) | | (0.41 | ) |
| EPS—diluted | 0.25 |
| | 0.37 |
| | (0.03 | ) | | (0.41 | ) |
| | | | | | | | |
| Fiscal Year 2015 | | | | | | | |
| Sales | $ | 317,567 |
| | $ | 146,637 |
| | $ | 174,890 |
| | $ | 161,320 |
|
| Gross profit | 73,140 |
| | 51,646 |
| | 57,951 |
| | 52,398 |
|
| Net income (loss) | (24,907 | ) | | 22 |
| | 9,283 |
| | 8,008 |
|
| EPS—basic | (0.85 | ) | | — |
| | 0.36 |
| | 0.32 |
|
| EPS—diluted | (0.85 | ) | | — |
| | 0.35 |
| | 0.31 |
|
Net income (loss) in the first, second, third, and fourth quarters of 2016 and the third and fourth quarters of 2015 include $14.2 million, $7.9 million, $5.4 million, $5.1 million, $13.0 million and $57.1 million, respectively, of charges incurred in connection with the Lake Region Medical acquisition (transaction and integration, inventory step-up amortization, debt related charges) and the Spin-off (professional and consulting fees). Sales for the fourth quarter of 2015 include $138.6 million from the acquisition of Lake Region Medical. Refer to Note 2 “Divestiture and Acquisitions.”
GREATBATCH, INC.
NOTES TO CONSOLIDATED FINANCIAL STATEMENTS
|
| | |
20. | | QUARTERLY SALES AND EARNINGS DATA—UNAUDITED |
ITEM 9. CHANGES IN AND DISAGREEMENTS WITH ACCOUNTANTS ON ACCOUNTING AND |
| | | | | | | | | | | | | | | |
| | 4th Qtr. | | 3rd Qtr. | | 2nd Qtr. | | 1st Qtr. |
| | (in thousands, except per share data) |
| 2013 | | | | | | | |
| Sales | $ | 176,619 |
| | $ | 167,730 |
| | $ | 171,331 |
| | $ | 148,265 |
|
| Gross profit | 57,385 |
| | 55,877 |
| | 57,302 |
| | 48,749 |
|
| Net income | 9,781 |
| | 11,071 |
| | 9,752 |
| | 5,663 |
|
| EPS—basic | 0.40 |
| | 0.46 |
| | 0.41 |
| | 0.24 |
|
| EPS—diluted | 0.38 |
| | 0.44 |
| | 0.39 |
| | 0.23 |
|
| | | | | | | | |
| 2012 | | | | | | | |
| Sales | $ | 159,186 |
| | $ | 161,340 |
| | $ | 166,548 |
| | $ | 159,103 |
|
| Gross profit | 51,874 |
| | 50,954 |
| | 51,933 |
| | 46,888 |
|
| Net income (loss) | (5,556 | ) | | (7,561 | ) | | 3,851 |
| | 4,467 |
|
| EPS—basic | (0.23 | ) | | (0.32 | ) | | 0.16 |
| | 0.19 |
|
| EPS—diluted | (0.23 | ) | | (0.32 | ) | | 0.16 |
| | 0.19 |
|
Net income in the third and fourth quarters of 2012 was impacted by charges incurred in connection with the consolidation of the Company’s Swiss orthopaedic facilities. See Note 13 “Other Operating Expenses, Net.”
Fourth quarter results for 2013 includes an additional week of operations in comparison to the same period of 2012 as the Company utilizes a fifty-two, fifty-three week fiscal year, which ends on the Friday nearest December 31st. Although this additional week of operations may have impacted certain financial statement line items, management believes that, when combined with the additional holiday and weather related shutdowns, this additional week did not materially impact our net operating results.
|
| | |
ITEM 9. | | CHANGES IN AND DISAGREEMENTS WITH ACCOUNTANTS ON ACCOUNTING AND FINANCIAL DISCLOSURE |
None.
ITEM 9A. CONTROLS AND PROCEDURES
|
ITEM 9A. |
| | CONTROLS AND PROCEDURES |
Management’s Report on Internal Control Over Financial Reporting appears in Part II, Item 8, “Financial Statements and Supplementary Data” of this report and is incorporated into this Item 9A by reference.
| |
| a. | Evaluation of Disclosure Controls and Procedures. |
Our management, including the principal executive officer and principal financial officer, evaluated our disclosure controls and procedures (as defined in Rules 13a-15(e) and 15d-15(e) under the Securities Exchange Act of 1934) related to the recording, processing, summarization and reporting of information in our reports that we file with the Securities and Exchange Commission as of January 3, 2014.December 30, 2016. These disclosure controls and procedures have been designed to provide reasonable assurance that material information relating to us, including our subsidiaries, is made known to our management, including these officers, by our employees, and that this information is recorded, processed, summarized, evaluated and reported, as applicable, within the time periods specified in the Securities and Exchange Commission’s rules and forms. Based on their evaluation, as of January 3, 2014,December 30, 2016, our principal executive officer and principal financial officer have concluded that our disclosure controls and procedures are effective.
| |
b. | b. Changes in Internal Control Over Financial Reporting. |
There have beenwere no changes in the registrant’sour internal control over financial reporting that occurred during our last fiscal quarter to which this Annual Report on Form 10-K relates that have materially affected, or are reasonably likely to materially affect, internal control over financial reporting.
ITEM 9B. OTHER INFORMATION
|
ITEM 9B. |
| | OTHER INFORMATION |
None.
PART III
ITEM 10. DIRECTORS, EXECUTIVE OFFICERS AND CORPORATE GOVERNANCE
Information regarding the Company’s directors appearing under the caption “Election of Directors” in the Company’s Proxy Statement for its 20142017 Annual Meeting of Stockholders is incorporated herein by reference.
Information regarding the Company’s executive officers is presented under the caption “Executive Officers of the Company” in Part I of this Annual Report on Form 10-K.
The other information required by Item 10 is incorporated herein by reference from the Company’s Proxy Statement for its 20142017 Annual Meeting of Stockholders.
ITEM 11. EXECUTIVE COMPENSATION
|
ITEM 11. |
| | EXECUTIVE COMPENSATION |
Information regarding executive compensation appearing under the captions “Compensation Discussion and Analysis”, “Executive Compensation” and “Compensation Committee Interlocks and Insider Participation” in the Company’s Proxy Statement for the 20142017 Annual Meeting of Stockholders is incorporated herein by reference.
ITEM 12. SECURITY OWNERSHIP OF CERTAIN BENEFICIAL OWNERS AND MANAGEMENT AND
RELATED STOCKHOLDER MATTERS
|
ITEM 12. |
| | SECURITY OWNERSHIP OF CERTAIN BENEFICIAL OWNERS AND MANAGEMENT AND RELATED STOCKHOLDER MATTERS |
Information regarding security ownership of certain beneficial owners and management and related stockholder matters, including the table titled “Equity Compensation Plan Information,”Information” and under the caption “Stock Ownership by Directors and Officers” in the Company’s Proxy Statement for the 20142017 Annual Meeting of Stockholders is incorporated herein by reference.
ITEM 13. CERTAIN RELATIONSHIPS AND RELATED TRANSACTIONS, AND DIRECTOR INDEPENDENCE
Information regarding certain relationships and related transactions, and director independence under the captions “Related Person Transactions” and “Board Independence” in the Company’s Proxy Statement for the 20142017 Annual Meeting of Stockholders is incorporated herein by reference.
ITEM 14. PRINCIPAL ACCOUNTANT FEES AND SERVICES
Information regarding the fees paid to and services provided by Deloitte & Touche LLP, the Company’s independent registered public accounting firm under the caption “Ratification of the Appointment of Independent Registered Public Accounting Firm” in the Company’s Proxy Statement for the 20142017 Annual Meeting of Stockholders is incorporated herein by reference.
PART IV
ITEM 15. EXHIBITS AND FINANCIAL STATEMENT SCHEDULES
|
ITEM 15. |
| | EXHIBITS AND FINANCIAL STATEMENT SCHEDULES |
| |
(a) | LIST OF DOCUMENTS FILED AS PART OF THIS REPORT |
(a) LIST OF DOCUMENTS FILED AS PART OF THIS REPORT
| |
| 1. | Financial statements and financial statement schedules filed as part of this Annual Report on Form 10-K. SeeRefer to Part II, Item 8. “Financial Statements and Supplementary Data.” |
| |
| 2. | The following financial statement schedule is included in this reportAnnual Report on Form 10-K (in thousands): |
Schedule II—Valuation and Qualifying Accounts
| | | | | | Col. C—Additions | | | | | | | | |
Col. A Description | Col. B Balance at Beginning of Period | | Charged to Costs & Expenses | | Charged to Other Accounts- Describe | | | | Col. D Deductions - Describe | | | Col. E Balance at End of Period | |
| January 3, 2014 | | | | | | | | | | |
| (in thousands) | | | | | Col. C—Additions | | | | |
Column A Description | | | Col. B Balance at Beginning of Period | | Charged to Costs & Expenses | | Charged to Other Accounts- Describe | | Col. D Deductions - Describe | | Col. E Balance at End of Period |
| December 30, 2016 | | | | | | | | | | | |
| Allowance for doubtful accounts | $ | 2,372 |
| | $ | (93 | ) | | $ | (15 | ) | | (4) | | $ | (263 | ) | (2) | | $ | 2,001 |
| | $ | 954 |
| | $ | 140 |
| | $ | 245 |
| (4) | $ | (597 | ) | (2) | $ | 742 |
|
| Valuation allowance for deferred income tax assets | $ | 12,768 |
| | $ | (1,263 | ) | (1) | $ | 32 |
| | (4) | | $ | 124 |
| (1) | | $ | 11,661 |
| | $ | 39,171 |
| | $ | 641 |
| (1) | $ | (5,135 | ) | (3)(4) | $ | 714 |
| (5) | $ | 35,391 |
|
| December 28, 2012 | | | | | | | | | | |
| January 1, 2016 | | | | | | | | | | | |
| Allowance for doubtful accounts | $ | 1,930 |
| | $ | 484 |
| | $ | 71 |
| | (3)(4) | | $ | (113 | ) | (2) | | $ | 2,372 |
| | $ | 1,411 |
| | $ | (70 | ) | | $ | 459 |
| (3)(4) | $ | (846 | ) | (2) | $ | 954 |
|
| Valuation allowance for deferred income tax assets | $ | 7,775 |
| | $ | 5,145 |
| (1) | $ | 124 |
| | (4) | | $ | (276 | ) | (5) | | $ | 12,768 |
| | $ | 10,709 |
| | $ | 788 |
| (1) | $ | 27,836 |
| (3)(4) | $ | (162 | ) | (5) | $ | 39,171 |
|
| December 30, 2011 | | | | | | | | | | |
| January 2, 2015 | | | | | | | | | | | |
| Allowance for doubtful accounts | $ | 1,830 |
| | $ | 288 |
| | $ | 170 |
| | (3)(4) | | $ | (358 | ) | (2) | | $ | 1,930 |
| | $ | 2,001 |
| | $ | 98 |
| | $ | 14 |
| (3)(4) | $ | (702 | ) | (2) | $ | 1,411 |
|
| Valuation allowance for deferred income tax assets | $ | 6,482 |
| | $ | 702 |
| (1) | $ | 591 |
| | (3)(4) | | $ | — |
| | | $ | 7,775 |
| | $ | 11,661 |
| | $ | (729 | ) | (1) | $ | — |
| | $ | (223 | ) | (1)(5) | $ | 10,709 |
|
| |
(1) | Valuation allowance recorded in the provision for income taxes for certain net operating losses and tax credits. The net increasedecrease in allowance in 20132014 primarily relates to the use of net operating losses incurred by our Switzerland operations.loss carryforwards. |
| |
(2) | Accounts written off, net of collections on accounts receivable previously written off. |
| |
(3) | BalancesBalance recorded as a part of our 20122015 acquisition of NeuroNexus Technologies, Inc.Lake Region Medical and 2011our 2014 acquisition of Micro Power Electronics, Inc.Centro de Construcción de Cardioestimuladores del Uruguay. 2016 amount represents measurement-period adjustments related to the acquisition of Lake Region Medical. |
| |
(4) | Includes foreign currency translation effect. |
| |
(5) | Primarily relates to return to provision adjustments for prior years. |
Schedules not listed above have been omitted because the information required to be set forth therein is not applicable or is shown in the financial statements or notes thereto.
| |
(3)3. | Exhibits required by Item 601 of Regulation S-K. The exhibits listed on the Exhibit Index of this Annual Report on Form 10-K have been previously filed, are filed herewith or are incorporated herein by reference to other filings. |
ITEM 16. FORM 10-K SUMMARY
None.
SIGNATURES
Pursuant to the requirements of Sections 13 or 15(d) of the Securities Exchange Act of 1934, the registrant has duly caused this report to be signed on its behalf by the undersigned, thereunto duly authorized.
|
| | | |
| | INTEGER HOLDINGS CORPORATION |
| | | |
| Dated: | March 4, 2014February 28, 2017 | By | /s/ Thomas J. Hook |
| | | | Thomas J. Hook (Principal Executive Officer) |
| | | | President &and Chief Executive Officer |
Pursuant to the requirements of the Securities Exchange Act of 1934, this report has been signed below by the following persons on behalf of the registrant and in the capacities and on the date indicated.
|
| | | | |
| Signature | | Title | | Date |
| | | | | |
| /s/ Thomas J. Hook | | President, & Chief Executive Officer &and Director (Principal Executive Officer)
| | March 4, 2014February 28, 2017 |
| Thomas J. Hook | | | | |
| | (Principal Executive Officer) | | |
| /s/ Michael Dinkins | | Executive Vice President &and Chief Financial Officer (Principal Financial Officer) | | March 4, 2014February 28, 2017 |
| Michael Dinkins | | | | |
| | (Principal Financial Officer) | | |
| /s/ Thomas J. Mazza | | Vice President, and Corporate Controller (Principal Accounting Officer)and Treasurer | | March 4, 2014February 28, 2017 |
| Thomas J. Mazza | | | | |
| | (Principal Accounting Officer) | | |
| /s/ Bill R. Sanford | | Chairman | | March 4, 2014February 28, 2017 |
| Bill R. Sanford | | | | |
| | | | |
| /s/ Pamela G. Bailey | | Director | | March 4, 2014February 28, 2017 |
| Pamela G. Bailey | | | | |
| | | | |
/s/ Anthony P. Bihl III | | Director | | March 4, 2014 |
Anthony P. Bihl III | | | | |
| | | | |
| /s/ Joseph W. Dziedzic | | Director | | March 4, 2014February 28, 2017 |
| Joseph W. Dziedzic | | | | |
| /s/ Jean M. Hobby | | Director | | February 28, 2017 |
| Jean M. Hobby | | | | |
/s/ Rudy A. MazzocchiM. Craig Maxwell | | Director | | March 4, 2014February 28, 2017 |
Rudy A. Mazzocchi | | | | |
| M. Craig Maxwell | | | | |
/s/ Kevin C. MeliaFilippo Passerini | | Director | | March 4, 2014February 28, 2017 |
Kevin C. Melia | | | | |
| | | | |
/s/ Dr. Joseph A. Miller, Jr. | | Director | | March 4, 2014 |
Dr. Joseph A. Miller, Jr. | | | | |
| Filippo Passerini | | | | |
| /s/ Peter H. Soderberg | | Director | | March 4, 2014February 28, 2017 |
| Peter H. Soderberg | | | | |
| /s/ Donald J. Spence | | Director | | February 28, 2017 |
| Donald J. Spence | | | | |
| /s/ William B. Summers, Jr. | | Director | | March 4, 2014February 28, 2017 |
| William B. Summers, Jr. | | | | |
EXHIBIT INDEX
|
| | |
EXHIBIT NUMBER | | DESCRIPTION |
| | | |
| 2.1 | | Agreement and Plan of Merger, dated as of August 27, 2015, by and among Lake Region Medical Holdings, Inc., Greatbatch, Inc. and Provenance Merger Sub Inc. (incorporated by reference to Exhibit 2.1 to our Current Report on Form 8-K filed on August 31, 2015). |
| | |
| 2.2 | | Separation and Distribution Agreement, dated March 14, 2016, between Greatbatch, Inc. and QiG Group, LLC (incorporated by reference to Exhibit 2.2 to our Current Report on Form 8-K filed on March 18, 2016). |
| | |
| 3.1 | | Amended and Restated Certificate of Incorporation as amendedof Integer Holdings Corporation (incorporated by reference to Exhibit 3.1 to our quarterly reportQuarterly Report on Form 10-Q for the period ended June 27, 2008)July 1, 2016). |
| | | |
| 3.2 | | Amended and Restated BylawsBy-laws of Integer Holdings Corporation (Amended as of August 3, 2016) (incorporated by reference to Exhibit 3.2 to our annual reportQuarterly Report on Form 10-K10-Q for the period ended JanuaryJuly 1, 2010)2016). |
| | |
| 4.1 | | Indenture (including form of Note), dated as of October 27, 2015, by and among Greatbatch Ltd., the guarantors from time to time party thereto and Wilmington Trust, National Association, as trustee (incorporated by reference to Exhibit 4.1 to our Current Report on Form 8-K filed on October 28, 2015). |
| | |
| 4.2 | | Stockholders Agreement, dated as of October 27, 2015, by and among Greatbatch, Inc., Kohlberg Kravis Roberts & Co. L.P., Bain Capital Investors, LLC and each other stockholder party thereto (incorporated by reference to Exhibit 4.2 to our Current Report on Form 8-K filed on October 28, 2015). |
| | | |
| 10.1# | | 1998 Stock Option Plan (including form of “standard” option agreement, form of “special” option agreement and form of “non-standard” option agreement) (incorporated by reference to Exhibit 10.2 to our Registration Statement on Form S-1 filed on May 22, 2000 (File No. 333-37554)). |
| | | |
10.2*#10.2# | | Amendment to Greatbatch, Inc. 1998 Stock Option Plan (incorporated by reference to Exhibit 10.2 to our Annual Report on Form 10-K for the period ended January 3, 2014). |
| | | |
| 10.3# | | Non-Employee Director Stock Incentive Plan (incorporated by reference to Exhibit A to our Definitive Proxy Statement on Schedule 14-A filed on April 22, 2002). |
| | |
10.4# | | Greatbatch, Inc. Executive Short Term Incentive Compensation Plan (incorporated by reference to Exhibit A to our Definitive Proxy Statement on Schedule 14-A14A filed on April 20, 2012). |
| | | |
10.5 | | License Agreement dated August 8, 1996, between Greatbatch Ltd. and Evans Capacitor Company (incorporated by reference to Exhibit 10.23 to our Registration Statement on Form S-1 (File No. 333-37554)). |
| | |
10.6+ | | Amendment No. 2 dated December 6, 2002, between Greatbatch Technologies, Ltd. and Evans Capacitor Company (incorporated by reference to Exhibit 10.18 to our Annual Report on Form 10-K for the year ended January 3, 2003). |
| | |
10.7#10.4# | | Form of Change of Control Agreement between Greatbatch, Inc. and its executive officers (Thomas J. Hook, Mauricio Arellano, Michelle Graham and Timothy G. McEvoy)McEvoy (incorporated by reference to Exhibit 10.1 to our quarterly reportQuarterly Report on Form 10-Q for the period ended July 1, 2011)2011 (File No. 001-16137)). |
| | | |
10.8#10.5# | | Amended and Restated Change of Control Agreement, dated August 5, 2016, between Integer Holdings Corporation and Thomas J. Hook (incorporated by reference to Exhibit 10.3 to our Quarterly Report on Form 10-Q for the period ended July 1, 2016). |
| | |
| 10.6# | | Form of Change of Control Agreement between Greatbatch, Inc. and its executive officers (Michael Dinkins, Andrew P. Holman,Jennifer M. Bolt, Jeremy Friedman, Antonio Gonzalez, Declan Smyth, and George M. Cintra)Kristin Trecker) (incorporated by reference to Exhibit 10.8 to our Annual Report on Form 10-K for the year ended December 28, 2012). |
| | | |
10.910.7 | | Second Amended and Restated Credit Agreement, dated September 20, 2013as of October 27, 2015, by and among Greatbatch Ltd., as the lendersborrower, Greatbatch, Inc., as parent, the financial institutions party thereto and Manufacturers and Traders Trust Company, as administrative agent Bank of America, N.A., as syndication agent and RBS Citizens, N.A. and Wells Fargo Bank, National Association, as co-documentation agents (incorporated by reference to Exhibit 10.1 to our Current Report on Form 8-K filed on September 23, 2013)October 28, 2015). |
| | | |
10.10#10.8* | | EmploymentAmendment No. 1 to Credit Agreement, dated August 5, 2013as of November 29, 2016, between Greatbatch Inc.Ltd., as the borrower, and Thomas J. Hook (incorporated by reference to Exhibit 10.1 to our Current Report on Form 8-K filed on August 9, 2013).Manufacturers and Traders Trust Company, as administrative agent, and the Lenders party thereto. |
| | | |
10.11#10.9# | | Employment Agreement, dated August 5, 2016, between Integer Holdings Corporation and Thomas J. Hook (incorporated by reference to Exhibit 10.2 to our Quarterly Report on Form 10-Q for the period ended July 1, 2016). |
| | |
| 10.10# | | 2005 Stock Incentive Plan (incorporated by reference to Exhibit B to our Definitive Proxy Statement on Schedule 14-A14A filed on April 20, 2007)2007 (File No. 001-16137)). |
| | | |
10.12#10.11# | | 2009 Stock Incentive Plan (incorporated by reference to Exhibit A to our Definitive Proxy Statement on Schedule 14-A14A filed on April 13, 2009)2009 (File No. 001-16137)). |
| | |
| 10.12# | | 2011 Stock Incentive Plan (incorporated by reference to Exhibit A to our Definitive Proxy Statement on Schedule 14A filed on April 14, 2014). |
| | | |
| 10.13# | | 2011Greatbatch, Inc. 2016 Stock Incentive Plan (as amended December 7, 2011) (incorporated by reference to Exhibit 10.12A to our Annual ReportDefinitive Proxy Statement on Form 10-K for the year ended December 30, 2011)Schedule 14A filed on April 18, 2016). |
| | |
|
| | |
EXHIBIT NUMBER | | DESCRIPTION |
| | | |
10.14*#10.14# | | Amendment to Greatbatch, Inc. 2011 Stock Incentive Plan, Greatbatch, Inc. 2009 Stock Incentive Plan, Greatbatch, Inc. 2005 Stock Incentive Plan |
|
| | |
EXHIBIT
NUMBER
| | DESCRIPTION (incorporated by reference to Exhibit 10.14 to our Annual Report on Form 10-K for the year ended January 3, 2014). |
| | | |
10.15*#10.15#* | | Second Amendment to Greatbatch, Inc. 2011 Stock Incentive Plan and Greatbatch, Inc. 2009 Stock Incentive Plan. |
| | |
| 10.16#* | | Amendment to Greatbatch, Inc. 2016 Stock Incentive Plan. |
| | |
| 10.17# | | Form of Restricted Stock Award LetterAgreement (incorporated by reference to Exhibit 10.15 to our Annual Report on Form 10-K for the year ended January 3, 2014). |
| | | |
10.16*#10.18# | | Form of Performance-Based Restricted Stock Units Award LetterAgreement (incorporated by reference to Exhibit 10.16 to our Annual Report on Form 10-K for the year ended January 3, 2014). |
| | | |
10.17*#10.19# | | Form of Nonqualified Option Award Letter (incorporated by reference to Exhibit 10.17 to our Annual Report on Form 10-K for the year ended January 3, 2014). |
| | | |
10.18*#10.20# | | Form of Time-Based Restricted Stock Units Award Letter (incorporated by reference to Exhibit 10.18 to our Annual Report on Form 10-K for the year ended January 3, 2014). |
| | |
| 10.21 | | Transition Services Agreement, dated March 14, 2016, between Greatbatch, Inc. and QiG Group, LLC (incorporated by reference to Exhibit 10.1 to our Current Report on Form 8-K filed on March 18, 2016). |
| | |
| 10.22 | | Amendment No. 1 to the Transition Services Agreement between Greatbatch, Inc. and Nuvectra Corporation (incorporated by reference to Exhibit 10.1 to our Quarterly Report on Form 10-Q for the period ended July 1, 2016). |
| | |
| 10.23 | | Tax Matters Agreement, dated March 14, 2016, between Greatbatch, Inc. and QiG Group, LLC (incorporated by reference to Exhibit 10.2 to our Current Report on Form 8-K filed on March 18, 2016). |
| | |
| 10.24 | | Employee Matters Agreement, dated March 14, 2016, between Greatbatch, Inc. and QiG Group, LLC (incorporated by reference to Exhibit 10.3 to our Current Report on Form 8-K filed on March 18, 2016). |
| | |
| 10.25# | | Employment Offer Letter, dated October 7, 2016, between Integer Holdings Corporation and Jeremy Friedman (incorporated by reference to Exhibit 10.1 to our Quarterly Report on Form 10-Q for the period ended September 30, 2016). |
| | | |
| 12.1* | | Ratio of Earnings to Fixed Charges (Unaudited) |
| | | |
| 21.1* | | Subsidiaries of Greatbatch, Inc.Integer Holdings Corporation |
| | | |
| 23.1* | | Consent of Independent Registered Public Accounting Firm |
|
| | |
| 31.1* | | Certification of Chief Executive Officer pursuant to Rule 13a-14(a) of the Securities Exchange Act. |
| | | |
| 31.2* | | Certification of Chief Financial Officer pursuant to Rule 13a-14(a) of the Securities Exchange Act. |
| | | |
| 32.1** | | Certification of Chief Executive Officer and Chief Financial Officer pursuant to 18 U.S.C. Section 1350 as adopted pursuant to Section 906 of the Sarbanes-Oxley Act of 2002. |
| | | |
101.INS101.INS* | | XBRL Instance Document |
| | | |
101.SCH101.SCH* | | XRBL Taxonomy Extension Schema Document |
| | | |
101.CAL101.CAL* | | XBRL Taxonomy Extension Calculation Linkbase Document |
| | | |
101.LAB101.LAB* | | XBRL Taxonomy Extension Labels Linkbase Document |
| | | |
101.PRE101.PRE* | | XBRL Taxonomy Extension Presentation Linkbase Document |
| | | |
101.DEF101.DEF* | | XBRL Taxonomy Extension Definition Linkbase Document |
Portions of those exhibits marked “+” have been omitted and filed separately with the Securities and Exchange Commission pursuant to a request for confidential treatment.
|
| |
| # - | Indicates exhibits that are management contracts or compensation plans or arrangements required to be filed pursuant to Item 14(c)15(b) of Form 10-K. |