UNITED STATES
SECURITIES AND EXCHANGE COMMISSION
Washington, D.C. 20549
FORM 10-K10-K/A
(Amendment No. 1)
(Mark One)
☒ ANNUAL REPORT PURSUANT TO SECTION 13 OR 15(d) OF THE SECURITIES EXCHANGE ACT OF 1934
For the fiscal year ended December 31, 20202022
OR
☐ TRANSITION REPORT PURSUANT TO SECTION 13 OR 15(d) OF THE SECURITIES EXCHANGE ACT OF 1934
For the transition period from to
Commission File Number 001-36331
Quotient Technology Inc.
(Exact name of registrant as specified in its Charter)
| | | | | | | | |
| Delaware | | 77-0485123 |
(State or other jurisdiction of
incorporation or organization) | | (I.R.S. Employer
Identification No.) |
400 Logue Avenue
Mountain View, CA
| | (I.R.S. Employer Identification No.) |
1260 East Stringham Avenue, 6th Floor Salt Lake City, UT | 94043 | 84106 |
| (Address of principal executive offices) | | (Zip Code) |
Registrant’s telephone number, including area code: (650) 605-4600
(Former name, former address and former fiscal year, if changed since last report)
Securities Registered pursuant to Section 12(b) of the Act:
| | | | | | | | | | | | | | |
| Title of each class | | Trading Symbol | | Name of each exchange on which registered |
| Common Stock, $0.00001 par value per share | | QUOT | | New York Stock Exchange |
Indicate by check mark if the registrant is a well-known seasoned issuer, as defined in Rule 405 of the Securities Act. Yes ☐ No ☒
Indicate by check mark if the registrant is not required to file reports pursuant to Section 13 or 15(d) of the Act. Yes ☐ No ☒
Indicate by check mark whether the registrant: (1) has filed all reports required to be filed by Section 13 or 15(d) of the Securities Exchange Act of 1934 during the preceding 12 months (or for such shorter period that the registrant was required to file such reports), and (2) has been subject to such filing requirements for the past 90 days. Yes ☒ No ☐
Indicate by check mark whether the registrant has submitted electronically every Interactive Data File required to be submitted pursuant to Rule 405 of Regulation S-T (§232.405 of this chapter) during the preceding 12 months (or for such shorter period that the registrant was required to submit such files). Yes ☒ No ☐
Indicate by check mark whether the registrant is a large accelerated filer, an accelerated filer, a non-accelerated filer, a smaller reporting company, or an emerging growth company. See the definition of “large accelerated filer”, “accelerated filer”, “smaller reporting company”, and “emerging growth company” in Rule 12b-2 of the Exchange Act.:
| | | | | | | | | | | |
| Large accelerated filer | ☒☐ | Accelerated filer | ☐☒ |
| | | | |
| Non-accelerated filer | ☐
| Small reporting company | ☐ |
| | | | |
| Emerging growth company | ☐ | | |
If an emerging growth company, indicate by check mark if the registrant has elected not to use the extended transition period for complying with any new or revised financial accounting standards provided pursuant to Section 13(a) of the Exchange Act. ☐
Indicate by check mark whether the registrant has filed a report on and attestation to its management’s assessment of the effectiveness of its internal control over financial reporting under Section 404(b) of the Sarbanes-Oxley Act (15 U.S.C. 7262(b)) by the registered public accounting firm that prepared or issued its audit report. ☒
If securities are registered pursuant to Section 12(b) of the Act, indicate by check mark whether the financial statements
of the registrant included in the filing reflect the correction of an error to previously issued financial statements. ☐
Indicate by check mark whether any of those error corrections are restatements that required a recovery analysis of incentive-based compensation received by any of the registrant’s executive officers during the relevant recovery period pursuant to §240.10D-1(b). ☐
Indicate by check mark whether the registrant is a shell company (as defined in Rule 12b-2 of the Exchange Act). Yes ☐ No ☒
The aggregate market value of the voting and non-voting common equity held by non-affiliates of the registrant, as of June 30, 2020,2022, the last business day of the registrant’s most recently completed second fiscal quarter, based on the closing price of $7.32$2.97 per share of the
Registrant’s common stock as reported by the New York Stock Exchange on June 30, 2020,2022, was $625.1$272.3 million. The calculation of the aggregate market value of voting and non-voting common equity excludes 5.14.6 million shares of the registrant held by executive officers, directors and stockholders that the registrant concluded were affiliates of the registrant on that date. Exclusion of such shares should not be construed to indicate that any such person possesses the power, direct or indirect, to direct or cause the direction of the management or policies of the registrant or that such person is controlled by or under common control with the registrant.
The number of shares of registrant’s Common Stock outstanding as of February 17, 2021March 10, 2023 was 92,578,728.97,675,512.
DOCUMENTS INCORPORATED BY REFERENCE
Portions of the registrant’s Definitive Proxy Statement relating to the Annual Meeting of Stockholders are incorporated by reference into Part III of this Annual Report on Form 10-K where indicated. Such definitive Proxy Statement will be filed with the Securities and Exchange Commission within 120 days after the end of the registrant’s fiscal year ended December 31, 2020.None.
Auditor Firm PCAOB ID: 42 Auditor Name: Ernst & Young LLP Auditor Location: San Jose, California
EXPLANATORY NOTE
This Amendment No. 1 (this “Amendment”) on Form 10-K/A is filed with respect to Quotient Technology Inc.’s Annual Report on Form 10-K for the fiscal year ended December 31, 2022 (the “Form 10-K”), filed with the Securities and Exchange Commission (the “SEC”) on March 16, 2023. This Amendment updates the Form 10-K, which omitted Part III (Items 10, 11, 12, 13 and 14) in reliance on General Instruction G(3) to Form 10-K, which provides that such information may be either incorporated by reference from the registrant’s definitive proxy statement or included in an amendment to Form 10-K, in either case filed with the SEC not later than 120 days after the end of Contentsthe fiscal year.
Accordingly, this Amendment is being filed solely to (i) amend Part III (Items 10, 11, 12, 13 and 14) of the Form 10-K to include the information required by such Items, (ii) delete the reference on the cover of the Form 10-K to the incorporation by reference of portions of our proxy statement into Part III of the Form 10-K, and (iii) file new certifications of our principal executive officer and principal financial officer as exhibits to this Amendment under Item 15 of Part IV hereof, pursuant to Rule 12b-15 under the Securities Exchange Act of 1934, as amended (the “Exchange Act”). No financial statements are included in this Amendment and this Amendment does not contain or amend any disclosure with respect to Items 307 and 308 of Regulation S-K; accordingly, paragraphs 3, 4 and 5 of the certifications have been omitted.
As described in the Form 8-K filed on April 21, 2023, the Board of Directors of the Company (“Board”) irrevocably committed to (i) hold the Company’s 2023 annual meeting of stockholders (the “2023 Annual Meeting”) no earlier than July 31, 2023 and (ii) publicly announce the date of the 2023 Annual Meeting no earlier than May 2, 2023. At such time as we set a date for the 2023 Annual Meeting, we intend to issue a press release, with sufficient notice to stockholders, announcing: (i) the date, time and location of the planned 2023 Annual Meeting and (ii) the new deadline for receipt of stockholder proposals to be submitted pursuant to Rule 14a-8 under the Exchange Act, as well as the new deadline for receipt of stockholder nominations for director under Rule 14a-19 of the Exchange Act, for inclusion in our proxy materials for the planned 2023 Annual Meeting (the "2023 Proxy Statement").
This Amendment makes no changes to the Form 10-K except for those to Part III and the filing of related certifications. This Amendment does not amend, update, or change the financial statements or any other items or disclosures contained in the Form 10-K and does not otherwise reflect events occurring after the original date of the Form 10-K; accordingly, this Amendment should be read in conjunction with our filings with the SEC subsequent to the filing of the Form 10-K.
Unless indicated otherwise, throughout this Amendment, references to “we,” “us,” “our,” “the Company,” or “Quotient” mean Quotient Technology Inc. and its subsidiaries.
PART III
Item 10. Directors, Executive Officers, and Corporate Governance
Directors
Our Board consists of ten members and is currently divided into two classes of directors, Class I and Class II, with the directors in Class II having a term that expires at the 2023 Annual Meeting and the directors in Class I having a term that expires at the 2024 annual meeting of stockholders (the “2024 Annual Meeting”). On June 29, 2022, we amended our certificate of incorporation to phase out the classified board structure so that the Board will be fully declassified by the time of the 2024 Annual Meeting. Pursuant to the amendment, the directors standing for election at the 2023 Annual Meeting will be elected for a one-year term expiring at the 2024 Annual Meeting.
Set forth in the table below is information regarding our current directors. As a result of the amendment to our certificate of incorporation, seven (7) of our current directors--Andrew Gessow, Lorraine Hariton, Matthew Krepsik, Robert McDonald, David Oppenheimer, Joseph Reece, and Michael Wargotz—have terms expiring at the 2023 Annual Meeting. Three (3) of our current directors—Kimberly Anstett, Alison Hawkins and Eric Higgs—have terms expiring at our 2024 Annual Meeting. Messrs. Reece and Wargotz were nominated by Engaged Capital, LLC and certain of its affiliates (the “Engaged Group”), a major stockholder of the Company, and appointed to the Board pursuant to the Cooperation Agreement, dated May 16, 2022, with the Engaged Group (the “Cooperation Agreement”). The Cooperation Agreement expired by its terms on March 1, 2023.
At such time as we set a date for the 2023 Annual Meeting, we will issue a press release, with sufficient notice to stockholders, announcing, among other things, the new deadline for receipt of stockholder nominations for director under Rule 14a-19. If such candidate(s) are nominated by a stockholder or stockholders within such time period, the appropriate disclosures relating to any such nominee(s) will be made in our 2023 Proxy Statement.
Except as set forth above in the second paragraph of this section, there were and are no arrangements or understandings between a director and any other person pursuant to which such director was selected as a director. The current class of each director is set forth in the table below, with each such director serving until the expiration of his or her term and until their respective successors are duly elected and qualified.
| | | | | | | | | | | | | | | | | | | | |
| Independent? | Class | Age | Position | Director Since | Current
Term
Expires |
| Directors | | | | | | |
| Andrew Gessow | √ | II | 65 | Director | 2013 | 2023 |
| Lorraine Hariton | √ | II | 68 | Director | 2021 | 2023 |
| Matthew Krepsik | | II | 41 | Director and CEO | 2022 | 2023 |
| Robert McDonald | √ | II | 69 | Director - Chair | 2018 | 2023 |
| David Oppenheimer | √ | II | 66 | Director | 2017 | 2023 |
| Joseph Reece | √ | II | 61 | Director | 2022 | 2023 |
| Michael Wargotz | √ | II | 64 | Director | 2023 | 2023 |
| Kimberly Anstett | √ | I | 50 | Director | 2022 | 2024 |
| Alison Hawkins | √ | I | 57 | Director | 2021 | 2024 |
| Eric D. Higgs | √ | I | 52 | Director | 2022 | 2024 |
Until the election of directors at the 2023 Annual Meeting, the Board is divided into two classes of directors, Class I and Class II, with the directors in Class II having a term that expires at the 2023 Annual Meeting and the directors in Class I having a term expiring at the 2024 Annual Meeting. As of the election of directors at the 2023 Annual Meeting, the directors so elected will join those directors already serving in Class I as of the 2023 Annual Meeting to create single class of directors, denominated as Class I, having a term that expires at the 2024 Annual Meeting.
Class II Directors (Term Expiring as of the 2023)
Andrew "Jody" Gessow has served on our Board since May 2013. Mr. Gessow currently serves as a managing partner at DivCore Equity Partners, a real estate investment firm, and as senior advisor atDivco West Real Estate Services (“Divco”). From May 2007 through December 2011, Mr. Gessow was the West Coast Partner and Managing Director of One Equity Partners LLC, the private equity platform of J.P. Morgan Chase & Co. Since January 2020, Mr. Gessow has served on the board of directors of Waterfall Security Solutions, an Israeli private industrial cybersecurity company. Previously, Mr. Gessow served as a member of the board of directors of Mandiant Corporation and the TV Guide Network. Mr. Gessow holds a B.B.A. in Business Administration from Emory University and an M.B.A. from Harvard University. We have determined that Mr. Gessow is qualified to serve as a member of our Board because of his experience in both managing and evaluating companies as an executive officer, board member and investor.
Lorraine Hariton has served on our Board since January 2021. Ms. Hariton currently serves as the President and Chief Executive Officer of Catalyst, a global nonprofit supported by many of the world’s most powerful CEOs and leading companies to help build workplaces that work for women. Prior to joining Catalyst, Ms. Hariton worked independently as a consultant from 2014 until August 2018. Previously, Ms. Hariton spent 25 years in various senior-level positions in Silicon Valley, including CEO of two venture-backed start-ups, before being appointed by President Obama in 2009 as Special Representative for Commercial and Business Affairs at the U.S. Department of State. More recently, she served as SVP for Global Partnerships for the New York Academy of Sciences where she was instrumental in establishing the Global STEM Alliance. From March 2014 to February 2016, Ms. Hariton served on the board of directors of Wave Systems Corporation, a publicly traded data security company, where she was chair of the nominating and governance committee. She also served on the California Board of Accountancy; the Entrepreneurs Foundation, and the Stanford Clayman Institute for Gender Research, amongst others. Ms. Hariton earned a M.B.A. from Harvard University, and a B.S. from Stanford University. We have determined that Ms. Hariton is qualified to serve as a member of our Board because of her experience in the technology industry, her executive management experience, her public company experience, and her diversity, equity and inclusion ("DEI") expertise.
Matthew Krepsik has served as CEO of the Company since May 2022 and as a member of our Board since June 2022. Mr. Krepsikpreviously served as our Chief Technology Officer from June 2021 through May 2022, leading the Company’s strategy and insights team as well as its engineering, product management, business development and media strategy functions. Mr. Krepsik was also responsible for the information technology ("IT") function for the Company. Prior to his promotion to Chief Technology Officer, Mr. Krepsik served as our Chief Analytics Officer from April 2021 through June 2021, having joined the Company in April 2021. Prior to joining Quotient, Mr. Krepsik served for 15 years in various managerial roles at Nielsen, a publicly traded company, most recently as Senior Vice President and General Manager of Outcomes Products (2019-2021), in which he led Nielsen's development and deployment of attribution, media planning and activation products. Mr. Krepsik's other positions at Nielsen included Global Head of Analytics Products (2016-2019), Executive Director of Analytics Asia-Pacific, Middle East and Africa (2012-2016), and Vice President, Analytics North America (2006-2012). He also had an integral role in Nielsen’s strategic review process, which culminated in the sale of its NielsenIQ business to Advent International for $2.7 billion. Mr. Krepsik’s academic career includes coursework at the London School of Economics as well as Bachelors and Master’s degrees in Economics from Marshall University and Miami University, respectively. We have determined that Mr. Krepsik is qualified to serve as a member of our Board due not only to his status as CEO but also his deep digital industry experience as well as his institutional knowledge and operational experience acquired from leading the Company’s strategy and insights team as well as its engineering, product management, business development and media strategy functions.
Robert McDonald has served on our Board since November 2018 and as Chairman of our Board since March 2022. Mr. McDonald has served through his career on boards of various companies and organizations, private and public, non-profit and for-profit. Mr. McDonald served as the U.S. Secretary of Veterans Affairs from July 2014 until January 2017. Mr. McDonald was Chairman and Chief Executive Officer of Procter & Gamble Company, a publicly traded company, from January 2010 until June 2013. Mr. McDonald joined Procter & Gamble in 1980 and served in various positions for that company. He was named Procter & Gamble’s Vice Chairman, Global Operations in 2004; Chief Operating Officer in 2007; President and Chief Executive Officer in 2009; and Chairman of the Board in 2010. Mr. McDonald has served on the board of directors of Audia Group since 2017, a private international plastics producer company, and has served as chairman of the West Point Association of Graduates, a private non-
profit organization, since January 2022. From 2005 to July 2014, Mr. McDonald served on the board of directors of Xerox Corporation, a provider of document management solutions, and from January 2014 to July 2014 Mr. McDonald served on the board of directors of United States Steel Corporation, an integrated steel producer, both of which are public companies. Mr. McDonald served on the board of directors of Partnership for Public Service from 2017 to 2021, served on the board of directors of Institute for Veterans and Military Families from 2018 to 2021, and served on the board of directors as Chairman of RallyPoint Networks from 2017 to 2022. Mr. McDonald graduated from the United States Military Academy at West Point in 1975. He earned his M.B.A. from the University of Utah in 1978. We have determined that Mr. McDonald is qualified to serve as a member of our Board because of his deep industry experience and knowledge of operational matters. Additionally, his extensive experience as a public company executive and director allows him to provide valuable knowledge and guidance to the Board and to enable him to lead effectively in his capacity as Chairman of the Board.
David Oppenheimer has served on our Board since July 2017. Mr. Oppenheimer is currently a President of Oppenheimer Advisors and General Partner of Verissimo Ventures. Mr. Oppenheimer served as the Chief Financial Officer at Udemy, Inc., a public company that is a global marketplace for learning and teaching online, from July 2018 through February 2019. Previously Mr. Oppenheimer was Chief Financial Officer at Planet Labs Inc., a public space and analytics company, having served in that role from October 2015 through August 2018. From April 2013 through February 2015, Mr. Oppenheimer served as Chief Financial Officer at Ebates Inc. (acquired by Rakuten, Inc.), an e-commerce company. Since April 2020, Mr. Oppenheimer has served on the board of directors of Lumus Ltd, an Israeli private augmented reality technology company. Additionally, Mr. Oppenheimer served on the board of directors and audit committee of HotChalk, Inc., a Delaware private education software company, from May 2015 until December 2020, and The Olympic Club, a private company, from January 2018 until December 2020. Mr. Oppenheimer holds a B.S. in Mechanical Engineering from the State University of New York at Buffalo and an M.B.A. from the University of California, Berkeley. We have determined that Mr. Oppenheimer is qualified to serve as a member of our Board because of his experience serving on audit committees and expertise in financial accounting at technology companies.
Joseph ("Joe") Reece has served on our Board since May 2022. Mr. Reece has been the co-managing partner of SilverBox Capital, LLC, and its predecessors since 2015. He previously served as the executive vice chair of UBS Group and head of UBS Securities LLC’s Investment Bank for the Americas from 2017 to 2018. Prior to these roles, he was at Credit Suisse from 1997 to 2015, in roles of increasing responsibility, including serving as global head of Equity Capital Markets and co-head of Credit Risk. His prior experience includes serving as an attorney for 10 years, including at the law firm Skadden, Arps, Slate, Meagher & Flom, LLP and at the Securities and Exchange Commission where he ultimately served as Special Counsel to the Division of Corporation Finance. He is currently a member of the board of directors of NCR Corporation where he serves as Lead Independent Director and Compass Minerals where he serves as Chairman of the Board, both of which are public companies. Joe has previously served as a member of the board of directors of SilverBox Engaged Merger Corp. I, including as the executive chair, Atlas Technical Consultants, Inc. and its predecessor company, Boxwood Merger Corp., where he served as lead independent director, Del Frisco's Restaurant Group, Inc., RumbleOn, Inc., CST Brands, Inc., LSB Industries, Inc., and UBS Securities LLC. Mr. Reece earned his B.S., M.B.A. and J.D. from the University of Akron and his LL.M from the Georgetown University Law Center. We have determined that Mr. Reece is qualified to serve as a member of our Board because of his expertise in finance and investment and his extensive experience as a public company director.
Michael Wargotz has served on our Board since February 2023. Mr. Wargotz currently serves as a member of the board of directors of Travel + Leisure Co., a publicly traded membership and leisure travel company. From 2011 to 2017, Mr. Wargotz served as Chairman of Axcess Ventures, an affiliate of Axcess Worldwide, a brand experience marketing development agency. From 2010 to 2011, he co-founded and served as Chief Financial Officer of The Milestone Aviation Group, a global aviation leasing company, from 2010 to 2011. Mr. Wargotz served as the Co-Chairman of Axcess Luxury and Lifestyle from August 2009 to July 2010. From 2006 to 2009, he served as the Chief Financial Advisor of NetJets, Inc., a leading provider of private aviation services from 2006 to 2009 and Vice President of NetJets from 2004 to 2006. Mr. Wargotz co-founded and was a partner in Axcess Worldwide from 2001 to 2004. From January 1998 to December 1999, Mr. Wargotz served in various leadership positions at Cendant Corporation, including President and Chief Executive Officer of its Lifestyle Division, Executive Vice President and Chief Financial Officer of its Alliance Marketing Segment, and Senior Vice President, Business Development. Prior to 1998, Mr. Wargotz served in various finance and accounting positions at HFS Incorporated,
PaineWebber & Co, America Express and Price Waterhouse. Mr. Wargotz received a B.A. in Accounting from Rutgers University and an M.B.A. from New York University. We have determined that Mr. Wargotz is qualified to serve as a member of our Board because of his substantial leadership, business development, branding and governance experience, as well as significant finance-related skills and expertise including audit oversight, financial reporting and compliance gained from over 30 years of relevant experience.
Class I Directors (Term Expiring as of the 2024 Annual Meeting)
Kimberly Anstett has served on our Board since June 2022. Ms. Anstett is an accomplished technology executive with more than 25 years of experience scaling businesses through strategy execution and transformation. Since September 2022, Ms. Anstett has served as Chief Information Officer of Trellix, a global cybersecurity company. Prior to joining Trellix, Ms. Anstett served as the Executive Vice President and Chief Technology Officer of Iron Mountain Inc., a publicly traded company that is an enterprise information management services company, from May 2019 to August 2022, where she led its product engineering and enterprise technology digital transformation. Prior to joining Iron Mountain, from May 2014 to April 2019, Ms. Anstett served as the Chief Information Officer for Nielsen, a publicly traded company that is a world renowned marketing and consumer intelligence enterprise that provides critical research, data and strategic insights about consumer behavior. At Nielsen, she led cyber security programs focused on securing end-to-end business operations and protecting enterprise and customer data. She also designed and led strategic partnership programs with many of the largest global partners at Nielsen. Ms. Anstett received a B.S. in Science, Electrical Engineering from Tufts University. We have determined that Ms. Anstett is qualified to serve as a member of our Board because of her leadership in the technology sector, experience leading cyber security programs and extensive experience with M&A transactions and post-acquisition integrations.
Alison Hawkins has served on our Board since July 2021. Ms. Hawkins currently serves as a Senior Advisor at Artemis Real Estate Partners ("Artemis"), a women-owned real estate private equity firm where she served as Managing Principal from 2015 to 2021. Ms. Hawkins was initially hired to lead the firm's capital raise strategy shortly after Artemis' founding in 2009 and remained in that role until 2013. From 2013 to 2015, Ms. Hawkins was employed by CBRE Global Investors, where as a managing director she held a senior capital-raising and strategic product development role for one of the largest global real estate firms. From 2004 to 2010, Ms. Hawkins served initially as an associate and later as director at Eastdil Secured, a national real estate investment bank, where she advised clients on investment sales and capital markets strategies. From 1999-2000, Ms. Hawkins was general counsel of Kibu, Inc., a venture-backed internet marketing company, and from 1990-1999 Ms. Hawkins served initially as an associate attorney and later as a partner with Milberg Weiss Bershad Hynes & Lerach LLP, a class action litigation firm. A graduate of Occidental College (A.B.), American University (J.D.), and the Wharton School (M.B.A.). Ms. Hawkins holds the Chartered Alternative Investments Analyst designation and is a member of the State Bar of California. She is a member of the Occidental College Board of Trustees, where she serves on the board’s audit and investment committees, and has served as Treasurer of Inspired Educ8ion, since June 2022. We have determined that Ms. Hawkins is qualified to serve on the Board because of her executive experience, her financial skills relating to company operations, investment evaluation and capital raising, her legal practice and risk management experience, and her DEI oversight experience.
Eric D. Higgs has served on our Board since March 2022. Mr. Higgs has more than two decades of leadership experience overseeing marketing strategy development and product execution in the consumer goods and retail industry. Since June 2020, Mr. Higgs has served as the Chief Executive Officer of the Boys & Girls Clubs of Middle Tennessee, where he leads the organization’s strategic direction, oversight of organizational operations, financials, programming, brand reputation and talent recruitment. Prior to his role at the Boys & Girls Clubs of Middle Tennessee, Mr. Higgs served in a number of roles with increasing responsibility at Bridgestone Americas from May 2016 to March 2020. He served as Senior Vice President, Marketing Operations (April 2020 to May 2020), where he was responsible for helping shape the future of Bridgestone Americas’ tire and solutions business and creating synergies between the marketing and sales organizations. Prior to this, he served as President of Bridgestone Americas’ Commercial Truck and Retread business (September 2018 to March 2020). Prior to joining Bridgestone, he spent approximately four years at Kimberly Clark from 2012 to 2016, during which he drove sales growth in two of its key businesses. Mr. Higgs also spent over 18 years at Procter & Gamble, a public company, from 1994 to 2012 leading marketing efforts and product launches for a number of business lines. Mr. Higgs holds a B.S. in Chemical Engineering from the University of Illinois and an M.B.A. from the Fuqua School of Business at
Duke University. We have determined that Mr. Higgs is qualified to serve as a member of our Board because he brings decades of leadership experience in the consumer goods and retail industry, his successful track record of building and growing brands through traditional and digital outlets and in driving improved sales and profitability, and his extensive sales and marketing knowledge as bringing value to the Company’s efforts to enhance its product portfolio and business operation.
Executive Officers
The following table identifies certain information, as of April 28, 2023, about our executive officers. Officers are appointed or elected by the Board to hold office until their successors are elected and qualified. There are no family relationships among any of our directors or executive officers. There are no arrangements or understandings between an executive officer and any other person pursuant to which such executive officer was or is to be selected as an officer.
| | | | | | | | |
| Name | Age | PagePosition(s) with Quotient |
| Matthew Krepsik | 41 | Chief Executive Officer and Board Member |
| | |
Item 1.
Yuneeb Khan | | 6Chief Financial Officer, Principal Accounting Officer and Treasurer, and Chief Operating Officer |
Item 1A.
| | |
Item 1B.
| | |
Item 2.
| | |
Item 3.
| | |
Item 4.
| | |
| | |
Item 5.
| | |
Item 6.
| | |
Item 7.
| | |
Item 7A.
| | |
Item 8.
| | |
Item 9.
| | |
Item 9A.
| | |
Item 9B.
| | |
| Connie Chen | | |
Item 10.
| | |
Item 11.
| | |
Item 12.
| | |
Item 13.
| | |
Item 14.
| | |
| 56 | PART IVGeneral Counsel, Compliance Officer and Secretary | |
Item 15.
| | |
Item 16.
| | |
Unless the context otherwise requires, the terms “Quotient,” “Coupons,” the “Company,” “we,” “us” and “our” in this Annual Report on Form 10-K refer to Quotient Technology Inc. and its consolidated subsidiaries.
Quotient, Ubimo, Ahalogy, Elevaate, SavingStar, Shopmium and our other registered or common law trademarks, service marks or trade names appearing in this Annual Report on Form 10-K are the property of Quotient and its subsidiaries. Other trademarks and trade names referred to in this Annual Report on Form 10-K are the property of their respective owners.
SPECIAL NOTE REGARDING FORWARD-LOOKING STATEMENTS
This Annual Report on Form 10-K contains forward-looking statements within the meaning of Section 27A has served as CEO of the Securities ActCompany since May 2022, and has served as a member of 1933,our Board since June 2022. For information on the business background of Mr. Krepsik, see "Class II Directors (Term Expiring at the 2023 Annual Meeting”) above.
Yuneeb Khan has served as amendedour Chief Financial Officer, Principal Accounting Officer and Treasurer since July 2022, and has simultaneously served as our Chief Operating Officer since February 2023. Prior to joining Quotient, Mr. Khan served from 2020 to 2021 as the Global President of NielsenIQ's Consumer Insights business, a leading marketing and consumer research enterprise operating in more than 80 countries. Mr. Khan is a seasoned executive with over 25 years of global finance and business leadership experience with world-renowned companies operating in a diversified set of industries. This includes 12 years (2010-2022) with the Nielsen Holdings plc ("Nielsen") organization, a global leader in audience measurement, data and analytics, during which Mr. Khan served in several high impact roles including Chief Financial Officer of Nielsen Global Connect (the “Securities Act”)predecessor of NielsenIQ) from 2019 to 2020 and Section 21EChief Financial Officer of Nielsen Global Operations and Technology from 2014 to 2019. Prior to joining Nielsen, Mr. Khan worked in several finance and operational positions with General Electric Company ("GE"), Saudi Basic Industries Corporation ("SABIC"), United Technologies Corporation, Kinnevik AB, Bristol Meyers Squib Company and PricewaterhouseCoopers. Throughout his career, Mr. Khan has built and led global teams, driven global transformation, and played a pivotal role in several large M&A transactions including the $11.6 billion sale of GE's Plastics division to SABIC in 2007 and the $2.7 billion sale of Nielsen Global Connect to the private equity firm Advent International in 2021. Mr. Khan is a Chartered Accountant with the Institute of Chartered Accountants of Pakistan (1999), and is a graduate of the Securities Exchange ActAdvanced Management Program (2021) of 1934, as amended (the “Exchange Act”). The words “anticipate,” “believe,” “continue,” “could,” “seek,” “might,” “estimate,” “expect,” “intend,” “may,” “plan,” “potential,” “predict,” “approximately,” “project,” “should,” “will,” “would” or the negative or plural of these words or similar expressions, as they relate to our company, business and management, are intended to identify forward-looking statements. Forward-looking statements contained in this Annual Report on Form 10-K include, but are not limited to, statements about:
•our financial performance, including our revenues, margins, costs, expenditures, growth rates and operating expenses, and our ability to generate positive cash flow and become profitable;Harvard Business School.
•Connie Chen has served as our expectations regarding Quotient Media Platform, Quotient Retailer Performance Media Platform, Quotient Promotions Platform, Quotient Retailer Promotions Platform, Quotient Consumer Properties, Quotient Retailer Media ServicesGeneral Counsel, Compliance Officer and Quotient Data & Analytics Platform;
•Secretary since January 2016 and served as our expectations regarding the shiftSenior Director of Legal Affairs from October 2014 to digital promotionsDecember 2015, and advertisingDirector of Legal Affairs from off-line channels; our abilitySeptember 2013 to adaptOctober 2014. From 2005 to CPG'sAugust 2013, she served as vice president, litigation and retailer's changes in marketing goals, strategiesdeputy general counsel at Rambus Inc., a semiconductor and budgets and the timing of their marketing spend;
•our abilityIP product company. Prior to maintain and grow our retailer network and expand into new verticals;
•our ability to capitalize on the shift from offline to digital marketing and growth in e-commerce;
•our ability to maintain and expand our data rights with our retailer network;
•our ability to successfully execute and expand our digital media solutions into areas such as retail performance media, social influencer marketing, sponsored product search, DOOH, and programmatic media;
•our ability to successfully execute and expand our promotions solutions into areas such as in-lane, targeted promotions, national rebates, and loyalty rewards programs;
•our strategies relating to the growth of our platforms and our business, including pricing strategies;our ability to demonstrate the value of our platforms through trusted measurement metrics;
•our ability to maintain and grow the size of our targetable audience;
•our ability to respond to changes in the legislative or regulatory environment, including with respect to privacy and data protection, or enforcement by government regulators, including fines, orders, or consent decrees;
•our ability to deploy, execute, and continue to develop our measurement and analytics capabilities;
•our ability to expand the use of our media and promotions offerings by consumers;
•our ability to innovate our consumer solutions and experiences to retain and grow our consumer base;
•our ability to expand the number, variety, quality, and relevance of promotions available on our platforms and through our network;
•our ability to hire, integrate, train and retain talented personnel;
•our ability to successfully integrate our newly acquired companies into our business;
•our ability to effectively manage scaling and international expansion of our operations;
•our ability to successfully compete with existing and new competitors; and
•our ability to maintain, protect and enhance our brand and intellectual property.
We caution you that the foregoing list may not contain all of the forward-looking statements made in this Annual Report on Form 10-K.
We have based these forward-looking statements on our current expectations and projections about future events and financial trends affecting our business. Forward-looking statements should not be read as guarantees of future performance or results, and will not necessarily be accurate indications of the times at, or by, which such performance or results will be achieved. Forward-looking statements are based on information available to our managementRambus, Ms. Chen held positions at the datelaw firm of this Annual Report on Form 10-KMorrison & Foerster LLP and our management’s good faith belief as of such date with respect to future events, and are subject to risks and uncertainties that could cause actual performance or results to differ materially from those expressed in or suggested by the forward-looking statements. Forward-looking statements involve known and unknown risks, uncertainties and other factors that may cause our actual results, performance or achievements to be materially different from any future results, performance or achievements expressed or implied by the forward-looking statements. We discuss these risks in greater detail in “Item 1A: Risk Factors” and elsewhere in this Annual Report on Form 10-K. Forward-looking statements speak only as of the date of this Annual Report on Form 10-K. We caution you that the foregoing list of important factors may not contain all of the material factors that are important to you. Except as required by law, we assume no obligation to publicly update or revise any forward-looking statement to reflect actual results, changes in assumptions based on new information, future events or otherwise. If we update one or more forward-looking statements, no inference should be drawn that we will make additional updates with respect to those or other forward-looking statements. Given these risks and uncertainties, you are cautioned not to place undue reliance on such forward-looking statements.
Summary of Risk Factors
Our business is subject to a number of risks, including risks that may prevent us from achieving our business objectives or may adversely affect our business, financial condition, results of operations, cash flows, and prospects. These risks are discussed more fully under "Item 1A. Risk Factors" below and include, but are not limited to, risks related to:
Risks Related to Our Business
•We have incurred net losses since inception and we may not be able to generate sufficient revenues or revenue growth to achieve or subsequently maintain profitability.
•Our revenue and business will be negatively affected if we fail to retain and expand our relationships with retailers and obtain retailer commitment and support for our platforms.
•The loss or decrease in spending of any significant customer could materially and adversely affect our results of operations and financial condition.
•If the distribution, revenue sharing or other fees that we pay increase or we are unable to meet contractual minimums under guaranteed distribution fee arrangements, our gross profit and business will be negatively affected.
•Our gross margins are dependent on many factors, some of which are not directly controlled by us.
•We expect a number of factors to cause our operating results to fluctuate on a quarterly and annual basis, which may make it difficult to predict our future performance.
•If we are unable to successfully respond to changes in the digital promotions market, our business could be negatively affected.
•If we fail to maintain and expand the use by consumers of digital promotions on our platform, our revenues and business will be negatively affected.
•Competition presentsWebMD, an ongoing threat to the success of our business.
•We depend in part on advertising agencies as intermediaries, and if we fail to develop and maintain these relationships, our business may be negatively affected.
•Our failure to attract, integrate and retain other highly qualified personnel in the future, could harm our business.
•The effects of health epidemics, including the COVID-19 pandemic, have had, and may continue to have, an adverse impact on our business, operations and the markets and communities in which we and our partners operate. The loss or decrease in spending of any significant customer could materially and adversely affect our results of operations and financial condition.
•Acquisitions, joint ventures and strategic investments could result in operating difficulties, dilution and other harmful consequences.
•If we fail to effectively manage our growth, our business and financial performance may suffer.
•If our websites or those of our publishers fail to rank prominently in unpaid search results from search engines, traffic to our websites could decline and our business would be adversely affected.
•Indemnity provisions in various agreements potentially expose us to substantial liability for intellectual property infringement and other losses including unauthorized use or disclosure of consumer data.
•Our business depends on strong brands, and if we are not able to maintain and enhance our brands, or if we receive unfavorable media coverage, our ability to retain and expand our number of CPGs, retailers and consumers will be impaired and our business and operating results will be negatively affected.
Risks Related to Government Regulation, Tax Law or Accounting Standards
•Our business is subject to complex and evolving laws, regulations and industry standards, and unfavorable interpretations of, or changes in, or our actual and perceived failure to comply with these laws, regulations and industry standards could substantially harm our business and results of operations.
•If our estimates or judgements relating to our critical accounting policies prove to be incorrect, our results of operations could be adversely affected.
Risks Related to Our Platforms, Technology and Intellectual Property
•If our security measures or information we collect and maintain are compromised or publicly exposed, CPGs, retailers and consumers may curtail or stop using our platforms and we could be subject to claims, penalties and fines.
•Our ability to generate revenue depends on the collection, reliability, and use of significant amounts of data from various sources, which may be restricted by consumer choice, restrictions imposed by retailers, publishers and browsers or other software developers, changes in technology, and new developments in laws, regulations and industry requirements or standards.
•Our business relies in part on electronic messaging, including emails and SMS text messages, and any technical, legal or other restrictions on the sending of electronic messages or an inability to timely deliver such communications could harm our business.
•Our business depends on our ability to maintain and scale the network infrastructure necessary to operate our platforms, including our websites and mobile applications, and any significant disruption in service could result in a loss of CPGs, retailers and consumers.
•We may not be able to adequately protect our intellectual property rights.
•We may be accused of infringing intellectual property rights of third parties.
•Some of our solutions contain open source software, which may pose particular risks to our proprietary software and solutions.
Risks Related to Ownership of our Common Stock
•The market price of our common stock has been, and is likely to continue to be, subject to wide fluctuations and could subject us to litigation.
Risks Related to Our Convertible Senior Notes
•We are leveraged financially, which could adversely affect our ability to adjust our business to respond to competitive pressures and to obtain sufficient funds to satisfy our future growth, business needs and development plans.
General Risks
•Our business is subject to interruptions, delays or failures resulting from earthquakes, other natural catastrophic events or terrorism.
•Our ability to raise capital in the future may be limited, and our failure to raise capital when needed could prevent us from growing.
•Global economic conditions could materially adversely affect our revenue and results of operations.
PART I
Item 1. Business.
Overview
Quotient Technology Inc. is an industry leading digital media and promotionsinternet healthcare technology company, that creates cohesive omnichannel brand-building and sales-driving marketing campaigns for consumer-packaged goods (“CPGs") companies and retailers throughout the path to purchase. These programs are delivered through our platforms across our broad network of digital properties to drive measurable sales and customer loyalty. Our network includes the digital properties of our retail partners and CPG customers, social media platforms, third-party properties, our flagship consumer brand Coupons.com properties and digital out-of-home ("DOOH") properties. This network provides Quotient with proprietary and licensed data, including retailers’ in-store point-of-sale (“POS”) shopper data, purchase intent and online behavior, location intelligence, to deliver more valuable outcomes for CPGs, retailers, and consumers. Customers and partners use Quotient to leverage consumer data, and insights, consumers via digital channels, and integrate marketing and merchandising programs, and to drive measurable sales results.
For our retail partners, we provide Quotient Retailer Promotions Platform, formerly knownwhere she served as Quotient Retailer iQ, and Quotient Retailer Performance Media Platform, to directly engage with shoppers across their websites, mobile, eCommerce, and social channels. These platforms are generally co-branded or white-labeled through retailers’ savings or loyalty programs and use shopper data to deliver relevant digital media and promotions solutionsassistant general counsel. Ms. Chen holds an A.B. from brand marketers and retailers to consumers. By partnering with Quotient, retailers can leverage their proprietary sales data and digital properties to build new alternative revenue streams and offer effective marketing opportunities for their brand partners to engage consumers, all while measuring the impact of every partnership.
Our network is made up of three constituencies:
•Our customers consist of approximately 800 CPGs, representing over 2,000 brands, including many of the leading food, beverage, personal care and household product manufacturers;
•Our retail partners, represent multiple classes of trade such as leading grocery retailers, drug, mass merchant, dollar, club, and convenience merchandise channels, where most CPGs' products are sold; and
•Millions of consumers who visit our websites, mobile properties, and social channels, as well as those of our CPGs and retailer partners.
Through these three groups, we have created a network effect, which we believe gives us a competitive advantage over both offline and online competitors. As our consumer audience increases, our platforms become more valuable to CPGs and their brands and retailers, which, in turn, rely more heavily on our platforms for their digital media and promotions. In addition, the breadth of media and promotion content offered from leading brands enables us to attract and retain more retailers and shoppers. As our network expands, we generate more consumer data and insights, which improves our ability to deliver more relevant, targeted and personalized media and promotions, and strengthens our measurement and data insights solutions.
We primarily generate revenue by using our technology platforms to create, target, deliver, analyze and measure digital media and/or promotional programs for our CPG customers, retail partners and advertising agencies. Using shopper data from our retail partners and our proprietary data and audience segments, we deliver targeted and/or personalized digital media and promotions to shoppers through our network, including our websites and mobile applications, as well as those of our publishers, retail partners and other third-party properties. As our customers and partners shift more of their marketing spend to digital channels, our solutions help them optimize the performance of such digital channels. Our solutions' performance is measured by attribution of digital campaigns to retail purchases in near real time, demonstrating return on spend for our customers and partners.
Our promotional products include digital paperless coupons, digital print coupons, in-lane on receipt promotions, digital rebates and loyalty offers. Our media solutions include display, social, DOOH, Retailer.com display and sponsored search, shoppable brand pages, and audiences. A growing number of campaigns our customers purchase are purchased as an integrated campaign which combines a mix of digital media and/or promotions solutions in a single campaign. The revenue we earn from these programs is generally based on cost-per-click, cost-per-impression, or cost-per-acquisition.
We also generate revenues from our Specialty Retail business, in which specialty stores including clothing, electronics, home improvement and many others offer coupon codes that we distribute digitally.
We generally pay a distribution fee or revenue share to retailers and publishers for activation or redemption of a digital promotion, for media campaigns, and for use of data for targeting or measurement. We also pay a fee to third-party publishers for traffic acquisition, which consists of delivering campaigns on certain networks or properties. These distribution, revenue share and third-party service fees are included in our cost of revenues.
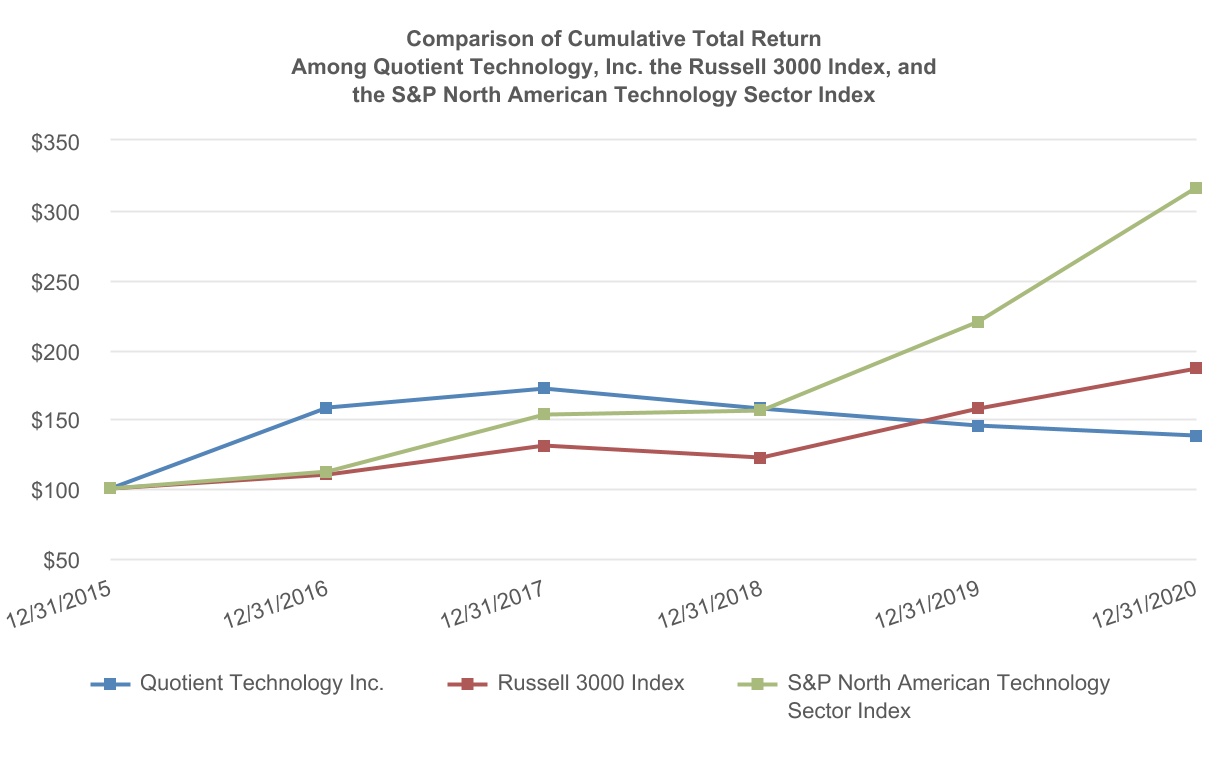
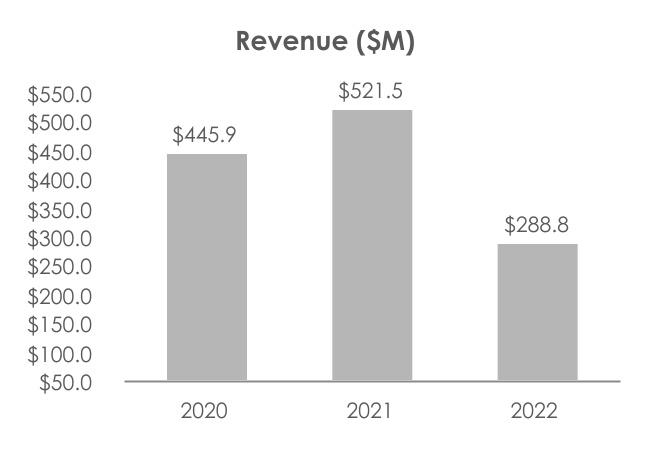
During 2020, we generated revenues of $445.9 million, representing 2% growth over 2019,Stanford University and a net loss of $65.4 million in 2020 as compared to $37.1 million in 2019. See our Consolidated Financial Statements and accompanying notes for more information. For the year ended December 31, 2020, there was no customer that accounted for greater than 10% of our total revenues. For the year ended December 31, 2019, there was one customer that accounted for greater than 10% of our total revenues. For the year ended December 31, 2018, there was no customer that accounted for greater than 10% of our total revenues.
Our Industry
CPGs and retailers continue to turn to data-driven digital marketing strategies to engage and influence shoppers to compete more effectively in today’s retail environment and drive sales. By shifting dollarsJ.D. from traditional offline channels to digital, CPGs and retailers can use consumer data and behaviors to target and deliver digital media and promotions with greater efficiency and return on investment.
For decades, brands and retailers have been focused on driving sales. However, only recently have they started to work more collaboratively to increase sales and revenue, which in turn benefits both parties. CPGs sell their products to retailers, and retailers are responsible for selling those products directly to consumers. To help retailers attract consumers and ensure sales, CPGs spend over $225 billion annually in promotions, media, shopper marketing, trade and other in-store advertising. Excluding trade and certain other budgets from the $225 billion results in approximately $117 billion which we believe is addressable on Quotient's network through our comprehensive solutions. Additionally, we continue to see a shift from offline to digital which continues to be a tailwind for our business. Historically, the vast majority of CPGs budgets have been spent in offline channels such as free-standing inserts found in newspapers, direct mail, printed circulars, in-store aisle tags, end caps and television. These traditional offline channels continue to become less effective as consumers spend more time online, particularly on mobile devices, giving way to the rising importance of using data to drive personalized and targeted, content to consumers. To reach consumers at the right time and place, more now than ever, CPGs are shifting dollars historically spent in offline channels to digital channels for both promotions and media.
At the same time, traditional retailers are paving the path for this digital shift by utilizing technology and creating digital strategies to better compete and drive sales. This includes focusing on retail performance media, loyalty strategies, eCommerce experiences, and data-driven media platforms, many of which Quotient powers for its retailers and partners. As retailers expand their digital capabilities, and shoppers increase their digital engagement through more eCommerce purchases or a mixed mode of on-line and in-store purchases, it creates greater opportunities for CPGs to shift marketing dollars from offline to digital as well as greater collaboration between the two parties.
Digital promotions, primarily funded by CPGs, have been found to be more effective and are redeemed at higher rates compared to traditional offline promotions. We believe that the ease of digital promotions, coupled with greater awareness of digital savings programs and increased demand for digital promotions, is broadening the demographic reach and driving continued momentum for digital promotions.
Digital media and promotions from consumer marketing spend funded by the CPGs to gain consumer awareness and drive sales within a specific retailer, also continues to shift from traditional in-store and print promotions and media to digital, particularly to mobile. Consumer marketers are looking to reach consumers directly across the right touchpoints throughout the path to purchase.
As the shift to digital media and promotions continues to grow, so does the importance placed on data to target audiences and measure campaign performance. As a greater portion of grocery sales have shifted to online, retailers are focused on implementing omnichannel strategies, technology, and solutions to meet consumer demands, compete effectively and drive sales. This is resulting in an increased number of digital touchpoints, using
combined data from offline and online sales, for retailers and their CPGs to target shoppers with relevant promotions and digital marketing. As retailers add more omnichannel capabilities, brands are able to shift more marketing dollars to digital.
Our Platforms and Solutions
We offer industry-leading digital platforms providing technology and services that power integrated digital media and promotions programs for brands and retailers. We do this through personalized and targeted media and promotions for the purpose of driving profitable sales, building shopper loyalty and increasing brand awareness and affinity. Our customers use our platforms to plan, manage and distribute digital media and promotions, target shopper audiences, and measure campaign performance and sales results.
Through Quotient’s solutions, CPGs and retailers can integrate their marketing campaigns' use of national brand promotions, loyalty rewards promotions, direct to consumer marketing, brand media advertising, social marketing, sponsored search, and DOOH.
We have a broad distribution network that includes our owned and operated web and mobile properties, such as Coupons.com, and thousands of publishing and retail partner properties. Through this network, we distribute relevant and targeted digital media and promotions.
Our solutions fall into the following categories:
Promotions
Quotient Promotions Platform (for CPGs)
Quotient Promotions Platform offers digital paperless promotions and digital print promotions across our distribution network. With digital paperless, shoppers add promotions directly to retailer loyalty accounts for automatic digital redemption or use a mobile device to take a picture of a retailer receipt with the appropriate purchase for cash back redemption. With digital print, shoppers select promotions and print them from their desktop or mobile device to redeem in store.
Through our platform, brands and retailers can reach shoppers on the web and on mobile devices by offering digital promotions through our extensive network which includes:
•the Coupons.com website and our Coupons.com mobile applications;
•brand and retailer websites and mobile applications; and
•thousands of third-party publishing websites and mobile applications in our network.
Quotient Promotions Platform offers national digital promotions from brands, and retail-specific promotions sourced from shopper marketers and retailers. Other platform solutions include in-lane on receipt promotions, loyalty rewards promotions, digital rebates, and specialty retail or promotional codes and rebates. Promotions can be personalized and/or targeted to shoppers through a combination of data points, including shopper purchase and intent data, historical purchase transactions, promotion activations and redemptions, interests, online clicks and search behavior, demographics, and location data. These techniques enable us to optimize the delivery of promotions across the network and drive campaign performance.
Quotient Retailer Promotions Platform (for retailers)
Quotient Retailer Promotions Platform, our proprietary and core platform, is used by top retailers in the grocery, drug, mass merchant, dollar, club and convenience merchandise channels to integrate into their POS systems, or loyalty program, which serves as their digital marketing platform, to create a direct, digital relationship with millions of their shoppers and an omnichannel experience. Through the Quotient Retailer Promotions Platform, we use consumer data and insights to distribute personalized and targeted media and promotions, primarily funded by our advertiser (brand) customers, to help drive consumer loyalty and increase sales. Additional solutions on this platform include personalized e-mails, targeted in-lane promotions at checkout, loyalty rewards, rebate offers, digital grocery list, digital receipts, branding landing pages, and digital circular.
Media
Quotient Media Platform (for CPGs)
Quotient Media platform offers targeted advertising solutions, enabling brands to reach shoppers before, during and after their shopping cycles with digital media campaigns. Brands can leverage our proprietary shopper data and audience segments to deliver targeted media ads across our network, including retail partners and Coupons.com, and across third-party publishers’ web, mobile and social channels outside our network. For example, we can target consumers on Facebook who have redeemed a promotion or purchased a product in a particular product category with advertising within that product category.
Our media solutions include display, social, DOOH, Retailer.com and sponsored search, shoppable brand pages and audiences.
Quotient Retailer Performance Media Platform (for retailers)
Quotient Retailer Performance Media Platform ("RPM"), provides retailers with the technology to build a sustainable omnichannel strategy leveraging the retailer's consumer data to drive sales and enhance the shopper experience. Through RPM, brand marketers can use specific retail data to target and deliver media directly to shoppers and measure direct sales results. Additionally, retailers deliver digital media campaigns through RPM. Solutions included on this platform include onsite media (sponsored search and display) and offsite media (programmatic, desktop and mobile, DOOH, social and self-service demand side platform ("DSP").We distribute this targeted media content via retailer digital properties, our expansive network including Coupons.com properties, and other third-party publishing sites. We also power Quotient Digital Circular, a personalized retail circular experience for shoppers, with targeted media units for CPGs to showcase their products and drive sales.
Quotient Analytics
Quotient Analytics provides campaign analytics and measured sales results to brands and retailers, attributing digital promotions and/or media campaigns to in-store and online purchases. Through Quotient Analytics, we combine purchase data from select retailers across the Quotient Retailer Promotion Platform and/or the Quotient Retailer Performance Media Platform with online engagement and purchase-intent data from Quotient’s flagship brand, Coupons.com, and the Company’s thousands of publishing partners. Our campaign measurement tools also provide brands and retailers with flexibility to adjust their campaigns in mid-flight to drive greater efficiency with marketing dollars. This capability and analysis is provided to customers who utilize our Promotions and Media Platforms. It provides the basis for our calculations to CPGs on their Return-on-Ad-Spend and Return-on-Promotion-Spend. As our platform, network and audience expands, the value of our data and analytics increases.
Quotient Consumer Properties
Our consumer properties complement our offerings and enable us to deliver critical capabilities. We provide CPGs and other parties access to our Coupons.com, Coupons.com Brandcaster and Shopmium audiences, including our website and mobile properties, to market their brands, including premium media and product placements on our site, promoted positions within our coupon galleries and premium placement in our marketing efforts.
Quotient Retailer Media Services
To complement Quotient's retailer platform solutions, we offer retailers the following individual capabilities to accomplish their specific objectives:
Creative Strategy:
•Our creative strategy and services team delivers high-quality, personalized ad creative to run across omnichannel media campaigns.
Media Buying:
•Our full-service media operations team offers high-performing media buying services, ranging from strategy and planning to real-time in-flight optimization.
Audiences:
•Quotient Audiences allows retailers to build and optimize audience segments to activate across media channels at scale. Our full-service data and analytics team enhances existing retailer data with Quotient’s proprietary data to build actionable audiences for brands.
Growth Strategy
We intend to grow our platforms and our business through the following key strategies:
Increase revenues from CPGs already on our platforms as well as expand our CPG base .
From our experience to date, we believe we have opportunities to continue increasing revenues from our existing customer base through:
•increasing our share of CPG spending on overall media and promotions by providing them a high return on their marketing investments and deploying larger digital marketing budgets as CPGs move off-line spend to on-line digital marketing spend;
•increasing the number of brands that are using our platforms within each CPG;
•leveraging data to provide our customers and partners with more insights, including campaign performance, and to distribute more targeted promotions, media, and analytics across our retail partner properties, our network including our owned and operated properties, and third-party sites; and
•maximizing consumer experiences across all products.
Increase the growing number of smaller CPGs that use, or desire to use our solutions.
We believe we have the opportunity to capture this revenue through:
•a dedicated sales team focused on smaller CPGs; and
•leveraging our solutions and retailer platforms to provide this segment of customers with digital opportunities on a national and shopper level versus traditional solutions that they have not had the ability to participate in, such as the offline free-standing insert (FSI), due to their market size.
Grow our digital promotions business. We plan to grow our digital promotions business through increased consumer demand of promotions, and by increasing the number of promotions that brands offer on our platforms leveraging the shift from offline to digital promotional channels. Additionally, smaller advertisers who have been excluded from the FSI are taking advantage of digital solutions for promotions. By bringing retailers and shoppers into our network, our ability to expand our targeted promotions and expand our audience reach grows, increasing our ability to more effectively engage consumers and drive sales. We plan to continue to expand our shopper adoption on Quotient Retailer Promotions Platform with our solutions, such as national promotions, targeted digital paperless promotions, targeted in-lane promotions at checkout, brand loyalty promotions, and our national rebate offering.
Grow our digital media business. As the industry continues to see eCommerce growth, the market for our digital media capabilities grows. We plan to capitalize on this through our digital media business, including Quotient RPM, programmatic display, social, DOOH, and our self-service sponsored search product as we see continued demand for these offerings from CPGs and our retail partners. We plan to continue to innovate and invest in our media solutions, expanding the use of our proprietary data as well as data from select exclusive retail partnerships,
and by adding and expanding relationships, including national media buyers and publishers, new partnerships, verticals, and third parties such as media agencies.
Offer more integrated digital media and promotions solutions. We continue to focus our sales strategy on further integrating digital media and promotions, including selling these offerings together through packaged solutions. We believe that brand spend on digital media and promotions will continue to grow as POS, mobile channels and social media offer new opportunities to engage consumers on their path to purchase.
Grow our retailer network and add retailers in new verticals. We believe we have the opportunity to grow the number of retailers that we partner with, thereby increasing the value of our platforms to all constituents. Also, we intend to continue growing our network with the addition of retailers outside of our core verticals in new verticals for our platform.
Grow international operations. Many CPGs and retailers on our platforms have global operations and we believe that we can opportunistically grow our operations and offerings in existing international markets and partner with our existing clients to enter new geographies in which they operate. We also plan to leverage our existing presence in France and the UK through our mobile application Shopmium, a receipt-scanning, cash-back mobile application platform, to develop further international opportunities.
Fraud Prevention and Distribution Controls
Our platforms include a proprietary digital distribution management system to enable CPGs and retailers to securely control the number of coupons distributed by device. We have controls in place to limit the number of digital coupons that can be printed. Similar controls are in place for linking coupons to loyalty cards and other paperless solutions, which allows us to limit the number of coupons distributed and activated. In addition, each printed coupon carries a unique ID that is encrypted, enabling us to trace each coupon from print to redemption. All of our digital print coupons can be authenticated and validated using this unique code. This unique ID also can be used to detect counterfeit or altered coupons. Our platforms allow us to systematically identify and respond to fraudulent and prohibited activities by restricting a device from printing coupons. We also have a proprietary rebate distribution solution with built in authentication capabilities through phone and payment verification. We have transactional level controls across rebate portfolio to enforce stacking rules and prevent receipt alteration and/or manipulation.
Sales and Marketing
We have a team of dedicated, skilled specialists focused on CPGs and retailers. We believe that our sales, integration, digital media and promotions campaign management and analytics, customer success and support capabilities are difficult to replicate and a key reason for the growth and success of our business. Our sales activity is focused on expanding the number of brands within existing and new CPG customers, including smaller CPGs, that offer digital media and promotions through our platforms as well as increasing the revenue from those brands currently using our platform. The team is also focused on expanding relationships within CPGs to include consumer marketing and digital media teams, where we believe there is a large opportunity for growth particularly in media. Additionally, we are focused on continuing to increase the size and breadth of our publishing and partner network. We are also seeking to partner with retailers in our non-core verticals.
In addition to sales support during the campaign planning process, our sales representatives provide additional support to CPGs and retailers to ensure that their campaigns are launched and delivered within specified time frames. Representatives assigned to specific customers review performance metrics and share feedback with the advertiser.
We are focused on managing our brand, increasing market awareness and generating new pipeline from both CPGs and retailers. We often present at industry conferences, create custom events and invest in public relations. In addition, our marketing team runs targeted digital marketing programs, develops data-led collateral and customer case studies, sponsors and conducts research, and delivers engaging content through social media channels. We are dedicated to growing our engaged consumer user base for Coupons.com through channels including paid media, search engine optimization, and public relations. This team is responsible for the acquisition, retention and ongoing engagement of users to increase our monthly promotions activations through Coupons.com.
Technology and Infrastructure
Since inception, we have made significant investments and will continue to invest in developing our differentiated and proprietary platforms aimed at solving the problems of CPGs and retailers in ways that traditional solutions cannot. We are focused on solutions that provide measurable results. We have assembled a team of highly skilled engineers and data scientists with deep expertise across a broad range of relevant disciplines. Key focus areas of our engineering team include:
•Scalable infrastructure. We use a combination of proprietary and open-source software to achieve a horizontally scalable, global, distributed and fault-tolerant architecture, with the goal of enabling us to ensure the continuity of our business, regardless of local disruptions. Our computational infrastructure currently processes millions of events per day and is designed in a way that enables us to add significant capacity to our platforms as we scale our business without requiring any material design or architecture modifications. We use a combination of public and private cloud computing platforms. Our private cloud technology infrastructure is hosted across data centers in co-location facilities in California and Virginia.
•Redundancy. Our critical production infrastructure utilizes a hot failover configuration which allows us to switch server loads, be it a single server or an entire data center, to the other data center within minutes. Data is continuously replicated between sites, and multiple copies at each site provide fast recovery whenever it is requested. Each data center has been designed to handle more than our entire server needs, which enables us to perform platform maintenance, business resumption and disaster recovery without any customer impact.
•Reporting. Our user interface provides flexible reporting and interactive visualization of the key drivers of success for each campaign. We use these reporting and visualization products internally to manage campaigns and provide campaign insights.
•AdTech. Our media delivery is largely powered by proprietary ad servers, creative and social platforms, workflow automation tools, and data management tools. We develop and use these platforms with a range of differentiated features that are specialized for the CPG and retail industries.
•Security. Our security policy adheres to established policies to ensure that all data, code, and production infrastructure are secure and protected. Our data centers are SSAE 16 Type II certified. We use our internal team and third parties to test, audit, and review our entire production environment to protect it.
Competition
We compete against a variety of different businesses with respect to different aspects of our business, including:
•providers of digital promotions such as Valassis’ Redplum.com, Catalina Marketing Corporation’s Cellfire, Inmar/You Technology, Neptune Retail Services' (formerly known as News America Marketing) SmartSource; companies that offer cash back solutions such as iBotta, Inc., Neptune Retail Services' Checkout 51;
•companies providing other e-commerce based services that allow consumers to obtain direct or indirect discounts on purchases; and companies that offer coupon codes such as RetailMeNot, Inc., which recently entered into an agreement to be purchased by J2 Global, Inc., Groupon, Inc., Exponential Interactive, Inc.’s TechBargains.com, Savings.com, Inc., Honey Science Corporation, which was recently acquired by PayPal Holdings, Inc., and Rakuten, Inc.;
•offline coupon and discount services, as well as newspapers, magazines and other traditional media companies that provide coupon promotions and discounts on products and services in free standing inserts or other forms, including Valassis Communications, Inc., Neptune Retail Services and Catalina Marketing Corporation;
•retailers who develop and manage digital advertising or data products in-house, such as The Kroger Company with its wholly owned subsidiary of 84.51°;
•internet sites and blogs that are focused on specific communities or interests that offer promotions or discount arrangements related to such communities or interests;
•companies offering online and marketing services to retailers and CPGs, such as MyWebGrocer, Inc. and Flipp Corp.; and
•companies offering digital advertising technology, inventory, data, and services solutions for CPGs and retailers including Alphabet, Inc., Facebook, Inc., Pinterest, Inc., Amazon.com, Inc., Adobe Inc., The Trade Desk, Inc., Oracle Corporation, Criteo S.A., Microsoft Corporation, and others;
We believe the principal factors that generally determine a company’s competitive advantage in our market include the following:
•scale and effectiveness of reach in connecting CPGs and retailers to consumers in a digital manner, through web, mobile and other online properties;
•scale and reach of our retailer network;
•scale and reach of our targetable audience data;
•ability to attract consumers to our platform;
•platform security, usability, scalability, reliability and availability;
•integration with retailer applications, point of sales systems, and consumer channels;
•access to consumer data;
•measurement that demonstrates the effectiveness of campaigns;
•quality of tools, reporting and analytics for planning, development and optimization of digital marketing campaigns;
•integration of products and solutions;
•rapid deployment of products and services for customers;
•breadth, quality and relevance of our solutions;
•ability to deliver high quality and increase number of digital promotions that are widely available and easy to use in consumers’ preferred form;
•brand recognition and reputation; and
•ability to recruit, retain, and train employees.
While we believe we compete effectively with respect to the factors identified above, we may face increasing competition from larger or more established companies that seek to enter our market or from smaller companies that launch new products, solutions and services that could gain market acceptance.
Human Capital Resources
Our long-term business success is driven by technological innovation, customer service, as well as operational and functional excellence. Attracting, developing and retaining top talent are critical to these long-term business success and are a key focus of the executive team. Our culture is underpinned by a newly defined set of core values that are integrated throughout our company and define how employees and leaders operate and interact. We recognize and celebrate our employees who champion our values through a newly established quarterly employee recognition program where employees are nominated by their peers for exemplary work demonstrating our values.
In 2020, the COVID-19 pandemic impacted our workforce, with a large majority of our employees working remotely since mid-March 2020. To support employees while working from home, we offered Wi-Fi reimbursement, expanded home office equipment support, provided several health and wellness programs and converted training offerings to a virtual format. We instituted a phased return-to-office plan with safety protocols and procedures outlined in a detailed Return-to-Office playbook. No employee layoffs that occurred in 2020 were related directly to COVID-19.
We continued to strategically hire during the COVID-19 pandemic. As of December 31, 2020, we had 1,163 full-time employees, consisting of 701 employees in the United States and 462 employees internationally. In 2020, a newly designed global onboarding program was introduced to enhance the new hire experience, especially as employees onboarded remotely for most of the year. Voluntary workforce turnover was 13.6% in 2020. At the end of 2020, our global workforce was 48.1% female, a slight increase over 2019. Nearly 38% of our employees who hold a manager title and above are women, an increase from 2019. Women represented 50% of our executive leadership team.
We are taking steps to expand our role as an employer that champions diversity, equity and inclusion. In 2020, we formed a 30-member diversity, equity and inclusion council focused on four key areas: Awareness and Education, Community Outreach, Recruitment and Development & Retention. At Quotient, we want everyone to feel valued and appreciated for their contributions to the growth and sustainability of our business.
We believe in cultivating high performing teams. In 2020, we launched a new performance management framework that aligns performance to reward and provides actionable feedback to employees. Twice a year, leaders commit to a comprehensive organization and talent review process, covering key elements such as organization structure, employee performance and potential, talent pipelines and development. We offer employees a free subscription to a leading learning platform to develop skills for current and future roles, as well as other online and facilitator-led learning opportunities.
We have a long-standing culture of helping local communities and neighbors through our philanthropic program. The program’s mission is to provide communities with tangible outcomes, leaving a positive legacy for future generations’ through the use of our time, talent, and technology. In 2020, we participated in virtual volunteer and community building events aimed at supporting local neighborhoods impacted by COVID-19 and organizations focused on supporting underrepresented groups.
Intellectual Property
We protect our intellectual property by relying on federal, state, and common law rights in the United States and equivalent rights in other jurisdictions, as well as contractual restrictions. We control access to our proprietary technology and algorithms by entering into confidentiality and invention assignment agreements with our employees and contractors, and confidentiality agreements with third parties.
In addition to these contractual arrangements, we also rely on a combination of trade secrets, patents, copyrights, trademarks, service marks and domain names to protect our intellectual property. We pursue the registration of our copyrights, trademarks, service marks and domain names in the United States and in certain locations outside the United States. As of December 31, 2020, we hold or have exclusive rights to 44 active issued patents in the United States and 30 active patents that have been issued outside of the United States with terms expiring between 2022 and 2038.
Circumstances outside our control could pose a threat to our intellectual property rights. For example, effective intellectual property protection may not be available in the United States or other countries in which we operate. Also, the efforts we have taken to protect our proprietary rights may not be sufficient or effective or may require significant expenditures and other resources to enforce. Any significant impairment of our intellectual property rights or unauthorized disclosure or use of our intellectual property could harm our business and our operating results, or ability to compete.
Companies in Internet-related and other industries may own large numbers of patents, copyrights and trademarks and may frequently request license agreements, threaten litigation or file suit against us based on allegations of infringement or other violations of intellectual property rights. We have been subject to in the past, and expect to face in the future, allegations that we have infringed the trademarks, copyrights, patents and other intellectual property rights of third parties, including our competitors and non-practicing entities. As we face increasing competition and as our business grows, we will likely face more claims of infringement.
Corporate Information
We changed our name to Quotient Technology Inc. on October 20, 2015. Our corporate website address is www.quotient.com. Information contained on, or that can be accessed through, our website does not constitute part of this report and inclusions of our website address in this report are inactive textual references only. Quotient, the
Quotient logo, the Coupons.com logo, the SavingStar logo, Elevaate, Shopmium, the Shopmium logo, Ahalogy, and Ubimo are trademarks or registered trademarks of Quotient Technology Inc. and its subsidiaries in the United States and other countries. Other marks are property of their respective owners.
Available Information
We file annual, quarterly and other reports, proxy statements and other information with the Securities and Exchange Commission (SEC) under the Exchange Act. We also make available, free of charge on the investor relations portion of our website at investors.quotient.com, our annual report on Form 10-K, quarterly reports on Form 10-Q, current reports on Form 8-K, and amendments to those reports filed or furnished pursuant to Section 13(a) or 15(d) of the Exchange Act as soon as reasonably practicable after they are filed electronically with the SEC. The SEC also maintains an Internet website at http://www.sec.gov/ where you can obtain most of our SEC filings. You can also obtain paper copies of these reports, without charge, by contacting Investor Relations at (650) 605-4600 (option 7).
Webcasts of our earnings calls and certain events we participate in or host with members of the investment community are available on our investor relations website at http://investors.quotient.com/. Additionally, we announce investor information, including news and commentary about our business and financial performance, SEC filings, notices of investor events, and our press and earnings releases, on our investor relations website, as well as through press releases, SEC filings, public conference calls, our corporate blog and social media in order to achieve broad, non-exclusionary distribution of information to the public. We encourage our investors and others to review the information we make public in these locations as such information could be deemed to be material information. Please note that this list may be updated from time to time. Investors and others can receive notifications of new information posted on our investor relations website in real time by signing up for email alerts. Further corporate governance information, including our corporate governance guidelines, board committee charters, corporate social responsibility report, and code of conduct, is also available on our investor relations website under the heading “Governance.” The contents of our websites, blog, press releases, public conference calls and social media are not incorporated by reference into this Annual Report on Form 10-K or in any other report or document we file with the SEC (and the contents of other SEC filings are not incorporated by reference into this Annual Report on Form 10-K or any other report or document we file with the SEC except as required by law or to the extent we expressly incorporate such SEC filing into this Annual Form 10-K or other report or document we file with the SEC), and any references to our websites are intended to be inactive textual references only.
Item 1A. Risk Factors.
Our operations and financial results are subject to various risks and uncertainties, including those described below, which could adversely affect our business, results of operations, cash flows, financial conditions, and the trading price of our common stock. The risks described below are not the only risk facing us. Risks and uncertainties not currently known to us or that we currently deem to be immaterial also may materially affect our business, financial condition, results of operations and prospects.
Risks Related to Our Business
We have incurred net losses since inception and we may not be able to generate sufficient revenues to achieve or subsequently maintain profitability.
We have incurred net losses of $65.4 million, $37.1 million and $28.3 million in 2020, 2019 and 2018 respectively. We have an accumulated deficit of $450.3 million as of December 31, 2020. We anticipate that our costs and expenses will increase in the foreseeable future as we continue to invest in:
•retailer partnerships;
•sales and marketing;
•research and development, including new product development;
•our technology infrastructure, business processes, and automation;
•general administration, including legal and accounting expenses related to our growth and continued expenses;
•expanding into new markets and verticals; and
•strategic opportunities and commercial relationships.
For example, we have incurred and expect to continue to incur expenses in developing and retaining retailer partnerships and developing self-service capabilities and automation. We may not succeed in increasing our revenues sufficiently to offset these expenses.
If we are unable to execute our growth strategy and gain efficiencies in our operating costs, our business could be adversely impacted. We cannot be certain that we will be able to attain or maintain profitability on a quarterly or annual basis. If we are unable to effectively manage these risks and difficulties as we encounter them, our business, financial condition and results of operations may suffer.
We may not achieve revenue growth.
We may not be able to achieve revenue growth, and we may not be able to generate sufficient revenues to achieve profitability. Historically the growth rate of our business, and as a result, our revenue growth, has varied from quarter-to-quarter and year-to-year, and we expect that variability to continue. Our revenues may fluctuate due to changes in marketing budgets of CPGs and retailers and the timing of their marketing spend. Marketing spend by CPGs is considered the most flexible and easiest to cut and CPGs can change their spend without notice, which can result in our inability to anticipate such fluctuations. For example, budget pressures or unspent budgets at the end of a CPG’s fiscal year may lead to respectively, unexpected reduced or increased spending on our platforms.
Decisions by CPGs or retailers to delay or reduce their digital marketing on our platforms or choose a solution from one of our competitors, or changes in our fee arrangements with CPGs, retailers and other commercial partners, could also slow our revenue growth or reduce our revenues. For instance, beginning in mid-March of 2020, decisions by CPGs and retailers to mostly pause or delay, and in some cases cancel, marketing campaigns due to the uncertainty, supply-chain disruption, and consumer purchasing behavior changes caused by the COVID-19 pandemic had an adverse impact on our revenue and revenue growth for the second quarter of 2020. While CPGs and retailers resumed digital marketing in the second half of 2020 generally, certain CPGs still are experiencing supply chain disruption and as circumstances change, we may continue to see reduced digital marketing levels and postponed or cancelled campaigns, particularly if COVID-19 outbreaks worsen.
Our business is complex and evolving. We may offer new capabilities, pricing, service models, process and delivery methods to CPGs and retailers. These new capabilities may change the way we generate and/or recognize revenue, which could impact our operating results. We announced in the first quarter of 2020 that effective second quarter of 2020, we would modify the way we process and deliver certain media products to enhance customer experience. As a result of these changes, we have recognized certain revenue on a net basis as compared to the prior recognition on a gross basis and this has caused a decrease in our revenue growth and impacted our revenues. In addition, if we shift a greater number of our arrangements with CPGs to new pricing models and we are not able to deliver on the results, our revenue growth and revenue could be negatively affected.
We believe that our continued revenue growth will depend on our ability to:
•increase our share of CPG spend on promotions and media (collectively, “marketing spend”) through our platforms, increase the number of brands that are using our platforms within each CPG, and expand our CPG base;
•adapt to changes in marketing goals, strategies and budgets of CPGs and retailers and the timing of their marketing spend;
•maintain and grow our retailer network and expand into new verticals;
•capitalize on the shift from offline to digital marketing and growth in e-commerce;
•maintain and expand our data rights with our retailer network;
•successfully execute and expand our digital media solutions into areas such as retail performance media, social influencer marketing, sponsored product search, DOOH, and programmatic media;
•successfully execute and expand our promotions solutions into areas such as in-lane, targeted promotions, national rebates, and loyalty rewards programs;
•demonstrate the value of our platforms through trusted measurement metrics;
•maintain and grow the size of our targetable audience;
•respond to changes in the legislative or regulatory environment, including with respect to privacy and data protection, or enforcement by government regulators, including fines, orders, or consent decrees;
•deploy, execute, and continue to develop our analytics capabilities;
•expand the use by consumers of our media and promotions offerings;
•successfully integrate our newly acquired companies into our business;
•innovate our consumer solutions and experiences to retain and grow our consumer base;
•expand the number, variety, quality, and relevance of promotions available on our platforms and through our network;
•increase the awareness of our brands, and earn and build our reputation;
•hire, integrate, train and retain talented personnel;
•effectively manage scaling and international expansion of our operations; and
•successfully compete with existing and new competitors.
However, we cannot assure you that we will successfully accomplish any of these actions. Failure to do so could harm our business and cause our operating results to suffer.
Our revenue and business will be negatively affected if we fail to retain and expand our relationships with retailers and obtain retailer commitment and support for our platforms.
The success and scale of our platforms depend on our strategic relationships with retailers and the level of retailer commitment and support for our platforms. If we do not renew, maintain and expand these relationships, or add new retailers to our platforms, our business will be negatively affected
For instance, our revenue and growth may be adversely impacted if retailers do not support our platforms. The success of our platforms requires integration with a retailer’s POS, loyalty programs and consumer channels. Certain platform capabilities may require integration with other retailer systems as well. This integration requires time and effort from the retailer; and may require us to work with a retailer’s third-party service providers, some of whom may be our competitors. In addition, the success of our platforms requires consumer and CPG adoption which requires significant marketing and other support from retailers, If retailers do not provide sufficient or timely resources and support, platform launches could be delayed and consumer and/or CPG adoption could be slow or minimal, which would negatively impact our revenue, costs of revenue, and recoverability of certain assets. For example, delays in the launch of in-lane promotions and sponsored search and display adversely impacted our revenue growth for the second half of 2019. Our revenue was negatively affected in the first half of 2020 when retailers mostly paused or delayed, and in some cases cancelled, marketing campaigns on our platforms in response to supply-chain challenges and out-of-stock product at shelf, consumer purchasing behavior changes, and other issues resulting from the COVID-19 pandemic.
The success of our platforms also depends in part on our use of consumer sales data provided by retailers, our access to retailer’s consumer channels, and the national scale and reach of our retailer network. If we fail to secure, or are found to be in violation of the terms of, such data, access and scale, we could lose access to retailer data and our platforms would be less valuable to CPGs and other business partners. If we do not renew our retailer agreements at the same level, lose a retailer, or fail to add new retailers on our platforms, our business, revenue and growth would be negatively affected.
In addition, we depend on retailers to comply with laws, regulations and industry standards relating to privacy and the use of consumer data. If we and our retail partners cannot timely respond to legal, regulatory and industry changes, or if retailers decide to limit or prohibit use of their data to comply with such changes, our revenue and growth would be impaired. For instance, if the California Consumer Privacy Act of 2018 (the " CCPA"), is amended to prohibit the “sale” (as defined in the CCPA) of loyalty program data, or if retailers materially restrict our use of sales and loyalty card data in light of the CCPA or similar laws or regulations, our business will be negatively affected. See the risk factor below titled “Our business is subject to complex and evolving laws, regulations and industry standards, and unfavorable interpretations of, or changes in, or failure by us to comply with these laws, regulations and industry standards could substantially harm our business and results of operations” for additional information.
Our sales cycle with retailers tends to be long and we may make investments and incur significant expenses before an agreement or renewal is reached, if at all, and before we are able to generate any revenue from such agreement or renewal. There are no guarantees that we will be able to recoup such investments and expenses, which would have an adverse effect on our business, financial condition and results of operations.
The loss or decrease in spending of any significant customer could materially and adversely affect our results of operations and financial condition.
Our business is exposed to risks related to customer concentration, particularly among CPGs and retailers. The loss or decrease in spending of any of our significant customers or deterioration in our relationships with any of them could materially and adversely affect our results of operations and financial condition.
If the distribution, revenue sharing or other fees that we pay increase or we are unable to meet contractual minimums under guaranteed distribution fee arrangements, our gross profit and business will be negatively affected.
We generally pay a distribution fee to retailers and publishers when we deliver media and promotions on their digital properties or through their loyalty programs. We also pay fees to retailers for use of their data to power our platforms. Such fees have increased as a percentage of our revenue in recent periods. As we renew agreements or enter into new ones, we may face pressure to pay higher distribution fees. If such fees continue to increase, our cost of revenue could increase and our operating results would be adversely affected. In addition, calculations of such fees are complex and if retailers disagree with our calculations in an audit, it could have an adverse impact on our business.
Some of our agreements with retailers include certain prepaid or guaranteed distribution fees, which, in some cases, may apply to multiple annual periods. If the adoption and usage of our platforms do not meet projections or minimums, these prepaid or guaranteed distribution fees may not be recoverable and any shortfall may be payable by us at the end of the applicable period. We consider various factors in our assessment of whether these prepaid or guaranteed distribution fees may not be recoverable, including our historical experience with the transaction volumes through the retailer and comparative retailers, ongoing communications with the retailer to increase its marketing efforts to promote the digital platform, as well as the projected revenue, and associated revenue share payments. For example, in 2020, implementation with a retailer of one of the Company’s solutions resulted in slower than expected adoption due to a variety of factors, including the spread of COVID-19 and a dispute related to the retailer's failure to perform certain obligations under the agreement. In light of these factors, we were not able to meet the contractual minimum under such arrangement at the end of the applicable period, which was originally scheduled to end in October 2020. In order to resolve a disagreement regarding the parties' respective obligations under the agreement with respect to such applicable period, we recognized a loss of $8.8 million to settle such matter. It is possible that we will not be able to meet future contractual minimums of this agreement or other agreements in the future, which could have an adverse impact on our business.
Our gross margins are dependent on many factors, some of which are not directly controlled by us.
The factors potentially affecting our gross margins include:
•our product mix since we have significant variations in our gross margin among products. Any substantial change in product mix could change our aggregate gross margin;
•growth and expansion of our lower-margin media products, including programmatic ads delivered through third-party ad-tech partners and publishers;
•ability to meet contractual minimums under guaranteed distribution fee arrangements;
•increasing costs of maintaining, expanding and adding retailer relationships;
•increasing data and traffic acquisition costs for offsite media on third-party properties;
•evolving fee arrangements with CPGs, which might have an impact on our gross margins;
•success of our pricing strategies, including outcome-based strategies;
•success of our investments in technology and automation or through acquisitions to gain cost efficiencies;
•increasing pricing pressures from competitors, CPGs and agencies representing CPGs; and
•success of higher-margin new products.
For instance, we have seen pressure on our gross margins, which we principally attribute to the factors described above and we expect this pressure to continue as our growth strategy evolves and our product mix continues to change. Although we expect to gain leverage as our business expands and through automation, there is no guarantee that we will succeed.
We expect a number of factors to cause our operating results to fluctuate on a quarterly and annual basis, which may make it difficult to predict our future performance.
Growth forecasts are subject to significant uncertainty and are based on assumptions and estimates that may not prove to be accurate. Historically, our revenue growth has varied from quarter-to-quarter and year-to-year, and we expect that variability to continue. In addition, our operating costs and expenses have fluctuated in the past, and we anticipate that our costs and expenses will increase over time as we continue to invest in growing our business. Our operating results could vary significantly from quarter-to-quarter and year-to-year as a result of these and other factors, many of which are outside of our control, and as a result we have a limited ability to forecast the amount of future revenue and expenses, which may adversely affect our ability to predict financial results accurately. Our ability to forecast our future results of operations is subject to a number of uncertainties, including our ability to effectively plan for and model future growth. We have encountered in the past, and may encounter in the future, risks and uncertainties frequently experienced by growing companies in changing industries. Our results of operations may fall below our estimates or the expectations of public market analysts and investors. Fluctuations in our quarterly operating results may lead analysts to change their long-term models for valuing our common stock, cause us to face short-term liquidity issues, impact our ability to retain or attract key personnel or cause other unanticipated issues, all of which could cause our stock price and the trading price of the convertible senior notes to decline. As a result of the potential variations in our quarterly revenue and operating results, we believe that quarter-to-quarter comparisons of our revenues and operating results may not be meaningful and the results of any one quarter or historical patterns should not be considered indicative of our future sales activity, expenditure levels or performance.
In addition to other factors discussed in this section, factors that may contribute to the variability of our quarterly and annual results include:
•our ability to adapt to changes in marketing goals, strategies and budgets of CPGs and retailers and the timing of their marketing spend;
•our ability to maintain or expand our retailer network and expand into new verticals;
•our ability to maintain and expand our data rights with our retailer network;
•our ability to leverage retailer demands to increase CPG spend on retailer performance media;
•the impact of competitors or competitive products and services, and our ability to compete in digital marketing;
•the impact of pricing pressures from our competitors, CPGs and agencies representing CPGs;
•reduction in demand or volatility in demand for one or more of our products, which may be caused by, among other things: delay or cancellation of marketing campaigns by CPGs and retailers as they focus on manufacturing in-demand products, replenishing out-of-stock items, adjust to changes in consumer purchasing behavior, contend with supply-chain challenges, and other issues arising out of the COVID-19 pandemic;
•disruption of planned themed marketing campaigns by CPGs and retailers, including campaigns that were adversely impacted by shelter-in-place orders and social distancing due to the COVID-19 pandemic;
•reduction in overall media spend by CPGs in reaction to the COVID-19 pandemic, which primarily had a negative effect on our media business starting March of 2020 and into the second quarter of 2020 and despite a return of bookings in the second half of 2020, could have an adverse effect through 2021;
•our ability to grow consumer selection and use of our digital promotion offerings and attract new consumers to our platform;
•our ability to obtain and increase the number of high quality promotions;
•changes in consumer behavior with respect to digital promotions and media and how consumers access digital promotions and media and our ability to develop applications that are widely accepted and generate revenues for CPGs, retailers and us;
•our ability to control costs including the costs of obtaining consumer data and investing, maintaining and enhancing our technology infrastructure;
•increased legal and compliance costs associated with data protection laws and regulations in various jurisdictions, including the CCPA, which went into effect on January 1, 2020, and invalidation of the EU-U.S.Privacy Shield framework and Swiss-U.S. Privacy Shield Framework in July 2020;
•the costs of developing new products, solutions and enhancements to our platform;
•whether new products successfully launch on time;
•our ability to manage our growth, including scaling our platform;
•the success of our sales and marketing efforts;
•the costs of successfully integrating acquired companies and employees into our operations, including costs related to the integration of Elevaate and Ubimo;
•changes in the legislative or regulatory environment, including with respect to privacy and data protection, or enforcement by government regulators, including fines, orders, or consent decrees;
•our ability to deal effectively with fraudulent transactions or customer disputes;
•our ability to collect payment for services timely, as COVID-19 pandemic may cause liquidity issues for some of our customers;
•the attraction and retention of qualified employees and key personnel, which can be affected by changes in U.S. immigration policies;
•the effectiveness of our internal controls;
•changes in accounting rules, tax laws or interpretations thereof; and
•changes in the way we process and deliver our services, which could affect whether revenue is recognized on a net or gross basis.
The effects of these factors individually or in combination, including the uncertainty created by the COVID-19 pandemic, could cause our quarterly and annual operating results to fluctuate, and affect our ability to forecast those results and our ability to achieve those forecasts. As a result, comparing our operating results on a period-to-period basis may not be meaningful. You should not rely on our past results as an indication of our future performance. This variability and unpredictability could also result in our failing to meet or exceeding the expectations of our investors or financial analysts for any period. In addition, we may release guidance in our quarterly earnings conference calls, quarterly earnings releases, investor day, or otherwise, based on predictions of our management, which are necessarily uncertain in nature. The guidance provided depends on our prediction of demand for our platform, maintaining and growing our retailer network, cost of maintaining retailer partnerships which can fluctuate greatly and are beyond our control. Our guidance may vary materially from actual results. If our revenue or operating results, or the rate of growth of our revenue or operating results, fall below or above the expectations of our investors or financial analysts, or below or above any forecasts or guidance we may provide to the market, or if the forecasts we provide to the market are below or above the expectations of analysts or investors, the price of our common stock could decline or increase substantially. Such a stock price decline or increase could occur even when we have met our own or other publicly stated revenue or earnings forecasts. Our failure to meet our own or other publicly stated revenue or earnings forecasts, or even when we meet our own forecasts but fall short of analyst or investor expectations, could cause our stock price to decline and expose us to costly lawsuits, including securities class action suits. Such litigation against us could impose substantial costs and divert our management’s attention and resources. If we exceed our own or other publicly stated revenue or earnings forecasts, or even when we meet our own forecasts but exceed analyst or investor expectations, our stock price could increase.
If we are unable to successfully respond to changes in the digital promotions market, our business could be negatively affected.
As consumer demand for digital promotions has increased, promotion spending has shifted from traditional promotions through traditional offline or analog channels, such as newspapers and direct mail, to digital coupons. Although we expect CPGs to reduce and eventually stop spending on the offline free-standing insert ("FSI"), our expectations regarding the timing of such change or our expectations that CPGs will shift some of their FSI budgets to our platforms or about the timing of such shifts may not be accurate. It is also difficult to predict whether CPGs will decide to shift FSI budgets to other marketing channels if digital promotions lose favor with CPGs, retailers or consumers. For example, some large retailers do not yet use digital paperless promotions. In the event of these or any other changes to the market, our continued success will depend on our ability to successfully adjust our strategy to meet the changing market dynamics. We will need to continue to grow demand for our platforms by CPGs, retailers and consumers, including through continued innovation and implementation of new initiatives associated with digital promotions. If a retailer decides not to accept digital paperless promotions, CPGs reduce spend in digital promotions, or CPGs chooses our competitors’ products and services, our business could be negatively affected.
If the demand for digital promotions does not continue to grow as we expect, or if we fail to successfully address this demand, our business will be harmed. For example, the growth of our revenue and gross margins require increasing or maintaining the number of brands that are using our promotions platforms within each CPG. If our projections regarding the adoption and usage of our promotions platforms by retailers, CPGs and consumers, do not occur or are slower than expected, our business, financial condition, results of operations and prospects will be harmed. Even if we are successful in driving the adoption and usage of promotions platforms by retailers, CPGs and consumers, if our fee arrangements or transaction volumes, or the mix and quality of offers, change or do not meet our projections, our revenues may be negatively affected. We expect that the market will evolve in ways which may be difficult to predict. For example, if consumer demand for our software-free print solution, in-lane promotions, national rebates, or our mobile applications does not grow as we expect or decreases, our business may be negatively affected. If we are unable to grow or successfully respond to changes in the digital promotions market, our business could be negatively affected and our results of operations could be negatively impacted. For example, some retailers discontinued the acceptance of paper coupons for a variety of reasons, including to address the fear that COVID-19 may be transmitted through paper. If retailers and consumers refuse to use our solutions involving paper, such as digital print, in-lane offers and national rebates, our business could be negatively affected. Our revenues may also be negatively affected if we are unable to manage the transition and the growth of digital paperless coupons is slower than the decline in digital print coupons. Conversely, acceleration of this shift (from, for example, acceptance of digital paperless coupons by new retailers) could lead to unanticipated increases in revenue.
If we fail to maintain and expand the use by consumers of digital promotions on our platform, our revenues and business will be negatively affected.
We must continue to maintain and expand the use by consumers of digital promotions in order to increase the attractiveness of our platforms to CPGs and retailers and to increase revenues and achieve profitability. If consumers do not perceive that we offer a broad selection of relevant and high-quality digital promotions, or that the usage of digital promotions is easy and convenient through our platforms, we may not be able to attract or retain consumers. In addition, as consumer behavior in accessing digital promotions changes and new distribution channels emerge, if we do not successfully respond and do not develop products or solutions that are widely accepted we may be unable to retain consumers or attract new consumers and as a result our business may suffer. We also depend on our retail partners to devote sufficient time, resources or funds to the promotion of our platforms and marketing of our digital promotions to consumers. If we are unable to maintain and expand the use by consumers of digital promotions on our platforms and consumer properties, as well as the digital properties and channels of retailers and other publishers in our network, or if we do not do so to a greater extent than our competitors, CPGs may find that offering digital promotions on our platforms do not reach consumers with the scale and effectiveness that is compelling to them. Likewise, if retailers find that use of our platforms does not increase sales of the promoted products and consumer loyalty to the retailer to the extent they expect, then the revenues we generate may not increase to the extent we expect or may decrease. Any of these could harm our business. Additionally, consumer shopping behavior has changed dramatically in response to the COVID-19 pandemic. For instance, shoppers continue to minimize shopping trips, rely on online grocery shopping, change buying habits as their lifestyles were impacted by state and local orders and social distancing. If consumers decide not to use our products that involve paper as a result of the COVID-19 pandemic and do not find our purely digital products compelling, our business could be harmed.
Competition presents an ongoing threat to the success of our business.
We expect competition in digital marketing to continue to increase. This industry is competitive, fragmented and rapidly changing. We compete against a variety of companies with respect to different aspects of our business, including:
•providers of digital promotions such as Valassis’ Redplum.com, Catalina Marketing Corporation’s Cellfire, Inmar/You Technology, Neptune Retail Services’ (formerly known as News America Marketing) SmartSource; companies that offer cash back solutions such as iBotta, Inc., Neptune Retail Services’ Checkout 51; companies providing other eCommerce based services that allow consumers to obtain direct or indirect discounts on purchases; and companies that offer coupon codes such as RetailMeNot, Inc., which recently entered into an agreement to be purchased by J2 Global, Inc., Groupon, Inc., Exponential Interactive, Inc.’s TechBargains.com, Savings.com, Inc., Honey Science Corporation, which was acquired by PayPal Holdings, Inc., and Rakuten, Inc.;
•offline coupon and discount services, as well as newspapers, magazines and other traditional media companies that provide coupon promotions and discounts on products and services in free standing inserts or other forms, including Valassis Communications, Inc., Neptune Retail Services and Catalina Marketing Corporation;
•retailers who develop and manage digital advertising or data products in-house, such as The Kroger Company with its wholly owned subsidiary of 84.51°;
•Internet sites and blogs that are focused on specific communities or interests that offer promotions or discount arrangements related to such communities or interests;
•companies offering online and marketing services to retailers and CPGs, such as MyWebGrocer, Inc. and Flipp Corp.; and
•companies offering digital advertising technology, inventory, data, and services solutions and channels for CPGs and retailers including: Alphabet Inc., Facebook, Inc., Pinterest, Inc., Amazon.com, Inc., Adobe Inc.,, The Trade Desk Inc., Oracle Corporation, Criteo S.A., Microsoft Corporation, and others.
We believe the principal factors that generally determine a company’s competitive advantage in our market include the following:
•scale and effectiveness of reach in connecting CPGs and retailers to consumers in a digital manner, through web, mobile and other digital properties;
•scale and reach of our retailer network;
•scale and reach of our targetable audience data;
•ability to attract consumers to our platform;
•platform security, usability, scalability, reliability and availability;
•integration with retailer applications, POS systems, and consumer channels;
•access to consumer data;
•measurement that demonstrates the effectiveness of campaigns;
•quality of tools, reporting and analytics for planning, development and optimization of digital marketing campaigns;
•integration of products and solutions;
•rapid deployment of products and services for customers;
•breadth, quality and relevance of our solutions;
•ability to deliver high quality and increasing number of digital promotions that are widely available and easy to use in consumers’ preferred form;
•brand recognition and reputation; and
•ability to recruit, retain and train employees.
We are subject to competition from large, well-established companies which have significantly greater financial, marketing and other resources than we do and have offerings that compete with our platforms or may choose to offer digital promotions and media and audiences as an add-on to their core business on their own or in partnership with one of our competitors that would directly compete with ours. Many of our larger actual and potential competitors have the resources to significantly change the nature of the digital promotions industry to their advantage, which could materially disadvantage us. For example, Alphabet Inc. and Facebook, Inc., retailers such as Kroger, online retailers such as Amazon have highly trafficked industry platforms which they have leveraged, or could leverage, to distribute digital promotions and media that could negatively affect our business. In addition, these potential competitors may have greater access to first-party data, be able to respond more quickly than we can to new or emerging technologies and changes in consumer habits. These competitors may engage in more extensive research and development efforts, undertake more far-reaching marketing campaigns and adopt more aggressive pricing policies, which may allow them to attract more consumers and, as a result, more CPGs and retailers, or generate revenues more effectively than we do. Our competitors may offer digital promotions or targeted media campaigns that are similar to the digital promotions and targeted media campaigns we offer or that achieve greater market acceptance than those we offer. We are also subject to competition from smaller companies that launch similar or new products and services that we do not offer and that could gain market acceptance.
Our success depends on the effectiveness of our platforms in connecting CPGs and retailers with consumers and with attracting consumer use of the digital promotions and media delivered through our platforms. To the extent we fail to provide digital promotions and media for high quality, relevant products, or otherwise fail to successfully reach consumers on their mobile device or elsewhere, consumers may become dissatisfied with our platforms and decide not to use our digital promotions or interact with our digital media and elect to use or view the digital promotions and media distributed by one of our competitors. As a result of these factors, our CPGs and retailers may not receive the benefits they expect, and CPGs may use the offerings of one of our competitors, and retailers may elect to handle promotions and media themselves or exclude us from integrating with their in-store and POS systems or consumer channels, and our operating results would be adversely affected. Similarly, if retailers elect to use a competitive distribution network or platform, and we do not have, or fail to maintain, an agreement to distribute content through that network or platform, CPGs may elect to provide digital promotions and media directly to that network or platform, instead of through our platform. If retailers and CPGs require our platforms to integrate
with competitive offerings instead of using our products, we could lose some of our competitive advantage and our business could be negatively affected.
We also face significant competition for trade promotion and marketing spending. We compete against online and mobile businesses, including those referenced above, and traditional advertising outlets, such as television, radio and print, and marketing spending. In order to grow our revenues and improve our operating results, we must increase our share of CPG spending on digital promotions and media relative to traditional sources and relative to our competitors, many of whom are larger companies that offer more traditional and widely accepted media products.
We also directly compete with retailers who develop and manage digital advertising or data products in-house, such as The Kroger Company with its wholly owned subsidiary of 84.51. Many retailers market and offer their own digital advertising solutions, including retailer performance media, targetable audiences and sponsor search, directly to CPGs. We also compete with retailers directly and indirectly for consumer traffic. Retailers will market promotions and media and directly to consumers using their own websites, email newsletters and alerts, mobile applications and social media channels. Additionally, some retailers also market and offer their own digital promotions and media directly to consumers using our platforms for which we earn no revenue. Our retailers could be more successful than we are at marketing their own digital promotions and media and could decide to terminate their relationship with us.
We may face competition from companies we do not yet know about. If existing or new companies develop, market or offer competitive digital coupon solutions, acquire one of our existing competitors or form a strategic alliance with one of our competitors, our ability to compete effectively could be significantly compromised and our operating results could be negatively affected. For example, on March 13, 2019, Inmar announced that it completed the acquisition of Kroger’s subsidiary You Technology and entered into a long-term service agreement to provide digital coupon services to the Kroger family of stores. Following this acquisition, Inmar terminated our agreement with You Technology as of December 2019. This adversely affected our ability to distribute digital promotions through You Technology, which generated less than 5% of our revenue in 2019.
We depend in part on advertising agencies as intermediaries, and if we fail to develop and maintain these relationships, our business may be negatively affected.
A growing portion of our business is conducted with advertising agencies acting on behalf of CPGs and retailers. Advertising agencies are instrumental in assisting CPGs and retailers to plan, manage and purchase media and promotions, and each advertising agency generally allocates media and promotion spend from CPGs and retailers across numerous channels. As advertising agencies represent the marketing budgets of multiple CPGs and retailers, we expect they will be able to exert more pricing pressure on us. We are still developing relationships with, and do not have exclusive relationships with, advertising agencies and we depend in part on advertising agencies to work with us as they embark on marketing campaigns for CPGs and retailers. While in most cases we have developed relationships directly with CPGs and retailers, we nevertheless depend in part on advertising agencies to present to their CPG and retailer clients the merits of our platform. Inaccurate descriptions of our platforms by advertising agencies, over whom we have no control, negative recommendations regarding use of our service offerings or failure to mention our platforms at all could hurt our business. In addition, if an advertising agency is disappointed with our platforms on a particular campaign or generally, we risk losing the business of the CPG or retailer for whom the campaign was run, and of other CPGs and retailers represented by that agency. Since many advertising agencies are affiliated with other advertising agencies in a larger corporate structure, if we fail to develop and maintain good relations with one advertising agency in such an organization, we may lose business from the affiliated advertising agencies as well.
Our sales could be adversely impacted by industry changes relating to the use of advertising agencies. Moreover, to the extent that we do not have a direct relationship with CPGs or retailers, the value we provide to CPGs and retailers may be attributed to the advertising agency rather than to us, further limiting our ability to develop long-term relationships directly with CPG and retailers. CPGs and retailers may move from one advertising agency to another, and we may lose the underlying business. The presence advertising agencies as intermediaries between us and the CPGs and retailers thus creates a challenge to building our own brand awareness and affinity with the CPGs and retailers that are the ultimate source of our revenues. In addition, advertising agencies conducting business with us could develop similar digital marketing solutions. As such, these advertising agencies are, or may become, our competitors. If they further develop their own capabilities they may be more likely to offer
their own solutions to advertisers, and our ability to compete effectively could be significantly compromised and our business, financial condition and operating results could be adversely affected.
Our failure to attract, integrate and retain other highly qualified personnel in the future, could harm our business.
As an industry leading digital promotions and media company we compete for sales, engineering and other technical talent in a highly competitive environment against large, well-established technology companies and well-funded start-ups, which have significantly greater financial and other resources than we do. If we do not succeed in attracting, hiring and integrating qualified personnel, or retaining and motivating existing personnel, we may be unable to grow effectively.
We may be limited in our ability to recruit global talent by U.S. immigration laws, including those related to H1-B visas. The demand for H1-B visas to fill highly-skilled technology and computer science jobs is greater than the number of H-1B visas available each year. In addition, the regulatory environment related to immigration under the current presidential administration may increase the likelihood that immigration laws may be modified to further limit the availability of H1-B visas. If a new or revised visa program is implemented, it may impact our ability to recruit, hire and retain qualified skilled personnel, which could adversely impact our business, operating results and financial condition.
The effects of health epidemics, including the COVID-19 pandemic, have had, and may continue to have, an adverse impact on our business, operations and the markets and communities in which we and our partners operate.
Our business and operations have been and may continue to be adversely affected by health epidemics, including the recent COVID-19 pandemic, impacting the markets and communities in which we and our partners operate. In December 2019, a novel strain of coronavirus, SARS-CoV-2, causing a disease referred to as COVID-19, was reported to have surfaced in Wuhan, China. Since then, COVID-19 has spread to many countries worldwide, including the United States.
In response to the COVID-19 pandemic, many state, local and foreign governments have put in place, and others in the future may put in place, quarantines, executive orders, shelter-in-place orders and similar government orders and restrictions in order to control the spread of the disease. Such orders or restrictions, or the perception that such orders or restrictions could occur, have resulted in business closures, work stoppages, slowdowns and delays, work-from-home policies, travel restrictions and cancellation of events, among other effects that could negatively impact productivity and disrupt our operations and those of our partners. Certain jurisdictions lifted such orders or restrictions only to return to these restrictions in the face of increases in new COVID-19 cases. The effects of these indefinite travel restrictions and prolonged alternative working arrangements are unknown, and may negatively impact the productivity of our employee base, and a disproportionately negative impact on our sales and operations functions, which could have an adverse effect on our business, operating results, and financial condition.
In addition, while the potential impact and duration of the COVID-19 pandemic on the global economy and our business in particular is difficult to assess or predict. A recession or market correction resulting from the spread of COVID-19 and its impacts could decrease marketing spend, particularly in media, adversely affecting the demand for our solutions, our business, and the value of our common stock. While we have seen CPGs historically continue to spend on promotions during economic downturns, there is no guarantee they will continue to do so.
The global COVID-19 pandemic continues to rapidly evolve, and we will continue to monitor the COVID-19 situation closely. The ultimate impact of the COVID-19 pandemic or a similar health epidemic is highly uncertain and subject to change. We do not yet know the full extent of potential delays or impacts on our business, operations or the global economy as a whole. The COVID-19 pandemic, and the various responses to it, may also have the effect of heightening many of the other risks discussed in this “Risk Factors” section.
Acquisitions, joint ventures and strategic investments could result in operating difficulties, dilution and other harmful consequences.
We have acquired a number of businesses, and expect to continue to evaluate and consider a wide array of potential strategic transactions, including acquisitions and dispositions of businesses, joint ventures, technologies, services, products and other assets and strategic investments. At any given time, we may be engaged in
discussions or negotiations with respect to one or more of these types of transactions. Any of these transactions could be material to our financial condition and results of operations. The process of integrating any acquired business may create unforeseen operating difficulties and expenditures and is itself risky. The areas where we may face difficulties include:
•expected and unexpected costs incurred in identifying and pursuing strategic transactions and performing due diligence regarding potential strategic transactions that may or may not be successful;
•failure of an acquired company to achieve anticipated revenue, earnings, cash flows or other desired technological and business goals;
•effectiveness of our due diligence review and our ability to evaluate the results of such due diligence, which are dependent upon the accuracy and completeness of statements and disclosures made by the acquired company;
•diversion of management time, as well as a shift of focus from operating the businesses to issues related to integration and administration;
•disputes as a result of certain terms and conditions of our transactions, such as payment of contingent consideration, compliance with covenants, or closing adjustments;
•the need to integrate technical operations and security protocols, which may lead to significant security breaches of, technical difficulties with, or interruptions to, the delivery and use of our products and services;
•the need to integrate the acquired company’s accounting, management, information, human resource and other administrative systems to permit effective management, and the lack of control if such integration is delayed or not implemented;
•retention of key employees from the acquired company and cultural challenges associated with integrating employees from the acquired company into our organization;
•the need to implement or improve controls, procedures and policies appropriate for a public company at companies that prior to acquisition had lacked such controls, procedures and policies;
•in some cases, the need to transition operations and customers onto our existing platforms;
•in certain instances, the ability to exert control of acquired businesses that include earnout provisions in the agreements relating to such acquisitions or the potential obligation to fund an earnout for, or other obligations related to, a product that has not met expectations;
•the need to integrate operations across different geographies, cultures and languages and to address the particular economic, currency, political and regulatory risks associated with specific countries;
•liability for activities of the acquired company before the acquisition, including violations of laws, rules and regulations, commercial disputes, tax liabilities and other known and unknown liabilities;
•difficulties valuing intangibles related to acquired businesses, which could lead to write-offs or charges related to acquired assets or goodwill; and
•litigation or other claims in connection with the acquired company, including claims from terminated employees, users, former stockholders or other third parties and intellectual property infringement claims.
For example, we have acquired businesses whose technologies are new to us and with which we did not have significant experience. We have made and are making investments of resources to support such acquisitions, which will result in ongoing operating expenses and may divert resources and management attention from other areas of our business. We cannot assure you that these investments and the integration of these acquisitions will be successful. If we fail to successfully integrate the companies we acquire, we may not realize the benefits expected from the transaction and our business may be negatively impacted.
Our failure to address these risks or other problems encountered in connection with our past or future acquisitions and investments could cause us to fail to realize the anticipated benefits of any or all of our acquisitions or joint ventures, or we may not realize them in the time frame expected or cause us to incur unanticipated liabilities, and harm our business. Future acquisitions or joint ventures may require us to issue dilutive additional equity securities, spend a substantial portion of our available cash, incur debt or contingent liabilities, amortize expenses related to intangible assets or incur incremental operating expenses or write-offs of goodwill or impaired acquired intangible assets, which could adversely affect our results of operations and harm our business.
If we fail to effectively manage our growth, our business and financial performance may suffer.
We have significantly expanded our operations and anticipate expanding further to pursue our growth strategy. Through acquisitions we have added multiple additional offices within the last three years. We also recently announced that we signed a lease in Salt Lake City, Utah and plan to move our principal executive offices there in mid-2021. Such expansion increases the complexity of our business and places significant demands on our management, operations, technical performance, financial resources and internal control over financial reporting functions. Continued growth could strain our ability to deliver solutions on our platforms, develop and improve our operational, financial, legal and management controls, and enhance our reporting systems and procedures. Failure to manage our expansion may limit our growth, damage our reputation and negatively affect our financial performance and harm our business.
To effectively manage this growth, we will need to continue to improve our operational, financial and management controls, and our reporting systems and procedures. If we do not effectively manage the growth of our business and operations the scalability of our business and our operating results could suffer.
Our current and planned personnel, systems, procedures and controls may not be adequate to support and effectively manage our future operations. We may not be able to hire, train, retain, motivate and manage required personnel. As we continue to grow, we must effectively integrate, develop and motivate a large number of new employees. We intend to continue to expand our research and development, sales and marketing, and general and administrative organizations, and over time, expand our international operations. To attract top talent, we have had to offer, and believe we will need to continue to offer, highly competitive compensation packages before we can validate the productivity of those employees. If we fail to effectively manage our hiring needs and successfully integrate our new hires, our efficiency and ability to meet our forecasts and our employee morale, productivity and retention could suffer, and our business and operating results could be adversely affected.
Providing our products and services to our CPGs, retailers and consumers is costly and we expect our expenses to continue to increase in the future as we grow our business with existing and new CPGs and retailers and develop new products and services that require enhancements to our technology infrastructure. In addition, our operating expenses, such as our sales, marketing and engineering expenses are expected to continue to grow to support our anticipated future growth. As a result of the requirements of being a public company we incur significant legal, accounting and other expenses. Our expenses may grow faster than our revenues, and our expenses may be greater than we anticipate. Managing our growth will require significant expenditures and allocation of valuable management resources. If we fail to achieve the necessary level of efficiency in our organization as it grows, our business, operating results and financial condition would be negatively affected.
If our websites or those of our publishers fail to rank prominently in unpaid search results from search engines, traffic to our websites could decline and our business would be adversely affected.
Our success depends in part on our ability to attract consumers through unpaid Internet search results on search engines, such as Google. The number of consumers we attract to our websites from search engines is due in large part to how and where our websites rank in unpaid search results. These rankings can be affected by a number of factors, many of which are not in our direct control, and they may change frequently. For example, major search engines frequently modify their ranking algorithms, methodologies or design layouts. As a result, links to our websites may not be prominent enough to drive traffic to our websites or we may receive less favorable placement which could reduce traffic to our website, and we may not know how or otherwise be in a position to influence the results. In some instances, search engine companies may change these rankings in order to promote their own competing products or services or the products or services of one or more of our competitors. Our websites have experienced fluctuations in search result rankings in the past, and we anticipate fluctuations in the future. For example, the search result rankings of our websites have fallen relative to the same time last year. In addition, websites must comply with search engine guidelines and policies. These guidelines and policies are complex and
may change at any time. If we fail to follow such guidelines and policies properly, search engines may rank our content lower in search results or could remove our content altogether from their index. Moreover, the use of voice recognition technology, such as Alexa, Google Assistant or Siri, may drive traffic away from search engines, which could reduce traffic to our website. Any reduction in the number of consumers directed to our websites could reduce the effectiveness of our coupon codes for specialty retailers and digital promotions for CPGs and retailers and could adversely impact our business and results of operations. It could also reduce our ability to sell media advertising on our sites, which would negatively impact revenues and harm our business. For example, we have seen a decline in the revenues from specialty retail and expect this trend to continue.
Factors adversely affecting performance marketing programs and our relationships with performance marketing networks and brand partners, or the termination of these relationships, may adversely affect our ability to attract and retain merchants and our coupon codes business.
A portion of our business is based upon consumers using coupon codes from specialty retailers in connection with the purchase of goods or services. The fees we earn for coupon codes accessed through our platforms are tracked by performance marketing networks. Third-party performance marketing networks provide publishers with affiliate tracking links that allow for revenues to be attributed to publishers. When a consumer executes a purchase on a publisher’s website as a result of a performance marketing program, most performance marketing conversion tracking tools credit the most recent link or ad clicked by the consumer prior to that purchase. This practice is generally known as “last-click attribution.” We generate revenues through transactions for which we receive last-click attribution. Risks that may adversely affect our performance marketing programs and our relationships with performance marketing networks include the following, some of which are outside our control:
•we may not be able to adapt to changes in the way in which advertisers and merchants attribute credit to us in their performance marketing programs, whether it be “first-click attribution” or “multichannel attribution,” which applies weighted values to each of a retailer’s advertisements and tracks how each of those advertisements contributes to a purchase, or otherwise;
•we may not receive revenue if consumers make purchases from their mobile devices as some retailers currently do not recognize affiliate tracking links on their mobile-optimized websites or applications, and tracking mechanisms on mobile websites or applications may not function to allow retailers to properly attribute sales to us;
•we may not generate revenue if consumers use mobile devices for shopping research but make purchases using coupon codes found on our sites in ways where we do not get credit;
•refund rates for products delivered on merchant sites may be greater than we estimate;
•performance marketing networks may not provide accurate and timely reporting on which we rely, we could fail to properly recognize and report revenues and misstate financial reports, projections and budgets and misdirect our advertising, marketing and other operating efforts for a portion of our business;
•we primarily rely on a small number of performance marketing networks in non-exclusive arrangements, the loss of which could adversely affect our coupon codes business;
•we primarily rely, in connection with our search engine marketing business, on a small number of brand partners that work with us in non-exclusive arrangements, the loss of which could adversely affect our coupon codes business;
•industry changes relating to the use of performance marketing networks could adversely impact our commission revenues;
•to the extent performance marketing networks serve as intermediaries between us and merchants, it may create challenges to building our own brand awareness and affinity with merchants, and the termination of our relationship with the performance marketing networks would terminate our ability to receive payments from merchants we service through that network;
•performance marketing networks may compete with us; and
•economic uncertainty related to the COVID-19 pandemic and its impact on consumer spending.
While coupon codes from specialty retailers represent a declining portion of our business, any of these risks could adversely affect our revenues in this area.
Failure to deal effectively with fraudulent or other improper transactions could harm our business.
Digital promotions can be in the form of redeemable coupons, coupon codes with unique identifiers, loyalty card linked offers, and national rebates. It is possible that third parties may create counterfeit digital coupons, coupon codes, exceed print or use limits in order, or submit fraudulent receipts to fraudulently or improperly claim discounts or credits for redemption. If we are unable to identify fraudulent national rebates claims before we pay out cash for these claims we might be unable to get reimbursement from our customers. It is possible that individuals will circumvent our anti-fraud systems using increasingly sophisticated methods or methods that our anti-fraud systems are not able to counteract. Further, we may not detect any of these unauthorized activities in a timely manner. Third parties who succeed in circumventing our anti-fraud systems may sell the fraudulent or fraudulently obtained digital coupons on social networks or claim discounts, credits or rebates that they are not entitled to, which would damage our brand and relationships with CPGs and harm our business. Legal measures we take or attempt to take against these third parties may be costly and may not be ultimately successful. In addition, our service could be subject to employee fraud or other internal security breaches, and we may be required to reimburse CPGs and retailers for any funds stolen or revenues lost as a result of such breaches. Our CPGs and retailers could also request reimbursement, or stop using our platforms and products, if they are affected by buyer fraud or other types of fraud. We may incur significant losses from fraud and counterfeit digital coupons and receipts. If our anti-fraud technical and legal measures do not succeed, our business may suffer.
Indemnity provisions in various agreements potentially expose us to substantial liability for intellectual property infringement and other losses including unauthorized use or disclosure of consumer data.
Our agreements with CPGs, retailers and other third parties may include indemnification provisions under which we agree to indemnify them for losses suffered or incurred as a result of claims of intellectual property infringement or other liabilities relating to or arising from our products, services or other contractual obligations including those relating to data use and consumer consent. The term of these indemnity provisions generally survives termination or expiration of the applicable agreement. Large indemnity payments, individually or in the aggregate across customers, could harm our business.
Our business depends on strong brands, and if we are not able to maintain and enhance our brands, or if we receive unfavorable media coverage, our ability to retain and expand our number of CPGs, retailers and consumers will be impaired and our business and operating results will be negatively affected.
We believe that the brand identity that we have developed has significantly contributed to the success of our business. We also believe that maintaining and enhancing our brand is critical to expanding our base of CPGs, retailers and consumers. Maintaining and enhancing our brands may require us to make substantial investments and these investments may not be successful. If we fail to promote and maintain our brands, or if we incur excessive expenses in this effort, our business would be negatively affected. We anticipate that, as our market becomes increasingly competitive, maintaining and enhancing our brands may become increasingly difficult and expensive.
Unfavorable publicity or consumer perception of our websites, mobile applications, platforms, practices or service offerings, or the offerings of our CPGs and retailers, could adversely affect our reputation, resulting in difficulties in recruiting, decreased revenues and a negative impact on the number of CPGs and retailers we feature and our user base, the loyalty of our consumers and the number and variety of digital coupons we offer. As a result, our business could be negatively affected.
Our use of and reliance on international research and development resources and operations may expose us to unanticipated costs or events.
We have research and development centers in India, France, and Israel. We expect to increase our headcount, development, and operations activity in India. There is no assurance that our reliance upon international research and development resources and operations will enable us to achieve our research and development and
operational goals or greater resource efficiency. Further, our international research and development and operations efforts involve significant risks, including:
•difficulty hiring and retaining appropriate personnel due to intense competition for such resources and resulting wage inflation in the cities where our research and development activities and operations are located;
•different labor regulations, especially in the European Union, where labor laws are generally more advantageous to employees as compared to United States, including deemed hourly wage and overtime regulations in these locations;
•exposure to liabilities under anti-corruption and anti-money laundering laws, including the U.S. Foreign Corrupt Practices Act of 1977, as amended, and similar applicable laws and regulations in other jurisdictions;
•delays and inefficiencies caused by geographical separation of our international research and development activities and operations and other challenges inherent to efficiently managing an increased number of employees over large geographic distances, including the need to implement appropriate systems, policies, benefits and compliance programs;
•the knowledge transfer related to our technology and resulting exposure to misappropriation of intellectual property or information that is proprietary to us, our customers and other third parties;
•heightened exposure to change in the economic, security and political conditions in the countries where our research and development activities and operations are located;
•fluctuations in currency exchange rates and regulatory compliance in the countries where our research and development activities and operations are located; and
•interruptions to our operations in the countries where our research and development activities and operations are located as a result of floods and other natural catastrophic events as well as other events beyond our control such as power disruptions or terrorism.
Difficulties resulting from the factors above could increase our research and development or operational expenses, delay the introduction of new products, or impact our product quality, the occurrence of any of which could adversely affect our business and operating results.
If we fail to expand effectively in international markets, our revenues and our business may be negatively affected.
We currently generate almost all of our revenues from the United States. We also operate to a limited extent in the United Kingdom, France and other countries in Europe. Many CPGs and retailers on our platforms have global operations and we plan to grow our operations and offerings through expansion in existing international markets and by partnering with our CPGs and retailers to enter new geographies that are important to them. Further expansion into international markets will require management attention and resources and we have limited experience entering new geographic markets. Entering new foreign markets will require us to localize our services to conform to a wide variety of local cultures, business practices, laws and policies. The different commercial and Internet infrastructure in other countries may make it more difficult for us to replicate our business model. In some countries, we will compete with local companies that understand the local market better than we do, and we may not benefit from first-to-market advantages. We may not be successful in expanding into particular international markets or in generating revenues from foreign operations. As we expand internationally, we will be subject to risks of doing business internationally, including the following:
•competition with strong local competitors and preference for local providers, or foreign companies entering the same markets;
•the cost and resources required to localize our platform;
•burdens of complying with a wide variety of different laws and regulations, including intellectual property laws and regulation of digital coupons and media, Internet services, privacy and data protection, marketing and consumer protection laws, anti-competition regulations and different liability standards, which may limit or prevent us from offering of our solutions in some jurisdictions or limit our ability to enforce contractual obligations;
•differences in how trade marketing spend is allocated;
•differences in the way digital promotions and media are delivered and how consumers access and use digital promotions;
•technology compatibility;
•difficulties in recruiting and retaining qualified employees and managing foreign operations;
•different employee/employer relationships and the existence of workers’ councils and labor unions;
•shorter payment cycles, different accounting practices and greater problems in collecting accounts receivable;
•higher product return rates;
•seasonal reductions in business activity;
•adverse tax effects and foreign exchange controls making it difficult to repatriate earnings and cash; and
•political and economic instability.
Our planned corporate structure and intercompany arrangements will be implemented in a manner we believe is in compliance with current prevailing tax laws. However, the tax benefits which we intend to eventually derive could be undermined if we are unable to adapt the manner in which we operate our business and due to changing tax laws.
Our failure to manage these risks and challenges successfully could materially and adversely affect our business, financial condition and results of operations.
Risks Related to Government Regulation, Tax Law or Accounting Standards
Our business is subject to complex and evolving laws, regulations and industry standards, and unfavorable interpretations of, or changes in, or our actual and perceived failure to comply with these laws, regulations and industry standards could substantially harm our business and results of operations.
We are subject to a variety of foreign, federal, state, local and municipal laws, regulations and industry standards that relate to privacy, electronic communications, data protection, intellectual property, eCommerce, competition, price discrimination, consumer protection, taxation, and the use of promotions. Many of these laws, regulations, and standards are still evolving and being tested in courts and industry standards are still developing. Our business, including our ability to operate and expand, could be adversely affected if legislation, regulations or industry standards are adopted, interpreted or implemented in a manner that is inconsistent with our current business practices and that require changes to these practices or the design of our platform. Existing and future laws, regulations and industry standards could restrict our operations, and our ability to retain or increase our CPGs and retailers and consumers’ use of digital promotions delivered on our platforms may be adversely affected and we may not be able to maintain or grow our revenues as anticipated.
For example, California also enacted legislation, the California Consumer Privacy Act of 2018, or the CCPA, which affords consumers expanded privacy protections as of January 1, 2020. The potential effects of this legislation are far reaching and has required us to modify our data processing practices and policies and to incur substantial costs and expenses in an effort to comply. For example, the CCPA requires companies that process information on California residents to make new disclosures to consumers about their data collection, use and sharing practices, and allows consumers to opt out of the sale of personal information with third parties and provides a private right of action and statutory damages for data breaches. The CCPA also provides for civil
penalties for violations, as well as a private right of action for data breaches that may increase the risk of data breach litigation, all of which may increase our compliance costs and potential liability. In addition, California voters recently approved the California Privacy Rights Act of 2020, or CPRA, that goes into effect on January 1, 2023. The CPRA would, among other things, give California residents the ability to limit the use of their sensitive information, provide for penalties for CPRA violations concerning California residents under the age of 16, and establish a new California Privacy Protection Agency to implement and enforce the law.
The enactment of the CCPA is prompting a wave of similar legislative developments in other states in the United States, which could create the potential for a patchwork of overlapping but different state laws. Some observers have noted that the CCPA could mark the beginning of a trend toward more stringent privacy legislation in the United States, which could increase our potential liability and adversely affect our business, results of operations, and financial condition. Some countries also are considering or have passed legislation requiring local storage and Processing of data, or similar requirements, which could increase the cost and complexity of operating our products and services and other aspects of our business.
Compliance with these and any other applicable privacy, data protection, data security, marketing and consumer protection guidelines, laws and regulations is a rigorous and time-intensive process, and we may be required to put in place additional mechanisms to ensure compliance with them. We believe our policies and practices comply in material respects with these guidelines, laws and regulations. However, if our belief is incorrect, or if these guidelines, laws or regulations or their interpretation change or new legislation or regulations are enacted, we may face significant fines and penalties that could adversely affect our business, financial condition and result of operations. Further, we could be compelled to provide additional disclosures to our consumers, obtain additional consents from our consumers before collecting, using, or disclosing their information or implement new safeguards or business processes to help individuals manage our use of their information, among other changes. We also cannot control our retail partners’ approach or interpretation of CCPA, the CPRA or other privacy regulations, which may impact their willingness or ability to provide us data that our platforms and solutions are dependent upon, or the terms on which they are willing or able to provide it. Changes to our data sources may restrict our ability to maintain or grow our revenues as anticipated.
If our estimates or judgements relating to our critical accounting policies prove to be incorrect, our results of operations could be adversely affected.
The preparation of financial statements in conformity with generally accepted accounting principles ("GAAP") requires management to make estimates and assumptions that affect the amounts reported in our financial statements and accompanying notes. We base our estimates on historical experience and on various other assumptions that we believe to be reasonable under the circumstances, as provided in the section titled “Management’s Discussion and Analysis of Financial Condition and Results of Operations.” The results of these estimates form the basis for making judgments about the carrying values of assets, liabilities and equity, and the amount of revenue and expenses that are not readily apparent from other sources. Significant assumptions and estimates used in preparing our consolidated financial statements include those related to business combinations, goodwill and intangible assets, treatment of our convertible senior notes, revenue recognition, promotion revenue, media revenue, gross versus net revenue reporting, arrangements with multiple performance obligations, stock-based compensation and provision for income taxes. For example, the recognition of our revenue is governed by certain criteria that determine whether we report revenue either on a gross basis, as a principal, or net basis, as an agent, depending upon the nature of the sales transaction. Historically, our media products revenue has generally been recognized on a gross basis. However, effective second quarter of 2020, we modified the way we process and deliver certain media products to enhance the customer experience. As a result of these changes, we expect that we will recognize certain revenue on a net basis, as compared to the prior recognition on a gross basis, and expect this will cause a decrease in our revenue growth and impact our revenues. We may have gross reporting for portions of our media products and other revenue in the future as a result of the evolution of our existing business practices, development of new products, acquisitions, or changes in accounting standards or interpretations, that in any case result in transactions with characteristics that dictate gross reporting. It is also possible that revenue reporting for existing businesses may change from gross to net or vice versa as a result of changes in contract terms or transaction mechanics. We may experience significant fluctuations in revenue in future periods depending upon, in part, the nature of our sales and our reporting of such revenue and related accounting treatment, without proportionate correlation to our underlying activity or net income. Any combination of net and gross revenue reporting would require us to make estimates and assumptions about the mix of gross and net-reported transactions based upon the volumes and characteristics of the transactions we think will make up the total mix of revenue in the period covered by the projection. Those estimates and assumptions may be inaccurate when made, or may be
rendered inaccurate by subsequent circumstances, such as changing the characteristics of our offerings or particular transactions in response to client demands, market developments, regulatory pressures, acquisitions, and other factors. Even apparently minor changes in transaction terms from those initially envisioned can result in different accounting conclusions from those foreseen. In addition, we may incorrectly extrapolate from revenue recognition treatment of prior transactions to future transactions that we believe are similar, but that ultimately are determined to have different characteristics that dictate different revenue reporting treatment. These factors may make our financial reporting more complex and difficult for investors to understand, may make comparison of our results of operations to prior periods or other companies more difficult, may make it more difficult for us to give accurate guidance, and could increase the potential for reporting errors.
Our results of operations may be adversely affected if our assumptions change or if actual circumstances differ from those in our assumptions, which could cause our results of operations to fall below the expectations of securities analysts and investors, resulting in a decline in the trading price of our common stock.
Failure to comply with federal, state and foreign privacy, data protection, marketing and consumer protection laws, regulations and industry standards, or the expansion of current or the enactment or adoption of new privacy, data protection, marketing and consumer protection laws, regulations or industry standards, could adversely affect our business.
We process data about consumers, including personally identifiable information or personal data, as well as other confidential or proprietary information necessary to operate our business, for legal and marketing purposes, and for other business-related purposes. We collect such information from individuals located both in the United States and abroad and may store or Process such information outside the country in which it was collected.
Data privacy and regulation of privacy, information security and Processing has become a significant issue in the United States, countries in Europe, and in other countries across the globe. The legal and regulatory framework for privacy and security issues is rapidly evolving, and is expected to increase our compliance costs and exposure to liability. We and our service providers and partners are subject to a variety of federal, state and foreign laws, regulations and industry standards regarding privacy, data protection, data security, marketing and consumer protection, which address the collection, storing, sharing, using, processing, disclosure and protection of data relating to individuals, as well as the tracking of consumer behavior and other consumer data (“Data Protection Laws”). We are also subject to laws, regulations and industry standards relating to endorsements and influencer marketing. Many of these laws, regulations and industry standards are changing, may be subject to differing interpretations, may be inconsistent among countries, or conflict with other rules, and may becostly to comply with or inconsistent among jurisdictions.
Various industry standards on privacy and data security have been developed and are expected to continue to develop, which may be adopted by industry participants at any time. We have committed to comply, and generally require our customers and partners to comply, with applicable self-regulatory principles, such as the Network Advertising Initiative’s Code of Conduct and the Digital Advertising Alliance’s Self-Regulatory Principles for Online Behavioral Advertising in the U.S. Trade associations and industry self-regulatory groups have also promulgated best practices and other industry standards relating to targeted advertising. Our efforts to comply with these self-regulatory principles include offering Internet users notice and choices about when advertising is served to them based, in part, on their interests. If we, our clients or partners make mistakes in the implementation of these principles, or if self-regulatory bodies expand these guidelines or government authorities issue different guidelines regarding Internet-based advertising, or opt out mechanisms fail to work as designed, or if Internet users misunderstand our technology or our commitments with respect to these principles, we may, as a result, be subject to negative publicity, government investigation, government or private litigation, or investigation by self-regulatory bodies or other accountability groups. Any such action against us, or investigations, even if meritless, could be costly and time consuming, require us to change our business practices, cause us to divert management’s attention and our resources, and be damaging to our brand, reputation, and business. In addition, privacy advocates and industry groups may propose new and different self-regulatory standards that either legally or contractually apply to us. We cannot yet determine the impact such future standards may have on our business.
We are or may also subject to the terms of our external and internal privacy and security policies, codes, representations, certifications, industry standards, publications and frameworks (“Privacy Policies”) and contractual obligations to third parties related to privacy, data protection, and information security and Processing, including contractual obligations to indemnify and hold harmless third parties from the costs or consequences of non-
compliance with Data Protection Laws or other obligations (“Data Protection Obligations”). Our solutions depend in part on our ability to use data that we obtain in connection with our offerings, and our ability to use this data may be subject to restrictions in our commercial agreements and subject to the privacy policies of the entities that provide us with this data. Our service providers or our partners’, failure to adhere to these third-party restrictions on data use may result in claims, proceedings or actions against us by our business counterparties or other parties, or other liabilities, including loss of business, reputational damage, and remediation costs, which could adversely affect our business.
We expect that there will continue to be new Data Protection Obligations, and we cannot yet determine the impact such future Data Protection Obligations may have on our business. Any significant change to Data Protection Laws and Data Protection Obligations, including without limitation, regarding the manner in which the express or implied consent of customers for Processing is obtained, could increase our costs and require us to modify our operations, possibly in a material manner, which we may be unable to complete and may limit our ability to store and Process data and operate our business.
Data Protection Laws and data protection worldwide is, and is likely to remain, uncertain for the foreseeable future, and our actual or perceived failure to address or comply with these laws could: increase our compliance and operational costs; limit our ability to market our products or services and attract new and retain current customers; limit or eliminate our ability to Process data; expose us to regulatory scrutiny, actions, investigations, fines and penalties; result in reputational harm; lead to a loss of business result in litigation and liability, including class action litigation; cause to incur significant costs, expenses and fees (including attorney fees); cause a material adverse impact to business operations or financial results, and; otherwise result in other material harm to our business (“Adverse Data Protection Impact”).
We are subject to Data Protection Laws, Privacy Policies and Data Protection Obligations as well as applicable foreign, federal, state, local and municipal laws, regulations and industry standards that relate to electronic communications, intellectual property, eCommerce, competition, price discrimination, consumer protection, taxation, and the use of promotions. We strive to comply with applicable laws, policies, contractual and other legal obligations as well as industry standards of conduct relating to privacy, data security, data protection, marketing and consumer protection to the extent possible, but we may at times fail to do so, or may be perceived to have failed to do so. These obligations and standards of conduct often are complex, vague, and difficult to comply with fully, and it is possible that these obligations and standards of conduct may be interpreted and applied in new ways and/ or in a manner that is inconsistent with each other or that new laws, regulations or other obligations may be enacted.
Moreover, despite our efforts, we may not be successful in achieving compliance if our employees, partners or vendors do not comply with applicable Data Protection Laws, Privacy Policies and Data Protection Obligations. We may be subject to, and suffer a an Adverse Data Protection Impact if we fail (or are perceived to have failed) to comply with applicable Data Protection Laws, Privacy Policies and Data Protection Obligations, or if our Privacy Policies are, in whole or part, found to be inaccurate, incomplete, deceptive, unfair, or misrepresentative of our actual practices. In addition, any such failure or perceived failure could result in public statements against us by consumer advocacy groups, the media or others, which may cause us material reputational harm.Our actual or perceived failure to comply with Data Protection Laws, Privacy Policies and Data Protection Obligations could also subject us to litigation, claims, proceedings, actions or investigations by governmental entities, authorities or regulators, which could result in an Adverse Data Protection Impact, including required changes to our business practices, the diversion of resources and the attention of management from our business, regulatory oversights and audits, discontinuance of necessary Processing, or other remedies that adversely affect our business.
We also expect that there will continue to be new laws, regulations, and industry standards concerning privacy, data protection, and information security proposed and enacted in various jurisdictions. In Europe, the General Data Protection Regulation (2016/679) (“GDPR”) went into effect in May 2018 and introduced strict requirements for Processing the personal data of European Union data subjects. The GDPR applies to us to the extent we Process the personal data of European Union data subjects. Companies that must comply with the GDPR face increased compliance obligations and risk, including more robust regulatory enforcement of data protection requirements, an order prohibiting Processing of European data subject personal data and potential fines for noncompliance of up to €20 million or 4% of the annual global revenues of the noncompliant company, whichever is greater. European data protection laws including the GDPR also generally prohibit the transfer of personal data from Europe, including the EEA, the United Kingdom, and Switzerland, to the United States and most other countries
unless the parties to the transfer have established a legal basis for the transfer and implemented specific safeguards to protect the transferred personal data. One of the primary mechanisms allowing U.S. companies to import personal information from Europe in compliance with the GDPR has been certification to the EU-U.S. Privacy Shield and Swiss-U.S. Privacy Shield frameworks administered by the U.S. Department of Commerce. However, the Court of Justice of the European Union, the “Schrems II” ruling, recently invalidated the EU-U.S. Privacy Shield framework. The Swiss Federal Data Protection and Information Commissioner also recently opined that the Swiss-U.S. Privacy Shield is inadequate for transfers of data from Switzerland to the U.S. Authorities in the United Kingdom, whose data protection laws are similar to those of the European Union, may similarly invalidate use of the EU-U.S. Privacy Shield as mechanisms for lawful personal information transfers from those countries to the United States.
The Schrems II decision also raised questions about whether one of the primary alternatives to the EU-U.S. Privacy Shield, namely, the European Commission’s Standard Contractual Clauses, can lawfully be used for personal information transfers from Europe to the United States or most other countries. At present, there are few, if any, viable alternatives to the EU-U.S. Privacy Shield and the Standard Contractual Clauses (“SCCs”). The European Commission recently proposed updates to the SCCs, and additional regulatory guidance has been released that seeks to imposes additional obligations on companies seeking to rely on the SCCs. As such, any transfers by us or our vendors of personal data from Europe may not comply with European data protection law; may increase our exposure to the GDPR’s heightened sanctions for violations of its cross-border data transfer restrictions and may reduce demand from companies subject to European data protection laws. Additionally, other countries outside of Europe have enacted or are considering enacting similar cross-border data transfer restrictions and laws requiring local data residency, which could increase the cost and complexity of delivering our products and operating our business. Additionally, other countries outside of Europe have enacted or are considering enacting similar cross-border data transfer restrictions and laws requiring local data residency, which could increase the cost and complexity of delivering our services and operating our business. In addition, we may experience reluctance or refusal by European consumers, retailers or CPGs to continue to using our solutions, and we may be at risk of enforcement actions taken by a European data protection authority until we ensure that all applicable data transfers to us from Europe are compliant with the European data protection laws.
Further, following a referendum in June 2016 in which voters in the United Kingdom approved an exit from the EU, the United Kingdom government has initiated a process to leave the EU, known as Brexit. Following December 31, 2020, the GDPR’s data protection obligations continue to apply to the United Kingdom in substantially unvaried form under the so called “UK GDPR” or more explicitly, the GDPR continues to form part of the laws in the United Kingdom by virtue of section 3 of the European Union (Withdrawal) Act 2018, as amended (including by the various Data Protection, Privacy and Electronic Communications (EU Exit) Regulations), which potentially exposes us to two parallel data protection regimes, each of which authorizes fines and the potential for divergent enforcement actions. In addition, it is still unclear whether the transfer of personal data from the EU to the United Kingdom will in the future continue to remain lawful under the GDPR.For example, pursuant to a post-Brexit agreement between the United Kingdom and the EU, the European Commission will continue to treat the United Kingdom as if it remained a member state of the EU in relation to transfers of personal data from the EEA to the United Kingdom, meaning such transfers may be made without a need for additional safeguards, for four months from January 1, 2021, with a potential additional two month extension. This “transition” period, however, will end if and when the European Commission adopts an adequacy decision in respect of the United Kingdom or the United Kingdom amends certain UK data protection laws, or relevant aspects thereof, without the EU’s consent (unless those amendments are made simply to align those UK data protection laws with the EU’s data protection regime). If the European Commission does not adopt an adequacy decision with regard to personal data transfers to the United Kingdom before the expiration of the transition period, from that point onwards, the United Kingdom will be a “third country” under the GDPR and such transfers will need to be made subject to GDPR-compliant safeguards (for example, the Standard Contractual Clauses). With substantial uncertainty over the interpretation and application of how United Kingdom will approach and address GDPR following the transition period, we may face challenges in addressing their requirements and making necessary changes to our policies and practices, and may incur significant costs and expenses in an effort to do so. Any failure or perceived failure by us to comply with applicable laws and regulations or any of our other legal obligations relating to privacy, data protection, or information security may result in governmental investigations or enforcement actions, litigation, claims, or public statements against usAny of the foregoing could result in significant liability or cause our customers to lose trust in us, any of which could have an adverse effect on our reputation, operations, financial performance and business. Furthermore, the costs of compliance with, and other burdens imposed by, the laws, regulations, and policies that are applicable to the
businesses of our customers may limit the adoption and use of, and reduce the overall demand for, our products and services.
In the United States, Data Protection Laws include rules and regulations promulgated under the authority of the Federal Trade Commission, the Electronic Communications Privacy Act, the Computer Fraud and Abuse Act, the California Consumer Privacy Act, or CCPA, and other state and federal laws relating to privacy and data security. The CCPA requires companies that process information on California residents to make new disclosures to consumers about their data collection, use and sharing practices, and allows consumers to opt out of the sale of personal information with third parties and provides a private right of action and statutory damages for data breaches. The CCPA may increase our compliance costs and potential liability. In addition, the California Privacy Rights Act of 2020, or CPRA, is scheduled to take effect on January 1, 2023, and would, among other things, give California residents the ability to limit the use of their sensitive information, provide for penalties for CPRA violations concerning California residents under the age of 16, and establish a new California Privacy Protection Agency to implement and enforce the law. The enactment of the CCPA is prompting a wave of similar legislative developments in other states in the United States, which could create the potential for a patchwork of overlapping but different state laws and could mark the beginning of a trend toward more stringent privacy legislation in the United States, which could increase our potential liability and adversely affect our business, results of operations, and financial condition. Some countries also are considering or have passed legislation requiring local storage and Processing of data, or similar requirements, which could increase the cost and complexity of providing our products and services and other aspects of our business.
We expect that there will continue to be new proposed laws, regulations and industry standards concerning privacy, data protection and information security in the United States and other jurisdictions, and we cannot yet determine the impact such future laws, regulations and standards may have on our business. With laws and regulations in the EU,the United States, and globally imposing new and relatively burdensome obligations, and with substantial uncertainty over the interpretation and application of these and other laws and regulations, there is a risk that the requirements of these laws and regulations, or of contractual or other obligations relating to privacy, data protection, or information security, are interpreted or applied in a manner that is, or is alleged to be, inconsistent with our management and Processing practices, our policies or procedures, or our products and services.For instance, with the increased focus on the use of data for advertising, the anticipation and expectation of future laws, regulations, standards and other obligations could impact us and our existing and potential business partners and delay certain business partnerships or deals until there is greater certainty. In addition, as we expand our data analytics and other data-related product offerings there may be increased scrutiny on our use of data and we may be subject to new and unexpected regulations. Future laws, regulations, standards and other obligations could, for example, impair our ability to collect or use information that we utilize to provide targeted digital promotions and media to consumers, CPGs and retailers, thereby impairing our ability to maintain and grow our total customers and increase revenues. Future restrictions on the collection, use, sharing or disclosure of our users’ data or additional requirementsforexpressorimpliedconsentofusersfortheuseanddisclosureofsuchinformationcouldrequireus to modify our solutions, possibly in a material manner, and could limit our ability to develop or outright prohibit new solutions and features.
We may face challenges in addressing their requirements of any such new laws, regulations, other legal obligations or industry standards, or any changed interpretation of existing laws, regulations or other standards and making necessary changes to our policies and practices, and such changes may require us to incur additional costs and restrict our business operations. Although we endeavor to comply with our Privacy Policies and other privacy-, data protection-, or information security-related obligations, we may at times fail to do so or may be perceived to have failed to do so. Moreover, despite our efforts, we may not be successful in achieving compliance if our employees or vendors to comply with our Privacy Policies and other privacy-, data protection-, or information security-related obligations. Any failure or perceived failure by us to comply with our Privacy Policies and our privacy-, data protection-, or information security-related obligations to customers or other third parties or any of our other legal obligations relating to privacy, data protection, information security, marketing or consumer protection, we may be subject to litigation, regulatory investigations, fines or other liabilities, as well as negative publicity or public statements against us by consumer advocacy groups or others and could result in significant liability or cause a loss of trust in us, which could have an adverse effect on our reputation and business. Furthermore, the costs of compliance with, and other burdens imposed by, the laws, regulations, and policies that are applicable to the businesses of our customers may limit the adoption and use of, and reduce the overall demand for, our products and services. Moreover, if future laws, regulations, other legal obligations or industry standards, or any changed interpretations of the foregoing limit our users’, CPGs’ or retailers’ ability to use and share personally identifiable
information or our ability to store, process and share personally identifiable information or other data, demand for our solutions could decrease, our costs could increase, our revenue growth could slow, and our business, financial condition and operating results could beharmed.
Additionally, if third parties we work with, such as vendors or developers, violate Data Protection Laws, Privacy Policies and Data Protection Obligations, such violations may also put our customers’ content at risk and could in turn have an adverse effect on our business. Any significant change to Data Protection Laws, Data Protection Obligations, or industry practices regarding the collection, use, retention, security, or disclosure of our customers’ content, or regarding the manner in which the express or implied consent of customers for the collection, use, retention, or disclosure of such content is obtained, could increase our costs and require us to modify our products and services, possibly in a material manner, which we may be unable to complete and may limit our ability to store and Process customer data or develop new applications and features.
We may be required to record a significant charge to earnings if our goodwill or amortizable intangible assets become impaired.
We are required under GAAP to review our amortizable intangible assets for impairment when events or changes in circumstances indicate the carrying value may not be recoverable. Goodwill is required to be tested for impairment at least annually. Conditions that would necessitate an impairment assessment include a significant decline in the observable market value of an asset, a significant change in the extent or manner in which an asset is used, or any other significant adverse change that would indicate that the carrying amount of an asset or group of assets may not be recoverable. The events and circumstances we consider include the business climate, legal factors, operating performance indicators and competition. In the future we may be required to record a significant charge to earnings in our consolidated financial statements during the period in which any impairment of our goodwill or amortizable intangible assets is determined. This could adversely impact our results of operations and harm our business.
Changes to financial accounting standards or the SEC’s rules and regulations may affect our financial statements and cause us to change our business practices.
We prepare our financial statements to conform to U.S. GAAP. These accounting principles are subject to interpretation by the FASB, American Institute of Certified Public Accountants (“AICPA”), the SEC and various bodies formed to interpret and create appropriate accounting policies. A change in those policies can have a significant effect on our reported results and may affect our reporting of transactions completed before a change is announced. Changes to those rules or the questioning of current practices may adversely affect our reported financial results or the way we conduct our business. For example, in August 2020, the FASB issued a new standard ASU 2020-06, Accounting for Convertible Instruments and Contracts in an Entity’s Own Equity, which generally requires companies to report our convertible debt instrument as a single liability instrument with no separate accounting for the embedded conversion features. Additionally, this ASU amends the diluted earnings per share calculation for convertible instruments by requiring the use of the if-converted method. The treasury stock method is no longer available. This new standard is effective for fiscal years beginning after December 15, 2021. Early adoption is permitted for interim and annual reporting periods beginning after December 15, 2020.
If we fail to maintain an effective system of disclosure controls and internal control over financial reporting, our ability to produce timely and accurate financial statements or comply with applicable regulations could be impaired.
We are subject to the reporting requirements of the Exchange Act, SOX, and the rules and regulations of the New York Stock Exchange, or the NYSE. We expect that the requirements of these rules and regulations will continue to increase our legal, accounting and financial compliance costs, make some activities more difficult, time consuming and costly, and place significant strain on our personnel, systems and resources.
SOX requires, among other things, that we maintain effective disclosure controls and procedures and internal control over financial reporting. We are continuing to develop and refine our disclosure controls and other procedures that are designed to ensure that information required to be disclosed by us in the reports that we will file with the SEC is recorded, processed, summarized and reported within the time periods specified in SEC rules and forms, and that information required to be disclosed in reports under the Exchange Act is accumulated and communicated to our principal executive and financial officers. We are also continuing to improve our internal
control over financial reporting. In order to maintain and improve the effectiveness of our disclosure controls and procedures and internal control over financial reporting, we have expended, and anticipate that we will continue to expend, significant resources, including accounting-related costs and significant management oversight. Any failure to implement and maintain effective internal control over financial reporting also could adversely affect the results of periodic management evaluations and annual independent registered public accounting firm attestation reports regarding the effectiveness of our internal control over financial reporting that we will be required to include in our periodic reports we will file with the SEC under Section 404 of SOX. In the event that we are not able to demonstrate compliance with Section 404 of SOX, that our internal control over financial reporting is perceived as inadequate or that we are unable to produce timely or accurate financial statements, investors may lose confidence in our operating results and our stock price could decline.
Our current controls and any new controls that we develop may become inadequate because of changes in conditions in our business. Further, weaknesses in our disclosure controls or our internal control over financial reporting may be discovered in the future. Any failure to develop or maintain effective controls, or any difficulties encountered in their implementation or improvement, could harm our operating results or cause us to fail to meet our reporting obligations and could result in a restatement of our financial statements for prior periods. Any failure to implement and maintain effective internal control over financial reporting also could adversely affect the results of management evaluations and independent registered public accounting firm audits of our internal control over financial reporting that we will eventually be required to include in our periodic reports that will be filed with the SEC. Ineffective disclosure controls and procedures and internal control over financial reporting could also cause investors to lose confidence in our reported financial and other information, which would likely have a negative effect on the trading price of our common stock. In addition, if we are unable to continue to meet these requirements, our common stock may not be able to remain listed on the NYSE.
Any failure to maintain effective disclosure controls and internal control over financial reporting could have a material and adverse effect on our business and operating results, and cause a decline in the price of our common stock.
State and foreign laws regulating money transmission could impact our rebates solutions.
Many states and certain foreign jurisdictions impose license and registration obligations on those companies engaged in the business of money transmission, with varying definitions of what constitutes money transmission. If our rebates solutions were to subject us to any applicable state or foreign laws, it could subject us to increased compliance costs and delay our ability to offer this product in certain jurisdictions pending receipt of any necessary licenses or registrations. If we need to make product and operational changes in light of these laws, the growth and adoption of these products may be adversely impacted, and our revenues may negatively affected.
Our ability to use our net operating losses to offset future taxable income may be subject to certain limitations.
In general, under Section 382 of the U.S. Internal Revenue Code of 1986, as amended, or the Code, and similar state law provisions, a corporation that undergoes an “ownership change” is subject to limitations on its ability to utilize its pre-change net operating losses, or NOLs, to offset post-change taxable income. If we have experienced an ownership change our existing NOLs may be subject to limitations under Section 382 of the Code. Future changes in our stock ownership, some of which are outside of our control, also could result in an ownership change under Section 382 of the Code. Additionally, our NOLs arising in tax years beginning prior to January 1, 2018 are subject to expiration and may expire prior to being utilized. Under the Tax Act, as modified by the CARES Act, NOLs arising in tax years beginning after December 31, 2017, are not subject to expiration and may be carried forward indefinitely, but the deductibility of such NOLs in tax years beginning after December 31, 2020, is limited to 80% of taxable income. It is uncertain if and to what extent various states will conform to the Tax Act or the CARES Act. There is also a risk that our NOLs could otherwise be unavailable to offset future income tax liabilities due to changes in the law, including regulatory changes, such as suspensions on the use of NOLs or other unforeseen reasons. In addition, at the state level, there may be periods during which the use of net operating loss carryforwards is suspended or otherwise limited, which could accelerate or permanently increase state taxes owed. We do not expect this to have a material impact on our financials because we currently maintain a full valuation allowance on our U.S. deferred tax assets. For these reasons, we may not be able to utilize all of our NOLs, even if we attain profitability.
Changes in the U.S. and foreign tax law or challenges by taxing authorities of the jurisdictions in which we operate could increase our worldwide effective tax rate and have a negative effect on our financial position and results of operations.
Changes in the U.S. taxation of international activities may increase our worldwide effective tax rate and harm our financial condition and results of operations. The taxing authorities of the jurisdictions in which we operate may challenge our methodologies for valuing developed technology or intercompany arrangements, including our transfer pricing, or determine that the manner in which we operate our business does not achieve the intended tax consequences, which could increase our worldwide effective tax rate and harm our financial position and results of operations. Significant judgment will be required in evaluating our tax positions and determining our provision for income taxes. During the ordinary course of business, there will be many transactions and calculations for which the ultimate tax determination is uncertain. As we expand our business to operate in numerous taxing jurisdictions, the application of tax laws may be subject to diverging and sometimes conflicting interpretations by tax authorities of these jurisdictions. It is not uncommon for taxing authorities in different countries to have conflicting views. In addition, tax laws are dynamic and subject to change as new laws are passed and new interpretations of the law are issued or applied. New income, sales, use or other tax laws, statutes, rules, regulations or ordinances could be enacted at any time, which could adversely affect our business operations and financial performance.
Further, existing tax laws, statutes, rules, regulations or ordinances could be interpreted, changed, modified or applied adversely to us. For example, legislation enacted in 2017, informally titled the Tax Cuts and Jobs Act, or the Tax Act, enacted many significant changes to the U.S. tax laws. Future guidance from the Internal Revenue Service and other tax authorities with respect to the Tax Act may affect us, and certain aspects of the Tax Act could be repealed or modified in future legislation. For example, the Coronavirus Aid, Relief, and Economic Security Act, or the CARES Act, modified certain provisions of the Tax Act. In addition, it is uncertain if and to what extent various states will conform to the Tax Act, the CARES Act, or any newly enacted federal tax legislation. Changes in corporate tax rates, the realization of net deferred tax assets relating to our operations, the taxation of foreign earnings, and the deductibility of expenses under the Tax Act or future reform legislation could have a material impact on the value of our deferred tax assets, could result in significant one-time charges, and could increase our future U.S. income tax expense.
Risks Related to Our Platforms, Technology and Intellectual Property
If our security measures or information we collect and maintain are compromised or publicly exposed, CPGs, retailers and consumers may curtail or stop using our platforms and we could be subject to claims, penalties and fines.
We collect, receive, store, process, generate, use, transfer, disclose, make accessible, protect, secure, dispose of and share (“Process” or “Processing”) data about consumers, including personally identifiable information or personal data, as well as other confidential or proprietary information necessary to operate our business, for legal and marketing purposes, and for other business-related purposes.
While we and our third-party service providers have implemented security measures designed to protect against security breaches, like all businesses that use computer systems and the Internet, our security measures, as well as those of companies we may acquire and our third-party service providers and partners, could fail or may be insufficient, resulting in the unauthorized disclosure, modification, misuse, unavailability, destruction, or loss of our or our customers’ data or other sensitive information. Any security breach of our operational systems, physical facilities, or the systems of our third-party partners, or the perception that one has occurred, could result in litigation, indemnity obligations, regulatory enforcement actions, investigations, fines, penalties, mitigation and remediation costs, disputes, reputational harm, diversion of management’s attention, and other liabilities and damage to our business. Even though we do not control the security measures of third parties, we may be responsible for any breach of such measures or suffer reputational harm even where we do not have recourse to the third party that caused the breach. In addition, any failure by our retail partners or other third-party partners to comply with applicable law or regulations could result in proceedings against us by governmental entities or others.
Cyberattacks, denial-of-service attacks, ransomware attacks, business email compromises, computer malware, viruses, social engineering (including phishing) and other malicious internet-based activity are prevalent in our industry and our customers and partners’ industries and continue to increase. In addition, we may experience attacks, unavailable systems, unauthorized access or disclosure due to employee or other theft or misuse, denial-of-service attacks, sophisticated attacks by nation-state and nation-state supported actors, and advanced persistent
threat intrusions. Despite our efforts to ensure the security, privacy, integrity, confidentiality, availability, and authenticity information technology networks and systems, Processing and information, we may not be able to anticipate or to implement effective preventive and remedial measures against all data security and privacy threats. We cannot guarantee that the recovery systems, security protocols, network protection mechanisms and other security measures that we have integrated into our systems, networks and physical facilities, which are designed to protect against, detect and minimize security breaches, will be adequate to prevent or detect service interruption, system failure data loss or theft, or other material adverse consequences. No security solution, strategy, or measures can address all possible security threats or block all methods of penetrating a network or otherwise perpetrating a security incident. The risk of unauthorized circumvention of our security measures or those of our third-party providers, clients and partners has been heightened by advances in computer and software capabilities and the increasing sophistication of hackers who employ complex techniques, including without limitation, the theft or misuse of personal and financial information, counterfeiting, “phishing” or social engineering incidents, ransomware, extortion, publicly announcing security breaches, account takeover attacks, denial or degradation of service attacks, malware, fraudulent payment and identity theft. The techniques used to sabotage, disrupt or to obtain unauthorized access to our applications, systems, networks, or physical facilities in which data is stored or through which data is transmitted change frequently, and we may be unable to implement adequate preventative measures or stop security breaches while they are occurring. The recovery systems, security protocols, network protection mechanisms and other security measures that we have integrated into our applications, systems, networks and physical facilities, which are designed to protect against, detect and minimize security breaches, may not be adequate to prevent or detect service interruption, system failure or data loss. Our applications, systems, networks, and physical facilities could be breached or personal information could be otherwise compromised due to employee error or malfeasance, if, for example, third parties attempt to fraudulently induce our employees, customers or partners to disclose information or user names and/or passwords, or otherwise compromise the security of our networks, systems and/or physical facilities. Third parties may also exploit vulnerabilities in, or obtain unauthorized access to, platforms, applications, systems, networks and/or physical facilities utilized by our vendors. We have and may in the future become the target of cyber-attacks by third parties seeking unauthorized access to our or our customers or partners’ data or to disrupt our operations or ability to provide our services. While we have been successful in preventing such unauthorized access and disruption in the past, we may not continue to be successful against these or other attacks in the future.
Due to the COVID-19 pandemic, our employees are temporarily working remotely, which may pose additional data security risks. If we, or our service providers and partners, experience compromises to security that result in performance or availability problems, the complete shutdown of one or more of our platforms, digital properties and mobile applications, or the misuse, loss or unauthorized access to or disclosure of confidential information, personally identifiable information, or other personal or proprietary data, CPGs, retailers, and consumers may lose trust and confidence in us and decrease their use of our platforms or stop using our platforms entirely. Such compromises to personal or sensitive information or proprietary data could lead to litigation or other adversarial actions by business partners such as retailers or consumers.
The costs to respond to a security breach and/or to mitigate any security vulnerabilities that may be identified could be significant, our efforts to address these problems may not be successful, and these problems could result in unexpected interruptions, delays, cessation of service, negative publicity, and other harm to our business and our competitive position.We could be required to fundamentally change our business activities and practices in response to a security breach or related regulatory actions or litigation, which could have an adverse effect on our business.
We have contractual and legal obligations to notify relevant stakeholders of security breaches. Most jurisdictions have enacted laws requiring companies to notify individuals, regulatory authorities, and others of security breaches involving certain types of data. In addition, our agreements with certain customers and partners may require us to notify them in the event of a security breach involving customer or partner data on our systems or those of subcontractors Processing customer or partner data on our behalf. Such mandatory disclosures are costly, could lead to negative publicity, may cause our customers to lose confidence in the effectiveness of our security measures, and require us to expend significant capital and other resources to respond to or alleviate problems caused by the actual or perceived security breach may cause us to breach customer contracts. Depending on the facts and circumstances of such an incident, these damages, penalties and costs could be significant and may not be covered by insurance or could exceed our applicable insurance coverage limits. Such an event also could harm our reputation and result in litigation against us. Any of these results could materially adversely affect our financial performance. Our agreements with certain customers may require us to use industry-standard, reasonable, or other
specified measures to safeguard sensitive personal information or confidential information, and any actual or perceived breach of such measures may increase the likelihood and frequency of customer audits under our agreements, which is likely to increase the costs of doing business. An actual or perceived security breach could lead to claims by our customers, or other relevant stakeholders that we have failed to comply with such legal or contractual obligations. As a result, we could be subject to legal action or our customers could end their relationships with us. There can be no assurance that any limitations of liability in our contracts, which we have in certain agreements, would be enforceable or adequate or would otherwise protect us from liabilities or damages.
Litigation resulting from security breaches may adversely affect our business. Unauthorized access to our applications, systems, networks, or physical facilities could result in litigation with our customers or other relevant stakeholders. These proceedings could force us to spend money in defense or settlement, divert management’s time and attention, increase our costs of doing business, or adversely affect our reputation. We could be required to fundamentally change our business activities and practices or modify our business and operational capabilities in response to such litigation, which could have an adverse effect on our business. If a security breach were to occur, and the confidentiality, integrity or availability of our data or the data of our partners or our customers was disrupted, we could incur significant liability, or our applications, systems, or networks may be perceived as less desirable, which could negatively affect our business and damage our reputation.
If we fail to detect or remediate a security breach in a timely manner, or a breach otherwise affects a large amount of data of one or more customers or partners, or if we suffer a cyberattack that impacts our ability to operate our applications, systems, or networks, we may suffer material damage to our reputation, business, financial condition, and results of operations. Further, we may not have adequate insurance coverage for security incidents or breaches, including fines, judgments, settlements, penalties, costs, attorney fees and other impacts that arise out of incidents or breaches. Depending on the facts and circumstances of such an incident, the damages, penalties and costs could be significant and may not be covered by insurance or could exceed our applicable insurance coverage limits. If the impacts of a security incident or breach, or the successful assertion of one or more large claims against us that exceeds our available insurance coverage, or results in changes to our insurance policies (including premium increases or the imposition of large deductible or co-insurance requirements), it could have an adverse effect on our business. In addition, we cannot be sure that our existing insurance coverage and coverage for errors and omissions will continue to be available on acceptable terms or that our insurers will not deny coverage as to all or part of any future claim or loss. Our risks are likely to increase as we continue to expand our applications, systems, or networks, grow our customer base, and Process, store, and transmit increasingly large amounts of proprietary and sensitive data.
Remediation of any potential cyber security breach may involve significant time, resources, and expenses, whichmayresultinpotentialregulatoryinquiries,litigationorotherinvestigations,andcanaffectourfinancialand operationalcondition.
Our ability to generate revenue depends on the collection, reliability, and use of significant amounts of data from various sources, which may be restricted by consumer choice, restrictions imposed by retailers, publishers and browsers or other software developers, changes in technology, and new developments in laws, regulations and industry requirements or standards.
Our ability to deliver our solutions depends on our ability to successfully leverage data, including data that we collect from consumers, data we receive from retailers and other parties, and data from our own operating history. Using loyalty card numbers both on-line and in-store, device identifiers (including Google AdID and Apple IDFA), cookies, and other tracking technologies, we, our retail partners and other data providers collect information about the interactions of consumers with our retail partners’ digital properties and in-store, our owned and operated properties, and certain other publisher sites and mobile applications, as well as other data such as location. We may enhance this data with other data, such as demographic information that we obtain from data providers. Our ability to successfully leverage such data depends on our continued ability to access and use such data, which can be restricted by a number of factors, including consumer choice, the success in obtaining consumer consent, restrictions imposed by our retail and other data partners or other third parties, publishers and web browser developers or other software developers, changes in technology, including changes in web browser technology, and new developments in, or new interpretations of laws, regulations and industry standards. For example, Apple has recently announced several changes to iOS that will require consumers to opt-in to sharing data with publisher sites and app, which may adversely impact our business. Consumer resistance to the collection and sharing of the data used to deliver targeted advertising, increased visibility of consent or “do not track” mechanism as a result of
industry regulatory and/or legal developments, the adoption by consumers of browsers settings or “ad-blocking” software and the development and deployment of new technologies could materially impact our ability to collect data or reduce our ability to deliver relevant promotions or media, which could materially impair the results of our operations. See the risk factor below titled “Our business is subject to complex and evolving laws, regulations and industry standards, and unfavorable interpretations of, or changes in, or failure by us to comply with these laws, regulations and industry standards could substantially harm our business and results of operations” for additional information.
In addition, unfavorable publicity and negative public perception about our industry or data collection and use could adversely affect our business and operating results. With the growth of online advertising and eCommerce, there is increasing awareness and concern among the general public, privacy advocates, mainstream media, governmental bodies and others regarding marketing, advertising, and privacy matters, particularly as they relate to individual privacy interests. Any unfavorable publicity or negative public perception about our use of data or other data focused industries could affect our business and results of operations, and may lead digital publishers like Facebook to change their business practices, or trigger additional regulatory scrutiny or lawmaking that affects us. Negative public attention could cause CPGs or our retail partners to discontinue using our targeted advertising solutions and limit our ability to measure campaigns delivered through our platforms. This public scrutiny may also lead to general distrust of data and marketing companies, consumer reluctance to share and permit use of personal data and increased consumer opt-out rates, any of which could negatively influence, change or reduce our current and prospective customers’ demand for our products and services and adversely affect our business and operating results.
If the use of mobile device identifiers, third-party cookies or other tracking technology is rejected by consumers, restricted by third parties outside of our control, or otherwise subject to unfavorable regulation, our performance could decline and we could lose customers and revenue.
We and our third-party partners might use a number of technologies to collect information used to deliver our solutions. For instance, mobile device identifiers such as Apple IDFA and Google AdID help us and our third-party partners identify, target and measure relevant promotions and media to consumers. Advertising shown on mobile applications can also be affected by blocking or restricting use of mobile device identifiers. Data regarding interactions between users and devices are tracked mostly through stable, pseudonymous advertising identifiers that are built into the device operating system with privacy controls that allow users to express a preference with respect to data collection for advertising, including to disable the identifier. These identifiers and privacy controls are defined by the developers of the platforms through which the applications are accessed and could be changed by the platforms in a way that may negatively impact our business. For example, Apple announced early 2020 that it will require user opt-in before permitting access to Apple’s unique identifier, or IDFA. Apple initially targeted fall of 2020 for implementing these changes but has pushed that date out to early this year. This shift from enabling user opt-out to an opt-in requirement is likely to have a substantial impact on the mobile advertising ecosystem and could harm our growth in this channel.
We also use small text files (referred to as "cookies"), placed through an Internet browser on a consumer's machine which corresponds to a data set that we keep on our servers, to gather important data to help deliver our solution. Certain of our cookies, including those that we predominantly use in delivering our solution through Internet browsers, are known as "third-party" cookies because they are delivered by third parties rather than by us. Our cookies collectinformation, such as when a consumer views an advertisement, clicks on an advertisement, or visits one of our advertisers' websites. In some countries, including countries in the European Economic Area, and certain states within the United States, such as California, this information may be considered personal information under applicable data protection laws. When a consumer interacts with our solutions on a mobile device, we may also obtain location-based information about the user's device through our cookies or other tracking technologies. We use these technologies to achieve our customers' campaign goals, to ensure that the same consumer does not unintentionally see the same media too frequently, to report aggregate information to our customers regarding the performance of their digital promotions and marketing campaigns, and to detect and prevent fraudulent activity throughout our network. We also use data from cookies to help us decide whether and how much to bid on an opportunity to place an advertisement in a certain Internet location and at a given time in front of a particular consumer. A lack of data associated with or obtained from third-party cookies may detract from our ability to make decisions about which inventory to purchase for a customer's campaign and may adversely affect the effectiveness of our solution and harm our business.
Cookies may be deleted or blocked by consumers. The most commonly used Internet browsers (including Chrome, Firefox, and Safari) allow their users to prevent cookies from being accepted by their browsers. Consumers can also delete cookies from their computers. Some consumers also download "ad blocking" software that prevents cookies from being stored on a user's computer. If more consumers adopt these settings or delete their cookies more frequently than they currently do, our business could be negatively affected. In addition, certain web browsers may block third-party cookies by default, and other browsers may do so in the future. Unless such default settings in browsers are altered by consumers to permit the placement of third-party cookies, we would be able to set fewer of our cookies in users’ browsers, which could adversely affect our business. In addition, companies such as Google have publicly disclosed their intention to move away from cookies to another form of persistent unique identifier, or ID, to identify individual consumers or Internet-connected devices in the bidding process on advertising exchanges. If companies do not use shared IDs across the entire ecosystem, this could have a negative impact on our ability to find the same user across different web properties,and reduce the effectiveness of our solution.
In addition, in the European Union, or EU, Directive 2009/136/EC, commonly referred to as the "Cookie Directive," directs EU member states to ensure that collecting information on a consumer's computer, such as through a cookie, is allowed only if the consumer has appropriately given his or her prior freely given, specific, informed and unambiguous consent. Similarly, this Directive, which also contains specific rules for the sending of marketing communications, limits the use of marketing texts messages and e-mails. Additionally, an e-Privacy Regulation, which will replace the Cookie Directive with requirements that could be stricter in certain respects, apply directly to activities within the EU without the need to be transposed in each Member State’s Law, and could impose stricter requirements regarding the use of cookies and marketing e-mails and text messages and additional penalties for noncompliance, has been proposed, although at this time it is unclear whether it will be approved as it is currently drafted or when its requirements will be effective. We may experience challenges in obtaining appropriate consent to our use of cookies from consumers or to send marketing communications to consumers within the EU, which may affect our ability to run promotions and our operating results and business in European markets, and we may not be able to develop or implement additional tools that compensate for the lack of data associated with cookies. Moreover, even if we are able to do so, such additional tools may be subject to further regulation, time consuming to develop or costly to obtain, and less effective than our current use of cookies.
We allow our clients to utilize application programming interfaces ("APIs"), with our platform, which could result in outages or security breaches and negatively impact our business, financial condition and results of operations.
The use of APIs by our customers and retail partners have significantly increased in recent years. Our APIs allow customers and retail partners to integrate their own business system with our platforms. The increased use of APIs increases security and operational risks to our systems, including the risk for intrusion attacks, data theft, or denial of service attacks. Furthermore, while APIs allow greater ease and power in accessing our platform, they also increase the risk of overusing our systems, potentially causing outages. While we have taken measures intended to decrease security and outage risks associated with the use of APIs, we cannot guarantee that such measures will be successful. Our failure to prevent outages or security breaches resulting from API use could result in government enforcement actions against us, claims for damages by consumers and other affected individuals, costs associated with investigation and remediation damage to our reputation and loss of goodwill, any of which could harm our business, financial condition and results of operations.
Our business relies in part on electronic messaging, including emails and SMS text messages, and any technical, legal or other restrictions on the sending of electronic messages or an inability to timely deliver such communications could harm our business.
Our business is in part dependent upon electronic messaging. We provide emails, mobile alerts and other messages to consumers informing them of the digital coupons on our websites, and we believe these communications help generate a significant portion of our revenues. We also use electronic messaging, in part, as part of the consumer sign-up and verification process. Because electronic messaging services are important to our business, if we are unable to successfully deliver electronic messages to consumers, if there are legal restrictions on delivering these messages to consumers, or if consumers do not or cannot open our messages, our revenues and profitability could be adversely affected. Changes in how webmail applications or other email management tools organize and prioritize email may result in our emails being delivered or routed to a less prominent location in a consumer’s inbox or viewed as “spam” by consumers and may reduce the likelihood of that consumer opening our emails. Actions taken by third parties that block, impose restrictions on or charge for the delivery of electronic
messages could also harm our business. From time to time, Internet service providers or other third parties may block bulk email transmissions or otherwise experience technical difficulties that result in our inability to successfully deliver emails or other messages to consumers.
Changes in laws or regulations, or changes in interpretations of existing laws or regulations, including the Telephone Consumer Protection Act ("TCPA") in the United States and laws regarding commercial electronic messaging in other jurisdictions, that would limit our ability to send such communications or impose additional requirements upon us in connection with sending such communications could also adversely impact our business. For example, the Federal Communications Commission amended certain of its regulations under the TCPA in recent years in a manner that could increase our exposure to liability for certain types of telephonic communication with customers, including but not limited to text messages to mobile phones. Under the TCPA, plaintiffs may seek actual monetary loss or statutory damages per violation, whichever is greater, and courts may treble the damage award for willful or knowing violations. Given the enormous number of communications we send to consumers, the actual or perceived improper sending of communications or a determination that there have been violations of the TCPA or other communications-based statutes could subject us to potential risks including liabilities or claims relating to consumer protection laws and expose us to significant damage awards that could, individually or in the aggregate, materially harm our business. Moreover, even if we prevail, such litigation against us could impose substantial costs and divert our management’s attention and resources.
We also rely on social networking messaging services to send communications. Changes to these social networking services’ terms of use or terms of service that limit promotional communications, restrictions that would limit our ability or our customers’ ability to send communications through their services, disruptions or downtime experienced by these social networking services or reductions in the use of or engagement with social networking services by customers and potential customers could also harm our business.
We rely on a third-party service for the delivery of daily emails and other forms of electronic communication, and delay or errors in the delivery of such emails or other messaging we send may occur and be beyond our control, which could damage our reputation or harm our business, financial condition and operating results. If we were unable to use our current electronic messaging services, alternate services are available; however, we believe our sales could be impacted for some period as we transition to a new provider, and the new provider may be unable to provide equivalent or satisfactory electronic messaging service. Any disruption or restriction on the distribution of our electronic messages, termination or disruption of our relationship with our messaging service providers, including our third-party service that delivers our daily emails, or any increase in our costs associated with our email and other messaging activities could harm our business.
Our business depends on our ability to maintain and scale the network infrastructure necessary to operate our platforms, including our websites and mobile applications, and any significant disruption in service could result in a loss of CPGs, retailers and consumers.
We deliver digital promotions and media via our platforms, including over our websites and mobile applications, as well as through those of our CPGs and retailers and our publishers and other third parties. Our reputation and ability to acquire, retain and serve CPGs and retailers, as well as consumers who use digital promotions or view media on our platforms are dependent upon the reliable performance of our platforms. As the number of our CPG customers, retailers and consumers and the number of digital promotions, digital media and information shared through our platforms continue to grow, we will need an increasing amount of network capacity and computing power. Our technology infrastructure and platforms are hosted across two data centers in co-location facilities in California and Virginia. We have spent and expect to continue to spend substantial amounts in our data centers and equipment and related network infrastructure to handle the traffic on our platforms. The operation of these systems is expensive and complex and could result in operational failures. In the event that the number of transactions or the amount of traffic on our platforms grows more quickly than anticipated, we may be required to incur significant additional costs. In addition, as we scale, we must continually invest in our information technology, and continue to invest in information security, infrastructure and automation. Deployment of new software or processes may adversely affect the performance of our services and harm the customer experience. If we fail to support our platforms or provide a strong customer experience, our ability to retain and attract customers may be negatively affected. Interruptions in these systems or service disruptions, whether due to system failures, computer viruses, malware, ransomware, denial of service attacks, attempts to degrade or disrupt services, or physical or electronic break-ins, could affect the security or availability of our websites and platforms, and prevent CPGs, retailers or consumers from accessing our platforms. A substantial portion of our network infrastructure is hosted by third-party providers. Any disruption in these services or any failure of these providers to handle existing or
increased traffic could significantly harm our business. Any financial or other difficulties these providers face may adversely affect our business, and we exercise little control over these providers, which increases our vulnerability to problems with the services they provide. If we do not maintain or expand our network infrastructure successfully or if we experience operational failures, we could lose current and potential CPGs, retailers and consumers, which could harm our operating results and financial condition.
We currently have not experienced disruptions to our network or operations as a result of COVID-19 but there are no guarantees there will not be disruptions in the future.
We are dependent on technology systems and electronic communications networks that are supplied and managed by third parties, which could result in our inability to prevent or respond to disruptions in our services.
Our ability to provide services to consumers depends on our ability to communicate with CPGs, retailers and consumers through the public Internet and electronic networks that are owned and operated by third parties. Our solutions and services also depend on the ability of our users to access the public Internet. In addition, in order to provide services promptly, our computer equipment and network servers must be functional 24 hours per day, which requires access to telecommunications facilities managed by third parties and the availability of electricity, which we do not control. Severe disruptions, outages, defects, or other security performance and quality problems with one or more of these networks, including as a result of utility or third-party system interruptions, or any material change in our contractual and other business relationships with third-party providers could impair our ability to process information, which could impede our ability to provide digital promotions and media to consumers, harm our reputation, increase expenses, including significant, unplanned capital investments and/or contractual obligations, result in a loss of consumers or CPGs and retailers, any of which could adversely affect our business, financial condition, and operating results.
For example, currently, as a result of work and travel restrictions related to the ongoing COVID-19 pandemic, all of our employees are working remotely and dependent upon their respective internet service providers to be able to access the internet, our systems and systems of our service providers. In other words, our business workflows now rely on availability of residential broadband bandwidth as well as connectivity which is currently under considerable strain. If the residential broadband and internet access break down under strain, our business and operations would be negatively affected.
We may not be able to adequately protect our intellectual property rights.
We regard our trademarks, service marks, copyrights, patents, trade dress, trade secrets, proprietary technology, and similar intellectual property as critical to our success.
We strive to protect our intellectual property rights in a number of jurisdictions, a process that is expensive and may not be successful or which we may not pursue in every location. We strive to protect our intellectual property rights by relying on federal, state and common law rights, contractual restrictions as well as rights provided under foreign laws. These laws are subject to change at any time and could further restrict our ability to protect our intellectual property rights.
We also may not be able to acquire or maintain appropriate domain names in all countries in which we do business. Furthermore, regulations governing domain names may not protect our trademarks and similar proprietary rights. We may be unable to prevent third parties from acquiring domain names that are similar to, infringe upon, or diminish the value of our trademarks and other proprietary rights.
We typically enter into confidentiality and invention assignment agreements with our employees and contractors, and confidentiality agreements with parties with whom we conduct business in order to limit access to, and disclosure and use of, our proprietary information. Also, from time to time, we make our intellectual property rights available to others under license agreements. However, these contractual arrangements and the other steps we have taken to protect our intellectual property may not prevent the misappropriation or disclosure of our proprietary information, infringement of our intellectual property rights or deter independent development of similar technologies by others and may not provide an adequate remedy in the event of such misappropriation or infringement. Third parties that license our proprietary rights also may take actions that diminish the value of our proprietary rights or reputation.
Obtaining and maintaining effective intellectual property rights is expensive, including the costs of defending our rights. Even where we have such rights, they may be later found to be unenforceable or have a limited scope of enforceability. We may not be able to discover or determine the extent of any unauthorized use of our proprietary rights. Litigation may be necessary to enforce our intellectual property rights, protect our respective trade secrets or determine the validity and scope of proprietary rights claimed by others. Any litigation of this nature, regardless of outcome or merit, could result in substantial costs and diversion of management and technical resources, any of which could adversely affect our business and operating results. If we fail to maintain, protect and enhance our intellectual property rights, our business and operating results may be negatively affected.
We may be accused of infringing intellectual property rights of third parties.
Other parties may claim that we infringe their proprietary rights. We are, have been subject to, and expect to continue to be subject to, claims and legal proceedings regarding alleged infringement by us of the intellectual property rights of third parties. Such claims, whether or not meritorious, may result in the expenditure of significant financial and managerial resources, injunctions against us, or the payment of damages, including to satisfy indemnification obligations. We may need to obtain licenses from third parties who allege that we have infringed their rights, but such licenses may not be available on terms acceptable to us or at all. In addition, we may not be able to obtain or utilize on terms that are favorable to us, or at all, licenses or other rights with respect to intellectual property we do not own. These risks have been amplified by the increase in third parties whose sole or primary business is to assert such claims.
We may be unable to continue to use the domain names that we use in our business, or prevent third parties from acquiring and using domain names that infringe on, are similar to, or otherwise decrease the value of our brand or our trademarks or service marks.
We may lose significant brand equity in our “Coupons.com” domain name, our “Quotient.com” domain name, and other valuable domain names. If we lose the ability to use a domain name, whether due to trademark claims, failure to renew an applicable registration, or any other cause, we may be forced to market our products under new domain names, which could cause us substantial harm, or to incur significant expense in order to purchase rights to the domain names in question. In addition, our competitors and others could attempt to capitalize on our brand recognition by using domain names similar to ours. We also may not be able to acquire or maintain appropriate domain names or trademarks in all countries in which we do business. Domain names similar to ours have been registered in the United States and elsewhere. We may be unable to prevent third parties from acquiring and using domain names that infringe on, are similar to, or otherwise decrease the value of our brand or our trademarks or service marks. Protecting and enforcing our rights in our domain names may require litigation, which could result in substantial costs and diversion of management’s attention and harm our business.
Some of our solutions contain open source software, which may pose particular risks to our proprietary software and solutions.
We use open source software in our solutions and will use open source software in the future. From time to time, we may face claims from third parties claiming ownership of, or demanding release of, the open source software and/or derivative works that we developed using such software (which could include our proprietary source code), or otherwise seeking to enforce the terms of the applicable open source license. These claims could result in litigation and could require us to purchase a costly license or cease offering the implicated solutions unless and until we can re-engineer them to avoid infringement. This re-engineering process could require significant additional research and development resources. In addition to risks related to license requirements, use of certain open source software can lead to greater risks than use of third-party commercial software, as open source licensors generally do not provide warranties or controls on the origin of software. Any of these risks could be difficult to eliminate or manage, and, if not addressed, could have a negative effect on our business and operating results.
Risks Related to Ownership of our Common Stock
The market price of our common stock has been, and is likely to continue to be, subject to wide fluctuations and could subject us to litigation.
The price of our common stock may change in response to variations in our operating results and also may change in response to other factors, including factors specific to technology companies, many of which are beyond
our control. As a result, our stock price may experience significant volatility. Among other factors that could affect our stock price are:
•the financial projections that we or analysts may choose to provide to the public, any changes in these projections or our failure for any reason to meet these projections;
•actual or anticipated changes or fluctuations in our results of operations;
•whether our results of operations meet the expectations of securities analysts or investors;
•addition or loss of significant customers or commercial business partners;
•price and volume fluctuations in the overall stock market from time to time;
•fluctuations in the trading volume of our shares or the size of our public float;
•success of competitive products or services;
•the public’s response to press releases or other public announcements by us or others, including our filings with the SEC;
•disputes or other developments related to proprietary rights, including patents, litigation matters or our ability to obtain intellectual property protection for our technologies;
•announcements relating to litigation;
•speculation about our business in the press or the investment community;
•reports, guidance and ratings issued by securities or industry analysts;
•future sales of our common stock by our significant stockholders, officers and directors;
•changes in our capital structure, such as future issuances of debt or equity securities;
•our entry into new markets;
•regulatory developments in the United States or foreign countries;
•strategic actions by us or our competitors, such as acquisitions or restructurings; and
•changes in accounting principles.
If any of the foregoing occurs, it could cause our stock price or trading volume to decline. In addition, the stock market in general has experienced substantial price and volume volatility that is often seemingly unrelated to the operating results of any particular companies. Moreover, if the market for technology stocks or the stock market in general experiences uneven investor confidence, the market price of our common stock could decline for reasons unrelated to our business, operating results or financial condition. The market price for our stock might also decline in reaction to events that affect other companies within, or outside, our industry, even if these events do not directly affect us. Some companies that have experienced volatility in the trading price of their stock have been subject of securities litigation. If we are the subject of such litigation, it could result in substantial costs and a diversion of management’s attention and resources.
Substantial future sales of shares by our stockholders could negatively affect our stock price.
Sales of a substantial number of shares of our common stock in the public market could depress the market price of our common stock and could impair our ability to raise capital through the sale of additional equity securities. We have approximately 91,743,302 shares of common stock outstanding as of December 31, 2020, assuming no exercise of our outstanding options or vesting of our outstanding RSUs.
Our equity incentive plans allow us to issue, among other things, stock options, restricted stock and restricted stock units and we have filed a registration statement under the Securities Act to cover the issuance of shares upon the exercise or vesting of awards granted under those plans.
The concentration of our common stock ownership with our executive officers, directors and owners of 5% or more of our outstanding common stock will limit our ability to influence corporate matters.
Our executive officers, directors and owners of 5% or more of our outstanding common stock together beneficially own approximately 41% of our outstanding common stock, based on the number of shares outstanding as of December 31, 2020. These stockholders therefore have significant influence over management and affairs and over all matters requiring stockholder approval, including the election of directors and significant corporate transactions, such as a merger or other sale of our company or its assets, for the foreseeable future. This concentrated control limits your ability to influence corporate matters and, as a result, we may take actions that our stockholders do not view as beneficial. This ownership could affect the value of your shares of common stock.
Our stock repurchase program could affect the price of our common stock and increase volatility and may be suspended or terminated at any time, which may result in a decrease in the trading price of our common stock.
Our Board of Directors has approved share repurchase programs for us to repurchase shares of our common stock. In April 2019, our Board of Directors authorized a one-year share repurchase program (“May 2019 Program”) for us to repurchase up to $60.0 million of our common stock from May 2019 through May 2020. In August 2019, our Board of Directors authorized a one-year share repurchase program (the “August 2019 Program”) for us to repurchase up to $50.0 million of our common stock from August 2019 through August 2020. In March 2020, we suspended the August 2019 Program, as a precautionary measure to maximize liquidity and increase available cash on hand during this time of uncertainty and the August 2019 Program expired in August 2020. In February 2021, our Board of Directors authorized a one-year share repurchase program (“2021 Program”) for us to repurchase up to $50.0 million of our common stock from February 2021 through February 2022. The 2021 Program could cause the price of our common stock to be higher than it would be in the absence of such a program and could potentially reduce the market liquidity for our common stock. Additionally, repurchases under any stock repurchase program will diminish our cash reserves, which could impact our ability to further develop our technology, access and/or retrofit additional facilities and service our indebtedness. In addition, we may face media or other scrutiny for past and any future stock repurchase programs. There can be no assurance that any stock repurchases will enhance stockholder value because the market price of our common stock may decline below the levels at which we repurchased such shares. Any failure to repurchase shares after we have announced our intention to do so may negatively impact our reputation and investor confidence in us and may negatively impact our stock price. Although our stock repurchase program is intended to enhance long-term stockholder value, short-term stock price fluctuations could reduce the program’s effectiveness.
If securities analysts do not publish research or if securities analysts or other third parties publish inaccurate or unfavorable research about us, the price of our common stock could decline.
The trading market for our common stock will rely in part on the research and reports that securities analysts and other third parties choose to publish about us. We do not control these analysts or other third parties. The price of our common stock could decline if one or more securities analysts downgrade our common stock or if one or more securities analysts or other third parties publish inaccurate or unfavorable research about us or cease publishing reports about us.
We do not intend to pay dividends for the foreseeable future.
We intend to retain all of our earnings for the foreseeable future to finance the operation and expansion of our business and do not anticipate paying cash dividends on our common stock. As a result, you can expect to receive a return on your investment in our common stock only if the market price of the stock increases.
Provisions in our charter documents and under Delaware law could discourage a takeover that stockholders may consider favorable.
Provisions in our certificate of incorporation and by-laws may have the effect of delaying or preventing a change of control or changes in our management. Amongst other things, these provisions:
•authorize the issuance of “blank check” preferred stock that could be issued by our Board of Directors to defend against a takeover attempt;
•establish a classified Board of Directors, as a result of which the successors to the directors whose terms have expired will be elected to serve from the time of election and qualification until the third annual meeting following their election;
•require that directors only be removed from office for cause and only upon a majority stockholder vote;
•provide that vacancies on the Board of Directors, including newly created directorships, may be filled only by a majority vote of directors then in office rather than by stockholders;
•prevent stockholders from calling special meetings; and
•prohibit stockholder action by written consent, requiring all actions to be taken at a meeting of the stockholders.
In addition, we are governed by the provisions of Section 203 of the Delaware General Corporation Law, which generally prohibits a Delaware corporation from engaging in a broad range of business combinations with any “interested” stockholder for a period of three years following the date on which the stockholder becomes an “interested” stockholder.
Risks Related to Our Convertible Senior Notes
We are leveraged financially, which could adversely affect our ability to adjust our business to respond to competitive pressures and to obtain sufficient funds to satisfy our future growth, business needs and development plans.
In November 2017, we issued $200 million aggregate principal amount of convertible senior notes (the “notes”). Our leveraged capital structure could have negative consequences, including, but not limited to, the following:
•we may be more vulnerable to economic downturns, less able to withstand competitive pressures and less flexible in responding to changing business and economic conditions;
•our ability to obtain additional financing in the future for working capital, capital expenditures, acquisitions, general corporate or other purposes may be limited;
•a substantial portion of our cash flow from operations in the future may be required for the payment of the principal amount of our existing indebtedness when it becomes due; and
•we may elect to make cash payments upon any conversion of the convertible notes, which would reduce our cash on hand
Our ability to meet our payment obligations under our notes depends on our ability to generate significant cash flow in the future. This, to some extent, is subject to general economic, financial, competitive, legislative, and regulatory factors as well as other factors that are beyond our control. There can be no assurance that our business will generate cash flow from operations, or that additional capital will be available to us, in an amount sufficient to enable us to meet our debt payment obligations and to fund other liquidity needs. If we are unable to generate sufficient cash flow to service our debt obligations, we may need to refinance or restructure our debt, sell assets, reduce or delay capital investments, or seek to raise additional capital. If we were unable to implement one or more of these alternatives, we may be unable to meet our debt payment obligations, which could have a material adverse effect on our business, results of operations, or financial condition.
The conditional conversion feature of the notes, if triggered, may adversely affect our financial condition and operating results.
In the event the conditional conversion feature of the notes is triggered, holders of the notes will be entitled to convert their notes at any time during specified periods at their option. Upon conversion, we will pay or deliver, as the case may be, cash, shares of our common stock or a combination of cash and shares of our common stock, at our election. If one or more holders elect to convert their notes, (unless we elect to satisfy our conversion obligation by delivering solely shares of our common stock (other than paying cash in lieu of delivering any fractional share)), we intend to settle a portion or all of our conversion obligation in cash, which could adversely affect our liquidity. In addition, even if holders of notes do not elect to convert their notes, we could be required under applicable accounting rules to reclassify all or a portion of the outstanding principal of the notes as a current rather than long-term liability, which would result in a material reduction of our net working capital.
The accounting method for convertible debt securities that may be settled in cash, such as the notes, could have a material effect on our reported financial results.
Under Accounting Standards Codification 470-20, Debt with Conversion and Other Options (“ASC 470-20”), an entity must separately account for the liability and equity components of the convertible debt instruments (such as the notes) that may be settled entirely or partially in cash upon conversion in a manner that reflects the issuer’s economic interest cost. The effect of ASC 470-20 on the accounting for the notes is that the equity component is required to be included in the additional paid-in capital section of stockholders’ equity on our consolidated balance sheet at the issuance date and the value of the equity component would be treated as debt discount for purposes of accounting for the debt component of the notes. As a result, we will be required to record a greater amount of non-cash interest expense as a result of the amortization of the discounted carrying value of the notes to their face amount over the term of the notes. We will report larger net losses (or lower net income) in our financial results because ASC 470-20 will require interest to include both the amortization of the debt discount and the instrument’s nonconvertible coupon interest rate, which could adversely affect our reported or future financial results, the trading price of our common stock and the trading price of the notes.
The Company uses the treasury stock method for calculating any potential dilutive effect of the conversion spread on diluted net income per share, if applicable. The effect of which is that the shares issuable upon conversion of such notes are not included in the calculation of diluted earnings per share except to the extent that the conversion value of such notes exceeds their principal amount. Under the treasury stock method, for diluted earnings per share purposes, the transaction is accounted for as if the number of shares of common stock that would be necessary to settle such excess, if we elected to settle such excess in shares, are issued. We cannot be sure that the accounting standards in the future will continue to permit the use of the treasury stock method. If we are unable or otherwise elect not to use the treasury stock method in accounting for the shares issuable upon conversion of the notes, then our diluted earnings per share could be adversely affected.
Conversion of our notes will dilute the ownership interest of existing stockholders and may depress the price of our common stock.
The conversion of some or all of our notes, if such conversion occurs, will dilute the ownership interests of then-existing stockholders to the extent we deliver shares upon conversion of any of the notes. Any sales in the public market of the common stock issuable upon such conversion could adversely affect prevailing market prices of our common stock. In addition, the existence of the notes may encourage short selling by market participants because the conversion of the notes could be used to satisfy short positions, or anticipated conversion of the notes into shares of our common stock could depress the price of our common stock.
General Risks
Our business is subject to interruptions, delays or failures resulting from earthquakes, other natural catastrophic events or terrorism.
Our headquarters is currently located in Mountain View, California. Our current technology infrastructure is hosted across two data centers in co-location facilities in California and Nevada. In addition, we use two other co-location facilities in California and Virginia to host our retailer platform. Our services, operations and the data centers from which we provide our services are vulnerable to damage or interruption from earthquakes, fires, floods, public health crises such as pandemics and epidemics, power losses, telecommunications failures, terrorist attacks, acts of war, human errors, break-ins and similar events (such as the COVID-19 pandemic). A significant natural disaster, such as an earthquake, fire or flood, could have a material adverse impact on our business, financial condition and results of operations and our insurance coverage may be insufficient to compensate us for losses that may occur. Acts of terrorism could cause disruptions to the Internet, our business or the economy as a whole. We may not have sufficient protection or recovery plans in certain circumstances, such as natural disasters affecting areas where data centers upon which we rely are located, and our business interruption insurance may be insufficient to compensate us for losses that may occur. Such disruptions could negatively impact our ability to run our websites, which could harm our business.
Our ability to raise capital in the future may be limited, and our failure to raise capital when needed could prevent us from growing.
We may in the future be required to raise additional capital through public or private financing or other arrangements. Such financing may not be available on acceptable terms, or at all, and our failure to raise capital when needed could harm our business. Additional equity or equity-linked financing, such as our convertible senior notes, may dilute the interests of our stockholders, and debt financing, if available, may involve restrictive covenants and could reduce our profitability. If we cannot raise funds on acceptable terms, we may not be able to grow our business. In addition, while the potential impact and duration of the COVID-19 pandemic on the global economy and our business in particular may be difficult to assess or predict, the pandemic has resulted in, and could result in, significant disruption of global financial markets, reducing our ability to access capital, which could negatively affect our liquidity in the future.
Global economic conditions could materially adversely affect our revenue and results of operations.
Our business has been and may continue to be affected by a number of factors that are beyond our control, such as general geopolitical, economic and business conditions, conditions in the financial markets, and changes in the overall demand for, or supply of, consumer packaged goods products. A severe and/or prolonged economic downturn could adversely affect our customers' financial condition and the levels of marketing spend of our customers. While we have seen CPGs historically continue to spend on promotions during economic downturns, there is no guarantee they will continue to do so. Weakness in, and uncertainty about, global economic conditions may cause CPGs and retailers to postpone marketing in response to tighter credit, negative financial news and/or declines in income or asset values. As also noted in the risk factor “The effects of health epidemics, including the COVID-19 pandemic, have had, and may continue to have, an adverse impact on our business, operations and the markets and communities in which we and our partners operate.,” above, the COVID-19 pandemic has significantly increased economic uncertainty. Some CPGs continue to experience supply chain pressures and have not returned to pre-pandemic levels of promotional marketing spend. The current severe economic slowdown resulting from the pandemic has already started to lead to a global recession. Adverse changes in economic conditions, including as a result of the pandemic, can significantly harm demand for our marketing solutions (or change the mix of solutions demanded) and make it more challenging to forecast our operating results and make business decisions.
In addition, the economic problems affecting the financial markets and the uncertainty in global economic conditions resulted in a number of adverse effects including a low level of liquidity in many financial markets, extreme volatility in credit, equity, currency and fixed income markets, instability in the stock market and high unemployment. There could be a number of other follow-on effects from these economic developments on our business, including customer insolvencies; decreased demand for our marketing solutions; decreasedcustomer ability to paytheir accounts; and increased collections risk and defaults.
Item 1B. Unresolved Staff Comments.
None.
Item 2. Properties.
Our principal executive office is located in Mountain View, California, totaling approximately 42,000 square feet under lease expiring December 2021. We have additional principal office space in Cincinnati, Ohio that includes two spaces totaling approximately 47,000 square feet under leases expiring from November 2023 to June 2024. We maintain additional leased spaces in New York, New York, Marina Del Rey, California, Nashville, Tennessee, Bangalore, India, Paris, France, London, United Kingdom, and Tel Aviv, Israel. We believe our properties are generally suitable to meet our needs for the foreseeable future. In addition, to the extent we require additional space in the future, we believe that it would be readily available on commercially reasonable terms.
During February 2021, the Company entered into an Office Lease (“Lease”) with approximately 25,610 rentable square feet, for office facilities located in Salt Lake City, Utah. The lease term is approximately eight years with total lease payments of $5.8 million over the lease term.
Item 3. Legal Proceedings.
We are a party to litigation and subject to claims incident to the ordinary course of business. Although the results of litigation and claims cannot be predicted with certainty, we currently believe that the final outcome of these
matters will not have a material adverse effect on our business, financial condition or results of operations. Regardless of the outcome, litigation can have an adverse impact on our business because of defense and settlement costs, diversion of management resources and other factors.
Item 4. Mine Safety Disclosures.
None.
PART II
Item 5. Market for Registrant’s Common Equity, Related Stockholder Matters and Issuer Purchases of Equity Securities.
Market Information
Our common stock, $0.00001 par value, began trading on the New York Stock Exchange under the symbol “COUP” on March 7, 2014, the date of our IPO. We changed our name to Quotient Technology Inc. on October 20, 2015. Our common stock began trading on the New York stock Exchange under the symbol “QUOT” on October 21, 2015.
Holders
As of February 16, 2021, there were 49 holders of record of our common stock. Because most of our shares of common stock are held by brokers and other institutions on behalf of stockholders, we are unable to estimate the total number of beneficial stockholders represented by these record holders.
Dividend Policy
We have never declared or paid any dividends on our common stock and do not anticipate that we will pay any dividends to holders of our common stock in the foreseeable future. Instead, we currently plan to retain any earnings to finance the growth of our business. Any future determination relating to dividend policy will be made at the discretion of our Board of Directors and will depend on our financial condition, results of operations and capital requirements as well as other factors deemed relevant by our Board of Directors.
Issuer Purchases of Equity Securities
In August 2019, the Company’s Board of Directors authorized a one-year share repurchase program for the Company to repurchase up to $50.0 million of its common stock from August 2019 through August 2020. During the year ended December 31, 2020, the Company did not repurchase any shares of its common stock and the program expired in August 2020.
Additionally, in February 2021, the Company’s Board of Directors authorized a one-year share repurchase program ("2021 Program") for the Company to repurchase up to $50.0 million of its common stock from February 2021 through February 2022. Stock repurchases may be made from time to time in open market transactions or privately negotiated transactions, and the Company may use a plan that is intended to meet the requirements of SEC Rule 10b5-1 to enable stock repurchases to occur during periods when the trading window would otherwise be closed. The Company may suspend, modify or terminate the 2021 Program at any time without prior notice.
Performance Graph
The following shall not be deemed “filed” for purposes of Section 18 of the Exchange Act, or incorporated by reference into any of our other filings under the Exchange Act or the Securities Act, except to the extent we specifically incorporate it by reference into such filing.
This chart compares the cumulative total return on our common stock with that of the Russell 3000 and the S&P North American Technology Sector Index. The chart assumes $100 was invested at the close of market on December 31, 2015, in our common stock, the Russell 3000 and the S&P North American Technology Sector Index, and assumes the reinvestment of any dividends. The stock price performance on the following graph is not necessarily indicative of future stock price performance.
| | | | | | | | | | | | | | | | | | | | | | | | | | | | | | | | | | | | | | |
| | INDEXED RETURNS
Quarter Ending |
| Company / Index | | 12/31/2015 | | 12/31/2016 | | 12/31/2017 | | 12/31/2018 | | 12/31/2019 | | 12/31/2020 |
| Quotient Technology Inc. | | $ | 100 | | | $ | 158 | | | $ | 172 | | | $ | 157 | | | $ | 145 | | | $ | 138 | |
| Russell 3000 Index | | $ | 100 | | | $ | 110 | | | $ | 131 | | | $ | 122 | | | $ | 157 | | | $ | 186 | |
S&P North American
Technology Sector Index | | $ | 100 | | | $ | 112 | | | $ | 153 | | | $ | 156 | | | $ | 220 | | | $ | 316 | |
Unregistered Sales of Equity Securities
Not applicable.
Item 6. Selected Financial Data
| | | | | | | | | | | | | | | | | | | | | | | | | | | | | |
| Year Ended December 31, |
| 2020 | | 2019 | | 2018 | | 2017 | | 2016 |
| (in thousands, except per share data) |
| Revenues | $ | 445,887 | | | $ | 436,160 | | | $ | 386,958 | | | $ | 322,115 | | | $ | 275,190 | |
| Cost of revenues (1) | 277,914 | | | 263,606 | | | 206,230 | | | 140,752 | | | 114,870 | |
| Gross margin | 167,973 | | 172,554 | | 180,728 | | 181,363 | | 160,320 |
| Operating expenses: | | | | | | | | | |
| Sales and marketing (1) | 104,527 | | | 101,244 | | | 90,086 | | | 92,833 | | | 92,596 | |
| Research and development (1) | 40,316 | | | 39,076 | | | 46,873 | | | 50,009 | | | 50,503 | |
| General and administrative (1) | 54,177 | | | 58,328 | | | 49,805 | | | 48,124 | | | 43,404 | |
Change in fair value of escrowed shares and
contingent consideration, net | 20,234 | | | 1,571 | | | 13,190 | | | 5,515 | | | (6,450) | |
| Total operating expenses | 219,254 | | | 200,219 | | | 199,954 | | | 196,481 | | | 180,053 | |
| Loss from operations | (51,281) | | | (27,665) | | | (19,226) | | | (15,118) | | | (19,733) | |
| Interest expense | (14,521) | | | (13,955) | | | (13,411) | | | (1,589) | | | — | |
| Other income, net | 1,140 | | | 5,223 | | | 4,801 | | | 928 | | | 495 | |
| Loss before income taxes | (64,662) | | | (36,397) | | | (27,836) | | | (15,779) | | | (19,238) | |
| Provision for (benefit from) income taxes | 719 | | | 660 | | | 482 | | | (702) | | | 241 | |
| Net loss | $ | (65,381) | | | $ | (37,057) | | | $ | (28,318) | | | $ | (15,077) | | | $ | (19,479) | |
| Net loss per share, basic and diluted | $ | (0.72) | | | $ | (0.41) | | | $ | (0.30) | | | $ | (0.17) | | | $ | (0.23) | |
Weighted-average number of common shares used
in computing net loss per share, basic and diluted | 90,412 | | | 91,163 | | | 93,676 | | | 89,505 | | | 84,157 | |
(1) The stock-based compensation expense included above was as follows:
| | | | | | | | | | | | | | | | | | | | | | | | | | | | | |
| Year Ended December 31, |
| 2020 | | 2019 | | 2018 | | 2017 | | 2016 |
| (in thousands) |
| Cost of revenues | $ | 1,743 | | | $ | 2,193 | | | $ | 2,315 | | | $ | 2,000 | | | $ | 1,821 | |
| Sales and marketing | 5,311 | | | 6,812 | | | 6,596 | | | 6,621 | | | 5,776 | |
| Research and development | 3,831 | | | 4,804 | | | 6,137 | | | 7,949 | | | 7,286 | |
| General and administrative | 17,486 | | | 18,328 | | | 16,338 | | | 15,682 | | | 13,403 | |
| Total stock-based compensation | $ | 28,371 | | | $ | 32,137 | | | $ | 31,386 | | | $ | 32,252 | | | $ | 28,286 | |
| | | | | | | | | | | | | | | | | | | | | | | | | | | | | |
| Year Ended December 31, |
| 2020 | | 2019 | | 2018 | | 2017 | | 2016 |
| Consolidated Balance Sheet Data: | (in thousands) |
| Cash, cash equivalents and short-term investments | $ | 222,752 | | | $ | 224,764 | | | $ | 322,766 | | | $ | 394,537 | | | $ | 175,346 | |
| Working capital | 257,450 | | | 249,811 | | | 352,810 | | | 404,145 | | | 207,694 | |
| Property and equipment, net | 17,268 | | | 13,704 | | | 15,579 | | | 16,610 | | | 16,376 | |
| Total assets | 586,792 | | | 591,938 | | | 662,353 | | | 629,075 | | | 362,756 | |
| Deferred revenues | 12,027 | | | 10,903 | | | 8,686 | | | 6,276 | | | 6,856 | |
| Convertible senior notes, net | 177,168 | | | 166,157 | | | 155,719 | | | 145,821 | | | — | |
| Total liabilities | 339,763 | | | 306,716 | | | 282,266 | | | 231,034 | | | 51,007 | |
| Total stockholder's equity | $ | 247,029 | | | $ | 285,222 | | | $ | 380,087 | | | $ | 398,041 | | | $ | 311,749 | |
Changes to Stockholder Director Nominations for the 2023 Annual Meeting
As described in the Form 8-K filed on April 21, 2023, the Board irrevocably committed to (i) hold the Company’s 2023 Annual Meeting no earlier than July 31, 2023 and (ii) publicly announce the date of the 2023 Annual Meeting no earlier than May 2, 2023. At such time as we set a date for the 2023 Annual Meeting, we will issue a press release, with sufficient notice to stockholders, announcing, among other things, the new deadline for receipt of stockholder nominations for director under Rule 14a-19 of the Exchange Act.
Audit Committee and Financial Experts
The Board's Audit Committee currently consists of Messrs. Oppenheimer, Higgs, and Wargotz, and Ms. Hawkins, with Mr. Oppenheimer serving as our Audit Committee chairperson. Mr. Higgs joined the Audit Committee on March 23, 2022, and Mr. Wargotz joined the Audit Committee on February 22, 2023. Our Board has determined that all of the members of the Audit Committee possess the level of financial literacy and sophistication required under the listing standards of the NYSE, and that each of Messrs. Oppenheimer and Wargotz is an audit committee financial expert as defined by SEC rules. Our Board has also determined that each of Mr. Oppenheimer, Ms. Hawkins, Mr. Higgs and Mr. Wargotz satisfies the independence requirements of Audit Committee members under the applicable rules and regulations of the SEC and the listing standards of the NYSE.
Code of Ethics
Our Board has adopted a code of business conduct and ethics that applies to all of our employees, officers and directors, including our Chief Executive Officer, Chief Operating Officer and Financial Officer, and other executive and senior financial officers. The full text of our code of business conduct and ethics is posted on the investor relations page on our website which is located at http://investor.quotient.com. We will post any amendments to our code of business conduct and ethics, or waivers of its requirements, on our website.
Delinquent Section 16(a) Reports
Under U.S. securities laws, directors, certain officers and persons holding more than 10% of our common stock must report their initial ownership of our common stock and any changes in their ownership to the SEC. To our knowledge, based solely on our review of copies of the reports filed with the SEC and the written representations of our directors and executive officers that no other reports were required to be filed during our fiscal year ended December 31, 2022 (“Fiscal 2022”), we believe that for Fiscal 2022, all required reports were filed on a timely basis under Section 16(a) of the Exchange Act.
Item 7. Management’s Discussion11. Executive Compensation
Executive Compensation
The following discusses the compensation for our Named Executive Officers ("NEOs") for 2022, who were as follows:
| | | | | |
| NEO | Title |
Matthew Krepsik(1) | Chief Executive Officer and Member of the Board of Directors |
Yuneeb Khan(2) | Chief Financial Officer, Principal Accounting Officer and Treasurer |
| Connie Chen | General Counsel, Compliance Officer and Secretary |
Steven Boal(3) | Former Chief Executive Officer |
Scott Raskin(4) | President |
Pamela Strayer(5) | Former Chief Financial Officer and Treasurer |
John Kellerman(6) | Former VP of Accounting, Former Interim Chief Financial Officer |
(1)Mr. Krepsik assumed the role of Chief Executive Officer of Quotient effective as of May 24, 2022.
(2)Mr. Khan assumed the role of Chief Financial Officer and AnalysisTreasurer of Quotient effective as of July 5, 2022. Mr. Khan also assumed the role of Chief Operating Officer as of February 22, 2023.
(3)Mr. Boal retired from his role as Chief Executive Officer of Quotient effective as of May 20, 2022. Mr. Boal continued to serve as an employee and member of the Board until June 29, 2022 by agreement between Mr. Boal and Quotient.
(4)Mr. Raskin agreed to step down as President of Quotient effective as of March 31, 2023.
(5)Ms. Strayer resigned as Chief Financial ConditionOfficer and ResultsTreasurer of Operations.Quotient effective as of April 5, 2022.
(6)Mr. Kellerman served as Interim Chief Financial Officer of Quotient from April 5, 2022 until July 5, 2022. His employment with Quotient ceased effective as of November 11, 2022.
You should read the following discussion and analysis of our financial condition and results of operations in conjunction with the consolidated financial statements and the related notes to consolidated financial statements included elsewhere in this annual report on Form 10-K. In addition to historical financial information, the following discussion contains forward-looking statements that reflect our plans, estimates, beliefs and expectations that involve risks and uncertainties. Our actual results and the timing of events could differ materially from those discussed in these forward-looking statements. Factors that could cause or contribute to these differences include those discussed below and elsewhere in this prospectus, particularly in “Risk Factors” and “Special Note Regarding Forward-Looking Statements.”
Business Overview
Business Description
Quotient Technology Inc. is an industry leading digitalpromotions and media and promotions technology company that creates cohesive omnichannel brand-buildingdelivers targeted digital promotions and sales-driving marketing campaignsmedia for CPGs companies and retailers throughout the path to purchase. These programs are delivered across our platforms across our broad network of digital properties to drive measurable sales results and customer loyalty. Our network includes the digital properties of our retail partners and CPG customers, social media platforms, third-party properties, our flagship consumer brand Coupons.com properties and DOOH properties. This network provides Quotient with proprietary and licensed data, including retailers’ in-store POS shopper data, purchase intent and online behavior, location intelligence, and, to deliver more valuable outcomes for CPGs, retailers, and consumers. Customers and partners use Quotient to leverage shopper data, and insights, consumers via digital channels, integrate marketing and merchandising programs, and leverage consumer data and insights to drive measurable sales results.
For our retail partners, we provide Quotient Retailer Promotions Platform, formerly known as Quotient Retailer iQ, and Quotient Retailer Performance Media Platform, to directly engage with shoppers across their websites, mobile, eCommerce, and social channels. These platforms are generally co-branded or white-labeled through retailers’ savings or loyalty programs and use shopper data to deliver relevant digital media and promotions solutions from brand marketersadvertisers and retailers to consumers. By partnering with Quotient, retailersreach consumers and drive action. Using our platforms and suite of omnichannel solutions, advertisers can leverage their proprietary sales dataplan, target, deliver and digital propertiesmeasure performance marketing to build new alternative revenue streamsimpact sales.
Our customers consist primarily of consumer-packaged goods (“CPG”) companies and offer effective marketing opportunities for their brand partnersmarketers (together referred to engageas “advertisers”) who want to drive sales and positive brand engagement with shoppers. Our digital marketing platform is designed to produce returns on marketing investment for advertisers by utilizing consumer behavior, intent data and point of sale ("POS") data to deliver the right marketing message and call to action to the right consumer at the right time, through multiple touchpoints while consumers all while measuring the impactare engaged online, out of every partnership.
Our network is made upQuotient partners with leading advertisers, publishers and retailers, including Clorox, Procter & Gamble, Unilever, CVS, Dollar General, Ahold Delhaize USA, Amazon and Microsoft.
Business Performance
2022 was a year of three constituencies: over 2,000 brands from approximately 800 CPGs; retail partners across multiple classes of trade suchtransformation for Quotient. Despite challenges caused by macroeconomic trends, we continued to execute on our financial and operational priorities, and as grocery retailers, drug, mass merchant, dollar, club,a result we entered 2023 with, in our view, a more stable and convenience merchandise channels; and consumers who visit our websites, mobile properties, social channels, as well as thosedurable foundation that puts Quotient in a position to deliver profitable growth in the coming years.
Some of our CPGsfinancial and retailer partners.strategic highlights from 2022 include:
We primarily generate revenuegenerated annual revenues of $288.8 million and Adjusted EBITDA of $14.9 million in 2022. Our business was impacted by using our technology platformssupply chain issues in 2022 that led CPGs to create, target, deliver, analyze and measure digital media and/or promotional programs for our CPG customers, retail partners and advertising agencies. Using shopper data from our retail partners and our proprietary data and audience segments, we deliver targeted and/or personalized digital media and promotionscontinue to shoppers through our network, including our websites and mobile applications, as well as those of our publishers, retail partners and other third-party properties. As our customers and partners shift more of their marketing spend to digital channels, our solutions help them optimize the performance of such digital channels. Our solutions’ performance is measured by attribution of digital ad campaigns to retail purchases in near real time, demonstrating returnpull back on spend for our customers and partners.
Our promotional products include digital paperless coupons, digital print coupons, in lane on receipt promotions, digital rebates and loyalty offers. Our media solutions include display, social, DOOH, Retailer.com display and sponsored search, shoppable brand pages, and audiences. A growing number of campaigns our customers purchase are purchased as an integrated campaign which combines a mix of digital media and/or promotions solutions in a single campaign. The revenue we earn from these programs is generally based on cost-per-click, cost-per-impression, or cost-per-acquisition.
We also generate revenues from our Specialty Retail business, in which specialty stores including clothing, electronics, home improvement and many others offer coupon codes that we distribute digitally.
marketing investment, as well as by continued macro-economic challenges impacting advertising spending across the industry.
•Our continued shift in focus from being a full service agency to being a technology platform provider, which enabled us to optimize our cost base and establish what we believe is a healthy EBITDA profile. To achieve this, we took actions that included simplifying our technology, better integrating acquisitions, and conducting responsible workforce reductions.
•We generally payimproved our capital structure by repaying our $200 million convertible notes in full in December 2022, replacing it with what we believe to be a distribution fee or revenue share to retailers and publishers for activation or redemptionrobust capital structure consisting of a digital promotion,4 year, $55 million term loan, a $50 million asset based revolving credit facility, and an optimized cash balance.
•Our promotions network remained a priority in 2022 and, through the addition of new partners and endpoints, we were able to grow its reach and scale by 7%, as represented by activations of promotions. The network delivered a total of $11.2 billion of savings to consumers throughout 2022, representing a 10% increase year over year, due to this increased reach and the power of our programmatic platform.
•We launched Shopmium, our formerly solely EU-focused consumer app, in the U.S. market as an important extension of our promotions business that allows Quotient to establish a first-party data relationship with shoppers and that provides incremental reach for our network.
•We have evolved our retailer strategy with the aim of addressing challenges facing brands and retailers due to the significant transformation and increasing fragmentation occurring in the retail media ecosystem. In December 2022 we launched our Retail Ad Network, which aggregates individual retail media networks to enable advertisers to target, manage, execute and measure off-site campaigns andacross multiple retailers through one central, transparent platform.
Below is a summary of our financial performance for useFiscal 2022, in comparison to previous fiscal years:
Compensation Overview
Annual Meeting Results
As part of dataits compensation review process, the Compensation Committee of the Board ("Compensation Committee") considers whether Quotient’s executive compensation program is aligned with the interests of our stockholders. In its review of Quotient’s executive compensation program, the Compensation Committee has carefully considered the approval by approximately 49% of the votes cast for targeting or measurement.Quotient’s say-on-pay vote at our 2022 annual meeting of stockholders, as compared to strong approval for the prior year’s say-on-pay proposal with approximately 96% of votes cast in support of Quotient’s executive compensation program.
In response to this disappointingly low say-on-pay approval at the 2022 annual meeting, we performed a comprehensive review of each of our compensation programs. We also payreached out to our top 25 stockholders (representing approximately 77% of our outstanding shares) in order to specifically solicit stockholder feedback
regarding Quotient’s executive compensation program, among other items. Twenty percent of these stockholders accepted our invitation to provide feedback. Robert McDonald, an independent director and Chairman of the Board, along with our Chief People Officer, our General Counsel and our Investor Relations representative, participated in meetings with each of these stockholders. During these meetings, these investors provided several key pieces of feedback regarding the existing executive compensation program:
•Quotient should not reprice stock options without stockholder approval;
•The executive compensation program should place a feestrong emphasis on performance-based compensation;
•The peer group should be reset to third-party publishersreflect the Company's current profile for traffic acquisition, which consistsmarket capitalizing and revenue;
•Performance metrics under Quotient’s executive compensation programs should be designed to preclude undesirable incentives, such as incentives to take excessive risks;
•Performance conditions and other criteria for receipt of delivering campaigns on certain networkscompensation should not be modified or sites. These distribution, revenue share,waived in a way that benefits executives (i.e., no “moving the goal posts”); and third-party service fees are included
•Mr. Boal’s severance package was above and beyond an appropriate level, for example the severance contemplated in our costhis Change of revenues. See Management’s DiscussionControl agreement.
As a result of this shareholder feedback, the Compensation Committee made a number of prospective changes to its executive compensation program to address stockholder feedback and Analysisto better align the go-forward policies with the interests of Financial ConditionQuotient’s stockholders, including:
•Recommending, for Board and Resultsstockholder approval, the adoption of Operations – “Non-GAAP Financial Measurea new equity incentive plan that is better aligned with stockholder interests and Key Operating Metrics” for more information.market practices, including:
Our operating expenses may•Preserving, but not increasing, the number of shares currently available under the Company's 2013 Equity Incentive Plan (the "2013 Plan");
•Prohibiting the repricing of options and stock appreciation rights without stockholder approval; and
•Eliminating the annual increase in the future as we continueshares available under the plan (the annual evergreen).
•Adjusting the criteria used to (1) investidentify Quotient’s peer group for making executive compensation decisions for 2023 in (i) research and developmentorder to enhance our platforms and investments in newer product offerings; (ii) sales and marketing to acquirebetter reflect Quotient’s current profile;
•Appointing a new CPG and retailer customers and increase revenues from our existing customers; and; (iii) corporate infrastructure; (2) amortize expenses related to intangibles assets associated with acquisitions and other strategic acquisitions and partnerships; and (3) remeasure contingent consideration related to acquisitions.
For 2020, 2019 and 2018, our revenues were $445.9 million, $436.2 million, and $387.0 million, respectively. Our net loss for 2020, 2019 and 2018 was $65.4 million, $37.1 million, and $28.3 million, respectively.
Seasonality
Somechairperson of the Company’s products experience seasonal salesCompensation Committee, Mr. Reece, effective as of February 22, 2023;
•Focusing performance-based long-term incentives on healthy revenue growth and buying patterns mirroring thoseprofitability, with managed upside payouts;
•Focusing annual cash incentives under the Company's Annual Incentive Plan ("AIP", as defined below in the CPG, retail, advertising,"Compensation Elements" section of this Form 10-K/A) on both profitability and eCommerce markets, including back-to-schoolrevenue, with managed upside payouts, and holiday campaigns, where demand increases duringintroducing a minimum gross profit threshold condition to the second halfattainment of the Company’s fiscal year. Seasonality may also be affected by CPG annual budget cycles, as some large CPGs have fiscal years endingGAAP revenue goal in June. We believeorder to preclude the creation of undesirable incentives; and
•Targeting base compensation levels around the 50th percentile among the company's peer group for the Company's key executives, with the exception of Mr. Khan, for whom the Committee has determined a higher level is appropriate due to his critical role in the Company's future growth.
Philosophy
The overall objective of our executive compensation programs is to pay our executive officers competitively and equitably in a way that this seasonality pattern has affected, and will continue to affect,aligns our business and the associated revenues during the first halffinancial goals, and second halfties back to overall Company and individual performance. The primary objectives of our fiscal year. We recognized 59%, 54% and 54% ofexecutive compensation programs for our annual revenue during the second half of 2020, 2019 and 2018, respectively. We believe the first half of 2020 results were negatively impacted by the COVID-19 pandemic resulting in a higher percentage of revenues in our second half of the year than we have experienced in the past.NEOs are:
We are cognizant of the rapid expansion of the COVID-19 pandemic and the resulting global implications. In an effort to protect the health and safety of our employees, our workforce has had, and continues in most instances, to spend a significant amount of time working remotely and travel has been severely curtailed. In an effort to contain COVID-19 or slow its spread, governments around the world have also enacted various measures, some of which have been subsequently rescinded or modified, including orders to close all businesses not deemed “essential,” isolate residents to their homes or places of residence, and practice social distancing when engaging in essential activities. We anticipate that these actions and the global health crisis caused by the COVID-19 pandemic will continue to negatively impact business activity across the globe. While we observed a significant increase in revenue growth during the second half compared to the first half of our fiscal year, we cannot estimate the impact COVID-19 will have in the future as government entities and businesses make decisions about whether and when to open businesses and what impact these decisions will have on consumer activity across the globe.
| | | | | |
| Pay-for-Performance | A significant portion of pay for executive officers is at-risk and performance-based with metrics that align total compensation with the Company’s sustainable growth strategy and values, annual financial objectives, and performance of our stock price. At-risk compensation includes short-term cash incentives and long-term performance-based equity incentives. |
| Alignment with Stockholders | Our compensation programs align executive officers’ interests with those of our stockholders, by providing equity-based forms of compensation and tying pay to Company and stock performance. We maintain stock ownership guidelines for all executive officers, and we remain committed to a culture of shared success through long-term equity awards. In response to stockholder feedback, we continued to award a portion of the 2022 equity grant in the form of performance-based RSUs with stringent vesting conditions. We believe the stock price vesting metrics are in alignment with stockholder interest. |
| Competitive Appeal | Our compensation programs are designed to attract, reward, and retain talented and highly qualified executive officers whose abilities and alignment to our values are critical to our success. We use market-based pay information to align each executive officer’s compensation to their position, responsibilities, and impact. |
| Drive Sustainable Growth | We use our compensation programs to invest in and reward talent with the greatest potential to drive the long-term growth of our Company, while holding employees accountable to the Company’s strategy and values. |
Strong Governance Practices
| | | | | |
| We Do | We Don't |
üReview compensation programs annually with the Compensation Committee |
ûProvide single trigger change of control severance benefits |
üMaintain robust stock ownership guidelines for all NEOs |
ûPermit hedging or pledging of equity securities
|
üEmphasize long-term equity in NEO pay mix |
ûProvide perquisites
|
üRely on the advice of an independent compensation consultant reporting directly to the Compensation Committee |
ûProvide tax gross-up payments |
üEnsure a significant portion of executive pay is "at-risk" and/or variable, dependent on company and/or stock price performance | û On a go-forward basis, intend to allow repricing without stockholder approval (if and upon obtaining approval of a new equity incentive plan that we intend to submit for approval at the 2023 Annual Meeting) |
üUse a market comparison of executive compensation against a relevant peer group | ûOn a go-forward basis, intend to provide for automatic annual increases in the shares available under our equity incentive plan (if and upon obtaining approval of a new equity incentive plan that we intend to submit for approval at the 2023 Annual Meeting) |
Compensation Elements
Our compensation program consists of base salary, annual incentives and long-term incentives. Each year the Compensation Committee reviews, for each NEO, the target opportunity value of each of these three elements. We will continuerefer to actively monitor the situationaggregate of the target opportunity value of each element as Total Direct Compensation (“TDC”). The Compensation Committee considers market practices, the criticality of the NEO's role to the business, and may take further actions that alterretention objectives as well as other factors such as company and individual performance to determine the appropriate TDC for each NEO and the mix of each element in the total. Each element is described in the table below.
| | | | | | | | |
| Element | Purpose | Characteristics |
| Base Salary | Attract and retain talent | •Fixed: 100% cash •Size reflects role responsibility, experience and individual performance, criticality to our success, and market benchmarking against our peer group |
Short-Term Incentive
(Annual Incentive Plan ("AIP")) | Motivate and reward accomplishment of short-term business goals | •Variable: 100% cash •AIP target payout opportunity reflects market practice expressed as % of base salary •Payouts are fully formulaic •In 2022, the primary metric under the 2022 AIP was Reported Adjusted EBITDA (in order to strongly incentivize performance on this metric) |
Long-Term Incentive
(Long-Term Incentive ("LTI")) | Motivate and reward sustainable long-term performance
Align delivered pay to returns experienced by stockholders
Attract and retain talent | •Variable: 100% equity •LTI opportunity is sized based on market practices, which includes benchmarking against our peer group, role responsibility, retention objectives, and individual performance •In 2022, annual LTI awards were denominated 50% in time-based RSUs and 50% in performance-based RSUs based on market best practices and aligned with stockholder interest, emphasize performance-based component of compensation, align with governance best practices, and market trends •2022 performance-based RSUs were subject to satisfaction of challenging Company stock price hurdles. |
A significant proportion of each NEO's target TDC is variable and at-risk due to its dependence on the achievement of preset, objective and quantitative performance goals in the AIP and long-term incentive awards based on the Company performance, as shown in the charts below.
The charts below reflect the mixture of Base Salary, AIP Target Opportunities, and LTI Opportunities for Messrs. Krepsik and Boal and for each of the other NEOs, other than Mr. Kellerman.
(1)Compensation Pay Mix is representative of 2022 total target compensation. Total target compensation for Mr. Boal is reflective of his pay prior to his stepping down as CEO on May 20, 2022, and total target compensation for Mr. Krepsik is reflective of his pay after his May 24, 2022 promotion to CEO.
How Pay Decisions Are Made
Role of the Compensation Committee
The Compensation Committee regularly reviews the philosophy and goals of our business operationsexecutive compensation programs to ensure they align with company objectives and strategy. Typically, our CEO makes compensation recommendations for NEOs and other members of the executive leadership team for approval by the Compensation Committee. The CEO does not participate in recommendations or discussions relating to his own compensation.
At the beginning of 2022, our then-current CEO made compensation recommendations for then-current NEOs other than the CEO, including Messrs. Krepsik and Raskin as maywell as Mses. Strayer and Chen, for consideration and approval by the Compensation Committee in Q1 of 2022, and also made recommendations to the Board regarding compensation to be required by federal, state, local or foreign authorities, or that we determine areprovided to Mr. Khan and Mr. Kellerman in connection with their commencement of service as Chief Financial Officer and interim Chief Financial Officer, respectively.
The Compensation Committee, with the assistance of an independent consultant, considers multiple factors including market data from a defined peer group, broader survey data reflecting companies of a similar profile, company and individual performance, stockholder feedback, and the judgment of its experienced members on what is in the best interests of the Company in making recommendations on CEO pay for approval by the Board.
The Compensation Committee follows a robust annual cycle to plan and review philosophy, goals, and execution of our executive compensation programs to ensure they align with company objectives and strategy. Highlights from our annual schedule are outlined in the below table. | | | | | |
| Timing | Focus Areas |
| Q1 | •Evaluated business performance and financial metrics for the prior fiscal year under the Annual Incentive Plan (AIP) •Discussed individual contributions, performance, and future potential of NEOs to determine compensation adjustments and overall pay mix targets •Finalized updated 2022 Long-Term Incentive Program ("LTI Program") design for NEOs •Aligned on performance measures, targets, and plan design for the 2022 AIP and any performance-based equity metrics |
| Q2 | •Approved new compensation structure for Mr. Krepsik in connection with his promotion to CEO •Approved retention packages for Mr. Raskin and Ms. Chen •Approved adjustments to Quotient's non-employee director compensation program |
| Q3 | •Reviewed and discussed usage of equity incentive compensation for non-NEOs and monitored ongoing dilution •Discussed plans for putting forward a new equity plan in 2023 and beyond |
| Q4 | •Reviewed annual meeting results including results of "say-on-pay" advisory vote from stockholders •Engaged in outreach to shareholders to seek their input on our executive compensation practices •Discussed modifications to the Company's compensation program in response to shareholder feedback •Approved Company peer group to be used for the 2023 executive compensation decisions •Discussed progress against equity budget, equity strategy and approach for 2023 and beyond |
Role of the Independent Compensation Committee Consultant
The Compensation Committee retained Aon plc ("Aon" or the "Compensation Consultant") as an independent consultant reporting directly to the Compensation Committee, to assist in providing market data, analysis and advice on executive and director compensation, and related governance matters. Aon and its affiliates did not provide any services to Quotient in 2022 other than executive and director compensation consulting for the Compensation Committee.
The Compensation Committee determined that Aon satisfied the independence factors specified in the NYSE listing rules. The Committee also determined that the work performed by Aon in 2022 did not raise any conflict of interest.
Peer Group
When evaluating executive compensation, the Compensation Committee reviews the pay practices and pay levels in a comparative group of companies of similar size and business sector to Quotient. We review the peer group annually for relevance and alignment with best practices and investor preferences. The peer group and the compensation assessment is just one input into the Company’s policy setting and pay decisions that is considered by the Compensation Committee. The selection criteria for inclusion in the 2022 peer group are summarized in the table below.
| | | | | | | | |
| Element | Description | Criteria |
| Industry/Sector | The markets in which the Company competes for product success and talent. | Public US-based software-as-a-service companies, marketing services companies, and interactive media & services companies.
If possible, companies with corporate headquarters in key technology hub locations. |
| Revenue | Trailing Twelve Month ("TTM") revenue is within a range that is comparable to Quotient’s revenue. | Generally between 0.5x to 3.7x ($300M to $2.0B) of Quotient revenue.
|
| Market Capitalization | Market capitalization is within a range that is comparable to Quotient’s market capitalization. | Generally between 0.5x to 4.0x($500M to $4.1B) of Quotient market capitalization. |
Other qualitative factors that were considered in selecting the relevant peer group include organizational complexity, time since an initial public offering, location of senior leaders and/or other key roles, and overall headcount. The peer group data analysis includes target base salary, annual incentive and long-term award values for similarly situated executives at the 25th, 50th, and 75th percentiles. In selecting the peer companies, the Compensation Committee tries to place the Company at or near the median or 50th percentile for revenue as a proxy for business scale given market volatility in valuations. At the time that the peer group was approved, the Company was at the 48th percentile for revenue.
The peer group data may also be supplemented with other relevant market data supplied by the Compensation Consultant that reflect companies of a similar profile as the peer group from broader survey data. This data is used, in addition to the peer group data, to ensure a relevant sample for informing pay decisions. The Compensation Committee looks at the peer group as part of its annual review and will continue to adjust the peers as appropriate.
In the third quarter of 2021, the Compensation Committee approved the peer group to be used to examine executive pay levels, pay mix and pay policies in connection with setting the go-forward program for the NEOs in 2022. After considering the recommendations of the Compensation Consultant, the Compensation Committee ultimately decided to retain the same peer group used in 2021 for 2022 compensation decisions.
The peer group companies for 2022 pay decisions are listed below.
| | | | | | | | |
| 2U, Inc. | LivePerson, Inc. | Stamps.com Inc. |
| 8x8, Inc. | QAD Inc. | TripAdvisor, Inc. |
| Benefitfocus, Inc. | QuinStreet, Inc. | TrueCar, Inc. |
| Box, Inc. | Rapid7, Inc. | Workiva Inc. |
| Cloudera, Inc. | Shutterstock, Inc. | Yelp Inc. |
| Cornerstone OnDemand, Inc. | SPS Commerce, Inc. | Zuora, Inc. |
As described below under "Revisions to Peer Group for Pay Decisions in 2023", the Compensation Committee approved the use of a modified peer group for 2023 compensation decisions based upon feedback from the Compensation Consultant and from our stockholders.
Compensation Elements
Base Salary
Base pay is fixed compensation delivered in return for day-to-day job responsibilities, leadership skills and experience. Our goal is to provide base salary compensation that is market competitive in comparison with roles of similar size and business-decision authority in our industry. Market competitive base pay helps to attract and retain executive talent. The Compensation Committee reviews each NEO’s base salary annually considering market comparisons, prevailing market conditions, role scope, individual experience and performance, and internal equity.
During the annual compensation review process, the Compensation Committee approved no change in base salary for any of Messrs. Krepsik, Raskin or Boal, or Mses. Chen or Strayer.
Later in the year, in connection with Mr. Krepsik’s appointment to the position of Chief Executive Officer, the Compensation Committee approved an increase in his base salary to $500,000 in order to reflect this increase in responsibilities, effective as of his assumption of that role. In addition, in connection with Mr. Khan’s commencement of employment as Chief Financial Officer of Quotient in July 2022, the Compensation Committee approved a base salary of $460,000, based upon the Committee’s review of market data, internal comparables, competitive assessment of the role, candidate experience, and recommendations from the Compensation Consultant.
| | | | | | | | | | | |
| Named Executive Officer | Base Salary as of December 31, 2021 | Base Salary as of December 31, 2022(2) | % Change |
| Matthew Krepsik | $375,000 | $500,000 | 33% |
| Scott Raskin | $465,000 | $465,000 | —% |
| Yuneeb Khan | $— | $460,000 | —% |
| Connie Chen | $380,000 | $380,000 | —% |
| Steven Boal | $500,000 | $500,000 | —% |
| Pamela Strayer | $450,000 | $450,000 | —% |
John Kellerman (1) | $316,200 | $338,000 | 7% |
(1)Mr. Kellerman received a merit increase in base salary from $316,200 to $338,000 effective on April 1, 2022 in conjunction with his Chief Accounting Officer role. He received no base pay compensation change for his interim Chief Financial Officer role.
(2)Messrs. Boal and Kellerman, and Ms. Strayer's base salary is as of the last date of their employment with the Company.
Annual Incentive Plan
We provide a cash-based incentive plan, or AIP, that is directly tied to achievement of financial goals that are predefined, objective, and considered to be stretch goals at the time of approval. The cash-based incentive plan is based on our annual performance and is designed to motivate and reward our NEOs and other AIP-eligible employees customers, partnersfor achieving short-term performance objectives. We believe this program supports our “pay-for-performance” culture. In designing the 2022 AIP, the Compensation Committee approved certain modifications from the 2021 AIP in order to enhance and stockholders. If CPGs, retailersstrengthen the focus on adjusted EBITDA, while also incentivizing Company
growth through a secondary revenue metric (see a more detailed description of the use of these metrics under the 2022 AIP below).
Setting Target Payout Opportunities Under the 2022 AIP
Target payout opportunities under the 2022 AIP were expressed as a percentage of the NEO’s annual base salary. During the annual compensation review process in the first quarter of 2022, the Compensation Committee approved no change in target payout opportunities for any of Mr. Krepsik, Mr. Raskin, Ms. Chen, Ms. Strayer or Mr. Boal, as compared to the 2021 AIP target payout opportunities.
In May 2022, in connection with Mr. Krepsik’s appointment as Chief Executive Officer, the Compensation Committee approved an increase in his target payout opportunity under the 2022 AIP from 75% to 100% of annual base salary in order to reflect this increase in responsibilities, effective as of his assumption of that role. In addition, in connection with Mr. Khan’s commencement of employment as Chief Financial Officer of Quotient in July 2022, the Compensation Committee approved a target payout opportunity under the 2022 AIP equal to 75% of annual base salary, based upon the Committee’s review of market data, internal comparables, competitive assessment of the role, candidate experience, and brands pause, delay, or cancel campaignsrecommendation from the Compensation Consultant.
2022 AIP Pay for Performance Alignment
The Compensation Committee established the following performance metrics and payout levels under the 2022 AIP for the NEOs, which goals were approved by the Compensation Committee in February 2022.
Payouts under the 2022 AIP are calculated based upon achievement of a primary metric, Reported Adjusted EBITDA, and a “modifier metric,” Reported Revenue1. Under the 2022 AIP, the threshold, target, and maximum performance targets with respect to the Reported Adjusted EBITDA and Reported Revenue metrics were as follows:
| | | | | | | | | | | |
| Threshold | Target | Maximum |
Reported Adjusted EBITDA(1) | $37M | $49M | $61M |
Reported Revenue(2) | $323M | $351M | $379M |
(1)For Mr. Kellerman only, due to his position at the uncertainty, supply-chain disruption,time of plan approval, a threshold of $25M, target of $49M, and consumer purchasing behavior changes causedmaximum of $61M.
(2)For Mr. Kellerman only, due to his position at the time of plan approval, a threshold of $295M, target of $351M, and maximum of $379M.
With a focus on at-risk compensation for our most senior officers, the threshold goals shown above were set at a higher level than those set for employees who were not members of our executive leadership team, which group included Mr. Kellerman who was not a member of the executive leadership team at the time the targets were set. Senior officers, including each of our NEOs other than Mr. Kellerman, would need to achieve 75% of the target metrics to earn any payout under the plan. Pursuant to the terms of 2022 AIP applicable to Mr. Kellerman (and other non-executive-leadership team members), the Company would need to achieve 50% of the target metrics in order for Mr. Kellerman to earn any payout under the plan. For non-executive employees, including Mr. Kellerman due to his position at the time of plan approval, the Compensation Committee subsequently approved paying out the 2022 AIP at the 25% of target opportunity level for retention and morale purposes in light of the significant transformation the Company was undergoing. As discussed below, Mr. Kellerman did not receive a payout under the 2022 AIP because his employment terminated before the end of 2022.
The purpose of the modifier metric is to increase or decrease the payout under the 2022 AIP to the extent the level of Reported Adjusted EBITDA achievement approaches the target level of achievement under the plan. This allows for a more narrow payout closer to the EBITDA target and faster acceleration or deceleration as results are further away from the target, further reinforcing the pay for performance intent of the AIP. In order to accomplish this,
1For purposes of the 2022 AIP, the Company defines (i) “Reported Adjusted EBITDA” as net income (loss) as reflected in our quarterly and annual financial statements, adjusted for stock-based compensation, depreciation and amortization, interest expense, other (income) expense net, provision for (benefit from) income taxes, change in fair value of contingent consideration, impairment of certain long-lived and right-of-use assets, litigation settlements, restructuring charges, shareholder activism response costs, certain business transformation and strategic growth initiatives costs, impairment of certain intangible assets, a loss contingency/settlement related to a contract dispute, certain acquisition related costs, and as applicable, other special items, and (ii) “Reported Revenue” as GAAP revenue as reflected in our quarterly and annual financial statements.
the weight of the modifier metric under the 2022 AIP increases incrementally between threshold and target achievement of the Reported Adjusted EBITDA goal as set forth below.
| | | | | | | | | | | | | | | | | | | | |
| Achievement of Reported Adjusted EBITDA Target | 75% or below | 80% | 85% | 90% | 95% | 100% -125% |
| Weight of Reported Adjusted EBITDA Performance | 100% | 90% | 80% | 70% | 60% | 50% |
| Weight of Reported Revenue Performance | 0% | 10% | 20% | 30% | 40% | 50% |
Under the 2022 AIP, the final plan achievement is equal to the greater of (i) the level of achievement calculated using both Reported Adjusted EBITDA performance and Reported Revenue Performance, weighted as set forth above, or (ii) the level of achievement calculated based only upon Reported Adjusted EBITDA, weighted at 100%.
Once the final plan achievement number has been calculated, payouts under the 2022 AIP are then determined based on the “Executive Plan Funding” level, as illustrated in the table below (with percentages interpolated linearly between these points). The Executive Plan Funding levels are intended to provide executive officers with a steeper payout curve to the extent performance levels are more than 10% above or below the target level of performance. This Executive Plan Funding modifier did not apply to Mr. Kellerman's 2022 AIP benefit due to his non-executive leadership position at the time of plan approval.
| | | | | | | | | | | | | | | | | | | | | | | | | | | | | | | | | | | | | | | | | |
| Final Plan Achievement (%) | <70 | 75 | 80 | 85 | 90 | 95 | 100 | 105 | 110 | 115 | 120 | 125 | >125 |
| Executive Plan Funding level (as a percentage of target) | 0 | 50 | 67 | 81 | 90 | 95 | 100 | 105 | 110 | 119 | 133 | 150 | 150 |
2022 AIP Results and Payouts
The Company’s Reported Adjusted EBITDA, as measured under the 2022 AIP, was $14.9M, while the Company’s Reported Revenue was $288.8M. Based upon these results, the Compensation Committee determined that the final plan achievement fell below the minimum threshold payout level for each of the then-serving NEOs. Accordingly, no bonus was paid under the AIP to the then-serving NEOs for the 2022 plan year. Mr. Kellerman was not eligible to receive a payment under the AIP due to his resignation of employment.
The table below sets forth the 2022 AIP target payout opportunities and payouts to each of our NEOs based upon 2022 performance:
| | | | | | | | |
| NEO | Target Payout Opportunity (as % of Base Salary) | 2022 AIP Payout |
| Matthew Krepsik | 100% | $0 |
| Scott Raskin | 100% | $0 |
| Yuneeb Khan | 75% | $0 |
| Connie Chen | 60% | $0 |
| Steven Boal | 100% | $0 |
| Pamela Strayer | 75% | $0 |
| John Kellerman | 40% | $0 |
Long-Term Incentive Program
Under our Long-term Incentive (LTI) program, the Compensation Committee awards long-term equity incentive awards to our NEOs, the purpose of which is to:
•motivate and reward sustainable long-term performance;
•align delivered long-term pay with the returns experienced by COVID-19, suchstockholders; and
•attract and retain talent.
For 2022, the annual long-term incentive grants under the 2022 LTI Program were delivered in the form of restricted stock units subject to (i) time-based and (ii) performance-based vesting conditions ("RSUs" and "PSUs", respectively), with the following key elements to drive Company performance and align with stockholder interests:
| | | | | |
| RSUs | •50% of target long-term incentive opportunity •Ratable quarterly time-based vesting over a four-year period |
| PSUs | •50% of target long-term incentive opportunity •Three-year performance period ending on March 1, 2025 •Performance-based vesting conditions satisfied with respect to 1/3 of PSUs subject to award based upon achievement of stock price hurdles $9.735, $12.98, and $16.225 •If a stock price hurdle is achieved in the first year (or, in the case of Mr. Khan, first seven months) of the performance period, then in alignment with long-term incentive intent, 50% of earned shares will be subject to further vesting conditions |
2022 LTI Program Pay for Performance Alignment
For 2022, as wedescribed above, for each NEO other than Mr. Kellerman, 50% of the LTI awards granted to the NEOs pursuant to the Company’s annual LTI award program were granted in the form of RSUs, while the other 50% were granted in the form of PSUs.
The Compensation Committee awarded a portion of 2022 LTI awards in the form of RSUs because it believes that RSUs help stabilize retention during periods of stock price volatility. By contrast, the PSUs have value if and only to the extent that the pre-established Company stock price hurdles have been met. The Compensation Committee selected Company stock price as the sole performance metric applicable to the 2022 LTI PSU awards in order to strongly align NEO interests and compensation with the returns experienced by stockholders. The Compensation Committee designed the PSU stock price hurdles to be challenging, but achievable with strong performance.
Under the 2022 PSU awards, a stock price hurdle will be met, and one third of the units thereunder will become vested, on the last day of any period of 20 consecutive trading days during the first halfperformance period ending on March 1, 2025 during which the closing price of the Company’s common stock on the NYSE equals or exceeds the stock price hurdle, subject to the NEO’s continuous service through such date except as otherwise provided in the PSU award agreement – see Potential Payments upon Termination, Change of Control or Certain Other Events below for further details. However, if a stock price hurdle is met within the first year thereof the date of grant, then 50% of the units which would otherwise vest on such date will instead vest on the first anniversary of the date the stock price hurdle is met to reinforce long-term performance, performance sustainability, and avoid focus on short-term outcomes.
Setting Award Levels Under the 2022 LTI Program
The Compensation Committee determined the size of the target award granted to each NEO based on a review of the market data provided by the Compensation Consultant, individual performance, current equity holdings, dilution relative to market practice, and total direct compensation mix.
The table below shows the approximate grant date fair value of the PSU and RSU grants approved by the Compensation Committee under the 2022 LTI Program, as well as the number of shares of Company common stock which the NEO is eligible to receive upon vesting of such grant.
| | | | | | | | | | | | | | | | | |
| 2022 LTI NEO Grants |
| Name | RSUs(1) | PSUs(2) | Total LTI |
| $ | # | $ | # | $ |
| Matthew Krepsik | 1,053,000 | 162,249 | 1,053,000 | 162,250 | 2,106,000 |
| Scott Raskin | 1,400,000 | 215,716 | 1,400,000 | 215,716 | 2,800,000 |
| Yuneeb Khan | 1,350,000 | 470,383 | 1,350,000 | 470,383 | 2,700,000 |
| Connie Chen | 750,000 | 115,562 | 750,000 | 115,562 | 1,500,000 |
| Steven Boal | 2,500,000 | 385,208 | 2,500,000 | 385,208 | 5,000,000 |
| Pamela Strayer | 1,350,000 | 208,012 | 1,350,000 | 208,012 | 2,700,000 |
(1)The Compensation Committee approved equity awards under the 2022 LTI Program for the executive officers (other than Mr. Kellerman) with a fixed grant date dollar value. The number of units granted subject to the PSU and RSU was determined by dividing the approved dollar value by the closing stock price of the Company’s common stock on the grant date, which was August 1, 2022 for Mr. Khan ($2.87) and March 1, 2022 ($6.49) in the case of all other NEOs who received awards under the 2022 LTI Program.
(2)This table reflects the number of shares of Company common stock payable to the NEOs with respect to the PSU awards based upon satisfaction of all three applicable stock price hurdles. Due to the rules for how the grant date fair value of the long-term incentive awards must be calculated for GAAP accounting purposes, the 2022 Summary Compensation Table does not reflect the same PSU values as this table. PSUs shown here are also not reflective of actual payout amounts, which will still be determined based upon the satisfaction of stock price hurdles prior to the conclusion of the specific measurement period. Actual payout may be less than what is illustrated here, depending on the satisfaction of the applicable stock price hurdles.
2021 PSU and 2022 PSU Performance
For the 2021 LTI Program, the shares eligible to be earned under the PSU plan by our NEOs is trending below threshold. The 2022 PSUs relating to the 2022 LTI Program are currently tracking below threshold. Therefore, no shares have been earned or vested. This represented the alignment of pay and performance during these specific periods.
Additional LTI Awards for NEOs During 2022
In addition to the LTI program awards granted to the NEOs as part of Quotient’s annual award program as described above, certain NEOs received additional LTI awards during 2022 as set forth below, either as a result of hirings or promotions or for ongoing retention as key leaders in the business responsible for running key functions aligned with our strategy. With the departure of Mr. Boal as CEO, stability and retention of the leadership team became a primary interest of the Compensation Committee.
•Matthew Krepsik: In connection with his promotion to the position of CEO, effective June 1, 2022, Mr. Krepsik received (i) a grant of 600,000 stock options, with a four-year vesting schedule pursuant to which 1/48 of the shares vest on the first day of each month after the grant date, and (ii) a grant of 300,000 RSUs, with a four-year vesting schedule pursuant to 6.25% of the RSUs vest on each three-month anniversary of the grant date, in each case subject to continued employment through the applicable vesting date; except that in the case of the RSU grant, upon Mr. Krepsik's termination of employment as a result of death that occurs more than one year from the grant date, the RSU award will fully vest.
•Scott Raskin and Connie Chen: In order to promote retention following Mr. Boal’s departure from the Company, the Compensation Committee approved the following grants, effective July 1, 2022: (i) grants of stock option awards to each of Mr. Raskin and Ms. Chen in an amount of 375,000 and 150,000 shares, respectively, each subject to a four-year vesting schedule pursuant to which 1/48 of the shares vest on the first of each month after the grant date, and (ii) grants of RSU awards to Mr. Raskin and Ms. Chen in an amount of 178,500 and 75,000 shares, respectively, each of which has a four-year vesting schedule pursuant to 6.25% of the RSUs will vest on each three-month anniversary of the vesting commencement date, in each case, subject to continued employment through the applicable vesting date; except that in the case of the RSU grants, upon the executive's termination of employment as a result of death that occurs more than one year from the grant date, the RSU award will fully vest.
•Yuneeb Khan: In connection with his hiring, Mr. Khan received a sign-on grant of RSUs with a grant date fair value of $1,500,000, which RSUs are subject to a four-year vesting schedule pursuant to which 25% of the units become vested on the first anniversary of the vesting commencement date (August 1, 2022), and 6.25% of the units will become vested on each three-month anniversary thereafter, subject to continued employment through each applicable vesting date; except that in the case of the RSU grant, upon Mr. Khan's termination of employment as a result of death that occurs more than one year from the grant date, the RSU award will fully vest.
•John Kellerman: In connection with his appointment to the position of interim Chief Financial Officer, effective May 1, 2022, Mr. Kellerman received a grant of 10,000 RSUs, which were subject to vesting in full on December 31, 2022, subject to Mr. Kellerman’s continuous employment through that date. As noted above, Mr. Kellerman did not receive any grants under the 2022 LTI Program.
As noted above, certain of these additional LTI awards were provided in the form of stock options. Each of these stock options was granted with an exercise price equal to the closing stock price of the Company’s common stock on the date of grant. Because stock options will have value only if the value of Quotient’s stock increases following the grant date, the Compensation Committee believes that grants of stock options provide a strong link between executive pay and stockholder returns.
2023 Compensation and Policy Changes
Following its review of the executive compensation program and the Company's long-term business strategy, and in careful response to feedback from stockholders, the Compensation Committee approved certain changes described below effective for 2023. Because these changes went into effect in 2023, their impact will not be reflected herein; rather, their impact will be reflected in the proxy statement for our 2024 Annual Meeting.
Clawback Policy (to be implemented)
The SEC has adopted, and the NYSE will later in 2023 implement, a mandatory "clawback policy" rule requiring public companies to establish and enforce a policy to recover excess incentive compensation from executive officers if amounts were based on material misstatements in financial reports. We intend to adopt a clawback policy that aligns with the SEC and NYSE mandates.
Revisions to Peer Group for Pay Decisions in 2023
In accordance with our normal practice, the Compensation Committee reviewed a peer group analysis prepared by the Compensation Consultant to support pay decisions in 2023. In response to feedback from our stockholders, the Compensation Committee adjusted the peer group criteria for revenue and market capitalization in order to reflect Quotient's projected revenue and make these criteria more reflective of Quotient's current profile (as set forth below). Consequently, 13 new companies have been added to the 2023 peer group (as compared to the 2022 peer group), while 9 companies in the 2022 peer group were not included in the 2023 peer group.
Revised Peer Group Criteria for Pay Decisions in 2023
| | | | | | | | | | | |
| Element | Description | 2022 Criteria | 2023 Criteria |
| Revenue | Trailing Twelve Month ("TTM") revenue is within a range comparable to Quotient’s revenue. | Generally between 0.5x and 3.7x ($300M to $2B) of Quotient revenue. | Generally between 0.5x and 3.25x ($150M to $1B) of Quotient revenue. |
| Market Capitalization | Market capitalization is within a range comparable to Quotient’s market capitalization. | Generally between 0.5x and 4.0x ($500M to $4.1B) of Quotient market capitalization. | Generally between 0.75x and 5.0x ($150M to $1B) of Quotient market capitalization. |
Base Salary, Bonus, and LTI Opportunities
Base Salary. In setting base salary for executives in 2023, the Compensation Committee generally targeted toward the 50th percentile based on the updated and re-aligned peer group, and consequently did not approve any increase in base salary for Messrs. Krepsik and Khan, or for Ms. Chen. The Committee also approved increasing Mr. Khan's target bonus opportunity to 85% in recognition of his appointment as Chief Operating Officer and increased scope of responsibilities.
2023 AIP. The Compensation Committee set the focus for 2023 on revenues and the quality of revenue as assessed by a profitability metric, using Reported Adjusted EBITDA and GAAP revenue goals. Under the terms of the 2023 AIP, Quotient must achieve a minimum threshold Gross Profit in order to qualify for attainment of the GAAP revenue metric.
2023 LTI Program. The Compensation Committee approved the 2023 LTI program grants to certain of its executive officers, which were generally made 50% in the form of RSUs and 50% in the form of PSUs, with PSUs designed to incentivize both profitability and revenue growth over a three year performance period.
2023 Equity Incentive Plan
As will be disclosed in our 2023 Proxy Statement, the Compensation Committee authorized the Company to move forward with a new equity incentive plan proposal, for subsequent Board and stockholder approval, with provisions that are better aligned with stockholder interests and market practices, including:
•Preserving, but not increasing, the number of shares currently available under the 2013 Plan;
•Prohibiting the repricing of options and stock appreciation rights without stockholder approval; and
•Eliminating the annual increase in the shares available under the plan (the annual evergreen).
Stock Ownership Guidelines
Under our stock ownership guidelines, the CEO and all other NEOs are expected to accumulate and maintain a meaningful level of share ownership. Shares may be owned directly, owned jointly with or separately by the individual’s spouse, or held in trust for the benefit of the individual, the individual’s spouse or children. Under the guidelines, the CEO is expected to own shares of Quotient common stock equal to the lesser of (i) a value equal to five times the CEO's annual base salary and (ii) 200,000 shares; and all other NEOs are expected to own shares of Quotient common stock equal to the lesser of (i) a value equal to one times his or her annual base salary and (ii) 30,000 shares. Each NEO, including the CEO, is required to meet these expectations within 5 years of first becoming subject to the stock ownership guidelines.
As of December 31, 2022, of our then-serving NEOs, Mr. Raskin and Ms. Chen had already satisfied the stock ownership guidelines, and we believe Messrs. Krepsik and Khan are on track to meet the objective within the required time frame.
Consideration of Risk
The Compensation Committee conducted a risk assessment of Quotient’s compensation policies and practices which included a report from the Compensation Consultant. The Compensation Committee concluded that Quotient’s compensation programs are not reasonably likely to have a material adverse impact on our promotionQuotient, its business and media revenuesits value. Specifically, the Committee noted the following:
•Good balance of fixed and associated growth. variable pay does not encourage excessive risk taking
•Good mix of short-term and long-term pay for officers prevents undue focus on short-term results, and overlapping vesting periods for equity awards exposes management to consequences of decision-making during the period in which any risks would materialize
•Reported Revenue and Reported Adjusted EBITDA metrics fund the AIP, and payouts are subject to a maximum cap and require a threshold level of achievement
•Executive compensation is reviewed annually, including updates to the peer group
•Compensation Committee retains an independent compensation consultant
•Robust share ownership guidelines for executive officers
•Existence of a company-wide Code of Conduct Policy
•Robust prohibition against short sales, hedging and pledging activity
Executive Offer Letters
The full extentCompany generally executes an offer of employment before an executive joins the Company. In 2022, each of the impactNEOs (other than Mr. Boal) were employed pursuant to an offer letter agreement that set forth the terms and conditions of the COVID-19 pandemicNEO’s employment with us. This offer letter has no specific term, and provides for at-will employment.
In connection with Mr. Khan’s hiring as Chief Financial Officer and Treasurer of the Company, Mr. Khan entered into an offer letter agreement with us outlining the basic terms of his employment. In addition to setting forth Mr. Khan’s start date, starting base salary, 2022 AIP target payout opportunity, 2022 LTI Program awards, additional sign-on RSU award, and eligibility for the Company’s standard benefits programs, the offer letter agreement also provided for (i) a one-time, $75,000 lump sum payment to offset relocation costs associated with Mr. Khan’s move to Salt Lake City, subject to full or partial clawback in the event of certain qualifying terminations of employment prior to the first anniversary of his commencement of employment with the Company, (ii) a housing allowance of up to $10,000 per month for the first 12 months following Mr. Khan’s commencement of employment, subject to his continuous employment with the Company, (iii) reimbursement of expenses for tax preparation assistance not to exceed $5,000 per year for 2022 and 2023; and (iv) immigration support through the Company’s immigration counsel to apply for an initial visa for Mr. Khan’s household partner. As a condition of Mr. Khan’s employment under the offer letter agreement, he, like all other employees, was also required to execute an At-Will Employment, Confidential Information, Invention Assignment and Arbitration Agreement with the Company.
Severance and Change of Control Agreements
We believe that severance and change of control protections play valuable roles in attracting and retaining executive officers. In 2022, the Company was party to a Change of Control Severance Agreement with each of the NEOs, including Messrs. Khan and Kellerman, who each entered into these agreements in 2022 in connection with their appointments to the position of Chief Financial Officer and interim Chief Financial Officer, respectively. In May of 2022, amendments were made to the Change of Control Severance Agreements for Messrs. Krepsik and Raskin, and for Ms. Chen. In June of 2022, additional amendments were made to the Change of Control Severance Agreements for Mr. Raskin and Ms. Chen. Please see “Potential Payments upon Termination, Change of Control or Certain Other Events” for additional information regarding these amendments.
Tax and Accounting Implications
Under Financial Accounting Standard Board ASC Topic 718 we are required to estimate and record an expense for each award of equity compensation over the vesting period of the award. We record share-based compensation expense on an ongoing basis according to ASC 718.
Section 162(m) of the Internal Revenue Code ("Code") places a limit of $1 million on the amount of compensation deductible by a company in any one year with respect to compensation paid to certain of its officers, called covered employees. To maintain flexibility in compensating our executive officers in a manner that promotes varying corporate goals, the Compensation Committee has not adopted a policy that all compensation must be deductible, particularly given that the Company currently carries net operating losses.
401(k) Plan
We maintain a tax-qualified retirement plan that provides eligible employees with an opportunity to save for retirement on a tax advantaged basis. Eligible employees are able to participate in the 401(k) plan following the date they meet the plan’s eligibility requirements, and participants are able to defer a percentage of their eligible compensation subject to applicable annual Internal Revenue Code and plan limits. Participants are 100% vested in their deferrals. The 401(k) plan permits us to make matching contributions and profit sharing contributions to eligible participants. We currently make a discretionary matching contribution equal to 50% of salary deferrals, not to exceed the lesser of 3% of compensation or $6,000. Participants are vested 100% after one year of service in matching and profit sharing contributions allocated to their account. Both employee contributions and Company contributions are allocated to individual participant accounts, and then are invested in investment alternatives selected by each participant. The 401(k) plan is intended to qualify under Sections 401(a) and 501(a) of the Code.
Other Benefits
Our NEOs are eligible to participate in the same broad-based retirement, health and welfare, and business operations and financial results will depend on numerous evolving factors thatexpense reimbursement policies as other full-time salaried employees.
In certain circumstances, when necessary for business purposes, we may not be able to accurately predict. See Part I, Item 1A, Risk Factors,provide additional assistance for an additional discussion of risks related to COVID-19.executive relocation circumstances.
Non-GAAP Financial Measure and Key Operating Metrics
Adjusted Earnings Before Interest, Taxes, Depreciation and Amortization (“Adjusted EBITDA”), a non-GAAPnon-U.S. GAAP financial measure, is a key metric used by our management and our Board of Directors to understand and evaluate our core operating performance and trends, to prepare and approve our annual budget, to develop short and long-term operational plans, and to determine bonus payouts. In particular, we believe that the exclusion of certain income and expenses in calculating Adjusted EBITDA can provide a useful measure for period-to-period comparisons of our core business. Additionally, Adjusted EBITDA is a key financial metric used by the compensation
committee of our Board of Directors in connection with the determination of compensation for our executive officers. Accordingly, we believe that Adjusted EBITDA provides useful information to investors and others in understanding and evaluating our operating results in the same manner as for our management and Board of Directors.
Adjusted EBITDA excludes non-cash charges, such as depreciation, amortization and stock-based compensation, because such non-cash expenses in any specific period may not directly correlate to the underlying performance of our business operations and can vary significantly between periods. Additionally, it excludes the effects of interest expense,expense; income taxes,taxes; other (income) expense, net,net; change in fair value contingent consideration; impairment of escrowed sharescertain long-lived and contingent consideration, net,right-of-use assets; litigation settlements; restructuring charges; shareholder activism response costs; certain business transformation and strategic growth initiatives costs; impairment charges for capitalized software development costs, charges related to Enterprise Resource Planning (“ERP”) software implementation costs,of certain acquisition related costs, restructuring charges andintangible assets; a loss contingency/settlement related to a contract dispute.dispute; and certain acquisition related costs. We exclude certain items because we believe that these costs (benefits) do not reflect expected future operating expenses. Additionally, certain items are inconsistent in amounts and frequency, making it difficult to contribute to a meaningful evaluation of our current or past operating performance.
Net loss and Adjusted EBITDA for each of the periods presented were as follows:
| | | Year Ended December 31, | | Year Ended December 31, |
| | 2020 | | 2019 | | 2018 | | 2022 | | 2021 | | 2020 |
| | (in thousands) | | (in thousands) |
| Net loss | Net loss | $ | (65,381) | | | $ | (37,057) | | | $ | (28,318) | | Net loss | $ | (76,511) | | | $ | (45,568) | | | $ | (65,381) | |
| Adjusted EBITDA | Adjusted EBITDA | 46,037 | | | 45,150 | | | 57,612 | | Adjusted EBITDA | $ | 14,857 | | | $ | 41,551 | | | $ | 46,037 | |
Our use of Adjusted EBITDA has limitations as an analytical tool, and youone should not consider it in isolation or as a substitute for analysis of our results as reported under U.S. GAAP. Some of these limitations are:
•although depreciation and amortization are non-cash charges, the assets being depreciated and amortized may have to be replaced in the future, and Adjusted EBITDA does not reflect cash capital expenditure requirements for such replacements or for new capital expenditure requirements;
•Adjusted EBITDA does not reflect changes in, or cash requirements for, our working capital needs;
•Adjusted EBITDA does not reflect interest and tax payments that may represent a reduction in cash available to us;
•Adjusted EBITDA also does not include the effects of stock-based compensation,compensation; depreciation; amortization of acquired intangible assets,impairment charges for capitalized software development costs,charges related to ERP software implementation costs, netassets; change in fair value of escrowed shares and contingent consideration,consideration; interest expense,expense; other (income) expense, net,net; provision for income taxes,taxes; impairment of certain acquisition related costs,long-lived and right-of-use assets; litigation settlements; restructuring chargescharges; shareholder activism response costs; certain business transformation and strategic growth initiatives costs; impairment of certain intangible assets; a loss contingency/settlement related to a contract dispute; and certain acquisition related costs; and
•other companies, including companies in our industry, may calculate Adjusted EBITDA differently, which reduces its usefulness as a comparative measure.
A reconciliation of Adjusted EBITDA to net loss, the most directly comparable U.S. GAAP financial measure, for each of the periods presented is set forth as follows:
| | | Year Ended December 31, | | Year Ended December 31, |
| | 2020 | | 2019 | | 2018 | | 2022 | | 2021 | | 2020 |
| | (in thousands) | | (in thousands) |
| Net loss | Net loss | $ | (65,381) | | | $ | (37,057) | | | $ | (28,318) | | Net loss | $ | (76,511) | | | $ | (45,568) | | | $ | (65,381) | |
| Adjustments: | Adjustments: | | Adjustments: | |
| Stock-based compensation | Stock-based compensation | 28,371 | | | 32,137 | | | 31,386 | | Stock-based compensation | 32,453 | | | 22,812 | | | 28,371 | |
| Depreciation and amortization | Depreciation and amortization | 36,352 | | | 31,437 | | | 25,041 | | Depreciation and amortization | 17,929 | | | 29,464 | | | 36,352 | |
| Acquisition related costs and other (1) | 12,361 | | | 7,670 | | | 7,221 | | |
Change in fair value of escrowed shares and contingent
consideration, net | 20,234 | | | 1,571 | | | 13,190 | | |
| Other (1) | | Other (1) | 35,851 | | | 14,433 | | | 12,361 | |
Change in fair value of contingent
consideration | | Change in fair value of contingent
consideration | — | | | 1,392 | | | 20,234 | |
| Interest expense | Interest expense | 14,521 | | | 13,955 | | | 13,411 | | Interest expense | 5,641 | | | 15,177 | | | 14,521 | |
| Other income, net | (1,140) | | | (5,223) | | | (4,801) | | |
| Other income (expense), net | | Other income (expense), net | (1,028) | | | 210 | | | (1,140) | |
| Provision for income taxes | Provision for income taxes | 719 | | | 660 | | | 482 | | Provision for income taxes | 522 | | | 3,631 | | | 719 | |
| Total adjustments | Total adjustments | $ | 111,418 | | | $ | 82,207 | | | $ | 85,930 | | Total adjustments | $ | 91,368 | | | $ | 87,119 | | | $ | 111,418 | |
| | Adjusted EBITDA | Adjusted EBITDA | $ | 46,037 | | | $ | 45,150 | | | $ | 57,612 | | Adjusted EBITDA | $ | 14,857 | | | $ | 41,551 | | | $ | 46,037 | |
(1)For the yearsyear ended December 31, 2022, Other includes a charge of $11.4 million related to the impairment of certain long-lived and right-of-use assets; $9.3 million related to litigation settlements; $8.9 million related to restructuring charges; $4.9 million related to shareholder activism response costs, and $1.3 million related to certain business transformation and strategic growth initiatives costs which includes $1.0 million related to the launch and scaling of Shopmium in the U.S. to replace coupons.com as our direct-to-consumer offering. For the year ended December 31, 2021, Other includes a charge of $9.1 million related to the impairment of certain intangible assets due to the circumstances surrounding the termination of our partnership with Albertsons, restructuring charges of $2.7 million, acquisition related costs of $1.7 million and $0.9 million in adjusted shareholder activism response costs. For the year ended December 31, 2020, 2019 and 2018, Other includes restructuring charges of $1.5 million, $4.3 million, and $4.4 million, respectively, and a $8.8 million loss contingency/settlement related to a contract dispute for the year ended December 31, 2020.with Albertsons associated with a guaranteed distribution fee arrangement, acquisition related costs of $2.0 million and restructuring charges of $1.5 million. Restructuring charges primarily relate to impairment charges for capitalized software development costs, and severance for certain executive management changes and impacted employees. Acquisition related costs primarily include certain bonuses contingent upon the acquired company meeting certain financial metrics over the contingent consideration period, andtogether with diligence, accounting, and legal
expenses incurred related to certain acquisitions. Additionally, beginning Q1 2022, shareholder activism response costs were excluded from Adjusted EBITDA. Prior period results have been revised for comparability which impacted Adjusted EBITDA for the year ended December 31, 2021.
This non-GAAP financial measure is not intended to be considered in isolation from, as substitute for, or as superior to, the corresponding financial measure prepared in accordance with U.S. GAAP. Because of these and other limitations, Adjusted EBITDA should be considered along with GAAP basedU.S. GAAP-based financial performance measures, including various cash flow metrics, net loss, and our other U.S. GAAP financial results.
Factors Affecting Our Performance2022 SUMMARY COMPENSATION TABLE
The following table provides information regarding all plan and non-plan compensation awarded to, earned by, or paid to, each of our NEOs during the year ended December 31, 2022 and, to the extent required by SEC disclosure rules, December 31, 2021 and December 31, 2020. Except as specified, the footnote disclosures below generally relate only to compensation for 2022. We included footnotes to compensation for prior years in the proxy statements relating to those years.
| | | | | | | | | | | | | | | | | | | | | | | | | | |
Name and
Principal
Position | Year | Salary
($) | Bonus
($) | Stock Awards ($)(1) | Option Awards ($)(2) | Non-Equity Incentive Plan Compensation ($)(3) | All Other
Compensation
($) | Total ($) |
Matthew Krepsik(11) | 2022 | 450,521 | — | 2,901,801 | 1,227,480 | — | 6,000(4) | 4,585,802 |
| CEO and Member of the Board | 2021 | 254,545 | — | 1,388,900 | — | 138,198 | 6,000 | 1,787,643 |
Yuneeb Khan(12) | 2022 | 226,515 | 150,000(5) | 3,249,824 | — | — | 125,000(6) | 3,751,339 |
| CFO, PAO and Treasurer | | | | | | | | |
| Connie Chen | 2022 | 380,000 | — | 1,445,696 | 243,210 | — | 6,000(4) | 2,074,906 |
| GC, Compliance Officer and Secretary | 2021 | 378,750 | — | 749,989 | — | 170,446 | 6,000 | 1,305,185 |
| 2020 | 368,804 | — | 712,492 | 599,871 | — | 6,552 | 1,687,719 |
Steven Boal(13) | 2022 | 250,000 | — | 6,823,034(7) | 7,328,996(7) | — | 2,130,769(8) | 16,532,799 |
| Former CEO | 2021 | 500,000 | — | 2,499,995 | — | 375,000 | 6,000 | 3,380,995 |
| 2020 | 500,000 | — | 2,499,986 | 1,999,575 | — | 7,032 | 5,006,593 |
Scott Raskin(14) | 2022 | 465,000 | — | 2,821,836 | 608,025 | — | 6,000(4) | 3,900,861 |
| Former President | 2021 | 461,250 | — | 1,399,996 | — | 345,977 | 6,000 | 2,213,223 |
| 2020 | 450,000 | — | 1,849,992 | 1,624,655 | — | 57,032 | 3,981,679 |
Pamela Strayer(15) | 2022 | 117,614 | — | 2,170,258(9) | — | — | — | 2,287,872 |
| Former CFO & Treasurer | 2021 | 450,000 | — | 1,399,996 | — | 253,125 | — | 2,103,121 |
| 2020 | 450,000 | — | 168,743 | — | — | 100,552 | 719,295 |
John Kellerman(16) | 2022 | 287,739 | — | 163,790(10) | — | — | 6,000(4) | 457,529 |
| Former Interim CFO | | | | | | | | |
Obtaining high quality promotions(1)The amounts reported in this column for 2022 reflect the aggregate grant date fair value of RSUs and increasingPSUs granted during the number of brand-authorized activations. Our abilityyear as computed in accordance with FASB ASC Topic 718. The assumptions used to grow revenue will depend upon our ability to shift more dollarscalculate these amounts are discussed in Note 10 to our platforms from our brand customers, continuenotes to obtain high quality promotions and increasethenumber of brand-authorized activations available through our platform. If we are unable to do any of these, growthconsolidated financial statements included in our revenue willAnnual Report on Form 10-K as of December 31, 2022, as filed with the SEC on March 16, 2023. In accordance with SEC rules, the amounts included in this column for the RSU awards granted during 2022 are calculated by multiplying the numbers of RSUs granted by the closing stock price of a share of Company common stock on the date of grant. The amounts included in this column for the PSU awards granted during 2022 are estimated based on a Monte Carlo simulation model as outlined in Note 10 of our financial statements included in our 2022 Annual Report. Under FASB ASC Topic 718, the vesting condition related to the PSU awards is considered a market condition and not a performance condition. Accordingly, there is no grant date fair value below or in excess of the amount reflected in the table above for the NEOs that could be adversely affected.calculated and disclosed based on achievement of the underlying market condition. Note that the amounts reported in this column reflect the accounting cost for these stock awards, and do not correspond to the actual economic value that may be received by the NEOs from them.
Increasing revenue from advertisers(2)The amounts reported in this column for 2022 reflect the aggregate grant date fair value of the options granted during the year, as computed in accordance with FASB ASC Topic 718. The assumptions used to calculate these amounts are discussed in Note 10 to our notes to consolidated financial statements included in our Annual Report on our platform. Our ability to grow our revenue inForm 10-K as of December 31, 2022, as filed with the future depends upon our ability to continue to increase revenues from existing and new advertisersSEC on our platforms through national brand coupons, targeted media and measurement, and increasing the number of brands that are using our platforms within each advertiser.March 16, 2023.
Variability(3)The amounts reflected in promotional and media spend by advertisers or brandsthis column represent cash payments earned under our Annual Incentive Plan (AIP). For more information please see . Our revenues may fluctuate due to changes in promotional or media spending budgets of advertisers and“Compensation Elements – Annual Incentive Plan.” For 2022, NEOs did not receive cash payments under the timing of their promotional and media spending. Decisions by major advertisers to delay or reduce their promotional and media spending, move campaigns, or divert spending away from digital promotions or media could slow our revenue growth or reduce our revenues.AIP.
Ability to scale Quotient Retail Performance Media Platform and further integrate with additional Retailers.(4) Our ability to grow our revenues will depend upon on our ability to continue to successfully implement and scale Quotient Retailer Promotion Platform and Quotient Retail Performance Media Platform among retailers. If we are unable to continue to successfully maintain our Quotient Retailer Promotion Platform and Quotient Retail Performance Media Platform partners, or if our retail partners do not provide sufficient support to our platforms, the growth in our revenues will be adversely affected. Our ability to grow our revenue in the future is also dependentThe amount reported represents 401(k) matching contributions.
upon our ability to further integrate digital media and promotions into retailers’ loyalty or POS systems and other channels so that advertisers and retailers can more effectively engage consumers and drive their own sales.
Growth of our consumer selection and digital offerings. Our ability to grow our revenue in the future will depend on our ability to innovate and invest in promotion and media solutions, including Quotient Retailer Promotion Platform, Quotient Retail Performance Media Platform, sponsored search, mobile solutions for consumers, including digital print, mobile solutions and digital promotion offerings for specialty/franchise retail together with cash-back offers, leverage our reach to consumers and the strength of our platforms to broaden the selection and consumers use of digital coupons and rebates as well as in-lane targeted promotions, manage the transition from digital print coupons to digital paperless coupons as well as the transition from desktop to mobile platforms, and invest in solutions around our data and analytic capabilities, referred to as Quotient Analytics and Audiences, for advertisers and retailers.
International Growth
(5)The amount reported represents a sign-on bonus per Mr. Khan's offer letter dated March 1, 2022.
(6)The amount reported represents a relocation stipend, and Acquisitionshousing allowance per Mr. Khan's offer letter dated March 1, 2022.
(7). Our ability to grow our revenues will also depend on our ability to grow our operations and offerings in existing international markets and expand our business through selective acquisitions, similar to our acquisitions of Ahalogy, Crisp, Elevaate, SavingStar, Shopmium and Ubimo and their integrationThis amount includes the incremental fair value associated with the core businessmodification of Mr. Boal's outstanding equity awards in connection with his termination of employment to provide variously for repricing, accelerated vesting, or extension of the term of such awards, the total value of which was $10,133,028. This amount is required to be included per SEC disclosure rules and does not reflect a new grant. For more information, please see "Potential Payments upon Termination, Change of Control or Certain Other Events."
(8)The amount reported represents 401(k) matching contributions, and a cash severance payment of $2,000,000 and subsidized COBRA coverage having a value of $124,769 per Mr. Boal's Separation Agreement dated May 16, 2022.
(9)Ms. Strayer's LTI grant of $2,170,258 was cancelled upon her resignation from the Company.
Components of Our Results of Operations
Revenues
We generate revenues by delivering digital promotions, including coupons, rebates and coupon codes, and digital media through our platforms. Advertisers (CPGs) choose one or more of our offerings and are charged a fee for each selected offering. Our customers generally submit insertion orders(10)Includes 39,438 RSUs that outlinewere cancelled upon Mr. Kellerman's resignation from the terms and conditions of a campaign, including the channels through which the campaign will be run, the offerings for each selected channel, the type of content to be delivered, the timeframe of the campaign, the number of authorized coupon activations or media impressions and the pricing of the campaign. Substantially all of our revenues are generated from sales within the United States.
Coupons. We generate revenues,as consumers select, activate, or redeem a coupon or rebate offer through our platform by either saving it to a retailer loyalty account for automatic digital redemption, or printing it for physical redemption at a retailer.Coupon setup fees relates to the creation of digital coupons and set up of the underlying campaign on our proprietary platforms for tracking of related activations or redemptions. We recognize revenues related to coupon setup fees over time, proportionally, on a per transaction basis, using the number of authorized transactions per insertion order, commencing on the date of the first coupon transaction. Coupon transaction fees are generally determined on a per unit activation or per redemption basis, and are generally billed monthly. Insertion orders generally include a limit on the number of activations, or times consumers may select a coupon.Company.
Coupon Codes(11). We generally generate revenues when a consumer makes a purchase using a coupon code from our platform and completion of the order is reported to us. This leads to a transaction, and a distribution fee is generally paid to us. In the same period that we recognize revenues for the delivery of coupon codes, we also estimate and record a reserve, based upon historical experience, to provide for end-user cancellations or product returns which may not be reported until a subsequent date.Mr. Krepsik was appointed CEO effective May 24, 2022.
Digital Media(12). Our media services enable advertisers (CPGs)Mr. Khan was appointed CFO, PAO & Treasurer effective July 5, 2022, and retailers to distribute digital media to promote their brands and products on our websites, and mobile applications, and through a network of affiliate publishers and non-publisher third parties that display our media offerings on their websites or mobile applications. Revenue is generally recognized each time a digital media ad is displayed or each time a user clicks on the media ad displayed on the Company’s websites, mobile applications or on third party websites. Media pricing is generally determined on a percampaign,impression or per click basis and are generally billed monthly.Changes to the way we process and deliver media could affect whether revenue is recognized on a gross or net basis.was appointed COO effective February 22,2023.
Cost(13)Mr. Boal retired as CEO effective May 20, 2022 and left the Company June 29, 2022.
(14)Mr. Raskin stepped down as President effective March 31, 2023.
(15)Ms. Strayer resigned as CFO and Treasurer effective April 5, 2022.
(16)Mr. Kellerman served as Interim CFO from April 5, 2022 through July 5, 2022, and left the Company November 11, 2022.
GRANT OF PLAN-BASED AWARDS
The following table provides information regarding grants of Revenuesplan-based awards to our NEOs during Fiscal 2022:
Cost of revenues includes the costs resulting from distribution fees or revenue share. If we deliver a digital promotion or media on a retailer’s website or mobile applications or through its loyalty program, or the website or mobile applications of a publisher, we generally pay a distribution fee or revenue share to the retailers or publisher | | | | | | | | | | | | | | | | | | | | | | | | | | | | | | | | | | | |
| | Estimated Future Payouts Under Non-Equity Incentive Plan Awards(1) | Estimated Future Payouts Under Equity Incentive Plan Awards(2) | | | | |
| Name | Grant
Date | Threshold ($) | Target
($) | Maximum ($) | Threshold
(#) | Target
(#) | Maximum
(#) | All Other Stock Awards: Number of Shares of Stock or Units (#)(3) | All Other Option Awards: Number of Securities Underlying Options
(#) | Exercise or base price of option awards
($/Sh) | Grant Date Fair Value of Stock And Option Awards ($)(5) |
| Matthew Krepsik | — | | 250,000 | | 500,000 | | 750,000 | | — | | — | | — | | — | | — | | — | | — | |
| 3/1/2022 | — | | — | | — | | 54,083 | | 162,250 | | 162,250 | | — | | — | | — | | 639,805 | |
| 3/1/2022 | — | | — | | — | | — | | — | | — | | 162,249 | | — | | — | | 1,052,996 | |
| 6/1/2022 | — | | — | | — | | — | | — | | — | | 300,000 | | — | | — | | 1,209,000 | |
| 6/1/2022 | — | | — | | — | | — | | — | | — | | — | | 600,000(4) | 4.03 | | 1,227,480 | |
| Yuneeb Khan | — | | 172,500 | | 345,000 | | 517,500 | | — | | — | | — | | — | | — | | — | | — | |
| 8/1/2022 | — | | — | | — | | 156,794 | | 470,383 | | 470,383 | | — | | — | | — | | 399,825 | |
| 8/1/2022 | — | | — | | — | | — | | — | | — | | 470,383 | | — | | — | | 1,349,999 | |
| 8/1/2022 | — | | — | | — | | — | | — | | — | | 522,648 | | — | | — | | 1,500,000 | |
| Connie Chen | — | | 114,000 | | 228,000 | | 342,000 | | — | | — | | — | | — | | — | | — | | — | |
| 3/1/2022 | — | | — | | — | | 38,520 | | 115,562 | | 115,562 | | — | | — | | — | | 455,699 | |
| 3/1/2022 | — | | — | | — | | — | | — | | — | | 115,562 | | — | | — | | 749,997 | |
| 7/1/2022 | — | | — | | — | | — | | — | | — | | 75,000 | | — | | — | | 240,000 | |
| 7/1/2022 | — | | — | | — | | — | | — | | — | | — | | 150,000(4) | 3.20 | | 243,210 | |
| Steven Boal | — | | 250,000 | | 500,000 | | 750,000 | | — | | — | | — | | — | | — | | — | | — | |
| 3/1/2022 | — | | — | | — | | 128,402 | | 385,208 | | 385,208 | | — | | — | | — | | 1,519,003 | |
| | | | | | | | | | | | | | | | | | | | | | | | | | | | | | | | | | | |
| 3/1/2022 | — | | — | | — | | — | | — | | — | | 385,208 | | — | | — | | 2,500,000 | |
| 5/20/2022 | — | | — | | — | | — | | — | | — | | — | | 47,000 | | 4.19 | | 98,329(6) |
| 5/20/2022 | — | | — | | — | | — | | — | | — | | — | | 600,000 | | 4.19 | | 1,265,294(6) |
| 5/20/2022 | — | | — | | — | | — | | — | | — | | — | | 469,461 | | 4.19 | | 978,160(6) |
| 5/20/2022 | — | | — | | — | | — | | — | | — | | — | | 299,529 | | 4.19 | | 679,478(6) |
| 5/20/2022 | — | | — | | — | | — | | — | | — | | — | | 300,000 | | 4.19 | | 742,931(6) |
| 5/20/2022 | — | | — | | — | | — | | — | | — | | — | | 261,000 | | 4.19 | | 647,899(6) |
| 5/20/2022 | — | | — | | — | | — | | — | | — | | — | | 800,000 | | 4.19 | | 2,282,211(6) |
| 5/20/2022 | — | | — | | — | | — | | — | | — | | — | | 240,000 | | 3.70 | | 69,496(6) |
| 5/20/2022 | — | | — | | — | | — | | — | | — | | — | | 600,000 | | 16.25 | | 58,075(6) |
| 5/20/2022 | — | | — | | — | | — | | — | | — | | — | | 503,000 | | 8.51 | | 507,124(6) |
| 6/29/2022 | — | | — | | — | | — | | — | | — | | 385,208 | | — | | — | | 41,090(6) |
| 6/29/2022 | — | | — | | — | | — | | — | | — | | 385,208 | | — | | — | | 1,037,411(6) |
| 6/29/2022 | — | | — | | — | | — | | — | | — | | 177,809 | | — | | — | | 720,126(6) |
| 6/29/2022 | — | | — | | — | | — | | — | | — | | 177,809 | | — | | — | | 495,088(6) |
| 6/29/2022 | — | | — | | — | | — | | — | | — | | 223,463 | | — | | — | | 395,952(6) |
| 6/29/2022 | — | | — | | — | | — | | — | | — | | 150,602 | | — | | — | | 114,364(6) |
| Scott Raskin | — | | 232,500 | | 465,000 | | 697,500 | | — | | — | | — | | — | | — | | — | | — | |
| 3/1/2022 | — | | — | | — | | 71,905 | | 215,716 | | 215,716 | | — | | — | | — | | 850,639 | |
| 3/1/2022 | — | | — | | — | | — | | — | | — | | 215,716 | | — | | — | | 1,399,997 | |
| 7/1/2022 | — | | — | | — | | — | | — | | — | | 178,500 | | — | | — | | 571,200 | |
| 7/1/2022 | — | | — | | — | | — | | — | | — | | — | | 375,000(4) | 3.20 | | 608,025 | |
| Pamela Strayer | — | | 168,750 | | 337,500 | | 506,250 | | — | | — | | — | | — | | — | | — | | — | |
| 3/1/2022 | — | | — | | — | | 69,337 | | 208,012 | | 208,012 | | — | | — | | — | | 820,260 | |
| 3/1/2022 | — | | — | | — | | — | | — | | — | | 208,012 | | — | | — | | 1,349,998 | |
| John Kellerman | 3/1/2022 | — | | — | | — | | — | | — | | — | | 6,000(7) | — | | — | | 38,940 | |
| 5/1/2022 | — | | — | | — | | — | | — | | — | | 10,000(7) | — | | — | | 53,100 | |
| 8/1/2022 | — | | — | | — | | — | | — | | — | | 25,000(7) | — | | — | | 71,750 | |
(1)The Company's AIP is denominated in 100% cash payout to all NEOs; therefore, all amounts reflect cash, if any, issued under the Company's AIP. These amounts represent the threshold, target and maximum cash award levels set in 2022 under the AIP.
(2)The PSU awards, which were issued under the 2013 Plan, are subject to vesting based upon the Company's achievement of stock price goals during the period beginning on March 1, 2022 and ending on March 1, 2025. The PSU awards vest with respect to one-third installments if the Company's stock price achieves, for twenty consecutive trading days, a price per share that equals or exceeds the following thresholds: $9.735, $12.98, and $16.225; provided that if any threshold is included in our costmet before February 28, 2023, 50% of revenues. These costs are expensed as incurred. Wethe tranche will vest on that date and the remaining 50% will vest one year later. With the exception of certain qualifying terminations of employment (as described under “Potential Payments upon Termination, Change of Control or Certain Other Events”), the executive generally do not pay a distribution fee for a coupon, rebate or code which is offeredmust provide service through the website of the CPG or retailer that is offering the coupon, rebate or coupon code. From time to time, we have entered into arrangements pursuant to which we have agreed to the payment of minimum distribution or other service fees that are included in our cost of revenues.
Cost of revenues also includes personnel compensation costs, depreciation and amortization expense of equipment, software and acquired intangible assets associated with revenue producing technologies, amortization of certain exclusivity rights acquired under strategic partnerships, data center costs and third-party service fees including traffic acquisition costs which consists of payments related to delivering campaigns on certain networks or sites, and purchase of third-party data. Personnel costs related to costs of revenues include salaries, bonuses, stock-based compensation and employee benefits. These costs are primarily attributable to individuals maintaining our data centers and members of our network operations group, which initiates, sets up and delivers digital promotion and media campaigns. We capitalize costs related to software that is developed or obtained for internal use. Costs incurred in connection with internal software development for revenue producing technologies are capitalized and are amortized in cost of revenues over the internal use software’s useful life. The amortization of these costs begins when the internally developed software is ready for its intended use.
Operating Expenses
We classify our operating expenses primarily into three categories: sales and marketing, research and development and general and administrative. Our operating expenses consist primarily of personnel compensation costs and, to a lesser extent, professional fees and facilities expense. Personnel costs for each category of operating expenses generally include salaries, bonuses, stock-based compensation and employee benefits.
Sales and marketing. Our sales and marketing expenses consist primarily of personnel compensation costs (including salaries and benefits, sales commissions, and stock-based compensation) provided to our sales and marketing personnel, brand marketing, amortization of acquired intangible assets, professional services, travel, trade shows and marketing materials. We expect to continue to invest in sales and marketingvesting date in order to support our growth and business objectives, while continuing to optimize our investmentvest in promotional and advertising activities.
Research and development. Our research and development expenses consist primarily of personnel compensation costs (including salaries and benefits, bonuses, and stock-based compensation) provided to our engineering personnel, costs of professional services associated with the ongoing development of new products and the enhancement of existing products; fees for design, testing, consulting, and other related services.
We believe that continued investment in technology, as well as business process and automation, is critical to attaining our strategic objectives. Our investment in research and development will be balanced with our continued operational and cost optimization efforts including headcount shift to low cost locations, as it provides us with the ability to invest in strategic areas, while managing growth in future periods.
General and administrative. Our general and administrative expenses consist primarily of personnel compensation costs (including salaries and benefits, bonuses and stock-based compensation) provided to our executives, finance, legal, human resources, compliance and otheradministrative personnel, as well as facility costs and other related overhead; accounting, tax and legal professional services fees and othercorporate expenses.
We expect to continue to incur additional general and administrative expenses in future periods as we continue to invest in corporate infrastructure to support our expected growth as well as additional compliance costs associated with being a public Company.
Change in fair value of escrowed shares and contingent consideration, net. The change in fair value of escrowed shares relates to the acquisition of certain exclusivity rights under a services and data agreement whereby a certain amount of shares were issued and placed in escrow. Those shares are subject to re-measurement until they are released from escrow. The change in fair value of contingent consideration is due to the re-measurement contingent consideration liabilities resulting from acquisitions based on the expected achievement of certain financial metrics over each acquisition’s respective contingent consideration period.his or her PSUs.
Interest expense
Interest expense consists of cash coupon interest, accretion of debt discounts and issuance costs and primarily relates to our debt obligations under our convertible senior notes issued during the fourth quarter of 2017.
Other Income (Expense), Net
Other income (expense), net, includes interest income on U.S. Treasury Bills held as cash equivalents and foreign currency exchange gains and losses.
Provision for Income Taxes
We recorded a provision for income taxes of $0.7 million, $0.7 million, and $0.5 million for the years ended December 31, 2020, 2019 and 2018, respectively. The provision for income taxes for the years ended December 31, 2020, 2019 and 2018 was primarily the impact of the indefinite lived deferred tax liabilities related to tax deductible goodwill, change in the geographical mix of earnings in foreign jurisdictions and state taxes.
Results of Operations
The following tables set forth our consolidated results of operations and our consolidated results of operations as a percentage of revenues for the periods presented
.
| | | | | | | | | | | | | | | | | | | | | | | | | | | | | | | | | | | |
| Year Ended December 31, |
| 2020 | | 2019 | | 2018 |
| (in thousands, except percentages) |
| Revenues | $ | 445,887 | | | 100.0 | % | | $ | 436,160 | | | 100.0 | % | | $ | 386,958 | | | 100.0 | % |
| Cost of revenues | 277,914 | | 62.3 | % | | 263,606 | | 60.4 | % | | 206,230 | | 53.3 | % |
| Gross margin | 167,973 | | | 37.7 | % | | 172,554 | | | 39.6 | % | | 180,728 | | | 46.7 | % |
| Operating expenses: | | | | | | | | | | | |
| Sales and marketing | 104,527 | | | 23.4 | % | | 101,244 | | | 23.2 | % | | 90,086 | | | 23.3 | % |
| Research and development | 40,316 | | | 9.0 | % | | 39,076 | | | 9.0 | % | | 46,873 | | | 12.1 | % |
| General and administrative | 54,177 | | | 12.2 | % | | 58,328 | | | 13.4 | % | | 49,805 | | | 12.9 | % |
Change in fair value of escrowed
shares and contingent consideration,
net | 20,234 | | | 4.5 | % | | 1,571 | | | 0.4 | % | | 13,190 | | | 3.4 | % |
| Total operating expenses | 219,254 | | | 49.2 | % | | 200,219 | | | 46.0 | % | | 199,954 | | | 51.7 | % |
| Loss from operations | (51,281) | | | (11.5) | % | | (27,665) | | | (6.3) | % | | (19,226) | | | (5.0) | % |
| Interest expense | (14,521) | | | (3.3) | % | | (13,955) | | | (3.2) | % | | (13,411) | | | (3.5) | % |
| Other income, net | 1,140 | | | 0.3 | % | | 5,223 | | | 1.2 | % | | 4,801 | | | 1.2 | % |
| Loss before income taxes | (64,662) | | | (14.5) | % | | (36,397) | | | (8.3) | % | | (27,836) | | | (7.3) | % |
| Provision for income taxes | 719 | | | 0.2 | % | | 660 | | | 0.2 | % | | 482 | | | 0.1 | % |
| Net loss | $ | (65,381) | | | (14.7) | % | | $ | (37,057) | | | (8.5) | % | | $ | (28,318) | | | (7.4) | % |
Disaggregated Revenue
(3)The RSUs granted under the 2013 Plan to each of the NEOs (other than Mr. Krepsik) in 2021 were granted subject to time-based vesting in quarterly installments over the four year period beginning on March 1, 2021, provided that the executive remains continually employed through each applicable vesting date. Mr. Krepsik’s May 1, 2021 award of 75,000 RSUs shall vest with respect to 25% of the award on May 1, 2022, and in equal quarterly installments thereafter until the May 1, 2025, and his May 1, 2021 award of 10,000 RSUs shall vest in full on May 1, 2022, in each case, subject to his continuous employment through each applicable vesting date. The RSUs granted on March 1, 2022 to Messrs. Krepsik, Raskin, and Boal, and Mses. Chen and Strayer, and the RSU granted on August 1, 2022 to Mr. Khan of 470,383 RSUs were granted subject to time-based vesting in quarterly installments over the four year period beginning on March 1, 2022 for NEOs (other than Mr. Khan whose begins on August 1, 2022). Mr. Khan's August 1, 2022 award of 522,648 RSUs will vest with respect to 25% of the award on August 1, 2023, and in equal quarterly installments thereafter until August 1, 2026. Mr. Krepsik's RSUs granted on June 1, 2022, and Mr. Raskin and Ms. Chen's RSUs granted on July 1, 2022 vest in quarterly installments over a four-year period beginning on June 1, 2022 for Mr. Krepsik and July 1, 2022 for Mr. Raskin and Ms. Chen. All RSUs granted are subject to the NEOs continuous employment through each applicable vesting date.
(4)Messrs. Krepsik and Raskin and Ms Chen's options vest pursuant to which 1/48 of the shares vest on the first day of each month after the grant date, subject to the NEOs continuous employment through each applicable vesting date.
(5)The amounts reported in this column reflect the grant date values of stock awards made to our NEOs computed in accordance with FASB ASC Topic 718. The amounts included in this column for the PSU awards granted during 2022 are estimated based on a Monte Carlo simulation model as outlined in Note 10 of our financial statements included in our 2022 Annual Report. Under FASB ASC Topic 718, the vesting condition related to the PSU awards is considered a market condition and not a performance condition. Accordingly, there is no grant date fair value below or in excess of the amount reflected in the table above for the NEOs that could be calculated and disclosed based on achievement of the underlying market condition. The assumptions used to calculate these amounts are discussed in Note 10 to our notes to consolidated financial statements included in our Annual Report on Form 10-K as of December 31, 2022, as filed with the SEC on March 16, 2023.
(6)Awards reflected in these rows for Mr. Boal reflect the incremental fair value associated with modifications to his outstanding equity awards in connection with his termination of employment.
(7)Mr. Kellerman's RSUs granted on March 1, 2022 and May 1, 2022 were granted subject to vesting in full on December 31, 2022, and his RSUs granted on August 1, 2022 vest in quarterly installments over a four-year period beginning on August 1, 2022, in each case, subject to continuous employment through each applicable vesting date.
Potential Payments upon Termination, Change of Control or Certain Other Events
We believe that severance and change of control protections play valuable roles in attracting and retaining executive officers.
Change of Control Severance Agreements
The following table presentsis a summary of the terms of the Change of Control Severance Arrangements for each of the NEOs, other than Messrs. Boal and Kellerman and Ms. Strayer, each of whom experienced a termination of employment during 2022.
During 2022, the Company was party to a Change of Control Severance Agreement with each of the NEOs which were in place prior to 2022. In 2022, with the commencement of Mr. Khan's employment as Chief Financial Officer and Treasurer, the Company entered into a Change of Control Severance Agreement effective July 5 2022, on the same general terms as other NEOs, with respect to his role.
During 2022, the Compensation Committee approved certain amendments to individual Change of Control Severance Agreements. On April 25, 2022, the Compensation Committee approved changes, effective May 1, 2022, to each of the Change of Control Severance Agreements for Messrs. Krepsik and Raskin and Ms. Chen. The changes to each Change of Control Agreement were approved by the Compensation Committee for the purpose of retaining our key employees, and minimizing the risk of their departure. These changes included: (i) modifying the “Change of Control Period” (as defined below) to commence six months, rather than three months, prior to a Change of Control, and (ii) modifying the definition of “Good Reason” (as defined below) to provide clarification regarding when a material reduction of the NEO’s duties, authorities, or responsibilities will constitute Good Reason. For Mr. Krepsik, in connection with his appointment as Chief Executive Officer, the material changes also included (i) extending the term of the agreement to May 1, 2025, (ii) providing for payment of severance benefits in the event of Mr. Krepsik's resignation of employment for "Good Reason" outside of the Change of Control Period, and (iii) increasing the severance benefits to which Mr. Krepsik is entitled in the event of a qualifying termination (both during and outside of the Change of Control Period). Additionally, the Compensation Committee approved further amendments to the Change of Control Severance Agreements for Mr. Raskin and Ms. Chen in June of 2022. The purpose of the June 2022 amendments, as explained further below, was to retain Mr. Raskin and Ms. Chen in order to prevent additional disruption which would be detrimental to the Company’s revenues disaggregated by type of services. The majority ofbusiness following Mr. Boal’s departure from the Company’s revenue is generated from sales within the United States.
| | | | | | | | | | | | | | | | | | | | | | | | | | | | | | | | | | | | | | | | | |
| | Year Ended December 31, | | 2019 to 2020 | | 2018 to 2019 |
| (in thousands, except percentages) | 2020 | | 2019 | | 2018 | | $ Change | | % Change | | $ Change | | % Change |
| Promotion | $ | 237,385 | | | $ | 246,479 | | | $ | 245,493 | | | $ | (9,094) | | | (4) | % | | $ | 986 | | | — | % |
| Media | 208,502 | | | 189,681 | | | 141,465 | | | 18,821 | | | 10 | % | | 48,216 | | | 34 | % |
| Total revenue | $ | 445,887 | | | $ | 436,160 | | | $ | 386,958 | | | $ | 9,727 | | | 2 | % | | $ | 49,202 | | | 13 | % |
Company.
Revenues
| | | | | | | | | | | | | | | | | | | | | | | | | | | | | | | | | | | | | | | | | |
| Year Ended December 31, | | 2019 to 2020 | | 2018 to 2019 |
| (in thousands, except percentages) | 2020 | | 2019 | | 2018 | | $ Change | | % Change | | $ Change | | % Change |
| Revenues | $ | 445,887 | | | $ | 436,160 | | | $ | 386,958 | | | $ | 9,727 | | | 2 | % | | $ | 49,202 | | | 13 | % |
Revenues increased by $9.7 million, or 2%, duringEach Change of Control Severance Agreement has a three-year term, which automatically renews for successive three-year periods thereafter, and any obligations of the year ended December 31, 2020, as compared to 2019. The increase was primarily due to growth in media revenue as a resultCompany will lapse upon the end of an increase in our media product offerings, partially offset by a decrease in revenues from digital promotion duethe term. Pursuant to the COVID-19 pandemic, as well asChange of Control Severance Agreements, if the NEO’s employment with the Company is terminated without "Cause" (as such term is defined in the Change of Control Severance Agreements and summarized below) and not by reason of death or "Disability" (as such term is defined in the Change of Control Severance Agreement), or in case of Messrs. Krepsik, Raskin or Khan, if the NEO terminates their employment with the Company for "Good Reason" (as such term is defined in the Change of Control Severance Agreement and summarized below), and, in any event, such termination does not occur within six months before or twelve months after a decrease"Change of Control" (as such term is defined in media revenues related to a portionthe Change of Control Severance Agreement) of the media business we exited duringCompany (the “Change of Control Period”), then, provided the year. During 2020, revenuesNEO signs and does not revoke a separation agreement and release of claims in favor of the Company and subject to the terms of the Change of Control Severance Agreement, the NEO will receive benefits as summarized in the table below and described more fully in the text following the table.
| | | | | | | | | | | |
| Name | Termination Event | Lump Sum (% of annual base salary) | Health Coverage Lump Sum (monthly COBRA premium factor) |
Matthew Krepsik(1) | Termination Without Cause/Resign for Good Reason | 100% | x 12 |
| Yuneeb Khan | Termination Without Cause/Resign for Good Reason | 100% | x 12 |
| Scott Raskin | Termination Without Cause/Resign for Good Reason | 100% | x 12 |
| Connie Chen | Termination Without Cause | 75% | x 9 |
(1)Increased from digital promotion75% of annual base salary and media campaigns were 53%a monthly COBRA premium factor of x9 as part of the May 1, 2022 amendments and 47%restatement of total revenues, respectively,Mr. Krepsik's Change of Control Severance Agreement.
As indicated in the table above, if the termination event occurs outside of the Change of Control Period, the NEO will receive the following benefits: (i) a lump-sum payment (less applicable withholding taxes) equal to 100% for Messrs. Krepsik, Raskin and Khan and 75% for Ms. Chen, of the NEO’s annual base salary as comparedin effect immediately prior to 57%the NEO’s termination date, and 43%(ii) a taxable lump-sum payment (less applicable withholding taxes) in an amount equal to the monthly COBRA premium that the NEO would be required to pay to continue the NEO’s group health coverage in effect on the date of total revenues, respectively,NEO’s termination of employment, multiplied by twelve for 2019.
CostMessrs. Krepsik, Raskin and Khan and nine for Ms. Chen. Notwithstanding the foregoing, pursuant to the June 2022 amendments to the Change of RevenuesControl Severance Agreements for each of Mr. Raskin and Gross Profit
| | | | | | | | | | | | | | | | | | | | | | | | | | | | | | | | | | | | | | | | | |
| Year Ended December 31, | | 2019 to 2020 | | 2018 to 2019 |
| (in thousands, except percentages) | 2020 | | 2019 | | 2018 | | $ Change | | % Change | | $ Change | | % Change |
| Cost of revenues | $ | 277,914 | | | $ | 263,606 | | | $ | 206,230 | | | $ | 14,308 | | | 5 | % | | $ | 57,376 | | | 28 | % |
| Gross profit | $ | 167,973 | | | $ | 172,554 | | | $ | 180,728 | | | $ | (4,581) | | | (3) | % | | $ | (8,174) | | | (5) | % |
| Gross margin | 38 | % | | 40 | % | | 47 | % | | | | | | | | |
CostMs. Chen, in the event a qualifying termination outside of revenuesa Change of Control Period occurs between June 10, 2022 and June 10, 2025 (the "Retention Period"), these executives will instead be entitled to receive the following: (i) a lump-sum payment (less applicable withholding taxes) equal to 150% or 200% (in the case of Ms. Chen and Mr. Raskin, respectively) of the NEO's annual base salary as in effect immediately prior to the NEO's termination date, (ii) a taxable lump-sum payment (less applicable withholding taxes) in an amount equal to the monthly COBRA premium that the NEO would be required to pay to continue the NEO's group health coverage in effect on the date of the NEO's termination of employment, multiplied by 18 or 24 (in the case of Ms. Chen and Mr. Raskin, respectively), and (iii) the NEO will receive a lump-sum payment (less applicable withholding taxes) equal to 150% or 200% (in the case of Ms. Chen and Mr. Raskin, respectively) of the NEO's annual bonus for the year ended December 31, 2020 increased by $14.3 million, or 5%,of termination at target level as comparedin effect immediately prior to the same period in 2019. The increase was primarily due toNEO's termination date.
Additionally, Ms. Chen’s amended Change of Control Severance Agreement provides that if a $8.8 million settlement related to a contract dispute resulting from a retailer's failure to perform certain obligations related to a guaranteed distribution fee arrangement, an increase in amortization expense of $3.5 million related to acquired intangible assets as well as certain exclusivity rights acquired under strategic partnerships, an increase in data center expenses of $1.5 million, and an increase in compensation costs, including stock-based compensation of $1.4 million. The increases were partially offset by a decrease in overhead expenses of $1.0 million related to facilities and infrastructure support and a net decrease of $0.3 million in data and traffic acquisition costs for offsite media on non-owned-and-operated properties, offset by an increase in distribution fees paid to our partners for media and promotions revenues delivered through their platforms.
Gross margin for the year ended December 31, 2020 decreased to 38% from 40%, as compared to the same period in 2019. The decrease was primarily due to an increase in amortization expense related to acquired intangible assets and a $8.8 million settlement related to a contract dispute, partially offset by the benefitqualifying termination occurs outside of the changeChange of performing certain media services underControl Period but within the specific directionRetention Period, then 50% of our customers resulting in recognizing revenue netthe total number of certain costs. During the third quarter of 2020, we exited the portion of media business that had gone through a delivery change resulting in recognizing revenues net of certain costs from gross.
We expect the costs associated with distributionshares subject to her then-outstanding and third-party service feesunvested equity awards subject solely to continue to increase in absolute dollarstime-based vesting conditions will vest and, in the future as we continue to expand and scale our distribution network and reach.
Sales and Marketing
| | | | | | | | | | | | | | | | | | | | | | | | | | | | | | | | | | | | | | | | | |
| Year Ended December 31, | | 2019 to 2020 | | 2018 to 2019 |
| (in thousands, except percentages) | 2020 | | 2019 | | 2018 | | $ Change | | % Change | | $ Change | | % Change |
| Sales and marketing | $ | 104,527 | | | $ | 101,244 | | | $ | 90,086 | | | $ | 3,283 | | | 3 | % | | $ | 11,158 | | | 12 | % |
| Percent of revenues | 23 | % | | 23 | % | | 23 | % | | | | | | | | |
Sales and marketing expenses increased by $3.3 million, or 3%, duringcase of stock options, become exercisable. Mr. Raskin’s amended Change of Control Severance Agreement provides that in the year ended December 31, 2020 as compared toevent of such a termination, 100% of the same period in 2019. The increase was primarily the resulttotal number of an increase in intangible asset amortization expense of $2.0 million related to our acquisitions, an increase in compensation costs of $2.0 million related to acquisitions and hiring additional employees to support our growth and business objectives, an increase in restructuring charges of $0.5 million related to severance for impacted employees and an increase in facilities expense of $0.2 million, partially offset by reduced spending in travel and entertainment costs of $1.4 million.shares subject
We expect to invest in sales and marketing in order to support our growth and business objectives.
Research and Development
| | | | | | | | | | | | | | | | | | | | | | | | | | | | | | | | | | | | | | | | | |
| Year Ended December 31, | | 2019 to 2020 | | 2018 to 2019 |
| (in thousands, except percentages) | 2020 | | 2019 | | 2018 | | $ Change | | % Change | | $ Change | | % Change |
| Research and development | $ | 40,316 | | | $ | 39,076 | | | $ | 46,873 | | | $ | 1,240 | | | 3 | % | | $ | (7,797) | | | (17) | % |
| Percent of revenues | 9 | % | | 9 | % | | 12 | % | | | | | | | | |
Researchto his then-outstanding and development expenses increasedunvested equity awards subject solely to time-based vesting conditions will vest and, in the case of stock options, become exercisable, and PSU awards granted to him on March 1, 2021 and March 1, 2022 will vest at target level. Furthermore, each outstanding stock option award held by $1.2 million,Mr. Raskin as of the termination date will be amended to extend the post-termination exercise period of the option as follows: (A) if the option has an exercise price that equals or 3%,exceeds the closing price of a share of the Company’s common stock as of his termination date, then the stock option will remain exercisable through the third anniversary of the termination date, and (B) if the option does not have an exercise price that equals or exceeds the closing price of a share of the Company’s common stock as of the termination date, then the stock option will remain exercisable through the earlier to occur of the third anniversary of the termination date and the date on which the option would have expired if Mr. Raskin’s employment had continued through the full term of the option.
Pursuant to the terms of the Change of Control Severance Agreements, if the NEO’s employment with the Company is terminated by the Company without Cause and not by reason of death or Disability or the NEO terminates his or her employment with the Company for Good Reason, and, in any event, such termination occurs during the year ended December 31, 2020, as comparedChange of Control Period, then, if the NEO signs and does not revoke a separation agreement and release of claims in favor of the Company and subject to the same periodterms of the Change of Control Agreement, the NEO will receive benefits as summarized in 2019. The increase was primarily duethe table below and described more fully in the text following the table.
| | | | | | | | | | | | | | |
| Name | Lump sum
% of annual base salary | Lump sum % of target annual incentive | Health coverage monthly COBRA premium factor | Outstanding and unvested equity at termination(1) |
Matthew Krepsik(2) | 150% | 150% | x 18 | 100% vesting of time-vesting Equity Awards |
| Scott Raskin | 150% | 150% | x 18 | 100% vesting of time-vesting Equity Awards |
| Yuneeb Khan | 150% | 150% | x 18 | 100% vesting of time-vesting Equity Awards |
| Connie Chen | 100% | 100% | x 12 | 100% vesting of time-vesting Equity Awards |
(1)As noted below, the Change of Control Severance Agreements provide that for any Equity Awards which are subject to an increaseperformance-based vesting, all such performance goals and other vesting criteria shall be treated as set forth in compensation coststhe underlying award agreement – see “Equity Incentive Awards” below for a description of $2.4 million relatedthe terms applicable to acquisitionsthe PSU awards held by each NEO in the event of a termination in connection with a Change of Control.
(2)Increased from 100% of annual base salary, 100% target annual bonus, and hiring additional employeesa monthly COBRA premium factor of x12 as part of the May 1, 2022 amendment and restatement of Mr. Krepsik's Change of Control Severance Agreement.
As indicated in the table above, if the termination event occurs during the Change of Control Period, the NEO will receive the following benefits: (i) a lump-sum payment (less applicable withholding taxes) equal to support our growth150% for Messrs. Krepsik, Raskin and business objectives, an increaseKhan and 100% for Ms. Chen of the NEO’s annual base salary as in restructuring chargeseffect immediately prior to the NEO’s termination date or, if greater, at the level in effect immediately prior to the Change of $0.3 million relatedControl; (ii) a lump-sum payment (less applicable withholding taxes) equal to severance150% for impacted employees, offset by an increase in capitalizationMessrs. Krepsik, Raskin and Khan and 100% for Ms. Chen of internal use software development costs of $1.5 million.
Duringthe NEO’s annual bonus for the year ended December 31, 2020, we capitalized internal use software development costs of $5.7 million,termination at target level, as comparedin effect immediately prior to $4.2 millionthe NEO’s termination date, or if greater, at the level in effect immediately prior to the Change of Control; (iii) a taxable lump-sum payment (less applicable withholding taxes) in an amount equal to the monthly COBRA premium that the NEO would be required to pay to continue NEO’s group health coverage in effect on the date of the NEO’s termination of employment, multiplied by eighteen for Messrs. Krepsik, Raskin and Khan and twelve for Ms. Chen; and (iv) 100% of the NEO’s then-outstanding and unvested Equity Awards (as such term is defined in the Change of Control Severance Agreement) will become vested in full and in the case of stock options and stock appreciation rights, will become exercisable; provided that in the case of any Equity Awards which are subject to performance-based vesting, all such performance goals and other vesting criteria will be treated as set forth in the underlying award agreement.
Notwithstanding the foregoing, pursuant to the June 2022 amendments to the Change of Control Severance Agreements for each of Mr. Raskin and Ms. Chen, if a qualifying termination occurs during a Change of Control Period and also during the year ended December 31, 2019. As we continueRetention Period, then Mr. Raskin and Ms. Chen will instead be entitled to investreceive the following benefits: (i) a lump-sum payment (less applicable withholding taxes) equal to 150% or 200% (in the case of Ms. Chen and Mr. Raskin, respectively) of the NEO's annual base salary as in our products and customer offerings to develop new product functionality, the higher capitalization of costs will result in lower research and development expenses.
We believe that continued investment in technology is critical to attaining our strategic objectives and we intend to balance our investment in research and development with our continued operational and cost optimization efforts. We expect to incur additional research and development expenses in future periods to expand our tools and products that will enable our business to scale and provide more offerings and platform capabilities to our customers.
General and Administrative
| | | | | | | | | | | | | | | | | | | | | | | | | | | | | | | | | | | | | | | | | |
| Year Ended December 31, | | 2019 to 2020 | | 2018 to 2019 |
| (in thousands, except percentages) | 2020 | | 2019 | | 2018 | | $ Change | | % Change | | $ Change | | % Change |
| General and administrative | $ | 54,177 | | | $ | 58,328 | | | $ | 49,805 | | | $ | (4,151) | | | (7) | % | | $ | 8,523 | | | 17 | % |
| Percent of revenues | 12 | % | | 13 | % | | 13 | % | | | | | | | | |
General and administrative expenses decreased by $4.2 million, or 7%, during the year ended December 31, 2020, as comparedeffect immediately prior to the same period in 2019. The decrease was primarily dueNEO's termination date; (ii) a lump-sum payment (less applicable withholding taxes) equal to a decrease in restructuring charges of $3.6 million due to150% or 200% (in the benefit of the non-recurring restructuring costs recorded in the third quarter of 2019 related to the impairment of capitalized software development costs associated with a non-strategic product and severance for certain executive management changes, a decrease in acquisition related charges of $1.4 million, a decrease in other administrative expenses of $0.8 million and a decrease in compensation costs of $0.1 million, partially offset by an increase in professional service fees of $1.7 million.
We expect to continue to incur additional general and administrative expenses in future periods as we continue to invest in corporate infrastructure and we intend to balance our investment in corporate infrastructure with our continued operational and cost optimization efforts.
Change in Fair Value of Escrowed Shares and Contingent Consideration, Net
| | | | | | | | | | | | | | | | | | | | | | | | | | | | | | | | | | | | | | | | | |
| Year Ended December 31, | | 2019 to 2020 | | 2018 to 2019 |
| (in thousands, except percentages) | 2020 | | 2019 | | 2018 | | $ Change | | % Change | | $ Change | | % Change |
Change in fair value of escrowed
shares and contingent
consideration, net | $ | 20,234 | | | $ | 1,571 | | | $ | 13,190 | | | $ | 18,663 | | | 1,188 | % | | $ | (11,619) | | | (88) | % |
During the year ended December 31, 2020, we recorded a charge
case of $20.2 million related to the change in fair value of contingent consideration resulting from the re-measurement of UbimoMs. Chen and Elevaate contingent consideration of $15.2 million and $5.0 million, respectively, as discussed in Note 3 (Fair Value Measurements) to our Consolidated Financial Statements.
Interest Expense and Other Income, Net
| | | | | | | | | | | | | | | | | | | | | | | | | | | | | | | | | | | | | | | | | |
| Year Ended December 31, | | 2019 to 2020 | | 2018 to 2019 |
| (in thousands, except percentages) | 2020 | | 2019 | | 2018 | | $ Change | | % Change | | $ Change | | % Change |
| Interest expense | $ | (14,521) | | | $ | (13,955) | | | $ | (13,411) | | | $ | (566) | | | 4 | % | | $ | (544) | | | 4 | % |
| Other income, net | 1,140 | | | 5,223 | | | 4,801 | | | (4,083) | | | (78) | % | | 422 | | | 9 | % |
| $ | (13,381) | | | $ | (8,732) | | | $ | (8,610) | | | $ | (4,649) | | | 53 | % | | $ | (122) | | | 1 | % |
Interest expense is related to the convertible senior notes issued during the fourth quarter of 2017, promissory note and finance lease obligations.
Other income, net consists primarily of interest income on U.S. Treasury Bills held as cash equivalents. The decrease in other income, net during the year ended December 31, 2020, as compared to the same period in 2019, was due to lower interest income earned on U.S. Treasury Bills held as cash equivalents, netMr. Raskin, respectively) of the effect of re-measuring balances in foreign currency due to exchange rate fluctuations.
Provision for Income Taxes
| | | | | | | | | | | | | | | | | | | | | | | | | | | | | | | | | | | | | | | | | |
| Year Ended December 31, | | 2019 to 2020 | | 2018 to 2019 |
| (in thousands, except percentages) | 2020 | | 2019 | | 2018 | | $ Change | | % Change | | $ Change | | % Change |
| Provision for income taxes | $ | 719 | | | $ | 660 | | | $ | 482 | | | $ | 59 | | | 9 | % | | $ | 178 | | | 37 | % |
The provision for income taxes of $0.7 millionNEO's annual bonus for the year ended December 31, 2020 was primarilyof termination at target level effective immediately prior to the impactNEO's termination date; and (iii) a taxable lump-sum payment (less applicable withholding taxes) in an amount equal to the monthly COBRA premium that the NEO would be required to pay to continue the NEO's group health coverage in effect on the date of the indefinite lived deferredNEO's termination of employment, multiplied by 18 or 24 (in the case of Ms. Chen and Mr. Raskin, respectively). In the event of such a termination, Mr. Raskin and Ms. Chen will each still be entitled to receive the equity acceleration described in the table above, but Mr. Raskin will also be entitled to amendment of each of his outstanding stock option awards to extend the post-termination exercise period of the options as follows: (A) if the option has an exercise price that equals or exceeds the closing price of a share of the Company’s common stock as of such termination date, then the option will remain exercisable through the third anniversary of the termination date, and (B) if the option does not have an exercise price that equals or exceeds the closing price of a share of the Company’s common stock as of the termination date, then the option will remain exercisable through the earlier to occur of the third anniversary of the termination date and the date on which such option would have expired if Mr. Raskin’s employment had continued through the full term of the option.
In the event that the severance and other benefits payable to the NEO constitute “parachute payments” under Section 280G of the Code and would be subject to the applicable excise tax, liabilities relatedthen the NEO’s severance benefits will be either (A) delivered in full or (B) delivered to such lesser extent which would result in no portion of such benefits being subject to the excise tax, deductible goodwill,whichever results in the receipt by the NEO on an after-tax basis of the greatest amount of benefits.
For purposes of each Change of Control Severance Agreement, “Cause” means the occurrence of any of the following: (i) NEO’s conviction of, or plea of “no contest” to, a felony or any crime involving fraud or embezzlement; (ii) NEO’s intentional misconduct; (iii) NEO’s material failure to perform his or her employment duties; (iv) NEO’s unauthorized use or disclosure of any proprietary information or trade secrets of the Company, or any of its subsidiaries, or any other party to whom NEO owes an obligation of nondisclosure as a result of his or her relationship with the Company or any of its subsidiaries; (v) an act of material fraud or dishonesty against the Company or any of its subsidiaries; (vi) NEO’s material violation of any policy of the Company or any of its subsidiaries or material breach of any written agreement with the Company or any of its subsidiaries; or (vii) NEO’s failure to cooperate with the Company in any investigation or formal proceeding.
For purposes of each Change of Control Severance Agreement, “Good Reason” means the NEO’s termination of his or her employment in accordance with the next sentence after the occurrence of one or more of the following events without the NEO’s express written consent: (i) a material reduction of the NEO’s duties, authorities, or responsibilities relative to NEO’s duties, authorities, or responsibilities in effect immediately prior to such reduction; (ii) a material reduction by the Company in the NEO’s rate of annual base salary; provided, however, that, a reduction of annual base salary that also applies to substantially all other similarly situated employees of the Company will not constitute “Good Reason”; (iii) a material change in the geographical mixgeographic location of earningsthe NEO’s primary work facility or location; provided, that a relocation of less than thirty-five miles from the NEO’s then present location will not be considered a material change in foreign jurisdictions and state taxes.
Liquidity and Capital Resources
We have financed our operations and capital expenditures primarily through cash flows from operation andgeographic location; or (iv) the issuancefailure of convertible senior notes. As of December 31, 2020, our principal source of liquidity were cash and cash equivalents of $222.8 million, which were held for working capital purposes. Our cash equivalents are comprised primarily of money market funds.
We have incurred and expect to continue to incur legal, accounting, regulatory compliance and other costs in future periods as we continue to invest in corporate infrastructure. In addition, we may use cash to fund acquisitions or invest in other businesses, or incur capital expenditures including leasehold improvements or technologies. We intend to continue to manage our operating expenses in line with our existing cash and available financial resources, and we anticipate we will incur increased spending in future periods in order to execute our long-term business plan and to support our growth to fund our operating expenses.
Our Board of Directors previously approved programs for us to repurchase shares of our common stock. In August 2019, our Board of Directors authorized a one-year share repurchase program (the “August 2019 Program”) for us to repurchase up to $50.0 million of our common stock from August 2019 through August 2020. During the year ended December 31, 2020, we did not repurchase any shares of our common stock and the August 2019 Program expired in August 2020.
In February 2021, the Company’s Board of Directors authorized the 2021 Program for the Company to repurchase upobtain from any successor or transferee of the Company an express written and unconditional assumption of the Company’s obligations to $50.0 millionthe NEO under the Change of its common stock from February 2021 through February 2022. Stock repurchases mayControl Severance Agreement. The Change of Control Severance Agreements for each of Messrs. Krepsik, Raskin and Khan and Ms. Chen provide that the first clause above also includes circumstances in which such material reduction results solely by virtue of the Company being acquired or made part of a larger entity (as, for example, when the Chief Financial Officer of the Company remains as such following a Change of Control but is not made the Chief Financial Officer of the acquiring corporation). In order for the NEO’s termination of employment to be made fromfor Good Reason, the NEO must not terminate employment with the Company without first providing the Company with written notice of the acts or omissions constituting the grounds for “Good Reason” within ninety days of the initial existence of the grounds for “Good Reason” and a cure period of thirty days following the date of written notice (the “Cure Period”), such grounds must not have been cured during such time, to time in open market transactions or privately negotiated transactions, and the Company may use a plan that is intended to meetNEO must terminate his employment within thirty days following the requirements of SEC Rule 10b5-1 to enable stock repurchases to occurCure Period.
during periods when the trading window would otherwise be closed. The Company may suspend, modify or terminate the 2021 Program at any time without prior notice.
We believe our existing cash, cash equivalents and cash flow from operations will be sufficient to meet our working capital and capital expenditure needs for at least the next 12 months. To the extent that current and anticipated future sources of liquidity are insufficient to fund our future business activities and requirements, we may be required to seek additional equity or debt financing.
Equity Incentive Awards
In the event additional financing is required from outside sources, weof a “Change in Control” as defined in the 2013 Plan, the acquiring or successor entity may assume or continue all or any awards outstanding under the 2013 Plan or substitute substantially equivalent awards. Any awards which are not be able to raise it on terms acceptable to usassumed or at all. During the period of uncertainty of volatility relatedcontinued in connection with a Change in Control or are not exercised or settled prior to the COVID-19 pandemic, weChange in Control will continueterminate effective as of the time of the Change in Control. The Compensation Committee may provide for the acceleration of vesting of any or all outstanding awards upon such terms and to monitor our liquidity. See Part I, Item 1A, Risk Factors,such extent as it determines, except that the vesting of all awards held by members of the Board who are not employees will automatically be accelerated in full. The 2013 Plan authorizes the Compensation Committee, in its discretion and without the consent of any participant, to cancel each or any outstanding award denominated in shares upon a Change in Control in exchange for a payment to the participant with respect to each share subject to the cancelled award of an additional discussionamount equal to the excess of risks relatedthe consideration to COVID-19.be paid per share of common stock in the Change in Control transaction over the exercise price per share, if any, under the award.
Under each of the Restricted Stock Unit Agreements pursuant to which the NEOs have been granted RSUs under the 2013 Plan, the NEO generally must be in service on the applicable vesting date in order to vest in the NEO's RSUs. However, in the case of RSUs granted on or after February 3, 2021, if the NEO’s employment or service with a “Participating Group Company” (as such term is defined in the 2013 Plan) (“Service”) terminates due to death on or after the first anniversary of the date of grant, then the RSUs held by the NEO will become fully vested. If the NEO has entered into a Change of Control Severance Agreement and the NEO’s Service is terminated by the Participating Company Group other than for “Cause” or by the NEO for “Good Reason” (as such terms are defined in the Change of Control Severance Agreements) during the Change of Control Period, then the RSUs will be treated as described above.
With respect to each of the outstanding PSU awards granted to the NEOs under the 2013 Plan, the applicable grant notices provide that in the event of the NEO’s termination of Service by reason of death occurring on or after the first anniversary of the grant date (but prior to a Change of Control), the number of PSUs associated with a 100% payout percentage (or, in the case of PSUs granted during 2022, the full number of units subject to the award) will become vested and be paid out. In November 2017, we issued $200.0 million aggregate principal amountthe event of 1.75% convertible senior notes duea termination of the NEO’s Service by reason of Disability prior to a Change of Control, a number of PSUs equal to the number of PSUs associated with a 100% payout percentage (or, in the case of the PSUs granted in 2022, the full number of units subject to the award), multiplied by a percentage equal to the number of months in the performance period that the NEO was in service divided by 36 (or, in the case of Mr. Khan, 31) will become vested and be paid out. In the event of a termination of the NEO’s Service by the Company other than for Cause (other than for death or Disability) that occurs on or after the first anniversary of the grant date (but prior to a Change of Control), a number of PSUs equal to the full number of PSUs subject to the award multiplied by a percentage equal to the number of months in the performance period during which the NEO was in service divided by 36 (or, in the case of Mr. Khan, 31) (in the case of the 2022 PSUs, reduced by any PSUs that had previously become vested) will become vested (to the extent, if any, based on actual performance) on the original vesting date that would have applied in the absence of the NEO’s termination. In the event of any other termination of Service prior to a Change of Control, the PSUs will immediately terminate.
With respect to each of the outstanding PSU awards granted to the NEOs under the 2013 Plan prior to 2022, in the event of a private placementChange of Control, if the acquiror assumes, continues or substitutes for the award, a number of PSUs shall be deemed eligible for vesting equal to qualified institutional buyers pursuant to Rule 144Athe greater of (i) actual performance against certain applicable performance metrics under the Securities Actawards, determined as if the date of 1933, as amended, (the “notes”the Change of Control was the final day of the performance period, or (ii) a number of PSUs associated with a 100% payout percentage (such higher number of PSUs, the “COC Eligible Units”). The notes are unsecured obligationsCOC Eligible Units will become vested on January 1, 2024, subject to the NEO’s continued Service through such date, except that in the event of the company and bear interest atNEO’s termination of Service during the Change of Control Period (as such term is defined in the NEO’s Change of Control Severance Agreement, if applicable) by the Company without Cause or by the NEO for Good Reason (as defined in the applicable Change of Control Severance Agreement) or by reason of the NEO’s death, the COC Eligible Units will immediately become vested upon the date of such termination or, if later, the date of the Change of Control (and in the event of any other termination, will immediately terminate). In the event of a fixed rateChange of 1.75% per annum, payable semi-annuallyControl in arrears on June 1 and December 1 of each year, commencing on June 1, 2018. The notes will mature on December 1, 2022, unless earlier repurchased, redeemed,which the acquiror does not assume, continue or converted in accordance with their terms.
Cash Flows
The following table summarizes our cash flowssubstitute for the periods presented (in thousands):
| | | | | | | | | | | | | | | | | |
| Year Ended December 31, |
| 2020 | | 2019 | | 2018 |
| Cash flows provided by operating activities | $ | 26,465 | | | $ | 31,818 | | | $ | 22,048 | |
| Cash flows used in investing activities | (11,369) | | | (16,824) | | | (21,119) | |
| Cash flows used in financing activities | (17,174) | | | (92,235) | | | (33,558) | |
| Effects of exchange rates on cash | 66 | | | (23) | | | 22 | |
| Net (decrease) increase in cash and cash equivalents | $ | (2,012) | | | $ | (77,264) | | | $ | (32,607) | |
Operating Activities
Cash provided by operating activities is a resultPSU award, the COC Eligible Units will become vested as of our net income or loss for the period adjusted for net non-cash income or expenses and changes in our operating assets and liabilities.
During 2020, net cash provided by operating activities of $26.5 million reflects our net loss of $65.4 million, adjusted for net non-cash expenses of $100.9 million, and cash used as a result of changes in working capital of $9.0 million. Non-cash expenses included depreciation and amortization, stock-based compensation, amortization of debt discount and issuance costs, allowance for credit losses, deferred income taxes, change in fair value of contingent consideration, and other non-cash expenses, including amortization of right-of-use asset and loss on disposal of property and equipment. The primary uses of cash from working capital items included payment for Ahalogy contingent consideration of $15.4 million, an increase in accounts receivable of $13.2 million, and a decrease in accrued compensation and benefits of $0.2 million, partially offset by an increase in accounts payable and other current liabilities of $24.3 million, a decrease in prepaid expenses and other current assets of $3.2 million, and an increase in deferred revenues of $1.1 million. During 2020, we made a payment of $8.8 million for settlement related to a contract dispute resulting from a retailer's failure to perform certain obligations related to a guaranteed distribution fee arrangement.
Investing Activities
Purchases of property and equipment which may vary from period-to-period dueimmediately prior to the timingChange of Control, subject to the expansion of our operations, the addition of headcount and the development activities relatedNEO’s continued Service through immediately prior to our future offerings. We expect to continue to invest in property and equipment and in the further development and enhancement of our software platforms for the foreseeable future. In addition, from time to time, we may consider potential acquisitions that would complement our existing service offerings, enhance our technical capabilities or expand our marketing and sales presence. Any future transaction of this nature could require potentially significant amounts of capital or could require us to issue our stock and dilute existing stockholders.such event.
During 2020, net cash used in investing activities
With respect to each of $11.4 million reflects purchasethe outstanding PSU awards granted to the NEOs during 2022, if a Change of propertyControl occurs while any portion of these PSUs are outstanding and equipmentunvested, then the PSUs will become vested upon the Change of $8.4 million, which includes capitalized software development costs,Control if and technology hardware and software to support our growth and paymentthe extent that the applicable stock price hurdles are satisfied, except that the value of $3.0 million to acquire certain exclusive rights pursuant to a strategic partnership agreement.
Financing Activities
Our financing activities have consisted primarily of repurchasesshare of common stock payments made for shares withheldused to cover payroll withholding taxesdetermine the vesting of such PSUs will be based solely on the amount or value of the per share consideration payable in such Change of Control. To the extent any PSUs do not become vested before or upon a Change of Control, and the issuanceacquiror assumes, continues or substitutes for such unvested PSUs, then all such unvested PSUs will become vested on March 1, 2025, subject to the NEO’s continuous service through that date, provided that if the NEO’s service is terminated during the Change of sharesControl Period by Quotient without Cause or by the NEO for Good Reason or by reason of common stock upon the exerciseNEO’s death, then all unvested 2022 PSUs will become vested as of stock options.
During 2020, net cash used in financing activities of $17.2 million reflects payments for Ahalogy contingent consideration of $14.6 million (initially measured and included as part of purchase consideration on the date of acquisition), payments made for shares withheldsuch termination. Upon any other termination of the NEO’s service following a Change of Control, the unvested PSUs will immediately terminate.
Under the Stock Option Agreements pursuant to coverwhich each of the required payroll withholding taxes of $7.2 million, and payments on promissory note and finance lease obligations of $0.4 million, partially offset by proceeds received from exercises ofNEOs, other than Mr. Krepsik, held unvested stock options under equity incentive plans, ESPP, and other, net of $5.0 million.
Off-Balance Sheet Arrangements
We did not have any off-balance sheet arrangements as of December 31, 2020.2022, unvested options thereunder will terminate immediately upon the NEO’s termination of Service, except as otherwise set forth in the NEO's Change of Control Severance Agreement, as described above.
Contractual ObligationsTermination Payments for NEOs Separated from Employment During 2022
The following table summarizes our future minimum payments under contractual commitmentsBoal Separation Agreement and Release
On May 16, 2022, the Company entered into a Separation Agreement and Release (the “Separation Agreement”) with Mr. Boal pursuant to which Mr. Boal ceased to serve as Chief Executive Officer of the Company, effective as of December 31, 2020 (in thousands):
| | | | | | | | | | | | | | | | | | | | | | | | | | | | | |
| Payments Due by Period |
| Total | | Less Than
1 Year | | 1 - 3 Years | | 3 - 5 Years | | More Than
5 Years |
| Convertible senior notes (1) | $ | 200,000 | | | $ | — | | | $ | 200,000 | | | $ | — | | | $ | — | |
| Interest obligations (2) | 6,708 | | | 3,500 | | | 3,208 | | | — | | | — | |
| Operating leases (3) | 24,703 | | | 4,636 | | | 7,014 | | | 5,086 | | | 7,967 | |
| Purchase obligations (4) | 43,155 | | | 23,465 | | | 14,970 | | | 714 | | | 4,006 | |
| Total | $ | 274,566 | | | $ | 31,601 | | | $ | 225,192 | | | $ | 5,800 | | | $ | 11,973 | |
(1)Represents aggregate principal amountMay 20, 2022, and separated from his employment with the Company, effective as of June 29, 2022. In consideration for Mr. Boal’s execution of the convertible senior notes due 2022, withoutSeparation Agreement and non-revocation of a mutual waiver and release of claims relating thereto, Mr. Boal became entitled to the effect of associated discounts.
(2)Representsfollowing benefits under the estimated interest obligation for our outstanding convertible senior notes that is payableSeparation Agreement in cash.
(3)We lease various office facilities, including our corporate headquarters in Mountain View, California and various sales offices, under operating lease agreements that expire through January 2031. The termslieu of the lease agreements provide for rental payments onbenefits payable under the Change of Control Severance Agreement to which he had been a graduated basis.party:
(4)•We have an unconditional purchase commitment for the years 2020 to 2034a lump sum cash severance benefit in the amount of $5.4 million$2,000,000, representing two times his annual base salary and target annual bonus;
•payment of Mr. Boal’s premiums for marketing arrangementscontinued health benefits provided under COBRA for 36 months after his termination date;
•full acceleration of vesting of all outstanding options, restricted stock units and performance stock units held by Mr. Boal, with performance stock units payable at 100% of the target level of performance; and
•amendment of outstanding stock options held by Mr. Boal to provide that (i) in the case of certain options relating to an aggregate of 2,776,990 shares of the purchaseCompany’s common stock, if the exercise price of such options exceeded the closing price of a 20-year suite license forshare of the Company’s common stock as of the day on which Mr. Boal ceased to serve as Chief Executive Officer of the Company (the “CEO End Date”), (A) the exercise price of each such option would be reduced to an amount equal to the closing price of a professional sports teamshare of the Company’s common stock as of the CEO End Date and (B) such option would remain exercisable through the third anniversary of Mr. Boal’s termination date and (ii) each outstanding option other than an options described in clause (i) above would remain exercisable through the earlier to occur of the third anniversary of Mr. Boal’s termination date and the date on which we use for sales and marketing purposes. Wesuch option would have unconditional purchase commitments, primarily related to distribution fees, ongoing software license fees and marketing services,expired if Mr. Boal’s employment had continued through the full term of $37.8 million.such option. The CEO End Date occurred on May 20, 2022.
The contractual commitment amountsfocus and objective of the Compensation Committee in approving the terms of the Separation Agreement with Mr. Boal described above was to facilitate a smooth and efficient transition of responsibility from Mr. Boal to our new CEO, on an accelerated timeline in response to settlement proposals by Engaged Capital. The Compensation Committee believes that in the table above are associated with agreements that are enforceablecontext of these unusual and legally binding. Obligations under contracts that we can cancel without a significant penalty are not includeddisruptive circumstances and the need to restore stability to the Company, the terms of the Separation Agreement, while atypical, were in the table above.
Critical Accounting Policies and Estimates
Our consolidated financial statements are prepared in accordance with U.S. generally accepted accounting principles. The preparationbest interests of these consolidated financial statements requires us to make estimates and assumptions that affect the reported amountsall of assets, liabilities, revenues, expenses and related disclosures. We evaluate our estimates and assumptions on an ongoing basis. Our estimates are based on historical experienceQuotient’s stockholders.
Strayer Consulting Agreement
In connection with Ms. Strayer’s resignation from employment, she entered into a Consulting Agreement with the Company dated as of April 15, 2022, pursuant to which she agreed to provide consulting and various other assumptionstransition services as an independent contractor during the period from April 5, 2022 through May 2, 2022. Ms. Strayer was not entitled to any cash compensation for her services during this period; however, Ms. Strayer's Consulting Agreement provided that we believecertain specified equity awards which were granted to be reasonableMs. Strayer during her service as an employee would continue to vest during this period as if she remained an employee of the Company. Ms. Strayer's Consulting Agreement included certain confidentiality covenants in favor of the Company. Ms. Strayer’s entry into Ms. Strayer's Consulting Agreement described above was conditioned upon her execution and non-revocation of a Separation Agreement and Release with Quotient. Other than the continued vesting of certain equity awards described above, Ms. Strayer was not entitled to receive any severance payments or benefits in connection with her termination of employment.
Kellerman Severance Benefits
Mr. Kellerman voluntarily resigned his employment with the Company effective as of November 11, 2022. As a consequence, he was not entitled to receive any severance benefits in connection with his resignation.
The following table sets forth the estimated incremental payments and benefits that would have been payable to our NEOs (excluding any NEO who experienced a termination of employment during 2022) in different termination scenarios under the circumstances. Our actual results could differ from these estimates.
We believeour executive compensation arrangements assuming that the assumptions and estimates associated withtriggering event occurred on December 30, 2022 (the last business combinations, goodwill and intangible assets, convertible senior notes, revenue recognition, stock-based compensation and income taxes haveday of the greatest potential impact on our consolidated financial statements. Therefore, we consider these to be our critical accounting policies and estimates. For further information on all of our significant accounting policies, see the notes to our consolidated financial statements.
Business Combinations
We account for acquisitions of entities that include inputs and processes and have the ability to create outputs as business combinations. Under the acquisition method of accounting, the total consideration is allocatedfiscal year). Due to the tangiblenumber of factors that affect the nature and identifiable intangible assets acquiredamount of any potential payments or benefits, actual payments and liabilities assumed based on their estimated fair values at the acquisition dates. The excess of the consideration transferred over those fair values is recorded as goodwill. During the measurement period, whichbenefits may be up to one year from the acquisition date, we may record adjustments to the assets acquired and liabilities assumed with the corresponding offset to goodwill.
In determining the fair value of assets acquired and liabilities assumed in a business combination, we use recognized valuation methods, including the income approach, market approach and cost approach, and apply present value modeling. Our significant estimates in the income, market or cost approach include identifying business factors such as size, growth, profitability, risk and return on investment and assessing comparable net revenues and operating income multiples in estimating the fair value. We also make certain assumptions specific to present value modeling valuation techniques which include risk-adjusted discount rates, rates of increase in operating expenses, weighted-average cost of capital, long-term growth rate assumptions and the future effective income tax rates.
The valuations of our acquired businesses have been performed by valuation specialists under our management’s supervision. We believe that the estimated fair value assigned to the assets acquired and liabilities assumed are based on reasonable assumptions and estimates that marketplace participants would use. However, such assumptions are inherently uncertain and actual results could differ from those estimates. Future changes in our assumptions or the interrelationship of those assumptions may negatively impact future valuations. In future measurements of fair value, adverse changes in discounted cash flow assumptions could result in an impairment of goodwill or intangible assets that would require a non-cash charge to the consolidated statements of operations and may have a material effect on our financial condition and operating results.
Acquisition related costs are not considered part of the consideration, and are expensed as general and administrative expense as incurred. Contingent consideration, if any is measured at fair value initially on the acquisition date as well as subsequently at the end of each reporting period, typically based on the expected achievement of certain financial metrics, until settlement at the end of the assessment period.
Goodwill and Intangible Assets
Goodwill is tested for impairment at least annually, and more frequently upon the occurrence of certain events that may indicate that the carrying value of goodwill may not be recoverable. Events or circumstances that could trigger an impairment test include, but are not limited to, a significant adverse changepresented in the business climate or in legal factors, an adverse action or assessment by a regulator, a loss of key personnel, significant changes in our use of the acquired assets or the strategy for our overall business, significant negative industry or economic trends, significant underperformance relative to operating performance indicators, a significant decline in market capitalization and significant changes in competition. We complete our annual impairment test during the fourth quarter of each year, at the reporting unit level, which is at the company level as a whole, since we operate in one single reporting segment.table below.
Intangible assets with a finite life are amortized over their estimated useful lives. Intangible assets are reviewed for impairment whenever events or changes in circumstances indicate the carrying amount of intangible assets may not be recoverable. | | | | | | | | | | | | | | | | | | | | |
| Name | Scenario | Cash
Severance ($) | COBRA
Benefits($) | RSU & PSU Awards ($)(1) | Option Awards ($)(2) | Total
($) |
| Matthew Krepsik | Termination Without Cause/Resignation
for Good Reason | 500,000 | | 39,680 | | — | | — | | 539,680 | |
| Termination for Death | — | | — | | 452,331 | | — | | 452,331 | |
| Termination for Disability | — | | — | | 292,263 | | — | | 292,263 | |
| Termination without Cause or Resignation
for Good Reason during the Change of Control Period | 1,500,000 | | 59,520 | | 2,361,394 | | — | | 3,920,914 | |
| Termination for Death During the Change of Control Period | — | | — | | 848,068 | | — | | 848,068 | |
| Change of Control | — | | — | | 848,068 | | — | | 848,068 | |
| Scott Raskin | Termination Without Cause/Resignation for Good Reason During the Retention Period | 1,860,000 | | 56,087 | | 2,993,814 | | 77,266 | | 4,987,167 | |
| Termination for Death | — | | — | | 533,650 | | — | | 533,650 | |
| Termination for Disability | — | | — | | 433,219 | | — | | 433,219 | |
| Termination without Cause or Resignation
for Good Reason during the Change of Control Period and Retention Period | 1,860,000 | | 56,087 | | 2,993,814 | | 77,266 | | 4,987,167 | |
| Termination for Death During the Change of Control Period | — | | — | | 1,081,441 | | — | | 1,081,441 | |
| Change of Control | — | | — | | 1,081,441 | | — | | 1,081,441 | |
| Yuneeb Khan | Termination Without Cause/Resignation for Good Reason | 460,000 | | 9,362 | | — | | — | | 469,362 | |
| Termination for Death | — | | — | | — | | — | | — | |
| Termination for Disability | — | | — | | 260,227 | | — | | 260,227 | |
| Termination without Cause or Resignation
for Good Reason during the Change of Control Period | 1,207,500 | | 14,043 | | 4,918,675 | | — | | 6,140,218 | |
| Termination for Death During the Change of Control Period | — | | — | | 1,613,414 | | — | | 1,613,414 | |
| Change of Control | — | | — | | 1,613,414 | | — | | 1,613,414 | |
| Connie Chen | Termination Without Cause During the Retention Period | 912,000 | | 39,491 | | 373,578 | | 15,453 | | 1,340,522 | |
We evaluate the need for an impairment charge relating to long-lived assets whenever events or changes in circumstances indicate that the carrying amount
| | | | | | | | | | | | | | | | | | | | |
| Termination for Death | — | | — | | 285,880 | | — | | 285,880 | |
| Termination for Disability | — | | — | | 232,077 | | — | | 232,077 | |
| Termination without Cause or Resignation
for Good Reason during the Change of Control Period and Retention Period | 912,000 | | 39,491 | | 1,326,498 | | 30,906 | | 2,308,895 | |
| Termination for Death During the Change of Control Period | — | | — | | 579,341 | | — | | 579,341 | |
| Change of Control | — | | — | | 579,341 | | — | | 579,341 | |
(1)The value of an asset may not be recoverable. The estimated future undiscounted cash flows associated with the asset are compared to the asset’s carrying amount to determine if a write down to a new depreciable basisaccelerated vesting of unvested RSUs and PSUs is required. If required, an impairment charge is recorded based on an estimate of future discounted cash flows.
We evaluate our intangible assets for potential impairment indicators at least quarterly and more frequently upon the occurrence of events that could impact prior conclusions. Judgment regarding the existence of impairment indicators is based on market conditions as well as the operational performance of our businesses. Additionally, future events could cause us to conclude that impairment indicators exist, and therefore long-lived assets could be impaired.
We consider the following to be some examples of indicators that may trigger an impairment review: (i) actual undiscounted cash flows significantly below historical or projected future undiscounted cash flows for the associated assets; (ii) significant changes in the manner or use of the assets or in our overall strategy with respect to the manner or use of the acquired assets or changes in our overall business strategy; (iii) significant negative industry or economic trends; (iv) increased competitive pressures; and (v) a significant decline in ourclosing stock price for a sustained periodon December 30, 2022, which was $3.43 per share. For the purpose of time.
Once we determine that a potential impairment indicator exists, we performcalculating the test for recoverability by comparing the estimated future undiscounted cash flows associated with the intangible assets with the intangible asset’s carrying amount. Where the carrying value of the intangible asset exceedsacceleration of PSU awards in connection with a Change of Control in the future undiscounted cash flows associatedabsence of a termination of employment, this table assumes that such PSUs were not assumed, continued or substituted by the acquiror in connection with the intangible assets, it is determined that theChange of Control.
(2)The value of those intangible assets cannot be recovered. For an intangible asset failing the recoverability test, an impairment chargeaccelerated vesting of unvested stock options is recorded forbased on the difference between the carrying valueclosing stock price on December 30, 2022, which was $3.43 per share, and the estimated fair value.exercise price per option multiplied by the number of unvested options. This does not reflect any dollar value associated with the acceleration of unvested stock options with exercise prices in excess of $3.43 per share.
Raskin Separation Agreement and Release
On January 18, 2023, Mr. Raskin agreed to step down as President of Quotient, effective as of March 31, 2023. As a result of this termination of employment by Quotient without “Cause” (as defined in Mr. Raskin’s Change of Control Severance Agreement), he became eligible for the severance benefits to which he was entitled upon a termination without “Cause” during the Retention Period under his Change of Control Severance Agreement (as described above). As a condition of Mr. Raskin’s receipt of these severance benefits, Mr. Raskin signed a Separation and Release Agreement with Quotient, dated as of March 31, 2023, which included a release of claims in favor of Quotient.
Outstanding Equity Awards as of December 31, 2022
The key assumptions used infollowing table sets forth information regarding equity awards held by our estimates of projected cash flow of our intangible assets deal largely with forecasts of sales levels, gross margins, and operating costs. These forecasts are typically based on historical trends and take into account recent developments as well as our plans and intentions. Any material change in our assumptions could significantly impact projected future cash flows of the intangible assets and these factors are considered in evaluating impairment. Other factors, such as increased competition or a decrease in the desirability of our products, could lead to lower projected sales levels, which would adversely impact cash flows. A significant decrease in cash flows in the future could result in an impairment of long-lived assets.NEOs at December 31, 2022.
Convertible Senior Notes
In accounting for the issuance of the notes, we separated the notes into liability and equity components. The carrying amount of the liability component was calculated by measuring the fair value of a similar liability that does not have an associated convertible feature. The carrying amount of the equity component representing the conversion option was determined by deducting the fair value of the liability component from the par value of the notes as a whole. This difference represents a debt discount that is amortized to interest expense over the terms of the notes. The equity component is not remeasured as long as it continues to meet the conditions for equity classification. In accounting for the issuance costs related to the notes, we allocated the total amount incurred to the liability and equity components. Issuance costs attributable to the liability components are being amortized to expense over the contractual term of the notes, and issuance costs attributable to the equity component were netted with the equity component in additional paid-in capital.
Revenue Recognition
We primarily generate revenue by providing digital media and promotions solutions to our customers and partners. Revenues are recognized when control of the promised goods or services is transferred to our customers, in an amount that reflects the consideration we expect to be entitled to in exchange for those goods or services.
We determine revenue recognition through the following steps:
•Identification of the contract, or contracts, with a customer
•Identification of the performance obligations in the contract
•Determination of the transaction price
•Allocation of the transaction price to the performance obligations in the contract
•Recognition of revenue when, or as, we satisfy a performance obligation | | | | | | | | | | | | | | | | | | | | | | | | | | |
| Option Award | Stock Awards |
| Name | Number of
Securities
Underlying
Unexercised
Options (#)
Exercisable | Number of Securities Underlying Unexercised Options (#) Unexercisable(1) | Option Exercise Price ($)(2) | Option
Expiration
Date | Number of Shares or Units of Stock That Have Not Vested (#)(3) | Market Value of Shares or Units of Stock That Have Not Vested ($)(4) | Equity Incentive Plan Awards: Number of Unearned Shares, Units or Other Rights That Have Not Vested(5) | Equity Incentive Plan Awards: Market or Payout Value of Unearned Shares, Units or Other Rights That Have Not Vested(4) |
| Matthew Krepsik | 75,000(6) | 525,000 | | 4.03 | | 6/1/2032 | — | | — | | — | | — | |
| — | | — | | — | | — | | 46,875(7) | 160,781 | | — | | — | |
| — | | — | | — | | — | | 131,828(8) | 452,170 | | — | | — | |
| — | | — | | — | | — | | 262,500(9) | 900,375 | | — | | — | |
| — | | — | | — | | — | | — | | — | | 63,750 | 218,663 | |
| — | | — | | — | | — | | — | | — | | 54,083 | | 185,505 | |
| Yuneeb Khan | — | | — | | — | | — | | 522,648(10) | 1,792,683 | | — | | — | |
| — | | — | | — | | — | | 440,985(11) | 1,512,579 | | — | | — | |
| — | | — | | — | | — | | — | | — | | 156,794 | | 537,803 | |
| Connie Chen | 37,334 | | — | | 8.51 | | 2/16/2026 | — | | — | | — | | — | |
| 12,666 | | — | | 8.51 | | 2/16/2026 | — | | — | | — | | — | |
| 100,000 | | — | | 13.00 | | 2/13/2027 | — | | — | | — | | — | |
| 54,000 | | — | | 13.10 | | 3/1/2028 | — | | — | | — | | — | |
| 79,561(12) | 5,305 | | 9.96 | | 3/1/2029 | — | | — | | — | | — | |
| 96,826(13) | 44,012 | | 8.95 | | 3/1/2030 | — | | — | | — | | — | |
We provide digital promotions, including digital coupons, and/or media programs to our customers which consists of CPG customers, retail partners and advertising agencies whereby we use our proprietary technology platforms to create, target, deliver and analyze these programs. We typically generate revenue from our customers through the use of these programs on a cost-per-click, cost-per-impression, or cost-per-acquisition basis. Programs usually include a limit on the number of clicks and/or impressions and are billed monthly.
The pricing of digital promotions programs typically includes both promotion setup fees and promotion campaign fees. Promotion setup fees are related to the creation of digital promotions and set up of the underlying campaign on our proprietary platforms for tracking of the related clicks. We recognize revenues related to promotion setup fees over time, proportionally, on a per click basis, using the number of authorized clicks, per insertion order, commencing on the date of the first click. A click refers to the consumers action of activating a digital promotion through our proprietary technology platform by either saving it to a retailer’s loyalty account for automatic digital redemption, or printing it for physical redemption at a retailer. Promotion campaign fees are usually determined on a per click basis. We typically recognize revenues for digital promotion campaign fees as clicks occur.
We generate revenue from promotions, in which consumer packaged goods brands, or CPGs, pay us to deliver coupons to consumers through our network of publishers and retail partners. We generate revenues, as consumers select, activate, or redeem a coupon through our platform by either saving it to a retailer loyalty account for automatic digital redemption, or printing it for physical redemption at a retailer. The pricing for promotion arrangements generally includes both coupon setup fees and coupon transaction fees. Coupon setup fees are related to the creation of digital coupons and set up of the underlying campaign on our proprietary platforms for tracking of related activations or redemptions. We recognize revenues related to coupon setup fees over time, proportionally, on a per transaction basis, using the number of authorized transactions per insertion order, commencing on the date of the first coupon transaction. Coupon transaction fees are generally determined on a per unit activation or per redemption basis, and are generally billed monthly. Insertion orders generally include a limit on the number of activations, or times consumers may select a coupon.
Digital promotion programs also include our Specialty Retail business, in which specialty stores including clothing, electronics, home improvement and others, offer coupon codes that we distribute. Each time a consumer makes a purchase using a coupon code, a fee is typically paid to us. We usually generate revenues when a consumer makes a purchase using a coupon code from our platform and completion of the order is reported to us. In the same period that we recognize revenues for the delivery of coupon codes, we also estimate and record a reserve, based upon historical experience, to provide for end-user cancellations or product returns which may not be reported until a subsequent date.
Our media services enable CPGs and retailers to distribute digital media ads to promote their brands and products on our retailers' websites, and mobile applications, and through a network of affiliate publishers and non-publisher third parties that display our media offerings on their websites or mobile applications. Pricing for media campaigns is usually determined on a cost-per-impression, cost-per-click or cost-per-acquisition basis. We recognize revenue each time a digital media ad is displayed or each time a user clicks on the media ad displayed on our websites, mobile applications or on third-party websites.
Gross versus Net Revenue Reporting
In the normal course of business and through our distribution network, we deliver digital media and promotions on retailers’ websites through retailers’ loyalty programs, and on the websites of digital publishers. In these situations, we evaluate whether we are the principal (i.e., report revenues on a gross basis) or agent (i.e., report revenues on a net basis). Generally, we report digital promotion and media advertising revenues for campaigns placed on third-party owned properties on a gross basis, that is, the amounts billed to our customers are recorded as revenues, and distribution fees paid to retailers or digital publishers are recorded as cost of revenues. We are the principal because we control the digital promotion and media advertising inventory before it is transferred to our customers. Our control is evidenced by our sole ability to monetize the digital coupon and media advertising inventory, being primarily responsible to our customers, having discretion in establishing pricing for the delivery of the digital media and promotions, or a combination of these.
In other cases, we report certain digital media advertising revenues on a net basis, that is, the costs for digital advertising inventory and third-party data paid to suppliers are deducted from gross revenues to arrive at net revenues. Our performance obligation in these arrangements is to provide the use of our platforms that enables customers to bid on digital advertising inventory, which is determined based on real-time bidding, use of data and
| | | | | | | | | | | | | | | | | | | | | | | | | | |
| 15,625(14) | 134,375 | | 3.20 | | 7/1/2032 | — | | — | | — | | — | |
| — | | — | | — | | — | | 2,667(15) | 9,121 | | — | | — | |
| — | | — | | — | | — | | 20,950(16) | 71,649 | | — | | — | |
| — | | — | | — | | — | | 30,005(17) | 102,617 | | — | | — | |
| — | | — | | — | | — | | 93,895(18) | 321,121 | | — | | — | |
| — | | — | | — | | — | | 70,313(19) | 240,470 | | — | | — | |
| — | | — | | — | | — | | — | | — | | 40,006 | 137,221 | |
| — | | — | | — | | — | | — | | — | | 38,250 | | 131,198 | |
| Steven Boal | 240,000 | | — | | 3.70 | | 2/7/2023 | — | | — | | — | | — | |
| 600,000 | | — | | 8.65 | | 11/14/2023 | — | | — | | — | | — | |
| 503,000 | | — | | 8.51 | | 6/29/2025 | — | | — | | — | | — | |
| 47,000 | | — | | 4.19 | | 6/29/2025 | — | | — | | — | | — | |
| 600,000 | | — | | 4.19 | | 6/29/2025 | — | | — | | — | | — | |
| 800,000 | | — | | 4.19 | | 6/29/2025 | — | | — | | — | | — | |
| 300,000 | | — | | 4.19 | | 6/29/2025 | — | | — | | — | | — | |
| 261,000 | | — | | 4.19 | | 6/29/2025 | — | | — | | — | | — | |
| 299,529 | | — | | 4.19 | | 6/29/2025 | — | | — | | — | | — | |
| 469,461 | | — | | 4.19 | | 6/29/2025 | — | | — | | — | | — | |
| Scott Raskin | 23,474 | | — | | 10.65 | | 2/6/2027 | — | | — | | — | | — | |
| 12,931 | | — | | 11.60 | | 6/4/2027 | — | | — | | — | | — | |
| 915,851(20) | 211,350 | | 7.34 | | 9/1/2029 | — | | — | | — | | — | |
| 262,237(21) | 119,200 | | 8.95 | | 3/1/2030 | — | | — | | — | | — | |
| 39,062(22) | 335,938 | | 3.20 | | 7/1/2032 | — | | — | | — | | — | |
| — | | — | | — | | — | | 102,180(23) | 349,456 | | — | | — | |
| — | | — | | — | | — | | 56,739(24) | 194,047 | | — | | — | |
| — | | — | | — | | — | | 56,010(25) | 191,554 | | — | | — | |
| — | | — | | — | | — | | 175,270(26) | 599,423 | | — | | — | |
| — | | — | | — | | — | | 167,344(27) | 572,316 | | — | | — | |
| — | | — | | — | | — | | — | | — | | 74,679 | 256,149 | |
| — | | — | | — | | — | | — | | — | | 71,905 | 246,634 | |
other add-on features in designing and executing our campaigns. We charge our customersOption is subject to accelerated vesting upon a platform fee based on a percentagequalifying termination of the digital advertising inventory and data costs purchased throughexecutive’s employment with us as described above in “Potential Payments upon Termination, Change of Control or Certain Other Events.”
(2)For options granted prior to our initial public offering, the use of our platforms. The platform fee is not contingent onamounts in this column represent at least the results of a digital media advertising campaign. We have determined that we are an agent in these arrangements because we does not have control of the digital advertising inventory before it is transferred to the customer and does not set prices agreed upon within the auction marketplace.
Arrangements with Multiple Performance Obligations
Our contracts with customers may include multiple performance obligations. For these contracts, we account for individual performance obligations separately if they are distinct. The transaction price is allocated to the separate performance obligations on a relative standalone selling price basis. We determine the best estimate of the standalone selling prices based on our overall pricing objectives, taking into consideration market conditions and other factors, including the value of our contracts and characteristics of targeted customers.
Stock-based Compensation
We account for stock-based compensation using the fair value method, which requires us to measure the stock-based compensation based on the grant-dateper-share fair value of the awards and recognize the compensation expense over the requisite service period. We account for forfeitures as they occur.
The fair value of each stock option award is estimated on the grant date using the Black-Scholes option-pricing model. The fair value of RSUs equals the market valuea share of our common stock on the date of grant. Our option-pricing model requiresgrant, as determined by our Board or, for options granted after our initial public offering, based on the input of highly subjective assumptions, the expected term of the option, the expected volatility of theclosing share price of our common stock risk-free interest rates,on the NYSE on the date of grant.
(3)The shares of common stock underlying the RSUs are subject to accelerated vesting upon a qualifying termination of the executive’s employment with us as described above in “Potential Payments upon Termination, Change of Control or Certain Other Events.”
(4)The market values of the RSUs and PSUs in these columns that have not vested are calculated by multiplying the expected dividend yieldnumber of units shown in the table by the closing share price of our common stock.stock on December 30, 2022, which was $3.43.
Income Taxes
We account for our income taxes using(5)The 2021 PSU awards are subject to vesting based upon the liability method. Deferred tax assetsCompany's performance against certain performance metrics during the period beginning on January 1, 2021 and liabilitiesending on December 31, 2023. The shares of common stock underlying the 2021 PSUs reflected in this column are recognized forassuming the expected tax consequencesthreshold level of temporary differences between the tax bases of assets and liabilities and their reported amounts using enacted tax rates in effect for the year the differences are expected to reverse. In evaluating our ability to recover our deferred tax assets we consider all available positive and negative evidence including our past operating results, the existence of cumulative losses in past fiscal years, and our forecast of future taxable income in the jurisdictions.
We have placed a valuation allowance on the U.S. deferred tax assets and certain non-U.S. deferred tax assets, because realization of these tax benefits through future taxable income does not meet the more-likely-than-not threshold.
We account for uncertainty in income taxes using a two-step approach to recognize and measure uncertain tax positions. The first step is to evaluate the tax position for recognition by determining if the weight of available evidence indicates that it is more likely than not that the positionperformance conditions will be sustained on audit, including resolutionachieved and will vest upon achievement of related appeals or litigation processes, if any.targets directly tied to the Company’s performance. The second step is to measure the tax benefit as the largest amount that is more than 50% likely of being realized upon settlement.
Tax laws2022 PSU awards are dynamic and subject to change as new lawsvesting based upon the Company's achievement of stock price goals during the period beginning on March 1, 2022 and ending on March 1, 2025. The shares of common stock underlying the 2022 PSUs reflected in this column are passedassuming the threshold level of performance conditions will be achieved and new interpretationswill vest upon achievement of targets directly tied to the Company’s stock price. Both 2021 and 2022 PSU awards are subject to accelerated vesting upon a qualifying termination of the law are issuedexecutive’s employment with us as described above in “Potential Payments upon Termination, Change of Control or applied. The U.S. recently enacted significant tax reform,Certain Other Events.”
Vesting Schedule for Outstanding Stock Options and certain provisions of the new law may adversely affect us. In addition, governmental tax authorities are increasingly scrutinizing the tax positions of companies. Many countries in the European Union, as well as a number of other countries and organizations such as the Organization for Economic Cooperation and Development, are actively considering changes to existing tax laws that, if enacted, could increase our tax obligations in countries where we do business. If U.S. or other foreign tax authorities change applicable tax laws, our overall taxes could increase, and our business, financial condition or results of operations may be adversely impacted.
Recently Issued Accounting Pronouncements
See Part II, Item 8. Consolidated Financial Statements and Supplementary Data, Note 2, Summary of Significant Accounting Policies, of Notes to Consolidated Financial Statements of this Annual Report on Form 10-K, for a full description of recent accounting pronouncements, including the actual and expected dates of adoption and
estimated effects on our consolidated results of operations and financial condition, which is incorporated herein by reference.
Item 7A. Quantitative and Qualitative Disclosures About Market Risk.
We have operations both within the United States and internationally, and we are exposed to market risks in the ordinary course of our business. These risks include primarily interest rate, foreign exchange risks and inflation. We do not hold or issue financial instruments for trading purposes.
Interest Rate Fluctuation Risk
Our cash and cash equivalents consist of cash, money market funds, and U.S. Treasury Bills. Our borrowings under finance lease obligations are generally at fixed interest rates.
The primary objective of our investment activities is to preserve principal while maximizing income without significantly increasing risk. Because our cash and cash equivalents have a relatively short maturity, our portfolio’s fair value is relatively insensitive to interest rate changes. We do not believe that an increase or decrease in interest rates of 100 basis points would have a material effect on our operating results or financial condition. In future periods, we will continue to evaluate our investment policy in order to ensure that we continue to meet our overall objectives.
Market Risk and Market Interest Risk
In November 2017, we issued $200.0 million aggregate principal amount of 1.75% convertible senior notes due 2022. The fair value of our convertible senior notes is subject to interest rate risk, market risk and other factors due to the convertible feature. The fair value of the convertible senior notes will generally increase as our common stock price increases and will generally decrease as our common stock price declines in value. The interest and market value changes affect the fair value of our convertible senior notes but do not impact our financial position, cash flows or results of operations due to the fixed nature of the debt obligation.
Foreign Currency Exchange Risk
We have limited foreign currency risks related to our revenues and operating expenses denominated in currencies other than the U.S. dollar, principally the British Pound Sterling and the Euro. The volatility of exchange rates depends on many factors that we cannot forecast with reliable accuracy. Although we have experienced and will continue to experience fluctuations in our net income (loss) as a result of transaction gains (losses) related to revaluing certain cash balances, trade accounts receivable balances and intercompany balances that are denominated in currencies other than the U.S. dollar, we believe such a change will not have a material impact on our results of operations. In the event our foreign sales and expenses increase, our operating results may be more greatly affected by fluctuations in the exchange rates of the currencies in which we do business. At this time, we do not, but we may in the future, enter into derivatives or other financial instruments in an attempt to hedge our foreign currency exchange risk. It is difficult to predict the impact hedging activities would have on our results of operations.
Inflation Risk
We do not believe that inflation has had a material effect on our business, financial condition or results of operations. If our costs were to become subject to significant inflationary pressures, we may not be able to fully offset such higher costs through price increases. Our inability or failure to do so could harm our business, financial condition and results of operations.
Item 8. Financial Statements and Supplementary Data.
Financial Statements
INDEX TO CONSOLIDATED FINANCIAL STATEMENTS
Restricted Stock Units:
| | | | | | | | |
| | |
| Note | Grant | Incremental Vesting Dates |
Consolidated Financial Statements:(6) | 6/1/2022 | 1/48 on 7/1/2022; 1/48 monthly thereafter for next 4 years. |
| (7) | 5/1/2021 | 25% on 5/1/2022; 6.25% quarterly thereafter for next 3 years. |
| | |
| | |
| | |
| | |
| | |
| | |
| | |
| | |
| | |
| | |
| | |
Report of Independent Registered Public Accounting Firm
To the Stockholders and the Board of Directors of Quotient Technology Inc.
Opinion on the Financial Statements
We have audited the accompanying consolidated balance sheets of Quotient Technology Inc. (the Company) as of December 31, 2020 and 2019, the related consolidated statements of operations, comprehensive loss,stockholders' equity and cash flows for each of the three years in the period ended December 31, 2020, and the related notes (collectively referred to as the “consolidated financial statements”). In our opinion, the consolidated financial statements present fairly, in all material respects, the financial position of the Company at December 31, 2020 and 2019, and the results of its operations and its cash flows for each of the three years in the period ended December 31, 2020, in conformity with U.S. generally accepted accounting principles.
We also have audited, in accordance with the standards of the Public Company Accounting Oversight Board (United States) (PCAOB), the Company's internal control over financial reporting as of December 31, 2020, based on criteria established in Internal Control-Integrated Framework issued by the Committee of Sponsoring Organizations of the Treadway Commission (2013 framework), and our report dated February 22, 2021 expressed an unqualified opinion thereon.
Basis for Opinion
These financial statements are the responsibility of the Company's management. Our responsibility is to express an opinion on the Company’s financial statements based on our audits. We are a public accounting firm registered with the PCAOB and are required to be independent with respect to the Company in accordance with the U.S. federal securities laws and the applicable rules and regulations of the Securities and Exchange Commission and the PCAOB.
We conducted our audits in accordance with the standards of the PCAOB. Those standards require that we plan and perform the audit to obtain reasonable assurance about whether the financial statements are free of material misstatement, whether due to error or fraud. Our audits included performing procedures to assess the risks of material misstatement of the financial statements, whether due to error or fraud, and performing procedures that respond to those risks. Such procedures included examining, on a test basis, evidence regarding the amounts and disclosures in the financial statements. Our audits also included evaluating the accounting principles used and significant estimates made by management, as well as evaluating the overall presentation of the financial statements. We believe that our audits provide a reasonable basis for our opinion.
Critical Audit Matter
The critical audit matter communicated below is a matter arising from the current period audit of the financial statements that was communicated or required to be communicated to the audit committee and that: (1) relates to accounts or disclosures that are material to the financial statements and (2) involved our especially challenging, subjective or complex judgments. The communication of the critical audit matter does not alter in any way our opinion on the consolidated financial statements, taken as a whole, and we are not, by communicating the critical audit matter below, providing a separate opinion on the critical audit matter or on the accounts or disclosures to which they relate.
| | | | | |
| Revenue Recognition |
Description of the Matter | As described in Note 2 to the consolidated financial statements, the Company generates its revenue by offering promotion and media services. Promotion revenue is recognized as coupons activations or redemptions occur. Media revenue is generally recognized each time a digital media ad is displayed or each time a user clicks on the media ad.
The Company’s revenue recognition process utilizes multiple complex, proprietary systems and tools, for the initiation, processing and recording of a high volume of individually-low-monetary-value transactions. The revenue recognition process is dependent on the effective design and operation of multiple systems and the completeness and accuracy of data sources, which required significant audit effort.
|
How We Addressed the Matter in Our Audit | We obtained an understanding, evaluated the design, and tested the operating effectiveness of internal controls over the Company’s accounting for revenue from contracts with customers. For example, with the support of our information technology professionals, we identified and tested the relevant systems used for the determination of initiation, delivery, recording and billing of revenue, which included controls related to the ongoing access to the relevant systems and data, change management controls over the relevant systems and interfaces, and effective configuration of the relevant systems.
To test the Company’s accounting for revenue from contracts with customers, we performed substantive audit procedures that included, among others, testing the completeness and accuracy of the underlying data within the Company’s billing system, performing data analytics by extracting data from the system to evaluate the completeness and accuracy of recorded revenue and deferred revenue amounts, tracing a sample of sales transactions to source data, and testing a sample of reconciliations of billings to cash collections.
|
| | | | | |
| (8) | 3/1/2022 | 6.25% on 6/1/2022; 6.25% quarterly thereafter for next 4 years. |
| (9) | 6/1/2022 | 6.25% on 9/1/2022; 6.25% quarterly thereafter for next 4 years. |
| (10) | 8/1/2022 | 25% on 8/1/2023; 6.25% quarterly thereafter for next 3 years. |
| (11) | 8/1/2022 | 6.25% on 11/1/2022; 6.25% quarterly thereafter for next 4 years. |
| (12) | 3/1/2019 | 1/48 on 4/1/2019; 1/48 monthly thereafter for next 4 years. |
| (13) | 3/1/2020 | 1/48 on 4/1/2020; 1/48 monthly thereafter for next 4 years. |
| (14) | 7/1/2022 | 1/48 on 8/1/2022; 1/48 monthly thereafter for next 4 years. |
| (15) | 3/1/2019 | 6.25% on 6/1/2019; 6.25% quarterly thereafter for next 4 years. |
| (16) | 3/1/2020 | 6.25% on 6/1/2020; 6.25% quarterly thereafter for next 4 years. |
| (17) | 3/1/2021 | 6.25% on 6/1/2021; 6.25% quarterly thereafter for next 4 years. |
| (18) | 3/1/2022 | 6.25% on 6/1/2022; 6.25% quarterly thereafter for next 4 years. |
| (19) | 7/1/2022 | 6.25% on 10/1/2022; 6.25% quarterly thereafter for next 4 years. |
| (20) | 9/1/2019 | 25% on 9/1/2020; 1/48 monthly thereafter for next 3 years. |
| (21) | 3/1/2020 | 1/48 on 4/1/2020; 1/48 monthly thereafter for next 4 years. |
| (22) | 7/1/2022 | 1/48 on 8/1/2022; 1/48 monthly thereafter for next 4 years. |
| (23) | 9/1/2019 | 25% on 9/1/2020; 6.25% quarterly thereafter for next 3 years. |
| (24) | 3/1/2020 | 6.25% on 4/1/2020; 6.25% quarterly thereafter for next 4 years. |
| (25) | 3/1/2021 | 6.25% on 4/1/2021; 6.25% quarterly thereafter for next 4 years. |
| (26) | 3/1/2022 | 6.25% on 4/1/2022; 6.25% quarterly thereafter for next 4 years. |
| (27) | 7/1/2022 | 6.25% on 8/1/2022; 6.25% quarterly thereafter for next 4 years. |
/s/ Ernst & Young LLPOption Exercises and Stock Vested
We have served asThe following table provides information regarding exercises of option awards and vesting of stock awards by our NEOs in 2022:
| | | | | | | | | | | | | | |
| Option Award | Stock Awards |
| Name | Number of Shares
Acquired on
Exercise | Value Released on
Exercise ($) | Number of
Shares Acquired on
Vesting | Value Realized on Vesting ($)(1) |
| Matthew Krepsik | — | | — | | 106,046 | | 355,803 | |
| Yuneeb Khan | — | | — | | 29,398 | | 79,963 | |
| Connie Chen | — | | — | | 69,618 | | 245,383 | |
| Steven Boal | — | | — | | 1,277,395 | | 4,218,685 | |
| Scott Raskin | — | | — | | 258,127 | | 929,949 | |
| Pamela Strayer | — | | — | | 27,875 | | 174,088 | |
| John Kellerman | — | | — | | 21,312 | | 96,728 | |
(1)Calculated by multiplying (i) the Company’s auditor since 2009.closing price of our common stock on the vesting date or if such day is the weekend or a holiday, on the immediately preceding trading day, by (ii) the number of shares of our common stock acquired upon vesting.
San Jose, CaliforniaCEO Pay Ratio
February 22, 2021For the year ended December 31, 2022, the median of the annual total compensation of all employees is $78,987, the annual total compensation of our CEO, Mr. Krepsik, is $4,585,802, and the ratio of this amount to the median of the annual total compensation of all employees is approximately 58 to 1.
This pay ratio is a reasonable estimate calculated in a manner consistent with SEC rules based on our payroll record and the methodology described below. Because the SEC rules for identifying the median compensated employee and calculating the pay ratio based on that employee’s annual total compensation allow companies to adopt a variety of methodologies, to apply certain exclusions, and to make reasonable estimates and assumptions
that reflect their compensation practices, the pay ratio reported by other companies may not be comparable to the pay ratio reported above, as other companies may have different employment and compensation practices and may utilize different methodologies, exclusions, estimates, and assumptions in calculating their own pay ratios.
For purposes of identifying our median compensated employee, we used our global employee population as of December 1, 2022, identified based on our payroll records. We used total compensation as our consistently applied compensation measure. In this context, total compensation means the annual salary or wages, plus target bonuses and commissions as of December 1, 2022. Individuals that did not work for the full year were annualized and amounts paid in foreign currencies were converted to US Dollars based on the applicable average annual exchange rate as of December 1, 2022.
Non-Employee Director Compensation
Non-employee directors receive compensation under our outside director compensation policy (the “Director Compensation Policy”) in the form of equity granted under the terms of our 2013 Plan, and cash, as described below. The policy is reviewed annually by the Compensation Committee in conjunction with the Compensation Committee’s independent compensation consultant in order to inform any decisions with respect to our executive compensation program. They consider multiple factors, including total compensation relative to our peer group, market survey data, board leadership and committees, and board governance trends.
Cash Compensation
In connection with their service as a director and consistent with the Director Compensation Policy, each non-employee director receives an annual cash retainer of $37,500 for serving on our Board. Prior to July 26, 2022 the Lead Independent Registered Public Accounting FirmDirector received an additional annual cash retainer of $15,000. Effective as of July 26, 2022, the Lead Independent Director received no additional cash retainer. Effective as of March 23, 2023, the Independent Board Chair receives an additional annual cash retainer of $40,000.
ToThe chairperson and members of the Stockholders andthree standing committees of our Board are also entitled to the following additional annual cash retainers:
| | | | | | | | |
| Board Committee | Chairperson Fee ($) | Member Fee ($) |
| Audit Committee | 21,500 | | 10,000 | |
| Compensation Committee | 15,000 | | 6,250 | |
Nominating and Corporate Governance
Committee | 8,000 | | 3,500 | |
Effective as of March 23, 2023, the members of the Strategic Committee, a non-standing committee of the Board whose members consist of DirectorsMessrs. Gessow, Reece and Wargotz and Ms. Hawkins, receive an annual cash retainer of Quotient Technology Inc. $10,000.
OpinionAll cash retainers are paid in quarterly installments to each non-employee director who has served in the relevant capacity for the immediately preceding fiscal quarter no later than 30 days following the end of such preceding fiscal quarter. A non-employee director who has served in the relevant capacity for only a portion of the immediately preceding fiscal quarter will receive a prorated payment of the quarterly payment of the applicable annual cash retainer.
Equity Compensation
Initial grant. Upon appointment to our Board, each non-employee director is granted an award (the “Initial Award”) of RSUs as compensation for his or her service. The number of RSUs subject to the Initial Award is determined by dividing $250,000 by the closing price of our stock on Internal Control Over Financial Reportingthe grant date or as computed in accordance with such other methodology as our Board or Compensation Committee may determine. The grant date of the Initial Award is the fifth trading day of the month immediately following the month in which the individual first becomes a non-employee director. The RSUs subject to the Initial Award vest as to one-third (1/3) of such RSUs on each of the
We have audited Quotient Technology Inc.’s internal control over
first three anniversaries of the date on which such person first becomes a non-employee director, subject to continued service as a director through the applicable vesting date.
Annual award. Each continuing non-employee director is granted an award of RSUs (the “Annual RSU Award”) on the date of the annual meeting of stockholders as compensation for his or her service. The number of RSUs subject to the Annual Award is determined by dividing $175,000 by the closing price of our stock on the grant date or as computed in accordance with such other methodology as our Board or Compensation Committee may determine. The grant date of the Annual Award is the date of the annual meeting of stockholders. The RSUs subject to the Annual Award vest upon the earlier of (i) the day prior to the next year’s annual meeting of stockholders or (ii) one year from the grant date, subject to continued service as a director through the applicable vesting date.
The following table provides information for the year ended December 31, 2022 regarding all compensation awarded to, earned by or paid to each person who served as a non-employee director in 2022.
Non-Employee Director Compensation — 2022
| | | | | | | | | | | | | | |
| Name | Fees Earned or
Paid in
Cash ($) | Stock Awards ($)(1) | | Total ($) |
| Kimberly Anstett | 24,652 | 424,998 | | 449,650 |
| Andrew Gessow | 63,667 | 174,998 | | 238,665 |
| Lorraine Hariton | 41,000 | 174,998 | | 215,998 |
| Alison Hawkins | 55,250 | 174,998 | | 230,248 |
| Eric Higgs | 42,583 | 424,996 | | 467,579 |
Steve Horowitz(2) | 17,459 | — | | 17,459 |
| Robert McDonald | 77,704 | 174,998 | | 252,702 |
Matthew O'Grady(3) | 39,239 | 424,996 | | 464,235 |
| David Oppenheimer | 68,515 | 174,998 | | 243,513 |
| Joseph Reece | 35,621 | 424,996 | | 460,617 |
Christy Wyatt(4) | 12,243 | 103,102 | | 12,243 |
(1)The amounts reported reflect the aggregate grant date fair value of RSUs granted during the year as computed in accordance with FASB ASC Topic 718. The assumptions used to calculate these amounts are discussed in Note 10 to our notes to consolidated financial reportingstatements included in our Annual Report on Form 10-K for the year ended December 31, 2022, as filed with the SEC on March 16, 2023. As required by SEC rules, the amounts shown exclude the impact of estimated forfeitures related to service-based vesting conditions. Note that the amounts reported in this column reflect the accounting cost for these stock awards and do not correspond to the actual economic value that may be received by the directors from them. For Ms. Wyatt, this amount includes the incremental fair value associated with the modification of her outstanding 2021 Annual RSU Award granted an June 3, 2021 to provide for accelerated vesting in connection with her resignation from the Board. This amount is required to be included per SEC disclosure rules and does not reflect a new grant.
(2)Mr. Horowitz resigned from the Board effective June 3, 2022.
(3)Mr. O'Grady's Annual RSU Award of $174,998 and Initial RSU Award of $249,998 was cancelled upon his resignation from the Board, which became effective as of December 31, 2020, based on criteria established in Internal Control - Integrated Framework issued by2022.
(4)Ms. Wyatt resigned from the CommitteeBoard effective March 24, 2022.
Our non-employee directors held the following number of Sponsoring Organizations of the Treadway Commission (2013 framework), (the COSO criteria). In our opinion, Quotient Technology Inc. (the Company) maintained, in all material respects, effective internal control over financial reportingoutstanding stock options and RSU awards as of December 31, 2020, based on2022.
| | | | | | | | |
| Name | Stock Options | RSUs |
| Kimberly Anstett | — | 138,240 |
| Andrew Gessow | 151,992 | 55,732 |
| Lorraine Hariton | — | 72,584 |
| Alison Hawkins | — | 76,182 |
| Eric Higgs | — | 96,382 |
Steve Horowitz(1) | — | — |
| Robert McDonald | — | 55,732 |
Matthew O'Grady(2) | — | — |
| David Oppenheimer | 21,551 | 55,732 |
| Joseph Reece | — | 111,535 |
Christy Wyatt(3) | — | — |
(1)Mr. Horowitz resigned from the COSO criteria.Board effective June 3, 2022.
We also have audited, in accordance with(2)Mr. O'Grady resigned from the standards of the Public Company Accounting Oversight Board (United States) (PCAOB), the consolidated balance sheets of the Companyeffective December 31, 2022 and therefore had no outstanding stock options or RSU awards as of December 31, 20202022.
(3)Ms. Wyatt resigned from the Board effective March 24, 2022.
Compensation Committee Interlocks and 2019, the related consolidated statements of operations, comprehensive loss, stockholders’ equity and cash flows for eachInsider Participation
The members of the three yearsCompensation Committee during 2022 consisted of Messrs. Gessow, Higgs, Oppenheimer and Reece. Mr. Reece joined the Compensation Committee in May 2022, pursuant to the Cooperation Agreement, and became Chair in February 2023. None of the current members of the Compensation Committee is currently or has been at any time one of our officers or employees. None of our executive officers currently serves, or in the periodpast year has served, as a member of the board of directors or compensation committee of any entity that has one or more executive officers serving on our Board or Compensation Committee.
Compensation Committee Report
The Compensation Committee has reviewed and discussed with management the Compensation Discussion and Analysis provided above. Based on its review and discussions, our Compensation Committee has recommended to our Board that the Compensation Discussion and Analysis be included in this Form 10-K/A and our Annual Report for the year ended December 31, 2020, and2022.
Submitted by the related notes and our report dated February 22, 2021 expressed an unqualified opinion thereon.
Basis for Opinion
The Company’s management is responsible for maintaining effective internal control over financial reporting and for its assessmentCompensation Committee of the effectiveness of internal control over financial reporting included in the accompanying Management’s Annual Report on Internal Control Over Financial Reporting. Our responsibility is to express an opinion on the Company’s internal control over financial reporting based on our audit. We are a public accounting firm registered with the PCAOB and are required to be independent with respect to the Company in accordance with the U.S. federal securities laws and the applicable rules and regulations of the Securities and Exchange Commission and the PCAOB.Board:
We conducted our audit in accordance with the standards of the PCAOB. Those standards require that we plan and perform the audit to obtain reasonable assurance about whether effective internal control over financial reporting was maintained in all material respects.Joseph Reece (Chairperson)
Our audit included obtaining an understanding of internal control over financial reporting, assessing the risk that a material weakness exists, testing and evaluating the design and operating effectiveness of internal control based on the assessed risk, and performing such other procedures as we considered necessary in the circumstances. We believe that our audit provides a reasonable basis for our opinion.Andrew Gessow
Definition and Limitations of Internal Control Over Financial ReportingDavid Oppenheimer
A company’s internal control over financial reporting is a process designed to provide reasonable assurance regarding the reliability of financial reporting and the preparation of financial statements for external purposes in accordance with generally accepted accounting principles. A company’s internal control over financial reporting includes those policies and procedures that (1) pertain to the maintenance of records that, in reasonable detail, accurately and fairly reflect the transactions and dispositions of the assets of the company; (2) provide reasonable assurance that transactions are recorded as necessary to permit preparation of financial statements in accordance with generally accepted accounting principles, and that receipts and expenditures of the company are being made only in accordance with authorizations of management and directors of the company; and (3) provide reasonable assurance regarding prevention or timely detection of unauthorized acquisition, use, or disposition of the company’s assets that could have a material effect on the financial statements.
Because of its inherent limitations, internal control over financial reporting may not prevent or detect misstatements. Also, projections of any evaluation of effectiveness to future periods are subject to the risk that controls may become inadequate because of changes in conditions, or that the degree of compliance with the policies or procedures may deteriorate.
/s/ Ernst & Young LLP
San Jose, California
February 22, 2021Eric D. Higgs
QUOTIENT TECHNOLOGY INC.
CONSOLIDATED BALANCE SHEETS
(in thousands, except share and per share data)
| | | | | | | | | | | |
| | December 31, |
| | 2020 | | 2019 |
| Assets | | | |
| Current assets: | | | |
| Cash and cash equivalents | $ | 222,752 | | | $ | 224,764 | |
Accounts receivable, net of allowance for credit losses of $2,070 and $2,021 at December 31, 2020 and 2019, respectively | 137,649 | | | 125,304 | |
| Prepaid expenses and other current assets | 18,547 | | | 22,026 | |
| Total current assets | 378,948 | | | 372,094 | |
| Property and equipment, net | 17,268 | | | 13,704 | |
| Operating lease right-of-use assets | 16,222 | | | 7,211 | |
| Intangible assets, net | 44,898 | | | 69,752 | |
| Goodwill | 128,427 | | | 128,427 | |
| Other assets | 1,029 | | | 750 | |
| Total assets | $ | 586,792 | | | $ | 591,938 | |
| Liabilities and Stockholders’ Equity | | | |
| Current liabilities: | | | |
| Accounts payable | $ | 15,959 | | | $ | 19,116 | |
| Accrued compensation and benefits | 14,368 | | | 15,232 | |
| Other current liabilities | 70,620 | | | 50,032 | |
| Deferred revenues | 12,027 | | | 10,903 | |
| Contingent consideration related to acquisitions | 8,524 | | | 27,000 | |
| Total current liabilities | 121,498 | | | 122,283 | |
| Other non-current liabilities | 18,314 | | | 7,119 | |
| Contingent consideration related to acquisitions | 20,930 | | | 9,220 | |
| Convertible senior notes, net | 177,168 | | | 166,157 | |
| Deferred tax liabilities | 1,853 | | | 1,937 | |
| Total liabilities | 339,763 | | | 306,716 | |
| Commitments and contingencies (Note 15) | 0 | | | 0 | |
| Stockholders’ equity: | | | |
Preferred stock, $0.00001 par value—10,000,000 shares authorized and 0 shares issued or outstanding at December 31, 2020 and 2019 | 0 | | | 0 | |
Common stock, $0.00001 par value—250,000,000 shares authorized; 91,743,302 and 89,371,199 shares issued and outstanding at December 31, 2020 and 2019, respectively | 1 | | | 1 | |
| Additional paid-in capital | 698,333 | | | 671,060 | |
| Accumulated other comprehensive loss | (1,001) | | | (916) | |
| Accumulated deficit | (450,304) | | | (384,923) | |
| Total stockholders’ equity | 247,029 | | | 285,222 | |
| Total liabilities and stockholders’ equity | $ | 586,792 | | | $ | 591,938 | |
See Accompanying Notes to Consolidated Financial Statements
QUOTIENT TECHNOLOGY INC.
CONSOLIDATED STATEMENTS OF OPERATIONS
(in thousands, except per share data)
| | | | | | | | | | | | | | | | | |
| | Year Ended December 31, |
| | 2020 | | 2019 | | 2018 |
| Revenues | $ | 445,887 | | | $ | 436,160 | | | $ | 386,958 | |
| Cost of revenues | 277,914 | | | 263,606 | | | 206,230 | |
| Gross margin | 167,973 | | | 172,554 | | | 180,728 | |
| Operating expenses: | | | | | |
| Sales and marketing | 104,527 | | | 101,244 | | | 90,086 | |
| Research and development | 40,316 | | | 39,076 | | | 46,873 | |
| General and administrative | 54,177 | | | 58,328 | | | 49,805 | |
Change in fair value of escrowed shares and contingent
consideration, net | 20,234 | | | 1,571 | | | 13,190 | |
| Total operating expenses | 219,254 | | | 200,219 | | | 199,954 | |
| Loss from operations | (51,281) | | | (27,665) | | | (19,226) | |
| Interest expense | (14,521) | | | (13,955) | | | (13,411) | |
| Other income, net | 1,140 | | | 5,223 | | | 4,801 | |
| Loss before income taxes | (64,662) | | | (36,397) | | | (27,836) | |
| Provision for income taxes | 719 | | | 660 | | | 482 | |
| Net loss | $ | (65,381) | | | $ | (37,057) | | | $ | (28,318) | |
| | | | | |
| Net loss per share, basic and diluted | $ | (0.72) | | | $ | (0.41) | | | $ | (0.30) | |
Weighted-average number of common shares used in computing
net loss per share, basic and diluted | 90,412 | | | 91,163 | | | 93,676 | |
See Accompanying Notes to Consolidated Financial Statements
QUOTIENT TECHNOLOGY INC.
CONSOLIDATED STATEMENTS OF COMPREHENSIVE LOSS
(in thousands)
| | | | | | | | | | | | | | | | | |
| | Year Ended December 31, |
| | 2020 | | 2019 | | 2018 |
| Net loss | (65,381) | | | (37,057) | | | (28,318) | |
| Other comprehensive income (loss): | | | | | |
| Foreign currency translation adjustments | (85) | | | (72) | | | (144) | |
| Comprehensive loss | $ | (65,466) | | | $ | (37,129) | | | $ | (28,462) | |
See Accompanying Notes to Consolidated Financial Statements
QUOTIENT TECHNOLOGY INC.
CONSOLIDATED STATEMENTS OF STOCKHOLDERS’ EQUITY
(in thousands, except share data)
| | | | | | | | | | | | | | | | | | | | | | | | | | | | | | | | | | | | | | | | | | | | | | | |
| | Common Stock | | Additional Paid-In Capital | | Treasury Stock | | | | Accumulated Deficit | | Total Stockholders' Equity |
| | Shares | | Amount | | | Shares | | Amount | | Accumulated Other Comprehensive Loss | | |
| Balance as of December 31, 2017 | 93,199,718 | | | $ | 1 | | | $ | 686,025 | | | 0 | | | $ | 0 | | | $ | (700) | | | $ | (287,285) | | | $ | 398,041 | |
| Exercise of employee stock options | 1,329,361 | | | — | | | 4,028 | | | — | | | — | | | — | | | — | | | 4,028 | |
| Vesting of restricted stock units | 2,287,008 | | | — | | | — | | | — | | | — | | | — | | | — | | | — | |
| Issuance of common stock, stock purchase plan | 323,439 | | | — | | | 3,467 | | | — | | | — | | | — | | | — | | | 3,467 | |
Payments for taxes related to net share settlement of equity awards | (880,262) | | | — | | | (11,658) | | | — | | | — | | | — | | | — | | | (11,658) | |
| Repurchases of common stock | (1,264,053) | | | — | | | — | | | 1,264,053 | | | (15,843) | | | — | | | — | | | (15,843) | |
| Retirement of treasury stock | — | | | — | | | (9,248) | | | (1,264,053) | | | 15,843 | | | — | | | (6,595) | | | 0 | |
| Cumulative-effect of accounting change | — | | | — | | | — | | | — | | | — | | | — | | | 105 | | | 105 | |
| Stock-based compensation | — | | | — | | | 31,479 | | | — | | | — | | | — | | | — | | | 31,479 | |
Change in fair value of escrowed shares related to a services and data agreement | — | | | — | | | (1,070) | | | — | | | — | | | — | | | — | | | (1,070) | |
| Other comprehensive loss | — | | | — | | | — | | | — | | | — | | | (144) | | | — | | | (144) | |
| Net loss | — | | | — | | | — | | | — | | | — | | | — | | | (28,318) | | | (28,318) | |
| Balance as of December 31, 2018 | 94,995,211 | | | $ | 1 | | | $ | 703,023 | | | 0 | | | $ | 0 | | | $ | (844) | | | $ | (322,093) | | | $ | 380,087 | |
| Exercise of employee stock options | 433,762 | | | — | | | 2,337 | | | — | | | — | | | — | | | — | | | 2,337 | |
| Vesting of restricted stock units | 2,735,184 | | | — | | | — | | | — | | | — | | | — | | | — | | | — | |
| Issuance of common stock, stock purchase plan | 300,949 | | | — | | | 2,680 | | | — | | | — | | | — | | | — | | | 2,680 | |
Payments for taxes related to net share settlement of equity awards | (1,004,914) | | | — | | | (9,838) | | | — | | | — | | | — | | | — | | | (9,838) | |
| Repurchases of common stock | (8,088,993) | | | — | | | — | | | 8,088,993 | | | (85,539) | | | — | | | — | | | (85,539) | |
| Retirement of treasury stock | — | | | — | | | (59,766) | | | (8,088,993) | | | 85,539 | | | — | | | (25,773) | | | 0 | |
| Stock-based compensation | — | | | — | | | 32,624 | | | — | | | — | | | — | | | — | | | 32,624 | |
| Other comprehensive loss | — | | | — | | | — | | | — | | | — | | | (72) | | | — | | | (72) | |
| Net loss | — | | | — | | | — | | | — | | | — | | | — | | | (37,057) | | | (37,057) | |
| Balance as of December 31, 2019 | 89,371,199 | | | $ | 1 | | | $ | 671,060 | | | 0 | | | $ | 0 | | | $ | (916) | | | $ | (384,923) | | | $ | 285,222 | |
| Exercise of employee stock options | 331,007 | | | — | | | 2,714 | | | — | | | — | | | — | | | — | | | 2,714 | |
| Vesting of restricted stock units | 2,293,593 | | | — | | | — | | | — | | | — | | | — | | | — | | | — | |
| Issuance of common stock for services provided | 117,210 | | | — | | | 689 | | | — | | | — | | | — | | | — | | | 689 | |
| Issuance of common stock, stock purchase plan | 474,178 | | | — | | | 2,289 | | | — | | | — | | | — | | | — | | | 2,289 | |
Payments for taxes related to net share settlement
of equity awards | (843,885) | | | — | | | (7,203) | | | — | | | — | | | — | | | — | | | (7,203) | |
| Stock-based compensation | — | | | — | | | 28,784 | | | — | | | — | | | — | | | — | | | 28,784 | |
| Other comprehensive loss | — | | | — | | | — | | | — | | | — | | | (85) | | | — | | | (85) | |
| Net loss | — | | | — | | | — | | | — | | | — | | | — | | | (65,381) | | | (65,381) | |
| Balance as of December 31, 2020 | 91,743,302 | | | $ | 1 | | | $ | 698,333 | | | 0 | | | $ | 0 | | | $ | (1,001) | | | $ | (450,304) | | | $ | 247,029 | |
See Accompanying Notes to Consolidated Financial Statements
QUOTIENT TECHNOLOGY INC.
CONSOLIDATED STATEMENTS OF CASH FLOWS
(in thousands)
| | | | | | | | | | | | | | | | | |
| | Year Ended December 31, |
| | 2020 | | 2019 | | 2018 |
| Cash flows from operating activities: | | | | | |
| Net loss | $ | (65,381) | | | $ | (37,057) | | | $ | (28,318) | |
Adjustments to reconcile net loss to net cash (used in) provided by operating
activities: | | | | | |
| Depreciation and amortization | 36,352 | | | 31,437 | | | 25,041 | |
| Stock-based compensation | 28,371 | | | 32,137 | | | 31,386 | |
| Amortization of debt discount and issuance cost | 11,011 | | | 10,438 | | | 9,898 | |
| Restructuring charge related to facility exit costs | 0 | | | 0 | | | 1,057 | |
| Allowance for credit losses | 888 | | | 1,227 | | | 509 | |
| Deferred income taxes | 719 | | | 660 | | | 482 | |
Change in fair value of escrowed shares and contingent
consideration, net | 20,234 | | | 1,571 | | | 13,190 | |
| Impairment of capitalized software development costs | 0 | | | 3,579 | | | 0 | |
| Other non-cash expenses | 3,275 | | | 2,392 | | | 207 | |
| Changes in operating assets and liabilities: | | | | | |
| Accounts receivable | (13,232) | | | (7,142) | | | (26,032) | |
| Prepaid expenses and other current assets | 3,164 | | | (11,145) | | | (861) | |
| Accounts payable and other current liabilities | 15,554 | | | (62) | | | 6,449 | |
| Payments for contingent consideration | (15,418) | | | 0 | | | (9,700) | |
| Accrued compensation and benefits | (197) | | | 1,567 | | | (1,287) | |
| Deferred revenues | 1,125 | | | 2,216 | | | 27 | |
| Net cash provided by operating activities | 26,465 | | | 31,818 | | | 22,048 | |
| | | | | |
| Cash flows from investing activities: | | | | | |
| Purchases of property and equipment | (8,351) | | | (9,021) | | | (6,077) | |
| Purchases of intangible assets | (3,018) | | | (14,811) | | | (20,545) | |
| Acquisitions, net of cash acquired | 0 | | | (13,730) | | | (33,661) | |
| Purchases of short-term investments | 0 | | | 0 | | | (75,120) | |
| Proceeds from maturities of short-term investment | 0 | | | 20,738 | | | 114,284 | |
| Net cash used in investing activities | (11,369) | | | (16,824) | | | (21,119) | |
| | | | | |
| Cash flows from financing activities: | | | | | |
| Proceeds from issuances of common stock under stock plans | 5,002 | | | 5,017 | | | 7,495 | |
| Payments for taxes related to net share settlement of equity awards | (7,203) | | | (9,838) | | | (11,658) | |
Repurchases and retirement of common stock under share repurchase
program | 0 | | | (87,097) | | | (14,285) | |
| Principal payments on promissory note and finance lease obligations | (391) | | | (317) | | | (310) | |
| Payments of contingent consideration | (14,582) | | | 0 | | | (14,800) | |
| Net cash used in financing activities | (17,174) | | | (92,235) | | | (33,558) | |
| Effect of exchange rates on cash and cash equivalents | 66 | | | (23) | | | 22 | |
| Net decrease in cash and cash equivalents | (2,012) | | | (77,264) | | | (32,607) | |
| Cash and cash equivalents at beginning of period | 224,764 | | | 302,028 | | | 334,635 | |
| Cash and cash equivalents at end of period | $ | 222,752 | | | $ | 224,764 | | | $ | 302,028 | |
| | | | | |
| Supplemental disclosures of cash flow information | | | | | |
| Cash paid for income taxes | $ | 220 | | | $ | 352 | | | $ | 246 | |
| Cash paid for interest | $ | 3,510 | | | $ | 3,517 | | | $ | 3,655 | |
| Supplemental disclosures of noncash investing and financing activities | | | | | |
| Repurchase of common stock not settled | $ | 0 | | | $ | 0 | | | $ | 1,558 | |
| Intangible asset acquisitions not yet paid | $ | 1,250 | | | $ | 1,000 | | | $ | 14,548 | |
| Fixed asset purchases not yet paid | $ | 1,757 | | | $ | 783 | | | $ | 1,253 | |
| Computer equipment acquired under promissory note | $ | 1,107 | | | $ | 0 | | | $ | 0 | |
See Accompanying Notes to Consolidated Financial Statements
QUOTIENT TECHNOLOGY INC.
Notes to Consolidated Financial Statements
1. Background
Description of Business
Quotient Technology Inc. (together with its subsidiaries, the “Company”), is an industry leading digital media and promotions company that creates cohesive omnichannel brand-building and sales-driving marketing campaigns for CPGs and retailers throughout the path to purchase. These programs are delivered across the Company’s broad network of digital properties to drive measurable sales results and customer loyalty. The Company's network includes the digital properties of retail partners and CPG customers, social media platforms, third-party properties, its flagship consumer brand Coupons.com properties and DOOH properties. This network provides the Company with proprietary and licensed data, including retailers’ in-store POS shopper data, purchase intent and online behavior, location intelligence, and to deliver more valuable outcomes for CPGs, retailers, and consumers. Customers and partners use Quotient to leverage shopper data, and insights, consumers via digital channels, integrate marketing and merchandising programs, and leverage consumer data and insights to drive measurable sales results.
2. Summary of Significant Accounting Policies
Basis of Presentation and Consolidation
The accompanying consolidated financial statements have been prepared in accordance with U.S. generally accepted accounting principles (“U.S. GAAP”). The Company’s consolidated financial statements include the accounts of the Company and its wholly-owned subsidiaries. All significant intercompany transactions and balances have been eliminated.
Use of Estimates
The preparation of financial statements in conformity with U.S. GAAP requires management to make estimates and assumptions that affect the reported amounts of assets and liabilities and disclosure of contingent liabilities at the date of the financial statements as well as the reported amounts of revenues and expenses during the reporting period. Such management estimates include, but are not limited to, revenue recognition, collectability of accounts receivable, coupon code sales return reserve, valuation of assets acquired and liabilities assumed in a business combination, useful lives of intangible assets, estimates related to recoverability of long-lived assets and goodwill, stock-based compensation, measurement of contingent consideration, restructuring accruals, debt discounts, deferred income tax assets and associated valuation allowances and distribution fee commitments. These estimates generally require judgments, may involve the analysis of historical and prediction of future trends, and are subject to change from period to period. Actual results may differ from the Company’s estimates, and such differences may be material to the accompanying consolidated financial statements.
The COVID-19 pandemic has created and may continue to create significant uncertainty in macroeconomic conditions, which may cause further business slowdowns or shutdowns, depress demand for the Company’s advertising business, and adversely impact the Company’s results of operations. The Company expects uncertainties around its key accounting estimates to continue to evolve depending on the duration and degree of impact associated with the COVID-19 pandemic. The Company’s estimates may change as new events occur and additional information emerges, and such changes are recognized or disclosed in its consolidated financial statements.
Cash and Cash Equivalents
The Company considers all highly liquid investments with original maturities of three months or less at the time of purchase to be cash equivalents. The Company classifies all cash equivalents as available-for-sale, which are recorded at fair value. Unrealized gains and losses are included in accumulated other comprehensive (loss) income in stockholders’ equity. Realized gains and losses are included in other income (expense), net.
Accounts Receivable, Net of Allowance for Credit Losses
Trade and other receivables are included in accounts receivables and primarily comprised of trade receivables that are recorded at invoiced amounts, net of an allowance for credit losses and do not bear interest.
Other receivables included unbilled receivables related to digital media and promotions advertising contracts with customers. The Company generally does not require collateral and performs ongoing credit evaluations of its customers and maintains allowances for potential credit losses. The Company maintains an allowance for credit losses based upon the expected collectability of its accounts receivable. The Company assesses collectability by reviewing accounts receivable on a collective basis where similar characteristics exist and on an individual basis when we identify specific customers with known disputes or collectability issues. In determining the amount of the allowance for credit losses, the Company reviewed credit profiles of its customers, contractual terms and conditions, current economic trends, reasonable and supportable forecasts of future economic conditions, and historical payment experience.
Property and Equipment, net
Property and equipment, net, are stated at cost less accumulated depreciation and amortization. Depreciation and amortization are computed using the straight-line method over the estimated useful lives of the assets, which are three years for computer equipment and software and five years for all other asset categories except leasehold improvements, which are amortized over the shorter of the lease term or the expected useful life of the improvements.
Internal-Use Software Development Costs
For costs incurred for computer software developed or obtained for internal use, the Company begins to capitalize its costs to develop software when preliminary development efforts are successfully completed, management has authorized and committed project funding, and it is probable that the project will be completed and the software will be used as intended. These costs are amortized to cost of revenues over the estimated useful life of the related asset, generally estimated to be three years. Costs related to preliminary project activities and post implementation activities, including training and maintenance are expensed as incurred and recorded in research and development expense on the Company’s consolidated statements of operations.
Leases
The Company determines if an arrangement is a lease at inception. Right-of-use (“ROU”) assets represent the Company’s right to use an underlying asset for the lease term and lease liabilities represent the Company’s obligation to make lease payments arising from the lease. The Company has elected the practical expedient not to recognize ROU assets and lease liabilities for short-term leases with terms of twelve months or less. Operating lease ROU assets and liabilities are recognized at commencement date based on the present value of lease payments over the lease term. As the rate implicit in each lease is not readily determinable, the Company uses an incremental borrowing rate to determine the present value of the lease payments at commencement date. The operating lease ROU asset also includes any lease payments made and excludes lease incentives. The lease terms may include options to extend or terminate the lease when it is reasonably certain that the Company will exercise that option. The Company accounts for lease and non-lease components as a single lease component. Operating lease expense is recognized on a straight-line basis over the lease term.
Operating ROU assets and lease liabilities are included on the Company’s consolidated balance sheet. Operating ROU assets are included as operating lease right-of-use assets. The current portion of the operating lease liabilities is included in other current liabilities and the long-term portion is included in other non-current liabilities on the Company’s consolidated balance sheet.
Business Combinations
The Company accounts for acquisitions of entities that include inputs and processes and have the ability to create outputs as business combinations. Under the acquisition method of accounting, the total consideration is allocated to the tangible and identifiable intangible assets acquired and liabilities assumed based on their estimated fair values at the acquisition date. The excess of the consideration transferred over those fair values is recorded as goodwill. During the measurement period, which may be up to one year from the acquisition date, the Company may record adjustments to the assets acquired and liabilities assumed with the corresponding offset to goodwill. Acquisition related costs are not considered part of the consideration, and are expensed as general and administrative expense as incurred. Contingent consideration, if any, is measured at fair value initially on the acquisition date as well as subsequently at the end of each reporting period, typically based on the expected achievement of certain financial metrics, until, the assessment period is over and it is finally settled.
Goodwill and Intangible Assets
Intangible assets with a finite life are amortized over their estimated useful lives. Goodwill is not subject to amortization but is tested for impairment at least annually, and more frequently upon the occurrence of certain events that may indicate that the carrying value of goodwill may not be recoverable. The Company completes its annual impairment test during the fourth quarter of each year, at the reporting unit level, which is at the company level as a whole, since the Company operates in 1 single reporting segment. There was 0 impairment of goodwill for the years ended December 31, 2020, 2019 and 2018.
Long-Lived assets are reviewed for impairment whenever events or changes in circumstances indicate that the carrying amount of such assets may not be recoverable.
The Company evaluates intangible assets for potential impairment indicators at least quarterly and more frequently upon the occurrence of events that could impact prior conclusions. Judgment regarding the existence of impairment indicators is based on market conditions and as well as the operational performance of its businesses. Additionally, future events could cause the Company to conclude that impairment indicators exist, and therefore long-lived assets could be impaired.
The Company considers the following to be some examples of indicators that may trigger an impairment review: (i) actual undiscounted cash flows significantly below historical or projected future undiscounted cash flows for the associated assets; (ii) significant changes in the manner or use of the assets or in our overall strategy with respect to the manner or use of the acquired assets or changes in its overall business strategy; (iii) significant negative industry or economic trends; (iv) increased competitive pressures; and (v) a significant decline in its stock price for a sustained period of time.
Once the Company determines that a potential impairment indicator exists, it performs the test for recoverability by comparing the estimated future undiscounted cash flows associated with the intangible assets with the intangible asset’s carrying amount. Where the carrying value of the intangible asset exceeds the future undiscounted cash flows associated with the intangible assets, it is determined that the value of those intangible assets cannot be recovered. For an intangible asset failing the recoverability test, an impairment charge is recorded for the difference between the carrying value and the estimated fair value.
The key assumptions used in the Company's estimates of projected cash flow of its intangible assets deal largely with forecasts of sales levels, gross margins, and operating costs. These forecasts are typically based on historical trends and take into account recent developments as well as its plans and intentions. Any material change in the Company's assumptions could significantly impact projected future cash flows of the intangible assets and these factors are considered in evaluating impairment. Other factors, such as increased competition or a decrease in the desirability of our products, could lead to lower projected sales levels, which would adversely impact cash flows. A significant decrease in cash flows in the future could result in an impairment of long-lived assets. There was no material impairment of intangible assets for the years ended December 31, 2020 2019 and 2018.
Fair Value of Financial Instruments
The carrying values of the Company’s financial instruments, including cash equivalents, accounts receivable, accounts payable, accrued compensation and benefits, and other current liabilities, approximate fair value due to their short-term nature. The Company records money market funds, short-term investments and contingent consideration at fair value. See Note 3 (Fair Value Measurements).
Convertible Senior Notes
In November 2017, the Company issued $200.0 million aggregate principal amount of 1.75% convertible senior notes due 2022 (the “notes”). In accounting for the issuance of the notes, the Company separated the notes into liability and equity components. The carrying amount of the liability component was calculated by measuring the fair value of a similar liability that does not have an associated convertible feature. The carrying amount of the equity component representing the conversion option was determined by deducting the fair value of the liability component from the par value of the notes as a whole. This difference represents a debt discount that is amortized to interest expense over the terms of the notes. The equity component is not remeasured as long as it continues to meet the conditions for equity classification. In accounting for the issuance costs related to the notes, the Company allocated the total amount incurred to the liability and equity components. Issuance costs attributable to the liability components are being amortized to expense over the contractual term of the notes, and issuance costs attributable to the equity component were netted with the equity component in additional paid-in capital.
Revenue Recognition
The Company primarily generates revenue by providing digital media and promotions solutions to its customers and partners. Revenues are recognized when control of the promised goods or services is transferred to the Company’s customers, in an amount that reflects the consideration the Company expects to be entitled to in exchange for those goods or services.
The Company determines revenue recognition through the following steps:
•Identification of the contract, or contracts, with a customer
•Identification of the performance obligations in the contract
•Determination of the transaction price
•Allocation of the transaction price to the performance obligations in the contract
•Recognition of revenue when, or as, we satisfy a performance obligation
The Company provides digital promotions, including digital coupons, and/or media programs to its customers which consists of CPG customers, retail partners and advertising agencies whereby it uses its proprietary technology platforms to create, target, deliver and analyze these programs. The Company typically generates revenue from its customers through the use of these programs on a cost-per-click, cost-per-impression, or cost-per-acquisition basis. Programs usually include a limit on the number of clicks and/or impressions and are billed monthly.
The pricing of digital promotions programs typically includes both promotion setup fees and promotion campaign fees. Promotion setup fees are related to the creation of digital promotions and set up of the underlying campaign on Quotient’s proprietary platforms for tracking of the related clicks. The Company recognizes revenues related to promotion setup fees over time, proportionally, on a per click basis, using the number of authorized clicks, per insertion order, commencing on the date of the first click. A click refers to the consumers action of activating a digital promotion through the Company’s proprietary technology platforms by either saving it to a retailer’s loyalty account for automatic digital redemption, or printing it for physical redemption at a retailer. Promotion campaign fees are usually determined on a per click basis. The Company typically recognizes revenues for digital promotion campaign fees as clicks occur.
The Company’s media programs enable CPGs and retailers to distribute digital media to promote their brands and products on its retailers' websites, and mobile applications, and through a network of affiliate publishers and non-publisher third parties that display its media offerings on their websites or mobile applications. Pricing for media campaigns is usually determined on a cost-per-impression, cost-per-click or cost-per-acquisition basis. The Company recognizes revenue each time a digital media ad is displayed or each time a user clicks on the media ad displayed on the Company’s websites, mobile applications or on third-party websites.
Digital promotion programs also include the Company’s Specialty Retail business, in which specialty stores including clothing, electronics, home improvement and many others offer coupon codes that we distribute. Each time a consumer makes a purchase using a coupon code, delivered through our platform, we earn a distribution fee. The Company usually generates revenues when a consumer makes a purchase using a coupon code from its platform and completion of the order is reported to the Company. In the same period that the Company recognizes revenues for the delivery of coupon codes, it also estimates and records a reserve, based upon historical experience, to provide for end-user cancellations or product returns which may not be reported until a subsequent date.
Gross versus Net Revenue Reporting
In the normal course of business and through its distribution network, the Company delivers digital media and promotions on retailers’ websites through retailers’ loyalty programs, and on the websites of digital publishers. In these situations, the Company evaluates whether it is the principal (i.e., report revenues on a gross basis) or agent (i.e., report revenues on a net basis). The Company reports certain digital promotion and media advertising revenues for campaigns placed on third-party owned properties on a gross basis, that is, the amounts billed to its customers are recorded as revenues, and distribution fees paid to retailers or digital publishers are recorded as cost of revenues. The Company is the principal because it controls the digital promotion and media advertising inventory before it is transferred to its customers. The Company’s control is evidenced by its sole ability to monetize the digital coupon and media advertising inventory, being primarily responsible to its customers, having discretion in establishing pricing for the delivery of the digital coupons and media, or a combination of these.
In other cases, the Company reports certain digital media advertising revenues on a net basis, that is, the costs for digital advertising inventory and third-party data paid to suppliers are deducted from gross revenues to arrive at net revenues. The Company’s performance obligation in these arrangements is to provide the use of its platforms that enables customers to bid on digital advertising inventory, which is determined based on real-time bidding, use of data and other add-on features in designing and executing their campaigns. The Company charges its customers a platform fee based on a percentage of the digital advertising inventory and data costs purchased through the use of its platforms. The platform fee is not contingent on the results of a digital media advertising campaign. The Company has determined that it’s an agent in these arrangements because it does not have control of the digital advertising inventory before it is transferred to the customer and does not set prices agreed upon within the auction marketplace.
Arrangements with Multiple Performance Obligations
The Company’s contracts with customers may include multiple performance obligations. For these contracts, the Company accounts for individual performance obligations separately if they are distinct. The transaction price is allocated to the separate performance obligations on a relative standalone selling price basis. The Company determines its best estimate of its standalone selling prices based on its overall pricing objectives, taking into consideration market conditions and other factors, including the value of its contracts and characteristics of targeted customers.
Deferred Revenues
Deferred revenues primarily relate to cash received or billings to customers associated with promotion setup fees, promotion campaign fees and digital media fees that are expected to be recognized upon click, or delivery of media impressions, which generally occur within the next twelve months. The Company records deferred revenues, including amounts which are refundable, when cash payments are received or become due in advance of the Company satisfying its performance obligations. The increase in the deferred revenue balance for year ended December 31, 2020 is primarily driven by cash payments received or due in advance of satisfying our performance obligations of $30.0 million, partially offset by $28.8 million of recognized revenue.
The Company’s payment terms vary by the type and size of its customers. For certain products or services and customer types, we require payment before the products or services are delivered to the customer.
Disaggregated Revenue
The following table presents the Company’s revenues disaggregated by type of services (in thousands). The majority of the Company’s revenue is generated from sales within the United States.
| | | | | | | | | | | | | | | | | |
| | Year Ended December 31, |
| | 2020 | | 2019 | | 2018 |
| Promotion | $ | 237,385 | | | $ | 246,479 | | | $ | 245,493 | |
| Media | 208,502 | | | 189,681 | | | 141,465 | |
| Total Revenue | $ | 445,887 | | | $ | 436,160 | | | $ | 386,958 | |
Practical Expedients and Exemptions
The Company does not disclose the value of unsatisfied performance obligations for (i) contracts with an original expected length of one year or less and (ii) contracts for which it recognizes revenue for an amount where it has the right to invoice for services performed.
Cost of Revenues
Cost of revenues consist primarily of distribution fees, personnel costs, depreciation related to data center equipment, and amortization expense related to capitalized internal use software, acquisition related intangible assets and purchased intangible assets, data center costs, third-party service fees including traffic acquisition costs and purchase of third-party data. Distribution fees consist of payments to partners within the Company’s network for their digital coupon publishing services. Personnel costs include salaries, bonuses, stock-based awards and
employee benefits and are primarily attributable to individuals maintaining the Company’s data centers and operations, which initiate, sets up and deliver digital coupon media campaigns.
Sales Commissions
The Company generally incurs and expenses sales commissions upon recognition of revenue for related goods and services, which typically occurs within one year or less. Sales commissions earned related to revenues for initial contracts are commensurate with sales commissions related to renewal contracts. These costs are included in sales and marketing expenses within the consolidated statements of operations.
Research and Development Expense
The Company expenses the cost of research and development as incurred. Research and development expense consists primarily of personnel and related headcount costs and costs of professional services associated with the ongoing development of the Company’s technology.
Stock-Based Compensation
The Company accounts for stock-based compensation for all stock-based awards made to employees and directors, including stock options, restricted stock units, performance-based restricted stock units, and employee stock purchase plan using the fair value method. This method requires the Company to measure the stock-based compensation based on the grant-date fair value of the awards and recognize the compensation expense over the requisite service period. The fair values of stock options and shares pursuant to Employee Stock Purchase Plan (“ESPP”) are estimated at the date of grant using the Black-Scholes-Merton option pricing model, which includes assumptions for the dividend yield, expected volatility, risk-free interest rate, and expected life. The fair values of restricted stock and restricted stock units are determined based upon the fair value of the underlying common stock at the date of grant. The Company expenses stock-based compensation using the straight-line method over the vesting term of all awards except for performance-based restricted stock units, which are expensed using the accelerated attribution method.
Advertising Expense
Advertising costs are expensed when incurred and are included in sales and marketing expense on the accompanying consolidated statements of operations. The Company incurred $2.0 million, $1.6 million and $0.3 million of advertising costs during the years ended December 31, 2020, 2019 and 2018, respectively. Advertising costs consist primarily of online marketing costs, such as sponsored search, advertising on social networking sites, e-mail marketing campaigns, loyalty programs, and affiliate programs.
Income Taxes
The Company accounts for income taxes in accordance with authoritative guidance, which requires the use of the liability method. Under this method, deferred income tax assets and liabilities are determined based upon the difference between the consolidated financial statement carrying amounts and the tax basis of assets and liabilities and are measured using the enacted tax rate expected to apply to taxable income in the years in which the differences are expected to reverse. A valuation allowance is provided when it is more likely than not that the deferred tax assets will not be realized. The Company recognizes liabilities for uncertain tax positions based upon a two-step process. To the extent a tax position does not meet a more-likely-than-not level of certainty, no benefit is recognized in the consolidated financial statements. If a position meets the more-likely-than-not level of certainty, it is recognized in the consolidated financial statements at the largest amount that has a greater than 50% likelihood of being realized upon ultimate settlement. The Company accounts for any applicable interest and penalties as a component of income tax expense.
Foreign Currency
Foreign currency denominated assets and liabilities of foreign subsidiaries, where the local currency is the functional currency, are translated into U.S. Dollars using the exchange rates in effect at the balance sheet dates, and income and expenses are translated using average exchange rates during the period. The resulting foreign currency translation adjustments are recorded in accumulated other comprehensive loss, a component of stockholders’ equity.
Gains and losses from foreign currency transactions are included in other income (expense), net in the accompanying consolidated statements of operations. Foreign currency transaction gains (losses) were immaterial for all the periods presented in the accompanying consolidated financial statements.
Other Comprehensive Income (Loss)
Other comprehensive income (loss) consists of foreign currency translation adjustments.
Net Income (Loss) per Share
The Company’s basic net income (loss) per share attributable to common stockholders is computed by dividing the net income (loss) by the weighted-average number of shares of common stock outstanding during the period. The diluted net income (loss) per share is computed by giving effect to all potentially dilutive common share equivalents outstanding during the period. The dilutive effect of dilutive common share equivalents is reflected in diluted net income (loss) per share by application of the treasury stock method. Since the Company intends to settle the principal amount of its outstanding convertible senior notes in cash, the Company uses the treasury stock method for calculating any potential dilutive effect of the conversion spread on diluted net income per share, if applicable. The effects of options to purchase common stock, RSUs, certain shares held in escrow, and convertible senior notes are excluded from the computation of diluted net loss per share attributable to common stockholders because their effect is antidilutive.
Segments
The Company’s chief operating decision maker (“CODM”), who is the Chief Executive Officer, reviews the Company’s financial information presented on a consolidated basis for purposes of allocating resources and evaluating its financial performance. There are no segment managers who are held accountable by the CODM, or anyone else, for operations, operating results, and planning for levels or components below the consolidated unit level. Accordingly, the Company has determined that it operates in 1 single reporting segment.
Concentration of Credit Risk
Financial instruments that potentially subject the Company to concentrations of credit risk consist primarily of cash, cash equivalents, short-term investments and accounts receivable. For cash, cash equivalents and short-term investments, the Company is exposed to credit risk in the event of default by the financial institutions to the extent of the amounts recorded on the accompanying consolidated balance sheets. Credit risk with respect to accounts receivable is dispersed due to the large number of customers. The Company does not require collateral for accounts receivable.
Recently Issued Accounting Pronouncements
Accounting Pronouncements Adopted
Credit Losses
In June 2016, the FASB issued Accounting Standards Update No. 2016-13 (ASU 2016-13) "Financial Instruments-Credit Losses (Topic 326): Measurement of Credit Losses on Financial Instruments", which requires the measurement and recognition of expected credit losses for financial assets held at amortized cost. ASU 2016-13 replaces the existing incurred loss impairment model with an expected loss model which requires the use of a broader range of information to estimate credit losses.
The Company adopted ASU 2016-13 on January 1, 2020 and the impact of the adoption was not material to the Company’s condensed consolidated financial statements and related disclosures.
Accounting Pronouncements Not Yet Adopted
In August 2020, the Financial Accounting Standards Board (“FASB”) issued ASU 2020-06, Debt—Debt with Conversion and Other Options (Subtopic 470-20) and Derivatives and Hedging—Contracts in Entity’s Own Equity (Subtopic 815-40): Accounting for Convertible Instruments and Contracts in an Entity’s Own Equity. The guidance simplifies an issuer's accounting for convertible debt instruments and its application of the derivatives scope
exception for contracts in its own entity. The guidance eliminates two of the three models in ASC 470-20 that require separate accounting for embedded conversion features. The standard is effective for the Company beginning January 1, 2022, and interim periods within that reporting period. The Company is currently evaluating the impact of adopting this new accounting guidance on the consolidated financial statements.
3. Fair Value Measurements
The fair value is defined as the price that would be received to sell an asset or paid to transfer a liability in an orderly transaction between market participants at the measurement date. Fair value is estimated by applying the following hierarchy, which prioritizes the inputs used to measure fair value into three levels and bases the categorization within the hierarchy upon the lowest level of input that is available and significant to the fair value measurement:
Level 1—Quoted prices (unadjusted) in active markets for identical assets or liabilities.
Level 2—Observable inputs other than quoted prices in active markets for identical assets and liabilities, quoted prices for similar assets or liabilities in active or inactive markets, or other inputs that are observable or can be corroborated by observable market data for substantially the full term of the assets or liabilities.
Level 3—Inputs that are generally unobservable and typically reflect management’s estimate of assumptions that market participants would use in pricing the asset or liability.
Assets and Liabilities Measured at Fair Value on a Recurring Basis
The Company’s fair value hierarchy for its financial assets and liabilities that are measured at fair value on a recurring basis are as follows (in thousands):
| | | | | | | | | | | | | | | | | | | | | | | |
| | December 31, 2020 |
| | Level 1 | | Level 2 | | Level 3 | | Total |
| Assets: | | | | | | | |
| Cash equivalents: | | | | | | | |
| Money market funds | $ | 104,964 | | | 0 | | | 0 | | | $ | 104,964 | |
| Total | $ | 104,964 | | | $ | 0 | | | $ | 0 | | | $ | 104,964 | |
| Liabilities: | | | | | | | |
| Contingent consideration related to acquisitions | 0 | | | 0 | | | 29,454 | | | 29,454 | |
| Total | $ | 0 | | | $ | 0 | | | $ | 29,454 | | | $ | 29,454 | |
| | | | | | | | | | | | | | | | | | | | | | | |
| | December 31, 2019 |
| | Level 1 | | Level 2 | | Level 3 | | Total |
| Assets: | | | | | | | |
| Cash equivalents: | | | | | | | |
| Money market funds | $ | 124,303 | | | 0 | | | 0 | | | $ | 124,303 | |
| U.S. Treasury Bills | 15,120 | | | 0 | | | 0 | | | 15,120 | |
| Total | $ | 139,423 | | | $ | 0 | | | $ | 0 | | | $ | 139,423 | |
| Liabilities: | | | | | | | |
| Contingent consideration related to acquisitions | 0 | | | 0 | | | 36,220 | | | 36,220 | |
| Total | $ | 0 | | | $ | 0 | | | $ | 36,220 | | | $ | 36,220 | |
The valuation technique used to measure the fair value of money market funds and U.S. Treasury Bills includes using quoted prices in active markets. The money market funds have a fixed net asset value (NAV) of $1.0.
The contingent consideration as of December 31, 2020 and 2019 relates to the acquisition of MLW Squared Inc. (“Ahalogy”), Elevaate Ltd. (“Elevaate”) and Ubimo, Ltd. (“Ubimo”). The fair values of contingent consideration are based on the expected achievement of certain financial metrics as defined under the acquisition agreements and was estimated using an option pricing method with significant inputs that are not observable in the market, thus
classified as a Level 3 instrument. The inputs included the expected achievement of certain financial metrics over the contingent consideration period, volatility and discount rate. The fair-value of the contingent consideration is classified as a liability and is re-measured each reporting period. Refer to Note 6 for further details related to the acquisitions.
The following table represents the change in the contingent consideration (in thousands):
| | | | | | | | | | | | | | | | | | | | | | | | | | | | | |
| | Ubimo | | Elevaate | | Ahalogy | | Crisp | | |
| | Level 3 | | Level 3 | | Level 3 | | Level 3 | | Total |
| Balance as of December 31, 2017 | 0 | | | 0 | | | 0 | | | 18,500 | | | 18,500 | |
Addition related to acquisition
(initial measurement) | 0 | | | 6,121 | | | 14,582 | | | 0 | | | 20,703 | |
| Change in fair value during the period | 0 | | | 0 | | | 8,260 | | | 6,000 | | | 14,260 | |
| Payments made during the period | 0 | | | 0 | | | 0 | | | (24,500) | | | (24,500) | |
| Balance as of December 31, 2018 | 0 | | | 6,121 | | | 22,842 | | | 0 | | | 28,963 | |
Addition related to acquisition
(initial measurement) | 5,686 | | | 0 | | | 0 | | | 0 | | | 5,686 | |
| Change in fair value during the period | 0 | | | (2,587) | | | 4,158 | | | 0 | | | 1,571 | |
| Balance as of December 31, 2019 | 5,686 | | | 3,534 | | | 27,000 | | | 0 | | | 36,220 | |
| Change in fair value during the period | 15,244 | | | 4,990 | | | 0 | | | 0 | | | 20,234 | |
| Payments made during the period | 0 | | | 0 | | | (27,000) | | | 0 | | (27,000) | |
| Balance as of December 31, 2020 | $ | 20,930 | | | $ | 8,524 | | | $ | 0 | | | $ | 0 | | | $ | 29,454 | |
During the years ended December 31, 2020, 2019, and 2018, the Company recorded a charge of $20.2 million, $1.6 million, and $14.3 million, respectively, for the re-measurement of the fair values of contingent consideration related to acquisitions, as a component of operating expenses in the accompanying consolidated statements of operations.
During the year ended December 31, 2020, the Company paid $27.0 million related to Ahalogy’s achievement of financial metrics, and as a result, 0 liability exists as of December 31, 2020. Out of the total consideration paid, $14.6 million was originally measured and recorded on the acquisition date as part of consideration transferred and $12.4 million was recorded subsequent to the acquisition date through changes in fair value of contingent consideration within the consolidated statements of operations.
During the year ended December 31, 2018, the Company paid $24.5 million related to Crisp’s achievement of financial metrics, and as a result, 0 liability existed as of December 31, 2018. Out of the total consideration paid, $14.8 million was originally measured and recorded on the acquisition date as part of consideration transferred and $9.7 million was recorded subsequent to the acquisition date through changes in fair value of contingent consideration within the consolidated statements of operations.
Fair Value Measurements of Other Financial Instruments
As of December 31, 2020 and 2019, the fair value of the 1.75% convertible senior notes due 2022 was $196.5 million and $195.4 million, respectively. The fair value was determined based on a quoted price of the convertible senior notes in an over-the-counter market on the last trading day of the reporting period. Accordingly, these convertible senior notes are classified within Level 2 in the fair value hierarchy. Refer to Note 9 for additional information related to the Company’s convertible debt.
4. Allowance for Credit Losses
The summary of activities in the allowance for credit losses is as follows (in thousands):
| | | | | | | | | | | | | | | | | |
| | Year Ended December 31, |
| | 2020 | | 2019 | | 2018 |
| Balance at beginning of period | $ | 2,021 | | | $ | 1,200 | | | $ | 786 | |
| Additions related to acquisitions | 0 | | | 377 | | | 32 | |
| Provision for expected credit losses | 888 | | | 1,227 | | | 509 | |
| Write-offs charged against the allowance | (839) | | | (783) | | | (127) | |
| Balance at end of period | $ | 2,070 | | | $ | 2,021 | | | $ | 1,200 | |
5. Balance Sheet Components
Property and Equipment, Net
Property and equipment consist of the following (in thousands):
| | | | | | | | | | | |
| | December 31, |
| | 2020 | | 2019 |
| Software | $ | 47,357 | | | $ | 41,876 | |
| Computer equipment | 23,912 | | | 25,773 | |
| Leasehold improvements | 6,197 | | | 5,883 | |
| Furniture and fixtures | 2,533 | | | 2,449 | |
| Total | 79,999 | | | 75,981 | |
| Accumulated depreciation and amortization | (65,959) | | | (63,543) | |
| Projects in process | 3,228 | | | 1,266 | |
| Property and equipment, net | $ | 17,268 | | | $ | 13,704 | |
Depreciation and amortization expense of property and equipment was $7.2 million, $7.5 million and $7.2 million for the years ended December 31, 2020, 2019 and 2018, respectively.
The Company capitalized internal use software development costs of $7.5 million, $5.8 million, and $2.9 million during the years ended December 31, 2020, 2019 and 2018, respectively. During the years ended December 31, 2020, 2019 and 2018, the Company had $3.4 million, $2.5 million and $1.3 million, respectively, in amortization expense related to internal use software, which is included in property and equipment depreciation and amortization expense and recorded as cost of revenues. The unamortized capitalized internal use software development costs were $8.6 million and $5.8 million as of December 31, 2020 and 2019, respectively and included as part of software costs.
Accrued Compensation and Benefits
Accrued compensation and benefits consist of the following (in thousands):
| | | | | | | | | | | |
| | December 31, |
| | 2020 | | 2019 |
| Commissions | $ | 7,247 | | | $ | 5,996 | |
| Bonus | 3,150 | | | 5,997 | |
| Payroll and related expenses | 3,116 | | | 2,533 | |
| Vacation | 855 | | | 706 | |
| Accrued compensation and benefits | $ | 14,368 | | | $ | 15,232 | |
Other Current Liabilities
Other current liabilities consist of the following (in thousands):
| | | | | | | | | | | |
| | December 31, |
| | 2020 | | 2019 |
| Distribution fees | $ | 36,245 | | | $ | 20,360 | |
| Traffic acquisition cost | 9,756 | | | 5,278 | |
| Operating lease liabilities | 3,650 | | | 3,168 | |
| Prefunded Liability | 3,067 | | | 5,429 | |
| Marketing expenses | 2,251 | | | 2,164 | |
| Liability related to purchased intangible asset | 1,250 | | | 1,000 | |
| Interest payable | 282 | | | 282 | |
| Other | 14,119 | | | 12,351 | |
| Other current liabilities | $ | 70,620 | | | $ | 50,032 | |
6. Acquisitions
Acquisition of Ubimo
On November 19, 2019, the Company acquired all outstanding shares of Ubimo, a leading data and media activation company.
The total preliminary acquisition consideration of $20.7 million consisted of $15.0 million in cash and contingent consideration of up to $24.8 million payable in cash with an estimated fair value of $5.7 million as of the acquisition date. The contingent consideration payout is based on Ubimo achieving certain financial metrics between the date of the acquisition through December 31, 2021. The acquisition date fair value was determined using an option pricing model. The fair value of the contingent consideration will be remeasured through earnings every reporting period. Refer to Note 3 for the fair value of contingent consideration at December 31, 2020.
Acquisition of Elevaate
On October 26, 2018, the Company acquired all the outstanding shares of Elevaate, a sponsored search company for retail partners and CPG brands.
The total preliminary acquisition consideration of $13.3 million consisted of $7.2 million in cash and contingent consideration of up to $18.5 million payable in cash with an estimated fair value of $6.1 million as of the acquisition date. The contingent consideration payout is based on Elevaate achieving certain financial metrics between February 1, 2019 through January 31, 2021. Refer to Note 3 for the fair value of contingent consideration at December 31, 2020.
Acquisition of SavingStar, Inc.
On August 27, 2018, the Company acquired all the outstanding shares of SavingStar, Inc. (“SavingStar”), a digital promotions companywith a CRM platform designed to help brands build and track loyalty programs with their consumers.
The total preliminary acquisition consideration at closing consisted of $7.5 million in cash. In addition, SavingStar may receive potential contingent consideration of up to $10.6 million payable in all cash, subject to achieving certain financial metrics between closing through February 29, 2020. At the date of acquisition, the contingent consideration’s fair value was determined to be 0 using an option pricing model. As of February 29, 2020, the date that the contingent consideration period ended, SavingStar did not achieve certain financial metrics for payout and the fair value was concluded to be 0. Accordingly, the Company determined that no payout was required when the contingent consideration period ended.
Acquisition of Ahalogy
On June 1, 2018, the Company acquired all the outstanding shares of Ahalogy, an influencer marketing firm that delivers premium content across social media channels for CPG brands. The acquisition enhances the
Company’s performance media solutions for CPGs and retailers, adding social media expertise and a roster of influencers.
The total preliminary acquisition consideration of $36.4 million consisted of $21.8 million in cash and contingent consideration of up to $30.0 million payable in all cash with an estimated fair value of $14.6 million as of the acquisition date. The contingent consideration payout was based on Ahalogy achieving certain financial metrics between closing through December 31, 2019. The acquisition date fair value of the contingent consideration was determined by using an option pricing model. The fair value of the contingent consideration was remeasured every reporting period. As of December 31, 2019, the date that the contingent consideration period ended, Ahalogy earned the full payout of the contingent consideration by achieving certain financial metrics.The Company paid out $30.0 million during the year ended December 31, 2020, of which $27.0 million related to contingent consideration and $3.0 million related to certain bonuses; and as a result, 0 liability exists as of December 31, 2020. Of the total $30.0 million that was paid, $14.6 million is classified within financing activity and the remaining $15.4 million is classified within operating activity on the Company’s consolidated statements of cash flows.
Each of these acquisitions were accounted for as a business combination. Accordingly, assets acquired and liabilities assumed were recorded at their estimated fair values as of the acquisition date when control was obtained. The Company expensed all transaction costs in the period in which they were incurred. The Company acquired various intangible assets resulting from these acquisitions, such as, customer relationships, vendor relationships, developed technologies and trade names. The fair value of the customer relationships was determined by using a discounted cash flow model. The fair value of the vendor relationships was determined by using a cost approach. The fair value of developed technologies was determined by using the relief from royalty method or the with-and-without method. The fair value of trade names was determined by using the relief from royalty method. The excess of the consideration paid over the fair value of the net tangible assets and liabilities and identifiable intangible assets acquired is recorded as goodwill. The goodwill arising from the acquisitions are largely attributable to the synergies expected to be realized. NaN of the goodwill recorded from the acquisitions will be deductible for income tax purposes.
For each of these acquisitions,the fair value of the consideration transferred and the assets acquired and liabilities assumed was determined by the Company and in doing so management engaged a third-party valuation specialist to measure the fair value of identifiable intangible assets and obligations related to deferred revenue and contingent consideration. The estimated fair value of the identifiable assets acquired and liabilities assumed in the relevant acquisition is based on management’s best estimates.
The following table summarizes the consideration paid for each acquisition and the related fair values of the assets acquired and liabilities assumed (in thousands):
| | | | | | | | | | | | | | | | | | | | | | | | | | | | | | | | | | | |
| | Purchase
Consideration | | Net
Tangible
Assets
Acquired/
(Liabilities
Assumed) | | Identifiable
Intangible
Assets | | Goodwill | | Goodwill
Deductible
for Taxes | | Acquisition
Related
Expenses
(1) |
| Ubimo | $ | 20,740 | | | $ | 384 | | | $ | 10,750 | | | $ | 9,606 | | | Not Deductible | | $ | 579 | |
| Elevaate | $ | 13,346 | | | $ | (60) | | | $ | 3,781 | | | $ | 9,625 | | | Not Deductible | | $ | 549 | |
| SavingStar | $ | 7,485 | | | $ | (1,126) | | | $ | 2,577 | | | $ | 6,034 | | | Not Deductible | | $ | 556 | |
| Ahalogy | $ | 36,432 | | | $ | 2,196 | | | $ | 11,580 | | | $ | 22,656 | | | Not Deductible | | $ | 684 | |
| | $ | 78,003 | | | $ | 1,394 | | | $ | 28,688 | | | $ | 47,921 | | | | | $ | 2,368 | |
(1)Expensed as general and administrative
The following table sets forth each component of identifiable intangible assets acquired in connection with the acquisitions: (in thousands):
| | | | | | | | | | | | | | | | | | | | | | | | | | | | | | | | | | | | | | | | | | | | | | | |
| | Ubimo | | Estimated
Useful
Life
(in Years) | | Elevaate | | Estimated
Useful
Life
(in Years) | | SavingStar | | Estimated
Useful
Life
(in Years) | | Ahalogy | | Estimated
Useful
Life
(in Years) |
| Developed technologies | $ | 7,100 | | | 4.0 | | $ | 3,307 | | | 5.0 | | $ | 1,476 | | | 3.0 | | $ | 3,100 | | | 4.0 |
| Customer relationships | 3,400 | | | 2.0 | | 379 | | | 5.0 | | 1,040 | | | 3.0 | | 6,210 | | | 6.0 |
| Trade names | 250 | | | 4.0 | | 95 | | | 3.0 | | 61 | | | 1.5 | | 650 | | | 4.0 |
| Vendor relationships | — | | | — | | | — | | | — | | | — | | | — | | | 1,620 | | | 2.0 |
Total identifiable
intangible assets | $ | 10,750 | | | | | $ | 3,781 | | | | | $ | 2,577 | | | | | $ | 11,580 | | | |
The financial results of the acquired companies are included in the Company’s consolidated statements of operations from their respective acquisition dates and were insignificant to the Company’s operating results. The pro forma impact of these acquisitions on consolidated revenues, income (loss) from operations and net loss was not material.
7. Goodwill and Intangible Assets
Goodwill:
Goodwill represents the excess of the consideration paid over the fair value of the net tangible and identifiable intangible assets acquired in a business combination. The changes in the carrying value of goodwill are as follows (in thousands):
| | | | | |
| Goodwill |
Balance as of December 31, 2018 | $ | 118,821 | |
Acquisition of Ubimo | 9,606 | |
Balance as of December 31, 2019 | 128,427 | |
Acquisitions | 0 | |
Balance as of December 31, 2020 | $ | 128,427 | |
Intangible Assets:
The following table summarizes the gross carrying amount and accumulated amortization for the intangible assets (in thousands):
| | | | | | | | | | | | | | | | | | | | | | | |
| | December 31, 2020 |
| | Gross | | Accumulated
Amortization | | Net | | Weighted
Average
Amortization
Period
(Years) |
| Media service rights | $ | 35,934 | | | $ | (25,688) | | | $ | 10,246 | | | 1.4 |
| Promotion service rights | 33,566 | | | (17,234) | | | 16,332 | | | 1.9 |
| Developed technologies | 27,170 | | | (18,511) | | | 8,659 | | | 2.5 |
| Customer relationships | 22,690 | | | (16,105) | | | 6,585 | | | 2.7 |
| Data access rights | 10,801 | | | (8,420) | | | 2,381 | | | 1.0 |
| Domain names | 5,948 | | | (5,596) | | | 352 | | | 0.0 |
| Trade names | 2,823 | | | (2,546) | | | 277 | | | 0.6 |
| Vendor relationships | 2,510 | | | (2,510) | | | 0 | | | 0.0 |
| Patents | 975 | | | (909) | | | 66 | | | 1.8 |
| Registered users | 420 | | | (420) | | | 0 | | | 0.0 |
| | $ | 142,837 | | | $ | (97,939) | | | $ | 44,898 | | | 2.0 |
| | | | | | | | | | | | | | | | | | | | | | | |
| | December 31, 2019 |
| | Gross | | Accumulated
Amortization | | Net | | Weighted
Average
Amortization
Period
(Years) |
| Media service rights | $ | 34,684 | | | $ | (16,098) | | | $ | 18,586 | | | 2.2 |
| Promotion service rights | 30,548 | | | (10,682) | | | 19,866 | | | 3.6 |
| Developed technologies | 27,170 | | | (12,790) | | | 14,380 | | | 3.2 |
| Customer relationships | 22,690 | | | (12,267) | | | 10,423 | | | 3.3 |
| Data access rights | 10,801 | | | (6,415) | | | 4,386 | | | 2.3 |
| Domain names | 5,948 | | | (5,540) | | | 408 | | | 0.8 |
| Trade names | 2,823 | | | (1,560) | | | 1,263 | | | 2.2 |
| Vendor relationships | 2,510 | | | (2,172) | | | 338 | | | 0.4 |
| Patents | 975 | | | (873) | | | 102 | | | 2.8 |
| Registered users | 420 | | | (420) | | | 0 | | | 0.0 |
| | $ | 138,569 | | | $ | (68,817) | | | $ | 69,752 | | | 3.0 |
As of December 31, 2020 and 2019, the Company has a domain name with a gross value of $0.4 million with an indefinite useful life that is not subject to amortization.
Intangible assets subject to amortization are amortized over their useful lives as shown in the table above. Amortization expense related to intangible assets subject to amortization was $29.1 million, $24.0 million and $17.8 million for the years ended December 31, 2020, 2019 and 2018, respectively. Estimated future amortization expense related to intangible assets as of December 31, 2020 is as follows (in thousands):
| | | | | |
| | Total |
| 2021 | $ | 25,211 | |
| 2022 | 15,193 | |
| 2023 | 3,583 | |
| 2024 | 559 | |
| 2025 | 0 | |
| Thereafter | 0 | |
| Total estimated amortization expense | $ | 44,546 | |
As of December 31, 2020, the Company performed an analysis of the impact of recent events, including business and market disruption caused by COVID-19, on the fair values of its intangible assets, and determined that an impairment does not exist. However, there can be no assurances that intangible assets will not be impaired in future periods and the Company will continue to monitor the operating results, cash flow forecasts and challenges from declines in current market conditions, as well as impacts of COVID-19 for these intangible assets.
8. Restructuring Charges
The Company has carried out certain restructuring activities to further drive operational efficiencies and to align its resources with its business strategies. Restructuring charges include facility exit costs related to future contractual lease payments recorded in general and administrative expense on the consolidated statements of operations and severance and benefit costs related to headcount reduction recorded on the consolidated statement of operations based on the impacted employees function. During the years ended December 31, 2020, 2019, and 2018, the Company recognized restructuring expense of $1.5 million, $4.3 million, and $4.4 million, respectively.
9. Debt Obligations
2017 Convertible Senior Notes
In November 2017, the Company issued $200.0 million aggregate principal amount of 1.75% convertible senior notes due 2022 in a private placement to qualified institutional buyers pursuant to Rule 144A under the Securities Act of 1933, as amended, (the “notes”). The notes are unsecured obligations of the Company and bear interest at a fixed rate of 1.75% per annum, payable semi-annually in arrears on June 1 and December 1 of each year, commencing on June 1, 2018. The total net proceeds from the debt offering, after deducting transaction costs, were approximately $193.8 million.
The conversion rate for the notes will initially be 57.6037 shares of the Company’s common stock per $1,000 principal amount of notes, which is equivalent to an initial conversion price of approximately $17.36 per share of common stock, subject to adjustment upon the occurrence of specified events.
Holders of the notes may convert their notes at their option at any time prior to the close of business on the business day immediately preceding September 1, 2022, only under the following circumstances: (1) during any calendar quarter commencing after the calendar quarter ending on March 31, 2018 (and only during such calendar quarter), if the last reported sale price of the Company’s common stock for at least 20 trading days (whether or not consecutive) during a period of 30 consecutive trading days ending on, and including, the last trading day of the immediately preceding calendar quarter is greater than or equal to 130% of the conversion price on each applicable trading day; (2) during the 5-business day period after any 5 consecutive trading day period (the “measurement period”) in which the trading price per $1,000 principal amount of notes for each trading day of the measurement period was less than 98% of the product of the last reported sale price of the Company’s common stock and the conversion rate for the notes on each such trading day; (3) if the Company calls any or all of the notes for redemption, at any time prior to the close of business on the scheduled trading day immediately preceding the redemption date; or (4) upon the occurrence of specified corporate events. On or after September 1, 2022, holders may convert all or any portion of their notes at any time prior to the close of business on the scheduled trading day immediately preceding the maturity date regardless of the foregoing conditions. Upon conversion, the Company will pay or deliver, as the case may be, cash, shares of its common stock or a combination of cash and shares of its common stock, at its election. The Company intends to settle the principal amount of the notes with cash.
The Company may not redeem the notes prior to December 5, 2020. It may redeem for cash all or any portion of the notes, at its option, on or after December 5, 2020 if the last reported sale price of its common stock has been at least 130% of the conversion price then in effect for at least 20 trading days (whether or not consecutive) during any 30 consecutive trading day period (including the last trading day of such period) ending not more than 3 trading days preceding the date on which it provides notice of redemption at a redemption price equal to 100% of the principal amount of the notes to be redeemed, plus accrued and unpaid interest to, but excluding, the redemption date. NaN sinking fund is provided for the notes.
If the Company undergoes a fundamental change prior to the maturity date, holders may require the Company to repurchase for cash all or any portion of their notes at a fundamental change repurchase price equal to 100% of the principal amount of the notes to be repurchased, plus accrued and unpaid interest to, but excluding, the fundamental change repurchase date.
In accounting for the issuance of the notes, the Company separated the notes into liability and equity components. The carrying amount of the liability component of $149.3 million was calculated by measuring the fair value of a similar debt instrument that does not have an associated convertible feature. The carrying amount of the equity component of $50.7 million, representing the conversion option, was determined by deducting the fair value of the liability component from the par value of the notes. The excess of the principal amount of the liability component over its carrying amount (“debt discount”) is amortized to interest expense over the term of the notes at an effective interest rate of 5.8%.
The Company allocated the total debt issuance costs incurred of $6.2 million to the liability and equity components of the notes in proportion to the respective values. Issuance costs attributable to the liability component of $4.6 million are being amortized to interest expense using the effective interest method over the contractual terms of the notes. Issuance costs attributable to the equity component of $1.6 million were netted with the equity component in additional paid-in capital.
The net carrying amount of the liability component of the notes recorded in convertible senior notes, net on the consolidated balance sheets was as follows (in thousands):
| | | | | | | | | | | |
| | December 31, 2020 | | December 31, 2019 |
| Principal | $ | 200,000 | | | $ | 200,000 | |
| Unamortized debt discount | (21,046) | | | (31,132) | |
| Unamortized debt issuance costs | (1,786) | | | (2,711) | |
| Net carrying amount of the liability component | $ | 177,168 | | | $ | 166,157 | |
The net carrying amount of the equity component of the notes recorded in additional paid-in capital on the consolidated balance sheets was $49.1 million, net of debt issuance costs of $1.6 million as of December 31, 2020 and 2019.
The following table sets forth the interest expense related to the notes recognized in interest expense on the consolidated statements of operations (in thousands):
| | | | | | | | | | | | | | | | | |
| | Year Ended December 31, |
| | 2020 | | 2019 | | 2018 |
| Contractual interest expense | $ | 3,500 | | | $ | 3,500 | | | $ | 3,500 | |
| Amortization of debt discount | 10,086 | | | 9,518 | | | 8,981 | |
| Amortization of debt issuance costs | 925 | | | 921 | | | 917 | |
| Total interest expense related to the Notes | $ | 14,511 | | | $ | 13,939 | | | $ | 13,398 | |
10. Stock-based Compensation
2013 Equity Incentive Plan
In October 2013, the Company adopted the 2013 Equity Incentive Plan (the “2013 Plan”), which became effective in March 2014 and serves as the successor to the Company’s 2006 Stock Plan (the “2006 Plan”). Pursuant to the 2013 Plan, 4,000,000 shares of common stock were initially reserved for grant, plus (1) any shares that were reserved and available for issuance under the 2006 Plan at the time the 2013 Plan became effective, and (2) any shares that become available upon forfeiture or repurchase by the Company under the 2006 Plan and (3) any shares added to the 2013 Plan pursuant to the next paragraph.
Under the 2013 Plan, the Company may grant stock options, stock appreciation rights, restricted stock and restricted stock units ("RSUs"), performance-based stock and units to employees, directors and consultants. The shares available will be increased at the beginning of each year by lesser of (i) 4% of outstanding common stock on the last day of the immediately preceding year, or (ii) such number determined by the Board of Directors and subject to additional restrictions relating to the maximum number of shares issuable pursuant to incentive stock options. Under the 2013 Plan, both the ISOs and NSOs are granted at a price per share not less than 100% of the fair market value on the effective date of the grant. The Board of Directors determines the vesting period for each option award on the grant date, and the options generally expire 10 years from the grant date or such shorter term as may be determined by the Board of Directors.
Stock Options
The fair value of each option was estimated using Black-Scholes model on the date of grant for the periods presented using the following assumptions:
| | | | | | | | | | | | | | | | | |
| | Year Ended December 31, |
| | 2020 | | 2019 | | 2018 |
| Expected life (in years) | 6.02 | | 6.02 - 6.08 | | 6.02 |
| Risk-free interest rate | 0.96% | | 1.42% - 2.66% | | 2.66 | % |
| Volatility | 50 | % | | 50 | % | | 50 | % |
| Dividend yield | 0 | | | 0 | | | 0 | |
The weighted-average grant-date fair value of options granted was $4.26, $4.33 and $6.59 per share during the years ended December 31, 2020, 2019, and 2018, respectively.
Restricted Stock Units and Performance-Based Restricted Stock Units
The fair value of RSUs equals the market value of the Company’s common stock on the date of grant. The RSUs are excluded from issued and outstanding shares until they are vested.
A summary of the Company’s stock option and RSUs award activity under the Plans is as follows:
| | | | | | | | | | | | | | | | | | | | | | | | | | | | | | | | | | | | | | | | | |
| | | | Options Outstanding | | RSUs Outstanding |
| | Shares
Available
for Grant | | Number of Shares | | Weighted
Average
Exercise
Price | | Weighted
Average
Remaining
Contractual
Term (Years) | | Aggregate
Intrinsic
Value
(in thousands) | | Number of
Shares | | Weighted
Average
Grant
Date Fair
Value |
| Balance as of December 31, 2017 | 4,425,155 | | | 7,412,228 | | | $ | 10.36 | | | 6.09 | | $ | 25,415 | | | 5,194,292 | | | 12.26 | |
| Increase in shares authorized | 3,727,989 | | | — | | | — | | | — | | | — | | | — | | | — | |
| Options granted | (801,000) | | | 801,000 | | | $ | 13.10 | | | — | | | — | | | — | | | — | |
| Options exercised | — | | | (1,329,361) | | | $ | 3.03 | | | — | | | $ | 13,821 | | | — | | | — | |
| Options canceled or expired | 261,861 | | | (261,861) | | | $ | 11.38 | | | — | | | — | | | — | | | — | |
| RSUs and PSUs granted | (2,838,879) | | | — | | | — | | | — | | | — | | | 2,838,879 | | | 13.12 | |
| RSUs released | — | | | — | | | — | | | — | | | — | | | (2,287,045) | | | 12.97 | |
| RSUs canceled or expired | 841,965 | | | — | | | — | | | — | | | — | | | (841,965) | | | 11.99 | |
| RSUs vested and withheld for taxes | 880,262 | | | — | | | — | | | — | | | — | | | — | | | — |
| Balance as of December 31, 2018 | 6,497,353 | | | 6,622,006 | | | $ | 12.12 | | | 5.96 | | $ | 9,987 | | | 4,904,161 | | | 12.48 | |
| Increase in shares authorized | 3,799,808 | | | — | | | — | | | — | | | — | | | — | | | — | |
| Options granted | (2,799,855) | | | 2,799,855 | | | $ | 8.74 | | | — | | | — | | | — | | | — | |
| Options exercised | — | | | (433,762) | | | $ | 5.39 | | | — | | | $ | 2,406 | | | — | | | — | |
| Options canceled or expired | 387,658 | | | (387,658) | | | $ | 11.37 | | | — | | | — | | | — | | | — | |
| RSUs granted | (4,015,504) | | | — | | | — | | | — | | | — | | | 4,015,504 | | | 9.49 | |
| RSUs released | — | | | — | | | — | | | — | | | — | | | (2,735,184) | | | 11.79 | |
| RSUs canceled or expired | 1,161,806 | | | — | | | — | | | — | | | — | | | (1,161,806) | | | 11.67 | |
| RSUs vested and withheld for taxes | 1,004,914 | | | — | | | — | | | — | | | — | | | — | | | — | |
| Balance as of December 31, 2019 | 6,036,180 | | | 8,600,441 | | | $ | 11.40 | | | 5.16 | | $ | 8,811 | | | 5,022,675 | | | 10.66 | |
| Increase in shares authorized | 3,574,847 | | | — | | | — | | | — | | | — | | | — | | | — | |
| Options granted | (1,150,178) | | | 1,150,178 | | | $ | 8.95 | | | — | | | — | | | — | | | — | |
| Options exercised | — | | | (331,007) | | | $ | 8.20 | | | — | | | $ | 463 | | | — | | | — | |
| Options canceled or expired | 1,259,391 | | | (1,259,391) | | | $ | 11.22 | | | — | | | — | | | — | | | — | |
| RSUs granted | (3,340,532) | | | — | | | — | | | — | | | — | | | 3,340,532 | | | 8.33 | |
| RSUs released | — | | | — | | | — | | | — | | | — | | | (2,410,803) | | | 10.41 | |
| RSUs canceled or expired | 1,243,550 | | | — | | | — | | | — | | | — | | | (1,243,550) | | | 10.83 | |
| RSUs vested and withheld for taxes | 843,885 | | | — | | | — | | | — | | | — | | | — | | | — | |
| Balance as of December 31, 2020 | 8,467,143 | | | 8,160,221 | | | $ | 11.21 | | | 5.03 | | $ | 7,100 | | | 4,708,854 | | | 9.09 | |
| Vested and exercisable as of December 31, 2020 | | | 5,978,237 | | | $ | 12.13 | | | 3.68 | | $ | 4,913 | | | | | |
The aggregate intrinsic value disclosed in the table above is based on the difference between the exercise price of the options and the fair value of the Company’s common stock.
The aggregate total fair value of shares vested during the years ended December 31, 2020, 2019, and 2018 was $7.5 million, $6.3 million and $6.7 million, respectively.
Additional information for options outstanding and exercisable as of December 31, 2020 is as follows:
| | | | | | | | | | | | | | | | | | | | | | | | | | | | | | | | |
| | | Options Outstanding | | Options Exercisable |
| Exercise Prices | | Number of
Shares | | Weighted Average Remaining Contractual Term (Years) | | Weighted
Average
Exercise
Price | | Number of
Shares | | Weighted
Average
Exercise
Price |
| $3.68 - $7.34 | | 1,675,201 | | | 6.42 | | $ | 6.45 | | | 900,251 | | | $ | 5.68 | |
| $8.51 -$8.65 | | 1,658,497 | | | 3.08 | | 8.59 | | | 1,658,497 | | | 8.59 | |
| $8.66 - $9.96 | | 2,002,915 | | | 7.70 | | 9.22 | | | 722,248 | | | 9.50 | |
| $10.53 - $16.25 | | 2,023,608 | | | 3.68 | | 13.81 | | | 1,897,241 | | | 13.87 | |
| $ | 25.00 | | | 800,000 | | | 2.87 | | $ | 25.00 | | | 800,000 | | | $ | 25.00 | |
| | | 8,160,221 | | | | | | | 5,978,237 | | | |
Employee Stock Purchase Plan
The Company’s Board of Directors adopted the 2013 Employee Stock Purchase Plan (“ESPP”), which became effective in March 2014, pursuant to which 1,200,000 shares of common stock were reserved for future issuance. In addition, ESPP provides for annual increases in the number of shares available for issuance on the first day of each year equal to the least of (i) 0.5% of the outstanding shares of common stock on the last day of the immediately preceding year, (ii) 400,000 shares or (iii) such other amount as may be determined by the Board of Directors. Eligible employees can enroll and elect to contribute up to 15% of their base compensation through payroll withholdings in each offering period, subject to certain limitations. Each offering period is six months in duration. The purchase price of the stock is the lower of 85% of the fair market value on (a) the first day of the offering period or (b) the purchase date.
The fair value of the option feature is estimated using the Black-Scholes model for the period presented based on the following assumptions:
| | | | | | | | | | | | | | | | | |
| | Year Ended December 31, |
| | 2020 | | 2019 | | 2018 |
| Expected life (in years) | 0.5 | | 0.5 | | 0.5 |
| Risk-free interest rate | 0.12% - 1.59% | | 1.59% - 2.50% | | 1.42% - 2.50% |
| Volatility | 55% - 60% | | 35% - 55% | | 35% - 40% |
| Dividend yield | 0 | | | 0 | | | 0 | |
During the year ended December 31, 2020, a total of 1,924,414 shares of common stock were issued under the 2013 Employee Stock Purchase Plan (“ESPP”), since inception of the plan. As of December 31, 2020, a total of 1,675,586 shares are available for issuance under the ESPP.
Stock-based Compensation Expense
The following table sets forth the total stock-based compensation expense resulting from stock options, RSUs, and ESPP included in the Company’s consolidated statements of operations (in thousands):
| | | | | | | | | | | | | | | | | |
| | Year Ended December 31, |
| | 2020 | | 2019 | | 2018 |
| Cost of revenues | $ | 1,743 | | | $ | 2,193 | | | $ | 2,315 | |
| Sales and marketing | 5,311 | | | 6,812 | | | 6,596 | |
| Research and development | 3,831 | | | 4,804 | | | 6,137 | |
| General and administrative | 17,486 | | | 18,328 | | | 16,338 | |
| Total stock-based compensation expense | $ | 28,371 | | | $ | 32,137 | | | $ | 31,386 | |
During the years ended December 31, 2020, 2019, and 2018 the Company capitalized stock-based compensation cost of $0.4 million, $0.5 million, and $0.1 million, respectively, in projects in process as part of property and equipment, net on the accompanying consolidated balance sheets.
As of December 31, 2020, there was $47.9 million unrecognized stock-based compensation expense of which $9.3 million is related to stock options and ESPP and $38.6 million is related to RSUs. The total unrecognized stock-based compensation expense related to stock options and ESPP as of December 31, 2020 will be amortized over a weighted-average period of 2.57 years. The total unrecognized stock-based compensation expense related to RSUs as of December 31, 2020 will be amortized over a weighted-average period of 2.74 years.
11. Stockholders’ Equity
Amended and Restated Certificate of Incorporation
In March 2014, the Company filed an amended and restated certificate of incorporation, which became effective immediately following the completion of the Company’s IPO. Under the restated certificate of incorporation, the authorized capital stock consists of 250,000,000 shares of common stock and 10,000,000 shares of preferred stock.
Common Stock. The rights, preferences and privileges of the holders of common stock are subject to the rights of the holders of shares of any series of preferred stock which the Company may issue in the future. Subject to the foregoing, for as long as such stock is outstanding, the holders of common stock are entitled to receive ratably any dividends as may be declared by the Board of Directors out of funds legally available for dividends. Holders of common stock are entitled to 1 vote per share on any matter to be voted upon by stockholders. The amended and restated certificate of incorporation establishes a classified Board of Directors that is divided into 3 classes with staggered three years terms. Only the directors in 1 class will be subject to election at each annual meeting of stockholders, with the directors in other classes continuing for the remainder of their three year terms. Upon liquidation, dissolution or winding-up, the assets legally available for distribution to the Company’s stockholders would be distributable ratably among the holders of common stock and any participating preferred stock outstanding at that time, subject to prior satisfaction of all outstanding debt and liabilities and the preferential rights of and the payment of liquidation preferences, if any, on any outstanding shares of preferred stock.
Preferred Stock. The Board of Directors is authorized to issue undesignated preferred stock in one or more series without stockholder approval and to determine for each such series of preferred stock the voting powers, designations, preferences, and special rights, qualifications, limitations, or restrictions as permitted by law, in each case without further vote of action by the stockholders. The Board of Directors can also increase or decrease the number of shares of any series of preferred stock, but not below the number of shares of that series then outstanding, without any further vote or action by the stockholders. The Board of Directors may authorize the issuance of preferred stock with voting or conversion rights that could adversely affect the voting power or other rights of the holders of common stock.
Amendment. The amendment of the provisions in the restated certificate requires approval by holders of at least 66 2/3% of the Company’s outstanding capital stock entitled to vote generally in the election of directors.
Common Stock Repurchases
The Board of Directors has approved programs for the Company to repurchase shares of its common stock. In August 2019, the Company’s Board of Directors authorized a one-year share repurchase program (the “August 2019 Program”) for the Company to repurchase up to $50.0 million of its common stock from August 2019 through August 2020. During the year ended December 31, 2020, the Company did 0t repurchase any shares of its common stock, and the program expired in August 2020.
Additionally, in February 2021, the Company’s Board of Directors authorized the 2021 Program for the Company to repurchase up to $50.0 million of its common stock from February 2021 through February 2022. Stock repurchases may be made from time to time in open market transactions or privately negotiated transactions, and the Company may use a plan that is intended to meet the requirements of SEC Rule 10b5-1 to enable stock repurchases to occur during periods when the trading window would otherwise be closed. The Company may suspend, modify or terminate the 2021 Program at any time without prior notice.
12. Income Taxes
The components of the Company’s loss before provision for income taxes were as follows (in thousands):
| | | | | | | | | | | | | | | | | |
| | Year Ended December 31, |
| | 2020 | | 2019 | | 2018 |
| Domestic | $ | 44,237 | | | $ | 39,102 | | | $ | 26,813 | |
| Foreign | 20,425 | | | (2,705) | | | 1,023 | |
| Total | $ | 64,662 | | | $ | 36,397 | | | $ | 27,836 | |
The components of the provision for (benefit from) income taxes are as follows (in thousands):
| | | | | | | | | | | | | | | | | |
| | Year Ended December 31, |
| | 2020 | | 2019 | | 2018 |
| Current: | | | | | |
| Federal | $ | 133 | | | $ | (14) | | | $ | 0 | |
| State | 34 | | | 219 | | | 147 | |
| Foreign | 642 | | | 342 | | | 390 | |
| Total current income tax expense | 809 | | | 547 | | | 537 | |
| Deferred: | | | | | |
| Federal | 93 | | | 93 | | | 120 | |
| State | 10 | | | 39 | | | 102 | |
| Foreign | (193) | | | (19) | | | (277) | |
| Total deferred income tax expense (benefit) | (90) | | | 113 | | | (55) | |
| Total | $ | 719 | | | $ | 660 | | | $ | 482 | |
A reconciliation of the federal statutory income tax rate to the Company’s effective tax rate is as follows:
| | | | | | | | | | | | | | | | | |
| | Year Ended December 31, |
| | 2020 | | 2019 | | 2018 |
| Federal tax | (21.00) | % | | (21.00) | % | | (21.00) | % |
| State income tax, net of federal tax benefit | 0.07 | % | | 0.70 | % | | 0.91 | % |
| Tax credits | (0.78) | % | | (2.20) | % | | (4.55) | % |
| Stock-based compensation | 4.31 | % | | 2.42 | % | | 0.44 | % |
| Foreign income taxes at other than U.S. rates | (2.15) | % | | (0.92) | % | | (0.85) | % |
| Acquisition related costs | 0.02 | % | | 0.43 | % | | 1.10 | % |
| Contingent consideration related to acquisitions | 0 | % | | 2.35 | % | | 10.90 | % |
| 162(m) | 1.39 | % | | 3.73 | % | | 1.31 | % |
| GILTI Inclusion | 0 | % | | 1.05 | % | | 0 | % |
| Other | 0.44 | % | | 1.26 | % | | 1.69 | % |
| Tax Cuts and Jobs Act | 0 | % | | 0 | % | | 0 | % |
| Valuation allowance, net | 18.81 | % | | 13.96 | % | | 11.82 | % |
| Effective tax rate | 1.11 | % | | 1.78 | % | | 1.77 | % |
The Company recorded a provision for income taxes of $0.7 million, $0.7 million and $0.5 million for the years ended December 31, 2020, 2019 and 2018, respectively. The provision for income taxes for the year ended December 31, 2020, 2019 and 2018 was primarily attributable to the impact of the indefinite lived deferred tax liabilities related to tax deductible goodwill, change in the geographical mix of earnings in foreign jurisdictions and state taxes.
As a result of meeting certain employment and capital investment actions under Section 10AA of the Indian Income Tax Act, the Company’s Indian subsidiary is wholly exempt from income tax for tax years beginning April 1, 2014 through March 31, 2019 and partially exempt from income tax for tax years beginning April 1, 2019 through March 31, 2024.
The components of the Company’s deferred tax assets and liabilities are as follows (in thousands):
| | | | | | | | | | | |
| | Year Ended December 31, |
| | 2020 | | 2019 |
| Deferred tax assets: | | | |
| Credits and net operating loss carryforward | $ | 116,119 | | | $ | 107,163 | |
| Accrued compensation | 280 | | | 174 | |
| Deferred revenues | 271 | | | 199 | |
| Stock-based compensation | 5,638 | | | 6,819 | |
| Property and equipment | 746 | | | 79 | |
| Purchased intangible assets | 4,411 | | | 38 | |
| Operating lease | 4,536 | | | 1,969 | |
| Other deferred tax assets | 1,682 | | | 1,056 | |
| Total deferred tax assets | 133,683 | | | 117,497 | |
| Valuation allowance | (121,927) | | | (107,161) | |
| Deferred tax liabilities: | | | |
| Basis difference on purchased intangible assets | 2,969 | | | 3,308 | |
| Operating lease | 3,683 | | | 1,297 | |
| Other deferred tax liabilities | 5,157 | | | 7,668 | |
| Tax deductible goodwill | 1,800 | | | 0 | |
| Total deferred tax liabilities | 13,609 | | | 12,273 | |
| Net deferred tax liabilities | $ | (1,853) | | | $ | (1,937) | |
Other deferred tax assets and liabilities are primarily comprised of the tax effects of charitable contributions, allowance for credit losses, and other miscellaneous accruals. As of December 31, 2020 and 2019, the Company had gross deferred tax assets of $133.7 million and $117.5 million, respectively. The Company also had deferred tax liabilities of $13.6 million and $12.3 million as of December 31, 2020 and 2019, respectively. Realization of the deferred tax assets is dependent upon the generation of future taxable income, if any, the amount and timing of which is uncertain. Based on the available objective evidence, and historical operating performance, management believes that it is more likely than not that all U.S. and certain foreign deferred tax assets are not realizable. Accordingly, the net deferred tax assets have been fully offset with a valuation allowance. The net valuation allowance increased by approximately $14.8 million and $11.9 million for the years ended December 31, 2020 and 2019, respectively.
As of December 31, 2020, the Company had federal net operating loss carryforwards of approximately $287.3 million which will begin to expire in the year 2021. The Company had state net and foreign operating loss carryforwards of approximately $277.1 million and $50.2 million, respectively. As of December 31, 2020, the Company has research credit carryforwards for federal income tax purposes of approximately $16.7 million which will begin to expire in the year 2032. The Company also had state net research credit carryforwards for income tax purposes of approximately $19.3 million which can be carried forward indefinitely. The Company also had MAT credit carry forwards for Indian income tax purposes of approximately $0.7 million which will begin to expire in the year 2030.
A reconciliation of the gross unrecognized tax benefit is as follows (in thousands):
| | | | | | | | | | | | | | | | | |
| | Year Ended December 31, |
| | 2020 | | 2019 | | 2018 |
| Unrecognized tax benefit - beginning balance | $ | 8,840 | | | $ | 8,217 | | | $ | 7,527 | |
| Decreases for tax positions taken in prior years | 0 | | | 0 | | | (242) | |
| Increases for tax positions taken in current year | 420 | | | 623 | | | 932 | |
| Unrecognized tax benefit - ending balance | $ | 9,260 | | | $ | 8,840 | | | $ | 8,217 | |
The unrecognized tax benefits, if recognized, would not impact the Company's effective tax rate as the recognition of these tax benefits would be offset by changes in the Company's valuation allowance. The Company does not believe there will be any material changes in its unrecognized tax benefits over the next twelve months.
As of December 31, 2020 and 2019, the Company had 0 accrued interest or penalties related to uncertain tax positions. Due to the Company’s historical loss position, all tax years from inception through December 31, 2020 remain open due to unutilized net operating losses.
The Company files income tax returns in the United States and various states and foreign jurisdictions and is subject to examination by various taxing authorities including major jurisdiction like the United States. As such, all its net operating loss and research credit carryforwards that may be used in future years are subject to adjustment, if and when utilized.
Utilization of the net operating loss carryforwards and credits may be subject to a substantial annual limitation due to the ownership change limitations provided by the Internal Revenue Code of 1986, as amended, and similar state provisions. The annual limitation may result in the expiration of net operating losses and credits before their utilization.
13. Net Income (Loss) per Share
Net Loss per Share Attributable to Common Stockholders
The computation of the Company’s basic and diluted net loss per share is as follows (in thousands, except per share data):
| | | | | | | | | | | | | | | | | |
| | Year Ended December 31, |
| | 2020 | | 2019 | | 2018 |
| Net loss | $ | (65,381) | | | $ | (37,057) | | | $ | (28,318) | |
| | | | | |
Weighted-average number of shares used to
compute net loss per share, basic and diluted | 90,412 | | | 91,163 | | | 93,676 | |
| | | | | |
| Net loss per share, basic and diluted | $ | (0.72) | | | $ | (0.41) | | | $ | (0.30) | |
Basic and diluted net loss per share is the same for each period presented, as the inclusion of all potential common shares outstanding would have been anti-dilutive.
The outstanding common equivalent shares excluded from the computation of the diluted net loss per share for the periods presented because including them would have been antidilutive are as follows (in thousands):
| | | | | | | | | | | | | | | | | |
| | Year Ended December 31, |
| | 2020 | | 2019 | | 2018 |
| Stock options and ESPP | 8,229 | | | 8,642 | | | 6,664 | |
| Restricted stock units | 4,709 | | | 5,023 | | | 4,904 | |
| Shares related to convertible senior notes | 11,521 | | | 11,521 | | | 11,521 | |
| | 24,459 | | | 25,186 | | | 23,089 | |
14. Leases
The Company has entered into operating leases primarily for office facilities. These leases have terms which typically range from 1 year to 5 years, and often include options to renew. These renewal terms can extend the lease term up to 6 years, and are included in the lease term when it is reasonably certain that the Company will exercise the option. Effective January 1, 2019, these operating leases are included as right-of-use assets in other assets on the consolidated balance sheets, as a result of the adoption of the new leasing standard as discussed under Note 2 to the consolidated financial statements, and represent the Company’s right to use the underlying asset for the lease term. The present value of the Company’s obligation to make lease payments are included in other current liabilities and other non-current liabilities on the consolidated balance sheets.
Based on the present value of the lease payments for the remaining lease term of the Company's existing leases, the Company recognized 1) right-of-use assets of $8.5 million, adjusted for deferred rent and lease incentives as of the adoption date, and 2) lease liabilities for operating leases of $11.5 million on January 1, 2019. Operating lease right-of-use assets and liabilities commencing after January 1, 2019 are recognized at commencement date based on the present value of lease payments over the lease term.
The Company has entered into short-term leases primarily for office facilities with an initial term of twelve months or less, and a professional sports team suite with a 20-year term, which it uses for sales and marketing purposes. The effective lease term for the professional sports team suite is based on the cumulative days available for use throughout the 20-year contractual term, which is less than twelve months and therefore is classified as a short-term lease. As of December 31, 2020, the Company’s lease commitment of $5.4 million, relating to the professional sports team suite, expires in 2034, and does not reflect short-term lease costs. These leases are not recorded on the Company's consolidated balance sheet due to the accounting policy election as discussed under Note 2 to the consolidated financial statements.
All operating lease expense is recognized on a straight-line basis over the lease term. During the year ended December 31, 2020, the Company recognized $5.3 million in total lease costs, which is comprised of $4.4 million in operating lease costs for right-of-use assets and $0.9 million in short-term lease costs related to short-term operating leases.
Because the rate implicit in each lease is not readily determinable, the Company uses its incremental borrowing rate to determine the present value of the lease payments. The Company has certain contracts for office facilities which may contain lease and non-lease components which it has elected to be treated as a single lease component due to the accounting policy election as discussed under Note 2 to the consolidated financial statements.
Supplemental cash flow information related to operating leases was as follows (in thousands):
| | | | | | | | |
| | Year Ended December 31, |
| | 2020 | 2019 |
| Cash paid for operating lease liabilities | $ | 3,940 | | $ | 5,581 | |
| Right-of-use assets obtained in exchange for lease obligations | 12,297 | | 14,287 | |
Supplemental balance sheet information related to operating leases was as follows (in thousands, except lease term and discount rate):
| | | | | | | | |
| | December 31, 2020 | December 31, 2019 |
| Operating right-of-use assets reported as: | | |
| Operating lease right-of-use assets | $ | 16,222 | | $ | 7,211 | |
| | | |
| Operating lease liabilities reported as: | | |
| Other current liabilities | $ | 3,650 | | $ | 3,168 | |
| Other non-current liabilities | 15,956 | | 6,692 | |
| Total operating lease liabilities | $ | 19,606 | | $ | 9,860 | |
| | | |
| Weighted average remaining lease term (in years) | 7.2 | 3.9 |
| Weighted average discount rate | 5.8 | % | 7.9 | % |
Maturities of operating lease liabilities were as follows (in thousands):
| | | | | |
| | Operating Leases |
| 2021 | $ | 4,636 | |
| 2022 | 3,555 | |
| 2023 | 3,459 | |
| 2024 | 2,845 | |
| 2025 | 2,241 | |
| 2026 and thereafter | 7,967 | |
| Total lease payments | $ | 24,703 | |
| | |
| Less: Imputed Interest | (5,097) | |
| Total | $ | 19,606 | |
15. Commitments and Contingencies
Purchase Obligations
The Company has unconditional purchase commitments, primarily related to distribution fees, software license fees and marketing services, of $37.8 million as of December 31, 2020.
Some of our agreements with retailers include certain prepaid or guaranteed distribution fees which, in some cases, may apply to multiple annual periods. If the adoption and usage of our platforms do not meet projections or minimums, these prepaid or guaranteed distribution fees may not be recoverable and any shortfall may be payable by us at the end of the applicable period. We considered various factors in our assessment including our historical experience with the transaction volumes through the retailer and comparative retailers, ongoing communications with the retailer to increase its marketing efforts to promote the digital platform, as well as the projected revenues, and associated revenue share payments. For example, in 2020, implementation with a retailer of one of the Company’s solutions resulted in slower than expected adoption due to a variety of factors, including the spread of COVID-19 and a dispute related to the retailer's failure to perform certain obligations under the agreement. In light of these factors, the Company was not able to meet the contractual minimum under such arrangement at the end of the applicable period, which was originally scheduled to end in October 2020. In order to resolve a disagreement regarding the parties' respective obligations under the agreement with respect to such applicable period, the Company
recognized a loss of $8.8 million to settle such matter. This loss is included in cost of revenues on our consolidated statements of operations.
Indemnification
In the normal course of business, to facilitate transactions related to the Company’s operations, the Company indemnifies certain parties, including CPGs, advertising agencies and other third parties. The Company has agreed
to hold certain parties harmless against losses arising from claims of intellectual property infringement or other liabilities relating to or arising from our products, services or other contractual infringement. The term of these indemnity provisions generally survive termination or expiration of the applicable agreement. To date, the Company has not recorded any liabilities related to these agreements.
In accordance with our bylaws and/or pursuant to indemnification agreements entered into with directors, officers and certain employees, we have indemnification obligations to our directors, officers and employees for claims brought against these persons arising out of certain events or occurrences while they are serving at our request in such a capacity. We maintain a director and officer liability insurance coverage to reduce our exposure to such obligations, and payments made under these agreements. To date, there have been no indemnification claims by these directors, officers and employees.
We maintain various insurance coverages, subject to policy limits, that enable us to recover a portion of any amounts paid by us in connection with our obligation to indemnify our customers and vendors. However, because our maximum liability associated with such indemnification obligations generally is not stated explicitly in the related agreements, and further because many states prohibit limitations of liability for such indemnified claims, the maximum potential amount of future payments we could be required to make under these indemnification provisions could significantly exceed insurance policy limits.
Litigation
In the ordinary course of business, the Company may be involved in lawsuits, claims, investigations, and proceedings consisting of intellectual property, commercial, employment, and other matters. The Company records a provision for these claims when it is both probable that a liability has been incurred and the amount of the loss, or a range of the potential loss, can be reasonably estimated. These provisions are reviewed regularly and adjusted to reflect the impacts of negotiations, settlements, rulings, advice of legal counsel, and other information or events pertaining to a particular case. In the event that one or more of these matters were to result in a claim against the Company, an adverse outcome, including a judgment or settlement, may cause a material adverse effect on the Company’s future business, operating results, or financial condition.
The Company believes that liabilities associated with any claims are remote, therefore the Company has not recorded any accrual for claims as of December 31, 2020 and 2019. The Company expenses legal fees in the period in which they are incurred.
16. Employee Benefit Plan
The Company maintains a defined-contribution plan in United States that is intended to qualify under Section 401(k) of the Internal Revenue Code. The 401(k) plan provides retirement benefits for eligible employees. Eligible employees may elect to contribute to the 401(k) plan. The Company provides a match of up to the lesser of 3% of each employee’s annual salary or $6,000, which vests immediately for employees with tenure of over a year of continuous employment. The Company’s matching contribution expense was $2.2 million, $1.7 million and $1.9 million for the years ended December 31, 2020, 2019 and 2018, respectively.
17. Concentrations
As of December 31, 2020 and 2019, there was 0 customer with an accounts receivable balance greater than 10% of total accounts receivable.
For the year ended December 31, 2020, there was 0 customer that accounted for revenues greater than 10% of revenues. For the year ended December 31, 2019, there was 1 customer that accounted for revenues greater than 10% of total revenues. For the year ended December 31, 2018, there was 0 customer that accounted for revenues greater than 10% of total revenues.
18. Information About Geographic Areas
Revenues generated outside of the United States were insignificant for all periods presented. Additionally, as the Company’s assets are primarily located in the United States, information regarding geographical location is not presented, as such amounts are immaterial to these consolidated financial statements taken as a whole.
19. Selected Quarterly Financial Data (Unaudited)
The following tables set forth our quarterly unaudited consolidated statements of operations for each of the eight quarters in the years ended December 31, 2020 and 2019 (in thousands, except per share data):
| | | | | | | | | | | | | | | | | | | | | | | | | | | | | | | | | | | | | | | | | | | | | | | |
| | Year Ended December 31, 2020 | | Year Ended December 31, 2019 |
| | Q4 | | Q3 | | Q2 | | Q1 | | Q4 | | Q3 | | Q2 | | Q1 |
| Revenues | $ | 142,529 | | | $ | 121,116 | | | $ | 83,455 | | | $ | 98,787 | | | $ | 118,532 | | | $ | 114,830 | | | $ | 104,691 | | | $ | 98,107 | |
| Cost of revenues | 92,469 | | | 73,603 | | | 50,731 | | | 61,111 | | | 72,219 | | | 70,458 | | | 64,106 | | | 56,823 | |
| Gross margin | 50,060 | | | 47,513 | | | 32,724 | | | 37,676 | | | 46,313 | | | 44,372 | | | 40,585 | | | 41,284 | |
| Operating expenses: | | | | | | | | | | | | | | | |
| Sales and marketing | 31,124 | | | 24,555 | | | 23,814 | | | 25,034 | | | 27,541 | | | 24,310 | | | 23,870 | | | 25,523 | |
| Research and development | 11,358 | | | 9,744 | | | 8,621 | | | 10,593 | | | 10,771 | | | 9,236 | | | 8,699 | | | 10,370 | |
| General and administrative | 14,720 | | | 12,099 | | | 12,268 | | | 15,090 | | | 14,227 | | | 17,643 | | | 12,835 | | | 13,623 | |
Change in fair value contingent
consideration, net | 14,446 | | | 1,562 | | | 3,766 | | | 460 | | | 519 | | | 999 | | | (3,009) | | | 3,062 | |
| Total operating expenses | 71,648 | | | 47,960 | | | 48,469 | | | 51,177 | | | 53,058 | | | 52,188 | | | 42,395 | | | 52,578 | |
| Loss from operations | (21,588) | | | (447) | | | (15,745) | | | (13,501) | | | (6,745) | | | (7,816) | | | (1,810) | | | (11,294) | |
| Interest expense | (3,691) | | | (3,646) | | | (3,610) | | | (3,574) | | | (3,539) | | | (3,507) | | | (3,470) | | | (3,439) | |
| Other income (expense), net | 432 | | | (59) | | | 187 | | | 580 | | | 1,009 | | | 1,175 | | | 1,508 | | | 1,531 | |
| Loss before income taxes | (24,847) | | | (4,152) | | | (19,168) | | | (16,495) | | | (9,275) | | | (10,148) | | | (3,772) | | | (13,202) | |
Provision for (benefit from)
income taxes | 458 | | | 66 | | | (35) | | | 230 | | | 285 | | | 215 | | | 134 | | | 26 | |
| Net loss | $ | (25,305) | | | $ | (4,218) | | | $ | (19,133) | | | $ | (16,725) | | | $ | (9,560) | | | $ | (10,363) | | | $ | (3,906) | | | $ | (13,228) | |
| | | | | | | | | | | | | | | |
| Net loss per share, basic and diluted | $ | (0.28) | | | $ | (0.05) | | | $ | (0.21) | | | $ | (0.19) | | | $ | (0.11) | | | $ | (0.12) | | | $ | (0.04) | | | $ | (0.14) | |
| | | | | | | | | | | | | | | |
Weighted-average number of
common shares used in computing
net loss per share, basic and diluted | 91,300 | | | 90,585 | | | 90,112 | | | 89,638 | | | 89,123 | | | 88,789 | | | 92,558 | | | 94,263 | |
20. Subsequent Events
In February 2021, the Company’s Board of Directors authorized the 2021 Program for the Company to repurchase up to $50.0 million of its common stock from February 2021 through February 2022. Stock repurchases may be made from time to time in open market transactions or privately negotiated transactions, and the Company may use a plan that is intended to meet the requirements of SEC Rule 10b5-1 to enable stock repurchases to occur during periods when the trading window would otherwise be closed. The Company may suspend, modify or terminate the 2021 Program at any time without prior notice.
In February 2021, the Company entered into an Office Lease (“Lease”) with approximately 25,610 rentable square feet, for office facilities located in Salt Lake City, Utah. The lease term is approximately eight years with total lease payments of $6.7 million over the lease term.
Item 9. Changes in and Disagreements with Accountants on Accounting and Financial Disclosure.
None.
Item 9A. Controls and Procedures.
Evaluation of Disclosure Controls and Procedures
The phrase “disclosure controls and procedures” refers to controls and procedures designed to ensure that information required to be disclosed in our reports filed or submitted under the Exchange Act, such as this Annual Report on Form 10-K, is recorded, processed, summarized and reported within the time periods specified in the rules and forms of the U.S. Securities and Exchange Commission (SEC). Disclosure controls and procedures are also designed to ensure that such information is accumulated and communicated to our management, including our
chief executive officer (CEO) and chief financial officer (CFO), as appropriate to allow timely decisions regarding required disclosure.
Our management, under the supervision and with the participation of our CEO and CFO, evaluated the effectiveness of the design and operation of our disclosure controls and procedures (as defined in Rules 13a- 15(e) and 15d- 15(e) under the Exchange Act, as of the end of the period covered by this Annual Report on Form 10-K. Based upon such evaluation, our CEO and CFO concluded that as of December 31, 2020, our disclosure controls and procedures were effective to provide reasonable assurance that information we are required to disclose in reports that we file or submit under the Exchange Act is recorded, processed, summarized, and reported within the time periods specified by the SEC, and that such information is accumulated and communicated to our management, including our CEO and CFO, as appropriate, to allow timely decisions regarding required disclosure.
Management’s Annual Report on Internal Controls Over Financial Reporting
Our management is responsible for establishing and maintaining adequate internal control over financial reporting (as defined in Rules 13a-15(f) and 15d-15(f) under the Exchange Act). Management conducted an assessment of the effectiveness of our internal control over financial reporting based on the criteria set forth in Internal Control—Integrated Framework issued by the Committee of Sponsoring Organizations of the Treadway Commission (2013 framework). Based on the assessment, management has concluded that its internal control over financial reporting was effective as of December 31, 2020 to provide reasonable assurance regarding the reliability of financial reporting and the preparation of financial statements in accordance with GAAP.
Our independent registered public accounting firm, Ernst & Young LLP, independently assessed the effectiveness of our internal control over financial reporting, as stated in their attestation report, which is included in Part II, Item 8 of this Form 10-K.
Changes in Internal Control over Financial Reporting
There were no changes in our internal control over financial reporting identified in management’s evaluation pursuant to Rules 13a-15(d) or 15d-15(d) of the Exchange Act during the fourth quarter of 2020 that materially affected, or are reasonably likely to materially affect, our internal control over financial reporting.
Limitations on Effectiveness of Controls and Procedures
In designing and evaluating the disclosure controls and procedures, management recognizes that any controls and procedures, no matter how well designed and operated, can provide only reasonable assurance of achieving the desired control objectives. In addition, the design of disclosure controls and procedures must reflect the fact that there are resource constraints and that management is required to apply judgment in evaluating the benefits of possible controls and procedures relative to their costs.
Item 9B. Other Information.
None.
PART III
Item 10. Directors, Executive Officers, and Corporate Governance
The information called for by this item will be set forth in our Proxy Statement for the Annual Meeting of Stockholders to be filed with the SEC within 120 days after the end of the fiscal year ended December 31, 2020 and is incorporated herein by reference.
Our Board of Directors has adopted a code of business conduct and ethics that applies to all of our employees, officers and directors, including our Chief Executive Officer, Chief Financial Officer and other executive and senior financial officers. The full text of our code of business conduct and ethics is posted on the investor relations page on our website which is located at http://investor.quotient.com. We will post any amendments to our code of business conduct and ethics, or waivers of its requirements, on our website.
Item 11. Executive Compensation
The information called for by this item will be set forth in our Proxy Statement and is incorporated herein by reference.
Item 12. Security Ownership of Certain Beneficial Owners and Management and Related Stockholder Matters
Security Ownership of Certain Beneficial Owners and Management
The following table sets forth, as of March 31, 2023, except as otherwise indicated, certain information requiredregarding beneficial ownership of our common stock (a) by this itemeach person known by us to be the beneficial owner of more than five percent of the outstanding shares of common stock, (b) by each director and nominee for director, (c) by the NEOs (as defined in “Executive Compensation” above) and (d) by all of our current executive officers and directors as a group.
We have determined beneficial ownership in accordance with the rules of the SEC. Except as indicated by the footnotes below, we believe, based on the information furnished to us, that the persons and entities named in the table below have sole voting and investment power with respect to all shares of common stock that they beneficially own, subject to applicable community property laws.
Applicable percentage ownership is based on 98,159,584 shares of common stock outstanding at March 31, 2023. In computing the number of shares of common stock beneficially owned by a person and the percentage ownership of that person, we deemed to be outstanding all shares of common stock subject to options held by that person or entity that are currently exercisable or that will bebecome exercisable within 60 days of March 31, 2023. We did not deem these shares outstanding, however, for the purpose of computing the percentage ownership of any other person. Unless otherwise indicated, the address of each beneficial owner listed in the table below is c/o Quotient Technology Inc., 1260 East Stringham Avenue, Suite 600, Salt Lake City, Utah 84106.
| | | | | | | | |
| Name of Beneficial Owner | Number of
Shares
Beneficially
Owned | Percent Owned |
| Directors, Director Nominee(s) and Executive Officers: | | |
Matthew Krepsik(1) | 240,023 | | * |
Yuneeb Khan(2) | 69,409 | | * |
Connie Chen(3) | 694,788 | | * |
Steven Boal(4) | 6,756,987 | | 6.88 | % |
Scott Raskin(5) | 3,133,171 | | 3.19 | % |
Pamela Strayer(6) | 96,156 | | * |
John Kellerman(7) | 22,123 | | * |
Kimberly Anstett(8) | — | | * |
Andrew Jody Gessow(9) | 637,743 | | * |
Lorraine Hariton(10) | 32,149 | | * |
Alison Hawkins(11) | 10,224 | | * |
Eric Higgs(12) | 13,550 | | * |
Robert McDonald(13) | 95,847 | | * |
David Oppenheimer(14) | 83,762 | | * |
Joseph Reece(15) | 53,601 | | * |
Michael Wargotz(16) | — | | * |
All executive officers, directors and director nominee(s) as a group (12 persons)(17) | 1,931,096 | | 1.97 | % |
| 5% Stockholders: | | |
Engaged Capital(18) | 8,107,150 | | 8.26 | % |
Lynrock Lake LP(19) | 6,567,376 | | 6.69 | % |
Trigran Investments, Inc.(20) | 5,203,508 | | 5.30 | % |
•Represents beneficial ownership of less than 1% of the outstanding shares of our common stock.
(1)Consists of (i) 97,835 shares held of record by Mr. Krepsik, (ii) 4,688 shares issuable upon the vesting of RSUs within 60 days of March 31, 2023, and (iii) 137,500 shares that are issuable upon the exercise of stock options, which are currently exercisable or exercisable within 60 days of March 31, 2023.
(2)Consists of (i) 40,010 shares held of record by Mr. Khan, and (ii) 29,399 shares issuable upon the vesting of RSUs within 60 days of March 31, 2023.
(3)Consists of (i) 258,489 shares held of record by Ms. Chen, (ii) 4,687 shares issuable upon the vesting of RSUs within 60 days of March 31, 2023, and (iii) 431,612 shares that are issuable upon the exercise of stock options, which are currently exercisable or exercisable within 60 days of March 31, 2023.
(4)Based on information set forth in a Form 4 filed with the SEC on July 1, 2022, consists of (i) 2,867,286 shares held of record by Mr. Boal, (ii) 3,237 shares held by the EBB 2011 Trust dated September 23, 2011, of which Stuart Schiff is trustee, (iii) 3,237 shares held by the JMB 2011 Trust dated September 23, 2011, of which Stuart Schiff is trustee, and (iv) 3,237 shares held by the SEB 2011 Trust dated September 23, 2011, of which Stuart Schiff is trustee. This also includes 3,879,990 shares that are issuable upon the exercise of stock options, which are currently exercisable or exercisable within 60 days of March 31, 2023.
(5)Consists of (i) 1,213,128 shares held of record by Mr. Raskin, and (ii) 1,920,043 shares that are issuable upon the exercise of stock options, which are currently exercisable or exercisable within 60 days of March 31, 2023. Mr. Raskin stepped down as President effective March 31, 2023.
(6)Based on information set forth in a D&O questionnaire completed by Ms. Strayer for FY’2022 on January 12, 2023, consists of 96,156 shares held of record by Ms. Strayer as of January 6, 2023.
(7)Based on information set forth in a D&O questionnaire completed by Mr. Kellerman for FY’2022 on January 11, 2023, consists of 22,123 shares held of record by Mr. Kellerman as of January 6, 2023.
(8)Ms. Anstett holds no shares of record.
(9)Consists of (i) 85,643 shares held of record by Mr. Gessow, (ii) 400,108 shares held of record by the Gessow Family Trust for which Mr. Gessow serves as trustee and (iii) 151,992 shares that are issuable upon the exercise of stock options, which are currently exercisable or exercisable within 60 days of March 31, 2023.
(10)Consists of 32,149 shares held of record by Ms. Hariton.
(11)Consists of 10,224 shares held of record by Ms. Hawkins.
(12)Consists of 13,550 shares held of record by Mr. Higgs.
(13)Consists of 95,847 shares held of record by Mr. McDonald.
(14)Consists of (i) 62,211 shares held of record by Mr. Oppenheimer and (ii) 21,551 shares that are issuable upon the exercise of stock options, which are currently exercisable or exercisable within 60 days of March 31, 2023.
(15)Consists of (i) 35,000 shares held of record by Mr. Reece, and (ii) 18,601 shares issuable upon the vesting of RSUs within 60 days of March 31, 2023,
(16)Mr. Wargotz holds no shares of record.
(17)Consists of (i) 1,131,066 shares beneficially owned by our Proxy Statementcurrent directors, director nominee(s) and current executive officers, (ii) 57,375 shares issuable upon the vesting of RSUs within 60 days of March 31, 2023 for the benefit of such individuals and (ii) 742,655 shares that are issuable upon the exercise of stock options, which are currently exercisable or exercisable within 60 days of March 31, 2023.
(18)Based on information set forth in a Schedule 13D/A filed with the SEC on November 14, 2022 by Engaged Capital, LLC, Engaged Capital Holdings, LLC, Glenn W. Welling, Engaged Capital Flagship Master Fund, LP, Engaged Capital Flagship Fund, LP, and Engaged Capital Flagship Fund, Ltd. (collectively, “Engaged Capital”). Engaged Capital, LLC, Engaged Capital Holdings, LLC and Glenn W. Welling have sole voting power over 8,107,150 of the shares reported, shared voting power over zero shares reported, sole dispositive power over 8,107,150 of the shares reported, and shared dispositive power over zero shares reported. Engaged Capital Flagship Master Fund, LP, Engaged Capital Flagship Fund, LP, and Engaged Capital Flagship Fund, Ltd. have sole voting power over 7,505,432 of the shares reported, shared voting power over zero shares reported, sole dispositive power over 7,505,432 of the shares reported, and shared dispositive power over zero shares reported. The address of each of Engaged Capital Flagship Master Fund, LP and Engaged Capital Flagship Fund, Ltd. is incorporated hereinc/o Conyers Trust Company (Cayman) Limited, Cricket Square, Hutchins Drive, P.O. Box 2681, Grand Cayman KY1-1111, Cayman Islands. The address of each of Engaged Capital Flagship Fund, LP., Engaged Capital, LLC, Engaged Capital Holdings, LLC and Mr. Welling is 610 Newport Center Drive, Suite 250, Newport Beach, California 92660.
(19)Based on information set forth in a Schedule 13G/A filed with the SEC on February 14, 2023 by reference.Lynrock Lake LP, Lynrock Lake Partners LLC and Cynthia Paul (collectively, “Lynrock Lake”). Lynrock Lake has sole voting power over 6,567,376 of the shares reported, shared voting power over zero shares reported, sole dispositive power over 6,567,376 of the shares reported, and shared dispositive power over zero shares reported. The address of Lynrock Lake is 2 International Drive, Suite 130, Rye Brook, NY 10573.
(20)Based on information set forth in a Schedule 13G/A filed with the SEC on February 10, 2023 by Trigran Investments, Inc., Douglas Granat, Lawrence A. Oberman, Steven G. Simon, Bradley F. Simon and Steven R. Monieson (collectively, “Trigran Investments”). Trigran Investments has sole voting power over zero shares reported, shared voting power over 4,789,327 of the shares reported, sole dispositive power over zero shares reported, and shared dispositive power over 5,203,508 of the shares reported. The address of Trigran Investments is 630 Dundee Road, Suite 230, Northbrook, IL 60062.
Equity Compensation Plan Information
Securities Authorized for Issuance Under Equity Compensation Plans
The following table includes information as of December 31, 2022 for equity compensation plans:
| | | | | | | | | | | |
| Plan Category | Number of
securities to be issued
upon exercise of
outstanding options,
warrants and rights | Weighted-average
exercise price of
outstanding options,
warrants and rights | Number of securities
remaining available
For future
issuance under equity
compensation plans |
Equity compensation plans
approved by security holders | 12,279,032(1) | 11.32(2) | 11,766,364(3) |
Equity compensation plans
not approved by security holders | n/a | n/a | n/a |
| Total | 12,279,032 | | 11,766,364 |
(1)Excludes purchase rights accruing under our 2013 Employee Stock Purchase Plan.
(2)The weighted average exercise price relates solely to outstanding stock option shares since shares subject to RSUs have no exercise price.
(3)Includes 1,598,303 shares of common stock that remain available for purchase under the 2013 Employee Stock Purchase Plan and 10,168,061 shares of common stock that remain available for purchase under our 2013 Plan. Additionally, our 2013 Plan provides for automatic increases in the number of shares available for issuance under it on the first day of each year starting on January 1, 2015 and each subsequent anniversary through 2023, by an amount equal to the smaller of (a) 4% of the number of shares of our common stock issued and outstanding on the immediately preceding December 31, or (b) an amount determined by the Board. Our 2013 Employee Stock Purchase Plan provides for automatic increases in the number of shares available for issuance under it on the first day of each year starting on January 1, 2015 and each subsequent anniversary through 2023, equal to the smallest of (a) 400,000, (b) 0.5% of the number of shares of our common stock issued and outstanding on the immediately preceding December 31, or (c) an amount determined by the Board. The amounts in this table do not include the evergreen increase that was effective on January 1, 2022.
Item 13. Certain Relationships and Related Transactions, and Director Independence
Certain Relationships and Related Transactions
Other than the executive and non-employee director compensation arrangements, including the employment, termination of employment and change in control arrangements, discussed in the “Executive Compensation” section, the indemnification arrangements with our executive officers and non-employee directors, and the transactions described below in this section, we were not party to any transactions since January 1, 2022 in which:
•the amounts involved exceeded or will exceed $120,000; and
•any of our directors, executive officers or holders of more than 5% of our capital stock, or any member of the immediate family of, or person sharing the household with, the foregoing persons, had or will have a direct or indirect material interest.
San Francisco Office Lease
The information, if any, required by this item will be set forthCompany entered into a lease agreement with DW Cal 301 Howard, LLC ("DW Cal") on February 28, 2020, for approximately 15,607 square feet of office space in San Francisco, for a term of 10 years. The total minimum future rental payments for the lease is $16.3 million. DW Cal is a joint venture in which DivcoWest Real Estate Services, LLC is a minority member. Mr. Gessow, one of our Proxy Statementindependent directors, serves as a Senior Advisor at Divco and is incorporated hereina managing partner at DivCore Equity Partners which is affiliated with Divco. All terms of the lease were negotiated at arms-length. The transaction was presented to our Audit Committee and approved in accordance with our Policy and Procedures with Respect to Transactions with Related Persons; and was also approved by reference.our Board. Mr. Gessow was not involved in decisions regarding the lease or in the Board and Audit Committee's approval thereof.
Amended and Restated Investor Rights Agreement
Item 14. Principal Accounting FeesIn June 2011, we entered into an Eighth Amended and ServicesRestated Investor Rights Agreement with the holders of our preferred stock. Such agreement provides, among other things, for certain rights relating to the registration of their shares of common stock, including those issued upon conversion of their preferred stock, including the right to demand that we file a registration statement or request that their shares be covered by a registration statement that we are otherwise filing.
Cooperation Agreement with Engaged Capital, LLC
On May 16, 2022, the Company entered into the Cooperation Agreement with the Engaged Group. The Cooperation Agreement expired by its own terms on March 1, 2023.
Pursuant to the Cooperation Agreement, the Board appointed Matthew O’Grady to the Board to serve as a Class II director and Joseph Reece (together with Mr. O’Grady, the “New Directors”) to the Board to serve as a Class III director. The Board also, on May 24, 2022, appointed Mr. O’Grady to the Nominating and Corporate Governance Committee and Mr. Reece to the Compensation Committee. Mr. O’Grady was also appointed to serve as Lead Independent Director for the duration of the Cooperation Agreement. Effective as of the Company's 2022 annual meeting of stockholders, all Class III directors became Class II directors. Mr. O'Grady resigned as a director effective as of December 31, 2022.
The information requiredBoard also agreed to nominate for election at the 2022 annual meeting of stockholders Matthew Krepsik, Robert McDonald, and Matthew O’Grady. The Cooperation Agreement having expired as of March 1, 2023, there are no other arrangements or understandings between any of our directors and any other person pursuant to which any person was selected as a director.
Pursuant to the Cooperation Agreement, the Company agreed to seek stockholder approval of an amendment to our charter (i.e., certificate of incorporation), which amendment was approved at the 2022 annual meeting of stockholders. Further, under the terms of the Cooperation Agreement, Steven Boal agreed to retire as CEO no later
than the 2022 annual meeting and to not stand for reelection as a director at the 2022 annual meeting, each of which events occurred.
The Cooperation Agreement further provided, among other things, that:
• During the term of the Cooperation Agreement, the number of authorized directors on the Board will not exceed ten directors without the consent of the Engaged Group, with such consent not to be unreasonably withheld.
• During the term of the Cooperation Agreement and for so long as the Engaged Group continuously beneficially owned in the aggregate at least the lesser of (i) 2.5% of outstanding shares of the Company’s common stock and (ii) 2,373,037 shares of common stock, the Engaged Group was entitled to recommend a replacement independent director who is not an affiliate of the Engaged Group in the event any New Director ceases to be a director of the Company for any reason, subject to certain conditions and the approval of the Nominating and Corporate Governance Committee and the Board, such approval not to be unreasonably withheld. Subsequent to Mr. O'Grady's resignation as a director, the Engaged Group recommended a replacement director, Michael Wargotz. On February 22, 2023, the Board appointed Mr. Wargotz to the Board.
• During the term of the Cooperation Agreement, the Engaged Group was subject to customary standstill restrictions, including with respect to nominating persons for election to the Board, submitting any proposal for consideration at any stockholder meeting and soliciting any proxy, consent or other authority to vote from stockholders or conducting any other referendum (including any “withhold,” “vote no” or similar campaign), and acquiring beneficial ownership of, or economic exposure to, more than 9.9% of the Common Stock for so long as the Company’s Tax Benefits Preservation Plan and the rights established thereunder remained in force. The Company Tax Benefits Preservation Plan expired on January 3, 2023.
• During the term of the Cooperation Agreement, the Engaged Group agreed to vote all shares of common stock and voting securities beneficially owned, directly or indirectly, by this item willthe Engaged Group at all annual and special meetings as well as in any consent solicitation of the Company’s stockholders (i) in favor of the nominees for director recommended by the Board, (ii) in favor of the board declassification proposal at the 2022 annual meeting of stockholders, and (iii) in accordance with the Board’s recommendation with respect to any other matter (unless Institutional Shareholder Services Inc. issued a contrary recommendation). Pursuant to the Cooperation Agreement, the Engaged Group was permitted to vote on any proposals relating to an extraordinary transaction in its sole discretion.
• Each party agreed not to disparage the other party, subject to certain exceptions.
• During the term of the Cooperation Agreement, each party agreed not to institute a lawsuit against the other party, subject to certain exceptions including the seeking of remedies for a breach of the Cooperation Agreement. Additionally, during the term of the Cooperation Agreement and for an additional two years after its termination, each party agreed not to institute a lawsuit against the other party relating to or arising out of any event occurring on or prior to the date of the Cooperation Agreement.
• By its terms, the Cooperation Agreement was to terminate as of the earliest to occur of (i) 30 calendar days prior to the notice deadline under the Company’s Bylaws for the nomination of director candidates for election to the Board at the Company’s 2023 annual meeting of stockholders, (ii) 120 calendar days prior to the first anniversary of the Company’s 2022 annual meeting of stockholders and (iii) the consummation of an extraordinary transaction. Such termination date was March 1, 2023.
The foregoing summary of the Cooperation Agreement does not purport to be set forth in our Proxy Statementcomplete and is incorporated hereinsubject to, and qualified in its entirety, by reference.the full text of the Cooperation Agreement, which is attached as Exhibit 10.1 to the Current Report on Form 8-K filed by the Company on May 18, 2022.
Review, approval or ratification of transactions with related parties
Our Board recognizes that transactions between our Company and persons or entities that may be deemed related persons can present potential or actual conflicts of interest and create the appearance of impropriety. Accordingly, our Board has delegated authority for the review and approval of all related person transactions to the Audit Committee. We have adopted a written Policy and Procedures with Respect to Transactions with Related Persons to provide procedures for reviewing, approving and ratifying any transaction involving our Company or any of its subsidiaries in which a 5% or greater stockholder, director, executive officer or members of their immediate family have or will have a direct or indirect material interest. This policy is intended to supplement, and not to supersede, our Company’s other policies that may be applicable to or involve transactions with related persons.
The policy provides that the Audit Committee reviews transactions subject to the policy and determines whether or not to approve or ratify those transaction. In reviewing transactions subject to the policy, the Audit or the Chair of the Audit Committee, as applicable, considers among other factors it deems appropriate:
•the material terms of the transaction;
•the nature of the related party’s interest;
•the nature of the related party’s relationship with the Company;
•the role of Company employees in arranging the transaction;
•the impact on the independence of any director;
•the costs and benefits to the Company; and
•an assessment of whether the transaction is competitively bid, or otherwise on terms that are fair to the Company and comparable to those that could be obtained in an arms-length negotiation with an unrelated third party.
Director Independence
Our Board has undertaken a review of the independence of each director. Based on information provided by each director concerning his or her background, employment and affiliations, our Board has determined that each of Messrs. Gessow, Higgs, McDonald, Oppenheimer, Reece and Wargotz, along with each of Mses. Hariton, Hawkins, and Anstett, do not have a relationship that would interfere with the exercise of independent judgment in carrying out the responsibilities of a director and that each of these directors is “independent” as that term is defined under the applicable rules and regulations of the SEC and the listing standards of the NYSE. Our Board also determined that former directors Steve Horowitz and Matthew O'Grady were independent during the respective periods that each served on our Board.
In considering the independence of the directors, the Board considered the Company's 10-year lease agreement with DW Cal 301 Howard, LLC, a joint venture in which DivcoWest Real Estate Services, LLC is a minority member; and Mr. Gessow's role as Senior Advisor at Divco and as a managing partner at DivCore Equity Partners which is affiliated with Divco. The terms of the lease were negotiated at arms-length and were consistent with market comparisons. Mr. Gessow was not involved in negotiating the lease, making any decisions regarding the lease, or approving the lease. In addition, Divco's share of the total lease payment of $16.3 million was less than 1% of the consolidated gross revenues of each of the Company and Divco in 2020, when we entered into the lease. This level is significantly below the maximum amount permitted under the NYSE listing standards for director independence (i.e., 2% of consolidated gross revenues). Accordingly, the Board determined that Mr. Gessow is independent.
Item 14. Principal Accountant Fees and Services
During our Fiscal 2022, Ernst & Young served as our independent registered public accounting firm.
Fees Paid to the Independent Registered Public Accounting Firm
The following table presents fees billed or to be billed by Ernst & Young for professional services rendered with respect to the years ended December 31, 2022 and 2021. All of these services were preapproved by the Audit Committee.
| | | | | | | | |
| 2022 ($) | 2021($) |
Audit Fees(1) | 3,164,010 | 2,973,590 | |
| Audit-Related Fees | — | | — | |
Tax Fees(2) | — | | 7,336 | |
All Other Fees(3) | 1,850 | | 2,000 | |
| TOTAL | 3,165,860 | | 2,982,926 | |
(1)“Audit fees” consist of fees for professional services provided in connection with the audit of our annual consolidated financial statements, the review of our quarterly consolidated financial statements, and audit services that are normally provided by our independent registered public accounting firm in connection with regulatory filings. The audit fees also include fees for professional services incurred with rendering an opinion under Section 404 of the Sarbanes-Oxley Act of 2002.
(2)“Tax fees” include fees for professional services related to tax advice. Tax advice fees encompass permissible services mainly related to international tax planning.
(3)"All Other Fees" include subscription fee to Ernst & Young's accounting research tool.
Auditor Independence
Under its charter, the Audit Committee pre-approves all services rendered by our independent registered public accounting firm, Ernst & Young. The Audit Committee has determined that the rendering of non-audit services by Ernst & Young was compatible with maintaining their independence.
Pre-Approval Policies and Procedures.
Consistent with requirements of the SEC and the Public Company Accounting Oversight Board (the “PCAOB”) regarding auditor independence, our Audit Committee is responsible for the appointment, compensation and oversight of the work of our independent registered public accounting firm. In recognition of this responsibility, our Audit Committee (or a member of the Audit Committee delegated by the Audit Committee) pre-approves all audit and permissible non-audit services provided by the independent registered public accounting firm. These services may include audit services, audit-related services, tax services and other services.
PART IV
Item 15. Exhibits, Financial Statement Schedules.
Documents filed as part of this report are as follows:
1.Consolidated Financial Statements
Our consolidated financial statements are listed in the “Index To Consolidated Financial Statements” in Part II, Item 8 of this Annual Report onthe Form 10-K.
2.Financial Statement Schedules
Financial statement schedules have been omitted because they are not applicable or the required information has been provided in the consolidated financial statements or in the notes thereto of this Annual Report onthe Form 10-K.
3.Exhibits
The exhibits listed in the accompanying “Index to Exhibits” are filed or incorporated by reference as part of this report.
Exhibit Index
| | | | | | | | | | | | | | | | | | | | | | | | | | | | | | | | | | | | | | |
| | | | | Incorporated by Reference |
Exhibit
Number | | Exhibit Description | | Form | | File No. | | Exhibit | | Filing
Date | | Filed
Herewith |
| 3.1 | | | | 10-K | | 001-36331 | | 3.1 | | 3/11/2016 | | |
| 3.2 | | | | 8-K | | 001-36331 | | 3.2 | | 10/6/2015 | | |
| 4.1 | | | | S-1/A | | 333-193692 | | 4.1 | | 2/25/2014 | | |
| 4.2 | | | | S-1 | | 333-193692 | | 4.2 | | 1/31/2014 | | |
| 4.3 | | | | 8-K | | 001-36331 | | 4.1 | | 11/17/2017 | | |
| 4.4 | | | | 8-K | | 001-36331 | | 4.1 | | 11/17/2017 | | |
| 4.5 | | | | 10-K | | 001-36331 | | 4.5 | | 3/2/2020 | | |
| 10.1† | | | | S-1/A | | 333-193692 | | 10.1 | | 2/14/2014 | | |
| 10.2† | | | | S-1 | | 333-193692 | | 10.2 | | 1/31/2014 | | |
| 10.3† | | | | S-1 | | 333-193692 | | 10.3 | | 1/31/2014 | | |
| 10.4† | | | | S-1 | | 333-193692 | | 10.4 | | 1/31/2014 | | |
| 10.5† | | | | 10-Q | | 001-36331 | | 10.6 | | 11/8/2016 | | |
| 10.6† | | | | 10-Q | | 001-36331 | | 10.1 | | 11/3/2017 | | |
| 10.7† | | | | 10-Q | | 001-36331 | | 10.7 | | 11/8/2016 | | |
| 10.8† | | | | 10-Q | | 001-36331 | | 10.8 | | 11/8/2016 | | |
| 10.9† | | | | 10-Q | | 001-36331 | | 10.1 | | 11/9/2018 | | |
| 10.10† | | | | 10-Q | | 001-36331 | | 10.2 | | 11/3/2017 | | |
| 10.11† | | | | 10-Q | | 001-36331 | | 10.3 | | 11/3/2017 | | |
| 10.12† | | | | 10-Q | | 001-36331 | | 10.1 | | 5/5/2017 | | |
| 10.13† | | | | S-1 | | 333-193692 | | 10.9 | | 2/25/2014 | | |
| 10.14† | | | | S-1/A | | 333-193692 | | 10.6 | | 2/25/2014 | | |
| 10.15† | | | | 10-Q | | 001-36331 | | 10.1 | | 11/8/2019 | | |
| 10.16† | | | | 10-Q | | 001-36331 | | 10.2 | | 11/8/2016 | | |
| 10.17† | | | | 10-Q | | 001-36331 | | 10.2 | | 11/8/2019 | | |
| 10.18† | | | | 10-K | | 001-36331 | | 10.2 | | 3/2/2020 | | |
| 10.19† | | | | 10-K | | 001-36331 | | 10.8 | | 3/11/2016 | | |
| | | | | | | | | | | | | | | | | | | | | | | | | | | | | | | | | | | | | | |
| | | | | Incorporated by Reference |
Exhibit Number | | Exhibit Description | | Form | | File No. | | Exhibit | | Filing Date | | Filed Herewith |
| 3.1 | | | | 10-K | | 001-36331 | | 3.1 | | 3/11/2016 | | |
| 3.2 | | | | 8-A | | 001-36331 | | 3.1 | | 11/12/2021 | | |
| 3.3 | | | | 8-K | | 001-36331 | | 3.1 | | 6/30/2022 | | |
| 3.4 | | | | 8-K | | 001-36331 | | 3.1 | | 1/3/2023 | | |
| 3.5 | | | | 10-Q | | 001-36331 | | 3.4 | | 8/9/2022 | | |
| 4.1 | | | | S-1/A | | 333-193692 | | 4.1 | | 2/25/2014 | | |
| 4.2 | | | | S-1 | | 333-193692 | | 4.2 | | 1/31/2014 | | |
| 4.3 | | | | 8-A | | 001-36331 | | 4.1 | | 11/12/2021 | | |
| 4.4 | | | | 8-K | | 001-36331 | | 4.2 | | 4/29/2022 | | |
| 4.5 | | | | 10-K | | 001-36331 | | 4.5 | | 3/16/2023 | | |
| 10.1† | | | | S-1/A | | 333-193692 | | 10.1 | | 2/14/2014 | | |
| 10.2† | | | | S-1 | | 333-193692 | | 10.2 | | 1/31/2014 | | |
| 10.3† | | | | S-1 | | 333-193692 | | 10.3 | | 1/31/2014 | | |
| 10.4† | | | | S-1 | | 333-193692 | | 10.4 | | 1/31/2014 | | |
| 10.5† | | | | 10-Q | | 001-36331 | | 10.6 | | 11/8/2016 | | |
| 10.6† | | | | 10-Q | | 001-36331 | | 10.1 | | 11/3/2017 | | |
| 10.7† | | | | 10-Q | | 001-36331 | | 10.7 | | 11/8/2016 | | |
| 10.8† | | | | 10-Q | | 001-36331 | | 10.8 | | 11/8/2016 | | |
| 10.9† | | | | 10-Q | | 001-36331 | | 10.1 | | 11/9/2018 | | |
| 10.10† | | | | 10-Q | | 001-36331 | | 10.2 | | 11/3/2017 | | |
| 10.11† | | | | 10-Q | | 001-36331 | | 10.3 | | 11/3/2017 | | |
| 10.12† | | | | 10-Q | | 001-36331 | | 10.1 | | 5/5/2017 | | |
| 10.13† | | | | S-1 | | 333-193692 | | 10.9 | | 2/25/2014 | | |
| | | | | | | | | | | | | | | | | | | | | | | | | | | | | | | | | | | | | | |
| | | | | Incorporated by Reference |
Exhibit
Number | | Exhibit Description | | Form | | File No. | | Exhibit | | Filing
Date | | Filed
Herewith |
| 10.20† | | | | 10-Q | | 001-36331 | | 10.3 | | 11/8/2016 | | |
| 10.21† | | | | 10-Q | | 001-36331 | | 10.4 | | 11/8/2016 | | |
| 10.22† | | | | 10-Q | | 001-36331 | | 10.1 | | 8/9/2019 | | |
| 10.23† | | | | 10-Q | | 001-36331 | | 10.2 | | 8/9/2019 | | |
| 10.24† | | | | 10-K | | 001-36331 | | 10.21 | | 2/27/2019 | | |
| 10.25† | | | | 10-Q | | 001-36331 | | 10.3 | | 11/8/2019 | | |
| 10.26† | | | | 10-K | | 001-36331 | | 10.26 | | 3/2/2020 | | |
| 10.27† | | | | 10-Q | | 001-36331 | | 10.3 | | 8/9/2019 | | |
| 10.28 | | | | S-1 | | 333-193692 | | 10.14 | | 1/31/2014 | | |
| 10.29 | | | | S-1 | | 333-193692 | | 10.15 | | 1/31/2014 | | |
| 10.30 | | | | 10-K | | 001-36331 | | 10.15 | | 3/19/2015 | | |
| 10.31 | | | | 10-Q | | 001-36331 | | 10.1 | | 8/5/2020 | | |
| 10.32 | | | | S-1 | | 333-193692 | | 10.16 | | 1/31/2014 | | |
| 10.33 | | | | S-1 | | 333-193692 | | 10.17 | | 1/31/2014 | | |
| 10.34 | | | | 10-Q | | 333-193692 | | 10.1 | | 8/8/2016 | | |
| 10.35 | | | | 10-Q | | 001-36331 | | 10.1 | | 8/5/2020 | | |
| 10.36 | | | | 8-K | | 001-36331 | | 10.1 | | 2/10/2021 | | |
| 10.37 | | | | 10-Q | | 001-36331 | | 10.1 | | 8/4/2017 | | |
| | | | | | | | | | | | | | | | | | | | | | | | | | | | | | | | | | | | | | |
| 10.14† | | | | 10-Q | | 001-36331 | | 10.2 | | 11/8/2019 | | |
| 10.15† | | | | 10-K | | 001-36331 | | 10.18 | | 3/2/2020 | | |
| 10.16† | | | | 10-Q | | 001-36331 | | 10.2 | | 5/10/2021 | | |
| 10.17† | | | | 10-Q | | 001-36331 | | 10.1 | | 5/5/2022 | | |
| 10.18† | | | | 10-Q | | 001-36331 | | 10.5 | | 8/9/2022 | | |
| 10.19† | | | | 10-Q | | 001-36331 | | 10.3 | | 11/8/2016 | | |
| 10.20† | | | | 10-Q | | 001-36331 | | 10.3 | | 11/8/2019 | | |
| 10.21† | | | | 10-Q | | 001-36331 | | 10.3 | | 5/5/2022 | | |
| 10.22† | | | | 10-Q | | 001-36331 | | 10.9 | | 8/9/2022 | | |
| 10.23† | | | | 10-K | | 001-36331 | | 10.26 | | 3/2/2020 | | |
| 10.24† | | | | 10-Q | | 001-36331 | | 10.3 | | 5/10/2021 | | |
| 10.25† | | | | 10-Q | | 001-36331 | | 10.4 | | 5/10/2021 | | |
| 10.26† | | | | 10-Q | | 001-36331 | | 10.4 | | 5/5/2022 | | |
| 10.27† | | | | 10-Q | | 001-36331 | | 10.11 | | 8/9/2022 | | |
| 10.28† | | | | 10-Q | | 001-36331 | | 10.2 | | 5/5/2022 | | |
| 10.29† | | | | 10-Q | | 001-36331 | | 10.6 | | 8/9/2022 | | |
| 10.30† | | | | 10-Q | | 001-36331 | | 10.7 | | 8/9/2022 | | |
| 10.31† | | | | 10-Q | | 001-36331 | | 10.3 | | 8/9/2019 | | |
| 10.32† | | | | 10-Q | | 001-36331 | | 10.4 | | 8/9/2022 | | |
| 10.33† | | | | 10-Q | | 001-36331 | | 10.3 | | 8/9/2022 | | |
| 10.34† | | | | 8-K | | 001-36331 | | 10.1 | | 5/18/2022 | | |
| 10.35 | | | | 10-Q | | 001-36331 | | 10.1 | | 8/5/2020 | | |
| 10.36 | | | | 8-K | | 001-36331 | | 10.1 | | 2/10/2021 | | |
| | | | | | | | | | | | | | | | | | | | | | | | | | | | | | | | | | | | | | |
| | | | | Incorporated by Reference |
Exhibit
Number | | Exhibit Description | | Form | | File No. | | Exhibit | | Filing
Date | | Filed
Herewith |
| 10.38 | | | | 8-K | | 001-36331 | | 10.1 | | 11/17/2017 | | |
| 21.1 | | | | | | | | | | | | X |
| 23.1 | | | | | | | | | | | | X |
| 24.1 | | | | | | | | | | | | X |
| 31.1 | | | | | | | | | | | | X |
| 31.2 | | | | | | | | | | | | X |
| 32.1* | | | | | | | | | | | | X |
| 32.2* | | | | | | | | | | | | X |
| 101.INS | | Inline XBRL Instance Document the instance document does not appear in the Interactive Data File because its XBRL tags are embedded within the Inline XBRL Document | | | | | | | | | | X |
| 101.SCH | | Inline XBRL Taxonomy Extension Schema Document | | | | | | | | | | X |
| 101.CAL | | Inline XBRL Taxonomy Extension Calculation Linkbase Document | | | | | | | | | | X |
| 101.DEF | | Inline XBRL Taxonomy Extension Definition Linkbase Document | | | | | | | | | | X |
| 101.LAB | | Inline XBRL Taxonomy Extension Label Linkbase Document | | | | | | | | | | X |
| 101.PRE | | Inline XBRL Taxonomy Extension Presentation Linkbase Document | | | | | | | | | | X |
| 104 | | Cover Page Interactive Data File (formatted as inline XBRL with applicable taxonomy extension information contained in Exhibits 101) | | | | | | | | | | X |
| | | | | | | | | | | | | | | | | | | | | | | | | | | | | | | | | | | | | | |
| 10.37 | | | | 8-K | | 001-36331 | | 10.1 | | 12/6/2022 | | |
| 10.38 | | | | 8-K | | 001-36331 | | 10.2 | | 12/6/2022 | | |
| 21.1 | | | | 10-K | | 001-36331 | | 21.1 | | 3/16/2023 | | |
| 23.1 | | | | 10-K | | 001-36331 | | 23.1 | | 3/16/2023 | | |
| 24.1 | | | | 10-K | | 001-36331 | | 24.1 | | 3/16/2023 | | |
| 31.1 | | | | 10-K | | 001-36331 | | 31.1 | | 3/16/2023 | | |
| 31.2 | | | | 10-K | | 001-36331 | | 31.2 | | 3/16/2023 | | |
| 31.3 | | | | | | | | | | | | X |
| 31.4 | | | | | | | | | | | | X |
| 32.1* | | | | 10-K | | 001-36331 | | 32.1 | | 3/16/2023 | | |
| 32.2* | | | | 10-K | | 001-36331 | | 32.2 | | 3/16/2023 | | |
| 101.INS | | Inline XBRL Instance Document the instance document does not appear in the Interactive Data File because its XBRL tags are embedded within the Inline XBRL Document | | | | | | | | | | X |
| 101.SCH | | Inline XBRL Taxonomy Extension Schema Document | | | | | | | | | | X |
| 101.CAL | | Inline XBRL Taxonomy Extension Calculation Linkbase Document | | | | | | | | | | X |
| 101.DEF | | Inline XBRL Taxonomy Extension Definition Linkbase Document | | | | | | | | | | X |
| 101.LAB | | Inline XBRL Taxonomy Extension Label Linkbase Document | | | | | | | | | | X |
| 101.PRE | | Inline XBRL Taxonomy Extension Presentation Linkbase Document | | | | | | | | | | X |
| 104 | | Cover Page Interactive Data File (formatted as inline XBRL with applicable taxonomy extension information contained in Exhibits 101) | | | | | | | | | | X |
| | | | | |
†
| Indicates a management contract or compensatory plan or arrangement. |
| * | The certifications attached as Exhibit 32.1 and 32.2 that accompany this Annual Reportaccompanied the Form 10-K filed on Form 10-KMarch 16, 2023 are not deemed filed with the Securities and Exchange Commission and are not to be incorporated by reference into any filing of Quotient under the Securities Act of 1933, as amended, or the Securities Exchange Act of 1934, as amended, whether made before or after the date of thisthe Form 10-K filed on March 16, 2023, irrespective of any general incorporation language contained in such filing. |
Item 16. Form 10-K Summary.
None.
SIGNATURES
Pursuant to the requirements of Section 13 or 15(d) of the Securities Exchange Act of 1934, as amended, the Registrant has duly caused this ReportForm 10-K/A, Amendment No. 1 to be signed on its behalf by the undersigned, thereunto duly authorized.
| | | | | | | | |
| | Quotient Technology Inc. |
| | |
Date: February 22, 2021April 28, 2023 | By: | /s/ Steven BoalMatt Krepsik |
| | | Steven BoalMatt Krepsik |
| | | Chief Executive Officer |
POWER OF ATTORNEY
KNOW ALL PERSONS BY THESE PRESENTS, that each person whose signature appears below constitutes and appoints Steven Boal, Pamela Strayer and Connie Chen, jointly and severally, his attorney-in-fact, each with the full power of substitution, for such person, in any and all capacities, to sign any and all amendments to this Annual Report on Form 10-K, and to file the same, with all exhibits thereto and other documents in connection therewith, with the Securities and Exchange Commission, granting unto said attorney-in-fact and agent full power and authority to do and perform each and every act and thing requisite and necessary to be done in connection therewith, as fully to all intents and purposes as he might do or could do in person hereby ratifying and confirming all that each of said attorneys-in-fact and agents, or his substitute, may do or cause to be done by virtue hereof.
Pursuant to the requirements of the Securities Exchange Act of 1934, as amended, this Report has been signed below by the following persons on behalf of the Registrant in the capacities and on the dates indicated.
| | | | | | | | | | | | | | |
Name | | Title | | Date |
| | | | |
/s/ Steven Boal | | Chief Executive Officer and Director (Principal Executive Officer) | | February 22, 2021 |
Steven Boal | | | | |
/s/ Pamela Strayer | | Chief Financial Officer and Treasurer (Principal Financial Officer and Principal Accounting Officer) | | February 22, 2021 |
Pamela Strayer | | | | |
/s/ Andrew J. Gessow | | Director | | February 22, 2021 |
Andrew J. Gessow | | | | |
/s/ Lorraine Hariton | | Director | | February 22, 2021 |
Lorraine Hariton | | | | |
/s/ Steve Horowitz | | Director | | February 22, 2021 |
Steve Horowitz | | | | |
/s/ Robert McDonald | | Director | | February 22, 2021 |
Robert McDonald | | | | |
/s/ Michelle McKenna | | Director | | February 22, 2021 |
Michelle McKenna | | | | |
/s/ David Oppenheimer | | Director | | February 22, 2021 |
David Oppenheimer | | | | |
/s/ Christy Wyatt | | Director | | February 22, 2021 |
Christy Wyatt | | | | |