•economic, political and market conditions and fluctuations, including inflation, interest rate and foreign currency risk inherent in U.S. and international operations;operations, and geopolitical instability;
•the performance and reliability of our technology and technology of third parties;parties on which we rely;
•any significant errorsystems failures or errors in our operational processes;
•our ability to continue to generate cash and manage our indebtedness; and
•adverse changes that may occur in the litigation or regulatory areas, or in the securities markets generally.generally, or increased regulatory oversight domestically or internationally.
Most of these factors are difficult to predict accurately and are generally beyond our control. You should consider the uncertainty and any risk related to forward-looking statements that we make. These risk factors are discussed under the caption “Item"Item 1A. Risk Factors,”Factors" in this Annual Report on Form 10-K. You are cautioned not to place undue reliance on these forward-looking statements, which speak only as of the date of this report. You should carefully read this entire Annual Report on Form 10-K, including “Item 7. Management’s Discussion and Analysis of Financial Condition and Results of Operations,”Operations” and the consolidated financial statements and the related notes. Except as required by the federal securities laws, we undertake no obligation to update any forward-looking statement, release publicly any revisions to any forward-looking statements or report the occurrence of unanticipated events. For any forward-looking statements contained in any document, we claim the protection of the safe harbor for forward-looking statements contained in the Private Securities Litigation Reform Act of 1995.
iv
PART I
Item 1.Business
Overview
Nasdaq Inc. is a leading providerglobal technology company serving the capital markets and other industries. Our diverse offerings of trading, clearing, marketplace technology, regulatory, securities listing, informationdata, analytics, software and publicservices enable clients to optimize and private company services. Our global offerings are diverseexecute their business vision with confidence.
We manage, operate and include trading and clearing across multiple asset classes, trade management services, data products, financial indexes, capital formation solutions, corporate solutions, and market technologyprovide our products and services. Our technology powers markets across the globe, supporting equity derivative trading, clearingservices in three business segments: Market Platforms, Capital Access Platforms and settlement, cash equity trading, fixed income trading, trading surveillance and many other functions.Anti-Financial Crime.
History
Nasdaq was founded in 1971 as a wholly-owned subsidiary of FINRA. Beginning in 2000, FINRA restructured and broadened ownership in Nasdaq by selling shares to FINRA members, investment companies and issuers listed on The Nasdaq Stock Market. In connection with this restructuring, FINRA fully divested its ownership of Nasdaq in 2006, and The Nasdaq Stock Market became fully operational as an independent registered national securities exchange in 2007. In 2006, Nasdaq also reorganized its operations into a holding company structure.
In February 2008, Nasdaq and OMX AB combined their businesses.businesses, and we changed our corporate name to The NASDAQ OMX Group, Inc. This transformational combination resulted in the expansion of our business from a U.S.-based exchange operator to a global exchange company offering technology that powers our own exchanges and markets as well as many other marketplaces around the world. In connection with this acquisition, we changed our corporate name to TheWe operated as the NASDAQ OMX Group Inc. We operated under this name until we rebranded our business as Nasdaq, Inc. in 2015.
Growth Strategy
To enable success in addition to growing organically,the evolving global financial system, we have executed multiple acquisitionsestablished our purpose, vision, and value proposition together with a focused growth strategy:
Our Purpose: We advance economic progress for all.
Our Vision: We will be the trusted fabric of the world’s financial system.
Our Value Proposition: We deliver world-leading platforms that have expanded our operations globallyimprove the liquidity, transparency and increasingly diversified our product and service offerings. integrity of the global economy.
Our most recent significant acquisitions include ISE in 2016 and eVestment in 2017.
Strategy: In 2017, Nasdaq completedwe set a review of its strategy for long-term growth. We examined key macroeconomic, regulatory and technology trends, consulted with our clients about short- and long-termtrends in their businesses and assessed the competitive landscape. We identified the following key trends that we believe will shape our future opportunities.
In 2022, we announced a new organizational structure which aligns our businesses more closely with the special marketplace platform businessesfoundational shifts that are coredriving the evolution of the global financial system. In order to Nasdaq,amplify our strategy, we aligned the Company more closely with evolving client needs. As a result, we have identified three new reporting segments, Market Platforms, Capital Access Platforms and Anti-Financial Crime, which align to reduce capital and resources in areas that are not as strategicour new divisional structure.
By aligning our business segments against these secular trends, we aim to deliver more for our clients and do not haveincrease growth across our key pillars of liquidity, transparency and integrity:
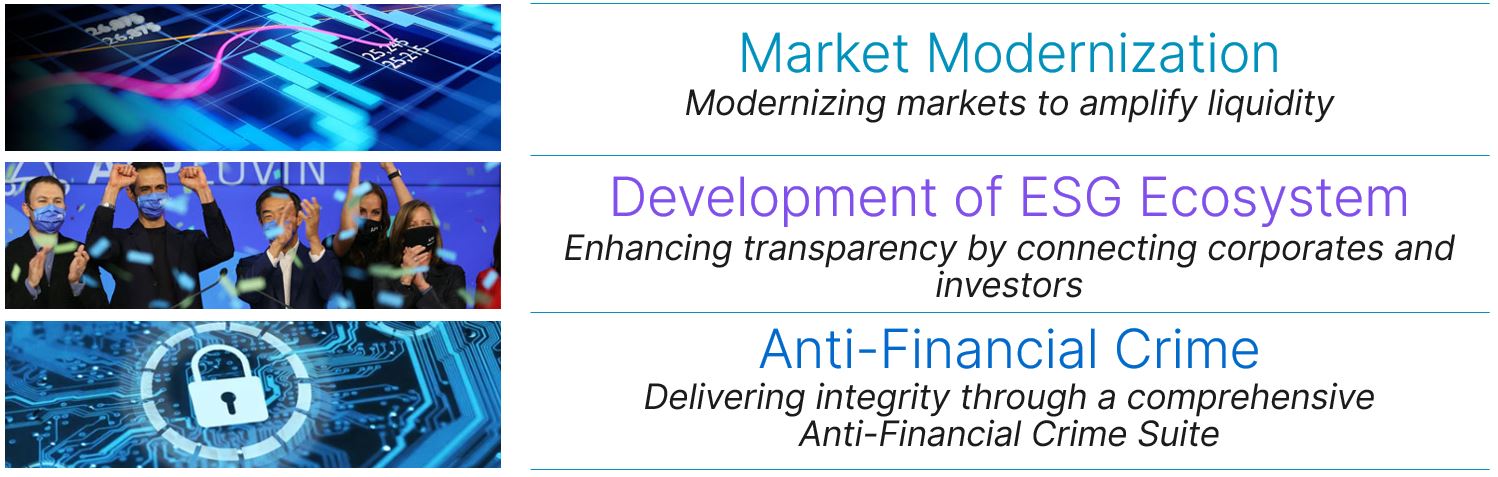
•Liquidity: Within our Market Platforms division, we continue to modernize markets by utilizing technology to maximize the liquidity of the global economy. New technologies, including cloud, blockchain, machine learning and artificial intelligence, present significant growthopportunities to further enhance market resiliency and scalability and make markets even more accessible. We believe that these technologies will enable more opportunities for market participants and new asset classes to be integrated across markets globally. We brought our markets and market-related technology businesses together, aligning complementary capabilities to capture the potential within Nasdaq.these technologies can unlock in our industry. By utilizing the division’s position at the center of markets, we believe that Market Platforms will be at the forefront of the financial system’s evolution and will play a critical role in advancing the modernization of markets across geographies and asset classes.
•Transparency: Our Capital Access Platforms division is uniquely placed to help clients navigate the increasing complexity of the evolving financial system through access to capital and transparency which enables economic growth. With over 10,000 corporate clients and 5,000 clients across the investment management ecosystem, Nasdaq is a trusted partner to aid the corporate and investment communities in making more informed decisions. Leveraging the insights and capabilities across our listings, advisory, data, index, and analytics teams, we believe that Capital Access Platforms will serve as a bridge between the investor and corporate communities, focused on enhancing the client experience by providing efficient routes to capital, delivering more holistic, actionable insights and intelligence, modernizing workflows, and navigating the climate and ESG landscape.
Products and Services
Our Market ServicesPlatforms segment delivers world leading platforms that improve the liquidity, transparency and integrity of the global economy by architecting and operating the world's best markets.
Our Market Platforms segment includes our Equity Derivative Trading Services and Clearing, Cash Equity Trading, FICC and Trade Management ServicesMarketplace Technology businesses.
Trading and ClearingServices
We provide trading services in North America and Europe. In the U.S., we operate six electronic options exchanges in the U.S.:exchanges: Nasdaq PHLX, The Nasdaq Options Market, Nasdaq BX Options, Nasdaq ISE, Nasdaq GEMX and Nasdaq MRX. These exchanges facilitate the trading of equity, options, ETF, options, index options and foreign currency options. Together, ourOur combined options market share in 2022 represented the largest share of the U.S. market for multiply-listed options on equities and ETFs.multi-listed equity options. Our
options trading platforms provide trading opportunities to both retail investors, algorithmic trading firms and market makers, who tend to prefer electronic trading, and institutional investors, who typically pursue more complexrequire high touch services to execute their trades, which are often performed on our trading strategies and often trade on the floor.floor in Philadelphia.
Trading Services also includes revenues from U.S. Tape plans. The plan administrators sell quotation and last sale information for all transactions, whether traded on The Nasdaq Stock Market or other exchanges, to market participants and to data distributors, whothen provide the information to subscribers. After deducting costs, the plan administrators distribute the tape revenues to the respective plan participants based on a formula required by Regulation NMS that takes into account both trading and quoting activity.
In addition,Canada, we operate an exchange with three independent markets for the trading of Canadian-listed securities.securities: Nasdaq Canada CXC, Nasdaq Canada CX2 and Nasdaq Canada CXD.
In 2022, we began migrating our North American markets to the AWS cloud-computing platform in a phased approach as part of a partnership to build the foundation of new capital markets. During the fourth quarter, we successfully completed the migration of Nasdaq MRX to the cloud. We believe the shift to cloud-based markets will provide our exchanges with more security, greater reliability, better scalability and the ability to quickly power up computing resources. This will, in turn, enable Nasdaq to provide its clients access to cloud-based capabilities, including virtual connectivity services, market analytics and machine learning, at a lower cost.
In Europe, we operate exchanges in Tallinn (Estonia), Riga (Latvia) and Vilnius (Lithuania) as Nasdaq operatesBaltic and exchanges in Stockholm (Sweden), Copenhagen (Denmark), Helsinki (Finland), and Reykjavik (Iceland). We also operate exchanges in Tallinn (Estonia), Riga (Latvia) and Vilnius (Lithuania). together with the clearing operations of Nasdaq Clearing, as Nasdaq Nordic.
Collectively, the Nasdaq Nordic and Nasdaq Baltic exchanges offer trading in cash equities, depository receipts, warrants, convertibles, rights, fund units and ETFs.ETFs, as well as trading and clearing of derivatives and clearing of resale and repurchase agreements. Our platform allows the exchanges to share the same trading system, which enables efficient cross-border trading and settlement, crosscross-exchange membership and a single source for Nordic data products. Settlement and registration of cash equity trading takes place in Sweden, Finland, Denmark and IcelandDenmark via the local central securities depositories. In addition, Nasdaq owns twoa central securities depositoriesdepository that provideprovides notary, settlement, central maintenance and other services in the Baltic countries and Iceland.
the trading and clearing of Nordic fixed income derivatives in a unique market structure. Buyers and sellers agree to trades in fixed income derivatives through bilateral negotiations and then report those trades to Nasdaq Clearing for CCP clearing.Clearing. Nasdaq Clearing acts asoffers central counterparty clearing services for fixed-income options and futures and interest rate swaps. Nasdaq Clearing also operates a clearing service for the counterparty to bothresale and repurchase agreement market.
2
In June 2021, we sold our U.S. Fixed Income business, which included an electronic platform for the buyer and seller.trading of U.S. Treasuries.
Nasdaq Commodities is the brand name for Nasdaq’s worldwide suite ofEuropean commodity-related products and services.services such as trading and clearing. Nasdaq Commodities’ offerings include oil,derivatives in power, natural gas and carbon emission markets, tankerseafood and dry cargo freight, seafood derivatives, iron ore, electricity certificates and clearing services.certificates. These products are listed on two of Nasdaq’s derivatives exchanges.Nasdaq Oslo ASA, except for seafood, which is listed on Fish Pool, a third-party platform.
Nasdaq Oslo ASA which is authorized by the Norwegian Ministry of Finance and supervised by the Norwegian Financial Supervisory Authority, is the commodity derivatives exchange for European products and freight.products. All trades with Nasdaq Oslo ASA are subject to clearing with Nasdaq Clearing, which is a CCP authorized under EMIR by the SFSA to conductoffers central counterparty clearing operations.services for commodities options and futures.
We also operate NFX, whichown a majority stake in Puro.earth, a Finnish-based leading platform for carbon removal. Puro.earth offers engineered carbon removal instruments that are verified and tradable through an open, online platform. Puro.earth’s marketplace capabilities add to our suite of ESG-focused technologies and workflow solutions and give our clients further resources to successfully achieve their ESG objectives.
In addition to our trading and clearing services business and our carbon market offering, in September 2022, we announced our planned launch of a new digital assets business to power the digital asset ecosystem. The launch underpins Nasdaq’s ambition to advance and help facilitate broader institutional participation in digital assets by providing trusted and institutional-grade solutions, focused on enhanced custody, liquidity and integrity. Nasdaq Digital Assets will initially develop an advanced custody solution. Nasdaq’s offering is a U.S. based designated contract market authorized by the CFTC. NFX currently lists cash-settled energy derivatives based on key energy benchmarks including oil, natural gas and U.S. power. All trades with NFX are subject to clearingregulatory approval in applicable jurisdictions. Additionally, we expanded our anti-financial crime technology with OCC.new coverage for the cryptocurrency ecosystem, including a comprehensive suite of crypto-specific fraud detection capabilities discussed below in “Anti-Financial Crime.”
Marketplace Technology comprises our trade management services and market technology businesses.
Our trade management services business provides market participants with a wide variety of alternatives for connecting to and accessing our markets for a fee. Shifting connectivity from proprietary networks to third-party networks has significantly reduced technology and network costs and increased our systems’ scalability while maintaining performance and reliability.
Our marketplaces may be accessed via a number of different protocols used for quoting, order entry, trade reporting DROP functionality and connectivity to various data feeds. We also offer thelaunched WorkX in 2021, an upgraded version of Nasdaq ACT Workstation, a browser-based,web-based, front-end interface that allows market participants to view data, utilize risk management tools, and enter orders, quotessubmit and review trade reports. WorkX enables a seamless workflow and enhanced trade intelligence. All Workstation users were migrated to WorkX in 2022. In addition, we offer a variety of add-on compliance tools to help firmsmarket participants comply with regulatory requirements.
We provide co-locationcolocation services to market participants, whereby we offer firms may lease cabinet space and power to house their own equipment and servers within our data centers. These participants are charged monthly fees for cabinet space, connectivity and support. Additionally, we offer a number of wireless connectivity routesofferings between select data centers using millimeter wave and microwave technology.
We also earn revenues from annual and monthly exchange membership and registration fees.
back-office systems, which allowallowed customers to entirely or partly outsource their company’s back-office functions.
Our market technology business is a leading global technology solutions provider and partner to exchanges, clearing organizations, central securities depositories, real-time updatingregulators, banks, brokers, buy-side firms and communicationcorporate businesses, and powers over 120 market infrastructure operators and new market clients in more than 55 countries. Our solutions can handle a wide array of assets, including but not limited to cash equities, equity derivatives, currencies, various interest-bearing securities, commodities, energy products and digital currencies. Our solutions can also be used in the creation of new asset classes by non-capital markets customers, including those in insurance liabilities securitization, cryptocurrencies and sports wagering, as discussed further below.
Nasdaq’s market technology is utilized by leading markets in the U.S., Europe and Asia as well as emerging markets in the Middle East, Latin America, and Africa.
During 2022, we continued to build out our SaaS business portfolio by extending and migrating our current offerings to SaaS, where we added 11 new SaaS customers. Our market technology business has evolved from its origins serving the capital markets, as we have leveraged NFF, our flexible and modular architecture technology that provides next generation capital markets capabilities in an open and agile environment, to develop our SaaS platform and offerings. We expect to continue to expand adoption of this SaaS model by our clients in the future.
For market infrastructure operators, which include exchanges, regulators, clearinghouses and central securities depositories, we provide and deliver mission-critical solutions across the trade lifecycle via the SocietyNFF, which is designed to cover all aspects of a market operator’s needs, from trading and clearing to risk management, market surveillance, index development, data, management, testing and quality assurance.
3
Recently, we have seen a growing demand for Worldwide Interbank Financial Telecommunication (SWIFT) to deposit banks.
Numerous market technology projects involve complex delivery management and systems integration. Through our integration services, we can assume responsibility for projects that involve migration to a new system and websites. Our solutions, including our Nasdaq IR Insight platform, allow investor relations officers to manage their investor relations programs using a varietythe establishment of toolsentirely new marketplaces. We also offer operation and support for the applications, systems platforms, networks and other components included in an information to understand their investor base, manage meetings and read research, consensus estimates and news while meeting corporate governance and disclosure requirements.
Capital Access Platforms
Our Capital Access Platforms segment delivers liquidity, transparency and integrity to the corporate issuer and investment community by empowering our clients to effectively navigate the capital markets, achieve their sustainability goals, and drive governance excellence. As we operate in the center of their communications programs.
Our European listing customers include companies, funds and governments. Customers issue securities in the form of cash
Data Products& Listing Services
Our Data Products business sellsU.S. and distributes historical and real-time quote and trade information to the sell-side, the buy-side, retail online brokers, proprietary trading shops, other venues, internet portals and data distributors. OurEuropean data products enhance transparency of market activity within our exchanges and provide critical information to professional and non-professional investors globally. Our Data business sells and distributes historical and real-time market data to sell-side customers, the institutional investing community, retail online brokers, proprietary trading firms, and other venues, as well as internet portals and data distributors.
We collect, process, and create information and earn revenues as a distributor of our own, as well as select third-party, content. We provide varying levels of quote and trade information to our customersmarket participants and to data distributors who in turn provide subscriptions for this information. Our systems enable distributors to gain access to our market depth, index values, mutual fund valuation, order imbalances, market sentiment and other analytical data.
We distribute this proprietary market information to both market participants and non-participants through a number of proprietary products, including Nasdaq TotalView, our flagship market depth quote product. TotalView shows subscribers quotes, orders and total anonymous interest at every displayed price level in The Nasdaq Stock Market for Nasdaq-listed securities and critical data for the opening, closing, halt and IPO crosses. We also offer TotalView products for our Nasdaq BX, Nasdaq PSX Nasdaqand Nordic markets. We also offer Nordic Equity TotalView, Nordic Derivatives TotalView and Nordic Fixed Income and otherTotalView for Nordic markets.
We operate several other proprietary services and data products to provide market information, including Nasdaq Basic, a low cost alternative to the industry Level 1 feed Ultrafeed,and Nasdaq Canada Basic, a normalizedlow cost alternative to other high speed, and consolidatedpriced data feed offering.feeds. We also provide a plethora ofvarious other data, including data relating to our 6 U.S. equities and options exchanges and Nordic equities, derivatives, fixed income, futures and U.S. futures, Nordic commodities, U.S. Treasuries,commodities.
Additionally, our Nasdaq Cloud Data Service provides a flexible and efficient method of delivery for real-time exchange data and other financial information. Data is made available through a suite of application programming interfaces, or APIs, allowing for the integration of data from disparate sources and a reduction in time to market for customer-designed applications. The API is highly scalable and can support the delivery of real-time exchange data.
We operate a variety of listing platforms around the world to provide multiple global indexescapital raising solutions for public companies. Companies listed on our markets represent a diverse array of industries including, among others, healthcare, consumer products, telecommunication services, information technology, financial services, industrials and global mutual funds.
energy. Our Data Products business also includes revenues from U.S. tape plans. The plan administrators sell quotation and last sale information for all transactions in Nasdaq-listed securities, whether traded onmain listing markets are The Nasdaq Stock Market or other exchanges, to market participants and to data distributors, who
Companies seeking to list securities on The Nasdaq Stock Market may do so on one of the three market tiers: The Nasdaq Global Select Market, The Nasdaq Global Market, or The Nasdaq Capital Market. To qualify, companies must meet minimum listing requirements, including specified financial and corporate governance criteria. Once listed, companies must maintain rigorous listing and corporate governance standards.
4
As of December 31, 2022, a total of 4,230 companies listed securities on The Nasdaq Stock Market, with 1,566 listings on The Nasdaq Global Select Market, 1,298 on The Nasdaq Global Market and 1,366 on The Nasdaq Capital Market.
We seek new listings from companies conducting IPOs, including SPACs, and direct listings as well as companies looking to switch from alternative exchanges. The 2022 new listings were comprised of the following:
| IPOs | 161 | ||||
| Switches from the New York Stock Exchange LLC, or NYSE, and the NYSE American LLC, or NYSE American | 14 | ||||
| Upgrades from OTC | 46 | ||||
| ETPs and Other Listings | 145 | ||||
| Total | 366 | ||||
| The Nasdaq Stock Market IPO win rates: | |||||
| 2022 total | 89 | % | |||
| Operating companies | 92 | % | |||
| SPACs | 86 | % | |||
During 2022, we had 14 new listings resulting from companies switching their listings from NYSE or NYSE American to join The Nasdaq Commodities, for the following classesStock Market. Together with companies that transferred additional securities to The Nasdaq Stock Market during 2022, an aggregate of assets: cash equities, bonds, derivatives and commodities. We provide varying levels of quote and trade information$36 billion in global equity market capitalization switched to market participants and to data distributors, who in turn provide subscriptions for this information. Significant European data products include Nordic Equity TotalView, Nordic Derivative TotalView, and Nordic Fixed Income TotalView, Level 2, Analytics and Fixings.The Nasdaq Stock Market.
We also provide index data products basedoffer listings on the exchanges that comprise Nasdaq indexes. Index data productsNordic and Nasdaq Baltic. For smaller companies and growth companies, we offer access to the financial markets through the Nasdaq First North alternative marketplaces. As of December 31, 2022, a total of 1,251 companies listed securities on our Nordic and Baltic exchanges.
Our European listing customers include companies, funds and governments. Customers issue securities in the form of cash equities, depository receipts, warrants, ETPs, convertibles, rights, options, bonds or fixed-income related products. In 2022, a total of 63 new companies listed on our Global Index Data Service, which delivers real-time index values throughout the trading day,Nordic and Global Index Watch/Global Index File Delivery Service, which delivers weightings and components data, corporate actions and a breadth of additional data.Baltic exchanges. In addition, 12 companies upgraded their listings from Nasdaq First North to Nasdaq Main Market.
Index Licensing and Services
Our Index Licensing and Services business is a leading index provider that develops and licenses Nasdaq brandedNasdaq-branded indexes associated derivatives and financial products. We also provide custom calculation services for third-party clients. License fees for our trademark licenses vary by product based on a percentage of underlying assets, dollar value of a product issuance, number of products or number of contracts traded. We also license cash-settled options, futures and options on futures on our indexes.
As of December 31, 2017, we had 3242022, 379 ETPs licensed to Nasdaq’slisted on 26 exchanges in over 20 countries tracked a Nasdaq index and accounted for $315 billion in AUM. This includes approximately $85 billion in ETP AUM, or 27% of the total AUM that tracked our smart beta indexes which had $167 billion of assets under management.during this same time period. Our flagship index, the Nasdaq-100 Index, includes the top 100 non-financial securitiescompanies listed on The Nasdaq Stock Market.Market, and is tracked by more than 100 ETPs worldwide, and had nearly $200 billion in assets tracking the index as of December 31, 2022.
We also operate theprovide index data products based on Nasdaq indexes. Index data products include our Global Index Family,Data Service, which includes more than 40,000 indexes. The family consists of
Workflow & Insights
Our Workflow & Insights business includes our analytics and corporate solutions businesses.
Our analytics business provides asset managers, investment consultants and institutional asset owners with information and analytics to make data-driven investment decisions, deploy their resources more productively, and provide liquidity solutions for private funds. Through our eVestment and Solovis solutions, we provide a suite of December 31, 2017, therecloud-based solutions that help institutional investors and consultants conduct pre-investment due diligence, and monitor their portfolios post-investment. The eVestment platform also enables asset managers to efficiently distribute information about their firms and funds to asset owners and consultants worldwide.
5
Through the Solovis platform, endowments, foundations, pensions and family offices transform how they collect and aggregate investment data, analyze portfolio performance, model and predict future outcomes, and share meaningful portfolio insights with key stakeholders. The Nasdaq Fund Network and Nasdaq Data Link are $70 billionadditional platforms in assets underour suite of investment data analytics offerings and data management in ETPs that tracktools. Nasdaq smart beta indexes.
Our corporate solutions business serves both public and private companies and organizations through our Investor Relations Intelligence, Governance Solutions and ESG Solutions products. Our public company clients can be companies listed on our exchanges or other U.S. and global exchanges. Our private company clients include a diverse group of securities,organizations ranging from family-owned companies, government organizations, law firms, privately held entities, and various non-profit organizations to hospitals and healthcare systems. We help organizations enhance their ability to understand and expand their global shareholder base, improve corporate governance, and navigate the evolving ESG landscape through our suite of advanced technology, analytics, and consulting services. We also advise clients on a range of governance and sustainability-related issues.
Our Investor Relations Intelligence offerings include a global team of expert consultants that deliver advisory services including Equity Surveillance & Shareholder Analysis, Investor Engagement and Perception Studies, as well as cloud-enabled tradingan industry-leading platform, Nasdaq IR Insight®, to investor relations professionals and clearing.executive teams. These solutions allow investor relations officers and executives to better manage their investor relations programs, understand their investor base, target new investors, manage meetings and consume key data such as investor profiles, equity research, consensus estimates and news.
Our ESG Solutions includes our ESG Advisory practice and our ESG software offering. Our ESG Advisory practice helps companies analyze, assess and action best practices to attract long-term capital. Our ESG Software offering includes OneReport, a SaaS solution, that helps organizations navigate corporate responsibility for projects involving migrationframeworks, manage information capture and response process, and deliver ESG data to a new system and the establishment of entirely new marketplaces. We also offer operation and support for the applications, systems platforms, networksratings agencies and other components included instakeholders. In June 2022, we acquired Metrio Software Inc., or Metrio, a turn-key information technologycloud-based solution as well as advisory services.that helps firms manage ESG data, perform greenhouse gas emissions calculations and accounting, and optimize granular data collection, report publication and dashboarding against targets. Both solutions support audit and assurance requirements.
Anti-Financial Crime
Our Risk & SurveillanceAnti-Financial Crime segment delivers leading platforms that improve the integrity and transparency of the financial world by providing SaaS solutions include: SMARTS, which isfor fraud detection, anti-money laundering, and trade and market surveillance.
The financial services industry has seen a managed servicegrowing demand for products and services focused on anti-financial crime. Our FRAML solution provides a cloud-based platform to help detect, investigate, and report money laundering and financial fraud to more than 2,300 financial institutions in North America.
Our surveillance solutions include a SaaS platform designed for banks, brokers and other market participants to assist them in complying with market rules, regulations and internal market surveillance policies;policies and TradeGuard, which isserves more than 170 clients. We also provide a suite of products that offersolution to regulators and exchanges with a real-time, multi-tiered risk solution that integrates pre-, at-robust platform to manage cross-market, cross-asset and on-trade risk management, including margining. multi-venue surveillance. This offering powers surveillance for more than 50 exchanges and 15 regulators.
In 2017,2022, we acquired Sybenetix, a leading surveillance provider that combines behavioral analyticsexpanded our anti-financial crime technology with new capabilities and cognitive computing with financial markets expertise. We expectcoverage for the addition of Sybenetix to our Risk & Surveillance suite of solutions to allowdigital assets ecosystem, allowing us to bring
Enablers, Differentiators and compliance software and services to help companies track, measure and manage key organizational risks.Competition
Technology
Technology plays a key role in ensuring the growth, reliability and regulation of financial markets. We have established a technology risk program to considerevaluate the resiliency of critical systems, including risks associated with cybersecurity. This program is focused on (i) identifying areas for improvement in systems, and (ii) implementing changes and upgrades to technology and processes to minimize future risk. We have continued our focus on improving the security of our technology with an emphasis on employee awareness through training, targeted phishing education campaigns, and new tool deployment for our securities operations team. See “Item 1A. Risk Factors,” in this Annual Report on Form 10-K for further discussion.
6
Nasdaq's shift to utilizing and deploying cloud infrastructure continued during 2022. In the fourth quarter of 2022, we migrated Nasdaq MRX to the cloud, which is the first exchange moved to an exclusively cloud-enabled infrastructure and the first exchange solely in the cloud of any regulated public market in the world. We believe that migrating our exchanges to the cloud, through our partnership with AWS, our preferred cloud provider, will result in improved performance and increased flexibility for our customers. We expect to move additional North American markets to the cloud with AWS during the next several years. The shift to cloud-based markets will enable Nasdaq Financial Framework isto provide its clients access to cloud-based capabilities, including virtual connectivity services, market analytics and machine learning, at a lower cost. We also expect to leverage the cloud-based infrastructure for our market technology clients, assisting such clients in developing their own platforms and customizing their offerings for their local, rapidly changing industry dynamics.
To facilitate the exchange migration to AWS, Nasdaq will also leverage its Fusion technology platform. Fusion positions Nasdaq’s approachNorth American and European markets to manage, operate and deploy a common platform that can be used across our nine Nasdaq derivative markets, while enabling our markets for cloud deployment.
We continue to utilize NFF for delivering end-to-end solutions forto market infrastructure operators, buy-side firms, sell-side firms and other non-financial markets.markets in addition to also supporting Nasdaq's own internal trading systems. The framework consists of a single operational core platform that ties together Nasdaq’s portfolio of functionality across the trade lifecycle, in an open framework whereby exchanges, clearinghouses, CSDscentral securities depositories, and other entities can easily integrate Nasdaq’s business applications with each other, as well as other third-party solutions. In addition to being able to integrate a broad range of business functions, the Nasdaq Financial FrameworkNFF enables end users to leverage recent technology developments, such as blockchain and machine learning.developments.
Competitive Strengths
We are a global, client-focused technology company with expertise in key global regions to support our markets,markets. We deploy robust technology services, disaster recovery capabilities and operations centers. In 2017,have developed a leading anti-financial crime and corporate and investor franchise. Our business segments complement each other and we believe that our strong competitive position in large, high-growth markets positions us for sustained growth.
A Unique Value Proposition
We operate leading platforms that can improve the liquidity, transparency, and integrity of the global economy, allowing us to:
•Develop efficient and reliable technologies to facilitate and protect the financial system across asset classes;
•Empower our clients to effectively navigate the capital markets, achieve their sustainability goals, and maintain corporate governance excellence; and
•Provide data, tools and insights that drive sound decision making.
Technological Strength
The strength and resiliency of our technology, enhanced by our Marketplace Technology business, in meeting the advancing demands of our global customer base is vital to the continued success of our business and distinguishes us from our competitors.
A Focus on Client Needs Across the Global Financial Ecosystem
We strive to migrate systemsserve a diverse range of clients that participate across the global financial ecosystem, including:
•Brokers and Traders - Helping brokers and traders to our facilityconfidently plan, optimize and execute their business vision.
•Market Participants - Providing market participants with access to liquidity and enabling them to efficiently consume, monitor, analyze, and capitalize on real-time market changes.
•Listed Companies - Enabling companies to access capital markets effectively and manage stakeholders.
•Investors and Asset Managers - Offering products and services to assist investors and asset managers in Chicago, as well as addedoptimizing their portfolios and consolidated locations asofferings.
•Market Infrastructure Operators - Assisting market infrastructure operators in increasing efficiency, meeting customer needs, and growing revenue.
•Banks and Financial Institutions - Providing safety and integrity through a resultsuite of acquisitionstrade surveillance and product enhancements.cloud-native anti-financial crime solutions.
Competition
Market ServicesPlatforms
We face intense competition in North America and Europe in businesses that comprisefor our MarketTrading Services segment.businesses. We seek to provide market participants with greater functionality, trading system stability speed of execution,and performance, high levels of customer service, and efficient pricing. In both North America
and Europe, our competitors include other exchange operators, operators of non-exchange (less-heavily regulated) trading systems and banks and brokerages that operate their own internal trading pools and platforms.
7
In the U.S., our options markets in the U.S. includecompete with exchanges operated by:by Cboe Global Markets, Inc., or CBOE;Cboe, Miami International Holdings, Inc., or Miami; andMIAX, Intercontinental Exchange, Inc., or ICE. Registered exchanges competing with ourICE, and BOX Options Market. In cash equities markets in the U.S. include, we compete with exchanges operated by CBOECboe, ICE, MIAX, The Investors Exchange, Members Exchange and ICE. In addition to competition from these exchanges in equities, weLong Term Stock Exchange. We also face competition from ATSs, and other less-heavily regulated broker-owned systems, some of which are also known as “dark pools,” and other less-heavily regulated broker-owned trade facilitation systems, as well as from other types of OTC trading. In Canada, our cash equities exchange competes with exchanges such as the Toronto Stock Exchange, or TSX, and other marketplaces.
In Europe, our cash equities markets in Europe includecompete with exchanges operated by: CBOE;such as Euronext N.V.;, Deutsche Börse A.G.; andAG, London Stock Exchange Group plc, or LSE. We also intensely compete withLSE, and many MTFs such as that operated byCboe, Turquoise Global Holdings Limited.and Aquis. Our competitors in the trading and clearing of options and futures on European equities include: theinclude Eurex, Group companies, or Eurex;Cboe, ICE Futures Europe;Europe and the MTF operated by Turquoise Global Holdings Limited.London Clearing House, or LCH. In addition, to competition from these exchanges and MTFs in equities markets in Europe, we face competition from other broker-owned systems, some of which are also known asdark pools, Systematic Internalizers, or SIs, and from other types of OTC trading. Competition among exchanges for trading European equity derivatives tends to occur where there is competition in the trading of the underlying equities. In addition to exchange-based competition, we face competition from OTC derivative markets.
The implementation of MiFID II and MiFIR over the next several years is expected to lead tohas resulted in further competitive pressure on our European trading business. MTFsSIs are already attracting a significant share of electronically matched volume. With the regulatory environment likely to become more favorable to alternative trading venues, we expect such venues tovolume and compete aggressively for the trading of equity securities listed on our Nordic exchanges. ElectronicDifferent bilateral trading systems pursuing block business will also remain active in Europe. We also expect trading on Systematic InternalizersRegulators are continuously monitoring the market structure and have, in a series of consultations, asked for input regarding suggested changes to increase markedly as volume migrates from other types of trading venues. In responding to current and potential competition, we constantly review our pricing and product offerings.MiFID II.
and services are subject to relentless competitive pressure from OTC dealers as well as exchanges. Our suite of commodity-related productsEuropean exchanges and services is in many cases designed to challenge the more established players.clearinghouses.
Our Trade Management ServicesMarketplace Technology business includes our trade management services and market technology businesses. Our trade management services business competes with other exchange operators, extranet providers, and data center providers.
Traditionally, exchanges and exchange-related businesses would internally develop technology, sometimes aided by consultants. However, this model has gradually changed as many operators have recognized the cost-savings made possible by buying technology from third parties. As a result, two types of competitors have emerged in our Corporate Solutions business, competition is varied and can be fragmented. For our Investor Relations services business, there are many regional competitors and relatively few global providers. Othermarket technology business: exchange operators and technology providers unaffiliated with exchanges. These organizations make available a range of off-the-shelf technology, including trading, clearing, settlement, depository and information dissemination, and offer customization and operation expertise. Market conditions in market technology are partneringevolving rapidly, which makes continuous investment and innovation a necessity. Our partnership with firmsAWS enables us to compete with other companies that have capabilitiesare developing cloud-based exchanges and market technology offerings.
Capital Access Platforms
Our Data business includes proprietary data products. Proprietary data products are made up exclusively of data derived from each exchange’s systems. Competition in this areathe data business is intense and seeking to acquire relevant assets in orderis influenced by rapidly changing technology and the creation of new product and service offerings.
The sale of our proprietary data products is under competitive threat globally from alternative exchanges and trading venues that offer similar products. Our data business competes with other exchanges and third-party vendors to provide investor relations servicesinformation to customers alongside listing services. The competitive landscape formarket participants. Examples of our Boardcompetitors in proprietary data products are ICE, Cboe, TSX, and Dow Jones & Leadership business varies by customer sector and geography. Most participants offer software-as-a-service solutions that are supported by a data center strategy. Some firms offer specialized services that focus on a single niche sector. The larger players often offer additional services. Customers frequently seek single-source providers that are able to address a broad range of needs within a single platform. The competitive landscape for our Public Relations Solutions business includes large providers of traditional wire services, full-service providers, which offer wire distribution along with audience targeting, monitoring and analytics services, and a large number of regional and niche providers. In our Digital Media Services business, competition is fragmented and includes firms that address enterprise buyers, offering them either managed or self-service capabilities.Company.
Our Listing Services business in both the U.S. and Europe provides a means of facilitating capital formation through public capital markets. There are competing ways of raising capital, and we seek to demonstrate the benefits of listing shares on anour exchange. Our primary competitor for larger company stock share listings in the U.S. is NYSE. The Nasdaq Stock Market also competes with NYSE American for listing of shares of smaller companies. Bats BZX Exchange, Inc. competes for ETP listings. The Nasdaq Stock Market competes with local and international markets located outside the U.S. for listings of equity securities of both U.S. and non-U.S. companies that choose to list (or dual-list) outside of their home country. For example, The Nasdaq Stock Market competes for listings with exchanges in Europe and Asia, such as LSE and The Stock Exchange of Hong Kong Limited. Additionally, we face competition from private equity firms that may elect to keep their portfolio companies as private companies.
8
The Listings Services business in Europe is characterized by a large number of exchanges competing for new or secondary listings. Each country has one or more national exchanges, which are often the first choice of companies in each respective country. For those considering an alternative, competing European exchanges that frequently attract many listings from outside their respective home countries include LSE, Euronext N.V. and Deutsche Börse A.G.AG. In addition to the larger exchanges, companies seeking capital or liquidity from public capital markets are able to raise capital without a regulated
market listing and can consider trading their shares on smaller markets and quoting facilities.
Our Index Licensingbusiness offers Nasdaq-branded indexes and Services businessfinancial products and faces competition from providers of various competing financial indexes. For example, there are a number of indexes that aim to track the technology sector and thereby compete with the Nasdaq-100 Index and the Nasdaq Composite Index. We face competition from investment banks, dedicated index providers, markets and other product developers.developers, including S&P Dow Jones Indices, MSCI and FTSE Russell.
Anti-Financial Crime
For our Anti-Financial Crime segment, which includes solutions for fraud detection, anti-money laundering or AML and trade and market surveillance, settlement, depositorycompetitors include core banking solution providers ranging from small to large independent solution providers, FinTech start-ups and information dissemination,in-house custom builds. We compete against enterprise solution providers and offer customizationpoint solutions for clients with larger AUM. Competitors also include companies that serve multiple industries in addition to financial services with generalized solutions, such as business intelligence tools, data integrators, investigation platforms and operation expertise.software covering the boarder compliance lifecycle. Recently, there has been an increase of FinTech start-ups shifting into the surveillance, fraud detection and AML space offering highly-specialized solutions for advanced data analytics, artificial intelligence and machine learning technology. The anti-financial crime and surveillance offerings compete on a number of factors, including but not limited to, increased workflow efficiency, quality of the data, quality of alerts and pricing.
Intellectual Property
We believe that our intellectual property assets are important for maintaining the competitive differentiation of our products, systems, software and services, enhancing our ability to access technology of third parties and maximizing our return on research and development investments.
To support our business objectives and benefit from our investments in research and development, we actively create and maintain a wide array of intellectual property assets, including patents and patent applications related to our innovations, products and services; trademarks related to our brands, products and services; copyrights in software and creative content; trade secrets; and through other intellectual property rights, licenses of various kinds and contractual provisions. We enter into confidentiality and invention assignment agreements with our employees and contractors, and utilize non-disclosure agreements with third parties with whom we conduct business in order to secure and protect our proprietary rights and to limit access to, and disclosure of, our proprietary information.
We own, or have licensed, rights to trade names, trademarks, domain names and service marks that we use in conjunction with our operations and services. We have registered many of our most important trademarks in the U.S. and in foreign countries. For example, our primary “Nasdaq” mark is a registered trademark that we actively seek to protect in the U.S. and in over 50 other countries worldwide.
9
Over time, we have accumulated a robust portfolio of issued patents in the U.S. and in many other jurisdictions across the world. We currently hold rights to patents relating to certain aspects of our products, systems, software and services, but we primarily rely on the innovative skills, technical competence and marketing abilities of our personnel. No single patent is in itself core to the operations of Nasdaq or any of its principal business areas.
Corporate Venture PracticeProgram
Environmental, Social and Governance Matters
Nasdaq is committed to further advancing our longer-term ESG strategy, advocacy and oversight. We continue to engage with internal and external stakeholders at all levels on ESG matters. During 2022, we deepened our corporate and community ESG efforts, including furthering our commitment to greater sustainability and climate change awareness.
The Nominating & ESG Committee has formal responsibility and oversight for ESG policies and programs and receives regular reporting on key ESG matters and initiatives. Our Corporate ESG Steering Committee serves as the central coordinating body for our ESG strategy; it is co-chaired by executive leaders and comprised of geographically diverse representatives from multiple business units.
We continued to be committed to carbon neutrality, and for the fifth consecutive year, achieved that goal across all business operations through the purchase of green power, carbon offsets, and renewable energy certificates. We were named to the Dow Jones Sustainability North America Index for the seventh consecutive year andreceived recognition from the Bloomberg Gender-Equity Index and The Human Rights Campaign’s Corporate Equality Index. In addition, Nasdaq’s ESG scores improved across multiple rating agencies during 2022, including four significant sustainability rating upgrades:
•MSCI: a two-tier rating increase to “AA,” from our “BBB” rating in the prior year, placing Nasdaq in MSCI’s “Leaders” category.
•CDP:a score improvement to an “A” from the prior year’s “B”, earning us a place on CDP’s “A List” for climate disclosures and actions.
•EcoVadis: status upgrade to “Gold Medal,” a recognition reserved for the top 5% of all rated companies, as compared to our “Silver Medal” status in the prior year.
•2022 S&P Corporate Sustainability Assessment (CSA): a score of 60, representing an 20% year-over-year score increase, placing Nasdaq in the 95th percentile of our industry group.
In 2022, Nasdaq also continued to be a signatory to the United Nations Global Compact and the United Nations Principles of Responsible Investment and became a signatory to the World Economic Forum Stakeholder Capitalism Metrics.
While our business operations account for a comparatively small environmental impact, we focus our environmental efforts on several key areas, including the way we use energy resources, manage our workspaces, engage our value chain and conduct business travel. Through these efforts, we seek to lessen the environmental impact of our organization by reducing atmospheric carbon emissions and managing water and waste associated with business operations. Nasdaq has approved near-term and long-term science-based emissions reduction targets with the Science Based Targets initiative, or SBTi. In 2022, the SBTi verified Nasdaq’s 2050 net-zero science-based target.
Nasdaq has obtained the LEED Platinum certification for our New York headquarters office in Times Square, which complements the LEED Gold certification for our 10th Floor Client Experience Center, our space for client events in our New York headquarters.We also achieved LEED Gold certifications for our new Greensboro, North Carolina office and existing office locations in Copenhagen, Reykjavik, San Francisco, Stockholm, Umeå, Vilnius and Washington, D.C. We continue to look for additional opportunities to transition to green offices across the globe as part of our strategy to reduce office operation-related emissions.
We help companies of all ESG maturity levels through our robust combination of technology, tools, data, insights and capital market solutions.During 2022, we maintained, and continued to expand, our portfolio of ESG services and solutions for our clients and stakeholders, including:
•the Nasdaq ESG Advisory Program, which pairs companies with ESG consulting expertise to help them analyze, assess and enact ESG program best practices with the goals of attracting long-term capital and enhancing value;
•the Nasdaq OneReport platform, which helps clients streamline the data gathering process under various frameworks for sustainability reporting and provides data to ratings agencies;
10
•the Metrio platform, which provides tools to address corporate issuers’ expanding ESG data collection, analytics, and reporting needs;
•the Nasdaq Sustainable Bond Network, which connects issuers and investors in sustainable, green and social bonds, and provides access to detailed information and impact data, allowing investors to make more informed decisions;
•the Nasdaq ESG Data Hub, which connects investors with expert led ESG data sets from leading providers across a wide spectrum of areas, including gender diversity, carbon emissions and climate risk, providing detailed and tangible intelligence on companies’ ESG profiles;
•the Nasdaq ESG Data Portal, which now includes ESG-related data from more than 630 Nordic companies;
•the Nasdaq ESG Footprint, a tool that helps both institutional and retail investors analyze the impact of their portfolios;
•the eVestment ESG Questionnaire, which provides a standard approach to ESG reporting thereby allowing for greater transparency into how ESG strategies work, providing deeper ESG data for allocator consumption, and enabling asset managers to better articulate their approach to ESG; and
•Puro.earth, a leading marketplace for carbon removal, which we believe will address the growing demand for carbon removal by corporations, as well as enable new carbon removal methodologies as technologies evolve.
In 2022, we requested our existing leading suppliers by spend to attest to our updated Supplier Code of Ethics. The Supplier Code of Ethics, which is available on our website, encourages our suppliers and vendors to adopt sustainability and environmental practices in line with our published Environmental Practices Statement, to promote a diverse and inclusive workforce and to engage diverse-owned business in their supply chain. Additionally, our new suppliers are required to attest to the Supplier Code of Ethics in connection with the commencement of their engagement.
Effective August 8, 2022, Nasdaq’s new listing rule requires companies listed on our U.S. exchange to publicly disclose consistent, transparent diversity statistics regarding their board of directors using a standardized template. Companies are also required to choose whether to meet recommended board diversity objectives or disclose their reasons for not doing so under new listing rules effective in 2023, 2025 and 2026 (depending on the company’s listing tier and board size). The diversity rules are currently being challenged by two advocacy groups in the U.S. Court of Appeals for the Fifth Circuit.
For more information regarding our ESG efforts in 2022, both internally and externally, please see the section entitled “Human Capital Management” below and our Proxy Statement.
Regulation
We are subject to extensive regulation in the U.S., Canada and Europe.
U.S. Regulation
U.S. federal securities laws establish a system of cooperative regulation of securities markets, market participants and listed companies. SROs conduct the day-to-day administration and regulation of the nation’s securities markets under the close supervision of, and subject to extensive regulation, oversight and enforcement by, the SEC. SROs, such as national securities exchanges, are registered with the SEC.
This regulatory framework applies to our U.S. business in the following ways:
National Securities Exchanges. SROs in the securities industry are an essential component of the regulatory scheme of the Exchange Act responsible for providing fair and orderly markets and protecting investors. The Exchange Act and the rules thereunder, as well as each SRO’s own rules, impose on the SROs many regulatory and operational responsibilities on SROs, including the day-to-day responsibilities for market and broker-dealer oversight. Before it may permit the registration of a national securities exchange as an SRO, the SEC must determine, among other things, that the exchange has a set of rules that is consistent with the requirements of the Exchange Act. Moreover, an SRO is responsible for enforcing compliance by its members, and persons associated with its members, with the provisions of the Exchange Act, the rules and regulations thereunder, and the rules of the SRO, including rules and regulations governing the business conduct of its members.
Nasdaq currently operates three cash equity, and six options markets and one corporate bond market in the U.S. We operate The Nasdaq Stock Market, and The Nasdaq Options Market and the Corporate Bond Market pursuant to The Nasdaq Stock Market’s SRO license; Nasdaq BX and Nasdaq BX Options pursuant to Nasdaq BX’s SRO license; Nasdaq PSX and Nasdaq PHLX pursuant to Nasdaq PHLX’s SRO license; and Nasdaq ISE, Nasdaq GEMX and Nasdaq MRX, each of which operates an options market under theirits own SRO license. As SROs, each entity has separate rules pertaining
to its broker-dealer members and listed companies.companies, as applicable. Broker-dealers that choose to become members of our exchanges are subject to the rules of those exchanges.
All of our U.S. national securities exchanges are subject to SEC oversight, as prescribed by the Exchange Act, including periodic and special examinations by the SEC. Our exchanges also are potentially subject to regulatory or legal action by the SEC or other interested parties at any time in connection with alleged regulatory violations. We also are subject to Section 17 of the Exchange Act, which imposes record-keeping requirements, including the requirement to make records available to the SEC for examination. We have been subject to a number of routine reviews and inspections by the SEC or external auditors in the ordinary course, and we have been and may in the future be subject to SEC enforcement proceedings. To the extent such actions or reviews and inspections result in regulatory or other changes, we may be required to modify the manner in which we conduct our business, which may adversely affect our business.business, operating results and financial condition.
11
Section 19 of the Exchange Act provides that our exchanges must submit to the SEC proposed changes to any of the SROs’ rules, practices and procedures, including revisions to provisions of our certificate of incorporation and by-laws that constitute SRO rules. The SEC will typically publish such proposed changes for public comment, followingafter which the SEC may approve or disapprove the proposal, as it deems appropriate. SEC approval requires a finding by the SEC that the proposal is consistent with the requirements of the Exchange Act and the rules and regulations thereunder. Pursuant to the requirements of the Exchange Act, our exchanges must file with the SEC, among other things, all proposals to change their pricing structure.
Nasdaq conducts real-time market monitoring, certain equity surveillance not involving cross-market activity, most options surveillance, rulemaking, enforcement and membership functions through our Nasdaq Regulation department. We review suspicious trading behavior discovered by our regulatory staff, and depending on the nature of the activity, may refer the activity to FINRA for further investigation. Pursuant to regulatory services agreements between FINRA and our SROs, FINRA provides certain regulatory services to our markets, including thesome regulation of trading activity and surveillance and investigative functions. Nevertheless, we have a direct regulatory role in conductingIn 2019, Nasdaq received SEC approval to reclaim from FINRA the responsibility and opportunity to bring enforcement actions against member firms for violating certain real-time market monitoring, certain equity surveillance not involving cross-market activity, most options surveillance, most rulemaking and some membership functions through our MarketWatch department. We refer suspicious trading behavior discovered by our regulatory staff to FINRA for further investigation.Nasdaq exchange rules governing conduct on the Nasdaq exchanges. Our SROs retain ultimate regulatory responsibility for all regulatory activities performed under regulatory agreements by FINRA, and for fulfilling all regulatory obligations for which FINRA does not have responsibility under the regulatory services agreements.
In addition to its other SRO responsibilities, The Nasdaq Stock Market, as a listing market, also is responsible for overseeing each listed company’s compliance with The Nasdaq Stock Market’s financial and corporate governance standards. Our listing qualifications department evaluates applications submitted by issuers interested in listingseeking to list their securities on The Nasdaq Stock Market to determine whether the quantitative and qualitative listing standards have been satisfied. Once securities are listed, the listing qualifications department monitors each
issuer’s on-going compliance with The Nasdaq Stock Market’s continued listing standards.
Broker-dealer regulation. Nasdaq’s broker-dealer subsidiaries are subject to regulation by the SEC, the SROs and the various state securities regulators. Nasdaq operates three broker-dealers: Nasdaq Execution Services, LLC, or NFSTX, LLC, and Nasdaq Capital Markets Advisory LLC. Each broker-dealer is registered with the SEC, a member of FINRA and registered in the U.S. states and territories required by the operation of its business.In addition, we own a minority interest in NPM Securities.
Nasdaq Execution Services currently operates as our routing broker for sending orders from Nasdaq’sNasdaq's U.S. cash equity and options exchanges to other venues for execution. Execution Access LLC, or Execution Access, operates as the broker-dealer for our fixed income business, including Nasdaq Fixed Income’sNFSTX is a registered ATS for U.S. Treasury securities. NPM Securities, LLC operatesand acts as an ATS involving primary andintermediary to facilitate secondary transactions in unregistered securities (i.e., securities not listed on acertain funds (both registered securities exchange andor not registered under Section 12the Investment Company Act of the Exchange Act)1940), including acting as the buyer’sbusiness development companies, certain closed-end funds and seller’s agent to facilitate private placement and mutual funds’ (including closed-end and interval funds’) transactions on the ATS. SMTX, LLC, or SMTX, also operates as a broker-dealer for NPM and acts as intermediary in connection with private non-capital raising transactions. Finally, Nasdaq Capital Markets Advisory LLC, orreal estate investment funds. Nasdaq Capital Markets Advisory acts as a third-party advisor to privately-held or publicly-traded companies during IPOs and various other offerings.
The SEC, FINRA and the exchangesSROs adopt, rules and examine broker-dealers and require strict compliance with, their rules and regulations.regulations applicable to broker-dealers. The SEC, SROs and state securities commissions may conduct administrative proceedings which can result in censures, fines, the issuance of cease-and-desist orders or the suspension or expulsion of a broker-dealer, its officers or employees. The SEC and state regulators may also institute proceedings against broker-dealers seeking an injunction or other sanction. The SEC and SRO rules cover many aspects of a broker-dealer’s business, including capital structure and withdrawals, sales methods, trade practices among broker-dealers, use and safekeeping of customers’ funds and securities, record-keeping, the financing of customers’ purchases, broker-dealer and employee registration and the conduct of directors, officers and employees. All broker-dealers have an SRO that is assigned by the SEC as the broker-dealer’s DEA.Designated Examining Authority. The DEADesignated Examining Authority is responsible for examining a broker-dealer for compliance with the SEC’s financial responsibility rules. FINRA is the current DEADesignated Examining Authority for Nasdaq Execution Services, Execution Access, NPM Securities, SMTX and Nasdaq Capital Markets Advisory.each of our broker-dealer subsidiaries.
As of December 31, 2017, Nasdaq Execution Services, Execution Access, NPM Securities, SMTX and Nasdaq Capital
Regulatory contractual relationships with FINRA.Our SROs have signed a series of regulatory service agreements covering the services FINRA provides to the respective SROs. Under these agreements, FINRA personnel act as our agents in performing the regulatory functions outlined above, and FINRA bills us a fee for these services. These agreements have enabled us to reduce our headcount while ensuring that the markets for which we are responsible are properly regulated. However, we have reduced the scope of services provided by FINRA under these regulatory services agreements and are performing certain of those regulatory functions directly. In addition, our SROs retain ultimate regulatory responsibility for all regulatory activities performed under these agreements by FINRA.
Exchange Act Rule 17d-2 permits SROs to enter into agreements, commonly called Rule 17d-2 agreements, approved by the SEC with respect to enforcement of common rules relating to common members. Our SROs have entered into several such agreements under which FINRA assumes regulatory responsibility for specifics covered by the agreement, including:
•agreements with FINRA covering the enforcement of common rules, the majority of which relate to the regulation of common members of our SROs and their members;FINRA;
12
•joint industry agreements with FINRA covering responsibility for enforcement of insider trading rules;
•joint industry agreement with FINRA covering enforcement of rules related to cash equity sales practices and certain other non-market related rules; and
•joint industry agreement covering enforcement of rules related to options sales practices.
Regulation NMS and Options Intermarket Linkage Plan. We are subject to Regulation NMS for our cash equity markets, and our options markets have joined the Options Intermarket Linkage Plan. These are designed to facilitate the routing of orders among exchanges to create a national market system as mandated by the Exchange Act. One of the principal purposes of a national market system is to assure that brokers may execute investors’ orders at the best market price. Both Regulation NMS and the Options Intermarket Linkage Plan require that exchanges avoid trade-throughs, locking or crossing of markets and provide market participants with electronic access to the best prices among the markets for the applicable cash equity or options order.
In addition, Regulation NMS requires that every national securities exchange on which an NMS stock is traded and every national securities association act jointly pursuant to one or more national market system plans to disseminate consolidated information, including a national best bid and national best offer, on quotations for transactions in NMS stocks, and that such plan or plans provide for the dissemination of all consolidated information for an individual NMS stock through a single plan processor.
The UTP Plan was filed with and approved by the SEC as a national market system plan in accordance with the Exchange Act and Regulation NMS to provide for the collection,
consolidation and dissemination of such information for Nasdaq-listed securities. The Nasdaq Stock Market serves as the processor for the UTP Plan pursuant to a contract that was extended for a five-yeartwo-year term beginning inthrough October 2015.2023. The Nasdaq Stock Market also serves as the administrator for the UTP Plan. As the processor, The Nasdaq Stock Market performs and discharges regulatory functions and responsibilities that are necessary for the members of the UTP Plan to discharge the regulatory functions related to the operation of a national market system that have been delegated to them under the Exchange Act and Regulation NMS. To fulfill its obligations as the processor, The Nasdaq Stock Market has designed, implemented, maintained, and operated a data processing and communications system, hardware, and software and communications infrastructure to provide processing for the UTP Plan. As the administrator, The Nasdaq Stock Market manages the distribution of market data, the collection of the resulting market data revenue, and the dissemination of that revenue to plan members.members in accordance with the terms of the UTP Plan and of Regulation NMS.
In May 2020, the SEC adopted an order to require changes to the governance of securities information processors. In June 2020, we and several other exchanges petitioned the U.S. Court of Appeals for the District of Columbia Circuit, or the Court of Appeals, to review the SEC’s governance order. In July 2022, the Court of Appeals vacated portions of the governance order that would have provided voting rights to persons other than SROs. At this time, the SEC has not directed implementation of the remaining portions of the governance order, but may do so in the future.
In December 2020, the SEC adopted a rule to modify the infrastructure for the collection, consolidation and dissemination of market data for exchange-listed national market stocks, or NMS data. The rule changes include, among other things, requiring exchanges to add more “core data” to the securities information processors, including partial depth-of-book, certain odd-lot quotations/transactions, auction, regulatory, and administrative data; eliminating central, official consolidators of tape plans and enabling multiple competing consolidators to register to aggregate and disseminate core data; and authorizing persons to purchase and aggregate core data directly from the exchanges for their own use. In May 2022, the Court of Appeals rejected a challenge to the rule brought by Nasdaq and several other exchanges. In September 2022, the SEC disapproved fees proposed by Nasdaq and other exchanges to implement the rule but did not direct exchanges to take further action to implement the rule. Accordingly, a schedule for implementing the rule has not been imposed by the SEC, and we are not certain of the timing, or the impact, of these new rules on our business or role as a securities information processor.
Regulation SCI. Regulation SCI is a set of rules designed to strengthen the technology infrastructure of the U.S. securities markets. Regulation SCI applies to national securities exchanges, operators of certain ATSs, market data information providers and clearing agencies, subjecting these entities to extensive new compliance obligations, with the goals of reducing the occurrence of technical issues that disrupt the securities markets and improving recovery time when disruptions occur.We implemented an inter-disciplinary program to ensure compliance with Regulation SCI. NewWe have also created Regulation SCI policies and procedures, were created,updated internal policies and procedures, were updated, and developed an information technology governance program was rolled out to ensure compliance.
Regulation of Registered Investment Advisor Subsidiary. Our subsidiary DWANDW is an investment advisor registered with the SEC under the Investment Advisors Act of 1940. In this capacity, DWANDW is subject to oversight and inspections by the SEC. Among other things, registered investment advisors like DWANDW must comply with certain disclosure obligations, advertising and fee restrictions and requirements relating to client suitability and custody of funds and securities. Registered investment advisors are also subject to anti-fraud provisions under both federal and state law.
13
CFTC Regulation. We also operate NFX, a designated contract market under the Commodity Exchange Act that is subject to regulatory oversight by the CFTC, an independent agency with the mandate to regulate commodity futures and options markets in the U.S. The National Futures Association provides regulatory services to NFX pursuant to a regulatory services agreement.
The Dodd-Frank Wall Street Reform and Consumer Protection Act also has resulted in increased CFTC regulation of our use of certain regulated derivatives products, as well as the operations of some of our subsidiaries outside the U.S. and their customers.
Canadian Regulation
Regulation of Nasdaq Canada and its three markets is performed by the Canadian Securities Administrators, an umbrella organization of Canada’s provincial and territorial securities regulators. OperatingAs a recognized exchange in Ontario, Nasdaq Canada must comply with the terms and conditions of its exchange recognition order. While exempt from exchange recognition in each jurisdiction in Canada other than Ontario where Nasdaq Canada carries on business, Nasdaq must also comply with the terms and conditions of an exemption order granted by the other jurisdictions in order to maintain its exemptive status. Oversight of the exchange is performed by Nasdaq Canada’s lead regulator, is the Ontario Securities Commission. As an approved ATS,
Nasdaq Canada is subject to the Marketplace Rules (National Instrument 21-101 and National Instrument 23-101),several national marketplace related instruments which includeset out requirements for marketplace operations, trading rules and managing electronic trading risk. Exchange terms and conditions include but are not limited to, requirements for governance, regulation, rules and rulemaking, fair access, transparency of operations, systemsconflict management and confidentiality of trading information. As an ATS, Nasdaq Canada is also a member of the Investment Industry Regulatory Organization of Canada and must comply with its dealer member rules. In December 2017, Nasdaq Canada received approval from the Ontario Securities Commission to become recognized as an exchange under the Securities Act of Ontario effective on March 1, 2018.financial viability.
European Regulation
Regulation of our markets in the European Union and the European Economic Area focuses on issuesmatters relating to financial services, listing and trading of securities, clearing and settlement of securities and commodities, as well as issues related to market abuse. In mid-2012, EMIR, a regulation relating to CCP services and OTC derivatives transactions, was adopted. As a consequence of EMIR, Nasdaq Clearing, like other European CCPs, applied to reauthorize its CCP operations. Nasdaq Clearing was the first European CCP to be authorized as EMIR-compliant when the SFSA approved its application as a CCP under EMIR in 2014.
In July 2016, the European Union’s Market Abuse Regulation, which is intended to prevent market abuse, entered into force. MiFID II and MiFIR entered into force in January 2018 and primarily affect our European trading businesses. Many of the provisions of MiFID II and MiFIR are implemented through technical standards drafted by the European Securities and Markets Authority and approved by the European Commission. In addition, in 2016, the European Union adopted legislation on governance and control of the production and use of benchmark indexes. The Benchmark Regulation applies in the European Union from early 2018. However, due to transitional clauses in the Benchmark Regulation, Nasdaq as a benchmark provider, doesdid not need to be in compliance with the Benchmark Regulation until January 1, 2020.2020 in relation to benchmarks provided by Nasdaq’s European subsidiaries, or until January 1, 2026, in relation to benchmarks provided by non-European Nasdaq entities. As the regulatory environment continues to changeevolve and related opportunities arise, we intend to continue product developmentdeveloping our products and services to ensure that the exchanges and clearinghousesclearinghouse that comprise Nasdaq
Nordic and Nasdaq Baltic maintain favorable liquidity and offer fair and efficient trading.
In addition, proposed rules under MiFID II and MiFIR rules are expected to include provisions for the establishment of a European consolidated tape of pre- and/or post-trade data. These rules may affect our ability to offer market data products in the same manner as we currently provide such offerings.
The entities that operate trading venues in the Nordic and Baltic countries are each subject to local regulations. As a result, we have a strong local presence in each jurisdiction in which we operate regulated businesses. The regulated entities have decision-making power and can adopt policies and procedures and retain resources to manage all operations subject to their license. In Sweden, general supervision of the Nasdaq Stockholm exchange is carried out by the SFSA, while Nasdaq Clearing’s role as CCP in the clearing of derivatives is overseensupervised by the SFSA and overseen by the Swedish central bank (Riksbanken). Additionally, as a function of the Swedish two-tier supervisory model, certain surveillance in relation toof the exchange market is carried out by us, actingthe Nasdaq Stockholm exchange, through ourits surveillance division.function.
Nasdaq Stockholm’s exchange activities are regulated primarily by the SSMA, which implements MiFID II into Swedish law and which sets up basic requirements regarding the board of the exchange and its share capital, and which also outlines the conditions on which exchange licenses are issued. The SSMA also provides that any changes to the exchange’s articles of association following initial registration must be approved by the SFSA. Nasdaq Clearing holds the license as a CCP under EMIR.
With respect to ongoing operations, the SSMA requires exchanges to conduct their activities in an honest, fair and professional manner, and in such a way as to maintain public confidence in the securities markets. When operating a regulated market, an exchange must apply the principles of free access (i.e., that each person which meets the requirements established by law and by the exchange may participate in trading), neutrality (i.e., that the exchange’s rules for the regulated market are applied in a consistent manner to all those who participate in trading) and transparency (i.e., that the participants must be given speedy,prompt, simultaneous and correct information concerning trading and that the general public must be given the opportunity to access this information). Additionally, the exchange operator must identify and manage the risks that may arise in its operations, use secure technical systems and identify and handle the conflicts of interest that may arise between the exchange or its owners’ interests and the interest in safeguarding effective risk management and secure technical systems. Similar requirements are set up by EMIR in relation to clearing operations.
14
The SSMA also contains the framework for both the SFSA’s supervisory work in relation to exchanges and clearinghouses and the surveillance to be carried out by the exchanges themselves. The latter includes the requirement that an exchange should have “an independent surveillance function with sufficient resources and powers to meet the exchange’s obligations.” That requires the exchange to, among other things, supervise trading and price information, compliance with laws, regulations and good market practice, participant compliance with trading participation rules, financial instrument compliance with relevant listing rules and the extent to which issuers meet their obligation to submit regular financial information to relevant authorities.
The regulatory environment in the other Nordic and Baltic countries in which a Nasdaq entity has a trading venue is broadly
similar to the regulatory environment in Sweden. Since 2005, there has been cooperation between the SFSA and the main supervisory authorities in Sweden, Iceland, Denmark and Finland, which looks to safeguard effective and comprehensive supervision of the exchanges comprising Nasdaq Nordic and the systems operated by it, and to ensure a common supervisory approach. In 2019, the supervisory authority in Norway joined this cooperation.
Nasdaq owns a central securities depository known as Nasdaq CSD SE (Societas Europaea)¸ that provides notary, settlement, central maintenance and other services in the Baltic countries and in Iceland. Nasdaq CSD SE is licensed under the European Central Securities Depositories Regulation and is supervised by the respective regulatory institutions.
We operate a licensed exchange, Nasdaq Oslo ASA, in Norway that trades and lists commodity derivatives. Although Norway is not a member of the EU, as a result of the European Economic Area, or EEA, agreement (entered into between the EU and European Free Trade Association) the regulatory environment is broadly similar to what applies in EU member states. In addition, in January 2019 new legislation entered into force in Norway mirroring the provisions of MiFID II and MIFIR. As a result, the regulatory environment in Norway is similar to Sweden. The Financial Supervisory Authority of Norway supervises the Norwegian exchange on an autonomous basis and the Norwegian exchange also has a separate market surveillance function overseen by the Financial Supervisory Authority.
Confidence in capital markets is paramount for trading to function properly. Nasdaq Nordic carries out market surveillance through an independent unit that is separate from the business operations. The surveillance work is conceptually organized into two functions: one for the review and admission of listing of instrumentsapplications and surveillance of companiesactivities related to issuers (issuer surveillance) and one for surveillance of trading (trading surveillance). The real-time trading surveillance for the Finnish, Icelandic, Danish and Swedish markets has been centralized toin Stockholm. In addition, there are specialdesignated personnel who carry out surveillance activities at each ofNasdaq Oslo and the three Baltic
exchanges. In Finland, Sweden and Sweden,Estonia, decisions to list new companies on the main market are made by independent listing committees that have external members in addition to members from each respective exchange and in the other countries the decision is made either by the respective president of the exchanges.exchange or by the executive board.
If there is suspicion that a listed company or member has acted in breach of exchange regulations, the matter is dealt withhandled by the respective surveillance department. Serious breaches are considered by the respective disciplinary committee in Denmark, Finland, Iceland, Sweden and Sweden.Norway. Suspected insider trading is reported to the appropriate authorities in the respective country.
Human Capital Management
Nasdaq has continued to strengthen our commitment to, and investment in, attracting, retaining, developing and motivating our employees during 2022.
In 2022, we introduced the Nasdaq Culture Book, which consolidates and explains Nasdaq’s culture, including Nasdaq’s vision and purpose; our values; and behavioral attributes that we believe successful employees at Nasdaq share.We believe that being clear and descriptive regarding our culture energizes and helps align employees, and also enables us to allow prospective employment candidates to better understand the organization they are considering joining.
We also continued to bolster our efforts to create a diverse and inclusive work environment of equal opportunity, where employees feel respected and valued for their contributions, and where Nasdaq and its employees have opportunities to make positive contributions to our local communities. See “Diversity, Equity and Inclusion” below for further discussion of these efforts.
As of December 31, 2017,2022, Nasdaq had 4,7346,377full and part-time employees, including employees of non-wholly owned consolidated subsidiaries.
15
Employee Safety
We are committed to ensuring the safety and well-being of our employees and stakeholders, and complying with local government regulations in the areas in which we operate. Our employees may work from our offices or work from home, with most of our employees continuing to utilize a hybrid work schedule of both working in an office and remotely during each week.
Talent Management and Development
We continued to increase our efforts in attracting and retaining our employees. Nasdaq seeks to hire world-class, innovative, and diverse talent across the globe.
Our internal employee engagement score, based on our biannual employee engagement surveys, increased year-over-year from 2021. Our workforce voluntary attrition rate during 2022 was approximately 11%, which was comparable to 2021.
Our Talent Attraction Team focused on strategic marketing and branding to position Nasdaq as a leading employer of choice for talent in our industry, helping to increase our pool of top candidates for open positions, particularly diverse candidates. We ran targeted attraction campaigns in our major markets using (with permission) local employee stories and photos, and partnered with diverse talent organizations, such as the National Society of Black Engineers, AfroTech, the Society of Women Engineers, Women in Technology, Grace Hopper and the Society of Hispanic Professional Engineers to help improve brand awareness of Nasdaq and attract a higher number of diverse candidates compared to 2021.
During 2022, we launched a year-long series called the Manager Forum, facilitated by our CEO and other senior and mid-career leaders, to engage managers in sustained leadership development, alongside our existing formal leadership development curriculum.
We also launched a new artificial intelligence-driven career development platform called the Career Hub that matches employees, based on their career aspirations, to internal training, potential mentors, short-term projects and full-time internal roles. This helped us increase our career satisfaction scores in our biannual employee engagement survey and supported employee retention.
We have invested in professional development for our employees, including offering access to more than 26,000 professional development programs; providing tuition assistance to employees enrolled in degree-granting academic programs; holding internal career fairs and career development programs; connecting employees to our formal mentoring programs and providing one-on-one professional coaching opportunities. We welcomed 156 interns to Nasdaq during 2022.
To reward our employees at various stages of their tenure with Nasdaq, we continued our anniversary recognition program that includes Nasdaq-branded merchandise, and, for major milestones, recognition on our Nasdaq Tower in Times Square. Additionally, our peer-to-peer employee recognition program rewards employees and highlights recognized employees on our internal social media channels, further amplifying the recognition.
Diversity, Equity and Inclusion
At Nasdaq, three pillars guide our diversity, equity and inclusion efforts: Workforce, Workplace and Marketplace. Workforce seeks to ensure thatour employee population is representative of the communities in which we operate. Workplace seeks to create a positive, equitable workplace experience for all employees of Nasdaq, and Marketplace aims to positively influence our peers in the capital market ecosystem, and to invest in our local communities in which we operate.
Nasdaq sponsors eleven employee-led internal affinity networks. These networks include more than 2,400 employee members, representing 37% of our employees and contractors. Nasdaq’s Employee Networks support the diverse communities that comprise our workforce, including Black, Asian American, Hispanic, LGBTQ+, female, disabled, veteran, and parent/caregiver communities. Nasdaq’s Employee Networks provide both formal and informal development programs and guidance for their members. The networks benefit the entire Nasdaq workforce through educational events, guest speakers, and volunteering opportunities.
Nasdaq regularly and proactively reviews and monitors diversity data across its businesses, including workforce composition, talent pipeline, and sentiment by business unit. In 2022, we offered two diversity trainings, “Conscious Inclusion” and “Inclusive Leadership,” for non-managers and managers, respectively. All of our executives completed this course, increasing understanding of diversity and equity priorities at the highest level. We also added customized developmental programs for underrepresented talent, including executive mentoring and accelerated leadership development programs. In 2022, we launched a high-potential leadership program for our female employees to enhance their skills and increase advancement opportunities.
We continue to seek to improve our diversity metrics, both through development of our internal talent pool and by focusing on interviewing diverse candidates externally for new employment opportunities. During our annual executive succession planning exercise with our Board of Directors, we realized a 26% increase, as compared to 2021, in the diversity of our senior executive succession candidates (considering gender, race and LGBTQ+ status) due to a focus by our senior executives on identifying and cultivating talent deeper in their organizations. As a signatory to the Parity Pledge, we fulfilled our commitment to interview female candidates for all externally advertised roles at the Vice President level and above.
16
Additionally, Nasdaq has been named to the Human Rights Campaign Corporate Equality Index, Coqual Black Equity Index, and several Seramount indexes, including 100 Best Companies and Best Companies for Dads. We were also named to the Bloomberg Gender Equality Index again in 2022.
Workplace Demographics
During 2022, we continued our progress to increase the diversity of our global workforce.Our global female employee base increased from 2021 and has grown each year since 2019, and in the United States, our minority employee base also grew, continuing a trend since 2019. Nasdaq has increased our underrepresented minority representation in the U.S., which includes Black/African American, Hispanic/Latino, Multiracial, Native American, Native Hawaiian, and Pacific Islander employees, from 14.9% in 2019 to 16.8% in 2022.
Gender and Ethnicity Performance Data as of December 31, 2022 and 2021
Gender:

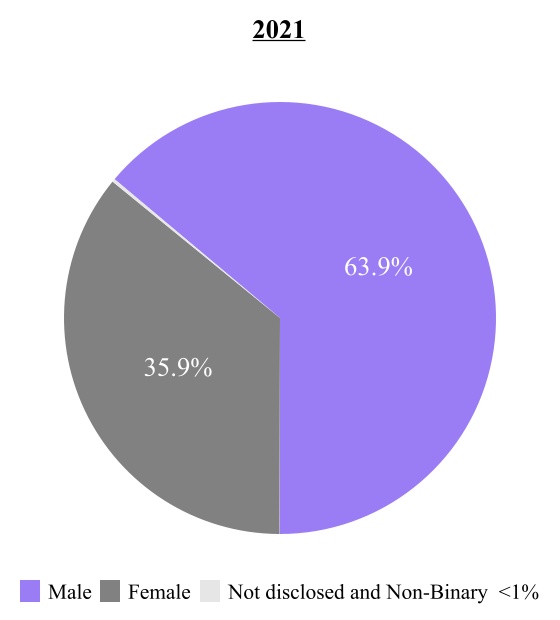

17
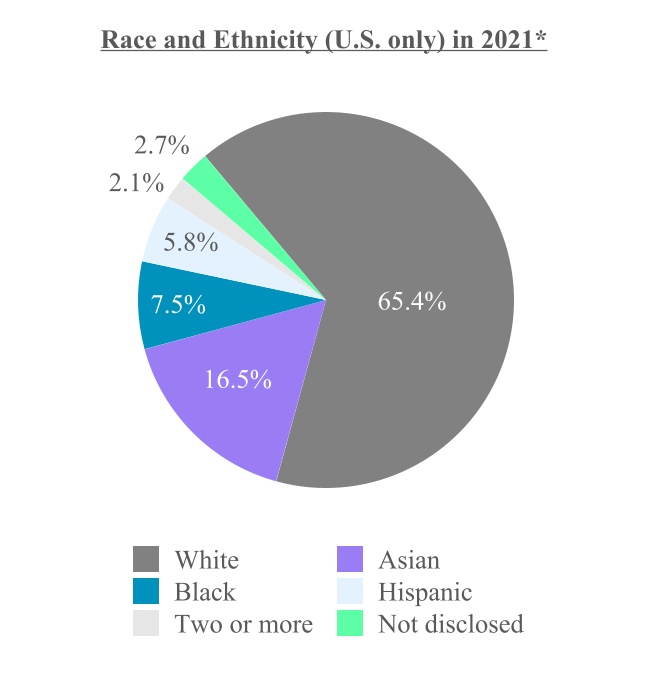
* In the charts above, not disclosed percentage includes employees that have chosen not to disclose and race and ethnicities that are less than 0.3%.
In 2022, we conducted a pay equity analysis, which supplements our annual multifaceted compensation review program, successfully concluding that review in the second quarter of the year. Our pay equity analysis for 2023 has already begun as part of the annual compensation review program to be completed in the same cycle next year.
Finally, to increase transparency of our workforce, Nasdaq publishes statistics on the composition of its own global workforce by gender, and of its U.S. workforce by gender, race and ethnicity, in our U.S. EEO-1 report and our Sustainability Report, which are available on our website.
Compensation and Benefits
Our Total Rewards compensation program is designed to attract, retain, and empower employees to successfully execute our growth strategy. Our comprehensive Total Rewards program reflects our commitment to protecting our employees’ health, well-being and financial security.
Our talented employees are our greatest asset, and we offer competitive compensation to attract and retain the best employees. Our pay-for-performance compensation programs includes market-competitive base salaries, annual bonuses or sales commissions, and equity grants.The majority of our employees are granted annual, long-term equity awards, enabling them to be owners of the company, committed to our long-term success and aligning their interests with the short-term and long-term interests of our shareholders.
Our Total Rewards program extends beyond compensation, offering a suite of programs, benefits, perquisites and resources to support employee priorities. In addition to cash and equity compensation, we also offer employee benefits such as health (medical, dental, vision and telehealth) insurance, fertility benefits, paid time off, paid parental leave, adoption assistance, an employee stock purchase plan, student loan repayment benefits, charitable contribution matching and a U.S. 401(k) plan with company matching. In response to the pandemic we introduced, and have continued to offer, additional benefits to support our employees, including caregiver support, back-up childcare, “flex days” (extra time off in addition to vacation), and hybrid work schedules, allowing our employees to focus on mental well-being.
Community Involvement
We are committed to creating lasting, positive change within our Company and the communities we serve. Our employees take pride in being active in our communities. Through our Nasdaq GoodWorks Corporate Responsibility Program, we have committed to supporting the communities in which we live and work by providing eligible full and part-time employees two paid days off per year to volunteer. We also match charitable donations of all Nasdaq employees and contractors up to $1,000, or more in certain circumstances, per calendar year.In 2022, Nasdaq employees raised over $1 million including donations and matches, supporting almost 650 charities worldwide.
Nasdaq’s “Purpose” comprises our philanthropic, community outreach, entrepreneurial support and employee volunteerism programs, all designed to leverage our unique place at the center of capital creation, markets, and technology and drive stronger economies, more equitable opportunities and contribute to a more sustainable world.
During 2022, Nasdaq held two Purpose roundtables, which convened corporate peers from companies at the forefront of these issues, sharing insights on the importance of purpose in their organization, and how it is embedded and communicated within their company and among stakeholders to drive impact.
Nasdaq also held its second annual “Purpose Week” to further champion economic progress for all, which included a series of company-wide webinars, volunteer opportunities, an innovation challenge and other events involving and recognizing company employees. In addition to those events, we launched a set of digital campaigns, accompanied by virtual conversations, spotlighting several of the Nasdaq Foundation’s community partners. These discussions explored topics such as creating a stronger investor identity for underrepresented communities and innovative approaches needed to tackle investor identity as one of the overlooked barriers to partaking in the capital markets.
18
The mission of the Nasdaq Foundation is focused on two primary goals: reimagining investor engagement to equip under-represented communities with the financial knowledge to share in the wealth that markets create; and leveraging our investment in the Nasdaq Entrepreneurial Center alongside new strategic partnerships with organizations that can help build a deeper, data-led understanding of where the challenges are greatest, what existing efforts could be amplified, and how the Nasdaq Foundation can make new and distinctive contributions.
During 2022, the Nasdaq Foundation provided 14 grants to organizations that seek to fulfill that mission. These grants were awarded to, among others, Black Girl Ventures, an ecosystem of Black/Brown woman-identifying leaders, assisting them through the early-stages of entrepreneurship; Change Labs, a community-led organization providing access to capital and resources to the next generation of Native American change makers; and Hispanic Access Foundation, which provides financial and investment training to Spanish-speaking Latinos.
Nasdaq Website and Availability of SEC Filings
We file periodic reports, proxy statements and other information with the SEC. The public may read and copy any materials we file with the SEC at the SEC’s Public Reference Room at 100 F Street, NE, Washington, DC 20549. The public may obtain information on the operation of the Public Reference Room by calling the SEC at 1-800-SEC-0330. The SEC maintains an internet sitea website that contains reports, proxy and information statements, and other information regarding issuers that file electronically with the SEC (such as us).SEC. The address of that site is http://www.sec.gov.
Our website is www.business.nasdaq.com.http://ir.nasdaq.com. Information on our website is not a part of this Form 10-K. We make available free of charge on our website, or provide a link to, our Forms 10-K, Forms 10-Q and Forms 8-K and any amendments to these documents, that are filed or furnished pursuant to Section 13(a) or 15(d) of the Exchange Act as soon as reasonably practicable after we electronically file such material with, or furnish it to, the SEC. To access these filings, go to Nasdaq’sour website and click on “Investor Relations,”“Financials” then under “Financials” click on “SEC Filings.”
Item 1A. Risk Factors.Factors
The risks and uncertainties described below are not the only ones facing us. Additional risks and uncertainties not presently known to us or that we currently believe to be immaterial may also adversely affect our business. If any of the following risks actually occur, our business, financial condition, or operating results could be adversely affected.
RISKS RELATED TO OUR BUSINESS AND INDUSTRY
Economic conditions and market factors, which are beyond our control, may adversely affect our business and financial condition.
Our business performance is impacted by a number of factors, including general economic conditions, in both the U.S. and Europe,current or expected inflation, interest rate fluctuations, market volatility, changes in investment patterns and priorities, pandemics (such as COVID-19) and other factors that are generally beyond our control. To the extent that global or national economic conditions weaken and result in slower growth or recessions, our business is likely tomay be negatively impacted. Adverse market conditions could reduce customer demand for our services and the ability of our customers, lenders and other counterparties to meet their obligations to us. Poor economic conditions may result in a reduction in the demand for our products and services, including our market technology, FRAML solutions, data, indexes and corporate solutions, or could result in a decline in the number of IPOs, reduced trading volumes or values and deterioration of the economic welfare of our listed companies, and a reductionwhich could cause an increase in the demand for our products, including our data, index, corporate solutions and market technology products. delistings.
Trading volumes and values are driven primarily by general market conditions and declines in trading volumes or values may affect our market share and impact our pricing. In addition, our Market ServicesPlatforms businesses receive revenues from a relatively small number of customers concentrated in the financial industry, so any event that impacts one or more customers or the financial industry in general could impact our revenues.
The number of listings on our markets is primarily influenced by factors such as investor demand, the global economy, available sources of financing, and tax and regulatory policies. Adverse conditions may jeopardize the ability of our listed companies to comply with the continued listing requirements of our exchanges.exchanges, or reduce the number of issuers launching IPOs, including SPACs, and direct listings. The number of IPOs on our exchanges decreased in 2022 and the number of delistings increased compared to 2021.
19
There may be less demand for our Corporate Solutions or Market Technologycorporate solutions, market technology and FRAML products and services if global economic conditions areremain weak. Our customers historically cut back onreduce purchases of new services and technology when growth rates decline, thereby reducingdiminishing our opportunities to sell new products and services or upgrade existing products and services.
Additionally, during a global economic downturn, or periods of economic, political or regulatory uncertainty, our sales cycle may become longer or more unpredictable due to customer budget constraints or unplanned administrative delays to approve purchases
A reduction in trading volumes or values, market share of trading, the number of our listed companies, or demand for
We face significant competition in our Market Platforms, Capital Access Platforms and Anti-Financial Crime businesses from other market participants. We face intense competition from other exchanges and markets for market share of trading activity and listings. In addition, our Data Products, Index Licensing and Services, Corporate Solutions and Market Technology businesses face significant competition from other market participants. This competition includes both product and price competition. Increased competition may result in a decline in our share of trading activity, listings and demand for the products we offer, thereby adversely affecting our operating results.
The liberalization and globalization of world markets has resulted in greater mobility of capital, greater international participation in local markets and more competition. As a result, both in the U.S. and in other countries, the competition among exchanges and other execution venues has become more intense. Marketplaces in both Europe and the U.S. have also merged to achieve greater economies of scale and scope.
Regulatory changes also have facilitated the entry of new participants in the European Union that compete with our European markets. The regulatory environment, both in the U.S. and in Europe, is structured to maintain this environment of intense competition. In addition, a high proportion of business in the securities markets is becoming concentrated in a smaller number of institutions and our revenue may therefore become concentrated in a smaller number of customers.
We also compete globally with other regulated exchanges and markets, ATSs, MTFs and other traditional and non-traditional execution venues. Some of these competitors also are our customers. In addition, competitors recently have launched new exchanges in the U.S., including an exchange established by a group of our customers. Competitors may develop market trading platforms that are more competitive than ours. Competitors may leverage data more effectively or enter into strategic partnerships, mergers or acquisitions that could make their trading, listings, clearing, data or technology businesses more competitive than ours.
We face intense price competition in all areas of our business. In particular, the trading industry is characterized by intense price competition. We have in the past lowered prices, and in the U.S., increased rebates for trade executions to attempt to gain or maintain market share. These strategies have not always been successful and have at times hurt operating performance. Additionally, we have also been, and may once again be, required to adjust pricing to respond to actions by competitors and new entrants, or due to new SEC regulations, which could adversely impact operating results. We are also subject to potential price competition from new competitors and from new and existing competitors. We also compete with
respect to the pricing of data products and with respect to products for pre-trade book data and for post-trade last sale data. In the future, our competitors may offer rebates for quotes and trades on their systems. In addition, pricing in our Corporate Services, Index Licensing and Services and Market Technology businesses is subject to competitive pressures.
If we are unable to compete successfully in respect to the pricing of our services and products,industries in which we do business, our business, financial condition and operating results maywill be adversely affected.
System limitations or failurescould harm our business.
Our businesses depend on the integrity and performance of the technology, computer and communications systems supporting them. If new systems fail to operate as intended or our existing systems cannot expand to cope with increased demand or otherwise fail to perform, we could experience unanticipated disruptions in service, slower response times and delays in the introduction of new products and services. We could experience a systems failure due to human error by our employees, contractors or vendors, electrical or telecommunications failures or disruptions, hardware or software failures or defects, cyberattacks, sabotage or similar unexpected events. These consequences could result in service outages, lower trading volumes or values, financial losses, decreased customer satisfaction, litigation and regulatory sanctions. Our markets and the markets that rely on our technology have experienced systems failures and delays in the past and could experience future systems failures and delays.
Although we currently maintain and expect to maintain multiple computer facilities, and leverage third party cloud providers, that are designed to provide redundancy and back-up to reduce the risk of system disruptions and have facilities in place that are expected to maintain service during a system disruption, such systems and facilities may prove inadequate. If trading volumes increase unexpectedly or other unanticipated events occur, we may need to expand and upgrade our technology, transaction processing systems and network infrastructure. We do not know whether we will be able to accurately project the rate, timing or cost of any volume increases, or expand and upgrade our systems and infrastructure to accommodate any increases in a timely manner.
20
While we have programs in place to identify and minimize our exposure to vulnerabilities and work in collaboration with the technology industry to share corrective measures with our business partners, we cannot guarantee that such events will not occur in the future. Any system issue that causes an interruption in services, decreases the responsiveness of our services or otherwise affects our services could impair our reputation, damage our brand name and negatively impact our business, financial condition and operating results.
We must continue to introduce new products, initiatives and enhancements to maintain our competitive position.
We intend to launch new products and initiatives and continue to explore and pursue opportunities to strengthen our business and grow our company. We may spend substantial time and money developing new products, such as our digital assets offering, initiatives and initiatives.enhancements to existing products. If these products and initiatives are not successful or their launches are delayed, including for regulatory uncertainty related to our digital assets offering, we may not be able to offset their costs, which could have an adverse effect on our business, financial condition and operating results.
In our technology operations, we have invested substantial amounts in the development of system platforms, the rollout of
our platforms and the adoption of new technologies, such as blockchain, machine intelligence and the cloud.including cloud-based infrastructure for certain of our offerings. Although investments are carefully planned, there can be no assurance that the demand for such platforms or technologies will justify the related investments. If we fail to generate adequate revenue from planned system platforms or the adoption of new technologies, or if we fail to do so within the envisioned timeframe, it could have an adverse effect on our results of operations and financial condition. In addition, clients may delay purchases in anticipation of new products or enhancements. We may allocate significant amounts of cash and other resources to product technologies or business models for which market demand is lower than anticipated. In addition, the introduction of new products by competitors, the emergence of new industry standards or the development of entirely new technologies to replace existing product offerings could render our existing or future products obsolete.
A decline in trading and clearing volumes or values or market share will decrease our trading and clearing revenues.
Trading and clearing volumes and values are directly affected by economic, political and market conditions, broad trends in business and finance, unforeseen market closures or other disruptions in trading, the level and volatility of interest rates, inflation, changes in price levels of securities and the overall level of investor confidence. In recent years,Beginning in 2020, trading and clearing volumes and values across our markets have fluctuated significantly depending on market conditions and other factors beyond our control. Current initiatives being considered by regulators and governments could have a material adverse effect on overall trading and clearing volumes or values. Because a significant percentage of our revenues is tied directly to the volume or
value of securities traded and cleared on our markets, it is likely that a general decline in trading and clearing volumes or values would lower revenues and may adversely affect our operating results if we are unable to offset falling volumes or values through pricing changes. Declines in trading and clearing volumes or values may also impact our market share or pricing structures and adversely affect our business and financial condition.
If our total market share in securities decreases relative to our competitors, our venues may be viewed as less attractive sources of liquidity. If our exchanges are perceived to be less liquid, then our business, financial condition and operating results could be adversely affected.
Since some of our exchanges offer clearing services in addition to trading services, a decline in market share of trading could lead to a decline in clearing and depository revenues. Declines in market share also could result in issuers viewing the value of a listing on our exchanges as less attractive, thereby adversely affecting our listing business. Finally, declines in market share of Nasdaq-listed securities, or recently adopted SEC rules and regulations, could lower The Nasdaq Stock Market’s share of tape pool revenues under the consolidated data plans, thereby reducing the revenues of our Data ProductsU.S. Tape plans business.
Our role in the global marketplace may placepositions us at greater risk for a cyberattack.
Our systems and operations are vulnerable to damage or interruption from security breaches. As a result of our adoption of a hybrid work environment, we have a broader and more distributed network footprint and increased reliance on the home networks of employees, and such remote work may cause heightened cybersecurity and operational risks. Some of these threats include attacks from foreign governments, hacktivists, insiders and criminal organizations. Foreign governments may seek to obtain a foothold in U.S. critical infrastructure, hacktivists may
seek to deploy denial of service attacks to bring attention to their cause, insiders may pose a risk byof human error or malicious activity and criminal organizations may seek to profit from stolen data. Computer malware, such as viruses and worms, also continue to be a threat with ransomware increasingly being used by criminals to extort money. Given our position in the global securities industry, we may be more likely than other companies to be a direct target, or an indirect casualty, of such events.
While we continue to employ and invest additional resources to monitor our systems and protect our infrastructure, these measures may prove insufficient depending upon the attack or threat posed. Any system issue, whether as a result of an intentional breach, collateral damage from a new virus or a non-malicious act, or due to a cybersecurity breach of a customer that results in a loss of our data or compromises our systems or those of our other customers utilizing the same products, could damage our reputation and cause us to lose customers, experienceresult in: a loss of customers; disrupted customer relationships; the loss of our intellectual property or sensitive data; lower trading volumes
21
or values, incur significant liabilities or otherwise have a negative impact on our business, our products and services, financial condition and operating results. AnyFurther, cybersecurity incidents that impact our vendors and other third parties that support our organization and industry could directly or indirectly impact us. There can be no assurance we will be able to identify and mitigate every incident involving cybersecurity attacks, breaches or incidents. A system breach may go undetected for an extended period of time. We also
Expanded cybersecurity regulations, and increased cybersecurity infrastructure and compliance costs, may adversely impact our results of operations.
As cybersecurity threats continue to increase in frequency and sophistication, and as the domestic and international regulatory and compliance structure related to information and cybersecurity; data privacy and data usage; and our digital assets offering, becomes increasingly complex and exacting, we may be required to devote significant additional resources to strengthen our cybersecurity capabilities, and to identify and remediate any security vulnerabilities. Compliance with laws and regulations concerning cybersecurity, data privacy and data usage could incurresult in significant expense, and any failure to comply could result in addressing any of these problemsproceedings against us by regulatory authorities or other third parties. Additional costs for bolstering cybersecurity capabilities, and increased cybersecurity and data privacy compliance costs, could adversely impact our business, financial condition and operating results. Additionally, our clients increasingly demand rigorous contractual, certification and audit provisions regarding cybersecurity, data protection and data usage, which may also increase our overall compliance burden and costs in addressing related data security and privacy concerns.meeting such obligations.
The success of our business depends on our ability to keep up with rapid technological and other competitive changes affecting our industry. Specifically, we must complete development of, successfully implement and maintain platforms that have the functionality, performance, capacity, reliability and speed required by our business and our regulators, as well as by our customers.
The markets in which we compete are characterized by rapidly changing technology, evolving industry and regulatory standards, frequent enhancements to existing products and services, the adoption of new services and products and changing customer demands. We are reliant on our customers that purchase our on-premise solutions to maintain a certain level of network infrastructure for our products to operate and to allow for our support of those products, and there is no assurance that a customer will implement such measures. We may not be able to keep up with rapid technological and other competitive changes affecting our industry. For example, we must continue to enhance our platforms to remain competitive as well as to address our regulatory responsibilities, and our business will be negatively affected if our platforms or the technology solutions we sell to our customers fail to function as
expected. If we are unable to develop our platforms to include other products and markets, or if our platforms do not have the required functionality, performance, capacity, reliability and speed required by our business and our regulators, as well as by our customers, we may not be able to compete successfully. Further, our failure to anticipate or respond adequately to changes in technology and customer preferences or any significant delays in product development efforts, could have a material adverse effect on our business, financial condition and operating results.
Failure to attract and retain key personnel may adversely affect our ability to conduct our business.
Our future success depends, in large part, upon our ability to attract and retain highly qualified and skilled professional personnel that can learn and embrace new technologies. In the current tight labor market, we have intensified our efforts to recruit and retain talent. Competition for key personnel in the various localities and business segments in which we operate is intense. We have, and may continue to, experience higher compensation costs to retain personnel, and hire new talent, that may not be offset by improved productivity, higher revenues or increased sales. Our ability to attract and retain key personnel, in particular senior officers or technology personnel, including from companies that we acquire, will be dependent on a number of factors, including prevailing market conditions, office/remote working arrangements and compensation and benefit packages offered by companies competing for the same talent. There is no guarantee that we will have the continued service of key employees who we rely upon to execute our business strategy and identify and pursue strategic opportunities and initiatives. In particular, we may have to incur costs to replace senior officers or other key employees who leave, and our ability to execute our business strategy could be impaired if we are unable to replace such persons in a timely manner or at all.
Our clearinghouse operations expose us to risks, including credit or liquidity risks that may include defaults by clearing members, or insufficiencies in margins or default funds.
We are subject to risks relating to our operation of a clearinghouse, including counterparty and liquidity risks, risk of defaults by clearing members and risks associated with adequacy of the customer margin and of default funds. Our clearinghouse operations expose us to counterparties with differing risk profiles. We may be adversely impacted by the financial distress or failure of a clearing member, which may cause us negative financial impact, reputational harm or regulatory consequences, including litigation or regulatory enforcement actions.
In September 2018, a member of the Nasdaq Clearing commodities market defaulted due to an inability to post sufficient collateral to cover increased margin requirements for the positions of the relevant member. For further discussion of the default, see Note 15, “Clearing Operations,” to the consolidated financial statements. There are no assurances that similar defaults will not occur again, which
22
could result in losses. To the extent that our regulatory capital and risk management policies are not adequate to manage future financial and operational risks in our clearinghouse, we may experience adverse consequences to our operating results or ability to conduct our business.
We are exposed to credit risk from third parties, including customers, counterparties and clearing agents.
We are exposed to credit risk from third parties, including customers, counterparties and clearing agents. These parties may default on their obligations to us due to bankruptcy, lack of liquidity, operational failure or other reasons.
We clear a range of equity-related and fixed-income-related derivative products, commodities and resale and repurchase agreements. We assume the counterparty risk for all transactions that are cleared through Nasdaq Clearing on our markets and guarantee that our cleared contracts will be honored. We enforce minimum financial and operational criteria for membership eligibility, require members and investors to provide collateral, and maintain established risk policies and procedures to ensure that the counterparty risks are properly monitored and proactively managed; however, none of these measures provides absolute assurance against experiencing financial losses from defaults by our counterparties on their obligations. No guarantee can be given that the collateral provided will at all times be sufficient. Although we maintain clearing capital resources to serve as an additional layer of protection to help ensure that we are able to meet our obligations, these resources also may not be sufficient.
We also have credit risk related to transaction and subscription-based revenues that are billed to customers on a monthly or quarterly basis, in arrears.
Credit losses such as those described above could adversely affect our consolidated financial position and results of operations.
Technology issues relating to our role as exclusive processor for Nasdaq-listed stocks could affect our business.
Nasdaq, as technology provider to the UTP Operating Committee, has implemented measures to enhance the resiliency of the existing processor system. Nasdaq transferred the processor technology platform to our INET platform and this migration further enhanced the resiliency of the processor systems. We further improved the systems' resiliency by adding the UTP SnapShot service. However, if future outages occur or the processor systems fail to function properly while we are operating the systems, it could have an adverse effect on our business, reputation and financial condition.
Stagnation or decline in the listings market could have an adverse effect on our revenues.
The market for listings is dependent on the prosperity of companies and the availability of risk capital. A stagnation or decline in the number of new listings, or an increase in the number of delistings, on The Nasdaq Stock Market and the Nasdaq Nordic and Nasdaq Baltic exchanges could cause a decrease in revenues for future years. Furthermore, new listings from IPOs, including SPACs, decreased in 2022. A prolonged decrease in the number of listings, or failure of existing SPACs to successfully complete transactions with target companies and dissolve, could negatively impact the growth of our revenues. Our Corporate Solutions business is also impacted by declines in the listings market or increases in acquisitions activity as there may be fewer publicly-traded customers that need our products.
RISKS RELATED TO TRANSACTIONAL ACTIVITIES AND STRATEGIC RELATIONSHIPS
We may not be able to successfully integrate acquired businesses, which may result in an inability to realize the anticipated benefits of our acquisitions.
We must rationalize, coordinate and integrate the operations of our acquired businesses, including eVestment and Sybenetix.businesses. This process involves complex technological, operational and
personnel-related challenges, which are time-consuming and expensive and may disrupt our business. The difficulties, costs and delays that could be encountered may include:
•difficulties, costs or complications in combining the companies’ operations, including technology platforms, which could lead to us not achieving the synergies we anticipate or customers not renewing their contracts with us as we migrate platforms;
•incompatibility of systems and operating methods;
•reliance on, or provision of, transition services;
•inability to use capital assets efficiently to develop the business of the combined company;
•difficulties of complying with government-imposed regulations in the U.S. and abroad, which may be conflicting;
•resolving possible inconsistencies in standards, controls, procedures and policies, business cultures and compensation structures;
•the diversion of management’s attention from ongoing business concerns and other strategic opportunities;
•difficulties in operating businesses we have not operated before;
•difficulties of integrating multiple acquired businesses simultaneously;
•the retention of key employees and management;
23
•the implementation of disclosure controls, internal controls and financial reporting systems at non-U.S. subsidiaries to enable us to comply with U.S. GAAP and U.S. securities laws and regulations, including the Sarbanes OxleySarbanes-Oxley Act of 2002, required as a result of our status as a reporting company under the Exchange Act;
•the coordination of geographically separate organizations;
•the coordination and consolidation of ongoing and future research and development efforts;
•possible tax costs or inefficiencies associated with integrating the operations of a combined company;
•pre-tax restructuring and revenue investment costs;
•the retention of strategic partners and attracting new strategic partners; and
•negative impacts on employee morale and performance as a result of job changes and reassignments.
Foreign acquisitions involve risks in addition to those mentioned above, including those related to integration of operations across different cultures and languages, our ability to enforce contracts in various jurisdictions, currency risks and the particular economic, political and regulatory risks associated with specific countries. We may not be able to address these risks successfully, or at all, without incurring significant costs, delays or other operating problems that could disrupt our business and have a material adverse effect on our financial condition.
For these reasons, we may not achieve the anticipated financial and strategic benefits from our acquisitions and strategic initiatives. Any actual cost savings and synergies may be lower than we expect and may take a longer time to achieve than we anticipate, and we may fail to realize the anticipated benefits of acquisitions.
We rely on third parties to perform certain functions, and our business could be adversely affected if these third parties fail to perform as expected or experience service interruptions affecting our operations.
We rely on third parties for regulatory, data center, cloud, data storage and processing, data content, clearing and other services. Interruptions or delays in services from our third-party data center hosting facilities or cloud computing platform providers could impair the delivery of our services and harm our business. To the extent that any of our vendors or other third-party service providers experiences difficulties or a significant disruption, breach or outage, materially changes their business relationship with us or is unable for any reason to perform their obligations, our business or our reputation may be materially adversely affected.Our access to cloud service provider infrastructure could be limited by a number of events, including technical or infrastructure failures, natural disasters or cybersecurity attacks. As we continue to grow our SaaS businesses, our dependency on the continuing operation and availability of these cloud service providers increases. If our cloud services from third party
providers are unavailable to us for any reason, or there are cloud service disruptions or a delay or inability to access our exchanges, platforms or certain of our cloud products or features, such unavailability or delays may adversely affect our clients, which could significantly impact our reputation, operations, business, and financial results.
For example, in 2022, we began to migrate our North American markets to AWS in a phased approach, starting with Nasdaq MRX in December 2022. AWS operates a platform that we use to provide services to our clients, and therefore we are vulnerable to service outages on the AWS platform that affect Nasdaq workloads running or stored in the AWS environment. If AWS does not deliver our system requirements on time, fails to provide maintenance and support to our specifications or a migration experiences integration challenges, the successful migration of our exchanges to the AWS cloud platform may be significantly delayed, which may adversely affect our reputation and financial results.
We also rely on members of our trading community to maintain markets and add liquidity. To the extent that any of our largest members experience difficulties, materially change their business relationship with us or are unable for any reason to perform market making activities, our business or our reputation may be materially adversely affected.
We may be required to recognize impairments of our goodwill, intangible assets or other long-lived assets in the future.
Our business acquisitions typically result in the recording of goodwill and intangible assets, and the recorded values of those assets may become impaired in the future. As of December 31, 2022, goodwill totaled $8.1 billion and intangible assets, net of accumulated amortization, totaled $2.6 billion. The determination of the value of such goodwill and intangible assets requires management to make estimates and assumptions that affect our consolidated financial statements.
We assess goodwill and intangible assets, as well as other long-lived assets, including equity method investments, equity securities, and property and equipment, for potential impairment on an annual basis or more frequently if indicators of impairment arise. We estimate the fair value of such assets by assessing many factors, including historical performance and projected cash flows. Considerable management judgment is necessary to project future cash flows and evaluate the impact of expected operating and macroeconomic changes on these cash flows. The estimates and assumptions we use are consistent with our internal planning process. However, there are inherent uncertainties in these estimates.
There were no impairment charges recorded relating to goodwill and indefinite-lived intangible assets and there were no material impairment charges recorded relating to other long-lived assets in 2022, 2021 and 2020.
We will needmay experience future events that may result in asset impairments. Future disruptions to invest in our operations to maintain and grow our business, andprolonged economic weakness, due to integrate acquisitions, and wepandemics or otherwise, or significant declines in operating results at any of our reporting units or businesses, may need additional funds, which may not be readily available.
Acquisitions, divestments, investments, joint ventures and other transactional activities may require significant resources and/or result in significant unanticipated losses, costs or liabilities.
Over the past several years, acquisitions have been significant factors in our growth. We have divested businesses and may continue to divest additional businesses or assets in the future. Although we cannot predict our transactional activities, we believe that additional acquisitions, divestments, investments, joint ventures and other transactional activities will be important to our strategy. Such transactions may be material in size and scope. Other potential purchasers of assets in our industry may have greater financial resources than we have. Therefore, we cannot be sure that we will be able to complete future transactions on terms favorable to us.
We also invest in early-stage companies through our Nasdaq Ventures program and hold minority interests in other entities. Given the size of these investments, we do not have operational control of these entities and may have limited visibility into risk management practices. Thus, we may be subject to additional capital requirements in certain circumstances and financial and reputational risks if there are operational failures.
We may finance future transactions by issuing additional equity and/or debt. The issuance of additional equity in connection with any such transaction could be substantially dilutive to existing shareholders. In addition, the announcement or implementation of future transactions by us or others could have a material effect on the price of our common stock. The issuance of additional debt could increase our leverage substantially. We could face financial risks associated with incurring additional debt, particularly if the debt results in significant incremental leverage. Additional debt may reduce our liquidity, curtail our access to financing markets, impact our standing with credit rating agencies and increase the cash flow required for debt service. Any incremental debt incurred to finance a transaction could also place significant constraints on the operation of our business.
Furthermore, any future transactions could entail a number of additional risks, including:
•the inability to maintain key pre-transaction business relationships;
•increased operating costs;
•the inability to meet our target for return on invested capital;
•increased debt obligations, which may adversely affect our targeted debt ratios;
•risks to the continued achievement of our strategic direction;
•risks associated with divesting employees, customers or vendors when divesting businesses or assets;
•declines in the value of investments;
•exposure to unanticipated liabilities, including after a transaction is completed;
•incurred but unreported claims for an impactacquired company;
•difficulties in realizing projected efficiencies, synergies and cost savings; and
•changes in our credit rating and financing costs.
Charges to earnings resulting from acquisitions, integrations and restructuring costs may materially adversely affect the market value of our common stock.
In accordance with U.S. GAAP, we account for the completion of our acquisitions using the acquisition method of accounting. We allocate the total estimated purchase price to net tangible and identifiable intangible assets based on their fair values as of the date of completion of the acquisition and record the excess of the purchase price over those fair values as goodwill. Our financial results, including earnings per share, could be adversely affected by a number of financial adjustments including the following:
•we may incur additional amortization expense over the estimated useful lives of certain of the intangible assets acquired in connection with acquisitions during such estimated useful lives;
•we may have additional depreciation expense as a result of recording acquired tangible assets at fair value, in accordance with U.S. GAAP, as compared to book value as recorded;
•to the extent the value of goodwill or intangible assets becomes impaired, we may be required to incur material charges relating to the impairment of those assets;
•we may incur additional costs from integrating our acquisitions. The success of our acquisitions depends, in part, on our ability to refinance debt, maintainintegrate these businesses into our credit rating, meet our regulatory capital requirements, engage in strategic initiatives, make acquisitions or strategic investments in other companies, pay dividends, repurchase our stock or react to changing economicexisting operations and business conditions. If we are unable to fund our capital or credit requirements, it could have an adverse effect on our business, financial conditionrealize anticipated cost savings, revenue synergies and operating results.growth opportunities; and
25
RISKS RELATED TO LEGAL AND REGULATORY MATTERS
We operate in a highly regulated industry and may be subject to censures, fines and enforcement proceedings if we fail to comply with regulatory obligations that can be ambiguous and can change unexpectedly.
We operate in a highly regulated industry and are subject to extensive regulation in the U.S., Europe and Canada. The securities trading industry is subject to significant regulatory oversight and could be subject to increased governmental and public scrutiny in the future that can change in response to global conditions and events.events, or due to changes in trading patterns, such as due to the recent volatility involving the trading of certain stocks.
Our ability to comply with complex and changing regulation is largely dependent on our establishment and maintenance of compliance, audit and reporting systems that can quickly adapt and respond, as well as our ability to attract and retain qualified compliance and other risk management personnel. While we have policies and procedures to identify, monitor and manage our risks and regulatory obligations, we cannot assure youThere is no assurance that our policies and procedures will always be effective or that we
will always be successful in monitoring or evaluating the risks to which we are or may be exposed.
Our regulated markets are subject to audits, investigations, administrative proceedings and enforcement actions relating to compliance with applicable rules and regulations. Regulators have broad powers to impose fines, penalties or censure, issue cease-and-desist orders, prohibit operations, revoke licenses or registrations and impose other sanctions on our exchanges, broker-dealers, central securities depositories, clearinghouse and markets for violations of applicable requirements.
In the future, we could be subject to SEC or other regulatory investigations or enforcement proceedings that could result in substantial sanctions, including revocation of our operating licenses. Any such investigations or proceedings, whether successful or unsuccessful, could result in substantial costs, the diversion of resources, including management time, and potential harm to our reputation, which could have a material adverse effect on our business, results of operations or financial condition. In addition, our exchanges could be required to modify or restructure their regulatory functions in response to any changes in the regulatory environment, or they may be required to rely on third parties to perform regulatory and oversight functions, each of which may require us to incur substantial expenses and may harm our reputation if our regulatory services are deemed inadequate.
The regulatory framework under which we operate and new regulatory requirements or new interpretations of existing regulatory requirements could require substantial time and resources for compliance, which could make it difficult and costly for us to operate our business.
Under current U.S. federal securities laws, changes in the rules and operations of our securities markets, including our pricing structure, must be reviewed and in many cases
explicitly approved by the SEC. The SEC may approve, disapprove, or recommend changes to proposals that we submit. In addition, the SEC may delay either the approval process or the initiation of the public comment process. In addition, favorableFavorable SEC rulings and interpretations can be challenged in and reversed by federal courts of appeals, reducing or eliminating the value of such prior interpretations. Any delay in approving changes, or the altering of any proposed change, could have an adverse effect on our business, financial condition and operating results.
We must compete not only with ATSs that are not subject to the same SEC approval process but also with other exchanges that may have lower regulation and surveillance costs than us. There is a risk that trading will shift to exchanges that charge lower
fees because, among other reasons, they spend significantly less on regulation.
In 2016, the SEC approved a plan for Nasdaq and other exchanges to establish a market-wide consolidated audit trail (CAT)CAT, to improve regulators’ ability to monitor trading activity. In addition to increased regulatory obligations, implementation of a consolidated audit trail could resulthas resulted in significant additional expenditures, including to implement anythe new technology to meet any of the plan’s requirements. Creating the CAT has required the development and implementation of complex and costly technology. This development effort has been funded by the SROs (including Nasdaq) in exchange for promissory notes that Nasdaq expects to be repaid at such time that the SEC approves the assessment of fees for the funding of the CAT. The SEC could determine not to approve the assessment of such fees in which case some or all of the promissory notes would not be repaid. As of December 31, 2022, we have accrued a net receivable of $85 million in connection with our portion of expenses related to the CAT implementation. In addition, the ongoing failure to timely launch or properly operate such technology exposes Nasdaq and other exchanges to SEC fines.
In addition, our registered broker-dealer subsidiaries are subject to regulation by the SEC, FINRA and other SROs. These subsidiaries are subject to regulatory requirements intended to ensure their general financial soundness and liquidity, which require that they comply with certain minimum capital requirements. The SEC and FINRA impose rules that require notification when a broker-dealer’s net capital falls below certain predefined criteria, dictate the ratio of debt to equity in the regulatory capital composition of a broker-dealer and constrain the ability of a broker-dealer to expand its business under certain circumstances. Additionally, the SEC’s Uniform Net Capital Rule and FINRA rules impose certain requirements that may have the effect of prohibiting a broker-dealer from distributing or withdrawing capital and requiring prior notice to the SEC and FINRA for certain withdrawals of capital. Any failure to comply with these broker-dealer regulations could have a material adverse effect on the operation of our business, financial condition and operating results.
26
Our non-U.S. business is subject to regulatory oversight in all the countries in which we operate regulated businesses, such as exchanges, clearinghouses or central securities depositories. In these countries, we have received authorization from the relevant authorities to conduct our regulated business activities. The authorities may issue regulatory fines or may ultimately revoke this authorizationour authorizations if we do not suitably carry out our regulated business activities. The authorities are also entitled to request that we adopt measures in order to ensure that we continue to fulfill the authorities’ requirements. Additionally, we are subject to the obligations under the Benchmark Regulation ((EU) 2016/1011), compliance with which could be costly or cause a change in our business practices.
Regulatory changes and changes in market structure and proprietary data could have a material adverse effect on our business.
Regulatory changes adopted by the SEC or other regulators of our markets, and regulatory changes that our markets may adopt in fulfillment of their regulatory obligations, could materially affect our business operations. In recent years, there has been increased regulatory and governmental focus on issues affecting the securities markets, including market structure, technological oversight and technological oversight.fees for proprietary market data, connectivity and transactions. The SEC, FINRA and the national
securities exchanges have introduced several initiatives to ensure the oversight, integrity and resilience of markets. In December 2022, the SEC proposed significant rule changes that, if adopted in their current form, would substantially alter how stocks are traded in the United States. While we and other market participants have the opportunity to submit comments on the proposal, and we will adjust our business model in accordance with any new SEC regulations implemented, these changes regarding trading may negatively impact our business and revenue.
If the rules themselves could also affect our operations in Europe. In addition, actions on anyremaining aspects of the specificorder and rule are ultimately implemented as set forth in their adopting releases, demand for certain of our proprietary tape share data products may be reduced, or we may have to reduce our pricing to compete with other entrants into the market for consolidated data. Our opponents in some markets are larger and better funded and, if successful in influencing certain policies, may successfully advocate for positions that adversely impact our business. These regulatory issues currently under review in the U.S. and Europe could have a material impact on our business.
In Canada, all new marketplace fees and changes to existing fees, including trading and market data fees, must be filed with and approved by the Ontario Securities Commission. In 2016, theThe Canadian Securities Administrators approved amendments adoptingadopted a Data Fees Methodology that restricts the total amount of fees that can be charged for professional uses by all marketplaces to a reference level that is not yet defined. When a reference is established,benchmark. Currently, all marketplaces will beare subject to annual reviews of their market data fees tying market data revenues to pre- and post- trade market share.share metrics. Permitted fee ranges are based on an interim domestic benchmark that is subject to change to an international benchmark, which could lower the permitted fees charged by marketplaces, which could adversely impact our revenues.
Our European exchanges currently offer market data products to customers on a non-discriminatory and reasonable commercial basis. The new MiFID II/MiFIR rules entail that the price for regulated market data such as pre- and post-trade data shall be based
on cost plus a reasonable margin. However, what constitutes “reasonable margin” isthese terms are not clearly defined. There is a risk that a different interpretation of this termthese terms may influence the fees for European market data products adversely. In addition, any future actions by the European Commission or European court decisionsUnion institutions could affect our ability to offer market data products in the same manner as today, thereby causing an adverse effect on our Data Productsmarket data revenues.
Many aspects of our business potentially involve substantial liability risks. Although under current law we are immune from private suits arising from conduct within our regulatory authority and from acts and forbearances incident to the exercise of our regulatory authority, this immunity only covers certain of our activities in the U.S., and we could be exposed to liability under national and local laws, court decisions and rules and regulations promulgated by regulatory agencies.
27
We face risks related to compliance with economic sanctions (including those administered by the U.S. Office of Foreign Assets Control), export controls, corruption (including the U.S. Foreign Corrupt Practices Act) and money laundering. While we maintain compliance programs to prevent and detect potential violations, such programs cannot completely eliminate the risk of error, whichnon-compliance. Because anti-financial crime management solutions comprises one of our primary business offerings, a significant compliance event involving one of these areas could more negatively impact our business than a comparable business without this service offering.
Liability could also result from disputes over the terms of a trade, claims that a system failure or delay cost a customer money, claims we entered into an unauthorized transaction or claims that we provided materially false or misleading statements in connection with a securities transaction. As we intend to defend any such litigation actively, significant legal expenses could be incurred. Although we carry insurance that may resultlimit our risk of damages in some cases, we still may sustain uncovered losses or losses in excess of available insurance that would affect our business, financial loss or reputational damage.condition and results of operations.
We have instituted extensive controlsself-regulatory obligations and also operate for-profit businesses, and these two roles may create conflicts of interest.
We have obligations to reduce the risk of error inherent in our operations; however, such risk cannot completely be eliminated.
prompt SEC scrutiny and liability for damages, thereby adversely affectingaffect our business and financial results.reputation.
Our Nordic and Baltic exchanges monitor trading and compliance with listing standards in accordance with the European Union’s Market Abuse Regulation and other applicable laws. Any failure to diligently and fairly regulate the Nordic and Baltic exchanges could significantly harm our reputation, prompt scrutiny from regulators and adversely affect our business and reputation.
Laws and regulations regarding security and safeguarding of our systems and services, protection of sensitive customer data and the handling of personal data and information may affect our services or result in increased costs, legal claims or fines against us.
Our business reliesoperates certain systems that may be considered “critical infrastructure” under certain regulations and licenses or sells certain systems or services to customers that are used by customers to fulfill certain core business requirements or process certain sensitive data. In response to recent events involving cybersecurity breaches, including ransomware
attacks, regulatory authorities are engaging in rulemaking to heighten cybersecurity requirements and obligations to notify authorities and/or take other action in response to a suspected incident. Such regulations may impact the requirements and cost of delivery for impacted systems and services and, in the event of an incident, increase the cost and complexity of our response and the potential financial and reputation impact from fines or private litigation. New regulations may also impact customer decision making and conditions on contracting for our services.
Our businesses and internal operations rely on the processing of data in many jurisdictions and the movement of data, including personal data, across national borders. Legal and contractual requirements relating to the processing, including, but not limited to, collection, storage, handling, use, disclosure, transfer and security, of personal data continue to evolve;evolve and regulatory scrutiny and customer requirements in this area isare increasing around the world. Significant uncertainty exists as privacy and data protection laws may be interpreted and applied differently across jurisdictions and may create inconsistent or conflicting requirements.requirements with privacy and other laws to which we are subject.
In addition to directly applying to certain Nasdaq business activities, we expect that this regulation maythese laws and industry-specific regulations, such as the Health Insurance Portability and Accountability Act (HIPAA) and the Gramm Leach Bliley Act, impact many of our customers, which may affect their requirementsdecisions to purchase our services. Under certain laws and decisions relatedregulations, as a supplier to services thatsuch customers, regulators may engage in direct enforcement actions or seek to impose liability on Nasdaq if we offer. Although we have a program underway to address GDPR requirements, ourdo not comply with them. Our efforts to comply with GDPR and other privacy and data protection laws may entail substantial expenses, may divert resources from other initiatives and projects, and could impact the services that we offer. Furthermore, enforcement actions and investigations by regulatory authorities related to data security incidents and privacy violations continue to increase. The enactment of more restrictive laws, rules or regulations, or future enforcement actions or investigations, or the creation of new rights to pursue damages could impact us through increased costs or restrictions on our business, and noncompliance could result in regulatory penalties and significant legal liability.
28
capital allocation program or effect strategic transactions in a tax-favorable manner. In addition, such changes, including federal or state financial transaction taxes, may increase the cost of companies and the availabilityour offerings or services, which may cause our clients to reduce their use of risk capital. A stagnation or declineour services.
In addition, some of our subsidiaries are subject to tax in the numberjurisdictions in which they are organized or operate. In computing our tax obligation in these jurisdictions, we take various tax positions. We cannot ensure that upon review of new listingsthese positions, the applicable authorities will agree with our positions. A successful challenge by a tax authority could result in additional taxes imposed on The Nasdaq Stock Market and the Nasdaq Nordic and Nasdaq Baltic exchanges will impact our revenues. Through December 31, 2017, we recognized revenue from new listings on The Nasdaq Stock Market on a straight-line basis over an estimated six-year service period. Asclients or our subsidiaries.
RISKS RELATED TO LIQUIDITY AND CAPITAL RESOURCES
A downgrade of January 1, 2018, we adopted ASU 2014-09; see “Recent Accounting Pronouncements,” of Note 2 “Summary of Significant Accounting Policies,” for further discussion. Both before and after the adoption of this new accounting standard, a stagnant market for listings could cause a decrease in revenues for future years. Furthermore, a prolonged decrease in the number of listings could negatively impact the growth of our transactions revenues. Our Corporate Solutions business is also impacted by declines in the listings market or increases in acquisitions activity as there will be fewer publicly-traded customers that need our products.
Our long-term debt is currently rated investment grade by two of the major rating agencies. These rating agencies regularly evaluate us, and their ratings of our long-term debt and commercial paper are based on a number of factors, including our financial strength and corporate development activity, as well as factors not entirely within our control, including conditions affecting our industry generally. There can be no assurance that we will maintain our current ratings. Our failure to maintain thosesuch ratings could reduce or eliminate our ability to issue commercial paper and adversely affect the cost and other terms upon which we are able to obtain funding and increase our cost of capital. A reduction in credit ratings would also result in increases in the cost of our commercial paper and other outstanding debt as the interest rate on the outstanding amounts under our credit facilities and most tranches of our senior notes fluctuates based on our credit ratings.
Our leverage limits our financial flexibility, increases our exposure to weakening economic conditions and may adversely affect our ability to obtain additional financing.
Our indebtedness as of December 31, 2022 was $5.4 billion. We may borrow additional amounts by utilizing available liquidity under our existing credit facilities, issuing additional debt securities or issuing short-term, unsecured commercial paper notes through our commercial paper program.
Our leverage and reliance on the capital markets could:
•reduce funds available to us for operations and general corporate purposes or for capital expenditures as a result of the dedication of a substantial portion of our consolidated cash flow from operations to the payment of principal and interest on our indebtedness;
•increase our exposure to a continued downturn in general economic conditions;
•place us at a competitive disadvantage compared with our competitors with less debt;
•affect our ability to obtain additional financing in the future for refinancing indebtedness, acquisitions, working capital, capital expenditures or other purposes; and
•increase our cost of debt and reduce or eliminate our ability to issue commercial paper.
In addition, we must comply with the covenants in our credit facilities. Among other things, these covenants restrict our ability to effect certain fundamental transactions, dispose of certain assets, incur additional indebtedness and grant liens on assets. Failure to meet any of the covenant terms of our credit facilities could result in an event of default. If an event of default occurs, and we are unable to receive a waiver of default, our lenders may increase our borrowing costs, restrict our ability to obtain additional borrowings and accelerate repayment of all amounts outstanding.
We will need to invest in our operations to maintain and grow our business and to integrate acquisitions, and we may need additional funds, which may not be readily available.
We depend on the availability of adequate capital to maintain and develop our business. Although we believe that we can meet our current capital requirements from internally generated funds, cash on hand and borrowings under our revolving credit facility and commercial paper program, if the capital and credit markets experience volatility, access to capital or credit may not be available on terms acceptable to us or at all. Rising interest rates could adversely affect our ability to pursue new financing opportunities, and it may be more expensive for us to issue new debt securities. Limited access to capital or credit in the future could have an impact on our ability to refinance debt, maintain our credit rating, meet our regulatory capital requirements, engage in strategic initiatives, make acquisitions or strategic investments in other companies, pay dividends, repurchase our stock or react to changing economic and business conditions. If we are unable to fund our capital or credit requirements, it could have an adverse effect on our business, financial condition and operating results.
In addition to our debt obligations, we will need to continue to invest in our operations for the foreseeable future to integrate acquired businesses and to fund new initiatives. If we do not achieve the expected operating results, we will need to reallocate our cash resources. This may include borrowing additional funds to service debt payments, which may impair our ability to make investments in our business or to integrate acquired businesses.
If we need to raise funds through issuing additional equity, our equity holders will suffer dilution. If we need to raise funds through incurring additional debt, we may become subject to covenants more restrictive than those contained in our credit facilities, the indentures governing our notes and our other debt instruments. Furthermore, if adverse economic conditions occur, we could experience decreased revenues from our operations which could affect our ability to satisfy financial and other restrictive covenants to which we are subject under our existing indebtedness.
29
RISKS RELATED TO INTELLECTUAL PROPERTY AND BRAND REPUTATION
Damage to our reputation or brand name could have a material adverse effect on our businesses.
One of our competitive strengths is our strong reputation and brand name. Various issues may give rise to reputational risk, including issues relating to:
•our ability to maintain the security of our data and systems;
•the quality and reliability of our technology platforms and systems;
•the ability to fulfill our regulatory obligations;
•the ability to execute our business plan, key initiatives or new business ventures and the ability to keep up with changing customer demand;
•the representation of our business in the media;
•the accuracy of our financial statements, and other financial and statistical information;information or ESG-related disclosures;
•the accuracy of our financial guidance or other information provided to our investors;
•the quality of our corporate governance structure;
•the quality of our products, including the reliability of our transaction-based, Corporate SolutionsServices and Market Technologymarketplace technology products, the accuracy of the quote and trade information provided by our Data Products& Listing Services business and the accuracy of calculations used by our Index Licensing and ServicesIndexes business for indexes and unit investment trusts;
•the quality of our disclosure controls or internal controls over financial reporting, including any failures in supervision;
•extreme price volatility on our markets;
•any negative publicity surrounding our listed companies;companies or our listing rules;
•any negative publicity surrounding the use of our products and/or services by our customers, including in connection with emerging asset classes such as crypto assets; and
•any misconduct, fraudulent activity or theft by our employees or other persons formerly or currently associated with us.
Although we monitor developments, including social media, for areas of potential risk to our brand and reputation, negative publicity or misrepresentations by third parties, particularly on social media, may adversely impact our credibility as a leader in the global capital markets and as a source for data and analytics. This may have an adverse effect on our brands, business and operating results. Damage to our reputation could cause some issuers not to list their securities on our exchanges as well asor switch to a different exchange. Reputational damage may also reduce the trading volumes or values on our exchanges or cause us to lose customers in our Data Products,& Listing Services, Index, Licensing and Services, Corporate SolutionsWorkflow & Insights or MarketMarketplace Technology businesses. This, in turn, may have a material adverse effect on our business, financial condition and operating results.
Failure to meet customer expectations or deadlines for the implementation of our products could result in negative publicity, losses and reduced sales, each of which may harm our reputation, business and results of operations.
We generally mutually agree with our customers on the duration, budget and costs associated with the implementation of certain of our products, particularly our market technology large-scale market infrastructure projects. Various factors may cause implementations to be delayed, inefficient or otherwise unsuccessful, including due to unforeseen project complexities, our deployment of insufficient resources or other external factors. The effects of a failure to meet an implementation schedule could include monetary credits for current or future service engagements, a reduction in fees for the project, or the expenditure of additional expenses to mitigate such delays. In addition, time-consuming implementations may also increase the personnel we must allocate to such customer, thereby increasing our costs and diverting attention from other projects. Unsuccessful, lengthy, or costly customer implementation projects could result in claims from customers, decreased customer satisfaction, harm to our reputation, and opportunities for competitors to displace us, each of which could have an adverse effect on our reputation, business and results of operations.
Our reputation or business could be negatively impacted by ESG matters and our reporting of such matters.
We communicate certain ESG-related initiatives, goals, and/or commitments regarding environmental matters, diversity, vendors and suppliers and other matters in our annual Sustainability Report, Task Force on Climate-related Financial Disclosures, or TCFD, Report, on our website, in our filings with the SEC, and elsewhere. These initiatives, goals, or commitments could be difficult to achieve and costly to implement. For example, in November 2022, we announced our commitment to achieve net-zero for Scope 3 greenhouse gas emissions by 2050, the achievement of which relies, in large part, on the accuracy of our estimates and assumptions, on the engagement of our value chain to reduce emissions and set their net-zero targets, and procuring renewable energy for our real estate and data center portfolios. We could fail to achieve, or be perceived to fail to achieve, this or other ESG-related initiatives, goals, or commitments. In addition, we could be criticized for the timing, scope or nature of these initiatives, goals, or commitments, or for any revisions to them. We could be subject to litigation or regulatory enforcement actions regarding the accuracy, adequacy, or completeness of our ESG-related disclosures. Our actual or perceived failure to achieve our ESG-related initiatives, goals, or commitments could negatively impact our reputation or otherwise materially harm our business.
30
Failure to protect our intellectual property rights, or allegations that we have infringed on the intellectual property rights of others, could harm our brand-building efforts and ability to compete effectively.
To protect our intellectual property rights, we rely on a combination of trademark laws, copyright laws, patent laws, trade secret protection, confidentiality agreements and other contractual arrangements with our affiliates, clients, strategic partners, employees and others. However, the efforts we have taken to protect our intellectual property and proprietary rights might not be sufficient, or effective, at stopping unauthorized use of those rights. We may be requiredunable to recognize impairmentsdetect the unauthorized use of, or take appropriate steps to enforce, our goodwill, intangible assetsintellectual property rights.
We have registered, or other long-lived assetsapplied to register, our trademarks in the future.
Third parties may assert intellectual property rights claims against us, which may be costly to defend, could require the payment of damages and could limit our ability to use certain technologies, trademarks or other intellectual property. Any intellectual property claims, with or without merit, could be expensive to litigate or settle and could divert management resources and attention. Successful challenges against us could require us to modify or discontinue our use of technology or business processes where such use is found to infringe or violate the recorded valuesrights of those assets may become impaired in the future. Asothers, or require us to purchase licenses from third parties, any of December 31, 2017, goodwill totaled approximately $6.6 billion and intangible assets, net of accumulated amortization, totaled approximately $2.5 billion. The determination of the value of such goodwill and intangible assets requires management to make estimates and assumptions thatwhich could adversely affect our consolidatedbusiness, financial statements.condition and operating results.
GENERAL RISK FACTORS
We assess goodwillare a holding company that depends on cash flow from our subsidiaries to meet our obligations, and intangible assets, as well asany restrictions on our subsidiaries’ ability to pay dividends or make other long-lived assets, including equity and cost method investments and property and equipment, for impairment on an annual basis or more frequently if indicators of impairment arise. We estimate the fair value of such assets by assessing many factors, including historical performance, capital requirements and projected cash flows. Considerable management judgment is necessarypayments to project future cash flows and evaluate the impact of expected operating and macroeconomic changes on these cash flows. The estimates and assumptions we use are consistent with our internal planning process. However, there are inherent uncertainties in these estimates.
In addition, unremitted earnings of certain subsidiaries outside of the U.S. are used to finance our international operations and are considered to be indefinitely reinvested.
If our subsidiaries are unable to pay dividends and make other long-lived assets, including related impairment, see “Goodwillpayments to us when needed, or if regulators or counterparties require us to increase capital deployed in certain of our regulated subsidiaries, we may be unable to satisfy our obligations, which would have a material adverse effect on our business, financial condition and Related Impairment,” “Indefinite-Lived Intangible Assets and Related Impairment,” and “Other Long-Lived Assets and Related Impairment,” of “Critical Accounting Policies and Estimates,” of Item 7. “Management’s Discussion and Analysis of Financial Condition and Results of Operations,” and “Goodwill and Indefinite-Lived Intangible Assets,” and “Valuation of Other
We may experience fluctuations in our operating results, which may adversely affect the market price of our common stock.
Our industry is risky and unpredictable and is directly affected by many national and international factors beyond our control, including:
•economic, political and geopolitical market conditions;
•natural disasters, terrorism, pandemics, war or other catastrophes;
•broad trends in finance and technology;
•changes in price levels and volatility in the stock markets;
•the level and volatility of interest rates;
•volatility in commodity markets, including the energy markets;
•inflation;
•changes in government monetary or tax policy;
•the imposition of governmental economic sanctions on countries in which we do business or where we plan to expand our business; and
•the perceived attractiveness of the U.S. or European capital markets; and
Any one of these factors could have a material adverse effect on our business, financial condition and operating results by causing a substantial decline in the financial services markets and reducing trading volumes or values.
31
Additionally, since borrowings under our credit facilities bear interest at variable rates and commercial paper is issued at prevailing interest rates, any increase in interest rates on debt that we have not fixed using interest rate hedges will increase our interest expense, reduce our cash flow or increase the cost of future borrowings or refinancings. Other than variable rate debt, we believe our business has relatively large fixed costs and low variable costs, which magnifies the impact of revenue fluctuations on our operating results. As a result, a decline in our revenue may lead to a relatively larger impact on operating results. A substantial portion of our operating expenses is related to personnel costs, regulation and corporate overhead, none of which can be adjusted quickly and some of which cannot be adjusted at all. Our operating expense levels are based on our expectations for future revenue. If actual revenue is below management’s expectations, or if our expenses increase before revenues do, both revenues less transaction-based expenses and operating results would be materially and adversely affected. Because of these factors, it is possible that our operating results or other operating metrics may fail to meet the expectations of stock market analysts and investors. If this happens, the market price of our common stock may be adversely affected.
Our operational processes are subject to the risk of error, which may result in financial loss or reputational damage.
We have instituted extensive controls to reduce the risk of error inherent in our operations; however, such risk cannot completely be eliminated. Our businesses are exposedhighly dependent on our ability to creditprocess and report, on a daily basis, a large number of transactions across numerous and diverse markets. Some of our operations require complex processes, and the introduction of new products or services or changes in processes or reporting due to regulatory requirements may result in an increased risk of errors for a period after implementation. Additionally, the likelihood of such errors or vulnerabilities is heightened as we acquire new products from third parties, includingwhether as a result of acquisitions or otherwise.
Data, other content or information that we distribute may contain errors or be delayed, causing reputational harm. Use of our products and services as part of the investment process creates the risk that clients, or the parties whose assets are managed by our clients, may pursue claims against us in the event of such delay or error. Even with a favorable outcome, significant litigation against us might unduly burden management, personnel, financial and other resources.
In addition, the sophisticated software we sell to our customers counterparties and clearing agents.
32
Our non-U.S. business operatesbusinesses operate in various international markets, particularlyincluding certain emerging markets that are subject to greater political, economic and social uncertainties than developed countries.
Our non-U.S. business operatesbusinesses operate in various international markets, including but not limited to Northern Europe, the Baltics, the Middle East, Africa and Asia. Therefore,Asia, and our non-U.S. operations are subject to the risk inherent in the international environment. Political, economic or social events or developments in one or more of our non-U.S. locations could
adversely affect our operations and financial results. Some locations, such as Lithuania, India and the Philippines, may increase risk. Some of thesehave economies that may be subject to greater political, economic and social uncertainties than countries with more developed institutional structures.structures, which may increase our operational risk.
Unforeseen or catastrophic events could interrupt our critical business functions. In addition, our U.S. and European businesses are heavily concentrated in particular areas and may be adversely affected by events in those areas.
We may incur losses as a result of unforeseen or catastrophic events, such as terrorist attacks, natural disasters, pandemics (such as COVID-19), extreme weather, fire, power loss, telecommunications failures, human error, theft, sabotage and vandalism. Given our position in the global capital markets, we may be more likely than other companies to be a target of suchfor malicious disruption activities.
In addition, our U.S. business operations are heavily concentrated on the East Coast, and our European business operations are heavily concentrated in Stockholm.the east coast of the U.S., and Stockholm, Sweden, respectively. Any event that affectsimpacts either of those geographic areas could potentially affect our ability to operate our businesses.
We have disaster recovery and business continuity plans and capabilities for critical systems and business functions to mitigate the risk of an interruption. However, anyAny interruption in our critical business functions or systems could negatively impact our financial condition and operating results. Additionally, some colocation customers may lack adequate disaster recovery solutions to avoid loss of trade flow from a sustained interruption of our critical systems.
Because we have operations in numerous countries, we are exposed to currency risk.
We have operations in the U.S., the Nordic and Baltic countries, Canada, the U.K.,United Kingdom, Australia and many other foreign countries. We therefore have significant exposure to exchange rate movements between the Euro, Swedish Krona, the Canadian dollar and other foreign currencies towardsagainst the U.S. dollar. Significant inflation or disproportionate changes in foreign exchange rates with respect to one or more of these currencies could occur as a result of general economic conditions, acts of war or terrorism, changes in governmental monetary or tax policy, changes in local interest rates or other factors. These exchange rate differences will affect the translation of our non-U.S. results of operations, interest expense and financial condition into U.S. dollars as part of the preparation of our consolidated financial statements and could adversely affect our financial results.statements.
If our risk management methods are not effective, our business, reputation and financial results may be adversely affected.
We haveutilize widely-accepted methods to identify, assess, monitor and manage our risks, including oversight of risk management by Nasdaq’s Global Risk Management Committee, which is comprised of senior executives and is responsiblehas the responsibility for regularly reviewing risks and referring significant risks to the board of directors or specific board committees. However, these methods may not be fully effective. Some ofLocal risk management committees in our international offices provide local risk oversight and escalation to local boards, as appropriate. Certain risk management methods may depend uponrequire subjective evaluation of dynamic information regarding markets, customers or other matters. That variable information may not in all cases be accurate, complete, up-to-date or properly
evaluated. If our methods arewe do not effectivesuccessfully identify, assess, monitor or we are not successful in monitoring or evaluatingmanage the risks to which we are or may be exposed, our business, reputation, financial condition and operating results could be materially adversely affected.
Decisions to declare future dividends on our common stock will be at the discretion of our board of directors based upon a review of relevant considerations. Accordingly,and there can be no guarantee that we will pay future dividends to our stockholders.
33
Provisions of our certificate of incorporation, by-laws, exchange rules (including provisions included to address SEC concerns) and governing law restrict the ownership and voting of our common stock. In addition, such provisions could delay or prevent a change in control of us and entrench current management.
Our organizational documents place restrictions on the voting rights of certain stockholders. The holders of our common stock are entitled to one vote per share on all matters to be voted upon by the stockholders except that no person may exercise voting rights in respect of any shares in excess of 5% of the then outstanding shares of our common stock. Any change to the 5% voting limitation would require SEC approval.
In response to the SEC’s concern about a concentration of our ownership, the rules of some of our exchange subsidiaries include a prohibition on any member or any person associated with a member of the exchange from beneficially owning more than 20% of our outstanding voting interests. SEC consent would be required before any investor could obtain more than a 20% voting interest in us. The rules of some of our exchange subsidiaries also require the SEC’s approval of any business ventures with exchange members, subject to exceptions.
Our organizational documents contain provisions that may be deemed to have an anti-takeover effect and may delay, deter or prevent a change of control of us, such as a tender offer or takeover proposal that might result in a premium over the market price for our common stock. Additionally, certain of these provisions make it more difficult to bring about a change in the composition of our board of directors, which could result in entrenchment of current management.
Our certificate of incorporation and by-laws:
•do not permit stockholders to act by written consent;
•require certain advance notice for director nominations and actions to be taken at annual meetings; and
•authorize the issuance of undesignated preferred stock, or “blank check” preferred stock, which could be issued by our board of directors without stockholder approval.
Section 203 of the Delaware General Corporation Law imposes restrictions on mergers and other business combinations between us and any holder of 15% or more (or, in some cases, a holder who previously held 15% or more) of our common stock. In general, Delaware law prohibits a publicly held corporation from engaging in a “business combination” with an “interested stockholder” for three years after the stockholder becomes an interested stockholder, unless the corporation’s board of directors and stockholders approve the business combination in a prescribed manner.
Finally, many of the European countries where we operate regulated entities require prior governmental approval before an investor acquires 10% or greater of our common stock.
Item 1B. Unresolved StaffComments. Comments
None.
Item 2.Properties. Properties
Generally, our properties are not earmarkedallocated for use by a particular segment. Instead, most of our properties are used by two or more segments. We regularly monitor the facilities we occupy to ensure that they suit our needs, particularly as we have reopened all our global offices and our employees have transitioned to a hybrid work environment. We believe the facilities that we occupy are adequate for the purposes for which they are currently used and are well-maintained. See Note 16, “Leases,” to the consolidated financial statements for further discussion.
Item 3. LegalProceedings. Proceedings
Item 4. Mine SafetyDisclosures. Disclosures
Not applicable.
PART II
Item 5. Market for Registrant’s Common Equity, Related Stockholder Matters and Issuer Purchases of Equity Securities.
Market Information
Our common stock has beenis listed on The Nasdaq Stock Market since February 10, 2005, under the ticker symbol “NDAQ.”
| High | Low | ||||||
| Fiscal 2017 | |||||||
| Fourth quarter | $ | 78.88 | $ | 71.62 | |||
| Third quarter | 77.25 | 70.36 | |||||
| Second quarter | 70.92 | 65.72 | |||||
| First quarter | 70.76 | 65.37 | |||||
| Fiscal 2016 | |||||||
| Fourth quarter | $ | 68.94 | $ | 63.23 | |||
| Third quarter | 71.01 | 63.99 | |||||
| Second quarter | 65.16 | 60.84 | |||||
| First quarter | 66.09 | 54.73 | |||||
As of February 21, 2018,13, 2023, we had approximately 276209 holders of record of our common stock. As of February 21, 2018, the closing price of our common stock was $79.12.
| December 31, | |||||||
| 2017 | 2016 | ||||||
| First quarter | $ | 0.32 | $ | 0.25 | |||
| Second quarter | 0.38 | 0.32 | |||||
| Third quarter | 0.38 | 0.32 | |||||
| Fourth quarter | 0.38 | 0.32 | |||||
| Total | $ | 1.46 | $ | 1.21 | |||
Issuer Purchases of Equity Securities
Share Repurchase Program
See “Share Repurchase Program,” of Note 14,12, “Nasdaq Stockholders’ Equity,” to the consolidated financial statements for further discussion of our share repurchase program.
34
Purchases of Equity Securities by the Issuer and Affiliated Purchasers
The table below represents repurchases made by or on behalf of us or any “affiliated purchaser” of our common stock during the fiscal quarter ended December 31, 2017:2022:
| Period | (a) Total Number of Shares Purchased | (b) Average Price Paid Per Share | (c) Total Number of Shares Purchased as Part of Publicly Announced Plans or Programs | (d) Maximum Dollar Value of Shares that May Yet Be Purchased Under the Plans or Programs (in millions) | ||||||||||||||||||||||
| October 2022 | ||||||||||||||||||||||||||
| Share repurchase program | — | $ | — | — | $ | 293 | ||||||||||||||||||||
| Employee transactions | 27,913 | $ | 59.76 | N/A | N/A | |||||||||||||||||||||
| November 2022 | ||||||||||||||||||||||||||
| Share repurchase program | — | $ | — | — | $ | 293 | ||||||||||||||||||||
| Employee transactions | 231 | $ | 66.52 | N/A | N/A | |||||||||||||||||||||
| December 2022 | ||||||||||||||||||||||||||
| Share repurchase program | — | $ | — | — | $ | 650 | ||||||||||||||||||||
| Employee transactions | 56,480 | $ | 61.76 | N/A | N/A | |||||||||||||||||||||
| Total Quarter Ended December 31, 2022 | ||||||||||||||||||||||||||
| Share repurchase program | — | $ | — | — | $ | 650 | ||||||||||||||||||||
| Employee transactions | 84,624 | $ | 61.11 | N/A | N/A | |||||||||||||||||||||
In the preceding table:
•N/A - Not applicable.
•See “Share Repurchase Program,” of Note 12, “Nasdaq Stockholders’ Equity,” to the consolidated financial statements for further discussion of our share repurchase program.
•Employee transactions represents shares surrendered to us to satisfy tax withholding obligations arising from the vesting of restricted stock and PSUs previously issued to employees.
| Period | (a) Total Number of Shares Purchased | (b) Average Price Paid Per Share | (c) Total Number of Shares Purchased as Part of Publicly Announced Plans or Programs | (d) Maximum Dollar Value of Shares that May Yet Be Purchased Under the Plans or Programs (in millions) | |||||||||
| October 2017 | |||||||||||||
| Share repurchase program | 377,516 | $ | 74.14 | 377,516 | $ | 227 | |||||||
| Employee transactions | 1,850 | $ | 74.94 | N/A | N/A | ||||||||
| November 2017 | |||||||||||||
| Share repurchase program | 9,732 | $ | 74.63 | 9,732 | $ | 226 | |||||||
| Employee transactions | 304 | $ | 72.40 | N/A | N/A | ||||||||
| December 2017 | |||||||||||||
| Share repurchase program | 1,100 | $ | 74.97 | 1,100 | $ | 226 | |||||||
| Employee transactions | 70,763 | $ | 78.69 | N/A | N/A | ||||||||
| Total Quarter Ended December 31, 2017 | |||||||||||||
| Share repurchase program | 388,348 | $ | 74.15 | 388,348 | $ | 226 | |||||||
| Employee transactions | 72,917 | $ | 78.57 | N/A | N/A | ||||||||
PERFORMANCE GRAPH
The following performance graph and related information shall not be deemed “filed” for purposes of Section 18 of the Exchange Act or incorporated by reference into any of our other filings under the Securities Act or the Exchange Act, except as shall be expressly set forth by specific reference in such filing.
The following graph compares the total return of our common stock to the Nasdaq Composite Stock Index, the S&P 500 and a selected peer group selected by us, shown below, for the past five years. The peer group includes ASX Limited, CBOE, CME Group Inc., Deutsche Börse A.G., ICE, LSE, and TMX Group Limited. Information for the indices and the peer group is provided from December 31, 2012 through December 31, 2017. years:
| Peer Group | |||||||||||||||||
| • | ASX Limited | • | Deutsche Börse AG | • | LSE | ||||||||||||
| • | B3 S.A. | • | Euronext N.V. | • | Singapore Exchange Limited | ||||||||||||
| • | Bolsas Mexicana de Valores, S.A.B. de C.V. | • | Hong Kong Exchanges and Clearing Limited | • | TMX Group Limited | ||||||||||||
| • | Cboe | • | ICE | ||||||||||||||
| • | CME Group Inc. | • | Japan Exchange Group, Inc. | ||||||||||||||
The figures represented below assume an initial investment of $100 in the common stock or index at the closing price on December 31, 20122017 and the reinvestment of all dividends.
COMPARISON OF 5 YEAR CUMULATIVE TOTAL RETURN*

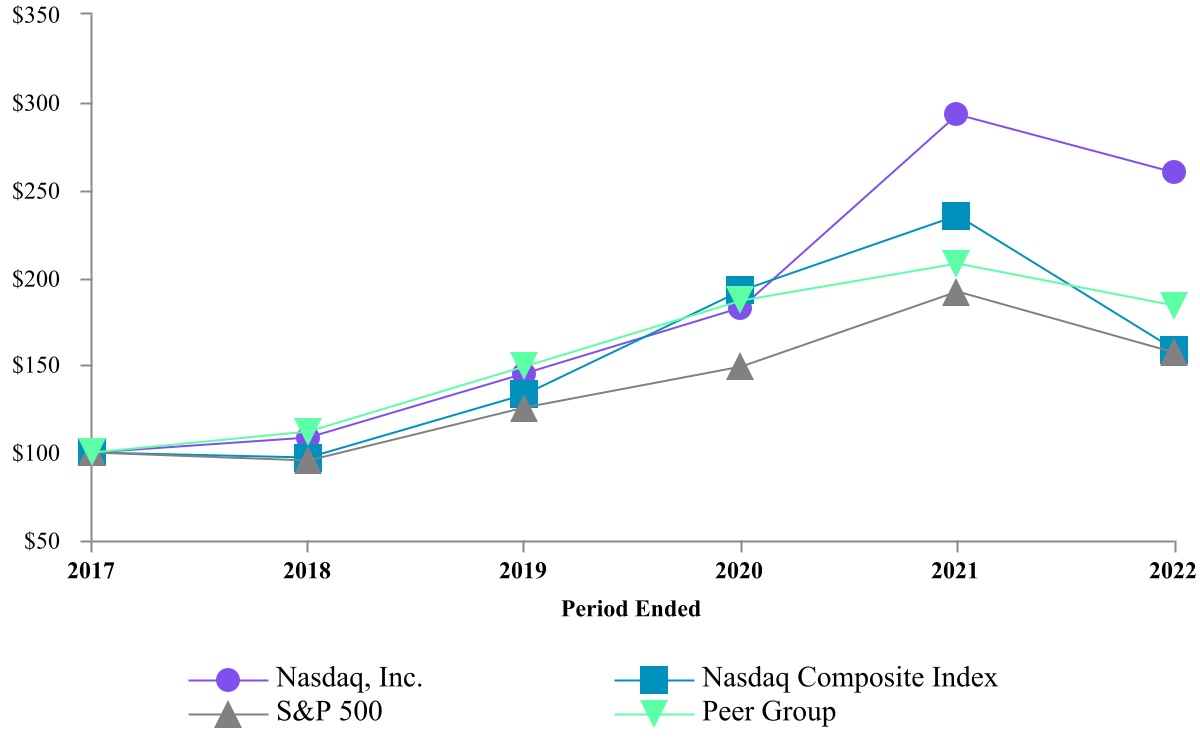
*$100 $100 invested on 12/31/122017 in stock or index, including reinvestment of dividends.
| Fiscal Year Ended December 31, | |||||||||||||||||||||||||||||||||||
| 2017 | 2018 | 2019 | 2020 | 2021 | 2022 | ||||||||||||||||||||||||||||||
| Nasdaq, Inc. | $ | 100 | $ | 108 | $ | 145 | $ | 183 | $ | 293 | $ | 260 | |||||||||||||||||||||||
| Nasdaq Composite Index | 100 | 97 | 133 | 192 | 235 | 159 | |||||||||||||||||||||||||||||
| S&P 500 | 100 | 96 | 126 | 149 | 192 | 157 | |||||||||||||||||||||||||||||
| Peer Group | 100 | 112 | 149 | 186 | 208 | 184 | |||||||||||||||||||||||||||||
36
| 2012 | 2013 | 2014 | 2015 | 2016 | 2017 | ||||||||||||||||||
| Nasdaq, Inc. | $ | 100.00 | $ | 161.79 | $ | 197.73 | $ | 244.01 | $ | 286.68 | $ | 334.72 | |||||||||||
| Nasdaq Composite | 100.00 | 141.63 | 162.09 | 173.33 | 187.19 | 242.29 | |||||||||||||||||
| S&P 500 | 100.00 | 132.39 | 150.51 | 152.59 | 170.84 | 208.14 | |||||||||||||||||
| Peer Group | 100.00 | 153.73 | 164.34 | 185.98 | 212.88 | 287.34 | |||||||||||||||||
Item 6. Selected FinancialData.[Reserved]
| Year Ended December 31, | ||||||||||||||||||||
| 2017 | 2016 | 2015 | 2014 | 2013 | ||||||||||||||||
| (in millions, except share and per share amounts) | ||||||||||||||||||||
| Statements of Income Data: | ||||||||||||||||||||
| Total revenues | $ | 3,965 | $ | 3,705 | $ | 3,403 | $ | 3,500 | $ | 3,211 | ||||||||||
| Transaction-based expenses | (1,537 | ) | (1,428 | ) | (1,313 | ) | (1,433 | ) | (1,316 | ) | ||||||||||
| Revenues less transaction-based expenses | 2,428 | 2,277 | 2,090 | 2,067 | 1,895 | |||||||||||||||
| Total operating expenses | 1,429 | 1,438 | 1,370 | 1,313 | 1,207 | |||||||||||||||
| Operating income | 999 | 839 | 720 | 754 | 688 | |||||||||||||||
| Net income attributable to Nasdaq | 734 | 108 | 428 | 414 | 385 | |||||||||||||||
| Per share information: | ||||||||||||||||||||
| Basic earnings per share | $ | 4.41 | $ | 0.65 | $ | 2.56 | $ | 2.45 | $ | 2.30 | ||||||||||
| Diluted earnings per share | $ | 4.33 | $ | 0.64 | $ | 2.50 | $ | 2.39 | $ | 2.25 | ||||||||||
| Cash dividends declared per common share | $ | 1.46 | $ | 1.21 | $ | 0.90 | $ | 0.58 | $ | 0.52 | ||||||||||
| Weighted-average common shares outstanding for earnings per share: | ||||||||||||||||||||
| Basic | 166,364,299 | 165,182,290 | 167,285,450 | 168,926,733 | 166,932,103 | |||||||||||||||
| Diluted | 169,585,031 | 168,800,997 | 171,283,271 | 173,018,849 | 171,266,146 | |||||||||||||||
| December 31, | ||||||||||||||||||||
| 2017 | 2016 | 2015 | 2014 | 2013 | ||||||||||||||||
| (in millions) | ||||||||||||||||||||
| Balance Sheets Data: | ||||||||||||||||||||
| Cash and cash equivalents and financial investments | $ | 612 | $ | 648 | $ | 502 | $ | 601 | $ | 587 | ||||||||||
| Total assets | 15,786 | 14,150 | 11,861 | 12,071 | 12,563 | |||||||||||||||
| Total long-term liabilities | 4,637 | 4,638 | 3,332 | 3,297 | 3,579 | |||||||||||||||
| Total Nasdaq stockholders' equity | 5,887 | 5,430 | 5,609 | 5,794 | 6,184 | |||||||||||||||
Item 7. Management’sManagement's Discussion and Analysis of Financial Condition and Results ofOperations. Operations
The following discussion and analysis of the financial condition and results of operations of Nasdaq should be read in conjunction with our consolidated financial statements and related notes included in this Form 10-K, as well as the discussion under “Item 1A. Risk Factors.”
For further discussion of our business,growth strategy, products and services, and competitive strengths, see “Item 1. Business.”
Business Segments
The following table includes key drivers for our Market Services, Corporate Services, Information Services and Market Technology segments. In evaluating the performance of our business, our senior management closely evaluates these key drivers.
| Year Ended December 31, | ||||||||||||
| 2017 | 2016 | 2015 | ||||||||||
| Market Services | ||||||||||||
| Equity Derivative Trading and Clearing | ||||||||||||
| U.S. equity options | ||||||||||||
| Total industry average daily volume (in millions) | 14.7 | 14.4 | 14.8 | |||||||||
| Nasdaq PHLX matched market share | 17.3 | % | 16.0 | % | 16.7 | % | ||||||
| The Nasdaq Options Market matched market share | 9.2 | % | 7.8 | % | 7.7 | % | ||||||
| Nasdaq BX Options matched market share | 0.7 | % | 0.8 | % | 0.8 | % | ||||||
Nasdaq ISE Options matched market share(1) | 9.1 | % | 5.8 | % | — | % | ||||||
Nasdaq GEMX Options matched market share(1) | 5.2 | % | 1.1 | % | — | % | ||||||
Nasdaq MRX Options matched market share(1) | 0.1 | % | 0.1 | % | — | % | ||||||
| Total matched market share executed on Nasdaq’s exchanges | 41.6 | % | 31.6 | % | 25.2 | % | ||||||
| Nasdaq Nordic and Nasdaq Baltic options and futures | ||||||||||||
Total average daily volume of options and futures contracts(2) | 330,218 | 376,730 | 380,725 | |||||||||
| Cash Equity Trading | ||||||||||||
| Total U.S.-listed securities | ||||||||||||
| Total industry average daily share volume (in billions) | 6.53 | 7.35 | 6.91 | |||||||||
| Matched share volume (in billions) | 295.9 | 321.6 | 327.7 | |||||||||
| The Nasdaq Stock Market matched market share | 14.2 | % | 14.0 | % | 15.8 | % | ||||||
| Nasdaq BX matched market share | 3.1 | % | 2.4 | % | 2.0 | % | ||||||
| Nasdaq PSX matched market share | 0.8 | % | 1.0 | % | 1.0 | % | ||||||
| Total matched market share executed on Nasdaq’s exchanges | 18.1 | % | 17.4 | % | 18.8 | % | ||||||
| Market share reported to the FINRA/Nasdaq Trade Reporting Facility | 34.5 | % | 33.1 | % | 31.8 | % | ||||||
Total market share(3) | 52.6 | % | 50.5 | % | 50.6 | % | ||||||
| Nasdaq Nordic and Nasdaq Baltic securities | ||||||||||||
| Average daily number of equity trades executed on Nasdaq’s exchanges | 552,104 | 472,428 | 438,864 | |||||||||
| Total average daily value of shares traded (in billions) | $ | 5.3 | $ | 5.1 | $ | 5.1 | ||||||
| Total market share executed on Nasdaq’s exchanges | 67.5 | % | 62.5 | % | 68.0 | % | ||||||
| FICC | ||||||||||||
| Fixed Income | ||||||||||||
| U.S. fixed income notional trading volume (in billions) | $ | 17,800 | $ | 21,504 | $ | 29,234 | ||||||
| Total average daily volume of Nasdaq Nordic and Nasdaq Baltic fixed income contracts | 115,185 | 89,252 | 108,708 | |||||||||
| Commodities | ||||||||||||
Power contracts cleared (TWh)(4) | 1,199 | 1,658 | 1,496 | |||||||||
| Corporate Services | ||||||||||||
| Initial public offerings | ||||||||||||
| The Nasdaq Stock Market | 136 | 91 | 143 | |||||||||
| Exchanges that comprise Nasdaq Nordic and Nasdaq Baltic | 88 | 62 | 78 | |||||||||
| Total new listings | ||||||||||||
The Nasdaq Stock Market(5) | 268 | 283 | 274 | |||||||||
Exchanges that comprise Nasdaq Nordic and Nasdaq Baltic(6) | 108 | 88 | 91 | |||||||||
| Number of listed companies | ||||||||||||
The Nasdaq Stock Market(7) | 2,949 | 2,897 | 2,859 | |||||||||
Exchanges that comprise Nasdaq Nordic and Nasdaq Baltic(8) | 984 | 900 | 852 | |||||||||
| Information Services | ||||||||||||
| Number of licensed ETPs | 324 | 298 | 222 | |||||||||
| ETP assets under management tracking Nasdaq indexes (in billions) | $ | 167 | $ | 124 | $ | 114 | ||||||
| Market Technology | ||||||||||||
Order intake (in millions)(9) | $ | 292 | $ | 276 | $ | 271 | ||||||
Total order value (in millions)(10) | $ | 847 | $ | 777 | $ | 788 | ||||||
| Year Ended December 31, | Percentage Change | |||||||||||||||||
| 2017 | 2016 | 2015 | 2017 vs. 2016 | 2016 vs. 2015 | ||||||||||||||
| (in millions, except per share amounts) | ||||||||||||||||||
| Revenues less transaction-based expenses | $ | 2,428 | $ | 2,277 | $ | 2,090 | 6.6 | % | 8.9 | % | ||||||||
| Operating expenses | 1,429 | 1,438 | 1,370 | (0.6 | )% | 5.0 | % | |||||||||||
| Operating income | 999 | 839 | 720 | 19.1 | % | 16.5 | % | |||||||||||
| Interest expense | (143 | ) | (135 | ) | (111 | ) | 5.9 | % | 21.6 | % | ||||||||
| Asset impairment charge | — | (578 | ) | — | (100.0 | )% | N/M | |||||||||||
| Income before income taxes | 880 | 136 | 630 | 547.1 | % | (78.4 | )% | |||||||||||
| Income tax provision | 146 | 28 | 203 | 421.4 | % | (86.2 | )% | |||||||||||
| Net income attributable to Nasdaq | $ | 734 | $ | 108 | $ | 428 | 579.6 | % | (74.8 | )% | ||||||||
| Diluted earnings per share | $ | 4.33 | $ | 0.64 | $ | 2.50 | 576.6 | % | (74.4 | )% | ||||||||
| Cash dividends declared per common share | $ | 1.46 | $ | 1.21 | $ | 0.90 | 20.7 | % | 34.4 | % | ||||||||
| Year Ended December 31, | Percentage Change | |||||||||||||||||||
| 2022 | 2021 | 2020 | 2022 vs. 2021 | 2021 vs. 2020 | ||||||||||||||||
| (in millions, except per share amounts) | ||||||||||||||||||||
| Revenues less transaction-based expenses | $ | 3,582 | $ | 3,420 | $ | 2,903 | 4.7 | % | 17.8 | % | ||||||||||
| Operating expenses | 2,018 | 1,979 | 1,669 | 2.0 | % | 18.6 | % | |||||||||||||
| Operating income | 1,564 | 1,441 | 1,234 | 8.5 | % | 16.8 | % | |||||||||||||
| Net income attributable to Nasdaq | $ | 1,125 | $ | 1,187 | $ | 933 | (5.2) | % | 27.2 | % | ||||||||||
| Diluted earnings per share | $ | 2.26 | $ | 2.35 | $ | 1.86 | (3.8) | % | 26.3 | % | ||||||||||
| Cash dividends declared per common share | $ | 0.78 | $ | 0.70 | $ | 0.65 | 11.4 | % | 7.7 | % | ||||||||||
In countries with currencies other than the U.S. dollar, revenues and expenses are translated using monthly average exchange rates. Impacts on our revenues less transaction-based expenses and operating income associated with fluctuations in foreign currency are discussed in more detail under “Item 7A. Quantitative and Qualitative Disclosures about Market Risk.”
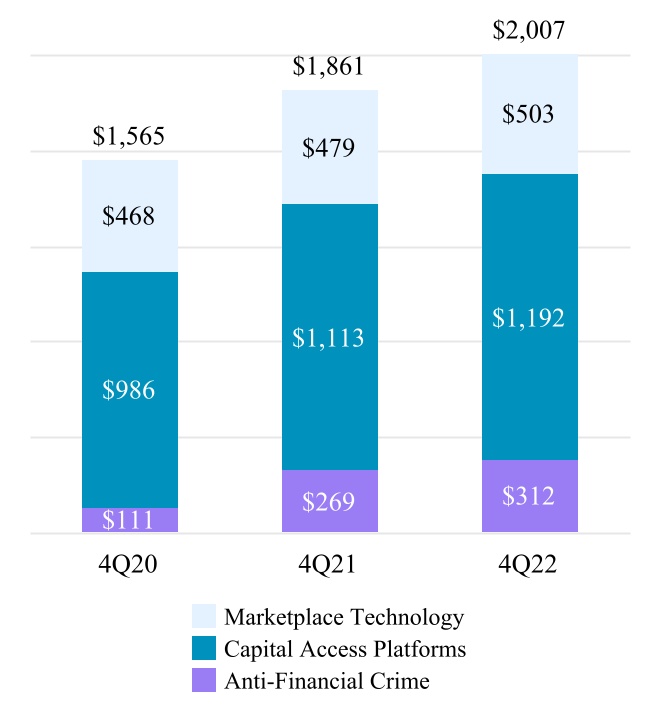
37
ARR for a given period is the annualized revenue derived from subscription contracts with a defined contract value. This excludes contracts that are not recurring, are one-time in nature, or where the contract value fluctuates based on defined metrics. Also excluded are contracts that are signed but not yet commenced. ARR is one of our key performance metrics to assess the health and trajectory of our recurring business. ARR does not have any standardized definition and is therefore unlikely to be comparable to similarly titled measures presented by other companies. ARR should be viewed independently of revenue and deferred revenue and is not intended to be combined with or to replace either of those items. ARR is not a forecast and the active contracts at the end of a reporting period used in calculating ARR may or may not be extended or renewed by our customers.
The ARR chart includes:
| ▪ | Anti-Financial Crime support and SaaS subscription contracts | |||||||
| ▪ | Proprietary market data subscriptions and annual listing fees within our Data & Listing Services business, index data subscriptions and guaranteed minimum on futures contracts within our Index business and subscription contracts under our Workflow & Insights business. | |||||||
| ▪ | Market technology support and SaaS subscription contracts as well as trade management services contracts, excluding one-time service requests. | |||||||
The following chart summarizes our quarterly annualized SaaS revenues for our Solutions Businesses, which are comprised of the Capital Access Platforms and Anti-Financial Crime segments and the Marketplace Technology business within the Market Platforms segment, for the three months ended December 31, 2022, 2021 and 2020 (in millions):
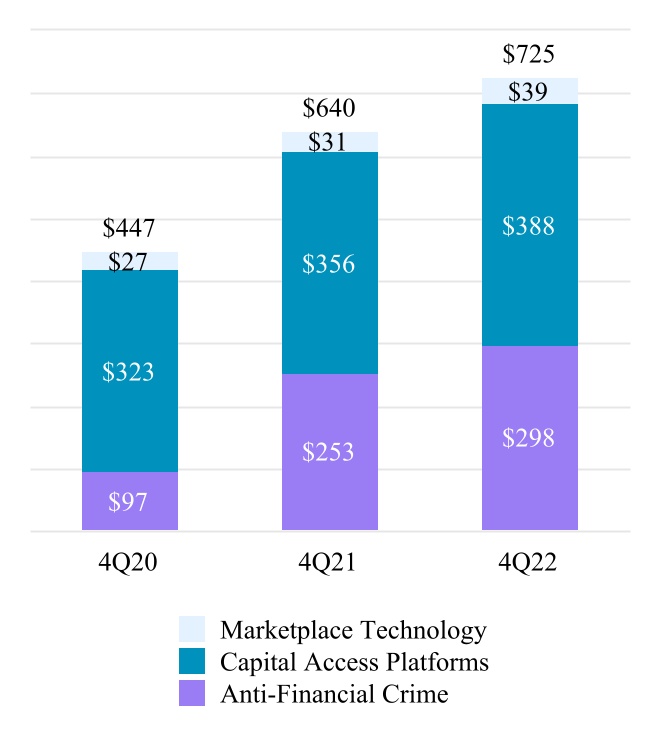
38
Segment Operating Results
The following table showspresents our revenues by segment, transaction-based expenses for our Market ServicesPlatforms segment and total revenues less transaction-based expenses:
| Year Ended December 31, | Percentage Change | ||||||||||||||||||||||
| 2022 | 2021 | 2020 | 2022 vs. 2021 | 2021 vs. 2020 | |||||||||||||||||||
| (in millions) | |||||||||||||||||||||||
| Market Platforms | $ | 4,225 | $ | 4,048 | $ | 4,179 | 4.4 | % | (3.1) | % | |||||||||||||
| Capital Access Platforms | 1,684 | 1,568 | 1,287 | 7.4 | % | 21.8 | % | ||||||||||||||||
| Anti-Financial Crime | 306 | 231 | 116 | 32.5 | % | 99.1 | % | ||||||||||||||||
| Other revenues | 11 | 39 | 43 | (71.8) | % | (9.3) | % | ||||||||||||||||
| Total revenues | 6,226 | 5,886 | 5,625 | 5.8 | % | 4.6 | % | ||||||||||||||||
| Transaction rebates | (2,092) | (2,168) | (2,028) | (3.5) | % | 6.9 | % | ||||||||||||||||
| Brokerage, clearance and exchange fees | (552) | (298) | (694) | 85.2 | % | (57.1) | % | ||||||||||||||||
| Total revenues less transaction-based expenses | $ | 3,582 | $ | 3,420 | $ | 2,903 | 4.7 | % | 17.8 | % | |||||||||||||
| Year Ended December 31, | Percentage Change | |||||||||||||||||
| 2017 | 2016 | 2015 | 2017 vs. 2016 | 2016 vs. 2015 | ||||||||||||||
| (in millions) | ||||||||||||||||||
| Market Services | $ | 2,418 | $ | 2,255 | $ | 2,084 | 7.2 | % | 8.2 | % | ||||||||
| Transaction-based expenses | (1,537 | ) | (1,428 | ) | (1,313 | ) | 7.6 | % | 8.8 | % | ||||||||
| Market Services revenues less transaction-based expenses | 881 | 827 | 771 | 6.5 | % | 7.3 | % | |||||||||||
| Corporate Services | 656 | 635 | 562 | 3.3 | % | 13.0 | % | |||||||||||
| Information Services | 588 | 540 | 512 | 8.9 | % | 5.5 | % | |||||||||||
| Market Technology | 303 | 275 | 245 | 10.2 | % | 12.2 | % | |||||||||||
| Total revenues less transaction-based expenses | $ | 2,428 | $ | 2,277 | $ | 2,090 | 6.6 | % | 8.9 | % | ||||||||
The following charts showpresent our Market Services, Corporate Services, Information ServicesPlatforms, Capital Access Platforms and Market TechnologyAnti-Financial Crime segments as a percentage of our total revenues, less transaction-based expensesexpenses.
Percentage of $2,428 million in 2017, $2,277 million in 2016 and $2,090 million in 2015:Revenues Less Transaction-based Expenses by Segment for the:

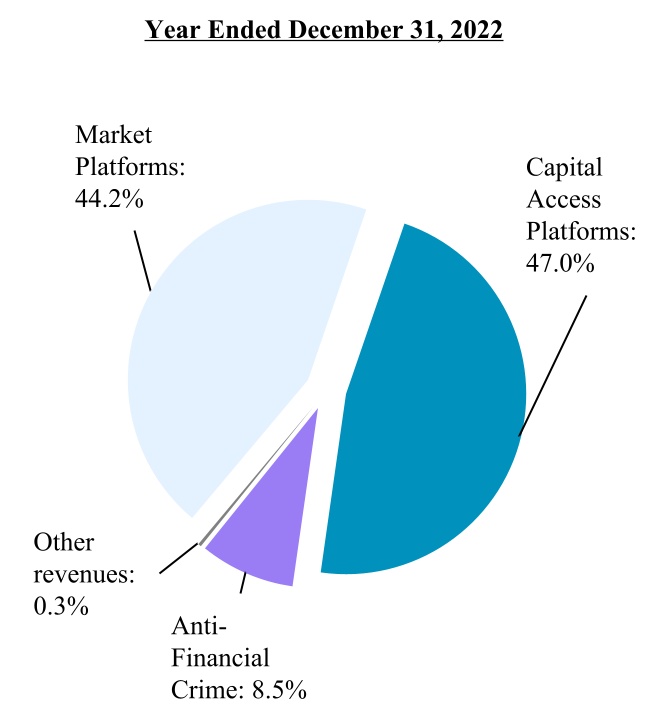

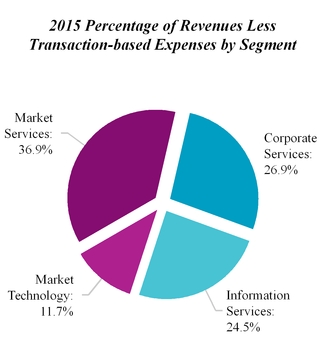
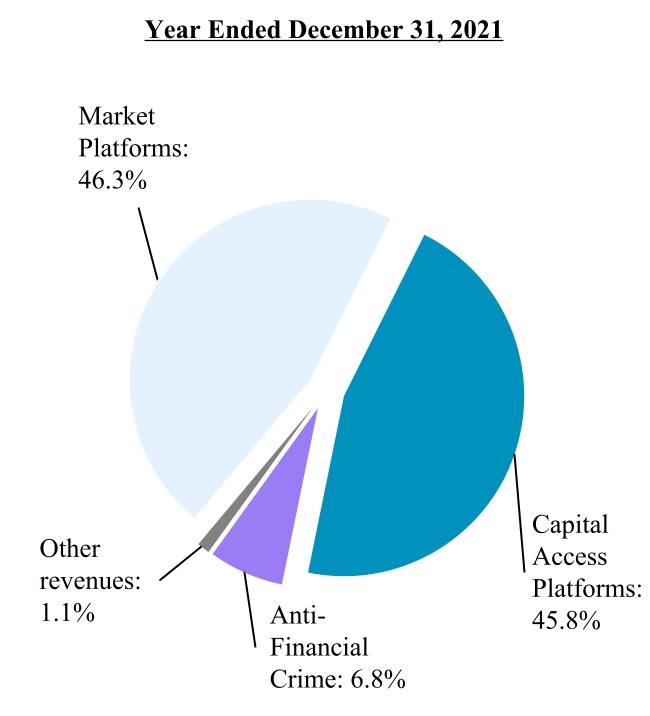
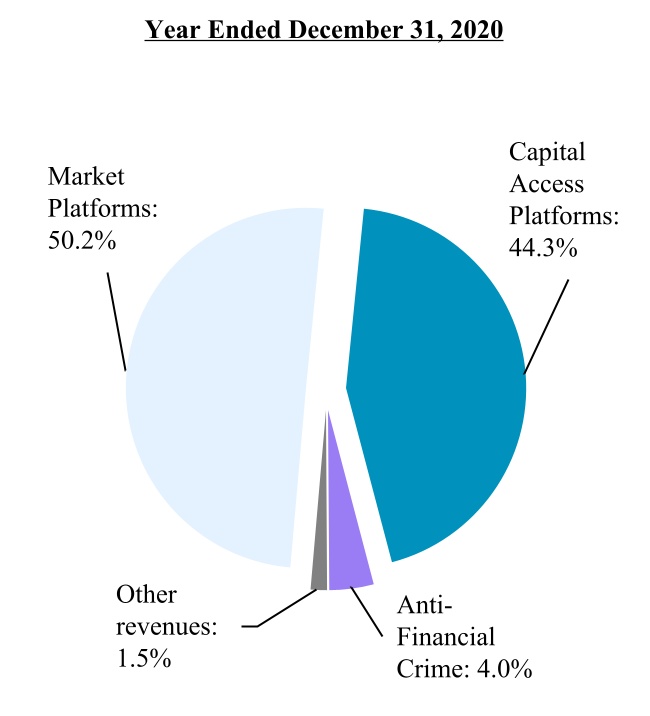
MARKET SERVICESPLATFORMS
The following tables present revenues from our Market Platforms segment:
| Year Ended December 31, | Percentage Change | |||||||||||||||||||
| 2022 | 2021 | 2020 | 2022 vs. 2021 | 2021 vs. 2020 | ||||||||||||||||
| (in millions) | ||||||||||||||||||||
| Trading Services | $ | 3,663 | $ | 3,503 | $ | 3,654 | 4.6 | % | (4.1) | % | ||||||||||
| Marketplace Technology | 562 | 545 | 525 | 3.1 | % | 3.8 | % | |||||||||||||
| Total Market Platforms | $ | 4,225 | $ | 4,048 | $ | 4,179 | 4.4 | % | (3.1) | % | ||||||||||
| Transaction-based expenses: | ||||||||||||||||||||
| Transaction rebates | (2,092) | (2,168) | (2,028) | (3.5) | % | 6.9 | % | |||||||||||||
| Brokerage, clearance and exchange fees | (552) | (298) | (694) | 85.2 | % | (57.1) | % | |||||||||||||
| Total Market Platforms, net | $ | 1,581 | $ | 1,582 | $ | 1,457 | (0.1) | % | 8.6 | % | ||||||||||
Trading Services
Our Trading Services business includes equity derivatives trading, cash equity trading, Nordic fixed income trading & clearing, U.S. Tape plans and other revenues. The following tables present net revenues by product from our Trading Services business:
| Year Ended December 31, | Percentage Change | |||||||||||||||||||
| 2022 | 2021 | 2020 | 2022 vs. 2021 | 2021 vs. 2020 | ||||||||||||||||
| (in millions) | ||||||||||||||||||||
| U.S. Equity Derivative Trading | $ | 371 | $ | 343 | $ | 287 | 8.2 | % | 19.5 | % | ||||||||||
| Cash Equity Trading | 397 | 429 | 381 | (7.5) | % | 12.6 | % | |||||||||||||
| U.S. Tape plans | 149 | 155 | 162 | (3.9) | % | (4.3) | % | |||||||||||||
| Other | 102 | 110 | 102 | (7.3) | % | 7.8 | % | |||||||||||||
| Trading Services, net | $ | 1,019 | $ | 1,037 | $ | 932 | (1.7) | % | 11.3 | % | ||||||||||
In the table showsabove, Other includes Nordic fixed income trading & clearing, Nordic derivatives, Nordic commodities, and Canadian cash equities trading.
U.S. Equity Derivative Trading
The following tables present total revenues, transaction-based expenses, and total revenues less transaction-based expenses as well as key drivers from our Market Services segment:
| Year Ended December 31, | Percentage Change | |||||||||||||||||
| 2017 | 2016 | 2015 | 2017 vs. 2016 | 2016 vs. 2015 | ||||||||||||||
| (in millions) | ||||||||||||||||||
| Market Services Revenues: | ||||||||||||||||||
Equity Derivative Trading and Clearing Revenues(1) | $ | 752 | $ | 541 | $ | 432 | 39.0 | % | 25.2 | % | ||||||||
| Transaction-based expenses: | ||||||||||||||||||
| Transaction rebates | (450 | ) | (288 | ) | (223 | ) | 56.3 | % | 29.1 | % | ||||||||
Brokerage, clearance and exchange fees(1) | (43 | ) | (25 | ) | (21 | ) | 72.0 | % | 19.0 | % | ||||||||
| Equity derivative trading and clearing revenues less transaction-based expenses | 259 | 228 | 188 | 13.6 | % | 21.3 | % | |||||||||||
Cash Equity Trading Revenues(2) | 1,279 | 1,349 | 1,315 | (5.2 | )% | 2.6 | % | |||||||||||
| Transaction-based expenses: | ||||||||||||||||||
| Transaction rebates | (692 | ) | (785 | ) | (756 | ) | (11.8 | )% | 3.8 | % | ||||||||
Brokerage, clearance and exchange fees(2) | (334 | ) | (309 | ) | (306 | ) | 8.1 | % | 1.0 | % | ||||||||
| Cash equity trading revenues less transaction-based expenses | 253 | 255 | 253 | (0.8 | )% | 0.8 | % | |||||||||||
| FICC Revenues | 96 | 99 | 98 | (3.0 | )% | 1.0 | % | |||||||||||
| Transaction-based expenses: | ||||||||||||||||||
| Transaction rebates | (16 | ) | (19 | ) | (4 | ) | (15.8 | )% | 375.0 | % | ||||||||
| Brokerage, clearance and exchange fees | (2 | ) | (2 | ) | (3 | ) | — | % | (33.3 | )% | ||||||||
| FICC revenues less transaction-based expenses | 78 | 78 | 91 | — | % | (14.3 | )% | |||||||||||
| Trade Management Services Revenues | 291 | 266 | 239 | 9.4 | % | 11.3 | % | |||||||||||
| Total Market Services revenues less transaction-based expenses | $ | 881 | $ | 827 | $ | 771 | 6.5 | % | 7.3 | % | ||||||||
U.S. Equity Derivative Trading and Clearing Revenues
| Year Ended December 31, | Percentage Change | |||||||||||||||||||
| 2022 | 2021 | 2020 | 2022 vs. 2021 | 2021 vs. 2020 | ||||||||||||||||
| (in millions) | ||||||||||||||||||||
| U.S. Equity Derivative Trading Revenues | $ | 1,252 | $ | 1,367 | $ | 1,122 | (8.4) | % | 21.8 | % | ||||||||||
| Section 31 fees | 89 | 32 | 69 | 178.1 | % | (53.6) | % | |||||||||||||
| Transaction-based expenses: | ||||||||||||||||||||
| Transaction rebates | (878) | (1,018) | (828) | (13.8) | % | 22.9 | % | |||||||||||||
| Section 31 fees | (89) | (32) | (69) | 178.1 | % | (53.6) | % | |||||||||||||
| Brokerage and clearance fees | (3) | (6) | (7) | (50.0) | % | (14.3) | % | |||||||||||||
| U.S. Equity derivative trading revenues, net | $ | 371 | $ | 343 | $ | 287 | 8.2 | % | 19.5 | % | ||||||||||
Section 31 fees are recorded as equity derivative trading and clearingcash equity derivative trading revenues with a corresponding amount recorded asin transaction-based expenses. In the U.S., weWe are assessed these fees from the SEC and pass them through to our customers in the form of incremental fees. Pass-through fees can increase or decrease due to rate changes by the SEC, our percentage of the overall industry volumes processed on our systems, and differences in actual dollar value of shares traded. The SEC implemented a fee increase in May 2022 and a decrease in February 2021. Since the amount recorded in revenues is equal to the amount recorded as transaction-based expenses,Section 31 fees, there is no impact on our net revenues.
| Year Ended December 31, | |||||||||||||||||
| 2022 | 2021 | 2020 | |||||||||||||||
| U.S. equity options | |||||||||||||||||
| Total industry average daily volume (in millions) | 38.2 | 37.2 | 27.7 | ||||||||||||||
| Nasdaq PHLX matched market share | 11.6 | % | 12.4 | % | 12.7 | % | |||||||||||
| The Nasdaq Options Market matched market share | 8.0 | % | 8.1 | % | 9.8 | % | |||||||||||
| Nasdaq BX Options matched market share | 2.8 | % | 1.4 | % | 0.2 | % | |||||||||||
| Nasdaq ISE Options matched market share | 5.7 | % | 6.6 | % | 7.8 | % | |||||||||||
| Nasdaq GEMX Options matched market share | 2.3 | % | 4.3 | % | 5.6 | % | |||||||||||
| Nasdaq MRX Options matched market share | 1.6 | % | 1.6 | % | 0.7 | % | |||||||||||
| Total matched market share executed on Nasdaq’s exchanges | 32.0 | % | 34.4 | % | 36.8 | % | |||||||||||
41
U.S. equity derivative trading revenues decreased in 2022 compared with 2021 primarily due to lower overall matched market share executed on Nasdaq's exchanges and lower gross capture rate, partially offset by higher industry trading volumes.
U.S. equity derivative trading revenues less transaction-based expenses. The increaseexpenses increased in 20172022 compared with 2016 is2021 primarily due to the inclusion of a full year of Section 31 fees from our acquisition of ISEhigher capture rates and higher industry trading volumes, and lower transaction rebates, partially offset by lower overall matched market share executed on Nasdaq's exchanges.
U.S. equity derivative trading and clearing revenues and U.S. equity derivative trading and clearing revenues less transaction-based expenses increased in 2021 compared with six months in 2016. The increase in 2016 compared with 2015 is2020 primarily due to the inclusion of six months of Section 31 fees from our acquisition of ISE.higher U.S. industry trading volumes, partially offset by lower overall U.S. matched market share executed on Nasdaq's exchanges and a lower capture rate.
Transaction rebates, in which we credit a portion of the per share execution charge to the market participant, increaseddecreased in both
Cash Equity Trading Revenues
The following tables present total revenues, transaction-based expenses, and total revenues less transaction-based expenses as well as key drivers and other metrics from our Cash Equity trading business:
| Year Ended December 31, | Percentage Change | |||||||||||||||||||
| 2022 | 2021 | 2020 | 2022 vs. 2021 | 2021 vs. 2020 | ||||||||||||||||
| (in millions) | ||||||||||||||||||||
| Cash Equity Trading Revenues | $ | 1,605 | $ | 1,578 | $ | 1,582 | 1.7 | % | (0.3) | % | ||||||||||
| Section 31 fees | 436 | 229 | 586 | 90.4 | % | (60.9) | % | |||||||||||||
| Transaction-based expenses: | ||||||||||||||||||||
| Transaction rebates | (1,184) | (1,118) | (1,169) | 5.9 | % | (4.4) | % | |||||||||||||
| Section 31 fees | (436) | (229) | (586) | 90.4 | % | (60.9) | % | |||||||||||||
| Brokerage and clearance fees | (24) | (31) | (32) | (22.6) | % | (3.1) | % | |||||||||||||
| Cash equity trading revenues, net | $ | 397 | $ | 429 | $ | 381 | (7.5) | % | 12.6 | % | ||||||||||
See discussion in "U.S. Equity Derivative Trading" for an explanation of Section 31 fees and the period over period analysis.
| Year Ended December 31, | |||||||||||||||||
| 2022 | 2021 | 2020 | |||||||||||||||
| Total U.S.-listed securities | |||||||||||||||||
| Total industry average daily share volume (in billions) | 11.9 | 11.4 | 10.9 | ||||||||||||||
| Matched share volume (in billions) | 522.8 | 491.9 | 508.3 | ||||||||||||||
| The Nasdaq Stock Market matched market share | 16.2 | % | 15.8 | % | 16.8 | % | |||||||||||
| Nasdaq BX matched market share | 0.5 | % | 0.6 | % | 0.9 | % | |||||||||||
| Nasdaq PSX matched market share | 0.8 | % | 0.7 | % | 0.6 | % | |||||||||||
| Total matched market share executed on Nasdaq’s exchanges | 17.5 | % | 17.1 | % | 18.3 | % | |||||||||||
| Market share reported to the FINRA/Nasdaq Trade Reporting Facility | 35.2 | % | 34.9 | % | 31.8 | % | |||||||||||
| Total market share | 52.7 | % | 52.0 | % | 50.1 | % | |||||||||||
| Nasdaq Nordic and Nasdaq Baltic securities | |||||||||||||||||
| Average daily number of equity trades executed on Nasdaq’s exchanges | 908,813 | 1,036,523 | 933,822 | ||||||||||||||
| Total average daily value of shares traded (in billions) | $ | 5.4 | $ | 6.4 | $ | 5.6 | |||||||||||
| Total market share executed on Nasdaq’s exchanges | 71.5 | % | 76.9 | % | 78.1 | % | |||||||||||
In the tables above, total market shares includes transactions executed on The Nasdaq Stock Market’s, Nasdaq BX’s and Nasdaq PSX’s systems plus trades reported through the FINRA/Nasdaq Trade Reporting Facility.
Cash equity trading revenues increased in 2022 compared with 2021 primarily due to higher U.S. industry trading volumes and cashhigher overall U.S. matched market share executed on Nasdaq's exchanges, partially offset by an unfavorable impact of changes in foreign exchange rates of $16 million, lower U.S. gross capture rate, lower European trading volumes and lower European market share executed on Nasdaq's exchanges.
Cash equity trading revenues less transaction-based expenses decreased in 20172022 compared with 2016 and increased in 2016 compared with 2015.
to lower U.S. industrycapture rate, the unfavorable impact of changes in foreign exchange rates of $16 million, lower European trading volumes partially offset by;
42
Cash equity trading revenues decreased in 2017 was also partially offset by an increase in Section 31 pass-through fee revenue.
Transaction rebates decreasedincreased in 20172022 compared with 2016 and increased in 2016 compared with 2015.2021. For The Nasdaq Stock Market Nasdaq PSX and Nasdaq Canada,PSX, we credit a portion of the per share execution charge to the market participant that
provides the liquidity, and for Nasdaq BX, we credit a portion of the per share execution charge to the market participant that takes the liquidity.
The decrease in 2017increase was primarily due to:
Nasdaq's exchanges and a lower rebate capture rate, partially offset by higher U.S. industry trading volumes;volumes.
U.S. Tape Plans
The following tables present revenues from our U.S. Tape plans business:
| Year Ended December 31, | Percentage Change | |||||||||||||||||||
| 2022 | 2021 | 2020 | 2022 vs. 2021 | 2021 vs. 2020 | ||||||||||||||||
| (in millions) | ||||||||||||||||||||
| U.S. Tape plans | $ | 149 | $ | 155 | $ | 162 | (3.9) | % | (4.3) | % | ||||||||||
U.S. Tape plans revenues decreased in 2022 compared with in 2021 and 2021 compared with 2020 primarily due to lower market share and usage.
Other
Other includes Nordic fixed income trading and clearing, Nordic derivatives, Nordic commodities and Canadian cash equities trading. The following tables present revenue and key driver from our Other business:
| Year Ended December 31, | Percentage Change | |||||||||||||||||||
| 2022 | 2021 | 2020 | 2022 vs. 2021 | 2021 vs. 2020 | ||||||||||||||||
| (in millions) | ||||||||||||||||||||
| Other | $ | 102 | $ | 110 | $ | 102 | (7.3) | % | 7.8 | % | ||||||||||
In the inclusiontable above, other includes transaction rebates of rebates associated$30 million, $32 million and $31 million in 2022, 2021 and 2020 respectively.
| Year Ended December 31, | |||||||||||||||||
| 2022 | 2021 | 2020 | |||||||||||||||
| Nasdaq Nordic and Nasdaq Baltic options and futures | |||||||||||||||||
| Total average daily volume of options and futures contracts | 296,626 | 287,182 | 320,204 | ||||||||||||||
In the tables above, Nasdaq Nordic and Nasdaq Baltic total average daily volume of options and futures contracts include Finnish option contracts traded on Eurex for which Nasdaq and Eurex have a revenue sharing arrangement.
Other revenues decreased in 2022 compared with our acquisition2021 primarily due to the unfavorable impact of Nasdaq Canada,changes in foreign exchange rates of $14 million and lower commodities products revenues, partially offset by a;higher European trading volumes and higher collateral management services revenues. Other revenues increased in 2021 compared with 2020 primarily due to the favorable impact of changes in foreign exchange rates of $5 million, higher capture rate and higher European clearing products revenues, partially offset by lower European trading volumes.
Marketplace Technology
Marketplace Technology includes our trade management services and market technology businesses.
The following tables present revenues and key drivers from our Marketplace Technology business:
| Year Ended December 31, | Percentage Change | |||||||||||||||||||
| 2022 | 2021 | 2020 | 2022 vs. 2021 | 2021 vs. 2020 | ||||||||||||||||
| (in millions) | ||||||||||||||||||||
| Marketplace Technology | $ | 562 | $ | 545 | $ | 525 | 3.1 | % | 3.8 | % | ||||||||||
| As of or Three Months Ended December 31, | ||||||||||||||||||||
| 2022 | 2021 | 2020 | ||||||||||||||||||
| (in millions) | ||||||||||||||||||||
| ARR | $ | 503 | $ | 479 | $ | 468 | ||||||||||||||
| Quarterly annualized SaaS revenues | 39 | 31 | 27 | |||||||||||||||||
| Order intake | $ | 264 | $ | 304 | $ | 167 | ||||||||||||||
In the table above, order intake is for our market technology business and represents the total contract value of orders signed during the period.
Marketplace technology revenues increased in 2022 compared with 2021 and 2021 compared with 2020 primarily due to higher trade management services revenues associated with increased demand for connectivity services, partially offset by lower market technology revenues. The decrease in our overall U.S. matched market share executed on Nasdaq’s exchanges.
43
CAPITAL ACCESS PLATFORMS
The following tables present revenues and key drivers from our Capital Access Platforms segment:
| Year Ended December 31, | Percentage Change | |||||||||||||||||||
| 2022 | 2021 | 2020 | 2022 vs. 2021 | 2021 vs. 2020 | ||||||||||||||||
| (in millions) | ||||||||||||||||||||
| Data & Listing Services | $ | 729 | $ | 680 | $ | 574 | 7.2 | % | 18.5 | % | ||||||||||
| Index | 486 | 459 | 324 | 5.9 | % | 41.7 | % | |||||||||||||
| Workflow & Insights | 469 | 429 | 389 | 9.3 | % | 10.3 | % | |||||||||||||
| Total Capital Access Platforms | $ | 1,684 | $ | 1,568 | $ | 1,287 | 7.4 | % | 21.8 | % | ||||||||||
| As of or Three Months Ended December 31, | |||||||||||||||||
| 2022 | 2021 | 2020 | |||||||||||||||
| (in millions) | |||||||||||||||||
| ARR | $ | 1,192 | $ | 1,113 | $ | 986 | |||||||||||
| Quarterly annualized SaaS revenues | $ | 388 | $ | 356 | $ | 323 | |||||||||||
Data & Listing Services Revenues
The following tables present key drivers from our Data & Listing Services business:
| Year Ended December 31, | ||||||||||||||||||||
| 2022 | 2021 | 2020 | ||||||||||||||||||
| IPOs | ||||||||||||||||||||
| The Nasdaq Stock Market | 161 | 752 | 316 | |||||||||||||||||
| Exchanges that comprise Nasdaq Nordic and Nasdaq Baltic | 38 | 174 | 45 | |||||||||||||||||
| Total new listings | ||||||||||||||||||||
| The Nasdaq Stock Market | 366 | 1,000 | 454 | |||||||||||||||||
| Exchanges that comprise Nasdaq Nordic and Nasdaq Baltic | 63 | 207 | 67 | |||||||||||||||||
| Number of listed companies | ||||||||||||||||||||
| The Nasdaq Stock Market | 4,230 | 4,178 | 3,392 | |||||||||||||||||
| Exchanges that comprise Nasdaq Nordic and Nasdaq Baltic | 1,251 | 1,235 | 1,071 | |||||||||||||||||
In the tables above:
•The Nasdaq Stock Market new listings include IPOs, including issuers that switched from other listing venues and separately listed ETPs. For the years ended December 31, 2022, 2021 and 2020, IPOs included 74, 433 and 132 SPACs, respectively.
•Exchanges that comprise Nasdaq Nordic and Nasdaq Baltic new listings include IPOs and represent companies listed on the Nasdaq Nordic and Nasdaq Baltic exchanges and companies on the alternative markets of Nasdaq First North.
•Number of total listed companies on The Nasdaq Stock Market for the years ended December 31, 2022, 2021 and 2020 included 528, 441 and 412 ETPs, respectively.
•Number of total listed companies on the exchanges that comprise Nasdaq Nordic and Nasdaq Baltic represents companies listed on these exchanges and companies on the alternative markets of Nasdaq First North.
Data & Listing Services revenues increased in 2022 compared with 2021 and 2021 compared with 2020. The increase in 20162022 was primarily due to an increase in Section 31 pass-through fees.
Index Revenues
The following tables present key drivers from our Index business:
| As of or Three Months Ended December 31, | ||||||||||||||||||||
| 2022 | 2021 | 2020 | ||||||||||||||||||
| Number of licensed ETPs | 379 | 362 | 339 | |||||||||||||||||
| TTM change in period end ETP AUM tracking Nasdaq indexes (in billions) | ||||||||||||||||||||
| Beginning balance | $ | 424 | $ | 359 | $ | 233 | ||||||||||||||
| Net (depreciation) appreciation | (142) | 83 | 80 | |||||||||||||||||
| Net impact of ETP sponsor switches | (1) | (92) | — | |||||||||||||||||
| Net inflows | 34 | 74 | 46 | |||||||||||||||||
| Ending balance | $ | 315 | $ | 424 | $ | 359 | ||||||||||||||
| Quarterly average ETP AUM tracking Nasdaq indexes (in billions) | $ | 326 | $ | 400 | $ | 334 | ||||||||||||||
| Quarterly annualized SaaS revenues (in millions) | $ | 220 | $ | 208 | $ | 179 | ||||||||||||||
In the table above, TTM represents trailing twelve months.
Index revenues increased in 2022 compared with 2021 and 2021 compared with 2020. The increase in 2022 was primarily due to higher licensing revenues from futures trading linked to the Nasdaq-100 Index, partially offset by lower AUM in ETPs linked to Nasdaq indexes. The increase in 2021 was primarily due to higher licensing revenues from higher average AUM in ETPs linked to Nasdaq indexes and higher licensing revenues from futures trading linked to the Nasdaq-100 Index.
44
Workflow & Insights Revenues
Workflow & Insights revenues increased in 2022 compared with 2021 and 2021 compared with 2020. The increase in both periods was due to an increase in both analytics and corporate solutions revenues. The increase in analytics revenues for both periods was primarily due to the growth in our eVestment and Solovis products driven by new sales, strong retention, and higher average revenue per client from expanded offerings. The increase in corporate solutions for both periods was due to higher adoption of our investor relations intelligence products as well as new ESG solutions, with ESG solutions being the primary driver of the increase in 2022.
ANTI-FINANCIAL CRIME
The following tables present revenues and key drivers from our Anti-Financial Crime segment:
| Year Ended December 31, | Percentage Change | |||||||||||||||||||
| 2022 | 2021 | 2020 | 2022 vs. 2021 | 2021 vs. 2020 | ||||||||||||||||
| (in millions) | ||||||||||||||||||||
| Anti-Financial Crime | $ | 306 | $ | 231 | $ | 116 | 32.5 | % | 99.1 | % | ||||||||||
| As of or Three Months Ended December 31, | ||||||||||||||||||||||||||
| 2022 | 2021 | 2020 | ||||||||||||||||||||||||
| (in millions) | ||||||||||||||||||||||||||
| ARR | $ | 312 | $ | 269 | $ | 111 | ||||||||||||||||||||
| Signed ARR | 338 | 288 | — | |||||||||||||||||||||||
| Quarterly annualized SaaS revenues | 298 | 253 | 97 | |||||||||||||||||||||||
In the table above, signed ARR reflects ARR recognized as revenue in the current period as well as ARR for new contracts signed but not yet commenced. We began tracking signed ARR in 2021 following our acquisition of Verafin, and thus there is no available metric for 2020.
Anti-financial crime revenues increased in 2022 compared with 2021 primarily due to an increase in demand for third party connectivity, co-location,fraud detection and test facilitiesanti-money laundering solutions and strong performance by our surveillance business in new sales to existing clients and new customer acquisitions. The increase was also driven by a $28 million purchase price adjustment on Verafin deferred revenue in 2021 and the inclusion of a full year of Verafin revenues from our acquisition of ISE compared with six months in 2016.2022. The increase in 20162021 compared with 2020 was primarily due to an increase in customer demand for network connectivity and the inclusion of six months of revenues from our acquisition of ISE.
Other revenues frominclude revenues related to our Corporate Services segment:
| Year Ended December 31, | Percentage Change | |||||||||||||||||
| 2017 | 2016 | 2015 | 2017 vs. 2016 | 2016 vs. 2015 | ||||||||||||||
| (in millions) | ||||||||||||||||||
| Corporate Services: | ||||||||||||||||||
| Corporate Solutions | $ | 386 | $ | 363 | $ | 298 | 6.3 | % | 21.8 | % | ||||||||
| Listing Services | 270 | 272 | 264 | (0.7 | )% | 3.0 | % | |||||||||||
| Total Corporate Services | $ | 656 | $ | 635 | $ | 562 | 3.3 | % | 13.0 | % | ||||||||
| Year Ended December 31, | Percentage Change | |||||||||||||||||
| 2017 | 2016 | 2015 | 2017 vs. 2016 | 2016 vs. 2015 | ||||||||||||||
| (in millions) | ||||||||||||||||||
| Information Services: | ||||||||||||||||||
| Data Products | $ | 454 | $ | 427 | $ | 399 | 6.3 | % | 7.0 | % | ||||||||
| Index Licensing and Services | 134 | 113 | 113 | 18.6 | % | — | % | |||||||||||
| Total Information Services | $ | 588 | $ | 540 | $ | 512 | 8.9 | % | 5.5 | % | ||||||||
also include a transitional services agreement associated with the acquisitions of ISE and Nasdaq Canada, and higher index data products revenues.a divested business.
| Year Ended December 31, | Percentage Change | |||||||||||||||||
| 2017 | 2016 | 2015 | 2017 vs. 2016 | 2016 vs. 2015 | ||||||||||||||
| (in millions) | ||||||||||||||||||
| Market Technology | $ | 303 | $ | 275 | $ | 245 | 10.2 | % | 12.2 | % | ||||||||
| Total Order Value | |||
| (in millions) | |||
| Fiscal year ended: | |||
| 2018 | $ | 263 | |
| 2019 | 204 | ||
| 2020 | 137 | ||
| 2021 | 102 | ||
| 2022 | 62 | ||
| 2023 and thereafter | 79 | ||
| Total | $ | 847 | |
Operating Expenses
The following table showspresents our operating expenses:
| Year Ended December 31, | Percentage Change | |||||||||||||||||||
| 2022 | 2021 | 2020 | 2022 vs. 2021 | 2021 vs. 2020 | ||||||||||||||||
| (in millions) | ||||||||||||||||||||
| Compensation and benefits | $ | 1,003 | $ | 938 | $ | 786 | 6.9 | % | 19.3 | % | ||||||||||
| Professional and contract services | 140 | 144 | 137 | (2.8) | % | 5.1 | % | |||||||||||||
| Computer operations and data communications | 207 | 186 | 151 | 11.3 | % | 23.2 | % | |||||||||||||
| Occupancy | 104 | 109 | 107 | (4.6) | % | 1.9 | % | |||||||||||||
| General, administrative and other | 125 | 85 | 142 | 47.1 | % | (40.1) | % | |||||||||||||
| Marketing and advertising | 51 | 57 | 39 | (10.5) | % | 46.2 | % | |||||||||||||
| Depreciation and amortization | 258 | 278 | 202 | (7.2) | % | 37.6 | % | |||||||||||||
| Regulatory | 33 | 64 | 24 | (48.4) | % | 166.7 | % | |||||||||||||
| Merger and strategic initiatives | 82 | 87 | 33 | (5.7) | % | 163.6 | % | |||||||||||||
| Restructuring charges | 15 | 31 | 48 | (51.6) | % | (35.4) | % | |||||||||||||
| Total operating expenses | $ | 2,018 | $ | 1,979 | $ | 1,669 | 2.0 | % | 18.6 | % | ||||||||||
| Year Ended December 31, | Percentage Change | |||||||||||||||||
| 2017 | 2016 | 2015 | 2017 vs. 2016 | 2016 vs. 2015 | ||||||||||||||
| (in millions) | ||||||||||||||||||
| Compensation and benefits | $ | 675 | $ | 664 | $ | 590 | 1.7 | % | 12.5 | % | ||||||||
| Professional and contract services | 156 | 153 | 148 | 2.0 | % | 3.4 | % | |||||||||||
| Computer operations and data communications | 125 | 111 | 107 | 12.6 | % | 3.7 | % | |||||||||||
| Occupancy | 95 | 86 | 85 | 10.5 | % | 1.2 | % | |||||||||||
| General, administrative and other | 82 | 72 | 65 | 13.9 | % | 10.8 | % | |||||||||||
| Marketing and advertising | 31 | 30 | 28 | 3.3 | % | 7.1 | % | |||||||||||
| Depreciation and amortization | 188 | 170 | 138 | 10.6 | % | 23.2 | % | |||||||||||
| Regulatory | 33 | 35 | 27 | (5.7 | )% | 29.6 | % | |||||||||||
| Merger and strategic initiatives | 44 | 76 | 10 | (42.1 | )% | 660.0 | % | |||||||||||
| Restructuring charges | — | 41 | 172 | (100.0 | )% | (76.2 | )% | |||||||||||
| Total operating expenses | $ | 1,429 | $ | 1,438 | $ | 1,370 | (0.6 | )% | 5.0 | % | ||||||||
The increase in compensation and benefits expense in 20172022 compared with 2021 was primarily duedriven by continued investment in employees to overall higher compensation costs resulting from our 2017drive growth and 2016 acquisitions and an unfavorableinflationary pressures, partially offset by a favorable impact from foreign exchange rates of $2 million,$42 million.
45
Headcount, including employees of non-wholly owned consolidated subsidiaries, increased to 6,377 employees as of December 31, 2022 from 5,814 as of December 31, 2021 reflecting growth across each of our three segments.
Professional and contract services expense decreased in 2022 compared with 2021 primarily due to a favorable impact from foreign exchange rates and a decrease in legal fees, partially offset by lower compensation expense reflecting lower performance incentives. Also impacting the change in compensation expense in 2017 was accelerated expense recorded in 2016 due to the retirement of the company's former CEO for equity awards previously granted. Thean increase in 2016 wasconsulting costs.
Computer operations and data communications expense increased in 2022 compared with 2021 primarily due to overall higher compensationsoftware costs resulting from our 2016 acquisitions and acceleratedhigher costs related to new cloud initiatives.
Occupancy expense decreased in 2022 compared with 2021 primarily due to the retirement of the company’s former CEO discussed above. Partially offsetting the 2016 increases was lower compensationa favorable impact from foreign exchange rates.
General, administrative and other expense increased in 2022 compared with 2021 primarily due to an accrual related to a legal matter and higher travel costs.
Marketing and advertising expense decreased in 2022 compared with 2021, reflecting lower performance incentivesIPO activity.
Depreciation and amortization expense decreased in 2022 compared with 2021 due to an impairment charge of $14 million in 2021 related to a finite-lived intangible asset for customer relationships associated with the wind down of a previous acquisition and a favorable impact from foreign exchange of $3 million.rates.
See Note 3,20, “Restructuring Charges,” to the consolidated financial statements for afurther discussion of our 2022 divisional alignment program and 2019 restructuring plans and charges recorded during 2016 and 2015.
associated with these plans.Non-operating Income and Expenses
The following table showspresents our non-operating income and expenses:
| Year Ended December 31, | Percentage Change | |||||||||||||||||
| 2017 | 2016 | 2015 | 2017 vs. 2016 | 2016 vs. 2015 | ||||||||||||||
| (in millions) | ||||||||||||||||||
| Interest income | $ | 7 | $ | 5 | $ | 4 | 40.0 | % | 25.0 | % | ||||||||
| Interest expense | (143 | ) | (135 | ) | (111 | ) | 5.9 | % | 21.6 | % | ||||||||
| Net interest expense | (136 | ) | (130 | ) | (107 | ) | 4.6 | % | 21.5 | % | ||||||||
| Asset impairment charge | — | (578 | ) | — | (100.0 | )% | N/M | |||||||||||
| Other investment income | 2 | 3 | — | (33.3 | )% | N/M | ||||||||||||
| Net income from unconsolidated investees | 15 | 2 | 17 | 650.0 | % | (88.2 | )% | |||||||||||
| Total non-operating expenses | $ | (119 | ) | $ | (703 | ) | $ | (90 | ) | (83.1 | )% | 681.1 | % | |||||
| Year Ended December 31, | Percentage Change | |||||||||||||||||||
| 2022 | 2021 | 2020 | 2022 vs. 2021 | 2021 vs. 2020 | ||||||||||||||||
| (in millions) | ||||||||||||||||||||
| Interest income | $ | 7 | $ | 1 | $ | 4 | 600.0 | % | (75.0) | % | ||||||||||
| Interest expense | (129) | (125) | (101) | 3.2 | % | 23.8 | % | |||||||||||||
| Net interest expense | (122) | (124) | (97) | (1.6) | % | 27.8 | % | |||||||||||||
| Net gain on divestiture of business | — | 84 | — | (100.0) | % | N/M | ||||||||||||||
| Other income | 2 | 81 | 5 | (97.5) | % | 1,520.0 | % | |||||||||||||
| Net income from unconsolidated investees | 31 | 52 | 70 | (40.4) | % | (25.7) | % | |||||||||||||
| Total non-operating income (expenses) | $ | (89) | $ | 93 | $ | (22) | (195.7) | % | (522.7) | % | ||||||||||
_______
N/M Not meaningful.
The following table presents our interest expense:
| Year Ended December 31, | Percentage Change | |||||||||||||||||||||||||
| 2022 | 2021 | 2020 | 2022 vs. 2021 | 2021 vs. 2020 | ||||||||||||||||||||||
| (in millions) | ||||||||||||||||||||||||||
| Interest expense on debt | $ | 120 | $ | 115 | $ | 93 | 4.3 | % | 23.7 | % | ||||||||||||||||
| Accretion of debt issuance costs and debt discount | 7 | 7 | 6 | — | % | 16.7 | % | |||||||||||||||||||
| Other fees | 2 | 3 | 2 | (33.3) | % | 50.0 | % | |||||||||||||||||||
| Interest expense | $ | 129 | $ | 125 | $ | 101 | 3.2 | % | 23.8 | % | ||||||||||||||||
Interest income increased in both 2017 and 20162022 compared with 2021 primarily due to an increase in interest rates.
Interest Expense
| Year Ended December 31, | Percentage Change | |||||||||||||||||
| 2017 | 2016 | 2015 | 2017 vs. 2016 | 2016 vs. 2015 | ||||||||||||||
| (in millions) | ||||||||||||||||||
| Interest expense on debt | $ | 135 | $ | 129 | $ | 106 | 4.7 | % | 21.7 | % | ||||||||
| Accretion of debt issuance costs and debt discount | 6 | 5 | 4 | 20.0 | % | 25.0 | % | |||||||||||
| Other bank and investment-related fees | 2 | 1 | 1 | 100.0 | % | — | % | |||||||||||
| Interest expense | $ | 143 | $ | 135 | $ | 111 | 5.9 | % | 21.6 | % | ||||||||
The net gain on divestiture of business in 2021 relates to lower cost debt. The increase in 2017the sale of our U.S. Fixed Income business, which was primarily associated withpart of our 2017FICC business within our Market Services segment. We recognized a pre-tax gain on the sale of $84 million, net of disposal costs. See “2021 Divestiture,” of Note 4, “Acquisitions and 2016 acquisitions and the increase in 2016 was primarily associated with our 2016 acquisitions.
46
Net income from unconsolidated investees decreased in 2017 and 20152022 compared with 2021 primarily relatesdue to a decrease in income recognized from our equity method investment in OCC. Net income from unconsolidated investees in 2016 includes income recognized from our equity method investments in OCC and EuroCCP N.V. , partially offset by the write-off of an equity method investment. See “Equity Method Investments,” of Note 7,6, “Investments,” to the consolidated financial statements for further discussion of our equity method investments. discussion.
Tax Matters
The Tax Cuts and Jobs Act was enacted on December 22, 2017 and is effective January 1, 2018. The new legislation contains several key provisions, including a reduction of the U.S. corporate income tax rate from 35% to 21%. We are required to remeasure all our U.S. deferred tax assets and liabilities as of December 22, 2017 and record the impact of such remeasurement in our 2017 financial statements. For the year ended December 31, 2017, we recorded a decrease to tax expense of $87 million, substantially all of which reflects the estimated impact associated with the remeasurement of our net U.S. deferred tax liability at the lower U.S. federal corporate income tax rate. The Tax Cuts and Jobs Act also imposes a transition tax on unremitted aggregate accumulated earnings of non-U.S. subsidiaries, which did not impact us.
| Year Ended December 31, | Percentage Change | |||||||||||||||||
| 2017 | 2016 | 2015 | 2017 vs. 2016 | 2016 vs. 2015 | ||||||||||||||
| ($ in millions) | ||||||||||||||||||
| Income tax provision | $ | 146 | $ | 28 | $ | 203 | 421.4 | % | (86.2 | )% | ||||||||
| Effective tax rate | 16.6 | % | 20.6 | % | 32.2 | % | ||||||||||||
| Year Ended December 31, | Percentage Change | |||||||||||||||||||
| 2022 | 2021 | 2020 | 2022 vs. 2021 | 2021 vs. 2020 | ||||||||||||||||
| (in millions) | ||||||||||||||||||||
| Income tax provision | $ | 352 | $ | 347 | $ | 279 | 1.4 | % | 24.4 | % | ||||||||||
| Effective tax rate | 23.9 | % | 22.6 | % | 23.0 | % | ||||||||||||||
For further discussion of our tax matters, see “Tax Matters,” and “Recent Accounting Pronouncements,” of Note 2, “Summary of Significant Accounting Policies,” and Note 11,17, “Income Taxes,” to the consolidated financial statements.
In addition to disclosing results determined in accordance with U.S. GAAP, we also have providedprovide non-GAAP net income attributable to Nasdaq and non-GAAP diluted earnings per share. Management uses this non-GAAP information internally, along with U.S. GAAP information, in evaluating our performance and in making financial and operational decisions. We believe our presentation of these measures provides investors with greater transparency and supplemental data relating to our financial condition and results of operations. In addition, we believe the presentation of these measures is useful to investors for period-to-period comparisons of results as the items described below do not reflectour ongoing operating performance.
These measures are not in accordance with, or an alternative to, U.S. GAAP, and may be different from non-GAAP measures used by other companies. In addition, other companies, including companies in our industry, may calculate such measures differently, which reduces their usefulness as comparative measures. Investors should not rely on any single financial measure when evaluating our business. This non-GAAP information should be considered as supplemental in nature and is not meant as a substitute for our operating results in accordance with U.S. GAAP. We
recommend investors review the U.S. GAAP financial measures included in this Annual Report on Form 10-K, including our consolidated financial statements and the notes thereto. When viewed in conjunction with our U.S. GAAP results and the accompanying reconciliation, we believe these non-GAAP measures provide greater transparency and a more complete understanding of factors affecting our business than U.S. GAAP measures alone.
We understand that analysts and investors regularly rely on non-GAAP financial measures, such as non-GAAP net income attributable to Nasdaq and non-GAAP diluted earnings per share, to assess operating performance. We use non-GAAP net income attributable to Nasdaq and non-GAAP diluted earnings per share because they highlight trends more clearly in our business that may not otherwise be apparent when relying solely on U.S. GAAP financial measures, since these measures eliminate from our results specific financial items that have less bearing on our ongoing operating performance. Non-GAAPWe believe that excluding the following items from the non-GAAP net
income attributable to Nasdaq for the periods presented below is calculated by adjusting for the following items:provides a more meaningful analysis of Nasdaq’s ongoing operating performance and comparisons in Nasdaq’s performance between periods:
•Amortization expense of acquired intangible assets: We amortize intangible assets acquired in connection with various acquisitions. Intangible asset amortization expense can vary from period to period due to episodic acquisitions completed, rather than from our ongoing business operations. As such, if intangible asset amortization is included in performance measures, it is more difficult to assess the day-to-day operating performance of the businesses and the relative operating performance of the businesses between periods, and the earnings power of Nasdaq. Performance measures excluding intangible asset amortization therefore provide investors with a more useful representation of our businesses’ ongoing activity in each period.periods.
•Merger and strategic initiatives expense: We have pursued various strategic initiatives and completed a number of acquisitions and divestitures in recent years whichthat have resulted in expenses which would not have otherwise been incurred. These expenses generally include integration costs, as well as legal, due diligence and other third party transaction costs. The frequency and the amount of such expenses vary significantly based on the size, timing and complexity of the transaction. Accordingly,These expenses primarily include integration costs, as well as legal, due diligence and other third-party transaction costs.
•Restructuring charges: In 2022, following our September announcement to realign our segments and leadership, we exclude these costsinitiated a divisional alignment program with a focus on realizing the full potential of this structure. In 2019, we initiated the transition of certain technology platforms to advance our strategic opportunities as a technology and analytics provider and continue the realignment of certain business areas. See Note 20, “Restructuring Charges,” to the consolidated financial statements for purposesfurther discussion of calculating non-GAAP measures which provide a more meaningful analysis of Nasdaq’s ongoing operating performance or comparison in Nasdaq’s performance between periods.
•Net income from unconsolidated investee: Our income on our investment in OCC may vary significantly compared to improve performance, cut costs and reduce spending and were primarily related to (i) severance and other termination benefits, (ii) asset impairment charges, and (iii) other charges. We exclude these restructuring costs because these costs do not reflect future operating expenses and do not contribute to a meaningful evaluation of Nasdaq’s ongoing operating performance or comparison of Nasdaq’s performance between periods.
47
•Other significant items: We have excluded certain other charges or gains, including certain tax items, that are the result of other non-comparable events to measure operating performance. We believeFor the exclusionyear ended December 31, 2022, other items include accruals related to a legal matter, included in general, administrative and other expense in our Consolidated Statements of such amounts allows managementIncome and investors to better understand the ongoing financial results of Nasdaq. For 2017, other significant items primarily include a make-whole redemption price premium paid on the early
•Significant tax items: The non-GAAP adjustment to the income tax provision for the years ended December 31, 2022 and 2021 primarily includes the tax impact of a separate equity method investment. For 2015, other significant items include income from our equity investment in OCC where we were not able to determine what our share of OCC’s income waseach non-GAAP adjustment. In addition, for the year ended December 31, 2014 until2021, the first quarter of 2015, when financial statements were made available to us. As a result, we recorded other income in the first quarter of 2015 relating to our share of OCC’s income for the year ended December 31, 2014. For 2015, other significant adjustments also included the reversal of a VAT refund.
The following table representstables present reconciliations between U.S. GAAP net income attributable to Nasdaq and diluted earnings per share and non-GAAP net income attributable to Nasdaq and diluted earnings per share:
| Year Ended December 31, | |||||||||||
| 2022 | 2021 | 2020 | |||||||||
| (in millions, except per share amounts) | |||||||||||
| U.S. GAAP net income attributable to Nasdaq | $ | 1,125 | $ | 1,187 | $ | 933 | |||||
| Non-GAAP adjustments: | |||||||||||
| Amortization expense of acquired intangible assets | 153 | 170 | 103 | ||||||||
| Merger and strategic initiatives expense | 82 | 87 | 33 | ||||||||
| Restructuring charges | 15 | 31 | 48 | ||||||||
| Net income from unconsolidated investee | (29) | (52) | (70) | ||||||||
| Regulatory matters | 1 | 33 | (6) | ||||||||
| Provision for notes receivable | — | — | 6 | ||||||||
| Extinguishment of debt | 16 | 33 | 36 | ||||||||
| Net gain on divestiture of business | — | (84) | — | ||||||||
| Charitable donations | — | — | 17 | ||||||||
| Other | 27 | (71) | 14 | ||||||||
| Total non-GAAP adjustments | 265 | 147 | 181 | ||||||||
| Total non-GAAP tax adjustments | (66) | (61) | (83) | ||||||||
| Total non-GAAP adjustments, net of tax | 199 | 86 | 98 | ||||||||
| Non-GAAP net income attributable to Nasdaq | $ | 1,324 | $ | 1,273 | $ | 1,031 | |||||
| U.S. GAAP effective tax rate | 23.9 | % | 22.6 | % | 23.0 | % | |||||
| Total adjustments from non-GAAP tax rate | 0.1 | % | 1.7 | % | 3.0 | % | |||||
| Non-GAAP effective tax rate | 24.0 | % | 24.3 | % | 26.0 | % | |||||
| Weighted-average common shares outstanding for diluted earnings per share | 497.9 | 505.1 | 500.7 | ||||||||
| U.S. GAAP diluted earnings per share | $ | 2.26 | $ | 2.35 | $ | 1.86 | |||||
| Total adjustments from non-GAAP net income | 0.40 | 0.17 | 0.20 | ||||||||
| Non-GAAP diluted earnings per share | $ | 2.66 | $ | 2.52 | $ | 2.06 | |||||
| Year Ended December 31, 2017 | Year Ended December 31, 2016 | Year Ended December 31, 2015 | ||||||||||||||||||||||
| Net Income | Diluted Earnings Per Share | Net Income | Diluted Earnings Per Share | Net Income | Diluted Earnings Per Share | |||||||||||||||||||
| (in millions, except share and per share amounts) | ||||||||||||||||||||||||
| U.S. GAAP net income attributable to Nasdaq and diluted earnings per share | $ | 734 | $ | 4.33 | $ | 108 | $ | 0.64 | $ | 428 | $ | 2.50 | ||||||||||||
| Non-GAAP adjustments: | ||||||||||||||||||||||||
| Amortization expense of acquired intangible assets | 92 | 0.54 | 82 | 0.49 | 62 | 0.36 | ||||||||||||||||||
| Merger and strategic initiatives | 44 | 0.26 | 76 | 0.45 | 10 | 0.06 | ||||||||||||||||||
| Extinguishment of debt | 10 | 0.06 | — | — | — | — | ||||||||||||||||||
| Restructuring charges | — | — | 41 | 0.24 | 172 | 1.00 | ||||||||||||||||||
| Asset impairment charge | — | — | 578 | 3.42 | — | — | ||||||||||||||||||
| Executive compensation | — | — | 12 | 0.07 | — | — | ||||||||||||||||||
| Regulatory matter | 1 | 0.01 | 6 | 0.04 | — | — | ||||||||||||||||||
| Income from OCC equity investment | — | — | — | — | (13 | ) | (0.08 | ) | ||||||||||||||||
| Reversal VAT refund | — | — | — | — | 12 | 0.07 | ||||||||||||||||||
| Sublease loss reserve | 2 | 0.01 | (1 | ) | (0.01 | ) | — | — | ||||||||||||||||
| Other | 2 | 0.01 | 6 | 0.04 | — | — | ||||||||||||||||||
| Adjustment to the income tax provision to reflect non-GAAP adjustments and other tax items | (70 | ) | (0.41 | ) | (287 | ) | (1.70 | ) | (90 | ) | (0.52 | ) | ||||||||||||
Impact of newly enacted U.S. tax legislation | (87 | ) | (0.51 | ) | — | — | — | — | ||||||||||||||||
Excess tax benefits related to employee share-based compensation | (40 | ) | (0.24 | ) | — | — | — | — | ||||||||||||||||
| Total non-GAAP adjustments, net of tax | (46 | ) | (0.27 | ) | 513 | 3.04 | 153 | 0.89 | ||||||||||||||||
| Non-GAAP net income attributable to Nasdaq and diluted earnings per share | $ | 688 | $ | 4.06 | $ | 621 | $ | 3.68 | $ | 581 | $ | 3.39 | ||||||||||||
| Weighted-average common shares outstanding for diluted earnings per share | 169,585,031 | 168,800,997 | 171,283,271 | |||||||||||||||||||||
LIQUIDITY AND CAPITAL RESOURCES
Historically, we have funded our operating activities and met our commitments through cash generated by operations, augmented by the periodic issuance of our common stock and debt. See Note 10, “Debt Obligations,” to the consolidated financial statements for further discussion. Currently, our cost and availability of funding remain healthy.
In the near term, we expect that our operations and the availability under our revolving credit commitmentfacility and commercial paper program will provide sufficient cash to fund our operating expenses, capital expenditures, debt repayments, any share repurchases and any dividends.
Principal factors that could affect the availability of our internally-generated funds include:
• deterioration of our revenues in any of our business segments;
• changes in regulatory and working capital requirements; and
•an increase in our expenses.
Principal factors that could affect our ability to obtain cash from external sources include:
• operating covenants contained in our credit facilities that limit our total borrowing capacity;
• credit rating downgrades, which could limit our access to additional debt;
• a significant decrease in the market price of our common stock; and
• volatility or disruption in the public debt and equity markets.
The following sections discuss the effects of changes in our financial assets, debt obligations, clearing and broker-dealer net capital requirements, and cash flows on our liquidity and capital resources.
| December 31, 2022 | December 31, 2021 | |||||||||||||
| (in millions) | ||||||||||||||
| Cash and cash equivalents | $ | 502 | $ | 393 | ||||||||||
| Financial investments | 181 | 208 | ||||||||||||
| Total financial assets | $ | 683 | $ | 601 | ||||||||||
| December 31, 2017 | December 31, 2016 | |||||||
| (in millions) | ||||||||
| Cash and cash equivalents | $ | 377 | $ | 403 | ||||
| Restricted cash | 22 | 15 | ||||||
| Financial investments, at fair value | 235 | 245 | ||||||
| Total financial assets | $ | 634 | $ | 663 | ||||
Cash and Cash Equivalents and Restricted Cash
Cash and cash equivalents includes all non-restricted cash in banks and highly liquid investments with original maturities of 90 days or less at the time of purchase. The balance retained in cash and cash equivalents is a function of anticipated or possible short-term cash needs, prevailing interest rates, our investment policy, and alternative investment choices. As of December 31, 2017,2022, our cash and cash equivalents of $377$502 million were primarily invested in bank deposits, money market funds and commercial paper. In the long-term, we may use both internally generated funds and external sources to satisfy our debt obligations and other long-term liabilities. Cash and cash equivalents as of December 31, 2017 decreased $262022 increased $109 million from December 31, 2016, primarily due to:2021.
Repatriation of Cash
Our cash and cash equivalents held outside of the U.S. in various foreign subsidiaries totaled $138$275 million as of December 31, 20172022 and $102$266 million as of December 31, 2016.2021. The remaining balance held in the U.S. totaled $239$227 million as of December 31, 20172022 and $301$127 million as of December 31, 2016.2021.
Unremitted earnings of certain subsidiaries outside of the U.S. are used to finance our international operations and are generally considered to be indefinitely reinvested. It is not our current intent to change this position. However,
Cash Flow Analysis
The following table summarizes the majoritychanges in cash flows:
| Year Ended December 31, | ||||||||||||||
| 2022 | 2021 | 2020 | ||||||||||||
| Net cash provided by (used in): | (in millions) | |||||||||||||
| Operating activities | $ | 1,706 | $ | 1,083 | $ | 1,252 | ||||||||
| Investing activities | 49 | (2,653) | (122) | |||||||||||
| Financing activities | 1,036 | 1,418 | 1,910 | |||||||||||
| Effect of exchange rate changes on cash and cash equivalents and restricted cash and cash equivalents | (1,293) | (331) | 353 | |||||||||||
| Net increase (decrease) in cash and cash equivalents and restricted cash and cash equivalents | 1,498 | (483) | 3,393 | |||||||||||
| Cash and cash equivalents, restricted cash and cash equivalents at beginning of period | 5,496 | 5,979 | 2,586 | |||||||||||
| Cash and cash equivalents, restricted cash and cash equivalents at end of period | $ | 6,994 | $ | 5,496 | $ | 5,979 | ||||||||
| Reconciliation of Cash, Cash Equivalents and Restricted Cash and Cash Equivalents | ||||||||||||||
| Cash and cash equivalents | $ | 502 | $ | 393 | $ | 2,745 | ||||||||
| Restricted cash and cash equivalents | 22 | 29 | 37 | |||||||||||
| Restricted cash and cash equivalents (default funds and margin deposits) | 6,470 | 5,074 | 3,197 | |||||||||||
| Total | $ | 6,994 | $ | 5,496 | $ | 5,979 | ||||||||
49
We have adjusted the presentation of the 2020 opening and ending amounts of cash, held outsidecash equivalents, and restricted cash and cash equivalents in our consolidated statements of cash flows to include restricted cash and cash equivalents related to the U.S.default funds and margin deposits. See Note 2, “Summary of Significant Accounting Policies,” to the consolidated financial statements for further discussion of this adjustment.
Net Cash Provided by Operating Activities
Net cash provided by operating activities primarily consists of net income adjusted for certain non-cash items such as: depreciation and amortization expense of property and equipment; amortization expense of acquired finite-lived intangible assets; expense associated with share-based compensation; deferred income taxes; expense associated with extinguishment of debt; net gain on divestiture of business; and net income from unconsolidated investees.
Net cash provided by operating activities is availablealso impacted by the effects of changes in operating assets and liabilities such as: accounts receivable and deferred revenue which are impacted by the timing of customer billings and related collections from our customers; accounts payable and accrued expenses due to timing of payments; accrued personnel costs, which are impacted by employee performance targets and the timing of payments related to employee bonus incentives; and Section 31 fees payable to the SEC, which is impacted by the changes in SEC fee rates and the timing of collections from customers and payments to the SEC.
Net cash provided by operating activities increased $623 million for repatriation, butthe year ended December 31, 2022 compared with the same period in 2021. The increase was primarily driven by Section 31 fees payable to the SEC due to higher SEC fee rates in 2022 and cash payments made in the second quarter of 2021 related to the acquisition of Verafin, including a tax obligation paid on behalf of Verafin of $221 million and a cash payment of $102 million, the release of which was subject to certain employment-related conditions following the closing of the acquisition of Verafin. During the fourth quarter of 2022, the remaining amount of the $102 million was accelerated and paid to the eligible former Verafin employees. The remaining change was primarily due to other fluctuations in our working capital.
Net Cash Provided by (Used in) Investing Activities
Net cash provided by investing activities for the year ended December 31, 2022 primarily related to net proceeds from sales and redemptions of investments related to default funds and margin deposits of $211 million and proceeds of $33 million from other investing activities, partially offset by purchases of property and equipment of $152 million and $41 million cash used for acquisitions, net of cash and cash equivalents acquired.
Net cash used in investing activities for the year ended December 31, 2021 primarily related to $2,430 million of cash used for acquisitions, net of cash and cash equivalents acquired, primarily $221 million of cash acquired that was utilized to satisfy an acquisition-related tax obligation on behalf of Verafin, $163 million of purchases of property and equipment, net purchases of investments related to default funds and margin deposits of $132 million, other investing activities of $87 million, and $31 million of net purchases of securities, partially offset by proceeds from the divestiture of a business, net of cash divested of $190 million.
Net Cash Provided by Financing Activities
Net cash provided by financing activities for the year ended December 31, 2022 primarily related to an increase in default funds and margin deposits of $2,440 million, proceeds of $541 million from the issuance of long-term-debt and proceeds of $238 million from the issuances of our commercial paper, net, partially offset by $1,097 million related to the repayment of our 2022 and 2024 Notes, $383 million of dividend payments to our shareholders, $325 million of repurchases of common stock pursuant to the ASR agreement and $308 million in other repurchases of common stock.
Net cash provided by financing activities for the year ended December 31, 2021 primarily related to an increase in default funds and margin deposits of $2,330 million, proceeds of $826 million from the issuances of long-term-debt and utilization of credit commitment and $420 million of proceeds from issuances of commercial paper, net, partially offset by repayment of borrowings under current lawour credit commitment and debt obligations of $804 million, $475 million of repurchases pursuant to the ASR agreement, $468 million in certain jurisdictions, could subject usother repurchases of common stock, $350 million of dividend payments to additional income taxes, less applicable foreign tax credits.
See “Share Repurchase Program,” of Note 14, “Nasdaq Stockholders’ Equity,4, “Acquisitions and Divestiture,” to the consolidated financial statements for further discussion of our share repurchase program.
| 2017 | 2016 | ||||||
| First quarter | $ | 0.32 | $ | 0.25 | |||
| Second quarter | 0.38 | 0.32 | |||||
| Third quarter | 0.38 | 0.32 | |||||
| Fourth quarter | 0.38 | 0.32 | |||||
| Total | $ | 1.46 | $ | 1.21 | |||
| Maturity Date | December 31, 2017 | December 31, 2016 | ||||||||
| (in millions) | ||||||||||
| Short-term debt - commercial paper | Weighted-average maturity of 22 days | $ | 480 | $ | — | |||||
| Long-term debt: | ||||||||||
| 5.25% senior unsecured notes | Repaid May 2017 | — | 369 | |||||||
| Senior unsecured floating rate notes | March 2019 | 498 | — | |||||||
| $400 million senior unsecured term loan facility | November 2019 | 100 | 399 | |||||||
| 5.55% senior unsecured notes | January 2020 | 599 | 598 | |||||||
| 3.875% senior unsecured notes | June 2021 | 716 | 625 | |||||||
| $1 billion revolving credit commitment | April 2022 | 110 | — | |||||||
| 1.75% senior unsecured notes | May 2023 | 712 | 622 | |||||||
| 4.25% senior unsecured notes | June 2024 | 496 | 495 | |||||||
| 3.85% senior unsecured notes | June 2026 | 496 | 495 | |||||||
| Total long-term debt | 3,727 | 3,603 | ||||||||
| Total debt obligations | $ | 4,207 | $ | 3,603 | ||||||
See Note 10,9, “Debt Obligations,” to the consolidated financial statements for further discussion of our debt obligations.
See “ASR Agreement,” “Share Repurchase Program,” and “Cash Dividends on Common Stock,” of Note 12, “Nasdaq Stockholders’ Equity,” to the consolidated financial statements for further discussion of our ASR agreement, share repurchase program and cash dividends paid on our common stock.
50
Financial Investments
Our financial investments totaled $181 million as of December 31, 2022 and Broker-Dealer Net$208 million as of December 31, 2021. Of these securities, $161 million as of December 31, 2022 and $162 million December 31, 2021, are assets primarily utilized to meet regulatory capital requirements, mainly for our clearing operations at Nasdaq Clearing. See Note 6, “Investments,” to the consolidated financial statements for further discussion.
Regulatory Capital Requirements
Clearing Operations Regulatory Capital Requirements
We are required to maintain minimum levels of regulatory capital for the clearing operations of Nasdaq Clearing. The level of regulatory capital required to be maintained is dependent upon many factors, including market conditions and creditworthiness of the counterparty. As of December 31, 2017,2022, our required regulatory capital of $160$125 million is primarilywas comprised of highly rated European government debt securities that are included in financial investments at fair value in the Consolidated Balance Sheets.
Broker-Dealer Net Capital Requirements
Our broker-dealer subsidiaries, Nasdaq Execution Services, Execution Access, NPM Securities, SMTX,NFSTX, LLC, and Nasdaq Capital Markets Advisory, are subject to regulatory requirements intended to ensure their general financial soundness and liquidity. These requirements obligate these subsidiaries to comply with minimum net capital requirements. The following table summarizes the net capital requirements for our broker-dealer subsidiaries asAs of December 31, 2017:
2022, the combined required minimum net capital totaled $1 million and the combined excess capital totaled $18 million, substantially all of which is held in cash and cash equivalents in the Consolidated Balance Sheets. The required minimum net capital is included in restricted cash and cash equivalents in the Consolidated Balance Sheets.| Broker-Dealer Subsidiaries | Total Net Capital | Required Minimum Net Capital | Excess Capital | |||||||||
| (in millions) | ||||||||||||
| Nasdaq Execution Services | $ | 7.3 | $ | 0.3 | $ | 7.0 | ||||||
| Execution Access | 47.7 | 0.4 | 47.3 | |||||||||
| NPM Securities | 0.2 | — | 0.2 | |||||||||
| SMTX | 1.5 | 0.3 | 1.2 | |||||||||
| Nasdaq Capital Markets Advisory | 0.5 | 0.3 | 0.2 | |||||||||
| Year Ended December 31, | Percentage Change | |||||||||||||||||
| 2017 | 2016 | 2015 | 2017 vs. 2016 | 2016 vs. 2015 | ||||||||||||||
| (in millions) | ||||||||||||||||||
| Net cash provided by (used in): | ||||||||||||||||||
| Operating activities | $ | 909 | $ | 776 | $ | 727 | 17.1 | % | 6.7 | % | ||||||||
| Investing activities | (890 | ) | (1,657 | ) | (435 | ) | (46.3 | )% | 280.9 | % | ||||||||
| Financing activities | (53 | ) | 948 | (400 | ) | (105.6 | )% | (337.0 | )% | |||||||||
| Effect of exchange rate changes on cash and cash equivalents and restricted cash | 15 | (6 | ) | (11 | ) | (350.0 | )% | (45.5 | )% | |||||||||
| Net increase (decrease) in cash and cash equivalents and restricted cash | (19 | ) | 61 | (119 | ) | (131.1 | )% | (151.3 | )% | |||||||||
| Cash and cash equivalents and restricted cash at beginning of period | 418 | 357 | 476 | 17.1 | % | (25.0 | )% | |||||||||||
| Cash and cash equivalents and restricted cash at end of period | $ | 399 | $ | 418 | $ | 357 | (4.5 | )% | 17.1 | % | ||||||||
Other Capital Requirements
We operate several other businesses, which are subject to local regulation and are required to maintain certain levels of $1,460regulatory capital. As of December 31, 2022, other required regulatory capital of $10 million, partially offset byprimarily related to Nasdaq Central Securities Depository, was primarily invested in European government debt securities that are included in financial investments in the Consolidated Balance Sheets and cash, paid for our 2017 acquisitions, net ofwhich is included in restricted cash and cash equivalents acquiredin the Consolidated Balance Sheets.
Equity and dividends
Stock Split Effected in the Form of $776 million.a Stock Dividend
See “Share Repurchase Program,” and “Cash Dividends on Common Stock,” of Note 14,12, “Nasdaq Stockholders’ Equity,” to the consolidated financial statements for further discussion of our share repurchase program andprogram.
ASR Agreement
See “ASR Agreement,” of Note 12, “Nasdaq Stockholders’ Equity,” to the consolidated financial statements for further discussion of our ASR agreement.
Cash Dividends on Common Stock
The following table presents our quarterly cash dividends paid per common share on our outstanding common stock.stock:
| 2022 | 2021 | ||||||||||
| First quarter | $ | 0.18 | $ | 0.16 | |||||||
| Second quarter | 0.20 | 0.18 | |||||||||
| Third quarter | 0.20 | 0.18 | |||||||||
| Fourth quarter | 0.20 | 0.18 | |||||||||
| Total | $ | 0.78 | $ | 0.70 | |||||||
See “Cash Dividends on Common Stock,” of Note 12, “Nasdaq Stockholders’ Equity,” to the consolidated financial statements for further discussion of the dividends.
51
Debt Obligations
The following table summarizes our debt obligations by contractual maturity:
| Maturity Date | December 31, 2022 | December 31, 2021 | ||||||||||||||||||
| (in millions) | ||||||||||||||||||||
| Short-term debt: | ||||||||||||||||||||
| Commercial paper | $ | 664 | $ | 420 | ||||||||||||||||
| 2022 Notes | December 2022 | — | 598 | |||||||||||||||||
| 2024 Notes | June 2024 | — | 499 | |||||||||||||||||
| Total short-term debt | $ | 664 | $ | 1,517 | ||||||||||||||||
| Long-term debt - senior unsecured notes: | ||||||||||||||||||||
| 2022 Credit Facility | December 2027 | (5) | (4) | |||||||||||||||||
| 2026 Notes | June 2026 | 498 | 498 | |||||||||||||||||
| 2029 Notes | March 2029 | 637 | 676 | |||||||||||||||||
| 2030 Notes | February 2030 | 637 | 676 | |||||||||||||||||
| 2031 Notes | January 2031 | 644 | 643 | |||||||||||||||||
| 2033 Notes | July 2033 | 653 | 694 | |||||||||||||||||
| 2040 Notes | December 2040 | 644 | 644 | |||||||||||||||||
| 2050 Notes | April 2050 | 486 | 486 | |||||||||||||||||
| 2052 Notes | March 2052 | 541 | — | |||||||||||||||||
| Total long-term debt | $ | 4,735 | $ | 4,313 | ||||||||||||||||
| Total debt obligations | $ | 5,399 | $ | 5,830 | ||||||||||||||||
In the table above, the 2024 Notes were reclassified to short-term debt as of March 31, 2022, and were repaid in April 2022.
In December 2022, Nasdaq amended and restated the 2020 Credit Facility with a new maturity date of December 16, 2027. In addition to the 2022 Credit Facility, we also have other credit facilities primarily to support our Nasdaq Clearing operations in Europe, as well as to provide a cash pool credit line for one subsidiary. These credit facilities, which are available in multiple currencies, totaled $184 million as of December 31, 2022 and $212 million as of December 31, 2021 in available liquidity, none of which was utilized.
As of December 31, 2022, we were in compliance with the covenants of all of our debt obligations.
See Note 9, “Debt Obligations,” to the consolidated financial statements for further discussion of our debt obligations.
Contractual Obligations and Contingent Commitments
Nasdaq has contractual obligations to make future payments under debt obligations by contract maturity, minimum rental commitments under non-cancelable operating leases, netlease payments, and other obligations. The following table shows thesesummarizes material cash requirements for known contractual and other obligations as of December 31, 2017:2022, and the estimated timing thereof.
| Payments Due by Period | |||||||||||||||||
| (in millions) | Total | <1 year | 1-3 years | 3-5 years | 5+ years | ||||||||||||
| Debt obligation by contractual maturity | $ | 7,188 | $ | 765 | $ | 224 | $ | 685 | $ | 5,514 | |||||||
| Operating lease obligations | 665 | 77 | 142 | 110 | 336 | ||||||||||||
| Purchase obligations | 453 | 86 | 104 | 91 | 172 | ||||||||||||
| Total | $ | 8,306 | $ | 928 | $ | 470 | $ | 886 | $ | 6,022 | |||||||
| Payments Due by Period | ||||||||||||||||||||
| Contractual Obligations | Total | Less than 1 year | 1-3 years | 3-5 years | More than 5 years | |||||||||||||||
| (in millions) | ||||||||||||||||||||
Debt obligations by contract maturity(1) | $ | 4,844 | $ | 612 | $ | 1,324 | $ | 1,076 | $ | 1,832 | ||||||||||
Minimum rental commitments under non-cancelable operating leases, net(2) | 439 | 87 | 140 | 102 | 110 | |||||||||||||||
Other obligations(3) | 18 | 14 | 4 | — | — | |||||||||||||||
| Total | $ | 5,301 | $ | 713 | $ | 1,468 | $ | 1,178 | $ | 1,942 | ||||||||||
•Operating lease obligations represent our undiscounted operating lease liabilities as of 992,247 sharesDecember 31, 2022, as well as legally binding minimum lease payments for leases signed but not yet commenced. See Note 16, “Leases,” to the consolidated financial statements for further discussion of Nasdaq common stockour leases.
•Purchase obligations primarily represent minimum outstanding obligations due under software license agreements. The balance as of December 31, 2022 is primarily comprised of our multi-year AWS partnership contract, which approximated certain tax benefits associatedreplaces our previous shorter term contracts, including those with no minimum spend commitment, and is not expected to increase our overall spend footprint with AWS over the transaction. Such contingent future issuanceslife of Nasdaq common stock will be paid ratably through 2027 if Nasdaq’s total gross revenues equal or exceed $25 million in each such year. The contingent future issuancesthe contract, based on projected growth and expansion of Nasdaq common stock are subject to anti-dilution protections and acceleration upon certain events.our existing AWS-based solutions.
Off-Balance Sheet Arrangements
For discussion of off-balance sheet arrangements see:
• Note 17,15, “Clearing Operations,” to the consolidated financial statements for further discussion of our non-cash default fund contributions and margin deposits received for clearing operations; and
• Note 19,18, “Commitments, Contingencies and Guarantees,” to the consolidated financial statements for further discussion of:
◦Guarantees issued and credit facilities available;
◦Other guarantees;
◦Routing brokerage activities;
◦Legal and regulatory matters; and
◦Tax audits.
Quantitative and Qualitative Disclosures About Market Risk
We have implemented policies and procedures to measure, manage, monitor and report risk exposures, which are reviewed regularly by management and the board of directors. We identify risk exposures and monitor and manage such risks on a daily basis.
We perform sensitivity analyses to determine the effects of market risk exposures. We may use derivative instruments solely to hedge financial risks related to our financial positions or risks that are incurred during the normal course of business. We do not use derivative instruments for speculative purposes.
Interest Rate Risk
We are subject to the risk of fluctuating interest rates in the normal course of business. Our exposure to market risk for changes in interest rates relates primarily to our financial investments and debt obligations, which are discussed below.
Financial Investments
As of December 31, 2017,2022, our investment portfolio was primarily comprised of trading securities, mainly highly rated European government debt securities, which pay a fixed rate of interest. These securities are subject to interest rate risk and the fair value of these securities will decrease in value if market interest rates increase. If market interest rates were to increase immediately and uniformly by a hypothetical 100 basis points from levels as of December 31, 2017,2022, the fair value of this portfolio would have declineddecline by $5$3 million.
Debt Obligations
As of December 31, 2017, substantially all2022, the majority of our debt obligations arewere fixed-rate obligations. Interest rates on certain tranches of notes are subject to adjustment to the extent our debt rating is downgraded below investment grade, as further discussed in Note 9, “Debt Obligations,” to the consolidated financial statements. While changes in interest rates will have no impact on the interest we pay on fixed-rate
obligations, we are exposed to changes in interest rates as a result of the issuance of our 2019 Notes, borrowings under our 20172022 Credit Facility, and 2016 Credit Facility, andas this facility has a variable interest rate. We are also exposed to changes in interest rates as a result of the amounts outstanding from the sale of commercial paper under our commercial paper program, all of which have variable interest rates. As of December 31, 2017,2022, we had principal amounts outstanding of $500 million on the 2019 Notes, $115 million under the 2017 Credit Facility, $100 million under the 2016 Credit Facility and $480$664 million of commercial paper.paper and no amounts outstanding under our 2022 Credit Facility. A hypothetical 100 basis points increase in interest rates on our outstanding 2019 Notes, the 2017 Credit Facility, the 2016 Credit Facility and our outstanding commercial paper would increase our annual interest expense by approximately $12$7 million based on borrowings as of December 31, 2017.
2022.We may utilize interest rate swap agreements to achieve a desired mix of variable and fixed rate debt.
Foreign Currency Exchange Rate Risk
| Euro | Swedish Krona | Other Foreign Currencies | U.S. Dollar | Total | ||||||||||||||||||||||||||||||||||||||||||||||||
| (in millions, except currency rate) | ||||||||||||||||||||||||||||||||||||||||||||||||||||
| Year Ended December 31, 2017 | ||||||||||||||||||||||||||||||||||||||||||||||||||||
| Euro | Swedish Krona | Other Foreign Currencies | U.S. Dollar | Total | ||||||||||||||||||||||||||||||||||||||||||||||||
| (in millions, except currency rate) | ||||||||||||||||||||||||||||||||||||||||||||||||||||
| Year Ended December 31, 2022 | Year Ended December 31, 2022 | |||||||||||||||||||||||||||||||||||||||||||||||||||
| Average foreign currency rate to the U.S. dollar | 1.1273 | 0.1170 | # | N/A | N/A | Average foreign currency rate to the U.S. dollar | 1.054 | 0.099 | # | N/A | N/A | |||||||||||||||||||||||||||||||||||||||||
| Percentage of revenues less transaction-based expenses | 9.7 | % | 8.8 | % | 6.0 | % | 75.5 | % | 100.0 | % | Percentage of revenues less transaction-based expenses | 6.2 | % | 5.1 | % | 4.1 | % | 84.6 | % | 100.0 | % | |||||||||||||||||||||||||||||||
| Percentage of operating income | 15.4 | % | 3.2 | % | (4.9 | )% | 86.3 | % | 100.0 | % | Percentage of operating income | 10.1 | % | (2.8) | % | (10.6) | % | 103.3 | % | 100.0 | % | |||||||||||||||||||||||||||||||
| Impact of a 10% adverse currency fluctuation on revenues less transaction-based expenses | $ | (24 | ) | $ | (21 | ) | $ | (14 | ) | $ | — | $ | (59 | ) | Impact of a 10% adverse currency fluctuation on revenues less transaction-based expenses | $ | (22) | $ | (18) | $ | (15) | $ | — | $ | (55) | |||||||||||||||||||||||||||
| Impact of a 10% adverse currency fluctuation on operating income | $ | (15 | ) | $ | (3 | ) | $ | (5 | ) | $ | — | $ | (23 | ) | Impact of a 10% adverse currency fluctuation on operating income | $ | (16) | $ | (4) | $ | (17) | $ | — | $ | (37) | |||||||||||||||||||||||||||
| Euro | Swedish Krona | Other Foreign Currencies | U.S. Dollar | Total | Euro | Swedish Krona | Other Foreign Currencies | U.S. Dollar | Total | |||||||||||||||||||||||||||||||||||||||||||
| (in millions, except currency rate) | (in millions, except currency rate) | |||||||||||||||||||||||||||||||||||||||||||||||||||
| Year Ended December 31, 2016 | ||||||||||||||||||||||||||||||||||||||||||||||||||||
| Year Ended December 31, 2021 | Year Ended December 31, 2021 | |||||||||||||||||||||||||||||||||||||||||||||||||||
| Average foreign currency rate to the U.S. dollar | 1.1064 | 0.1168 | # | N/A | N/A | Average foreign currency rate to the U.S. dollar | 1.183 | 0.117 | # | N/A | N/A | |||||||||||||||||||||||||||||||||||||||||
| Percentage of revenues less transaction-based expenses | 10.0 | % | 8.5 | % | 5.9 | % | 75.6 | % | 100.0 | % | Percentage of revenues less transaction-based expenses | 7.1 | % | 6.2 | % | 4.9 | % | 81.8 | % | 100.0 | % | |||||||||||||||||||||||||||||||
| Percentage of operating income | 18.3 | % | 1.0 | % | (5.9 | )% | 86.6 | % | 100.0 | % | Percentage of operating income | 10.4 | % | (4.6) | % | (9.1) | % | 103.3 | % | 100.0 | % | |||||||||||||||||||||||||||||||
| Impact of a 10% adverse currency fluctuation on revenues less transaction-based expenses | $ | (23 | ) | $ | (19 | ) | $ | (14 | ) | $ | — | $ | (56 | ) | Impact of a 10% adverse currency fluctuation on revenues less transaction-based expenses | $ | (24) | $ | (21) | $ | (17) | $ | — | $ | (62) | |||||||||||||||||||||||||||
| Impact of a 10% adverse currency fluctuation on operating income | $ | (15 | ) | $ | (1 | ) | $ | (5 | ) | $ | — | $ | (21 | ) | Impact of a 10% adverse currency fluctuation on operating income | $ | (15) | $ | (7) | $ | (13) | $ | — | $ | (35) | |||||||||||||||||||||||||||
____________
# Represents multiple foreign currency rates.
N/A Not applicable.
53
Our investments in foreign subsidiaries are exposed to volatility in currency exchange rates through translation of the foreign subsidiaries’ net assets or equity to U.S. dollars. Substantially all of our foreign subsidiaries operate in functional currencies other than the U.S. dollar. Fluctuations in currency exchange rates may create volatility in our results of operations as we are
comprehensive loss within stockholders’ equity in the Consolidated Balance Sheets.
Our primary exposure to net assets in foreign currencies as of December 31, 20172022 is presented in the following table:
| Net Assets | Impact of a 10% Adverse Currency Fluctuation | |||||||||||||
| (in millions) | ||||||||||||||
| Swedish Krona | $ | 2,941 | $ | 294 | ||||||||||
| British Pound | 155 | 15 | ||||||||||||
| Norwegian Krone | 150 | 15 | ||||||||||||
| Canadian Dollar | 107 | 11 | ||||||||||||
| Australian Dollar | 99 | 10 | ||||||||||||
| Euro | 53 | 5 | ||||||||||||
| Net Assets | Impact of a 10% Adverse Currency Fluctuation | |||||||
| (in millions) | ||||||||
Swedish Krona(1) | $ | 3,541 | $ | (354 | ) | |||
| Norwegian Krone | 200 | (20 | ) | |||||
| Canadian Dollar | 193 | (19 | ) | |||||
| British Pound | 202 | (20 | ) | |||||
| Euro | 144 | (14 | ) | |||||
| Australian Dollar | 104 | (10 | ) | |||||
Credit Risk
Credit risk is the potential loss due to the default or deterioration in credit quality of customers or counterparties. We are exposed to credit risk from third parties, including customers, counterparties and clearing agents. These parties may default on their obligations to us due to bankruptcy, lack of liquidity, operational failure or other reasons. We limit our exposure to credit risk by rigorously evaluating the counterparties with which we make investments and execute agreements. The financialFor our investment portfolio, our objective is to invest in securities to preserve principal while maximizing yields, without significantly increasing risk. Credit risk associated with investments is minimized substantially by ensuring that these financial assets are placed with governments which have investment grade ratings, well-capitalized financial institutions and other creditworthy counterparties.
Our subsidiary, Nasdaq Execution Services, may be exposed to credit risk due to the default of trading counterparties in connection with the routing services it provides for our trading customers. System trades in cash equities routed to other market centers for members of our cash equity exchanges are routed by Nasdaq Execution Services for clearing to the NSCC. In this function, Nasdaq Execution Services is to be neutral by the end of the trading day, but may be exposed to intraday risk if a trade extends beyond the trading day and into the next day, thereby leaving Nasdaq Execution Services susceptible to counterparty risk in the period between accepting the trade and routing it to the clearinghouse. In this interim period, Nasdaq Execution Services is not novating like a clearing broker but instead is subject to the short-term risk of counterparty failure before the clearinghouse enters the transaction. Once the
clearinghouse officially accepts the trade for novation, Nasdaq Execution Services is legally removed from trade execution risk. However, Nasdaq has membership obligations to NSCC independent of Nasdaq Execution Services’ arrangements.
Pursuant to the rules of the NSCC and Nasdaq Execution Services’ clearing agreement, Nasdaq Execution Services is liable for any losses incurred due to a counterparty or a clearing
agent’s failure to satisfy its contractual obligations, either by making payment or delivering securities. Adverse movements in the prices of securities that are subject to these transactions can increase our credit risk. However, we believe that the risk of material loss is limited, as Nasdaq Execution Services’ customers are not permitted to trade on margin and NSCC rules limit counterparty risk on self-cleared transactions by establishing credit limits and capital deposit requirements for all brokers that clear with NSCC. Historically, Nasdaq Execution Services has never incurred a liability due to a customer’s failure to satisfy its contractual obligations as counterparty to a system trade. Credit difficulties or insolvency, or the perceived possibility of credit difficulties or insolvency, of one or more larger or visible market participants could also result in market-wide credit difficulties or other market disruptions.
We are exposed to credit risk through our clearing operations with Nasdaq Clearing. See Note 17, “Clearing Operations,” to the consolidated financial statements for further discussion.
We also are exposed to credit risk through our clearing operations with Nasdaq Clearing. See Note 15, “Clearing Operations,” to the consolidated financial statements for further discussion. Our clearinghouse holds material amounts of clearing member cash deposits, which are held or invested primarily to provide security of capital while minimizing credit, market and liquidity risks. While we seek to achieve a reasonable rate of return, we are primarily concerned with preservation of capital and managing the risks associated with these deposits. As the clearinghouse may pass on interest revenues (minus costs) to the members, this could include negative or reduced yield due to market conditions. The following is a summary of the risks associated with these deposits and how these risks are mitigated.
54
•Liquidity Risk. Liquidity risk is the risk a clearinghouse may not be able to meet its payment obligations in the right currency, in the right place and the right time. To mitigate this risk, the clearinghouse monitors liquidity requirements closely and maintains funds and assets in a manner which minimizes the risk of loss or delay in the access by the clearinghouse to such funds and assets. For example, holding funds with a central bank where possible or investing in highly liquid government debt instruments serves to reduce liquidity risks.
•Interest Rate Risk. Interest rate risk is the risk that interest rates rise causing the value of purchased securities to decline. If we were required to sell securities prior to maturity, and interest rates had risen, the sale of the securities might be made at a loss relative to the latest market price. Our clearinghouse seeks to manage this risk by making short term investments of members' cash deposits. In addition, the clearinghouse investment guidelines allow for direct purchases or repurchase agreements with short dated maturities of high quality sovereign debt (for example, European government and U.S. Treasury securities), central bank certificates and multilateral development bank debt instruments.
•Security Issuer Risk. Security issuer risk is the risk that an issuer of a security defaults on its payment when the security matures. This risk is mitigated by limiting allowable investments and collateral under reverse repurchase agreements to high quality sovereign, government agency or multilateral development bank debt instruments.
Critical Accounting Policies and Estimates
The preparation of financial statements and related disclosures in conformity with U.S. GAAP requires management to make judgments, assumptions, and estimates that affect the amounts reported in the consolidated financial statements and accompanying notes. Note 2, “Summary of Significant Accounting Policies,” to the consolidated financial statements describes the significant accounting policies and methods used in the preparation of the consolidated financial statements. The accounting policies described below are significantly affected by critical accounting estimates. Such accounting policies require significant judgments, assumptions, and estimates used in the preparation of the consolidated financial statements, and actual results could differ materially from the amounts reported based on these policies.
Revenue Recognition
We generally recognize revenue over time as our customers simultaneously receive and consume the benefits provided by our performance because our customer controls the asset for which we are creating, our performance does not create an asset with alternative use, and we have a right to payment for performance completed to date. For these services, we recognize revenue over time using costs incurred to date relative to total estimated costs at completion to measure progress toward satisfying our performance obligation. Incurred costs represent work performed, which corresponds with, and thereby depicts, the transfer of control to the customer.
Accounting for our long-term contracts requires judgment relative to assessing risks and their impact on the estimate of revenues and costs. Our estimates are impacted by factors such as the potential for schedule and technical issues, productivity and the complexity of work performed. Revenue and cost estimates for our long-term contracts are reviewed and reassessed at least quarterly. When adjustments in estimated total contract costs are required, any judgments or assumptions by management as these amountschanges in the estimated revenues from prior estimates are recognized ratably overin the following 12-month period. However, listingcurrent period for the effect of additional shares fees and initial listing fees are recognizedsuch change. If estimates of total costs to be incurred on a straight-line basis overcontract exceed estimates of total revenues, a provision for the entire estimated service periods, which are four and six years, respectively, basedloss on our historical listing experience and projected future listing duration. Unamortized balances arethe contract is recorded as deferred revenue in the Consolidated Balance Sheets.period in which the loss is determined.
For further discussion related to recognition of these revenues, see “Revenue fromFrom Contracts with Customers.” See “Recent Accounting Pronouncements,Customers - Revenue Recognition - Marketplace Technology,” of Note 2, “Summary of Significant Accounting Policies,” to the consolidated financial statements for further discussion.statements.
55
Goodwill, Indefinite-Lived Intangible Assets and Related Impairment Testing
Assets acquired and liabilities assumed in connection with our acquisitions are recorded at their estimated fair values. Goodwill represents the excess of purchase price over the value assigned to the net assets, including identifiable intangible assets, of a business acquired. Goodwill is allocated to our reporting units based on the assignment of the fair values of each reporting unit of the acquired company. We test goodwillrecognize specifically identifiable intangibles, such as customer relationships, technology, exchange and clearing registrations, trade names and licenses when a specific right or contract is acquired. Goodwill and intangible assets deemed to have indefinite useful lives, primarily exchange and clearing registrations, are not amortized but instead are tested for impairment at the reporting unit levelleast annually as of October 1 and more frequently whenever events or changes in interim periods if certain events occur indicatingcircumstances indicate that the carrying amountfair value of the asset may be impaired,less than its carrying amount, such as changes in the business climate, poor indicators of operating performance or the sale or disposition of a significant portion of a reporting unit. For purposes
In September 2022, we announced a new organizational structure which aligns our businesses more closely with the foundational shifts that are driving the evolution of performingthe global financial system. Our four previous reportable segments, Market Services, Corporate Platforms, Investment Intelligence and Market Technology have been changed to align with our new corporate structure that includes three segments: Market Platforms, Capital Access Platforms and Anti-Financial Crime. Under ASC 350-20, “Intangibles Goodwill and Other,” when a company reorganizes its reporting structure, an impairment test must be performed both before and after the change, and goodwill must be reassigned to reporting units. Accordingly, goodwill was reassigned based on relative fair value of each reporting unit.
We perform our goodwill impairment test at the reporting unit level. For 2022, we performed the goodwill impairment test under our five reporting units are theprevious organizational structure: Market Services segment, the two businesses comprising the Corporate Platforms segment: Listing Services segment:and Corporate Solutions, and Listing Services, the Information ServicesInvestment Intelligence segment, and the Market Technology segment.segment, which represented our five reporting units. We also performed the test for impairment during the fourth quarter ofunder our fiscal year using an October 1 measurement date. current organization structure, which includes three reporting units: Market Platforms segment, Capital Access Platforms segment and Anti-Financial Crime segment.
When testing goodwill and indefinite-lived intangible assets for impairment, we have the option of first performing a qualitative
assessment to determine whether it is more likely than not that the fair value of a reporting unit or indefinite-lived intangible asset is less than itstheir respective carrying amountamounts as the basis to determine if it is necessary to perform a quantitative goodwill impairment test. In performing a qualitative assessment, we consider the extent to which unfavorable events or circumstances identified, such as changes in economic conditions, industry and market conditions or company specific events, could affect the comparison of the reporting unit’s fair value with its carrying amount. If we choose not to complete a qualitative assessment, for a given reporting unit, or if the initial assessment indicates that it is more likely than not that the carrying amount of a reporting unit or the carrying amount of an indefinite-lived intangible asset exceeds itstheir respective estimated fair value,values, a quantitative test is required.
The following table presents the balances of goodwill for our reportable segments pre-segment realignment at the time of our 20172022 annual impairment test:
| October 1, 2017 | |||
| (in millions) | |||
| Market Services | $ | 3,560 | |
| Corporate Services | 491 | ||
| Information Services | 1,915 | ||
| Market Technology | 188 | ||
| $ | 6,154 | ||
| October 1, 2022 | |||||
| (in millions) | |||||
| Market Technology | $ | 2,122 | |||
| Investment Intelligence | 2,256 | ||||
| Corporate Platforms | 471 | ||||
| Market Services | 3,097 | ||||
| $ | 7,946 | ||||
56
The following table presents the balances of goodwill for our reportable segments post segment realignment at the time of our 2022 annual impairment test. The carrying value of goodwill was reassigned to our new reportable segments based on a relative fair value allocation approach.
| October 1, 2022 | |||||
| (in millions) | |||||
| Market Platforms | $ | 2,819 | |||
| Capital Access Platforms | 4,122 | ||||
| Anti-Financial Crime | 1,005 | ||||
| $ | 7,946 | ||||
In 2017,2022 and 2021, we performedelected to perform a quantitative test for our annual impairment test for goodwill as several years had elapsed sinceand indefinite-lived intangible assets. In conducting the date of certainquantitative assessment, we determined that the fair value of our quantitative valuations. The last quantitative tests were in 2013 for the Listing Services, Information Services and Market Technology reporting units and in 2015 for the Market Services reporting unit. We also performed a quantitative goodwill impairment test on the remaining businesses in our Corporate Solutions reporting unit since our Public Relations Solutions and Digital Media Services businesses have been classified as held for sale. See Note 5, “Assets and Liabilities Held for Sale,” to the consolidated financial statements for further discussion.
Although we believe our estimates of fair value are reasonable, the determination of certain valuation inputs is subject to management’s judgment. Changes in these inputs could materially affect the results of our impairment review. If our forecasts of cash flows or other key inputs are negatively revised in the future, the estimated fair value of each reporting unit and of our indefinite-lived intangible assets would be adversely impacted, potentially leading to an impairment in the future that could materially affect our operating results.
Subsequent to our annual impairment test, no indications of impairment were identified.
Other Long-Lived Assets and Related Impairment
We review our other long-lived assets, such as finite-lived intangible assets, equity and cost method investments, as well as property and equipment, and operating lease assets for potential impairment when there is evidence that events or changes in circumstances indicate that the carrying amount of an asset may not be recoverable. The carrying amount of an asset is not recoverable if it exceeds the sum of the undiscounted cash flows expected to result from the use and eventual disposition of the asset. We evaluate our equity and cost method investments for other-than-temporary declines in value by considering a variety of factors such as the earnings capacity of the investment and the fairFair value of the investment compared to its carrying amount. In addition, for investments where the market valuefinite-lived intangible assets and property and equipment is readily determinable, we
There were no material finite-lived intangible assets impairment charges in 2022 and 2020. We recorded an impairment charge of $14 million in 2021 related to a finite-lived intangible asset for customer relationships associated with the wind down of a previous acquisition included in depreciation and amortization expense in the Consolidated Statements of Income.
We recorded pre-tax, non-cash property and equipment asset impairment charges of $9 million for the year ended December 31, 2017, $8 million for 2016in 2022, $4 million in 2021 and $18$14 million for 2015. See Note 8, “Propertyin 2020. The asset impairment charges in 2022 and Equipment, net,”2020 primarily related to the consolidated financial statements for further discussion. The impairment charge in 2017 is included in mergercapitalized software that was retired and strategic initiatives expense in the Consolidated Statements of Income and the 2016 and 2015 impairment charges are included in restructuring charges in the Consolidated Statements of Income during the respective period.
No othermaterial impairments of equity method investments were recorded in 2017, 2016to reduce the carrying value of our other long-lived assets during 2022, 2021 or 2015.2020.
Income Taxes
Estimates and judgments are required in the calculation of certain tax liabilities and in the determination of the recoverability of certain deferred tax assets, which arise from net operating loss carryforwards, tax credit carryforwards and temporary differences between the tax and financial statement recognition of revenuerevenues and expense.expenses. Our deferred tax assets are reduced by a valuation allowance if it is more likely than not that some portion or all of the recorded deferred tax assets will not be realized in future periods. Management is required to determine whether a tax position is more likely than not to be sustained upon examination, including resolution of any related appeals or litigation processes, based on the technical merits of the position. Once it is determined that a position meets the recognition thresholds, the position is measured to determine the amount of benefit to be recognized in the consolidated financial statements. Interest and/or penalties related to income tax matters are recognized in income tax expense.
In assessing the need for a valuation allowance, we consider all available evidence including past operating results, the existence of cumulative losses in the most recent fiscal years, estimates of future taxable income and the feasibility of tax planning strategies. In the event that we change our determination as to the amount of deferred tax assets that can be realized, we will adjust our valuation allowance with a corresponding impact to the provision for income taxes in the period in which such determination is made.
In addition, the calculation of our tax liabilities involves uncertainties in the application of tax regulations in the U.S. and other tax jurisdictions. We recognize potential liabilities for anticipated tax audit issues in such jurisdictions based on our
estimate of whether, and the extent to which, additional taxes and interest may be due. While we believe that our tax liabilities reflect the probable outcome of identified tax uncertainties, it is reasonably possible that the ultimate resolution of any tax matter may be greater or less than the amount accrued. If events occur and the payment of these amounts ultimately proves unnecessary, the reversal of the liabilities would result in tax benefits being recognized in the period when we determine the liabilities are no longer necessary. If our estimate of tax liabilities proves to be less than the ultimate assessment, a further charge to expense would result.
Recent Accounting Pronouncements Not Yet Adopted
Item 7A. Quantitative and Qualitative Disclosures About MarketRisk. Risk
Information about quantitative and qualitative disclosures about market risk is incorporated herein by reference from “Item 7. Management’s Discussion and Analysis of Financial Condition and Results of Operations—Operations - Quantitative and Qualitative Disclosures About Market Risk.”
Item 8. Financial Statements and SupplementaryData. Data
Nasdaq’s consolidated financial statements, including Consolidated Balance Sheets as of December 31, 20172022 and 2016,2021, Consolidated Statements of Income for the years ended December 31, 2017, 20162022, 2021 and 2015,2020, Consolidated Statements of Comprehensive Income (Loss) for the years ended December 31, 2017, 20162022, 2021 and 2015,2020, Consolidated Statements of Changes in Stockholders' Equity for the years ended December 31, 2017, 20162022, 2021 and 2015,2020, Consolidated Statements of Cash Flows for the years ended December 31, 2017, 20162022, 2021 and 20152020 and notes to our consolidated financial statements, together with a report thereon of Ernst & Young LLP, dated February 28, 2018,23, 2023, are attached hereto as pages F-1 through F-52F-44 and incorporated by reference herein.
1st Qtr 2017 | 2nd Qtr 2017 | 3rd Qtr 2017 | 4th Qtr 2017 | |||||||||||||
| (in millions, except per share amounts) | ||||||||||||||||
| Total revenues | $ | 971 | $ | 1,000 | $ | 969 | $ | 1,024 | ||||||||
| Transaction-based expenses | (388 | ) | (398 | ) | (362 | ) | (389 | ) | ||||||||
| Revenues less transaction-based expenses | 583 | 602 | 607 | 635 | ||||||||||||
| Total operating expenses | 335 | 358 | 343 | 392 | ||||||||||||
| Operating income | 248 | 244 | 264 | 243 | ||||||||||||
| Net income attributable to Nasdaq | $ | 169 | $ | 147 | $ | 171 | $ | 246 | ||||||||
| Basic earnings per share | $ | 1.02 | $ | 0.89 | $ | 1.03 | $ | 1.47 | ||||||||
| Diluted earnings per share | $ | 0.99 | $ | 0.87 | $ | 1.01 | $ | 1.45 | ||||||||
| Cash dividends declared per common share | $ | 0.32 | $ | 0.38 | $ | 0.38 | $ | 0.38 | ||||||||
| 1st Qtr 2016 | 2nd Qtr 2016 | 3rd Qtr 2016 | 4th Qtr 2016 | |||||||||||||
| (in millions, except per share amounts) | ||||||||||||||||
| Total revenues | $ | 905 | $ | 897 | $ | 929 | $ | 973 | ||||||||
| Transaction-based expenses | (371 | ) | (338 | ) | (344 | ) | (374 | ) | ||||||||
| Revenues less transaction-based expenses | 534 | 559 | 585 | 599 | ||||||||||||
| Total operating expenses | 315 | 385 | 352 | 386 | ||||||||||||
| Operating income | 219 | 174 | 233 | 213 | ||||||||||||
| Net income (loss) attributable to Nasdaq | $ | 132 | $ | 70 | $ | 131 | $ | (224 | ) | |||||||
| Basic earnings (loss) per share | $ | 0.80 | $ | 0.42 | $ | 0.79 | $ | (1.35 | ) | |||||||
| Diluted earnings (loss) per share | $ | 0.78 | $ | 0.42 | $ | 0.77 | $ | (1.35 | ) | |||||||
| Cash dividends declared per common share | $ | 0.57 | $ | — | $ | 0.32 | $ | 0.32 | ||||||||
Item 9. Changes in and Disagreements with Accountants on Accountingand FinancialDisclosure. Disclosure
None.
Item 9A. Controls andProcedures. Procedures
Management’s Report on Internal Control Over Financial Reporting
Management is responsible for the preparation and integrity of the consolidated financial statements appearing in the reports that we file with the SEC. The consolidated financial statements were prepared in conformity with U.S. generally accepted accounting principles and include amounts based on management’s estimates and judgments.
Management is also responsible for establishing and maintaining adequate internal control over Nasdaq’s financial reporting. Although there are inherent limitations in the effectiveness of any system of internal control over financial reporting, we maintain a system of internal control that is designed to provide reasonable assurance as to the fair and reliable preparation and presentation of the consolidated financial statements, as well as to safeguard assets from unauthorized use or disposition that could have a material effect on the financial statements.
Our management assessed the effectiveness of our internal control over financial reporting as of December 31, 2017,2022, based on criteria established in Internal Control—Integrated Framework issued by the Committee of Sponsoring Organizations of the Treadway Commission (COSO) (2013 framework). This evaluation included review of the documentation of controls, evaluation of the design effectiveness of controls, testing of the operating effectiveness of controls and a conclusion on this evaluation. Based on its assessment, our management believes that, as of December 31, 2017,2022, our internal control over financial reporting is effective.
Ernst & Young LLP, an independent registered public accounting firm, has issued an attestation report on Nasdaq’s internal control over financial reporting, which is included herein.
58
Report of Independent Registered Public Accounting Firm
To the Shareholders and the Board of Directors of Nasdaq, Inc.
Opinion on Internal Control over Financial Reporting
We have audited Nasdaq, Inc.’s internal control over financial reporting as of December 31, 2017,2022, based on criteria established in Internal Control-IntegratedControl—Integrated Framework issued by the Committee of Sponsoring Organizations of the Treadway Commission (2013 framework) (the COSO criteria). In our opinion, Nasdaq, Inc. (the Company) maintained, in all material respects, effective internal control over financial reporting as of December 31, 2017,2022, based on the COSO criteria.
We also have audited, in accordance with the standards of the Public Company Accounting Oversight Board (United States) (PCAOB), the consolidated balance sheets of the Company as of December 31, 20172022 and 2016, and2021, the related consolidated statements of income, comprehensive income, (loss), changes in stockholders’ equity and cash flows for each of the three years in the period ended December 31, 2017,2022, and the related notes and our report dated February 28, 201823, 2023 expressed an unqualified opinion thereon.
Basis for Opinion
The Company’s management is responsible for maintaining effective internal control over financial reporting and for its assessment of the effectiveness of internal control over financial reporting included in the accompanying Management’s Report on Internal Control Over Financial Reporting. Our responsibility is to express an opinion on the Company’s internal control over financial reporting based on our audit. We are a public accounting firm registered with the PCAOB and are required to be independent with respect to the Company in accordance with the U.S. federal securities laws and the applicable rules and regulations of the Securities and Exchange Commission and the PCAOB.
We conducted our audit in accordance with the standards of the PCAOB. Those standards require that we plan and perform the audit to obtain reasonable assurance about whether effective internal control over financial reporting was maintained in all material respects.
Our audit included obtaining an understanding of internal control over financial reporting, assessing the risk that a material weakness exists, testing and evaluating the design and operating effectiveness of internal control based on the assessed risk, and performing such other procedures as we considered necessary in the circumstances. We believe that our audit provides a reasonable basis for our opinion.
Definition and Limitations of Internal Control Over Financial Reporting
A company’s internal control over financial reporting is a process designed to provide reasonable assurance regarding the reliability of financial reporting and the preparation of financial statements for external purposes in accordance with generally accepted accounting principles. A company’s internal control over financial reporting includes those policies and procedures that (1) pertain to the maintenance of records that, in reasonable detail, accurately and fairly reflect the transactions and dispositions of the assets of the company; (2) provide reasonable assurance that transactions are recorded as necessary to permit preparation of financial statements in accordance with generally accepted accounting principles, and that receipts and expenditures of the company are being made only in accordance with authorizations of management and directors of the company; and (3) provide reasonable assurance regarding prevention or timely detection of unauthorized acquisition, use, or disposition of the company’s assets that could have a material effect on the financial statements.
Because of its inherent limitations, internal control over financial reporting may not prevent or detect misstatements. Also, projections of any evaluation of effectiveness to future periods are subject to the risk that controls may become inadequate because of changes in conditions, or that the degree of compliance with the policies or procedures may deteriorate.
/s/Ernst & Young LLP
New York, New York
February 28, 2018
59
Item 9B. OtherInformation. Information
None.
Item 9C. Disclosure Regarding Foreign Jurisdictions that Prevent Inspections
Not applicable.
PART III
Item 10. Directors, Executive Officers and CorporateGovernance. Governance
Information about Nasdaq’s directors, as required by Item 401 of Regulation S-K, is incorporated by reference from the discussion under the caption “Board of Directors—Proposal I: Election of Directors”“Director Nominees” in Nasdaq’s Proxy Statement. Information about Nasdaq’s executive officers, as required by Item 401 of Regulation S-K, is incorporated by reference from the discussion under the caption “Other Items—ExecutiveItems-Executive Officers” in the Proxy Statement. Information about Section 16 reports, as required by Item 405 of Regulation S-K, is incorporated by reference from the discussion under the caption “Section“Other Items-Delinquent Section 16(a) Beneficial Ownership Reporting Compliance”Reports” in the Proxy Statement. Information about Nasdaq’s code of ethics, as required by Item 406 of Regulation S-K, is incorporated by reference from the discussion under the caption “Other Items—Corporate Governance”“Operating with Integrity” in the Proxy Statement. Information about Nasdaq’s nomination procedures, audit committeeAudit & Risk Committee and audit committeeAudit & Risk Committee financial experts, as required by Items 407(c)(3), 407(d)(4) and 407(d)(5) of Regulation S-K, is incorporated by reference from the discussions under the headings “Board of Directors—Proposal I: Election of Directors”“Director Nominees” and “Board of Directors—Board Committees” in the Proxy Statement.
Item 11. Executive Compensation.Compensation
Information about Nasdaq’s director and executive compensation, as required by Items 402, 407(e)(4) and 407(e)(5) of Regulation S-K, is incorporated by reference from the discussions under the headings “Board of Directors—Director“Director Compensation” and “Named Executive Officer“Executive Compensation” in the Proxy Statement.
Item 12. Security Ownership of Certain Beneficial Owners and Management and Related StockholderMatters. Matters
Information about security ownership of certain beneficial owners and management, as required by Item 403 of Regulation S-K, is incorporated by reference from the discussion under the heading “Other Items—SecurityItems-Security Ownership of Certain Beneficial Owners and Management” in the Proxy Statement.
Equity Compensation Plan and ESPP Information
Nasdaq’s Equity Plan provides for the issuance of our equity securities to our officersall employees and other employees, directors and consultants. as part of their compensation plan.
In addition, most employees of Nasdaq and its subsidiaries are eligible to participatein jurisdictions where participation in the ESPP is permitted, all our employees are eligible. Employees may purchase shares of our common stock at 85.0%a 15% discount to the lesser of the fair market valueclosing price of our common stock on (i) the price calculation date. first trading day of the offering period or (ii) the last trading day of the offering period. Offering periods under the ESPP are six months in duration. As of December 31, 2022, all our employees are eligible to participate.
The Equity Plan and the ESPP have been previously approved previously by our stockholders. The following table sets forth information regarding outstanding options and shares reserved for future issuance under all of Nasdaq’s compensation plans as of December 31, 2017.
| Plan Category | Number of shares to be issued upon exercise of outstanding options, warrants and rights(a) | Weighted-average exercise price of outstanding options, warrants and rights(b) | Number of shares remaining available for future issuance under equity compensation plans (excluding shares reflected in column(a))(c) | |||||||||||||||||
| Equity compensation plans approved by stockholders | 1,420,323 | $ | 41.79 | 38,534,312 | ||||||||||||||||
| Equity compensation plans not approved by stockholders | — | — | — | |||||||||||||||||
| Total | 1,420,323 | $ | 41.79 | 38,534,312 | ||||||||||||||||
In the table above:
•The number of shares to be issued upon exercise of outstanding options, warrants and rights include only the number of shares to be issued upon exercise of outstanding options, warrants and rights. As of December 31, 2022, we also had 6,347,055 shares to be issued upon vesting of outstanding restricted stock and PSUs.
•The number of shares remaining available for future issuance under equity compensation plans (excluding shares reflected in column (a) includes 26,430,038 shares of common stock that may be awarded pursuant to the Equity Plan and (b) 12,104,274 shares of common stock that may be issued pursuant to the ESPP.
| Plan Category | Number of shares to be issued upon exercise of outstanding options, warrants and rights(a)(1) | Weighted-average exercise price of outstanding options, warrants and rights(b) | Number of shares remaining available for future issuance under equity compensation plans (excluding shares reflected in column(a))(c) | ||||||||
| Equity compensation plans approved by stockholders | 571,380 | $ | 43.84 | 7,891,426 | (2) | ||||||
| Equity compensation plans not approved by stockholders | — | $ | — | — | |||||||
| Total | 571,380 | $ | 43.84 | 7,891,426 | (2) | ||||||
Item 13. Certain Relationships and Related Transactions, and DirectorIndependence. Independence
Information about certain relationships and related transactions, as required by Item 404 of Regulation S-K, is incorporated herein by reference from the discussion under the heading “Other Items—CertainItems-Certain Relationships and Related Transactions” in the Proxy Statement. Information about director independence, as required by Item 407(a) of Regulation S-K, is incorporated herein by reference from the discussion under the heading “Board of Directors—Proposal I: Election of Directors”“Director Nominees” in the Proxy Statement.
60
Item 14. Principal Accountant Fees andServices. Services
Information about principal accountant fees and services, as required by Item 9(e) of Schedule 14A, is incorporated herein by reference from the discussion under the heading “Audit Committee Matters—& Risk Annual Evaluation and 20182023 Selection of the Independent Auditors”Auditor” in the Proxy Statement.
Item 15. Exhibits and FinancialStatement Schedules.Schedules
(a)(1) Financial Statements
See “Index to Consolidated Financial Statements.”
(a)(2) Financial Statement Schedules
All schedules are omitted because they are not applicable or the required information is included in the consolidated financial statements or notes.
(a)(3) Exhibits
| Exhibit Number | ||||||||
| Share Purchase Agreement, dated as of November 18, 2020, by and among Osprey Acquisition Corporation, a wholly owned subsidiary of Nasdaq, Verafin Holdings Inc., certain shareholders of Verafin (the “Sellers”), and Shareholder Representative Services LLC, solely in its capacity as the representative of the Sellers (incorporated herein by reference to Exhibit 2.2 to the Annual Report on Form 10-K for the year ended December 31, 2020 filed on February 23, 2021).† | ||||||||
| Amendment to Share Purchase Agreement, dated as of | ||||||||
| Amended and Restated Certificate of Incorporation of Nasdaq (incorporated herein by reference to Exhibit 3.1 to the Current Report on Form 8-K filed on January 28, 2014). | ||||||||
| Certificate of Elimination of Nasdaq’s Series A Convertible Preferred Stock (incorporated herein by reference to Exhibit 3.1.1 to the Current Report on Form 8-K filed on January 28, 2014). | ||||||||
| Certificate of Amendment of Nasdaq’s Amended and Restated Certificate of Incorporation (incorporated herein by reference to Exhibit 3.1 to the Current Report on Form 8-K filed on November 19, 2014). | ||||||||
| Certificate of Amendment of Nasdaq’s Amended and Restated Certificate of Incorporation (incorporated herein by reference to Exhibit 3.1 to the Current Report on Form 8-K filed on September 8, 2015). | ||||||||
| Certificate of Amendment of Nasdaq’s Amended and Restated Certificate of Incorporation (incorporated herein by reference to Exhibit 3.1 to the Current Report on Form 8-K filed on July 20, 2022). | ||||||||
| Nasdaq’s By-Laws (incorporated herein by reference to Exhibit 3.2 to the Current Report on Form 8-K filed on November 21, 2016). | ||||||||
| Form of Common Stock certificate (incorporated herein by reference to Exhibit 4.1 to the Quarterly Report on Form 10-Q for the quarter ended September 30, 2015 filed on November 4, 2015). | ||||||||
| Stockholders’ Agreement, dated as of February 27, 2008, between Nasdaq, Inc. (f/k/a The NASDAQ OMX Group, Inc.) and Borse Dubai Limited (incorporated herein by reference to Exhibit 10.2 to the Current Report on Form 8-K filed on March 3, 2008). | ||||||||
| First Amendment to Stockholders’ Agreement, dated as of February 19, 2009, between Nasdaq, Inc. (f/k/a The NASDAQ OMX Group, Inc.) and Borse Dubai Limited (incorporated herein by reference to Exhibit 4.10.1 to the Annual Report on Form 10-K for the year ended December 31, 2008 filed on February 27, 2009). | ||||||||
| Registration Rights Agreement, dated as of February 27, 2008, among Nasdaq, Inc. (f/k/a The NASDAQ OMX Group, Inc.), Borse Dubai Limited and Borse Dubai Nasdaq Share Trust (incorporated herein by reference to Exhibit 10.3 to the Current Report on Form 8-K filed on March 3, 2008). | ||||||||
| First Amendment to Registration Rights Agreement, dated as of February 19, 2009, among Nasdaq, Inc. (f/k/a The NASDAQ OMX Group, Inc.), Borse Dubai Limited and Borse Dubai Nasdaq Share Trust (incorporated herein by reference to Exhibit 4.11.1 to the Annual Report on Form 10-K for the year ended December 31, 2008 filed on February 27, 2009). | ||||||||
| Stockholders’ Agreement, dated as of December 16, 2010, between Nasdaq, Inc. (f/k/a The NASDAQ OMX Group, Inc.) and Investor AB (incorporated herein by reference to Exhibit 4.12 to the Annual Report on Form 10-K for the year ended December 31, 2010 filed on February 24, 2011). | ||||||||
| First Amendment to Nasdaq Stockholders’ Agreement, dated as of December 14, 2022, between Nasdaq, Inc. and Investor AB (incorporated herein by reference to Exhibit 4.1 to the Current Report on Form 8-K filed on December 16, 2022). | ||||||||
61
| Indenture, dated as of June 7, 2013, between Nasdaq, Inc. (f/k/a The NASDAQ OMX Group, Inc.) and Wells Fargo Bank, National Association, as Trustee (incorporated herein by reference to Exhibit 4.1 to the Current Report on Form 8-K filed on June 10, 2013). | ||||||||
| First Supplemental Indenture, dated as of June 7, 2013, among Nasdaq, Inc. (f/k/a The NASDAQ OMX Group, Inc.), Wells Fargo Bank, National Association, as Trustee, Deutsche Bank AG, London Branch, as paying agent, and Deutsche Bank Luxembourg S.A., as registrar and transfer agent (incorporated herein by reference to Exhibit 4.2 to the Current Report on Form 8-K filed on June 10, 2013). | ||||||||
| Second Supplemental Indenture, dated as of May 29, 2014, among Nasdaq, Inc. (f/k/a The NASDAQ OMX Group, Inc.) and Wells Fargo Bank, National Association, as Trustee (incorporated herein by reference to Exhibit 4.1 to the Current Report on Form 8-K filed on May 30, 2014). | ||||||||
| Third Supplemental Indenture, dated as of May 20, 2016, among Nasdaq, Inc., Wells Fargo Bank, National Association, as Trustee, and HSBC Bank USA, National Association, as paying agent and as registrar and transfer agent (incorporated herein by reference to the Current Report on Form 8-K filed on May 23, 2016). | ||||||||
| Fifth Supplemental Indenture, dated as of September 22, 2017, among Nasdaq, Inc. and Wells Fargo Bank, National Association, as Trustee (incorporated herein by reference to Exhibit 4.1 to the Current Report on Form 8-K filed on September 22, 2017). | ||||||||
| Seventh Supplemental Indenture, dated February 13, 2020, among Nasdaq, Inc., | ||||||||
| Eighth Supplemental Indenture, dated April 28, 2020, by and between Nasdaq, Inc. and Wells Fargo Bank, National Association, as Trustee (incorporated herein by reference to Exhibit 4.2 to the Current Report on Form 8-K filed on | ||||||||
| Ninth Supplemental Indenture, dated December 21, 2020, by and between Nasdaq, Inc. and Wells Fargo Bank, National Association, as Trustee (incorporated herein by reference to Exhibit 4.2 to the Current Report on Form 8-K filed on December 21, 2020). | ||||||||
| Tenth Supplemental Indenture, dated December 21, 2020, by and between Nasdaq, Inc. and Wells Fargo Bank, National Association, as Trustee (incorporated herein by reference to Exhibit 4.3 to the Current Report on Form 8-K filed on December 21, 2020). | ||||||||
| Eleventh Supplemental Indenture, dated December 21, 2020, by and between Nasdaq, Inc. and Wells Fargo Bank, National Association, as Trustee (incorporated herein by reference to Exhibit 4.4 to the Current Report on Form 8-K filed on December 21, 2020). | ||||||||
| Twelfth Supplemental Indenture, dated July 30, 2021, by and among Nasdaq, Inc., Wells Fargo Bank, National Association, as Trustee and HSBC Bank USA, National Association, as registrar and transfer agent (incorporated by reference to Exhibit 4.2 to the Company’s 8-A filed on July 30, 2021). | ||||||||
| Thirteenth Supplemental Indenture, dated as of March 7, 2022, by and between Nasdaq, Inc. and Computershare Trust Company, N.A. (as successor to Wells Fargo Bank, National Association), as trustee (incorporated by reference to Exhibit 4.2 to the Company's Current Report on Form 8-K filed on March 7, 2022). | ||||||||
| Description of Securities. | ||||||||
| Amended and Restated Board Compensation Policy, effective on | ||||||||
| Nasdaq Executive Corporate Incentive Plan, effective as of January 1, 2015 (incorporated herein by reference to Exhibit 10.1 to the Current Report on Form 8-K filed on May 11, 2015).* | ||||||||
| Nasdaq, Inc. Equity Incentive Plan (as amended and restated as of April 24, 2018) (incorporated herein by reference to Exhibit 10.1 to the Form S-8 filed on May 25, 2018).* | ||||||||
| Form of Nasdaq Non-Qualified Stock Option Award Certificate (incorporated herein by reference to Exhibit 10.3 to the Annual Report on Form 10-K for the year ended December 31, 2010 filed on February 24, 2011).* | ||||||||
| Form of Nasdaq Restricted Stock Unit Award Certificate (employees) | ||||||||
| Form of Nasdaq Restricted Stock Unit Award Certificate (directors) (incorporated herein by reference to Exhibit 10.2 to the Quarterly Report on Form 10-Q for the quarter ended June 30, 2022 filed on August 3, 2022).* | ||||||||
62
| Form of Nasdaq One-Year Performance Share Unit Agreement (incorporated herein by reference to Exhibit 10.4 to the Quarterly Report on Form 10-Q for the quarter ended June 30, 2019 filed on August 5, 2019).* | ||||||||
| Form of Nasdaq Three-Year Performance Share Unit Agreement (incorporated herein by reference to Exhibit 10.3 to the Quarterly Report on Form 10-Q for the quarter ended June 30, 2022 filed on August 3, 2022).* | ||||||||
| Form of Nasdaq Continuing Obligations Agreement (incorporated by reference to Exhibit 10.9 to the Company’s Annual Report on Form 10-K for the year ended December 31, 2021 filed on February 23, 2022). | ||||||||
| Amended and Restated Supplemental Executive Retirement Plan, dated as of December 17, 2008 (incorporated herein by reference to Exhibit 10.6 to the Annual Report on Form 10-K for the year ended December 31, 2008 filed on February 27, 2009).* | ||||||||
| Amendment No. 1 to Amended and Restated Supplemental Executive Retirement Plan, effective as of December 31, 2008 (incorporated herein by reference to Exhibit 10.6.1 to the Annual Report on Form 10-K for the year ended December 31, 2008 filed on February 27, 2009).* | ||||||||
| Nasdaq Supplemental Employer Retirement Contribution Plan, dated as of December 17, 2008 (incorporated herein by reference to Exhibit 10.7 to the Annual Report on Form 10-K for the year ended December 31, 2008 filed on February 27, 2009).* | ||||||||
| Nonqualified Stock Option Award Certificate to Adena T. Friedman from Nasdaq, Inc. in connection with grant made on January 3, 2017 (incorporated herein by reference to Exhibit 10.1 to the Quarterly Report on Form 10-Q for the quarter ended September 30, 2017 filed on November 7, 2017).* | ||||||||
| Employment | ||||||||
| Nonqualified Stock Option Award Certificate to Adena T. Friedman from Nasdaq, Inc. in connection with grant made on January 3, 2022 (incorporated by reference to Exhibit 10.15 to the Company’s Annual Report on Form 10-K for the year ended December 31, 2021 filed on February 23, 2022).* | ||||||||
| Employment Agreement by and between Nasdaq, Inc. and | ||||||||
| Employment Offer Letter by and between Nasdaq, Inc. and Michelle Daly (incorporated by reference to Exhibit 10.1 to the Current Report on Form 8-K filed on May 3, 2021).* | ||||||||
| Nasdaq Change in Control Severance Plan for Executive Vice Presidents and Senior Vice Presidents, effective November 26, 2013, as amended December 6, 2022.* | ||||||||
| Credit Agreement, dated as of December 21, 2020, among Nasdaq, Inc., the various lenders from time to time party thereto and, Bank of America, N.A., as administrative agent and issuing bank (incorporated herein by reference to Exhibit 10.1 to the Current Report on Form 8-K filed on | ||||||||
| Amended and Restated Credit Agreement, dated | ||||||||
| Form of Commercial Paper Dealer Agreement between Nasdaq, Inc., as Issuer, and the Dealer party thereto (incorporated herein by reference to Exhibit 10.3 to the Current Report on Form 8-K filed on April 26, 2017). | ||||||||
| Verafin Holdings Inc. Amended and Restated Management Incentive Plan* | ||||||||
| Verafin Holdings Inc. Amended and Restated Management Incentive Plan Award Agreement, by and between Verafin Solutions ULC and Brendan Brothers, dated as of January 11, 2023* | ||||||||
| Verafin Holdings Inc. Amended and Restated Management Incentive Plan Award Agreement, by and between Verafin Solutions ULC and Jamie King, dated as of October 18, 2022* | ||||||||
| Statement regarding computation of per share earnings (incorporated herein by reference from Note | ||||||||
63
| List of all subsidiaries. | ||||||||
| Consent of Ernst & Young LLP. | ||||||||
| Powers of Attorney. | ||||||||
| Certification of | ||||||||
| Certification of Executive Vice President | ||||||||
| Certifications Pursuant to 18 U.S.C. Section 1350, as adopted pursuant to Section 906 of Sarbanes-Oxley. | ||||||||
| 101 | ||||||||
| The following materials from the Nasdaq, Inc. Annual Report on Form 10-K for the year ended December 31, |
| Cover Page Interactive Data File, formatted in iXBRL and contained in Exhibit 101. |
* Management contract or compensatory plan or arrangement.
† Schedules have been omitted pursuant to Item 601(b)(2) of Regulation S-K.
(b) Exhibits:
See Item 15(a)(3) above.
(c) Financial Statement Schedules:
All schedules are omitted because they are not applicable or the required information is included in the consolidated financial statements or notes.
64
We have audited the accompanying consolidated balance sheets of Nasdaq, Inc. (the Company) as of December 31, 2017 and 2016, and the related consolidated statements of income, comprehensive income (loss), changes in equity and cash flows for each of the three years in the period ended December 31, 2017 and the related notes (collectively referred to as the “consolidated financial statements”). Inconducted our opinion, the consolidated financial statements present fairly, in all material respects, the financial position of the Company at December 31, 2017 and 2016, and the results of its operations and its cash flows for each of the three years in the period ended December 31, 2017, in conformity with U.S. generally accepted accounting principles.
Our audit included obtaining an understanding of internal control over financial reporting, assessing the risk that a material weakness exists, testing and evaluating the design and operating effectiveness of internal control based on the assessed risk, and performing such other procedures as we considered necessary in the circumstances. We believe that our audit provides a reasonable basis for our opinion.
Definition and Limitations of Internal Control Over Financial Reporting
A company’s internal control over financial reporting is a process designed to provide reasonable assurance regarding the reliability of financial reporting and the preparation of financial statements for external purposes in accordance with generally accepted accounting principles. A company’s internal control over financial reporting includes those policies and procedures that (1) pertain to the maintenance of records that, in reasonable detail, accurately and fairly reflect the transactions and dispositions of the assets of the company; (2) provide reasonable assurance that transactions are recorded as necessary to permit preparation of financial statements in accordance with generally accepted accounting principles, and that receipts and expenditures of the company are being made only in accordance with authorizations of management and directors of the company; and (3) provide reasonable assurance regarding prevention or timely detection of unauthorized acquisition, use, or disposition of the company’s assets that could have a material effect on the financial statements.
Because of its inherent limitations, internal control over financial reporting may not prevent or detect misstatements. Also, projections of any evaluation of effectiveness to future periods are subject to the risk that controls may become inadequate because of changes in conditions, or that the degree of compliance with the policies or procedures may deteriorate.
/s/ Ernst & Young LLP
New York, New York
February 23, 2023
59
Item 9B. Other Information
None.
Item 9C. Disclosure Regarding Foreign Jurisdictions that Prevent Inspections
Not applicable.
PART III
Item 10. Directors, Executive Officers and Corporate Governance
Information about Nasdaq’s directors, as required by Item 401 of Regulation S-K, is incorporated by reference from the discussion under the caption “Director Nominees” in Nasdaq’s Proxy Statement. Information about Nasdaq’s executive officers, as required by Item 401 of Regulation S-K, is incorporated by reference from the discussion under the caption “Other Items-Executive Officers” in the Proxy Statement. Information about Section 16 reports, as required by Item 405 of Regulation S-K, is incorporated by reference from the discussion under the caption “Other Items-Delinquent Section 16(a) Reports” in the Proxy Statement. Information about Nasdaq’s code of ethics, as required by Item 406 of Regulation S-K, is incorporated by reference from the discussion under the caption “Operating with Integrity” in the Proxy Statement. Information about Nasdaq’s nomination procedures, Audit & Risk Committee and Audit & Risk Committee financial experts, as required by Items 407(c)(3), 407(d)(4) and 407(d)(5) of Regulation S-K, is incorporated by reference from the discussions under the headings “Director Nominees” and “Board Committees” in the Proxy Statement.
Item 11. Executive Compensation
Information about Nasdaq’s director and executive compensation, as required by Items 402, 407(e)(4) and 407(e)(5) of Regulation S-K, is incorporated by reference from the discussions under the headings “Director Compensation” and “Executive Compensation” in the Proxy Statement.
Item 12. Security Ownership of Certain Beneficial Owners and Management and Related Stockholder Matters
Information about security ownership of certain beneficial owners and management, as required by Item 403 of Regulation S-K, is incorporated by reference from the discussion under the heading “Other Items-Security Ownership of Certain Beneficial Owners and Management” in the Proxy Statement.
Equity Compensation Plan and ESPP Information
Nasdaq’s Equity Plan provides for the issuance of our equity securities to all employees and directors as part of their compensation plan.
In addition, in jurisdictions where participation in the ESPP is permitted, all our employees are eligible. Employees may purchase shares of our common stock at a 15% discount to the lesser of the closing price of our common stock on (i) the first trading day of the offering period or (ii) the last trading day of the offering period. Offering periods under the ESPP are six months in duration. As of December 31, 2022, all our employees are eligible to participate.
The Equity Plan and the ESPP have been previously approved by our stockholders. The following table sets forth information regarding outstanding options and shares reserved for future issuance under all of Nasdaq’s compensation plans as of December 31, 2017, based on criteria established2022.
| Plan Category | Number of shares to be issued upon exercise of outstanding options, warrants and rights(a) | Weighted-average exercise price of outstanding options, warrants and rights(b) | Number of shares remaining available for future issuance under equity compensation plans (excluding shares reflected in column(a))(c) | |||||||||||||||||
| Equity compensation plans approved by stockholders | 1,420,323 | $ | 41.79 | 38,534,312 | ||||||||||||||||
| Equity compensation plans not approved by stockholders | — | — | — | |||||||||||||||||
| Total | 1,420,323 | $ | 41.79 | 38,534,312 | ||||||||||||||||
In the table above:
•The number of shares to be issued upon exercise of outstanding options, warrants and rights include only the number of shares to be issued upon exercise of outstanding options, warrants and rights. As of December 31, 2022, we also had 6,347,055 shares to be issued upon vesting of outstanding restricted stock and PSUs.
•The number of shares remaining available for future issuance under equity compensation plans (excluding shares reflected in Internal Control-Integrated Frameworkcolumn (a) includes 26,430,038 shares of common stock that may be awarded pursuant to the Equity Plan and (b) 12,104,274 shares of common stock that may be issued pursuant to the ESPP.
Item 13. Certain Relationships and Related Transactions, and Director Independence
Information about certain relationships and related transactions, as required by Item 404 of Regulation S-K, is incorporated herein by reference from the Committeediscussion under the heading “Other Items-Certain Relationships and Related Transactions” in the Proxy Statement. Information about director independence, as required by Item 407(a) of Sponsoring OrganizationsRegulation S-K, is incorporated herein by reference from the discussion under the heading “Director Nominees” in the Proxy Statement.
60
Item 14. Principal Accountant Fees and Services
Information about principal accountant fees and services, as required by Item 9(e) of Schedule 14A, is incorporated herein by reference from the discussion under the heading “Audit & Risk Annual Evaluation and 2023 Selection of the Treadway Commission (2013 framework),Independent Auditor” in the Proxy Statement.
PART IV
Item 15. Exhibits and our report dated February 28, 2018 expressed an unqualified opinion thereon.Financial Statement Schedules
(a)(1) Financial Statements
See “Index to Consolidated Financial Statements.”
(a)(2) Financial Statement Schedules
All schedules are omitted because they are not applicable or the required information is included in the consolidated financial statements or notes.
(a)(3) Exhibits
| Exhibit Number | ||||||||
| Share Purchase Agreement, dated as of November 18, 2020, by and among Osprey Acquisition Corporation, a wholly owned subsidiary of Nasdaq, Verafin Holdings Inc., certain shareholders of Verafin (the “Sellers”), and Shareholder Representative Services LLC, solely in its capacity as the representative of the Sellers (incorporated herein by reference to Exhibit 2.2 to the Annual Report on Form 10-K for the year ended December 31, 2020 filed on February 23, 2021).† | ||||||||
| Amendment to Share Purchase Agreement, dated as of February 11, 2021, by and among Osprey Acquisition Corporation, a wholly owned subsidiary of Nasdaq, Verafin Holdings Inc., certain shareholders of Verafin (the “Sellers”), and Shareholder Representative Services LLC, solely in its capacity as the representative of the Sellers (incorporated herein by reference to Exhibit 2.3 to the Annual Report on Form 10-K for the year ended December 31, 2020 filed on February 23, 2021). | ||||||||
| Amended and Restated Certificate of Incorporation of Nasdaq (incorporated herein by reference to Exhibit 3.1 to the Current Report on Form 8-K filed on January 28, 2014). | ||||||||
| Certificate of Elimination of Nasdaq’s Series A Convertible Preferred Stock (incorporated herein by reference to Exhibit 3.1.1 to the Current Report on Form 8-K filed on January 28, 2014). | ||||||||
| Certificate of Amendment of Nasdaq’s Amended and Restated Certificate of Incorporation (incorporated herein by reference to Exhibit 3.1 to the Current Report on Form 8-K filed on November 19, 2014). | ||||||||
| Certificate of Amendment of Nasdaq’s Amended and Restated Certificate of Incorporation (incorporated herein by reference to Exhibit 3.1 to the Current Report on Form 8-K filed on September 8, 2015). | ||||||||
| Certificate of Amendment of Nasdaq’s Amended and Restated Certificate of Incorporation (incorporated herein by reference to Exhibit 3.1 to the Current Report on Form 8-K filed on July 20, 2022). | ||||||||
| Nasdaq’s By-Laws (incorporated herein by reference to Exhibit 3.2 to the Current Report on Form 8-K filed on November 21, 2016). | ||||||||
| Form of Common Stock certificate (incorporated herein by reference to Exhibit 4.1 to the Quarterly Report on Form 10-Q for the quarter ended September 30, 2015 filed on November 4, 2015). | ||||||||
| Stockholders’ Agreement, dated as of February 27, 2008, between Nasdaq, Inc. (f/k/a The NASDAQ OMX Group, Inc.) and Borse Dubai Limited (incorporated herein by reference to Exhibit 10.2 to the Current Report on Form 8-K filed on March 3, 2008). | ||||||||
| First Amendment to Stockholders’ Agreement, dated as of February 19, 2009, between Nasdaq, Inc. (f/k/a The NASDAQ OMX Group, Inc.) and Borse Dubai Limited (incorporated herein by reference to Exhibit 4.10.1 to the Annual Report on Form 10-K for the year ended December 31, 2008 filed on February 27, 2009). | ||||||||
| Registration Rights Agreement, dated as of February 27, 2008, among Nasdaq, Inc. (f/k/a The NASDAQ OMX Group, Inc.), Borse Dubai Limited and Borse Dubai Nasdaq Share Trust (incorporated herein by reference to Exhibit 10.3 to the Current Report on Form 8-K filed on March 3, 2008). | ||||||||
| First Amendment to Registration Rights Agreement, dated as of February 19, 2009, among Nasdaq, Inc. (f/k/a The NASDAQ OMX Group, Inc.), Borse Dubai Limited and Borse Dubai Nasdaq Share Trust (incorporated herein by reference to Exhibit 4.11.1 to the Annual Report on Form 10-K for the year ended December 31, 2008 filed on February 27, 2009). | ||||||||
| Stockholders’ Agreement, dated as of December 16, 2010, between Nasdaq, Inc. (f/k/a The NASDAQ OMX Group, Inc.) and Investor AB (incorporated herein by reference to Exhibit 4.12 to the Annual Report on Form 10-K for the year ended December 31, 2010 filed on February 24, 2011). | ||||||||
| First Amendment to Nasdaq Stockholders’ Agreement, dated as of December 14, 2022, between Nasdaq, Inc. and Investor AB (incorporated herein by reference to Exhibit 4.1 to the Current Report on Form 8-K filed on December 16, 2022). | ||||||||
61
| Indenture, dated as of June 7, 2013, between Nasdaq, Inc. (f/k/a The NASDAQ OMX Group, Inc.) and Wells Fargo Bank, National Association, as Trustee (incorporated herein by reference to Exhibit 4.1 to the Current Report on Form 8-K filed on June 10, 2013). | ||||||||
| First Supplemental Indenture, dated as of June 7, 2013, among Nasdaq, Inc. (f/k/a The NASDAQ OMX Group, Inc.), Wells Fargo Bank, National Association, as Trustee, Deutsche Bank AG, London Branch, as paying agent, and Deutsche Bank Luxembourg S.A., as registrar and transfer agent (incorporated herein by reference to Exhibit 4.2 to the Current Report on Form 8-K filed on June 10, 2013). | ||||||||
| Second Supplemental Indenture, dated as of May 29, 2014, among Nasdaq, Inc. (f/k/a The NASDAQ OMX Group, Inc.) and Wells Fargo Bank, National Association, as Trustee (incorporated herein by reference to Exhibit 4.1 to the Current Report on Form 8-K filed on May 30, 2014). | ||||||||
| Third Supplemental Indenture, dated as of May 20, 2016, among Nasdaq, Inc., Wells Fargo Bank, National Association, as Trustee, and HSBC Bank USA, National Association, as paying agent and as registrar and transfer agent (incorporated herein by reference to the Current Report on Form 8-K filed on May 23, 2016). | ||||||||
| Fifth Supplemental Indenture, dated as of September 22, 2017, among Nasdaq, Inc. and Wells Fargo Bank, National Association, as Trustee (incorporated herein by reference to Exhibit 4.1 to the Current Report on Form 8-K filed on September 22, 2017). | ||||||||
| Sixth Supplemental Indenture, dated as of April 1, 2019, among Nasdaq, Inc., Wells Fargo Bank, National Association, as Trustee, and HSBC Bank USA, National Association, as paying agent and as registrar and transfer agent (incorporated by reference to Exhibit 4.2 to the Form 8-A filed on April 1, 2019). | ||||||||
| Seventh Supplemental Indenture, dated February 13, 2020, among Nasdaq, Inc., Wells Fargo Bank, National Association, as Trustee, and HSBC Bank USA, National Association, as paying agent and as registrar and transfer agent (incorporated herein by reference to Exhibit 4.2 to the Company’s Form 8-A filed on February 13, 2020). | ||||||||
| Eighth Supplemental Indenture, dated April 28, 2020, by and between Nasdaq, Inc. and Wells Fargo Bank, National Association, as Trustee (incorporated herein by reference to Exhibit 4.2 to the Current Report on Form 8-K filed on April 28, 2020). | ||||||||
| Ninth Supplemental Indenture, dated December 21, 2020, by and between Nasdaq, Inc. and Wells Fargo Bank, National Association, as Trustee (incorporated herein by reference to Exhibit 4.2 to the Current Report on Form 8-K filed on December 21, 2020). | ||||||||
| Tenth Supplemental Indenture, dated December 21, 2020, by and between Nasdaq, Inc. and Wells Fargo Bank, National Association, as Trustee (incorporated herein by reference to Exhibit 4.3 to the Current Report on Form 8-K filed on December 21, 2020). | ||||||||
| Eleventh Supplemental Indenture, dated December 21, 2020, by and between Nasdaq, Inc. and Wells Fargo Bank, National Association, as Trustee (incorporated herein by reference to Exhibit 4.4 to the Current Report on Form 8-K filed on December 21, 2020). | ||||||||
| Twelfth Supplemental Indenture, dated July 30, 2021, by and among Nasdaq, Inc., Wells Fargo Bank, National Association, as Trustee and HSBC Bank USA, National Association, as registrar and transfer agent (incorporated by reference to Exhibit 4.2 to the Company’s 8-A filed on July 30, 2021). | ||||||||
| Thirteenth Supplemental Indenture, dated as of March 7, 2022, by and between Nasdaq, Inc. and Computershare Trust Company, N.A. (as successor to Wells Fargo Bank, National Association), as trustee (incorporated by reference to Exhibit 4.2 to the Company's Current Report on Form 8-K filed on March 7, 2022). | ||||||||
| Description of Securities. | ||||||||
| Amended and Restated Board Compensation Policy, effective on June 16, 2021 (incorporated herein by reference to Exhibit 10.1 to the Quarterly Report on Form 10-Q for the quarter ended June 30, 2021 filed on August 4, 2021).* | ||||||||
| Nasdaq Executive Corporate Incentive Plan, effective as of January 1, 2015 (incorporated herein by reference to Exhibit 10.1 to the Current Report on Form 8-K filed on May 11, 2015).* | ||||||||
| Nasdaq, Inc. Equity Incentive Plan (as amended and restated as of April 24, 2018) (incorporated herein by reference to Exhibit 10.1 to the Form S-8 filed on May 25, 2018).* | ||||||||
| Form of Nasdaq Non-Qualified Stock Option Award Certificate (incorporated herein by reference to Exhibit 10.3 to the Annual Report on Form 10-K for the year ended December 31, 2010 filed on February 24, 2011).* | ||||||||
| Form of Nasdaq Restricted Stock Unit Award Certificate (employees) (incorporated herein by reference to Exhibit 10.1 to the Quarterly Report on Form 10-Q for the quarter ended June 30, 2022 filed on August 3, 2022).* | ||||||||
| Form of Nasdaq Restricted Stock Unit Award Certificate (directors) (incorporated herein by reference to Exhibit 10.2 to the Quarterly Report on Form 10-Q for the quarter ended June 30, 2022 filed on August 3, 2022).* | ||||||||
62
| Form of Nasdaq One-Year Performance Share Unit Agreement (incorporated herein by reference to Exhibit 10.4 to the Quarterly Report on Form 10-Q for the quarter ended June 30, 2019 filed on August 5, 2019).* | ||||||||
| Form of Nasdaq Three-Year Performance Share Unit Agreement (incorporated herein by reference to Exhibit 10.3 to the Quarterly Report on Form 10-Q for the quarter ended June 30, 2022 filed on August 3, 2022).* | ||||||||
| Form of Nasdaq Continuing Obligations Agreement (incorporated by reference to Exhibit 10.9 to the Company’s Annual Report on Form 10-K for the year ended December 31, 2021 filed on February 23, 2022). | ||||||||
| Amended and Restated Supplemental Executive Retirement Plan, dated as of December 17, 2008 (incorporated herein by reference to Exhibit 10.6 to the Annual Report on Form 10-K for the year ended December 31, 2008 filed on February 27, 2009).* | ||||||||
| Amendment No. 1 to Amended and Restated Supplemental Executive Retirement Plan, effective as of December 31, 2008 (incorporated herein by reference to Exhibit 10.6.1 to the Annual Report on Form 10-K for the year ended December 31, 2008 filed on February 27, 2009).* | ||||||||
| Nasdaq Supplemental Employer Retirement Contribution Plan, dated as of December 17, 2008 (incorporated herein by reference to Exhibit 10.7 to the Annual Report on Form 10-K for the year ended December 31, 2008 filed on February 27, 2009).* | ||||||||
| Nasdaq, Inc. Deferred Compensation Plan (incorporated by reference to Exhibit 10.1 to the Company's Current Report on Form 8-K filed on June 16, 2022).* | ||||||||
| Nonqualified Stock Option Award Certificate to Adena T. Friedman from Nasdaq, Inc. in connection with grant made on January 3, 2017 (incorporated herein by reference to Exhibit 10.1 to the Quarterly Report on Form 10-Q for the quarter ended September 30, 2017 filed on November 7, 2017).* | ||||||||
| Employment Agreement between Nasdaq and Adena Friedman, made and entered into on November 19, 2021 and effective as of January 1, 2022 (incorporated by reference to Exhibit 10.14 to the Company’s Annual Report on Form 10-K for the year ended December 31, 2021 filed on February 23, 2022).* | ||||||||
| Nonqualified Stock Option Award Certificate to Adena T. Friedman from Nasdaq, Inc. in connection with grant made on January 3, 2022 (incorporated by reference to Exhibit 10.15 to the Company’s Annual Report on Form 10-K for the year ended December 31, 2021 filed on February 23, 2022).* | ||||||||
| Employment Agreement by and between Nasdaq, Inc. and Bradley J. Peterson, dated October 1, 2020 (incorporated herein by reference to Exhibit 10.17 to the Annual Report on Form 10-K for the year ended December 31, 2020 filed on February 23, 2021).* | ||||||||
| Employment Agreement by and between Nasdaq, Inc. and Bradley J. Peterson, dated June 22, 2022 (incorporated herein by reference to Exhibit 10.5 to the Quarterly Report on Form 10-Q for the quarter ended June 30, 2022 filed on August 3, 2022). | ||||||||
| Employment Offer Letter by and between Nasdaq, Inc. and Michelle Daly (incorporated by reference to Exhibit 10.1 to the Current Report on Form 8-K filed on May 3, 2021).* | ||||||||
| Nasdaq Change in Control Severance Plan for Executive Vice Presidents and Senior Vice Presidents, effective November 26, 2013, as amended December 6, 2022.* | ||||||||
| Credit Agreement, dated as of December 21, 2020, among Nasdaq, Inc., the various lenders from time to time party thereto and, Bank of America, N.A., as administrative agent and issuing bank (incorporated herein by reference to Exhibit 10.1 to the Current Report on Form 8-K filed on December 21, 2020). | ||||||||
| LIBOR Transition Amendment, dated as of October 19, 2021 by and among Nasdaq, Inc. and Bank of America, N.A., as administrative agent (incorporated herein by reference to Exhibit 10.23 to the Annual Report on Form 10-K for the year ended December 31, 2021 filed on February 23, 2022). | ||||||||
| Amended and Restated Credit Agreement, dated as of December 16, 2022, among Nasdaq, Inc., the various lenders and issuing bank party thereto and Bank of America, N.A., as administrative agent (incorporated herein by reference to Exhibit 10.1 to the Current Report on Form 8-K filed on December 16, 2022). | ||||||||
| Form of Commercial Paper Dealer Agreement between Nasdaq, Inc., as Issuer, and the Dealer party thereto (incorporated herein by reference to Exhibit 10.3 to the Current Report on Form 8-K filed on April 26, 2017). | ||||||||
| Verafin Holdings Inc. Amended and Restated Management Incentive Plan* | ||||||||
| Verafin Holdings Inc. Amended and Restated Management Incentive Plan Award Agreement, by and between Verafin Solutions ULC and Brendan Brothers, dated as of January 11, 2023* | ||||||||
| Verafin Holdings Inc. Amended and Restated Management Incentive Plan Award Agreement, by and between Verafin Solutions ULC and Jamie King, dated as of October 18, 2022* | ||||||||
| Statement regarding computation of per share earnings (incorporated herein by reference from Note 13 to the consolidated financial statements under Part II, Item 8 of this Form 10-K). | ||||||||
63
| List of all subsidiaries. | ||||||||
| Consent of Ernst & Young LLP. | ||||||||
| Powers of Attorney. | ||||||||
| Certification of Chief Executive Officer pursuant to Section 302 of the Sarbanes-Oxley Act of 2002 (“Sarbanes-Oxley”). | ||||||||
| Certification of Executive Vice President and Chief Financial Officer pursuant to Section 302 of Sarbanes-Oxley. | ||||||||
| Certifications Pursuant to 18 U.S.C. Section 1350, as adopted pursuant to Section 906 of Sarbanes-Oxley. | ||||||||
| 101 | The following materials from the Nasdaq, Inc. Annual Report on Form 10-K for the year ended December 31, 2022, formatted in iXBRL (Inline eXtensible Business Reporting Language): (i) Consolidated Balance Sheets as of December 31, 2022 and December 31, 2021; (ii) Consolidated Statements of Income for the years ended December 31, 2022, 2021 and 2020 (iii) Consolidated Statements of Comprehensive Income for the years ended December 31, 2022, 2021 and 2020; (iv) Consolidated Statements of Changes in Stockholders' Equity for the years ended December 31, 2022, 2021 and 2020; (v) Consolidated Statements of Cash Flows for the years ended December 31, 2022, 2021 and 2020; and (vi) notes to consolidated financial statements. | |||||||
| 104 | Cover Page Interactive Data File, formatted in iXBRL and contained in Exhibit 101. | |||||||
* Management contract or compensatory plan or arrangement.
† Schedules have been omitted pursuant to Item 601(b)(2) of Regulation S-K.
(b) Exhibits:
See Item 15(a)(3) above.
(c) Financial Statement Schedules:
All schedules are omitted because they are not applicable or the required information is included in the consolidated financial statements or notes.
Item 16. Form 10-K Summary
None.
64
Basis for Opinion
The Company’s management is responsible for maintaining effective internal control over financial reporting and for its assessment of the effectiveness of internal control over financial reporting included in the accompanying Management’s Report on Internal Control Over Financial Reporting. Our responsibility is to express an opinion on the Company’s internal control over financial reporting based on our audit. We are a public accounting firm registered with the PCAOB and are required to be independent with respect to the Company in accordance with the U.S. federal securities laws and the applicable rules and regulations of the Securities and Exchange Commission and the PCAOB.
We conducted our audit in accordance with the standards of the PCAOB. Those standards require that we plan and perform the audit to obtain reasonable assurance about whether effective internal control over financial reporting was maintained in all material respects.
Our audit included obtaining an understanding of internal control over financial reporting, assessing the risk that a material weakness exists, testing and evaluating the design and operating effectiveness of internal control based on the assessed risk, and performing such other procedures as we considered necessary in the circumstances. We believe that our audit provides a reasonable basis for our opinion.
Definition and Limitations of Internal Control Over Financial Reporting
A company’s internal control over financial reporting is a process designed to provide reasonable assurance regarding the reliability of financial reporting and the preparation of financial statements for external purposes in accordance with generally accepted accounting principles. A company’s internal control over financial reporting includes those policies and procedures that (1) pertain to the maintenance of records that, in reasonable detail, accurately and fairly reflect the transactions and dispositions of the assets of the company; (2) provide reasonable assurance that transactions are recorded as necessary to permit preparation of financial statements in accordance with generally accepted accounting principles, and that receipts and expenditures of the company are being made only in accordance with authorizations of management and directors of the company; and (3) provide reasonable assurance regarding prevention or timely detection of unauthorized acquisition, use, or disposition of the company’s assets that could have a material effect on the financial statements.
Because of its inherent limitations, internal control over financial reporting may not prevent or detect misstatements. Also, projections of any evaluation of effectiveness to future periods are subject to the risk that controls may become inadequate because of changes in conditions, or that the degree of compliance with the policies or procedures may deteriorate.
/s/ Ernst & Young LLP
New York, New York
February 23, 2023
59
Item 9B. Other Information
None.
Item 9C. Disclosure Regarding Foreign Jurisdictions that Prevent Inspections
Not applicable.
PART III
Item 10. Directors, Executive Officers and Corporate Governance
Information about Nasdaq’s directors, as required by Item 401 of Regulation S-K, is incorporated by reference from the discussion under the caption “Director Nominees” in Nasdaq’s Proxy Statement. Information about Nasdaq’s executive officers, as required by Item 401 of Regulation S-K, is incorporated by reference from the discussion under the caption “Other Items-Executive Officers” in the Proxy Statement. Information about Section 16 reports, as required by Item 405 of Regulation S-K, is incorporated by reference from the discussion under the caption “Other Items-Delinquent Section 16(a) Reports” in the Proxy Statement. Information about Nasdaq’s code of ethics, as required by Item 406 of Regulation S-K, is incorporated by reference from the discussion under the caption “Operating with Integrity” in the Proxy Statement. Information about Nasdaq’s nomination procedures, Audit & Risk Committee and Audit & Risk Committee financial experts, as required by Items 407(c)(3), 407(d)(4) and 407(d)(5) of Regulation S-K, is incorporated by reference from the discussions under the headings “Director Nominees” and “Board Committees” in the Proxy Statement.
Item 11. Executive Compensation
Information about Nasdaq’s director and executive compensation, as required by Items 402, 407(e)(4) and 407(e)(5) of Regulation S-K, is incorporated by reference from the discussions under the headings “Director Compensation” and “Executive Compensation” in the Proxy Statement.
Item 12. Security Ownership of Certain Beneficial Owners and Management and Related Stockholder Matters
Information about security ownership of certain beneficial owners and management, as required by Item 403 of Regulation S-K, is incorporated by reference from the discussion under the heading “Other Items-Security Ownership of Certain Beneficial Owners and Management” in the Proxy Statement.
Equity Compensation Plan and ESPP Information
Nasdaq’s Equity Plan provides for the issuance of our equity securities to all employees and directors as part of their compensation plan.
In addition, in jurisdictions where participation in the ESPP is permitted, all our employees are eligible. Employees may purchase shares of our common stock at a 15% discount to the lesser of the closing price of our common stock on (i) the first trading day of the offering period or (ii) the last trading day of the offering period. Offering periods under the ESPP are six months in duration. As of December 31, 2022, all our employees are eligible to participate.
The Equity Plan and the ESPP have been previously approved by our stockholders. The following table sets forth information regarding outstanding options and shares reserved for future issuance under all of Nasdaq’s compensation plans as of December 31, 2022.
| Plan Category | Number of shares to be issued upon exercise of outstanding options, warrants and rights(a) | Weighted-average exercise price of outstanding options, warrants and rights(b) | Number of shares remaining available for future issuance under equity compensation plans (excluding shares reflected in column(a))(c) | |||||||||||||||||
| Equity compensation plans approved by stockholders | 1,420,323 | $ | 41.79 | 38,534,312 | ||||||||||||||||
| Equity compensation plans not approved by stockholders | — | — | — | |||||||||||||||||
| Total | 1,420,323 | $ | 41.79 | 38,534,312 | ||||||||||||||||
In the table above:
•The number of shares to be issued upon exercise of outstanding options, warrants and rights include only the number of shares to be issued upon exercise of outstanding options, warrants and rights. As of December 31, 2022, we also had 6,347,055 shares to be issued upon vesting of outstanding restricted stock and PSUs.
•The number of shares remaining available for future issuance under equity compensation plans (excluding shares reflected in column (a) includes 26,430,038 shares of common stock that may be awarded pursuant to the Equity Plan and (b) 12,104,274 shares of common stock that may be issued pursuant to the ESPP.
Item 13. Certain Relationships and Related Transactions, and Director Independence
Information about certain relationships and related transactions, as required by Item 404 of Regulation S-K, is incorporated herein by reference from the discussion under the heading “Other Items-Certain Relationships and Related Transactions” in the Proxy Statement. Information about director independence, as required by Item 407(a) of Regulation S-K, is incorporated herein by reference from the discussion under the heading “Director Nominees” in the Proxy Statement.
60
Item 14. Principal Accountant Fees and Services
Information about principal accountant fees and services, as required by Item 9(e) of Schedule 14A, is incorporated herein by reference from the discussion under the heading “Audit & Risk Annual Evaluation and 2023 Selection of the Independent Auditor” in the Proxy Statement.
PART IV
Item 15. Exhibits and Financial Statement Schedules
(a)(1) Financial Statements
See “Index to Consolidated Financial Statements.”
(a)(2) Financial Statement Schedules
All schedules are omitted because they are not applicable or the required information is included in the consolidated financial statements or notes.
(a)(3) Exhibits
| Exhibit Number | ||||||||
| Share Purchase Agreement, dated as of November 18, 2020, by and among Osprey Acquisition Corporation, a wholly owned subsidiary of Nasdaq, Verafin Holdings Inc., certain shareholders of Verafin (the “Sellers”), and Shareholder Representative Services LLC, solely in its capacity as the representative of the Sellers (incorporated herein by reference to Exhibit 2.2 to the Annual Report on Form 10-K for the year ended December 31, 2020 filed on February 23, 2021).† | ||||||||
| Amendment to Share Purchase Agreement, dated as of February 11, 2021, by and among Osprey Acquisition Corporation, a wholly owned subsidiary of Nasdaq, Verafin Holdings Inc., certain shareholders of Verafin (the “Sellers”), and Shareholder Representative Services LLC, solely in its capacity as the representative of the Sellers (incorporated herein by reference to Exhibit 2.3 to the Annual Report on Form 10-K for the year ended December 31, 2020 filed on February 23, 2021). | ||||||||
| Amended and Restated Certificate of Incorporation of Nasdaq (incorporated herein by reference to Exhibit 3.1 to the Current Report on Form 8-K filed on January 28, 2014). | ||||||||
| Certificate of Elimination of Nasdaq’s Series A Convertible Preferred Stock (incorporated herein by reference to Exhibit 3.1.1 to the Current Report on Form 8-K filed on January 28, 2014). | ||||||||
| Certificate of Amendment of Nasdaq’s Amended and Restated Certificate of Incorporation (incorporated herein by reference to Exhibit 3.1 to the Current Report on Form 8-K filed on November 19, 2014). | ||||||||
| Certificate of Amendment of Nasdaq’s Amended and Restated Certificate of Incorporation (incorporated herein by reference to Exhibit 3.1 to the Current Report on Form 8-K filed on September 8, 2015). | ||||||||
| Certificate of Amendment of Nasdaq’s Amended and Restated Certificate of Incorporation (incorporated herein by reference to Exhibit 3.1 to the Current Report on Form 8-K filed on July 20, 2022). | ||||||||
| Nasdaq’s By-Laws (incorporated herein by reference to Exhibit 3.2 to the Current Report on Form 8-K filed on November 21, 2016). | ||||||||
| Form of Common Stock certificate (incorporated herein by reference to Exhibit 4.1 to the Quarterly Report on Form 10-Q for the quarter ended September 30, 2015 filed on November 4, 2015). | ||||||||
| Stockholders’ Agreement, dated as of February 27, 2008, between Nasdaq, Inc. (f/k/a The NASDAQ OMX Group, Inc.) and Borse Dubai Limited (incorporated herein by reference to Exhibit 10.2 to the Current Report on Form 8-K filed on March 3, 2008). | ||||||||
| First Amendment to Stockholders’ Agreement, dated as of February 19, 2009, between Nasdaq, Inc. (f/k/a The NASDAQ OMX Group, Inc.) and Borse Dubai Limited (incorporated herein by reference to Exhibit 4.10.1 to the Annual Report on Form 10-K for the year ended December 31, 2008 filed on February 27, 2009). | ||||||||
| Registration Rights Agreement, dated as of February 27, 2008, among Nasdaq, Inc. (f/k/a The NASDAQ OMX Group, Inc.), Borse Dubai Limited and Borse Dubai Nasdaq Share Trust (incorporated herein by reference to Exhibit 10.3 to the Current Report on Form 8-K filed on March 3, 2008). | ||||||||
| First Amendment to Registration Rights Agreement, dated as of February 19, 2009, among Nasdaq, Inc. (f/k/a The NASDAQ OMX Group, Inc.), Borse Dubai Limited and Borse Dubai Nasdaq Share Trust (incorporated herein by reference to Exhibit 4.11.1 to the Annual Report on Form 10-K for the year ended December 31, 2008 filed on February 27, 2009). | ||||||||
| Stockholders’ Agreement, dated as of December 16, 2010, between Nasdaq, Inc. (f/k/a The NASDAQ OMX Group, Inc.) and Investor AB (incorporated herein by reference to Exhibit 4.12 to the Annual Report on Form 10-K for the year ended December 31, 2010 filed on February 24, 2011). | ||||||||
| First Amendment to Nasdaq Stockholders’ Agreement, dated as of December 14, 2022, between Nasdaq, Inc. and Investor AB (incorporated herein by reference to Exhibit 4.1 to the Current Report on Form 8-K filed on December 16, 2022). | ||||||||
61
| Indenture, dated as of June 7, 2013, between Nasdaq, Inc. (f/k/a The NASDAQ OMX Group, Inc.) and Wells Fargo Bank, National Association, as Trustee (incorporated herein by reference to Exhibit 4.1 to the Current Report on Form 8-K filed on June 10, 2013). | ||||||||
| First Supplemental Indenture, dated as of June 7, 2013, among Nasdaq, Inc. (f/k/a The NASDAQ OMX Group, Inc.), Wells Fargo Bank, National Association, as Trustee, Deutsche Bank AG, London Branch, as paying agent, and Deutsche Bank Luxembourg S.A., as registrar and transfer agent (incorporated herein by reference to Exhibit 4.2 to the Current Report on Form 8-K filed on June 10, 2013). | ||||||||
| Second Supplemental Indenture, dated as of May 29, 2014, among Nasdaq, Inc. (f/k/a The NASDAQ OMX Group, Inc.) and Wells Fargo Bank, National Association, as Trustee (incorporated herein by reference to Exhibit 4.1 to the Current Report on Form 8-K filed on May 30, 2014). | ||||||||
| Third Supplemental Indenture, dated as of May 20, 2016, among Nasdaq, Inc., Wells Fargo Bank, National Association, as Trustee, and HSBC Bank USA, National Association, as paying agent and as registrar and transfer agent (incorporated herein by reference to the Current Report on Form 8-K filed on May 23, 2016). | ||||||||
| Fifth Supplemental Indenture, dated as of September 22, 2017, among Nasdaq, Inc. and Wells Fargo Bank, National Association, as Trustee (incorporated herein by reference to Exhibit 4.1 to the Current Report on Form 8-K filed on September 22, 2017). | ||||||||
| Sixth Supplemental Indenture, dated as of April 1, 2019, among Nasdaq, Inc., Wells Fargo Bank, National Association, as Trustee, and HSBC Bank USA, National Association, as paying agent and as registrar and transfer agent (incorporated by reference to Exhibit 4.2 to the Form 8-A filed on April 1, 2019). | ||||||||
| Seventh Supplemental Indenture, dated February 13, 2020, among Nasdaq, Inc., Wells Fargo Bank, National Association, as Trustee, and HSBC Bank USA, National Association, as paying agent and as registrar and transfer agent (incorporated herein by reference to Exhibit 4.2 to the Company’s Form 8-A filed on February 13, 2020). | ||||||||
| Eighth Supplemental Indenture, dated April 28, 2020, by and between Nasdaq, Inc. and Wells Fargo Bank, National Association, as Trustee (incorporated herein by reference to Exhibit 4.2 to the Current Report on Form 8-K filed on April 28, 2020). | ||||||||
| Ninth Supplemental Indenture, dated December 21, 2020, by and between Nasdaq, Inc. and Wells Fargo Bank, National Association, as Trustee (incorporated herein by reference to Exhibit 4.2 to the Current Report on Form 8-K filed on December 21, 2020). | ||||||||
| Tenth Supplemental Indenture, dated December 21, 2020, by and between Nasdaq, Inc. and Wells Fargo Bank, National Association, as Trustee (incorporated herein by reference to Exhibit 4.3 to the Current Report on Form 8-K filed on December 21, 2020). | ||||||||
| Eleventh Supplemental Indenture, dated December 21, 2020, by and between Nasdaq, Inc. and Wells Fargo Bank, National Association, as Trustee (incorporated herein by reference to Exhibit 4.4 to the Current Report on Form 8-K filed on December 21, 2020). | ||||||||
| Twelfth Supplemental Indenture, dated July 30, 2021, by and among Nasdaq, Inc., Wells Fargo Bank, National Association, as Trustee and HSBC Bank USA, National Association, as registrar and transfer agent (incorporated by reference to Exhibit 4.2 to the Company’s 8-A filed on July 30, 2021). | ||||||||
| Thirteenth Supplemental Indenture, dated as of March 7, 2022, by and between Nasdaq, Inc. and Computershare Trust Company, N.A. (as successor to Wells Fargo Bank, National Association), as trustee (incorporated by reference to Exhibit 4.2 to the Company's Current Report on Form 8-K filed on March 7, 2022). | ||||||||
| Description of Securities. | ||||||||
| Amended and Restated Board Compensation Policy, effective on June 16, 2021 (incorporated herein by reference to Exhibit 10.1 to the Quarterly Report on Form 10-Q for the quarter ended June 30, 2021 filed on August 4, 2021).* | ||||||||
| Nasdaq Executive Corporate Incentive Plan, effective as of January 1, 2015 (incorporated herein by reference to Exhibit 10.1 to the Current Report on Form 8-K filed on May 11, 2015).* | ||||||||
| Nasdaq, Inc. Equity Incentive Plan (as amended and restated as of April 24, 2018) (incorporated herein by reference to Exhibit 10.1 to the Form S-8 filed on May 25, 2018).* | ||||||||
| Form of Nasdaq Non-Qualified Stock Option Award Certificate (incorporated herein by reference to Exhibit 10.3 to the Annual Report on Form 10-K for the year ended December 31, 2010 filed on February 24, 2011).* | ||||||||
| Form of Nasdaq Restricted Stock Unit Award Certificate (employees) (incorporated herein by reference to Exhibit 10.1 to the Quarterly Report on Form 10-Q for the quarter ended June 30, 2022 filed on August 3, 2022).* | ||||||||
| Form of Nasdaq Restricted Stock Unit Award Certificate (directors) (incorporated herein by reference to Exhibit 10.2 to the Quarterly Report on Form 10-Q for the quarter ended June 30, 2022 filed on August 3, 2022).* | ||||||||
62
| Form of Nasdaq One-Year Performance Share Unit Agreement (incorporated herein by reference to Exhibit 10.4 to the Quarterly Report on Form 10-Q for the quarter ended June 30, 2019 filed on August 5, 2019).* | ||||||||
| Form of Nasdaq Three-Year Performance Share Unit Agreement (incorporated herein by reference to Exhibit 10.3 to the Quarterly Report on Form 10-Q for the quarter ended June 30, 2022 filed on August 3, 2022).* | ||||||||
| Form of Nasdaq Continuing Obligations Agreement (incorporated by reference to Exhibit 10.9 to the Company’s Annual Report on Form 10-K for the year ended December 31, 2021 filed on February 23, 2022). | ||||||||
| Amended and Restated Supplemental Executive Retirement Plan, dated as of December 17, 2008 (incorporated herein by reference to Exhibit 10.6 to the Annual Report on Form 10-K for the year ended December 31, 2008 filed on February 27, 2009).* | ||||||||
| Amendment No. 1 to Amended and Restated Supplemental Executive Retirement Plan, effective as of December 31, 2008 (incorporated herein by reference to Exhibit 10.6.1 to the Annual Report on Form 10-K for the year ended December 31, 2008 filed on February 27, 2009).* | ||||||||
| Nasdaq Supplemental Employer Retirement Contribution Plan, dated as of December 17, 2008 (incorporated herein by reference to Exhibit 10.7 to the Annual Report on Form 10-K for the year ended December 31, 2008 filed on February 27, 2009).* | ||||||||
| Nasdaq, Inc. Deferred Compensation Plan (incorporated by reference to Exhibit 10.1 to the Company's Current Report on Form 8-K filed on June 16, 2022).* | ||||||||
| Nonqualified Stock Option Award Certificate to Adena T. Friedman from Nasdaq, Inc. in connection with grant made on January 3, 2017 (incorporated herein by reference to Exhibit 10.1 to the Quarterly Report on Form 10-Q for the quarter ended September 30, 2017 filed on November 7, 2017).* | ||||||||
| Employment Agreement between Nasdaq and Adena Friedman, made and entered into on November 19, 2021 and effective as of January 1, 2022 (incorporated by reference to Exhibit 10.14 to the Company’s Annual Report on Form 10-K for the year ended December 31, 2021 filed on February 23, 2022).* | ||||||||
| Nonqualified Stock Option Award Certificate to Adena T. Friedman from Nasdaq, Inc. in connection with grant made on January 3, 2022 (incorporated by reference to Exhibit 10.15 to the Company’s Annual Report on Form 10-K for the year ended December 31, 2021 filed on February 23, 2022).* | ||||||||
| Employment Agreement by and between Nasdaq, Inc. and Bradley J. Peterson, dated October 1, 2020 (incorporated herein by reference to Exhibit 10.17 to the Annual Report on Form 10-K for the year ended December 31, 2020 filed on February 23, 2021).* | ||||||||
| Employment Agreement by and between Nasdaq, Inc. and Bradley J. Peterson, dated June 22, 2022 (incorporated herein by reference to Exhibit 10.5 to the Quarterly Report on Form 10-Q for the quarter ended June 30, 2022 filed on August 3, 2022). | ||||||||
| Employment Offer Letter by and between Nasdaq, Inc. and Michelle Daly (incorporated by reference to Exhibit 10.1 to the Current Report on Form 8-K filed on May 3, 2021).* | ||||||||
| Nasdaq Change in Control Severance Plan for Executive Vice Presidents and Senior Vice Presidents, effective November 26, 2013, as amended December 6, 2022.* | ||||||||
| Credit Agreement, dated as of December 21, 2020, among Nasdaq, Inc., the various lenders from time to time party thereto and, Bank of America, N.A., as administrative agent and issuing bank (incorporated herein by reference to Exhibit 10.1 to the Current Report on Form 8-K filed on December 21, 2020). | ||||||||
| LIBOR Transition Amendment, dated as of October 19, 2021 by and among Nasdaq, Inc. and Bank of America, N.A., as administrative agent (incorporated herein by reference to Exhibit 10.23 to the Annual Report on Form 10-K for the year ended December 31, 2021 filed on February 23, 2022). | ||||||||
| Amended and Restated Credit Agreement, dated as of December 16, 2022, among Nasdaq, Inc., the various lenders and issuing bank party thereto and Bank of America, N.A., as administrative agent (incorporated herein by reference to Exhibit 10.1 to the Current Report on Form 8-K filed on December 16, 2022). | ||||||||
| Form of Commercial Paper Dealer Agreement between Nasdaq, Inc., as Issuer, and the Dealer party thereto (incorporated herein by reference to Exhibit 10.3 to the Current Report on Form 8-K filed on April 26, 2017). | ||||||||
| Verafin Holdings Inc. Amended and Restated Management Incentive Plan* | ||||||||
| Verafin Holdings Inc. Amended and Restated Management Incentive Plan Award Agreement, by and between Verafin Solutions ULC and Brendan Brothers, dated as of January 11, 2023* | ||||||||
| Verafin Holdings Inc. Amended and Restated Management Incentive Plan Award Agreement, by and between Verafin Solutions ULC and Jamie King, dated as of October 18, 2022* | ||||||||
| Statement regarding computation of per share earnings (incorporated herein by reference from Note 13 to the consolidated financial statements under Part II, Item 8 of this Form 10-K). | ||||||||
63
| List of all subsidiaries. | ||||||||
| Consent of Ernst & Young LLP. | ||||||||
| Powers of Attorney. | ||||||||
| Certification of Chief Executive Officer pursuant to Section 302 of the Sarbanes-Oxley Act of 2002 (“Sarbanes-Oxley”). | ||||||||
| Certification of Executive Vice President and Chief Financial Officer pursuant to Section 302 of Sarbanes-Oxley. | ||||||||
| Certifications Pursuant to 18 U.S.C. Section 1350, as adopted pursuant to Section 906 of Sarbanes-Oxley. | ||||||||
| 101 | The following materials from the Nasdaq, Inc. Annual Report on Form 10-K for the year ended December 31, 2022, formatted in iXBRL (Inline eXtensible Business Reporting Language): (i) Consolidated Balance Sheets as of December 31, 2022 and December 31, 2021; (ii) Consolidated Statements of Income for the years ended December 31, 2022, 2021 and 2020 (iii) Consolidated Statements of Comprehensive Income for the years ended December 31, 2022, 2021 and 2020; (iv) Consolidated Statements of Changes in Stockholders' Equity for the years ended December 31, 2022, 2021 and 2020; (v) Consolidated Statements of Cash Flows for the years ended December 31, 2022, 2021 and 2020; and (vi) notes to consolidated financial statements. | |||||||
| 104 | Cover Page Interactive Data File, formatted in iXBRL and contained in Exhibit 101. | |||||||
* Management contract or compensatory plan or arrangement.
† Schedules have been omitted pursuant to Item 601(b)(2) of Regulation S-K.
(b) Exhibits:
See Item 15(a)(3) above.
(c) Financial Statement Schedules:
All schedules are omitted because they are not applicable or the required information is included in the consolidated financial statements or notes.
Item 16. Form 10-K Summary
None.
64
SIGNATURES
Pursuant to the requirements of Section 13 or 15(d) of the Securities Exchange Act of 1934, the registrant has duly caused this report to be signed on its behalf by the undersigned, thereunto duly authorized, on February 23, 2023.
| Nasdaq, Inc. | ||||||||
| (Registrant) | ||||||||
| By: | /s/ Adena T. Friedman | |||||||
| Name: | Adena T. Friedman | |||||||
| Title: | Chief Executive Officer | |||||||
| Date: | February 23, 2023 | |||||||
Pursuant to the requirements of the Securities Exchange Act of 1934, this report has been signed below by the following persons on behalf of the registrant and in the capacities indicated as of February 23, 2023.
| By: | /s/ Adena T. Friedman | |||||||
| Name: | Adena T. Friedman | |||||||
| Title: | Chief Executive Officer and Chair of the Board | |||||||
| By: | /s/ Ann M. Dennison | |||||||
| Name: | Ann M. Dennison | |||||||
| Title: | Executive Vice President and Chief Financial Officer | |||||||
| By: | /s/ Michelle Daly | |||||||
| Name: | Michelle Daly | |||||||
| Title: | Senior Vice President, Controller and Principal Accounting Officer | |||||||
| By: | * | |||||||
| Name: | Michael R. Splinter | |||||||
| Title: | Director | |||||||
| By: | * | |||||||
| Name: | Melissa M. Arnoldi | |||||||
| Title: | Director | |||||||
| By: | * | |||||||
| Name: | Charlene T. Begley | |||||||
| Title: | Director | |||||||
| By: | * | |||||||
| Name: | Steven D. Black | |||||||
| Title: | Director | |||||||
| By: | * | |||||||
| Name: | Essa Kazim | |||||||
| Title: | Director | |||||||
| By: | * | |||||||
| Name: | Thomas A. Kloet | |||||||
| Title: | Director | |||||||
| By: | * | |||||||
| Name: | John D. Rainey | |||||||
| Title: | Director | |||||||
| By: | * | |||||||
| Name: | Johan Torgeby | |||||||
| Title: | Director | |||||||
| By: | * | |||||||
| Name: | Toni Townes-Whitley | |||||||
| Title: | Director | |||||||
| By: | * | |||||||
| Name: | Alfred W. Zollar | |||||||
| Title: | Director | |||||||
| * Pursuant to Power of Attorney | ||||||||
| By: | /s/ John A. Zecca | |||||||
| Name: | John A. Zecca | |||||||
| Title: | Attorney-in-Fact | |||||||
65
Nasdaq, Inc.
INDEX TO CONSOLIDATED FINANCIAL STATEMENTS
The following consolidated financial statements of Nasdaq, Inc. and its subsidiaries are presented herein on the page indicated:
F-1
Report of Independent Registered Public Accounting Firm
To the Shareholders and the Board of Directors of Nasdaq, Inc.
Opinion on the Financial Statements
We have audited the accompanying consolidated balance sheets of Nasdaq, Inc. (the Company) as of December 31, 2022 and 2021, the related consolidated statements of income, comprehensive income, changes in stockholders’ equity and cash flows for each of the three years in the period ended December 31, 2022, and the related notes (collectively referred to as the “consolidated financial statements”). In our opinion, the consolidated financial statements present fairly, in all material respects, the financial position of the Company at December 31, 2022 and 2021, and the results of its operations and its cash flows for each of the three years in the period ended December 31, 2022, in conformity with U.S. generally accepted accounting principles.
We also have audited, in accordance with the standards of the Public Company Accounting Oversight Board (United States) (PCAOB), the Company's internal control over financial reporting as of December 31, 2022, based on criteria established in Internal Control-Integrated Framework issued by the Committee of Sponsoring Organizations of the Treadway Commission (2013 framework), and our report dated February 23, 2023 expressed an unqualified opinion thereon.
Basis for Opinion
These financial statements are the responsibility of the Company's management. Our responsibility is to express an opinion on the Company’s financial statements based on our audits. We are a public accounting firm registered with the PCAOB and are required to be independent with respect to the Company in accordance with the U.S. federal securities laws and the applicable rules and regulations of the Securities and Exchange Commission and the PCAOB.
We conducted our audits in accordance with the standards of the PCAOB. Those standards require that we plan and perform the audit to obtain reasonable assurance about whether the financial statements are free of material misstatement, whether due to error or fraud. Our audits included performing procedures to assess the risks of material misstatement of the financial statements, whether due to error or fraud, and performing procedures that respond to those risks. Such procedures included examining, on a test basis, evidence regarding the amounts and disclosures in the financial statements. Our audits also included evaluating the accounting principles used and significant estimates made by management, as well as evaluating the overall presentation of the financial statements. We believe that our audits provide a reasonable basis for our opinion.
Critical Audit Matter
The critical audit matter communicated below is a matter arising from the current period audit of the financial statements that was communicated or required to be communicated to the audit committee and that: (1) relates to accounts or disclosures that are material to the financial statements and (2) involved our especially challenging, subjective or complex judgments. The communication of the critical audit matter does not alter in any way our opinion on the consolidated financial statements, taken as a whole, and we are not, by communicating the critical audit matter below, providing a separate opinion on the critical audit matter or on the accounts or disclosures to which it relates.
F-2
| Market Technology Revenue Recognition | ||||||||
| Description of the Matter | As described in Notes 2 and 3 to the consolidated financial statements, the Company enters into long-term market technology contracts with customers to develop customized technology solutions, license the right to use software, and provide support and other services which results in these contracts containing multiple performance obligations. The Company recognized $562 million of Marketplace Technology revenue for the year ended December 31, 2022. Of this amount, a portion relates to market technology contracts where the Company allocates the contract transaction price to each performance obligation using its best estimate of the standalone selling price of each distinct good or service in the respective market technology contract. In instances where standalone selling price is not directly observable, such as when a product or service is not sold separately, the Company determines the standalone selling price predominantly through an expected cost plus a margin approach. The Company recognizes revenue over time using costs incurred to date relative to total estimated costs at completion to measure progress toward satisfying the performance obligation. Revenue recognized subject to such estimation was $75 million for the year ended December 31, 2022. Auditing the Company’s calculation of the standalone selling price and timing of revenue recognition was complex and involved a high degree of subjective auditor judgment because of the significant management judgment required to develop the estimates. The standalone selling price is based on an estimate of total project costs, ongoing monitoring of completion of performance obligations and establishing margins for goods or services where a standalone selling price is not directly observable. | |||||||
| How We Addressed the Matter in Our Audit | We obtained an understanding, evaluated the design and tested the operating effectiveness of controls over the Company's processes with respect to estimates that impact the timing and measurement of revenue recognition. For example, we tested controls over the allocation of contract transaction price to performance obligations, including management’s review of the estimated margin used when applying the cost plus an estimated margin to determine the standalone selling price. We also evaluated the design and tested the operating effectiveness of controls over the completeness and accuracy of the data utilized to measure the estimate and recognize the revenue in the appropriate period. We performed substantive audit procedures that included, among other things, evaluating the significant assumptions and the accuracy and completeness of the underlying data used in management’s calculation. Specifically, we inspected certain new customer agreements signed during the year, including change requests, and tested management’s determination of the standalone selling price and its allocation to performance obligations in accordance with the cost plus a margin approach, including comparing the margin assumptions to actual margins earned on completed contracts. We also tested the accuracy of the revenue recognized in the current period by inspecting reports relating to the hours recorded on a project. We evaluated the adequacy of the Company’s disclosures in Notes 2 and 3 to the consolidated financial statements related to market technology revenue recognition. | ||||
/s/ Ernst & Young LLP
We have served as the Company’s auditor since 1986.
New York, New York
February 28, 201823, 2023
F-3
Nasdaq, Inc.
Consolidated Balance Sheets
(in millions, except share and par value amounts)
| December 31, 2022 | December 31, 2021 | ||||||||||
| Assets | |||||||||||
| Current assets: | |||||||||||
| Cash and cash equivalents | $ | 502 | $ | 393 | |||||||
| Restricted cash and cash equivalents | 22 | 29 | |||||||||
| Default funds and margin deposits (including restricted cash and cash equivalents of $6,470 and $5,074, respectively) | 7,021 | 5,911 | |||||||||
| Financial investments | 181 | 208 | |||||||||
| Receivables, net | 677 | 588 | |||||||||
| Other current assets | 201 | 294 | |||||||||
| Total current assets | 8,604 | 7,423 | |||||||||
| Property and equipment, net | 532 | 509 | |||||||||
| Goodwill | 8,099 | 8,433 | |||||||||
| Intangible assets, net | 2,581 | 2,813 | |||||||||
| Operating lease assets | 444 | 366 | |||||||||
| Other non-current assets | 608 | 571 | |||||||||
| Total assets | $ | 20,868 | $ | 20,115 | |||||||
| Liabilities | |||||||||||
| Current liabilities: | |||||||||||
| Accounts payable and accrued expenses | $ | 185 | $ | 185 | |||||||
| Section 31 fees payable to SEC | 243 | 62 | |||||||||
| Accrued personnel costs | 243 | 252 | |||||||||
| Deferred revenue | 357 | 329 | |||||||||
| Other current liabilities | 122 | 115 | |||||||||
| Default funds and margin deposits | 7,021 | 5,911 | |||||||||
| Short-term debt | 664 | 1,018 | |||||||||
| Total current liabilities | 8,835 | 7,872 | |||||||||
| Long-term debt | 4,735 | 4,812 | |||||||||
| Deferred tax liabilities, net | 456 | 406 | |||||||||
| Operating lease liabilities | 452 | 386 | |||||||||
| Other non-current liabilities | 226 | 234 | |||||||||
| Total liabilities | 14,704 | 13,710 | |||||||||
| Commitments and contingencies | |||||||||||
| Equity | |||||||||||
| Nasdaq stockholders’ equity: | |||||||||||
| Common stock, $0.01 par value, 900,000,000 shares authorized, shares issued: 513,157,630 at December 31, 2022 and 520,256,817 at December 31, 2021; shares outstanding: 491,592,491 at December 31, 2022 and 500,038,905 at December 31, 2021 | 5 | 5 | |||||||||
| Additional paid-in capital | 1,445 | 1,949 | |||||||||
| Common stock in treasury, at cost: 21,565,139 shares at December 31, 2022 and 20,217,912 shares at December 31, 2021 | (515) | (437) | |||||||||
| Accumulated other comprehensive loss | (1,991) | (1,587) | |||||||||
| Retained earnings | 7,207 | 6,465 | |||||||||
| Total Nasdaq stockholders’ equity | 6,151 | 6,395 | |||||||||
| Noncontrolling interests | 13 | 10 | |||||||||
| Total equity | 6,164 | 6,405 | |||||||||
| Total liabilities and equity | $ | 20,868 | $ | 20,115 | |||||||
| December 31, 2017 | December 31, 2016 | ||||||
| Assets | |||||||
| Current assets: | |||||||
| Cash and cash equivalents | $ | 377 | $ | 403 | |||
| Restricted cash | 22 | 15 | |||||
| Financial investments, at fair value | 235 | 245 | |||||
| Receivables, net | 423 | 429 | |||||
| Default funds and margin deposits | 3,988 | 3,301 | |||||
| Other current assets | 187 | 167 | |||||
| Assets held for sale | 297 | — | |||||
| Total current assets | 5,529 | 4,560 | |||||
| Property and equipment, net | 400 | 362 | |||||
| Deferred tax assets | 391 | 717 | |||||
| Goodwill | 6,586 | 6,027 | |||||
| Intangible assets, net | 2,468 | 2,094 | |||||
| Other non-current assets | 412 | 390 | |||||
| Total assets | $ | 15,786 | $ | 14,150 | |||
| Liabilities | |||||||
| Current liabilities: | |||||||
| Accounts payable and accrued expenses | $ | 177 | $ | 175 | |||
| Section 31 fees payable to SEC | 128 | 108 | |||||
| Accrued personnel costs | 170 | 207 | |||||
| Deferred revenue | 189 | 162 | |||||
| Other current liabilities | 85 | 129 | |||||
| Default funds and margin deposits | 3,988 | 3,301 | |||||
| Short-term debt | 480 | — | |||||
| Liabilities held for sale | 45 | — | |||||
| Total current liabilities | 5,262 | 4,082 | |||||
| Long-term debt | 3,727 | 3,603 | |||||
| Deferred tax liabilities | 602 | 720 | |||||
| Non-current deferred revenue | 146 | 171 | |||||
| Other non-current liabilities | 162 | 144 | |||||
| Total liabilities | 9,899 | 8,720 | |||||
| Commitments and contingencies | |||||||
| Equity | |||||||
| Nasdaq stockholders’ equity: | |||||||
| Common stock, $0.01 par value, 300,000,000 shares authorized, shares issued: 172,373,432 at December 31, 2017 and 170,501,186 at December 31, 2016; shares outstanding: 167,441,030 at December 31, 2017 and 166,579,468 at December 31, 2016 | 2 | 2 | |||||
| Additional paid-in capital | 3,024 | 3,104 | |||||
| Common stock in treasury, at cost: 4,932,402 shares at December 31, 2017 and 3,921,718 shares at December 31, 2016 | (247 | ) | (176 | ) | |||
| Accumulated other comprehensive loss | (862 | ) | (979 | ) | |||
| Retained earnings | 3,970 | 3,479 | |||||
| Total Nasdaq stockholders’ equity | 5,887 | 5,430 | |||||
| Total liabilities and equity | $ | 15,786 | $ | 14,150 | |||
See accompanying notes to consolidated financial statements.
Nasdaq,Inc.
Consolidated Statements of Income
(in millions, except per share amounts)
| Year Ended December 31, | |||||||||||||||||||||||||||||
| 2022 | 2021 | 2020 | |||||||||||||||||||||||||||
| Revenues: | |||||||||||||||||||||||||||||
| Market Platforms | $ | 4,225 | $ | 4,048 | $ | 4,179 | |||||||||||||||||||||||
| Capital Access Platforms | 1,684 | 1,568 | 1,287 | ||||||||||||||||||||||||||
| Anti-Financial Crime | 306 | 231 | 116 | ||||||||||||||||||||||||||
| Other revenues | 11 | 39 | 43 | ||||||||||||||||||||||||||
| Total revenues | 6,226 | 5,886 | 5,625 | ||||||||||||||||||||||||||
| Transaction-based expenses: | |||||||||||||||||||||||||||||
| Transaction rebates | (2,092) | (2,168) | (2,028) | ||||||||||||||||||||||||||
| Brokerage, clearance and exchange fees | (552) | (298) | (694) | ||||||||||||||||||||||||||
| Revenues less transaction-based expenses | 3,582 | 3,420 | 2,903 | ||||||||||||||||||||||||||
| Operating expenses: | |||||||||||||||||||||||||||||
| Compensation and benefits | 1,003 | 938 | 786 | ||||||||||||||||||||||||||
| Professional and contract services | 140 | 144 | 137 | ||||||||||||||||||||||||||
| Computer operations and data communications | 207 | 186 | 151 | ||||||||||||||||||||||||||
| Occupancy | 104 | 109 | 107 | ||||||||||||||||||||||||||
| General, administrative and other | 125 | 85 | 142 | ||||||||||||||||||||||||||
| Marketing and advertising | 51 | 57 | 39 | ||||||||||||||||||||||||||
| Depreciation and amortization | 258 | 278 | 202 | ||||||||||||||||||||||||||
| Regulatory | 33 | 64 | 24 | ||||||||||||||||||||||||||
| Merger and strategic initiatives | 82 | 87 | 33 | ||||||||||||||||||||||||||
| Restructuring charges | 15 | 31 | 48 | ||||||||||||||||||||||||||
| Total operating expenses | 2,018 | 1,979 | 1,669 | ||||||||||||||||||||||||||
| Operating income | 1,564 | 1,441 | 1,234 | ||||||||||||||||||||||||||
| Interest income | 7 | 1 | 4 | ||||||||||||||||||||||||||
| Interest expense | (129) | (125) | (101) | ||||||||||||||||||||||||||
| Net gain on divestiture of business | — | 84 | — | ||||||||||||||||||||||||||
| Other income | 2 | 81 | 5 | ||||||||||||||||||||||||||
| Net income from unconsolidated investees | 31 | 52 | 70 | ||||||||||||||||||||||||||
| Income before income taxes | 1,475 | 1,534 | 1,212 | ||||||||||||||||||||||||||
| Income tax provision | 352 | 347 | 279 | ||||||||||||||||||||||||||
| Net income | 1,123 | 1,187 | 933 | ||||||||||||||||||||||||||
| Net loss attributable to noncontrolling interests | 2 | — | — | ||||||||||||||||||||||||||
| Net income attributable to Nasdaq | $ | 1,125 | $ | 1,187 | $ | 933 | |||||||||||||||||||||||
| Per share information: | |||||||||||||||||||||||||||||
| Basic earnings per share | $ | 2.28 | $ | 2.38 | $ | 1.89 | |||||||||||||||||||||||
| Diluted earnings per share | $ | 2.26 | $ | 2.35 | $ | 1.86 | |||||||||||||||||||||||
| Cash dividends declared per common share | $ | 0.78 | $ | 0.70 | $ | 0.65 | |||||||||||||||||||||||
| Year Ended December 31, | ||||||||||||
| 2017 | 2016 | 2015 | ||||||||||
| Revenues: | ||||||||||||
| Market Services | $ | 2,418 | $ | 2,255 | $ | 2,084 | ||||||
| Corporate Services | 656 | 635 | 562 | |||||||||
| Information Services | 588 | 540 | 512 | |||||||||
| Market Technology | 303 | 275 | 245 | |||||||||
| Total revenues | 3,965 | 3,705 | 3,403 | |||||||||
| Transaction-based expenses: | ||||||||||||
| Transaction rebates | (1,158 | ) | (1,092 | ) | (983 | ) | ||||||
| Brokerage, clearance and exchange fees | (379 | ) | (336 | ) | (330 | ) | ||||||
| Revenues less transaction-based expenses | 2,428 | 2,277 | 2,090 | |||||||||
| Operating expenses: | ||||||||||||
| Compensation and benefits | 675 | 664 | 590 | |||||||||
| Professional and contract services | 156 | 153 | 148 | |||||||||
| Computer operations and data communications | 125 | 111 | 107 | |||||||||
| Occupancy | 95 | 86 | 85 | |||||||||
| General, administrative and other | 82 | 72 | 65 | |||||||||
| Marketing and advertising | 31 | 30 | 28 | |||||||||
| Depreciation and amortization | 188 | 170 | 138 | |||||||||
| Regulatory | 33 | 35 | 27 | |||||||||
| Merger and strategic initiatives | 44 | 76 | 10 | |||||||||
| Restructuring charges | — | 41 | 172 | |||||||||
| Total operating expenses | 1,429 | 1,438 | 1,370 | |||||||||
| Operating income | 999 | 839 | 720 | |||||||||
| Interest income | 7 | 5 | 4 | |||||||||
| Interest expense | (143 | ) | (135 | ) | (111 | ) | ||||||
| Asset impairment charge | — | (578 | ) | — | ||||||||
| Other investment income | 2 | 3 | — | |||||||||
| Net income from unconsolidated investees | 15 | 2 | 17 | |||||||||
| Income before income taxes | 880 | 136 | 630 | |||||||||
| Income tax provision | 146 | 28 | 203 | |||||||||
| Net income | 734 | 108 | 427 | |||||||||
| Net loss attributable to noncontrolling interests | — | — | 1 | |||||||||
| Net income attributable to Nasdaq | $ | 734 | $ | 108 | $ | 428 | ||||||
| Per share information: | ||||||||||||
| Basic earnings per share | $ | 4.41 | $ | 0.65 | $ | 2.56 | ||||||
| Diluted earnings per share | $ | 4.33 | $ | 0.64 | $ | 2.50 | ||||||
| Cash dividends declared per common share | $ | 1.46 | $ | 1.21 | $ | 0.90 | ||||||
| Year Ended December 31, | ||||||||||||
| 2017 | 2016 | 2015 | ||||||||||
| Net income | $ | 734 | $ | 108 | $ | 427 | ||||||
| Other comprehensive income (loss): | ||||||||||||
| Foreign currency translation gains (losses): | ||||||||||||
| Net foreign currency translation gains (losses) | 214 | (183 | ) | (283 | ) | |||||||
| Income tax benefit (expense) | (96 | ) | 68 | 100 | ||||||||
| Total | 118 | (115 | ) | (183 | ) | |||||||
| Employee benefit plan gains (losses): | ||||||||||||
| Employee benefit plan adjustment gains (losses) | (2 | ) | — | 2 | ||||||||
| Income tax benefit (expense) | 1 | — | (1 | ) | ||||||||
| Total | (1 | ) | — | 1 | ||||||||
| Total other comprehensive income (loss), net of tax | 117 | (115 | ) | (182 | ) | |||||||
| Comprehensive income (loss) | 851 | (7 | ) | 245 | ||||||||
| Comprehensive loss attributable to noncontrolling interests | — | — | 1 | |||||||||
| Comprehensive income (loss) attributable to Nasdaq | $ | 851 | $ | (7 | ) | $ | 246 | |||||
Number of Common Shares Outstanding | Common Stock at Par Value | Additional Paid-in Capital | Common Stock In Treasury, at Cost | Accumulated Other Comprehensive Loss | Retained Earnings | Non- controlling Interests | Total | ||||||||||||||||||||||||
| Balance at December 31, 2014 | 168,795,263 | $ | 2 | $ | 3,222 | $ | (41 | ) | $ | (682 | ) | $ | 3,292 | $ | 1 | $ | 5,794 | ||||||||||||||
| Net income (loss) | — | — | — | — | — | — | 428 | (1 | ) | 427 | |||||||||||||||||||||
| Foreign currency translation, net of tax of $100 | — | — | — | — | (183 | ) | — | — | (183 | ) | |||||||||||||||||||||
| Employee benefit plan adjustments, net of tax of $1 | — | — | — | — | 1 | — | — | 1 | |||||||||||||||||||||||
| Cash dividends declared per common share | — | — | — | — | — | (149 | ) | — | (149 | ) | |||||||||||||||||||||
| Share repurchase program | (7,191,685 | ) | — | (340 | ) | (37 | ) | — | — | — | (377 | ) | |||||||||||||||||||
| Share-based compensation | 1,455,380 | — | 68 | — | — | — | — | 68 | |||||||||||||||||||||||
| Stock option exercises, net | 682,054 | — | 18 | — | — | — | — | 18 | |||||||||||||||||||||||
| Other issuances of common stock, net | (408,989 | ) | — | 55 | (33 | ) | — | — | — | 22 | |||||||||||||||||||||
| Purchase of subsidiary shares to noncontrolling interests and other adjustments | — | — | (12 | ) | — | — | — | — | (12 | ) | |||||||||||||||||||||
| Issuance of Nasdaq common stock related to a prior acquisition | 992,247 | — | — | — | — | — | — | — | |||||||||||||||||||||||
| Balance at December 31, 2015 | 164,324,270 | $ | 2 | $ | 3,011 | $ | (111 | ) | $ | (864 | ) | $ | 3,571 | $ | — | $ | 5,609 | ||||||||||||||
| Net income | — | — | — | — | — | 108 | — | 108 | |||||||||||||||||||||||
| Foreign currency translation, net of tax of $68 | — | — | — | — | (115 | ) | — | — | (115 | ) | |||||||||||||||||||||
| Cash dividends declared per common share | — | — | — | — | — | (200 | ) | — | (200 | ) | |||||||||||||||||||||
| Share repurchase program | (1,547,778 | ) | — | (100 | ) | — | — | — | — | (100 | ) | ||||||||||||||||||||
| Share-based compensation | 2,361,699 | — | 86 | — | — | — | — | 86 | |||||||||||||||||||||||
| Stock option exercises, net | 1,219,820 | — | 41 | — | — | — | — | 41 | |||||||||||||||||||||||
| Other issuances of common stock, net | (770,790 | ) | — | 66 | (65 | ) | — | — | — | 1 | |||||||||||||||||||||
| Issuance of Nasdaq common stock related to a prior acquisition | 992,247 | — | — | — | — | — | — | — | |||||||||||||||||||||||
| Balance at December 31, 2016 | 166,579,468 | $ | 2 | $ | 3,104 | $ | (176 | ) | $ | (979 | ) | $ | 3,479 | $ | — | $ | 5,430 | ||||||||||||||
| Net income | — | — | — | — | — | 734 | — | 734 | |||||||||||||||||||||||
Foreign currency translation, net of tax of $96 | — | — | — | — | 118 | — | — | 118 | |||||||||||||||||||||||
| Employee benefit plan adjustments, net of tax of $1 | — | — | — | — | (1 | ) | — | — | (1 | ) | |||||||||||||||||||||
| Cash dividends declared per common share | — | — | — | — | — | (243 | ) | — | (243 | ) | |||||||||||||||||||||
| Share repurchase program | (2,843,519 | ) | — | (203 | ) | — | — | — | — | (203 | ) | ||||||||||||||||||||
| Share-based compensation | 2,384,821 | — | 70 | — | — | — | — | 70 | |||||||||||||||||||||||
| Stock option exercises, net | 1,102,830 | — | 24 | — | — | — | — | 24 | |||||||||||||||||||||||
| Other issuances of common stock, net | (774,817 | ) | — | 29 | (71 | ) | — | — | — | (42 | ) | ||||||||||||||||||||
| Issuance of Nasdaq common stock related to a prior acquisition | 992,247 | — | — | — | — | — | — | — | |||||||||||||||||||||||
| Balance at December 31, 2017 | 167,441,030 | $ | 2 | $ | 3,024 | $ | (247 | ) | $ | (862 | ) | $ | 3,970 | $ | — | $ | 5,887 | ||||||||||||||
See accompanying notes to consolidated financial statements.
F-5
Nasdaq,Inc.
Consolidated Statements of Comprehensive Income
(in millions)
| Year Ended December 31, | |||||||||||||||||||||||||||||
| 2022 | 2021 | 2020 | |||||||||||||||||||||||||||
| Net income | $ | 1,123 | $ | 1,187 | $ | 933 | |||||||||||||||||||||||
| Other comprehensive income (loss): | |||||||||||||||||||||||||||||
| Foreign currency translation gains (losses) | (375) | (176) | 269 | ||||||||||||||||||||||||||
Income tax benefit (expense)(1) | (32) | (42) | 49 | ||||||||||||||||||||||||||
| Foreign currency translation, net | (407) | (218) | 318 | ||||||||||||||||||||||||||
| Employee benefit plan adjustment gains (losses) | 5 | (1) | — | ||||||||||||||||||||||||||
| Employee benefit plan income tax provision | (2) | — | — | ||||||||||||||||||||||||||
| Employee benefit plan, net | 3 | (1) | — | ||||||||||||||||||||||||||
| Total other comprehensive income (loss), net of tax | (404) | (219) | 318 | ||||||||||||||||||||||||||
| Comprehensive income | 719 | 968 | 1,251 | ||||||||||||||||||||||||||
| Comprehensive loss attributable to noncontrolling interests | 2 | — | — | ||||||||||||||||||||||||||
| Comprehensive income attributable to Nasdaq | $ | 721 | $ | 968 | $ | 1,251 | |||||||||||||||||||||||
____________
(1) Primarily relates to the tax effect of unrealized gains and losses on Euro denominated notes.
See accompanying notes to consolidated financial statements.
F-6
Nasdaq, Inc.
Consolidated Statements of Changes in Stockholders' Equity
(in millions)
| Year Ended December 31, | |||||||||||||||||||||||||||||||||||||||||||||||||||||||||||
| 2022 | 2021 | 2020 | |||||||||||||||||||||||||||||||||||||||||||||||||||||||||
| Shares | $ | Shares | $ | Shares | $ | ||||||||||||||||||||||||||||||||||||||||||||||||||||||
| Common stock | 500 | 5 | 495 | 5 | 495 | 5 | |||||||||||||||||||||||||||||||||||||||||||||||||||||
| Additional paid-in capital | |||||||||||||||||||||||||||||||||||||||||||||||||||||||||||
| Beginning balance | 1,949 | 2,544 | 2,629 | ||||||||||||||||||||||||||||||||||||||||||||||||||||||||
| Share repurchase program | (5) | (308) | (9) | (468) | (6) | (222) | |||||||||||||||||||||||||||||||||||||||||||||||||||||
ASR agreement(1) | (6) | (325) | (7) | (475) | — | — | |||||||||||||||||||||||||||||||||||||||||||||||||||||
| Share-based compensation | 3 | 106 | 3 | 90 | 3 | 87 | |||||||||||||||||||||||||||||||||||||||||||||||||||||
| Stock option exercises, net | — | — | — | 1 | — | 2 | |||||||||||||||||||||||||||||||||||||||||||||||||||||
Other issuances of common stock, net(2) | 1 | 23 | 19 | 257 | 3 | 48 | |||||||||||||||||||||||||||||||||||||||||||||||||||||
| Ending balance | 1,445 | 1,949 | 2,544 | ||||||||||||||||||||||||||||||||||||||||||||||||||||||||
| Common stock in treasury, at cost | |||||||||||||||||||||||||||||||||||||||||||||||||||||||||||
| Beginning balance | (437) | (376) | (336) | ||||||||||||||||||||||||||||||||||||||||||||||||||||||||
| Other employee stock activity | (1) | (78) | (1) | (61) | — | (40) | |||||||||||||||||||||||||||||||||||||||||||||||||||||
| Ending balance | (515) | (437) | (376) | ||||||||||||||||||||||||||||||||||||||||||||||||||||||||
| Accumulated other comprehensive loss | |||||||||||||||||||||||||||||||||||||||||||||||||||||||||||
| Beginning balance | (1,587) | (1,368) | (1,686) | ||||||||||||||||||||||||||||||||||||||||||||||||||||||||
| Other comprehensive income (loss) | (404) | (219) | 318 | ||||||||||||||||||||||||||||||||||||||||||||||||||||||||
| Ending balance | (1,991) | (1,587) | (1,368) | ||||||||||||||||||||||||||||||||||||||||||||||||||||||||
| Retained earnings | |||||||||||||||||||||||||||||||||||||||||||||||||||||||||||
| Beginning balance | 6,465 | 5,628 | 5,027 | ||||||||||||||||||||||||||||||||||||||||||||||||||||||||
Impact of adoption of ASU 2016-13 | — | — | (12) | ||||||||||||||||||||||||||||||||||||||||||||||||||||||||
| Net income attributable to Nasdaq | 1,125 | 1,187 | 933 | ||||||||||||||||||||||||||||||||||||||||||||||||||||||||
| Cash dividends declared per common share | (383) | (350) | (320) | ||||||||||||||||||||||||||||||||||||||||||||||||||||||||
| Ending balance | 7,207 | 6,465 | 5,628 | ||||||||||||||||||||||||||||||||||||||||||||||||||||||||
| Total Nasdaq stockholders’ equity | 6,151 | 6,395 | 6,433 | ||||||||||||||||||||||||||||||||||||||||||||||||||||||||
| Noncontrolling interests | |||||||||||||||||||||||||||||||||||||||||||||||||||||||||||
| Beginning balance | 10 | 3 | — | ||||||||||||||||||||||||||||||||||||||||||||||||||||||||
| Net activity related to noncontrolling interests | 3 | 7 | 3 | ||||||||||||||||||||||||||||||||||||||||||||||||||||||||
| Ending balance | 13 | 10 | 3 | ||||||||||||||||||||||||||||||||||||||||||||||||||||||||
| Total Equity | 492 | $ | 6,164 | 500 | $ | 6,405 | 495 | $ | 6,436 | ||||||||||||||||||||||||||||||||||||||||||||||||||
____________
(1) See “ASR Agreement,” of Note 12, “Nasdaq Stockholders’ Equity,” for further discussion.
(2) In 2021, other issuances of common stock primarily related to shares accelerated and issued upon the sale of our U.S. Fixed Income business.
See accompanying notes to consolidated financial statements.
F-7
Nasdaq, Inc.
Consolidated Statements of Cash Flows
(in millions)
| Year Ended December 31, | |||||||||||||||||
| 2022 | 2021 | 2020 | |||||||||||||||
| Cash flows from operating activities: | |||||||||||||||||
| Net income | $ | 1,123 | $ | 1,187 | $ | 933 | |||||||||||
| Adjustments to reconcile net income to net cash provided by operating activities: | |||||||||||||||||
| Depreciation and amortization | 258 | 278 | 202 | ||||||||||||||
| Share-based compensation | 106 | 90 | 87 | ||||||||||||||
| Deferred income taxes | 38 | 94 | 41 | ||||||||||||||
| Extinguishment of debt | 16 | 33 | 36 | ||||||||||||||
| Net gain on divestiture of business | — | (84) | — | ||||||||||||||
| Net income from unconsolidated investees | (31) | (52) | (70) | ||||||||||||||
| Other reconciling items included in net income | 28 | 6 | 32 | ||||||||||||||
| Net change in operating assets and liabilities, net of effects of acquisitions: | |||||||||||||||||
| Receivables, net | (101) | (6) | (167) | ||||||||||||||
| Other assets | 98 | (140) | 26 | ||||||||||||||
| Accounts payable and accrued expenses | 19 | (17) | 5 | ||||||||||||||
| Section 31 fees payable to SEC | 181 | (162) | 92 | ||||||||||||||
| Accrued personnel costs | — | 28 | 32 | ||||||||||||||
| Deferred revenue | 16 | 106 | 15 | ||||||||||||||
Other liabilities(1) | (45) | (278) | (12) | ||||||||||||||
| Net cash provided by operating activities | 1,706 | 1,083 | 1,252 | ||||||||||||||
| Cash flows from investing activities: | |||||||||||||||||
| Purchases of securities | (322) | (316) | (283) | ||||||||||||||
| Proceeds from sales and redemptions of securities | 320 | 285 | 402 | ||||||||||||||
| Proceeds from divestiture of business, net of cash divested | — | 190 | — | ||||||||||||||
| Proceeds from sale of investment securities | — | — | 22 | ||||||||||||||
| Acquisition of businesses, net of cash and cash equivalents acquired | (41) | (2,430) | (157) | ||||||||||||||
| Purchases of property and equipment | (152) | (163) | (188) | ||||||||||||||
Investments related to default funds and margin deposits, net(2) | 211 | (132) | 109 | ||||||||||||||
| Other investing activities | 33 | (87) | (27) | ||||||||||||||
| Net cash provided by (used in) investing activities | 49 | (2,653) | (122) | ||||||||||||||
| Cash flows from financing activities: | |||||||||||||||||
| Proceeds from (repayments of) commercial paper, net | 238 | 420 | (391) | ||||||||||||||
| Repayments of debt and credit commitment | (1,097) | (804) | (1,468) | ||||||||||||||
| Payment of debt extinguishment cost | (16) | (33) | (36) | ||||||||||||||
| Proceeds from issuances of debt, net of issuance costs and utilization of credit commitment | 541 | 826 | 3,807 | ||||||||||||||
| Repurchases of common stock | (308) | (468) | (222) | ||||||||||||||
| ASR agreement | (325) | (475) | — | ||||||||||||||
| Dividends paid | (383) | (350) | (320) | ||||||||||||||
| Proceeds received from employee stock activity and other issuances | 23 | 26 | 50 | ||||||||||||||
| Payments related to employee shares withheld for taxes | (78) | (61) | (40) | ||||||||||||||
| Default funds and margin deposits | 2,440 | 2,330 | 527 | ||||||||||||||
| Other financing activities | 1 | 7 | 3 | ||||||||||||||
| Net cash provided by financing activities | 1,036 | 1,418 | 1,910 | ||||||||||||||
| Effect of exchange rate changes on cash and cash equivalents and restricted cash and cash equivalents | (1,293) | (331) | 353 | ||||||||||||||
| Net increase (decrease) in cash and cash equivalents and restricted cash and cash equivalents | 1,498 | (483) | 3,393 | ||||||||||||||
Cash and cash equivalents, restricted cash and cash equivalents at beginning of period | 5,496 | 5,979 | 2,586 | ||||||||||||||
| Cash and cash equivalents, restricted cash and cash equivalents at end of period | $ | 6,994 | $ | 5,496 | $ | 5,979 | |||||||||||
| Reconciliation of Cash, Cash Equivalents and Restricted Cash and Cash Equivalents | |||||||||||||||||
| Cash and cash equivalents | $ | 502 | $ | 393 | $ | 2,745 | |||||||||||
| Restricted cash and cash equivalents | 22 | 29 | 37 | ||||||||||||||
| Restricted cash and cash equivalents (default funds and margin deposits) | 6,470 | 5,074 | 3,197 | ||||||||||||||
| Total | $ | 6,994 | $ | 5,496 | $ | 5,979 | |||||||||||
| Supplemental Disclosure Cash Flow Information | |||||||||||||||||
| Interest paid | $ | 116 | $ | 118 | $ | 97 | |||||||||||
Income taxes paid, net of refund(1) | $ | 274 | $ | 501 | $ | 290 | |||||||||||
| Year Ended December 31, | |||||||||||
| 2017 | 2016 | 2015 | |||||||||
| Cash flows from operating activities: | |||||||||||
| Net income | $ | 734 | $ | 108 | $ | 427 | |||||
| Adjustments to reconcile net income to net cash provided by operating activities: | |||||||||||
| Depreciation and amortization | 188 | 170 | 138 | ||||||||
| Share-based compensation | 70 | 86 | 68 | ||||||||
| Deferred income taxes | 10 | (136 | ) | (14 | ) | ||||||
| Non-cash restructuring charges | — | 8 | 136 | ||||||||
| Asset impairment charge | — | 578 | — | ||||||||
| Net income from unconsolidated investees | (15 | ) | (2 | ) | (17 | ) | |||||
| Other reconciling items included in net income | 25 | 9 | 7 | ||||||||
| Net change in operating assets and liabilities, net of effects of acquisitions: | |||||||||||
| Receivables, net | 25 | (24 | ) | 55 | |||||||
| Other assets | 261 | (18 | ) | (41 | ) | ||||||
| Accounts payable and accrued expenses | (12 | ) | 5 | (38 | ) | ||||||
| Section 31 fees payable to SEC | 20 | 5 | (26 | ) | |||||||
| Accrued personnel costs | (41 | ) | 27 | 33 | |||||||
| Deferred revenue | (43 | ) | (15 | ) | (49 | ) | |||||
| Other liabilities | (61 | ) | (25 | ) | 48 | ||||||
| Net assets held for sale | (252 | ) | — | — | |||||||
| Net cash provided by operating activities | 909 | 776 | 727 | ||||||||
| Cash flows from investing activities: | |||||||||||
| Purchases of trading securities | (366 | ) | (443 | ) | (346 | ) | |||||
| Proceeds from sales and redemptions of trading securities | 394 | 392 | 319 | ||||||||
| Purchases of available-for-sale investment securities | (26 | ) | (25 | ) | (38 | ) | |||||
| Proceeds from maturities of available-for-sale investment securities | 30 | 19 | 29 | ||||||||
| Capital contribution in equity method investment | — | — | (30 | ) | |||||||
| Acquisition of businesses, net of cash and cash equivalents acquired | (776 | ) | (1,460 | ) | (226 | ) | |||||
| Purchases of property and equipment | (144 | ) | (134 | ) | (133 | ) | |||||
| Other investment activities | (2 | ) | (6 | ) | (10 | ) | |||||
| Net cash used in investing activities | (890 | ) | (1,657 | ) | (435 | ) | |||||
| Cash flows from financing activities: | |||||||||||
| Proceeds from commercial paper, net | 480 | — | — | ||||||||
| Repayments of long-term debt | (708 | ) | (1,156 | ) | (369 | ) | |||||
| Payment of debt extinguishment cost | (9 | ) | — | — | |||||||
| Proceeds from utilization of credit commitment, net of debt issuance costs | 150 | 898 | 506 | ||||||||
| Proceeds from issuances of senior unsecured notes, net of debt issuance costs | 498 | 1,159 | — | ||||||||
| Proceeds from issuance of term loan facility | — | 399 | — | ||||||||
| Cash paid for repurchase of common stock | (203 | ) | (100 | ) | (377 | ) | |||||
| Cash dividends | (243 | ) | (200 | ) | (149 | ) | |||||
| Proceeds received from employee stock activity | 53 | 54 | 29 | ||||||||
| Payments related to employee shares withheld for taxes | (71 | ) | (65 | ) | (34 | ) | |||||
| Proceeds (disbursements) of customer funds | — | (38 | ) | 13 | |||||||
| Other financing activities | — | (3 | ) | (19 | ) | ||||||
| Net cash (used in) provided by financing activities | (53 | ) | 948 | (400 | ) | ||||||
| Effect of exchange rate changes on cash and cash equivalents and restricted cash | 15 | (6 | ) | (11 | ) | ||||||
| Net increase (decrease) in cash and cash equivalents and restricted cash | (19 | ) | 61 | (119 | ) | ||||||
| Cash and cash equivalents and restricted cash at beginning of period | 418 | 357 | 476 | ||||||||
| Cash and cash equivalents and restricted cash at end of period | $ | 399 | $ | 418 | $ | 357 | |||||
| Supplemental Disclosure Cash Flow Information | |||||||||||
| Cash paid for: | |||||||||||
| Interest | $ | 129 | $ | 119 | $ | 103 | |||||
| Income taxes, net of refund | $ | 154 | $ | 191 | $ | 202 | |||||
(2) Includes purchases and proceeds from sales and redemptions related to the default funds and margin deposits of our clearing operations. For further information, see "Default Fund Contributions and Margin Deposits," within Note 15, "Clearing Operations."
See accompanying notes to consolidated financial statements.
Nasdaq, Inc.
Notes to Consolidated Financial Statements
1. Organization and Nature of OperationsORGANIZATION AND NATURE OF OPERATIONS
Nasdaq Inc. is a leading providerglobal technology company serving the capital markets and other industries. Our diverse offerings of trading, clearing, marketplace technology, regulatory, securities listing, informationdata, analytics, software and publicservices enable clients to optimize and private company services. execute their business vision with confidence.
In 2022, we announced a new organizational structure which aligns our businesses more closely with the foundational shifts that are driving the evolution of the global financial system. In order to amplify our strategy, we aligned the Company more closely with evolving client needs. As a result, our four previous business segments, Market Technology, Investment Intelligence, Corporate Platforms and Market Services, have been changed to align with our new corporate structure that now includes three business segments: Capital Access Platforms, Market Platforms, and Anti-Financial Crime.
For further discussion of our businesses, see “Products and Services,” of “Item 1. Business.”
Market Platforms
Our global offerings are diverseMarket Platforms segment includes our Trading Services and includeMarketplace Technology businesses. Our Trading Services business primarily includes revenues from equity derivatives trading, and clearing across multiple asset classes, trade management services, data products, financial indexes, capital formation solutions, corporate solutions, and market technology products and services. Our technology powers markets across the globe, supporting equity derivative trading, clearing and settlement, cash equity trading, Nordic fixed income trading trading surveillance& clearing, Nordic commodities and many other functions.
Our transaction-based platforms provide market participants with the ability to access, process, display and integrate orders and quotes. The platforms allow the routing and execution of buy and sell orders as well as the reporting of transactions, providing fee-based revenues.
In the U.S., we operate six electronic options exchangesaddition to our trading and three cash equity exchanges. The Nasdaq Stock Market, the largest of our cash equities exchanges, is the largest single venue of liquidity for trading U.S.-listed cash equities. We also operate an electronic platform for trading of U.S. Treasuries and NFX, a U.S. based designated contract market which lists cash-settled energy derivatives based on key energy benchmarks including oil, natural gas and U.S. power. In addition, we also operate three Canadian markets for the trading of Canadian-listed securities.
Our Marketplace Technology business includes our trade management services and Vilnius (Lithuania) as Nasdaq Baltic. Collectively, Nasdaq Nordic and Nasdaq Baltic offer trading in cash equities, depository receipts, warrants, convertibles, rights, fund units and ETFs, as well as trading and clearing of derivatives and clearing of resale and repurchase agreements.
Our market technology business is a leading global technology solutions provider and customizedpartner to exchanges, clearing organizations, central securities administrationdepositories, regulators, banks, brokers, buy-side firms and corporate businesses. Our solutions to financial participantsare utilized by leading markets in the Nordic market.U.S., Europe and Asia as well as emerging markets in the Middle East, Latin America, and Africa.
Our Corporate ServicesCapital Access Platforms segment includes our Corporate Solutions andData & Listing Services, Index and Workflow & Insights businesses.
Our Corporate Solutionsdata business serves corporate clients, including companies listed onsells and distributes historical and real-time market data to the sell-side, the institutional investing community, retail online brokers, proprietary trading firms and other venues, as well as internet portals and data distributors. Our data products can enhance transparency of market activity within our exchanges and private companies. We help organizations manage the two-way flowprovide critical information to professional and non-professional investors globally. Additionally, our Nasdaq Cloud Data Service provides a flexible and efficient method of information with their key constituents, including their board membersdelivery for real-time exchange data and investors, and with clients and the public through our suite of advanced technology, analytics, and consultative services. Our Corporate Solutions business currently offers products to serve the following key areas: investor relations, board & leadership, public relations solutions, and digital media services. As of September 30, 2017, our Public Relations Solutions and Digital Media Services businesses have been classified as held for sale. See Note 5, “Assets and Liabilities Held for Sale,” for further discussion. In January 2018, we announced that we entered into a definitive agreement to sell these businesses. See “Definitive Agreement to Sell our Public Relations Solutions and Digital Media Services Businesses,” of Note 21, “Subsequent Events,” for further discussion.other financial information.
Our Listing Serviceslisting services business includes ouroperates in the U.S. and European Listing Services businesses. We operateEurope on a variety of listing platforms around the world to provide multiple global capital raising solutions for private and public companies. Our main listing markets are The Nasdaq Stock Market and the Nasdaq Nordic and Nasdaq Baltic exchanges. Through Nasdaq First North, our Nordic and Baltic operations also offer alternative marketplaces for smaller companies and growth companies. OurIn July 2021, we contributed our NPM business, which was included in our Listing Services business, also includesto a standalone, independent company, of which we own the largest minority interest, together with a consortium of third-party financial institutions. The NPM whichbusiness provides liquidity solutions for private companies.companies to enable employees, investors, and companies to execute transactions.
F-9
As of December 31, 2017,2022, there were 2,9494,230 total listings on The Nasdaq Stock Market, including 373528 ETPs. The combined market capitalization was approximately $11.6$19.3 trillion. In Europe, the Nasdaq Nordic and Nasdaq Baltic exchanges, together with Nasdaq First North, were home to 9841,251 listed companies with a combined market capitalization of approximately $1.5$1.9 trillion.
Our Index Licensing and Services business develops and licenses Nasdaq brandedNasdaq-branded indexes associated derivatives, and financial productsproducts. We also license cash-settled options, futures and also provides custom calculation services for third-party clients.options on futures on our indexes. As of December 31, 2017,2022, 379 ETPs listed on 26 exchanges in over 20 countries tracked a Nasdaq index and accounted for $315 billion in AUM.
Workflow & Insights includes our analytics and corporate solutions businesses. Our analytics business provides asset managers, investment consultants and institutional asset owners with information and analytics to make data-driven investment decisions, deploy their resources more productively, and provide liquidity solutions for private funds. Through our eVestment and Solovis solutions, we had 324 ETPs licensedprovide a suite of cloud-based solutions that help institutional investors and consultants conduct pre-investment due diligence, and monitor their portfolios post-investment. The eVestment platform also enables asset managers to Nasdaq’s indexes which had $167 billionefficiently distribute information about their firms and funds to asset owners and consultants worldwide.
Through the Solovis platform, endowments, foundations, pensions and family offices transform how they collect and aggregate investment data, analyze portfolio performance, model and predict future outcomes, and share meaningful portfolio insights with key stakeholders. The Nasdaq Fund Network and Nasdaq Data Link are additional platforms in our suite of assets under management.
Our Market Technologycorporate solutions business includes our Investor Relations Intelligence, ESG Solutions and Governance Solutions products, which serve both public and private companies and organizations. Our public company clients can be companies listed on our exchanges or other U.S. and global exchanges. Our private company clients include a diverse group of organizations ranging from family-owned companies, government organizations, law firms, privately held entities, and various non-profit organizations to hospitals and healthcare systems. We help organizations enhance their ability to understand and expand their global shareholder base, improve corporate governance, and navigate the evolving ESG landscape through our suite of advanced technology, analytics, reporting and consulting services. In June 2022, we acquired Metrio, a provider of ESG data collection, analytics and reporting services based in Montreal, Canada. We plan to integrate Metrio’s SaaS platform into our suite of ESG solutions.
Anti-Financial Crime
Our Anti-Financial Crime segment isprovides anti-financial crime management solutions on a leading global technology solutions providercloud-based platform to help detect, investigate, and partner to exchanges, clearing organizations, central securities depositories, regulators, banks,report money laundering and financial fraud through Verafin, which was acquired in February 2021. Our Anti-Financial Crime segment includes Nasdaq Trade Surveillance, a SaaS solution designed for brokers and corporate businesses. Our Market Technology business is the sales channel for our complete global offeringother market participants to other marketplaces.
2. Summary of Significant Accounting PoliciesSUMMARY OF SIGNIFICANT ACCOUNTING POLICIES
Basis of Presentation and Principles of Consolidation
The consolidated financial statements are prepared in accordance with U.S. GAAP and include the accounts of Nasdaq, its wholly-owned subsidiaries and other entities in which Nasdaq has a controlling financial interest. When we do not have a controlling interest in an entity but exercise significant influence over the entity’s operating and financial policies, such investment is accounted for under the equity method of accounting. We recognize our share of earnings or losses of an equity method investee based on our ownership percentage. See “Equity Method Investments,” of Note 7,6, “Investments,” for further discussion of our equity method investments.
The accompanying consolidated financial statements reflect all adjustments which are, in the opinion of management, necessary for a fair statement of the results. These adjustments
are of a normal recurring nature. All significant intercompany accounts and transactions have been eliminated in consolidation.
Certain prior year amounts have been reclassified to conform to the current year presentation.
During the fourth quarter of 2021, we adjusted the presentation of cash and cash equivalents held within default funds and margin deposits on the consolidated statement of cash flows from operating activities, to present them as restricted cash and cash equivalents with the associated changes being included within cash flows from investing and financing activities. These balances cannot be used to satisfy the Company's operating or other liabilities. See Note 15, “Clearing Operations,” for further discussion of the default funds and margin deposits.
Prior period amounts have also been adjusted to conform to current period presentation. This immaterial adjustment had no impact on our previously reported consolidated balance sheets, consolidated statements of income, or consolidated statements of comprehensive income.
F-10
The table below presents a summary of the 2020 Statements of Cash Flows as reported and as adjusted:
| Year Ended December 31, 2020 | |||||||||||
| As Reported | Adjustment | Adjusted | |||||||||
| (in millions) | |||||||||||
| Net cash provided by operating activities | $ | 1,252 | $ | — | $ | 1,252 | |||||
| Net cash used in investing activities | (231) | 109 | (122) | ||||||||
| Net cash provided by financing activities | 1,383 | 527 | 1,910 | ||||||||
| Effect of exchange rate changes on cash, cash equivalents, restricted cash and cash equivalents | 16 | 337 | 353 | ||||||||
| Net increase in cash, cash equivalents, restricted cash and cash equivalents | 2,420 | 973 | 3,393 | ||||||||
| Cash, cash equivalents, restricted cash and cash equivalents at beginning of period | 362 | 2,224 | 2,586 | ||||||||
| Cash, cash equivalents, restricted cash and cash equivalents at end of period | $ | 2,782 | $ | 3,197 | $ | 5,979 | |||||
| Reconciliation of Cash, Cash Equivalents and Restricted Cash and Cash Equivalents | |||||||||||
| Cash and cash equivalents | $ | 2,745 | $ | — | $ | 2,745 | |||||
| Restricted cash and cash equivalents | 37 | — | 37 | ||||||||
| Restricted cash and cash equivalents (Default funds and margin deposits) | — | 3,197 | 3,197 | ||||||||
| Total | $ | 2,782 | $ | 3,197 | $ | 5,979 | |||||
Use of Estimates
Foreign Currency
Foreign denominated assets and liabilities are remeasured into the functional currency at exchange rates in effect at the balance sheet date and recorded through the income statement. Gains or losses resulting from foreign currency transactions are remeasured using the rates on the dates on which those elements are recognized during the period, and are included in general, administrative and other expense in the Consolidated Statements of Income.
Translation gains or losses resulting from translating our subsidiaries’ financial statements from the local functional currency to the reporting currency, net of tax, are included in accumulated other comprehensive loss within stockholders’ equity in the Consolidated Balance Sheets. Assets and liabilities are translated at the balance sheet date while revenues and expenses are translated at the date the transaction occurs or at an applicable average rate.
Cash and Cash Equivalents
Cash and cash equivalents include all non-restricted cash in banks and highly liquid investments with original maturities of 90 days or less at the time of purchase. Such equivalent investments included in cash and cash equivalents in the Consolidated Balance Sheets were $183$242 million as of December 31, 20172022 and $251$109 million as of December 31, 2016.2021. Cash equivalents are carried at cost plus accrued interest, which approximates fair value due to the short maturities of these investments.
Restricted Cash
requirement or not available for general use and as such is classified as restricted cash in the Consolidated Balance Sheets. As of December 31, 20172022 and 2016, current2021, restricted cash and cash equivalents primarily includes restricted cashfunds held for regulatory capital for our trading and clearing businesses.
Default Funds and Margin Deposits
Nasdaq Clearing members’ cash contributions are included in default funds and margin deposits in the Consolidated Balance Sheets as both a current asset and a current liability. These balances may fluctuate over time due to changes in the amount of deposits required and whether members choose to provide cash or non-cash contributions. Non-cash contributions include highly rated government debt securities that must meet specific criteria approved by Nasdaq Clearing. Non-cash contributions are pledged assets that are not recorded in the Consolidated Balance Sheets as Nasdaq Clearing does not take legal ownership of these assets and the risks and rewards remain with the clearing members.
Receivables, net
Our receivables are concentrated with our member firms, market data distributors, listed companies, investor relations intelligence, governance, anti-financial crime and marketplace technology customers. Receivables are shown net of allowance for credit losses. The allowance is maintained at a level that management believes to be sufficient to absorb expected losses over the life of our accounts receivable portfolio. The allowance is increased by the provision for bad debts, which is included in general, administrative and other expense in the Consolidated Statements of Income, and decreased by the amount of charge-offs, net of recoveries.
F-11
The allowance is primarily based on an aging methodology. This method applies loss rates based on historical loss information which is disaggregated by business segment and, as deemed necessary, is adjusted for other factors and considerations that could impact collectibility.Additionally, we consider corporate default rate averages over an extended period as compared to the period covered by our historical loss data and include an adjustment to historical loss percentages for current conditions and expected future conditions if necessary.
In circumstances where a specific customer’s inability to meet its financial obligations is known (i.e., bankruptcy filings), we determine whether a specific provision for bad debts is required. Accounts receivable are written-off against the allowance when collection efforts cease. Due to changing economic, business and market conditions, we review the allowance quarterly and make changes to the allowance through the provision for bad debts as appropriate. If circumstances change (i.e., higher than expected defaults or an unexpected material adverse change in a major customer’s ability to pay), our estimates of recoverability could be reduced by a material amount. The total allowance netted against receivables in the Consolidated Balance Sheets was $15 million as of December 31, 2022, $17 million as of December 31, 2021 and $21 million as of December 31, 2020. The change in the balance in 2022 was immaterial.
In 2020 we adopted ASU 2016-13, which changed the impairment model for certain financial instruments. We recorded a $12 million non-cash cumulative effect adjustment to retained earnings on our opening Consolidated Balance Sheets as of January 1, 2020 as a result of the adoption of this new standard.
Investments
Purchases and sales of investment securities are recognized on settlement date.
Financial Investments
Financial investments are comprised of trading securities bought principally to meet regulatory capital requirements mainly for our clearing operations at Nasdaq Clearing. These investments are classified as trading securities as they are generally sold in the near term, with changes in fair value included in other income in the Consolidated Statements of Income.
Fair value is generally obtained from third-party pricing sources. When available, quoted market prices are used to determine fair value. If quoted market prices are not available, fair values are estimated using pricing models with observable market inputs. The inputs to the valuation models vary by the type of security being priced but are typically benchmark yields, reported trades, broker-dealer quotes, and prices of similar assets. Pricing models generally do not entail material subjectivity because the methodologies employed use inputs observed from active markets. See “Fair Value Measurements,” below for further discussion of fair value measures.
Equity Securities
Investments in equity securities with readily determinable fair values (other than those accounted for under the equity method or those that result in consolidation of the investee) are measured at fair value and any changes in fair value are recognized in other income in the Consolidated Statements of Income.
Equity investments without readily determinable fair values are accounted for under the measurement alternative, under which investments are measured at cost, less any impairment, plus or minus changes resulting from observable price changes in orderly transactions for the identical or a similar investment of the same issuer on a prospective basis. We assess relevant transactions that occur on or before the balance sheet date to identify observable price changes, and we regularly monitor these investments to evaluate whether there is an indication that the investment is impaired, based on the share price from the investee's latest financing round, the performance of the investee in relation to its own operating targets, the investee's liquidity and cash position, and general market conditions. If a qualitative assessment indicates that the security is impaired, Nasdaq will estimate the fair value of the security and, if the fair value is less than the carrying amount of the security, will recognize an impairment loss in net income equal to the difference in the period the impairment occurs. See Note 6, “Investments,” for further discussion of our equity securities.
For the years ended December 31, 2022, 2021 and 2020, no material adjustments were made to the carrying value of our equity securities.
Our investments in equity securities are included in other non-current assets in the Consolidated Balance Sheets, as we intend to hold these investments for more than one year.
Equity Method Investments
In general, the equity method of accounting is used when we own 20% to 50% of the outstanding voting stock of a company or when we are able to exercise significant influence over the operating and financial policies of a company. We have certain investments in which we have determined that we have significant influence and as such account for the investments under the equity method of accounting. We record our estimated pro-rata share of earnings or losses each reporting period and record any dividends as a reduction in the investment balance. We evaluate our equity method investments for other-than-temporary declines in value by considering a variety of factors such as the earnings capacity of the investment and the fair value of the investment compared to its carrying amount. In addition, for investments where the market value is readily determinable, we consider the underlying stock price. If the estimated fair value of the investment is less than the carrying amount and management considers the decline in value to be other than temporary, the excess of the carrying amount over the estimated fair value is recognized in net income in the period the impairment occurs. See Note 6, “Investments,” for further discussion of our equity method investments.
F-12
No impairments were recorded to reduce the carrying value of our equity method investments in 2022, 2021 or 2020.
Derivative Financial Instruments and Hedging Activities
Non-Designated Derivatives
We use foreign exchange forward contracts to manage foreign currency exposure of intercompany loans.loans, accounts receivable, accounts payable and other balance sheet items. These contracts are not designated as hedges for financial reporting purposes. The change in fair value of these contracts is recognized in general, administrative and other expense in the Consolidated Statements of Income and offsets the foreign currency impact recognized on the intercompany loans.exposure.
As of December 31, 20172022 and 2016,2021, the fair value amounts of our derivative instruments were immaterial.
Net Investment Hedges
Net assets of our foreign subsidiaries are exposed to volatility in foreign currency exchange rates. We may utilize net investment hedges to offset the translation adjustment arising from re-measuring our investment in foreign subsidiaries.
Our 20212029, 2030 and 20232033 Notes have been designated as a hedge of our net investment in certain foreign subsidiaries to mitigate
the foreign exchange risk associated with certain investments in these subsidiaries. Any increase or decrease related to the remeasurement of the 20212029, 2030, and 20232033 Notes into U.S. dollars is recorded withinin accumulated other comprehensive loss within stockholders’ equity in the Consolidated Balance Sheets. See “3.875% Senior Unsecured“2029 Notes,” “2030 Notes,” and “1.75% Senior Unsecured Notes,”“2033 Notes” of Note 10,9, “Debt Obligations,” for further discussion.
Property and Equipment, net
Property and equipment, including leasehold improvements, are carried at cost less asset impairment charges and accumulated depreciation and amortization. Depreciation and amortization are recognized using the straight-line method over the estimated useful lives of the related assets, which range from 10 to 40 years for buildings and improvements, 23 to 5 years for data processing equipment, and 5 to 10 years for furniture and equipment.
Leasehold improvements are amortized using the straight-line method over the shorter of their estimated useful lives or the remaining term of the related lease.
We develop systems solutions for both internal and external use. Certain costs incurred in connection with developing or obtaining internal use software are capitalized. In addition, certain costs of computer software to be sold, leased, or otherwise marketed as a separate product or as part of a product or process are capitalized beginning when a product’s technological feasibility has been established and ending when a product is available for general release. Technological feasibility is established upon completion of a detailed program design or, in its absence, completion. Prior to reaching technological feasibility, all costs are charged to expense. Unamortized capitalized costs are included in data processing equipment and software, within property and equipment, net in the Consolidated Balance Sheets. Capitalized software costs are amortized on a straight-line basis over the estimated useful lives of the software, generally 35 to 510 years. Amortization of these costs is included in depreciation and amortization expense in the Consolidated Statements of Income.
Property and equipment are subject to impairment testing when events or conditions indicate that the remaining termcarrying amount of an asset may not be recoverable. The carrying amount of an asset is not recoverable if it exceeds the sum of the undiscounted cash flows expected to result from the use and eventual disposition of the asset, or for internal use software, the fair value of the asset. Any required impairment loss is measured as the amount by which the carrying amount of the asset exceeds its fair value and is recorded as a reduction in the carrying amount of the related lease.asset and a charge to operating results.
See Note 8,7, “Property and Equipment, net,” for further discussion.
Leases
At inception, we determine whether a contract is or contains a lease. We have operating leases which are primarily real estate leases for our U.S. and European headquarters and for general office space. As of December 31, 2022, these leases have varying lease terms with remaining maturities ranging from 2 to 14 years. Operating lease balances are included in operating lease assets, other current liabilities, and operating lease liabilities in our Consolidated Balance Sheets. We do not have any leases classified as finance leases.
F-13
Operating lease assets represent our right to use an underlying asset for the lease term and lease liabilities represent our obligation to make lease payments arising from the lease. Operating lease assets and liabilities are recognized at commencement date based on the present value of lease payments over the lease term. Since our leases do not provide an implicit rate, we use our incremental borrowing rate based on the estimated rate of interest for collateralized borrowing over a similar term of the lease payments at commencement date in determining the present value of lease payments. The operating lease asset also includes any lease payments made and excludes lease incentives. Our lease terms include options to extend or terminate the lease when we are reasonably certain that we will exercise that option. Lease expense for lease payments is recognized on a straight-line basis over the lease term. Certain of our lease agreements include rental payments adjusted periodically for inflation based on an index or rate. These payments are included in the initial measurement of the operating lease liability and operating lease asset. However, rental payments that are based on a change in an index or a rate are considered variable lease payments and are expensed as incurred.
We have lease agreements with lease and non-lease components, which are accounted for as a single performance obligation to the extent that the timing and pattern of transfer are similar for the lease and non-lease components and the lease component qualifies as an operating lease. We do not recognize lease liabilities and operating lease assets for leases with a term of 12 months or less. We recognize these lease payments on a straight-line basis over the lease term. See Note 16, “Leases,” for further discussion.
Goodwill and Indefinite-Lived Intangible Assets
Goodwill represents the excess of purchase price over the value assigned to the net assets, including identifiable intangible assets, of a business acquired. Goodwill is assessedallocated to our reporting units based on the assignment of the fair values of each reporting unit of the acquired company. We recognize specifically identifiable intangibles, such as customer relationships, technology, exchange and clearing registrations, trade names and licenses when a specific right or contract is acquired. Goodwill and intangible assets deemed to have indefinite useful lives, primarily exchange and clearing registrations, are not amortized but instead are tested for impairment at least annually in the fourth quarteras of our fiscal year using an October 1 measurement date, orand more frequently if conditions existwhenever events or changes in circumstances indicate that indicate thatthe fair value of the asset may be impaired,less than its carrying amount, such as changes in the business climate, poor indicators of operating performance or the sale or disposition of a significant portion of a reporting unit. When testing goodwill and indefinite-lived intangible assets for impairment, we have the option of first performing a qualitative assessment to determine whether it is more likely than not that the fair value of a reporting unit or indefinite-lived intangible asset is less than itstheir respective carrying amountamounts as the basis to determine if it is necessary to perform a quantitative goodwill impairment test. In performing a qualitative assessment, we consider the extent to which
indicates that it is more likely than not that the carrying amount of a reporting unit or the carrying amount of an indefinite-lived intangible asset exceeds itstheir respective estimated fair value,values, a quantitative test is required.
There was no impairment of goodwill for the years ended December 31, 2017, 2016 and 2015 and there were no indefinite-lived intangible asset impairment charges in 2017. As discussed in “Intangible Asset Impairment Charges,” of Note 6, “Goodwill and Acquired Intangible Assets,” we recorded pre-tax, non-cash indefinite-lived intangible asset impairment charges of $578 million in 2016 and $119 million in 2015. There was no other impairment ofor indefinite-lived intangible assets for the years ended December 31, 20162022, 2021 and
We review our other long-lived assets, such as finite-lived intangible assets and property and equipment, for potential impairment when there is evidence that events or changes in circumstances indicate that the carrying amount of an asset may not be recoverable. The carrying amount of an asset is not recoverable if it exceeds the sum of the undiscounted cash flows expected to result from the use and eventual disposition of the asset. Fair value of finite-lived intangible assets and property and equipment is based on various valuation techniques. Any required impairment loss is measured as the amount by which the carrying amount of the asset exceeds its fair value and is recorded as a reduction in the carrying amount of the related asset and a charge to operating results. See Note 8, “Property
There were no material finite-lived impairment charges in 2022 and Equipment, net,”2020. We recorded pre-tax, non-cash finite-lived intangible assets impairment charges of $14 million in 2021 related to a finite-lived intangible asset for further discussioncustomer relationships associated with the wind down of a previous acquisition. In addition, we also recorded pre-tax, non-cash property and equipment asset impairment charges of $8 million in 2022, $4 million in 2021 and $14 million in 2020.
F-14
Revenue Recognition and Transaction-Based Expenses
Revenue From Contracts With Customers
Our revenue recognition policies under “Revenue from Contracts with Customers (Topic 606),” are described in the following paragraphs.
Contract Balances
Substantially all of our revenues are considered to be revenues from contracts with customers. The related accounts receivable balances are recorded in 2017, 2016our Consolidated Balance Sheets as receivables which are net of an allowance for credit losses of $15 million as of December 31, 2022 and 2015.$17 million as of December 31, 2021. The changes in the balance between periods were immaterial. We do not have obligations for warranties, returns or refunds to customers.
Sales commissions earned by our sales force are considered incremental and recoverable costs of obtaining a companycontract with a customer. These costs are deferred and when we are able to exercise significant influenceamortized on a straight-line basis over the operating and financial policiesperiod of a company. We have certain investments in whichbenefit that we have determined that we have significant influenceto be the contract term or estimated service period. Sales commissions for renewal contracts are deferred and as such account foramortized on a straight-line basis over the investments under the equity method of accounting. We record our pro-rata share of earnings or losses each periodrelated contractual renewal period. Amortization expense is included in compensation and record any dividends as a reductionbenefits expense in the investment balance.Consolidated Statements of Income. The balance of deferred costs and related amortization expense are not material to our consolidated financial statements. Sales commissions are expensed when incurred if contract durations are one year or less. Sales taxes are excluded from transaction prices.
Certain judgments and estimates were used in the identification and timing of satisfaction of performance obligations and the related allocation of transaction price and are discussed below. We evaluate our equity method investments for other-than-temporary declines in value by consideringbelieve that these represent a variety of factors such as the earnings capacityfaithful depiction of the investmenttransfer of services to our customers.
Revenue Recognition
Our primary revenue contract classifications are described below. Although we may discuss additional revenue details in our “Management's Discussion and Analysis of Financial Condition and Results of Operations,” the fair valuecategories below best represent those that depict similar economic characteristics of the investment compared to its carrying amount. In addition, for investments where the market value is readily determinable, we consider the underlying stock price. If the estimated fair valuenature, amount, timing and uncertainty of the investment is less than the carrying amountour revenues and management considers the decline in value to be other than temporary, the excess of the carrying amount over the estimated fair value is recognized in the financial statements as an impairment. See “Equity Method Investments,” of Note 7, “Investments,” for further discussion of an other-than-temporary charge recorded in 2016 on an equity method investment.
Market Services RevenuesPlatforms
Transaction-Based Trading and Clearing
Transaction-based trading and clearing includes equity derivative trading and clearing, revenues, cash equity trading revenues,and FICC revenues, and trade management services revenues.
In the U.S. equity derivative, transaction fees are based on trading volumes for trades executed on our U.S. exchanges and in Europe, transaction fees are based on the volume and value of traded and cleared contracts. In Canada, transaction fees are based on trading volumes for trades executed on our Canadian exchange.
Nasdaq satisfies its performance obligation for trading services upon the execution of a customer trade and clearing services when a contract is cleared, as trading and clearing we record cash equity trading revenues from transactions on a gross basis as revenuesare substantially complete when they are executed and record related expenses as transaction-based expenses, as we have certain risk associatedno further obligation to the customer at that time. Transaction-based trading and clearing fees can be variable and are based on trade volume tiered discounts. Transaction revenues, as well as any tiered volume discounts, are calculated and billed monthly in accordance with trade execution. For further discussion see “Equity Derivative Tradingour published fee schedules. In the U.S., we also pay liquidity payments to customers based on our published fee schedules. We use these payments to improve the liquidity on our markets and Clearing and Cash Equity Trading Transaction-Based Expenses” below.
For U.S. equity derivative trading, we credit a portion of the per share execution charge to the market participant that provides the liquidity. For U.S. and Canadian cash equity trading, including for The Nasdaq Stock Market, Nasdaq PSX and Nasdaq PSX,CXC, we credit a portion of the per share execution charge to the market participant that provides the liquidity, and for Nasdaq BX and Nasdaq CX2, we credit a portion of the per share execution charge to the market participant that takes the liquidity. We
record these credits as transaction rebates that are included in transaction-based expenseexpenses in the Consolidated Statements of Income. These transaction rebates are paid on a monthly basis and the amounts due are included in accounts payable and accrued expenses in the Consolidated Balance Sheets.
F-15
In the U.S., we pay Section 31 fees to the SEC for supervision and regulation of securities markets. We pass these costs along to our customers through our equity derivative trading and clearing fees and our cash equity trading fees. We collect the fees as a pass-through charge from organizations executing eligible trades on our options exchanges and our cash equity platforms and we recognize these amounts in transaction-based expenses when incurred. Section 31 fees received are included in cash and cash equivalents in the Consolidated Balance Sheets at the time of receipt and, as required by law, the amount due to the SEC is remitted semiannually and recorded as Section 31 fees payable to the SEC in the Consolidated Balance Sheets until paid. Since the amount recorded as revenues is equal to the amount recorded as transaction-based expenses, there is no impact on our revenues less transaction-based expenses. As we hold the cash received until payment to the SEC, we earn interest income on the related cash balances.
Under our Limitation of Liability Rule and procedures, we may, subject to certain caps, provide compensation for losses directly resulting from theour systems’ actual failure to correctly process an order, quote, message or other data into our platform. We do not record a liability for any potential claims that may be submitted under the Limitation of Liability Rule unless they meet the provisions required in accordance with U.S. GAAP. As such, losses arising as a result of the rule are accrued and charged to expense only if the loss is probable and estimable.
•We are the administrator for the UTP plan, in addition to being a participant in the plan. In our unique role as administrator, we facilitate the collection and clearingdissemination of energy, emission allowance, freight, seafood and other commodity products. Trading and clearing revenues are basedon behalf of the plan participants. As a participant, we share in the net distribution of revenues according to the plan on the volume and valuesame terms as all other plan participants.
•The operating committee of traded and cleared contracts, and recognized when executed or when contracts are cleared. In addition, Nasdaq Commodities members are billed an annual feethe plan, which is recognized ratably overcomprised of representatives from each of the following 12-month period.participants, including us solely in our capacity as a plan participant, is responsible for setting the level of fees to be paid by distributors and subscribers and taking action in accordance with the provisions of the plan, subject to SEC approval.
Trade management process in our Nasdaq Clearing operations, we recognize interest income on cash contributions that we manage when earned.services
We generate revenues by providingprovide market participants with severala wide variety of alternatives for connecting to and accessing our markets for a fee. The type of connectivity is determined by the level of functionality a customer needs. As a result, access services revenues vary depending on the type of connection provided to customers. We provide co-location services toalso offer market participants colocation services, whereby we charge firms may leasefor cabinet space and power to house their own equipment and servers within our data centers. These participants are charged monthly fees for cabinet space, connectivity and support. Additionally, we offersupport in accordance with our published fee schedules. These fees are recognized on a number of wireless connectivity routes between select data centers using millimeter wave and microwave technology. monthly basis when the performance obligation is met. We also earn revenues from annual and monthly exchange membership and registration fees. Revenues for providing access to our markets, co-location services and monthly exchange membership and registration fees are recognized on a monthly basis as the service is provided. Revenues from annual fees for exchange membership and registration fees are recognized ratably over the following 12-month period.
Market Technology
Market technology revenues primarily consist of SaaS revenues, software, license and support revenues, and change request revenues.
We enter into long-term contracts with customers to develop customized technology solutions, license the right to use software, and provide support and other services to our customers. We also enter into agreements to modify the system solutions sold by Nasdaq after delivery has occurred. In addition, we enter into subscription agreements which allow customers to connect to our servers to access our software.
Our long-term contracts with customers to develop customized technology solutions, license the right to use software and provide support and other services to our customers have multiple performance obligations. The performance obligations are generally: (i) software license and installation service and (ii) software support. We have determined that the software license and installation service are not distinct as the license and the customized installation service are inputs to produce the combined output, a functional and integrated software system.
F-16
For contracts with multiple performance obligations, we allocate the contract transaction price to each performance obligation using our best estimate of the standalone selling price of each distinct good or service in the contract. In instances where standalone selling price is not directly observable, such as when we do not sell the product or service separately, we determine the standalone selling price predominantly through an expected cost plus a margin approach. For the years ended December 31, 2022, 2021 and 2020 we recognized revenues of $75 million, $77 million and $90 million, respectively, related to the contracts described above.
Contract modifications are routine in the performance of our contracts. Contracts are often modified to account for changes in contract specifications or requirements. In most instances, contract modifications are for goods and services that are not distinct, and, therefore, are accounted for as part of the existing contract.
For our long-term contracts, payments are generally made throughout the contract life and can be dependent on either reaching certain milestones or paid upfront in advance of the service period depending on the stage of the contract. For subscription agreements, contract payment terms can be quarterly, annually or monthly, in advance. For all other contracts, payment terms vary.
We generally recognize revenue over time as our customers simultaneously receive and consume the benefits provided by our performance because our customer controls the asset for which we are creating, our performance does not create an asset with alternative use, and we have a right to payment for performance completed to date. For these services, we recognize revenue over time using costs incurred to date relative to total estimated costs at completion to measure progress toward satisfying our performance obligation. Incurred costs represent work performed, which corresponds with, and thereby depicts, the transfer of control to the customer. Contract costs generally include labor and direct overhead. For software support and update services, and for subscription agreements which allow customers to connect to our servers to access our software, we generally recognize revenue ratably over the service period beginning on the date our service is made available to the customer since the customer receives and consumes the benefit consistently over the period as Nasdaq provides the services.
Accounting for our long-term contracts requires judgment relative to assessing risks and their impact on the estimate of revenues and costs. Our estimates are impacted by factors such as the potential for schedule and technical issues, productivity, and the complexity of work performed. When adjustments in estimated total contract costs are required, any changes in the estimated revenues from prior estimates are recognized in the current period for the effect of such change. If estimates of total costs to be incurred on a contract exceed estimates of total revenues, a provision for the entire estimated loss on the contract is recorded in the period in which the loss is determined.
Capital Access Platforms
Data and Listings
Data revenues are earned from U.S. and European proprietary data products. We earn revenues primarily based on the number of data subscribers and distributors of our data. Data revenues are subscription-based and are recognized on a continuous basis as services are rendered.
Listing services revenues primarily include annual renewal fees, initial listing fees and annual renewal fees. Under Topic 606, the initial listing fee is allocated to multiple performance obligations including initial and subsequent listing services and corporate solutions products (when a company qualifies to receive certain complimentary IPO products under the applicable Nasdaq rule), as well as a customer's material right to renew the option to list on our exchanges. In performing this allocation, the standalone selling price of additional shares fees.
In the U.S., annual renewal fees are charged to listed companies based on thetheir number of outstanding shares of companies listed in the U.S. at the end of the prior year and are recognized ratably over the following 12-month period.twelve-month period since the customer receives and consumes the benefit as Nasdaq provides the service. Annual fees are charged to newly listed companies on a pro-rata basis, based on outstanding shares at the time of listing and recognized over the remainder of the year. European annual renewal fees, which are received from companies listed on our Nasdaq Nordic and Nasdaq Baltic exchanges and Nasdaq First North, are directly related to the listed companies’ market capitalization on a trailing 12-month basis.
Index Licensing and Services Revenues
We develop and license Nasdaq brandedNasdaq-branded indexes associated derivatives and financial products as part of our Global Index Family.products. We also provide index data products and custom calculation services for third-party clients. Revenues primarily include license fees from these branded indexes associated derivatives and financial products in the U.S. and abroad. We primarily have two types of license agreements: transaction-based licenses and asset-based licenses. Transaction-based licenses are generally renewable long-term agreements. Customers are charged based on transaction volume or a minimum contract amount, or both. If a customer is charged based on transaction volume, we recognize revenue when the transaction occurs. If a customer is charged based on a minimum contract amount, we recognize revenue on a pro-rata basis over the licensing term.term since the customer receives and consumes the benefit as Nasdaq provides the service. Asset-based licenses are also generally long-termrenewable agreements. Customers are charged based on a percentage of assets under managementAUM for licensed products, per the agreement, on a monthly or quarterly basis. These revenues are recognized over the term of the license agreement.agreement since the customer receives and consumes the benefit as Nasdaq provides the service. Revenue from index data subscriptions are recognized on a monthly basis.
Analytics revenues are earned from investment content and analytics products. We earn revenues primarily based on the number of content and analytics subscribers and distributors.
Subscription agreements are generally one to three years in term, payable in advance, and provide for automatic renewal. Subscription-based revenues are recognized over time on a ratable basis over the contract period beginning on the date that our service is made available to the customer since the customer receives and consumes the benefit as Nasdaq provides the service.
Our corporate solutions business includes our Investor Relations Intelligence, ESG Services and Governance Solutions businesses, which serve both public and private companies and organizations.
Corporate solutions revenues primarily include subscription and transaction-based income from our investor relations intelligence and governance solutions products and services. Subscription-based revenues earned are recognized over time on a ratable basis over the contract period beginning on the date that our service is made available to the customer since the customer receives and consumes the benefit as Nasdaq provides the service. Generally, fees are billed in advance and the contract provides for automatic renewal. As part of subscription agreements, customers can also be charged usage fees based upon actual usage of the services provided. Revenues from usage fees are recognized at a point in time when the service is provided.
Anti-Financial Crime
Anti-Financial Crime revenues primarily consist of software, license and support revenues, change request and advisory revenues, and software as a serviceSaaS revenues.
We enter into agreements to modify the system solutions sold by Nasdaq after delivery has occurred. These revenues are recognized when earned.
Other revenues include revenues related to our Nordic broker services business for which we completed the wind-down in June 2022, as well as revenues associated with our U.S. Fixed Income business, which was sold in June 2021. Prior to the closing of the transaction, these revenues were included in our Market Technology business was impacted due to the adoption of ASU 2014-09, “Revenue from Contracts with Customers.”Platforms and Capital Access Platforms segments. See “Recent Accounting Pronouncements,“2021 Divestiture,” of Note 2, “Summary of Significant Accounting Policies,4, “Acquisitions and Divestiture,” to the consolidated financial statements for further discussion.discussion of this divestiture. Additionally, for the years ended December 31, 2021 and 2020, other revenues include revenues associated with the NPM business which we contributed in July 2021 to a standalone, independent company, of which we own the largest minority interest, together with a consortium of third-party financial institutions. Prior to July 2021, these revenues were included in our Capital Access Platforms segment. For the twelve months ended December 31, 2022, other revenues also include a transitional services agreement associated with a divested business.
Earnings Per Share
We present both basic and diluted earnings per share. Basic earnings per share is computed by dividing net income attributable to Nasdaq by the weighted-average number of common shares outstanding for the period. Diluted earnings per share is computed by dividing net income attributable to Nasdaq by the weighted-average number of common shares and common share equivalents outstanding during the period and reflects the assumed conversion of all dilutive securities, which primarily consist of restricted stock, PSUs, and employee stock options, restricted stock, and PSUs.options. Common share equivalents are excluded from the computation in periods for which they have an anti-dilutive effect. Stock options for which the exercise price exceeds the average market price over the period are anti-dilutive and, accordingly, are excluded from the calculation. Shares which are considered contingently issuable are included in the computation of dilutive earnings per share on a weighted average basis when management determines the applicable performance criteria would have been met if the performance period ended as of the date of the relevant computation. See Note 15,13, “Earnings Per Share,” for further discussion.
F-18
Pension and Post-Retirement Benefits
Pension and other post-retirement benefit plan information for financial reporting purposes is developed using actuarial valuations. We assess our pension and other post-retirement benefit plan assumptions on a regular basis. In evaluating these assumptions, we consider many factors, including evaluation of the discount rate, expected rate of return on plan assets, mortality rate, healthcare cost trend rate, retirement age assumption, our historical assumptions compared with actual results and analysis of current market conditions and asset allocations. See Note 12,10, “Retirement Plans,” for further discussion.
Discount rates used for pension and other post-retirement benefit plan calculations are evaluated annually and modified to reflect the prevailing market rates at the measurement date of a high-quality fixed-income debt instrument portfolio that would provide the future cash flows needed to pay the benefits included in the benefit obligations as they come due. Actuarial assumptions are based upon management’s best estimates and judgment.
The expected rate of return on plan assets for our U.S. pension plans represents our long-term assessment of return expectations which may change based on significant shifts in economic and financial market conditions. The long-term rate
of return on plan assets is derived from return assumptions based on targeted allocations for various asset classes. While we consider the pension plans’ recent performance and other economic growth and inflation factors, which are supported by long-term historical data, the return expectations for the targeted asset categories represent a long-term prospective return.
Share-Based Compensation
Nasdaq uses the fair value method of accounting for share-based awards. Share-based awards, or equity awards, include stock options, restricted stock, PSUs, and PSUs. The fair value of stock options are estimated using the Black-Scholes option-pricing model.options. The fair value of restricted stock awards and PSUs, other than PSUsgranted with market conditions, is determined based on the grant date closing stock price less the present value of future cash dividends. We estimate the fair value of PSUs granted with market conditions using a Monte Carlo simulation model at the date of grant. The fair value of stock options are estimated using the Black-Scholes option-pricing model.
We generally recognize compensation expense for equity awards on a straight-line basis over the requisite service period of the award, taking into account an estimated forfeiture rate. Granted but unvested shares are generally forfeited upon termination of employment.
Excess tax benefits or expense related to employee share-based payments, if any, are recognized as income tax benefit or expense in the Consolidated Statements of Income when the awards vest or are settled.
Nasdaq also has an ESPP that allows eligible employees to purchase a limited number of shares of our common stock at six-month intervals, called offering periods, at 85.0% of the lower of the fair market value on the first or the last day of each offering period. The 15.0% discount given to our employees is included in compensation and benefits expense in the Consolidated Statements of Income.
See Note 13,11, “Share-Based Compensation,” for further discussion of our share-based compensation plans.
We expense rent from non-cancellable operating leases, net of sublease income, on a straight line basis, based on future minimum lease payments. The netincur incremental direct merger and strategic initiative costs are included in occupancy expense in the Consolidated Statements of Income. See Note 18, “Leases,” for further discussion.relating to various completed and potential acquisitions, divestitures, and other strategic opportunities. These costs generally include integration costs, as well as legal, due diligence and other third-party transaction costs.
Fair Value Measurements
Fair value is defined as the price that would be received from selling an asset or paid to transfer a liability, or the exit price, in an orderly transaction between market participants at the measurement date. When determining the fair value measurements for assets and liabilities required or permitted to be either recorded or disclosed at fair value, we consider the principal or most advantageous market in which we would transact, and we also consider assumptions that market participants would use when pricing the asset or liability. Fair value measurement establishes a hierarchy of valuation techniques based on whether the inputs to those valuation techniques are observable or unobservable. Observable inputs
reflect market data obtained from independent sources, while unobservable inputs reflect Nasdaq’s market assumptions. These two types of inputs create the following fair value hierarchy:
•Level 1—1 - Quoted prices for identical instruments in active markets.
•Level 2—2 - Quoted prices for similar instruments in active markets; quoted prices for identical or similar instruments in markets that are not active; and model-derived valuations whose inputs are observable or whose significant value drivers are observable.
•Level 3—3 - Instruments whose significant value drivers are unobservable.
This hierarchy requires the use of observable market data when available.
See Note 16,14, “Fair Value of Financial Instruments,” for further discussion.
F-19
Tax Matters
We use the asset and liability method to determine income taxes on all transactions recorded in the consolidated financial statements. Deferred tax assets (net of valuation allowances) and deferred tax liabilities are presented net by jurisdiction as either a non-current asset or liability in our Consolidated Balance Sheets, as appropriate. Deferred tax assets and liabilities are determined based on differences between the financial statement carrying amounts and the tax basis of existing assets and liabilities (i.e., temporary differences) and are measured at the enacted rates that will be in effect when these differences are realized. If necessary, a valuation allowance is established to reduce deferred tax assets to the amount that is more likely than not to be realized.
In order to recognize and measure our unrecognized tax benefits, management determines whether a tax position is more likely than not to be sustained upon examination, including resolution of any related appeals or litigation processes, based on the technical merits of the position. Once it is determined that a position meets the recognition thresholds, the position is measured to determine the amount of benefit to be recognized in the consolidated financial statements. Interest and/or penalties related to income tax matters are recognized in income tax expense.
On August 26, 2022, we effected a 3-for-1 stock split of the tax law changesCompany's common stock in the periodform of enactment, sucha stock dividend to shareholders of record as remeasuringof August 12, 2022. The par value per share of our U.S. deferred tax assets and liabilities, reassessingcommon stock remains $0.01 per share. All references made with respect to a number of shares or per share amounts throughout this Annual Report on Form 10-K have been retroactively adjusted to reflect the net realizabilitystock split.
Subsequent Events
We have evaluated subsequent events through the issuance date of deferred tax assets and liabilities, and determining the applicability of the one-time mandatory transition taxthis Annual Report on accumulated foreign earnings. SAB 118 has provided guidance which allows us to record provisional amounts during a measurement period not to extend beyond one year of the enactment date. As of December 31, 2017, we have recorded a provisional estimate of the effects of the new legislation. We will continue to analyze the Tax Cuts and Jobs Act and related accounting guidance and interpretations in order to finalize any impacts within the measurement period.
3. REVENUE FROM CONTRACTS WITH CUSTOMERS
Revenue | |||
The following tables presentsummarize the expected effectdisaggregation of the adoption of Topic 606 on our Consolidated Statements of Incomerevenue by major product and service and by segment for the years ended December 31, 20172022, 2021 and 2016:2020:
| Year Ended December 31, | |||||||||||||||||
| 2022 | 2021 | 2020 | |||||||||||||||
| (in millions) | |||||||||||||||||
| Market Platforms | |||||||||||||||||
| Trading Services, net | $ | 1,019 | $ | 1,037 | $ | 932 | |||||||||||
| Marketplace Technology | 562 | 545 | 525 | ||||||||||||||
| Capital Access Platforms | |||||||||||||||||
| Data & Listing Services | 729 | 680 | 574 | ||||||||||||||
| Index | 486 | 459 | 324 | ||||||||||||||
| Workflow & Insights | 469 | 429 | 389 | ||||||||||||||
| Anti-Financial Crime | 306 | 231 | 116 | ||||||||||||||
| Other revenues | 11 | 39 | 43 | ||||||||||||||
| Revenues less transaction-based expenses | $ | 3,582 | $ | 3,420 | $ | 2,903 | |||||||||||
| Year Ended December 31, 2017 | Year Ended December 31, 2016 | ||||||||||||||||||||||
| As Reported | Adjustment to Reflect Adoption of Topic 606 | As Adjusted | As Reported | Adjustment to Reflect Adoption of Topic 606 | As Adjusted | ||||||||||||||||||
| (in millions) | (in millions) | ||||||||||||||||||||||
| Revenues less transaction-based expenses: | |||||||||||||||||||||||
| Market Services | $ | 881 | $ | — | $ | 881 | $ | 827 | $ | — | $ | 827 | |||||||||||
| Corporate Services | 656 | (3 | ) | 653 | 635 | (3 | ) | 632 | |||||||||||||||
| Information Services | 588 | — | 588 | 540 | — | 540 | |||||||||||||||||
| Market Technology | 303 | (14 | ) | 289 | 275 | 2 | 277 | ||||||||||||||||
| Total revenues less transaction-based expenses | 2,428 | (17 | ) | 2,411 | 2,277 | (1 | ) | 2,276 | |||||||||||||||
Total operating expenses (1) | 1,429 | (9 | ) | 1,420 | 1,438 | 2 | 1,440 | ||||||||||||||||
| Income before income taxes | 880 | (8 | ) | 872 | 136 | (3 | ) | 133 | |||||||||||||||
| Income tax provision (benefit) | 146 | (3 | ) | 143 | 28 | (1 | ) | 27 | |||||||||||||||
| Net income attributable to Nasdaq | $ | 734 | $ | (5 | ) | $ | 729 | $ | 108 | $ | (2 | ) | $ | 106 | |||||||||
| Diluted earnings per share | $ | 4.33 | $ | (0.03 | ) | $ | 4.30 | $ | 0.64 | $ | (0.01 | ) | $ | 0.63 | |||||||||
Contract Balances
Substantially all of our revenues are considered to our Market Technology business.
For the majority of our contracts with customers, except for our market technology and 2016:
listing services contracts, our performance obligations range from three months to three years and there is no significant variable consideration.
| December 31, 2017 | December 31, 2016 | ||||||||||||||||||||||
| As Reported | Adjustment to Reflect Adoption of Topic 606 | As Adjusted | As Reported | Adjustment to Reflect Adoption of Topic 606 | As Adjusted | ||||||||||||||||||
| (in millions) | (in millions) | ||||||||||||||||||||||
| Assets: | |||||||||||||||||||||||
| Other current assets | $ | 187 | $ | (19 | ) | $ | 168 | $ | 167 | $ | (15 | ) | $ | 152 | |||||||||
| Other non-current assets | 412 | (38 | ) | 374 | 390 | (46 | ) | 344 | |||||||||||||||
| Deferred tax assets | 391 | 2 | 393 | 717 | (1 | ) | 716 | ||||||||||||||||
| Total assets | $ | 15,786 | $ | (55 | ) | $ | 15,731 | $ | 14,150 | $ | (62 | ) | $ | 14,088 | |||||||||
| Liabilities: | |||||||||||||||||||||||
| Deferred revenue | $ | 189 | $ | (28 | ) | $ | 161 | $ | 162 | $ | (24 | ) | $ | 138 | |||||||||
| Non-current deferred revenue | 146 | (20 | ) | 126 | 171 | (36 | ) | 135 | |||||||||||||||
| Total liabilities | $ | 9,899 | $ | (48 | ) | $ | 9,851 | $ | 8,720 | $ | (60 | ) | $ | 8,660 | |||||||||
| Nasdaq stockholders' equity: | |||||||||||||||||||||||
| Retained earnings | $ | 3,970 | $ | (7 | ) | $ | 3,963 | $ | 3,479 | $ | (2 | ) | $ | 3,477 | |||||||||
| Total Nasdaq stockholders' equity | 5,887 | (7 | ) | 5,880 | 5,430 | (2 | ) | 5,428 | |||||||||||||||
| Total liabilities and equity | $ | 15,786 | $ | (55 | ) | $ | 15,731 | $ | 14,150 | $ | (62 | ) | $ | 14,088 | |||||||||
Deferred revenue is the only significant contract asset or liability as of December 31, 2022. Deferred revenue represents consideration received that is yet to be recognized as revenue for unsatisfied performance obligations. Deferred revenue primarily represents our contract liabilities related to our fees for Annual and Initial Listings, Workflow & Insights, Market Technology and Anti-Financial Crime contracts. See Note 8, “Deferred Revenue,” for our discussion on deferred revenue balances, activity, and expected timing of recognition.
The following table presents a summarysummarizes the amount of restructuring plan charges in the Consolidated Statements of Income:
| Year Ended December 31, | |||||||
| 2016 | 2015 | ||||||
| (in millions) | |||||||
| Rebranding of trade name | $ | — | $ | 119 | |||
| Severance | 22 | 25 | |||||
| Facilities-related | 1 | — | |||||
| Asset impairments | 8 | 18 | |||||
| Other | 10 | 10 | |||||
| Total restructuring charges | $ | 41 | $ | 172 | |||
| Market Technology | Anti-Financial Crime | Workflow & Insights | Total | ||||||||||||||||||||
| (in millions) | |||||||||||||||||||||||
| 2023 | $ | 193 | $ | 382 | $ | 137 | $ | 712 | |||||||||||||||
| 2024 | 155 | 214 | 79 | 448 | |||||||||||||||||||
| 2025 | 127 | 90 | 30 | 247 | |||||||||||||||||||
| 2026 | 92 | 27 | 11 | 130 | |||||||||||||||||||
| 2027 | 54 | 10 | 8 | 72 | |||||||||||||||||||
| 2028+ | 72 | 6 | — | 78 | |||||||||||||||||||
| Total | $ | 693 | $ | 729 | $ | 265 | $ | 1,687 | |||||||||||||||
4. AcquisitionsACQUISITIONS AND DIVESTITURE
We completed the following acquisitions and divestiture in 2017, 20162022 and 2015.2021. Financial results of each transaction are included in our Consolidated Statements of Incomeconsolidated financial statements from the date of each acquisition.
In June 2022, we acquired Metrio, a provider of ESG data collection, analytics and reporting services based in Montreal, Canada. We plan to integrate Metrio’s SaaS platform into our suite of ESG solutions. Metrio is part of our Workflow & Insight business in our Capital Access Platforms segment.
2021 Divestiture
| Purchase Consideration | Total Net Liabilities Acquired | Total Net Deferred Tax Liability | Acquired Intangible Assets | Goodwill | |||||||||||||||
| (in millions) | |||||||||||||||||||
| eVestment | $ | 744 | $ | (10 | ) | $ | (104 | ) | $ | 405 | $ | 453 | |||||||
In connection with this sale, we issued approximately 6.2 million shares of Nasdaq common stock. Nasdaq used the proceeds from the sale, available tax benefits and working and clearing capital of this business, as well as other sources of cash, to repurchase shares of Nasdaq common stock to reduce the impact on earnings per share dilution from the sale. To facilitate these repurchases, in June 2021, the board of directors authorized an increase to the share repurchase program. These share repurchases were completed during the second quarter of 2022. See “Share Repurchase Program,” of Note 12, “Nasdaq Stockholders' Equity,” for further discussion.
2021 Acquisition
Acquisition of Verafin
In February 2021, we completed the acquisition of Verafin, a SaaS technology provider of anti-financial crime management solutions that provides a cloud-based platform to help detect, investigate, and report money laundering and fraud, for an aggregate purchase price of $2.75 billion, subject to certain adjustments. The $2.75 billion purchase price included a cash payment of $102 million, reflected in cash from operating activities in our Consolidated Statements of Cash Flows, the release of which was subject to certain employment-related conditions following the closing of the transaction. During the fourth quarter of 2022, the parties to the transaction agreed that the remaining amount of the $102 million initial cash payment not yet paid would be accelerated and paid to the eligible former Verafin employees. The remaining expense was recorded as merger and strategic initiatives expense. Verafin is part of our Anti-Financial Crime segment.
The amounts in the table above represent the preliminary allocation of purchase price as of December 31, 2017 and are subject to revision during the remainder of the measurement period, a period not to exceed 12 months from the acquisition date. Adjustments to the provisional values, which may include tax and other estimates, during the measurement period will be recorded in the reporting period in which the adjustment amounts are determined. Changes to amounts recorded as assets and liabilities may result in a corresponding adjustment to goodwill.
| Purchase Consideration | Total Net Assets (Liabilities) Acquired | Total Net Deferred Tax Liability | Acquired Intangible Assets | Goodwill | |||||||||||||||
| (in millions) | |||||||||||||||||||
| ISE | $ | 1,070 | $ | 83 | $ | (185 | ) | $ | 623 | $ | 549 | ||||||||
| Boardvantage | 242 | 28 | (38 | ) | 111 | 141 | |||||||||||||
| Marketwired | 111 | (1 | ) | (5 | ) | 31 | 86 | ||||||||||||
| Nasdaq Canada | 116 | 6 | (20 | ) | 76 | 54 | |||||||||||||
| Purchase Consideration | Total Net Assets Acquired | Total Net Deferred Tax Liability | Acquired Intangible Assets | Goodwill | |||||||||||||||
| (in millions) | |||||||||||||||||||
| DWA | $ | 226 | $ | 8 | $ | (34 | ) | $ | 141 | $ | 111 | ||||||||
F-21
| (in millions) | ||||||||
| Goodwill | $ | 1,882 | ||||||
| Acquired Intangible Assets | 815 | |||||||
| Total Net Liabilities Acquired | (46) | |||||||
| Purchase Consideration | $ | 2,651 | ||||||
Intangible Assets
The following table presents the details of acquired intangible assets for Verafin at the date of each acquisition. All acquiredAcquired intangible assets with finite lives are amortized using the straight-line method.
Customer Relationships | Technology | Trade Name | Total Acquired Intangible Assets | ||||||||||||||||||||||||||||||||||
| 2017 | 2016 | 2015 | |||||||||||||||||||||||||||||||||||
| eVestment | ISE | Boardvantage | Marketwired | Nasdaq Canada | DWA | ||||||||||||||||||||||||||||||||
| ($ in millions) | |||||||||||||||||||||||||||||||||||||
| Intangible Assets | |||||||||||||||||||||||||||||||||||||
| Exchange registrations | $ | — | $ | 467 | $ | — | $ | — | $ | — | $ | — | |||||||||||||||||||||||||
| Intangible asset value (in millions) | Intangible asset value (in millions) | $ | 532 | $ | 246 | $ | 37 | $ | 815 | ||||||||||||||||||||||||||||
| Discount rate used | — | 8.6 | % | — | — | — | — | Discount rate used | 7.5 | % | 7.5 | % | 7.5 | % | |||||||||||||||||||||||
| Estimated average useful life | — | Indefinite | — | — | — | — | Estimated average useful life | 22 years | 7 years | 20 years | |||||||||||||||||||||||||||
| Customer relationships | $ | 378 | $ | 148 | $ | 103 | $ | 29 | $ | 76 | $ | 29 | |||||||||||||||||||||||||
| Discount rate used | 9.3 | % | 9.1 | % | 15.5 | % | 16.4 | % | 10.3 | % | 17.5 | % | |||||||||||||||||||||||||
| Estimated average useful life | 14 years | 13 years | 14 years | 6 years | 17 years | 15 years | |||||||||||||||||||||||||||||||
| Trade name | $ | 13 | $ | 8 | $ | 2 | $ | 2 | $ | — | $ | 108 | |||||||||||||||||||||||||
| Discount rate used | 9.2 | % | 8.6 | % | 15.0 | % | 15.8 | % | — | 17.0 | % | ||||||||||||||||||||||||||
| Estimated average useful life | 8 years | Indefinite | 1 year | 2 years | — | Indefinite | |||||||||||||||||||||||||||||||
| Technology | $ | 14 | $ | — | $ | 6 | $ | — | $ | — | $ | 4 | |||||||||||||||||||||||||
| Discount rate used | 9.2 | % | — | 15.5 | % | — | — | 17.0 | % | ||||||||||||||||||||||||||||
| Estimated average useful life | 8 years | — | 5 years | — | — | 5 years | |||||||||||||||||||||||||||||||
| Total intangible assets | $ | 405 | $ | 623 | $ | 111 | $ | 31 | $ | 76 | $ | 141 | |||||||||||||||||||||||||
F-12
No impairments were recorded to reduce the carrying value of our equity method investments in 2022, 2021 or 2020.
Derivative Financial Instruments and Hedging Activities
Non-Designated Derivatives
We estimated the useful lifeuse foreign exchange forward contracts to manage foreign currency exposure of the trade name to be indefinite.intercompany loans, accounts receivable, accounts payable and other balance sheet items. These contracts are not designated as hedges for financial reporting purposes. The useful life was based on several factors including the numberchange in fair value of years the name has beenthese contracts is recognized in service, its popularity within the industry,general, administrative and our intention to continue its useother expense in the brandingConsolidated Statements of products.
As partof December 31, 2022 and 2021, the fair value amounts of our acquisitionsderivative instruments were immaterial.
Net Investment Hedges
Net assets of eVestment, Boardvantage,our foreign subsidiaries are exposed to volatility in foreign currency exchange rates. We may utilize net investment hedges to offset the translation adjustment arising from re-measuring our investment in foreign subsidiaries.
Our 2029, 2030 and DWA, we acquired developed technology.
Property and Equipment, net
Property and equipment, including leasehold improvements, are carried at cost less asset impairment charges and accumulated depreciation and amortization. Depreciation and amortization are recognized using the straight-line method over the estimated useful lifelives of the Boardvantage technologyrelated assets, which range from 10 to 40 years for buildings and DWA technologyimprovements, 3 to 5 years for data processing equipment, and 5 to 10 years for furniture and equipment.
Leasehold improvements are amortized using the straight-line method over the shorter of their estimated useful lives or the remaining term of the related lease.
We develop systems solutions for both internal and external use. Certain costs incurred in connection with developing or obtaining internal use software are capitalized. In addition, certain costs of computer software to be 5 years.
Property and equipment are subject to its current fair value, and whether actions required to complete the planimpairment testing when events or conditions indicate that it is unlikely that significant changes to the plan will be made or that the plan will be withdrawn. We initially measure a disposal group that is classified as held for sale at the lower of its carrying amount of an asset may not be recoverable. The carrying amount of an asset is not recoverable if it exceeds the sum of the undiscounted cash flows expected to result from the use and eventual disposition of the asset, or fair value less costs to sell. Any loss resulting from this measurement is recognized in the period in which the held for sale criteria are met. Conversely, gains are not recognized until the date of sale. We assessinternal use software, the fair value of a disposal group less costs to sell each reporting period it remains classifiedthe asset. Any required impairment loss is measured as held for sale and report any subsequent changes as an adjustment tothe amount by which the carrying amount of the disposal group,asset exceeds its fair value and is recorded as long as the new carrying amount does not exceeda reduction in the carrying amount of the disposal group at the time it was initially classified as heldrelated asset and a charge to operating results.
See Note 7, “Property and Equipment, net,” for sale. Assetsfurther discussion.
Leases
At inception, we determine whether a contract is or contains a lease. We have operating leases which are not depreciated or amortized while theyprimarily real estate leases for our U.S. and European headquarters and for general office space. As of December 31, 2022, these leases have varying lease terms with remaining maturities ranging from 2 to 14 years. Operating lease balances are classified as held for sale. Upon determining that a disposal group meets the criteria to be classified as held for sale, we report theincluded in operating lease assets, other current liabilities, and operating lease liabilities of the disposal group as assets held for sale and liabilities held for sale in our Consolidated Balance Sheets. We do not have any leases classified as finance leases.
F-13
Operating lease assets represent our right to evaluate strategic alternativesuse an underlying asset for the lease term and lease liabilities represent our Public Relations Solutions and Digital Media Services businesses within our Corporate Solutions business as part of our strategic refinement. The Corporate Solutions business is part of our Corporate Services segment. The Public Relations Solutions and Digital Media Services businesses includeobligation to make lease payments arising from the following products and services:
We have lease agreements with lease and non-lease components, which are accounted for sale as a single performance obligation to the extent that the timing and pattern of September 30, 2017. The disposal of these businesses did not represent a strategic shift that would have a major effect on our operations and financial results and is, therefore, not classified as discontinued operations. No impairment charge was recordedtransfer are similar for the year ended December 31, 2017lease and non-lease components and the lease component qualifies as an operating lease. We do not recognize lease liabilities and operating lease assets for leases with a term of 12 months or less. We recognize these lease payments on a straight-line basis over the carrying amount of the net assets was less than the fair value less costs to sell. Fair value was determined based upon the anticipated sales price of these businesses based on current market conditions and assumptions made by management, which may differ from actual results and may result in an impairment if market conditions deteriorate. In January 2018, we announced that we entered into a definitive agreement to sell our Public Relations Solutions and Digital Media Services businesses. Based on the sales price in the agreement, no impairment charge was recorded. lease term. See “Definitive Agreement to Sell our Public Relations Solutions and Digital Media Services Businesses,” of Note 21, “Subsequent Events,16, “Leases,” for further discussion.
| December 31, 2017 | ||||
(in millions) | ||||
| Receivables, net | $ | 27 | ||
| Property and equipment, net | 21 | |||
Goodwill (1) | 202 | |||
| Intangible assets, net | 38 | |||
| Other assets | 9 | |||
| Total assets held for sale | $ | 297 | ||
| Deferred tax liabilities | $ | 16 | ||
| Other current liabilities | 29 | |||
| Total liabilities held for sale | $ | 45 | ||
Market Services | Corporate Services | Information Services | Market Technology | Total | |||||||||||||||
| (in millions) | |||||||||||||||||||
| Balance at December 31, 2016 | $ | 3,390 | $ | 674 | $ | 1,806 | $ | 157 | $ | 6,027 | |||||||||
| Goodwill acquired | — | — | 453 | 13 | 466 | ||||||||||||||
| Measurement period adjustment | — | (7 | ) | — | — | (7 | ) | ||||||||||||
| Foreign currency translation adjustment | 156 | 25 | 103 | 18 | 302 | ||||||||||||||
Goodwill reclassified as held for sale(1) | — | (202 | ) | — | — | (202 | ) | ||||||||||||
| Balance at December 31, 2017 | $ | 3,546 | $ | 490 | $ | 2,362 | $ | 188 | $ | 6,586 | |||||||||
Goodwill represents the excess of purchase price over the value assigned to the net assets, including identifiable intangible assets, of a business acquired. Goodwill is allocated to our reporting units based on the assignment of the fair values of each reporting unit of the acquired company. We test goodwillrecognize specifically identifiable intangibles, such as customer relationships, technology, exchange and clearing registrations, trade names and licenses when a specific right or contract is acquired. Goodwill and intangible assets deemed to have indefinite useful lives, primarily exchange and clearing registrations, are not amortized but instead are tested for impairment at the reporting unit levelleast annually as of October 1 and more frequently whenever events or changes in interim periods if certain events occur indicatingcircumstances indicate that the carrying amountfair value of the asset may be impaired,less than its carrying amount, such as changes in the business climate, poor indicators of operating performance or the sale or disposition of a significant portion of a reporting unit. When testing goodwill and indefinite-lived intangible assets for impairment, we have the option of first performing a qualitative assessment to determine whether it is more likely than not that the fair value of a reporting unit or indefinite-lived intangible asset is less than their respective carrying amounts as the basis to determine if it is necessary to perform a quantitative impairment test. If we choose not to complete a qualitative assessment, or if the initial assessment
indicates that it is more likely than not that the carrying amount of a reporting unit or the carrying amount of an indefinite-lived intangible asset exceeds their respective estimated fair values, a quantitative test is required.
In performing a quantitative impairment test, we compare the fair value of each reporting unit and indefinite-lived intangible asset with their respective carrying amounts. If the carrying amounts of the reporting unit or the indefinite-lived intangible asset exceed their respective fair values, an impairment charge is recognized in an amount equal to the difference, limited to the total amount of goodwill allocated to that reporting unit or the total carrying value of the indefinite-lived intangible asset.
There was no impairment of goodwill or indefinite-lived intangible assets for the years ended December 31, 2017, 20162022, 2021 and 2015; however,2020. Future disruptions to our business and events, such as extendedprolonged economic weakness or unexpected significant declines in operating results of aany of our reporting unitunits or businesses, may result in goodwill or indefinite-lived intangible asset impairment charges in the future.
Other Long-Lived Assets
We review our other long-lived assets, such as finite-lived intangible assets and property and equipment, for potential impairment when there is evidence that events or changes in circumstances indicate that the carrying amount of an asset may not be recoverable. The carrying amount of an asset is not recoverable if it exceeds the sum of the undiscounted cash flows expected to result from the use and eventual disposition of the asset. Fair value of finite-lived intangible assets and property and equipment is based on various valuation techniques. Any required impairment loss is measured as the amount by which the carrying amount of the asset exceeds its fair value and is recorded as a reduction in the carrying amount of the related asset and a charge to operating results.
There were no material finite-lived impairment charges in 2022 and 2020. We recorded pre-tax, non-cash finite-lived intangible assets impairment charges of $14 million in 2021 related to a finite-lived intangible asset for customer relationships associated with the wind down of a previous acquisition. In addition, we also recorded pre-tax, non-cash property and equipment asset impairment charges of $8 million in 2022, $4 million in 2021 and $14 million in 2020.
F-14
Revenue Recognition and Transaction-Based Expenses
Revenue From Contracts With Customers
Substantially all of our total acquired intangible assets, both finite-revenues are considered to be revenues from contracts with customers. The related accounts receivable balances are recorded in our Consolidated Balance Sheets as receivables which are net of an allowance for credit losses of $15 million as of December 31, 2022 and indefinite-lived:
| December 31, 2017 | December 31, 2016 | ||||||||||||||||||||||||||
| Gross Amount | Accumulated Amortization | Net Amount | Weighted-Average Useful Life (in Years) | Gross Amount | Accumulated Amortization | Net Amount | Weighted-Average Useful Life (in Years) | ||||||||||||||||||||
| (in millions) | (in millions) | ||||||||||||||||||||||||||
| Finite-Lived Intangible Assets | |||||||||||||||||||||||||||
| Technology | $ | 65 | $ | (22 | ) | $ | 43 | 8 | $ | 38 | $ | (24 | ) | $ | 14 | 5 | |||||||||||
| Customer relationships | 1,708 | (526 | ) | 1,182 | 18 | 1,394 | (464 | ) | 930 | 18 | |||||||||||||||||
| Other | 17 | (4 | ) | 13 | 8 | 7 | (6 | ) | 1 | 6 | |||||||||||||||||
| Foreign currency translation adjustment | (111 | ) | 46 | (65 | ) | (160 | ) | 58 | (102 | ) | |||||||||||||||||
| Total finite-lived intangible assets | $ | 1,679 | $ | (506 | ) | $ | 1,173 | $ | 1,279 | $ | (436 | ) | $ | 843 | |||||||||||||
| Indefinite-Lived Intangible Assets | |||||||||||||||||||||||||||
| Exchange and clearing registrations | $ | 1,257 | $ | — | $ | 1,257 | $ | 1,257 | $ | — | $ | 1,257 | |||||||||||||||
| Trade names | 129 | — | 129 | 130 | — | 130 | |||||||||||||||||||||
| Licenses | 52 | — | 52 | 52 | — | 52 | |||||||||||||||||||||
| Foreign currency translation adjustment | (143 | ) | — | (143 | ) | (188 | ) | — | (188 | ) | |||||||||||||||||
| Total indefinite-lived intangible assets | $ | 1,295 | $ | — | $ | 1,295 | $ | 1,251 | $ | — | $ | 1,251 | |||||||||||||||
| Total intangible assets | $ | 2,974 | $ | (506 | ) | $ | 2,468 | $ | 2,530 | $ | (436 | ) | $ | 2,094 | |||||||||||||
For the majority of our contracts with customers there is no significant variable consideration. We do not have a material amount of revenues recognized from performance obligations that were satisfied in prior periods. We do not provide disclosures about transaction price allocated to unsatisfied performance obligations if contract durations are less than one year.
For contract durations that are one-year or greater, the portion of transaction price allocated to unsatisfied performance obligations is included in Note 3, “Revenue From Contracts With Customers.” Our deferred revenue primarily arises from contract liabilities related to our fees for annual and initial listings, workflow & insights, marketplace technology and anti-financial crime contracts. Deferred revenue is the only significant contract asset or liability as of December 31, 2022. See Note 5, “Assets and Liabilities Held for Sale,8, “Deferred Revenue,” for our discussion of deferred revenue balances, activity, and expected timing of recognition. See “Revenue Recognition” below for further discussion.
| Gross Amount | Accumulated Amortization | Net Amount | |||||||||
| (in millions) | |||||||||||
| Finite-lived intangible assets reclassified as held for sale: | |||||||||||
| Customer relationships | $ | 54 | $ | (17 | ) | $ | 37 | ||||
| Other | 2 | (1 | ) | 1 | |||||||
| Total finite-lived intangible assets held for sale | $ | 56 | $ | (18 | ) | $ | 38 | ||||
straight-line basis over the related contractual renewal period. Amortization expense for acquired finite-lived intangible assets was $92 million for the year ended December 31, 2017, $82 million for the year ended December 31, 2016, and $62 million for the year ended December 31, 2015. Amortization expense increased in 2017 and 2016 primarily due to additional amortization expense associated with acquired intangible assets. The increase in 2017 was associated with our 2017 and 2016 acquisitions and the increase in 2016 was primarily associated with our 2016 acquisitions. These amounts areis included in depreciationcompensation and amortizationbenefits expense in the Consolidated Statements of Income. The balance of deferred costs and related amortization expense are not material to our consolidated financial statements. Sales commissions are expensed when incurred if contract durations are one year or less. Sales taxes are excluded from transaction prices.
Certain judgments and estimates were used in the identification and timing of satisfaction of performance obligations and the related allocation of transaction price and are discussed below. We believe that these represent a faithful depiction of the transfer of services to our customers.
Revenue Recognition
Our primary revenue contract classifications are described below. Although we may discuss additional revenue details in our “Management's Discussion and Analysis of Financial Condition and Results of Operations,” the categories below best represent those that depict similar economic characteristics of the nature, amount, timing and uncertainty of our revenues and cash flows.
Market Platforms
Trading Services
Transaction-Based Trading and Clearing
Transaction-based trading and clearing includes equity derivative trading and clearing, cash equity trading and FICC revenues. Nasdaq charges transaction fees for trades executed on our exchanges, as well as on orders that are routed to and executed on other market venues. Nasdaq charges clearing fees for contracts cleared with Nasdaq Clearing.
In the U.S., transaction fees are based on trading volumes for trades executed on our U.S. exchanges and in Europe, transaction fees are based on the volume and value of traded and cleared contracts. In Canada, transaction fees are based on trading volumes for trades executed on our Canadian exchange.
Nasdaq satisfies its performance obligation for trading services upon the execution of a customer trade and clearing services when a contract is cleared, as trading and clearing transactions are substantially complete when they are executed and we have no further obligation to the customer at that time. Transaction-based trading and clearing fees can be variable and are based on trade volume tiered discounts. Transaction revenues, as well as any tiered volume discounts, are calculated and billed monthly in accordance with our published fee schedules. In the U.S., we also pay liquidity payments to customers based on our published fee schedules. We use these payments to improve the liquidity on our markets and therefore recognize those payments as a cost of revenue.
For U.S. equity derivative trading, we credit a portion of the per share execution charge to the market participant that provides the liquidity. For U.S. and Canadian cash equity trading, including for The Nasdaq Stock Market, Nasdaq PSX and Nasdaq CXC, we credit a portion of the per share execution charge to the market participant that provides the liquidity, and for Nasdaq BX and Nasdaq CX2, we credit a portion of the per share execution charge to the market participant that takes the liquidity. We record these credits as transaction rebates that are included in transaction-based expenses in the Consolidated Statements of Income. These transaction rebates are paid on a monthly basis and the amounts due are included in accounts payable and accrued expenses in the Consolidated Balance Sheets.
Under our Limitation of foreign currency translation adjustmentsLiability Rule and procedures, we may, subject to certain caps, provide compensation for losses directly resulting from our systems’ actual failure to correctly process an order, quote, message or other data into our platform. We do not record a liability for any potential claims that may be submitted under the Limitation of $65 million as of December 31, 2017) of acquired finite-lived intangible assets as of December 31, 2017 is as follows:
| (in millions) | |||
| 2018 | $ | 114 | |
| 2019 | 99 | ||
| 2020 | 99 | ||
| 2021 | 97 | ||
| 2022 | 94 | ||
| 2023 and thereafter | 735 | ||
| Total | $ | 1,238 | |
U.S. Tape Plans
For U.S. Tape plans, revenues are collected monthly based on published fee schedules and distributed quarterly to the U.S. exchanges based on a formula required by Regulation NMS that takes into account both trading and quoting activity. These revenues are presented on a net basis as all indicators of principal versus agent reporting under U.S. GAAP have been considered in analyzing the appropriate presentation of the revenue sharing. The following are primary indicators of net reporting:
•We are the administrator for the UTP plan, in addition to being a participant in the plan. In our unique role as administrator, we facilitate the collection and dissemination of revenues on behalf of the plan participants. As a participant, we share in the net distribution of revenues according to the plan on the same terms as all other plan participants.
•The operating committee of the plan, which is comprised of representatives from each of the participants, including us solely in our capacity as a plan participant, is responsible for setting the level of fees to be paid by distributors and subscribers and taking action in accordance with the provisions of the plan, subject to SEC approval.
•Risk of loss on the revenue is shared equally among plan participants according to the plan.
Marketplace Technology
Trade management services
We provide market participants with a wide variety of alternatives for connecting to and accessing our markets for a fee. We also offer market participants colocation services, whereby we charge firms for cabinet space and power to house their own equipment and servers within our data centers. These participants are charged monthly fees for cabinet space, connectivity and support in accordance with our published fee schedules. These fees are recognized on a monthly basis when the performance obligation is met. We also earn revenues from annual and monthly exchange membership and registration fees. Revenues for monthly exchange membership and registration fees are recognized on a monthly basis as the service is provided. Revenues from annual fees for exchange membership and registration fees are recognized ratably over the following twelve-month period since the customer receives and consumes the benefit as Nasdaq provides the service. We also offered broker services to financial participants in the Nordic market primarily offering back office technology solutions. Revenues from broker services are based on a fixed basic fee for licensing, maintenance and support and development, and an incremental fee depending on the number of transactions. Broker services revenues were generally billed and recognized monthly. As previously disclosed, in January 2020, we commenced an orderly wind-down of this broker services business. BasedThe wind-down was completed in the second quarter of 2022.
Market Technology
Market technology revenues primarily consist of SaaS revenues, software, license and support revenues, and change request revenues.
We enter into long-term contracts with customers to develop customized technology solutions, license the right to use software, and provide support and other services to our customers. We also enter into agreements to modify the system solutions sold by Nasdaq after delivery has occurred. In addition, we enter into subscription agreements which allow customers to connect to our servers to access our software.
Our long-term contracts with customers to develop customized technology solutions, license the right to use software and provide support and other services to our customers have multiple performance obligations. The performance obligations are generally: (i) software license and installation service and (ii) software support. We have determined that the software license and installation service are not distinct as the license and the customized installation service are inputs to produce the combined output, a functional and integrated software system.
F-16
For contracts with multiple performance obligations, we allocate the contract transaction price to each performance obligation using our best estimate of the standalone selling price of each distinct good or service in the contract. In instances where standalone selling price is not directly observable, such as when we do not sell the product or service separately, we determine the standalone selling price predominantly through an expected cost plus a margin approach. For the years ended December 31, 2022, 2021 and 2020 we recognized revenues of $75 million, $77 million and $90 million, respectively, related to the contracts described above.
Contract modifications are routine in the performance of our contracts. Contracts are often modified to account for changes in contract specifications or requirements. In most instances, contract modifications are for goods and services that are not distinct, and, therefore, are accounted for as part of the existing contract.
For our long-term contracts, payments are generally made throughout the contract life and can be dependent on either reaching certain milestones or paid upfront in advance of the service period depending on the stage of the contract. For subscription agreements, contract payment terms can be quarterly, annually or monthly, in advance. For all other contracts, payment terms vary.
We generally recognize revenue over time as our customers simultaneously receive and consume the benefits provided by our performance because our customer controls the asset for which we are creating, our performance does not create an asset with alternative use, and we have a right to payment for performance completed to date. For these services, we recognize revenue over time using costs incurred to date relative to total estimated costs at completion to measure progress toward satisfying our performance obligation. Incurred costs represent work performed, which corresponds with, and thereby depicts, the transfer of control to the customer. Contract costs generally include labor and direct overhead. For software support and update services, and for subscription agreements which allow customers to connect to our servers to access our software, we generally recognize revenue ratably over the service period beginning on the date our service is made available to the customer since the customer receives and consumes the benefit consistently over the period as Nasdaq provides the services.
Accounting for our long-term contracts requires judgment relative to assessing risks and their impact on the estimate of revenues and costs. Our estimates are impacted by factors such as the potential for schedule and technical issues, productivity, and the complexity of work performed. When adjustments in estimated total contract costs are required, any changes in the estimated revenues from prior estimates are recognized in the current period for the effect of such change. If estimates of total costs to be incurred on a contract exceed estimates of total revenues, a provision for the entire estimated loss on the contract is recorded in the period in which the loss is determined.
Capital Access Platforms
Data and Listings
Data revenues are earned from U.S. and European proprietary data products. We earn revenues primarily based on the number of data subscribers and distributors of our data. Data revenues are subscription-based and are recognized on a monthly basis.
Listing services revenues primarily include initial listing fees and annual renewal fees. Under Topic 606, the initial listing fee is allocated to multiple performance obligations including initial and subsequent listing services and corporate solutions products (when a company qualifies to receive certain complimentary IPO products under the applicable Nasdaq rule), as well as a customer's material right to renew the option to list on our exchanges. In performing this allocation, the standalone selling price of the performance obligations is based on the initial and annual listing fees and the standalone selling price of the IPO complimentary services is based on its market value. All listing fees are billed upfront and the identified performance obligations are satisfied over time since the customer receives and consumes the benefit as Nasdaq provides the listing service. The amount of revenue related to IPO complimentary services performance obligation is recognized ratably over a three-year period, which is based on contract terms, with the remaining revenue recognized ratably over six years which is based on our historical listing experience and projected future listing duration.
In the U.S., annual renewal fees are charged to listed companies based on their number of outstanding shares at the end of the prior year and are recognized ratably over the following twelve-month period since the customer receives and consumes the benefit as Nasdaq provides the service. Annual fees are charged to newly listed companies on a pro-rata basis, based on outstanding shares at the time of listing and recognized over the remainder of the year. European annual renewal fees, which are received from companies listed on our Nasdaq Nordic and Nasdaq Baltic exchanges and Nasdaq First North, are directly related to the listed companies’ market capitalization on a trailing twelve-month basis and are recognized ratably over the following twelve-month period since the customer receives and consumes the benefit as Nasdaq provides the service.
F-17
Index
We develop and license Nasdaq-branded indexes and financial products. We also provide index data products and custom calculation services for third-party clients. Revenues primarily include license fees from these branded indexes and financial products in the U.S. and abroad. We primarily have two types of license agreements: transaction-based licenses and asset-based licenses. Transaction-based licenses are generally renewable agreements. Customers are charged based on transaction volume or a minimum contract amount, or both. If a customer is charged based on transaction volume, we recognize revenue when the transaction occurs. If a customer is charged based on a minimum contract amount, we recognize revenue on a pro-rata basis over the licensing term since the customer receives and consumes the benefit as Nasdaq provides the service. Asset-based licenses are also generally renewable agreements. Customers are charged based on a percentage of AUM for licensed products, per the agreement, on a monthly or quarterly basis. These revenues are recognized over the term of the license agreement since the customer receives and consumes the benefit as Nasdaq provides the service. Revenue from index data subscriptions are recognized on a monthly basis.
Workflow & Insights
Analytics revenues are earned from investment content and analytics products. We earn revenues primarily based on the number of content and analytics subscribers and distributors.
Subscription agreements are generally one to three years in term, payable in advance, and provide for automatic renewal. Subscription-based revenues are recognized over time on a ratable basis over the contract period beginning on the date that our service is made available to the customer since the customer receives and consumes the benefit as Nasdaq provides the service.
Our corporate solutions business includes our Investor Relations Intelligence, ESG Services and Governance Solutions businesses, which serve both public and private companies and organizations.
Corporate solutions revenues primarily include subscription and transaction-based income from our investor relations intelligence and governance solutions products and services. Subscription-based revenues earned are recognized over time on a ratable basis over the contract period beginning on the date that our service is made available to the customer since the customer receives and consumes the benefit as Nasdaq provides the service. Generally, fees are billed in advance and the contract provides for automatic renewal. As part of subscription agreements, customers can also be charged usage fees based upon this review, management changedactual usage of the strategic directionservices provided. Revenues from usage fees are recognized at a point in time when the service is provided.
Anti-Financial Crime
Anti-Financial Crime revenues primarily consist of SaaS revenues. We enter into subscription agreements which allow customers access to our cloud platform, or in the case of certain surveillance customers, a connection to our servers to access the software. Subscription agreements are generally three years in term, payable in advance, with the option of automatic renewal for some products. Subscription-based revenues are recognized over time on a ratable basis over the contract period beginning on the date that our service is made available to the customer since the customer receives and consumes the benefit as Nasdaq provides the service.
Other Revenues
Other revenues include revenues related to our Nordic broker services business for which we completed the wind-down in June 2022, as well as revenues associated with our U.S. Fixed Income business, which was sold in June 2021. Prior to the closing of the transaction, these revenues were included in our Market Platforms and more closely integratedCapital Access Platforms segments. See “2021 Divestiture,” of Note 4, “Acquisitions and Divestiture,” to the U.S. and European Fixed Income businesses under a single brand called Nasdaq Fixed Income. As partconsolidated financial statements for further discussion of this effort,divestiture. Additionally, for the years ended December 31, 2021 and 2020, other revenues include revenues associated with the NPM business which we decidedcontributed in July 2021 to no longer utilizea standalone, independent company, of which we own the eSpeed trade name.largest minority interest, together with a consortium of third-party financial institutions. Prior to July 2021, these revenues were included in our Capital Access Platforms segment. For the twelve months ended December 31, 2022, other revenues also include a transitional services agreement associated with a divested business.
Earnings Per Share
We present both basic and diluted earnings per share. Basic earnings per share is computed by dividing net income attributable to Nasdaq by the weighted-average number of common shares outstanding for the period. Diluted earnings per share is computed by dividing net income attributable to Nasdaq by the weighted-average number of common shares and common share equivalents outstanding during the period and reflects the assumed conversion of all dilutive securities, which primarily consist of restricted stock, PSUs, and employee stock options. Common share equivalents are excluded from the computation in periods for which they have an anti-dilutive effect. Stock options for which the exercise price exceeds the average market price over the period are anti-dilutive and, accordingly, are excluded from the calculation. Shares which are considered contingently issuable are included in the computation of dilutive earnings per share on a weighted average basis when management determines the applicable performance criteria would have been met if the performance period ended as of the date of the relevant computation. See Note 13, “Earnings Per Share,” for further discussion.
F-18
Pension and Post-Retirement Benefits
Pension and other post-retirement benefit plan information for financial reporting purposes is developed using actuarial valuations. We assess our pension and other post-retirement benefit plan assumptions on a regular basis. In connectionevaluating these assumptions, we consider many factors, including evaluation of the discount rate, expected rate of return on plan assets, mortality rate, healthcare cost trend rate, retirement age assumption, our historical assumptions compared with these triggering events, following board approvalactual results and analysis of current market conditions and asset allocations. See Note 10, “Retirement Plans,” for further discussion.
Discount rates used for pension and other post-retirement benefit plan calculations are evaluated annually and modified to reflect the prevailing market rates at the measurement date of a high-quality fixed-income debt instrument portfolio that would provide the future cash flows needed to pay the benefits included in January 2017,the benefit obligations as they come due. Actuarial assumptions are based upon management’s best estimates and judgment.
The expected rate of return on plan assets for our U.S. pension plans represents our long-term assessment of return expectations which may change based on significant shifts in economic and financial market conditions. The long-term rate of return on plan assets is derived from return assumptions based on targeted allocations for various asset classes. While we recordedconsider the pension plans’ recent performance and other economic growth and inflation factors, which are supported by long-term historical data, the return expectations for the targeted asset categories represent a pre-tax, non-cash intangible asset impairment chargelong-term prospective return.
Share-Based Compensation
Nasdaq uses the fair value method of $578 million to write off the fullaccounting for share-based awards. Share-based awards, or equity awards, include restricted stock, PSUs, and stock options. The fair value of restricted stock awards and PSUs, other than PSUs granted with market conditions, is determined based on the eSpeed trade namegrant date closing stock price less the present value of future cash dividends. We estimate the fair value of PSUs granted with market conditions using a Monte Carlo simulation model at the date of grant. The fair value of stock options are estimated using the Black-Scholes option-pricing model.
We generally recognize compensation expense for equity awards on a straight-line basis over the requisite service period of the award, taking into account an estimated forfeiture rate. Granted but unvested shares are generally forfeited upon termination of employment.
Excess tax benefits or expense related to employee share-based payments, if any, are recognized as we no longer attributed any material value to the trade name. This charge is recorded in asset impairment chargeincome tax benefit or expense in the Consolidated Statements of Income for 2016. when the awards vest or are settled.
Nasdaq also has an ESPP that allows eligible employees to purchase a limited number of shares of our global rebranding initiative, we decided to change our company name from The NASDAQ OMX Group, Inc. to Nasdaq, Inc., which became effective in the third quarter of 2015. In connection with this action, we decided to discontinue the usecommon stock at six-month intervals, called offering periods, at 85.0% of the OMX trade namelower of the fair market value on the first or the last day of each offering period. The 15.0% discount given to our employees is included in compensation and recorded a pre-tax, non-cash impairment charge of $119 million because we no longer attributed any material value to the trade name. This charge is recorded in restructuring chargesbenefits expense in the Consolidated Statements of IncomeIncome.
See Note 11, “Share-Based Compensation,” for 2015.further discussion of our share-based compensation plans.
Merger and Strategic Initiatives
We incur incremental direct merger and strategic initiative costs relating to various completed and potential acquisitions, divestitures, and other strategic opportunities. These intangiblecosts generally include integration costs, as well as legal, due diligence and other third-party transaction costs.
Fair Value Measurements
Fair value is defined as the price that would be received from selling an asset impairment charges didor paid to transfer a liability, or the exit price, in an orderly transaction between market participants at the measurement date. When determining the fair value measurements for assets and liabilities required or permitted to be either recorded or disclosed at fair value, we consider the principal or most advantageous market in which we would transact, and we also consider assumptions that market participants would use when pricing the asset or liability. Fair value measurement establishes a hierarchy of valuation techniques based on whether the inputs to those valuation techniques are observable or unobservable. Observable inputs reflect market data obtained from independent sources, while unobservable inputs reflect Nasdaq’s market assumptions. These two types of inputs create the following fair value hierarchy:
•Level 1 - Quoted prices for identical instruments in active markets.
•Level 2 - Quoted prices for similar instruments in active markets; quoted prices for identical or similar instruments in markets that are not impactactive; and model-derived valuations whose inputs are observable or whose significant value drivers are observable.
•Level 3 - Instruments whose significant value drivers are unobservable.
This hierarchy requires the company’suse of observable market data when available.
See Note 14, “Fair Value of Financial Instruments,” for further discussion.
F-19
Tax Matters
We use the asset and liability method to determine income taxes on all transactions recorded in the consolidated cash flows, liquidity,financial statements. Deferred tax assets (net of valuation allowances) and deferred tax liabilities are presented net by jurisdiction as either a non-current asset or capital resourcesliability in our Consolidated Balance Sheets, as appropriate. Deferred tax assets and liabilities are determined based on differences between the financial statement carrying amounts and the tax basis of existing assets and liabilities (i.e., temporary differences) and are measured at the enacted rates that will be in effect when these differences are realized. If necessary, a valuation allowance is established to reduce deferred tax assets to the amount that is more likely than not to be realized.
In order to recognize and measure our unrecognized tax benefits, management determines whether a tax position is more likely than not to be sustained upon examination, including resolution of any related primarily to our Market Services segment. However, for segment reporting purposes, these charges were allocated to corporate itemsappeals or litigation processes, based on the decisiontechnical merits of the position. Once it is determined that these charges should nota position meets the recognition thresholds, the position is measured to determine the amount of benefit to be used to evaluate any particular segment’s operating performance.
Stock Split Effected in the Form of a Stock Dividend
On August 26, 2022, we effected a 3-for-1 stock split of the Company's common stock in the form of a stock dividend to shareholders of record as of August 12, 2022. The par value hierarchyper share of our common stock remains $0.01 per share. All references made with respect to a number of shares or per share amounts throughout this Annual Report on Form 10-K have been retroactively adjusted to reflect the stock split.
Subsequent Events
We have evaluated subsequent events through the issuance date of this Annual Report on Form 10-K.
3. REVENUE FROM CONTRACTS WITH CUSTOMERS
Disaggregation of Revenue
The following tables summarize the disaggregation of revenue by major product and service and by segment for the years ended December 31, 2022, 2021 and 2020:
| Year Ended December 31, | |||||||||||||||||
| 2022 | 2021 | 2020 | |||||||||||||||
| (in millions) | |||||||||||||||||
| Market Platforms | |||||||||||||||||
| Trading Services, net | $ | 1,019 | $ | 1,037 | $ | 932 | |||||||||||
| Marketplace Technology | 562 | 545 | 525 | ||||||||||||||
| Capital Access Platforms | |||||||||||||||||
| Data & Listing Services | 729 | 680 | 574 | ||||||||||||||
| Index | 486 | 459 | 324 | ||||||||||||||
| Workflow & Insights | 469 | 429 | 389 | ||||||||||||||
| Anti-Financial Crime | 306 | 231 | 116 | ||||||||||||||
| Other revenues | 11 | 39 | 43 | ||||||||||||||
| Revenues less transaction-based expenses | $ | 3,582 | $ | 3,420 | $ | 2,903 | |||||||||||
Substantially all revenues from the Capital Access Platforms and Anti-Financial Crime segments as well as our Marketplace Technology business were recognized over time for the years ended December 31, 2022, 2021 and 2020. For the years ended December 31, 2022, 2021 and 2020 approximately 93.1%, 93.6%, and 94.8% respectively, of Trading Services revenues were recognized at a point in time and 6.9%, 6.4% and 5.2%, respectively, were recognized over time.
Contract Balances
Substantially all of our revenues are inherentconsidered to be revenues from contracts with customers. The related accounts receivable balances are recorded in impairment tests performedour Consolidated Balance Sheets as receivables, which are net of allowance for doubtful accounts of $15 million as of December 31, 2022 and include assumptions$17 million as of December 31, 2021. The changes in the balance between periods were immaterial. We do not have obligations for warranties, returns or refunds to customers.
For the majority of our contracts with customers, except for our market technology and listing services contracts, our performance obligations range from three months to three years and there is no significant variable consideration.
F-20
Deferred revenue is the only significant contract asset or liability as of December 31, 2022. Deferred revenue represents consideration received that is yet to be recognized as revenue for unsatisfied performance obligations. Deferred revenue primarily represents our contract liabilities related to our fees for Annual and Initial Listings, Workflow & Insights, Market Technology and Anti-Financial Crime contracts. See Note 8, “Deferred Revenue,” for our discussion on deferred revenue balances, activity, and expected timing of recognition.
We do not have a material amount of revenue recognized from performance obligations that were satisfied in prior periods. We do not provide disclosures about transaction price allocated to unsatisfied performance obligations if contract durations are less than one year. For our initial listings, the transaction price allocated to remaining performance obligations is included in deferred revenue. For our Market Technology, Anti-Financial Crime, and Workflow & Insights contracts, the portion of transaction price allocated to unsatisfied performance obligations is presented in the table below. To the extent consideration has been received, unsatisfied performance obligations would be included in the table below as well as deferred revenue.
The following table summarizes the amount of the transaction price allocated to performance obligations that are unsatisfied, for contract durations greater than one year, as of December 31, 2022:
| Market Technology | Anti-Financial Crime | Workflow & Insights | Total | ||||||||||||||||||||
| (in millions) | |||||||||||||||||||||||
| 2023 | $ | 193 | $ | 382 | $ | 137 | $ | 712 | |||||||||||||||
| 2024 | 155 | 214 | 79 | 448 | |||||||||||||||||||
| 2025 | 127 | 90 | 30 | 247 | |||||||||||||||||||
| 2026 | 92 | 27 | 11 | 130 | |||||||||||||||||||
| 2027 | 54 | 10 | 8 | 72 | |||||||||||||||||||
| 2028+ | 72 | 6 | — | 78 | |||||||||||||||||||
| Total | $ | 693 | $ | 729 | $ | 265 | $ | 1,687 | |||||||||||||||
4. ACQUISITIONS AND DIVESTITURE
We completed the following acquisitions and timingdivestiture in 2022 and 2021. Financial results of expected futureeach transaction are included in our consolidated financial statements from the date of each acquisition.
2022 Acquisition
In June 2022, we acquired Metrio, a provider of ESG data collection, analytics and reporting services based in Montreal, Canada. We plan to integrate Metrio’s SaaS platform into our suite of ESG solutions. Metrio is part of our Workflow & Insight business in our Capital Access Platforms segment.
2021 Divestiture
In June 2021, we sold our U.S. Fixed Income business, which was part of our FICC business within our Market Platforms segment, to Tradeweb Markets Inc. We recognized a pre-tax gain on the sale of $84 million, net of disposal costs. The pre-tax gain was included in net gain on divestiture of business in the Consolidated Statements of Income.
In connection with this sale, we issued approximately 6.2 million shares of Nasdaq common stock. Nasdaq used the proceeds from the sale, available tax benefits and working and clearing capital of this business, as well as other sources of cash, flows, growth ratesto repurchase shares of Nasdaq common stock to reduce the impact on earnings per share dilution from the sale. To facilitate these repurchases, in June 2021, the board of directors authorized an increase to the share repurchase program. These share repurchases were completed during the second quarter of 2022. See “Share Repurchase Program,” of Note 12, “Nasdaq Stockholders' Equity,” for further discussion.
2021 Acquisition
Acquisition of Verafin
In February 2021, we completed the acquisition of Verafin, a SaaS technology provider of anti-financial crime management solutions that provides a cloud-based platform to help detect, investigate, and report money laundering and fraud, for an aggregate purchase price of $2.75 billion, subject to certain adjustments. The $2.75 billion purchase price included a cash payment of $102 million, reflected in cash from operating activities in our Consolidated Statements of Cash Flows, the determinationrelease of appropriate discount rates. We believewhich was subject to certain employment-related conditions following the closing of the transaction. During the fourth quarter of 2022, the parties to the transaction agreed that the
The amounts in the table below represent the final allocation of the purchase price. The allocation of the purchase price was subject to revision during the measurement period, a period not to exceed 12 months from the acquisition date. Adjustments to the provisional values, which may include tax and other estimates, during the measurement period are recorded in the reporting period in which the adjustment amounts are determined. In 2021, we recorded a measurement period adjustment of $9 million. This adjustment resulted in an increase to both total net liabilities acquired and goodwill. This adjustment did not result in different calculationsan impact to our Consolidated Statements of fair value.Income. The allocation of the purchase price for Verafin was finalized in the first quarter of 2022.
| (in millions) | ||||||||
| Goodwill | $ | 1,882 | ||||||
| Acquired Intangible Assets | 815 | |||||||
| Total Net Liabilities Acquired | (46) | |||||||
| Purchase Consideration | $ | 2,651 | ||||||
Intangible Assets
The following table presents the details of our investments:acquired intangible assets for Verafin at the date of acquisition. Acquired intangible assets with finite lives are amortized using the straight-line method.
| December 31, 2017 | December 31, 2016 | ||||||
| (in millions) | |||||||
| Trading securities | $ | 221 | $ | 228 | |||
| Available-for-sale investment securities | 14 | 17 | |||||
| Equity method investments | 131 | 124 | |||||
| Cost method investments | $ | 152 | $ | 144 | |||
Customer Relationships | Technology | Trade Name | Total Acquired Intangible Assets | |||||||||||
| Intangible asset value (in millions) | $ | 532 | $ | 246 | $ | 37 | $ | 815 | ||||||
| Discount rate used | 7.5 | % | 7.5 | % | 7.5 | % | ||||||||
| Estimated average useful life | 22 years | 7 years | 20 years | |||||||||||
Equity Method Investments
In general, the equity method of accounting is used when we own 20% to 50% of the outstanding voting stock of a company or when we are able to exercise significant influence over the operating and financial policies of a company. We have certain investments in which we have determined that we have significant influence and as such account for the investments under the equity method of accounting. We record our estimated pro-rata share of earnings or losses each reporting period and record any dividends as a reduction in the investment balance. We evaluate our equity method investments for other-than-temporary declines in value by considering a variety of factors such as the earnings capacity of the investment and the fair value of the investment compared to its carrying amount. In addition, for investments where the market value is readily determinable, we consider the underlying stock price. If the estimated fair value of the investment is less than the carrying amount and management considers the decline in value to be other than temporary, the excess of the carrying amount over the estimated fair value is recognized in net income in the period the impairment occurs. See Note 6, “Investments,” for further discussion of our equity method investments.
F-12
No impairments were recorded to reduce the carrying value of our equity method investments in 2022, 2021 or 2020.
Derivative Financial Instruments and Hedging Activities
Non-Designated Derivatives
We use foreign exchange forward contracts to manage foreign currency exposure of intercompany loans, accounts receivable, accounts payable and other balance sheet items. These contracts are not designated as hedges for financial reporting purposes. The change in fair value of these contracts is recognized in general, administrative and other expense in the Consolidated Statements of Income and offsets the foreign currency exposure.
As of December 31, 20172022 and 2021, the fair value amounts of our derivative instruments were immaterial.
Net Investment Hedges
Net assets of our foreign subsidiaries are exposed to volatility in foreign currency exchange rates. We may utilize net investment hedges to offset the translation adjustment arising from re-measuring our investment in foreign subsidiaries.
Our 2029, 2030 and 2033 Notes have been designated as a hedge of our net investment in certain foreign subsidiaries to mitigate the foreign exchange risk associated with certain investments in these subsidiaries. Any increase or decrease related to the remeasurement of the 2029, 2030, and 2033 Notes into U.S. dollars is recorded in accumulated other comprehensive loss within stockholders’ equity in the Consolidated Balance Sheets. See “2029 Notes,” “2030 Notes,” and “2033 Notes” of Note 9, “Debt Obligations,” for further discussion.
Property and Equipment, net
Property and equipment, including leasehold improvements, are carried at cost less asset impairment charges and accumulated depreciation and amortization. Depreciation and amortization are recognized using the straight-line method over the estimated useful lives of the related assets, which range from 10 to 40 years for buildings and improvements, 3 to 5 years for data processing equipment, and 5 to 10 years for furniture and equipment.
Leasehold improvements are amortized using the straight-line method over the shorter of their estimated useful lives or the remaining term of the related lease.
We develop systems solutions for both internal and external use. Certain costs incurred in connection with developing or obtaining internal use software are capitalized. In addition, certain costs of computer software to be sold, leased, or otherwise marketed as a separate product or as part of a product or process are capitalized beginning when a product’s technological feasibility has been established and ending when a product is available for general release. Technological feasibility is established upon completion of a detailed program design or, in its absence, completion. Prior to reaching technological feasibility, all costs are charged to expense. Unamortized capitalized costs are included in data processing equipment and software, within property and equipment, net in the Consolidated Balance Sheets. Capitalized software costs are amortized on a straight-line basis over the estimated useful lives of the software, generally 5 to 10 years. Amortization of these costs is included in depreciation and amortization expense in the Consolidated Statements of Income.
Implementation costs incurred in a cloud computing arrangement that is a service contract are capitalized as a prepaid asset, included in other assets in our Consolidated Balance Sheets, and are amortized over the expected service period in the relevant expense category in the Consolidated Statements of Income.
Property and equipment are subject to impairment testing when events or conditions indicate that the carrying amount of an asset may not be recoverable. The carrying amount of an asset is not recoverable if it exceeds the sum of the undiscounted cash flows expected to result from the use and eventual disposition of the asset, or for internal use software, the fair value of the asset. Any required impairment loss is measured as the amount by which the carrying amount of the asset exceeds its fair value and is recorded as a reduction in the carrying amount of the related asset and a charge to operating results.
See Note 7, “Property and Equipment, net,” for further discussion.
Leases
At inception, we determine whether a contract is or contains a lease. We have operating leases which are primarily real estate leases for our U.S. and European headquarters and for general office space. As of December 31, 2016,2022, these leases have varying lease terms with remaining maturities ranging from 2 to 14 years. Operating lease balances are included in operating lease assets, other current liabilities, and operating lease liabilities in our Consolidated Balance Sheets. We do not have any leases classified as finance leases.
F-13
Operating lease assets represent our right to use an underlying asset for the lease term and lease liabilities represent our obligation to make lease payments arising from the lease. Operating lease assets and liabilities are recognized at commencement date based on the present value of lease payments over the lease term. Since our leases do not provide an implicit rate, we use our incremental borrowing rate based on the estimated rate of interest for collateralized borrowing over a similar term of the lease payments at commencement date in determining the present value of lease payments. The operating lease asset also includes any lease payments made and excludes lease incentives. Our lease terms include options to extend or terminate the lease when we are reasonably certain that we will exercise that option. Lease expense for lease payments is recognized on a straight-line basis over the lease term. Certain of our lease agreements include rental payments adjusted periodically for inflation based on an index or rate. These payments are included in the initial measurement of the operating lease liability and operating lease asset. However, rental payments that are based on a change in an index or a rate are considered variable lease payments and are expensed as incurred.
We have lease agreements with lease and non-lease components, which are accounted for as a single performance obligation to the extent that the timing and pattern of transfer are similar for the lease and non-lease components and the lease component qualifies as an operating lease. We do not recognize lease liabilities and operating lease assets for leases with a term of 12 months or less. We recognize these lease payments on a straight-line basis over the lease term. See Note 16, “Leases,” for further discussion.
Goodwill and Indefinite-Lived Intangible Assets
Goodwill represents the excess of purchase price over the value assigned to the net assets, including identifiable intangible assets, of a business acquired. Goodwill is allocated to our reporting units based on the assignment of the fair values of each reporting unit of the acquired company. We recognize specifically identifiable intangibles, such as customer relationships, technology, exchange and clearing registrations, trade names and licenses when a specific right or contract is acquired. Goodwill and intangible assets deemed to have indefinite useful lives, primarily exchange and clearing registrations, are not amortized but instead are tested for impairment at least annually as of October 1 and more frequently whenever events or changes in circumstances indicate that the fair value of the asset may be less than its carrying amount, such as changes in the business climate, poor indicators of operating performance or the sale or disposition of a significant portion of a reporting unit. When testing goodwill and indefinite-lived intangible assets for impairment, we have the option of first performing a qualitative assessment to determine whether it is more likely than not that the fair value of a reporting unit or indefinite-lived intangible asset is less than their respective carrying amounts as the basis to determine if it is necessary to perform a quantitative impairment test. If we choose not to complete a qualitative assessment, or if the initial assessment
indicates that it is more likely than not that the carrying amount of a reporting unit or the carrying amount of an indefinite-lived intangible asset exceeds their respective estimated fair values, a quantitative test is required.
In performing a quantitative impairment test, we compare the fair value of each reporting unit and indefinite-lived intangible asset with their respective carrying amounts. If the carrying amounts of the reporting unit or the indefinite-lived intangible asset exceed their respective fair values, an impairment charge is recognized in an amount equal to the difference, limited to the total amount of goodwill allocated to that reporting unit or the total carrying value of the indefinite-lived intangible asset.
There was no impairment of goodwill or indefinite-lived intangible assets for the years ended December 31, 2022, 2021 and 2020. Future disruptions to our business and events, such as prolonged economic weakness or unexpected significant declines in operating results of any of our reporting units or businesses, may result in goodwill or indefinite-lived intangible asset impairment charges in the future.
Other Long-Lived Assets
We review our other long-lived assets, such as finite-lived intangible assets and property and equipment, for potential impairment when there is evidence that events or changes in circumstances indicate that the carrying amount of an asset may not be recoverable. The carrying amount of an asset is not recoverable if it exceeds the sum of the undiscounted cash flows expected to result from the use and eventual disposition of the asset. Fair value of finite-lived intangible assets and property and equipment is based on various valuation techniques. Any required impairment loss is measured as the amount by which the carrying amount of the asset exceeds its fair value and is recorded as a reduction in the carrying amount of the related asset and a charge to operating results.
There were no material finite-lived impairment charges in 2022 and 2020. We recorded pre-tax, non-cash finite-lived intangible assets impairment charges of $14 million in 2021 related to a finite-lived intangible asset for customer relationships associated with the wind down of a previous acquisition. In addition, we also recorded pre-tax, non-cash property and equipment asset impairment charges of $8 million in 2022, $4 million in 2021 and $14 million in 2020.
F-14
Revenue Recognition and Transaction-Based Expenses
Revenue From Contracts With Customers
Our revenue recognition policies under “Revenue from Contracts with Customers (Topic 606),” are described in the following paragraphs.
Contract Balances
Substantially all of our revenues are considered to be revenues from contracts with customers. The related accounts receivable balances are recorded in our Consolidated Balance Sheets as receivables which are net of an allowance for credit losses of $15 million as of December 31, 2022 and $17 million as of December 31, 2021. The changes in the balance between periods were immaterial. We do not have obligations for warranties, returns or refunds to customers.
For the majority of our contracts with customers there is no significant variable consideration. We do not have a material amount of revenues recognized from performance obligations that were satisfied in prior periods. We do not provide disclosures about transaction price allocated to unsatisfied performance obligations if contract durations are less than one year.
For contract durations that are one-year or greater, the portion of transaction price allocated to unsatisfied performance obligations is included in Note 3, “Revenue From Contracts With Customers.” Our deferred revenue primarily arises from contract liabilities related to our fees for annual and initial listings, workflow & insights, marketplace technology and anti-financial crime contracts. Deferred revenue is the only significant contract asset or liability as of December 31, 2022. See Note 8, “Deferred Revenue,” for our discussion of deferred revenue balances, activity, and expected timing of recognition. See “Revenue Recognition” below for further descriptions of our revenue contracts.
Sales commissions earned by our sales force are considered incremental and recoverable costs of obtaining a contract with a customer. These costs are deferred and amortized on a straight-line basis over the period of benefit that we have determined to be the contract term or estimated service period. Sales commissions for renewal contracts are deferred and amortized on a straight-line basis over the related contractual renewal period. Amortization expense is included in compensation and benefits expense in the Consolidated Statements of Income. The balance of deferred costs and related amortization expense are not material to our consolidated financial statements. Sales commissions are expensed when incurred if contract durations are one year or less. Sales taxes are excluded from transaction prices.
Certain judgments and estimates were used in the identification and timing of satisfaction of performance obligations and the related allocation of transaction price and are discussed below. We believe that these represent a faithful depiction of the transfer of services to our customers.
Revenue Recognition
Our primary revenue contract classifications are described below. Although we may discuss additional revenue details in our “Management's Discussion and Analysis of Financial Condition and Results of Operations,” the categories below best represent those that depict similar economic characteristics of the nature, amount, timing and uncertainty of our revenues and cash flows.
Market Platforms
Trading Services
Transaction-Based Trading and Clearing
Transaction-based trading and clearing includes equity derivative trading and clearing, cash equity trading and FICC revenues. Nasdaq charges transaction fees for trades executed on our exchanges, as well as on orders that are routed to and executed on other market venues. Nasdaq charges clearing fees for contracts cleared with Nasdaq Clearing.
In the U.S., transaction fees are based on trading volumes for trades executed on our U.S. exchanges and in Europe, transaction fees are based on the volume and value of traded and cleared contracts. In Canada, transaction fees are based on trading volumes for trades executed on our Canadian exchange.
Nasdaq satisfies its performance obligation for trading services upon the execution of a customer trade and clearing services when a contract is cleared, as trading and clearing transactions are substantially complete when they are executed and we have no further obligation to the customer at that time. Transaction-based trading and clearing fees can be variable and are based on trade volume tiered discounts. Transaction revenues, as well as any tiered volume discounts, are calculated and billed monthly in accordance with our published fee schedules. In the U.S., we also pay liquidity payments to customers based on our published fee schedules. We use these payments to improve the liquidity on our markets and therefore recognize those payments as a cost of revenue.
For U.S. equity derivative trading, we credit a portion of the per share execution charge to the market participant that provides the liquidity. For U.S. and Canadian cash equity trading, including for The Nasdaq Stock Market, Nasdaq PSX and Nasdaq CXC, we credit a portion of the per share execution charge to the market participant that provides the liquidity, and for Nasdaq BX and Nasdaq CX2, we credit a portion of the per share execution charge to the market participant that takes the liquidity. We record these credits as transaction rebates that are included in transaction-based expenses in the Consolidated Statements of Income. These transaction rebates are paid on a monthly basis and the amounts due are included in accounts payable and accrued expenses in the Consolidated Balance Sheets.
F-15
In the U.S., we pay Section 31 fees to the SEC for supervision and regulation of securities markets. We pass these costs along to our customers through our equity derivative trading and clearing fees and our cash equity trading fees. We collect the fees as a pass-through charge from organizations executing eligible trades on our options exchanges and our cash equity platforms and we recognize these amounts in transaction-based expenses when incurred. Section 31 fees received are included in cash and cash equivalents in the Consolidated Balance Sheets at the time of receipt and, as required by law, the amount due to the SEC is remitted semiannually and recorded as Section 31 fees payable to the SEC in the Consolidated Balance Sheets until paid. Since the amount recorded as revenues is equal to the amount recorded as transaction-based expenses, there is no impact on our revenues less transaction-based expenses. As we hold the cash received until payment to the SEC, we earn interest income on the related cash balances.
Under our Limitation of Liability Rule and procedures, we may, subject to certain caps, provide compensation for losses directly resulting from our systems’ actual failure to correctly process an order, quote, message or other data into our platform. We do not record a liability for any potential claims that may be submitted under the Limitation of Liability Rule unless they meet the provisions required in accordance with U.S. GAAP. As such, losses arising as a result of the rule are accrued and charged to expense only if the loss is probable and estimable.
U.S. Tape Plans
For U.S. Tape plans, revenues are collected monthly based on published fee schedules and distributed quarterly to the U.S. exchanges based on a formula required by Regulation NMS that takes into account both trading and quoting activity. These revenues are presented on a net basis as all indicators of principal versus agent reporting under U.S. GAAP have been considered in analyzing the appropriate presentation of the revenue sharing. The following are primary indicators of net reporting:
•We are the administrator for the UTP plan, in addition to being a participant in the plan. In our unique role as administrator, we facilitate the collection and dissemination of revenues on behalf of the plan participants. As a participant, we share in the net distribution of revenues according to the plan on the same terms as all other plan participants.
•The operating committee of the plan, which is comprised of representatives from each of the participants, including us solely in our capacity as a plan participant, is responsible for setting the level of fees to be paid by distributors and subscribers and taking action in accordance with the provisions of the plan, subject to SEC approval.
•Risk of loss on the revenue is shared equally among plan participants according to the plan.
Marketplace Technology
Trade management services
We provide market participants with a wide variety of alternatives for connecting to and accessing our markets for a fee. We also offer market participants colocation services, whereby we charge firms for cabinet space and power to house their own equipment and servers within our data centers. These participants are charged monthly fees for cabinet space, connectivity and support in accordance with our published fee schedules. These fees are recognized on a monthly basis when the performance obligation is met. We also earn revenues from annual and monthly exchange membership and registration fees. Revenues for monthly exchange membership and registration fees are recognized on a monthly basis as the service is provided. Revenues from annual fees for exchange membership and registration fees are recognized ratably over the following twelve-month period since the customer receives and consumes the benefit as Nasdaq provides the service. We also offered broker services to financial participants in the Nordic market primarily offering back office technology solutions. Revenues from broker services are based on a fixed basic fee for licensing, maintenance and support and development, and an incremental fee depending on the number of transactions. Broker services revenues were generally billed and recognized monthly. As previously disclosed, in January 2020, we commenced an orderly wind-down of this broker services business. The wind-down was completed in the second quarter of 2022.
Market Technology
Market technology revenues primarily consist of SaaS revenues, software, license and support revenues, and change request revenues.
We enter into long-term contracts with customers to develop customized technology solutions, license the right to use software, and provide support and other services to our customers. We also enter into agreements to modify the system solutions sold by Nasdaq after delivery has occurred. In addition, we enter into subscription agreements which allow customers to connect to our servers to access our software.
Our long-term contracts with customers to develop customized technology solutions, license the right to use software and provide support and other services to our customers have multiple performance obligations. The performance obligations are generally: (i) software license and installation service and (ii) software support. We have determined that the software license and installation service are not distinct as the license and the customized installation service are inputs to produce the combined output, a functional and integrated software system.
F-16
For contracts with multiple performance obligations, we allocate the contract transaction price to each performance obligation using our best estimate of the standalone selling price of each distinct good or service in the contract. In instances where standalone selling price is not directly observable, such as when we do not sell the product or service separately, we determine the standalone selling price predominantly through an expected cost plus a margin approach. For the years ended December 31, 2022, 2021 and 2020 we recognized revenues of $75 million, $77 million and $90 million, respectively, related to the contracts described above.
Contract modifications are routine in the performance of our contracts. Contracts are often modified to account for changes in contract specifications or requirements. In most instances, contract modifications are for goods and services that are not distinct, and, therefore, are accounted for as part of the existing contract.
For our long-term contracts, payments are generally made throughout the contract life and can be dependent on either reaching certain milestones or paid upfront in advance of the service period depending on the stage of the contract. For subscription agreements, contract payment terms can be quarterly, annually or monthly, in advance. For all other contracts, payment terms vary.
We generally recognize revenue over time as our customers simultaneously receive and consume the benefits provided by our performance because our customer controls the asset for which we are creating, our performance does not create an asset with alternative use, and we have a right to payment for performance completed to date. For these services, we recognize revenue over time using costs incurred to date relative to total estimated costs at completion to measure progress toward satisfying our performance obligation. Incurred costs represent work performed, which corresponds with, and thereby depicts, the transfer of control to the customer. Contract costs generally include labor and direct overhead. For software support and update services, and for subscription agreements which allow customers to connect to our servers to access our software, we generally recognize revenue ratably over the service period beginning on the date our service is made available to the customer since the customer receives and consumes the benefit consistently over the period as Nasdaq provides the services.
Accounting for our long-term contracts requires judgment relative to assessing risks and their impact on the estimate of revenues and costs. Our estimates are impacted by factors such as the potential for schedule and technical issues, productivity, and the complexity of work performed. When adjustments in estimated total contract costs are required, any changes in the estimated revenues from prior estimates are recognized in the current period for the effect of such change. If estimates of total costs to be incurred on a contract exceed estimates of total revenues, a provision for the entire estimated loss on the contract is recorded in the period in which the loss is determined.
Capital Access Platforms
Data and Listings
Data revenues are earned from U.S. and European proprietary data products. We earn revenues primarily based on the number of data subscribers and distributors of our data. Data revenues are subscription-based and are recognized on a monthly basis.
Listing services revenues primarily include initial listing fees and annual renewal fees. Under Topic 606, the initial listing fee is allocated to multiple performance obligations including initial and subsequent listing services and corporate solutions products (when a company qualifies to receive certain complimentary IPO products under the applicable Nasdaq rule), as well as a customer's material right to renew the option to list on our exchanges. In performing this allocation, the standalone selling price of the performance obligations is based on the initial and annual listing fees and the standalone selling price of the IPO complimentary services is based on its market value. All listing fees are billed upfront and the identified performance obligations are satisfied over time since the customer receives and consumes the benefit as Nasdaq provides the listing service. The amount of revenue related to IPO complimentary services performance obligation is recognized ratably over a three-year period, which is based on contract terms, with the remaining revenue recognized ratably over six years which is based on our historical listing experience and projected future listing duration.
In the U.S., annual renewal fees are charged to listed companies based on their number of outstanding shares at the end of the prior year and are recognized ratably over the following twelve-month period since the customer receives and consumes the benefit as Nasdaq provides the service. Annual fees are charged to newly listed companies on a pro-rata basis, based on outstanding shares at the time of listing and recognized over the remainder of the year. European annual renewal fees, which are received from companies listed on our Nasdaq Nordic and Nasdaq Baltic exchanges and Nasdaq First North, are directly related to the listed companies’ market capitalization on a trailing twelve-month basis and are recognized ratably over the following twelve-month period since the customer receives and consumes the benefit as Nasdaq provides the service.
F-17
Index
We develop and license Nasdaq-branded indexes and financial products. We also provide index data products and custom calculation services for third-party clients. Revenues primarily include license fees from these branded indexes and financial products in the U.S. and abroad. We primarily have two types of license agreements: transaction-based licenses and asset-based licenses. Transaction-based licenses are generally renewable agreements. Customers are charged based on transaction volume or a minimum contract amount, or both. If a customer is charged based on transaction volume, we recognize revenue when the transaction occurs. If a customer is charged based on a minimum contract amount, we recognize revenue on a pro-rata basis over the licensing term since the customer receives and consumes the benefit as Nasdaq provides the service. Asset-based licenses are also generally renewable agreements. Customers are charged based on a percentage of AUM for licensed products, per the agreement, on a monthly or quarterly basis. These revenues are recognized over the term of the license agreement since the customer receives and consumes the benefit as Nasdaq provides the service. Revenue from index data subscriptions are recognized on a monthly basis.
Workflow & Insights
Analytics revenues are earned from investment content and analytics products. We earn revenues primarily based on the number of content and analytics subscribers and distributors.
Subscription agreements are generally one to three years in term, payable in advance, and provide for automatic renewal. Subscription-based revenues are recognized over time on a ratable basis over the contract period beginning on the date that our service is made available to the customer since the customer receives and consumes the benefit as Nasdaq provides the service.
Our corporate solutions business includes our Investor Relations Intelligence, ESG Services and Governance Solutions businesses, which serve both public and private companies and organizations.
Corporate solutions revenues primarily include subscription and transaction-based income from our investor relations intelligence and governance solutions products and services. Subscription-based revenues earned are recognized over time on a ratable basis over the contract period beginning on the date that our service is made available to the customer since the customer receives and consumes the benefit as Nasdaq provides the service. Generally, fees are billed in advance and the contract provides for automatic renewal. As part of subscription agreements, customers can also be charged usage fees based upon actual usage of the services provided. Revenues from usage fees are recognized at a point in time when the service is provided.
Anti-Financial Crime
Anti-Financial Crime revenues primarily consist of SaaS revenues. We enter into subscription agreements which allow customers access to our cloud platform, or in the case of certain surveillance customers, a connection to our servers to access the software. Subscription agreements are generally three years in term, payable in advance, with the option of automatic renewal for some products. Subscription-based revenues are recognized over time on a ratable basis over the contract period beginning on the date that our service is made available to the customer since the customer receives and consumes the benefit as Nasdaq provides the service.
Other Revenues
Other revenues include revenues related to our Nordic broker services business for which we completed the wind-down in June 2022, as well as revenues associated with our U.S. Fixed Income business, which was sold in June 2021. Prior to the closing of the transaction, these revenues were included in our Market Platforms and Capital Access Platforms segments. See “2021 Divestiture,” of Note 4, “Acquisitions and Divestiture,” to the consolidated financial statements for further discussion of this divestiture. Additionally, for the years ended December 31, 2021 and 2020, other revenues include revenues associated with the NPM business which we contributed in July 2021 to a standalone, independent company, of which we own the largest minority interest, together with a consortium of third-party financial institutions. Prior to July 2021, these revenues were included in our Capital Access Platforms segment. For the twelve months ended December 31, 2022, other revenues also include a transitional services agreement associated with a divested business.
Earnings Per Share
We present both basic and diluted earnings per share. Basic earnings per share is computed by dividing net income attributable to Nasdaq by the weighted-average number of common shares outstanding for the period. Diluted earnings per share is computed by dividing net income attributable to Nasdaq by the weighted-average number of common shares and common share equivalents outstanding during the period and reflects the assumed conversion of all dilutive securities, which primarily consist of restricted stock, PSUs, and employee stock options. Common share equivalents are excluded from the computation in periods for which they have an anti-dilutive effect. Stock options for which the exercise price exceeds the average market price over the period are anti-dilutive and, accordingly, are excluded from the calculation. Shares which are considered contingently issuable are included in the computation of dilutive earnings per share on a weighted average basis when management determines the applicable performance criteria would have been met if the performance period ended as of the date of the relevant computation. See Note 13, “Earnings Per Share,” for further discussion.
F-18
Pension and Post-Retirement Benefits
Pension and other post-retirement benefit plan information for financial reporting purposes is developed using actuarial valuations. We assess our pension and other post-retirement benefit plan assumptions on a regular basis. In evaluating these assumptions, we consider many factors, including evaluation of the discount rate, expected rate of return on plan assets, mortality rate, healthcare cost trend rate, retirement age assumption, our historical assumptions compared with actual results and analysis of current market conditions and asset allocations. See Note 10, “Retirement Plans,” for further discussion.
Discount rates used for pension and other post-retirement benefit plan calculations are evaluated annually and modified to reflect the prevailing market rates at the measurement date of a high-quality fixed-income debt instrument portfolio that would provide the future cash flows needed to pay the benefits included in the benefit obligations as they come due. Actuarial assumptions are based upon management’s best estimates and judgment.
The expected rate of return on plan assets for our U.S. pension plans represents our long-term assessment of return expectations which may change based on significant shifts in economic and financial market conditions. The long-term rate of return on plan assets is derived from return assumptions based on targeted allocations for various asset classes. While we consider the pension plans’ recent performance and other economic growth and inflation factors, which are supported by long-term historical data, the return expectations for the targeted asset categories represent a long-term prospective return.
Share-Based Compensation
Nasdaq uses the fair value method of accounting for share-based awards. Share-based awards, or equity awards, include restricted stock, PSUs, and stock options. The fair value of restricted stock awards and PSUs, other than PSUs granted with market conditions, is determined based on the grant date closing stock price less the present value of future cash dividends. We estimate the fair value of PSUs granted with market conditions using a Monte Carlo simulation model at the date of grant. The fair value of stock options are estimated using the Black-Scholes option-pricing model.
We generally recognize compensation expense for equity awards on a straight-line basis over the requisite service period of the award, taking into account an estimated forfeiture rate. Granted but unvested shares are generally forfeited upon termination of employment.
Excess tax benefits or expense related to employee share-based payments, if any, are recognized as income tax benefit or expense in the Consolidated Statements of Income when the awards vest or are settled.
Nasdaq also has an ESPP that allows eligible employees to purchase a limited number of shares of our common stock at six-month intervals, called offering periods, at 85.0% of the lower of the fair market value on the first or the last day of each offering period. The 15.0% discount given to our employees is included in compensation and benefits expense in the Consolidated Statements of Income.
See Note 11, “Share-Based Compensation,” for further discussion of our share-based compensation plans.
Merger and Strategic Initiatives
We incur incremental direct merger and strategic initiative costs relating to various completed and potential acquisitions, divestitures, and other strategic opportunities. These costs generally include integration costs, as well as legal, due diligence and other third-party transaction costs.
Fair Value Measurements
Fair value is defined as the price that would be received from selling an asset or paid to transfer a liability, or the exit price, in an orderly transaction between market participants at the measurement date. When determining the fair value measurements for assets and liabilities required or permitted to be either recorded or disclosed at fair value, we consider the principal or most advantageous market in which we would transact, and we also consider assumptions that market participants would use when pricing the asset or liability. Fair value measurement establishes a hierarchy of valuation techniques based on whether the inputs to those valuation techniques are observable or unobservable. Observable inputs reflect market data obtained from independent sources, while unobservable inputs reflect Nasdaq’s market assumptions. These two types of inputs create the following fair value hierarchy:
•Level 1 - Quoted prices for identical instruments in active markets.
•Level 2 - Quoted prices for similar instruments in active markets; quoted prices for identical or similar instruments in markets that are not active; and model-derived valuations whose inputs are observable or whose significant value drivers are observable.
•Level 3 - Instruments whose significant value drivers are unobservable.
This hierarchy requires the use of observable market data when available.
See Note 14, “Fair Value of Financial Instruments,” for further discussion.
F-19
Tax Matters
We use the asset and liability method to determine income taxes on all transactions recorded in the consolidated financial statements. Deferred tax assets (net of valuation allowances) and deferred tax liabilities are presented net by jurisdiction as either a non-current asset or liability in our Consolidated Balance Sheets, as appropriate. Deferred tax assets and liabilities are determined based on differences between the financial statement carrying amounts and the tax basis of existing assets and liabilities (i.e., temporary differences) and are measured at the enacted rates that will be in effect when these differences are realized. If necessary, a valuation allowance is established to reduce deferred tax assets to the amount that is more likely than not to be realized.
In order to recognize and measure our unrecognized tax benefits, management determines whether a tax position is more likely than not to be sustained upon examination, including resolution of any related appeals or litigation processes, based on the technical merits of the position. Once it is determined that a position meets the recognition thresholds, the position is measured to determine the amount of benefit to be recognized in the consolidated financial statements. Interest and/or penalties related to income tax matters are recognized in income tax expense.
Stock Split Effected in the Form of a Stock Dividend
On August 26, 2022, we effected a 3-for-1 stock split of the Company's common stock in the form of a stock dividend to shareholders of record as of August 12, 2022. The par value per share of our common stock remains $0.01 per share. All references made with respect to a number of shares or per share amounts throughout this Annual Report on Form 10-K have been retroactively adjusted to reflect the stock split.
Subsequent Events
We have evaluated subsequent events through the issuance date of this Annual Report on Form 10-K.
3. REVENUE FROM CONTRACTS WITH CUSTOMERS
Disaggregation of Revenue
The following tables summarize the disaggregation of revenue by major product and service and by segment for the years ended December 31, 2022, 2021 and 2020:
| Year Ended December 31, | |||||||||||||||||
| 2022 | 2021 | 2020 | |||||||||||||||
| (in millions) | |||||||||||||||||
| Market Platforms | |||||||||||||||||
| Trading Services, net | $ | 1,019 | $ | 1,037 | $ | 932 | |||||||||||
| Marketplace Technology | 562 | 545 | 525 | ||||||||||||||
| Capital Access Platforms | |||||||||||||||||
| Data & Listing Services | 729 | 680 | 574 | ||||||||||||||
| Index | 486 | 459 | 324 | ||||||||||||||
| Workflow & Insights | 469 | 429 | 389 | ||||||||||||||
| Anti-Financial Crime | 306 | 231 | 116 | ||||||||||||||
| Other revenues | 11 | 39 | 43 | ||||||||||||||
| Revenues less transaction-based expenses | $ | 3,582 | $ | 3,420 | $ | 2,903 | |||||||||||
Substantially all revenues from the Capital Access Platforms and Anti-Financial Crime segments as well as our Marketplace Technology business were recognized over time for the years ended December 31, 2022, 2021 and 2020. For the years ended December 31, 2022, 2021 and 2020 approximately 93.1%, 93.6%, and 94.8% respectively, of Trading Services revenues were recognized at a point in time and 6.9%, 6.4% and 5.2%, respectively, were recognized over time.
Contract Balances
Substantially all of our revenues are considered to be revenues from contracts with customers. The related accounts receivable balances are recorded in our Consolidated Balance Sheets as receivables, which are net of allowance for doubtful accounts of $15 million as of December 31, 2022 and $17 million as of December 31, 2021. The changes in the balance between periods were immaterial. We do not have obligations for warranties, returns or refunds to customers.
For the majority of our contracts with customers, except for our market technology and listing services contracts, our performance obligations range from three months to three years and there is no significant variable consideration.
F-20
Deferred revenue is the only significant contract asset or liability as of December 31, 2022. Deferred revenue represents consideration received that is yet to be recognized as revenue for unsatisfied performance obligations. Deferred revenue primarily represents our contract liabilities related to our fees for Annual and Initial Listings, Workflow & Insights, Market Technology and Anti-Financial Crime contracts. See Note 8, “Deferred Revenue,” for our discussion on deferred revenue balances, activity, and expected timing of recognition.
We do not have a material amount of revenue recognized from performance obligations that were satisfied in prior periods. We do not provide disclosures about transaction price allocated to unsatisfied performance obligations if contract durations are less than one year. For our initial listings, the transaction price allocated to remaining performance obligations is included in deferred revenue. For our Market Technology, Anti-Financial Crime, and Workflow & Insights contracts, the portion of transaction price allocated to unsatisfied performance obligations is presented in the table below. To the extent consideration has been received, unsatisfied performance obligations would be included in the table below as well as deferred revenue.
The following table summarizes the amount of the transaction price allocated to performance obligations that are unsatisfied, for contract durations greater than one year, as of December 31, 2022:
| Market Technology | Anti-Financial Crime | Workflow & Insights | Total | ||||||||||||||||||||
| (in millions) | |||||||||||||||||||||||
| 2023 | $ | 193 | $ | 382 | $ | 137 | $ | 712 | |||||||||||||||
| 2024 | 155 | 214 | 79 | 448 | |||||||||||||||||||
| 2025 | 127 | 90 | 30 | 247 | |||||||||||||||||||
| 2026 | 92 | 27 | 11 | 130 | |||||||||||||||||||
| 2027 | 54 | 10 | 8 | 72 | |||||||||||||||||||
| 2028+ | 72 | 6 | — | 78 | |||||||||||||||||||
| Total | $ | 693 | $ | 729 | $ | 265 | $ | 1,687 | |||||||||||||||
4. ACQUISITIONS AND DIVESTITURE
We completed the following acquisitions and divestiture in 2022 and 2021. Financial results of each transaction are included in our consolidated financial statements from the date of each acquisition.
2022 Acquisition
In June 2022, we acquired Metrio, a provider of ESG data collection, analytics and reporting services based in Montreal, Canada. We plan to integrate Metrio’s SaaS platform into our suite of ESG solutions. Metrio is part of our Workflow & Insight business in our Capital Access Platforms segment.
2021 Divestiture
In June 2021, we sold our U.S. Fixed Income business, which was part of our FICC business within our Market Platforms segment, to Tradeweb Markets Inc. We recognized a pre-tax gain on the sale of $84 million, net of disposal costs. The pre-tax gain was included in net gain on divestiture of business in the Consolidated Statements of Income.
In connection with this sale, we issued approximately 6.2 million shares of Nasdaq common stock. Nasdaq used the proceeds from the sale, available tax benefits and working and clearing capital of this business, as well as other sources of cash, to repurchase shares of Nasdaq common stock to reduce the impact on earnings per share dilution from the sale. To facilitate these repurchases, in June 2021, the board of directors authorized an increase to the share repurchase program. These share repurchases were completed during the second quarter of 2022. See “Share Repurchase Program,” of Note 12, “Nasdaq Stockholders' Equity,” for further discussion.
2021 Acquisition
Acquisition of Verafin
In February 2021, we completed the acquisition of Verafin, a SaaS technology provider of anti-financial crime management solutions that provides a cloud-based platform to help detect, investigate, and report money laundering and fraud, for an aggregate purchase price of $2.75 billion, subject to certain adjustments. The $2.75 billion purchase price included a cash payment of $102 million, reflected in cash from operating activities in our Consolidated Statements of Cash Flows, the release of which was subject to certain employment-related conditions following the closing of the transaction. During the fourth quarter of 2022, the parties to the transaction agreed that the remaining amount of the $102 million initial cash payment not yet paid would be accelerated and paid to the eligible former Verafin employees. The remaining expense was recorded as merger and strategic initiatives expense. Verafin is part of our Anti-Financial Crime segment.
The amounts in the table below represent the final allocation of the purchase price. The allocation of the purchase price was subject to revision during the measurement period, a period not to exceed 12 months from the acquisition date. Adjustments to the provisional values, which may include tax and other estimates, during the measurement period are recorded in the reporting period in which the adjustment amounts are determined. In 2021, we recorded a measurement period adjustment of $9 million. This adjustment resulted in an increase to both total net liabilities acquired and goodwill. This adjustment did not result in an impact to our Consolidated Statements of Income. The allocation of the purchase price for Verafin was finalized in the first quarter of 2022.
F-21
| (in millions) | ||||||||
| Goodwill | $ | 1,882 | ||||||
| Acquired Intangible Assets | 815 | |||||||
| Total Net Liabilities Acquired | (46) | |||||||
| Purchase Consideration | $ | 2,651 | ||||||
Intangible Assets
The following table presents the details of acquired intangible assets for Verafin at the date of acquisition. Acquired intangible assets with finite lives are amortized using the straight-line method.
Customer Relationships | Technology | Trade Name | Total Acquired Intangible Assets | |||||||||||
| Intangible asset value (in millions) | $ | 532 | $ | 246 | $ | 37 | $ | 815 | ||||||
| Discount rate used | 7.5 | % | 7.5 | % | 7.5 | % | ||||||||
| Estimated average useful life | 22 years | 7 years | 20 years | |||||||||||
Customer Relationships
Customer relationships represent the non-contractual and contractual relationships with customers.
Methodology
Customer relationships were valued using the income approach, specifically an excess earnings method. The excess earnings method examines the economic returns contributed by the identified tangible and intangible assets of a company, and then isolates the excess return that is attributable to the intangible asset being valued.
Discount Rate
The discount rate used reflects the amount of risk associated with the hypothetical cash flows for the customer relationships relative to the overall business. In developing a discount rate for the customer relationships, we estimated a weighted-average cost of capital for the overall business and we utilized this rate as an input when discounting the cash flows. The resulting discounted cash flows were then tax-effected at the applicable statutory rate.
For our acquisition of Verafin, a discounted tax amortization benefit was added to the fair value of the assets under the assumption that the customer relationships would be amortized for tax purposes over a period of 20 years.
Estimated Useful Life
We estimate the useful life based on the historical behavior of the customers and a parallel analysis of the customers using the excess earnings method.
Technology
As part of our acquisition of Verafin, we acquired developed technology.
Methodology
The developed technology was valued using the income approach, specifically the relief-from-royalty method, or RFRM. The RFRM is used to estimate the cost savings that accrue to the owner of an intangible asset who would otherwise have to pay royalties or license fees on revenues earned through the use of the asset. The royalty rate is applied to the projected revenue over the expected remaining life of the intangible asset to estimate royalty savings. The net after-tax royalty savings are calculated for each year in the remaining economic life of the technology and discounted to present value.
Discount Rate
The discount rate used reflects the amount of risk associated with the hypothetical cash flows for the developed technology relative to the overall business as discussed above in “Customer Relationships.”
Estimated Useful Life
We have estimated the useful life of the Verafin technology to be 7 years.
Trade Name
As part of our acquisition of Verafin, we acquired a trade name. The trade name is recognized in the industry and carries a reputation for quality. As such, the reputation and positive recognition embodied in the trade name is a valuable asset to Nasdaq.
Methodology
The Verafin trade name was valued using the income approach, specifically the RFRM as discussed above in “Technology.”
Discount Rate
The discount rate used reflects the amount of risk associated with the hypothetical cash flows for the trade name relative to the overall business as discussed above in “Customer Relationships.”
Estimated Useful Life
We have estimated the useful life of the Verafin trade name to be 20 years and our intention is to continue to use it in the branding of products.
Pro Forma Results and Acquisition-Related Costs
The consolidated financial statements for the years ended December 31, 2022, 2021 and 2020 include the financial results of the above acquisitions from the date of the acquisitions. Pro forma financial results have not been presented since these acquisitions were not material to our financial results.
Acquisition-related costs for the transactions described above were expensed as incurred and are included in merger and strategic initiatives expense in the Consolidated Statements of Income.
F-22
5. GOODWILL AND ACQUIRED INTANGIBLE ASSETS
Goodwill
The following table presents the changes in goodwill by business segment during the year ended December 31, 2022:
| (in millions) | |||||
| Market Platforms | |||||
| Balance at December 31, 2021 | $ | 3,129 | |||
| Foreign currency translation adjustments | (217) | ||||
| Balance at December 31, 2022 | $ | 2,912 | |||
| Capital Access Platforms | |||||
| Balance at December 31, 2021 | $ | 4,292 | |||
| Goodwill acquired | 40 | ||||
| Foreign currency translation and other adjustments | (154) | ||||
| Balance at December 31, 2022 | $ | 4,178 | |||
| Anti-Financial Crime | |||||
| Balance at December 31, 2021 | $ | 1,012 | |||
| Foreign currency translation adjustments | (3) | ||||
| Balance at December 31, 2022 | $ | 1,009 | |||
| Total | |||||
| Balance at December 31, 2021 | $ | 8,433 | |||
| Balance at Goodwill acquired | 40 | ||||
| Foreign currency translation adjustments | (374) | ||||
| Balance at December 31, 2022 | $ | 8,099 | |||
As of December 31, 2022, the amount of goodwill that is expected to be deductible for tax purposes in future periods is $35 million.
Goodwill represents the excess of purchase price over the value assigned to the net assets, including identifiable intangible assets, of a business acquired. Goodwill is allocated to our reporting units based on the assignment of the fair values of each reporting unit of the acquired company. We test goodwill for impairment at the reporting unit level annually, or in interim periods if certain events occur indicating that the carrying amount may be impaired, such as changes in the business climate, poor indicators of operating performance or the sale or disposition of a significant portion of a reporting unit. There was no impairment of goodwill for the years ended December 31, 2022, 2021 and 2020; however, events such as prolonged economic weakness or unexpected significant declines in operating results of any of our reporting units or businesses, may result in goodwill impairment charges in the future.
AcquiredIntangible Assets
The following table presents details of our total acquired intangible assets, both finite- and indefinite-lived:
| December 31, 2022 | December 31, 2021 | ||||||||||||||||||||||||||||||||||||||||
| Finite-Lived Intangible Assets | (in millions) | ||||||||||||||||||||||||||||||||||||||||
| Gross Amount | |||||||||||||||||||||||||||||||||||||||||
| Technology | $ | 304 | $ | 295 | |||||||||||||||||||||||||||||||||||||
| Customer relationships | 2,005 | 2,050 | |||||||||||||||||||||||||||||||||||||||
| Trade names and other | 60 | 60 | |||||||||||||||||||||||||||||||||||||||
| Foreign currency translation adjustment | (209) | (143) | |||||||||||||||||||||||||||||||||||||||
| Total gross amount | $ | 2,160 | $ | 2,262 | |||||||||||||||||||||||||||||||||||||
| Accumulated Amortization | |||||||||||||||||||||||||||||||||||||||||
| Technology | $ | (97) | $ | (54) | |||||||||||||||||||||||||||||||||||||
| Customer relationships | (778) | (711) | |||||||||||||||||||||||||||||||||||||||
| Trade names and other | (17) | (11) | |||||||||||||||||||||||||||||||||||||||
| Foreign currency translation adjustment | 120 | 81 | |||||||||||||||||||||||||||||||||||||||
| Total accumulated amortization | $ | (772) | $ | (695) | |||||||||||||||||||||||||||||||||||||
| Net Amount | |||||||||||||||||||||||||||||||||||||||||
| Technology | $ | 207 | $ | 241 | |||||||||||||||||||||||||||||||||||||
| Customer relationships | 1,227 | 1,339 | |||||||||||||||||||||||||||||||||||||||
| Trade names and other | 43 | 49 | |||||||||||||||||||||||||||||||||||||||
| Foreign currency translation adjustment | (89) | (62) | |||||||||||||||||||||||||||||||||||||||
| Total finite-lived intangible assets | $ | 1,388 | $ | 1,567 | |||||||||||||||||||||||||||||||||||||
| Indefinite-Lived Intangible Assets | |||||||||||||||||||||||||||||||||||||||||
| Exchange and clearing registrations | $ | 1,257 | $ | 1,257 | |||||||||||||||||||||||||||||||||||||
| Trade names | 121 | 121 | |||||||||||||||||||||||||||||||||||||||
| Licenses | 52 | 52 | |||||||||||||||||||||||||||||||||||||||
| Foreign currency translation adjustment | (237) | (184) | |||||||||||||||||||||||||||||||||||||||
| Total indefinite-lived intangible assets | $ | 1,193 | $ | 1,246 | |||||||||||||||||||||||||||||||||||||
| Total intangible assets, net | $ | 2,581 | $ | 2,813 | |||||||||||||||||||||||||||||||||||||
There was no impairment of indefinite-lived intangible assets for the years ended December 31, 2022, 2021 and 2020. We recorded an impairment charge of $14 million in 2021 related to a finite-lived intangible asset for customer relationships associated with the wind down of a previous acquisition included in depreciation and amortization expense in the Consolidated Statements of Income. There were no material finite-lived impairment charges in 2022 and 2020.
F-23
The following table presents our amortization expense for acquired finite-lived intangible assets:
| Year Ended December 31, | |||||||||||||||||
| 2022 | 2021 | 2020 | |||||||||||||||
| (in millions) | |||||||||||||||||
| Amortization expense | $ | 153 | $ | 170 | $ | 103 | |||||||||||
The table below presents the estimated future amortization expense (excluding the impact of foreign currency translation adjustments of $89 million as of December 31, 2022) of acquired finite-lived intangible assets as of December 31, 2022:
| (in millions) | |||||
| 2023 | $ | 159 | |||
| 2024 | 153 | ||||
| 2025 | 151 | ||||
| 2026 | 148 | ||||
| 2027 | 147 | ||||
| 2028+ | 719 | ||||
| Total | $ | 1,477 | |||
6. INVESTMENTS
The following table presents the details of our investments:
| December 31, 2022 | December 31, 2021 | ||||||||||
| (in millions) | |||||||||||
| Financial investments | $ | 181 | $ | 208 | |||||||
| Equity method investments | 390 | 363 | |||||||||
| Equity securities | 86 | 67 | |||||||||
Financial Investments
Financial investments are comprised of trading securities, primarily highly rated European government debt securities, of which $161 million as of December 31, 2022 and $162 million as of December 31, 2021, are assets primarily utilized to meet regulatory capital requirements, mainly for our clearing operations at Nasdaq Clearing.
Equity Method Investments
We record our estimated pro-rata share of earnings or losses each reporting period and record any dividends as a reduction in the investment balance. As of December 31, 2022 and 2021, our equity method investments primarily included our 40.0% equity interestsinterest in OCC and EuroCCP N.V.OCC.
The carrying amounts of our equity method investments are included in other non-current assets in the Consolidated Balance Sheets. No impairments were recorded for the years end December 31, 2022, 2021 and 2020.
Net income recognized from our equity interest in the earnings and losses of these equity method investments, primarily OCC, was $15$31 million, $52 million and $70 million for the years ended December 31, 2022, 2021 and 2020, respectively. For the year ended December 31, 2017, $2 million for the year ended December 31, 2016 and $17 million for the year ended December 31, 2015. The change2022, lower equity interest in the year ended December 31, 2017earnings of OCC, as compared withto 2021, was primarily driven by a reduction in the same period in 2016 relates to our additional 20.0% ownership interest inclearing fee rate that OCC which we acquired in connection with our acquisition of ISE in June 2016, bringing our total ownership interest in OCC to 40.0%,charges its customers, partially offset by $2 million of wind down costs associated with an equity method investment that was previously written off. The change in the year ended December 31, 2016 compared with the same period in 2015 is primarily due to income recognized
Equity Securities
The carrying amounts of our cost method investmentsequity securities are included in other non-current assets in the Consolidated Balance Sheets. We elected the measurement alternative for substantially all of our equity securities as they do not have a readily determinable fair value. No material adjustments were made to the carrying value of our equity securities for the years ended December 31, 2022, 2021 and 2020. As of December 31, 20172022 and December 31, 2016,2021, our cost methodequity securities primarily represent various strategic investments primarily representedmade through our 5% ownership interest in Borsa İstanbul, and our 5% ownership interest in LCH.Clearnet Group Limited. corporate venture program as well as investments acquired through various acquisitions.
The following table presents our major categories of property and equipment, net:
| Year Ended December 31, | Year Ended December 31, | |||||||||||||||||
| 2017 | 2016 | 2022 | 2021 | |||||||||||||||
| (in millions) | (in millions) | |||||||||||||||||
| Data processing equipment and software | $ | 626 | $ | 665 | Data processing equipment and software | $ | 786 | $ | 735 | |||||||||
| Furniture, equipment and leasehold improvements | 279 | 254 | Furniture, equipment and leasehold improvements | 305 | 288 | |||||||||||||
| Total property and equipment | 905 | 919 | Total property and equipment | 1,091 | 1,023 | |||||||||||||
| Less: accumulated depreciation and amortization | (505 | ) | (557 | ) | ||||||||||||||
| Less: accumulated depreciation and amortization and impairment charges | Less: accumulated depreciation and amortization and impairment charges | (559) | (514) | |||||||||||||||
| Total property and equipment, net | $ | 400 | $ | 362 | Total property and equipment, net | $ | 532 | $ | 509 | |||||||||
Depreciation and amortization expense for property and equipment was $96$105 million for the year ended December 31, 2017, $882022, $108 million for the year ended December 31, 20162021, and $76$99 million for the year ended December 31, 2015. The increase in depreciation and amortization expense in 2017 and 2016 was primarily due to additional expense associated with assets and
We recorded pre-tax, non-cash property and equipment asset impairment charges of $9 million for the year ended December 31, 2017, $8 million for the year ended December 31, 2016 and $18 million for the year ended December 31, 2015. The asset impairment charge in 2017 primarily related to the write-off of capitalized software and hardware equipment associated with our 2017 and 2016 acquisitions and is included in merger and strategic initiatives expense in the Consolidated Statements of Income. The asset
As of December 31, 20172022 and 2016,2021, we did not own any real estate properties.
F-24
8. DEFERRED REVENUE
Deferred revenue represents consideration received that is yet to be recognized as revenue. The changes in our deferred revenue during the year ended December 31, 2017 and 20162022 are reflected in the following table:
Balance at December 31, 2021 | Additions | Revenue Recognized | Adjustments | Balance at December 31, 2022 | |||||||||||||||||||||||||||||||||||||
| (in millions) | |||||||||||||||||||||||||||||||||||||||||
| Market Platforms: | |||||||||||||||||||||||||||||||||||||||||
| Market Technology | $ | 36 | $ | 28 | $ | (30) | $ | (5) | $ | 29 | |||||||||||||||||||||||||||||||
| Capital Access Platforms: | |||||||||||||||||||||||||||||||||||||||||
| Initial Listing | 145 | 25 | (51) | (3) | 116 | ||||||||||||||||||||||||||||||||||||
| Annual Listings | 2 | 3 | (2) | (1) | 2 | ||||||||||||||||||||||||||||||||||||
| Workflow & Insights | 159 | 166 | (152) | (1) | 172 | ||||||||||||||||||||||||||||||||||||
| Anti-Financial Crime | 81 | 106 | (79) | — | 108 | ||||||||||||||||||||||||||||||||||||
| Other | 25 | 12 | (13) | (3) | 21 | ||||||||||||||||||||||||||||||||||||
| Total | $ | 448 | $ | 340 | $ | (327) | $ | (13) | $ | 448 | |||||||||||||||||||||||||||||||
| Initial Listing Revenues | Listing of Additional Shares Revenues | Annual Renewal and Other Revenues | Market Technology Revenues | Total | |||||||||||||||
| (in millions) | |||||||||||||||||||
| Balance at January 1, 2017 | $ | 54 | $ | 37 | $ | 57 | $ | 185 | $ | 333 | |||||||||
| Additions | 18 | 11 | 569 | 208 | 806 | ||||||||||||||
| Revenue recognized | (17 | ) | (22 | ) | (544 | ) | (240 | ) | (823 | ) | |||||||||
| Translation adjustment | — | — | 1 | 20 | 21 | ||||||||||||||
Deferred revenue reclassified as held for sale(1) | — | — | (2 | ) | — | (2 | ) | ||||||||||||
| Balance at December 31, 2017 | $ | 55 | $ | 26 | $ | 81 | $ | 173 | $ | 335 | |||||||||
| Balance at January 1, 2016 | $ | 59 | $ | 53 | $ | 28 | $ | 187 | $ | 327 | |||||||||
| Additions | 13 | 12 | 606 | 233 | 864 | ||||||||||||||
| Revenue recognized | (18 | ) | (28 | ) | (576 | ) | (227 | ) | (849 | ) | |||||||||
| Translation adjustment | — | — | (1 | ) | (8 | ) | (9 | ) | |||||||||||
| Balance at December 31, 2016 | $ | 54 | $ | 37 | $ | 57 | $ | 185 | $ | 333 | |||||||||
•Adjustments reflect foreign currency translation adjustments.
•Other primarily includes deferred revenue from our Index business, data contracts and non-U.S. listing of additional shares revenues and annual renewal and other revenues primarily reflect revenues fromfees. These fees are included in our Listing Services business within our Corporate ServicesCapital Access Platforms segment.
As of December 31, 2017,2022, we estimate that our deferred revenue which is primarily corporate services and market technology revenues, will be recognized in the following years:
| Initial Listing Revenues | Listing of Additional Shares Revenues | Annual Renewal and Other Revenues | Market Technology Revenues | Total | |||||||||||||||
| (in millions) | |||||||||||||||||||
| Fiscal year ended: | |||||||||||||||||||
| 2018 | $ | 17 | $ | 13 | $ | 79 | $ | 80 | $ | 189 | |||||||||
| 2019 | 15 | 7 | 2 | 35 | 59 | ||||||||||||||
| 2020 | 11 | 5 | — | 33 | 49 | ||||||||||||||
| 2021 | 7 | 1 | — | 15 | 23 | ||||||||||||||
| 2022 | 4 | — | — | 3 | 7 | ||||||||||||||
| 2023 and thereafter | 1 | — | — | 7 | 8 | ||||||||||||||
| $ | 55 | $ | 26 | $ | 81 | $ | 173 | $ | 335 | ||||||||||
Fiscal year ended: | 2023 | 2024 | 2025 | 2026 | 2027 | 2028+ | Total | ||||||||||||||||||||||||||||||||||
| (in millions) | |||||||||||||||||||||||||||||||||||||||||
| Market Platforms: | |||||||||||||||||||||||||||||||||||||||||
| Market Technology | $ | 28 | $ | 1 | $ | — | $ | — | $ | — | $ | — | $ | 29 | |||||||||||||||||||||||||||
| Capital Access Platforms: | |||||||||||||||||||||||||||||||||||||||||
| Initial Listings | 40 | 30 | 20 | 17 | 8 | 1 | 116 | ||||||||||||||||||||||||||||||||||
| Annual Listings | 2 | — | — | — | — | — | 2 | ||||||||||||||||||||||||||||||||||
| Workflow & Insights | 169 | 3 | — | — | — | — | 172 | ||||||||||||||||||||||||||||||||||
| Anti-Financial Crime | 106 | 2 | — | — | — | — | 108 | ||||||||||||||||||||||||||||||||||
| Other | 12 | 5 | 3 | 1 | — | — | 21 | ||||||||||||||||||||||||||||||||||
| Total | $ | 357 | $ | 41 | $ | 23 | $ | 18 | $ | 8 | $ | 1 | $ | 448 | |||||||||||||||||||||||||||
The timing of recognition of our deferred revenue related to certain market technology revenuescontracts is primarily dependent upon the completion of customization and any significant modifications made pursuant to existing market technology contracts. As such, as it relates
to market technology revenues, the timing represents our best estimate.
F-25
9. DEBT OBLIGATIONS
The following table presents the changes in the carrying amount of our debt obligations during the year ended December 31, 2017:2022:
| December 31, 2021 | Additions | Payments, Foreign Currency Translation and Accretion | December 31, 2022 | ||||||||||||||||||||
| (in millions) | |||||||||||||||||||||||
| Short-term debt: | |||||||||||||||||||||||
| Commercial paper | $ | 420 | $ | 3,685 | $ | (3,441) | $ | 664 | |||||||||||||||
| 2022 Notes | 598 | — | (598) | — | |||||||||||||||||||
| 2024 Notes | 499 | — | (499) | — | |||||||||||||||||||
| Total short-term debt | $ | 1,517 | $ | 3,685 | $ | (4,538) | $ | 664 | |||||||||||||||
| Long-term debt - senior unsecured notes: | |||||||||||||||||||||||
| 2026 Notes | 498 | — | — | 498 | |||||||||||||||||||
| 2029 Notes | 676 | — | (39) | 637 | |||||||||||||||||||
| 2030 Notes | 676 | — | (39) | 637 | |||||||||||||||||||
| 2050 Notes | 486 | — | — | 486 | |||||||||||||||||||
| 2031 Notes | 643 | — | 1 | 644 | |||||||||||||||||||
| 2040 Notes | 644 | — | — | 644 | |||||||||||||||||||
| 2033 Notes | 694 | — | (41) | 653 | |||||||||||||||||||
| 2052 Notes | — | 541 | — | 541 | |||||||||||||||||||
| 2022 Credit Facility | (4) | (2) | 1 | (5) | |||||||||||||||||||
| Total long-term debt | $ | 4,313 | $ | 539 | $ | (117) | $ | 4,735 | |||||||||||||||
| Total debt obligations | $ | 5,830 | $ | 4,224 | $ | (4,655) | $ | 5,399 | |||||||||||||||
| December 31, 2016 | Additions | Payments, Accretion and Other | December 31, 2017 | ||||||||||||
| (in millions) | |||||||||||||||
| Short-term debt - commercial paper | $ | — | $ | 2,514 | $ | (2,034 | ) | $ | 480 | ||||||
| Long-term debt: | |||||||||||||||
| 5.55% senior unsecured notes due January 15, 2020 | 598 | — | 1 | 599 | |||||||||||
| 5.25% senior unsecured notes repaid on May 26, 2017 | 369 | — | (369 | ) | — | ||||||||||
| 3.875% senior unsecured notes due June 7, 2021 | 625 | — | 91 | 716 | |||||||||||
| 4.25% senior unsecured notes due June 1, 2024 | 495 | — | 1 | 496 | |||||||||||
| 1.75% senior unsecured notes due May 19, 2023 | 622 | — | 90 | 712 | |||||||||||
| 3.85% senior unsecured notes due June 30, 2026 | 495 | — | 1 | 496 | |||||||||||
| Senior unsecured floating rate notes due March 22, 2019 | — | 498 | — | 498 | |||||||||||
| $400 million senior unsecured term loan facility due November 25, 2019 (average interest rate of 2.47% for the period January 1, 2017 through December 31, 2017) | 399 | — | (299 | ) | 100 | ||||||||||
| $1 billion revolving credit commitment due April 25, 2022 (average interest rate of 2.66% for the period April 25, 2017 through December 31, 2017) | — | 155 | (45 | ) | 110 | ||||||||||
| Total long-term debt | 3,603 | 653 | (529 | ) | 3,727 | ||||||||||
| Total debt obligations | $ | 3,603 | $ | 3,167 | $ | (2,563 | ) | $ | 4,207 | ||||||
The long-term debt senior unsecured notes in the table above, and discussion below, are listed based on their issuance date.
Commercial Paper Program
In May 2017,January 2022, we used a combination of cash on hand and net proceeds from the sale ofissued commercial paper to redeem allpartially fund our ASR agreement. See “ASR Agreement,” of our 2018 Notes.Note 12, “Nasdaq Stockholders' Equity.” In addition, in June 2017,December 2022, we used net proceeds from the sale ofissued commercial paper to repay $300 million of the amount outstanding on the 2016 Credit Facility. See “Early Extinguishment of 2018 Notes”in full and “2016 Credit Facility” below for further discussion.
see “2022 Notes” below. As of December 31, 2017,2022, we had $664 million outstanding under our commercial paper notes in the table above reflect the aggregate principal amount, less the unamortized discount which is being accreted through interest expense over the life of the applicable notes. The original maturities of these notes range from 12 days to 119 days and the weighted-average maturity is 22 days. The weighted-average effective interest rate is 1.70% per annum.program.
Senior Unsecured Notes
Our 2040 Notes were issued at par. All of our other outstanding senior unsecured notes were all issued at a discount. As a result of the discount, the proceeds received from each issuance were less than the aggregate principal amount. As of December 31, 2017,2022, the amounts in the table above reflect the aggregate principal amount, less the unamortized debt discount and the unamortized debt issuance costs, which are being accreted through interest expense over the life of the applicable
Early Extinguishment of 20182024 Notes
In December 2010,May 2014, Nasdaq issued the 2018 Notes. The 20182024 Notes, which paid interest semiannually at a rate of 5.25%4.25% per annum.
In May 2017,April 2022, we redeemed all of our 2018 Notes using a combination of cash on hand andprimarily used the net proceeds from the sale of commercial paper issued through the commercial paper program. See “Commercial Paper Program” above for2052 Notes to repay in full and redeem our 2024 Notes. For further discussion of our commercial paper program.see “2052 Notes” below. In connection with the early extinguishment of the 20182024 Notes, in April 2022 we recorded a pre-tax charge of $9$16 million, which primarily includedincludes a make-whole redemption price premium. This charge is included in general, administrative and other expense in the Consolidated Statements of Income for the year ended December 31, 2017.
In June 2013,2016, Nasdaq issued the 2021 Notes. The 20212026 Notes, which pay interest semi-annually at a rate of 3.85% per annum until June 30, 2026. Such interest rate may vary with Nasdaq’s debt rating, to the extent Nasdaq is downgraded below investment grade, up to a rate not to exceed 5.85%.
2029 Notes
In April 2019, Nasdaq issued the 2029 Notes, which pay interest annually at a rate of 3.875%1.75% per annum until June 7, 2021 and suchMarch 28, 2029. Such interest rate may vary with Nasdaq’s debt rating, to the extent Nasdaq is downgraded below investment grade,up to a rate not to exceed 5.875%3.75%.
F-26
The 20212029 Notes have been designated as a hedge of our net investment in certain foreign subsidiaries to mitigate the foreign exchange risk associated with certain investments in these subsidiaries. The increase decrease in the carrying amount of $91$39 millionnoted in the “Payments, AccretionForeign Currency Translation and Other”Accretion” column in the table above primarily reflects the translationremeasurement of the 20212029 Notes into U.S. dollars and is recorded in accumulated other comprehensive loss within Nasdaq's stockholders’ equity in the Consolidated Balance Sheets as of December 31, 2022.
2030 Notes
In February 2020, Nasdaq issued the 2030 Notes, which pay interest annually at a rate of 0.875% in arrears, which began on February 13, 2021.
The 2030 Notes were designated as a hedge of our net investment in certain foreign subsidiaries to mitigate the foreign exchange risk associated with certain investments in these subsidiaries. The decrease in the carrying amount of $39 million noted in the “Payments, Foreign Currency Translation and Accretion” column in the table above primarily reflects the remeasurement of the 2030 Notes into U.S. dollars and is recorded in accumulated other comprehensive loss within Nasdaq's stockholders’ equity in the Consolidated Balance Sheets as of December 31, 2017.2022.
In May 2014,April 2020, Nasdaq issued the 2024 Notes. The 20242050 Notes, which pay interest semiannuallysemi-annually at a rate of 4.25%3.25% per annum until June 1, 2024 and suchApril 28, 2050. Such rate may vary with Nasdaq’sNasdaq's debt rating, to the extent Nasdaq is downgraded below investment grade, up to a rate not to exceed 6.25%5.25%.
In May 2016,December 2020, Nasdaq issued the 20232022, 2031 and 2040 Notes. WeThe net proceeds were used to partially fund the acquisition of Verafin. For further discussion of the acquisition of Verafin, see “2021 Acquisition,” of Note 4, “Acquisitions and Divestiture.”
2022 Notes
In December 2022, we used the net proceeds from commercial paper to repay, in full, the 20232022 Notes. The 2022 Notes and the 2026paid interest semi-annually in arrears, which began on June 21, 2021.
2031 Notes to fund our acquisition of ISE. See “Acquisition of ISE,” of Note 4, “Acquisitions,” for further discussion of the ISE acquisition.
The 20232031 Notes pay interest annually at asemi-annually in arrears, which began on January 15, 2021. The interest rate of 1.75% per annum until May 19, 2023 and such rate1.650% may vary with Nasdaq’sNasdaq's debt rating, to the extent Nasdaq is downgraded below investment grade, up to a rate not to exceed 3.75%3.65%.
2040 Notes
The 20232040 Notes pay interest semi-annually in arrears, which began on June 21, 2021. The interest rate of 2.500% may vary with Nasdaq's debt rating, to the extent Nasdaq is downgraded below investment grade, up to a rate not to exceed 4.50%.
2033 Notes
In July 2021, Nasdaq issued the 2033 Notes, which pay interest annually in arrears, at a rate of 0.900%, beginning on July 30, 2022.
The 2033 Notes have been designated as a hedge of our net investment in certain foreign subsidiaries to mitigate the foreign exchange rate risk associated with certain investments in these subsidiaries. The increase decrease in the carrying amount of $90$41 millionnoted in the “Payments, AccretionForeign Currency Translation and Other”Accretion” column in the table above primarily reflects the translationremeasurement of the 20232033 Notes into U.S. dollars and is recorded in accumulated other comprehensive loss within Nasdaq stockholders’ equity in the Consolidated Balance Sheets as of December 31, 2017.2022.
In June 2016,March 2022, Nasdaq issued $550 million aggregate principal amount of 3.950% senior notes due in 2052, which pay interest semi-annually in arrears, beginning on September 7, 2022. The interest rate of 3.950% may vary with Nasdaq's debt rating, to the 2026 Notes.extent Nasdaq is downgraded below investment grade, up to a rate not to exceed 5.950%. The net proceeds from the 2052 Notes were $541 million after deducting the underwriting discount and expenses of the offering. We used the net proceeds from the 2023 Notes and the 20262052 Notes to fund our acquisition of ISE. See “Acquisition of ISE,” of Note 4, “Acquisitions,” for further discussionredeem all of the ISE acquisition.
Credit Facilities
2022 Credit Facility
In December 2020, Nasdaq entered into the 2020 Credit Facility, which replaced a former credit facility and consists of a $1.25 billion five-year revolving credit facility (with sublimits for non-dollar borrowings, swingline borrowings and letters of credit). We amended and restated the 2020 Credit Facility in December 2022 with a new maturity date of December 16, 2027. Nasdaq intends to use funds available under the 2022 Credit Facility for general corporate purposes and to provide liquidity support for the repayment of commercial paper issued through the commercial paper program. Nasdaq is permitted to repay borrowings under our 2022 Credit Facility at any time in whole or in part, without penalty.
As of December 31, 2017,2022, no amounts were outstanding on the amounts in the table above reflect the aggregate principal amount, less the2022 Credit Facility. The $(5) million balance represents unamortized debt issuance costs which are being accreted through interest expense over the life of the applicable credit facility. Nasdaq is permitted
F-27
Borrowings under the revolving credit facility and swingline borrowings bear interest on the principal amount outstanding at a variable interest rate based on either the SOFR (or a successor rate to repaySOFR), the base rate (as defined in the 2022 credit agreement), or other applicable rate with respect to non-dollar borrowings, underplus an applicable margin that varies with Nasdaq’s debt rating. We are charged commitment fees of 0.100% to 0.250%, depending on our credit facilities at any timerating, whether or not amounts have been borrowed. These commitment fees are included in whole or in part, without penalty.interest expense and were not material for the years ended December 31, 2022 and 2021.
to financial statements, notice of defaults and certain other material events, maintenance of properties and insurance, and customary events of default, including cross-defaults to our material indebtedness.
Other Credit Facilities
These facilities include customary affirmative and negative operating covenants and events of default.
Debt Covenants
As of December 31, 2017,2022, we were in compliance with the covenants of all of our debt obligations.
10. RETIREMENT PLANS
| Year Ended December 31, | |||||||||||
| 2017 | 2016 | 2015 | |||||||||
| (in millions) | |||||||||||
| Current income taxes: | |||||||||||
| Federal | $ | 51 | $ | 37 | $ | 139 | |||||
| State | 17 | 21 | 42 | ||||||||
| Foreign | 68 | 106 | 36 | ||||||||
| Total current income taxes | 136 | 164 | 217 | ||||||||
| Deferred income taxes: | |||||||||||
| Federal | (14 | ) | (97 | ) | (18 | ) | |||||
| State | 24 | (35 | ) | (1 | ) | ||||||
| Foreign | — | (4 | ) | 5 | |||||||
| Total deferred income taxes | 10 | (136 | ) | (14 | ) | ||||||
| Total income tax provision | $ | 146 | $ | 28 | $ | 203 | |||||
| Year Ended December 31, | ||||||||
| 2017 | 2016 | 2015 | ||||||
| Federal income tax provision at the statutory rate | 35.0 | % | 35.0 | % | 35.0 | % | ||
| State income tax provision, net of federal effect | 2.6 | % | (6.7 | )% | 3.9 | % | ||
| Change in deferred taxes due to change in law | (9.9 | )% | (1.2 | )% | 0.2 | % | ||
| Excess tax benefits related to employee share-based compensation | (4.0 | )% | — | % | — | % | ||
| Non-U.S. subsidiary earnings | (6.0 | )% | (7.3 | )% | (6.4 | )% | ||
| Tax credits and deductions | (1.0 | )% | (5.1 | )% | (0.8 | )% | ||
| Change in unrecognized tax benefits | (0.8 | )% | 4.2 | % | 0.3 | % | ||
| Other, net | 0.7 | % | 1.7 | % | — | % | ||
| Actual income tax provision | 16.6 | % | 20.6 | % | 32.2 | % | ||
| December 31, | |||||||
| 2017 | 2016 | ||||||
| (in millions) | |||||||
| Deferred tax assets: | |||||||
| Deferred revenues | $ | 25 | $ | 39 | |||
| U.S. federal net operating loss | 1 | 2 | |||||
| Foreign net operating loss | 30 | 37 | |||||
| State net operating loss | 4 | 1 | |||||
| Compensation and benefits | 42 | 99 | |||||
| Foreign currency translation | 292 | 528 | |||||
| Tax credits | 7 | 7 | |||||
| Other | 20 | 34 | |||||
| Gross deferred tax assets | $ | 421 | $ | 747 | |||
| Deferred tax liabilities: | |||||||
| Amortization of software development costs and depreciation | $ | (47 | ) | $ | (63 | ) | |
| Amortization of acquired intangible assets | (510 | ) | (596 | ) | |||
| Investments | (26 | ) | (37 | ) | |||
| Other | (19 | ) | (24 | ) | |||
| Gross deferred tax liabilities | (602 | ) | (720 | ) | |||
| Net deferred tax assets before valuation allowance | (181 | ) | 27 | ||||
| Less: valuation allowance | (30 | ) | (30 | ) | |||
| Net deferred tax assets (liabilities) | $ | (211 | ) | $ | (3 | ) | |
| Jurisdiction | Amount | Expiration Date | ||||
| (in millions) | ||||||
| U.S. Federal NOL | $ | 1 | 2033-2035 | |||
| Foreign NOL | 4 | 2018-2026 | ||||
| Foreign NOL | 26 | No expiration date | ||||
| State NOL | 4 | 2025-2036 | ||||
| U.S. Federal Tax credits | 7 | 2018-2027 | ||||
| Year Ended December 31, | |||||||||||
| 2017 | 2016 | 2015 | |||||||||
| (in millions) | |||||||||||
| Domestic | $ | 556 | $ | (155 | ) | $ | 393 | ||||
| Foreign | 324 | 291 | 237 | ||||||||
| Income before income tax provision | $ | 880 | $ | 136 | $ | 630 | |||||
| Year Ended December 31, | |||||||
| 2017 | 2016 | ||||||
| (in millions) | |||||||
| Beginning balance | $ | 48 | $ | 40 | |||
| Additions as a result of tax positions taken in prior periods | 2 | 9 | |||||
| Additions as a result of tax positions taken in the current period | 5 | 3 | |||||
| Reductions related to settlements with taxing authorities | — | (4 | ) | ||||
| Reductions as a result of lapses of the applicable statute of limitations | (10 | ) | — | ||||
| Ending balance | $ | 45 | $ | 48 | |||
Defined Contribution Savings Plan
We sponsor a 401(k) Planplan which is a voluntary defined contribution savings plan, for U.S. employees. Employees are immediately eligible to make contributions to the plan and are also eligible for an employer contribution match at an amount equal to 100.0% of the first 6.0% of eligible employee contributions. Savings plan expense is included in compensation and benefits expense in the Consolidated Statements of Income was $13 million for 2017, $11 million for 2016 and $10 million for 2015. Income:
| Year Ended December 31, | |||||||||||||||||
| 2022 | 2021 | 2020 | |||||||||||||||
| (in millions) | |||||||||||||||||
| Savings Plan expense | $ | 17 | $ | 14 | $ | 14 | |||||||||||
Pension and Supplemental Executive Retirement Plans
We maintain non-contributory, defined-benefit pension plans, non-qualified SERPs for certain senior executives and other post-retirement benefit plans for eligible employees in the U.S., collectively referred to as the Nasdaq Benefit Plans. Our pension plans and SERPs are frozen. Future service and salary for all participants do not count toward an accrual of benefits under the pension plans and SERPs. Most employees outside the U.S. are covered by local retirement plans or by applicable social laws. Benefits under social laws are generally expensed in the periods in which the costs are incurred. The total expense for these plans is included in compensation and benefits expense in the Consolidated Statements of Income and was $21 million in 2017, $23 million in 2016 and $22 million in 2015.Income:
| Year Ended December 31, | |||||||||||||||||
| 2022 | 2021 | 2020 | |||||||||||||||
| (in millions) | |||||||||||||||||
| Retirement Plans expense | $ | 24 | $ | 26 | $ | 23 | |||||||||||
Nasdaq recognizes the funded status of the Nasdaq Benefit Plans, measured as the difference between the fair value of the plan assets and the benefit obligation, in the Consolidated Balance Sheets. The funded status related to
As of December 31, 2022, the Nasdaq Benefit Plansfair value of our U.S. defined-benefit pension plan's assets was $79 million and the benefit obligation was $81 million. As a result, the U.S. defined-benefit pension plan is underfunded by $60$2 million as of December 31, 2017, $592022.
As of December 31, 2021, the fair value of our U.S. defined-benefit pension plan's assets was $111 million and the benefit obligation was $112 million. As a result, the U.S. defined-benefit pension plan was underfunded by $1 million as of December 31, 20162021.
F-28
During 2022 and $642021, we did not make any contributions to our U.S. defined-benefit pension plan. For our SERP and other post-retirement benefit plans, the net underfunded liability was $28 million as of December 31, 20152022 and $34 million as of December 31, 2021. The underfunded liability for the above plans is included in accrued personnel costs and other non-current liabilities in the Consolidated Balance Sheets. The fair value of the plan assets was $79 million as of December 31, 2017 and $74 million as of December 31, 2016 and the benefit obligation was $139 million as of December 31, 2017 and $133 million as of December 31, 2016. The plan assets of the Nasdaq Benefit Plans are invested in securities per target allocations adopted by Nasdaq’s Pension and 401(k) Committee and are primarily invested in equity andcollective fund investments that have underlying investments in fixed income securities,securities. The collective fund investments are valued at net asset value which are primarily categorized as Level 2 in theis a practical expedient to estimate fair value hierarchy.value.
Accumulated Other Comprehensive Loss
As of December 31, 2017,2022, accumulated other comprehensive
loss for the Nasdaq Benefit Plans was $22$23 million reflecting an unrecognized net loss of $37$28 million, partially offset by an income tax benefit of $15$5 million, primarily due to our pension plans.
Estimated Future Benefit Payments
We expect to make the following benefit payments to participants in the next ten fiscal years under the Nasdaq Benefit Plans:
| Pension | SERP | Post-retirement | Total | ||||||||||||||||||||
| Fiscal Year Ended: | (in millions) | ||||||||||||||||||||||
| 2023 | $ | 8 | $ | 5 | $ | — | $ | 13 | |||||||||||||||
| 2024 | 7 | 3 | — | 10 | |||||||||||||||||||
| 2025 | 7 | 3 | — | 10 | |||||||||||||||||||
| 2026 | 8 | 2 | — | 10 | |||||||||||||||||||
| 2027 | 8 | 2 | — | 10 | |||||||||||||||||||
| 2028 through 2032 | 33 | 7 | 2 | 42 | |||||||||||||||||||
| $ | 71 | $ | 22 | $ | 2 | $ | 95 | ||||||||||||||||
Nonqualified Deferred Compensation Plan
their annual salary and bonus up to certain approval limits. All deferrals and associated earnings are our general unsecured obligations and were immaterial for the year ended December 31, 2022.| Pension | SERP | Post-retirement | Total | ||||||||||||
| Fiscal Year Ended: | (in millions) | ||||||||||||||
| 2018 | $ | 5 | $ | 2 | $ | — | $ | 7 | |||||||
| 2019 | 5 | 7 | — | 12 | |||||||||||
| 2020 | 5 | 2 | — | 7 | |||||||||||
| 2021 | 5 | 2 | — | 7 | |||||||||||
| 2022 | 6 | 2 | — | 8 | |||||||||||
| 2023 through 2027 | 29 | 10 | 1 | 40 | |||||||||||
| $ | 55 | $ | 25 | $ | 1 | $ | 81 | ||||||||
We have a share-based compensation program that provides our board of directors broad discretion in creating employee equity incentives.for employees and non-employee directors. Share-based awards granted under this program include stock options, restricted stock (consisting of restricted stock units), PSUs and PSUs.stock options. For accounting purposes, we consider PSUs to be a form of restricted stock. Generally, annual employee awards are granted on April 1st of each year.
Summary of Share-Based Compensation Expense
The following table showspresents the total share-based compensation expense resulting from equity awards and the 15.0% discount for the ESPP for the years ended December 31, 2017, 20162022, 2021 and 20152020, which is included in compensation and benefits expense in the Consolidated Statements of Income:
| Year Ended December 31, | |||||||||||
| 2017 | 2016 | 2015 | |||||||||
| (in millions) | |||||||||||
| Share-based compensation expense before income taxes | $ | 70 | $ | 86 | $ | 68 | |||||
| Income tax benefit | (29 | ) | (35 | ) | (28 | ) | |||||
| Share-based compensation expense after income taxes | $ | 41 | $ | 51 | $ | 40 | |||||
| Year Ended December 31, | |||||||||||||||||||||||||||||
| 2022 | 2021 | 2020 | |||||||||||||||||||||||||||
| (in millions) | |||||||||||||||||||||||||||||
| Share-based compensation expense before income taxes | $ | 106 | $ | 90 | $ | 87 | |||||||||||||||||||||||
Common Shares Available Under Our Equity Plan
As of December 31, 2017,2022, we had approximately 5.826.4 million shares of common stock authorized for future issuance under our Equity Plan.
Restricted Stock
We grant restricted stock to most active employees. The grant date fair value of restricted stock awards is based on the closing stock price at the date of grant less the present value of future cash dividends. Restricted stock awards granted to employees below the manager level generally vest 25.0%33.3% on the first anniversary of the grant date, 33.3% on the second anniversary of the grant date, 25.0%and 33.3% on the third anniversary of the grant date. Restricted stock awards granted to employees at or above the manager level generally vest 33.3% on the second anniversary of the grant date, 33.3% on the third anniversary of the grant date, and 50.0%33.3% on the fourth anniversary of the grant date. We generally recognize compensation expense for restricted stock awards on a straight-line basis over the requisite service period of the award, taking into account an estimated forfeiture rate.
F-29
Summary of Restricted Stock Activity
The following table summarizes our restricted stock activity for the years ended December 31, 2017, 20162022, 2021 and 2015:2020:
| Restricted Stock | |||||||||||||||||
| Restricted Stock | Number of Awards | Weighted-Average Grant Date Fair Value | |||||||||||||||
| Number of Awards | Weighted-Average Grant Date Fair Value | ||||||||||||||||
| Unvested balances at December 31, 2014 | 3,193,230 | $ | 30.99 | ||||||||||||||
| Unvested at December 31, 2019 | Unvested at December 31, 2019 | 4,460,268 | $ | 25.79 | |||||||||||||
| Granted | 823,950 | $ | 49.26 | Granted | 2,229,900 | 29.98 | |||||||||||
| Vested | (370,998 | ) | $ | 29.90 | Vested | (1,498,071) | 24.32 | ||||||||||
| Forfeited | (302,444 | ) | $ | 34.34 | Forfeited | (274,944) | 27.06 | ||||||||||
| Unvested balances at December 31, 2015 | 3,343,738 | $ | 35.36 | ||||||||||||||
| Unvested at December 31, 2020 | Unvested at December 31, 2020 | 4,917,153 | $ | 28.07 | |||||||||||||
| Granted | 724,200 | $ | 62.91 | Granted | 1,523,235 | 50.52 | |||||||||||
| Vested | (1,238,980 | ) | $ | 27.91 | Vested | (1,624,809) | 27.78 | ||||||||||
| Forfeited | (268,380 | ) | $ | 43.29 | Forfeited | (416,559) | 34.04 | ||||||||||
| Unvested balances at December 31, 2016 | 2,560,578 | $ | 45.92 | ||||||||||||||
| Unvested at December 31, 2021 | Unvested at December 31, 2021 | 4,399,020 | $ | 35.39 | |||||||||||||
| Granted | 737,864 | $ | 67.48 | Granted | 1,785,138 | 57.65 | |||||||||||
| Vested | (1,102,823 | ) | $ | 38.56 | Vested | (1,525,442) | 31.22 | ||||||||||
| Forfeited | (207,119 | ) | $ | 52.29 | Forfeited | (278,203) | 42.07 | ||||||||||
| Unvested balances at December 31, 2017 | 1,988,500 | $ | 57.34 | ||||||||||||||
| Unvested at December 31, 2022 | Unvested at December 31, 2022 | 4,380,513 | $ | 45.48 | |||||||||||||
As of December 31, 2017, $542022, $111 million of total unrecognized compensation cost related to restricted stock is expected to be recognized over a weighted-average period of 1.8 years.
PSUs
One-Year PSU Program
Three-Year PSU Program
Under the three-year performance-based program, each eligible individual receives PSUs, subject to market conditions, with a three-year cumulative performance period that vest at the end of the performance period. Compensation cost is recognized over the three-year vesting period.performance period, taking into account an estimated forfeiture rate, regardless of whether the market condition is satisfied, provided that the requisite service period has been completed. Performance will be determined by comparing Nasdaq’s TSR to two peer groups, each weighted 50.0%. The first peer group consists of exchange companies, and the second peer group consists of all companies in the S&P 500. Nasdaq’s relative performance ranking against each of these groups will determine the final number of shares delivered to each individual under the program. The payoutaward issuance under this program will be between 0.0% and 200.0% of the number of PSUs granted and will be determined by Nasdaq’s overall performance against both peer groups. However, if Nasdaq’s TSR is negative for the three-year performance period, regardless of TSR ranking, the payoutaward issuance will not exceed 100.0% of the number of PSUs granted. We estimate the fair value of PSUs granted under the three-year PSU program using the Monte Carlo simulation model, as these awards contain a market condition.
The following weighted-average assumptions were used to determine the weighted-average fair values of the PSU awards granted under the three-year PSU program for the years ended December 31, 20172022 and 2016:2021:
| Year Ended December 31, | |||||||||||
| 2022 | 2021 | ||||||||||
| Weighted-average risk free interest rate | 2.61 | % | 0.33 | % | |||||||
| Expected volatility | 30.04 | % | 30.30 | % | |||||||
| Weighted-average grant date share price | $ | 60.55 | $ | 51.88 | |||||||
| Weighted-average fair value at grant date | $ | 63.68 | $ | 72.75 | |||||||
| Year Ended December 31, | |||||
| 2017 | 2016 | ||||
Weighted-average risk free interest rate(1) | 1.44 | % | 0.84 | % | |
Expected volatility(2) | 19.2 | % | 21.0 | % | |
| Weighted-average grant date share price | $69.45 | $66.36 | |||
| Weighted-average fair value at grant date | $81.57 | $93.25 | |||
In addition, the annual dividend assumption utilized in the Monte Carlo simulation model is based on Nasdaq’s dividend yield at the date of grant.
F-30
Summary of PSU Activity
The following table summarizes our PSU activity for the years ended December 31, 2017, 20162022, 2021 and 2015:2020:
| PSUs | |||||||||||||||||||||||
| One-Year Program | Three-Year Program | ||||||||||||||||||||||
| Number of Awards | Weighted-Average Grant Date Fair Value | Number of Awards | Weighted-Average Grant Date Fair Value | ||||||||||||||||||||
| Unvested at December 31, 2019 | 951,753 | $ | 26.96 | 2,392,353 | $ | 32.77 | |||||||||||||||||
| Granted | 80,340 | 28.06 | 960,984 | 35.81 | |||||||||||||||||||
| Vested | (415,269) | 26.03 | (902,301) | 27.19 | |||||||||||||||||||
| Forfeited | (108,180) | 27.47 | (21,069) | 32.75 | |||||||||||||||||||
| Unvested at December 31, 2020 | 508,644 | $ | 27.78 | 2,429,967 | $ | 36.04 | |||||||||||||||||
| Granted | — | — | 1,081,707 | 58.66 | |||||||||||||||||||
| Vested | (299,292) | 27.66 | (1,178,181) | 38.95 | |||||||||||||||||||
| Forfeited | (60,150) | 27.76 | (41,121) | 47.43 | |||||||||||||||||||
| Unvested at December 31, 2021 | 149,202 | $ | 28.01 | 2,292,372 | $ | 45.01 | |||||||||||||||||
| Granted | — | — | 1,495,092 | 45.66 | |||||||||||||||||||
| Vested | (142,459) | 28.02 | (1,735,842) | 32.57 | |||||||||||||||||||
| Forfeited | (6,743) | 27.85 | (85,080) | 52.27 | |||||||||||||||||||
| Unvested at December 31, 2022 | — | $ | — | 1,966,542 | $ | 56.44 | |||||||||||||||||
| PSUs | |||||||||||||
| One-Year Program | Three-Year Program | ||||||||||||
| Number of Awards | Weighted-Average Grant Date Fair Value | Number of Awards | Weighted-Average Grant Date Fair Value | ||||||||||
| Unvested balances at December 31, 2014 | 558,040 | $ | 24.17 | 1,654,567 | $ | 35.57 | |||||||
| Granted | 206,199 | $ | 48.16 | 649,626 | $ | 49.69 | |||||||
| Vested | (247,273 | ) | $ | 30.51 | (837,109 | ) | $ | 22.50 | |||||
| Forfeited | (92,999 | ) | $ | 34.74 | (27,366 | ) | $ | 43.49 | |||||
| Unvested balances at December 31, 2015 | 423,967 | $ | 41.34 | 1,439,718 | $ | 49.41 | |||||||
| Granted | 242,642 | $ | 58.33 | 761,501 | $ | 66.89 | |||||||
| Vested | (242,793 | ) | $ | 39.63 | (879,926 | ) | $ | 43.81 | |||||
| Forfeited | (45,050 | ) | $ | 47.72 | (6,625 | ) | $ | 69.11 | |||||
| Unvested balances at December 31, 2016 | 378,766 | $ | 52.55 | 1,314,668 | $ | 63.18 | |||||||
| Granted | 197,075 | $ | 65.51 | 803,712 | $ | 55.57 | |||||||
| Vested | (202,073 | ) | $ | 49.93 | (1,079,925 | ) | $ | 42.83 | |||||
| Forfeited | (40,764 | ) | $ | 55.92 | (28,497 | ) | $ | 87.86 | |||||
| Unvested balances at December 31, 2017 | 333,004 | $ | 61.39 | 1,009,958 | $ | 78.18 | |||||||
As of December 31, 2017, $9 million of2022, total unrecognized compensation cost related to the one-yearthree-year PSU program is $44 million and is expected to be recognized over a weighted-average period of 1.4 years. For the three-year PSU program, $21 million of total unrecognized compensation cost is expected to be recognized over a weighted-average period of 1.41.3 years.
Stock Options
In January 2022, in connection with a new five year employment agreement, our Chief Executive Officer received an aggregate of 613,872 performance-based non-qualified stock options, which will vest as follows:
•50% will vest contingent upon the achievement of certain performance conditions; and
•50% will vest five years after the grant date, subject to continued employment through such date.
The fair value of stock options isare estimated using the Black-Scholes option-pricing model. Each grant has a 10-year life. In January 2017, our CEO received 268,817 performance-based non-qualified stockThese options which will vest annually over a three-year period, with each vesting contingent uponexpire 10 years after the achievementdate of annual performance parameters. On January 30, 2018, Nasdaq's management compensation committee and board of directors determined that the performance goal for 2017 was met, resulting in the settlement of the first one-third of the grant. There were no stock option awards granted duringfor the years ended December 31, 20162021 and 2015.
2020.A summary of stock option activity for the yearyears ended December 31, 20172022, 2021 and 2020 is as follows:
Number of Stock Options | Weighted-Average Exercise Price | Weighted- Average Remaining Contractual Term (in years) | Aggregate Intrinsic Value (in millions) | |||||||||||
| Outstanding at December 31, 2019 | 1,137,306 | $ | 18.11 | |||||||||||
| Exercised | (255,585) | 7.97 | ||||||||||||
| Forfeited | (1,662) | 6.98 | ||||||||||||
| Outstanding at December 31, 2020 | 880,059 | $ | 21.07 | 5.5 | $ | 20 | ||||||||
| Exercised | (73,227) | 8.43 | ||||||||||||
| Forfeited | (381) | 8.43 | ||||||||||||
| Outstanding at December 31, 2021 | 806,451 | $ | 22.23 | 5.0 | $ | 39 | ||||||||
| Granted | 613,872 | 67.49 | ||||||||||||
| Outstanding at December 31, 2022 | 1,420,323 | $ | 41.79 | 6.2 | $ | 32 | ||||||||
| Exercisable at December 31, 2022 | 806,451 | $ | 22.23 | 4.0 | $ | 32 | ||||||||
| Number of Stock Options | Weighted-Average Exercise Price | |||||
| Outstanding at December 31, 2014 | 3,316,782 | $ | 27.56 | |||
| Exercised | (682,054 | ) | 26.84 | |||
| Forfeited | (8,241 | ) | 28.53 | |||
| Outstanding at December 31, 2015 | 2,626,487 | $ | 27.74 | |||
| Exercised | (1,219,820 | ) | 34.00 | |||
| Forfeited | (296 | ) | 23.31 | |||
| Outstanding at December 31, 2016 | 1,406,371 | $ | 22.32 | |||
| Granted | 268,817 | 66.68 | ||||
| Exercised | (1,102,830 | ) | 21.98 | |||
| Forfeited | (978 | ) | 21.33 | |||
| Outstanding at December 31, 2017 | 571,380 | $ | 43.84 | |||
| Exercisable at December 31, 2017 | 302,563 | $ | 23.55 | |||
| Outstanding | Exercisable | |||||||||||||||||||||||||||
| Range of Exercise Prices | Number of Stock Options | Weighted-Average Remaining Contractual Term (in years) | Weighted-Average Exercise Price | Aggregate Intrinsic Value (in millions) | Number Exercisable | Weighted-Average Remaining Contractual Term (in years) | Weighted-Average Exercise Price | Aggregate Intrinsic Value (in millions) | ||||||||||||||||||||
| $17.36 | - | $19.99 | 94,265 | 2.14 | $ | 19.73 | $ | 5 | 94,265 | 2.14 | $ | 19.73 | $ | 5 | ||||||||||||||
| $20.00 | - | $25.75 | 206,980 | 2.39 | 25.20 | 11 | 206,980 | 2.39 | 25.20 | 11 | ||||||||||||||||||
| $25.76 | - | $66.68 | 270,135 | 8.84 | 66.53 | 3 | 1,318 | 0.48 | 36.40 | — | ||||||||||||||||||
| Total | 571,380 | 5.40 | $ | 43.84 | $ | 19 | 302,563 | 2.30 | $ | 23.55 | $ | 16 | ||||||||||||||||
ESPP
We have an ESPP under which approximately 2.112.1 million shares of our common stock have been reservedwere available for future issuance as of December 31, 2017.2022. Under our ESPP, employees may purchase shares having a value not exceeding 10.0% of their annual compensation, subject to applicable annual Internal Revenue Service limitations. We record compensation expense related to the 15.0% discount that is given to our employees. The following table summarizes employee activity and expense associated with the ESPP for the years ended December 31, 2017, 2016 and 2015.
| Year Ended December 31, | |||||||||||
| 2017 | 2016 | 2015 | |||||||||
| Number of shares purchased by employees | 235,859 | 233,464 | 247,444 | ||||||||
| Weighted-average price of shares purchased | $ | 58.26 | $ | 50.39 | $ | 40.95 | |||||
| Compensation expense (in millions) | $ | 3 | $ | 4 | $ | 4 | |||||
F-31
| Year Ended December 31, | ||||||||||||||||||||
| 2022 | 2021 | 2020 | ||||||||||||||||||
| Number of shares purchased by employees | 591,820 | 605,274 | 663,369 | |||||||||||||||||
| Weighted-average price of shares purchased | $ | 43.54 | $ | 41.41 | $ | 31.93 | ||||||||||||||
Compensation expense (in millions) | $ | 8 | $ | 7 | $ | 5 | ||||||||||||||
12.NASDAQSTOCKHOLDERS' EQUITY
Common Stock
As of December 31, 2017, 300,000,0002022, 900,000,000 shares of our common stock were authorized, 172,373,432513,157,630 shares were issued and 167,441,030491,592,491 shares were outstanding. As of December 31, 2021, 900,000,000 shares of our common stock were authorized, 520,256,817 shares were issued and 500,038,905 shares were outstanding. The holders of common stock are entitled to one vote per share, except that our certificate of incorporation limits the ability of any personshareholder to vote in excess of 5.0% of the then-outstanding shares of Nasdaq common stock.
Common Stock in Treasury, at Cost
We account for the purchase of treasury stock under the cost method with the shares of stock repurchased reflected as a reduction to Nasdaq stockholders’ equity and included in common stock in treasury, at cost in the Consolidated Balance Sheets. Shares repurchased under our share repurchase program are currently retired and canceled. Whencanceled and are therefore not included in the common stock in treasury balance. If treasury shares are reissued, they are recorded at the average cost of the treasury shares acquired. We held 4,932,40221,565,139 shares of common stock in treasury as of December 31, 20172022 and 3,921,71820,217,912 shares as of December 31, 2016,2021, most of which are related to shares of our common stock repurchasedwithheld for the settlement of employee tax withholding obligations arising from the vesting of restricted stock.stock and PSUs.
Share Repurchase Program
These purchasesrepurchases may be made from time to time at prevailing market prices in open market purchases, privately-negotiated transactions, block purchase techniques, an accelerated share repurchase program or otherwise, as determined by our management. The purchasesrepurchases are primarily funded from existing cash balances. The share repurchase program may be suspended, modified or discontinued at any time.
time, and has no defined expiration date.The following table summarizesis a summary of our share repurchase activity:activity, excluding the repurchases done through our ASR agreement described below, reported based on settlement date, for the year ended December 31, 2022:
| Year Ended December 31, | ||||||||
| 2017 | 2016 | |||||||
| Number of shares of common stock repurchased | 2,843,519 | 1,547,778 | ||||||
| Average price paid per share | $ | 71.56 | $ | 64.42 | ||||
| Total purchase price (in millions) | $ | 203 | $ | 100 | ||||
| Year Ended December 31, 2022 | ||||||||||||||
| Number of shares of common stock repurchased | 5,465,595 | |||||||||||||
| Average price paid per share | $ | 56.26 | ||||||||||||
Total purchase price (in millions) | $ | 308 | ||||||||||||
In the table above, the number of shares of common stock repurchased excludes an aggregate of 1,347,227 shares withheld upon the vesting of restricted stock and PSUs for the year ended December 31, 2022.
As discussed above in “Common Stock in Treasury, at Cost,” shares repurchased under our share repurchase program are currently retired and cancelled. As of December 31, 2017, the remaining amount authorized for share repurchases under the program was $226 million.
ASR Agreement
In January 2018, the board2022, we entered into an ASR agreement to repurchase $325 million of directors authorized an additional $500 million for the share repurchase program bringing thecommon stock. We received a total capacity to $726 million.
Preferred Stock
Our certificate of incorporation authorizes the issuance of 30,000,000 shares of preferred stock, par value $0.01 per share, issuable from time to time in one or more series. As of December 31, 20172022 and December 31, 2016,2021, no shares of preferred stock were issued or outstanding.
Cash Dividends on Common Stock
During 2017,2022, our board of directors declared and paid the following cash dividends:
| Declaration Date | Dividend Per Common Share | Record Date | Total Amount Paid | Payment Date | ||||||||
| (in millions) | ||||||||||||
| January 30, 2017 | $ | 0.32 | March 17, 2017 | $ | 53 | March 31, 2017 | ||||||
| April 25, 2017 | 0.38 | June 16, 2017 | 63 | June 30, 2017 | ||||||||
| July 25, 2017 | 0.38 | September 15, 2017 | 64 | September 29, 2017 | ||||||||
| October 24, 2017 | 0.38 | December 15, 2017 | 63 | December 29, 2017 | ||||||||
| $ | 243 | |||||||||||
| Declaration Date | Dividend Per Common Share | Record Date | Total Amount Paid | Payment Date | ||||||||||||||||||||||
| (in millions) | ||||||||||||||||||||||||||
| January 26, 2022 | $ | 0.18 | March 11, 2022 | $ | 88 | March 25, 2022 | ||||||||||||||||||||
| April 20, 2022 | 0.20 | June 10, 2022 | 98 | June 24, 2022 | ||||||||||||||||||||||
| July 19, 2022 | 0.20 | September 16, 2022 | 99 | September 30, 2022 | ||||||||||||||||||||||
| October 19, 2022 | 0.20 | December 2, 2022 | 98 | December 16, 2022 | ||||||||||||||||||||||
| $ | 383 | |||||||||||||||||||||||||
The total amount paid of $243$383 million was recorded in retained earnings within Nasdaq's stockholders' equity in the Consolidated Balance Sheets as ofat December 31, 2017.2022.
F-32
In April 2017,January 2023, the board of directors declaredapproved a regular quarterly cash dividend of $0.38 per share on our outstanding common stock which reflected a 19.0% increase from our prior quarterly cash dividend of $0.32. In addition, in April 2017, our board of directors adopted a dividend policy with the intention to provide shareholders with regular and growing dividends over the long term as earnings and cash flow grow.
The board of directors maintains a dividend policy with the intention to provide stockholders with regular and increasing dividends as earnings and cash flows increase.
Foreign Currency Translation Adjustments | Employee Benefit Plan Adjustments | Accumulated Other Comprehensive Loss | ||||||||||
| (in millions) | ||||||||||||
| Gross balance, December 31, 2016 | $ | (1,481 | ) | $ | (35 | ) | $ | (1,516 | ) | |||
| Income taxes | 523 | 14 | 537 | |||||||||
| Net balance, December 31, 2016 | $ | (958 | ) | $ | (21 | ) | $ | (979 | ) | |||
| Gross balance, December 31, 2017 | $ | (1,268 | ) | $ | (37 | ) | $ | (1,305 | ) | |||
| Income taxes | 428 | 15 | 443 | |||||||||
| Net balance, December 31, 2017 | $ | (840 | ) | $ | (22 | ) | $ | (862 | ) | |||
The following table sets forth the computation of basic and diluted earnings per share:
| Year Ended December 31, | |||||||||||||||||
| 2022 | 2021 | 2020 | |||||||||||||||
| Numerator: | (in millions, except share and per share amounts) | ||||||||||||||||
| Net income attributable to common shareholders | $ | 1,125 | $ | 1,187 | $ | 933 | |||||||||||
| Denominator: | |||||||||||||||||
| Weighted-average common shares outstanding for basic earnings per share | 492,420,787 | 497,698,377 | 493,245,573 | ||||||||||||||
| Weighted-average effect of dilutive securities: | |||||||||||||||||
| Employee equity awards | 5,436,778 | 7,389,189 | 6,406,596 | ||||||||||||||
| Contingent issuance of common stock | — | — | 1,059,654 | ||||||||||||||
| Weighted-average common shares outstanding for diluted earnings per share | 497,857,565 | 505,087,566 | 500,711,823 | ||||||||||||||
| Basic and diluted earnings per share: | |||||||||||||||||
| Basic earnings per share | $ | 2.28 | $ | 2.38 | $ | 1.89 | |||||||||||
| Diluted earnings per share | $ | 2.26 | $ | 2.35 | $ | 1.86 | |||||||||||
| Year Ended December 31, | |||||||||||
| 2017 | 2016 | 2015 | |||||||||
| (in millions, except share and per share amounts) | |||||||||||
| Numerator: | |||||||||||
| Net income attributable to common shareholders | $ | 734 | $ | 108 | $ | 428 | |||||
| Denominator: | |||||||||||
| Weighted-average common shares outstanding for basic earnings per share | 166,364,299 | 165,182,290 | 167,285,450 | ||||||||
| Weighted-average effect of dilutive securities: | |||||||||||
| Employee equity awards | 2,861,892 | 3,258,136 | 3,638,981 | ||||||||
| Contingent issuance of common stock | 358,840 | 360,571 | 358,840 | ||||||||
| Weighted-average common shares outstanding for diluted earnings per share | 169,585,031 | 168,800,997 | 171,283,271 | ||||||||
| Basic and diluted earnings per share: | |||||||||||
| Basic earnings per share | $ | 4.41 | $ | 0.65 | $ | 2.56 | |||||
| Diluted earnings per share | $ | 4.33 | $ | 0.64 | $ | 2.50 | |||||
Securities that were not included in the computation of diluted earnings per share on a weighted-average basis, asbecause their inclusioneffect was dilutive. The remaining stock options, shares of restricted stock and PSUs are antidilutive and as such, they were properly excluded.
The following table presentstables present our financial assets and financial liabilities that arewere measured at fair value on a recurring basis as of December 31, 20172022 and December 31, 2016. We did not have any financial liabilities measured at fair value on a recurring basis as of December 31, 2017 and December 31, 2016.2021.
| December 31, 2017 | |||||||||||||||
| Total | Level 1 | Level 2 | Level 3 | ||||||||||||
| (in millions) | |||||||||||||||
| Financial investments, at fair value | $ | 235 | $ | 135 | $ | 100 | $ | — | |||||||
| Default fund and margin deposit investments | 2,129 | 371 | 1,758 | — | |||||||||||
| Total | $ | 2,364 | $ | 506 | $ | 1,858 | $ | — | |||||||
| December 31, 2016 | |||||||||||||||
| Total | Level 1 | Level 2 | Level 3 | ||||||||||||
| (in millions) | |||||||||||||||
| Financial investments, at fair value | $ | 245 | $ | 151 | $ | 94 | $ | — | |||||||
| Default fund and margin deposit investments | 1,900 | 614 | 1,286 | — | |||||||||||
| Total | $ | 2,145 | $ | 765 | $ | 1,380 | $ | — | |||||||
| December 31, 2022 | ||||||||||||||||||||||||||||||||||||||||||||||||||
| Total | Level 1 | Level 2 | Level 3 | |||||||||||||||||||||||||||||||||||||||||||||||
| (in millions) | ||||||||||||||||||||||||||||||||||||||||||||||||||
| European government debt securities | $ | 147 | $ | 147 | $ | — | $ | — | ||||||||||||||||||||||||||||||||||||||||||
| Corporate debt securities | 7 | — | 7 | — | ||||||||||||||||||||||||||||||||||||||||||||||
| State-owned enterprises and municipal securities | 7 | — | 7 | — | ||||||||||||||||||||||||||||||||||||||||||||||
| Swedish mortgage bonds | 20 | — | 20 | — | ||||||||||||||||||||||||||||||||||||||||||||||
| Total assets at fair value | $ | 181 | $ | 147 | $ | 34 | $ | — | ||||||||||||||||||||||||||||||||||||||||||
| December 31, 2021 | ||||||||||||||||||||||||||||||||||||||||||||||||||
| Total | Level 1 | Level 2 | Level 3 | |||||||||||||||||||||||||||||||||||||||||||||||
| (in millions) | ||||||||||||||||||||||||||||||||||||||||||||||||||
| European government debt securities | $ | 144 | $ | 144 | $ | — | $ | — | ||||||||||||||||||||||||||||||||||||||||||
| Corporate debt securities | 20 | — | 20 | — | ||||||||||||||||||||||||||||||||||||||||||||||
| State-owned enterprises and municipal securities | 11 | — | 11 | — | ||||||||||||||||||||||||||||||||||||||||||||||
| Swedish mortgage bonds | 21 | — | 21 | — | ||||||||||||||||||||||||||||||||||||||||||||||
| Time deposits | 12 | — | 12 | — | ||||||||||||||||||||||||||||||||||||||||||||||
| Total assets at fair value | $ | 208 | $ | 144 | $ | 64 | $ | — | ||||||||||||||||||||||||||||||||||||||||||
Financial Instruments Not Measured at Fair Value on a Recurring Basis
Some of our financial instruments are not measured at fair value on a recurring basis but are recorded at amounts that approximate fair value due to their liquid or short-term nature. Such financial assets and financial liabilities include: cash and cash equivalents, restricted cash and cash equivalents, receivables, net, certain other current assets, accounts payable and accrued expenses, Section 31 fees payable to SEC, accrued personnel costs, commercial paper and certain other current liabilities.
F-33
We also consider our debt obligations to be financial instruments. As of December 31, 2022, the majority of our debt obligations were fixed-rate obligations. We are exposed to changes in interest rates as a result of borrowings under our 2022 Credit Facility, as the interest rates on this facility have a variable rate depending on the maturity of the borrowing and the implied underlying reference rate. As of December 31, 2022, we had no outstanding borrowings under our 2022 Credit Facility. We are also exposed to changes in interest rates as a result of the amounts outstanding from the sale of commercial paper under our commercial paper program. As of December 31, 2022, we had $664 million outstanding under our commercial paper program. The fair value of our remaining debt obligations utilizing discounted cash flow analyses for our floating rate debt, and prevailing market rates for our fixed rate debt was $4.4 billion as of December 31, 20172022 and $3.8$5.9 billion as of December 31, 2016.2021. The discounted cash flow analyses are based on borrowing rates currently available to us for debt with similar terms and maturities. The fair value of our commercial paper approximatesas of December 31, 2022 approximated the carrying value since the rates of interest on this short-term debt approximateapproximated market rates as of December 31, 2017.rates. Our commercial paper and our fixed rate and floating rate debt are categorized as Level 2 in the fair value hierarchy.
For further discussion of our debt obligations, see Note 10,9, “Debt Obligations.”
Non-Financial Assets Measured at Fair Value on a Non-Recurring Basis
Our non-financial assets, which include goodwill, intangible assets, and other long-lived assets, are not required to be carried at fair value on a recurring basis. Fair value measures of non-financial assets are primarily used in the impairment analysis of these assets. Any resulting asset impairment would require that the non-financial asset be recorded at its fair value. Nasdaq uses Level 3 inputs to measure the fair value of the above assets on a non-recurring basis. As of December 31, 20172022 and December 31, 2016,2021, there were no non-financial assets measured at fair value on a non-recurring basis.
NasdaqClearing
Nasdaq Clearing is authorized and supervised under EMIR as a multi-asset clearinghouse by the SFSASFSA. Such authorization is effective for all member states of the European Union and is authorized to
Through our clearing operations in the financial markets, which include the resale and repurchase market, the commodities markets, and the seafood market, Nasdaq Clearing is the legal counterparty for, and guarantees the fulfillment of, each contract cleared. These contracts are not used by Nasdaq Clearing for the purpose of trading on its own behalf. As the legal counterparty of each transaction, Nasdaq Clearing bears the counterparty risk between the purchaser and seller in the contract. In its guarantor role, Nasdaq Clearing has precisely equal and offsetting claims to and from clearing members on opposite sides of each contract, standing as the CCP on every contract cleared. In accordance with the rules and regulations of Nasdaq Clearing, clearing members’ open positions are aggregated to create a single portfolio for which default fund and margin collateral requirements are calculated.calculated for each clearing member’s positions in accounts with the CCP. See “Default Fund Contributions and Margin Deposits” below for further discussion of Nasdaq Clearing’s default fund and margin requirements.
Nasdaq Clearing maintains fourthree member sponsored default funds: one related to financial markets, one related to commodities markets and one related to the seafood market, and a mutualized fund.market. Under this structure, Nasdaq Clearing and its clearing members must contribute to the total regulatory capital related to the clearing operations of Nasdaq Clearing. This structure applies an initial separation of default fund contributions for the financial, commodities and seafood markets in order to create a buffer for each market’s counterparty risks. Simultaneously, a mutualized default fund provides capital efficiencies to Nasdaq Clearing’s members with regard to total regulatory capital required. See “Default Fund Contributions” below for further discussion of Nasdaq Clearing’s default fund. PowerA power of assessment and a liability waterfall have also have been implemented.implemented to further align risk between Nasdaq Clearing and its clearing members. See “Power of Assessment” and “Liability Waterfall” below for further discussion. These requirements ensure
Nasdaq Commodities Clearing Default
In September 2018, a member of the alignment of risk between Nasdaq Clearing commodities market defaulted due to the inability to post sufficient collateral to cover increased margin requirements for the positions of the relevant member, which had experienced losses due to sharp adverse movements in the Nordic - German power market spread. Nasdaq Clearing followed default procedures and offset the future market risk on the defaulting member’s positions.
F-34
In December 2018, the SFSA initiated a review of Nasdaq Clearing. In January 2021, the SFSA issued a warning combined with an administrative fine of approximately $29 million (SEK 300 million) to Nasdaq Clearing based on its clearing members.review. Nasdaq Clearing appealed the SFSA´s decision to the Administrative Court. In December 2021, the court rejected Nasdaq Clearing’s appeal and upheld the decision of the SFSA. In January 2022, Nasdaq Clearing appealed this decision to the Administrative Court of Appeal. The most recent hearing took place in October 2022, and we received the decision in November 2022. The court decided to reduce the administrative fine issued by the SFSA from 300 million SEK to 250 million SEK (approximately $24 million). In December 2022, Nasdaq Clearing appealed the decision of the Administrative Court of Appeal to the Supreme Administrative Court of Appeal. While we continue to firmly believe in the merit of our appeal, due to the decision by the Administrative Court, we have determined it is appropriate to record an accrual for the full amount of the administrative fine issued by the SFSA. A charge for $29 million was recorded to regulatory expense in our Consolidated Statements of Income for the year ended December 31, 2021. As a result of the reduced fine communication in 2022, we have released $5 million to regulatory expense for the year ended December 31, 2022.
Default Fund Contributions and Margin Deposits
As of December 31, 2017,2022, clearing member default fund contributions and margin deposits were as follows:
| December 31, 2022 | |||||||||||||||||
| Cash Contributions | Non-Cash Contributions | Total Contributions | |||||||||||||||
| (in millions) | |||||||||||||||||
| Default fund contributions | $ | 1,345 | $ | 115 | $ | 1,460 | |||||||||||
| Margin deposits | 5,676 | 7,683 | 13,359 | ||||||||||||||
| Total | $ | 7,021 | $ | 7,798 | $ | 14,819 | |||||||||||
| December 31, 2017 | |||||||||||
| Cash Contributions | Non-Cash Contributions | Total Contributions | |||||||||
| (in millions) | |||||||||||
| Default fund contributions | $ | 360 | $ | 130 | $ | 490 | |||||
| Margin deposits | 3,628 | 4,047 | 7,675 | ||||||||
| Total | $ | 3,988 | $ | 4,177 | $ | 8,165 | |||||
Our clearinghouse holds material amounts of clearing member cash deposits which are held or invested primarily to provide security of capital while minimizing credit, market and liquidity risks. While we seek to achieve a reasonable rate of return, we are primarily concerned with preservation of capital and managing the risks associated with these deposits.
Clearing member cash contributions are maintained in demand deposits held at central banks and large, highly rated financial institutions or secured through direct investments, primarily central bank certificates and highly rated European government debt securities with original maturities primarily one year or less, reverse repurchase agreements and multilateral development bank debt securities. Investments in
reverse repurchase agreements range in maturity from 2 to 10 days and are secured with highly rated government securities and multilateral development banks. The carrying value of these securities approximates their fair value due to the short-term nature of the instruments and reverse repurchase agreements.
Nasdaq Clearing has invested the total cash contributions of $7,021 million as of December 31, 2022 and $5,911 million as of December 31, 2021, in accordance with its investment policy as follows:
| December 31, 2022 | December 31, 2021 | ||||||||||
| (in millions) | |||||||||||
| Demand deposits | $ | 4,775 | $ | 3,061 | |||||||
| Central bank certificates | 1,695 | 2,013 | |||||||||
| Restricted cash and cash equivalents | $ | 6,470 | $ | 5,074 | |||||||
| European government debt securities | 222 | 414 | |||||||||
| Reverse repurchase agreements | 192 | 152 | |||||||||
| Multilateral development bank debt securities | 137 | 271 | |||||||||
| Investments | $ | 551 | $ | 837 | |||||||
| Total | $ | 7,021 | $ | 5,911 | |||||||
In the table above, the change from December 31, 2021 to December 31, 2022 includes currency translation adjustments of $1,255 million for restricted cash and cash equivalents and $75 million for investments.
For the years ended December 31, 2022, 2021 and 2020 investments related to default funds and margin deposits, net includes purchases of investment securities of $47,525 million, $41,098 million and $54,046 million, respectively, and proceeds from sales and redemptions of investment securities of $47,736 million, $40,966 million and $54,155 million, respectively.
In the investment activity related to default fund and margin contributions, we are exposed to counterparty risk related to reverse repurchase agreement transactions, which reflect the risk that the counterparty might become insolvent and, thus, fail to meet its obligations to Nasdaq Clearing. We mitigate this risk by only engaging in transactions with high credit quality reverse repurchase agreement counterparties and by limiting the acceptable collateral under the reverse repurchase agreement to high quality issuers, primarily government securities and other securities explicitly guaranteed by a government. The value of the underlying security is monitored during the lifetime of the contract, and in the event the market value of the underlying security falls below the reverse repurchase amount, our clearinghouse may require additional collateral or a reset of the contract.
Default Fund Contributions
F-35
member is active. Clearing members’ eligible contributions may include cash and non-cash contributions. Cash contributions received are maintained in demand deposits held in cashat central banks and large, highly rated financial institutions or invested by Nasdaq Clearing, in accordance with its investment policy, either in central bank certificates, highly rated government debt securities, time deposits, central bank certificates or reverse repurchase agreements with highly rated government debt securities as collateral.collateral, or multilateral development bank debt securities. Nasdaq Clearing maintains and manages all cash deposits related to margin collateral. All risks and rewards of collateral ownership, including interest, belong to Nasdaq Clearing. Clearing members’ cash contributions are included in default funds and margin deposits in the Consolidated Balance Sheets as both a current asset and a current liability. Non-cash contributions include highly rated government debt securities that must meet specific criteria approved by Nasdaq Clearing. Non-cash contributions are pledged assets that are not recorded in the Consolidated Balance Sheets as Nasdaq Clearing does not take legal ownership of these assets and the risks and rewards remain with the clearing members. These balances may fluctuate over time due to changes in the amount of deposits required and whether members choose to provide cash or non-cash contributions. Assets pledged are held at a nominee account in Nasdaq Clearing’s name for the benefit of the clearing members and are immediately accessible by Nasdaq Clearing in the event of a default. In addition to clearing members’ required contributions to the liability waterfall, Nasdaq Clearing is also required to contribute capital to the liability waterfall and overall regulatory capital as specified under its clearinghouse rules. As of December 31, 2017,2022, Nasdaq Clearing committed capital totaling $114$125 million to the liability waterfall and overall regulatory capital, in the form of government debt securities, which are recorded as financial investments at fair value in the Consolidated Balance Sheets. The combined regulatory capital of the clearing members and Nasdaq Clearing will serveis intended to secure the obligations of a clearing member exceeding such member’s own margin and default fund deposits and may be used to cover losses sustained by a clearing member in the event of a default.
Margin Deposits
Nasdaq Clearing requires all clearing members to provide collateral, which may consist of cash and non-cash contributions, to guarantee performance on the clearing
members’ open positions, or initial margin. In addition, clearing members must also provide collateral to cover the daily margin call if needed. See “Default Fund Contributions” above for further discussion of cash and non-cash contributions.
Similar to default fund contributions, Nasdaq Clearing maintains and manages all cash deposits related to margin collateral. All risks and rewards of collateral ownership, including interest, belong to Nasdaq Clearing.Clearing and are recorded in revenues. These cash deposits are recorded in default funds and margin deposits in the Consolidated Balance Sheets as both a current asset and a current liability.
Pledged margin collateral is not recorded in our Consolidated Balance Sheets as all risks and rewards of collateral ownership, including interest, belong to the counterparty. Assets pledged are held at a nominee account in Nasdaq Clearing’s name for the benefit of the clearing members and are immediately accessible by Nasdaq Clearing in the event of a default.
Nasdaq Clearing marks to market all outstanding contracts and requires payment from clearing members whose positions have lost value. The mark-to-market process helps identify any clearing members that may not be able to satisfy their financial obligations in a timely manner allowing Nasdaq Clearing the ability to mitigate the risk of a clearing member defaulting due to exceptionally large losses. In the event of a default, Nasdaq Clearing can access the defaulting member’s margin and default fund deposits to cover the defaulting member’s losses.
Regulatory Capital and Risk Management Calculations
Nasdaq Clearing manages risk through a comprehensive counterparty risk management framework, which is comprised of policies, procedures, standards and financial resources. The level of regulatory capital is determined in accordance with Nasdaq Clearing’s regulatory capital and default fund policy, as approved by the SFSA. Regulatory capital calculations are continuously updated through a proprietary capital-at-risk calculation model that establishes the appropriate level of capital.
As mentioned above, Nasdaq Clearing is the legal counterparty for each contract tradedcleared and thereby guarantees the fulfillment of each contract. Nasdaq Clearing accounts for this guarantee as a performance guarantee. We determine the fair value of the performance guarantee by considering daily settlement of contracts and other margining and default fund requirements, the risk management program, historical evidence of default payments, and the estimated probability of potential default payouts. The calculation is determined using proprietary risk management software that simulates gains and losses based on historical market prices, extreme but plausible market scenarios, volatility and other factors present at that point in time for those particular unsettled contracts. Based on this analysis, excluding any liability related to the Nasdaq commodities clearing default (see discussion above), the estimated liability was nominal and no liability was recorded as of December 31, 2017. 2022.
| December 31, 2017 | |||
| (in millions) | |||
Commodity and seafood options, futures and forwards(1)(2)(3) | $ | 524 | |
Fixed-income options and futures(1)(2) | 729 | ||
Stock options and futures(1)(2) | 132 | ||
Index options and futures(1)(2) | 111 | ||
| Total | $ | 1,496 | |
| December 31, 2017 | December 31, 2016 | ||||
Commodity and seafood options, futures and forwards(1) | 2,824,188 | 3,530,746 | |||
| Fixed-income options and futures | 20,376,383 | 14,639,065 | |||
| Stock options and futures | 26,023,816 | 28,496,143 | |||
| Index options and futures | 44,928,284 | 50,636,527 | |||
| Total | 94,152,671 | 97,302,481 | |||
Power of Assessment
To further strengthen the contingent financial resources of the clearinghouse, Nasdaq Clearing has power of assessment that provides the ability to collect additional funds from its clearing members to cover a defaulting member’s remaining obligations up to the limits established under the terms of the clearinghouse rules. The power of assessment corresponds to 100.0%230.0% of the clearing member’s aggregate contribution to the financial, commodities and seafood markets’ default funds.
F-36
Liability Waterfall
The liability waterfall is the priority order in which the capital resources would be utilized in the event of a default where the defaulting clearing member’s collateral and default fund contribution would not be sufficient to cover the cost to settle its portfolio. If a default occurs and the defaulting clearing member’s collateral, including cash deposits and pledged assets, is depleted, then capital is utilized in the following amount and order:
•junior capital contributed by Nasdaq Clearing, which totaled $18$40 million as of December 31, 2017;2022;
•a loss sharingloss-sharing pool related only to the financial market that is contributed to by clearing members and only applies if the defaulting member’s portfolio includes interest rate swap products;
•specific market default fund where the loss occurred (i.e., the financial, commodities, or seafood market), which includes capital contributions of the clearing members on a pro-rata basis; and
•fully segregated senior capital contributed tofor each specific market contributed by Nasdaq Clearing, calculated in accordance with clearinghouse rules, which totaled $24$21 million as of December 31, 2017; and
If additional funds are needed after utilization of the mutualized default fund,liability waterfall, or if part of the waterfall has been utilized and needs to be replenished, then Nasdaq Clearing will utilize its power of assessment and additional capital contributions will be required by non-defaulting members up to the limits established under the terms of the clearinghouse rules.
During 2022, Nasdaq Clearing updated its recovery plan and rule book by introducing additional recovery tools, in line with the new European Union regulations for the recovery and resolution of central counterparties, which became effective during 2022.
Market Value of Derivative Contracts Outstanding
The following table presents the market value of derivative contracts outstanding prior to netting:
| December 31, 2022 | |||||
| (in millions) | |||||
| Commodity and seafood options, futures and forwards | $ | 654 | |||
| Fixed-income options and futures | 2,282 | ||||
| Stock options and futures | 141 | ||||
| Index options and futures | 43 | ||||
| Total | $ | 3,120 | |||
In the table above:
•We determined the fair value of our option contracts using standard valuation models that were based on market-based observable inputs including implied volatility, interest rates and the spot price of the underlying instrument.
•We determined the fair value of our futures contracts based upon quoted market prices and average quoted market yields.
•We determined the fair value of our forward contracts using standard valuation models that were based on market-based observable inputs including benchmark rates and the spot price of the underlying instrument.
Derivative Contracts Cleared
The following table presents the total number of derivative contracts cleared through Nasdaq Clearing for the years ended December 31, 2022 and 2021:
| Year Ended December 31, | |||||||||||
| 2022 | 2021 | ||||||||||
| Commodity and seafood options, futures and forwards | 288,142 | 536,252 | |||||||||
| Fixed-income options and futures | 21,992,124 | 23,140,918 | |||||||||
| Stock options and futures | 18,619,950 | 20,308,811 | |||||||||
| Index options and futures | 45,616,647 | 37,860,187 | |||||||||
| Total | 86,516,863 | 81,846,168 | |||||||||
In the table above, the total volume in cleared power related to commodity contracts was 413 Terawatt hours (TWh) and 813 TWh for the years ended December 31, 2022 and 2021, respectively.
Resale and Repurchase Agreements Contracts Outstanding and Cleared
The outstanding contract value of resale and repurchase agreements was $120 million and $139 million as of December 31, 2022 and 2021, respectively. The total number of resale and repurchase agreements contracts cleared was 6,287,717 and 6,070,414 for the years ended December 31, 2022 and 2021, respectively.
F-37
16. LEASES
We lease some of our office space under non-cancelablehave operating leases with third partieswhich are primarily real estate leases predominantly for our U.S. and subleaseEuropean headquarters, data centers and for general office spacespace. The following table provides supplemental balance sheet information related to third parties. SomeNasdaq's operating leases:
| Leases | Balance Sheet Classification | December 31, 2022 | December 31, 2021 | |||||||||||||||||
| (in millions) | ||||||||||||||||||||
| Assets: | ||||||||||||||||||||
| Operating lease assets | Operating lease assets | $ | 444 | $ | 366 | |||||||||||||||
| Liabilities: | ||||||||||||||||||||
| Current lease liabilities | Other current liabilities | $ | 54 | $ | 37 | |||||||||||||||
| Non-current lease liabilities | Operating lease liabilities | 452 | 386 | |||||||||||||||||
| Total lease liabilities | $ | 506 | $ | 423 | ||||||||||||||||
The following table summarizes Nasdaq's lease cost:
| Year Ended December 31, | ||||||||||||||||||||||||||||||||
| 2022 | 2021 | 2020 | ||||||||||||||||||||||||||||||
| (in millions) | ||||||||||||||||||||||||||||||||
| Operating lease cost | $ | 75 | $ | 85 | $ | 85 | ||||||||||||||||||||||||||
| Variable lease cost | 32 | 28 | 26 | |||||||||||||||||||||||||||||
| Sublease income | (3) | (4) | (4) | |||||||||||||||||||||||||||||
| Total lease cost | $ | 104 | $ | 109 | $ | 107 | ||||||||||||||||||||||||||
In the table above, operating lease costs include short-term lease cost, which was immaterial.
The following table reconciles the undiscounted cash flows for each of the first five years and total of the remaining years to the operating lease liabilities recorded in our Consolidated Balance Sheets.
| December 31, 2022 | ||||||||
| (in millions) | ||||||||
| 2023 | $ | 71 | ||||||
| 2024 | 70 | |||||||
| 2025 | 60 | |||||||
| 2026 | 51 | |||||||
| 2027 | 48 | |||||||
| 2028+ | 314 | |||||||
| Total lease payments | 614 | |||||||
| Less: interest | (108) | |||||||
| Present value of lease liabilities | $ | 506 | ||||||
In the table above, interest is calculated using the interest rate for each lease. Present value of lease agreements contain renewal optionsliabilities include the current portion of $54 million.
Total lease payments in the table above exclude $51 million of legally binding minimum lease payments for leases signed but not yet commenced.
The following table provides information related to Nasdaq's lease term and escalation clauses based on increases in property taxesdiscount rate:
| December 31, 2022 | ||||||||
| Weighted-average remaining lease term (in years) | 10.5 | |||||||
| Weighted-average discount rate | 3.6 | % | ||||||
The following table provides supplemental cash flow information related to Nasdaq's operating leases:
| Year Ended December 31, | |||||||||||||||||
| 2022 | 2021 | 2020 | |||||||||||||||
| (in millions) | |||||||||||||||||
| Cash paid for amounts included in the measurement of operating lease liabilities | $ | 66 | $ | 77 | $ | 77 | |||||||||||
| Lease assets obtained in exchange for operating lease liabilities | $ | 137 | $ | 45 | $ | 100 | |||||||||||
17. INCOME TAXES
IncomeBefore Income Tax Provision
The following table presents the domestic and building operating costs.foreign components of income before income tax provision:
| Year Ended December 31, | |||||||||||||||||
| 2022 | 2021 | 2020 | |||||||||||||||
| (in millions) | |||||||||||||||||
| Domestic | $ | 1,216 | $ | 1,299 | $ | 898 | |||||||||||
| Foreign | 259 | 235 | 314 | ||||||||||||||
| Income before income tax provision | $ | 1,475 | $ | 1,534 | $ | 1,212 | |||||||||||
Income Tax Provision
The income tax provision consists of the following amounts:
| Year Ended December 31, | |||||||||||||||||
| 2022 | 2021 | 2020 | |||||||||||||||
| (in millions) | |||||||||||||||||
| Current income taxes provision: | |||||||||||||||||
| Federal | $ | 170 | $ | 144 | $ | 114 | |||||||||||
| State | 67 | 45 | 50 | ||||||||||||||
| Foreign | 77 | 64 | 74 | ||||||||||||||
| Total current income taxes provision | 314 | 253 | 238 | ||||||||||||||
| Deferred income taxes provision (benefit): | |||||||||||||||||
| Federal | 36 | 82 | 37 | ||||||||||||||
| State | 6 | 22 | 6 | ||||||||||||||
| Foreign | (4) | (10) | (2) | ||||||||||||||
| Total deferred income taxes provision | 38 | 94 | 41 | ||||||||||||||
| Total income tax provision | $ | 352 | $ | 347 | $ | 279 | |||||||||||
F-38
We have determined that undistributed earnings of certain non-U.S. subsidiaries will be reinvested for an indefinite period of time. We have both the intent and ability to indefinitely reinvest these earnings. As of December 31, 2017, future minimum lease payments under non-cancelable operating leases (net2022, the cumulative amount of sublease income) areundistributed earnings in these subsidiaries is $273 million. Given our intent and ability to reinvest these earnings for an indefinite period of time, we have not accrued a deferred tax liability on these earnings. A determination of an unrecognized deferred tax liability related to these earnings is not practicable.
A reconciliation of the income tax provision, based on the U.S. federal statutory rate, to our actual income tax provision for the years ended December 31, 2022, 2021 and 2020 is as follows:
| Year Ended December 31, | |||||||||||||||||
| 2022 | 2021 | 2020 | |||||||||||||||
| Federal income tax provision at the statutory rate | 21.0 | % | 21.0 | % | 21.0 | % | |||||||||||
| State income tax provision, net of federal effect | 3.8 | % | 3.9 | % | 4.2 | % | |||||||||||
| Excess tax benefits related to employee share-based compensation | (0.9) | % | (1.3) | % | (0.6) | % | |||||||||||
| Non-U.S. subsidiary earnings | 0.5 | % | 0.3 | % | 0.5 | % | |||||||||||
| Tax credits and deductions | (0.3) | % | (0.3) | % | (0.2) | % | |||||||||||
| Change in unrecognized tax benefits | 1.1 | % | 0.6 | % | (0.6) | % | |||||||||||
| Other, net | (1.3) | % | (1.6) | % | (1.3) | % | |||||||||||
| Actual income tax provision | 23.9 | % | 22.6 | % | 23.0 | % | |||||||||||
The increase in our effective tax rate in 2022 compared to 2021 was primarily due to an increase in state unrecognized tax benefits. The decrease in our effective tax rate in 2021 compared to 2020 was primarily due to a tax benefit related to federal, state and local provision to return adjustments, which is included in other, net in the table above and excess tax benefits related to employee share-based compensation.
The effective tax rate may vary from period to period depending on, among other factors, the geographic and business mix of earnings and losses. These same and other factors, including history of pre-tax earnings and losses, are taken into account in assessing the ability to realize deferred tax assets.
President Biden signed into law the Inflation Reduction Act of 2022 on August 16, 2022. Nasdaq does not expect any material impact to the financial statements or our effective tax rate in future periods.
Deferred Income Taxes
The temporary differences, which give rise to our deferred tax assets and (liabilities), consisted of the following:
| December 31, | |||||||||||
| 2022 | 2021 | ||||||||||
| (in millions) | |||||||||||
| Deferred tax assets: | |||||||||||
| Deferred revenues | $ | 18 | $ | 12 | |||||||
| U.S. federal net operating loss | 5 | — | |||||||||
| Foreign net operating loss | 12 | 4 | |||||||||
| State net operating loss | 3 | 1 | |||||||||
| Compensation and benefits | 42 | 32 | |||||||||
| Tax credits | 3 | — | |||||||||
| Federal benefit of uncertain tax positions | 9 | 6 | |||||||||
| Operating lease liabilities | 118 | 99 | |||||||||
| Unrealized losses | — | 2 | |||||||||
| Other | 33 | 30 | |||||||||
| Gross deferred tax assets | 243 | 186 | |||||||||
| Less: valuation allowance | (4) | (4) | |||||||||
| Total deferred tax assets, net of valuation allowance | $ | 239 | $ | 182 | |||||||
| Deferred tax liabilities: | |||||||||||
| Amortization of software development costs and depreciation | $ | (65) | $ | (65) | |||||||
| Amortization of acquired intangible assets and goodwill | (375) | (322) | |||||||||
| Investments | (105) | (99) | |||||||||
| Unrealized gains | (29) | — | |||||||||
| Operating lease assets | (103) | (84) | |||||||||
| Other | (15) | (16) | |||||||||
| Gross deferred tax liabilities | $ | (692) | $ | (586) | |||||||
| Net deferred tax liabilities | $ | (453) | $ | (404) | |||||||
| Reported as: | |||||||||||
| Non-current deferred tax assets | $ | 3 | $ | 2 | |||||||
| Deferred tax liabilities, net | (456) | (406) | |||||||||
| Net deferred tax liabilities | $ | (453) | $ | (404) | |||||||
In the table above, non-current deferred tax assets are included in other non-current assets in the Consolidated Balance Sheets.
We recognized a valuation allowance of $4 million as of December 31, 2022 and 2021 due to recurring operating losses in a foreign jurisdiction. Based on all available positive and negative evidence, we believe the sources of future taxable income are sufficient to realize the remainder of Nasdaq's deferred tax asset inventory.
Gross Lease Commitments | Sublease Income | Net Lease Commitments | |||||||||
| (in millions) | |||||||||||
| Year ending December 31: | |||||||||||
| 2018 | $ | 90 | $ | 3 | $ | 87 | |||||
| 2019 | 76 | 3 | 73 | ||||||||
| 2020 | 70 | 3 | 67 | ||||||||
| 2021 | 57 | 3 | 54 | ||||||||
| 2022 | 51 | 3 | 48 | ||||||||
| Thereafter | 113 | 3 | 110 | ||||||||
| Total future minimum lease payments | $ | 457 | $ | 18 | $ | 439 | |||||
Nasdaq has deferred tax assets associated with NOLs in U.S. state and local and non-U.S. jurisdictions with the following expiration dates:
| Jurisdiction | December 31, 2021 | Expiration Date | ||||||
| (in millions) | ||||||||
| Foreign NOL | $ | 12 | No expiration | |||||
| Federal NOL | 5 | No expiration | ||||||
| State NOL | 3 | 2025-2040 | ||||||
Unrecognized Tax Benefits
A reconciliation of the beginning and ending amount of unrecognized tax benefits is as follows:
| Year Ended December 31, | |||||||||||||||||
| 2022 | 2021 | 2020 | |||||||||||||||
| (in millions) | |||||||||||||||||
| Beginning balance | $ | 57 | $ | 42 | $ | 48 | |||||||||||
| Additions as a result of tax positions taken in prior periods | 13 | 16 | 9 | ||||||||||||||
| Additions as a result of tax positions taken in the current period | 9 | 11 | 2 | ||||||||||||||
| Reductions related to settlements with taxing authorities | (7) | (6) | (6) | ||||||||||||||
| Reductions as a result of lapses of the applicable statute of limitations | (2) | (6) | (11) | ||||||||||||||
| Ending balance | $ | 70 | $ | 57 | $ | 42 | |||||||||||
We had $70 million of unrecognized tax benefits as of December 31, 2022, $57 million as of December 31, 2021, and $42 million as of December 31, 2020 which, if recognized in the future, would affect our effective tax rate. Nasdaq does not believe that our unrecognized tax benefits will materially change over the next 12 months.
We recognize interest and/or penalties related to income tax matters in the provision for income taxes in our Consolidated Statements of Income, which was less than $1 million tax expense for operating leases (netthe year ended December 31, 2022, and a tax benefit of sublease income$2 million for both years ended December 31, 2021 and 2020. Accrued interest and penalties, net of $3tax effect were $5 million in 2017,as of December 31, 2022 and $4 million as of December 31, 2021.
Tax Audits
Nasdaq and its eligible subsidiaries file a consolidated U.S. federal income tax return and applicable state and local income tax returns and non-U.S. income tax returns. We are subject to examination by federal, state and local, and foreign tax authorities. Our Federal income tax return for the years 2019 through 2021 is subject to examination by the Internal Revenue Service. Several state tax returns are currently under examination by the respective tax authorities for the years 2012 through 2021. Non-U.S. tax returns are subject to examination by the respective tax authorities for the years 2017 through 2022. We regularly assess the likelihood of additional assessments by each jurisdiction and have established tax reserves that we believe are adequate in 2016,relation to the potential for additional assessments. Examination outcomes and $5 millionthe timing of examination settlements are subject to uncertainty. Although the results of such examinations may have an impact on our unrecognized tax benefits, we do not anticipate that such impact will be material to our consolidated financial position or results of operations. We do not expect to settle any material tax audits in 2015) was $83 million in 2017, $78 million in 2016, and $88 million in 2015. the next twelve months.
Guarantees Issued and Credit Facilities Available
In addition to the default fund contributions and margin collateral pledged by clearing members discussed in Note 17,15, “Clearing Operations,” we have obtained financial guarantees and credit facilities, which are guaranteed by us through counter indemnities, to provide further liquidity related to our clearing businesses. Financial guarantees issued to us totaled $14$4 million as of December 31, 20172022 and $13$5 million as of December 31, 2016.2021. As discussed in “Other Credit Facilities,” of Note 10,9, “Debt Obligations,” clearing-relatedwe also have credit facilities primarily related to our Nasdaq Clearing operations, which are available in multiple currencies, and totaled $187$184 million as of December 31, 20172022 and $170$212 million as of December 31, 2016,2021 in available liquidity, none of which was utilized.
Other Guarantees
Through our clearing operations in the financial markets, Nasdaq Clearing is the legal counterparty for, and guarantees the performance of, its clearing members. See Note 17,15, “Clearing Operations,” for further discussion of Nasdaq Clearing performance guarantees.
We have provided a guarantee related to lease obligations for The Nasdaq Entrepreneurial Center, Inc., which is a not-for-profit organization designed to convene, connect and engage aspiring and current entrepreneurs. This entity is not included in the consolidated financial statements of Nasdaq.
We believe that the potential for us to be required to make payments under these arrangements is unlikely. Accordingly, no contingent liability is recorded in the Consolidated Balance Sheets for the above guarantees.
F-40
Routing Brokerage Activities
One of our broker-dealer subsidiaries, Nasdaq Execution Services, provides a guarantee to securities clearinghouses and exchanges under its standard membership agreements, which require members to guarantee the performance of other members. If a member becomes unable to satisfy its obligations to a clearinghouse or exchange, other members would be required to meet its shortfalls. To mitigate these performance risks, the exchanges and clearinghouses often require members to post collateral, as well as meet certain minimum financial standards. Nasdaq Execution Services’ maximum potential liability under these arrangements cannot be quantified. However, we believe that the potential for Nasdaq Execution Services to be required to make payments under these arrangements is unlikely. Accordingly, no contingent liability is recorded in the Consolidated Balance Sheets for these arrangements.
Legal and Regulatory Matters
Armenian Stock Exchange Investigation
As previously disclosed in our prior filings with the SEC, a former non-U.S. subsidiary of Nasdaq, NASDAQ OMX Armenia OJSC, operated the Armenian Stock Exchange and the Central Depository of Armenia, which are regulated by the Central Bank of Armenia under Armenian law. In accordance with the requirements of Armenian law, Mellat Bank SB CJSC, an Armenian entity that is designated under Executive Order 13382, was a market participant on the Armenian Stock Exchange and, as a result, paid participation and transaction fees to the Armenian Stock Exchange during the period from 2012-2014. In 2014, we voluntarily self-disclosed this matter to the U.S. Department of Treasury’s Office of Foreign Assets Control, or OFAC, and received authorization from OFAC to continue, if necessary, certain activities pertaining to Mellat Bank SB CJSC in Armenia in a limited manner. In 2015, Nasdaq sold a majority of its ownership of Nasdaq OMX Armenia OJSC, with the remaining minority interest sold in 2018.
OFAC has been conducting an inquiry into the Armenian Stock Exchange matter described above and in our prior filings since 2016, and during the first quarter of 2021, we were named asadvised that OFAC is considering a defendantcivil monetary penalty in a putative class action, Rabin v. NASDAQ OMX PHLX LLC, et al., No. 15-551 (E.D. Pa.), filedconnection with that matter. We are currently in 2015discussions with OFAC.
We believe our decision to voluntarily self-report this issue and our continued cooperation with OFAC, along with the permit we received from OFAC in connection with our transactions involving the United States District Court for the Eastern District of Pennsylvania. On April 21, 2016, the court entered an order granting our motion to dismiss the complaint. The plaintiff appealed the dismissalArmenian Stock Exchange, will be mitigating factors with respect to the Courtmatter, and that any monetary fines or restrictions will not be material to our financial results. We cannot currently predict when our discussions with OFAC will conclude or the exact amount of Appealsany potential penalties imposed, but have accrued for an immaterial loss contingency.
CFTC Matter
In June 2022, NASDAQ Futures, Inc. (“NFX”), a non-operational, wholly-owned subsidiary of Nasdaq, received a telephonic “Wells Notice” from the Third Circuit on May 18, 2016. On October 25, 2017, the Third Circuit issued a decision affirming the dismissalstaff of the case, and on November 22, 2017, denied a petition for rehearing and rehearing en banc.
Nasdaq Commodities Clearing Default
In 2022, as a result from this litigation. However,of a decision received in the fourth quarter, we believe (asrecorded an adjustment to reduce a previous accrual recorded in 2021 related to an administrative fine issued by the district court concluded) thatSFSA associated with the claims are without meritdefault which occurred in 2018. The charge and will continue to litigate vigorously.subsequent adjustment were included in regulatory expense in our Consolidated Statements of Income for the years ended December 31, 2022 and 2021. See “Nasdaq Commodities Clearing Default,” of Note 15, “Clearing Operations,” for further information.
Other Matters
Except as disclosed above and in prior reports filed under the Exchange Act, we are not currently a party to any litigation or proceeding that we believe could have a material adverse effect on our business, consolidated financial condition, or operating
results. However, from time to time, we have been threatened with, or named as a defendant in, lawsuits or involved in regulatory proceedings.
F-41
In the normal course of business, Nasdaq discusses matters with its regulators raised during regulatory examinations or otherwise subject to their inquiry and oversight. These matters could result ininquiries. Management believes that censures, fines, penalties or other sanctions. Management believes the outcome ofsanctions that could result from any resulting actionsongoing examinations or inquiries will not have a material impact on its consolidated financial position or results of operations. However, we are unable to predict the outcome or the timing of the ultimate resolution of these matters, or the potential fines, penalties or injunctive or other equitable relief, if any, that may result from these matters.
Tax Audits
We are engaged in ongoing discussions and audits with taxing authorities on various tax matters, the resolutions of which are uncertain. Currently, there are matters that may lead to assessments, some of which may not be resolved for several years. Based on currently available information, we believe we have adequately provided for any assessments that could result from those proceedings where it is more likely than not that we will be assessed. We review our positions on these matters as they progress. See “Tax Audits,” of Note 17, “Income Taxes,” for further discussion.
This Annual Report on Form 10-K presents our results in alignment with the new corporate structure. All periods presented are restated to reflect the new structure.
Our management allocates resources, assesses performance and manages these businesses as fourthree separate segments. We evaluate the performance of our segments based on several factors, of which the primary financial measure is operating income. Results of individual businesses are presented based on our management accounting practices and structure.
Our chief operating decision maker does not review total assets or statements of income below operating income by segments as key performance metrics; therefore, such information is not presented below.The following table presents certain information regarding our operatingbusiness segments for the years ended December 31, 2017, 20162022, 2021 and 2015 :2020:
| Year Ended December 31, | |||||||||||||||||
| 2022 | 2021 | 2020 | |||||||||||||||
| Market Platforms | (in millions) | ||||||||||||||||
| Total revenues | $ | 4,225 | $ | 4,048 | $ | 4,179 | |||||||||||
| Transaction-based expenses | (2,644) | (2,466) | (2,722) | ||||||||||||||
| Revenues less transaction-based expenses | 1,581 | 1,582 | 1,457 | ||||||||||||||
| Depreciation and amortization* | 59 | 64 | 55 | ||||||||||||||
| Operating income | 859 | 893 | 784 | ||||||||||||||
| Purchase of property and equipment | 83 | 96 | 125 | ||||||||||||||
| Capital Access Platforms | |||||||||||||||||
| Total revenues | 1,684 | 1,568 | 1,287 | ||||||||||||||
| Depreciation and amortization* | 36 | 34 | 30 | ||||||||||||||
| Operating income | 916 | 844 | 651 | ||||||||||||||
| Purchase of property and equipment | 50 | 50 | 54 | ||||||||||||||
| Anti-Financial Crime | |||||||||||||||||
| Total revenues | 306 | 231 | 116 | ||||||||||||||
| Depreciation and amortization* | 10 | 8 | 6 | ||||||||||||||
| Operating income | 80 | 44 | 35 | ||||||||||||||
| Purchase of property and equipment | 19 | 17 | 9 | ||||||||||||||
| Corporate Items | |||||||||||||||||
| Total revenues | 11 | 39 | 43 | ||||||||||||||
| Depreciation and amortization | 153 | 172 | 111 | ||||||||||||||
| Operating loss | (291) | (340) | (236) | ||||||||||||||
| Consolidated | |||||||||||||||||
| Total revenues | $ | 6,226 | $ | 5,886 | $ | 5,625 | |||||||||||
| Transaction-based expenses | (2,644) | (2,466) | (2,722) | ||||||||||||||
| Revenues less transaction-based expenses | $ | 3,582 | $ | 3,420 | $ | 2,903 | |||||||||||
| Depreciation and amortization | $ | 258 | $ | 278 | $ | 202 | |||||||||||
| Operating income | $ | 1,564 | $ | 1,441 | $ | 1,234 | |||||||||||
| Purchase of property and equipment | $ | 152 | $ | 163 | $ | 188 | |||||||||||
| Market Services | Corporate Services | Information Services | Market Technology | Corporate Items | Consolidated | ||||||||||||||||||
| (in millions) | |||||||||||||||||||||||
| 2017 | |||||||||||||||||||||||
| Total revenues | $ | 2,418 | $ | 656 | $ | 588 | $ | 303 | $ | — | $ | 3,965 | |||||||||||
| Transaction-based expenses | (1,537 | ) | — | — | — | — | (1,537 | ) | |||||||||||||||
| Revenues less transaction-based expenses | 881 | 656 | 588 | 303 | — | 2,428 | |||||||||||||||||
| Depreciation and amortization | 95 | 49 | 25 | $ | 19 | — | 188 | ||||||||||||||||
| Operating income (loss) | 481 | 184 | 418 | $ | 65 | (149 | ) | 999 | |||||||||||||||
| Total assets | 9,471 | 866 | 3,420 | 627 | 1,402 | 15,786 | |||||||||||||||||
| Purchase of property and equipment | 59 | 41 | 10 | 34 | — | 144 | |||||||||||||||||
| 2016 | |||||||||||||||||||||||
| Total revenues | $ | 2,255 | $ | 635 | $ | 540 | $ | 275 | $ | — | $ | 3,705 | |||||||||||
| Transaction-based expenses | (1,428 | ) | — | — | — | — | (1,428 | ) | |||||||||||||||
| Revenues less transaction-based expenses | 827 | 635 | 540 | 275 | — | 2,277 | |||||||||||||||||
| Depreciation and amortization | 87 | 47 | 18 | 18 | — | 170 | |||||||||||||||||
| Operating income (loss) | 450 | 158 | 383 | 69 | (221 | ) | 839 | ||||||||||||||||
| Total assets | 8,626 | 1,263 | 2,439 | 559 | 1,263 | 14,150 | |||||||||||||||||
| Purchase of property and equipment | 62 | 37 | 8 | 27 | — | 134 | |||||||||||||||||
| 2015 | |||||||||||||||||||||||
| Total revenues | $ | 2,084 | $ | 562 | $ | 512 | $ | 245 | $ | — | $ | 3,403 | |||||||||||
| Transaction-based expenses | (1,313 | ) | — | — | — | — | (1,313 | ) | |||||||||||||||
| Revenues less transaction-based expenses | 771 | 562 | 512 | 245 | — | 2,090 | |||||||||||||||||
| Depreciation and amortization | 64 | 42 | 14 | 18 | — | 138 | |||||||||||||||||
| Operating income (loss) | 413 | 140 | 365 | 58 | (256 | ) | 720 | ||||||||||||||||
| Total assets | 6,906 | 576 | 2,456 | 752 | 1,171 | 11,861 | |||||||||||||||||
| Purchase of property and equipment | 53 | 38 | 11 | 31 | — | 133 | |||||||||||||||||
Certain amounts are allocated to corporate itemsCorporate Items in our management reports based on the decision that those activities shouldas we believe they do not be usedcontribute to evaluate the segment’sa meaningful evaluation of a particular segment's ongoing operating performance. The followingThese items, which are allocated to corporate items for segment reporting purposes:presented in the table below, include the following:
F-42
•Amortization expense of acquired intangible assets: We amortize intangible assets acquired in connection with various acquisitions. Intangible asset amortization expense can vary from period to period due to episodic acquisitions completed, rather than from our ongoing business operations. As such, if intangible asset amortization is included in performance measures, it is more difficult to assess the day-to-day operating performance of the segments, and the relative operating performance of the segments between periods. Management does not consider intangible asset amortization expense for the purpose of evaluating the performance of our segments or their managers or when making decisions to allocate resources. Therefore, we believe performance measures excluding intangible asset amortization expense provide management with a more useful representation of our segments' ongoing activity in each period.
•Merger and strategic initiatives expense:We have pursued various strategic initiatives and completed a number of acquisitions and divestitures in recent years whichthat have resulted in expenses which would not have otherwise been incurred. These expenses generally include integration costs, as well as legal, due diligence and other third partythird-party transaction costs. The frequency and the amount of such expenses vary significantly based on the size, timing and complexity of the transaction. Accordingly,Management does not consider merger and strategic initiatives expense for the purpose of evaluating the performance of our segments or their managers or when making decisions to allocate resources. Therefore, we do not allocatebelieve performance measures excluding merger and strategic initiatives expense provide management with a useful representation of our segments' ongoing activity in each period.
•Restructuring charges: In October 2022, following our September announcement to realign our segments and leadership, we initiated a divisional alignment program with a focus on realizing the full potential of this structure. In 2019, we initiated the transition of certain technology platforms to advance our strategic opportunities as a technology and analytics provider and continue the realignment of certain business areas. See Note 20, “Restructuring Charges,” for further discussion of these costsplans. We believe performance measures excluding restructuring charges provide management with a useful representation of our segments' ongoing activity in each period.
•Revenues and expenses - divested/contributed businesses: For 2022 and 2021, we have included in corporate items the revenues and expenses of our U.S. Fixed Income business, which was previously included in our Market Platforms and Capital Access Platforms results. See “2021 Divestiture,” of Note 4, “Acquisitions and Divestiture,” for purposesfurther discussion of disclosing segment results because they do not contributethis divestiture. Also included are the revenues and expenses of our Nordic broker services business for which we completed the wind-down in June 2022. For 2021 and 2020, we included in corporate items the revenues and expenses associated with the NPM business which we contributed to a meaningful evaluationstandalone, independent company, of which we own the largest minority interest, together with a particular segment’s ongoing operating performance.consortium of third-party financial institutions in July 2021. Prior to July, these revenues were previously included in our Capital Access Platforms results.
•Other significant items: We have excludedincluded certain other charges or gains that arein corporate items, to the resultextent we believe they should be excluded when evaluating the ongoing operating performance of other non-comparable events to measure operating performance. Foreach individual segment. Other items include:
◦for the year ended December 31, 2017,2022, accruals related to a legal matter, included in general, administrative and other significant items included loss on extinguishmentexpense in our Consolidated Statements of debtIncome and a sublease loss reserve charge recorded on space we currently occupy due to excess capacity. For 2016, other significant items primarily included a regulatory fine receivedmatter offset by our exchange in Stockholm and Nasdaq Clearing, the release of $5 million in relation to the reduction of the administrative fine issued by the SFSA included in regulatory expense in our Consolidated Statements of Income;
◦for the year ended December 31, 2021 a sublease loss reserve duecharge related to
an administrative fine imposed by the early exit of a facilitySFSA. The 2022 and costs2021 SFSA fine is associated with the accelerationdefault that occurred in 2018, see “Nasdaq Commodities Clearing Default,” of previously granted equity awards due toNote 15, “Clearing Operations,” for further discussion; and for the retirement of our former CEO. For 2015, other significant items includedyear ended December 31, 2020 the reversal of a VAT refund. We believeregulatory fine issued by the exclusionSFSA. All charges and releases have been included in regulatory expense in the Consolidated Statements of such amounts allows managementIncome;
◦for the year ended December 31, 2020, a provision for notes receivable associated with the funding of technology development for the consolidated audit trail;
◦for the years ended December 31, 2022, 2021 and investors2020, a charge on extinguishment of debt;
◦for the year ended December 31, 2020, charitable donations made to better understand the financial resultsNasdaq Foundation, COVID-19 response and relief efforts, and social justice charities; and
◦for the years ended December 31, 2022 and 2020, certain litigation costs which are recorded in professional and contract services expense in the Consolidated Statements of Nasdaq.Income.
The above charges are recorded in general, administrative and other expense, unless otherwise noted, in our Consolidated Statements of Income.
F-43
| Year Ended December 31, | |||||||||||
| 2017 | 2016 | 2015 | |||||||||
| (in millions) | |||||||||||
| Amortization expense of acquired intangible assets | $ | 92 | $ | 82 | $ | 62 | |||||
| Merger and strategic initiatives expense | 44 | 76 | 10 | ||||||||
| Restructuring charges | — | 41 | 172 | ||||||||
| Loss on extinguishment of debt | 10 | — | — | ||||||||
| Regulatory matter | 1 | 6 | — | ||||||||
| Sublease loss reserve | 2 | (1 | ) | — | |||||||
| Reversal of VAT refund receivables | — | — | 12 | ||||||||
| Executive compensation | — | 12 | — | ||||||||
| Other | — | 5 | — | ||||||||
| Total | $ | 149 | $ | 221 | $ | 256 | |||||
| Year Ended December 31, | |||||||||||||||||
| 2022 | 2021 | 2020 | |||||||||||||||
| (in millions) | |||||||||||||||||
| Revenues - divested/contributed businesses | $ | 11 | $ | 39 | $ | 43 | |||||||||||
| Expenses: | |||||||||||||||||
| Amortization expense of acquired intangible assets | 153 | 170 | 103 | ||||||||||||||
| Merger and strategic initiatives expense | 82 | 87 | 33 | ||||||||||||||
| Restructuring charges | 15 | 31 | 48 | ||||||||||||||
| Regulatory matters | 1 | 33 | (6) | ||||||||||||||
| Provision for notes receivable | — | — | 6 | ||||||||||||||
| Extinguishment of debt | 16 | 33 | 36 | ||||||||||||||
| Charitable donations | — | — | 17 | ||||||||||||||
| Expenses - divested/contributed businesses | 5 | 16 | 24 | ||||||||||||||
| Other | 30 | 9 | 18 | ||||||||||||||
| Total expenses | 302 | 379 | 279 | ||||||||||||||
| Operating loss | $ | (291) | $ | (340) | $ | (236) | |||||||||||
For further discussion of our segments’ results, see “Segment Operating Results,” of “Item 7. Management’s Discussion and Analysis of Financial Condition and Results of Operations—Segment Operating Results.Operations.”
Geographic Data
The following table presents total revenues and property and equipment, net by geographic area for 2017, 20162022, 2021 and 2015.2020. Revenues are classified based upon the location of the customer. Property and equipment information is based on the physical location of the assets.
| Total Revenues | Property and Equipment, Net | |||||||||||||||||
Total Revenues | Property and Equipment, Net | |||||||||||||||||
| (in millions) | ||||||||||||||||||
| 2017: | ||||||||||||||||||
| 2022: | 2022: | (in millions) | ||||||||||||||||
| United States | $ | 3,062 | $ | 247 | United States | $ | 5,100 | $ | 344 | |||||||||
| All other countries | 903 | 153 | All other countries | 1,126 | 188 | |||||||||||||
| Total | $ | 3,965 | $ | 400 | Total | $ | 6,226 | $ | 532 | |||||||||
| 2016: | ||||||||||||||||||
| 2021: | 2021: | |||||||||||||||||
| United States | $ | 2,659 | $ | 244 | United States | $ | 4,822 | $ | 325 | |||||||||
| All other countries | 1,046 | 118 | All other countries | 1,064 | 184 | |||||||||||||
| Total | $ | 3,705 | $ | 362 | Total | $ | 5,886 | $ | 509 | |||||||||
| 2015: | ||||||||||||||||||
| 2020: | 2020: | |||||||||||||||||
| United States | $ | 2,408 | $ | 217 | United States | $ | 4,662 | $ | 311 | |||||||||
| All other countries | 995 | 106 | All other countries | 963 | 164 | |||||||||||||
| Total | $ | 3,403 | $ | 323 | Total | $ | 5,625 | $ | 475 | |||||||||
Our property and equipment, net for all other countries primarily includes assets held in Sweden.
No single customer accounted for 10.0% or more of our revenues in 2017, 20162022, 2021 and 2015.2020.
20. RESTRUCTURING CHARGES
In October 2022, following our September announcement to realign our segments and leadership, we initiated a divisional alignment program with a focus on realizing the full potential of this structure. In connection with the program, we expect to incur $115 million to $145 million in pre-tax charges principally related to employee-related costs, consulting, asset impairments and contract terminations over a two-year period. We expect to achieve benefits, in the form of combined annual run rate operating efficiencies and revenue synergies of approximately $30 million annually by 2025. Costs related to the divisional alignment program will be recorded as restructuring charges in the Consolidated Statements of Income.
In September 2019, we initiated the transition of certain technology platforms to advance the Company's strategic opportunities as a technology and analytics provider and continue the realignment of certain business areas. In connection with these restructuring efforts, we retired certain elements of our market infrastructure and technology product offerings as we implement NFF and other technologies internally and externally. This represented a fundamental shift in our strategy and technology as well as executive realignment. In June 2021, we completed our 2019 restructuring plan and recognized total pre-tax charges of $118 million over a two-year period. Total pre-tax charges related primarily to non-cash items such as asset impairments and accelerated depreciation, and third-party consulting costs. Severance and employee-related charges were also incurred.
The following table presents a summary of the 2022 and 2019 restructuring plan charges in the Consolidated Statements of Income for the years ended December 31, 2022, 2021 and 2020.
| Year Ended December 31, | |||||||||||||||||
| 2022 | 2021 | 2020 | |||||||||||||||
| (in millions) | |||||||||||||||||
| Asset impairment charges | $ | 8 | $ | 4 | $ | 14 | |||||||||||
| Consulting services | 3 | 19 | 22 | ||||||||||||||
| Contract terminations | — | — | 3 | ||||||||||||||
| Employee-related costs | 3 | 1 | 3 | ||||||||||||||
| Other | 1 | 7 | 6 | ||||||||||||||
| Total restructuring charges | $ | 15 | $ | 31 | $ | 48 | |||||||||||
F-44