| — | | – | special Director voting rights; and |
| — | | – | the ability of the Board of Directors to consider the interests of various constituencies, including our employees, customers, suppliers, creditors and the local communities in which we operate. |
Gerald B. Shreiber is the founder of the Company and the current beneficial owner of 22% of its outstanding stock. Our Certificate of Incorporation provides that he has three votes on the Board of Directors (subject to certain adjustments). Therefore, he and one other director have voting control of the Board. The performance of this Company is greatly impacted by his leadership and decisions. His voting control reduces the restrictions on his actions. His retirement, disability or death will have a significant impact on our future operations. Gerald B. Shreiber is the founder of the Company and the current beneficial owner of 24% of its outstanding stock. Our Certificate of Incorporation provides that he has three votes on the Board of Directors (subject to certain adjustments). Therefore, he and one other director have voting control of the Board. The performance of this Company is greatly impacted by his leadership and decisions. His voting control reduces the restrictions on his actions. His retirement, disability or death will have a significant impact on our future operations.
Risk Related to Product Changes |
There are risks in the marketplace related to trade and consumer acceptance of product improvements, packing initiatives and new product introductions.
There are risks in the marketplace related to trade and consumer acceptance of product improvements, packing initiatives and new product introductions.
Risks Related to Change in the Business |
Our ability to successfully manage changes to our business processes, including selling, distribution, product capacity, information management systems and the integration of acquisitions, will directly affect our results of operations. Our ability to successfully manage changes to our business processes, including selling, distribution, product capacity, information management systems and the integration of acquisitions, will directly affect our results of operations.
Risks Associated with Foreign Operations |
Foreign operations generally involve greater risk than doing business in the United States. Foreign economies differ favorably or unfavorably from the United States’ economy in such respects as the level of inflation and debt, which may result in fluctuations in the value of the country’s currency and real property. Further, there may be less government regulation in various countries, and difficulty in enforcing legal rights outside the United States. Additionally, in some foreign countries, there is the possibility of expropriation or confiscatory taxation limitations on the removal of property or other assets, political or social instability or diplomatic developments which could affect the operations and assets of U.S. companies doing business in that country. Sales of our foreign operations were $11,658,000, $11,078,000, and $9,785,000 in fiscal years 2009, 2008 and 2007, respectively. At September 26, 2009, the total assets of our foreign operations were approximately $8.5 million or 2% of total assets. Foreign operations generally involve greater risk than doing business in the United States. Foreign economies differ favorably or unfavorably from the United States’ economy in such respects as the level of inflation and debt, which may result in fluctuations in the value of the country’s currency and real property. Further, there may be less government regulation in various countries, and difficulty in enforcing legal rights outside the United States. Additionally, in some foreign countries, there is the possibility of expropriation or confiscatory taxation limitations on the removal of property or other assets, political or social instability or diplomatic developments which could affect the operations and assets of U.S. companies doing business in that country. Sales of our foreign operations were $7,889,000, $7,034,000 and $5,694,000 in years 2006, 2005 and 2004, respectively. At September 30, 2006, the total assets of our foreign operations were approximately $5.3 million or 2% of total assets.
Seasonality and Quarterly Fluctuations |
Our sales are affected by the seasonal demand for our products. Demand is greater during the summer months primarily as a result of the warm weather demand for our ICEE and frozen juice treats and desserts products. Because of seasonal fluctuations, there can be no assurance that the results of any particular quarter will be indicative of results for the full year or for future years. Our sales are affected by the seasonal demand for our products. Demand is greater during the summer months primarily as a result of the warm weather demand for our ICEE and frozen juice bar products. Because of seasonal fluctuations, there can be no assurance that the results of any particular quarter will be indicative of results for the full year or for future years.
Item 1B.Unresolved Staff Comments |
We have no unresolved SEC staff comments to report. We have no unresolved SEC staff comments to report.
Back to Contents
| Item 2.Properties | The Company’s primary east coast manufacturing facility is located in Pennsauken, New Jersey in a 70,000 square foot building on a two-acre lot. Soft pretzels are manufactured at this Company-owned facility which also serves as the Company’s corporate headquarters. This facility operates at approximately 65% of capacity. The Company leases a 101,200 square foot building adjacent to its manufacturing facility in Pennsauken, New Jersey through March 2022. The Company has constructed a large freezer within this facility for warehousing and distribution purposes. The warehouse has a utilization rate of 80-90% depending on product demand. The Company also leases, through January 2022, 16,000 square feet of office and warehouse space located next to the Pennsauken, New Jersey plant. The Company leases through January 2011 an additional 23,000 square feet of warehouse space several blocks distant from these facilities. The Company owns a 150,000 square foot building on eight acres in Bellmawr, New Jersey. The facility is used by the Company to manufacture some of its products including funnel cake, pretzels, churros and cookies. The facility operates at about 85% of capacity. 8
PropertiesTable of Contents
The Company’s primary west coast manufacturing facility is located in Vernon (Los Angeles), California. It consists of a 137,000 square foot facility in which soft pretzels, churros and various lines of baked goods are produced and warehoused. Included in the 137,000 square foot facility is a 30,000 square foot freezer used for warehousing and distribution purposes which was constructed in 1996. The facility is leased through November 2017. The Company leases an additional 45,000 square feet of office and warehouse space, adjacent to its manufacturing facility, through November 2017. The manufacturing facility operates at approximately 55% of capacity. |
The Company leases through November 2017 a 25,000 square foot frozen juice treat and dessert manufacturing facility located in Norwalk (Los Angeles), California which operates at approximately 50% of capacity. The Company leases an 85,000 square foot bakery manufacturing facility located in Atlanta, Georgia. The lease runs through December 2010. The facility operates at about 55% of capacity. The Company owns a 46,000 square foot frozen juice treat and dessert manufacturing facility and a 42,000 square foot dry storage warehouse located on six acres in Scranton, Pennsylvania. The manufacturing facility, which was expanded from 26,000 square feet in 1998, operates at approximately 60% of capacity. The Company leases a 29,600 square foot soft pretzel manufacturing facility located in Hatfield, Pennsylvania. The lease runs through June 2017. The facility operates at approximately 60% of capacity. The Company leases a 19,200 square foot soft pretzel manufacturing facility located in Carrollton, Texas. The lease runs through April 2016. The facility operates at approximately 80% of capacity. The Company leases an additional property containing a 6,500 square foot storage freezer across the street from the manufacturing facility, which lease expires May 2016. The Company leases an 18,000 square foot soft pretzel manufacturing facility located in Chambersburg, Pennsylvania. The lease runs through September 2010 with options to extend the term. The facility operates at approximately 50% of capacity. The Company’s fresh bakery products manufacturing facility and offices are located in Bridgeport, New Jersey in three buildings totaling 133,000 square feet. The buildings are leased through December 2015. The manufacturing facility operates at approximately 45% of capacity. The Company owns a 65,000 square foot fig and fruit bar manufacturing facility located on 9-1/2 acres in Moscow Mills (St. Louis), Missouri. The facility operates at about 65% of capacity. The Company leases a building in Pensacola, Florida for the manufacturing, packing and warehousing of dumplings. The building is approximately 14,000 square feet and the lease runs through December 2010. The manufacturing facility operates at approximately 75% of capacity. The Company’s Bavarian Pretzel Bakery headquarters and warehouse and distribution facilities are owned and located in an 11,000 square foot building in Lancaster, Pennsylvania. The Company also leases approximately 134 warehouse and distribution facilities in 44 states, Mexico and Canada. The Company’s primary east coast manufacturing facility is located in Pennsauken, New Jersey in a 70,000 square foot building on a two-acre lot. Soft pretzels are manufactured at this Company-owned facility which also serves as the Company’s corporate headquarters. This facility operates at approximately 70% of capacity. The Company leases a 101,200 square foot building adjacent to its manufacturing facility in Pennsauken, New Jersey through March 2012. The Company has constructed a large freezer within this facility for warehousing and distribution purposes. The warehouse has a utilization rate of 80-90% depending on product demand. The Company also leases, through September 2011, 16,000 square feet of office and warehouse space located next to the Pennsauken, New Jersey plant.
The Company owns a 150,000 square foot building on eight acres in Bellmawr, New Jersey. Approximately 30% of the facility is leased to a third party. The amount of the sublease income is not material to the Company’s financial statements. The remainder is used by the Company to manufacture some of its products including funnel cake, pretzels, churros and cookies. The facility operates at about 50% of capacity.
The Company’s primary west coast manufacturing facility is located in Vernon (Los Angeles), California. It consists of a 137,000 square foot facility in which soft pretzels, churros and various lines of baked goods are produced and warehoused. Included in the 137,000 square foot facility is a 30,000 square foot freezer used for warehousing and distribution purposes which was constructed in 1996. The facility is leased through November 2017. The Company leases an additional 45,000 square feet of office and warehouse space adjacent to its manufacturing facility through November 2017. The manufacturing facility operates at approximately 70% of capacity.
The Company leases an 85,000 square foot bakery manufacturing facility located in Atlanta, Georgia. The lease runs through December 2010. The facility operates at about 50% of capacity.
The Company owns a 46,000 square foot frozen juice treat and dessert manufacturing facility located on three acres in Scranton, Pennsylvania. The facility, which was expanded from 26,000 square feet in 1998, operates at approximately 75% of capacity.
The Company leases a 29,635 square foot soft pretzel manufacturing facility located in Hatfield, Pennsylvania. The lease runs through June 2017. The facility operates at approximately 65% of capacity.
The Company leases a 19,200 square foot soft pretzel manufacturing facility located in Carrollton, Texas. The lease runs through April 2011. The facility operates at approximately 80% of capacity. The Company leases an additional property containing a 6,500 square foot storage freezer across the street from the manufacturing facility, which lease expires May 2016.
The Company leases an 18,000 square foot soft pretzel manufacturing facility located in Chambersburg, Pennsylvania. The lease runs through September 2007 with options to extend the term. The facility operates at approximately 60% of capacity.
The Company’s fresh bakery products manufacturing facility and offices are located in Bridgeport, New Jersey in two buildings totaling 94,320 square feet. The buildings are leased through December 2011. The manufacturing facility operates at approximately 40% of capacity.
The Company’s Bavarian Pretzel Bakery headquarters and warehouse and distribution facilities are owned and located in an 11,000 square foot building in Lancaster, Pennsylvania.
The Company also leases approximately 125 warehouse and distribution facilities in 44 states, Mexico and Canada.
The Company has no material pending legal proceedings, other than ordinary routine litigation incidental to the business, to which the Company or any of its subsidiaries is a party or of which any of their property is subject. The Company has no material pending legal proceedings, other than ordinary routine litigation incidental to the business, to which the Company or any of its subsidiaries is a party or of which any of their property is subject.
Back to Contents
| Item 4. | Submission Of Matters To A Vote Of Security Holders |
There were no matters submitted to a vote of the security holders during the quarter ended September 26, 2009. 9
There were no matters submitted to a vote of the security holders during the quarter ended September 30, 2006.
Back to Contents
PART II
Table of ContentsItem 5. | Market For Registrant’s Common Equity, Related Stockholder Matters And Issuer Purchases Of Equity SecuritiesPART II
|
The Company’s common stock is traded on the NASDAQ Global Select Market under the symbol “JJSF.” The following table sets forth the high and low sale price quotations as reported by NASDAQ for the common stock for each quarter of the years ended September 24, 2005 and September 30, 2006.
| | | High | | Low | | | | |
|
| |
|
| | Fiscal 2005 | | | | | | | | | First quarter | | $ | 24.68 | | $ | 20.13 | | | Second quarter | | | 25.20 | | | 21.55 | | | Third quarter | | | 27.52 | | | 22.43 | | | Fourth quarter | | | 30.00 | | | 25.48 | | | | | | | | | | | Fiscal 2006 | | | | | | | | | First quarter | | $ | 32.34 | | $ | 26.55 | | | Second quarter | | | 35.22 | | | 29.09 | | | Third quarter | | | 35.51 | | | 29.76 | | | Fourth quarter | | | 33.94 | | | 28.58 | |
On November 20, 2006, there were 18,498,826 shares of common stock outstanding. Those shares were held by approximately 2,600 beneficial shareholders and shareholders of record.
A 2-for-1 stock split per common share was distributed January 5, 2006 to shareholders of record on December 15, 2005. All share amounts in this Form 10-K reflect the stock split.
The Company paid cash dividends of $5,273,000 and $3,400,000 in fiscal years 2006 and 2005, respectively.
The Company’s Board of Directors declared a cash dividend of $.075 per common share payable October 5, 2006 to shareholders of record on September 15, 2006, and a cash dividend of $.085 per common share payable January 4, 2007 to shareholders of record on December 15, 2006. The cash dividend of $.085/share represents a 13% increase from the previous quarterly dividend rate of $.075/share. The Company anticipates that its Board of Directors will continue to declare quarterly cash dividends; however, the continuance of cash dividends is not guaranteed and is dependent on many factors.
The Company did not repurchase any of its common stock in fiscal years 2006, 2005 and 2004.
For information on the Company’s Equity Compensation Plans, please see Item 12 herein.
| | Market For Registrant’s Common Equity, Related Stockholder Matters And Issuer Purchases Of Equity Securities |
The Company’s common stock is traded on the NASDAQ Global Select Market under the symbol “JJSF.” The following table sets forth the high and low sale price quotations as reported by NASDAQ and dividend information for the common stock for each quarter of the years ended September 27, 2008 and September 26, 2009. Common Stock Market Price | | | | High
| | Low
| | Declared
Dividend
|
|---|
Fiscal 2008
| | | | | | | | | | | | | | | | First quarter | | | | $ | 38.76 | | | $ | 29.01 | | | $ | .0925 | | | Second quarter | | | | | 31.85 | | | | 23.38 | | | | .0925 | | | Third quarter | | | | | 29.97 | | | | 26.74 | | | | .0925 | | | Fourth quarter | | | | | 36.07 | | | | 27.00 | | | | .0925 | | Fiscal 2009
| | | | | | | | | | | | | | | | First quarter | | | | $ | 34.50 | | | $ | 24.07 | | | $ | .0975 | | | Second quarter | | | | | 36.57 | | | | 30.12 | | | | .0975 | | | Third quarter | | | | | 40.14 | | | | 32.10 | | | | .0975 | | | Fourth quarter | | | | | 44.75 | | | | 35.17 | | | | .0975 | |
As of November 20, 2009, there were about 6,000 beneficial shareholders. In our fiscal year ended September 26, 2009, we purchased and retired 450,597 shares of our common stock at a cost of $12,510,000 under a million share buyback authorization approved by the Company’s Board of Directors in February 2008. No shares were repurchased in the fourth quarter of the year. Of the shares purchased and retired in 2009, 400,000 shares were purchased at the purchase price of $27.90 per share from Gerald B. Shreiber, Chairman of the Board, Chief Executive Officer and Director of the Company. In our 2008 fiscal year ended September 27, 2008, we purchased and retired 135,124 shares of our common stock at a cost of $3,539,000. The Company did not repurchase any of its common stock in fiscal year 2007. For information on the Company’s Equity Compensation Plans, please see Item 12 herein. 10
Table of Contents Stock Performance Graph | Selected Financial Data |
| | | Fiscal year ended in September
(In thousands except per share data) | | | | |
| | | | | 2006 | | 2005 | | 2004 | | 2003 | | 2002 | | | | |
|
| |
|
| |
|
| |
|
| |
|
| | | Net Sales | | $ | 514,831 | | $ | 457,112 | | $ | 416,588 | | $ | 364,567 | | $ | 353,187 | | | Net Earnings | | $ | 29,450 | | $ | 26,043 | | $ | 22,710 | | $ | 19,902 | | $ | 18,113 | | | Total Assets | | $ | 340,808 | | $ | 305,924 | | $ | 277,424 | | $ | 239,478 | | $ | 220,036 | | | Long-Term Debt | | $ | — | | $ | — | | $ | — | | $ | — | | $ | — | | | Stockholders’ Equity | | $ | 262,873 | | $ | 234,762 | | $ | 210,096 | | $ | 182,564 | | $ | 168,709 | | | | | | | | | | | | | | | | | | | | | Common Share Data | | | | | | | | | | | | | | | | | | Earnings Per Diluted Share | | $ | 1.57 | | $ | 1.40 | | $ | 1.24 | | $ | 1.10 | | $ | 1.00 | | | Earnings Per Basic Share | | $ | 1.60 | | $ | 1.43 | | $ | 1.27 | | $ | 1.13 | | $ | 1.04 | | | Book Value Per Share | | $ | 14.23 | | $ | 12.85 | | $ | 11.67 | | $ | 10.43 | | $ | 9.48 | | | Common Shares Outstanding At Year End | | | 18,468 | | | 18,272 | | | 18,012 | | | 17,514 | | | 17,806 | | | Cash Dividends Declared Per Common Share | | $ | .30 | | $ | .25 | | $ | — | | $ | — | | $ | — | |
The selected financial data for the last five years was derived from our audited consolidated financial statements. The following selected financial data should be read in conjunction with “Management’s Discussion and Analysis of Financial Condition and Results of Operations” and our consolidated financial statements and related notes thereto, especially as the information pertains to fiscal 2007, 2008 and 2009. | | | | Fiscal year ended in September
(In thousands except per share data)
| |
|---|
| | | | 2009
| | 2008
| | 2007
| | 2006
| | 2005
|
|---|
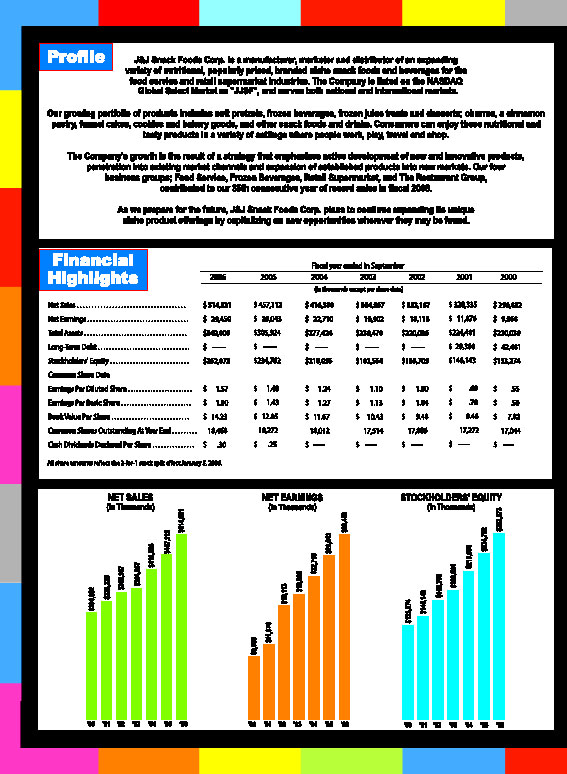
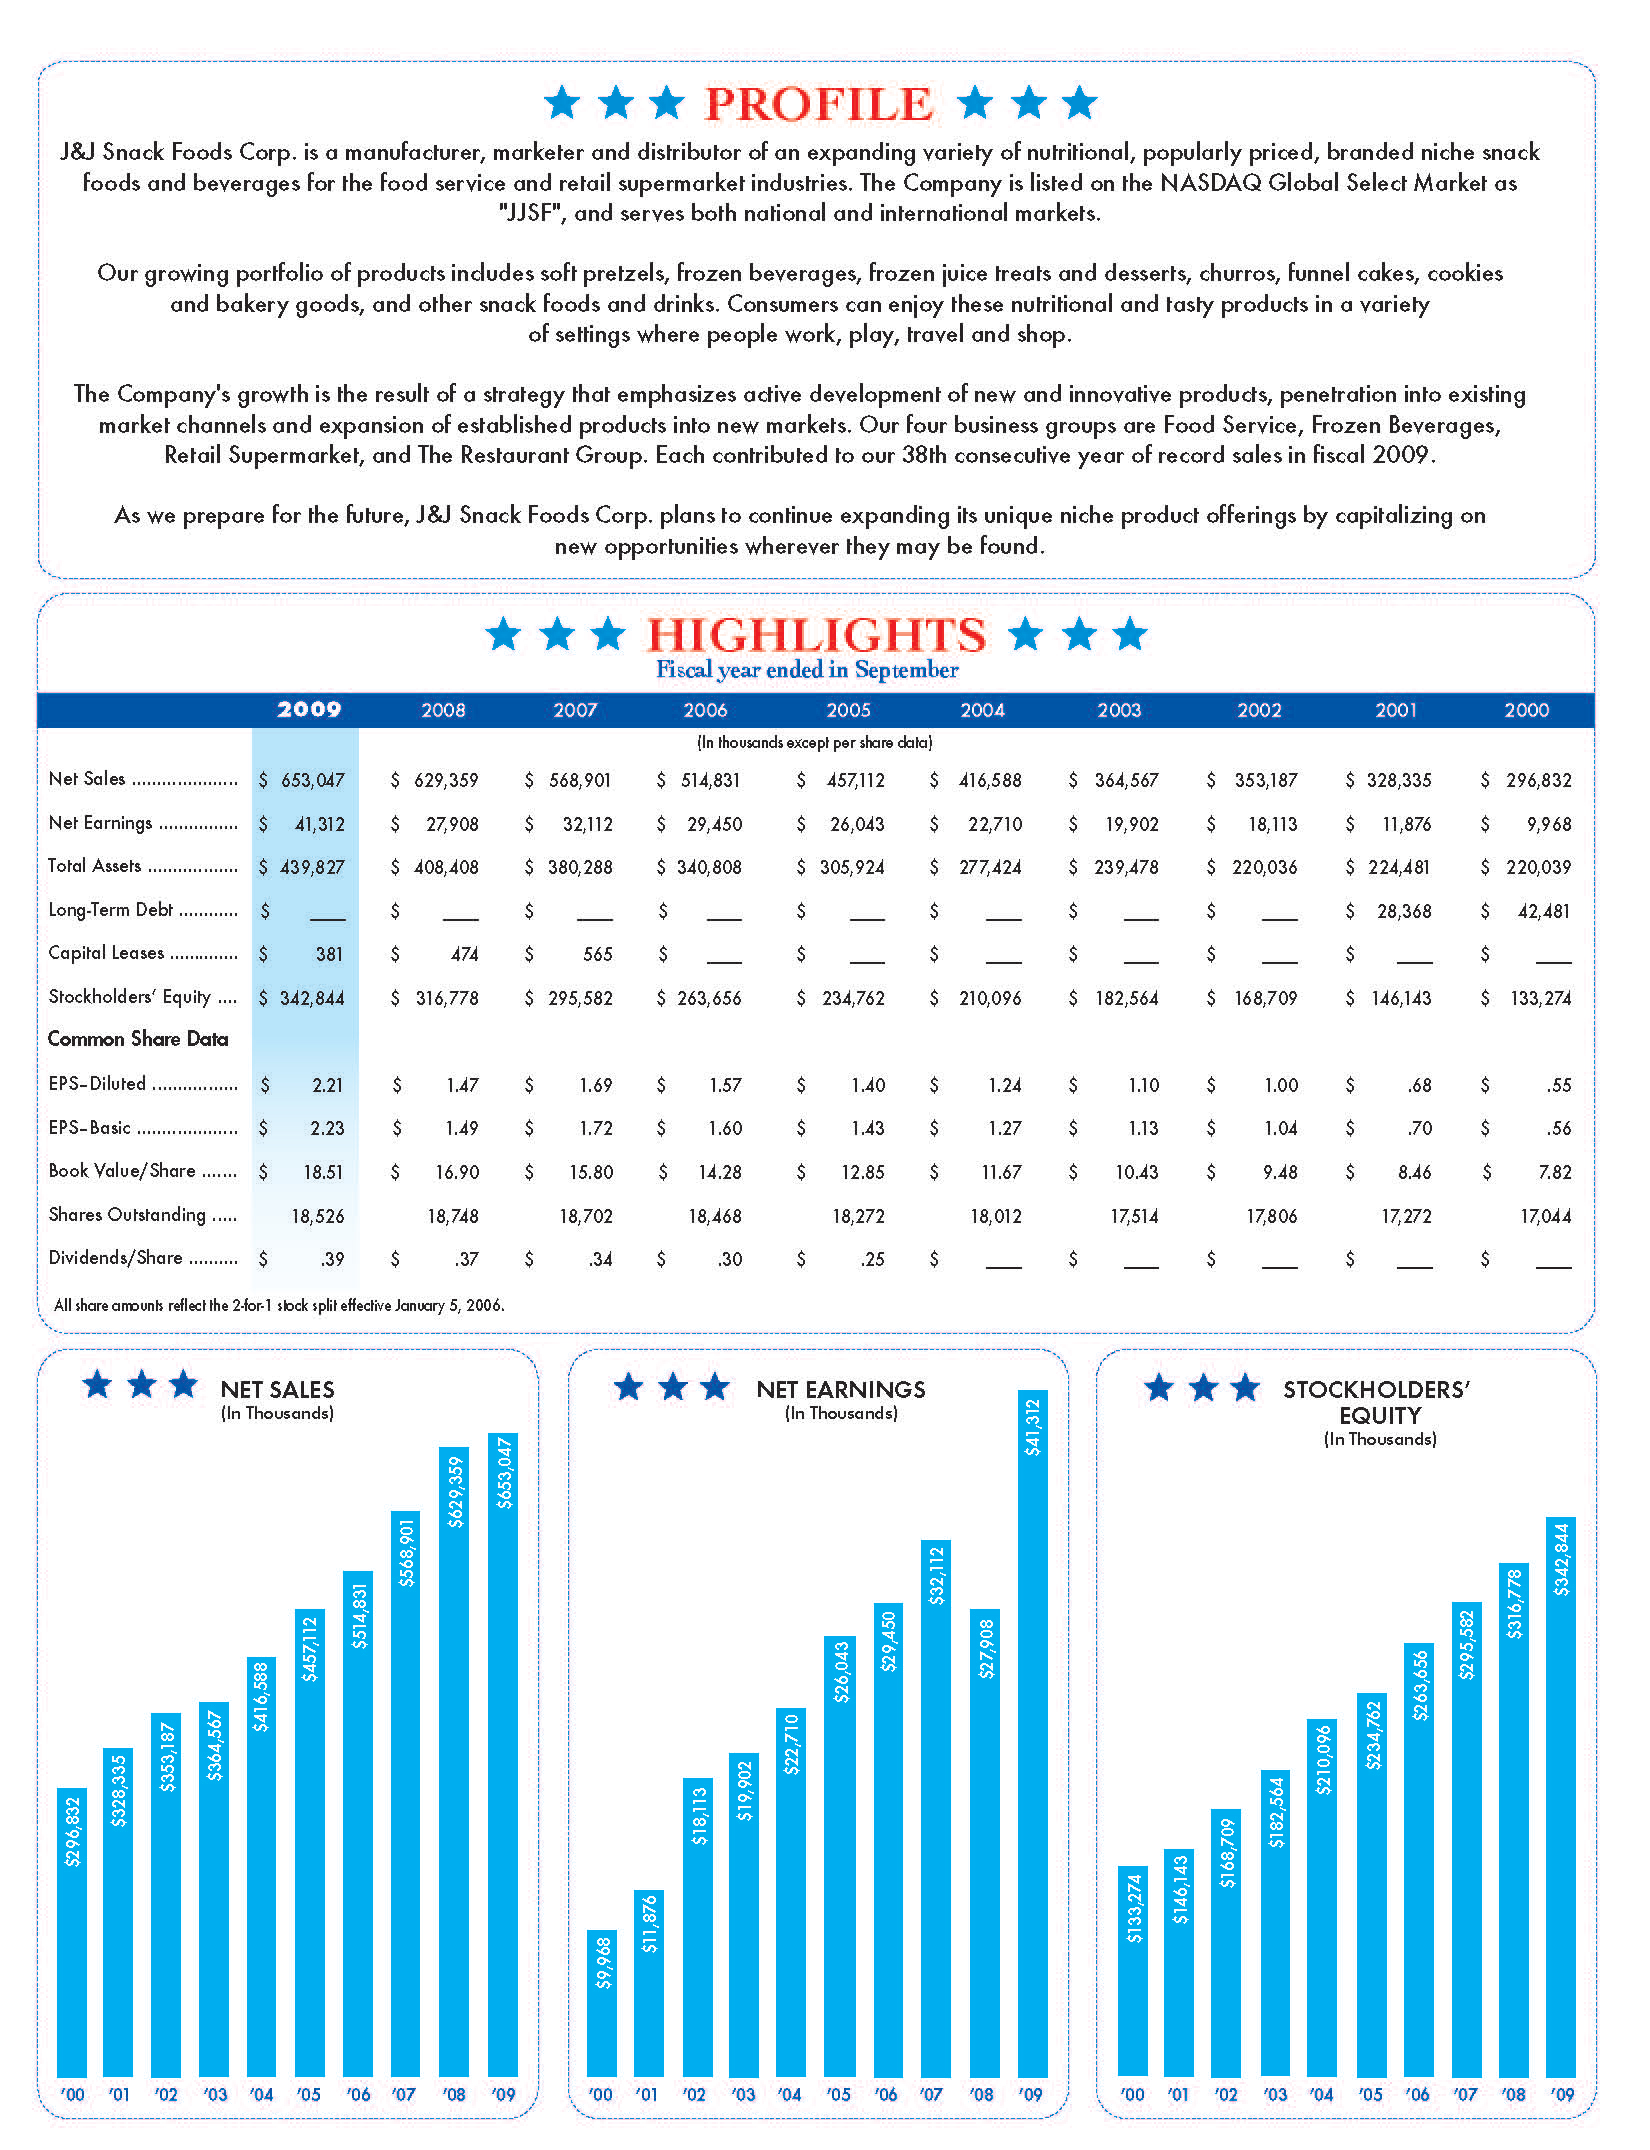
| Net Sales | | | | $ | 653,047 | | | $ | 629,359 | | | $ | 568,901 | | | $ | 514,831 | | | $ | 457,112 | | | Net Earnings | | | | $ | 41,312 | | | $ | 27,908 | | | $ | 32,112 | | | $ | 29,450 | | | $ | 26,043 | | | Total Assets | | | | $ | 439,827 | | | $ | 408,408 | | | $ | 380,288 | | | $ | 340,808 | | | $ | 305,924 | | | Long-Term Debt | | | | $ | — | | | $ | — | | | $ | — | | | $ | — | | | $ | — | | | Capital Lease Obligations | | | | $ | 381 | | | $ | 474 | | | $ | 565 | | | $ | — | | | $ | — | | | Stockholders’ Equity | | | | $ | 342,844 | | | $ | 316,778 | | | $ | 295,582 | | | $ | 263,656 | | | $ | 234,762 | | | | Common Share Data
| | | | | | | | | | | | | | | | | | | | | | | | Earnings Per Diluted Share | | | | $ | 2.21 | | | $ | 1.47 | | | $ | 1.69 | | | $ | 1.57 | | | $ | 1.40 | | | Earnings Per Basic Share | | | | $ | 2.23 | | | $ | 1.49 | | | $ | 1.72 | | | $ | 1.60 | | | $ | 1.43 | | | Book Value Per Share | | | | $ | 18.51 | | | $ | 16.90 | | | $ | 15.80 | | | $ | 14.28 | | | $ | 12.85 | | | Common Shares Outstanding At Year End | | | | | 18,526 | | | | 18,748 | | | | 18,702 | | | | 18,468 | | | | 18,272 | | Cash Dividends Declared
Per Common Share | | | | $ | .39 | | | $ | .37 | | | $ | .34 | | | $ | .30 | | | $ | .25 | |
11
Table of Contents
Back to Contents
| Item 7. | Management’s Discussion And Analysis Of Financial Condition And Results Of Operations |
In addition to historical information, this document and analysis contains forward-looking statements. The forward-looking statements contained herein are subject to certain risks and uncertainties that could cause actual results to differ materially from those projected in the forward-looking statements. Important factors that might cause such a difference include, but are not limited to, those discussed in the “Management’s Discussion and Analysis of Financial Condition and Results of Operations.” Readers are cautioned not to place undue reliance on these forward-looking statements, which reflect management’s analysis only as of the date hereof. We undertake no obligation to publicly revise or update these forward-looking statements to reflect events or circumstances that arise after the date hereof. In addition to historical information, this discussion and analysis contains forward-looking statements. The forward-looking statements contained herein are subject to certain risks and uncertainties that could cause actual results to differ materially from those projected in the forward-looking statements. Important factors that might cause such a difference include, but are not limited to, those discussed in the “Management’s Discussion and Analysis of Financial Condition and Results of Operations.” Readers are cautioned not to place undue reliance on these forward-looking statements which reflect management’s analysis only as of the date hereof. We undertake no obligation to publicly revise or update these forward-looking statements to reflect events or circumstances that arise after the date hereof.
Critical Accounting Policies, Judgments and Estimates |
We prepare our financial statements in conformity with accounting principles generally accepted in the United States of America. The preparation of such financial statements requires management to make estimates and assumptions that affect the reported amounts of assets and liabilities and disclosures of contingent assets and liabilities at the date of those financial statements and the reported amounts of revenues and expenses during the reporting period. Actual results could differ from those estimates. The Company discloses its significant accounting policies in the accompanying notes to its audited consolidated financial statements. Judgments and estimates of uncertainties are required in applying the Company’s accounting policies in certain areas. Following are some of the areas requiring significant judgments and estimates: revenue recognition, accounts receivable, cash flow and valuation assumptions in performing asset impairment tests of long-lived assets, estimates of the useful lives of intangible assets and insurance reserves. There are numerous critical assumptions that may influence accounting estimates in these and other areas. We base our critical assumptions on historical experience, third-party data and various other estimates we believe to be reasonable. A description of the aforementioned policies follows: Revenue Recognition — We recognize revenue from our products when the products are shipped to our customers and when equipment service is performed for our customers who are charged on a time and material basis. We also sell equipment service contracts with terms of coverage ranging between 12 and 60 months. We record deferred income on equipment service contracts which is amortized by the straight-line method over the term of the contracts. Revenue is recognized only where persuasive evidence of an arrangement exists, our price is fixed or determinable and collectability is reasonably assured. We record offsets to revenue for allowances, end-user pricing adjustments, trade spending, coupon redemption costs and returned product. Customers generally do not have the right to return product unless it is damaged or defective. Off-invoice allowances are deducted directly from the amount invoiced to our customer when our products are shipped to the customer. Offsets to revenue for allowances, end-user pricing adjustments and trade spending are recorded primarily as a reduction of accounts receivable based on our estimates of liability which are based on customer programs and historical experience. These offsets to revenue are based primarily on the quantity of product purchased over specific time periods. For our Retail Supermarket and Frozen Beverages segments, we accrue for the liability based on products sold multiplied by per product offsets. Offsets to revenue for our Food Service segment are calculated in a similar manner for offsets owed to our direct customers; however, because shipments to end-users are unknown to us until reported by our direct customers or by the end-users, there is a greater degree of uncertainty as to the accuracy of the amounts accrued for end-user offsets. Additional uncertainty may occur as customers take deductions when they make payments to us. This creates complexities because our customers do not always provide reasons for the deductions taken. Additionally, customers may take deductions to which they are not entitled and the length of time customers take deductions to which they are entitled can vary from two weeks to well over a year. Because of the aforementioned uncertainties, the process to determine the amount of liability to record is cumbersome and subject to inaccuracies. However, we feel that due to constant monitoring of the process, any inaccuracies would not be material. Our recorded liability for allowances, end-user pricing adjustments and trade spending was approximately $14,000,000 and $12,090,000 at September 26, 2009 and September 27, 2008, respectively. Accounts Receivable — We record accounts receivable at the time revenue is recognized. Bad debt expense is recorded in marketing and administrative expenses. The amount of the allowance for doubtful accounts is based 12
Table of America. The preparation of such financial statements requires management to make estimates and assumptions that affect the reported amounts of assets and liabilities and disclosures of contingent assets and liabilities at the date of those financial statements and the reported amounts of revenues and expenses during the reporting period. Actual results could differ from those estimates. The Company discloses its significant accounting policies in the accompanying notes to its audited consolidated financial statements.
Judgments and estimates of uncertainties are required in applying the Company’s accounting policies in certain areas. Following are some of the areas requiring significant judgments and estimates: revenue recognition, accounts receivable, cash flow and valuation assumptions in performing asset impairment tests of long-lived assets, estimates of the useful lives of intangible assets and insurance reserves.
There are numerous critical assumptions that may influence accounting estimates in these and other areas. We base our critical assumptions on historical experience, third-party data and various other estimates we believe to be reasonable. A description of the aforementioned policies follows:
Revenue Recognition — We recognize revenue from our products when the products are shipped to our customers and when equipment service is performed for our customers who are charged on a time and material basis. We also sell equipment service contracts with terms of coverage ranging between 12 and 60 months. We record deferred income on equipment service contracts which is amortized by the straight-line method over the term of the contracts. We record offsets to revenue for allowances, end-user pricing adjustments and trade spending. Off-invoice allowances are deducted directly from the amount invoiced to our customer when our products are shipped to the customer. Offsets to revenue for allowances, end-user pricing adjustments and trade spending are recorded primarily as a reduction of accounts receivable based on our estimates of liability which are based on customer programs and historical experience. These offsets to revenue are based primarily on the quantity of product purchased over specific time periods. For our Retail Supermarket and Frozen Beverages segments, we accrue for the liability based on products sold multiplied by per product offsets. Offsets to revenue for our Food Service segment are calculated in a similar manner for offsets owed to our direct customers; however, because shipments to end-users are unknown to us until reported by our direct customers or by the end-users, there is a greater degree of uncertainty as to the accuracy of the amounts accrued for end-user offsets. Additional uncertainty may occur as customers take deductions when they make payments to us. This creates complexities because our customers do not always provide reasons for the deductions taken. Additionally, customers may take deductions to which they are not entitled and the length of time customers take deductions to which they are entitled can vary from two weeks to well over a year. Because of the aforementioned uncertainties, the process to determine the amount of liability to record is cumbersome and subject to inaccuracies. However, we feel that due to constant monitoring of the process, any inaccuracies would not be material. Our recorded liability for allowances, end-user pricing adjustments and trade spending was approximately $8,938,000 and $8,084,000 at September 30, 2006 and September 24, 2005, respectively. The increase in our recorded liability resulted from the general increases in our business.
Back to Contents
Accounts Receivable — We record accounts receivable at the time revenue is recognized. Bad debt expense is recorded in marketing and administrative expenses. The amount of the allowance for doubtful accounts is based on our estimate of the accounts receivable amount that is uncollectable. It is comprised of a general reserve based on historical experience and amounts for specific customers’ accounts receivable balances that we believe are at risk due to our knowledge of facts regarding the customer(s). We continually monitor our estimate of the allowance for doubtful accounts and adjust it monthly. We usually have 2 to 3 customers with accounts receivable balances of between $1.5 million to $4 million. Failure of these customers, and others with lesser balances, to pay us the amounts owed could have a material impact on our consolidated financial statements.
Accounts receivable due from any of our customers is subject to risk. Our total bad debt expense was $300,000, $112,000 and $245,000 for the fiscal years 2006, 2005 and 2004 respectively. At September 30, 2006 and September 24, 2005, our accounts receivables were $53,033,000 and $46,261,000, net of an allowance for doubtful accounts of $963,000 and $1,054,000.
Asset Impairment — Goodwill of our restaurant group reporting unit decreased by $52,000 in 2004 and goodwill of our frozen beverages reporting unit increased by $679,000 in 2004. In 2005, goodwill of our food service reporting unit increased by $7,145,000 as a result of the acquisition of Snackworks, LLC and in 2006 by $839,000 as a result of a smaller acquisition. In 2006, goodwill of our frozen beverages reporting unit increased by $3,487,000 as a result of the acquisitions of ICEE of Hawaii and SLUSH PUPPIE.
We have three reporting units with goodwill totaling $57,948,000 as of September 30, 2006. We utilize historical reporting unit cash flows (defined as reporting unit operating income plus depreciation and amortization) as a proxy for expected future reporting unit cash flows to evaluate the fair value of these reporting units. If the fair value estimated substantially exceeds the carrying value of the reporting unit, including the goodwill, if any, associated with that unit, we do not recognize any impairment loss. We do not engage a third party to assist in this analysis as we believe that our in-house expertise is adequate to perform the analysis.
Licenses and rights are being amortized by the straight-line method over periods ranging from 4 to 20 years and amortization expense is reflected throughout operating expenses. The gross carrying amount of intangible assets increased by $5,831,000 in 2005 primarily as a result of the acquisition of $6,080,000 of intangible assets of Snackworks, LLC. The gross carrying amount of intangible assets increased by $17,034,000 in 2006 primarily as a result of the acquisition of $15,188,000 of intangible assets of the SLUSH PUPPIE business. Long-lived assets, including fixed assets and intangibles, are reviewed for impairment as events or changes in circumstances occur indicating that the carrying amount ofthe asset may not be recoverable. Cash flow analyses are used to assess impairment. The estimates of future cash flows involve considerable management judgment and are based upon assumptions about expected future operating performance. Assumptions used in these forecasts are consistent with internal planning. The actual cash flows could differ from management’s estimates due to changes in business conditions, operating performance, economic conditions, competition and consumer preferences.
Insurance Reserves — We have a self-insured medical plan which covers approximately 1,000 of our employees. We record a liability for incurred but not yet paid claims based on our historical experience of claims payments and a calculated lag time period. We maintain a spreadsheet that includes claims payments made each month according to the date the claim was incurred. This enables us to have an historical record of claims incurred but not yet paid at any point in the past. We then compare our accrued liability to the more recent claims incurred but not yet paid amounts and adjust our recorded liability up or down accordingly. Our recorded liability at September 30, 2006 and September 24, 2005 was $1,101,000 and $1,536,000, respectively. Considering that we have stop loss coverage of $125,000 for each individual plan subscriber, the general consistency of claims payments and the short time lag, we believe that there is not a material exposure for this liability. Because of the foregoing, we do not engage a third party actuary to assist in this analysis.
We self-insure, up to loss limits, worker’s compensation and automobile liability claims. Accruals for claims under our self-insurance program are recorded on a claims-incurred basis. Under this program, the estimated liability for claims incurred but unpaid in fiscal year 2006 and 2005 was $2,800,000 and
Back to Contents
on our estimate of the accounts receivable amount that is uncollectable. It is comprised of a general reserve based on historical experience and amounts for specific customers’ accounts receivable balances that we believe are at risk due to our knowledge of facts regarding the customer(s). We continually monitor our estimate of the allowance for doubtful accounts and adjust it monthly. We usually have approximately 10 customers with accounts receivable balances of between $1 million to $7 million. Failure of these customers, and others with lesser balances, to pay us the amounts owed, could have a material impact on our consolidated financial statements.
Accounts receivable due from any of our customers is subject to risk. Our total bad debt expense was $492,000, $502,000 and $189,000 for the fiscal years 2009, 2008 and 2007, respectively. At September 26, 2009 and September 27, 2008, our accounts receivables were $59,734,000 and $61,176,000, net of an allowance for doubtful accounts of $623,000 and $926,000. Asset Impairment — We have three reporting units with goodwill totaling $60,314,000 as of September 26, 2009. We utilize historical reporting unit cash flows (defined as reporting unit operating income plus depreciation and amortization) as a proxy for expected future reporting unit cash flows to evaluate the fair value of these reporting units. If the fair value estimated substantially exceeds the carrying value of the reporting unit, including the goodwill, if any, associated with that unit, we do not recognize any impairment loss. We generally do not engage a third party to assist in this analysis as we believe that our in-house expertise is adequate to perform the analysis. Licenses and rights, customer relationships and non compete agreements are being amortized by the straight-line method over periods ranging from 3 to 20 years and amortization expense is reflected throughout operating expenses. Long-lived assets, including fixed assets and intangibles, are reviewed for impairment as events or changes in circumstances occur indicating that the carrying amount of the asset may not be recoverable. Cash flow analyses are used to assess impairment. The estimates of future cash flows involve considerable management judgment and are based upon assumptions about expected future operating performance. Assumptions used in these forecasts are consistent with internal planning. The actual cash flows could differ from management’s estimates due to changes in business conditions, operating performance, economic conditions, competition and consumer preferences. Useful Lives of Intangible Assets — Most of our trade names which have carrying value have been assigned an indefinite life and are not amortized because we plan to receive the benefit from them indefinitely. If we decide to curtail or eliminate the use of any of the trade names or if sales that are generated from any particular trade name do not support the carrying value of the trade name, then we would record an impairment or assign an estimated useful life and amortize over the remaining useful life. Rights such as prepaid licenses and non compete agreements are amortized over contractual periods. The useful lives of customer relationships are based on the discounted cash flows expected to be received from sales to the customers adjusted for an attrition rate. The loss of a major customer or declining sales in general could create an impairment charge. Insurance Reserves — We have a self-insured medical plan which covers approximately 1,200 of our employees. We record a liability for incurred but not yet reported or paid claims based on our historical experience of claims payments and a calculated lag time period. We maintain a spreadsheet that includes claims payments made each month according to the date the claim was incurred. This enables us to have an historical record of claims incurred but not yet paid at any point in the past. We then compare our accrued liability to the more recent claims incurred but not yet paid amounts and adjust our recorded liability up or down accordingly. Our recorded liability at September 26, 2009 and September 27, 2008 was $1,157,000 and $772,000, respectively. Considering that we have stop loss coverage of $175,000 for each individual plan subscriber, the general consistency of claims payments and the short time lag, we believe that there is not a material exposure for this liability. Because of the foregoing, we do not engage a third party actuary to assist in this analysis. We self-insure, up to loss limits, worker’s compensation and automobile liability claims. Accruals for claims under our self-insurance program are recorded on a claims-incurred basis. Under this program, the estimated liability for claims incurred but unpaid in fiscal years 2009 and 2008 was $2,300,000 and $1,600,000, respectively. Our total recorded liability for all years’ claims incurred but not yet paid was $7,100,000 and $6,400,000 at September 26, 2009 and September 27, 2008, respectively. We estimate the liability based on total incurred claims and paid claims adjusting for loss development factors which account for the development of open claims over time. We estimate the amounts we expect to pay for some insurance years by multiplying incurred losses 13
Table of Contents
by a loss development factor which is based on insurance industry averages and the age of the incurred claims; our estimated liability is then the difference between the amounts we expect to pay and the amounts we have already paid for those years. Loss development factors that we use range from 1.0 to 2.0. However, for some years, the estimated liability is the difference between the amounts we have already paid for that year and the maximum we could pay under the program in effect for that particular year because the calculated amount we expect to pay is higher than the maximum. For other years, where there are few claims open, the estimated liability we record is the amount the insurance company has reserved for those claims. We evaluate our estimated liability on a continuing basis and adjust it accordingly. Due to the multi-year length of these insurance programs, there is exposure to claims coming in lower or higher than anticipated; however, due to constant monitoring and stop loss coverage on individual claims, we believe our exposure is not material. Because of the foregoing, we do not engage a third party actuary to assist in this analysis. In connection with these self-insurance agreements, we customarily enter into letters of credit arrangements with our insurers. At September 26, 2009 and September 27, 2008, we had outstanding letters of credit totaling $8,675,000 and $9,475,000, respectively.
Refer to Note A to the accompanying consolidated financial statements for additional information on our accounting policies. $2,700,000, respectively. Our total recorded liability for all years’ claims incurred but not yet paid was $7,650,000 and $6,450,000 at September 30, 2006 and September 24, 2005, respectively. We estimate the liability based on total incurred claims and paid claims adjusting for loss development factors which account for the development of open claims over time. We estimate the amounts we expect to pay for some insurance years by multiplying incurred losses by a loss development factor which is based on insurance industry averages and the age of the incurred claims; our estimated liability is then thedifference between the amounts we expect to pay and the amounts we have already paid for those years. Loss development factors that we use range from 1.0 to 1.73. However, for some years, the estimated liability is the difference between the amounts we have already paid for that year and the maximum we could pay under the program in effect for that particular year because the calculated amount we expect to pay is higher than the maximum. For other years, where there are few claims open, the estimated liability we record is the amount the insurance company has reserved for those claims. We evaluate our estimated liability on a continuing basis and adjust it accordingly. Due to the multi-year length of these insurance programs, there is exposure to claims coming in lower or higher than anticipated; however, due to constant monitoring and stop loss coverage on individual claims, we believe our exposure is not material. Because of the foregoing, we do not engage a third party actuary to assist in this analysis. In connection with these self-insurance agreements, we customarily enter into letters of credit arrangements with our insurers. At September 30, 2006 and September 24, 2005, we had outstanding letters of credit totaling approximately $8,620,000 and $7,700,000, respectively.
Refer to Note A to the accompanying consolidated financial statements for additional information on our accounting policies.
| Fiscal 2006 (53 weeks) Compared to Fiscal 2005 (52 weeks) |
Net sales increased $57,719,000 or 13% to $514,831,000 in fiscal 2006 from $457,112,000 in fiscal 2005. Adjusting for sales related to the acquisitions of Snackworks, LLC in March 2005, ICEE of Hawaii in January 2006 and SLUSH PUPPIE in May 2006, sales increased approximately 10%, or $43,576,000.
We have four reportable segments, as disclosed in the accompanying notes to the consolidated financial statements: Food Service, Retail Supermarkets, The Restaurant Group and Frozen Beverages.
The Chief Operating Decision Maker for Food Service, Retail Supermarkets and The Restaurant Group and the Chief Operating Decision Maker for Frozen Beverages monthly review and evaluate operating income and sales in order to assess performance and allocate resources to each individual segment. In addition, the Chief Operating Decision Makers review and evaluate depreciation, capital spending and assets of each segment on a quarterly basis to monitor cash flow and asset needs of each segment.
Sales to food service customers increased $40,044,000 or 14% to $320,167,000 in fiscal 2006. Excluding sales from the acquisition of Snackworks, LLC, sales increased $34,303,000, or 12%. Soft pretzel sales to the food service market increased $12,273,000, or 14%, to $99,581,000 for the 2006 year due primarily to the acquisition of Snackworks, LLC. Excluding Snackworks sales, pretzel sales increased $6,532,000, or 7%, with much of the increase coming from new business generated by Snackworks’ products. Sales of bakery products increased $15,189,000, or 12%, for the year. The increased sales were primarily to our private label and industrial business customers. Two customers accounted for 75% of the sales increase. Churro sales increased 50% to $22,154,000 due primarily to increased sales to one customer. Frozen juice bar and ices sales increased $4,643,000 or 12% to $44,336,000 for the year with sales to school food service customers accounting for most of the increase. The changes in sales throughout the Food Service segment were from a combination of volume changes and price increases.
Sales of products to retail supermarkets increased $4,601,000 or 11% to $46,948,000 in fiscal 2006. Total soft pretzel sales to retail supermarkets were $22,552,000, an increase of 3% from fiscal 2005 mainly
Back to Contents
due to pricing. Sales of frozen juice bars and ices increased $2,212,000 or 9% to $25,800,000 in 2006 from $23,588,000 in 2005 primarily due to the introduction of several new products. Coupon costs, a reduction of sales, were down $1,778,000, or 46%, for the year, because of decreased distribution of coupons.
Sales of our Restaurant Group, which operates BAVARIAN PRETZEL BAKERY and PRETZEL GOURMET retail stores in the Mid-Atlantic region, declined by 28% primarily due to closings or licensings of 5 stores. At September 30, 2006, we had 13 stores open. Sales of stores open for both years were down 1.7% for the year.
Frozen beverage and related product sales increased $14,586,000 or 11% to $143,819,000 in fiscal 2006. Excluding the benefit of sales from the acquisitions of ICEE of Hawaii and SLUSH PUPPIE, frozen beverages and related product sales would have been up 5% for the year. Beverage sales alone were up 9% for the year. Excluding sales from the acquisitions, beverage sales alone would have been up 1% for the year. Service revenue increased $1,180,000, or 5%, to $25,418,000 for the year as we continue to emphasize growing this part of our business. Machine sales increased $4,327,000 to $17,584,000 for the year. Sales to two customers accounted for more than half of the machine sales increase.
Other than as commented upon above by segment, there are no material specific reasons for the reported sales increases or decreases. Sales levels can be impacted by the appeal of our products to our customers and consumers and their changing tastes, competitive and pricing pressures, sales execution, marketing programs, seasonal weather, customer stability and general economic conditions.
Gross profit as a percent of sales decreased .43 of a percentage point to 33% of sales from 34% in 2005. The drop in gross profit percentage resulted from increased sales of lower margin beverage machines in our Frozen Beverage segment, continuing commodity and utility cost increases and slotting expense to introduce new retail supermarket products along with lower unit sales in our base frozen carbonated beverage business. Partially offsetting these factors were increased efficiencies from higher volume and pricing, which included reduced coupon expense in our Retail Supermarkets segment. Our slotting expense for the year was about $1.9 million more in 2006 than in 2005. We were impacted by higher commodity and packaging cost increases of over $4.5 million and higher utility costs of approximately $2.3 million for the year. We expect to continue to be impacted by higher commodity and packaging pricing and higher utility costs over at least the short term.
Total operating expenses increased $12,557,000 to $127,355,000 in fiscal 2006 but as a percentage of sales decreased .37 of a percentage point and were 25% of sales in both years. Marketing expenses dropped .54 of a percentage point to 12% of sales. The decrease in marketing expense as a percent of sales was the result of controlled spending and higher sales throughout all our business. Distribution expenses were 9% of sales in both years even though our gasoline costs increased by over $1 million. Administrative expenses were 4% of sales in both years. Operating expenses this year include an impairment charge of $1,193,000 in the Food Service segment for the writedown of robotic packaging equipment based on a determination made during the year that we would not be able to make the equipment work as intended. Other general income of $76,000 in 2006 compared to other general expense of $430,000, which included expense related to Hurricane Katrina.
Operating income increased $4,815,000 or 12% to $45,064,000 in fiscal 2006 as a result of the aforementioned items. Operating income also benefited by lower group and liability insurance costs of about $1.3 million. Adjusting for share-based compensation expense that would have been recognized in 2005 if Statement of Financial Accounting Standards No. 123 (revised 2004), Share-Based Payment (Statement 123(R)), which revised Statement of Financial Accounting Standards No. 123, Accounting for Stock-Based Compensation had been followed, operating income increased 16%. Adjusting for share-based compensation
Back to Contents
expense that would have been recognized in 2005 if Statement 123(R) had been followed and excluding the impact of the writedown of impaired robotic packaging equipment, operating income increased 19%.
Investment income increased by $1,448,000 to $3,137,000 primarily due to an increase in the general level of interest rates.
The effective income tax rate increased to 39% in fiscal year 2006 from 38% in 2005 due to estimated increases in state tax payments and a lower tax benefit on share-based compensation.
Net earnings increased $3,407,000 or 13% in fiscal 2006 to $29,450,000 or $1.57 per fully diluted share as a result of the aforementioned items. Adjusting for share-based compensation expense that would have been recognized in 2005 if Statement 123(R) had been followed, net earnings increased $4,534,000 or 18%. Adjusting for share-based compensation expense that would have been recognized in 2005 if Statement 123(R) had been followed and excluding the impact of the writedown of impaired robotic packaging equipment, net earnings increased $5,274,000 or 21%.
There are many factors which can impact our net earnings from year to year and in the long run, among which are the supply and cost of raw materials and labor, insurance costs, factors impacting sales as noted above, the continuing consolidation of our customers, our ability to manage our manufacturing, marketing and distribution activities, our ability to make and integrate acquisitions and changes in tax laws and interest rates.
| Fiscal 20052009 (52 weeks) Compared to Fiscal 20042008 (52 weeks)
|
Net sales increased $23,688,000, or 4%, to $653,047,000 in fiscal 2009 from $629,359,000 in fiscal 2008. We have four reportable segments, as disclosed in the accompanying notes to the consolidated financial statements: Food Service, Retail Supermarkets, The Restaurant Group and Frozen Beverages. The Chief Operating Decision Maker for Food Service, Retail Supermarkets and The Restaurant Group and the Chief Operating Decision Maker for Frozen Beverages monthly review and evaluate operating income and sales in order to assess performance and allocate resources to each individual segment. In addition, the Chief Operating Decision Makers review and evaluate depreciation, capital spending and assets of each segment on a quarterly basis to monitor cash flow and asset needs of each segment. Net sales increased $40,524,000 or 10% to $457,112,000 in fiscal 2005 from $416,588,000 in fiscal 2004. Adjusting for sales related to the acquisitions of Country Home Bakers, Inc. in 2004 and Snackworks, LLC in 2005, sales increased approximately 5%, or $22,000,000.
We have four reportable segments, as disclosed in the notes to the accompanying consolidated financial statements: Food Service, Retail Supermarkets, The Restaurant Group and Frozen Beverages.
The Chief Operating Decision Maker for Food Service, Retail Supermarkets and The Restaurant Group and the Chief Operating Decision Maker for Frozen Beverages monthly review and evaluate operating income and sales in order to assess performance and allocate resources to each individual segment. In addition, the Chief Operating Decision Makers review and evaluate depreciation, capital spending and assets of each segment on a quarterly basis to monitor cash flow and asset needs of each segment.
Sales to food service customers increased $17,559,000, or 4%, to $417,753,000 in fiscal 2009. Soft pretzel sales to the food service market decreased $313,000, or about 1/3 of one percent, to $99,471,000 for the year. Unit sales of soft pretzels were down 3% for the year. Sales of bakery products excluding biscuit and dumpling sales and fruit and fig bar sales, increased $6,607,000, or 4%, for the year. Biscuit and dumpling sales were up 8% to $32,845,000 due to increased distribution and new product offerings. Sales of fig and fruit bars increased 11% to $29,497,000 due to strong volume growth spread across our customer base. Churro sales were up 16% for the year with $29,404,000 of sales in 2009 with over 80% of the sales increase coming from sales to one customer. Frozen juice bar and ices sales decreased $934,000 or 2% to $50,272,000 for the year. Sales of our funnel cake products were up $2,872,000, or 49%, with sales to one customer accounting for about one-half of the increase. The changes in sales throughout the Food Service segment were from a combination of volume changes and price increases. Sales to food service customers increased $29,600,000 or 12% to $280,123,000 in fiscal 2005. Excluding Country Home Bakers and Snackworks acquisitions’ related sales, sales increased $11,230,000, or 4%. Soft pretzel sales to the food service market increased $6,585,000, or 8%, to $87,308,000 for the 2005 year due primarily to the acquisition of Snackworks, LLC. Excluding Snackworks sales, pretzel sales increased $695,000, or less than 1%. Although there were increases and decreases in sales spread among many of our customers, two customers by themselves had increased sales of about $3,000,000. Sales of bakery products increased $16,048,000, or 14%, for the year. Excluding sales related to the acquisition of Country Home Bakers, sales of bakery products increased $3,568,000 or 3%. The increased sales were primarily to our private label and industrial business customers. Churro sales increased 12% to $14,777,000 with three customers accounting for more than one-half of the increased sales. Frozen juice bar and ices sales increased $2,682,000 or 7% to $39,693,000 for the year with sales to school food service customers accounting for virtually all of the increase. Sales of our funnel cake products increased $2,996,000 due to sales to one customer. The changes in sales throughout the food service segment were from a combination of volume changes and price increases.
Back to Contents
Sales of products to retail supermarkets increased $8,046,000 or 14% to $65,158,000 in fiscal 2009. Total soft pretzel sales to retail supermarkets were $30,506,000, an increase of 11% from fiscal 2008, on a unit volume decrease of 2%. Sales of frozen juice bars and ices increased 19% to $37,819,000 in 2009 on a case volume increase of 25%. Increased trade spending of $1.3 million for the introduction of new frozen novelty items and a shift in product mix reduced sales dollars in relation to the unit volume increases. Coupon costs, a reduction of sales, increased 38% or about $1,029,000 for the year. Sales of products to retail supermarkets increased $3,504,000 or 9% to $42,347,000 in fiscal 2005. Total soft pretzel sales to retail supermarkets were $21,839,000, an increase of 19% from fiscal 2004. Approximately one-half of the increase was due to the expansion of PRETZELFILS to additional markets with the balance coming primarily from increased sales of our flagship SUPERPRETZEL brand in existing markets. Sales of frozen juice bars and ices increased $1,166,000 or 5% to $23,588,000 in 2005 from $22,422,000 in 2004 due to an extremely strong fourth quarter during which sales of LUIGI’S Real Italian Ice increased by approximately 50%. Coupon costs, a reduction of sales, were up $876,000, or 29%, for the year.
Sales of our Restaurant Group, which operates BAVARIAN PRETZEL BAKERY and PRETZEL GOURMET retail stores in the Mid-Atlantic region, declined by 23% primarily due to closings or licensings of stores in the 14
Table of Contents
past year. At September 26, 2009, we had 4 stores open. Sales of stores open for both years were down 7% for the year.
Sales of our Restaurant Group, which operates BAVARIAN PRETZEL BAKERY and PRETZEL GOURMET retail stores in the Mid-Atlantic region, declined by 29% primarily due to closings or licensings of 11 stores. At September 24, 2005, we had 19 stores open.
Frozen beverage and related product sales decreased $1,539,000 or 1% to $168,879,000 in fiscal 2009. Beverage sales alone were down 1% for the year. Gallon sales were down 2% for the year in our base ICEE business. Service revenue increased $3,210,000, or 8%, to $42,013,000 for the year as we continue to grow this part of our business. Frozen carbonated machine sales decreased $2,834,000 to $10,004,000 for the year. Frozen beverage and related product sales increased $9,634,000 or 8% to $129,233,000 in fiscal 2005. Beverage sales alone were up 2% for the year with sales increases and decreases spread among our customer base. Service revenue increased $6,130,000, or 34%, to $24,238,000 for the year as we continue to emphasize growing this part of our business. Increased service revenue to one customer accounted for over 40% of the increase with no other customer accounting for more than 10% of the increase. Machine sales increased $2,568,000 to $13,257,000 for the year. Sales to two customers accounted for all of the machine sales increase.
Other than as commented upon above by segment, there are no material specific reasons for the reported sales increases or decreases. Sales levels can be impacted by the appeal of our products to our customers and consumers and their changing tastes, competitive and pricing pressures, sales execution, marketing programs, seasonal weather, customer stability and general economic conditions. Gross profit as a percent of sales increased 2.28 percentage points in 2009 from 2008 to 32%. Lower commodity costs in excess of $11,000,000, higher pricing and increased efficiencies due to volume in some of our product lines partially offset by higher workers’ compensation and group health insurance expense were the primary drivers causing the gross profit percentage increase. Total operating expenses decreased $1,665,000 to $141,906,000 in fiscal 2009 and as a percentage of sales decreased 1.08 percentage points to 22% of sales in 2009. Other general income was $5,000 this year. Other general income of $375,000 last year primarily consisted of gains on the disposition of assets and insurance gains in our Food Service and Frozen Beverages segments offset by store closing costs in our Restaurant Group segment of $102,000. Marketing expenses decreased .45 percentage points and remained at 11% of sales. Controlled spending in our Food Service and Frozen Beverages segments accounted for the overall decline. Distribution expenses decreased .75 of a percentage point and remained at 8% of sales due to lower freight and fuel costs. Administrative expenses were about 3-1/2% of sales in both years. Operating income increased $23,602,000, or 54%, to $66,938,000 in fiscal 2009 as a result of the aforementioned items. Investment income decreased by $1,279,000 to $1,386,000 due to the general decline in the level of interest rates. The effective income tax rate was 39% in both fiscal years. Net earnings increased $13,404,000, or 48%, in fiscal 2009 to $41,312,000, or $2.21 per diluted share as a result of the aforementioned items. There are many factors which can impact our net earnings from year to year and in the long run, among which are the supply and cost of raw materials and labor, insurance costs, factors impacting sales as noted above, the continuing consolidation of our customers, our ability to manage our manufacturing, marketing and distribution activities, our ability to make and integrate acquisitions and changes in tax laws and interest rates. Fiscal 2008 (52 weeks) Compared to Fiscal 2007 (52 weeks) Net sales increased $60,548,000, or 11%, to $629,359,000 in fiscal 2008 from $568,901,000 in fiscal 2007. Adjusting for sales related to the acquisitions of DADDY RAY’S and Hom/Ade Foods in January 2007, and WHOLE FRUIT Sorbet and FRUIT-A-FREEZE Frozen Fruit Bar brands in April 2007, sales increased approximately 7%, or $41,681,000. We have four reportable segments, as disclosed in the accompanying notes to the consolidated financial statements: Food Service, Retail Supermarkets, The Restaurant Group and Frozen Beverages. The Chief Operating Decision Maker for Food Service, Retail Supermarkets and The Restaurant Group and the Chief Operating Decision Maker for Frozen Beverages monthly review and evaluate operating income and sales 15
Table of Contents
in order to assess performance and allocate resources to each individual segment. In addition, the Chief Operating Decision Makers review and evaluate depreciation, capital spending and assets of each segment on a quarterly basis to monitor cash flow and asset needs of each segment.
Food Service Sales to food service customers increased $44,430,000, or 12%, to $400,194,000 in fiscal 2008. Excluding the benefit of sales from acquisitions, sales increased approximately 7%. Soft pretzel sales to the food service market increased $925,000, or 1%, to $99,784,000 for the year. Sales of bakery products excluding Hom/Ade and DADDY RAY’S, increased $19,768,000, or 14%, for the year. Hom/Ade and DADDY RAY sales were $30,380,000 and $26,596,000, respectively, for the year. Churro sales were up 15% for the year with $25,286,000 of sales in 2008. Frozen juice bar and ices sales increased $3,635,000 or 8% to $51,206,000 for the year. Without WHOLE FRUIT and FRUIT-A-FREEZE, sales increased 5% for the year. Sales of our funnel cake products were down $835,000, or 12%, as sales declined to one customer. The changes in sales throughout the Food Service segment were from a combination of volume changes and price increases. Retail Supermarkets Sales of products to retail supermarkets increased $4,981,000 or 10% to $57,112,000 in fiscal 2008. Total soft pretzel sales to retail supermarkets were $27,559,000, an increase of 11% from fiscal 2007 virtually all due to pricing. Sales of frozen juice bars and ices increased 8% to $31,742,000 in 2008 due to increased volume of WHOLE FRUIT and FRUIT-A-FREEZE and reduced allowances on our other products. Coupon costs, a reduction of sales, were essentially unchanged for the year. The Restaurant Group Sales of our Restaurant Group, which operates BAVARIAN PRETZEL BAKERY and PRETZEL GOURMET retail stores in the Mid-Atlantic region, declined by 41% primarily due to closings or licensings of stores in the past year. At September 27, 2008, we had 5 stores open. Sales of stores open for both years were down 4% for the year. Frozen Beverages Frozen beverage and related product sales increased $12,178,000 or 8% to $170,418,000 in fiscal 2008. Beverage sales alone were up 6% for the year with approximately 2/3 of the increase resulting from a change in distribution to one customer and the balance resulting from pricing. Gallon sales were down 4% for the year in our base ICEE business. Service revenue increased $7,554,000, or 24%, to $38,803,000 for the year as we continue to grow this part of our business. Frozen carbonated machine sales decreased $1,680,000 to $14,793,000 for the year. Consolidated Other than as commented upon above by segment, there are no material specific reasons for the reported sales increases or decreases. Sales levels can be impacted by the appeal of our products to our customers and consumers and their changing tastes, competitive and pricing pressures, sales execution, marketing programs, seasonal weather, customer stability and general economic conditions. Gross profit as a percent of sales decreased 3.09 percentage points in 2008 from 2007 to 30%. We were impacted by higher unit commodity costs of over $30,000,000 for the year. This compares to an increase of less than $10,000,000 in 2007 compared to 2006. We expect to be impacted by higher commodity costs going forward, at least over the short term; however, we do expect the magnitude of the year over year increases to continue the decline which began in our fourth quarter. Reduced trade spending of about $2,700,000 in our retail supermarket segment benefitted gross profit and contributed to the improved operating income in the Retail Supermarkets segment. Pricing and lower liability insurance costs of approximately $1,900,000 also helped to partially offset some of the commodity costs’ increase. Total operating expenses increased $5,624,000 to $143,571,000 in fiscal 2008 but as a percentage of sales decreased 1.44 percentage points to 23% of sales in 2008. Other general income of $375,000 this year primarily 16
Table of Contents
consists of gains on the disposition of assets and insurance gains in our Food Service and Frozen Beverages segments offset by store closing costs in our Restaurant Group segment of $102,000. Last year, other general income consisted of primarily $495,000 and $321,000 insurance gains in the Frozen Beverages and The Restaurant Group segments, respectively and a royalty settlement of $569,000 in the Food Service segment reduced by other general expense items. Marketing expenses decreased 1.26 percentage points to 11% of sales. Controlled spending in our Food Service and Retail Supermarket segments accounted for the decline with lower advertising expense of approximately $2,000,000 accounting for about 25% of the percentage point decline. Distribution expenses decreased .24 of a percentage point to 8% of sales even though our fuel costs were approximately $2 million higher in our Frozen Beverages segment and administrative expenses were about 3-1/2% of sales in both years.
Operating income decreased $5,244,000, or 11%, to $43,336,000 in fiscal 2008 as a result of the aforementioned items. Investment income decreased by $55,000 to $2,665,000 primarily due to lower investment returns in the fourth quarter. The effective income tax rate increased to 39% in fiscal year 2008 from 37% in fiscal 2007. Last year included the benefit of the resolution of state and foreign tax matters. This year had a lower benefit from stock based compensation as well as additional expense resulting from changes in state tax requirements. Net earnings decreased $4,204,000, or 13%, in fiscal 2008 to $27,908,000, or $1.47 per diluted share as a result of the aforementioned items. There are many factors which can impact our net earnings from year to year and in the long run, among which are the supply and cost of raw materials and labor, insurance costs, factors impacting sales as noted above, the continuing consolidation of our customers, our ability to manage our manufacturing, marketing and distribution activities, our ability to make and integrate acquisitions and changes in tax laws and interest rates. Other than as commented upon above by segment, there are no material specific reasons for the reported sales increases or decreases. Sales levels can be impacted by the appeal of our products to our customers and consumers and their changing tastes, competitive and pricing pressures, sales execution, marketing programs, seasonal weather, customer stability and general economic conditions.
Gross profit as a percent of sales, although at 34% of sales for both 2005 and 2004, increased .26 of a percentage point primarily because of pricing and efficiencies related to higher volume and a significant improvement in the gross profit of our Restaurant Group business.
Total operating expenses increased $9,781,000 to $114,798,000 in fiscal 2005 but as a percentage of sales were essentially the same in both 2005 and 2004. Marketing expenses were 13% of sales in both fiscals 2005 and 2004, although they dropped about 6/10 of one percent of sales. The decrease in marketing expense as a percent of sales was the result of controlled spending and higher sales throughout all our business. Distribution expenses increased about 6/10 of one percent of sales to 9% of sales from 8% of sales in 2004. Distribution expenses increased as a percent of sales because of higher fuel and outside carrier costs. Administrative expenses were 4% in both years even though we incurred approximately $400,000 of external costs related to compliance with the Sarbanes-Oxley Act. Other general expense of $430,000 in 2005 was an increase of $401,000 from 2004 which increase resulted primarily from costs relating to Hurricane Katrina.
Operating income increased $5,057,000 or 14% to $40,249,000 in fiscal 2005 as a result of the aforementioned items.
Operating income was impacted by approximately $700,000 of higher insurance costs compared to a year ago due to increased claims under our liability policies. Manufacturing plant utilities costs were higher by about $1,000,000 for the year compared to last year with about two-thirds of the increase coming in the second half of the year.
Investment income increased by $1,123,000 to $1,689,000 due to an increase in the general level of interest rates and higher investable balances of cash and marketable securities.
Back to Contents
Interest expense and other increased $26,000 to $136,000 in 2005.
The effective income tax rate increased to 38% in fiscal year 2005 from 36% in 2004 due to estimated increases in state tax payments and an increase in the estimated enacted rate applied to net deferred tax liabilities.
Net earnings increased $3,333,000 or 15% in fiscal 2005 to $26,043,000 or $2.80 per fully diluted share as a result of the aforementioned items.
There are many factors which can impact our net earnings from year to year and in the long run, among which are the supply and cost of raw materials and labor, insurance costs, factors impacting sales as noted above, the continuing consolidation of our customers, our ability to manage our manufacturing, marketing and distribution activities, our ability to make and integrate acquisitions and changes in tax laws and interest rates.
ACQUISITIONS In March 2005, we acquired all of the assets of Snackworks LLC, d/b/a Bavarian Brothers, a manufacturer of soft pretzels headquartered in Rancho Cucamonga, California. Snackworks operates production facilities in California and Chambersburg, Pennsylvania and markets its products under the brand names SERIOUSLY TWISTED!, BAVARIAN BROTHERS and CINNAPRETZEL. Snackworks sells throughout the continental United States primarily to mass merchandisers and theatres. On January 31, 2006, we acquired the stock of ICEE of Hawaii. ICEE of Hawaii, headquartered in Waipahu, Hawaii, distributes ICEE frozen beverages and related products throughout the Hawaiian islands. On May 26, 2006, The ICEE Company, our frozen carbonated beverage distribution company, acquired the SLUSH PUPPIE branded business from Dr. Pepper/Seven Up, Inc., a Cadbury Schweppes Americas Beverages Company for $18.1 million plus approximately $4.3 million in working capital. SLUSH PUPPIE, North America’s leading brand for frozen non-carbonated beverages, is sold through an existing established distributor network to over 20,000 locations in the United States and Canada as well as to certain international markets. On January 9, 2007, we acquired the assets of Hom/Ade Foods, Inc. Hom/Ade Foods, Inc., based in Pensacola, Florida is a manufacturer and distributor of biscuits and dumplings sold under the MARY B’s and private label store brands predominately to the retail supermarket trade. Annual sales of the business were approximately $30 million for the year ended December 2006. On January 31, 2007, we acquired the assets of Radar, Inc. Radar, Inc. is a manufacturer and seller of fig and fruit bars selling its products under the brand DADDY RAY’S. Headquartered and with its manufacturing facility in Moscow Mills, Missouri (outside of St. Louis), Radar, Inc. had annual sales of approximately $23 million dollars selling to the retail grocery segment and mass merchandisers, both branded and private label. On April 2, 2007, we acquired the WHOLE FRUIT Sorbet and FRUIT-A-FREEZE Frozen Fruit Bar brands, along with related assets including a manufacturing facility located in Norwalk, California, selling primarily to the supermarket industry. Sales for 2007 were $2,429,000. 17
Table of Contents On June 25, 2007, we acquired the assets of an ICEE distributor in Kansas with annual sales of less than $1 million. These acquisitions were accounted for under the purchase method of accounting, and their operations are included in the accompanying consolidated financial statements from their respective acquisition dates. LIQUIDITY AND CAPITAL RESOURCES |
Although there are many factors that could impact our operating cash flow, most notably net earnings, we believe that our future operating cash flow, along with our borrowing capacity, our current cash and cash equivalent balances and our investment securities is sufficient to fund future growth and expansion. See Note C to these financial statements for a discussion of our investment securities. Fluctuations in the value of the Mexican and Canadian currencies and the resulting translation of the net assets of our Mexican and Canadian subsidiaries caused an increase of $1,428,000 in accumulated other comprehensive loss in 2009 and a decrease of $3,000 in 2008 and an increase of $42,000 in 2007. In 2009, sales of the two subsidiaries were $11,658,000 as compared to $11,078,000 in 2008 and $9,785,000 in 2007. In our fiscal year ended September 26, 2009, we purchased and retired 450,597 shares of our common stock at a cost of $12,510,000 under a million share buyback authorization approved by the Company’s Board of Directors in February 2008. Of the shares purchased and retired in 2009, 400,000 shares were purchased at the purchase price of $27.90 per share from Gerald B. Shreiber, Chairman of the Board, Chief Executive Officer and Director of the Company. In our 2008 fiscal year ended September 27, 2008, we purchased and retired 135,124 shares of our common stock at a cost of $3,539,000. The Company did not repurchase any of its common stock in fiscal year 2007. In December 2006, we entered into an amended and restated loan agreement with our existing banks which provides for up to a $50,000,000 revolving credit facility repayable in December 2011. The agreement contains restrictive covenants and requires commitment fees in accordance with standard banking practice. There were no outstanding balances under the facility at September 26, 2009 and September 27, 2008. The significant financial covenants are: In January 2004, we acquired the assets of Country Home Bakers, Inc. Country Home Bakers, Inc., with its manufacturing facility in Atlanta, Georgia, manufactures and distributes bakery products to the food service and supermarket industries. Its product line includes cookies, biscuits, and frozen doughs sold under the names READI-BAKE, COUNTRY HOME and private labels sold through supermarket in-store bakeries.
In March 2005, we acquired all of the assets of Snackworks LLC, d/b/a Bavarian Brothers, a manufacturer of soft pretzels headquartered in Rancho Cucamonga, California. Snackworks operates production facilities in California and Chambersburg, Pennsylvania and markets its products under the brand names SERIOUSLY TWISTED!, BAVARIAN BROTHERS and CINNAPRETZEL. Snackworks sells throughout the continental United States primarily to mass merchandisers and theatres.
On January 31, 2006, we acquired the stock of ICEE of Hawaii. ICEE of Hawaii, headquartered in Waipahu, Hawaii, distributes ICEE frozen beverages and related products throughout the Hawaiian islands. Annual sales are approximately $2.3 million.
On May 26, 2006, The ICEE Company, our frozen carbonated beverage distribution company, acquired the SLUSH PUPPIE branded business from Dr. Pepper/Seven Up, Inc., a Cadbury Schweppes Americas Beverages Company for $18.1 million plus approximately $4.3 in working capital. SLUSH PUPPIE, North America’s leading brand for frozen non-carbonated beverages, is sold through an existing established distributor network to over 20,000 locations in the United States and Canada as well as to certain international markets. Sales of the SLUSH PUPPIE business were approximately $18 million in 2005.
These acquisitions were accounted for under the purchase method of accounting, and their operations are included in the accompanying consolidated financial statements from their respective acquisition dates.
Although there are many factors that could impact our operating cash flow, most notably net earnings, we believe that our future operating cash flow, along with our borrowing capacity, is sufficient to fund future growth and expansion. Based on our past levels of operating cash flow, which has averaged $51,584,000 per year over the past three years, and the strength of our consolidated balance sheet, we believe that we have the capability to borrow in excess of $200,000,000. This is management’s current opinion, which could change over time depending on future events.
Fluctuations in the value of the Mexican peso and the resulting translation of the net assets of our Mexican frozen beverage subsidiary caused a decrease of $46,000 in accumulated other comprehensive loss in 2006 and a decrease of $143,000 in 2005 and an increase of $104,000 in 2004. In 2006, sales of the Mexican subsidiary were $6,285,000 as compared to $5,399,000 in 2005 and $4,308,000 in 2004.
In fiscal years 2006, 2005 and 2004, we did not purchase or retire any of our Company stock.
In December 2006, we entered into an amended and restated loan agreement with our existing banks which provides for up to a $50,000,000 revolving credit facility repayable in December 2011. The agreement contains restrictive covenants and requires commitment fees in accordance with standard banking practice.
Back to Contents
There were no outstanding balances under the prior facility at September 30, 2006 and September 24, 2005. The significant financial covenants are:
| | | | • | Earnings before interest expense and income taxes divided by interest expense shall not be less than 1.5 to 1. |
| | | | • |
Tangible net worth must initially be more than $170 million. |
| | | | • |
Total funded indebtedness divided by earnings before interest expense, income taxes, depreciation and amortization shall not be greater than 2.25 to 1. |
| | | | • |
Total liabilities divided by tangible net worth shall not be more than 2.0 to 1. |
We were in compliance with the financial covenants described above at September 26, 2009. We self-insure, up to loss limits, certain insurable risks such as worker’s compensation and automobile liability claims. Accruals for claims under our self-insurance program are recorded on a claims-incurred basis. Under this program, the estimated liability for claims incurred but unpaid in fiscal years 2009 and 2008 was $2,300,000 and $1,600,000, respectively. In connection with certain self-insurance agreements, we customarily enter into letters of credit arrangements with our insurers. At September 26, 2009 and September 27, 2008, we had outstanding letters of credit totaling $8,675,000 and $9,475,000, respectively. 18
Table of Contents The following table presents our contractual cash flow commitments on long-term debt, operating leases and purchase commitments for raw materials and packaging. See Notes to the consolidated financial statements for additional information on our long-term debt and operating leases. | | | | Payments Due by Period
(in thousands)
| |
|---|
| | | | Total
| | Less
Than
1 Year
| | 1-3
Years
| | 4-5
Years
| | After
5 Years
|
|---|
Long-term debt, including
current maturities | | | | $ | — | | | $ | — | | | $ | — | | | $ | — | | | $ | — | | | Capitalized lease obligations | | | | | 381 | | | | 96 | | | | 199 | | | | 86 | | | | — | | | Purchase commitments | | | | | 46,000 | | | | 46,000 | | | | — | | | | — | | | | — | | | Operating leases | | | | | 43,176 | | | | 9,167 | | | | 13,893 | | | | 7,626 | | | | 12,490 | | | Total | | | | $ | 89,557 | | | $ | 55,263 | | | $ | 14,092 | | | $ | 7,712 | | | $ | 12,490 | |
The purchase commitments do not exceed our projected requirements over the related terms and are in the normal course of business. We were in compliance with the restrictive covenants described above at September 30, 2006.
We self-insure, up to loss limits, certain insurable risks such as worker’s compensation and automobile liability claims. Accruals for claims under our self-insurance program are recorded on a claims-incurred basis. Under this program, the estimated liability for claims incurred but unpaid in fiscal year 2006 and 2005 was $2,800,000 and $2,700,000, respectively. In connection with certain self-insurance agreements, we customarily enter into letters of credit arrangements with our insurers. At September 30, 2006 and September 24, 2005, we had outstanding letters of credit totaling approximately $8,620,000 and $7,700,000, respectively.
The following table presents our contractual cash flow commitments on long-term debt, operating leases and purchase commitments for raw materials and packaging. See Notes to the consolidated financial statements for additional information on our long-term debt and operating leases.
| | | Payments Due by Period
(in thousands) | | | | | | | Less | | | | | | | | | | | | | | | | Than | | 1-3 | | 4-5 | | After | | | | | Total | | 1 Year | | Years | | Years | | 5 Years | | | | |
|
| |
|
| |
|
| |
|
| |
|
| | | Long-term debt, including current maturities | | $ | — | | $ | — | | $ | — | | $ | — | | $ | — | | | Purchase commitments | | | 25,113 | | | 25,113 | | | — | | | — | | | — | | | Operating leases | | | 37,382 | | | 9,924 | | | 14,621 | | | 6,390 | | | 6,447 | | | | |
|
| |
|
| |
|
| |
|
| |
|
| | | Total | | $ | 62,495 | | $ | 35,037 | | $ | 14,621 | | $ | 6,390 | | $ | 6,447 | |
The purchase commitments do not exceed our projected requirements over the related terms and are in the normal course of business.
Fiscal 20062009 Compared to Fiscal 20052008 |
Cash and cash equivalents and marketable securities held to maturity net of a decline in auction market preferred stock increased $37,055,000, or 45%, to $118,990,000 from a year ago primarily because net cash provided by operating activities of $80,633,000 was more than cash used for purchases of property, plant and equipment by $53,443,000, which was partially offset by cash used in financing activities of $15,740,000. Trade receivables decreased $1,442,000, or 2%, to $59,734,000 in 2009 due primarily to better management of receivables. Inventories decreased $3,091,000 or 6% to $46,004,000 in 2009 due to lower unit costs of inventories, improved management and timing. Net property, plant and equipment increased $4,109,000 to $97,173,000 because purchases of fixed assets for the improvement and expansion of our manufacturing capabilities and frozen carbonated beverage business exceeded depreciation on existing assets. Other intangible assets, less accumulated amortization decreased $4,508,000 to $49,125,000 due completely to amortization. Goodwill was unchanged at $60,314,000 from September 27, 2008 to September 26, 2009. Accounts payable and accrued liabilities decreased $14,000. Accrued compensation expense increased 14% to $11,656,000 due to an increase in our employee base, a general increase in the level of pay rates and higher bonuses due to be paid. Deferred income tax liabilities increased by $3,977,000 to $27,033,000 which related primarily to amortization of goodwill and other intangible assets and depreciation of property, plant and equipment. Other long-term liabilities at September 26, 2009 include $1,895,000 of gross unrecognized tax benefits. Common stock decreased $6,638,000 to $41,777,000 in 2009 because increases totalling $4,923,000 from the exercise of incentive and nonqualified stock options, stock issued under our stock purchase plan for employees and share-based compensation expense were less than the repurchase of common stock of $12,510,000 by $6,638,000. Net cash provided by operating activities increased $25,736,000 to $80,633,000 in 2009 primarily because of the increase to net earnings of $13,404,000 and decreases in accounts receivable, inventories and prepaid expenses totalling $4,174,000 compared to increases in those assets totalling $7,686,000 last year. Net cash used in investing activities increased $28,971,000 to $47,825,000 in 2009 from $18,854,000 in 2008 primarily because of increased purchases of marketable securities, net of proceeds. 19
Table of Contents Net cash used in financing activities of $15,740,000 in 2009 compared to net cash used by financing activities of $7,600,000 in 2008. The increase was caused primarily by an increase of $8,971,000 in payments to repurchase common stock. In 2009, the major variables in determining our net increase in cash and cash equivalents and marketable securities were our net earnings, depreciation and amortization of fixed assets, purchases of property, plant and equipment and the repurchase of common stock. Other variables which in the past have had a significant impact on our change in cash and cash equivalents are payments for the purchase of companies, proceeds from borrowings and payments of long-term debt. As discussed in results of operations, our net earnings may be influenced by many factors. Depreciation and amortization of fixed assets is primarily determined by past purchases of property, plant and equipment although it could be impacted by a significant acquisition. Purchases of property, plant and equipment are primarily determined by our ongoing normal manufacturing and marketing requirements but could be increased significantly for manufacturing expansion requirements or large frozen beverage customer needs. From time to time, we have repurchased common stock and we anticipate that we will do so again in the future. We are actively seeking acquisitions that could be a significant use of cash. Although the balance of our long-term debt is $0 at September 26, 2009, we may borrow in the future depending on our needs. Cash and cash equivalents and marketable securities available for sale increased $6,601,000, or 9%, to $76,621,000 from a year ago primarily because net cash provided by operating activities of $54,965,000 exceeded cash used for purchases of property, plant and equipment and for purchase of companies by $8,962,000.
Trade receivables increased $6,772,000 or 15% to $53,033,000 in 2006 due primarily to an increased level of business resulting from acquisitions and internal growth. Inventories increased $4,106,000 or 12% to $37,790,000 in 2006. The increases were due primarily to increased levels of business and higher unit costs of inventories.
Net property, plant and equipment decreased $3,598,000 to $85,447,000 because depreciation of fixed assets exceeded purchases of fixed assets and assets acquired in acquisitions.
Other intangible assets, less accumulated amortization increased $15,626,000 to $22,669,000 primarily because of the purchase of intangible assets of $15,188,000 in the SLUSH PUPPIE acquisition.
Goodwill increased $4,326,000 to $57,948,000 primarily as a result of the purchase of SLUSH PUPPIE.
Accounts payable and accrued liabilities increased $4,672,000, or 10% from 2005 to 2006 primarily because of increased levels of business, higher accruals for our insurance reserves and higher income taxes payable.
Back to Contents
Deferred income tax liabilities increased by $224,000 to $18,211,000 which related primarily to amortization of goodwill and other intangible assets.
Common stock increased $4,224,000 to $40,315,000 in 2006 because of the exercise of incentive and nonqualified stock options, stock issued under our stock purchase plan for employees and share-based compensation expense.
Net cash provided by operating activities increased $2,321,000 to $54,965,000 in 2006 primarily because of an increase to net earnings of $3,407,000 offset by an increase in working capital of $1,363,000.
Net cash used in investing activities decreased $4,804,000 to $50,629,000 in 2006 from $55,433,000 in 2005 primarily because purchases of marketable securities, net of proceeds from marketable securities, were $12,950,000 lower in 2006 than in 2005 and purchases of property, plant and equipment were $1,893,000 lower in 2006 than in 2005. This was partially offset by $10,176,000 of higher payments in 2006 for purchases of companies.
Net cash used in financing activities of $2,464,000 in 2006 compared to net cash used by financing activities of $1,159,000 in 2005. The increase was primarily caused by the increased payments of cash dividends of $1,873,000 in 2006, in which we paid four quarterly cash dividends compared to three in 2005, the first year in which we paid cash dividends.
In 2006, the major variables in determining our net increase in cash and cash equivalents and marketable securities available for sale were our net earnings, depreciation and amortization of fixed assets, purchases of property, plant and equipment and payments for the purchase of companies. Other variables which in the past have had a significant impact on our change in cash and cash equivalents are payments for the repurchase of common stock, proceeds from borrowings and payments of long-term debt. As discussed in results of operations, our net earnings may be influenced by many factors. Depreciation and amortization of fixed assets is primarily determined by past purchases of property, plant and equipment although it could be impacted by a significant acquisition in the current year. Purchases of property, plant and equipment are primarily determined by our ongoing normal manufacturing and marketing requirements but could be increased significantly for manufacturing expansion requirements or large frozen beverage customer needs. From time to time, we have repurchased common stock and we anticipate that we will do so again in the future. We are actively seeking acquisitions that could be a significant use of cash. Although the balance of our long-term debt is $0 at September 30, 2006, we may borrow in the future depending on our needs.
Fiscal 20052008 Compared to Fiscal 20042007 |
Cash and cash equivalents, marketable securities held to maturity and auction market preferred stock increased $24,916,000, or 44%, to $81,935,000 from a year ago primarily because net cash provided by operating activities of $54,897,000 was more than cash used for purchases of property, plant and equipment and for purchase of companies by $32,116,000, which was partially offset by cash used in financing activities of $7,600,000. Trade receivables increased $4,404,000, or 8%, to $61,176,000 in 2008 due primarily to higher net sales. Inventories increased $2,496,000 or 5% to $49,095,000 in 2008 due primarily to higher unit costs of inventories. Net property, plant and equipment was essentially unchanged at $93,064,000 because purchases of fixed assets were essentially offset by depreciation of fixed assets. Other intangible assets, less accumulated amortization decreased $4,700,000 to $53,633,000 due completely to amortization. Goodwill was unchanged at $60,314,000 from September 29, 2007 to September 27, 2008. Accounts payable and accrued liabilities increased $550,000, or 1% from 2007 to 2008 primarily because of higher costs of raw materials and packaging. Deferred income tax liabilities increased by $3,876,000 to $23,056,000 which related primarily to amortization of goodwill and other intangible assets and depreciation of property, plant and equipment. Other long-term liabilities at September 27, 2008 include $1,735,000 of gross unrecognized tax benefits. Common stock increased $1,135,000 to $48,415,000 in 2008 because increases from the exercise of incentive and nonqualified stock options, stock issued under our stock purchase plan for employees and share-based compensation expense exceeded the repurchase of common stock of $3,539,000 by $1,135,000. Net cash provided by operating activities decreased $2,946,000 to $54,897,000 in 2008 primarily because of the decrease to net earnings of $4,204,000. Net cash used in investing activities decreased $38,980,000 to $18,854,000 in 2008 from $57,834,000 in 2007 primarily because we did not make any acquisitions in 2008. Net cash used in financing activities of $7,600,000 in 2008 compared to net cash used by financing activities of $1,769,000 in 2007. The increase was caused by $3,539,000 of payments to repurchase common stock along with a decrease in proceeds from the issuance of common stock upon the exercise of stock options. In 2008, the major variables in determining our net increase in cash and cash equivalents and marketable securities were our net earnings, depreciation and amortization of fixed assets and purchases of property, plant and equipment. Additionally, in 2008, due to the failure of the auction market, we reclassified a portion of our investment 20
Table of Contents
securities to long-term assets (see Note C to these financial statements). Other variables which in the past have had a significant impact on our change in cash and cash equivalents are payments for the repurchase of common stock, payments for the purchases of companies, proceeds from borrowings and payments of long-term debt. As discussed in results of operations, our net earnings may be influenced by many factors. Depreciation and amortization of fixed assets is primarily determined by past purchases of property, plant and equipment although it could be impacted by a significant acquisition. Purchases of property, plant and equipment are primarily determined by our ongoing normal manufacturing and marketing requirements but could be increased significantly for manufacturing expansion requirements or large frozen beverage customer needs. From time to time, we have repurchased common stock and we anticipate that we will do so again in the future. We are actively seeking acquisitions that could be a significant use of cash. Although the balance of our long-term debt is $0 at September 27, 2008, we may borrow in the future depending on our needs.
Cash and cash equivalents and marketable securities available for sale increased $13,920,000, or 25%, to $70,020,000 from a year ago primarily because net cash provided by operating activities of $52,644,000 exceeded cash used for purchases of property, plant and equipment and for purchase of companies by $14,924,000.
Trade receivables decreased $1,492,000 or 3% to $46,261,000 in 2005 due to more efficient collections. Inventories increased $4,097,000 or 14% to $33,684,000 in 2005. The increases were due primarily to increased levels of business and higher unit costs of inventories. Parts inventory increased in our frozen beverages business in response to higher levels of managed service business.
Net property, plant and equipment decreased $429,000 to $89,045,000 because depreciation of fixed assets exceeded purchases of fixed assets and assets acquired in acquisitions.
Other intangible assets, less accumulated amortization increased $5,239,000 to $7,043,000 because of the purchase of intangible assets of $6,080,000 in the Snackworks acquisition.
Goodwill increased $7,145,000 to $53,622,000 as a result of the purchase of Snackworks, LLC.
Accounts payable and accrued liabilities increased $5,256,000, or 11% from 2004 to 2005 primarily because of increased levels of business, higher accruals for our insurance reserves and higher income taxes payable.
Back to Contents
Deferred income tax liabilities increased by $1,166,000 to $17,987,000 which related primarily to depreciation of property, plant and equipment.
Common stock increased $3,022,000 to $36,091,000 in 2005 because of the exercise of incentive and nonqualified stock options and stock issued under our stock purchase plan for employees.
Net cash provided by operating activities increased $5,500,000 to $52,644,000 in 2005 primarily because of an increase to net earnings of $3,333,000 and a reduction in working capital of $2,363,000 in 2005 compared to an increase in working capital of $1,995,000 in 2004 which was partially offset by a reduction in deferred income taxes of $174,000 in 2005 compared to an increase in deferred taxes of $2,394,000 in 2004.
Net cash used in investing activities decreased $13,511,000 to $55,433,000 in 2005 from $68,944,000 in 2004 primarily because purchases of marketable securities, net of proceeds from marketable securities, were $18,775,000 higher in 2004 than in 2005 which was partially offset by $3,420,000 of higher payments in 2005 for purchases of companies.
Net cash used in financing activities of $1,159,000 in 2005 compared to net cash provided by financing activities of $3,810,000 in 2004. The change was primarily caused by the payment of cash dividends of $3,400,000 in 2005, the first year in which we paid cash dividends.
In 2005, the major variables in determining our net increase in cash and cash equivalents and marketable securities available for sale were our net earnings, depreciation and amortization of fixed assets, purchases of property, plant and equipment and payments for the purchase of companies. Other variables which in the past have had a significant impact on our change in cash and cash equivalents are payments for the repurchase of common stock, proceeds from borrowings and payments of long-term debt. As discussed in results of operations, our net earnings may be influenced by many factors. Depreciation and amortization of fixed assets is primarily determined by past purchases of property, plant and equipment although it could be impacted by a significant acquisition in the current year. Purchases of property, plant and equipment are primarily determined by our ongoing normal manufacturing and marketing requirements but could be increased significantly for manufacturing expansion requirements or large frozen beverage customer needs.
| Item 7A. | Quantitative And Qualitative Disclosures About Market Risk |
The following is the Company’s quantitative and qualitative analysis of its financial market risk: The following is the Company’s quantitative and qualitative analysis of its financial market risk:
Interest Rate Sensitivity |
The Company has in the past entered into interest rate swaps to limit its exposure to interest rate risk and may do so in the future if the Board of Directors feels that such non-trading purpose is in the best interest of the Company and its shareholders. As of September 26, 2009, the Company had no interest rate swap contracts. The Company has in the past entered into interest rate swaps to limit its exposure to interest rate risk and may do so in the future if the Board of Directors feels that such non-trading purpose is in the best interest of the Company and its shareholders. As of September 30, 2006, the Company had no interest rate swap contracts.
At September 26, 2009, the Company had no long-term debt obligations. At September 30, 2006, the Company had no long-term debt obligations.
The Company’s most significant raw material requirements include flour, shortening, corn syrup, sugar, juice, cheese, chocolate, and a variety of nuts. The Company attempts to minimize the effect of future price fluctuations related to the purchase of raw materials primarily through forward purchasing to cover future manufacturing requirements, generally for periods from 1 to 12 months. Futures contracts are not used in combination with forward purchasing of these raw materials. The Company’s procurement practices are intended to reduce the risk of future price increases, but also may potentially limit the ability to benefit from possible price decreases. The Company’s most significant raw material requirements include flour, shortening, corn syrup, chocolate, and macadamia nuts. The Company attempts to minimize the effect of future price fluctuations related to the purchase of raw materials primarily through forward purchasing to cover future manufacturing requirements, generally for periods from 1 to 12 months. Futures contracts are not used in combination with forward purchasing of these raw materials. The Company’s procurement practices are intended to reduce the risk of future price increases, but also may potentially limit the ability to benefit from possible price decreases.
Back to Contents
Foreign Exchange Rate Risk |
The Company has not entered into any forward exchange contracts to hedge its foreign currency rate risk as of September 26, 2009 because it does not believe its foreign exchange exposure is significant. The Company has not entered into any forward exchange contracts to hedge its foreign currency rate risk as of September 30, 2006 because it does not believe its foreign exchange exposure is significant.
| Item 8. | Financial Statements And Supplementary Data |
The financial statements of the Company are filed under this Item 8, beginning on page F-1 of this report. The financial statements of the Company are filed under this Item 8, beginning on page F-1 of this report.
| Item 9. | Changes In And Disagreements With Accountants On Accounting And Financial Disclosure |
None. None.
| Disclosure Controls and Procedures |
We carried out an evaluation under the supervision and with the participation of our management, including our chief executive officer and chief financial officer, of the effectiveness of the design and operation of our disclosure controls and procedures, as such term is defined under Rule 13a-15(e) promulgated under the Securities Exchange Act of 1934 (the “Exchange Act), as amended for financial reporting, as of September 30, 2006. Based on that evaluation, our chief executive officer and chief financial officer concluded that these controls and procedures are effective to ensure that information required to be disclosed by the Company in reports that it files or submits under the Exchange Act is recorded, processed, summarized, and reported as specified in Securities and Exchange Commission rules and forms. There were no changes in these controls or procedures identified in connection with the evaluation of such controls or procedures that occurred during our last fiscal quarter, or in other factors that have materially affected, or are reasonably likely to materially affect these controls or procedures. There were no changes in the Company’s internal controls over financial reporting that occurred during our last fiscal quarter.
Our disclosure controls and procedures are designed to ensure that information required to be disclosed by us in the reports that we file or submit under the Exchange Act is recorded, processed, summarized, and reported, within the time periods specified in the rules and forms of the Securities and Exchange Commission. These disclosure controls and procedures include, among other things, controls and procedures designed to ensure that information required to be disclosed by us in the reports that we file under the Exchange Act is accumulated and communicated to our management, including our chief executive officer and chief financial officer, as appropriate to allow timely decisions regarding required disclosure.
We carried out an evaluation under the supervision and with the participation of our management, including our chief executive officer and chief financial officer, of the effectiveness of the design and operation of our disclosure controls and procedures, as such term is defined under Rule 13a-15(e) promulgated under the Securities Exchange Act of 1934 (the “Exchange Act”), as amended for financial reporting, as of September 26, 2009. Based on that evaluation, our chief executive officer and chief financial officer concluded that these controls and procedures are effective to ensure that information required to be disclosed by the Company in reports that it files or submits 21
Table of Contents
under the Exchange Act is recorded, processed, summarized, and reported as specified in Securities and Exchange Commission rules and forms. There were no changes in these controls or procedures identified in connection with the evaluation of such controls or procedures that occurred during our last fiscal quarter, or in other factors that have materially affected, or are reasonably likely to materially affect these controls or procedures. There were no changes in the Company’s internal controls over financial reporting that occurred during our last fiscal quarter.
Our disclosure controls and procedures are designed to provide reasonable assurance that information required to be disclosed by us in the reports that we file or submit under the Exchange Act is recorded, processed, summarized, and reported, within the time periods specified in the rules and forms of the Securities and Exchange Commission. These disclosure controls and procedures include, among other things, controls and procedures designed to provide reasonable assurance that information required to be disclosed by us in the reports that we file under the Exchange Act is accumulated and communicated to our management, including our chief executive officer and chief financial officer, as appropriate to allow timely decisions regarding required disclosure. Management’s Report on Internal Control over Financial Reporting |
Our management is responsible for establishing and maintaining adequate internal control over financial reporting. Internal control over financial reporting is defined in Rule 13a-15(f) and 15d-15(f) under the Exchange Act as a process designed by, or under the supervision of, the chief executive officer and chief financial officer and effected by the board of directors and management to provide reasonable assurance regarding the reliability of financial reporting and the preparation of financial statements for external purposes in accordance with generally accepted accounting principles and includes those policies and procedures that: Pertain to the maintenance of records that in reasonable detail accurately and fairly reflect the transactions and dispositions of our assets; | | | | • |
Provide reasonable assurance that transactions are recorded as necessary to permit preparation of financial statements in accordance with generally accepted accounting principles, and that receipts and expenditures of the company are being made only in accordance with authorizations of our management and board of directors; |
| | | | • |
Provide reasonable assurance regarding prevention or timely detection of unauthorized acquisition, use or disposition of our assets that could have a material effect on the financial statements. |
Because of its inherent limitations, internal control over financial reporting may not prevent or detect misstatements. Projections of any evaluation of effectiveness to future periods are subject to the risks that controls may become inadequate because of changes in conditions, or that the degree of compliance with the policies or procedures may deteriorate. Our management assessed the effectiveness of our internal control over financial reporting as of September 26, 2009. In making this assessment, our management used the criteria set forth by the Committee of Sponsoring Organizations of the Treadway Commission (COSO) in Internal Control-Integrated Framework. Based on our assessment, our management believes that, as of September 26, 2009, our internal control over financial reporting is effective. There have been no changes that occurred during our fourth quarter that have materially affected, or are reasonably likely to materially affect, our internal control over financial reporting.
Back to Contents
Because of its inherent limitations, internal control over financial reporting may not prevent or detect misstatements. Projections of any evaluation of effectiveness to future periods are subject to the risks that controls may become inadequate because of changes in conditions, or that the degree of compliance with the policies or procedures may deteriorate.
Our management assessed the effectiveness of our internal control over financial reporting as of September 30, 2006. In making this assessment, our management used the criteria set forth by the Committee of Sponsoring Organizations of the Treadway Commission (COSO) in Internal Control-Integrated Framework.
Based on our assessment, our management believes that, as of September 30, 2006, our internal control over financial reporting is effective.
Additionally, our independent accounting firm, Grant Thornton LLP, audited management’s assessment and independently assessed the effectiveness of the Company’s internal control over financial reporting. Grant Thornton LLP has issued an attestation report concurring with management’s assessment of internal controls, which is included in Part II, Item 8 of this Form 10-K.
| Item 9B. | Other Information |
There was no information required on Form 8-K during the quarter that was not reported.
There was no information required on Form 8-K during the quarter that was not reported. PART III
Back to Contents
PART III
Item 10.Directors, Executive Officers and Corporate Governance Portions of the information concerning directors and executive officers, appearing under the captions “Information Concerning Nominees For Election To Board” and “Information Concerning Continuing Directors And Executive Officers Of Officers” and information concerning Section 16(a) Compliance appearing under the caption 22
Table of Contents “Compliance with Section 16(a) of the Securities Exchange Act of 1934” in the Company’s Proxy Statement filed with the Securities and Exchange Commission in connection with the Annual Meeting of Shareholders to be held on February 8, 2010 (“2009 Proxy Statement”) is incorporated herein by reference.Portions of the information concerning the Audit Committee, the requirement for an Audit Committee Financial Expert and the Nominating Committee in the Company’s 2009 Proxy Statement filed with the Securities and Exchange Commission in connection with the Annual Meeting of Shareholders to be held on February 8, 2010, is incorporated herein by reference. The RegistrantCompany has adopted a Code of Ethics pursuant to Section 406 of the Sarbanes-Oxley Act of 2002, which applies to the Company’s principal executive officer and senior financial officer. The Company has also adopted a Code of Business Conduct and Ethics which applies to all employees. The Company will furnish any person, without charge, a copy of the Code of Ethics upon written request to J & J Snack Foods Corp., 6000 Central Highway, Pennsauken, New Jersey 08109, Attn: Dennis Moore. A copy of the Code of Ethics can also be found on our website atwww.jjsnack.com. Any waiver of any provision of the Code of Ethics granted to the principal executive officer or senior financial officer may only be granted by a majority of the Company’s disinterested directors. If a waiver is granted, information concerning the waiver will be posted on our website www.jjsnack.com for a period of 12 months. |
Portions of the information concerning directors and executive officers, appearing under the captions “Information Concerning Nominees For Election To Board” and “Information Concerning Continuing Directors And Executive Officers” and information concerning Section 16(a) Compliance appearing under the caption “Compliance with Section 16(a) of the Securities Exchange Act of 1934” in the Company’s Proxy Statement filed with the Securities and Exchange Commission in connection with the Annual Meeting of Shareholders to be held on February 7, 2007 (2007 Proxy Statement) is incorporated herein by reference.
Portions of the information concerning the Audit Committee, the requirement for an Audit Committee Financial Expert and the Nominating Committee in the Company’s 2007 Proxy Statement filed with the Securities and Exchange Commission in connection with the Annual Meeting of Shareholders to be held on February 7, 2007, is incorporated herein by reference.
The Company has adopted a Code of Ethics pursuant to Section 406 of the Sarbanes-Oxley Act of 2002, which applies to the Company’s principal executive officer and senior financial officer. The Company has also adopted a Code of Business Conduct and Ethics which applies to all employees. The Company will furnish any person, without charge, a copy of the Code of Ethics upon written request to J & J Snack Foods Corp., 6000 Central Highway, Pennsauken, New Jersey 08109, Attn: Dennis Moore. A copy of the Code of Ethics can also be found on our website at www.jjsnack.com. Any waiver of any provision of the Code of Ethics granted to the principal executive officer or senior financial officer may only be granted by a majority of the Company’s disinterested directors. If a waiver is granted, information concerning the waiver will be posted on our website www.jjsnack.com for a period of 12 months.
Item 11.Executive Compensation |
Information concerning executive compensation appearing in the Company’s 2009 Proxy Statement under the caption “Management Remuneration” is incorporated herein by reference. The following is a list of the executive officers of the Company and their principal past occupations or employment. All such persons serve at the pleasure of the Board of Directors and have been elected to serve until the Annual Meeting of Shareholders on February 8, 2010 or until their successors are duly elected. The following is a list of the executive officers of the Company and their principal past occupations or employment. All such persons serve at the pleasure of the Board of Directors and have been elected to serve until the Annual Meeting of Shareholders on February 7, 2007 or until their successors are duly elected.
| | Name
| | Age | | Position | Name
| | | | Age
| | Position
|
|---|
|
|
| |
| |
|
| | Gerald B. Shreiber | 65 | | | | | 68 | | | Chairman of the Board, President, Chief Executive Officer and Director | | Dennis G. Moore | | | | | 54 | | | Senior Vice President, Chief Financial Officer, Secretary, Treasurer and Director | | Robert M. Radano | | | | | 60 | | | Senior Vice President, Sales and Chief Operating Officer | | Dan Fachner | | | | | 49 | | | President of The ICEE Company Subsidiary | | Vincent Melchiorre | | | | | 49 | | | Executive Vice President and Chief Marketing Officer |
Gerald B. Shreiber is the founder of the Company and has served as its Chairman of the Board, President, and Chief Executive Officer and Director | since its inception in 1971. His term as a director expires in 2010. Dennis G. Moore | 51 | | | Senior Vice President, joined the Company in 1984. He served in various controllership functions prior to becoming the Chief Financial Officer Secretary, Treasurer and Director | | in June 1992. His term as a director expires in 2012. Robert M. Radano | 57 | | | joined the Company in 1972 and in May 1996 was named Chief Operating Officer of the Company. Prior to becoming Chief Operating Officer, he was Senior Vice President, Sales and Chief Operating Officer | | responsible for national food service sales of J & J. Dan Fachner | 46 | | | has been an employee of ICEE-USA Corp., which was acquired by the Company in May 1987, since 1979. He was named Senior Vice President of The ICEE Company Subsidiary | | Michael Karaban
| 60 | | | Senior Vicein April 1994 and became President Marketing |
in May 1997.Vincent Melchiorre joined the Company in June 2007. Prior to joining the Company, he had been employed in management positions with Weston Foods, USA for one year, The Tasty Baking Company for three years and The Campbell Soup Company for over twenty years. 23
Gerald B. Shreiber is the founder of the Company and has served as its Chairman of the Board, President, and Chief Executive Officer since its inception in 1971. His term as a director expires in 2010.
Dennis G. Moore joined the Company in 1984. He served in various controllership functions prior to becoming the Chief Financial Officer in June 1992. His term as a director expires in 2007.
Robert M. Radano joined the Company in 1972 and in May 1996 was named Chief Operating Officer of the Company. Prior to becoming Chief Operating Officer, he was Senior Vice President, Sales responsible for national food service sales of J & J.
Dan Fachner has been an employee of ICEE-USA Corp., which was acquired by the Company in May 1987, since 1979. He was named Senior Vice President of The ICEE Company in April 1994 and became President in May 1997.
Michael Karaban has been an employee of the Company in charge of its marketing department since 1990 and in February 2002 was elected Senior Vice President, Marketing.
Back to Contents
Table of ContentsItem 12. | | Security Ownership Of Certain Beneficial Owners And Management And Related Stockholder Matters |
Information concerning the security ownership of certain beneficial owners and management appearing in the Company’s 2009 Proxy Statement under the caption “Security Ownership of Certain Beneficial Owners And Management And Related Stockholder Mattersand Management” is incorporated herein by reference. |
The following table details information regarding the Company’s existing equity compensation plans as of September 26, 2009. | | | | (a) | | (b) | | (c) |
|---|
Plan Category
| | | | Number of
securities to
be issued upon
exercise of
outstanding
options, warrants
and rights
| | Weighted-average
exercise price
of outstanding
options, warrants
and rights
| | Number of
securities remaining
available for future
issuance under
equity compensation
plans (excluding
securities reflected
in column (a))
|
|---|
Equity compensation plans approved
by security holders | | | | | 746,000 | | | $ | 23.70 | | | | 1,321,000 | | Equity compensation plans not approved
by security holders | | | | | — | | | | — | | | | — | | | Total | | | | | 746,000 | | | $ | 23.70 | | | | 1,321,000 | |
Information concerning the security ownership of certain beneficial owners and management appearing in the Company’s 2007 Proxy Statement under the caption “Security Ownership of Certain Beneficial Owners and Management” is incorporated herein by reference.
The following table details information regarding the Company’s existing equity compensation plans as of September 30, 2006.
| | | (a) | | (b) | | (c) | | | Plan Category | | | Number of securities to be issued upon exercise of outstanding options, warrants and rights | | Weighted-average exercise price of outstanding options, warrants and rights | | Number of securities remaining available for future issuance under equity compensation plans (excluding securities reflected in column (a)) | |
|
| | |
|
| |
|
| |
|
| | | Equity compensation plans approved by security holders | | | 1,233,000 | | $ | 16.17 | | | 963,000 | | | Equity compensation plans not approved by security holders | | | — | | | — | | | — | | | | |
|
| |
|
| |
|
| | | Total | | | 1,233,000 | | $ | 16.17 | | | 963,000 | | | | |
|
| |
|
| |
|
| |
| Item 13.Certain Relationships And Related Transactions, and Director Independence |
None to report. None to report.
Item 14.Principal Accounting Fees And Services |
Information concerning the Principal Accounting Fees and Services in the Company’s 2007 Proxy Statement is incorporated herein by reference.
Information concerning the Principal Accountant Fees and Services in the Company’s 2009 Proxy Statement is incorporated herein by reference. PART IV
Back to Contents
PART IV
Item 15.Exhibits, Financial Statement Schedules |
(a) The following documents are filed as part of this Report: | | | | | The following documents are filed as part of this Report: |
(1) Financial Statements The financial statements filed as part of this report are listed on the Index to Consolidated Financial Statements and Financial Statements Schedule on page F-1. |
| | | | | | (2) | Financial Statement SchedulesSchedule — Page S-1 |
| | | | | Schedule II — Valuation and Qualifying Accounts |
All other schedules are omitted either because they are not applicable or because the information required is contained in the financial statements or notes thereto.
| 3.1 | | 3.1 | Amended and Restated Certificate of Incorporation filed February 28, 1990. (Incorporated by reference from the Company’s Form 10-Q dated May 4, 1990.) |
| 3.2 | | Revised Bylaws adopted May 17, 2006. (Incorporated by reference from the Company’s Form 10-K dated December 6, 2006.) |
| 4.3 | | Amended and Restated Loan Agreement dated December 1, 2006 by and among J & J Snack Foods Corp. and Certain of its Subsidiaries and Citizens Bank of Pennsylvania, as Agent. (Incorporated by reference from the Company’s Form 10-K dated December 6, 2006.) |
24
Table of Contents | 10.1 | | | | 3.2** | Revised Bylaws adopted May 17, 2006. |
| | | | 4.3** | Amended and Restated Loan Agreement dated December 1, 2006 by and among J & J Snack Foods Corp. and Certain of its Subsidiaries and Citizens Bank of Pennsylvania, as Agent. |
| | | | 10.1 | Proprietary Exclusive Manufacturing Agreement dated July 17, 1984 between J & J Snack Foods Corp. and Wisco Industries, Inc. (Incorporated by reference from the Company’s Form S-1 dated February 4, 1986, file no. 33-2296). |
| 10.2* | | | | 10.2* | J & J Snack Foods Corp. Stock Option Plan. (Incorporated by reference from the Company’s Definitive Proxy Statement dated December 19, 2002.) |
| 10.3* | | Adoption Agreement for MFS Retirement Services, Inc. Non-Standardized 401(K) Profit Sharing Plan and Trust, effective September 1, 2004. (Incorporated by reference from the Company’s Form 10-K dated December 6, 2006.) | | 10.3* |
** | Adoption Agreement for MFS Retirement Services, Inc. Non-Standardized 401(K) Profit Sharing Plan and Trust, effective September 1, 2004.| 10.4* | | J & J Snack Foods Corp. Directors’ and Consultants’ Deferred Compensation Plan adopted November 21, 2005. (Incorporated by reference from the Company’s Form 10-K dated December 6, 2006.) | | | | | 10.4* |
** | J & J Snack Foods Corp. Directors’ and Consultants’ Deferred Compensation Plan adopted November 21, 2005. | | | | | 10.6 | Lease dated September 24, 1991 between J & J Snack Foods Corp. of New Jersey and A & H Bloom Construction Co. for the 101,200 square foot building next to the Company’s manufacturing facility in Pennsauken, New Jersey. (Incorporated by reference form| 10.6 | | Lease dated September 24, 1991 between J & J Snack Foods Corp. of New Jersey and A & H Bloom Construction Co. for the 101,200 square foot building next to the Company’s manufacturing facility in Pennsauken, New Jersey. (Incorporated by reference from the Company’s Form 10-K dated December 17, 1991.) | |
| 10.7 | Lease dated August 29, 1995 between J & J Snack Foods Corp. and 5353 Downey Associated Ltd. for the lease of the Vernon, CA facility. (Incorporated by reference from the Company’s Form 10-K dated December 21, 1995.) | |
| 10.8* | | | | 10.8* | J & J Snack Foods Corp. Employee Stock Purchase Plan (Incorporated by reference from the Company’s Form S-8 dated May 16, 1996). | |
| 10.11 | | | | 10.11 | Amendment No. 1 to Lease dated August 29, 1995 between J & J Snack Foods Corp. and 5353 Downey Associated Ltd. for the lease of the Vernon, CA facility. (Incorporated by reference from the Company’s Form 10-K dated December 18, 2002). | | |
| 10.12 | | Employment agreement between Vincent A. Melchiorre and J & J Snack Foods Corp. (Incorporated by reference from the Company’s 8-K dated June 5, 2007). | | 14.1 | Code of Ethics Pursuant to Section 406 of the Sarbanes-Oxley Act of 2002. |
| 10.13** | | Lease dated July 15, 2009 between J & J Snack Foods Sales Corp. and The Bloom Organization of South Jersey, LLC for the 101,200 square foot building next to the Company’s manufacturing facility in Pennsauken, New Jersey. | | | (Incorporated |
| 10.14** | | Leases and amendments to leases between Liberty Venture I, LP and J & J Snack Foods Corp. for the three buildings located in Bridgeport, New Jersey. |
| 14.1 | | Code of Ethics Pursuant to Section 406 of the Sarbanes-Oxley Act of 2002. (Incorporated by reference from the Company’s 10-Q dated July 20, 2004). | |
| 21.1** | | | | 21.1** | Subsidiaries of J & J Snack Foods Corp. |
| 23.1** | | Consent of Independent Registered Public Accounting Firm. |
| 31.1** | | | | 23.1** | Consent of Independent Registered Public Accounting Firm. |
Back to Contents
| 31.1** | Certification Pursuant to Section 302 of the Sarbanes-Oxley Act of 2002. |
| 31.2** | | | | 31.2** | Certification Pursuant to Section 302 of the Sarbanes-Oxley Act of 2002. |
| 32.1** | | | | 32.1** | Certification Pursuant to 18 U.S.C. Section 1350, As Adopted Pursuant To Section 906 Of The Sarbanes-Oxley Act of 2002. |
| 32.2** | | | | 32.2** | Certification Pursuant to 18 U.S.C. Section 1350, As Adopted Pursuant To Section 906 Of The Sarbanes-Oxley Act of 2002. | | | |
25
Table of Contents SIGNATURES
Back to Contents
SIGNATURES
Pursuant to the requirements of Section 13(a) or 15(d) of the Securities Exchange Act of 1934, the Registrant has duly caused report to be signed on its behalf by the undersigned, thereunto duly authorized. | | J & J SNACK FOODS CORP. | | | | December 6, 2006 | | By | /s/ Gerald B. Shreiber | | | Gerald B. Shreiber,
Chairman of the Securities Exchange Act of 1934, the Registrant has duly caused report to be signed on its behalf by the undersigned, thereunto duly authorized. | | | | J & J SNACK FOODS CORP. | | | December 8, 2009 | | | | By | | /s/ Gerald B. Shreiber | | | | | | | Gerald B. Shreiber,
Chairman of the Board,
President, Chief Executive
Officer and Director
(Principal Executive Officer) | |
Pursuant to the requirements of the Securities Exchange Act of 1934, this report has been signed below by the following persons on behalf of the Registrant and in the capacities and on the dates indicated. | December 8, 2009 | | | | | | /s/ Gerald B. Shreiber | | | | | | | Gerald B. Shreiber,
Chairman of the Board,
President, Chief Executive
Officer and Director
(Principal Executive Officer) | | December 8, 2009 | | | | | | /s/ Dennis G. Moore
Dennis G. Moore, Senior Vice
President, Chief Financial
Officer and Director
(Principal Financial Officer)
(Principal Accounting Officer) | | December 8, 2009 | | | | | | /s/ Sidney R. Brown
Sidney R. Brown, Director | | December 8, 2009 | | | | | | /s/ Peter G. Stanley
Peter G. Stanley, Director | | December 8, 2009 | | | | | | /s/ Leonard M. Lodish
Leonard M. Lodish, Director |
26
Table of Contents J & J SNACK FOODS CORP.
INDEX TO CONSOLIDATED FINANCIAL STATEMENTS
AND FINANCIAL STATEMENT SCHEDULE Financial Statements:
| | | | December 6, 2006 | | /s/ Gerald B. Shreiber
Gerald B. Shreiber,
Chairman of the Board,
President, Chief Executive
Officer and Director | | | | December 6, 2006 | | /s/ Dennis G. Moore
Dennis G. Moore, Senior Vice
President, Chief Financial
Officer and Director | | | | December 6, 2006 | | /s/ Sidney R. Brown
Sidney R. Brown, Director | | | | December 6, 2006 | | /s/ Peter G. Stanley
Peter G. Stanley, Director | | | | December 6, 2006 | | /s/ Leonard M. Lodish
Leonard M. Lodish, Director | | | | |
Back to Contents
J & J SNACK FOODS CORP.
INDEX TO CONSOLIDATED FINANCIAL STATEMENTS
AND FINANCIAL STATEMENT SCHEDULE
Financial Statements:
| | Report of Independent Registered Public Accounting Firm | | | | | F-2 | | | Consolidated Balance Sheets as of September 26, 2009 and September 27, 2008 | | | | | F-3 | | Consolidated Statements of Earnings for fiscal years ended September 26, 2009,
September 27, 2008 and September 29, 2007 | | | | | F-4 | | Consolidated Statement of Changes in Stockholders’ Equity for the fiscal years
ended September 26, 2009, September 27, 2008 and September 29, 2007 | | | | | F-5 | | Consolidated Statements of Cash Flows for fiscal years ended September 26, 2009,
September 27, 2008 and September 29, 2007 | | | | | F-6 | | | Notes to Consolidated Financial Statements | | | | | F-7 | | Financial Statement Schedule:
| | | | | | | | Schedule II — Valuation and Qualifying Accounts | | | | | S-1 | | | | | | | |
F-1
Table of Contents Report of Independent Registered Public Accounting Firm | | | F-2 | | | | | | | We have audited the accompanying consolidated balance sheets of J & J Snack Foods Corp. and Subsidiaries as of September 30, 200626, 2009 and September 24, 2005 | | | F-4 | | | | | | | Consolidated Statements27, 2008, and the related consolidated statements of Earningsearnings, changes in stockholders’ equity, and cash flows for each of the three fiscal years in the period ended September 30, 2006,26, 2009 (52 weeks, 52 weeks, and 52 weeks, respectively). Our audits of the basic financial statements included the financial statement schedule, listed in the index appearing under Item 15(a)(2). We have also audited J & J Snack Foods Corp. and Subsidiaries’ internal control over financial reporting as of September 24, 200526, 2009, based on criteria established inInternal Control-Integrated Framework issued by the Committee of Sponsoring Organizations of the Treadway Commission (COSO). J & J Snack Foods Corp. and Subsidiaries’ management is responsible for these financial statements and financial statement schedule, for maintaining effective internal control over financial reporting, and for its assessment of the effectiveness of internal control over financial reporting which is included in the accompanying Management’s Report on Internal Control over Financial Reporting. Our responsibility is to express an opinion on these financial statements and financial statement schedule and an opinion on J & J Snack Foods Corp. and Subsidiaries’ internal control over financial reporting based on our audits.We conducted our audits in accordance with the standards of the Public Company Accounting Oversight Board (United States). Those standards require that we plan and perform the audits to obtain reasonable assurance about whether the financial statements are free of material misstatement and whether effective internal control over financial reporting was maintained in all material respects. Our audits of the financial statements included examining, on a test basis, evidence supporting the amounts and disclosures in the financial statements, assessing the accounting principles used and significant estimates made by management, and evaluating the overall financial statement presentation. Our audit of internal control over financial reporting included obtaining an understanding of internal control over financial reporting, assessing the risk that a material weakness exists, and testing and evaluating the design and operating effectiveness of internal control based on the assessed risk. Our audits also included performing such other procedures as we considered necessary in the circumstances. We believe that our audits provide a reasonable basis for our opinions. A company’s internal control over financial reporting is a process designed to provide reasonable assurance regarding the reliability of financial reporting and the preparation of financial statements for external purposes in accordance with generally accepted accounting principles. A company’s internal control over financial reporting includes those policies and procedures that (1) pertain to the maintenance of records that, in reasonable detail, accurately and fairly reflect the transactions and dispositions of the assets of the company; (2) provide reasonable assurance that transactions are recorded as necessary to permit preparation of financial statements in accordance with generally accepted accounting principles, and that receipts and expenditures of the company are being made only in accordance with authorizations of management and directors of the company; and (3) provide reasonable assurance regarding prevention or timely detection of unauthorized acquisition, use, or disposition of the company’s assets that could have a material effect on the financial statements. Because of its inherent limitations, internal control over financial reporting may not prevent or detect misstatements. Also, projections of any evaluation of effectiveness to future periods are subject to the risk that controls may become inadequate because of changes in conditions, or that the degree of compliance with the policies or procedures may deteriorate. In our opinion, the financial statements referred to above present fairly, in all material respects, the consolidated financial position of J & J Snack Foods Corp. and Subsidiaries as of September 26, 2009 and September 25, 200427, 2008, and the consolidated results of its operations and its consolidated cash flows for each of the three fiscal years in the period ended September 26, 2009 (52 weeks, 52 weeks and 52 weeks) in conformity with accounting principles generally accepted in the United States of America. Also, in our opinion, the related financial statement schedule, when considered in relation to the basic financial statements taken as a whole, presents fairly, in all material respects, the information set forth therein. Also in our opinion, J & J Snack Foods Corp. and Subsidiaries maintained, in all material respects, effective internal control over financial reporting as of September 26, 2009, based on criteria established inInternal Control-Integrated Framework issued by COSO. As discussed in Note A to the consolidated financial statements, the Company has adopted Accounting Standards Codification No. 740, Income Taxes, relating to uncertainties in income taxes in 2008. /s/ GRANT THORNTON LLP Philadelphia, Pennsylvania December 8, 2009 F-2
Table of Contents J & J SNACK FOODS CORP. AND SUBSIDIARIES
CONSOLIDATED BALANCE SHEETS | | | | | September 26,
2009
| | September 27,
2008
|
|---|
| | | | (in thousands, except share amounts) | |
|---|
Assets
| | | | | | | | | | | Current Assets
| | | | | | | | | | | | Cash and cash equivalents | | | | $ | 60,343 | | | $ | 44,265 | | | Marketable securities held to maturity | | | | | 38,653 | | | | 2,470 | | | Auction market preferred stock | | | | | — | | | | 14,000 | | Receivables
| | | | | | | | | | | | Trade, less allowances of $623 and $926, respectively | | | | | 59,734 | | | | 61,176 | | | Other | | | | | 808 | | | | 677 | | | Inventories | | | | | 46,004 | | | | 49,095 | | | Prepaid expenses and other | | | | | 1,910 | | | | 1,962 | | | Deferred income taxes | | | | | 3,659 | | | | 3,555 | | | Total current assets | | | | | 211,111 | | | | 177,200 | | | | | Property, Plant and Equipment, at cost | | | | | 383,156 | | | | 364,164 | | | Less accumulated depreciation and amortization | | | | | 285,983 | | | | 271,100 | | | | | | | | 97,173 | | | | 93,064 | | Other Assets
| | | | | | | | | | | | Goodwill | | | | | 60,314 | | | | 60,314 | | | Other intangible assets, net | | | | | 49,125 | | | | 53,633 | | | Marketable securities held to maturity | | | | | 19,994 | | | | — | | | Auction market preferred stock | | | | | — | | | | 21,200 | | | Other | | | | | 2,110 | | | | 2,997 | | | | | | | | 131,543 | | | | 138,144 | | | | | | | $ | 439,827 | | | $ | 408,408 | | Liabilities and Stockholders’ Equity
| | | | | | | | | | | | Current Liabilities | | | | | | | | | | | | Current obligations under capital leases | | | | $ | 96 | | | $ | 93 | | | Accounts payable | | | | | 48,204 | | | | 48,580 | | | Accrued liabilities | | | | | 5,919 | | | | 5,557 | | | Accrued compensation expense | | | | | 11,656 | | | | 10,232 | | | Dividends payable | | | | | 1,804 | | | | 1,732 | | | Total current liabilities | | | | | 67,679 | | | | 66,194 | | | | | Long-term obligations under capital leases | | | | | 285 | | | | 381 | | | Deferred income taxes | | | | | 27,033 | | | | 23,056 | | | Other long-term liabilities | | | | | 1,986 | | | | 1,999 | | Stockholders’ Equity
| | | | | | | | | | | Preferred stock, $1 par value; authorized,
10,000,000 shares; none issued | | | | | — | | | | — | | Common stock, no par value; authorized, 50,000,000 shares;
issued and outstanding 18,526,000 and 18,748,000 respectively | | | | | 41,777 | | | | 48,415 | | | Accumulated other comprehensive loss | | | | | (3,431 | ) | | | (2,003 | ) | | Retained earnings | | | | | 304,498 | | | | 270,366 | | | | | | | | 342,844 | | | | 316,778 | | | | | | | $ | 439,827 | | | $ | 408,408 | |
The accompanying notes are an integral part of these statements.
F-3
Table of Contents | | F-5 | J & J SNACK FOODS CORP. AND SUBSIDIARIES
CONSOLIDATED STATEMENTS OF EARNINGS
(in thousands, except per share information) | | | | Fiscal year ended
| |
|---|
| | | | September 26,
2009
(52 weeks)
| | September 27,
2008
(52 weeks)
| | September 29,
2007
(52 weeks)
|
|---|
| Net Sales | | | | $ | 653,047 | | | $ | 629,359 | | | $ | 568,901 | | | Cost of goods sold(1) | | | | | 444,203 | | | | 442,452 | | | | 382,374 | | | Gross profit | | | | | 208,844 | | | | 186,907 | | | | 186,527 | | | Operating expenses | | | | | | | | | | | | | | | | Marketing(2) | | | | | 69,493 | | | | 69,792 | | | | 70,248 | | | Distribution(3) | | | | | 49,705 | | | | 52,609 | | | | 48,945 | | | Administrative(4) | | | | | 22,713 | | | | 21,545 | | | | 20,142 | | | Other general income | | | | | (5 | ) | | | (375 | ) | | | (1,388 | ) | | | | | | | 141,906 | | | | 143,571 | | | | 137,947 | | | Operating income | | | | | 66,938 | | | | 43,336 | | | | 48,580 | | | | Other income (expenses)
| | | | | | | | | | | | | | | | Investment income | | | | | 1,386 | | | | 2,665 | | | | 2,720 | | | Interest expense and other | | | | | (115 | ) | | | (116 | ) | | | (142 | ) | | | | | | | 1,271 | | | | 2,549 | | | | 2,578 | | | Earnings before income taxes | | | | | 68,209 | | | | 45,885 | | | | 51,158 | | | | | Income taxes | | | | | 26,897 | | | | 17,977 | | | | 19,046 | | | | | NET EARNINGS | | | | $ | 41,312 | | | $ | 27,908 | | | $ | 32,112 | | | | | Earnings per diluted share | | | | $ | 2.21 | | | $ | 1.47 | | | $ | 1.69 | | | | | Weighted average number of diluted shares | | | | | 18,713 | | | | 19,008 | | | | 19,005 | | | | | Earnings per basic share | | | | $ | 2.23 | | | $ | 1.49 | | | $ | 1.72 | | | | | Weighted average number of basic shares | | | | | 18,516 | | | | 18,770 | | | | 18,635 | |
| (1) | | Includes share-based compensation expense of $211 for the year ended September 26, 2009, $229 for the year ended September 27, 2008 and $227 for the year ended September 29, 2007. | | | | |
| (2) | | Includes share-based compensation expense of $729 for the year ended September 26, 2009, $799 for the year ended September 27, 2008 and $716 for the year ended September 29, 2007. |
| (3) | | Includes share-based compensation expense of $21 for the year ended September 26, 2009, $23 for the year ended September 27, 2008 and $50 for the year ended September 29, 2007. |
| (4) | | Includes share-based compensation expense of $755 for the year ended September 26, 2009, $800 for the year ended September 27, 2008 and $747 for the year ended September 29, 2007. |
F-4
Table of Contents J & J SNACK FOODS CORP. AND SUBSIDIARIES
CONSOLIDATED STATEMENT OF CHANGES IN STOCKHOLDERS’ EQUITY
(in Stockholders’ Equitythousands) | | | | Common Stock
| |
|---|
| | | | Shares
| | Amount
| | Accumulated
Other
Comprehensive
Loss
| | Retained
Earnings
| | Total
| | Comprehensive
Income
|
|---|
| Balance at October 1, 2006 | | | | | 18,468 | | | $ | 41,098 | | | $ | (1,964 | ) | | $ | 224,522 | | | $ | 263,656 | | | | | | Issuance of common stock upon
exercise of stock options | | | | | 211 | | | | 3,669 | | | | — | | | | — | | | | 3,669 | | | | | | Issuance of common stock for
employee stock purchase plan | | | | | 23 | | | | 700 | | | | — | | | | — | | | | 700 | | | | | | | Foreign currency translation adjustment | | | | | — | | | | — | | | | (42 | ) | | | — | | | | (42 | ) | | $ | (42 | ) | Issuance of common stock under
deferred stock plan | | | | | — | | | | 275 | | | | — | | | | — | | | | 275 | | | | | | | Dividends declared | | | | | — | | | | — | | | | — | | | | (6,326 | ) | | | (6,326 | ) | | | | | | Share-based compensation | | | | | — | | | | 1,538 | | | | — | | | | — | | | | 1,538 | | | | | | | Net earnings | | | | | — | | | | — | | | | — | | | | 32,112 | | | | 32,112 | | | | 32,112 | | | Comprehensive income | | | | | — | | | | — | | | | — | | | | — | | | | — | | | $ | 32,070 | | | Balance at September 29, 2007 | | | | | 18,702 | | | $ | 47,280 | | | $ | (2,006 | ) | | $ | 250,308 | | | $ | 295,582 | | | | | | Cumulative effective of change in
accounting for income taxes | | | | | — | | | | — | | | | — | | | | (925 | ) | | | (925 | ) | | | | | Issuance of common stock upon
exercise of stock options | | | | | 150 | | | | 2,029 | | | | — | | | | — | | | | 2,029 | | | | | | Issuance of common stock for
employee stock purchase plan | | | | | 31 | | | | 782 | | | | — | | | | — | | | | 782 | | | | | | | Foreign currency translation adjustment | | | | | — | | | | — | | | | 3 | | | | — | | | | 3 | | | $ | 3 | | | Issuance of common stock under deferred stock plan | | | | | — | | | | 388 | | | | — | | | | — | | | | 388 | | | | | | | Dividends declared | | | | | — | | | | — | | | | — | | | | (6,925 | ) | | | (6,925 | ) | | | | | | Share-based compensation | | | �� | | — | | | | 1,475 | | | | — | | | | — | | | | 1,475 | | | | | | | Repurchase of common stock | | | | | (135 | ) | | | (3,539 | ) | | | — | | | | — | | | | (3,539 | ) | | | | | | Net earnings | | | | | — | | | | — | | | | — | | | | 27,908 | | | | 27,908 | | | | 27,908 | | | Comprehensive income | | | | | — | | | | — | | | | — | | | | — | | | | — | | | $ | 27,911 | | | Balance at September 27, 2008 | | | | | 18,748 | | | $ | 48,415 | | | $ | (2,003 | ) | | $ | 270,366 | | | $ | 316,778 | | | | | | | Issuance of common stock upon exercise of stock options | | | | | 198 | | | | 3,284 | | | | — | | | | — | | | | 3,284 | | | | | | | Issuance of common stock for employee stock purchase plan | | | | | 26 | | | | 687 | | | | — | | | | — | | | | 687 | | | | | | | Foreign currency translation adjustment | | | | | — | | | | — | | | | (1,428 | ) | | | — | | | | (1,428 | ) | | $ | (1,428 | ) | Issuance of common stock under
deferred stock plan | | | | | 5 | | | | 368 | | | | — | | | | — | | | | 368 | | | | | | | Dividends declared | | | | | — | | | | — | | | | — | | | | (7,180 | ) | | | (7,180 | ) | | | | | | Share-based compensation | | | | | — | | | | 1,533 | | | | — | | | | — | | | | 1,533 | | | | | | | Repurchase of common stock | | | | | (451 | ) | | | (12,510 | ) | | | — | | | | — | | | | (12,510 | ) | | | | | | Net earnings | | | | | — | | | | — | | | | — | | | | 41,312 | | | | 41,312 | | | | 41,312 | | | Comprehensive income | | | | | — | | | | — | | | | — | | | | — | | | | — | | | $ | 39,884 | | | Balance at September 26, 2009 | | | | | 18,526 | | | $ | 41,777 | | | $ | (3,431 | ) | | $ | 304,498 | | | $ | 342,844 | | | | | |
The accompanying notes are an integral part of these statements.
F-5
Table of Contents J & J SNACK FOODS CORP. AND SUBSIDIARIES
CONSOLIDATED STATEMENTS OF CASH FLOWS
(in thousands) | | | | Fiscal year ended
| |
|---|
| | | | September 26,
2009
(52 weeks)
| | September 27,
2008
(52 weeks)
| | September 29,
2007
(52 weeks)
|
|---|
Operating activities:
| | | | | | | | | | | | | | | | Net earnings | | | | $ | 41,312 | | | $ | 27,908 | | | $ | 32,112 | | Adjustments to reconcile net earnings to net
cash provided by operating activities:
| | | | | | | | | | | | | | | | Depreciation and amortization of fixed assets | | | | | 22,663 | | | | 22,181 | | | | 22,451 | | | Amortization of intangibles and deferred costs | | | | | 5,090 | | | | 5,289 | | | | 4,557 | | Gains from disposals and impairment
of property & equipment | | | | | (31 | ) | | | (174 | ) | | | (49 | ) | | Other | | | | | — | | | | — | | | | (150 | ) | | Share-based compensation | | | | | 1,716 | | | | 1,851 | | | | 1,740 | | | Deferred income taxes | | | | | 3,839 | | | | 3,446 | | | | 557 | | Changes in assets and liabilities, net of effects
from purchase of companies:
| | | | | | | | | | | | | | | | Decrease (increase) in accounts receivable | | | | | 1,144 | | | | (4,701 | ) | | | (569 | ) | | Decrease (increase) in inventories | | | | | 2,993 | | | | (2,448 | ) | | | (5,722 | ) | | Decrease (increase) in prepaid expenses and other | | | | | 37 | | | | (537 | ) | | | (65 | ) | Increase in accounts payable and
accrued liabilities | | | | | 1,870 | | | | 2,082 | | | | 2,981 | | | Net cash provided by operating activities | | | | | 80,633 | | | | 54,897 | | | | 57,843 | | Investing activities:
| | | | | | | | | | | | | | | | Purchases of property, plant and equipment | | | | | (27,190 | ) | | | (22,781 | ) | | | (22,765 | ) | Payments for purchases of companies,
net of cash acquired | | | | | — | | | | — | | | | (52,747 | ) | | Purchase of marketable securities | | | | | (66,380 | ) | | | (2,470 | ) | | | — | | | Proceeds from redemption and sales of marketable securities | | | | | 10,204 | | | | — | | | | — | | | Purchase of auction market preferred stock | | | | | — | | | | (10,500 | ) | | | (60,875 | ) | | Proceeds from redemption and sales of auction market preferred stock | | | | | 35,200 | | | | 16,500 | | | | 78,882 | | | Proceeds from disposal of property and equipment | | | | | 326 | | | | 932 | | | | 592 | | | Other | | | | | 15 | | | | (535 | ) | | | (921 | ) | | Net cash used in investing activities | | | | | (47,825 | ) | | | (18,854 | ) | | | (57,834 | ) | | | Financing activities:
| | | | | | | | | | | | | | | | Payments to repurchase common stock | | | | | (12,510 | ) | | | (3,539 | ) | | | — | | | Proceeds from issuance of common stock | | | | | 3,971 | | | | 2,811 | | | | 4,369 | | | Payments of cash dividend | | | | | (7,108 | ) | | | (6,781 | ) | | | (6,123 | ) | | Payments on capitalized lease obligations | | | | | (93 | ) | | | (91 | ) | | | (15 | ) | | Net cash used in financing activities | | | | | (15,740 | ) | | | (7,600 | ) | | | (1,769 | ) | Effect of exchange rate on cash and
cash equivalents | | | | | (990 | ) | | | 3 | | | | (42 | ) | Net increase (decrease) in cash and
cash equivalents | | | | | 16,078 | | | | 28,446 | | | | (1,802 | ) | | Cash and cash equivalents at beginning of year | | | | | 44,265 | | | | 15,819 | | | | 17,621 | | | Cash and cash equivalents at end of year | | | | $ | 60,343 | | | $ | 44,265 | | | $ | 15,819 | |
The accompanying notes are an integral part of these statements.
F-6
Table of Contents J & J SNACK FOODS CORP. AND SUBSIDIARIES
NOTES TO CONSOLIDATED FINANCIAL STATEMENTS
NOTE A — SUMMARY OF SIGNIFICANT ACCOUNTING POLICIES J & J Snack Foods Corp. and Subsidiaries (the Company) manufactures, markets and distributes a variety of nutritional snack foods and beverages to the food service and retail supermarket industries. A summary of the significant accounting policies consistently applied in the preparation of the accompanying consolidated financial statements follows. 1. Principles of Consolidation The consolidated financial statements include the accounts of J & J Snack Foods Corp. and its wholly-owned subsidiaries. Intercompany balances and transactions have been eliminated in the consolidated financial statements. 2. Revenue Recognition We recognize revenue from our products when the products are shipped to our customers and when equipment service is performed for our customers who are charged on a time and material basis. We also sell equipment service contracts with terms of coverage ranging between 12 and 60 months. We record deferred income on equipment service contracts which is amortized by the straight-line method over the term of the contracts. Revenue is recognized only where persuasive evidence of an arrangement exists, our price is fixed or determinable and collectability is reasonably assured. We record offsets to revenue for allowances, end-user pricing adjustments, trade spending, coupon redemption costs and returned product. Customers generally do not have the right to return product unless it is damaged or defective. All amounts billed to customers related to shipping and handling are classified as revenues. Our product costs include amounts for shipping and handling, therefore, we charge our customers shipping and handling fees at the time the products are shipped or when services are performed. The cost of shipping products to the customer is recognized at the time the products are shipped to the customer and our policy is to classify them as Distribution expenses. The cost of shipping products to the customer classified as Distribution expenses was $49,705,000, $52,609,000 and $48,945,000 for the fiscal years ended 2009, 2008 and 2007, respectively. During the years ended September 30, 2006,26, 2009, September 24, 200527, 2008 and September 25, 2004 | | | F-6 | | | | | | | Consolidated Statements29, 2007, we sold $16,745,000, $11,881,000 and $9,000,000, respectively, of Cash Flowsservice contracts related to frozen beverage machines. At September 26, 2009 and September 27, 2008, deferred income on service contracts was $1,424,000 and $1,130,000, respectively, of which $90,000 and $144,000 is included in other long-term liabilities as of September 26, 2009 and September 27, 2008, respectively and the balance is reflected as short-term and included in accrued liabilities on the consolidated balance sheet. Service contract income of $16,451,000, $11,911,000 and $9,612,000 was recognized for the fiscal years ended September 30, 2006, September 24, 20052009, 2008 and September 25, 20042007, respectively. | | | F-7 | | | | | | | | | | F-8 | | | | | | | Financial Statement Schedule:3. Foreign Currency
| | | | | | | | | | | | | S-1 | | | | | | | | | | S-2 | |
Back to Contents
REPORT OF INDEPENDENT REGISTERED PUBLIC ACCOUNTING FIRM
Shareholders and
Board of Directors
J & J Snack Foods Corp. and Subsidiaries
We have audited the accompanying consolidated balance sheets of J & J Snack Foods Corp. and Subsidiaries as of September 30, 2006 and September 24, 2005, and the related consolidated statements of earnings, changes in stockholders’ equity, and cash flows for each of the fiscal years in the three-year period ended September 30, 2006 (53 weeks, 52 weeks, and 52 weeks, respectively). We have also audited management’s assessment, included in the accompanying Form 10-K, that J & J Snack Foods Corp. and Subsidiaries maintained effective internal control over financial reporting as of September 30, 2006, based on criteria established in Internal Control-Integrated Framework issued by the Committee of Sponsoring Organizations of the Treadway Commission (COSO). J & J Snack Foods Corp. and Subsidiaries’ management is responsible for these financial statements, for maintaining effective internal control over financial reporting, and for its assessment of the effectiveness of internal control over financial reporting. Our responsibility is to express an opinion on these financial statements, an opinion on management’s assessment, and an opinion on the effectiveness of the company’s internal control over financial reporting based on our audits.
We conducted our audits in accordance with the standards of the Public Company Accounting Oversight Board (United States). Those standards require that we plan and perform the audits to obtain reasonable assurance about whether the financial statements are free of material misstatement and whether effective internal control over financial reporting was maintained in all material respects. Our audits of the financial statements included examining, on a test basis, evidence supporting the amounts and disclosures in the financial statements, assessing the accounting principles used and significant estimates made by management, and evaluating the overall financial statement presentation.
Our audit of internal control included obtaining an understanding of internal control over financial reporting, evaluating management’s assessment, testing and evaluating the design and operating effectiveness of internal control, and performing such other procedures as we considered necessary in the circumstances. We believe that our audits provide a reasonable basis for our opinions.
A company’s internal control over financial reporting is a process designed to provide reasonable assurance regarding the reliability of financial reporting and the preparation of financial statements for external purposes in accordance with generally accepted accounting principles. A company’s internal control over financial reporting includes those policies and procedures that (1) pertain to the maintenance of records that, in reasonable detail, accurately and fairly reflect the transactions and dispositions of the assets of the company; (2) provide reasonable assurance that transactions are recorded as necessary to permit preparation of financial statements in accordance with generally accepted accounting principles, and that receipts and expenditures of the company are being made only in accordance with authorizations of management and directors of the company; and (3) provide reasonable assurance regarding prevention or timely detection of unauthorized acquisition, use, or disposition of the company’s assets that could have a material effect on the financial statements.
Because of its inherent limitations, internal control over financial reporting may not prevent or detect misstatements. Also, projections of any evaluation of effectiveness to future periods are subject to the risk that controls may become inadequate because of changes in conditions, or that the degree of compliance with the policies or procedures may deteriorate.
In our opinion, the financial statements referred to above present fairly, in all material respects, the consolidated financial position of J & J Snack Foods Corp. and Subsidiaries as of September 30, 2006 and September 24, 2005, and the consolidated results of its operations and its consolidated cash flows for each of the fiscal years in the three-year period ended September 30, 2006 (53 weeks, 52 weeks and 52 weeks) in conformity with accounting principles generally accepted in the United States of America. Also in our opinion, management’s assessment that J & J Snack Foods Corp. and Subsidiaries maintained effective internal control over financial reporting as of September 30, 2006, is fairly stated, in all material respects, based on criteria established in Internal Control—Integrated Framework issued by the Committee of
Back to Contents
Sponsoring Organizations of the Treadway Commission (COSO). Furthermore, in our opinion, J & J Snack Foods Corp. and Subsidiaries maintained, in all material respects, effective internal control over financial reporting as of September 30, 2006, based on criteria established in Internal Control—Integrated Framework issued by the Committee of Sponsoring Organizations of the Treadway Commission (COSO).
As discussed in note A to the consolidated financial statements, the Company changed its method of accounting for share-based payments as of September 25, 2005.
Philadelphia, Pennsylvania
November 10, 2006
(except Note G to
which the date is
December 1, 2006)
Back to Contents
J & J SNACK FOODS CORP. AND SUBSIDIARIES
CONSOLIDATED BALANCE SHEETS
| | | September 30, | | September 24, | | | | | 2006 | | 2005 | | | | |
|
| |
|
| | | | | (in thousands, except share amounts) | | Assets | | | | | | | | | Current Assets | | | | | | | | | Cash and cash equivalents | | $ | 17,621 | | $ | 15,795 | | | Marketable securities available for sale | | | 59,000 | | | 54,225 | | | Receivables | | | | | | | | | Trade, less allowances of $963 and $1,054, respectively | | | 53,033 | | | 46,261 | | | Other | | | 630 | | | 660 | | | Inventories | | | 37,790 | | | 33,684 | | | Prepaid expenses and other | | | 1,457 | | | 1,215 | | | Deferred income taxes | | | 2,713 | | | 2,393 | | | | |
|
| |
|
| | | Total current assets | | | 172,244 | | | 154,233 | | | | | | | | | | | | Property, Plant and Equipment, at cost | | | 333,838 | | | 326,143 | | | Less accumulated depreciation and amortization | | | 248,391 | | | 237,098 | | | | |
|
| |
|
| | | | | | 85,447 | | | 89,045 | | Other Assets | | | | | | | | | Goodwill | | | 57,948 | | | 53,622 | | | Other intangible assets, net | | | 22,669 | | | 7,043 | | | Other | | | 2,500 | | | 1,981 | | | | |
|
| |
|
| | | | | | 83,117 | | | 62,646 | | | | |
|
| |
|
| | | | | $ | 340,808 | | $ | 305,924 | | | | |
|
| |
|
| | Liabilities and Stockholders’ Equity | | | | | | | | | Current Liabilities | | | | | | | | | Accounts payable | | $ | 40,835 | | $ | 37,029 | | | Accrued liabilities | | | 8,502 | | | 7,636 | | | Accrued compensation expense | | | 8,367 | | | 7,095 | | | Dividends payable | | | 1,385 | | | 1,142 | | | | |
|
| |
|
| | | Total current liabilities | | | 59,089 | | | 52,902 | | | | | | | | | | | | Deferred income taxes | | | 18,211 | | | 17,987 | | | Other long-term liabilities | | | 635 | | | 273 | | | | | | | | | | | Stockholders’ Equity | | | | | | | | | Preferred stock, $1 par value; authorized, 10,000,000 shares; none issued | | | — | | | — | | Common stock, no par value; authorized, 50,000,000 shares; issued and
outstanding 18,468,000 and 18,272,000 respectively | | | 40,315 | | | 36,091 | | | Accumulated other comprehensive loss | | | (1,964 | ) | | (1,918 | ) | | Retained earnings | | | 224,522 | | | 200,589 | | | | |
|
| |
|
| | | | | | 262,873 | | | 234,762 | | | | |
|
| |
|
| | | | | $ | 340,808 | | $ | 305,924 | | | | |
|
| |
|
| |
All share amounts reflect the 2-for-1 stock split effective January 5, 2006.
The accompanying notes are an integral part of these statements.
Back to Contents
J & J SNACK FOODS CORP. AND SUBSIDIARIES
CONSOLIDATED STATEMENTS OF EARNINGS
(in thousands, except per share information)
| | | Fiscal year ended
| | | | | September 30, | | September 24, | | September 25, | | | | | 2006 | | 2005 | | 2004 | | | | | (53 weeks) | | (52 weeks) | | (52 weeks) | | | | |
|
| |
|
| |
|
| | | Net Sales | | $ | 514,831 | | $ | 457,112 | | $ | 416,588 | | Cost of goods sold(1) | | | 342,412 | | | 302,065 | | | 276,379 | | | | |
|
| |
|
| |
|
| | | Gross profit | | | 172,419 | | | 155,047 | | | 140,209 | | | | |
|
| |
|
| |
|
| | | Operating expenses | | | | | | | | | | | Marketing(2) | | | 61,601 | | | 57,197 | | | 54,585 | | Distribution(3) | | | 45,331 | | | 39,589 | | | 33,574 | | Administrative(4) | | | 19,306 | | | 17,582 | | | 16,829 | | | Impairment charge | | | 1,193 | | | — | | | — | | | Other general expense (income) | | | (76 | ) | | 430 | | | 29 | | | | |
|
| |
|
| |
|
| | | | | | 127,355 | | | 114,798 | | | 105,017 | | | | |
|
| |
|
| |
|
| | | Operating income | | | 45,064 | | | 40,249 | | | 35,192 | | | | |
|
| |
|
| |
|
| | | Other income (expenses) | | | | | | | | | | | | Investment income | | | 3,137 | | | 1,689 | | | 566 | | | Interest expense and other | | | (129 | ) | | (136 | ) | | (113 | ) | | | |
|
| |
|
| |
|
| | | | | | 3,008 | | | 1,553 | | | 453 | | | | |
|
| |
|
| |
|
| | | Earnings before income taxes | | | 48,072 | | | 41,802 | | | 35,645 | | | Income taxes | | | 18,622 | | | 15,759 | | | 12,935 | | | | |
|
| |
|
| |
|
| | | NET EARNINGS | | $ | 29,450 | | $ | 26,043 | | $ | 22,710 | | | | |
|
| |
|
| |
|
| | | Earnings per diluted share | | $ | 1.57 | | $ | 1.40 | | $ | 1.24 | | | | |
|
| |
|
| |
|
| | | Weighted average number of diluted shares | | | 18,807 | | | 18,600 | | | 18,286 | | | | |
|
| |
|
| |
|
| | | Earnings per basic share | | $ | 1.60 | | $ | 1.43 | | $ | 1.27 | | | | |
|
| |
|
| |
|
| | | Weighted average number of basic shares | | | 18,421 | | | 18,194 | | | 17,818 | | | | |
|
| |
|
| |
|
| | | | | | | | | | | | | |
(1) Includes share-based compensation expenseexpenses are translated at the average rate of $297exchange for the year ended September 30, 2006. |
(2) Includes share-based compensation expenseperiod. The cumulative translation adjustment is recorded as a separate component of $576 for the year ended September 30, 2006. |
(3) Includes share-based compensation expense of $26 for the year ended September 30, 2006. |
(4) Includes share-based compensation expense of $405 for the year ended September 30, 2006. |
All share amounts reflect the 2-for-1 stock split effective January 5, 2006.stockholders’ equity and changes to such are included in comprehensive income.
The accompanying notes are an integral part of these statements.
Back to Contents
J & J SNACK FOODS CORP. AND SUBSIDIARIES
CONSOLIDATED STATEMENT OF CHANGES IN STOCKHOLDERS’ EQUITY
(in thousands)
| | | | | | | Accumulated
Other
Comprehensive
Loss | | | | | | | | | | | | | | | | | | | | | | | | | | | | | | | Common Stock
| | | Retained
Earnings | | | | Comprehensive
Income | | | | | Shares | | Amount | | | | Total | | | | | |
|
| |
|
| |
|
| |
|
| |
|
| |
|
| | | Balance at September 28, 2003 | | | 17,514 | | $ | 28,143 | | $ | (1,957 | ) | $ | 156,378 | | $ | 182,564 | | | | | | Issuance of common stock upon exercise of stock options | | | 472 | | | 4,553 | | | — | | | — | | | 4,553 | | | | | | Issuance of common stock for employee stock purchase plan | | | 26 | | | 373 | | | — | | | — | | | 373 | | | | | | Foreign currency translation adjustment | | | — | | | — | | | (104 | ) | | — | | | (104 | ) | $ | (104 | ) | | Net earnings | | | — | | | — | | | — | | | 22,710 | | | 22,710 | | | 22,710 | | | | | | | | | | | | | | | | | | | |
| | | Comprehensive income | | | — | | | — | | | — | | | — | | | — | | $ | 22,606 | | | | |
| |
| |
| |
| |
| |
| | | Balance at September 25, 2004 | | | 18,012 | | $ | 33,069 | | $ | (2,061 | ) | $ | 179,088 | | $ | 210,096 | | | | | | Issuance of common stock upon exercise of stock options | | | 236 | | | 2,577 | | | — | | | — | | | 2,577 | | | | | | Issuance of common stock for employee stock purchase plan | | | 24 | | | 445 | | | — | | | — | | | 445 | | | | | | Foreign currency translation adjustment | | | — | | | — | | | 143 | | | — | | | 143 | | $ | 143 | | | Dividends declared | | | — | | | — | | | — | | | (4,542 | ) | | (4,542 | ) | | | | | Net earnings | | | — | | | — | | | — | | | 26,043 | | | 26,043 | | | 26,043 | | | | | | | | | | | | | | | | | | | |
| | | Comprehensive income | | | — | | | — | | | — | | | — | | | — | | $ | 26,186 | | | | |
| |
| |
| |
| |
| |
| | | Balance at September 24, 2005 | | | 18,272 | | $ | 36,091 | | $ | (1,918 | ) | $ | 200,589 | | $ | 234,762 | | | | | | Issuance of common stock upon exercise of stock options | | | 164 | | | 2,253 | | | — | | | — | | | 2,253 | | | | | | Issuance of common stock for employee stock purchase plan | | | 23 | | | 556 | | | — | | | — | | | 556 | | | | | | Foreign currency translation adjustment | | | — | | | — | | | (46 | ) | | — | | | (46 | ) | $ | (46 | ) | | Issuance of common stock under deferred stock plan | | | 9 | | | 111 | | | — | | | — | | | 111 | | | | | | Dividends declared | | | — | | | — | | | — | | | (5,517 | ) | | (5,517 | ) | | | | | Share-based compensation | | | — | | | 1,304 | | | — | | | — | | | 1,304 | | | | | | Net earnings | | | — | | | — | | | — | | | 29,450 | | | 29,450 | | | 29,450 | | | | | | | | | | | | | | | | | | | |
| | | Comprehensive income | | | — | | | — | | | — | | | — | | | — | | $ | 29,404 | | | | |
| |
| |
| |
| |
| |
| | | Balance at September 30, 2006 | | | 18,468 | | $ | 40,315 | | $ | (1,964 | ) | $ | 224,522 | | $ | 262,873 | | | | | | | |
| |
| |
| |
| |
| | | | |
All share amounts reflect the 2-for-1 stock split effective January 5, 2006.
The accompanying notes are an integral part of this statement.
Back to Contents
J & J SNACK FOODS CORP. AND SUBSIDIARIES
CONSOLIDATED STATEMENTS OF CASH FLOWS
(in thousands)
| | | Fiscal year ended
| | | | | September 30, | | September 24, | | September 25, | | | | | 2006 | | 2005 | | 2004 | | | | | (53 weeks) | | (52 weeks) | | (52 weeks) | | | | |
|
| |
|
| |
|
| | Operating activities: | | | | | | | | | | | | Net earnings | | $ | 29,450 | | $ | 26,043 | | $ | 22,710 | | | Adjustments to reconcile net earnings to net cash provided by operating activities: | | | | | | | | | | | | Depreciation and amortization of fixed assets | | | 22,848 | | | 23,215 | | | 23,170 | | | Amortization of intangibles and deferred costs | | | 1,760 | | | 1,047 | | | 898 | | | (Gains) losses from disposals of property & equipment | | | (131 | ) | | 150 | | | (33 | ) | | Impairment of fixed assets | | | 1,193 | | | — | | | — | | | Share-based compensation | | | 1,304 | | | — | | | — | | | Deferred income taxes | | | (96 | ) | | (174 | ) | | 2,394 | | | Changes in assets and liabilities, net of effects from purchase of companies: | | | | | | | | | | | | (Increase) decrease in accounts receivable | | | (4,223 | ) | | 1,048 | | | (6,887 | ) | | Increase in inventories | | | (2,160 | ) | | (3,465 | ) | | (2,423 | ) | | (Increase) decrease in prepaid expenses and other | | | (167 | ) | | 139 | | | 83 | | | Increase in accounts payable and accrued liabilities | | | 5,187 | | | 4,641 | | | 7,232 | | | | |
|
| |
|
| |
|
| | | Net cash provided by operating activities | | | 54,965 | | | 52,644 | | | 47,144 | | | | |
|
| |
|
| |
|
| | Investing activities: | | | | | | | | | | | | Purchases of property, plant and equipment | | | (19,739 | ) | | (21,632 | ) | | (21,644 | ) | | Payments for purchases of companies, net of cash acquired | | | (26,264 | ) | | (16,088 | ) | | (12,668 | ) | | Proceeds from investments held to maturity | | | — | | | — | | | 275 | | | Purchase of marketable securities | | | (40,825 | ) | | (31,725 | ) | | (45,500 | ) | | Proceeds from sales of marketable securities | | | 36,050 | | | 14,000 | | | 9,000 | | | Proceeds from disposal of property and equipment | | | 1,046 | | | 819 | | | 1,628 | | | Other | | | (897 | ) | | (807 | ) | | (35 | ) | | | |
|
| |
|
| |
|
| | | Net cash used in investing activities | | | (50,629 | ) | | (55,433 | ) | | (68,944 | ) | | | |
|
| |
|
| |
|
| | Financing activities: | | | | | | | | | | | | Proceeds from issuance of common stock | | | 2,809 | | | 2,241 | | | 3,810 | | | Payments of cash dividend | | | (5,273 | ) | | (3,400 | ) | | — | | | | |
|
| |
|
| |
|
| | | Net cash (used in) provided by financing activities | | | (2,464 | ) | | (1,159 | ) | | 3,810 | | | | |
|
| |
|
| |
|
| | | Effect of exchange rate on cash and cash equivalents | | | (46 | ) | | 143 | | | (104 | ) | | | |
|
| |
|
| |
|
| | | Net increase (decrease) in cash and cash equivalents | | | 1,826 | | | (3,805 | ) | | (18,094 | ) | | | |
|
| |
|
| |
|
| | | Cash and cash equivalents at beginning of year | | | 15,795 | | | 19,600 | | | 37,694 | | | | |
|
| |
|
| |
|
| | | Cash and cash equivalents at end of year | | $ | 17,621 | | $ | 15,795 | | $ | 19,600 | | | | |
|
| |
|
| |
|
| |
The accompanying notes are an integral part of these statements.
Back to Contents
J & J SNACK FOODS CORP. AND SUBSIDIARIES
NOTES TO CONSOLIDATED FINANCIAL STATEMENTS
NOTE A — SUMMARY OF SIGNIFICANT ACCOUNTING POLICIES
J & J Snack Foods Corp. and Subsidiaries (the Company) manufactures, markets and distributes a variety of nutritional snack foods and beverages to the food service and retail supermarket industries. A summary of the significant accounting policies consistently applied in the preparation of the accompanying consolidated financial statements follows.
1. | Principles of Consolidation
|
The consolidated financial statements include the accounts of J & J Snack Foods Corp. and its wholly-owned subsidiaries. Intercompany balances and transactions have been eliminated in the consolidated financial statements.
We recognize revenue from Food Service, Retail Supermarkets, The Restaurant Group and Frozen Beverage products at the time the products are shipped to third parties. When we perform services under service contracts for frozen beverage dispenser machines, revenue is recognized upon the completion of the services on specified machines. We provide an allowance for doubtful receivables after taking into consideration historical experience and other factors.
We follow EITF Issue 00-10, “Accounting for Shipping and Handling Fees and Costs” (Issue 00-10). Issue 00-10 requires that all amounts billed to customers related to shipping and handling should be classified as revenues. Our product costs include amounts for shipping and handling, therefore, we charge our customers shipping and handling fees at the time the products are shipped or when services are performed. The cost of shipping products to the customer is recognized at the time the products are shipped to the customer and our policy is to classify them as Distribution expenses. The cost of shipping products to the customer classified as Distribution expenses was $45,331,000, $39,589,000 and $33,574,000 for the fiscal years ended 2006, 2005 and 2004, respectively.
Staff Accounting Bulletin No. 101, Revenue Recognition in Financial Statements (SAB 101) and Staff Accounting Bulletin No. 104, Revenue Recognition, corrected copy (SAB 104) address certain criteria for revenue recognition. SAB 101 and SAB 104 outline the criteria that must be met to recognize revenue and provides guidance for disclosures related to revenue recognition policies. Our revenue recognition policies comply with the guidance contained in SABs 101 and 104.
We also sell service contracts covering frozen beverage machines sold. The terms of coverage range between 12 and 60 months. We record deferred income on service contracts which is amortized by the straight-line method over the term of the contracts.
During the years ended September 30, 2006, September 24, 2005 and September 25, 2004, we sold $6,000,000, $5,506,000 and $3,225,000, respectively, of service contracts related to frozen beverage machines. At September 30, 2006 and September 24, 2005, deferred income on service contracts was $1,748,000 and $1,631,000, respectively, of which $183,000 and $273,000 is included in other long-term liabilities as of September 30, 2006 and September 24, 2005, respectively and the balance is reflected as short-term and included in accrued liabilities on the consolidated balance sheet. Service contract income of $5,883,000, $5,728,000 and $3,156,000 was recognized for the fiscal years ended 2006, 2005 and 2004, respectively.
Assets and liabilities in foreign currencies are translated into U.S. dollars at the rate of exchange prevailing at the balance sheet date. Revenues and expenses are translated at the average rate of exchange for the period. The cumulative translation adjustment is recorded as a separate component of stockholders’ equity and changes to such are included in comprehensive income.
Back to Contents
J & J SNACK FOODS CORP. AND SUBSIDIARIES
NOTES TO CONSOLIDATED FINANCIAL STATEMENTS — (Continued)
NOTE A — SUMMARY OF SIGNIFICANT ACCOUNTING POLICIES — (Continued)
In preparing financial statements in conformity with accounting principles generally accepted in the United States of America, management is required to make estimates and assumptions that affect the reported amounts of assets and liabilities, the disclosure of contingent assets and liabilities at the date of the financial statements, and the reported amounts of revenues and expenses during the reporting period. Actual results could differ from those estimates. F-7
Table of Contents J & J SNACK FOODS CORP. AND SUBSIDIARIES
NOTES TO CONSOLIDATED FINANCIAL STATEMENTS (Continued)
NOTE A — SUMMARY OF SIGNIFICANT ACCOUNTING POLICIES (Continued)
In preparing financial statements in conformity with accounting principles generally accepted in the United States of America, management is required to make estimates and assumptions that affect the reported amounts of assets and liabilities, the disclosure of contingent assets and liabilities at the date of the financial statements, and the reported amounts of revenues and expenses during the reporting period. Actual results could differ from those estimates.
Cash equivalents are short-term, highly liquid investments with original maturities of three months or less. Cash equivalents are short-term, highly liquid investments with original maturities of three months or less.
| 6. | Concentrations of Credit Risk and Accounts Receivable |
We maintain cash balances at financial institutions located in various states. Some of our accounts are insured by the Federal Deposit Insurance Corporation up to $250,000. We customarily maintain cash balances in excess of these insurance limits. Some of our cash is in bank accounts which are insured by the Federal Deposit Insurance Corporation with no limit. Other financial instruments that could potentially subject us to concentrations of credit risk are trade accounts receivable; however, such risks are limited due to the large number of customers comprising our customer base and their dispersion across geographic regions. We usually have approximately 10 customers with accounts receivable balances of between $1 million to $7 million. We have several large customers that account for a significant portion of our sales. Our top ten customers accounted for 43%, 42% and 42% of our sales during fiscal years 2009, 2008 and 2007, respectively, with our largest customer accounting for 9% of our sales in 2009, 9% in 2008 and 8% in 2007. Three of the ten customers are food distributors who sell our product to many end users. The majority of our accounts receivable are due from trade customers. Credit is extended based on evaluation of our customers’ financial condition and collateral is not required. Accounts receivable payment terms vary and are stated in the financial statements at amounts due from customers net of an allowance for doubtful accounts. Accounts outstanding longer than the payment terms are considered past due. We determine our allowance by considering a number of factors, including the length of time trade accounts receivable are past due, our previous loss history, customers’ current ability to pay their obligations to us, and the condition of the general economy and the industry as a whole. We write off accounts receivable when they become uncollectible, and payments subsequently received on such receivables are credited to the allowance for doubtful accounts. We maintain cash balances at financial institutions located in various states. Accounts at each institution are insured by the Federal Deposit Insurance Corporation up to $100,000. We periodically maintain cash balances in excess of these insurance limits.
Other financial instruments that could potentially subject us to concentrations of credit risk are trade accounts receivable; however, such risks are limited due to the large number of customers comprising our customer base and their dispersion across geographic regions. We usually have 2 to 3 customers with accounts receivable balances of between $1,500,000 to $4,000,000.
The majority of our accounts receivable are due from trade customers. Credit is extended based on evaluation of our customers’ financial condition and collateral is not required. Accounts receivable payment terms vary and are stated in the financial statements at amounts due from customers net of an allowance for doubtful accounts. Accounts outstanding longer than the payment terms are considered past due. We determine our allowance by considering a number of factors, including the length of time trade accounts receivable are past due, our previous loss history, customers’ current ability to pay their obligations to us, and the condition of the general economy and the industry as a whole. We write off accounts receivable when they become uncollectible, and payments subsequently received on such receivables are credited to the allowance for doubtful accounts.
Inventories are valued at the lower of cost (determined by the first-in, first-out method) or market. In December 2004, the FASB issued Statement 151, “Inventory Costs, an amendment of ARB No. 43, Chapter 4”.
Statement 151 retains the general principle of ARB 43, Chapter 4, “Inventory Pricing (AC Section I78)”, that inventories are presumed to be stated at cost; however, it amends ARB 43 to clarify that
abnormal amounts of idle facilities, freight, handling costs, and spoilage should be recognized as charges of the current period
| | | | • | allocation of cost (determined by the first-in, first-out or weighted-average method) or market. We recognize abnormal amounts of idle facilities, freight, handling costs, and spoilage as charges of the current period. Additionally, we allocate fixed production overheads to inventories should be based on the normal capacity of our production facilities. We calculate normal capacity as the production facilities. |
expected to be achieved over a number of periods or seasons under normal circumstances, taking into account the loss of capacity resulting from planned maintenance. This requires us to use judgment to determine when production is outside the range of expected variation in production (either abnormally low or abnormally high). In periods of abnormally low production (for example, periods in which there is significantly lower demand, labor and material shortages exist, or there is unplanned equipment downtime) the amount of fixed overhead allocated to each unit of production is not increased. However, in periods of abnormally high production the amount of fixed overhead allocated to each unit of production is decreased to assure inventories are not measured above cost.We review for slow moving and obsolete inventory and a reserve is established for the value of inventory that we estimate will not be used. At September 26, 2009 and September 27, 2008, our reserve for inventory was $4,209,000 and $3,817,000, respectively. Statement 151 defines normal capacity as the production expected to be achieved over a number of periods or seasons under normal circumstances, taking into account the loss of capacity resulting from planned maintenance. The Board concluded that normal capacity refers to a range of production levels that will vary based on business- and industry-specific factors. Accordingly, an entity will have to use judgment to determine when production is outside the range of expected variation in production (either abnormally low or abnormally high). In periods of abnormally low production (for example, periods in which there is
Back to Contents
J & J SNACK FOODS CORP. AND SUBSIDIARIES
NOTES TO CONSOLIDATED FINANCIAL STATEMENTS — (Continued)
NOTE A — SUMMARY OF SIGNIFICANT ACCOUNTING POLICIES — (Continued)
significantly lower demand, labor and material shortages exist, or there is unplanned equipment downtime) the amount of fixed overhead allocated to each unit of production should not be increased. However, in periods of abnormally high production the amount of fixed overhead allocated to each unit of production is decreased to assure inventories are not measured above cost.
The guidance in Statement 151 is effective for inventory costs during fiscal years beginning after June 15, 2005 and should be applied prospectively. Since we essentially follow the guidelines of Statement 151, the adoption did not have a material impact on our financial statements.
We classify our investment securities in one of three categories: held to maturity, trading, or available for sale; however, we have classified our auction market preferred stock separately on our balance sheet and in our statement of cash flows because of the failure of the auction market beginning in February 2008. The balance of our investment F-8
Table of Contents J & J SNACK FOODS CORP. AND SUBSIDIARIES
NOTES TO CONSOLIDATED FINANCIAL STATEMENTS (Continued)
NOTE A — SUMMARY OF SIGNIFICANT ACCOUNTING POLICIES (Continued)
portfolio consists solely of investments classified as held to maturity. See Note C for further information on our holdings of investment securities.
We account for our investment securities in accordance with SFAS No. 115, “Accounting for Certain Investments in Debt and Equity Securities.” This standard requires investments in securities to be classified in one of three categories: held-to-maturity, trading, or available-for-sale. Our investment portfolio consists solely of investments classified as available for sale and are accounted for as such in accordance with SFAS No. 115.
| 9. | Depreciation and Amortization |
Depreciation of equipment and buildings is provided for by the straight-line method over the assets’ estimated useful lives. We review our equipment and buildings to ensure that they provide economic benefit and are not impaired. Amortization of improvements is provided for by the straight-line method over the term of the lease or the assets’ estimated useful lives, whichever is shorter. Licenses and rights arising from acquisitions are amortized by the straight-line method over periods ranging from 3 to 20 years. We use market value tests and discounted cash flow models to test goodwill and other intangible assets for impairment. These assets are reviewed for impairment annually or more frequently as a triggering event, such as the loss of a major customer, might occur. Depreciation of equipment and buildings is provided for by the straight-line method over the assets’ estimated useful lives. Amortization of improvements is provided for by the straight-line method over the term of the lease or the assets’ estimated useful lives, whichever is shorter. Licenses and rights arising from acquisitions are amortized by the straight-line method over periods ranging from 4 to 20 years.
We follow SFAS No. 144, “Accounting for the Impairment or Disposal of Long-Lived Assets,” (SFAS No. 144). SFAS No. 144 supersedes SFAS No. 121, “Accounting for the Impairment of Long-Lived Assets and for Long-Lived Assets to be Disposed of,” but it retains many of the fundamental provisions of that Statement. We recorded an impairment charge of $1,193,000 in 2006 in the food service segment for the writedown of robotic packaging equipment based on a determination made during the year that we would not be able to make the equipment work as intended.
| 10. | Fair Value of Financial Instruments |
The carrying value of our short-term financial instruments, such as accounts receivables and accounts payable, approximate their fair values, based on the short-term maturities of these instruments. The carrying value of our short-term financial instruments, such as accounts receivables and accounts payable, approximate their fair values, based on the short-term maturities of these instruments.
| 11. | Income Taxes We account for our income taxes under the liability method. Under the liability method, deferred tax assets and liabilities are determined based on the difference between the financial statement and tax bases of assets and liabilities as measured by the enacted tax rates that will be in effect when these differences reverse. Deferred tax expense is the result of changes in deferred tax assets and liabilities. Additionally, we recognize a liability for income taxes and associated penalties and interest for tax positions taken or expected to be taken in a tax return which are more likely than not to be overturned by taxing authorities (“uncertain tax positions”). We have not recognized a tax benefit in our financial statements for these uncertain tax positions. On September 30, 2007, the first day of the 2008 fiscal year, we recognized a $925,000 decrease to opening retained earnings from the cumulative effect of recognizing a liability for uncertain tax positions. As of September 26, 2009, the total amount of gross unrecognized tax benefits is $1,895,000, all of which would impact our effective tax rate over time, if recognized. We recognize interest and penalties related to income tax matters as a part of the provision for income taxes. The Company had $742,000 and $588,000 of accrued interest and penalties as of September 26, 2009 and September 27, 2008, respectively. We recognized $3,000 and $6,000 of penalties and interest in the years ended September 26, 2009 and September 27, 2008, respectively. A reconciliation of the beginning and ending amount of unrecognized tax benefits is as follows: | | | | (in thousands) |
|---|
| Balance at September 27, 2008 | | | | $ | 1,735 | |
We account for our income taxes under the liability method. Under the liability method, deferred tax assets and liabilities are determined based on the difference between the financial statement and tax bases
Additions based on tax positions
related to the current year | | | | | 246 | | | Reductions for tax positions of prior years | | | | | (86 | ) | | Settlements | | | | | — | | | Balance at September 26, 2009 | | | | $ | 1,895 | | |
In addition to our federal tax return and tax returns for Mexico and Canada, we file tax returns in all states that have a corporate income tax. Virtually all the returns noted above are open for examination for three to four years. F-9
Table of assets and liabilities as measured by the enacted tax rates that will be in effect when these differences reverse. Deferred tax expense is the result of changes in deferred tax assets and liabilities. In June 2006, the FASB issued Interpretation No. 48 (FIN 48), Accounting for Uncertainty in Income Taxes, an Interpretation of FASB Statement No. 109 (SFAS 109).
FIN 48 clarifies the accounting for uncertainty in income taxes recognized in an entity’s financial statements in accordance with SFAS 109. FIN 48 prescribes a recognition threshold and measurement attribute for the financial statement recognition and measurement of a tax position taken or expected to be taken in a tax return. FIN 48 also provides guidance on derecognition, classification, interest and penalties, accounting in interim periods, disclosure and transition.
FIN 48 also provides guidance on financial reporting and classification of differences between tax positions taken in a tax return and amounts recognized in the financial statements.
FIN 48 is effective for fiscal years beginning after December 15, 2006; earlier application is encouraged. We are currently evaluating the provisions of FIN 48 to determine its impact on our financial statements.
Back to Contents
J & J SNACK FOODS CORP. AND SUBSIDIARIES
NOTES TO CONSOLIDATED FINANCIAL STATEMENTS — (Continued)
NOTE A — SUMMARY OF SIGNIFICANT ACCOUNTING POLICIES — (Continued)
J & J SNACK FOODS CORP. AND SUBSIDIARIES
NOTES TO CONSOLIDATED FINANCIAL STATEMENTS (Continued)
NOTE A — SUMMARY OF SIGNIFICANT ACCOUNTING POLICIES (Continued)
12. | Earnings Per Common Share |
Basic earnings per common share (EPS) excludes dilution and is computed by dividing income available to common shareholders by the weighted average common shares outstanding during the period. Diluted EPS takes into consideration the potential dilution that could occur if securities (stock options) or other contracts to issue common stock were exercised and converted into common stock. We follow SFAS No. 128, “Earnings Per Share” (EPS). Basic EPS excludes dilution and is computed by dividing income available to common shareholders by the weighted average common shares outstanding during the period. Diluted EPS takes into consideration the potential dilution that could occur if securities (stock options) or other contracts to issue common stock were exercised and converted into common stock.
Our calculation of EPS is as follows: | | | | Fiscal Year Ended September 26, 2009
| |
|---|
| | | | Income
(Numerator)
| | Shares
(Denominator)
| | Per Share
Amount
|
|---|
| | | | (in thousands, except per share amounts) | |
|---|
Earnings Per Basic Share
| | Net Income available to common stockholders | | | | $ | 41,312 | | | | 18,516 | | | $ | 2.23 | | Effect of Dilutive Securities
| | Options | | | | | — | | | | 197 | | | | (.02 | ) | Earnings Per Diluted Share
| Net Income available to common stockholders
plus assumed conversions | | | | $ | 41,312 | | | | 18,713 | | | $ | 2.21 | |
114,236 anti-dilutive shares have been excluded in the computation of 2009 diluted EPS because the options’ exercise price is greater than the average market price of the common stock. | | | | Fiscal Year Ended September 27, 2008
| |
|---|
| | | | Income
(Numerator)
| | Shares
(Denominator)
| | Per Share
Amount
|
|---|
| | | | (in thousands, except per share amounts) | |
|---|
Earnings Per Basic Share
| | Net Income available to common stockholders | | | | $ | 27,908 | | | | 18,770 | | | $ | 1.49 | | Effect of Dilutive Securities
| | Options | | | | | — | | | | 238 | | | | (.02 | ) | Earnings Per Diluted Share
| Net Income available to common stockholders
plus assumed conversions | | | | $ | 27,908 | | | | 19,008 | | | $ | 1.47 | |
273,471 anti-dilutive shares have been excluded in the computation of 2008 diluted EPS because the options’ exercise price is greater than the average market price of the common stock. | | | | Fiscal Year Ended September 29, 2007
| |
|---|
| | | | Income
(Numerator)
| | Shares
(Denominator)
| | Per Share
Amount
|
|---|
| | | | (in thousands, except per share amounts) | |
|---|
Earnings Per Basic Share
| | Net Income available to common stockholders | | | | $ | 32,112 | | | | 18,635 | | | $ | 1.72 | | Effect of Dilutive Securities
| | Options | | | | | — | | | | 370 | | | | (.03 | ) | | | Earnings Per Diluted Share
| | | | | | | | | | | | | | | Net Income available to common stockholders
plus assumed conversions | | | | $ | 32,112 | | | | 19,005 | | | $ | 1.69 | |
F-10
Table of EPS is as follows (all share amounts reflect the 2-for-1 stock split effective January 5, 2006): | | | Fiscal Year Ended September 30, 2006 | | | | |
| | | | | Income | | Shares | | Per Share | | | | | (Numerator) | | (Denominator) | | Amount | | | | |
|
| |
|
| |
|
| | | | | (in thousands, except per share amounts) | | Earnings Per Basic Share | | | | | | | | | | | | Net Income available to common stockholders | | $ | 29,450 | | | 18,421 | | $ | 1.60 | | Effect of Dilutive Securities | | | | | | | | | | | | Options | | | — | | | 386 | | | ( .03 | ) | | | |
|
| |
|
| |
|
| | Earnings Per Diluted Share | | | | | | | | | | | | Net Income available to common stockholders plus assumed conversions | | $ | 29,450 | | | 18,807 | | $ | 1.57 | | | | |
|
| |
|
| |
|
| |
500 anti-dilutive shares have been excluded in the computation of 2006 diluted EPS because the options’ exercise price is greater than the average market price of the common stock.
| | | Fiscal Year Ended September 24, 2005 | | | | |
| | | | | Income | | Shares | | Per Share | | | | | (Numerator) | | (Denominator) | | Amount | | | | |
|
| |
|
| |
|
| | | | | (in thousands, except per share amounts) | | Earnings Per Basic Share | | | | | | | | | | | | Net Income available to common stockholders | | $ | 26,043 | | | 18,194 | | $ | 1.43 | | Effect of Dilutive Securities | | | | | | | | | | | | Options | | | — | | | 406 | | | ( .03 | ) | | | |
|
| |
|
| |
|
| | Earnings Per Diluted Share | | | | | | | | | | | | Net Income available to common stockholders plus assumed conversions | | $ | 26,043 | | | 18,600 | | $ | 1.40 | | | | |
|
| |
|
| |
|
| | | | | | | | | | | | | |
| | | Fiscal Year Ended September 25, 2004 | | | | |
| | | | | Income | | Shares | | Per Share | | | | | (Numerator) | | (Denominator) | | Amount | | | | |
|
| |
|
| |
|
| | | | | (in thousands, except per share amounts) | | Earnings Per Basic Share | | | | | | | | | | | | Net Income available to common stockholders | | $ | 22,710 | | | 17,818 | | $ | 1.27 | | Effect of Dilutive Securities | | | | | | | | | | | | Options | | | — | | | 468 | | | ( .03 | ) | | | |
|
| |
|
| |
|
| | Earnings Per Diluted Share | | | | | | | | | | | | Net Income available to common stockholders plus assumed conversions | | $ | 22,710 | | | 18,286 | | $ | 1.24 | | | | |
|
| |
|
| |
|
| |
3,400 anti-dilutive shares have been excluded in the computation of 2004 diluted EPS because the options’ exercise price is greater than the average market price of the common stock.
Back to Contents
J & J SNACK FOODS CORP. AND SUBSIDIARIES
NOTES TO CONSOLIDATED FINANCIAL STATEMENTS — (Continued)
NOTE A — SUMMARY OF SIGNIFICANT ACCOUNTING POLICIES — (Continued)
J & J SNACK FOODS CORP. AND SUBSIDIARIES
NOTES TO CONSOLIDATED FINANCIAL STATEMENTS (Continued)
NOTE A — SUMMARY OF SIGNIFICANT ACCOUNTING POLICIES (Continued)
128,200 anti-dilutive shares have been excluded in the computation of 2007 diluted EPS because the options’ exercise price is greater than the average market price of the common stock. 13. | Accounting for Stock-Based Compensation |
At September 26, 2009, the Company has three stock-based employee compensation plans. Share-based compensation was recognized as follows: | | | | September 26,
2009
| | September 27,
2008
| | September 29,
2007
|
|---|
| | | | (in thousands, except per share amounts) | |
|---|
| Stock options | | | | $ | 508 | | | $ | 1,019 | | | $ | 833 | | | Stock purchase plan | | | | | 237 | | | | 137 | | | | 146 | | | Deferred stock issued to outside directors | | | | | 138 | | | | 138 | | | | 138 | | | Restricted stock issued to an employee | | | | | 87 | | | | 100 | | | | 31 | | | | | | | $ | 970 | | | $ | 1,394 | | | $ | 1,148 | | | Per diluted share | | | | $ | .05 | | | $ | .07 | | | $ | .06 | | | The above compensation is net of tax benefits | | | | $ | 746 | | | $ | 457 | | | $ | 592 | |
At September 26, 2009, the Company has unrecognized compensation expense of approximately $650,000 to be recognized over the next three fiscal years. The fair value of each option grant is estimated on the date of grant using the Black-Scholes options-pricing model with the following weighted average assumptions used for grants in fiscal 2009, 2008 and 2007: expected volatility of 23.3% for fiscal year 2009, 25.2% for year 2008 and 27.4% for year 2007; weighted average risk-free interest rates of 2.70%, 3.60% and 4.57%; dividend rate of 1.2%, 1.1% and .9% and expected lives ranging between 5 and 10 years for all years. Expected forfeiture rates of 15% were used for all years. Expected volatility is based on the historical volatility of the price of our common shares over the past 50 to 51 months for 5 year options and 10 years for 10 year options. We use historical information to estimate expected life and forfeitures within the valuation model. The expected term of awards represents the period of time that options granted are expected to be outstanding. The risk-free rate for periods within the expected life of the option is based on the U.S. Treasury yield curve in effect at the time of grant. Compensation cost is recognized using a straight-line method over the vesting or service period and is net of estimated forfeitures. Effective with this fiscal year, the Company follows FASB Statement No. 123(R), “Share-Based Payment”. Statement 123(R) requires that the compensation cost relating to share-based payment transactions be recognized in financial statements. That cost is measured based on the fair value of the equity or liability instruments issued.
Statement 123(R) covers a wide range of share-based compensation arrangements including share options, restricted share plans, performance-based awards, share appreciation rights, and employee share purchase plans.
In addition to the accounting standard that sets forth the financial reporting objectives and related accounting principles, Statement 123(R) includes an appendix of implementation guidance that provides expanded guidance on measuring the fair value of share-based payment awards.
Statement 123(R) replaces FASB Statement No. 123, Accounting for Stock-Based Compensation, and supersedes APB Opinion No. 25, Accounting for Stock Issued to Employees. Statement 123, as originally issued in 1995, established as preferable a fair-value-based method of accounting for share-based payment transactions with employees. However, that Statement permitted entities the option of continuing to apply the guidance in Opinion 25, as long as the footnotes to financial statements disclosed what net income would have been had the preferable fair-value-based method been used.
Since the Company adopted Statement 123(R) using the modified-prospective transition method, prior periods have not been restated. Under this method, we are required to record compensation expense for all awards granted after the date of adoption and for the unvested portion of previously granted awards that remain outstanding as of the beginning of the period of adoption. We measured share-based compensation cost using the Black-Scholes option pricing model.
At September 30, 2006, the Company has two stock-based employee compensation plans. Share-based compensation of $988,000, net of a tax benefit of $316,000, or $.05 per diluted share, was recognized for the year ended September 30, 2006. At September 30, 2006, the Company has unrecognized compensation expense of approximately $1.8 million to be recognized over the next three fiscal years. Reported net income, adjusting for share-based compensation that would have been recognized in 2005 and 2004 if Statement 123(R) had been followed is (all share amounts reflect the 2-for-1 stock split effective January 5, 2006):
| | | Fiscal year ended | | | | |
| | | | | September 30, | | September 24, | | September 25, | | | | | 2006 | | 2005 | | 2004 | | | | | (53 weeks) | | (52 weeks) | | (52 weeks) | | | | |
|
| |
|
| |
|
| | | Net income, as reported | | $ | 29,450 | | $ | 26,043 | | $ | 22,710 | | | Less: share-based compensation costs determined under fair-value based method for all awards, net of tax | | | — | | | 1,127 | | | 1,135 | | | | |
|
| |
|
| |
|
| | | Adjusted net earnings | | $ | 29,450 | | $ | 24,916 | | $ | 21,575 | | | | |
|
| |
|
| |
|
| | | Earnings per share of common stock — basic: | | | | | | | | | | | | As reported | | $ | 1.60 | | $ | 1.43 | | $ | 1.27 | | | Share-based compensation | | | — | | | ( .06 | ) | | ( .06 | ) | | | |
|
| |
|
| |
|
| | | Adjusted net earnings | | $ | 1.60 | | $ | 1.37 | | $ | 1.21 | | | Earnings per share of common stock — diluted: | | | | | | | | | | | | As reported | | $ | 1.57 | | $ | 1.40 | | $ | 1.24 | | | Share-based compensation | | | — | | | ( .06 | ) | | ( .06 | ) | | | |
|
| |
|
| |
|
| | | Adjusted net earnings | | $ | 1.57 | | $ | 1.34 | | $ | 1.18 | |
Back to Contents
J & J SNACK FOODS CORP. AND SUBSIDIARIES
NOTES TO CONSOLIDATED FINANCIAL STATEMENTS — (Continued)
NOTE A — SUMMARY OF SIGNIFICANT ACCOUNTING POLICIES — (Continued)
The fair value of these options is estimated on the date of grant using the Black-Scholes option pricing model with the following weighted-average assumptions for grants in fiscal 2006, 2005 and 2004; expected volatility of 34.2% for fiscal year 2006, 27.9% for year 2005 and 30.7% for year 2004; weighted average risk-free interest rates of 4.41%, 3.82% and 3.27%; dividend rate of 1% for years 2006 and 2005 and expected lives ranging between 5 and 10 years for all years. An expected forfeiture rate of 18% was used for year 2006.
Expected volatility is based on the historical volatility of the price of our common shares over the past 53 months for 5 year options and 10 years for 10 year options. We use historical information to estimate expected life and forfeitures within the valuation model. The expected term of awards represents the period of time that options granted are expected to be outstanding. The risk-free rate for periods within the expected life of the option is based on the U.S. Treasury yield curve in effect at the time of grant. Compensation cost is recognized using a straight-line method over the vesting or service period and is net of estimated forfeitures.
Advertising costs are expensed as incurred. Total advertising expense was $2,267,000, $1,666,000, and $4,084,000 for the fiscal years 2009, 2008 and 2007, respectively. Advertising costs are expensed as incurred. Total advertising expense was $1,589,000, $1,617,000, and $1,772,000 for the fiscal years 2006, 2005 and 2004, respectively.
| 15. | Commodity Price Risk Management |
Our most significant raw material requirements include flour, shortening, corn syrup, sugar, juice, cheese, chocolate, and a variety of nuts. We attempt to minimize the effect of future price fluctuations related to the purchase of raw materials primarily through forward purchasing to cover future manufacturing requirements, generally for periods from 1 to 12 months. As of September 26, 2009, we have approximately $46 million of such commitments. Futures contracts are not used in combination with forward purchasing of these raw materials. Our procurement practices are intended to reduce the risk of future price increases, but also may potentially limit the ability to benefit from possible price decreases. Our policy is to recognize estimated losses on purchase commitments when they occur. At each of the last three fiscal year ends, we did not have any material losses on our purchase commitments. F-11
Table of Contents J & J SNACK FOODS CORP. AND SUBSIDIARIES
NOTES TO CONSOLIDATED FINANCIAL STATEMENTS (Continued)
NOTE A — SUMMARY OF SIGNIFICANT ACCOUNTING POLICIES (Continued)
Our most significant raw material requirements include flour, shortening, corn syrup, chocolate, and macadamia nuts. We attempt to minimize the effect of future price fluctuations related to the purchase of raw materials primarily through forward purchasing to cover future manufacturing requirements, generally for periods from 1 to 12 months. As of September 30, 2006, we have approximately $25,000,000 of such commitments. Futures contracts are not used in combination with forward purchasing of these raw materials. Our procurement practices are intended to reduce the risk of future price increases, but also may potentially limit the ability to benefit from possible price decreases.
| 16. | Research and Development Costs |
Research and development costs are expensed as incurred. Total research and development expense was $761,000, $571,000 and $529,000 for the fiscal years 2009, 2008 and 2007, respectively. Research and development costs are expensed as incurred. Total research and development expense was $558,000, $574,000 and $365,000 for the fiscal years 2006, 2005 and 2004, respectively.
| 17. | Recent Accounting Pronouncements |
In December 2007, the FASB issued guidance expanding the definition of a business combination and requiring the fair value of the purchase price of an acquisition, including the issuance of equity securities, to be determined on the acquisition date. The guidance also requires that all assets, liabilities, contingent considerations, and contingencies of an acquired business be recorded at fair value at the acquisition date. In addition, the guidance requires that acquisition costs generally be expensed in the period incurred and changes in accounting for deferred tax asset valuation allowances and acquired income tax uncertainties after the measurement period to impact income tax expense. We will adhere to this guidance effective for our first quarter of Fiscal 2010. In August 2008, the FASB issued guidance that revises the factors that a company should consider to develop renewal or extension assumptions used in estimating the useful life of a recognized intangible asset. The new guidance will apply to all intangible assets acquired after the guidance’s effective date. The guidance also requires new disclosures for all intangible assets recognized as of, and subsequent to, the effective date. The underlying purpose of the guidance is to improve the consistency between the period of expected cash flows used to measure the fair value of a recognized intangible asset and the useful life of an intangible asset. This guidance is effective for our 2010 fiscal year. We are evaluating the effect the implementation of this guidance will have on our consolidated financial statements. In April 2009, the FASB issued guidance that amends the provisions in its guidance issued in December 2007 for the initial recognition and measurement, subsequent measurement and accounting, and disclosures for assets and liabilities arising from contingencies in business combinations. This revised guidance eliminates the distinction between contractual and non-contractual contingencies, including the initial recognition and measurement criteria, included in the December 2007 guidance and carries forward most of the provisions related to acquired contingencies in its June 2001 guidance. This guidance is effective for contingent assets and contingent liabilities acquired in business combinations for which the acquisition date is on or after the beginning of our fiscal year 2010. The effect of this guidance on our consolidated financial statements will depend upon the nature, terms and size of any acquired contingencies consummated in fiscal year 2010 or later. In June 2009, the FASB issued the FASB Accounting Standards Codification (“the Codification”), which establishes the Codification as the source of authoritative accounting guidance to be applied in the preparation of financial statements in conformity with generally accepted accounting principles (“GAAP”). The Codification, which changes the referencing of financial standards, became effective for interim and annual periods ending on or after September 15, 2009. The codification is now the single official source of authoritative U.S. GAAP (other than guidance issued by the Securities and Exchange Commission), superseding existing FASB, American Institute of Certified Public Accountants, Emerging Issues Task Force and related literature. Only one level of authoritative U.S. GAAP now exists. All other literature is considered non-authoritative. The Codification does not change U.S. GAAP. We adopted the Codification during our fiscal year ended September 26, 2009. In September 2006, the SEC staff issued Staff Accounting Bulletin No. 108, “Considering the Effects of Prior Year Misstatements when Quantifying Misstatements in Current Year Financial Statements.” SAB 108 was issued to provide consistency between how registrants quantify financial statement misstatements.
Historically, there have been two widely used methods for quantifying the effects of financial statement misstatements. These methods are referred to as the “roll-over” and “iron curtain” method. The roll-over method quantifies the amount by which the current year income statement is misstated. Exclusive reliance on an income statement approach can result in the accumulation of errors on the balance sheet that may not have been material to any individual income statement, but which may misstate one or more balance sheet accounts. The iron curtain method quantifies the error as the cumulative amount by which the current year balance sheet is misstated. Exclusive reliance on a balance sheet approach can result in disregarding the effects of errors in the current year income statement that results from the correction of an error existing in previously issued financial statements. We currently use the roll-over method for quantifying identified financial statement misstatements.
Back to Contents
J & J SNACK FOODS CORP. AND SUBSIDIARIES
NOTES TO CONSOLIDATED FINANCIAL STATEMENTS — (Continued)
NOTE A — SUMMARY OF SIGNIFICANT ACCOUNTING POLICIES — (Continued)
SAB 108 established an approach that requires quantification of financial statement misstatements based on the effects of the misstatement on each of the company’s financial statements and the related financial statement disclosures. This approach is commonly referred to as the “dual approach” because it requires quantification of errors under both the roll-over and iron curtain methods.
SAB 108 allows registrants to initially apply the dual approach either by (1) retroactively adjusting prior financial statements as if the dual approach had always been used or by (2) recording the cumulative effect of initially applying the dual approach as adjustments to the carrying values of assets and liabilities as of October 1, 2006 with an offsetting adjustment recorded to the opening balance of retained earnings. Use of this “cumulative effect” transition method requires detailed disclosure of the nature and amount of each individual error being corrected through the cumulative adjustment and how and when it arose.
We do not expect to record any such cumulative adjustment.
Certain prior year financial statement amounts have been reclassified to be consistent with the presentation for the current year. F-12
Table of Contents J & J SNACK FOODS CORP. AND SUBSIDIARIES
NOTES TO CONSOLIDATED FINANCIAL STATEMENTS (Continued)
NOTE B — ACQUISITIONS On March 17, 2005, we acquired all of the assets of Snackworks LLC, d/b/a Bavarian Brothers, a manufacturer of soft pretzels headquartered in Rancho Cucamonga, California for $14.8 million plus approximately $600,000 for inventory. Snackworks operated production facilities in California and Chambersburg, Pennsylvania and markets its products under the brand names SERIOUSLY TWISTED!, BAVARIAN BROTHERS and CINNAPRETZEL. Snackworks sells throughout the continental United States primarily to mass merchandisers and theatres. On January 31, 2006, we acquired the stock of ICEE of Hawaii. ICEE of Hawaii, headquartered in Waipahu, Hawaii, distributes ICEE frozen beverages and related products throughout the Hawaiian islands. Annual sales are approximately $2.3 million. On May 26, 2006, The ICEE Company, our frozen carbonated beverage distribution company, acquired the SLUSH PUPPIE branded business from Dr. Pepper/Seven Up, Inc., a Cadbury Schweppes Americas Beverages Company for $18.1 million plus approximately $4.3 million in working capital. SLUSH PUPPIE, North America’s leading brand for frozen non-carbonated beverages, is sold through an existing established distributor network to over 20,000 locations in the United States and Canada as well as to certain international markets. On January 9, 2007 we acquired the assets of Hom/Ade Foods, Inc., a manufacturer and distributor of biscuits and dumplings sold under the MARY B’S and private label store brands to the supermarket industry. Hom/Ade is headquartered in Pensacola, Florida. On January 31, 2007 we acquired the assets of Radar Inc., a manufacturer and seller of fig and fruit bars selling its products under the brand DADDY RAY’S. Headquartered and with its manufacturing facility in Moscow Mills, Missouri (outside of St. Louis), Radar, Inc. had annual sales of approximately $23 million dollars selling to the retail grocery segment and mass merchandisers, both branded and private label. On April 2, 2007, we acquired the WHOLE FRUIT Sorbet and FRUIT-A-FREEZE Fruit Bar brands, along with related assets including a manufacturing facility located in Norwalk, California which sells primarily to the supermarket industry. On June 25, 2007, we acquired the assets of an ICEE distributor in Kansas with annual sales of less than $1 million. The allocation of the purchase prices for the Hom/Ade and Radar acquisitions and other acquisitions which were made during the 2007 fiscal year is as follows: | | | | Hom/Ade
| | Radar
| | Other
|
|---|
| | | | (in thousands) | |
|---|
| Working Capital | | | | $ | 1,410 | | | $ | 1,284 | | | $ | 989 | | | Property, plant & equipment | | | | | 233 | | | | 5,750 | | | | 1,442 | | | Trade Names | | | | | 6,220 | | | | 1,960 | | | | 3,086 | | | Customer Relationships | | | | | 17,250 | | | | 10,730 | | | | 58 | | | Covenant not to Compete | | | | | 301 | | | | 109 | | | | — | | | Goodwill | | | | | 476 | | | | 1,287 | | | | 603 | | | | | | | $ | 25,890 | | | $ | 21,120 | | | $ | 6,178 | |
Included in the purchase price for Hom/Ade is a pre-acquisition contingency which was settled in the first quarter of fiscal year 2008 for approximately $1.9 million. The following pro forma information discloses net sales, net earnings and earnings per share for the three fiscal years ended September 26, 2009 including the sales and net earnings of Hom/Ade, Radar and Slush Puppie for all periods. F-13
Table of Contents J & J SNACK FOODS CORP. AND SUBSIDIARIES
NOTES TO CONSOLIDATED FINANCIAL STATEMENTS (Continued)
NOTE B — ACQUISITIONS (Continued)
The impact of the other acquisitions made during the periods on net sales, net earnings and earnings per share was not significant. | | | | Pro Forma | |
|---|
| | | | Fiscal year ended
| |
|---|
| | | | September 26,
2009
(52 weeks)
| | September 27,
2008
(52 weeks)
| | September 29,
2007
(52 weeks)
|
|---|
| | | | (in thousands except per share information) | |
|---|
| Net Sales | | | | $ | 653,047 | | | $ | 629,359 | | | $ | 581,024 | | | Net Earnings | | | | $ | 41,312 | | | $ | 27,908 | | | $ | 33,235 | | | Earnings per diluted share | | | | $ | 2.21 | | | $ | 1.47 | | | $ | 1.75 | | | Earnings per basic share | | | | $ | 2.23 | | | $ | 1.49 | | | $ | 1.78 | |
These acquisitions were accounted for under the purchase method of accounting, and their operations are included in the accompanying consolidated financial statements from their acquisition dates. NOTE C — INVESTMENT SECURITIES We have classified our investment securities as marketable securities held to maturity and auction market preferred stock (AMPS). The FASB defines fair value as the price that would be received from selling an asset or paid to transfer a liability in an orderly transaction between market participants. As such, fair value is a market-based measurement that should be determined based on assumptions that market participants would use in pricing an asset or liability. As a basis for considering such assumptions, the FASB has established three levels of inputs that may be used to measure fair value: NOTE B — ACQUISITIONS
In January 2004, we acquired the assets of Country Home Bakers, Inc. Country Home Bakers, Inc., with its manufacturing facility in Atlanta, Georgia, manufactures and distributes bakery products to the food service and supermarket industries. Its product line includes cookies, biscuits, and frozen doughs sold under the names READI-BAKE, COUNTRY HOME and private labels sold through supermarket in-store bakeries.
On March 17, 2005, we acquired all of the assets of Snackworks LLC, d/b/a Bavarian Brothers, a manufacturer of soft pretzels headquartered in Rancho Cucamonga, California for $14.8 million plus approximately $600,000 for inventory. Snackworks operates production facilities in California and Chambersburg, Pennsylvania and markets its products under the brand names SERIOUSLY TWISTED!, BAVARIAN BROTHERS and CINNAPRETZEL. Snackworks sells throughout the continental United States primarily to mass merchandisers and theatres. Annual sales are approximately $11 million. The allocation of the purchase price is as follows:
| | | (in thousands) | | | |
|
| | | Property, plant and equipment | $ | 1,600 | | | Inventory | | 604 | | | Trade names | | 1,690 | | | Customer relationships | | 4,290 | | | Covenant not to compete | | 100 | | | Goodwill | | 7,145 | | | |
|
| | | | $ | 15,429 | | | |
|
| |
On January 31, 2006, we acquired the stock of ICEE of Hawaii. ICEE of Hawaii, headquartered in Waipahu, Hawaii, distributes ICEE frozen beverages and related products throughout the Hawaiian islands. Annual sales are approximately $2.3 million.
On May 26, 2006, The ICEE Company, our frozen carbonated beverage distribution company, acquired the SLUSH PUPPIE branded business from Dr. Pepper/Seven Up, Inc., a Cadbury Schweppes Americas Beverages Company for $18.1 million plus approximately $4.3 in working capital. SLUSH PUPPIE, North America’s leading brand for frozen non-carbonated beverages, is sold through an existing established distributor network to over 20,000 locations in the United States and Canada as well as to certain
Back to Contents
J & J SNACK FOODS CORP. AND SUBSIDIARIES
NOTES TO CONSOLIDATED FINANCIAL STATEMENTS — (Continued)
NOTE B — ACQUISITIONS — (Continued)
international markets. Sales of the SLUSH PUPPIE business were approximately $18 million in 2005. The allocation of the purchase price is as follows:
| | | | (in thousands) | | | |
|
| | | Working Capital | $ | 4,264 | | | Property, plant and equipment | | 25 | | | Prepaid license | | 1,400 | | | Trade names | | 7,460 | | | Customer relationships | | 6,180 | | | Covenant not to compete | | 148 | | | Goodwill | | 2,987 | | | |
|
| | | | $ | 22,464 | | | |
|
| |
These acquisitions were accounted for under the purchase method of accounting, and their operations are included in the consolidated financial statements from their acquisition dates.
NOTE C — INVESTMENT SECURITIES
The amortized cost, unrealized gains and losses, and fair market values of our investment securities available for sale at September 30, 2006 are summarized as follows:
| | | | | Gross | | Gross | | Fair | | | | | Amortized | | Unrealized | | Unrealized | | Market | | | | | Cost | | Gains | | Losses | | Value | | | | |
|
| |
|
| |
|
| |
|
| | | | | (in thousands) | | Available for Sale Securities
| | | | | | | | | | | | | | | Equity Securities | | $ | 54,000 | | $ | — | | $ | — | | $ | 54,000 | | | Municipal Government Securities | | | 5,000 | | | — | | | — | | | 5,000 | | | | |
|
| |
|
| |
|
| |
|
| | | | | $ | 59,000 | | $ | — | | $ | — | | $ | 59,000 | | | | |
|
| |
|
| |
|
| |
|
| |
The amortized cost, unrealized gains and losses, and fair market values of our investment securities available for sale at September 24, 2005 are summarized as follows:
| | | | | Gross | | Gross | | Fair | | | | | Amortized | | Unrealized | | Unrealized | | Market | | | | | Cost | | Gains | | Losses | | Value | | | | |
|
| |
|
| |
|
| |
|
| | | | | (in thousands) | | | Available for Sale Securities | | | | | | | | | | | | | | | Equity Securities | | $ | 49,225 | | $ | — | | $ | — | | $ | 49,225 | | | Municipal Government Securities | | | 5,000 | | | — | | | — | | | 5,000 | | | | |
|
| |
|
| |
|
| |
|
| | | | | $ | 54,225 | | $ | — | | $ | — | | $ | 54,225 | | | | |
|
| |
|
| |
|
| |
|
| |
Because of the short-term nature of our investment securities held at September 30, 2006 and September 24, 2005, they do not fluctuate from par.
Proceeds from the sale of marketable securities were $36,050,000 and $14,000,000 in the periods ended September 30, 2006, and September 24, 2005, respectively, with no gain or loss recorded. We use the specific identification method to determine the cost of securities sold.
Back to Contents
J & J SNACK FOODS CORP. AND SUBSIDIARIES
NOTES TO CONSOLIDATED FINANCIAL STATEMENTS — (Continued)
NOTE D — INVENTORIES
Inventories consist of the following:
| | | September 30, | | September 24, | | | | | 2006 | | 2005 | | | | |
|
| |
|
| | | | | (in thousands) | | | | | | | | | | | | Finished goods | | $ | 18,398 | | $ | 16,016 | | | Raw materials | | | 5,415 | | | 4,935 | | | Packaging materials | | | 3,803 | | | 3,485 | | | Equipment parts and other | | | 10,174 | | | 9,248 | | | | |
|
| |
|
| | | | | $ | 37,790 | | $ | 33,684 | | | | |
|
| |
|
| |
Inventory is presented net of an allowance for obsolescence of $2,330,000 and $1,922,000 as of fiscal year ends 2006 and 2005, respectively.
NOTE E — PROPERTY, PLANT AND EQUIPMENT
Property, plant and equipment consist of the following:
| | | September 30, | | September 24, | | Estimated | | | | | 2006 | | 2005 | | Useful Lives | | | | |
|
| |
|
| |
|
| | | | | (in thousands) | | | | | | | | | | | | | | | Land | | $ | 556 | | $ | 556 | | | — | | | Buildings | | | 4,497 | | | 4,497 | | | 15-39.5 years | | | Plant machinery and equipment | | | 108,682 | | | 105,815 | | | 5-10 years | | | Marketing equipment | | | 189,925 | | | 188,601 | | | 5 years | | | Transportation equipment | | | 2,013 | | | 1,271 | | | 5 years | | | Office equipment | | | 9,219 | | | 8,966 | | | 3-5 years | | | Improvements | | | 16,264 | | | 15,083 | | | 5-20 years | | | Construction in progress | | | 2,682 | | | 1,354 | | | — | | | | |
| |
| | | | | | | | $ | 333,838 | | $ | 326,143 | | | | | | | |
| |
| | | | |
NOTE F — GOODWILL AND INTANGIBLE ASSETS
Our four reporting units, which are also reportable segments, are Food Service, Retail Supermarket, The Restaurant Group and Frozen Beverages.
The carrying amount of acquired intangible assets for the reportable segments are as follows:
| | | September 30, 2006 | | September 24, 2005 | | | | |
| |
| | | | | Gross | | | | Gross | | | | | | | | Carrying | | Accumulated | | Carrying | | Accumulated | | | | | Amount | | Amortization | | Amount | | Amortization | | | | |
|
| |
|
| |
|
| |
|
| | | | | (in thousands) | | | Food Service | | | | | | | | | | | | | | | Amortized intangible assets Licenses and rights | | $ | 9,013 | | $ | 3,029 | | $ | 8,913 | | $ | 1,906 | | | | |
|
| |
|
| |
|
| |
|
| | | Retail Supermarket | | | | | | | | | | | | | | | Amortized intangible assets Licenses and rights | | $ | — | | $ | — | | $ | — | | $ | — | | | | |
|
| |
|
| |
|
| |
|
| | | The Restaurant Group | | | | | | | | | | | | | | | Amortized intangible assets Licenses and rights | | $ | — | | $ | — | | $ | — | | $ | — | | | | |
|
| |
|
| |
|
| |
|
| | | Frozen Beverages | | | | | | | | | | | | | | | Indefinite lived intangible assets Licenses and rights | | $ | 8,960 | | $ | — | | $ | — | | $ | — | | | Amortized intangible assets Licenses and rights | | $ | 8,175 | | $ | 450 | | $ | 201 | | $ | 165 | | | | |
|
| |
|
| |
|
| |
|
| | | | | $ | 17,135 | | $ | 450 | | $ | 201 | | $ | 165 | | | | |
|
| |
|
| |
|
| |
|
| |
Back to Contents
J & J SNACK FOODS CORP. AND SUBSIDIARIES
NOTES TO CONSOLIDATED FINANCIAL STATEMENTS — (Continued)
NOTE F — GOODWILL AND INTANGIBLE ASSETS — (Continued)
Licenses and rights are being amortized by the straight-line method over periods ranging from 4 to 20 years and amortization expense is reflected throughout operating expenses. In fiscal year 2005, intangible assets of $6,080,000 were acquired in the Snackworks acquisition. In January 2006, intangible assets of $1,746,000 were acquired in the ICEE of Hawaii acquisition and a product license agreement for $100,000 was entered into by the food service segment. In May 2006, intangible assets of $15,188,000 were acquired in the SLUSH PUPPIE acquisition. Aggregate amortization expense of intangible assets for the fiscal years 2006, 2005 and 2004 was $1,408,000, $822,000 and $443,000.
Estimated amortization expense for the next five fiscal years is approximately $1,900,000 in 2007, $1,800,000 in 2008, $1,600,000 in 2009 and 2010, and $1,500,000 in 2011. The weighted average amortization period of the intangible assets is 10.2 years.
| Level 1 | | | | Observable inputs such as quoted prices in active markets for identical assets or liabilities; | | Level 2 | | | | Observable inputs, other than Level 1 inputs in active markets, that are observable either directly or indirectly; and | | Level 3 | | | | Unobservable inputs for which there is little or no market data, which require the reporting entity to develop its own assumptions. |
We have concluded that the carrying value of 26 week certificates of deposit placed through the Certificate of Deposit Account Registry Service equals fair market value. Other marketable securities held to maturity values are derived solely from level 1 inputs. We have no holdings of AMPS at September 26, 2009. The amortized cost, unrealized gains and losses, and fair market values of our investment securities held to maturity at September 26, 2009 are summarized as follows: | | | | Amortized
Cost
| | Gross
Unrealized
Gains
| | Fair
Unrealized
Losses
| | Market
Value
|
|---|
| | | | (in thousands) | |
|---|
| US Government Agency Debt | | | | $ | 6,009 | | | $ | 22 | | | $ | 1 | | | $ | 6,030 | | | FDIC Backed Corporate Debt | | | | | 13,213 | | | | 198 | | | | — | | | | 13,411 | | | Certificates of Deposit | | | | | 39,425 | | | | 21 | | | | 3 | | | | 39,443 | | | | | | | $ | 58,647 | | | $ | 241 | | | $ | 4 | | | $ | 58,884 | |
All of the certificates of deposit are within the FDIC limits for insurance coverage.
F-14
Table of Contents J & J SNACK FOODS CORP. AND SUBSIDIARIES
NOTES TO CONSOLIDATED FINANCIAL STATEMENTS (Continued)
NOTE C — INVESTMENT SECURITIES (Continued)
The amortized cost, unrealized gains and losses, and fair market values of our investment securities held to maturity at September 27, 2008 are summarized as follows: | Certificates of Deposit | | | | $ | 2,470 | | | $ | — | | | $ | 6 | | | $ | 2,464 | | | | | | | $ | 2,470 | | | $ | — | | | $ | 6 | | | $ | 2,464 | |
All of the certificates of deposit are within the FDIC limits for insurance coverage. The amortized cost and fair value of the Company’s held to maturity securities by contractual maturity at September 26, 2009 and September 27, 2008 are summarized as follows: | | | | September 26, 2009
| | September 27, 2008
| |
|---|
| | | | Amortized
Cost
| | Fair
Market
Value
| | Amortized
Cost
| | Fair
Market
Value
|
|---|
| | | | (in thousands) | |
|---|
| Due in one year or less | | | | $ | 38,653 | | | $ | 38,668 | | | $ | 2,470 | | | $ | 2,464 | | | Due after one year through five years | | | | | 19,994 | | | | 20,216 | | | | — | | | | — | | | Total held to maturity securities | | | | $ | 58,647 | | | $ | 58,884 | | | $ | 2,470 | | | $ | 2,464 | | | Less current portion | | | | | 38,653 | | | | 38,668 | | | | 2,470 | | | | 2,464 | | | Long term held to maturity securities | | | | $ | 19,994 | | | $ | 20,216 | | | $ | — | | | $ | — | |
The amortized cost, unrealized gains and losses, and fair market values of our auction market preferred stock at September 27, 2008 are summarized as follows: | | | | Amortized
Cost
| | Gross
Unrealized
Gains
| | Gross
Unrealized
Losses
| | Fair
Market
Value
|
|---|
| | | | (in thousands) | |
|---|
Auction Market Preferred Stock
| | | | | | | | | | | | | | | | | | | | Equity Securities | | | | $ | 35,200 | | | $ | — | | | $ | — | | | $ | 35,200 | | | | | | | $ | 35,200 | | | $ | — | | | $ | — | | | $ | 35,200 | |
The AMPS we owned at September 27, 2008 are senior equity securities of closed-end funds and have priority over the fund’s common shares as to distribution of assets and dividends, as described in each fund’s prospectus. On August 21, 2008, Merrill Lynch announced a plan to purchase, at par, AMPS held by J & J and other of its clients. Redemption of our AMPS subsequent to the failure of the auction process in February 2008 was $10,000,000, our carrying value, in the year ended September 27,2008 and $15,400,000, also our carrying value, in the year ended September 26, 2009. In January 2009, we sold $19,800,000 of our AMPS to Merrill Lynch at our carrying value. Proceeds from the sale and redemption of AMPS were $35,200,000 in the year ended September 26, 2009, with no gain or loss recorded. Proceeds from the sale and redemption of AMPS were $16,500,000 in the year ended September 27, 2008, with no gain or loss recorded. We use the specific identification method to determine the cost of securities sold. Proceeds from the sale and redemption of marketable securities were $10,204,000 in the year ended September 26, 2009, and none in the prior year, with no gain or loss recorded. We use the specific identification method to determine the cost of securities sold. F-15
Table of Contents J & J SNACK FOODS CORP. AND SUBSIDIARIES
NOTES TO CONSOLIDATED FINANCIAL STATEMENTS (Continued)
NOTE D — INVENTORIES Inventories consist of the following: | | | | September 26,
2009
| | September 27,
2008
|
|---|
| | | | (in thousands) | |
|---|
| Finished goods | | | | $ | 19,913 | | | $ | 23,512 | | | Raw materials | | | | | 8,060 | | | | 7,658 | | | Packaging materials | | | | | 5,141 | | | | 5,405 | | | Equipment parts and other | | | | | 12,890 | | | | 12,520 | | | | | | | $ | 46,004 | | | $ | 49,095 | |
Inventory is presented net of an allowance for obsolescence of $4,209,000 and $3,817,000 as of fiscal year ends 2009 and 2008, respectively. NOTE E — PROPERTY, PLANT AND EQUIPMENT Property, plant and equipment consist of the following: | | | | September 26,
2009
| | September 27,
2008
| | Estimated
Useful Lives
|
|---|
| | | | (in thousands) | |
|---|
| Land | | | | $ | 1,416 | | | $ | 1,416 | | | | — | | | Buildings | | | | | 8,672 | | | | 8,672 | | | | 15–39.5 years | | | Plant machinery and equipment | | | | | 133,758 | | | | 124,591 | | | | 5–20 years | | | Marketing equipment | | | | | 202,708 | | | | 195,878 | | | | 5–7 years | | | Transportation equipment | | | | | 2,733 | | | | 2,878 | | | | 5 years | | | Office equipment | | | | | 11,461 | | | | 10,820 | | | | 3–5 years | | | Improvements | | | | | 18,454 | | | | 17,694 | | | | 5–20 years | | | Construction in progress | | | | | 3,954 | | | | 2,215 | | | | — | | | | | | | $ | 383,156 | | | $ | 364,164 | | | | | |
NOTE F — GOODWILL AND INTANGIBLE ASSETS Our four reporting units, which are also reportable segments, are Food Service, Retail Supermarket, The Restaurant Group and Frozen Beverages. The carrying amount of acquired intangible assets for the reportable segments are as follows: | | | | September 26, 2009
| | September 27, 2008
| |
|---|
| | | | Gross
Carrying
Amount
| | Accumulated
Amortization
| | Gross
Carrying
Amount
| | Accumulated
Amortization
|
|---|
| | | | (in thousands) | |
|---|
Food Service
| | | | | | | | | | | | | | | | | | | | | Indefinite lived intangible assets
| | | | | | | | | | | | | | | | | | | | Trade Names | | | | $ | 8,180 | | | $ | — | | | $ | 8,180 | | | $ | — | | | | Amortized intangible assets
| | | | | | | | | | | | | | | | | | | | Non compete agreements | | | | | 435 | | | | 282 | | | | 435 | | | | 215 | | | Customer relationships | | | | | 33,287 | | | | 11,526 | | | | 33,287 | | | | 8,087 | | | Licenses and rights | | | | | 3,606 | | | | 2,061 | | | | 3,606 | | | | 1,835 | | | | | | | $ | 45,508 | | | $ | 13,869 | | | $ | 45,508 | | | $ | 10,137 | |
F-16
Table of Contents J & J SNACK FOODS CORP. AND SUBSIDIARIES
NOTES TO CONSOLIDATED FINANCIAL STATEMENTS (Continued)
NOTE F — GOODWILL AND INTANGIBLE ASSETS (Continued)
| | | | September 26, 2009
| | September 27, 2008
| |
|---|
| | | | Gross
Carrying
Amount
| | Accumulated
Amortization
| | Gross
Carrying
Amount
| | Accumulated
Amortization
|
|---|
| | | | (in thousands) | |
|---|
Retail Supermarket
| | | | | | | | | | | | | | | | | | | | | Indefinite lived intangible assets
| | | | | | | | | | | | | | | | | | | | Trade Names | | | | $ | 2,731 | | | $ | — | | | $ | 2,731 | | | $ | — | | | | The Restaurant Group
| | | | | | | | | | | | | | | | | | | | | Amortized intangible assets
| | | | | | | | | | | | | | | | | | | | Licenses and rights | | | | $ | — | | | $ | — | | | $ | — | | | $ | — | | | | Frozen Beverages
| | | | | | | | | | | | | | | | | | | | | Indefinite lived intangible assets
| | | | | | | | | | | | | | | | | | | | Trade Names | | | | $ | 9,315 | | | $ | — | | | $ | 9,315 | | | $ | — | | | | Amortized intangible assets
| | | | | | | | | | | | | | | | | | | | Non compete agreements | | | | | 148 | | | | 141 | | | | 148 | | | | 99 | | | Customer relationships | | | | | 6,478 | | | | 2,212 | | | | 6,478 | | | | 1,548 | | | Licenses and rights | | | | | 1,601 | | | | 434 | | | | 1,601 | | | | 364 | | | | | | | $ | 17,542 | | | $ | 2,787 | | | $ | 17,542 | | | $ | 2,011 | |
The gross carrying amount of intangible assets is determined by applying a discounted cash flow model to the future sales and earnings associated with each intangible asset or is set by contract cost. The amortization period used for definite lived intangible assets is set by contract period or by the period over which the bulk of the discounted cash flow is expected to be generated. We currently believe that we will receive the benefit from the use of the trade names classified as indefinite lived intangible assets indefinitely and they are therefore not amortized. Licenses and rights are being amortized by the straight-line method over periods ranging from 3 to 20 years and amortization expense is reflected throughout operating expenses. Aggregate amortization expense of intangible assets for the fiscal years 2009, 2008 and 2007 was $4,508,000, $4,700,000 and $3,974,000. Estimated amortization expense for the next five fiscal years is approximately $4,500,000 in 2010, $4,100,000 in 2011, $3,800,000 in 2012 and $3,700,000 in 2013 and 2014. The weighted average amortization period of the intangible assets is 10.3 years. Goodwill |
The carrying amounts of goodwill for the reportable segments are as follows: | | | | Food
Service
| | Retail
Supermarkets
| | Restaurant
Group
| | Frozen
Beverages
| | Total
|
|---|
| | | | (in thousands) | |
|---|
Balance at
September 26, 2009 | | | | $ | 23,988 | | | $ | — | | | $ | 386 | | | $ | 35,940 | | | $ | 60,314 | | Balance at
September 27, 2008 | | | | $ | 23,988 | | | $ | — | | | $ | 386 | | | $ | 35,940 | | | $ | 60,314 | |
F-17
Table of goodwill for the reportable segments are as follows: | | | Food | | Retail | | Restaurant | | Frozen | | | | | | | | Service | | Supermarkets | | Group | | Beverages | | Total | | | | |
|
| |
|
| |
|
| |
|
| |
|
| | | | | (in thousands) | | | | | | | | | | | | | | | | | | | | | Balance at September 30, 2006 | | $ | 22,225 | | $ | — | | $ | 386 | | $ | 35,337 | | $ | 57,948 | | | | |
|
| |
|
| |
|
| |
|
| |
|
| | | Balance at September 24, 2005 | | $ | 21,386 | | $ | — | | $ | 386 | | $ | 31,850 | | $ | 53,622 | | | | |
|
| |
|
| |
|
| |
|
| |
|
| |
Goodwill of $7,145,000 in the food service segment was acquired in the March 2005 acquisition of Snackworks, LLC. and $839,000 was acquired in an acquisition in August 2006. Goodwill of $500,000 in the frozen beverages segment was acquired in the January 2006 acquisition of ICEE of Hawaii. Goodwill of $2,987,000 in the frozen beverages segment was acquired in the May 2006 acquisition of the SLUSH PUPPIE branded business.
NOTE G — LONG-TERM DEBT
In December 2006, we entered into an amended and restated loan agreement with our existing banks which provides for up to a $50,000,000 revolving credit facility repayable in December 2011, with the availability of repayments without penalty. The agreement contains restrictive covenants and requires commitment fees in accordance with standard banking practice. As of September 30, 2006 and September 24, 2005, there were no outstanding balances under the prior facility.
We self-insure, up to loss limits, certain insurable risks such as worker’s compensation and automobile liability claims. Accruals for claims under our self-insurance program are recorded on a claims-incurred basis. Under this program, the estimated liability for claims incurred but unpaid in fiscal years 2006 and 2005 was $2,800,000 and $2,700,000, respectively. In connection with certain self-insurance agreements, we customarily enter into letters of credit arrangements with our insurers. At September 30, 2006 and September 24, 2005, we had outstanding letters of credit totaling approximately $8,620,000 and $7,700,000, respectively.
Back to Contents
J & J SNACK FOODS CORP. AND SUBSIDIARIES
NOTES TO CONSOLIDATED FINANCIAL STATEMENTS — (Continued)
NOTE H — INCOME TAXES
Income tax expense (benefit) is as follows:
| | | Fiscal year ended | | | | |
| | | | | September 30, | | September 24, | | September 25, | | | | | 2006 | | 2005 | | 2004 | | | | |
|
| |
|
| |
|
| | | | | (in thousands) | | | Current | | | | | | | | | | | | U.S. Federal | | $ | 15,982 | | $ | 13,932 | | $ | 9,441 | | | Foreign | | | 233 | | | 210 | | | 140 | | | State | | | 2,503 | | | 1,791 | | | 960 | | | | |
|
| |
|
| |
|
| | | | | | 18,718 | | | 15,933 | | | 10,541 | | | | |
|
| |
|
| |
|
| | | Deferred | | | | | | | | | | | | U.S. Federal | | | (82 | ) | | (153 | ) | | 2,200 | | | State | | | (14 | ) | | (21 | ) | | 194 | | | | |
|
| |
|
| |
|
| | | | | | (96 | ) | | (174 | ) | | 2,394 | | | | |
|
| |
|
| |
|
| | | | | $ | 18,622 | | $ | 15,759 | | $ | 12,935 | | | | |
|
| |
|
| |
|
| |
The provisions for income taxes differ from the amounts computed by applying the statutory federal income tax rate of approximately 35% to earnings before income taxes for the following reasons:
| | | Fiscal year ended | | | | |
| | | | | September 30, | | September 24, | | September 25, | | | | | 2006 | | 2005 | | 2004 | | | | |
|
| |
|
| |
|
| | | | | (in thousands) | | | | | | | | | | | | | | | Income taxes at statutory rates | | $ | 16,825 | | $ | 14,631 | | $ | 12,283 | | | Increase (decrease) in taxes resulting from: | | | | | | | | | | | | State income taxes, net of federal income tax benefit | | | 1,663 | | | 1,170 | | | 725 | | | Other, net | | | 134 | | | (42 | ) | | (73 | ) | | | |
|
| |
|
| |
|
| | | | | $ | 18,622 | | $ | 15,759 | | $ | 12,935 | | | | |
|
| |
|
| |
|
| |
Deferred tax assets and liabilities consist of the following:
| | | September 30, | | September 24, | | | | | 2006 | | 2005 | | | | |
|
| |
|
| | | | | (in thousands) | | | Deferred tax assets | | | | | | | | | Vacation accrual | | $ | 908 | | $ | 831 | | | Insurance accrual | | | 2,883 | | | 2,624 | | | Deferred income | | | 138 | | | 225 | | | Allowances | | | 1,326 | | | 1,181 | | | Other, net | | | 921 | | | 666 | | | | |
|
| |
|
| | | | | | 6,176 | | | 5,527 | | | | |
|
| |
|
| | | Deferred tax liabilities | | | | | | | | | Amortization of goodwill and other intangible assets | | | 8,758 | | | 7,428 | | | Depreciation of property and equipment | | | 12,874 | | | 13,643 | | | Other, net | | | 42 | | | 50 | | | | |
|
| |
|
| | | | | | 21,674 | | | 21,121 | | | | |
|
| |
|
| | | | | $ | 15,498 | | $ | 15,594 | | | | |
|
| |
|
| |
Back to Contents
J & J SNACK FOODS CORP. AND SUBSIDIARIES
NOTES TO CONSOLIDATED FINANCIAL STATEMENTS — (Continued)
NOTE I — COMMITMENTS
J & J SNACK FOODS CORP. AND SUBSIDIARIES
NOTES TO CONSOLIDATED FINANCIAL STATEMENTS (Continued)
NOTE F — GOODWILL AND INTANGIBLE ASSETS (Continued)
The carrying value of goodwill is determined based on the excess of the purchase price of acquisitions over the estimated fair value of tangible and intangible net assets. Goodwill is not amortized but is evaluated annually by management for impairment. There were no impairment charges in 2009, 2008 or 2007. NOTE G — LONG-TERM DEBT In December 2006, we entered into an amended and restated loan agreement with our existing banks which provides for up to a $50,000,000 revolving credit facility repayable in December 2011, with the availability of repayments without penalty. The agreement contains restrictive covenants and requires commitment fees in accordance with standard banking practice. As of September 26, 2009 and September 27, 2008, there were no outstanding balances under the facility. NOTE H — OBLIGATIONS UNDER CAPITAL LEASES Obligations under capital leases consist of the following: | | | | September 26,
2009
| | September 27,
2008
|
|---|
| | | | (in thousands) | |
|---|
| Capital lease obligations, with interest at 2.6%, payable in monthly installments of $8,700, through August 2013 | | | | $ | 381 | | | $ | 474 | | | Less current portion | | | | | 96 | | | | 93 | | | | | | | $ | 285 | | | $ | 381 | |
NOTE I — INCOME TAXES Income tax expense (benefit) is as follows: | | | | Fiscal year ended
| |
|---|
| | | | September 26,
2009
| | September 27,
2008
| | September 29,
2007
|
|---|
| | | | (in thousands) | |
|---|
Current
| | | | | | | | | | | | | | | | U.S. Federal | | | | $ | 18,574 | | | $ | 11,417 | | | $ | 15,485 | | | Foreign | | | | | 706 | | | | 844 | | | | 423 | | | State | | | | | 3,744 | | | | 2,270 | | | | 2,581 | | | | | | | | 23,024 | | | | 14,531 | | | | 18,489 | | Deferred
| | | | | | | | | | | | | | | | U.S. Federal | | | | | 3,106 | | | | 2,983 | | | | 474 | | | Foreign | | | | | 109 | | | | (168 | ) | | | — | | | State | | | | | 658 | | | | 631 | | | | 83 | | | | | | | | 3,873 | | | | 3,446 | | | | 557 | | | | | | | $ | 26,897 | | | $ | 17,977 | | | $ | 19,046 | |
F-18
Table of Contents J & J SNACK FOODS CORP. AND SUBSIDIARIES
NOTES TO CONSOLIDATED FINANCIAL STATEMENTS (Continued)
NOTE I — INCOME TAXES (Continued)
The provisions for income taxes differ from the amounts computed by applying the statutory federal income tax rate of approximately 35% to earnings before income taxes for the following reasons: | | | | Fiscal year ended
| |
|---|
| | | | September 26,
2009
| | September 27,
2008
| | September 29,
2007
|
|---|
| | | | (in thousands) | |
|---|
| Income taxes at statutory rates | | | | $ | 23,873 | | | $ | 16,059 | | | $ | 17,905 | | Increase (decrease) in taxes resulting from:
| | | | | | | | | | | | | | | | State income taxes, net of federal income tax benefit | | | | | 2,958 | | | | 1,918 | | | | 1,819 | | | Other, net | | | | | 66 | | | | — | | | | (678 | ) | | | | | | $ | 26,897 | | | $ | 17,977 | | | $ | 19,046 | |
Deferred tax assets and liabilities consist of the following: | | | | September 26,
2009
| | September 27,
2008
|
|---|
| | | | (in thousands) | |
|---|
Deferred tax assets
| | | | | | | | | | | | Vacation accrual | | | | $ | 1,233 | | | $ | 1,117 | | | Insurance accrual | | | | | 2,943 | | | | 2,634 | | | Deferred income | | | | | 67 | | | | 105 | | | Allowances | | | | | 1,902 | | | | 1,865 | | | Inventory capitalization | | | | | 499 | | | | 519 | | | Share-based compensation | | | | | 1,113 | | | | 896 | | | Other, net | | | | | 65 | | | | 104 | | | | | | | | 7,822 | | | | 7,240 | | Deferred tax liabilities
| | | | | | | | | | | | Amortization of goodwill and other intangible assets | | | | | 13,388 | | | | 11,899 | | | Depreciation of property and equipment | | | | | 17,793 | | | | 14,818 | | | Other, net | | | | | 15 | | | | 24 | | | | | | | | 31,196 | | | | 26,741 | | | | | | | $ | 23,374 | | | $ | 19,501 | |
| Lease Commitments |
The following is a summary of approximate future minimum rental commitments for non-cancelable operating leases with terms of more than one year as of September 26, 2009: | | | | Plants and
Offices
| | Equipment
| | Total
|
|---|
| | | | (in thousands) | |
|---|
| 2010 | | | | $ | 5,008 | | | $ | 4,159 | | | $ | 9,167 | | | 2011 | | | | | 4,263 | | | | 3,543 | | | | 7,806 | | | 2012 | | | | | 3,868 | | | | 2,219 | | | | 6,087 | | | 2013 | | | | | 3,516 | | | | 724 | | | | 4,240 | | | 2014 | | | | | 3,357 | | | | 29 | | | | 3,386 | | | 2015 and thereafter | | | | | 12,490 | | | | — | | | | 12,490 | | | | | | | $ | 32,502 | | | $ | 10,674 | | | $ | 43,176 | |
Total rent expense was $12,856,000, $12,907,000 and $13,803,000 for fiscal years 2009, 2008 and 2007, respectively. F-19
Table of Contents J & J SNACK FOODS CORP. AND SUBSIDIARIES
NOTES TO CONSOLIDATED FINANCIAL STATEMENTS (Continued)
NOTE J — COMMITMENTS (Continued)
The following is a summary of approximate future minimum rental commitments for non-cancelable operating leases with terms of more than one year as of September 30, 2006:
| | | Plants and
Offices | | Equipment | | Total | | | | |
|
| |
|
| |
|
| | | | | (in thousands) | | | | | | | | | | | | | | | 2007 | | $ | 4,702 | | $ | 5,222 | | $ | 9,924 | | | 2008 | | | 3,991 | | | 4,188 | | | 8,179 | | | 2009 | | | 3,577 | | | 2,865 | | | 6,442 | | | 2010 | | | 2,949 | | | 982 | | | 3,931 | | | 2011 | | | 2,282 | | | 177 | | | 2,459 | | | 2012 and thereafter | | | 6,359 | | | 88 | | | 6,447 | | | | |
|
| |
|
| |
|
| | | | | $ | 23,860 | | $ | 13,522 | | $ | 37,382 | | | | |
|
| |
|
| |
|
| |
Total rent expense was $13,418,000, $11,516,000 and $11,220,000 for fiscal years 2006, 2005 and 2004, respectively.
We are a party to litigation which has arisen in the normal course of business which management currently believes will not have a material adverse effect on our financial condition or results of operations. We self-insure, up to loss limits, certain insurable risks such as worker’s compensation and automobile liability claims. Accruals for claims under our self-insurance program are recorded on a claims incurred basis. Our total recorded liability for all years’ claims incurred but not yet paid was $7,100,000 and $6,400,000 at September 26, 2009 and September 27, 2008, respectively. In connection with certain self-insurance agreements, we customarily enter into letters of credit arrangements with our insurers. At September 26, 2009 and September 27, 2008, we had outstanding letters of credit totaling $8,675,000 and $9,475,000, respectively. NOTE K — CAPITAL STOCK In our fiscal year ended September 26, 2009, we purchased and retired 450,597 shares of our common stock at a cost of $12,510,000 under a million share buyback authorization approved by the Company’s Board of Directors in February 2008. Of the shares purchased and retired in 2009, 400,000 shares were purchased at the purchase price of $27.90 per share from Gerald B. Shreiber, Chairman of the Board, Chief Executive Officer and Director of the Company. In our 2008 fiscal year ended September 27, 2008, we purchased and retired 135,124 shares of our common stock at a cost of $3,539,000. The Company did not repurchase any of its common stock in fiscal year 2007. NOTE L — STOCK OPTIONS We have a Stock Option Plan (the “Plan”). Pursuant to the Plan, stock options may be granted to officers and our key employees which qualify as incentive stock options as well as stock options which are nonqualified. The exercise price of incentive stock options is at least the fair market value of the common stock on the date of grant. The exercise price for nonqualified options is determined by a committee of the Board of Directors. The options are generally exercisable after three years and expire no later than ten years from date of grant. There were 1,400,000 shares reserved under the Plan; options for 702,000 shares remain unissued as of September 26, 2009. There are options that were issued under an option plan that has since expired that are still outstanding. We have an Employee Stock Purchase Plan (“ESPP”) whereby employees purchase stock by making contributions through payroll deductions for six month periods. The purchase price of the stock is 85% of the lower of the market price of the stock at the beginning of the six-month period or the end of the six-month period. In fiscal years 2009, 2008 and 2007 employees purchased 25,803, 31,366 and 23,140 shares at average purchase prices of $26.63, $24.93 and $30.22, respectively. ESPP expense of $237,000, $137,000 and $146,000 was recognized for fiscal years 2009, 2008 and 2007, respectively. F-20
Table of business which management currently believes will not have a material adverse effect on our financial condition or results of operations. We self-insure, up to loss limits, certain insurable risks such as worker’s compensation and automobile liability claims. Accruals for claims under our self-insurance program are recorded on a claims incurred basis. Under this program, the estimated liability for claims incurred but unpaid in fiscal years 2006 and 2005 was $2,800,000 and $2,700,000, respectively. In connection with certain self-insurance agreements, we customarily enter into letters of credit arrangements with our insurers. At September 30, 2006 and September 24, 2005, we had outstanding letters of credit totaling approximately $8,620,000 and $7,700,000, respectively.
NOTE J — CAPITAL STOCK
In fiscal years 2004, 2005 and 2006, we did not purchase and retire any shares of our common stock.
NOTE K — STOCK OPTIONS
We have a Stock Option Plan (the “Plan”). Pursuant to the Plan, stock options may be granted to officers and our key employees which qualify as incentive stock options as well as stock options which are nonqualified. The exercise price of incentive stock options is at least the fair market value of the common stock on the date of grant. The exercise price for nonqualified options is determined by a committee of the Board of Directors. The options are generally exercisable after three years and expire no later than ten years from date of grant. There were 800,000 shares reserved under the Plan; options for 263,000 shares remain unissued as of September 30, 2006. There are options that were issued under an option plan that has since expired that are still outstanding.
We have an Employee Stock Purchase Plan (“ESPP”) whereby employees purchase stock by making contributions through payroll deductions for six month periods. The purchase price of the stock is 85% of the lower of the market price of the stock at the beginning of the six-month period or the end of the six-month period. In fiscal years 2006, 2005 and 2004 employees purchased 23,205, 23,996 and 25,436 shares at average purchase prices of $23.95, $18.53 and $14.66, respectively.
Back to Contents
J & J SNACK FOODS CORP. AND SUBSIDIARIES
NOTES TO CONSOLIDATED FINANCIAL STATEMENTS (Continued)
NOTE L — STOCK OPTIONS (Continued)
A summary of the status of our stock option plans as of fiscal years 2009, 2008 and 2007 and the changes during the years ended on those dates is represented below: | | | | Incentive Stock Options
| | Nonqualified Stock Options
| |
|---|
| | | | Stock
Options
Outstanding
| | Weighted-
Average
Exercise
Price
| | Stock
Options
Outstanding
| | Weighted-
Average
Exercise
Price
|
|---|
| Balance, October 1, 2007 | | | | | 729,935 | | | | 17.93 | | | | 492,354 | | | | 13.30 | | | Granted | | | | | 114,700 | | | | 41.45 | | | | 35,000 | | | | 36.49 | | | Exercised | | | | | (151,130 | ) | | | 17.45 | | | | (68,000 | ) | | | 6.19 | | | Cancelled | | | | | (20,100 | ) | | | 23.70 | | | | — | | | | | | | | | Balance, September 29, 2007 | | | | | 673,405 | | | | 21.87 | | | | 459,354 | | | | 16.12 | | | Granted | | | | | 96,345 | | | | 33.22 | | | | 20,000 | | | | 34.17 | | | Exercised | | | | | (111,768 | ) | | | 16.57 | | | | (77,000 | ) | | | 9.66 | | | Cancelled | | | | | (44,150 | ) | | | 26.36 | | | | (5,000 | ) | | | 38.54 | | | | | Balance, September 27, 2008 | | | | | 613,832 | | | | 24.29 | | | | 397,354 | | | | 18.00 | | | Granted | | | | | 4,500 | | | | 32.13 | | | | — | | | | — | | | Exercised | | | | | (169,388 | ) | | | 18.73 | | | | (71,000 | ) | | | 10.70 | | | Cancelled | | | | | (20,000 | ) | | | 26.79 | | | | (20,000 | ) | | | 20.02 | | | | | Balance, September 26, 2009 | | | | | 428,944 | | | $ | 26.45 | | | | 306,354 | | | $ | 19.55 | | Exercisable Options,
September 26, 2009 | | | | | 238,149 | | | | | | | | 236,354 | | | | | |
The weighted-average fair value of incentive options granted during fiscal years ended September 26, 2009, September 27, 2008 and September 29, 2007 was $7.13, $7.99 and $11.98, respectively. The weighted-average fair value of non-qualified stock options granted during the fiscal years ended September 27, 2008 and September 29, 2007 was $15.21 and $14.29, respectively. There were no non-qualified options granted during the fiscal year ended September 26, 2009. The total instrinsic value of stock options exercised was $5.4 million, $3.2 million and $5.4 million in fiscal years 2009, 2008 and 2007, respectively. The following table summarizes information about incentive stock options outstanding at September 26, 2009: | | | | Options Outstanding
| | Options Exercisable
| |
|---|
Range of
Exercise Prices
| | | | Number
Outstanding
at
September 26,
2009
| | Weighted-
Average
Remaining
Contractual
Life
| | Weighted-
Average
Exercise
Price
| | Number
Exercisable
at
September 26,
2009
| | Weighted-
Average
Exercise
Price
|
|---|
| $ 6.38 – $ 7.94 | | | | | 47,000 | | | | .9 | years | | $ | 6.57 | | | | 47,000 | | | $ | 6.57 | | | $10.60 – $10.60 | | | | | 92,632 | | | | 1.9 | years | | $ | 10.60 | | | | 92,632 | | | $ | 10.60 | | | $27.42 – $38.28 | | | | | 194,612 | | | | 2.2 | years | | $ | 31.43 | | | | 98,517 | | | $ | 29.70 | | | $41.50 – $41.60 | | | | | 94,700 | | | | 2.2 | years | | $ | 41.60 | | | | — | | | $ | — | | | | | | | | 428,944 | | | | | | | | | | | | 238,149 | | | | | |
F-21
Table of Contents J & J SNACK FOODS CORP. AND SUBSIDIARIES
NOTES TO CONSOLIDATED FINANCIAL STATEMENTS (Continued)
NOTE L — STOCK OPTIONS (Continued)
The following table summarizes information about nonqualified stock options outstanding at September 26, 2009: | | | | Options Outstanding
| | Options Exercisable
| |
|---|
Range of
Exercise Prices
| | | | Number
Outstanding
at
September 26,
2009
| | Weighted-
Average
Remaining
Contractual
Life
| | Weighted-
Average
Exercise
Price
| | Number
Exercisable
at
September 26,
2009
| | Weighted-
Average
Exercise
Price
|
|---|
| $ 7.97 – $10.30 | | | | | 124,000 | | | | 1.1 | years | | $ | 9.13 | | | | 124,000 | | | $ | 9.13 | | | $19.77 – $27.42 | | | | | 92,354 | | | | 3.0 | years | | $ | 20.27 | | | | 92,354 | | | $ | 20.27 | | | $29.78 – $38.81 | | | | | 90,000 | | | | 7.0 | years | | $ | 33.17 | | | | 20,000 | | | $ | 29.78 | | | | | | | | 306,354 | | | | | | | | | | | | 236,354 | | | | | |
NOTE M — 401(k) PROFIT-SHARING PLAN We maintain a 401(k) profit-sharing plan for our employees. Under this plan, we may make discretionary profit-sharing and matching 401(k) contributions. Contributions of $1,354,000, $1,411,000 and $1,333,000 were made in fiscal years 2009, 2008 and 2007, respectively. NOTE N — CASH FLOW INFORMATION The following is supplemental cash flow information: | | | | Fiscal Year Ended
| |
|---|
| | | | September 26,
2009
| | September 27,
2008
| | September 29,
2007
|
|---|
| | | | (in thousands) | |
|---|
Cash paid for:
| | | | | | | | | | | | | | | | Interest | | | | $ | 14 | | | $ | 21 | | | $ | 6 | | | Income taxes | | | | | 21,345 | | | | 13,896 | | | | 17,753 | | | | Non cash items:
| | | | | | | | | | | | | | | | Capital leases | | | | $ | — | | | $ | — | | | $ | 580 | |
NOTE O — SEGMENT REPORTING We principally sell our products to the food service and retail supermarket industries. We also distribute our products directly to the consumer through our chain of retail stores referred to as The Restaurant Group. Sales and results of our frozen beverages business are monitored separately from the balance of our food service business and restaurant group because of different distribution and capital requirements. We maintain separate and discrete financial information for the four operating segments mentioned above which is available to our Chief Operating Decision Makers. We have applied no aggregate criteria to any of these operating segments in order to determine reportable segments. Our four reportable segments are Food Service, Retail Supermarkets, The Restaurant Group and Frozen Beverages. All inter-segment net sales and expenses have been eliminated in computing net sales and operating income (loss). These segments are described below. F-22
Table of Contents J & J SNACK FOODS CORP. AND SUBSIDIARIES
NOTES TO CONSOLIDATED FINANCIAL STATEMENTS (Continued)
NOTE O — SEGMENT REPORTING (Continued)
J & J SNACK FOODS CORP. AND SUBSIDIARIES
NOTES TO CONSOLIDATED FINANCIAL STATEMENTS — (Continued)
NOTE K — STOCK OPTIONS — (Continued)
A summary of the status of our stock option plans as of fiscal years 2006, 2005 and 2004 and the changes during the years ended on those dates is represented below:
| | | Incentive Stock Options | | Nonqualified Stock Options | | | | |
| |
| | | | | | | Weighted- | | | | Weighted- | | | | | Stock | | Average | | Stock | | Average | | | | | Options | | Exercise | | Options | | Exercise | | | | | Outstanding | | Price | | Outstanding | | Price | | | | |
|
| |
|
| |
|
| |
|
| | | Balance, September 28, 2003 | | | 1,211,258 | | $ | 11.28 | | | 638,000 | | $ | 9.00 | | | Granted | | | 207,400 | | | 20.04 | | | 20,000 | | | 20.43 | | | Exercised | | | (437,054 | ) | | 9.19 | | | (74,000 | ) | | 5.50 | | | Cancelled | | | (40,498 | ) | | 12.24 | | | — | | | — | | | | |
| | | | |
| | | | | | Balance, September 25, 2004 | | | 941,106 | | | 14.06 | | | 584,000 | | | 9.84 | | | Granted | | | 12,646 | | | 23.65 | | | 24,354 | | | 21.35 | | | Exercised | | | (177,052 | ) | | 9.43 | | | (88,000 | ) | | 5.89 | | | Cancelled | | | (27,212 | ) | | 15.14 | | | — | | | — | | | | |
| | | | |
| | | | | | Balance, September 24, 2005 | | | 749,488 | | | 15.28 | | | 520,354 | | | 11.04 | | | Granted | | | 135,671 | | | 29.73 | | | 40,000 | | | 30.44 | | | Exercised | | | (111,224 | ) | | 13.75 | | | (68,000 | ) | | 6.13 | | | Cancelled | | | (44,000 | ) | | 19.70 | | | — | | | | | | | |
| | | | |
| | | | | | Balance, September 30, 2006 | | | 729,935 | | $ | 17.93 | | | 492,354 | | $ | 13.30 | | | Exercisable Options, September 30, 2006 | | | 432,930 | | | | | | 408,000 | | | | |
The weighted-average fair value of incentive options granted during fiscal years ended September 30, 2006, September 24, 2005 and September 25, 2004 was $9.48, $7.95 and $7.08, respectively. The weighted-average fair value of nonqualified stock options granted during the fiscal years ended September 30, 2006 and September 24, 2005 was $14.79 and $8.80, respectively.
The following table summarizes information about incentive stock options outstanding at September 30, 2006:
| | | Options Outstanding | | Options Exercisable | | | | |
| |
| | | | | Number | | Weighted- | | | | Number | | | | | | | | Outstanding | | Average | | Weighted- | | Exercisable | | Weighted- | | | | | at | | Remaining | | Average | | at | | Average | | Range of | | September 30, | | Contractual | | Exercise | | September 30, | | Exercise | | Exercise Prices | | 2006 | | Life | | Price | | 2006 | | Price | |
| |
|
| |
|
| |
|
| |
|
| |
|
| | | $ 6.38 – $ 7.94 | | | 81,000 | | | 4.0 years | | $ | 6.49 | | | 81,000 | | $ | 6.49 | | | $10.60 – $15.20 | | | 139,932 | | | 4.8 years | | $ | 10.73 | | | 139,932 | | $ | 10.73 | | | $16.85 – $22.40 | | | 372,886 | | | 2.2 years | | $ | 18.83 | | | 211,998 | | $ | 17.65 | | | $27.42 – $32.98 | | | 136,117 | | | 4.2 years | | $ | 29.66 | | | — | | $ | — | | | | |
| | | | | | | |
| | | | | | | | | 729,935 | | | | | | | | | 432,930 | | | | | | | |
| | | | | | | |
| | | | |
Back to Contents
J & J SNACK FOODS CORP. AND SUBSIDIARIES
NOTES TO CONSOLIDATED FINANCIAL STATEMENTS — (Continued)
NOTE K — STOCK OPTIONS — (Continued)
The following table summarizes information about nonqualified stock options outstanding at September 30, 2006:
| | | Options Outstanding | | Options Exercisable | | | | |
| |
| | | | | Number | | Weighted- | | | | Number | | | | | | | | Outstanding | | Average | | Weighted- | | Exercisable | | Weighted- | | | | | at | | Remaining | | Average | | at | | Average | | Range of | | September | | Contractual | | Exercise | | September | | Exercise | | Exercise Prices | | 30, 2006 | | Life | | Price | | 30, 2006 | | Price | |
| |
|
| |
|
| |
|
| |
|
| |
|
| | | $ 6.19 – $ 7.97 | | | 136,000 | | | 2.1 years | | $ | 7.08 | | | 136,000 | | $ | 7.08 | | | $ 9.63 – $10.88 | | | 204,000 | | | 2.9 years | | $ | 10.27 | | | 204,000 | | $ | 10.27 | | | $19.77 – $29.78 | | | 132,354 | | | 6.0 years | | $ | 21.67 | | | 68,000 | | $ | 19.77 | | | $31.10 – $31.10 | | | 20,000 | | | 10.0 years | | $ | 31.10 | | | — | | | — | | | | |
| | | | | | | |
| | | | | | | | | 492,354 | | | | | | | | | 408,000 | | | | | | | |
| | | | | | | |
| | | | |
NOTE L — 401(k) PROFIT-SHARING PLAN
We maintain a 401(k) profit-sharing plan for our employees. Under this plan, we may make discretionary profit-sharing and matching 401(k) contributions. Contributions of $1,219,000, $1,243,000 and $1,141,000 were made in fiscal years 2006, 2005 and 2004, respectively.
NOTE M — CASH FLOW INFORMATION
The following is supplemental cash flow information:
| | | Fiscal year ended | | | | |
| | | | | September 30, | | September 24, | | September 25, | | | | | 2006 | | 2005 | | 2004 | | | | |
|
| |
|
| |
|
| | | | | (in thousands) | | | Cash paid for: | | | | | | | | | | | | Interest | | $ | 4 | | $ | 26 | | $ | — | | | Income taxes | | | 17,465 | | | 14,734 | | | 11,350 | |
NOTE N — SEGMENT REPORTING
We principally sell our products to the food service and retail supermarket industries. We also distribute our products directly to the consumer through our chain of retail stores referred to as The Restaurant Group. Sales and results of our frozen beverages business are monitored separately from the balance of our food service business and restaurant group because of different distribution and capital requirements. We maintain separate and discrete financial information for the four operating segments mentioned above which is available to our Chief Operating Decision Makers. We have applied no aggregate criteria to any of these operating segments in order to determine reportable segments. Our four reportable segments are Food Service, Retail Supermarkets, The Restaurant Group and Frozen Beverages. All inter-segment net sales and expenses have been eliminated in computing net sales and operating income (loss). These segments are described below.
The primary products sold by the food service segment are soft pretzels, frozen juice treats and desserts, churros and baked goods. Our customers in the food service segment include snack bars and food stands in chain, department and discount stores; malls and shopping centers; fast food outlets; stadiums and sports arenas; leisure and theme parks; convenience stores; movie theatres; warehouse club stores; schools, colleges and other institutions. Within the food service industry, our products are purchased by the consumer primarily for consumption at the point-of-sale. The primary products sold to the food service industry are soft pretzels, frozen juice treats and desserts, churros and baked goods. Our customers in the food service industry include snack bars and food stands in chain, department and discount stores; malls and shopping centers; fast food outlets; stadiums and sports arenas; leisure and theme parks; convenience stores; movie theatres; warehouse club stores; schools, colleges
Back to Contents
J & J SNACK FOODS CORP. AND SUBSIDIARIES
NOTES TO CONSOLIDATED FINANCIAL STATEMENTS — (Continued)
NOTE N — SEGMENT REPORTING — (Continued)
and other institutions. Within the food service industry, our products are purchased by the consumer primarily for consumption at the point-of-sale.
The primary products sold to the retail supermarket industry are soft pretzel products — including SUPERPRETZEL, frozen juice treats and desserts including LUIGI’S Real Italian Ice, MINUTE MAID Juice Bars and Soft Frozen Lemonade, WHOLE FRUIT frozen fruit bars, WHOLE FRUIT Sorbet, BARQ’S FLOATZ and ICEE Squeeze-Up Tubes and TIO PEPE’S Churros. Within the retail supermarket industry, our frozen and prepackaged products are purchased by the consumer for consumption at home. The primary products sold to the retail supermarket industry are soft pretzel products — including SUPERPRETZEL, frozen juice treats and desserts including LUIGI’S Real Italian Ice, MINUTE MAID Juice Bars and Soft Frozen Lemonade, BARQ’S FLOATZ and ICEE Squeeze-Up Tubes and TIO PEPE’S Churros. Within the retail supermarket industry, our frozen and prepackaged products are purchased by the consumer for consumption at home.
We sell direct to the consumer through our Restaurant Group, which operates BAVARIAN PRETZEL BAKERY and PRETZEL GOURMET, our chain of specialty snack food retail outlets. We sell direct to the consumer through our Restaurant Group, which operates BAVARIAN PRETZEL BAKERY and PRETZEL GOURMET, our chain of specialty snack food retail outlets.
We sell frozen beverages to the food service industry, including our restaurant group, primarily under the names ICEE, SLUSH PUPPIE and ARCTIC BLAST in the United States, Mexico and Canada.
Back to Contents
J & J SNACK FOODS CORP. AND SUBSIDIARIES
NOTES TO CONSOLIDATED FINANCIAL STATEMENTS — (Continued)
NOTE N — SEGMENT REPORTING — (Continued)
The Chief Operating Decision Maker for Food Service, Retail Supermarkets and The Restaurant Group and the Chief Operating Decision Maker for Frozen Beverages monthly review and evaluate operating income and sales in order to assess performance and allocate resources to each individual segment. In addition, the Chief Operating Decision Makers review and evaluate depreciation, capital spending and assets of each segment on a quarterly basis to monitor cash flow and asset needs of each segment. Information regarding the operations in these four reportable segments is as follows:
| | | Fiscal year ended | | | | |
| | | | | September 30, | | September 24, | | September 25, | | | | | 2006 | | 2005 | | 2004 | | | | |
|
| |
|
| |
|
| | | | | (in thousands) | | | Sales to external customers: | | | | | | | | | | | | Food Service | | $ | 320,167 | | $ | 280,123 | | $ | 250,523 | | | Retail Supermarket | | | 46,948 | | | 42,347 | | | 38,843 | | | The Restaurant Group | | | 3,897 | | | 5,409 | | | 7,623 | | | Frozen Beverages | | | 143,819 | | | 129,233 | | | 119,599 | | | | |
|
| |
|
| |
|
| | | | | $ | 514,831 | | $ | 457,112 | | $ | 416,588 | | | | |
|
| |
|
| |
|
| | | Depreciation and Amortization: | | | | | | | | | | | | Food Service | | $ | 13,992 | | $ | 13,715 | | $ | 13,504 | | | Retail Supermarket | | | — | | | — | | | — | | | The Restaurant Group | | | 102 | | | 209 | | | 422 | | | Frozen Beverages | | | 10,514 | | | 10,338 | | | 10,142 | | | | |
|
| |
|
| |
|
| | | | | $ | 24,608 | | $ | 24,262 | | $ | 24,068 | | | | |
|
| |
|
| |
|
| | | Operating Income (Loss): | | | | | | | | | | | | Food Service | | $ | 32,083 | | $ | 26,401 | | $ | 21,266 | | | Retail Supermarket | | | 1,945 | | | 2,918 | | | 2,701 | | | The Restaurant Group | | | (253 | ) | | (314 | ) | | (988 | ) | | Frozen Beverages | | | 11,289 | | | 11,244 | | | 12,213 | | | | |
|
| |
|
| |
|
| | | | | $ | 45,064 | | $ | 40,249 | | $ | 35,192 | | | | |
|
| |
|
| |
|
| | | Capital Expenditures: | | | | | | | | | | | | Food Service | | $ | 11,111 | | $ | 9,832 | | $ | 9,294 | | | Retail Supermarket | | | — | | | — | | | — | | | The Restaurant Group | | | 3 | | | 45 | | | 22 | | | Frozen Beverages | | | 8,625 | | | 11,755 | | | 12,328 | | | | |
|
| |
|
| |
|
| | | | | $ | 19,739 | | $ | 21,632 | | $ | 21,644 | | | | |
|
| |
|
| |
|
| | | Assets: | | | | | | | | | | | | Food Service | | $ | 218,834 | | $ | 209,734 | | $ | 183,740 | | | Retail Supermarket | | | — | | | — | | | — | | | The Restaurant Group | | | 838 | | | 1,010 | | | 1,461 | | | Frozen Beverages | | | 121,136 | | | 95,180 | | | 92,223 | | | | |
|
| |
|
| |
|
| | | | | $ | 340,808 | | $ | 305,924 | | $ | 277,424 | | | | |
|
| |
|
| |
|
| |
Back to Contents
J & J SNACK FOODS CORP. AND SUBSIDIARIES
NOTES TO CONSOLIDATED FINANCIAL STATEMENTS — (Continued)
NOTE O — QUARTERLY FINANCIAL DATA (UNAUDITED)
| | | Fiscal Year Ended September 30, 2006 | | | | |
| | | | | | | | | | | Net Earnings | | | | | | | | | | | Per | | | | | | | Gross | | Net | | Diluted | | | | | Net Sales | | Profit | | Earnings | | Share(1) | | | | |
|
| |
|
| |
|
| |
|
| | | | | (in thousands, except per share information) | | | | | | | | | | | | | | | | | | 1st Quarter | | $ | 108,571 | | $ | 33,117 | | $ | 3,010 | | $ | .16 | | | 2nd Quarter | | | 112,044 | | | 35,226 | | | 4,137 | | | .22 | | | 3rd Quarter | | | 140,132 | | | 50,733 | | | 10,786 | | | .57 | | | 4th Quarter | | | 154,084 | | | 53,343 | | | 11,517 | | | .61 | | | | |
|
| |
|
| |
|
| |
|
| | | Total | | $ | 514,831 | | $ | 172,419 | | $ | 29,450 | | $ | 1.57 | | | | |
|
| |
|
| |
|
| |
|
| | | | | | | | | | | | | | | | |
| | | Fiscal Year Ended September 24, 2005 | | | | |
| | | | | | | | | | | Net Earnings | | | | | | | | | | | Per | | | | | | | Gross | | Net | | Diluted | | | | | Net Sales | | Profit | | Earnings | | Share(1) | | | | |
|
| |
|
| |
|
| |
|
| | | | | (in thousands, except per share information) | | | | | | | | | | | | | | | | | | 1st Quarter | | $ | 98,521 | | $ | 29,996 | | $ | 2,482 | | $ | .13 | | | 2nd Quarter | | | 99,350 | | | 32,196 | | | 3,790 | | | .20 | | | 3rd Quarter | | | 129,452 | | | 46,275 | | | 9,879 | | | .53 | | | 4th Quarter | | | 129,789 | | | 46,580 | | | 9,892 | | | .53 | | | | |
|
| |
|
| |
|
| |
|
| | | Total | | $ | 457,112 | | $ | 155,047 | | $ | 26,043 | | $ | 1.40 | | | | |
|
| |
|
| |
|
| |
|
| |
All share amounts reflect the 2-for-1 stock split effective January 5, 2006.
(1) Total of quarterly amounts do not necessarily agree to the annual report amounts duefood service industry, including our restaurant group, primarily under the names ICEE, SLUSH PUPPIE and ARCTIC BLAST in the United States, Mexico and Canada.The Chief Operating Decision Maker for Food Service, Retail Supermarkets and The Restaurant Group and the Chief Operating Decision Maker for Frozen Beverages monthly review and evaluate operating income and sales in order to separateassess performance and allocate resources to each individual segment. In addition, the Chief Operating Decision Makers review and evaluate depreciation, capital spending and assets of each segment on a quarterly calculationsbasis to monitor cash flow and asset needs of each segment. Information regarding the operations in these four reportable segments is as follows: | | | | Fiscal year ended
| |
|---|
| | | | September 26,
2009
| | September 27,
2008
| | September 29,
2007
|
|---|
| | | | (in thousands) | |
|---|
Sales to external customers:
| | | | | | | | | | | | | | | | Food Service | | | | $ | 417,753 | | | $ | 400,194 | | | $ | 355,764 | | | Retail Supermarket | | | | | 65,158 | | | | 57,112 | | | | 52,131 | | | The Restaurant Group | | | | | 1,257 | | | | 1,635 | | | | 2,766 | | | Frozen Beverages | | | | | 168,879 | | | | 170,418 | | | | 158,240 | | | | | | | $ | 653,047 | | | $ | 629,359 | | | $ | 568,901 | | Depreciation and Amortization:
| | | | | | | | | | | | | | | | Food Service | | | | $ | 16,530 | | | $ | 16,655 | | | $ | 16,176 | | | Retail Supermarket | | | | | — | | | | — | | | | — | | | The Restaurant Group | | | | | 33 | | | | 54 | | | | 60 | | | Frozen Beverages | | | | | 11,190 | | | | 10,761 | | | | 10,772 | | | | | | | $ | 27,753 | | | $ | 27,470 | | | $ | 27,008 | |
F-23
Table of Contents J & J SNACK FOODS CORP. AND SUBSIDIARIES
NOTES TO CONSOLIDATED FINANCIAL STATEMENTS (Continued)
NOTE O — SEGMENT REPORTING (Continued)
| | | | Fiscal year ended
| |
|---|
| | | | September 26,
2009
| | September 27,
2008
| | September 29,
2007
|
|---|
| | | | (in thousands) | |
|---|
Operating Income (Loss):
| | | | | | | | | | | | | | | | Food Service | | | | $ | 45,024 | | | $ | 24,784 | | | $ | 33,417 | | | Retail Supermarket | | | | | 7,442 | | | | 4,665 | | | | (2 | ) | | The Restaurant Group | | | | | (64 | ) | | | (140 | ) | | | 31 | | | Frozen Beverages | | | | | 14,536 | | | | 14,027 | | | | 15,134 | | | | �� | | | $ | 66,938 | | | $ | 43,336 | | | $ | 48,580 | | Capital Expenditures:
| | | | | | | | | | | | | | | | Food Service | | | | $ | 14,979 | | | $ | 11,898 | | | $ | 12,755 | | | Retail Supermarket | | | | | — | | | | — | | | | — | | | The Restaurant Group | | | | | — | | | | — | | | | 102 | | | Frozen Beverages | | | | | 12,211 | | | | 10,883 | | | | 9,908 | | | | | | | $ | 27,190 | | | $ | 22,781 | | | $ | 22,765 | | Assets:
| | | | | | | | | | | | | | | | Food Service | | | | $ | 309,988 | | | $ | 277,481 | | | $ | 252,843 | | | Retail Supermarket | | | | | — | | | | — | | | | — | | | The Restaurant Group | | | | | 557 | | | | 629 | | | | 690 | | | Frozen Beverages | | | | | 129,282 | | | | 130,298 | | | | 126,755 | | | | | | | $ | 439,827 | | | $ | 408,408 | | | $ | 380,288 | |
NOTE P — QUARTERLY FINANCIAL DATA (UNAUDITED) | | | | Fiscal Year Ended September 26, 2009
| |
|---|
| | | | Net
Sales
| | Gross
Profit
| | Net
Earnings
| | Net Earnings
Per Diluted
Share (1)
|
|---|
| | | | (in thousands, except per share information) | |
|---|
1st Quarter | | | | $ | 141,142 | | | $ | 40,682 | | | $ | 4,319 | | | $ | .23 | | 2nd Quarter | | | | | 149,352 | | | | 45,377 | | | | 7,244 | | | | .39 | | 3rd Quarter | | | | | 179,761 | | | | 61,034 | | | | 14,929 | | | | .80 | | 4th Quarter | | | | | 182,792 | | | | 61,751 | | | | 14,820 | | | | .79 | | | Total | | | | $ | 653,047 | | | $ | 208,844 | | | $ | 41,312 | | | $ | 2.21 | |
| | | | Fiscal Year Ended September 27, 2008
| |
|---|
| | | | Net
Sales
| | Gross
Profit
| | Net
Earnings
| | Net Earnings
Per Diluted
Share (1)
|
|---|
| | | | (in thousands, except per share information) | |
|---|
1st Quarter | | | | $ | 130,898 | | | $ | 35,387 | | | $ | 1,897 | | | $ | .10 | | 2nd Quarter | | | | | 144,229 | | | | 40,400 | | | | 3,998 | | | | .21 | | 3rd Quarter | | | | | 176,839 | | | | 55,752 | | | | 10,820 | | | | .57 | | 4th Quarter | | | | | 177,393 | | | | 55,368 | | | | 11,193 | | | | .59 | | | Total | | | | $ | 629,359 | | | $ | 186,907 | | | $ | 27,908 | | | $ | 1.47 | |
| (1) | | Total of quarterly amounts do not necessarily agree to the annual report amounts due to separate quarterly calculations of weighted average shares outstanding |
Back to Contents
REPORT OF INDEPENDENT REGISTERED PUBLIC ACCOUNTING FIRM
Shareholders and Board of Directors
J&J Snack Foods Corp. and Subsidiaries
We have audited in accordance with the standards of the Public Company Accounting Oversight Board (United States) the consolidated financial statements of J&J Snack Foods Corp. and Subsidiaries referred to in our report dated November 10, 2006 (except for Note G, as to which the date is December 1, 2006), which is included in the Annual Report to Shareholders and incorporated by reference in Part II of this form. Our audit was conducted for the purpose of forming an opinion on the basic financial statements taken as a whole. The accompanying Schedule II is presented for purposes of additional analysis and is not a required part of the basic financial statements. This schedule has been subjected to the auditing procedures applied in the audit of the basic financial statements and, in our opinion, is fairly stated in all material respects in relation to the basic financial statements taken as a whole.
Philadelphia, Pennsylvania
November 10, 2006 (except for Note G, as to which the date is December 1, 2006)
Back to Contents
SCHEDULE II— VALUATION AND QUALIFYING ACCOUNTS
| | | | | Opening
Balance | | Charged to
expense | | | | Closing
Balance | | Year | | Description | | | | Deductions | | |
|
| |
|
| |
|
| |
|
| |
|
| |
|
| | | 2006 | | | Allowance for doubtful accounts | | $ | 1,054,000 | | $ | 300,000 | | $ | 391,000 | (1) | $ | 963,000 | | | 2005 | | | Allowance for doubtful accounts | | | 1,104,000 | | | 112,000 | | | 162,000 | (1) | | 1,054,000 | | | 2004 | | | Allowance for doubtful accounts | | | 991,000 | | | 245,000 | | | 132,000 | (1) | | 1,104,000 | | | 2006 | | | Inventory Reserve | | | 1,922,000 | | | 408,000 | | | — | | | 2,330,000 | | | 2005 | | | Inventory Reserve | | | 1,131,000 | | | 791,000 | | | — | | | 1,922,000 | | | 2004 | | | Inventory Reserve | | | 617,000 | | | 514,000 | | | — | | | 1,131,000 | | | | | | | | | | | | | | | | | | | |
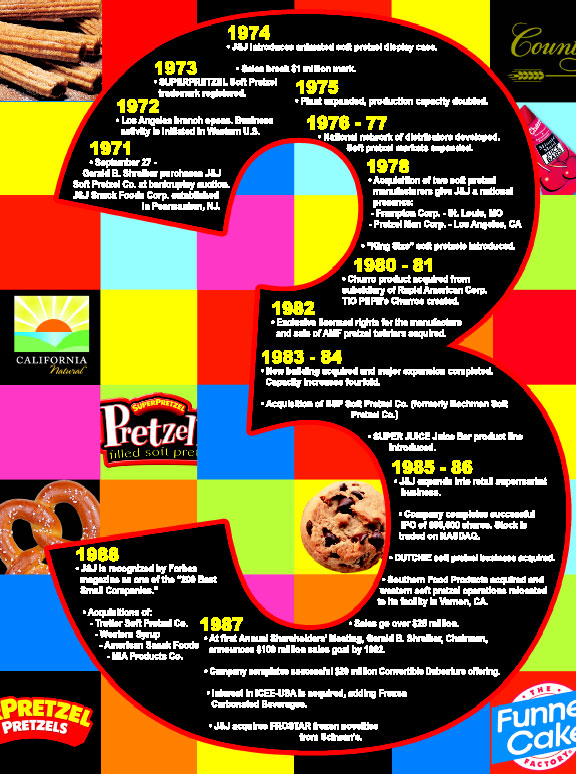


J & J SNACK FOODS CORP. AND SUBSIDIARIES
NOTES TO CONSOLIDATED FINANCIAL STATEMENTS (Continued)
NOTE Q — SUBSEQUENT EVENT Subsequent events through December 8, 2009 have been evaluated for disclosure and recognition. We have no subsequent events to disclose. F-25
Table of Contents SCHEDULE II — VALUATION AND QUALIFYING ACCOUNTS Year
| | | | Description
| | Opening
Balance
| | Charged to
Expense
| | Deductions
| | Closing
Balance
|
|---|
| 2009 | | | | Allowance for doubtful account | | $ | 926,000 | | | $ | 492,000 | | | $ | 795,000 | (1) | | $ | 623,000 | | | 2008 | | | | Allowance for doubtful accounts | | $ | 1,052,000 | | | $ | 502,000 | | | $ | 628,000 | (1) | | $ | 926,000 | | | 2007 | | | | Allowance for doubtful accounts | | $ | 963,000 | | | $ | 189,000 | | | $ | 100,000 | (1) | | $ | 1,052,000 | | | 2009 | | | | Inventory Reserve | | $ | 3,817,000 | | | $ | 2,036,000 | | | $ | 1,644,000 | (2) | | $ | 4,209,000 | | | 2008 | | | | Inventory Reserve | | $ | 2,864,000 | | | $ | 3,149,000 | | | $ | 2,196,000 | (2) | | $ | 3,817,000 | | | 2007 | | | | Inventory Reserve | | $ | 2,330,000 | | | $ | 1,911,000 | | | $ | 1,377,000 | (2) | | $ | 2,864,000 | |
| (1) | | Write-off of uncollectible accounts receivable. |
| (2) | | Disposals of obsolete inventory. |
S-1
|
|
|
|
|
|