Spire Alabama’s distribution system is connected to two major interstate natural gas pipeline systems, Southern Natural Gas Company, L.L.C. (Southern Natural Gas) and Transcontinental Gas Pipe Line Company, LLC (Transco). It is also connected to two intrastate natural gas pipeline systems.
Spire Alabama purchases natural gas from various natural gas producers and marketers. Certain volumes are purchased under firm contractual commitments with other volumes purchased on a spot market basis. The purchased volumes are delivered to Spire Alabama’s system using a variety of firm transportation, interruptible transportation and storage capacity arrangements designed to meet the system’s varying levels of demand.
In fiscal 2017,2021, Spire Alabama purchased natural gas from 1426 different suppliers to meet current gas sales, storage injection, and liquefied natural gas (LNG) liquefaction requirements, of which seventhree are under long-term supply agreements. Approximately 58.076.1 Bcf was transportedpurchased for delivery by Southern Natural Gas, 4.45.8 Bcf by Transco, and 5.69.7 Bcf through intrastate pipelines to the Spire Alabama delivery points for its residential, commercial, and industrial customers.
The fiscal 20172021 peak day send out for Spire Alabama was 0.6 Bcf on January 7, 2017,February 16, 2021, when the average temperature was 3122 degrees Fahrenheit in Birmingham, of which 100% was met with supplies transported through Southern Natural Gas, Transco, intrastate facilities, and one of the four LNG peak shaving facilities.
Spire Gulf’s distribution system is directly connected to interstate pipelines, natural gas processing plants and gas storage facilities. Spire Gulf buys from a variety of producers and marketers, with BP Energy Company being the primary supplier.
Natural Gas Storage
Spire Missouri believes it currently has ample storage capacity to meet the demands of its distribution system, particularly to augment its supply during peak demand periods; however, see related discussion of Spire STL Pipeline under the caption “—The Utilities’ ability to meet their customers’ natural gas requirements may be impaired if contracted gas supplies, interstate pipeline and/or storage services are not available or delivered in a timely manner” under Item 1A, Risk Factors, and in Note 15, Regulatory Matters, of the Notes to Financial Statements in Item 8. Spire Missouri has a contractual right to store 21.621.5 Bcf of gas in MRT’s storage facility located in Unionville, Louisiana, 16.3 Bcf of gas storage in Southern Star’s system storage facilities located in Kansas and Oklahoma, and 1.4 Bcf of firm storage on PEPL’s system storage. MRT’s tariffs allow injections into storage from May 161 through November 151 and require the withdrawal from storage of all but 2.14.3 Bcf from November 161 through May 15.1. Southern Star tariffs allow both injections and withdrawals into storage year roundyear-round with ratchets that restrict the associated flows dependent upon the underlying inventory level per the contracts.
In addition, Spire Missouri East supplements pipeline gas with natural gas withdrawn from its own underground storage field located in St. Louis and St. Charles Counties in Missouri. The field is designed to provide approximately 0.3 Bcf of natural gas withdrawals on a peak day and maximum annual net withdrawals of approximately 4.0 Bcf of natural gas based on the inventory level that Spire Missouri plans to maintain.
Spire Alabama has a contractual right to store 12.512.7 Bcf of gas with Southern Natural Gas, 0.2 Bcf of gas with Transco and 0.2 Bcf of gas with Tennessee Gas Pipeline. In addition, Spire Alabama has 1.82.0 Bcf of LNG storage that can provide the system with up to an additional 0.2 Bcf of natural gas daily to meet peak day demand.
Spire Gulf obtains adequate storage capacity through Gulf South Pipeline Company, LP, and Sempra’sEnstor Gas, LLC’s Bay Gas Storage.
Union Agreements
The Company believes labor relations with its employees are good. Should that condition change, the Company could experience labor disputes, work stoppages or other disruptions that could negatively impact the Company’s system operations, customer service, results of operations and cash flows.
The following table presents the Company’s various labor agreements as of September 30, 2021:
Union |
| Local |
| Employees Covered |
|
| Contract Start Date |
| Contract End Date | |
Spire Missouri |
|
|
|
|
|
|
|
|
|
|
United Steel, Paper and Forestry, Rubber Manufacturing, Allied-Industrial and Service Workers International Union (USW) |
| 884 |
|
| 68 |
|
| August 10, 2021 |
| July 31, 2024 |
USW |
| 11-6 |
|
| 911 |
|
| August 1, 2021 |
| July 31, 2024 |
USW |
| 11-6-03 (fka 11-194) |
|
| 115 |
|
| August 1, 2021 |
| July 31, 2024 |
USW |
| 12561 |
|
| 137 |
|
| October 9, 2019 |
| July 31, 2022 |
USW |
| 14228 |
|
| 46 |
|
| October 9, 2019 |
| July 31, 2022 |
USW |
| 11-267 |
|
| 29 |
|
| October 9, 2019 |
| July 31, 2022 |
International Brotherhood of Electrical Workers |
| 53 |
|
| 1 |
|
| July 8, 2020 |
| September 30, 2022 |
Gas Workers Metal Trades locals of the United Association of Journeyman and Apprentices of the Plumbing and Pipefitting Industry of the United States and Canada |
| 781-Kansas City |
|
| 230 |
|
| September 21, 2019 |
| July 31, 2022 |
Gas Workers Metal Trades locals of the United Association of Journeyman and Apprentices of the Plumbing and Pipefitting Industry of the United States and Canada |
| 781-Monett |
|
| 52 |
|
| September 21, 2019 |
| July 31, 2022 |
Total Spire Missouri |
|
|
|
| 1,589 |
|
|
|
|
|
|
|
|
|
|
|
|
|
|
|
|
Spire Alabama |
|
|
|
|
|
|
|
|
|
|
USW |
| 12030 |
|
| 238 |
|
| May 1, 2020 |
| April 30, 2023 |
United Association of Gas Fitters |
| 548 |
|
| 220 |
|
| May 1, 2019 |
| April 30, 2022 |
Total Spire Alabama |
|
|
|
| 458 |
|
|
|
|
|
|
|
|
|
|
|
|
|
|
|
|
Spire Gulf |
|
|
|
|
|
|
|
|
|
|
USW |
| 541 |
|
| 67 |
|
| August 1, 2020 |
| July 31, 2023 |
|
|
|
|
|
|
|
|
|
|
|
Total Spire |
|
|
|
| 2,114 |
|
|
|
|
|
Operating Revenues and Customer Information
The following tables present information on Spire’s revenues and therms sold and transported (before intersegment eliminations), and annual average numbers of customers for the three years ended September 30, 2021, 2020 and 2019.
Gas Utility Operating Revenues |
|
|
|
|
|
|
|
|
|
|
|
|
(% of Total) |
| 2021 |
|
| 2020 |
|
| 2019 |
| |||
Residential |
|
| 58 | % |
|
| 68 | % |
|
| 68 | % |
Commercial & Industrial |
|
| 28 | % |
|
| 22 | % |
|
| 23 | % |
Transportation |
|
| 6 | % |
|
| 6 | % |
|
| 6 | % |
Other |
|
| 8 | % |
|
| 4 | % |
|
| 3 | % |
Total |
|
| 100 | % |
|
| 100 | % |
|
| 100 | % |
Gas Utility Therms Sold and Transported |
|
|
|
|
|
|
|
|
|
|
|
|
(In millions) |
| 2021 |
|
| 2020 |
|
| 2019 |
| |||
Residential |
|
| 1,091.0 |
|
|
| 1,054.2 |
|
|
| 1,132.9 |
|
Commercial & Industrial |
|
| 488.6 |
|
|
| 473.4 |
|
|
| 525.2 |
|
Transportation |
|
| 1,647.0 |
|
|
| 1,670.5 |
|
|
| 1,673.2 |
|
Interruptible |
|
| 15.3 |
|
|
| 14.8 |
|
|
| 16.2 |
|
Total System |
|
| 3,241.9 |
|
|
| 3,212.9 |
|
|
| 3,347.5 |
|
Off-System |
|
| 70.8 |
|
|
| 84.9 |
|
|
| 38.5 |
|
Total |
|
| 3,312.7 |
|
|
| 3,297.8 |
|
|
| 3,386.0 |
|
Gas Utility Customers |
| 2021 |
|
| 2020 |
|
| 2019 |
| |||
Residential |
|
| 1,612,385 |
|
|
| 1,599,693 |
|
|
| 1,584,570 |
|
Commercial & Industrial |
|
| 112,635 |
|
|
| 112,566 |
|
|
| 112,561 |
|
Transportation |
|
| 846 |
|
|
| 847 |
|
|
| 842 |
|
Interruptible |
|
| 63 |
|
|
| 67 |
|
|
| 69 |
|
Total |
|
| 1,725,929 |
|
|
| 1,713,173 |
|
|
| 1,698,042 |
|
Total annual average number of customers for Spire Missouri and Spire Alabama for fiscal 2021 was 1,194,781 and 428,427, respectively.
Regulatory Matters
For details on regulatory matters, see
Note 15, Regulatory Matters, of the Notes to Financial Statements in Item 8.Other Pertinent Matters
Spire Missouri is the only distributor of natural gas within its franchised service areas, while Spire Alabama is the main distributor of natural gas in its service areas. Spire Missouri and Spire Alabama have franchises in nearly all the communities where they provide service with terms varying from five years to an indefinite duration. A franchise is essentially a municipal permit to install and maintain pipes and construct other facilities in the community. All of the franchises are free from unduly burdensome restrictions and are adequate for the conduct of Spire Missouri’s and Spire Alabama’s current public utility businesses in their respective states. In recent years, although certain franchise agreements have expired, the Utilities have continued to provide service in those communities without formal franchises.
The principal competition for the Utilities comes from the local electric companies. Other competitors in the service areas include suppliers of fuel oil, coal, and propane, as well as natural gas pipelines that can directly connect to large volume customers. For the Missouri Utilities, competition also comes from district steam systems in the downtown areas of both St. Louis and Kansas City, and for Spire Alabama, from municipally or publicly owned gas distributors located adjacent to its service territory. Coal ishas been price competitive as a fuel source for very large boiler plant loads, but environmental requirements for coal have shifted the economic advantage to natural gas. Oil and propane can be used to fuel boiler loads and certain direct-fired process applications, but these fuels require on-site storage, thus limiting their competitiveness. In certain cases,Competition also comes from district steam has been competitive with gas forsystems in the downtown areas of both St. Louis and Kansas City area heating users.
Residential, commercial, and industrial markets representedcustomers represent approximately 91%87% and 82% of fiscal 20172021 operating revenues for Spire Missouri and Spire Alabama, respectively. Given the current level of natural gas supply and market conditions, the Utilities believe that the relative comparison of natural gas equipment and operating costs with those of competitive fuels will not change significantly in the foreseeable future, and that these markets will continue to be supplied by natural gas. In new multi-family and commercial rental markets, the Utilities’ competitive exposures are presently limited to space and water heating applications.
Spire Missouri offersand Spire Alabama offer gas transportation service to its large-userlarge commercial and industrial customers. Transportation customers represent approximately 2% and commercial customers.16% of fiscal 2021 operating revenues for Spire Missouri and Spire Alabama, respectively. The Spire Missouri tariff approved for that type of service produces a margin similar to that which theSpire Missouri Utilities would have received under their regular sales rates. Similarly, Spire Alabama’s transportation tariff allows it to transport gas for large commercial and industrial customers rather than buying and reselling it to them and is based on Spire Alabama’s sales profit margin so that operating margins are unaffected. During fiscal 2017, substantially all of Spire Alabama’s large commercial and industrial customer deliveries involved the transportation of customer-owned gas.
The Utilities are subject to various environmental laws and regulations that, to date, have not materially affected the Utilities’ or the Company’s financial position and results of operations. For a detailed discussion of environmental matters, see
Note 16, Commitment and Contingencies, of the Notes to Financial Statements in Item 8.| Union | Local | Employees Covered | Contract Start Date | Contract End Date |
| Spire Missouri | ||||
| United Steel, Paper and Forestry, Rubber Manufacturing, Allied-Industrial and Service Workers International Union (USW) | 884 | 64 | August 1, 2015 | July 31, 2018 |
| USW | 11-6 | 932 | August 1, 2015 | July 31, 2018 |
| USW | 11-194 | 85 | August 1, 2015 | July 31, 2018 |
| USW | 12561 | 130 | August 16, 2016 | July 31, 2019 |
| USW | 14228 | 41 | August 16, 2016 | July 31, 2019 |
| USW | 11-267 | 27 | August 16, 2016 | July 31, 2019 |
| Gas Workers Metal Trades locals of the United Association of Journeyman and Apprentices of the Plumbing and Pipefitting Industry of the United States and Canada | 781-Kansas City | 189 | August 16, 2016 | July 31, 2019 |
| Gas Workers Metal Trades locals of the United Association of Journeyman and Apprentices of the Plumbing and Pipefitting Industry of the United States and Canada | 781-Monett | 56 | August 16, 2016 | July 31, 2019 |
| Total Spire Missouri | 1,524 | |||
| Spire Alabama | ||||
| USW | 12030 | 200 | May 1, 2017 | April 30, 2020 |
| USW | 12030-A | 53 | May 1, 2017 | April 30, 2020 |
| United Association of Gas Fitters | 548 | 122 | July 1, 2016 | April 30, 2019 |
| Total Spire Alabama | 375 | |||
| Spire Gulf | ||||
| USW | 3-541 | 65 | December 1, 2013 | November 30, 2017 |
| Total Spire | 1,964 | |||
| Gas Utility Operating Revenues | ||||||||||||
| (In millions) | 2017 | 2016 | 2015 | |||||||||
| Residential | $ | 1,084.5 | $ | 979.0 | $ | 1,263.1 | ||||||
| Commercial & Industrial | 389.2 | 331.3 | 462.3 | |||||||||
| Interruptible | 5.1 | 2.0 | 2.3 | |||||||||
| Transportation | 99.8 | 93.1 | 92.2 | |||||||||
| Off-System and Other Incentive | 67.9 | 50.7 | 76.2 | |||||||||
| Provisions for Refunds and Other | 21.4 | 3.3 | (0.3 | ) | ||||||||
| Total Gas Utility Operating Revenues | $ | 1,667.9 | $ | 1,459.4 | $ | 1,895.8 | ||||||
| Gas Utility Therms Sold and Transported | ||||||||||||
| (In millions) | 2017 | 2016 | 2015 | |||||||||
| Residential | 866.2 | 867.5 | 1,065.1 | |||||||||
| Commercial & Industrial | 446.7 | 420.4 | 491.6 | |||||||||
| Interruptible | 12.6 | 4.6 | 3.6 | |||||||||
| Transportation | 1,467.5 | 1,089.8 | 989.0 | |||||||||
| System Therms Sold and Transported | 2,793.0 | 2,382.3 | 2,549.3 | |||||||||
| Off-System | 175.6 | 183.3 | 193.5 | |||||||||
| Total Gas Utility Therms Sold and Transported | 2,968.6 | 2,565.6 | 2,742.8 | |||||||||
| Gas Utility Customers | 2017 | 2016 | 2015 | |||||||||
| Residential | 1,550,777 | 1,540,366 | 1,434,584 | |||||||||
| Commercial & Industrial | 133,864 | 137,450 | 132,388 | |||||||||
| Interruptible | 64 | 42 | 18 | |||||||||
| Transportation | 827 | 824 | 796 | |||||||||
| Total Gas Utility Customers | 1,685,532 | 1,678,682 | 1,567,786 | |||||||||
GAS MARKETING
Spire Marketing is engaged in the marketing of natural gas and providing energyrelated services to both on-system utility transportationthroughout the United States, which includes customers within and customers outside of the Utilities’ traditional service areas. DuringFor fiscal 2017, Gas2021 and 2020, Spire Marketing utilized over 20 interstatevolumes averaged 2.02 Bcf/day and intrastate pipelines2.13 Bcf/day, respectively. The majority of Spire Marketing’s business is derived from the procurement and over 100 suppliers to marketphysical delivery of natural gas to more than 200 retail customers and 100 wholesale customers,a diverse customer base, primarily in the central United States (US).and southern U.S. Through its retail operations, Spire Marketing offers natural gas marketing services to large commercial and industrial customers, while its wholesale business consists of producers, pipelines, power generators, municipalities, storage operators, and utility companies. Wholesale activities currently represent a majority of the total Gas Marketing business.
In the course of its business, Spire Marketing enters into agreements to purchase natural gas at a future date in order to lock up supply to cover future sales commitments to its customers. To secure access to the markets it serves, Spire Marketing contracts for transportation capacity on various pipelines from both pipeline companies directly and from other parties through the secondary capacity market from third parties.market. Throughout fiscal 2017,2021, Spire Marketing held approximately 0.681.1 Bcf per day of firm transportation capacity. In addition, to ensure reliability of service and to provide operational flexibility, Spire Marketing enters into firm storage contracts and interruptible park and loan transactions with various companies, where it is able to buy and retain gas to be delivered at a future date, at which time it sells the natural gas to third parties. As of September 30, 2017, Gas2021, Spire Marketing has contracted for approximately 7.222.8 Bcf of such storage and park and loan capacity for the 2017-20182021-2022 winter season.
OTHER
Other components of the flexibility that its overall portfolio of assets provided.Company’s consolidated information include:
• | unallocated corporate items, including certain debt and associated interest costs; |
• | Spire STL Pipeline and Spire Storage West LLC (“Spire Storage”), described below; and |
• | Spire’s subsidiaries engaged in the operation of a propane pipeline, the compression of natural gas, and risk management, among other activities. |
Spire STL Pipeline LLC, Spire NGL LLC, and subsidiaries engaged in compression of natural gas and risk management, among other activities.
Spire Storage is engaged in the storage of natural gas supply and meet peak demands on its distribution system. Spire NGL LLC also provides propane transportation servicesin the western region of the United States. The facility consists of two storage fields operating under one FERC market-based rate tariff currently authorized to third parties.
Item 1A. Risk Factors
Spire’s and the Utilities’ business and financial results are subject to a number of risks and uncertainties, including those set forth below. The risks described below are those the Company and the Utilities consider to be material. When considering any investment in Spire or the Utilities’ securities, investors should carefully consider the following information, as well as information contained in the caption “Forward-Looking Statements,” Item 7A, and other documents Spire, Spire Missouri, and Spire Alabama file with the SEC. This list is not exhaustive, and Spire’s and the Utilities’ respective management places no priority or likelihood based on the risk descriptions, order of presentation or grouping by subsidiary. All references to dollar amounts are in millions.
RISKS AND UNCERTAINTIES THAT RELATE TO THE BUSINESS AND FINANCIAL RESULTS OF SPIRE AND ITS SUBSIDIARIES
Failing to secure a permanent re-authorization of the Spire STL Pipeline to operate could adversely affect the Company.
On June 22, 2021, the U.S. Court of Appeals for the District of Columbia Circuit issued an order vacating Spire STL Pipeline’s certificates to operate by the FERC and remanding the proceeding back to the FERC, which took effect on October 8, 2021. The FERC, however, has issued a temporary emergency certificate authorization for the continued operation of the Spire STL Pipeline through December 13, 2021, unless otherwise shortened or revoked. Whether to extend the temporary emergency authorization or issue a new temporary authorization remains pending with the FERC. Also pending with the FERC is its decision on remand regarding whether to grant or deny permanent re-authorization of the pipeline. The commissioners’ statements at the November 18, 2021 FERC open meeting suggest they do not intend to allow the pipeline’s authorization to lapse in a manner that causes service to be interrupted this winter; however, they have not yet issued an order to extend the temporary authorization through the end of the 2021-2022 winter, and there is no assurance that the FERC will act to do so.
The court decision to vacate the Spire STL Pipeline’s Certificate of Public Convenience and Necessity previously issued by the FERC in 2018 could, depending on the course of action the FERC takes, cause a temporary or permanent halt in the natural gas supply transported by the pipeline or result in new regulatory conditions imposed on the pipeline, any of which could adversely affect the Company (including Spire Missouri) and our customers.
Spire Missouri relies on the Spire STL Pipeline to transport natural gas into the St. Louis region. In the event the pipeline is taken out of service or even as a result of regulatory uncertainty and business constraints associated with ongoing temporary authorization of the pipeline, Spire Missouri’s customers, financial condition and results of operations may be adversely impacted, which could result in a material adverse effect on the Company’s financial condition and operating results, as discussed under RISKS THAT RELATE TO THE GAS UTILITY SEGMENT below.
In addition, in the event the pipeline is taken out of service, the Company’s financial condition and results of operations may be adversely impacted by impairment of Spire STL Pipeline’s assets, currently carried at over $270 million, and other effects. Spire STL Pipeline will continue to pursue all legal and regulatory avenues to ensure its continued and future operation.
Reductions in capacity of interconnecting, third-party pipelines could cause a reduction in volumes transported by the Spire STL Pipeline, which could adversely affect the Company.
Spire STL Pipeline is dependent upon third-party pipelines and other facilities to provide delivery options to and from its pipeline. If any pipeline connection were to become unavailable for volumes of natural gas due to repairs, damage to the facility, lack of capacity or any other reason, Spire STL Pipeline’s ability to continue shipping natural gas to end markets could be restricted, and to the extent not mitigated by contractual indemnification, insurance or tariffs, would thereby reduce its revenues. Any permanent interruption at any key pipeline interconnect that causes a material reduction in volumes transported on its pipeline could result in an impairment loss that could have a material adverse effect on the Company’s financial condition and operating results.
As a holding company, Spire depends on its operating subsidiaries to meet its financial obligations.
Spire is a holding company with no significant assets other than the stock of its operating subsidiaries and cash investments. Spire, and Spire Missouri prior to the holding company’s formation in 2000, havehas paid common stock dividends continuously since 1946. Spire’s ability to pay dividends to its shareholders is dependent on the ability of its subsidiaries to generate sufficient net income and cash flows to pay upstream dividends and make loans or loan repayments. In addition, because it is a holding company and the substantial portion of its assets are represented by its holdings in the Utilities, the risks faced by the Utilities as described below under RISKS THAT RELATE TO THE GAS UTILITY SEGMENT may also adversely affect Spire’s cash flows, liquidity, financial condition and results of operations.
A downgrade in Spire’s and/or its subsidiaries’ credit ratings may negatively affect its ability to access capital and its cost of capital.
Currently, Spire, Spire Missouri, and its utility subsidiariesSpire Alabama have investment grade credit ratings, which are subject to review and change by the rating agencies. Standard & Poor’s has rated Spire’s debt at BBB+, one notch lower than its issuer rating of A-, and Moody’s (which does not use issuer ratings) rated Spire’s debt at Baa2.ratings. There is no assurance that such credit ratings for any of the Spire companies will remain in effect for any given period of time or that such ratings will not be lowered, suspended or withdrawn entirely by the rating agencies, if, in each rating agency’s judgment, circumstances so warrant. Spire has a working capital line of credit to meet its short-term liquidity needs. Spire’s line of credit may be used to meet the liquidity needs of any of its subsidiaries, subject to sublimits. If the rating agencies lowered the credit rating at any of these entities, particularly below investment grade, it might significantly limit suchthat entity’s ability to secure new or additional credit facilities and would increase its costs of borrowing. Spire’s or the Utilities’ ability to borrow under current or new credit facilities and costs of that borrowing have a direct impact on their ability to execute their operating strategies.
Pipeline integrity programs and repairs may impose significant costs and liabilities on the Company.
The U.S. Pipeline and Hazardous Materials Safety Administration (PHMSA) requires pipeline operators to develop integrity management programs to comprehensively evaluate certain areas along their pipelines and to take additional measures to protect pipeline segments located in “high consequence areas” where a leak or rupture could potentially do the most harm. As the operator of a pipeline, Spire STL Pipeline is required to:
• | perform ongoing assessments of pipeline integrity; |
• | identify and characterize applicable threats to pipeline segments that could impact a “high consequence area”; |
• | improve data collection, integration and analysis; |
• | repair and remediate the pipeline as necessary; and |
• | implement preventative and mitigating actions. |
The Company is required to maintain pipeline integrity testing programs that are intended to assess pipeline integrity. Any repair, remediation, preventative or mitigating actions may adverselyrequire significant capital and operating expenditures. Should the Company fail to comply with applicable statutes and the PHMSA Office of Pipeline Safety’s rules and related regulations and orders, it could be subject to significant penalties and fines.
We face risks related to widespread public health concerns, such as the COVID-19 outbreak.
The actual or perceived effects of a disease outbreak, epidemic, pandemic or similar widespread public health concern, such as COVID-19, could negatively affect Spire’s or its subsidiaries’our operations, liquidity, financial condition, cash flows and results of operations.
During fiscal 2020 and, to a lesser extent, 2021, we experienced impacts on our results of operations as a result of COVID-19 including, but not limited to:
• | reduced collection of late payment charges, lower revenue on commercial and industrial volumes; |
• | increased bad debt expenses; |
• | increases in certain operational expenses such as enhanced cleaning and personal protection equipment; |
• | decreases in expense for travel and medical claims; and |
• | higher residential customer charges due to a temporary moratorium on disconnections. |
We are continuing to assess the developments involving our workforce, customers and suppliers, as well as the ongoing response of federal and state authorities, our regulators and other business risks inherentand community leaders. For example, the Company is currently reviewing the potential financial impacts related to the emergency temporary standard related to COVID-19 vaccination and testing released by the Occupational Safety and Health Administration on November 4, 2021. An extended slowdown of the United States' economy or demand for commodities and/or material changes in government policy in response to COVID-19 could result in lower demand for natural gas, particularly among our commercial and industrial customers, as well as negatively impact the ability of our customers, contractors, suppliers and other business partners to remain in business or return to reasonable business activity in the activitiesnear future. While the crisis has not had a material effect on the Company to date, the impacts continue to unfold, and the full extent of Spire’s subsidiaries. If,future developments is not known at this time and may have a material impact on our results of operations, financial condition, liquidity and prospects. We have identified the following potential categories of risks for Spire, Spire Missouri and Spire Alabama outside of those already experienced through September 2021:
• | The health, safety and productivity of our workforce, including in a physically dispersed environment; |
• | Decreases in non-essential operational functions and/or capital investment; |
• | Supply chain impacts due to decreased production and imports of materials and supplies; |
• | The impact on operating results due to increased costs, lower demand in Spire’s service territories and/or lower fees associated with suspending service disconnections and other billing practices or other moratoriums; |
• | The impact of new regulatory actions that could increase costs or provide for future regulatory recovery of those costs; |
• | Spire’s continued ability to access normal functioning capital markets in a prolonged economic downturn; |
• | Adverse investment performance for postretirement benefit plan assets or the failure to maintain sustained growth in these investments over time could lead to an increase in our plan costs and funding requirements related to the plans; and |
• | Cybersecurity risks associated with a portion of our workforce working remotely. |
Spire is an essential business and continues to operate, while adhering to precautionary safety measures, to ensure that critical infrastructure improvements continue and to maintain the safety of the gas distribution network.
To the extent the COVID-19 health crisis adversely affects our business, it may also have the effect of heightening many of the other risks described in this item.
Climate change and regulatory and legislative developments in the normal courseenergy industry related to climate change may in the future adversely affect operations and financial results.
Climate change, and regulatory, public policy, or legislative changes to address the potential for climate change, could adversely affect operations and financial results of the Company. Management believes it is likely that any such resulting impacts would occur over a long period of time and thus would be difficult to quantify with any degree of specificity. To the extent climate change results in warmer temperatures, financial results could be adversely affected through lower gas volumes and revenues and lack of marketing opportunities. Another possible impact of climate change may be more frequent and more severe weather events, such as hurricanes and tornadoes, which could increase costs to repair damaged facilities and restore service to customers or result in lost revenues if the Company were unable to deliver natural gas to customers. To the extent such impacts are not covered by insurance or recovered in rates, this could have a material adverse effect on the Company’s financial condition, operating results and cash flows.
In addition, there have been a number of federal, state and local legislative and regulatory initiatives proposed in recent years in an attempt to control or limit the effects of global warming and overall climate change, including greenhouse gas emissions, such as methane and carbon dioxide. The adoption in the future of this type of legislation by Congress or similar legislation by states or localities, or the adoption of related regulations by federal, state or local governments mandating a substantial reduction in greenhouse gas emissions, restricting the use of fossil fuels, such as natural gas, or restricting the construction of infrastructure necessary to deliver natural gas to customers could have far-reaching and significant impacts on the energy industry. Such new legislation or regulations could result in increased compliance costs or additional operating restrictions, affect the demand for natural gas or impact the prices charged to customers. At this time, we cannot predict the potential impact of such laws or regulations that may be adopted on the Company’s and the Utilities’ future business, financial condition or financial results.
Transporting, distributing, and storing natural gas and propane involves numerous risks that may result in accidents and other operating risks and costs.
Natural gas transportation, distribution and storage activities inherently involve a variety of hazards and operations risks, such as leaks, accidental explosions, damage caused by third parties, and mechanical problems, which could cause substantial financial losses. In addition, these risks could result in serious injury to employees and non-employees, loss of human life, significant damage to property, environmental pollution, impairment of operations, and substantial losses to the Company and its subsidiaries. The location of pipelines and storage facilities near populated areas, including residential areas, commercial business centers, and industrial sites, could increase the level of damages resulting from these risks. Similar risks also exist for Spire or any of its subsidiaries becomes a partyMissouri’s propane storage, transmission and minor distribution operations. These activities may subject the Company to litigation suchor administrative proceedings. Such litigation or proceedings could result in substantial monetary judgments, fines, or penalties against the Company and its subsidiaries or be resolved on unfavorable terms. The Utilities and other Spire businesses are subject to federal and state laws and regulations requiring them to maintain certain safety and system integrity measures by identifying and managing storage and pipeline risks. Compliance with these laws and regulations, or future changes in these laws and regulations, may result in increased capital, operating and other costs which may not be recoverable in a timely manner from customers in rates. In accordance with customary practice,industry practices, the Utilities and other Spire and its subsidiariesbusinesses maintain insurance against a significant portion of, but not all, risks and losses. In addition, in the normal course of its operations, Spire and its subsidiaries may be exposed to loss from other sources, such as bad debt expense or the failure of a counterparty to meet its financial obligations. Spire and its operating companies employ many strategies to gain assurance that such risks are appropriately managed, mitigated, or insured, as appropriate. To the extent a loss is not fully covered by insurance or other risk mitigation strategies, that loss could adversely affect the Company’s and/or its subsidiaries’ financial condition and results of operations.
In connection with acquisitions, Spire Missouri and Spire Missouri recorded goodwill and long-lived assets that could become impaired and adversely affect its financial condition and results of operations.
Spire and Spire Missouri assess goodwill for impairment annually or more frequently if events or circumstances occur that would more likely than not reduce the fair value of a reporting unit below its carrying value. The Company and Spire Missouri assess their long-lived assets for impairment whenever events or circumstances indicate that an asset’s carrying amount may not be recoverable. To the extent the value of goodwill or long-lived assets becomes impaired, the Company and Spire Missouri may be required to incur impairment charges that could have a material impact on their results of operations.
Since interest rates are a key component, among other assumptions, in the models used to estimate the fair values of the Company’s reporting units, asrises in interest rates rise,would generally decrease the calculated fair values decrease and future impairments may occur. Due to the subjectivity of the assumptions and estimates underlying the impairment analysis, Spire and Spire Missouri cannot provide assurance that future analyses will not result in impairment. These assumptions and estimates include projected cash flows, current and future rates for contracted capacity, growth rates, weighted average cost of capital and market multiples. For additional information, see
Changes to income tax policy, certain tax elections, tax regulations and future taxable income could adversely impact the Company’s financial condition and results of operations.
The Company has significantly reduced its current federal and state income tax obligations over the past few years through tax planning strategies andincluding the extensionuse of bonus depreciation deductions for certain expenditures for property. As a result, the Company has generated large annual taxable losses that have resulted in significant federal and state net operating losses. The Company plans to utilize these net operating losses in the future to reduce income tax obligations. The value of these net operating losses could be reduced if the Company cannot generate enough taxable income in the future to utilize all of the net operating losses generated prior to the Tax Cuts and Jobs Act of 2017 before they expire due to lower than expected financial performance or if the Internal Revenue Service does not agree with the filing positions of the Company.
Changes to income tax policy, laws and regulations, including but not limited to changes in tax rates, the deductibility of certain expenses including interest and state and local income taxes and/or changes in the deductibility of certain expenditures for property, could adversely impact the Company. If enacted, thoseThose impacts could include reducing the value of its net operating losses and could result in material charges to earnings. Further, the Company’s financial condition and results of operations may be adversely impacted.
Spire’s pension and other postretirement benefitsbenefit plans are subject to investment and interest rate risk that could negatively impact its financial condition.
The Company and its subsidiaries have pension and other postretirement benefitsbenefit plans that provide benefits to many of their employees and retirees. Costs of providing benefits and related funding requirements of these plans are subject to changes in the market value of the assets that fund the plans. The funded status of the plans and the related costs reflected in ourthe Company’s financial statements are affected by various factors, which are subject to an inherent degree of uncertainty, including economic conditions, financial market performance, interest rates, life expectancies and demographics. Recessions and volatility in the domestic and international financial markets have negatively affected the asset values of Spire’s pension plans at various times in the past. Poor investment returns or lower interest rates may necessitate accelerated funding of the plans to meet minimum federal government requirements, which could have an adverse impact on the Company’s and its subsidiaries’ financial condition and results of operations.
The Company’s natural gas storage business includes inherent geologic and operational risks, as well as risks from competition and changes in market fundamentals.
In 2017 and 2018, the Company acquired two neighboring storage facilities, one of which had been operating in bankruptcy for an extended period. The Company has restructured to integrate these facilities into one, now known as Spire Storage, to increase capacity, improve operating performance, and improve the integrity of its storage fields and associated above-ground facilities. Any damage to the storage facility or pipelines, or lack of integrity to its storage fields, to the extent not covered by insurance, could have a material adverse effect on the Company’s financial condition, operating results and cash flows.
The Company’s storage assets are connected to third-party-owned pipelines. The continuing operation of such third-party pipelines is not within its control. If any of these pipelines become unable to transport, treat or process natural gas or natural gas liquids, or if the volumes it gathers or transports do not meet the quality requirements of such pipelines, the Company’s revenues and cash flows could be adversely affected.
The Company does not own all the land on which its storage facilities were constructed, and it is, therefore, subject to the possibility of more onerous terms or increased costs to retain necessary land use, if and when applicable property rights expire or are renewed. Changes in the terms of such land use could have an adverse impact on the financial condition, results of operations and cash flows for the Company’s storage business.
Spire Storage is subject to competition from similar services provided by pipelines and from competing independent storage providers capable of serving its customers. Natural gas storage is a competitive business, with competitors having the ability to expand storage capacity. Increased competition in the natural gas storage business could reduce the demand and drive rates down for the Company’s natural gas storage services.
Storage businesses are affected by various gas market fundamentals which impact the level of demand for storage services and the rates that can be charged for these services. These market fundamentals include: seasonal price spread; monthly, daily and hourly price volatility; locational basis for pricing points on pipelines connected to a storage facility; seasonal, daily and hourly weather; and operational impacts in supply and market areas served by a storage facility and its connected pipelines. These fundamentals have varying and potentially material adverse impacts on the various services offered by storage facilities and the rates that can be charged for these services in the market. These services include long-term firm storage, short-term park and loan, wheeling, and optimization. Rates below the variable costs to operate a storage facility could result in a decision to not operate all the capacity in the facility or to operate the facility at a loss if required to fulfill firm customer contract obligations. A sustained decline in these rates or a shut-in of all or a portion of one or more facilities’ capacity could have an adverse impact on the Company’s financial condition, results of operations and cash flows.
RISKS THAT RELATE TO THE GAS UTILITY SEGMENT
Regulation of the Utilities’ businesses may impact rates they are able to charge, costs, and profitability.
The Utilities are subject to regulation by federal, state and local authorities. At the state level, the Utilities are regulated in Missouri by the Missouri Public Service Commission (MoPSC), in Alabama by the Alabama Public Service Commission (APSC), and in Mississippi by the Mississippi Public Service Commission (MSPSC). These state public service commissions regulate many aspects of the Utilities’ distribution operations, including construction and maintenance of facilities, operations, safety, the rates the Utilities may charge customers, the terms of service to their customers, transactions with their affiliates, the rate of return they are allowed to realize, and the accounting treatment for certain aspects of their operations. For further discussion of these accounting matters, see
Regulatory Accounting underAccounting for the economics of rate regulation affects multiple financial statement line items, including property, plant, and equipment; regulatory assets and liabilities; operating revenues; and depreciation expense, and affects multiple disclosures in the Company’s financial statements. There is a risk that the state public service commissions will not approve full recovery of the costs of providing utility service or recovery of all amounts invested in the utility business and a reasonable return on that investment. A material disallowance of deferred costs could adversely affect the Utilities’ results of operations.
The MoPSC also approves Spire Missouri’s Infrastructure System Replacement Surcharge (ISRS). The ISRS allows Spire Missouri expedited recovery for its investment to upgrade its infrastructure and enhance its safety and reliability without the necessity of a formal rate case. Such investments are subject to review, and there is risk that any material disallowance of costs under ISRS could adversely affect the timing of revenues.
The Utilities’ ability to obtain and timely implement rate increases and rate supplements to maintain the current rate of return is subject to regulatory review and approval. There can be no assurance that they will be able to obtain rate increases or rate supplements or continue earning the current authorized rates of return. Spire Alabama’s and Spire Gulf’s rate setting process, Rate Stabilization and Equalization (RSE), is subject to regulation by the APSC and is implemented pursuant to an APSC order that will continue beyondorders expiring September 30, 20182022 and September 30, 2021, respectively,respectively. RSE adjustments would continue after those dates unless the APSC enters an order to the contrary in a manner consistent with the law. Spire Mississippi is subject to regulation by the MSPSC and utilizes the Rate Stabilization Adjustment (RSA) Rider. For further details, see Note 15, Regulatory and Other Matters, of the Notes to Financial Statements in Item 7.
The Utilities could incur additional costs if required to adjust to new laws or regulations, revisions to existing laws or regulations or changes in interpretations of existing laws or regulations such as the Dodd-Frank Act.regulations. In addition, as the regulatory environment for the natural gas industry increases in complexity, the risk of inadvertent noncompliance could also increase. If the Utilities fail to comply with applicable laws and regulations, whether existing or new, they could be subject to fines, penalties or other enforcement action by the authorities that regulate the Utilities’ operations.
The Utilities’ ability to meet their customers’ natural gas requirements may be impaired if contracted gas supplies, interstate pipeline and/or storage services are not available or delivered in a timely manner.
In order to meet their customers’ annual and seasonal natural gas demands, the Utilities must obtain sufficient supplies, interstate pipeline capacity, and storage capacity. If they are unable to obtain these, either from their suppliers’ inability to deliver the contracted commodity or the inability to secure replacement quantities, to the extent not mitigated by tariffs, contractual indemnification or insurance, the Utilities’ financial condition and results of operations may be adversely impacted. If a substantial disruption in interstate natural gas pipelines’ transmission and storage capacity were to occur during periods of heavy demand, the Utilities’ financial results could be adversely impacted.
In particular, the natural gas supply provided to Spire Missouri by Spire STL Pipeline is currently at risk due to the order issued by the U.S. Court of Appeals for the District of Columbia Circuit vacating the Spire STL Pipeline’s Certificate of Public Convenience and Necessity previously issued by the FERC and remanding the matter back to the FERC for further action. In the event this pipeline is taken out of service, either temporarily or permanently, Spire Missouri’s ability to secure new pipeline contracts on other systems serving the region may be significantly constrained, and Spire Missouri would not be able to replace that supply based on similar terms or at all over the short term based on current market and operating conditions. In the event that the Spire STL Pipeline is unavailable and an extreme weather event occurs, Spire Missouri would face heightened risks, including service outages and other disruptions; the need for service restoration, creating hazards for Spire Missouri, its employees, and its customers; the potential for loss of life and property in its service territory; and associated exposure to litigation or administrative proceedings. If this pipeline is taken out of service, Spire Missouri may need to design, construct, and place in service new facilities or modify existing facilities in order to receive gas from alternate sources, giving rise to additional regulatory and business risks and hazards.
Spire Missouri will continue to pursue all legal and regulatory avenues to ensure access to reliable, affordable and safe delivery of energy for eastern Missouri. If Spire Missouri is unable to obtain sufficient pipeline capacity to meet its customers’ annual and seasonal natural gas demands, Spire Missouri’s financial condition and results of operations may be adversely impacted which could result in a material adverse effect on the Company’s financial condition and operating results.
The Utilities are involved in legal or administrative proceedings before various courts and governmental bodies that could adversely affect their results of operations, cash flows and financial condition.
The Utilities are involved in legal or administrative proceedings before various courts and governmental bodies with respect to general claims, rates, environmental issues, gas cost prudence reviews and other matters. For further details, see Contingencies in Note 1516 to the financial statements in Item 8. Adverse decisions regarding these matters, to the extent they require the Utilities to make payments in excess of amounts provided for in their financial statements, or to the extent they are not covered by insurance, could adversely affect the Utilities’ results of operations, cash flows and financial condition.
The Utilities’ liquidity may be adversely affected by delays in recovery of their costs, due to regulation.
In the normal course of business, there is a lag between when the Utilities incur increases in certain of their costs and the time in which those costs are considered for recovery in the ratemaking process. Cash requirements for increased operating costs, increased funding levels of defined benefit pension and postretirement costs, capital expenditures, and other increases in the costs of doing business can require outlays of cash prior to the authorization of increases in rates charged to customers, as approved by the MoPSC, APSC, and MSPSC. Accordingly, the Utilities’ liquidity can be adversely impacted to the extent higher costs are not timely recovered from their customers.
The Utilities’ liquidity and, in certain circumstances, the Utilities’ results of operations may be adversely affected by the cost of purchasing natural gas during periods in which natural gas prices are rising significantly.
The tariff rate schedules of theSpire Missouri, Utilities, Spire Gulf and Spire Mississippi contain Purchased Gas Adjustment (PGA) clauses and Spire Alabama’s tariff rate schedule contains a Gas Supply Adjustment (GSA) rider that permit the Utilities to file for rate adjustments to recover the cost of purchased gas. Changes in the cost of purchased gas are flowed through to customers and may affect uncollectible amounts and cash flows and can therefore impact the amount of capital resources.
Currently, theSpire Missouri Utilities areis allowed to adjust the gas cost component of rates up to four times each year while Spire Alabama and Spire Gulf (collectively, the Alabama Utilities)“Alabama Utilities”) and Spire Mississippi may adjust the gas cost component of their rates on a monthly basis. TheSpire Missouri Utilities must make a mandatory gas cost adjustment at the beginning of the winter, in November, and during the next twelve months may make up to three additional discretionary gas cost adjustments, so long as each of these adjustments is separated by at least two months.
The MoPSC typically approves the Spire Missouri Utilities’ PGA changes on an interim basis, subject to refund and the outcome of a subsequent audit and prudence review. Due to such review process, there is a risk of a disallowance of full recovery of these costs. Any material disallowance of purchased gas costs would adversely affect revenues.results of operations. The Alabama Utilities’ gas supply charges are submitted for APSC review on a monthly basis, regardless of whether there is a request for a change, so prudence review occurs on an ongoing basis. Spire Mississippi’s PGA is adjusted on a monthly basis for the most recent charges and is filed at the MSPSC on a monthly basis.
Increases in the prices the Utilities charge for gas may also adversely affect revenues because they could lead customers to reduce usage and cause some customers to have trouble paying the resulting higher bills. These higher prices may increase bad debt expenses and ultimately reduce earnings. Rapid increases in the price of purchased gas may result in an increase in short-term debt.
To lower financial exposure to commodity price fluctuations, Spire Missouri enters into contracts to hedge the forward commodity price of its natural gas supplies. As part of this strategy, Spire Missouri may use fixed-price forward physical purchase contracts, swaps, futures, and option contracts. However, Spire Missouri does not hedge the entire exposure of energy assets or positions to market price volatility, and the coverage will vary over time. Any costs, gains, or losses experienced through hedging procedures, including carrying costs, generally flow through the PGA clause, thereby limiting the Missouri Utilities’Spire Missouri’s exposure to earnings volatility. However, variations in the timing of collections of such gas costs under the PGA clause and the effect of cash payments for margin deposits associated with the Missouri Utilities’Spire Missouri’s use of natural gas derivative instruments may cause short-term cash requirements to vary. These procedures remain subject to prudence review by the MoPSC.
Other than fixed-price forward physical purchase contracts, Spire Alabama currently does not utilize risk mitigation strategies that incorporate commodity hedge instruments but has the ability to do so through its GSA. Spire Gulf hedgesand Spire Mississippi typically hedge a portion of their gas supply for up to 30 months in advance, and Spire Mississippi utilizes hedging for the upcoming heating season.
Environmental laws and regulations may require significant expenditures or increase operating costs.
The Utilities are subject to federal, state and local environmental laws and regulations affecting many aspects of their present and future operations. These laws and regulations require the Utilities to obtain and comply with a wide variety of environmental licenses, permits, inspections, and approvals. Failure to comply with these laws and regulations and failure to obtain any required permits and licenses may result in costs to the Utilities in the form of fines, penalties or business interruptions, which may be material. In addition, existing environmental laws and regulations could be revised or reinterpreted and/or new laws and regulations could be adopted or become applicable to the Utilities or their facilities, thereby impacting the Utilities’ cost of compliance. The discovery of presently unknown environmental conditions, including former manufactured gas plant sites, and claims against the Utilities under environmental laws and regulations may result in expenditures and liabilities, which could be material. To the extent environmental compliance costs are not fully covered by insurance or recovered in rates from customers, those costs may have an adverse effect on the Utilities’ financial condition and results of operations.
The Utilities’ business activities are concentrated in three states.
The Utilities are subjectprovide natural gas distribution services to pipeline safetycustomers in Alabama, Mississippi, and system integrity lawsMissouri. Changes in the regional economies, politics, regulations and regulations that may require significant expenditures or significant increases in operating costs.
The Utilities may be adversely affected by economic conditions.
Periods of slowed economic activity generally result in decreased energy consumption, particularly by industrial and resultslarge commercial companies, a loss of operations.
Because of the highly competitive nature of its business,competition, the Utilities may not be able to retain existing customers or acquire new customers, which could have an adverse impact on their business, operating results and financial condition.
The Utilities face the risk that larger commercial or industrial customers may bypass gas distribution services by gaining distribution directly from interstate pipelines or, in the case of Spire Alabama and Spire Gulf, also from municipally or publicly owned gas distributors located adjacent to its service territory. The Utilities cannot provide any assurance that increased competition or other changes in legislation, regulation or policies will not have a material adverse effect on their business, financial condition or results of operations.
The Utilities compete with distributors offering a broad range of services and prices, from full-service distributors to those offering delivery only. The Utilities also compete for retail customers with suppliers of alternative energy products, principally propane and electricity. If they are unable to compete effectively, the Utilities may lose existing customers and/or fail to acquire new customers, which in the aggregate could have a material adverse effect on their business, operating results and financial condition.
Changes in the wholesale costs of purchased natural gas supplies may adversely impact the Utilities’ competitive position compared with alternative energy sources.
Changes in wholesale natural gas prices compared with prices for electricity, fuel oil, coal, propane, or other energy sources may affect the Utilities’ retention of natural gas customers and may adversely impact their financial condition and results of operations.
Significantly warmer-than-normal weather conditions, the effects of climate change, legislative and regulatory initiatives in response to climate change or in support of increased energy efficiency, and other factors that influence customer usage may affect the Utilities’ sale of heating energy and adversely impact their financial position and results of operations.
The Utilities’ earnings are primarily generated by the sale of heating energy. TheSpire Missouri Utilitiesand Spire Mississippi each have weather mitigation rate designs and thea Weather Normalization Adjustment rider, Spire Alabama Utilities havehas a Temperature Adjustment Riders (TARs), each of which isRider, and Spire Gulf has a Weather Impact Normalization Factor. These mechanisms, approved by the respective state regulatory body, which provide better assurance of the recovery of fixed costs and margins during winter months despite variations in sales volumes due to the impacts of weather, while the annual rate designs of Alabama and Mississippi help adjust for other factors that affect customer usage. However, significantly warmer-than-normal weather conditions in the Utilities’ service areas and other factors, such as climate change, alternative energy sources and increased efficiency of gas furnaces and other appliances, may result in reduced profitability and decreased cash flows attributable to lower gas sales. Furthermore, continuation of the weather mitigation rate design at Spire Missouri East, the rate design whereby distribution costs are recovered predominantly through fixed monthly charges at Spire Missouri West, or the RSE at Spire Alabama and Spire Gulf, arethese adjustment factors is subject to regulatory discretion.
In addition, legislative and regulatory initiatives by the federal, state and local governments addressing greenhouse gas emissions or restricting the use of natural gas could adversely affect customer demand. The promulgation of regulations by the U. S. Environmental Protection Agency (EPA), particularly those regulatingof the emissions of greenhouse gases and by the U. S. Department of Energy supporting higher efficiency for residential gas furnaces and other gas appliances or the potential enactment of congressional legislation addressing global warming and climate change may decrease customer usage, encourage fuel switching from gas to other energy forms, and may result in future additional compliance costs that could impact the Utilities’ financial conditions and results of operations.
Regional supply/demand fluctuations and changes in national infrastructure, as well as regulatory discretion, may adversely affect the Missouri Utilities’ ability to profit from off-system sales and capacity release.
Spire Missouri’s and Spire Alabama’s income from off-system sales and capacity release is subject to fluctuations in market conditions and changing supply and demand conditions in areas the Missouri Utilities hold pipeline capacity rights. Specific factors impacting the Missouri Utilities’ income from off-system sales and capacity release include the availability of attractively-pricedattractively priced natural gas supply, availability of pipeline capacity, and market demand. Income from off-system sales and capacity release is shared with customers. TheSpire Missouri Utilitiesand Spire Alabama are allowed to retain 15% to 25% of the first $6.0 in annual income earned (depending on the levelnet margins achieved as a result of income earned)such off-system sales and 30% of income exceeding $6.0 annually. In accordance with an agreement approved by the MoPSC, Spire Missouri East deferred, until fiscal 2017, its ability to retain 15% of the first $2.0. Spire Missouri West is allowed to retain 15% to 25% of the first $3.6 in annual income earned (depending on the level of income earned) and 30% of income exceeding $3.6 annually.capacity releases. The Missouri Utilities’ ability to retain such income in the future is subject to regulatory discretion in a base rate proceeding.
RISKS THAT RELATE TO THE GAS MARKETING SEGMENT
Increased competition, fluctuations in natural gas commodity prices, expiration of supply and transportation arrangements, and infrastructure projects may adversely impact the future profitability of Gas Marketing.
Competition in the marketplace and fluctuations in natural gas commodity prices have a direct impact on the Gas Marketing business. Changing market conditions and prices, the narrowing of regional and seasonal price differentials and limited future price volatility may adversely impact its sales margins or affect its ability to procure gas supplies and/or to serve certain customers, which may reduce sales profitability and/or increase certain credit requirements caused by reductions in netting capability. Also, Gas Marketing profitability may be impacted by the effects of the expiration, in the normal course of business, of certain of its natural gas supply contracts if those contracts cannot be replaced and/or renewed with arrangements with similar terms and pricing. Although the FERC regulates the interstate transportation of natural gas and establishes the general terms and conditions under which Spire Marketing may use interstate gas pipeline capacity to purchase and transport natural gas, itSpire Marketing must occasionally renegotiate its transportation agreements with a concentrated group of pipeline companies. Renegotiated terms of new agreements, or increases in FERC-authorized rates of existing agreements, may impact Gas Marketing’s future profitability. Profitability may also be adversely impacted if pipeline capacity or future storage capacity secured is not fully utilized and/or its costs are not fully recovered.utilized.
Reduced access to credit and/or capital markets may prevent the Gas Marketing business from executing operating strategies.
The Gas Marketing segment relies on its cash flows, ability to effect net settlements with counterparties, parental guarantees,guaranties, and access to Spire’s liquidity resources to satisfy its credit and working capital requirements. Spire Marketing’s ability to rely on parental guaranteesguaranties is dependent upon Spire’s financial condition and credit ratings. If Spire’s credit ratings were lowered, particularly below investment grade, counterparty acceptance of parental guaranteesguaranties may diminish, resulting in decreased availability of credit. Additionally, under such circumstances, certain counterparties may require Spire Marketing to provide prepayments or cash deposits, amounts of which would be dependent upon natural gas market conditions. Reduced access to credit or increased credit requirements, which may also be caused by factors such as higher overall natural gas prices, may limit Spire Marketing’s ability to enter into certain transactions. In addition, Spire Marketing has concentrations of counterparty credit risk in that a significant portion of its transactions are with (or are associated with) energy producers, utility companies, and pipelines. These concentrations of counterparties have the potential to affect the Company’s overall exposure to credit risk, either positively or negatively, in that each of these three groups may be affected similarly by changes in economic, industry, or other conditions. Spire Marketing also has concentrations of credit risk in certain individually significant counterparties. Spire Marketing closely monitors its credit exposure and, although uncollectible amounts have not been significant, increased counterparty defaults are possible and may result in financial losses and/or capital limitations.
Risk management policies, including the use of derivative instruments, may not fully protect GasSpire Marketing’s sales and results of operations from volatility and may result in financial losses.
In the course of its business, Spire Marketing enters into contracts to purchase and sell natural gas at fixed prices and index-based prices. Commodity price risk associated with these contracts has the potential to impact earnings and cash flows. To minimize this risk, Spire Marketing has a risk management policy that provides for daily monitoring of a number of business measures, including fixed price commitments.
Spire Marketing currently manages the commodity price risk associated with fixed-price commitments for the purchase or sale of natural gas by either closely matching the offsetting physical purchase or sale of natural gas at fixed prices or through the use of natural gas futures, options, and swap contracts traded on or cleared through the New York Mercantile Exchange, Inc. (NYMEX) andand/or the Intercontinental Exchange (ICE) to lock in margins. These exchange-traded/cleared contracts may be designated as cash flow hedges of forecasted transactions. However, market conditions and regional price changes may cause ineffective portions of matched positions to result in financial losses. Additionally, to the extent that Spire Marketing’s natural gas contracts are classified as trading activities or do not otherwise qualify for the normal purchases or normal sales designation (or the designation is not elected), the contracts are recorded as derivatives at fair value each period. Accordingly, the associated gains and losses are reported directly in earnings and may cause volatility in results of operations. Gains or losses (realized and unrealized) on certain wholesale purchase and sale contracts, consisting of those classified as trading activities, are required to be presented on a net basis (instead of a gross basis) in the statements of consolidated income. Such presentation could result in volatility in the Company’s operating revenues.
As a natural gas market participant, Spire Marketing is subject to applicable FERC- and Commodity Futures Trading Commission (CFTC)-administered statutes, rules, regulations and orders, including those directed generally to prevent manipulation of or fraud involving natural gas physical transactions and financial instruments, such as futures, options and swaps. Spire Marketing could be subject to substantial penalties and fines by the FERC or CFTC, or both, for failure to comply with such rules.
Spire Marketing’s ability to meet its customers’ natural gas requirements may be impaired if contracted gas supplies and interstate pipeline services are not available or delivered in a timely manner.
Spire Marketing’s ability to deliver natural gas to its customers is contingent upon the ability of natural gas producers, other gas marketers, and interstate pipelines to fulfill delivery obligations to Spire Marketing under firm contracts. If these counterparties fail to perform, they have a contractual obligation to reimburse Spire Marketing for adverse consequences. Spire Marketing will attempt to use such reimbursements to obtain the necessary supplies so that it may fulfill its customer obligations. To the extent that it is unable to obtain the necessary supplies, Spire Marketing’s financial position and results of operations may be adversely impacted.
Regulatory and legislative developments pertaining to the energy industry may adversely impact SpireGas Marketing’s results of operations, financial condition and cash flows.
The SpireGas Marketing business is non-regulated, in that the rates it charges its customers are not currently established by or subject to approval by any regulatory body with jurisdiction over utilities.its business. However, it is subject to various laws and regulations affecting the energy industry. New regulatory and legislative actions may adversely impact SpireGas Marketing’s results of operations, financial condition, and cash flows by potentially reducing customer growth opportunities and/or increasing the costs of doing business.
Gas Marketing incurs additional costs to comply with new lawsuses bilateral contracts and regulations,derivative instruments such as the Dodd-Frank Act amendments to the Commodity Exchange Act, which authorizes the Commodity Futures Trading Commission (the CFTC) to regulate futures contracts, options and swaps. These derivative transactions include instruments and bilateral contracts that Spire Marketing usesswaps to hedge or mitigate ongoing commercial risks. TheMost standardized swaps, under the Dodd-Frank Act, contemplates that most standardized swaps will beare required to be cleared through a registered clearing facility and traded on a designated exchange or swap execution facility, subject to certain exceptions. In addition, the CFTC’s rules require companies, includeincluding Spire Marketing, to maintain regulatory records of swap transactions, and to report swaps to centralized swap data repositories, (SDRs), among other new compliance obligations. Although Spire Marketing may qualify for exceptions to certain of the newthese CFTC rules, its derivatives counterparties will beare subject to new capital, margin, documentation and business conduct requirements imposed as a result of the Dodd-Frank Act. Such new rules willThese obligations may increase transaction costs and may make it more difficult for Spire Marketing to enter into hedging transactions on favorable terms or affect the number and/or creditworthiness of available swap counterparties. The full impact of the new CFTC requirements will not be known definitively until all of the Dodd-Frank Act regulations have been finalized and fully implemented. Spire Marketing’s inability to enter into derivatives instruments or other commercial risk hedging transactions on favorable terms, or at all, could increase operating expenses and expose it to unhedged commercial risks, including potential adverse changes in commodity prices.
In October 2020, the CFTC finalized its rules that modify and expand the applicability of speculative position limits on the amounts of certain futures contracts (including options thereon), cash-settled “lookalike” contracts for or linked to the commodities underlying the foregoing futures contracts, as well as economically equivalent swaps containing “identical material” contractual specifications, terms and conditions as the foregoing contracts. While Spire Marketing anticipates qualifying for a bona fide hedging exemption from such limits, the CFTC’s final rules and earlier adopted aggregation rules may cause Spire Marketing’s hedging strategies described above to be limited if Spire Marketing is unable to qualify for an exemption.
GENERAL RISK FACTORS
Unexpected losses may adversely affect Spire’s or its subsidiaries’ financial condition and results of operations.
As with most businesses, there are operations and business risks inherent in the activities of Spire’s subsidiaries. If, in the normal course of business, Spire or any of its subsidiaries becomes a party to litigation, such litigation could result in substantial monetary judgments, fines, or penalties or be resolved on unfavorable terms. In accordance with customary practice, Spire and its subsidiaries maintain insurance against a significant portion of, but not all, risks and losses. In addition, in the normal course of its operations, Spire and its subsidiaries may be exposed to loss from other sources, such as bad debt expense or the regulatory environment forfailure of a counterparty to meet its financial obligations. Spire and its operating companies employ many strategies to gain assurance that such risks are appropriately managed, mitigated, or insured, as appropriate. To the extent a loss is not fully covered by insurance or other risk mitigation strategies, that loss could adversely affect the Company’s and/or its subsidiaries’ financial condition and results of operations.
Increased dependence on technology may hinder Spire’s and its subsidiaries’ business operations and adversely affect their financial condition and results of operations if such technologies fail.
Spire and its subsidiaries have implemented or acquired a variety of technological tools including both Company-owned information technology and technological services provided by outside parties. These tools and systems support critical functions including Spire and its subsidiaries’ integrated planning, scheduling and dispatching of field resources, its automated meter reading system, customer care and billing, procurement and accounts payable, operational plant logistics, management reporting, and external financial reporting. The failure of these or other similarly important technologies, or the Company’s or its subsidiaries’ inability to have these technologies supported, updated, expanded, or integrated into other technologies, could hinder their business operations and, to the extent not covered by insurance, could adversely impact their financial condition and results of operations.
Although the Company and its subsidiaries have, when possible, developed alternative sources of technology and built redundancy into their computer networks and tools, there can be no assurance that these efforts to date would protect against all potential issues related to the loss of any such technologies or the Utilities’ use of such technologies.
A cyberattack may disrupt Spire’s operations or lead to a loss or misuse of confidential and proprietary information or potential liability.
The Company and its subsidiaries are subject to cybersecurity risks primarily related to breaches of security pertaining to sensitive customer, employee, and vendor information maintained by the Company, its subsidiaries, or its third-party vendors in the normal course of business, as well as breaches in the technology that manages natural gas industrydistribution operations and other business processes. A loss of confidential or proprietary data or security breaches of technology for operations or business processes could adversely affect the Company’s and its subsidiaries’ reputation, diminish customer confidence, disrupt operations, and subject the Company and its subsidiaries to possible financial liability, any of which could have a material effect on the Company’s and its subsidiaries’ financial condition and results of operations.
The Company acknowledges that increased dependence on technology increases in complexity,the Company’s exposure to cyberattack. The Company and its subsidiaries closely monitor both preventive and detective measures to manage these risks and maintain cyber risk insurance to mitigate a significant portion, but not all, of these risks and losses. To the extent that the occurrence of any of these cyber events is not fully covered by insurance, it could adversely affect the Company’s and its subsidiaries’ financial condition and results of operations.
Workforce risks may affect the Company’s financial results.
The Company and its subsidiaries are subject to various workforce risks, including, but not limited to, the risk that it will be unable to attract and retain qualified personnel; that it will be unable to effectively transfer to new personnel the knowledge and expertise of inadvertent noncompliancean aging workforce as those workers retire; and that it will be unable to reach collective bargaining arrangements with the unions that represent certain of its workers, which could also increase. Ifresult in work stoppages.
Resources expended to pursue or integrate business acquisitions, investments or other business arrangements may adversely affect Spire’s financial position and results of operations and return on investments made may not meet the Company’s expectations.
From time to time, Spire may seek to grow through strategic acquisitions, investments or other business failsarrangements. Attractive acquisition and investment opportunities may be difficult to complycomplete on economically acceptable terms. It is possible for Spire to expend considerable resources pursuing acquisitions and investments but, for a variety of reasons, decide not to move forward. Similarly, investment opportunities may be hindered or halted by regulatory or legal actions. To the extent that acquisitions or investments are made, such transactions involve a number of risks, including but not limited to, the assumption of material liabilities, the diversion of management’s attention from daily operations, difficulties in assimilation and retention of employees, securing adequate capital to support the transaction, and regulatory approval. Uncertainties exist in assessing the value, risks, profitability, and liabilities associated with applicable lawscertain businesses or assets and regulations, whether existingthere is a possibility that anticipated operating and financial efficiencies expected to result from an acquisition or new ones,investment do not develop. Additionally, there are no assurances that resources expended will achieve their intended result.
The failure to complete an acquisition successfully or to integrate acquisitions or investments it may undertake could behave an adverse effect on the Spire’s financial condition and results of operations and the market’s perception of the Company’s execution of its strategy. To the extent Spire engages in any of the above activities together with or through one or more of its subsidiaries, including the Utilities, such subsidiaries may face the same risks.
Changes in accounting standards may adversely impact the Company’s financial condition and results of operations.
Spire and its subsidiaries are subject to fines, penaltieschanges in U.S. generally accepted accounting principles (GAAP), SEC regulations and other interpretations of financial reporting requirements for public utilities. Neither the Company nor any of its subsidiaries have any control over the impact these changes may have on their financial condition or results of operations nor the timing of such changes. The potential issues associated with rate-regulated accounting, along with other potential changes to GAAP that the U.S. Financial Accounting Standards Board (FASB) continues to consider may be significant.
Catastrophic events may adversely affect the Company’s facilities and operations.
Catastrophic events such as fires, earthquakes, explosions, floods, tornadoes, hurricanes, tropical storms, terrorist acts, acts of civil unrest, pandemic illnesses or other enforcement action bysimilar occurrences could adversely affect the authoritiesUtilities’ facilities and operations, as well as those of Spire STL Pipeline and Spire Storage. The Utilities have emergency planning and training programs in place to respond to events that regulatecould cause business interruptions. However, unanticipated events or a combination of events, failure in resources needed to respond to events, or slow or inadequate response to events may have an adverse impact on the operations, financial condition, and results of operations of the Company and its operations.
Item 1B. Unresolved Staff Comments
None.
Item 2. Properties
Spire
Refer to the information below about the principal properties of Spire Missouri and Spire Alabama. The Spire EnergySouth utilities own approximately 5,500 miles of pipelines. Other properties of Spire and its subsidiaries including Spire Marketing and Spire EnergySouth, do not constitute a significant portion of its properties. The current leases for office space in downtown St. Louis commenced in early 2015, with terms ranging from 10 to 20 years, with multiple renewal options. For further information on leases see
Spire Missouri
The principal properties of Spire Missouri consist of its gas distribution system, which includes more than 30,00031,000 miles of main and related service lines, odorization and regulation facilities, and customer meters. The mains and service lines are located in municipal streets or alleys, public streets or highways, or on lands of others for which we haveSpire Missouri has obtained the necessary legal rights to place and operate ourits facilities on such property. Spire Missouri has an underground natural gas storage facility, several operating centers, and other related properties. Substantially all of Spire Missouri’s utility plant is subject to the liens of its mortgage. All the properties of Spire Missouri are held in fee, or by easement, or under lease agreements. The principal lease agreements include underground storage rights that are of indefinite duration.
Spire Alabama
The properties of Spire Alabama consist primarily of its gas distribution system, which includes approximately 23,000more than 24,000 miles of main and related service lines, odorization and regulation facilities, and customer meters. The mains and service lines are located in municipal streets or alleys, public streets or highways, or on lands of others for which we haveSpire Alabama has obtained the necessary legal rights to place and operate ourits facilities on such property. Spire Alabama also has four LNG facilities, several operating centers, and other related properties. All of the properties of Spire Alabama are held in fee, or by easement, or under lease agreements.
Item 3. Legal Proceedings
For a description of pending regulatory matters of Spire, see
Note 15, Regulatory Matters, of the Notes to Financial Statements in Item 8. For a description of environmental and other legal matters, see Contingencies in Note 16Item 4. Mine Safety Disclosures
Not applicable.
INFORMATION ABOUT OUR EXECUTIVE OFFICERS OF THE REGISTRANT
Name | Age | |||
Position with Company (1) | Appointed (2) | |||
S. Sitherwood | 61 | |||
President and Chief Executive Officer | February 2012 | |||
Chairman of the Board, | January 2015 | |||
Chairman of the Board, | September 2014 | |||
S. L. Lindsey | 55 | |||
Executive Vice President, Chief Operating Officer | January 2020 | |||
Executive Vice President, Chief Executive Officer of Gas Utilities and | October 2012 | |||
Chief Executive Officer, Spire Missouri | December 2018 | |||
President and Chief Executive Officer, Spire Missouri | January 2015 | |||
Chief Executive Officer, Spire Alabama | September 2014 | |||
S. P. Rasche | 61 | |||
Executive Vice President and Chief Financial Officer | November 2013 | |||
Chief Financial Officer, Spire Missouri (until January 2020) | May 2012 | |||
Chief Financial Officer, Spire Alabama (until January 2020) | September 2014 | |||
M. C. Darrell | 63 | Senior Vice President, Chief | May 2012 | |
M. C. Geiselhart | 62 | Senior Vice President, | January 2015 | |
S. B. Carter (3) | 49 | |||
Senior Vice President, | January 2019 | |||
Senior Vice President, | January | |||
President, | ||||
December 2018 |
(1) | The information provided relates to the Company and its principal subsidiaries. Many of the executive officers have served or currently serve as officers or directors for other subsidiaries of the Company. |
(2) | Officers of Spire are normally reappointed by |
(3) | Mr. |
PART II
Item 5. Market for Registrant’s Common Equity, Related Stockholder Matters, and Issuer Purchases of Equity Securities
Spire
Spire’s common stock trades on The New York Stock Exchange (NYSE) under the symbol “SR.” The high and the low sales price for the common stock for each quarter in the two most recent fiscal years were:
| 2017 | 2016 | ||||||||||||||
| High | Low | High | Low | ||||||||||||
| 1st Quarter | $ | 66.65 | $ | 59.54 | $ | 61.04 | $ | 53.86 | |||||||
| 2nd Quarter | 68.30 | 62.33 | 68.79 | 57.10 | |||||||||||
| 3rd Quarter | 72.83 | 63.84 | 70.87 | 61.00 | |||||||||||
| 4th Quarter | 78.00 | 68.30 | 71.21 | 61.96 | |||||||||||
Dividends declaredare payable on the Company’s common stock at the discretion of its Board of Directors (the “Board”). Spire, and Spire Missouri prior to the holding company’s formation in 2000, has paid common stock dividends continuously since 1946, with 2021 marking the 18th consecutive year of increasing dividends on an annualized basis. Although the Board expects to continue paying dividends on the common stock for the two most recent fiscal years were:
| 2017 | 2016 | ||||||
| 1st Quarter | $ | 0.525 | $ | 0.49 | |||
| 2nd Quarter | 0.525 | 0.49 | |||||
| 3rd Quarter | 0.525 | 0.49 | |||||
| 4th Quarter | 0.525 | 0.49 | |||||
Performance Graph
COMPARISON OF FIVE-YEAR CUMULATIVE TOTAL RETURN*
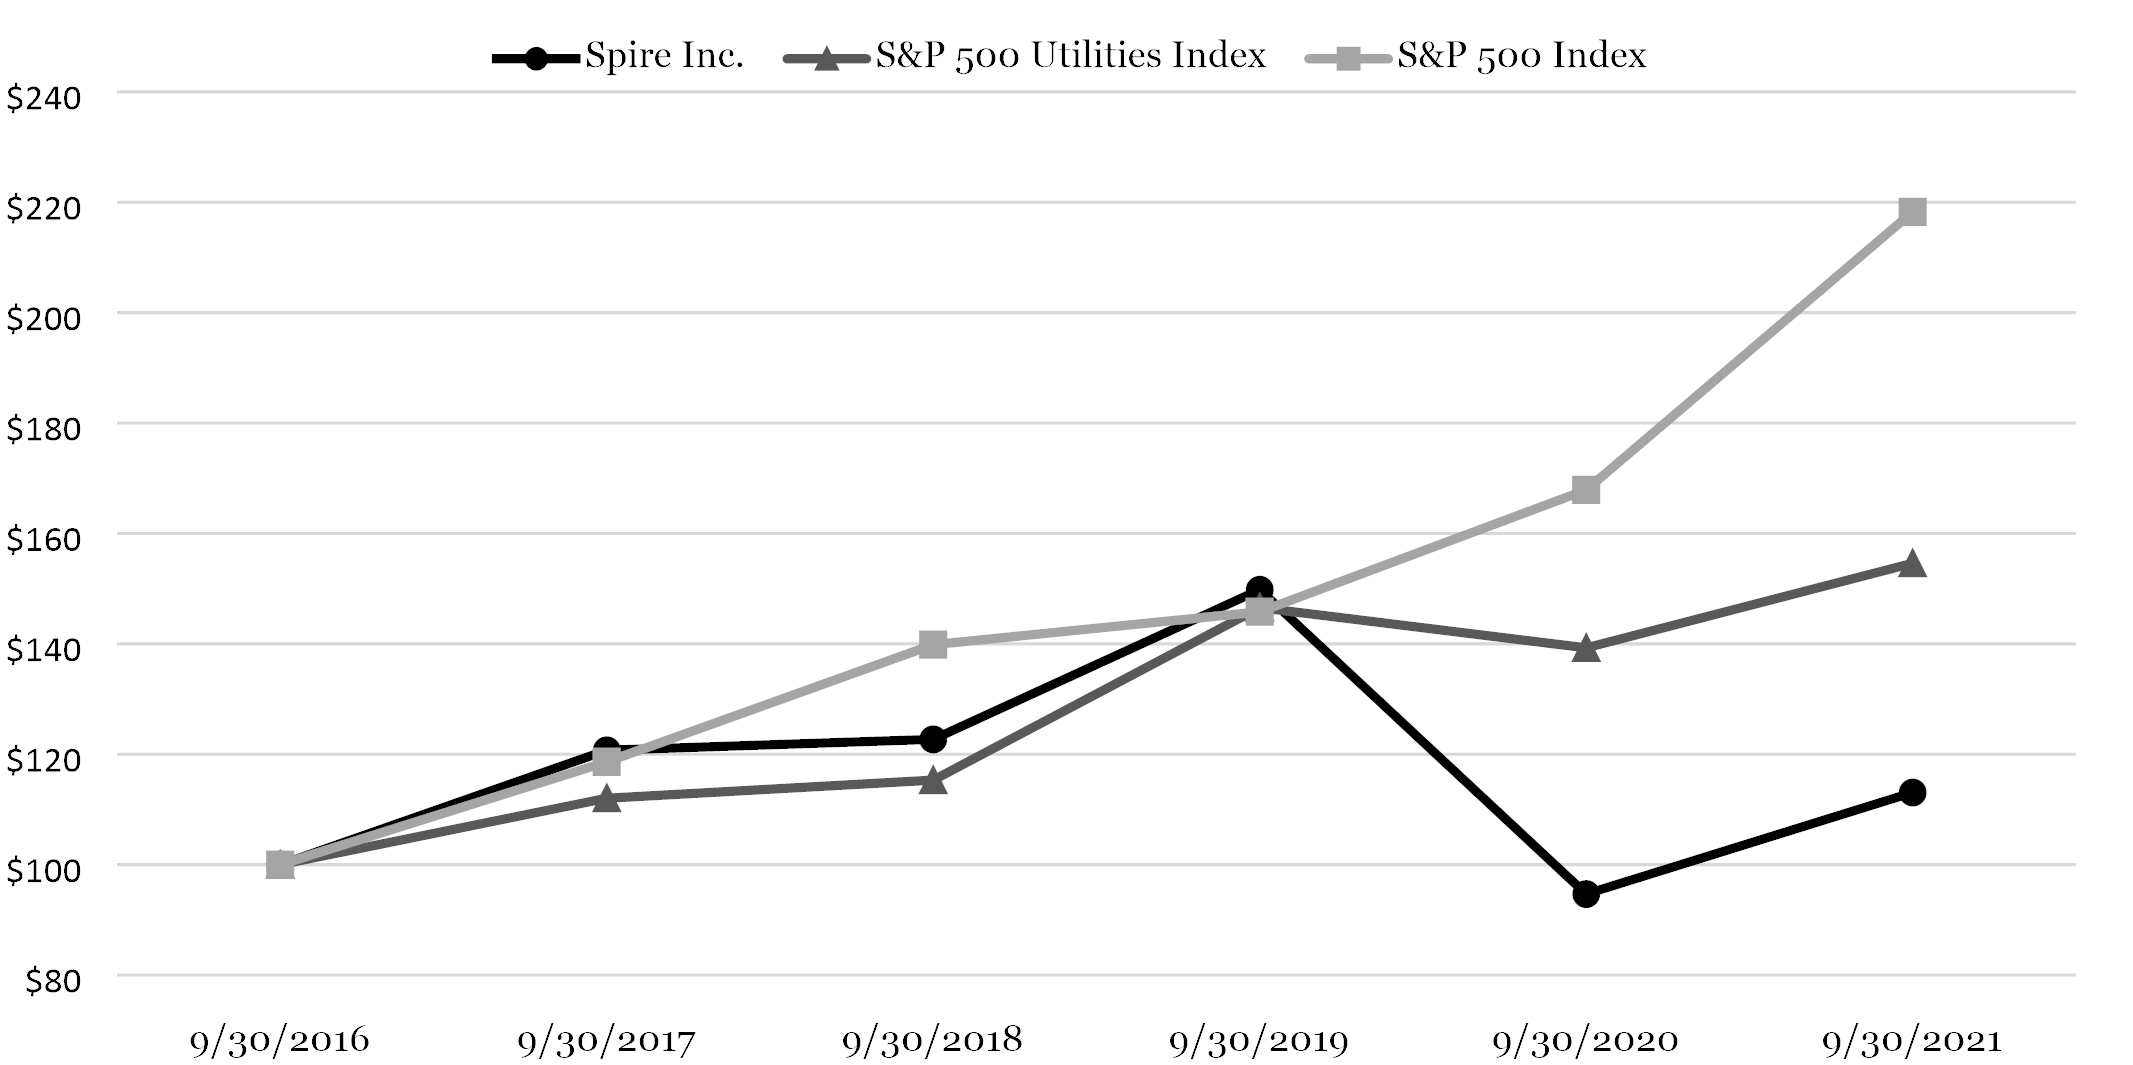
September 30 |
| 2016 |
| 2017 |
| 2018 |
| 2019 |
| 2020 |
| 2021 |
| ||||||
Spire Inc. |
| $ | 100.00 |
| $ | 120.72 |
| $ | 122.70 |
| $ | 149.82 |
| $ | 94.67 |
| $ | 113.07 |
|
S&P 500 Utilities Index |
|
| 100.00 |
|
| 112.03 |
|
| 115.31 |
|
| 146.56 |
|
| 139.28 |
|
| 154.61 |
|
S&P 500 Index |
|
| 100.00 |
|
| 118.61 |
|
| 139.85 |
|
| 145.80 |
|
| 167.89 |
|
| 218.26 |
|
* | Cumulative total return is based on a $100 investment on September 30, 2016, assuming reinvestment of dividends. |
The S&P 500 Utilities Index is comprised of 28 utilities heavily weighted to large capitalization (median market cap of $21.6 billion) electric utilities. Stocks of small and mid cap electric utilities and gas utility companies in 2017 and 2016, totaling $2.10 per share and $1.96 per share, respectively.
For disclosures related to securities authorized for issuance under equity compensation plans, see
Note 3, Stock-Based Compensation, of the Notes to Financial Statements in ItemDuring the three months ended September 30, 2017,2021, the only repurchases of ourthe Company’s common stock waswere pursuant to elections by employees to have shares of stock withheld to cover employee tax withholding obligations upon the vesting of performance-based and time-vested restricted stock and stock units. The following table provides information on those repurchases:
Period |
| (a) Total Number of Shares Purchased |
|
| (b) Average Price Paid Per Share |
|
| (c) Total Number of Shares Purchased as Part of Publicly Announced Plans or Programs |
|
| (d) Maximum Number of Shares that May Yet be Purchased Under the Plans or Programs |
| ||||
July 1, 2021 - July 31, 2021 |
|
| 1,054 |
|
| $ | 72.01 |
|
|
| — |
|
|
| — |
|
August 1, 2021 - August 31, 2021 |
|
| 40 |
|
|
| 72.27 |
|
|
| — |
|
|
| — |
|
September 1, 2021 - September 30, 2021 |
|
| 392 |
|
|
| 65.14 |
|
|
| — |
|
|
| — |
|
Total |
|
| 1,486 |
|
| $ | 70.20 |
|
|
| — |
|
|
| — |
|
| Period | (a) Total Number of Shares Purchased | (b) Average Price Paid Per Share | (c) Total Number of Shares Purchased as Part of Publicly Announced Plans or Programs | (d) Maximum Number of Shares that May Yet be Purchased Under the Plans or Programs |
July 1, 2017 - July 31, 2017 | 347 | $69.55 | — | — |
August 1, 2017 - August 31, 2017 | — | — | — | — |
September 1, 2017 - September 30, 2017 | — | — | — | — |
| Total | 347 | $69.55 | — | — |
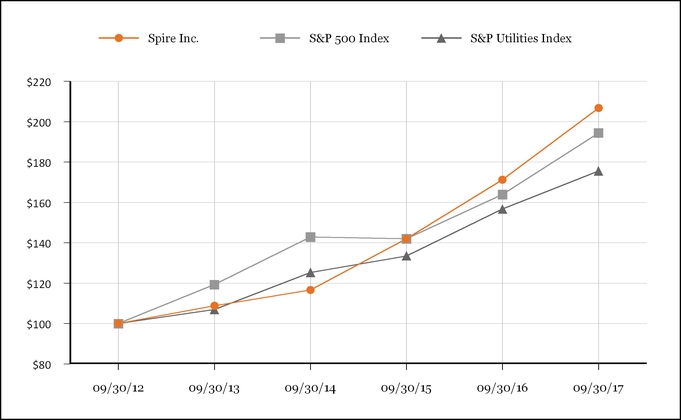
| September 30, | 2012 | 2013 | 2014 | 2015 | 2016 | 2017 | |||||||||||||||||
| Spire Inc. | $ | 100.00 | $ | 108.90 | $ | 116.61 | $ | 142.06 | $ | 171.23 | $ | 206.75 | |||||||||||
| S&P 500 Index | 100.00 | 119.34 | 142.89 | 142.02 | 163.93 | 194.44 | |||||||||||||||||
| S&P Utilities Index | 100.00 | 106.99 | 125.32 | 133.55 | 156.74 | 175.60 | |||||||||||||||||
Spire Missouri
Spire Missouri common stock is owned by its parent, Spire Inc., and is not traded on any stock exchange. Dividends declared on common stock for the two most recent fiscal years were:
| 2017 | 2016 | ||||||
| 1st Quarter | $ | 600.15 | $ | 864.30 | |||
| 2nd Quarter | — | 866.20 | |||||
| 3rd Quarter | — | 909.86 | |||||
| 4th Quarter | — | 569.64 | |||||
Spire Missouri’s mortgage contains restrictions on its ability to pay cash dividends on its common stock, as described in further detail in
Note 5, Shareholders’ Equity, of the Notes to Financial Statements in Item 8. As of September 30,Spire Alabama
Spire Alabama common stock is owned by its parent, Spire Inc., and is not traded on any stock exchange.
| 2017 | 2016 | ||||||
| 1st Quarter | $ | 3.42 | $ | 3.80 | |||
| 2nd Quarter | 1.90 | 4.06 | |||||
| 3rd Quarter | 3.42 | 4.06 | |||||
| 4th Quarter | 4.94 | 4.06 | |||||
Item 6. Selected Financial Data
| Spire | Fiscal Years Ended September 30 | ||||||||||||||||||
| (Dollars in millions, except per share amounts) | 2017 | 2016(1) | 2015 | 2014(2) | 2013(3) | ||||||||||||||
| Statements of Income data | |||||||||||||||||||
| Total Operating Revenues | $ | 1,740.7 | $ | 1,537.3 | $ | 1,976.4 | $ | 1,627.2 | $ | 1,017.0 | |||||||||
| Net Income | 161.6 | 144.2 | 136.9 | 84.6 | 52.8 | ||||||||||||||
| Common Stock data | |||||||||||||||||||
| Diluted Earnings Per Share of Common Stock | $ | 3.43 | $ | 3.24 | $ | 3.16 | $ | 2.35 | $ | 2.02 | |||||||||
| Dividends Declared Per Share of Common Stock | 2.10 | 1.96 | 1.84 | 1.76 | 1.70 | ||||||||||||||
Balance Sheet data (4) | |||||||||||||||||||
| Total Assets | $ | 6,546.7 | $ | 6,064.4 | $ | 5,277.6 | $ | 5,059.3 | $ | 3,117.3 | |||||||||
| Long-Term Debt (less current portion) | 1,995.0 | 1,820.7 | 1,758.9 | 1,836.3 | 904.6 | ||||||||||||||
Net Economic Earnings data (5) | |||||||||||||||||||
| Net Income (GAAP) | $ | 161.6 | $ | 144.2 | $ | 136.9 | $ | 84.6 | $ | 52.8 | |||||||||
| Unrealized loss (gain) on energy-related derivatives | 6.0 | (0.1 | ) | (2.8 | ) | (1.6 | ) | 1.0 | |||||||||||
| Lower of cost or market inventory adjustments | — | 0.2 | 0.4 | (1.1 | ) | 1.4 | |||||||||||||
| Realized (gain) loss on economic hedges prior to the sale of the physical commodity | (0.3 | ) | (1.6 | ) | 2.4 | (0.4 | ) | — | |||||||||||
| Acquisition, divestiture and restructuring activities | 4.0 | 9.2 | 9.8 | 29.5 | 17.3 | ||||||||||||||
| Gain on sale of property | — | — | (7.6 | ) | — | — | |||||||||||||
| Income tax effect of adjustments | (3.7 | ) | (2.8 | ) | (0.8 | ) | (10.9 | ) | (7.6 | ) | |||||||||
| Net Economic Earnings (Non-GAAP) | $ | 167.6 | $ | 149.1 | $ | 138.3 | $ | 100.1 | $ | 64.9 | |||||||||
| Diluted Earnings per Share of Common Stock: | |||||||||||||||||||
| Net Income (GAAP) | $ | 3.43 | $ | 3.24 | $ | 3.16 | $ | 2.35 | $ | 2.02 | |||||||||
| Unrealized loss (gain) on energy-related derivatives | 0.13 | — | (0.07 | ) | (0.04 | ) | 0.04 | ||||||||||||
| Lower of cost or market inventory adjustments | — | 0.01 | 0.01 | (0.03 | ) | 0.05 | |||||||||||||
| Realized (gain) loss on economic hedges prior to the sale of the physical commodity | (0.01 | ) | (0.04 | ) | 0.06 | (0.01 | ) | — | |||||||||||
| Acquisition, divestiture and restructuring activities | 0.09 | 0.21 | 0.23 | 0.82 | 0.67 | ||||||||||||||
| Gain on sale of property | — | — | (0.18 | ) | — | — | |||||||||||||
| Income tax effect of adjustments | (0.08 | ) | (0.06 | ) | (0.02 | ) | (0.31 | ) | (0.29 | ) | |||||||||
| Weighted average shares adjustment | — | 0.06 | — | 0.27 | 0.38 | ||||||||||||||
| Net Economic Earnings (Non-GAAP) | $ | 3.56 | $ | 3.42 | $ | 3.19 | $ | 3.05 | $ | 2.87 | |||||||||
Item 7. Management’s Discussion and Analysis of Financial Condition and Results of Operations
(Dollars in millions, except per share and per unit amounts)
INTRODUCTION
This section analyzes the financial condition and results of operations of Spire Inc. (Spire or the Company)(the “Company”), Spire Missouri Inc. (Spire Missouri or the Missouri Utilities), and Spire Alabama Inc. (Spire Alabama). Spire Missouri, Spire Alabama and Spire EnergySouth Inc. (Spire EnergySouth) are wholly owned subsidiaries of the Company. Spire Missouri changed its name from Laclede Gas Company on August 30, 2017, and Spire Alabama changed its name from Alabama Gas Corporation on September 1, 2017. Spire Missouri, Spire Alabama and the subsidiaries of Spire EnergySouth Inc. (formerly known as EnergySouth, Inc.) are collectively referred to as the Utilities.“Utilities.” The subsidiaries of Spire EnergySouth are Spire Gulf Inc. (Spire Gulf, formerly known as Mobile Gas Service Corporation) and Spire Mississippi Inc. (Spire Mississippi, formerly known as Willmut Gas & Oil Company).Mississippi. This section includes management’s view of factors that affect the respective businesses of the Company, Spire Missouri and Spire Alabama, explanations of financial results including changes in earnings and costs from the prior periods, and the effects of such factors on the Company’s, Spire Missouri’s and Spire Alabama’s overall financial condition and liquidity.
Reference is made to “Item 1A. Risk Factors” and “Forward-Looking Statements,” which describe important factors that could cause actual results to differ from expectations and non-historical information contained herein. In addition, the following discussion should be read in conjunction with the audited financial statements and accompanying notes thereto of Spire, Spire Missouri and Spire Alabama included in “Item 8. Financial Statements and Supplementary Data.”
OVERVIEW
The Company has two key businessreportable segments: Gas Utility and Gas Marketing. Nearly all of Spire’s earnings are primarily derived from its Gas Utility segment, which reflects the regulated activities of the Utilities. Due to the seasonal nature of the Utilities’ business and the Spire Missouri rate design, earnings of Spire Spire Missouri and Spire Alabamaeach of the Utilities are typically concentrated during the heating season of November through April each fiscal year.
Gas Utility - Spire Missouri
Spire Missouri is Missouri’s largest natural gas distribution utility and is regulated by the Missouri Public Service Commission (MoPSC).MoPSC. Spire Missouri serves St. Louis, and eastern Missouri through Spire Missouri East (formerly Laclede Gas Company) and serves Kansas City, and western Missouri throughother areas throughout the state. Spire Missouri West (formerlypurchases natural gas in the wholesale market from producers and marketers and ships the gas through interstate pipelines into its own distribution facilities for sale to residential, commercial and industrial customers. Spire Missouri Gas Energy, or MGE).also transports gas through its distribution system for certain larger customers who buy their own gas on the wholesale market. Spire Missouri delivers natural gas to retail customers at rates and in accordance with tariffs authorized by the MoPSC. The earnings of Spire Missouri are primarily generated by the sale of heating energy. The rate design for each service territory serves to lessen the impact of weather volatility on its customers during cold winters and stabilize Spire Missouri’s earnings.
Gas Utility - Spire Alabama
Spire Alabama is the largest natural gas distribution utility in the state of Alabama.Alabama and is regulated by the APSC. Spire Alabama’s service territory is located in central and northern Alabama. Among the cities served by Spire Alabama are Birmingham, the center of the largest metropolitan area in the state, and Montgomery, the state capital. Spire Alabama is regulated by the Alabama Public Service Commission (APSC). Spire Alabama purchases natural gas through interstate and intrastate suppliers and distributes the purchased gas through its distribution facilities for sale to residential, commercial, and industrial customers and other end-users of natural gas. Spire Alabama also provides transportation services to large industrial and commercial customers located ontransports gas through its distribution system. Thesesystem for certain large commercial and industrial customers for a transportation fee. Effective December 1, 2020, for most of these transportation service customers, using Spire Alabama as their agent or acting on their own,will also purchase gas directly from marketers or suppliers and arrangeon the wholesale market for sale to the customer upon delivery of the gas intoto the Spire Alabama distribution system. All Spire Alabama charges a feeservices are provided to transport such customer-ownedcustomers at rates and in accordance with tariffs authorized by the APSC.
Gas Utility - Spire EnergySouth
Spire Gulf and Spire Mississippi are utilities engaged in the purchase, retail distribution and sale of natural gas through its distribution system to approximately 100,000 customers in southern Alabama and south-central Mississippi. Spire Gulf is regulated by the customers’ facilities.
Gas Marketing
Spire Marketing Inc. (Spire Marketing) is engaged in the marketing of natural gas and related activities on a non-regulated basis and is reported in the Gas Marketing segment. Spire Marketing markets natural gas across the country with the core of its footprint located incentral and around the central United States (US).southern U.S. It holds firm transportation and storage contracts in order to effectively manage its customer base,transactions with counterparties, which consists ofprimarily include producers, pipelines, power generators, storage operators, municipalities, electric and gas utility companies, and large commercial and industrial customers.
Other
Other components of the Company’s consolidated information include:
• | unallocated corporate items, including certain debt and associated interest costs; |
• | Spire STL Pipeline, a subsidiary of Spire providing interstate natural gas pipeline transportation services; |
• | Spire Storage, a subsidiary of Spire providing interstate natural gas storage services; and |
• | Spire’s subsidiaries engaged in the operation of a propane pipeline, the compression of natural gas, and risk management, among other activities. |
Business Evaluation Factors
Based on the nature of the business of the Company and its subsidiaries, as well as current economic conditions, management focuses on the followingseveral key variables in evaluating the financial condition and results of operations and managing the business.
For the Gas Utility segment:segment, these include:
• | the Utilities’ ability to recover from their customers the costs of purchasing and distributing natural gas; |
• | the impact of weather and other factors, such as customer conservation, on revenues and expenses; |
• | changes in the regulatory environment at the federal, state, and local levels, as well as decisions by regulators, that impact the Utilities’ ability to earn the authorized rate of return and recover prudent costs in each of the service territories they serve; |
• | the Utilities’ ability to access credit markets and maintain working capital sufficient to meet operating requirements; |
• | the effect of natural gas price volatility on the business; and |
• | the ability to manage costs, integrate and standardize operations, and upgrade infrastructure. |
In the Utilities’ ability to recover the costs of purchasing and distributing natural gas from their customers;
• | the risks of competition; |
• | fluctuations in natural gas prices; |
• | the changing flow and availability of natural gas; |
• | new national infrastructure projects; |
• | the ability to procure firm transportation and storage services at reasonable rates; |
• | credit and/or capital market access; |
• | counterparty risks; and |
• | the effect of natural gas price volatility on the business. |
Further information regarding how management seeks to manage these key variables is discussed below.
Gas Utility
The Utilities seek to provide reliable natural gas services at a reasonable cost, while maintaining and building secure and dependable infrastructures. The Utilities’ strategies focus on improving both performance and the ability to recover their authorized distribution costs and rates of return. The Utilities’ distribution costs are the essential, primarily fixed, expenditures itthey must incur to operate and maintain more than 58,00060,000 miles of mains and services comprising thetheir natural gas distribution systems and related storage facilities for Spire Missouri, Spire Alabama and the subsidiaries of Spire EnergySouth.
The Utilities’ distribution costs include wages and employee benefit costs, depreciation and maintenance expenses, and other regulated utility operating expenses, excluding natural and propane gas expense. Distribution costs are considered in the rate-making process, and recovery of these types of costs is included in revenues generated through the Utilities’ tariff rates. Spire Missouri’s tariff rates are approved by the MoPSC, whereas Spire Alabama’s tariff rates are approved by the APSC. The subsidiaries of Spire EnergySouth, Spire Gulf and Spire Mississippi have tariff rates that are approved by the APSC and Mississippi Public Service Commission (MSPSC),MSPSC, respectively.
Spire Missouri and Spire Alabama also has anhave off-system sales and capacity release income streamstreams that isare regulated by tariff.
| Customer Share | Company Share | |
| Spire Missouri East | ||
| First $2.0 of pre-tax income* | 85% | 15% |
| Next $2.0 of pre-tax income | 80% | 20% |
| Next $2.0 of pre-tax income | 75% | 25% |
| Amounts of pre-tax income exceeding $6.0 | 70% | 30% |
| * Customer share was set to 85% and company share set to 15% in fiscal 2017. For fiscal 2016 and 2015, the customer share and company share were 100% and 0%, respectively. | ||
| Spire Missouri West | ||
| First $1.2 of pre-tax income | 85% | 15% |
| Next $1.2 of pre-tax income | 80% | 20% |
| Next $1.2 of pre-tax income | 75% | 25% |
| Amounts of pre-tax income exceeding $3.6 | 70% | 30% |
The Utilities work actively to reduce the impact of wholesale natural gas price volatility on their costs by strategically structuring their natural gas supply portfolios to increase their gas supply availability and pricing alternatives. They may also use derivative instruments to hedge against significant changes in the commodity price of natural gas. Nevertheless, the overall cost of purchased gas remains subject to fluctuations in market conditions. The Purchased Gas Adjustment (PGA) clause of Spire Missouri, Spire Gulf and Spire Mississippi and Spire Alabama’sthe Gas Supply Adjustment (GSA) rider of Spire Alabama allow the Utilities to flow through to customers, subject to prudence review by the public service commissions, the cost of purchased gas supplies, including costs, cost reductions and related carrying costs associated with the use of derivative instruments to mitigate volatility in the cost of natural gas, as well as gas inventory carrying costs.gas. As of September 30, 2017,2021, Spire Missouri had active derivative positions, but Spire Alabama has had no gas supply derivative instrument activity since 2010. Except in certain situations discussed under the caption “—The Utilities’ ability to meet their customers’ natural gas requirements may be impaired if contracted gas supplies, interstate pipeline and/or storage services are not available or delivered in a timely manner” under Item 1A, Risk Factors, and in Note 15, Regulatory Matters, of the Notes to Financial Statements in Item 8, the Utilities believe they will continue to be able to obtain sufficient gas supply. The price of natural gas supplies and other economic conditions may affect sales volumes, due to the conservation efforts of customers, and cash flows associated with the timing of collection of gas costs and related accounts receivable from customers.
The Utilities rely on short-term credit and long-term capital markets, as well as cash flows from operations, to satisfy their seasonal cash requirements and fund their capital expenditures. The Utilities’ ability to issueUtilities access the commercial paper market through a program administered by the holding company, which then loans borrowed funds to the Utilities. The Utilities directly access their lines of credit, issuethe long-term bonds, or obtain new lines of creditbond market. Access to debt markets is dependent on current conditions in the credit and capital markets. Management focuses on maintaining a strong balance sheet and believes itthe Utilities currently hashave adequate access to credit and capital markets and will have sufficient capital resources to meet their foreseeable obligations. See the
Gas Marketing
Spire Marketing is engaged in the marketing of natural gas and providing energyrelated services to both on-system utility transportationthroughout the United States, which includes customers within and customers outside of the Utilities’ traditional service areas. Spire Marketing utilizes its natural gas supply agreements, transportation agreements, park and loan agreements, storage agreements and other executory contracts to support a variety of services to its customers at competitive prices. It closely monitors and manages the natural gas commodity price and volatility risks associated with providing such services to its customers through the use of a variety of risk management activities, including the use of exchange-traded/cleared derivative instruments and other contractual arrangements. Spire Marketing is committed to managing commodity price risk while it seeks to expand the services that it now provides. Nevertheless, income from the Gas Marketing operations is subject to more fluctuations in market conditions than the Utilities’ operations.
The Gas Marketing business is directly impacted by the effects of competition in the marketplace, the impacts of new infrastructure, surplus natural gas supplies, and the addition of new demand from exports, power generation and industrial load. Spire Marketing’s management expects a growing need for marketing services across the country as customers manage seasonal variability and marketplace volatility.
In addition to its operating cash flows, Spire Marketing relies on Spire’s parental guaranteesguaranties to secure its purchase and sales obligations of natural gas, and it also has access to Spire’s liquidity resources. A large portion of Spire Marketing’s receivables are from customers in the energy industry. It also enters into netting arrangements with many of its energy counterparties to reduce overall credit and collateral exposure. On a net dollar exposure basis, the majority of Spire Marketing’s customers are utilities or utility affiliates. Although Spire Marketing’s uncollectible amounts are closely monitored and have not been significant, increases in uncollectible amounts from customers are possible and could adversely affect GasSpire Marketing’s liquidity and results of operations.
Spire Marketing carefully monitors the creditworthiness of counterparties to its transactions. It performs in-house credit reviews of potential customers and may require credit assurances such as prepayments, letters of credit or parental guaranteesguaranties when appropriate. Credit limits for customers are established and monitored.
Spire Marketing cannot be certain that all of its wholesale purchase and sale transactions will settle physically. As such, certainthese transactions are designated as trading activities for financial reporting purposes, due to their settlement characteristics. Results of operations from trading activities are reported on a net basis in Gas Marketing operating revenues (or expenses, if negative), which may cause volatility in the Company’s operating revenues, but have no effect on operating income or net income.
In the course of its business, Spire Marketing enters into commitments associated with the purchase or sale of natural gas. In accordance with US generally accepted accounting principles (GAAP),U.S. GAAP, some of its purchase and sale transactions are not recognized in earnings until the natural gas is physically delivered, while other energy-related transactions, including those designated as trading activities, are required to be accounted for as derivatives with the changes in their fair value (representing unrealized gains or losses) recorded in earnings in periods prior to settlement. Because related transactions of a purchase and sale strategy may be accounted for differently, there may be timing differences in the recognition of earnings under GAAP and economic earnings realized upon settlement. The Company reports both GAAP and net economic earnings (non-GAAP), as discussed below.in the section “Non-GAAP Measures”.
COVID-19
The outbreak of COVID-19 has adversely impacted economic activity and conditions worldwide. We are continuing to assess the developments involving our workforce, customers and suppliers, as well as the response of federal and state authorities, our regulators and other business and community leaders. The Company has implemented what we believe to be appropriate procedures and protocols to ensure the safety of our customers, suppliers and employees. These actions include activating incident management procedures, work-from-home for our office-based employees, limiting direct contact with our customers, and suspending disconnections and late payment fees for our utility customers for several months in 2020.
We have experienced impacts on our results of operations from COVID-19, including:
• | lost late payment fees due to a moratorium from late March through mid-June 2020; |
• | minor net margin impact from lower commercial and industrial volumes offset by additional residential fixed charges; |
• | bad debt expense increases due to additional expected credit losses on accounts receivable balances; and |
• | net other direct cost reductions due to lower travel, meals and entertainment and training offset by increased costs for enhanced cleaning and personal protective equipment for our facilities and field personnel compared to normal and expected levels. |
Spire Missouri received an Accounting Authority Order from the MoPSC to defer certain costs incurred through March 31, 2021, and has recorded a related regulatory asset of $6.2 as of September 30, 2021. Even with the cost increases and lost revenues, Spire Alabama exceeded the allowed return and recorded a Rate Stabilization and Equalization giveback in September 2020 and in January 2021, so there was no bottom-line impact of these COVID-19 effects.
An extended slowdown of the United States' economy, changes in commodity costs and/or significant changes in policy and regulation could result in lower demand for natural gas as well as negatively impact the ability of our customers, contractors, suppliers and other business partners to remain in business or return to operating health. These could have a material adverse effect on our results of operations, financial condition, liquidity and prospects.
The Company is participating in the Coronavirus Aid, Relief, and Economic Security Act (CARES Act) provisions allowing for a payroll tax deferral which does not have an impact on our results of operations but defers the payment of the Company’s portion of certain payroll taxes until later in fiscal 2021 and 2022. Although the Company does not currently expect to seek relief under any other CARES Act provisions, we will continue to monitor all pending and future federal, state and local efforts related to the Gas UtilityCOVID-19 health crisis and Gas Marketing segments, other non-utility activities of the Company include:
NON-GAAP MEASURES
Net income, earnings per share and operation of a proposed 65-mile Federal Energy Regulatory Commission (FERC) regulated pipeline to deliver natural gas into eastern Missouri; and
Net Economic Earnings and Net Economic Earnings Per Share
Net economic earnings and net economic earnings per share are non-GAAP measures that exclude from net income the after-tax impacts of fair value accounting and timing adjustments associated with energy-related transactions, as well asthe impacts of acquisition, divestiture and restructuring activities. Theseactivities, and the largely non-cash impacts of impairments and other non-recurring or unusual items such as certain regulatory, legislative or GAAP standard-setting actions. In addition, net economic earnings per share would exclude the impact, in the fiscal year of issuance, of any shares issued to finance acquisitions that have yet to be included in net economic earnings.
The fair value and timing adjustments are made in instances where the accounting treatment differs from what management considers the economic substance of the underlying transaction, including the following:
• | Net unrealized gains and losses on energy-related derivatives that are required by GAAP fair value accounting associated with current changes in the fair value of financial and physical transactions prior to their completion and settlement. These unrealized gains and losses result primarily from two sources: |
1) | changes in the fair values of physical and/or financial derivatives prior to the period of settlement; and |
2) | ineffective portions of accounting hedges, required to be recorded in earnings prior to settlement, due to differences in commodity price changes between the locations of the forecasted physical purchase or sale transactions and the locations of the underlying hedge instruments; |
• | Lower of cost or market adjustments to the carrying value of commodity inventories resulting when the net realizable value |
• | Realized gains and losses resulting from the settlement of economic hedges prior to the sale of the physical commodity. |
These adjustments eliminate the impact of timing differences and the impact of current changes in the fair value of financial and physical transactions prior to their completion and settlement. Unrealized gains or losses are recorded in each period until being replaced with the actual gains or losses realized when the associated physical transactions occur. While management uses these non-GAAP measures to evaluate both the Utilities and non-utility businesses, the net effect of adjustments on the Utilities’ earnings is minimal because gains or losses on their natural gas derivative instruments are deferred pursuant to state regulation.
Contribution Margin
In addition to operating revenues and operating expenses, management also uses the non-GAAP measure of contribution margin when evaluating results of operations. Contribution margin is defined as operating revenues less natural gas costs and gross receipts tax expense. The Utilities pass to their customers (subject to prudence review by, as applicable, the MoPSC, APSC or MSPSC) increases and decreases in the wholesale cost of natural gas in accordance with their PGA clauses or GSA rider.riders. The volatility of the wholesale natural gas market results in fluctuations from period to period in the recorded levels of, among other items, revenues and natural gas cost expense. Nevertheless, increases and decreases in the cost of gas associated with system gas sales volumes and gross receipts tax expense (which are calculated as a percentage of revenues), with the same amount (excluding immaterial timing differences) included in revenues, hashave no direct effect on operating income. Contribution margin is defined as operating revenues less natural and propane gas costs and gross receipts tax expense. As these items are reflected in both operating revenue and operating expenses and management has little control over these amounts for the Utilities,Therefore, management believes that contribution margin is a useful supplemental measure. In addition, it is management’s belief that contribution margin andmeasure, along with the remaining operating expenses, that calculate operating income are useful infor assessing the Company’s and the Utilities’ performance as management has more abilityperformance.
EARNINGS
This section contains discussion and analysis of the results for the year ended September 30, 2021 compared to influence control over these revenuesthe results for the year ended September 30, 2020. The discussion and expenses.
Spire
Net Income (Loss) and Net Economic Earnings (Loss)
The following tables reconcile the Company’s net economic earnings to the most comparable GAAP number, net income.
|
| Gas Utility |
|
| Gas Marketing |
|
| Other |
|
| Consol- idated |
|
| Per Diluted Share** |
| |||||
Year Ended September 30, 2021 |
|
|
|
|
|
|
|
|
|
|
|
|
|
|
|
|
|
|
|
|
Net Income (Loss) [GAAP] |
| $ | 237.2 |
|
| $ | 44.8 |
|
| $ | (10.3 | ) |
| $ | 271.7 |
|
| $ | 4.96 |
|
Adjustments, pre-tax: |
|
|
|
|
|
|
|
|
|
|
|
|
|
|
|
|
|
|
|
|
Missouri regulatory adjustments |
|
| (9.0 | ) |
|
| — |
|
|
| — |
|
|
| (9.0 | ) |
|
| (0.17 | ) |
Fair value and timing adjustments |
|
| 0.3 |
|
|
| 3.0 |
|
|
| — |
|
|
| 3.3 |
|
|
| 0.06 |
|
Acquisition, divestiture and restructuring activities |
|
| — |
|
|
| — |
|
|
| (1.3 | ) |
|
| (1.3 | ) |
|
| (0.02 | ) |
Income tax effect of adjustments* |
|
| 2.1 |
|
|
| (0.8 | ) |
|
| 0.3 |
|
|
| 1.6 |
|
|
| 0.03 |
|
Net Economic Earnings (Loss) [Non-GAAP] |
| $ | 230.6 |
|
| $ | 47.0 |
|
| $ | (11.3 | ) |
| $ | 266.3 |
|
| $ | 4.86 |
|
|
|
|
|
|
|
|
|
|
|
|
|
|
|
|
|
|
|
|
|
|
Year Ended September 30, 2020 |
|
|
|
|
|
|
|
|
|
|
|
|
|
|
|
|
|
|
|
|
Net Income (Loss) [GAAP] |
| $ | 213.6 |
|
| $ | 7.0 |
|
| $ | (132.0 | ) |
| $ | 88.6 |
|
| $ | 1.44 |
|
Adjustments, pre-tax: |
|
|
|
|
|
|
|
|
|
|
|
|
|
|
|
|
|
|
|
|
Impairments |
|
| — |
|
|
| — |
|
|
| 148.6 |
|
|
| 148.6 |
|
|
| 2.89 |
|
Fair value and timing adjustments |
|
| (0.3 | ) |
|
| 2.8 |
|
|
| — |
|
|
| 2.5 |
|
|
| 0.05 |
|
Income tax effect of adjustments* |
|
| 0.1 |
|
|
| (0.7 | ) |
|
| (31.3 | ) |
|
| (31.9 | ) |
|
| (0.62 | ) |
Net Economic Earnings (Loss) [Non-GAAP] |
| $ | 213.4 |
|
| $ | 9.1 |
|
| $ | (14.7 | ) |
| $ | 207.8 |
|
| $ | 3.76 |
|
|
|
|
|
|
|
|
|
|
|
|
|
|
|
|
|
|
|
|
|
|
Year Ended September 30, 2019 |
|
|
|
|
|
|
|
|
|
|
|
|
|
|
|
|
|
|
|
|
Net Income (Loss) [GAAP] |
| $ | 190.5 |
|
| $ | 18.5 |
|
| $ | (24.4 | ) |
| $ | 184.6 |
|
| $ | 3.52 |
|
Adjustments, pre-tax: |
|
|
|
|
|
|
|
|
|
|
|
|
|
|
|
|
|
|
|
|
Provision for ISRS rulings |
|
| 12.2 |
|
|
| — |
|
|
| — |
|
|
| 12.2 |
|
|
| 0.23 |
|
Fair value and timing adjustments |
|
| — |
|
|
| 1.2 |
|
|
| — |
|
|
| 1.2 |
|
|
| 0.03 |
|
Acquisition, divestiture and restructuring activities |
|
| — |
|
|
| — |
|
|
| 0.4 |
|
|
| 0.4 |
|
|
| 0.01 |
|
Income tax effect of adjustments* |
|
| (2.9 | ) |
|
| (0.3 | ) |
|
| (0.1 | ) |
|
| (3.3 | ) |
|
| (0.06 | ) |
Net Economic Earnings (Loss) [Non-GAAP] |
| $ | 199.8 |
|
| $ | 19.4 |
|
| $ | (24.1 | ) |
| $ | 195.1 |
|
| $ | 3.73 |
|
| Gas Utility | Gas Marketing | Other | Consol-idated | Per Diluted Share** | ||||||||||||||||
| Year Ended September 30, 2017 | ||||||||||||||||||||
| Net Income (Loss) (GAAP) | $ | 180.5 | $ | 3.4 | $ | (22.3 | ) | $ | 161.6 | $ | 3.43 | |||||||||
| Adjustments, pre-tax: | ||||||||||||||||||||
| Unrealized loss on energy-related derivatives | 0.1 | 5.9 | — | 6.0 | 0.13 | |||||||||||||||
Realized gain on economic hedges prior to the sale of the physical commodity | — | (0.3 | ) | — | (0.3 | ) | (0.01 | ) | ||||||||||||
| Acquisition, divestiture and restructuring activities | 1.5 | — | 2.5 | 4.0 | 0.09 | |||||||||||||||
| Income tax effect of adjustments* | (0.6 | ) | (2.2 | ) | (0.9 | ) | (3.7 | ) | (0.08 | ) | ||||||||||
| Net Economic Earnings (Loss) (Non-GAAP) | $ | 181.5 | $ | 6.8 | $ | (20.7 | ) | $ | 167.6 | $ | 3.56 | |||||||||
| Year Ended September 30, 2016 | ||||||||||||||||||||
| Net Income (Loss) (GAAP) | $ | 159.0 | $ | 7.1 | $ | (21.9 | ) | $ | 144.2 | $ | 3.24 | |||||||||
| Adjustments, pre-tax: | ||||||||||||||||||||
| Unrealized (gain) loss on energy-related derivatives | (0.3 | ) | 0.2 | — | (0.1 | ) | — | |||||||||||||
| Lower of cost or market inventory adjustments | — | 0.2 | — | 0.2 | 0.01 | |||||||||||||||
Realized gain on economic hedges prior to the sale of the physical commodity | — | (1.6 | ) | — | (1.6 | ) | (0.04 | ) | ||||||||||||
| Acquisition, divestiture and restructuring activities | 2.3 | — | 6.9 | 9.2 | 0.21 | |||||||||||||||
| Income tax effect of adjustments* | (0.7 | ) | 0.5 | (2.6 | ) | (2.8 | ) | (0.06 | ) | |||||||||||
| Weighted average shares adjustment ** | — | — | — | — | 0.06 | |||||||||||||||
| Net Economic Earnings (Loss) (Non-GAAP) | $ | 160.3 | $ | 6.4 | $ | (17.6 | ) | $ | 149.1 | $ | 3.42 | |||||||||
| Year Ended September 30, 2015 | ||||||||||||||||||||
| Net Income (Loss) (GAAP) | $ | 153.3 | $ | 4.1 | $ | (20.5 | ) | $ | 136.9 | $ | 3.16 | |||||||||
| Adjustments, pre-tax: | ||||||||||||||||||||
| Unrealized gain on energy-related derivatives | (0.1 | ) | (2.7 | ) | — | (2.8 | ) | (0.07 | ) | |||||||||||
| Lower of cost or market inventory adjustments | — | 0.4 | — | 0.4 | 0.01 | |||||||||||||||
Realized loss on economic hedges prior to the sale of the physical commodity | — | 2.4 | — | 2.4 | 0.06 | |||||||||||||||
| Acquisition, divestiture and restructuring activities | 3.1 | — | 6.7 | 9.8 | 0.23 | |||||||||||||||
| Gain on sale of property | (7.6 | ) | — | — | (7.6 | ) | (0.18 | ) | ||||||||||||
| Income tax effect of adjustments* | 1.7 | — | (2.5 | ) | (0.8 | ) | (0.02 | ) | ||||||||||||
| Net Economic Earnings (Loss) (Non-GAAP) | $ | 150.4 | $ | 4.2 | $ | (16.3 | ) | $ | 138.3 | $ | 3.19 | |||||||||
* | |
Income tax effect is calculated by applying federal, state and local income tax rates applicable to ordinary income to the amounts of the pre-tax reconciling |
** | |
Net economic earnings per share is calculated by replacing consolidated net income with consolidated net economic earnings in the GAAP diluted |
Consolidated
Spire’s net income was $161.6$271.7 in fiscal 2017,2021, compared with $144.2$88.6 in fiscal 2016.2020. Basic and diluted earnings per share were $3.44$4.97 and $3.43,$4.96, respectively, for fiscal 20172021 compared with basic and diluted earnings per share of $3.26 and $3.24, respectively,$1.44 for fiscal 2016. 2020.
The prior year amount reflects the impact of the third quarter 2020 impairment charge of $148.6 ($117.3 after tax). Excluding this charge, net income increased $65.8, driven by increases of $37.8 and $23.6 in Gas Marketing and Gas Utility, respectively, combined with a $4.4 improvement in results from Other.
Net economic earnings were $167.6 (or $3.56$266.3 ($4.86 per diluted share) in fiscal 2017, compared with $149.1 (or $3.42 per share) in fiscal 2016, an increase of $18.5. Net income increased in fiscal 2017for the twelve months ended September 30, 2021, compared to fiscal 2016 primarily due to $21.5 income growth$207.8 ($3.76 per diluted share) for the same period last year, reflecting earnings improvements in the Gas Utility segment, partly offset by a $3.7 income decline inboth the Gas Marketing segment and a $0.4 larger loss from other activities.
Gas Utility
Gas Utility net income and net economic earnings increased by $21.5$23.6 from the prior year. The Gas Utility segment is higher due principally to a $24.1 increase in contribution margin resulting from higher off-system sales in the second quarter of the current year. This increase was a result of managing our gas inventory levels to serve our customers during the cold weather events in February 2021 and $21.2, respectively, in fiscal 2017, compared to fiscal 2016. The increases to net income and net economic earnings were driven by the $9.6 income growth generated by the Spire EnergySouth acquisition, margin growth and combined lower O&M expenses atallowed Spire Missouri andto capitalize on gas flow disruptions resulting in increased off-system sales which also benefited our customers. The current year also benefited from a $15.9 increase in Spire Alabama. The margin growth was driven by higher Infrastructure System Replacement Surcharge (ISRS) charges atMissouri ISRS revenues (including the Missouri Utilities andimpact of a prior-year provision of $2.2 related to the ISRS ruling settled in the year), $9.8 in net favorable regulatoryrate adjustments under the RSE mechanism at Spire Alabama, partlythe Missouri Supreme Court ruling that partially reversed 2018 rate case pension cost disallowances totaling $9.0 ($6.8 after tax), and $6.3 higher contribution margin due to the impacts of colder weather in the second quarter of the current year. These positive impacts were partially offset by weather impacts resulting from warmer winter temperatures. These impacts were partly offset by increaseshigher run-rate operating costs and a $14.7 increase in depreciation and amortization expenses. Additionally, interest expensereflecting increased capital investment and a disallowed meter cost recovery in Spire Missouri.
Net economic earnings in the current year were $230.6, an increase of $17.2 over the same period in the prior year. The increase was primarily driven by higher due to the Spire EnergySouth acquisitioncontribution margin that was only partly offset by an increase in depreciation and amortization and higher interest charges experienced by Spire Missouri. Income taxes were also higher duerun-rate operating expenses, after reclassification of certain postretirement benefit costs to other income and expense (no impact on net income) (“Nonservice Cost Transfer”) and the Spire EnergySouth acquisition and higher pre-tax income for both Spire Missouri and Spire Alabama. Further detailsSupreme Court ruling that partially reversed 2018 rate case pension cost disallowances. These impacts are discusseddescribed in the Gas Utility, Spire Missouri, and Spire Alabama sectionsfurther detail below.
Gas Marketing
The Gas Marketing segment reported net income totaling $3.4, a decrease$44.8 for the twelve months ended September 30, 2021, versus net income of $3.7 compared with$7.0 during the same period last year. Net economic earnings for fiscal 2017 increased $0.4the twelve months ended September 30, 2021, was $47.0, an increase of $37.9 from fiscal 2016. The decrease in net income was primarily attributable to unfavorable mark-to-market (MTM) activity in the current year. Net economic earnings benefited from increased value from spreads and asset optimization in the current year versus the prior year. Further details are discussed in the Gas Marketing section below.
Other
The increasedCompany’s other non-utility activities generated a net loss of $10.3 for fiscal 2021, compared to a net loss of $132.0 for the same period last year. Fiscal 2020 reflects the $117.3 after-tax impairment charge previously mentioned. Net economic loss was $11.3 for fiscal 2021, an improvement of $3.4 compared to fiscal 2020. The improvement was driven primarily the result of higher current year interest charges associated with the September 2016 acquisition ofby a smaller loss from Spire EnergySouth.Storage.
Operating Revenues and Operating Expenses
Reconciliations of contribution margin to the most directly comparable GAAP measure are shown below.
|
| Gas Utility |
|
| Gas Marketing |
|
| Other |
|
| Eliminations |
|
| Consolidated |
| |||||
Year Ended September 30, 2021 |
|
|
|
|
|
|
|
|
|
|
|
|
|
|
|
|
|
|
|
|
Operating Income |
| $ | 374.0 |
|
| $ | 58.5 |
|
| $ | 17.7 |
|
| $ | — |
|
| $ | 450.2 |
|
Operation and maintenance expenses |
|
| 422.2 |
|
|
| 17.1 |
|
|
| 40.2 |
|
|
| (13.7 | ) |
|
| 465.8 |
|
Depreciation and amortization |
|
| 204.4 |
|
|
| 1.2 |
|
|
| 7.5 |
|
|
| — |
|
|
| 213.1 |
|
Taxes, other than income taxes |
|
| 157.0 |
|
|
| 0.9 |
|
|
| 2.2 |
|
|
| — |
|
|
| 160.1 |
|
Less: Gross receipts tax expense |
|
| (93.9 | ) |
|
| (0.1 | ) |
|
| — |
|
|
| — |
|
|
| (94.0 | ) |
Contribution Margin [Non-GAAP] |
|
| 1,063.7 |
|
|
| 77.6 |
|
|
| 67.6 |
|
|
| (13.7 | ) |
|
| 1,195.2 |
|
Natural gas costs |
|
| 961.7 |
|
|
| 18.8 |
|
|
| 0.1 |
|
|
| (34.3 | ) |
|
| 946.3 |
|
Gross receipts tax expense |
|
| 93.9 |
|
|
| 0.1 |
|
|
| — |
|
|
| — |
|
|
| 94.0 |
|
Operating Revenues |
| $ | 2,119.3 |
|
| $ | 96.5 |
|
| $ | 67.7 |
|
| $ | (48.0 | ) |
| $ | 2,235.5 |
|
|
| Gas Utility |
|
| Gas Marketing |
|
| Other |
|
| Eliminations |
|
| Consolidated |
| |||||
Year Ended September 30, 2020 |
|
|
|
|
|
|
|
|
|
|
|
|
|
|
|
|
|
|
|
|
Operating Income (Loss) |
| $ | 334.3 |
|
| $ | 9.3 |
|
| $ | (137.2 | ) |
| $ | — |
|
| $ | 206.4 |
|
Operation and maintenance expenses |
|
| 421.3 |
|
|
| 11.8 |
|
|
| 38.2 |
|
|
| (12.7 | ) |
|
| 458.6 |
|
Depreciation and amortization |
|
| 189.7 |
|
|
| 0.6 |
|
|
| 7.0 |
|
|
| — |
|
|
| 197.3 |
|
Taxes, other than income taxes |
|
| 146.5 |
|
|
| 1.1 |
|
|
| 0.8 |
|
|
| — |
|
|
| 148.4 |
|
Impairment loss |
|
| — |
|
|
| — |
|
|
| 148.6 |
|
|
| — |
|
|
| 148.6 |
|
Less: Gross receipts tax expense |
|
| (91.1 | ) |
|
| (0.4 | ) |
|
| — |
|
|
| — |
|
|
| (91.5 | ) |
Contribution Margin [Non-GAAP] |
|
| 1,000.7 |
|
|
| 22.4 |
|
|
| 57.4 |
|
|
| (12.7 | ) |
|
| 1,067.8 |
|
Natural gas costs |
|
| 660.2 |
|
|
| 65.1 |
|
|
| 0.4 |
|
|
| (29.6 | ) |
|
| 696.1 |
|
Gross receipts tax expense |
|
| 91.1 |
|
|
| 0.4 |
|
|
| — |
|
|
| — |
|
|
| 91.5 |
|
Operating Revenues |
| $ | 1,752.0 |
|
| $ | 87.9 |
|
| $ | 57.8 |
|
| $ | (42.3 | ) |
| $ | 1,855.4 |
|
Gas Utility | Gas Marketing | Other | Eliminations | Consolidated | ||||||||||||||||
| Year Ended September 30, 2017 | ||||||||||||||||||||
| Operating Income (Loss) | $ | 321.6 | $ | 5.2 | $ | (5.1 | ) | $ | — | $ | 321.7 | |||||||||
| Operation and maintenance expenses | 409.1 | 5.9 | 11.8 | (5.5 | ) | 421.3 | ||||||||||||||
| Depreciation and amortization | 153.5 | 0.1 | 0.5 | — | 154.1 | |||||||||||||||
| Taxes, other than income taxes | 137.8 | 0.5 | 0.2 | — | 138.5 | |||||||||||||||
| Less: Gross receipts tax expense | (83.0 | ) | (0.1 | ) | — | — | (83.1 | ) | ||||||||||||
| Contribution Margin (Non-GAAP) | 939.0 | 11.6 | 7.4 | (5.5 | ) | 952.5 | ||||||||||||||
| Natural and propane gas costs | 645.9 | 67.6 | 0.3 | (8.7 | ) | 705.1 | ||||||||||||||
| Gross receipts tax expense | 83.0 | 0.1 | — | — | 83.1 | |||||||||||||||
| Operating Revenues | $ | 1,667.9 | $ | 79.3 | $ | 7.7 | $ | (14.2 | ) | $ | 1,740.7 | |||||||||
|
| Gas Utility |
|
| Gas Marketing |
|
| Other |
|
| Eliminations |
|
| Consolidated |
| |||||
Year Ended September 30, 2019 |
|
|
|
|
|
|
|
|
|
|
|
|
|
|
|
|
|
|
|
|
Operating Income (Loss) |
| $ | 293.4 |
|
| $ | 23.2 |
|
| $ | (14.3 | ) |
| $ | — |
|
| $ | 302.3 |
|
Operation and maintenance expenses |
|
| 441.7 |
|
|
| 11.7 |
|
|
| 31.6 |
|
|
| (10.9 | ) |
|
| 474.1 |
|
Depreciation and amortization |
|
| 179.4 |
|
|
| 0.1 |
|
|
| 2.2 |
|
|
| — |
|
|
| 181.7 |
|
Taxes, other than income taxes |
|
| 151.7 |
|
|
| 0.8 |
|
|
| 1.5 |
|
|
| — |
|
|
| 154.0 |
|
Less: Gross receipts tax expense |
|
| (99.1 | ) |
|
| (0.2 | ) |
|
| — |
|
|
| — |
|
|
| (99.3 | ) |
Contribution Margin [Non-GAAP] |
|
| 967.1 |
|
|
| 35.6 |
|
|
| 21.0 |
|
|
| (10.9 | ) |
|
| 1,012.8 |
|
Natural gas costs |
|
| 794.6 |
|
|
| 47.9 |
|
|
| 0.5 |
|
|
| (2.7 | ) |
|
| 840.3 |
|
Gross receipts tax expense |
|
| 99.1 |
|
|
| 0.2 |
|
|
| — |
|
|
| — |
|
|
| 99.3 |
|
Operating Revenues |
| $ | 1,860.8 |
|
| $ | 83.7 |
|
| $ | 21.5 |
|
| $ | (13.6 | ) |
| $ | 1,952.4 |
|
| Gas Utility | Gas Marketing | Other | Eliminations | Consolidated | ||||||||||||||||
| Year Ended September 30, 2016 | ||||||||||||||||||||
| Operating Income (Loss) | $ | 278.3 | $ | 11.8 | $ | (7.8 | ) | $ | — | $ | 282.3 | |||||||||
| Operation and maintenance expenses | 379.3 | 5.6 | 12.1 | (2.4 | ) | 394.6 | ||||||||||||||
| Depreciation and amortization | 136.9 | 0.1 | 0.5 | 137.5 | ||||||||||||||||
| Taxes, other than income taxes | 125.2 | 0.3 | (0.2 | ) | 125.3 | |||||||||||||||
| Less: Gross receipts tax expense | (75.3 | ) | (0.1 | ) | — | — | (75.4 | ) | ||||||||||||
| Contribution Margin (Non-GAAP) | 844.4 | 17.7 | 4.6 | (2.4 | ) | 864.3 | ||||||||||||||
| Natural and propane gas costs | 539.7 | 60.7 | 0.2 | (3.0 | ) | 597.6 | ||||||||||||||
| Gross receipts tax expense | 75.3 | 0.1 | — | — | 75.4 | |||||||||||||||
| Operating Revenues | $ | 1,459.4 | $ | 78.5 | $ | 4.8 | $ | (5.4 | ) | $ | 1,537.3 | |||||||||
| Gas Utility | Gas Marketing | Other | Eliminations | Consolidated | ||||||||||||||||
| Year Ended September 30, 2015 | ||||||||||||||||||||
| Operating Income (Loss) | $ | 274.6 | $ | 6.8 | $ | (8.9 | ) | $ | — | $ | 272.5 | |||||||||
| Operation and maintenance expenses | 391.5 | 5.4 | 11.7 | (1.0 | ) | 407.6 | ||||||||||||||
| Depreciation and amortization | 129.9 | 0.3 | 0.6 | — | 130.8 | |||||||||||||||
| Taxes, other than income taxes | 142.2 | 0.4 | — | — | 142.6 | |||||||||||||||
| Less: Gross receipts tax expense | (96.1 | ) | (0.2 | ) | — | — | (96.3 | ) | ||||||||||||
| Contribution Margin (Non-GAAP) | 842.1 | 12.7 | 3.4 | (1.0 | ) | 857.2 | ||||||||||||||
| Natural and propane gas costs | 957.6 | 140.5 | 0.3 | (75.5 | ) | 1,022.9 | ||||||||||||||
| Gross receipts tax expense | 96.1 | 0.2 | — | — | 96.3 | |||||||||||||||
| Operating Revenues | $ | 1,895.8 | $ | 153.4 | $ | 3.7 | $ | (76.5 | ) | $ | 1,976.4 | |||||||||
Consolidated
Spire’s operating revenues increased by $380.1, driven by higher revenues across all segments, net of $1,740.7 forintercompany eliminations. Both the year ended September 30, 2017 compared with for $1,537.3 the same period last year. The increase wasGas Utility and Gas Marketing segments saw their favorable results driven primarilyprincipally by the Utilities, the result of the Spire EnergySouth acquisition, higher ISRS charges at Spire Missouri, favorable regulatory adjustments at Spire Alabama, and higher gas costs passed on to customers in both Missouri and Alabama. These positive drivers were partly offset by lower demandextreme weather experienced as a result of warmer weather. Winter Storm Uri in February of the current year. Specifically, the Gas Utility increase was $367.3, Spire Marketing increased $8.6, while Other (net of intercompany eliminations) increased $4.2, reflecting higher combined revenues from both Spire Storage and Spire STL Pipeline (which entered service in late calendar 2019).
Spire’s contribution margin increased $88.2 for the twelve months ended September 30, 2017,$127.4 compared towith the same twelve-month period last year.year, with all segments reporting increases. The increase was primarily due to higherGas Utility contribution margin increased $63.0, primarily driven by the $51.2 increase from Spire Missouri and the $10.8 increase at Spire Alabama. The $55.2 increase in Gas Marketing reflects very favorable weather and market conditions in the current year second quarter. Higher contribution margins at Spire STL Pipeline are consistent with its in-service date early in fiscal 2020, and Spire Storage’s improvement reflects higher utilization of $94.6 forits storage capacity.
Depreciation and amortization expenses were higher in the Gas Utility segment, slightlydue principally to higher capital investments. Gas Utility O&M expenses were $0.9 higher in the current year, largely due to the Missouri Supreme Court ruling that partially reversed 2018 rate case pension cost disallowances totaling $9.0 offset by the lower contribution margin reportedNonservice Cost Transfer of $2.1. These fluctuations are described in Gas Marketing. Operation and maintenance (O&M) expenses increased $26.7 for the twelve months ended September 30, 2017 as compared to the same period last year, as discussedmore detail below. Depreciation and amortization expenses increased $16.6, driven principally by the Spire EnergySouth acquisition and continued infrastructure investment at Spire Missouri and Spire Alabama in fiscal 2017.
Gas Utility
Operating Revenues
– Gas Utility operating revenues for fiscalSpire Missouri – Higher PGA gas cost recoveries |
| $ | 183.2 |
|
Spire Missouri and Spire Alabama – Off-system sales and capacity release |
|
| 113.0 |
|
Spire Missouri and Spire Alabama – Volumetric usage (net of weather mitigation) |
|
| 31.9 |
|
Spire Missouri – Higher ISRS (including ISRS rulings prior year true-up) |
|
| 15.9 |
|
Spire Alabama – RSE: net adjustments |
|
| 9.4 |
|
Spire EnergySouth growth |
|
| 5.3 |
|
All other factors |
|
| 8.6 |
|
Total Variation |
| $ | 367.3 |
|
| New customer revenue from Spire EnergySouth acquisition | $ | 92.1 | |
| Higher wholesale gas costs passed on to customers | 87.2 | ||
| Spire Alabama – Lower Rate Stabilization and Equalization (RSE) revenue reduction and higher Cost Control Measure (CCM) benefit | 19.2 | ||
| Spire Missouri - Higher off-system sales and capacity release | 17.9 | ||
| Spire Missouri - Higher ISRS charges | 14.2 | ||
| Higher gross receipts tax | 4.9 | ||
| Weather / temperature adjustment impact | (27.3 | ) | |
| All other | 0.3 | ||
| Total Variation | $ | 208.5 | |
As shown in the table above, the increase in revenues was driven primarily by a $183.2 increase in Spire Missouri gas costs (including $195.8 of cover charges and OFO penalties to certain wholesale customers), a $113.0 increase in off-system sales, and higher weather/volumetric impacts of $31.9. The segment also benefited from a $15.9 increase of Spire Missouri ISRS, a $9.4 increase due to Spire Alabama’s rate adjustments under the RSE mechanism, and $5.3 growth from Spire EnergySouth.
Contribution Margin
– Gas Utility contribution margin wasSpire Missouri and Spire Alabama – Off-system sales and capacity release |
| $ | 24.1 |
|
Spire Missouri – Higher ISRS (including ISRS rulings prior year true-up) |
|
| 15.9 |
|
Spire Alabama – RSE: net adjustments |
|
| 9.8 |
|
Spire Missouri and Spire Alabama – Volumetric usage |
|
| 6.3 |
|
All other factors |
|
| 6.9 |
|
Total Variation |
| $ | 63.0 |
|
| Contribution margin from Spire EnergySouth acquisition | $ | 66.6 | |
| Spire Alabama – Lower RSE revenue reduction and higher CCM benefit | 19.2 | ||
| Spire Missouri - Higher ISRS charges | 14.2 | ||
| Spire Missouri - Higher off-system sales and capacity release | 1.4 | ||
| Weather / temperature adjustment impact | (8.6 | ) | |
| All other | 1.8 | ||
| Total Variation | $ | 94.6 | |
The contribution margin increase wasresulted primarily from higher off-system sales, Missouri ISRS (net of ISRS ruling provisions), Spire Alabama rate adjustments under the RSE mechanism, and higher volumetric margins. The higher off-system sales and volumetric impacts were primarily the result of the extreme weather conditions from Winter Storm Uri in February of the current year.
Operating Expenses– O&M expenses in fiscal 2021 increased by $0.9 million compared to the prior-year period. This variance reflects the Nonservice Cost Transfer of $2.1 and the $9.0 decrease attributable to the $66.6 of operating margin resulting from the Spire EnergySouth acquisition, lower RSE revenueMissouri Supreme Court ruling that partially reversed 2018 rate case pension cost disallowances. Excluding these impacts, O&M expenses increased by $7.8 due primarily to higher employee-related costs and $3.7 due to one-time cost adjustments beneficial CCM and return on capital impacts totaling $19.2 for Spire Alabama, and benefits of higher ISRS charges for the Missouri Utilities in 2017 of $14.2. These positive impacts offset the negative impact of weather and temperature adjustments. Temperatures in the Spire Missouri territory experienced degree days that were 1% warmer than last year and 20% warmer than normal. Degree days in the Spire Alabama service areas in fiscal 2017 were 15% warmer than the prior year, and 35% warmer than normal. Temperatures are a significant part of the Utilities’ rate cases, contributingrelating to the constrained margins experiencedstipulations settled in the current year.
Gas Marketing
Operating Revenues
–Gas Marketing operating revenue for theContribution Margin
– Gas Marketing contribution marginSpire Marketing, along with many natural gas industry participants, faced the unprecedented effects of Winter Storm Uri. Numerous natural gas producers and midstream operators were unable to deliver natural gas to market as they experienced wellhead freeze-offs, power outages and equipment failure from the extreme weather. These events resulted in supply curtailments, and related notices of force majeure to excuse performance, from and to certain counterparties. Further, these events have made Spire Marketing subject to various commercial disputes (including regarding force majeure) and a regulatory dispute regarding tariff obligations as a shipper on an interstate pipeline. As such, Spire Marketing recorded an estimate of potential liabilities for damages based on the facts and circumstances surrounding each counterparty transaction as of March 31, 2021. During the subsequent two quarters, a number of these disputes have been resolved and/or exposures clarified based on further communication with the counterparties. It is expected that the estimate will change as new facts emerge or further settlements are reached, and it is possible that final settlement amounts may materially differ from the current estimate.
Other
Other operating revenue increased $9.9 for the year ended September 30, 2021 compared to 2020, driven principally by Spire Storage and Spire STL Pipeline that was placed in service in November of 2019. Other operating expenses were $2.0 higher than the prior year reflecting higher activity levels at Spire Storage and Spire STL Pipeline FERC Certificate defense costs.
Interest Charges
Consolidated interest charges during the year ended September 30, 2021 increased $1.1 versus the prior year. The increase was primarily driven by net long-term debt issuances in the debt incurredcurrent year and assumed as a result of the prior year benefiting from Allowance for Funds Used in Construction (AFUDC) non-cash income at Spire EnergySouth acquisition generating interest expense of $8.5, combined with marginally higherSTL Pipeline. The current year also benefited from lower interest rates on floating rate debtthat were only slightly offset by higher levels of average short-term borrowings. Short-term rates averaged 0.4% in the first six months ofcurrent year versus 1.7% for the prior year and, higher interest rates on the senior notes issued in March of this year that were used to retire the $250.0 of floating rate debt. Also, for the twelve monthsyears ended September 30, 20172021 and 2016,2020, average short-term borrowings were $485.8$610.5 and $273.9, respectively, and the average interest rates on these borrowings were 1.2% and 0.9%,$576.2, respectively.
Income Taxes
Consolidated income tax expense increased $8.1during the year ended September 30, 2021 was $68.5, compared to $12.4 for fiscal 2020. This increase of $56.1 is primarily the result of the $31.3 tax benefit relating to the impairment loss recorded in the third quarter of fiscal 2017 from fiscal 2016 primarily2020, combined with higher pre-tax book income this year and a higher effective rate due to higher pre-tax income. Themix of earnings among entities in the current year effective tax rate of 32.4% was essentially flat versus fiscal 2016’s effective rate of 32.5%.year.
Spire Missouri
Summary Operating Results
|
| Year ended September 30, |
| |||||
|
| 2021 |
|
| 2020 |
| ||
Operating Income |
| $ | 228.6 |
|
| $ | 205.6 |
|
Operation and maintenance expenses |
|
| 261.1 |
|
|
| 251.0 |
|
Depreciation and amortization |
|
| 129.2 |
|
|
| 118.0 |
|
Taxes, other than income taxes |
|
| 110.9 |
|
|
| 103.2 |
|
Less: Gross receipts tax expense |
|
| (64.3 | ) |
|
| (63.5 | ) |
Contribution Margin [Non-GAAP] |
|
| 665.5 |
|
|
| 614.3 |
|
Natural gas costs |
|
| 786.8 |
|
|
| 515.8 |
|
Gross receipts tax expense |
|
| 64.3 |
|
|
| 63.5 |
|
Operating Revenues |
| $ | 1,516.6 |
|
| $ | 1,193.6 |
|
Net Income |
| $ | 144.1 |
|
| $ | 130.2 |
|
| Year ended September 30, | 2017 | 2016 | |||||
| Operating Income | $ | 196.9 | $ | 186.9 | |||
| Operation and maintenance expenses | 243.8 | 244.4 | |||||
| Depreciation and amortization | 93.1 | 88.6 | |||||
| Taxes, other than income taxes | 99.8 | 96.3 | |||||
| Less: Gross receipts tax expense | (60.0 | ) | (57.4 | ) | |||
| Contribution Margin (non-GAAP) | 573.6 | 558.8 | |||||
| Natural and propane gas costs | 538.3 | 471.3 | |||||
| Gross receipts tax expense | 60.0 | 57.4 | |||||
| Operating Revenues | $ | 1,171.9 | $ | 1,087.5 | |||
Operating revenues during the twelve months ended September 30, 20172021, increased $84.4$323.0 from the same period last year primarily due to a $183.2 increase attributable to higher gas costs (including $195.8 of cover charges and OFO penalties to certain wholesale customers), a $110.6 increase due to higher off-system sales, $15.9 higher ISRS, and a $6.7 increase in volumetric impacts (net of weather mitigation) relating to colder weather conditions primarily in the second quarter of the current year.
Contribution margin increased $51.2 versus the same period in the prior year. The variance was attributable to a $22.9 increase in off-system sales and $6.5 higher volumetric margins (both principally due to the extreme weather in February of the current year), as well as the previously mentioned $15.9 increase in ISRS, and $1.3 related to customer growth.
O&M expenses during the twelve months ended September 30, 2021, increased $10.1 from the same period last year. Revenues were impactedExcluding the Nonservice Cost Transfer of $5.0 and the Missouri Supreme Court ruling totaling $9.0 discussed above, O&M was higher by $14.1, reflecting higher employee-related expenses and $3.7 relating to cost adjustments relating to stipulations settled in the current Spire Missouri rate case. Depreciation increased by $11.2 as a result of continuing capital investment and a $3.4 charge pertaining to disallowed meter cost recovery by the MoPSC.
Spire Missouri’s other expense increased $0.2 versus the comparable prior-year period. Removing the impact of the Nonservice Cost Transfer of $5.0, other expense increased $5.2, primarily bydue to higher gas costs of $50.9 passed on to customers, $17.9 higher off- system and capacity release sales, higher ISRS charges of $14.2, and higher gross receipts taxes of $3.3. These impacts were slightlycharitable contributions in the current year only being partly offset by negative weather impacts.
Net income for the twelve months ended September 30, 20172021, increased $14.8 from$13.9 versus the same period last year. Higher ISRS charges of $14.2 were only partly offset by a negative $2.6 weather impact attributable to the 1% warmer weather experienced in the currentprior year.
Temperatures in Spire Missouri’s service areas during the twelve months ended September 30, 20172021, were $0.6 lower than the prior year. Lower employment-related costs were almost completely offset by higher professional services. Depreciation and amortization increased $4.5, reflecting continued infrastructure investments throughout Missouri. Interest expense in the current year was $1.7 greater than prior year, the result of a combination of higher short-term borrowings and higher average effective interest rates. Income taxes were $2.1 higher for the twelve months ended September 30, 2017 versus the comparable prior year period due to higher pre-tax book income, mitigated by a slightly lower effective tax rate.
Spire Alabama
Summary Operating Results
|
| Year ended September 30, |
| |||||
|
| 2021 |
|
| 2020 |
| ||
Operating Income |
| $ | 117.0 |
|
| $ | 102.9 |
|
Operation and maintenance expenses |
|
| 132.5 |
|
|
| 139.1 |
|
Depreciation and amortization |
|
| 62.1 |
|
|
| 59.3 |
|
Taxes, other than income taxes |
|
| 37.1 |
|
|
| 34.8 |
|
Less: Gross receipts tax expense |
|
| (25.1 | ) |
|
| (23.3 | ) |
Contribution Margin [Non-GAAP] |
|
| 323.6 |
|
|
| 312.8 |
|
Natural gas costs |
|
| 145.3 |
|
|
| 118.9 |
|
Gross receipts tax expense |
|
| 25.1 |
|
|
| 23.3 |
|
Operating Revenues |
| $ | 494.0 |
|
| $ | 455.0 |
|
Net Income |
| $ | 73.8 |
|
| $ | 65.7 |
|
| Year ended September 30, | 2017 | 2016 | |||||
| Operating Income | $ | 105.8 | $ | 91.5 | |||
| Operation and maintenance expenses | 130.4 | 133.5 | |||||
| Depreciation and amortization | 49.9 | 47.8 | |||||
| Taxes, other than income taxes | 29.9 | 28.4 | |||||
| Less: Gross receipts tax expense | (19.5 | ) | (17.9 | ) | |||
| Contribution Margin (Non-GAAP) | 296.5 | 283.3 | |||||
| Natural and propane gas costs | 84.5 | 67.3 | |||||
| Gross receipts tax expense | 19.5 | 17.9 | |||||
| Operating Revenues | $ | 400.5 | $ | 368.5 | |||
Operating revenues for the twelve months ended September 30, 20172021, increased $32.0 versus$39.0 from the comparablesame period ended September 30, 2016. Oflast year. The change was principally driven by a $25.2 increase in weather and usage impacts (net of weather mitigation) and $9.4 higher net rate adjustments under the increase, $19.2 of the increase related to lower RSE return on equity revenue adjustments and higher CCM benefitsmechanism. Off-system sales in the current year $11.2 resulted from weather/temperature adjustments, along with slightly higher gross receipts taxescontributed $2.4 to revenue growth, as off-system sales only commenced in the fourth quarter of $1.6.
Contribution margin increased $13.2 versus prior year, as $19.2 in favorable$10.8, which was principally a result of the rate adjustments under the RSE CCM adjustmentsmechanism of $9.8 and return on capital more than offset negative weather and usage impacts of $6.0. Contributing$1.2 related to the favorable current year RSE return on equity adjustment impact was a fiscal 2016 reduction in revenues relating to a legal settlement of $6.0. There was no impact to net income, as this revenue adjustment offset a corresponding $6.0 gain recorded in other income.
Net income for the twelve months ended September 30, 2016. The decrease in other operating expenses was driven primarily by lower employee-related costs, which were favorably impacted by the warmer weather in the current year. Depreciation and amortization was $2.1 higher2021, increased $8.1 versus the same period last year, the result of continued infrastructure investment throughout Spire Alabama’s service territory. Income tax expense increased $3.4, primarily due to the higher pre-tax book income earned in the currentprior year.
Temperatures in Spire Alabama’s service area during the twelve months ended September 30, 20172021, were 35% warmer than normal and 15% warmer12.0% colder than the same period alast year earlier.but 6.4% warmer than normal. Spire Alabama’s total system therms sold and transported were 900.61,029.6 million for the twelve months ended September 30, 2017,2021, compared with 878.11,034.8 million for the same period last year. Off-system sales, and related therms sold totaled 48.4 million, versus 54.3 million in the prior year.
LIQUIDITY AND CAPITAL RESOURCES
Recent Cash Flows
|
| 2021 |
|
| 2020 |
|
| 2019 |
| |||
Net cash provided by operating activities |
| $ | 249.8 |
|
| $ | 469.9 |
|
| $ | 450.9 |
|
Net cash used in investing activities |
|
| (622.0 | ) |
|
| (631.6 | ) |
|
| (838.3 | ) |
Net cash provided by financing activities |
|
| 379.4 |
|
|
| 160.0 |
|
|
| 371.8 |
|
Net cash provided by operating activities decreased $220.1 from 2020 to 2021 and increased $19.0 from 2019 to 2020. Principally, these changes were related to regulatory timing and fluctuations in working capital items, as discussed below in the Future Cash Requirements section. More specifically, when looking at the change from 2020 to 2021, the large increase in accounts receivable was due to the February 2021 cold weather event and the related delayed collections. In addition, this significant cold weather event impacted other areas, including increased inventories to ensure supply and increased accounts payable as related gas costs had risen. For furthermore information, onsee the GSA, RSE and CCM mechanisms, please see Note 1, Summarydiscussion of Significant Accounting Policies, and Spire Missouri’s Operational Flow Order in Note 15, Regulatory Matters, inof the Notes to Financial Statements.
In fiscal 2021, the Company used $9.6 less cash in investing activities than in fiscal 2016, compared with $136.92020, primarily driven by a $13.6 decrease in capital expenditures. The primary driver of the lower capital expenditures was a $53.3 decline related to Spire STL Pipeline and Spire Storage, largely offset by a $42.6 capital spending increase at Gas Utility, where the focus remained on infrastructure upgrades and new business development.
In fiscal 2020, the Company used $206.7 less cash in investing activities than in fiscal 2015. Basic2019. The major driver of the reduction was lower capital expenditures, down $184.9 versus the prior year. The Spire STL Pipeline, which was placed into service in the first fiscal quarter of 2020, accounted for $97.4 of the reduction, and diluted earnings per shareexpenditures at Spire Storage were $3.26 and $3.24, respectively, for$59.6 below prior year levels. Capital expenditures at the Utilities were down $29.1.
Net cash provided by financing activities was up $219.4 when comparing fiscal 2016 compared with basic and diluted earnings per share of $3.16 for2021 to fiscal 2015. Net economic earnings2020. Current year long-term debt issuances were $149.1 (or $3.42 per share)$629.1, or $119.1 higher than in fiscal 2016, compared with $138.3 (or $3.19 per share)2020, and the combination of lower net repayments of both long-term and short-term debt in fiscal 2015. 2021 contributed $150.8 to the year-over-year increase. Partially offsetting these increases was a $40.1 decline in cash generated from common stock issuances and $5.2 higher common stock dividend payments.
Net income increasedcash provided by financing activities declined $211.8 in fiscal 2016 compared to2020 versus fiscal 2015 primarily due to $5.7 income growth2019, the major driver being the prior year issuance of preferred stock that generated $242.0 in proceeds. Year-over-year net debt issuance increased by $32.3, and the Gas Utility segment and $3.0 income growthissuance of common stock generated $21.6 more cash in the Gas Marketing segment,fiscal 2020 than in fiscal 2019. These increases in cash were only partly offset by a $1.4 larger loss from other activities.
Future Cash Requirements
The Company’s short-term borrowing requirements typically peak during colder months when the Utilities borrow money to 2015. The increasescover the lag between when they purchase natural gas and when their customers pay for that gas. Changes in the wholesale cost of natural gas (including cash payments for margin deposits associated with Spire Missouri’s use of natural gas derivative instruments), variations in the timing of collections of gas cost under the Utilities’ PGA clauses and GSA riders, the seasonality of accounts receivable balances, and the utilization of storage gas inventories cause short-term cash requirements to net incomevary during the year and net economic earnings were drivenfrom year to year, and may cause significant variations in the Company’s cash provided by higher ISRS charges ator used in operating activities.
Spire’s material cash requirements as of September 30, 2021, are related to capital expenditures, principal and interest payments on long-term debt, natural gas purchase obligations, and dividends.
Total Company capital expenditures are planned to be $570 for fiscal 2022, though Spire Missouri and net favorable regulatory adjustments at Spire Alabama, partly offset by lower volumes resulting from warmer winter temperatures. The segment also benefited fromhad purchase commitments for only a decreasesmall portion of these as of September 30, 2021.
As detailed in O&M, which includes effectsNote 6, Long-Term Debt, of the warmer weather. These impacts were partly offset by an increaseNotes to Financial Statements in depreciation and amortization expenses. Additionally, interest expense was higherItem 8, $55.8 of the total $3,014.6 principal amount is due to the increase experienced by Spire Missouri. Income taxes were also higher due to higher pre-tax income for both the Spire Missouri and Spire Alabama.
Spire’s natural gas purchase obligations totaled $1,889.0, including $759.1 for fiscal 2016 increased $2.2 from fiscal 2015.2022, representing the minimum payments required under existing natural gas transportation and storage contracts and natural gas supply agreements. The increases in net income and net economic earnings were primarily attributableamounts reflect fixed obligations as well as obligations to increases in contribution margin, with the impact to net economic earnings being partly offset by mark-to-market activitypurchase natural gas at future market prices, calculated using forward market prices as discussed in the Gas Marketing section below.
Spire reported operating revenuesdividends declared and payable as of $1,537.3 for the fiscal year ended September 30, 2016 compared with $1,976.4 for2021, totaled $39.4, while annualized dividends based on the same prior year period. The decrease was driven primarily byregular quarterly amounts declared on November 11, 2021, are estimated at $156.
Source of Funds
It is management’s view that the Utilities, the result of lower volumes and lower gas costs passed on to customers. Spire’s contribution margin increased $7.1 for the twelve months ended September 30, 2016, compared to the same prior year period. The increase was primarily due to higher contribution margin of $5.0 and $2.3 for the Gas Marketing and Gas Utility segments, respectively, slightly offset by the lower contribution margin reported in Other. O&M expenses decreased $9.4 for the twelve months ended September 30, 2016 as compared to fiscal 2015, as discussed below. The decrease in O&M expenses was partially offset by $6.7 higher depreciation and amortization expense, driven principally by continued infrastructure investment at the Utilities in fiscal 2016.
| Lower wholesale gas costs passed on to customers | $ | (262.8 | ) |
| Lower system sales volumes | (147.4 | ) | |
| Spire Missouri - Lower off-system sales and capacity release | (25.3 | ) | |
| Lower gross receipts tax | (21.8 | ) | |
| Spire Missouri - Higher ISRS charges | 13.8 | ||
| Spire Alabama - Lower RSE revenue adjustments | 4.5 | ||
| New customer revenue from Spire EnergySouth acquisition | 3.3 | ||
| All other | (0.7 | ) | |
| Total Variation | $ | (436.4 | ) |
| Lower system sales volume | $ | (18.0 | ) |
| Spire Missouri - Higher ISRS charges | 13.8 | ||
| Spire Alabama - Lower RSE revenue adjustments | 4.5 | ||
| Contribution margin from Spire EnergySouth acquisition | 2.2 | ||
| All other | (0.2 | ) | |
| Total Variation | $ | 2.3 | |
The Company’s, Spire Missouri’s and Spire Alabama’s access to capital markets, including the commercial paper market, and their respective financing costs, may depend on the credit rating of the entity that is accessing the capital markets. Their debt is rated by two rating agencies: Standard & Poor’s Corporation (“S&P”) and Moody’s Investors Service (“Moody’s”). As of September 30, 2021, the debt ratings of the Company, Spire Missouri and Spire Alabama, shown in the same period infollowing table, remain at investment grade with a stable outlook.
S&P | Moody’s | |||
Spire Inc. senior unsecured long-term debt | BBB+ | Baa2 | ||
Spire Inc. preferred stock | BBB | Ba1 | ||
Spire Inc. short-term debt | A-2 | P-2 | ||
Spire Missouri senior secured long-term debt | A | A1 | ||
Spire Alabama senior unsecured long-term debt | A- | A2 |
Cash and Cash Equivalents
Bank deposits were used to support working capital needs of the prior year, respectively, significantly contributing to the $18.0 negative volume impact on contribution margin in fiscal 2016.
Short-term Debt
The Utilities’ short-term borrowing requirements typically peak during the twelvecolder months, ended September 30, 2015, due principally to continued infrastructure capital spending in fiscal 2016. O&M expenses decreased $8.4 forwhile most of the twelve months ended September 30, 2016 compared to the same period in the prior year. Excluding the impact of a $7.6 gain onCompany’s other needs are less seasonal. These short-term cash requirements can be met through the sale of propertycommercial paper or the use of a revolving credit facility. For information about these resources, see Note 7, Notes Payable and Credit Agreements, of the Notes to Financial Statements in 2015, O&M expensesItem 8 and “Interest Rate Risk” under “Market Risk” below.
Long-term Debt and Equity
At September 30, 2021, including the current portion but excluding unamortized discounts and debt issuance costs, Spire had long-term debt totaling $3,014.6, of which $1,348.0 was issued by Spire Missouri, $625.0 was issued by Spire Alabama, and $211.6 was issued by other subsidiaries. For more information about long-term debt, see Note 6 of the Notes to Financial Statements in Item 8 and “Interest Rate Risk” under “Market Risk” below.
On December 15, 2020, Spire Alabama issued and sold to certain institutional investors in a private placement $150.0 of 2.04% Series 2020 Senior Notes due December 15, 2030. Interest is payable semi-annually. The notes are senior unsecured obligations of Spire Alabama and rank equal in right to payment with all its other senior unsecured indebtedness. Spire Alabama used the proceeds to repay short-term debt.
In February 2021, Spire issued 3.5 million equity units for an aggregate stated amount of $175.0, resulting in net proceeds of $169.3 after underwriting fees and other issuance costs. See Note 5, Shareholders’ Equity, of the Notes to Financial Statements in Item 8 for additional discussion of these equity units.
On May 20, 2021, pursuant to its registration statement on Form S-3 filed with the SEC, Spire Missouri issued $305.0 of 3.30% first mortgage bonds due June 1, 2051, secured equally with all its other first mortgage bonds. Interest is payable semi-annually. Spire Missouri used the proceeds to redeem $55.0 principal amount of 3.00% first mortgage bonds due March 15, 2023, and to repay short-term debt.
Spire Missouri was authorized by the MoPSC to issue registered securities (first mortgage bonds, unsecured debt and preferred stock), common stock, and private placement debt in an aggregate amount of up to $660.0 for financings placed any time before September 30, 2023. As of September 30, 2021, $355.0 remained available under this authorization. Spire Alabama has no standing authority to issue long-term debt and must petition the APSC for each planned issuance.
Spire has a shelf registration statement on Form S-3 on file with the SEC for the issuance and sale of up to 250,000 shares of common stock under its Dividend Reinvestment and Direct Stock Purchase Plan. There were $16.0 below 2015 levels due primarily182,689 and 177,295 shares at September 30, 2021 and November 12, 2021, respectively, remaining available for issuance under this Form S-3. Spire and Spire Missouri also have a universal shelf registration statement on Form S-3 on file with the SEC for the issuance of various equity and debt securities, which expires on May 14, 2022.
On February 6, 2019, Spire entered into an “at-the-market” equity distribution agreement, supplemented as of May 14, 2019, pursuant to lower badwhich the Company may offer and sell, from time to time, shares of its common stock having an aggregate offering price of up to $150.0. Those shares are issued pursuant to Spire’s universal shelf registration statement referenced above and a prospectus supplement dated May 14, 2019. Under this program, a total of 626,249 shares were issued in fiscal 2019 and 2020, and as of September 30, 2021, Spire can still issue shares having an aggregate offering price of up to $102.2.
Including the current portion of long-term debt, expense (reflectingthe Company’s long-term consolidated capitalization consisted of 47% equity at September 30, 2021 and 50% equity at September 30, 2020. For more information about equity, see Note 5 of the Notes to Financial Statements in Item 8.
ENVIRONMENTAL MATTERS
The Utilities and other Spire subsidiaries own and operate natural gas distribution, transmission and storage facilities, the operations of which are subject to various environmental laws, regulations and interpretations. While environmental issues resulting from such operations arise in the ordinary course of business, such issues have not materially affected the Company’s, Spire Missouri’s or Spire Alabama’s financial position and results of operations. As environmental laws, regulations and their interpretations change, however, the Company and the Utilities may be required to incur additional costs. For information relative to environmental matters, see Contingencies in Note 16 of the Notes to Financial Statements in Item 8.
REGULATORY MATTERS
In May and July 2021, the U.S. Department of Homeland Security’s Transportation Security Administration issued security directives that included several new cybersecurity requirements for critical pipeline owners and operators. Among these requirements is the implementation of specific mitigation measures to protect against ransomware attacks and other known threats to information and operational technology systems; development and implementation of a cybersecurity contingency and recovery plan; and performance of a cybersecurity architecture design review. We are currently implementing several of these directives and evaluating the potential effect of several others on our operations and facilities, as well as the potential cost of implementation, and will continue to monitor for any clarifications or amendments to these directives. We are also engaged in a continuous program of testing and updating our cybersecurity measures.
For discussions of other regulatory matters for Spire, Spire Missouri, and Spire Alabama, see Note 15, Regulatory Matters, of the Notes to Financial Statements in Item 8.
ACCOUNTING PRONOUNCEMENTS
The Company, Spire Missouri and Spire Alabama have evaluated or are in the process of evaluating the impact that recently issued accounting standards will have on their financial position or results of warmer weather experienced during the heating season) and employee-related costs.
CRITICAL ACCOUNTING ESTIMATES
Our discussion and analysis of our financial condition, results of operations, liquidity and capital resources are based upon our financial statements, which have been prepared in accordance with GAAP, which requires that we make estimates and judgments that affect the reported amounts of assets, liabilities, revenues and expenses, and related disclosure of contingent assets and liabilities. We evaluate our estimates on an ongoing basis. We base our estimates on historical experience and on various other assumptions that we believe are reasonable under the circumstances, the results of which form the basis for making judgments about the carrying values of assets and liabilities that are not readily apparent from other sources. Actual results may differ from these estimates. We believe the following represent the more significant items requiring the use of judgment and estimates in preparing our financial statements:
Regulatory Accounting
– The Utilities account for their regulated operations in accordance withPGA Clause
– Spire Missouri’s PGA clauses allowsGSA Rider
–Spire Alabama’s rate schedules for natural gas distribution charges contain a GSA rider, established in 1993, which permits the pass-through to customers of changes in the cost of gas supply. Spire Alabama’s tariff provides a temperature adjustment mechanism, also included in the GSA, that is designed to moderate the impact of departures from normal temperatures on Spire Alabama’s earnings. The temperature adjustment applies primarily to residential, small commercial and small industrial customers. Other non-temperature weather related conditions that may affect customer usage are not included in the temperature adjustment. In prior years, Spire Alabama entered into cash flow derivative commodity instruments to hedge its exposure to price fluctuations on its gas supply. Spire Alabama recognizes all derivatives at fair value as either assets or liabilities on the balance sheet. Any realized gains or losses are passed through to customers using the mechanisms of the GSA rider in accordance with Spire Alabama’s APSC approved tariff and are recognized as a regulatory asset or regulatory liability. All derivative commodity instruments in a gain position are valued on a discounted basis incorporating an estimate of performance risk specific to each related counterparty. Derivative commodity instruments in a loss position are valued on a discounted basis incorporating an estimate of performance risk specific to Spire Alabama. Spire Alabama currently has no active gas supply derivative positions.ISRS –The ISRS allows Spire Missouri expedited recovery for its investment to upgrade its infrastructure and enhance its safety and reliability without the necessity of a formal rate case. Spire Missouri records ISRS revenues as authorized by the excessMoPSC and estimates the probability and amount of any refunds based on commission precedent, current legal rulings, the opinion of legal counsel, and other considerations.
For more information, see Note 15, Regulatory Matters, of the acquisition-date fair value of the consideration transferred over the amount of acquisition-date identifiable assets acquired net of assumed liabilities, and adjustments are recorded during the measurement periodNotes to finalize the allocation of purchase price. Spire Missouri has recorded goodwill related to the 2013 acquisition of Spire Missouri West, and Spire also has recorded goodwill related to the 2016 and 2014 acquisitions of Spire EnergySouth and Spire Alabama, respectively. Neither Spire EnergySouth nor Spire Alabama have goodwill on their balance sheets as push down accounting was not applied. Spire and Spire Missouri evaluate goodwill for impairment as of July 1 of each year, or more frequently if events and circumstances indicate that goodwill might be impaired. The goodwill impairment test compares the fair value of each reporting unit to its carrying amount, including goodwill. At July 1, 2017, 2016 and 2015, Spire and Spire Missouri each applied a quantitative goodwill evaluation model to their reporting units and concluded goodwill was not impaired because the fair value exceeded the carrying amounts.
Employee Benefits and Postretirement Obligations
– Pension and postretirement obligations are calculated by actuarial consultants that utilize several statistical factors and other assumptions provided by management related to future events, such as discount rates, returns on plan assets, compensation increases, and mortality rates. For the Utilities, the amount of expense recognized and the amounts reflected in other comprehensive income are dependent upon the regulatory treatment provided for such costs, as discussed further below. Certain liabilities related to group medical benefits and workers’ compensation claims, portions of which are self-insured and/or contain “stop-loss” coverage with third-party insurers to limit exposure, are established based on historical trends.The amount of net periodic pension and other postretirement benefit costs recognized in the financial statements related to the Utilities’ qualified pension plans and other postretirement benefit plans is based upon allowances, as approved by the MoPSC (for Spire Missouri) and as approved by the APSC (for Spire Alabama). The allowances have been established in the rate-making process for the recovery of these costs from customers. The differences between these amounts and actual pension and other postretirement benefit costs incurred for financial reporting purposes are deferred as regulatory assets or regulatory liabilities. GAAP also requires that changes that affect the funded status of pension and other postretirement benefit plans, but that are not yet required to be recognized as components of pension and other postretirement benefit costs, be reflected in other comprehensive income. For the Utilities’ qualified pension plans and other postretirement benefit plans, amounts that would otherwise be reflected in other comprehensive income are deferred with entries to regulatory assets or regulatory liabilities.
For more information, see Note 13, Pension Plans and Other Postretirement Benefits, of the Notes to Financial Statements in Item 8.
The tables below reflect the sensitivity of Spire’s plans to potential changes in key assumptions:
Pension Plan Benefits:
Actuarial Assumptions |
| Increase/ (Decrease) |
| Estimated Increase/ (Decrease) to Projected Benefit Obligation |
| Estimated Increase/ (Decrease) to Annual Net Pension Cost* | ||||||||||||
Discount Rate |
|
|
| 0.25 | % |
|
|
| $ | (19.5 | ) |
|
|
| $ | 0.4 |
|
|
|
|
|
| (0.25 | )% |
|
|
|
| 20.6 |
|
|
|
|
| (0.5 | ) |
|
Expected Return on Plan Assets |
|
|
| 0.25 | % |
|
|
|
| — |
|
|
|
|
| (1.1 | ) |
|
|
|
|
| (0.25 | )% |
|
|
|
| — |
|
|
|
|
| 1.1 |
|
|
Rate of Future Compensation Increase |
|
|
| 0.25 | % |
|
|
|
| 1.3 |
|
|
|
|
| 0.3 |
|
|
|
|
|
| (0.25 | )% |
|
|
|
| (1.3 | ) |
|
|
|
| (0.2 | ) |
|
Postretirement Benefits:
Actuarial Assumptions |
| Increase/ (Decrease) |
| Estimated Increase/ (Decrease) to Projected Postretirement Benefit Obligation |
| Estimated Increase/ (Decrease) to Annual Net Postretirement Benefit Cost* | ||||||||||||
Discount Rate |
|
|
| 0.25 | % |
|
|
| $ | (4.8 | ) |
|
|
| $ | 0.1 |
|
|
|
|
|
| (0.25 | )% |
|
|
|
| 4.9 |
|
|
|
|
| (0.1 | ) |
|
Expected Return on Plan Assets |
|
|
| 0.25 | % |
|
|
|
| — |
|
|
|
|
| (0.7 | ) |
|
|
|
|
| (0.25 | )% |
|
|
|
| — |
|
|
|
|
| 0.7 |
|
|
Pension Plan Benefits: Actuarial Assumptions | Increase/ (Decrease) | Estimated Increase/ (Decrease) to Projected Benefit Obligation | Estimated Increase/ (Decrease) to Annual Net Pension Cost* | ||||||||||||||
| Discount Rate | 0.25 | % | $ | (17.9 | ) | $ | 0.6 | ||||||||||
| (0.25 | )% | 18.7 | (0.6 | ) | |||||||||||||
| Expected Return on Plan Assets | 0.25 | % | — | (1.1 | ) | ||||||||||||
| (0.25 | )% | — | 1.3 | ||||||||||||||
| Rate of Future Compensation Increase | 0.25 | % | 4.9 | 0.6 | |||||||||||||
| (0.25 | )% | (4.7 | ) | (0.5 | ) | ||||||||||||
Postretirement Benefits: Actuarial Assumptions | Increase/ (Decrease) | Estimated Increase/ (Decrease) to Projected Postretirement Benefit Obligation | Estimated Increase/ (Decrease) to Annual Net Postretirement Benefit Cost* | ||||||||||||||
| Discount Rate | 0.25 | % | $ | (5.0 | ) | $ | 0.1 | ||||||||||
| (0.25 | )% | 5.2 | (0.1 | ) | |||||||||||||
| Expected Return on Plan Assets | 0.25 | % | — | (0.6 | ) | ||||||||||||
| (0.25 | )% | — | 0.6 | ||||||||||||||
| Annual Medical Cost Trend | 1.00 | % | 10.0 | 1.7 | |||||||||||||
| (1.00 | )% | (9.2 | ) | (1.4 | ) | ||||||||||||
* | Excludes the impact of regulatory deferral mechanism. See Note 13, Pension Plans and Other Postretirement Benefits, of the Notes to Financial Statements in Item 8 for information regarding the regulatory treatment of these costs. |
Impairment of Long-lived Assets – Long-lived assets classified as held and used are evaluated for impairment when events or changes in circumstances indicate that the carrying value of such assets may not be recoverable. Whether impairment has occurred is determined by comparing the estimated undiscounted cash flows attributable to the assets with the carrying value of the assets. If the carrying value exceeds the undiscounted cash flows, the Company recognizes an impairment charge equal to the amount of the carrying value that exceeds the estimated fair value of the assets. In the period in which the Company determines an asset meets held-for-sale criteria, an impairment charge is recorded to the extent the book value exceeds its fair value less cost to sell.
On July 1, 2020, Spire’s Board of Directors, based upon the recommendation of senior management, revised the development plan for Spire Storage, resulting in an impairment charge of $140.8 related to Spire Storage assets in the quarter ended June 30, 2020. The revision was driven by the realization that a longer time horizon will be required for optimization and positioning of the storage facility to serve energy markets in the western United States. Among other factors, evaluations of the continuing evolution of market dynamics in the region led management to update models of various development alternatives. Separately in the quarter ended June 30, 2020, Spire recorded impairment charges totaling $7.8 related to two commercial compressed natural gas fueling stations as a result of revised projections reflecting lower diesel prices and slower conversions of Class 8 vehicles. The fair values used in measuring the impairment charges were determined with an expected present value technique using a discounted cash flow method under an income approach. Our impairment loss calculations required management to make assumptions and to apply judgment in order to estimate fair values of the assets. This involved estimating cash flows, useful lives, and current market value for similar assets and selecting a discount rate that reflects the risk inherent in future cash flows. Cash flow projections were based on assumptions about future market demand and achievement of certain operational capabilities. Assumptions were selected from a range of reasonably possible amounts and were supported by relevant and reliable data. However, if actual results are not consistent with our estimates and assumptions, we may be exposed to additional impairments that could be material. We do not believe there is a reasonable likelihood that there will be a material change in the estimates or assumptions we use to calculate asset impairment losses.
Income Taxes – Income tax calculations require estimates due to book-tax differences, estimates with respect to regulatory treatment of certain items, and uncertainty in the interpretation of tax laws and regulations. Critical assumptions and judgments also include projections of future taxable income to determine the ability to utilize net operating losses and credit carryforwards prior to their expiration. Deferred tax assets and liabilities are measured using enacted tax rates expected to apply to taxable income in the years in which those temporary differences are expected to be recovered or settled. Management regularly assesses financial statement tax provisions to identify any change in regulatory treatment or tax related estimates and assumptions that could have a material impact on cash flows, financial position and/or results of operations. For more information, see Note 12, Income Taxes, of the Notes to Financial Statements in Item 8.
For further discussion of significant accounting policies, see Note 1, Summary of Significant Accounting Policies, of the Notes to Financial Statements.
| Cash Flow Summary | 2017 | 2016 | 2015 | ||||||||
| Net cash provided by operating activities | $ | 288.3 | $ | 328.3 | $ | 322.4 | |||||
| Net cash used in investing activities | (433.5 | ) | (612.7 | ) | (298.7 | ) | |||||
| Net cash provided by (used in) financing activities | 147.4 | 275.8 | (26.0 | ) | |||||||
Spire Short‑term Borrowings1 | Spire Missouri Commercial Paper Borrowings2 | Spire Alabama Bank Line Borrowings | Total Short‑term Borrowings | |
| Year Ended September 30, 2017 | ||||
| Weighted average borrowings outstanding | $369.0 | $88.5 | $28.3 | $485.8 |
| Weighted average interest rate | 1.3% | 0.9% | 1.6% | 1.2% |
| Range of borrowings outstanding | $73.0 - $675.6 | $0.0 - $329.7 | $0.0 - $102.5 | $395.5 - $675.6 |
| As of September 30, 2017 | ||||
| Borrowings outstanding | $477.3 | $— | $— | $477.3 |
| Weighted average interest rate | 1.5% | —% | —% | 1.5% |
| Year Ended September 30, 2016 | ||||
| Weighted average borrowings outstanding | $42.7 | $201.0 | $30.2 | $273.9 |
| Weighted average interest rate | 1.6% | 0.7% | 1.4% | 0.9% |
| Range of borrowings outstanding | $0.0 - $82.0 | $43.0 - $307.2 | $0.0 - $82.0 | $73.1 - $427.2 |
| As of September 30, 2016 | ||||
| Borrowings outstanding | $73.0 | $243.7 | $82.0 | $398.7 |
| Weighted average interest rate | 1.8% | 0.8% | 1.5% | 1.1% |
| Spire | Spire Missouri | Spire Alabama | |||||||||
| 2018 | $ | 100.0 | $ | 100.0 | $ | — | |||||
| 2019 | 180.0 | 50.0 | — | ||||||||
| 2020 | 40.0 | — | 40.0 | ||||||||
| 2021 | 55.0 | — | — | ||||||||
| 2022 | 50.0 | — | 50.0 | ||||||||
| Payments due by period | |||||||||||||||||||
| Contractual Obligations | Total | Less than 1 Year | 1-3 Years | 3-5 Years | More than 5 Years | ||||||||||||||
| Principal Payments on Long-term Debt | $ | 2,112.0 | $ | 100.0 | $ | 220.0 | $ | 105.0 | $ | 1,687.0 | |||||||||
| Interest Payments on Long-term Debt (a) | 1,242.5 | 85.8 | 160.4 | 144.6 | 851.7 | ||||||||||||||
| Operating Leases (b) | 83.7 | 10.1 | 17.1 | 12.1 | 44.4 | ||||||||||||||
| Purchase Obligations – Natural Gas (c) | 1,281.8 | 703.3 | 373.9 | 66.8 | 137.8 | ||||||||||||||
| Purchase Obligations – Other (d) | 74.9 | 63.6 | 9.2 | 1.8 | 0.3 | ||||||||||||||
| Asset Retirement Obligations | 296.6 | 10.1 | 23.3 | 16.8 | 246.4 | ||||||||||||||
| Total (e) | $ | 5,091.5 | $ | 972.9 | $ | 803.9 | $ | 347.1 | $ | 2,967.6 | |||||||||
MARKET RISK
Commodity Price Risk
Gas Utility
The Utilities’ commodity price risk, which arises from market fluctuations in the price of natural gas, is primarily managed through the operation of the Missouri Utilities’Spire Missouri’s PGA clauses and Spire Alabama’s GSA rider. The PGA clauses and GSA rider allows the Utilities to flow through to customers, subject to prudence review by the MoPSC and APSC, the cost of purchased gas supplies, as well as gas inventory carrying costs.supplies. Spire Missouri is allowed the flexibility to make up to three discretionary PGA changes during each year, in addition to its mandatory November PGA change, so long as such changes are separated by at least two months. Spire Missouri is able to mitigate, to some extent, changes in commodity prices through the use of physical storage supplies and regional supply diversity. The Utilities also have risk management policies that allow for the purchase of natural gas derivative instruments with the goal of managing its price risk associated with purchasing natural gas on behalf of its customers. These policies prohibit speculation. As of September 30, 2017,2021, Spire Missouri had active natural gas derivative positions, but Spire Alabama did not. Costs and cost reduction, including carrying costs, associated with the use of natural gas derivative instruments are allowed to be passed on to customers through the operation of the PGA clauses or GSA rider. Accordingly, the Utilities do not expect any adverse earnings impact as a result of the use of these derivative instruments. However, the timing of recovery for cash payments related to margin requirements may cause short-term cash requirements to vary. For more information about the Utilities’ natural gas derivative instruments, see
Gas Marketing
In the course of its business, Spire’s non-regulated gas marketing subsidiary, Spire Marketing, enters into contracts to purchase and sell natural gas at fixed prices and natural gas index-based prices. Commodity price risk associated with these contracts has the potential to impact earnings and cash flows. To minimize this risk, Spire Marketing has a risk management policy that provides for daily monitoring of a number of business measures, including fixed price commitments. In accordance with the risk management policy, Spire Marketing manages the price risk associated with its fixed price commitments. This risk is currently managed either by closely matching the offsetting physical purchase or sale of natural gas at fixed-prices or through the use of natural gas futures, options and swap contracts traded on or cleared through the New York Mercantile Exchange (NYMEX) and Intercontinental Exchange (ICE) to lock in margins. At September 30, 20172021 and 2016,2020, Spire Marketing’s unmatched fixed-price positions were not material to Spire’s financial position or results of operations.
As mentioned above, Spire Marketing uses natural gas futures, options and swap contracts traded on or cleared through the NYMEX and ICE to manage the commodity price risk associated with its fixed-price natural gas purchase and sale commitments. These derivative instruments may be designated as cash flow hedges of forecasted purchases or sales. Such accounting treatment, if elected, generally permits a substantial portion of the gain or loss to be deferred from recognition in earnings until the period that the associated forecasted purchase or sale is recognized in earnings. To the extent a hedge is effective, gains or losses on the derivatives will be offset by changes in the value of the hedged forecasted transactions. Information about the fair values of Spire Marketing’s exchange-traded/cleared natural gas derivative instruments is presented below:
|
| Derivative Fair Values |
|
| Cash Margin |
|
| Derivatives and Cash Margin |
| |||
Net balance of derivative assets at September 30, 2020 |
| $ | 5.7 |
|
| $ | (0.4 | ) |
| $ | 5.3 |
|
Changes in fair value |
|
| 77.5 |
|
|
| — |
|
|
| 77.5 |
|
Settlements/purchases - net |
|
| (31.1 | ) |
|
| — |
|
|
| (31.1 | ) |
Changes in cash margin |
|
| — |
|
|
| (38.9 | ) |
|
| (38.9 | ) |
Net balance of derivative assets at September 30, 2021 |
| $ | 52.1 |
|
| $ | (39.3 | ) |
| $ | 12.8 |
|
|
| As of September 30, 2021 | |||||||||||||||||||
Maturity by Fiscal Year |
| Total |
|
| 2022 |
|
| 2023 |
|
| 2024 |
|
| 2025 |
|
| |||||
Fair values of exchange-traded/cleared natural gas derivatives - net |
| $ | 59.3 |
|
| $ | 51.0 |
|
| $ | 7.9 |
|
| $ | 0.3 |
|
| $ | 0.1 |
|
|
Fair values of basis swaps - net |
|
| 1.7 |
|
|
| 1.1 |
|
|
| 0.5 |
|
|
| 0.1 |
|
|
| — |
|
|
Fair values of puts and calls - net |
|
| (8.3 | ) |
|
| (8.2 | ) |
|
| (0.1 | ) |
|
| — |
|
|
| — |
|
|
|
|
|
|
|
|
|
|
|
|
|
|
|
|
|
|
|
|
|
|
|
|
Position volumes: |
|
|
|
|
|
|
|
|
|
|
|
|
|
|
|
|
|
|
|
|
|
MMBtu - net (short) long futures/swap/option positions |
|
| 61.9 |
|
|
| 41.5 |
|
|
| 18.4 |
|
|
| 1.8 |
|
|
| 0.2 |
|
|
MMBtu - net (short) long basis swap positions |
|
| 0.1 |
|
|
| 2.4 |
|
|
| (1.9 | ) |
|
| (0.4 | ) |
|
| — |
|
|
MMBtu - net (short) puts and calls positions |
|
| (2.4 | ) |
|
| (2.4 | ) |
|
| — |
|
|
| — |
|
|
| — |
|
|
Derivative Fair Values | Cash Margin | Derivatives and Cash Margin | |||||||||
| Net balance of derivative assets at September 30, 2016 | $ | (1.3 | ) | $ | 4.1 | $ | 2.8 | ||||
| Changes in fair value | 4.4 | — | 4.4 | ||||||||
| Settlements/purchases - net | (2.7 | ) | — | (2.7 | ) | ||||||
| Changes in cash margin | — | (2.2 | ) | (2.2 | ) | ||||||
| Net balance of derivative assets at September 30, 2017 | $ | 0.4 | $ | 1.9 | $ | 2.3 | |||||
| As of September 30, 2017 | |||||||||||||||||||||||
| Maturity by Fiscal Year | Total | 2018 | 2019 | 2020 | 2021 | 2022 | |||||||||||||||||
| Fair values of exchange-traded/cleared natural gas derivatives - net | $ | 0.6 | $ | 0.6 | $ | — | $ | — | $ | — | $ | — | |||||||||||
| Fair values of basis swaps - net | (0.1 | ) | (0.3 | ) | 0.2 | — | — | — | |||||||||||||||
| Position volumes: | |||||||||||||||||||||||
| MMBtu - net (short) long futures/swap/option positions | (16.1 | ) | (18.6 | ) | (0.9 | ) | 1.9 | 0.8 | 0.7 | ||||||||||||||
| MMBtu - net (short) long basis swap positions | (4.2 | ) | (2.9 | ) | (1.1 | ) | (0.2 | ) | — | — | |||||||||||||
Certain of Spire Marketing’s physical natural gas derivative contracts are designated as normal purchases or normal sales, as permitted by GAAP. This election permits the Company to account for the contract in the period the natural gas is delivered. Contracts not designated as normal purchases or normal sales, including those designated as trading activities, are accounted for as derivatives with changes in fair value recognized in earnings in the periods prior to settlement.
Below is a reconciliation of the beginning and ending balances for physical natural gas contracts accounted for as derivatives, none of which will settle beyond fiscal 2020:2022:
Net balance of derivative liabilities at September 30, 2020 |
| $ | (7.4 | ) |
Changes in fair value |
|
| (50.8 | ) |
Settlements |
|
| (3.3 | ) |
Net balance of derivative liabilities at September 30, 2021 |
| $ | (61.5 | ) |
| Net balance of derivative assets at September 30, 2016 | $ | 6.3 | |
| Changes in fair value | (0.7 | ) | |
| Settlements | (7.1 | ) | |
| Net balance of derivative liabilities at September 30, 2017 | $ | (1.5 | ) |
For further details related to Spire Marketing’s derivatives and hedging activities, see
Note 10, Derivative Instruments and Hedging Activities, of the Notes to FinancialCounterparty Credit Risk
Spire Marketing has concentrations of counterparty credit risk in that a significant portion of its transactions are with energy producers, utility companies and pipelines. These concentrations of counterparties have the potential to affect the Company’s overall exposure to credit risk, either positively or negatively, in that each of these three groups may be affected similarly by changes in economic, industry or other conditions. Spire Marketing also has concentrations of credit risk with certain individually significant counterparties. To the extent possible, Spire Marketing enters into netting arrangements with its counterparties to mitigate exposure to credit risk. It is also exposed to credit risk associated with its derivative contracts designated as normal purchases and normal sales. Spire Marketing closely monitors its credit exposure and, although uncollectible amounts have not been significant, increased counterparty defaults are possible and may result in financial losses and/or capital limitations. For more information on these and other concentrations of credit risk, including how Spire Marketing manages these risks, see
Note 11,Concentrations of Credit Risk, of the Notes to FinancialInterest Rate Risk
The Company is subject to interest rate risk associated with its long-term and short-term debt issuances. Based on average short-term borrowings during fiscal 2017,2021, an increase of 100 basis points in the underlying average interest rate for short-term debt would have caused an increase in interest expense (and a decrease in pre-tax earnings and cash flows) of approximately $4.9$6.1 on an annual basis. Portions of such increasesan increase may be offset through the Utilities’ application of PGA and GSA carrying costs. At September 30, 2017,2021, Spire had no variable rate long-term debt outstanding but had fixed-rate long-term debt totaling $2,112.0,$3,014.6, of which includes $67.0 of fixed-rate long-term debt assumed through the acquisition of Spire EnergySouth.$1,348.0 was issued by Spire Missouri, had fixed-rate long-term debt totaling $980.0 and$625.0 was issued by Spire Alabama, had fixed rate long-term debt of $250.0, both included in Spire’s total long-term debt.and $1,041.6 was issued by Spire and other subsidiaries. While thesethe long-term debt issues are fixed-rate, they are subject to changes in fair value as market interest rates change. However, increases or decreases in fair value would impact earnings and cash flows only if the Company were to reacquire any of these issues in the open market prior to maturity. Under GAAP applicable to the Utilities’ regulated operations, losses or gains on early redemptions of long-term debt would typically be deferred as regulatory assets or regulatory liabilities and amortized over a future period.
Refer to
Note 10, Derivative Instruments and Hedging Activities, of the Notes to Financial Statements in Item 8 for additional details onItem 7A. Quantitative and Qualitative Disclosures About Market Risk
For this discussion, see “Market Risk” in Item 7, Management’s Discussion and Analysis of Financial Condition and Results of Operations –
Item 8. Financial Statements and Supplementary Data
Page | |||
50 | |||
51 | |||
Financial Statements (for years ended September 30, | |||
Spire Inc. | |||
58 | |||
59 | |||
60 | |||
62 | |||
63 | |||
Spire Missouri Inc. | |||
64 | |||
65 | |||
67 | |||
68 | |||
Spire Alabama Inc. | |||
69 | |||
70 | |||
72 | |||
73 | |||
Notes to Financial Statements | |||
74 | |||
81 | |||
83 | |||
86 | |||
86 | |||
90 | |||
92 | |||
93 | |||
94 | |||
96 | |||
102 | |||
103 | |||
105 | |||
115 | |||
117 | |||
124 | |||
127 |
Management Reports on Internal Control over Financial Reporting
Spire Inc.
Management is responsible for establishing and maintaining adequate internal controls over financial reporting. Spire Inc.’s internal control over financial reporting is a process designed to provide reasonable assurance regarding the reliability of financial reporting and the preparation of financial statements for external purposes in accordance with accounting principles generally accepted in the United States of America. Because of its inherent limitations, internal control over financial reporting may not prevent or detect misstatements and can provide only reasonable assurance with respect to financial statement preparation and presentation. Also, projections of any evaluation of effectiveness to future periods are subject to the risks that controls may become inadequate because of changes in conditions, or that the degree of compliance with the policies or procedures may deteriorate.
Spire Inc.’s management, including ourits Chief Executive Officer and Chief Financial Officer, conducted an assessment of the effectiveness of Spire Inc.’s internal control over financial reporting as of September 30, 2017.2021. In making this assessment, management used the criteria in
Spire Missouri Inc.
Management is responsible for establishing and maintaining adequate internal controls over financial reporting. Spire Missouri Inc.’s internal control over financial reporting is a process designed to provide reasonable assurance regarding the reliability of financial reporting and the preparation of financial statements for external purposes in accordance with accounting principles generally accepted in the United States of America. Because of its inherent limitations, internal control over financial reporting may not prevent or detect misstatements and can provide only reasonable assurance with respect to financial statement preparation and presentation. Also, projections of any evaluation of effectiveness to future periods are subject to the risks that controls may become inadequate because of changes in conditions, or that the degree of compliance with the policies or procedures may deteriorate.
Spire Missouri Inc.’s management, including ourits Chief Executive Officer and Chief Financial Officer, conducted an assessment of the effectiveness of Spire Missouri Inc.’s internal control over financial reporting as of September 30, 2017.2021. In making this assessment, management used the criteria in
Spire Alabama Inc.
Management is responsible for establishing and maintaining adequate internal controls over financial reporting. Spire Alabama Inc.’s internal control over financial reporting is a process designed to provide reasonable assurance regarding the reliability of financial reporting and the preparation of financial statements for external purposes in accordance with accounting principles generally accepted in the United States of America. Because of its inherent limitations, internal control over financial reporting may not prevent or detect misstatements and can provide only reasonable assurance with respect to financial statement preparation and presentation. Also, projections of any evaluation of effectiveness to future periods are subject to the risks that controls may become inadequate because of changes in conditions, or that the degree of compliance with the policies or procedures may deteriorate.
Spire Alabama Inc.’s management, including ourits Chief Executive Officer and Chief Financial Officer, conducted an assessment of the effectiveness of Spire Alabama Inc.’s internal control over financial reporting as of September 30, 2017.2021. In making this assessment, management used the criteria in
REPORT OF INDEPENDENT REGISTERED PUBLIC ACCOUNTING FIRM
To the shareholders and the Board of Directors and Shareholders of
Opinion on Internal Control over Financial Reporting
We have audited the internal control over financial reporting of Spire Inc. and subsidiaries (the “Company”) as of September 30, 2017,2021, based on criteria established in
We have also audited, in accordance with the standards of the Public Company Accounting Oversight Board (United States) (PCAOB), the consolidated financial statements as of and for the year ended September 30, 2021, of the Company and our report dated November 22, 2021, expressed an unqualified opinion on those financial statements.
Basis for Opinion
The Company’s management is responsible for maintaining effective internal control over financial reporting and for itstheir assessment of the effectiveness of internal control over financial reporting, included in the accompanying Spire section of Management Reports on Internal Control Over Financial Reporting. Our responsibility is to express an opinion on the Company’s internal control over financial reporting based on our audit.
We conducted our audit in accordance with the standards of the Public Company Accounting Oversight Board (United States).PCAOB. Those standards require that we plan and perform the audit to obtain reasonable assurance about whether effective internal control over financial reporting was maintained in all material respects. Our audit included obtaining an understanding of internal control over financial reporting, assessing the risk that a material weakness exists, testing and evaluating the design and operating effectiveness of internal control based on the assessed risk, and performing such other procedures as we considered necessary in the circumstances. We believe that our audit provides a reasonable basis for our opinion.
Definition and Limitations of Internal Control over Financial Reporting
A company’s internal control over financial reporting is a process designed by, or under the supervision of, the company’s principal executive and principal financial officers, or persons performing similar functions, and effected by the company’s board of directors, management, and other personnel to provide reasonable assurance regarding the reliability of financial reporting and the preparation of financial statements for external purposes in accordance with generally accepted accounting principles. A company’s internal control over financial reporting includes those policies and procedures that (1) pertain to the maintenance of records that, in reasonable detail, accurately and fairly reflect the transactions and dispositions of the assets of the company; (2) provide reasonable assurance that transactions are recorded as necessary to permit preparation of financial statements in accordance with generally accepted accounting principles, and that receipts and expenditures of the company are being made only in accordance with authorizations of management and directors of the company; and (3) provide reasonable assurance regarding prevention or timely detection of unauthorized acquisition, use, or disposition of the company’s assets that could have a material effect on the financial statements.
Because of theits inherent limitations, of internal control over financial reporting including the possibility of collusion or improper management override of controls, material misstatements due to error or fraud may not be preventedprevent or detected on a timely basis.detect misstatements. Also, projections of any evaluation of the effectiveness of the internal control over financial reporting to future periods are subject to the risk that the controls may become inadequate because of changes in conditions, or that the degree of compliance with the policies or procedures may deteriorate.
/s/ Deloitte & Touche LLP
St. Louis, Missouri
November 22, 2021
REPORT OF INDEPENDENT REGISTERED PUBLIC ACCOUNTING FIRM
To the shareholders and the Board of Directors of Spire Inc.
Opinion on the Financial Statements
We have audited the accompanying consolidated balance sheets of Spire Inc. and subsidiaries (the “Company”) as of September 30, 2021 and 2020, the related consolidated statements of income, comprehensive income, shareholders’ equity, and cash flows, for each of the three years in the period ended September 30, 2021, and the related notes (collectively referred to as the “financial statements”). In our opinion, the Company maintained,financial statements present fairly, in all material respects, effective internal control overthe financial reportingposition of the Company as of September 30, 2017, based on2021 and 2020, and the criteria established in
We have also audited, in accordance with the standards of the Public Company Accounting Oversight Board (United States) (PCAOB), the consolidatedCompany’s internal control over financial statementsreporting as of and for the year ended September 30, 2017
Basis for each of the three years in the period ended September 30, 2017. Opinion
These consolidated financial statements are the responsibility of the Company’s management. Our responsibility is to express an opinion on the consolidatedCompany’s financial statements based on our audits.
We conducted our audits in accordance with the standards of the Public Company Accounting Oversight Board (United States).PCAOB. Those standards require that we plan and perform the audit to obtain reasonable assurance about whether the financial statements are free of material misstatement. An audit includesmisstatement, whether due to error or fraud. Our audits included performing procedures to assess the risks of material misstatement of the financial statements, whether due to error or fraud, and performing procedures that respond to those risks. Such procedures included examining, on a test basis, evidence supportingregarding the amounts and disclosures in the financial statements. An auditOur audits also includes assessingincluded evaluating the accounting principles used and significant estimates made by management, as well as evaluating the overall presentation of the financial statement presentation.statements. We believe that our audits provide a reasonable basis for our opinion.
Critical Audit Matter
The critical audit matter communicated below is a matter arising from the current-period audit of the financial statements that was communicated or required to be communicated to the audit committee and that (1) relates to accounts or disclosures that are material to the financial statements and (2) involved our especially challenging, subjective, or complex judgments. The communication of critical audit matters does not alter in any way our opinion on the financial statements, taken as a whole, and we are not, by communicating the critical audit matter below, providing a separate opinion on the critical audit matter or on the accounts or disclosures to which it relates.
Regulatory Matters – Impact of Rate Regulation on the Financial Statements – Refer to Note 15 to the financial statements
Critical Audit Matter Description
The Company accounts for their regulated operations in accordance with Financial Accounting Standards Board Accounting Standards Codification Topic 980, Regulated Operations. The provisions of this accounting guidance require, among other things, that financial statements of a rate-regulated enterprise reflect the actions of regulators, where appropriate. These actions may result in the recognition of revenues and expenses in time periods that are different than non-rate-regulated enterprises. When this occurs, costs are deferred as assets in the balance sheet (regulatory assets) and recorded as expenses when those amounts are reflected in rates. Also, regulators can impose liabilities upon a regulated company for amounts previously collected from customers and for recovery of costs that are expected to be incurred in the future (regulatory liabilities).
The Company is subject to rate regulation by the Missouri, Alabama, and Mississippi Public Service Commissions (the “Commissions”), which have jurisdiction with respect to the rates of natural gas companies within their respective geographies. The Company has stated that all regulatory assets and regulatory liabilities are recoverable or refundable through the regulatory process.
Accounting for the economics of rate regulation affects multiple financial statement line items, including property, plant, and equipment; regulatory assets and liabilities; operating revenues; and depreciation expense, and affects multiple disclosures in the Company’s financial statements. There is a risk that the Commissions will not approve full recovery of the costs of providing utility service or recovery of all amounts invested in the utility business and a reasonable return on that investment. As a result, we identified the impact of rate regulation as a critical audit matter due to the high degree of subjectivity involved in assessing the impact of current and future regulatory orders on events that have occurred as of September 30, 2021, and the judgments made by management to support its assertions about impacted account balances and disclosures. Management judgments included assessing the likelihood of (1) recovery in future rates of incurred costs or (2) refunds to customers or future reduction in rates. Given that management’s accounting judgments are based on assumptions about the outcome of future decisions by the Commissions, auditing these rate-impacted account balances and disclosures, and the related judgments, requires specialized knowledge of accounting for rate regulation due to the inherent complexities associated with the specialized rules related to accounting for the effects of cost-based regulation.
How the Critical Audit Matter Was Addressed in the Audit
Our audit procedures related to the uncertainty of future decisions by the Commissions included the following, among others:
• | We tested the effectiveness of management’s controls over evaluating the likelihood of (1) the recovery in future rates of costs incurred as property, plant, and equipment and deferred as regulatory assets, and (2) a refund or a future reduction in rates that should be reported as regulatory liabilities. We tested the effectiveness of management’s controls over the initial recognition of amounts as property, plant, and equipment; regulatory assets or liabilities; and the monitoring and evaluation of regulatory developments that may affect the likelihood of recovering costs in future rates or of a future reduction in rates. |
• | We evaluated the Company’s disclosures related to the impacts of rate regulation, including the balances recorded and regulatory developments, in the financial statements. |
• | We read relevant regulatory orders issued by the Commissions for the Company in Missouri, Alabama, and Mississippi; regulatory statutes, interpretations, procedural memorandums, and filings made by interveners; and other publicly available information to assess the likelihood of recovery in future rates or of a future reduction in rates based on precedents of the Commissions’ treatment of similar costs under similar circumstances. |
• | We obtained from management the regulatory orders that support the probability of recovery, refund, and/or future reduction in rates for regulatory assets and liabilities and assessed management’s assertion that amounts are probable of recovery, refund, or a future reduction in rates. |
/s/ Deloitte & Touche LLP
St. Louis, Missouri
November 22, 2021
We have served as the Company’s auditor since 1953.
REPORT OF INDEPENDENT REGISTERED PUBLIC ACCOUNTING FIRM
To the shareholder and the Board of Directors of Spire Missouri Inc.
Opinion on the Financial Statements
We have audited the accompanying balance sheets of Spire Missouri Inc. (a wholly owned subsidiary of Spire Inc.) (the “Company”) as of September 30, 2021 and 2020, the related statements of comprehensive income, shareholder’s equity, and cash flows, for each of the three years in the period ended September 30, 2021, and the related notes (collectively referred to as the “financial statements”). In our opinion, such consolidatedthe financial statements present fairly, in all material respects, the financial position of Spire Inc. and subsidiariesthe Company as of September 30, 20172021 and 2016,2020, and the results of their operations and their cash flows for each of the three years in the period ended September 30, 2017,2021, in conformity with accounting principles generally accepted in the United States of America.
Basis for each of the three years in the period ended September 30, 2017. Opinion
These financial statements are the responsibility of the Company’s management. Our responsibility is to express an opinion on the Company’s financial statements based on our audits.
We conducted our audits in accordance with the standards of the Public Company Accounting Oversight Board (United States).PCAOB. Those standards require that we plan and perform the audit to obtain reasonable assurance about whether the financial statements are free of material misstatement.misstatement, whether due to error or fraud. The Company is not required to have, nor were we engaged to perform, an audit of itstheir internal control over financial reporting. OurAs part of our audits, included considerationwe are required to obtain an understanding of internal control over financial reporting as a basis for designing audit procedures that are appropriate in the circumstances, but not for the purpose of expressing an opinion on the effectiveness of the Company’s internal control over financial reporting. Accordingly, we express no such opinion. An audit also includes
Our audits included performing procedures to assess the risks of material misstatement of the financial statements, whether due to error or fraud, and performing procedures that respond to those risks. Such procedures included examining, on a test basis, evidence supportingregarding the amounts and disclosures in the financial statements, assessingstatements. Our audits also included evaluating the accounting principles used and significant estimates made by management, as well as evaluating the overall presentation of the financial statement presentation.statements. We believe that our audits provide a reasonable basis for our opinion.
Critical Audit Matter
The critical audit matter communicated below is a matter arising from the current-period audit of the financial statements that was communicated or required to be communicated to the audit committee and that (1) relates to accounts or disclosures that are material to the financial statements and (2) involved our especially challenging, subjective, or complex judgments. The communication of critical audit matters does not alter in any way our opinion suchon the financial statements, present fairly, in all material respects,taken as a whole, and we are not, by communicating the critical audit matter below, providing a separate opinion on the critical audit matter or on the accounts or disclosures to which it relates.
Regulatory Matters – Impact of Rate Regulation on the Financial Statements – Refer to Note 15 to the financial positionstatements
Critical Audit Matter Description
The Company accounts for their regulated operations in accordance with Financial Accounting Standards Board Accounting Standards Codification Topic 980, Regulated Operations. The provisions of Spirethis accounting guidance require, among other things, that financial statements of a rate-regulated enterprise reflect the actions of regulators, where appropriate. These actions may result in the recognition of revenues and expenses in time periods that are different than non-rate-regulated enterprises. When this occurs, costs are deferred as assets in the balance sheet (regulatory assets) and recorded as expenses when those amounts are reflected in rates. Also, regulators can impose
liabilities upon a regulated company for amounts previously collected from customers and for recovery of costs that are expected to be incurred in the future (regulatory liabilities).
The Company is subject to rate regulation by the Missouri Inc.Public Service Commission (the “Commission”), which has jurisdiction with respect to the rates of natural gas companies within their geography. The Company has stated that all regulatory assets and regulatory liabilities are recoverable or refundable through the regulatory process.
Accounting for the economics of rate regulation affects multiple financial statement line items, including property, plant, and equipment; regulatory assets and liabilities; operating revenues; and depreciation expense, and affects multiple disclosures in the Company’s financial statements. There is a risk that the Commission will not approve full recovery of the costs of providing utility service or recovery of all amounts invested in the utility business and a reasonable return on that investment. As a result, we identified the impact of rate regulation as a critical audit matter due to the high degree of subjectivity involved in assessing the impact of current and future regulatory orders on events that have occurred as of September 30, 2017 and 2016,2021, and the resultsjudgments made by management to support their assertions about impacted account balances and disclosures. Management judgments included assessing the likelihood of its operations(1) recovery in future rates of incurred costs or (2) refunds to customers or future reduction in rates. Given that management’s accounting judgments are based on assumptions about the outcome of future decisions by the Commission, auditing these rate-impacted account balances and its cash flowsdisclosures, and the related judgments, requires specialized knowledge of accounting for eachrate regulation due to the inherent complexities associated with the specialized rules related to accounting for the effects of cost-based regulation.
How the three yearsCritical Audit Matter Was Addressed in the period ended September 30, 2017, in conformity with accounting principles generally accepted inAudit
Our audit procedures related to the United Statesuncertainty of America.future decisions by the Commission included the following, among others:
• | We tested the effectiveness of management’s controls over evaluating the likelihood of (1) the recovery in future rates of costs incurred as property, plant, and equipment and deferred as regulatory assets, and (2) a refund or a future reduction in rates that should be reported as regulatory liabilities. We tested the effectiveness of management’s controls over the initial recognition of amounts as property, plant, and equipment; regulatory assets or liabilities; and the monitoring and evaluation of regulatory developments that may affect the likelihood of recovering costs in future rates or of a future reduction in rates. |
• | We evaluated the Company’s disclosures related to the impacts of rate regulation, including the balances recorded and regulatory developments, in the financial statements. |
• | We read relevant regulatory orders issued by the Commission for the Company in Missouri; regulatory statutes, interpretations, procedural memorandums, and filings made by interveners; and other publicly available information to assess the likelihood of recovery in future rates or of a future reduction in rates based on precedents of the Commission’s treatment of similar costs under similar circumstances. |
• | We obtained from management the regulatory orders that support the probability of recovery, refund, and/or future reduction in rates for regulatory assets and liabilities and assessed management’s assertion that amounts are probable of recovery, refund, or a future reduction in rates. |
/s/ Deloitte & Touche LLP
St. Louis, Missouri
November 15, 2017
We have served as the Company’s auditor since 1953.
REPORT OF INDEPENDENT REGISTERED PUBLIC ACCOUNTING FIRM
To the shareholder and the Board of Directors and Shareholder of
Opinion on the Financial Statements
We have audited the accompanying balance sheets and statements of capitalization of Spire Alabama Inc. (formerly Alabama Gas Corporation) (a wholly owned subsidiary of Spire Inc.) (the “Company”) as of September 30, 20172021 and 2016, and2020, the related statements of income, common shareholder’s equity, and cash flows, for each of the three years in the period ended September 30, 2017. 2021, and the related notes (collectively referred to as the “financial statements”). In our opinion, the financial statements present fairly, in all material respects, the financial position of the Company as of September 30, 2021 and 2020, and the results of their operations and their cash flows for each of the three years in the period ended September 30, 2021, in conformity with accounting principles generally accepted in the United States of America.
Basis for Opinion
These financial statements are the responsibility of the Company’s management. Our responsibility is to express an opinion on the Company’s financial statements based on our audits.
We conducted our audits in accordance with the standards of the Public Company Accounting Oversight Board (United States).PCAOB. Those standards require that we plan and perform the audit to obtain reasonable assurance about whether the financial statements are free of material misstatement.misstatement, whether due to error or fraud. The Company is not required to have, nor were we engaged to perform, an audit of itstheir internal control over financial reporting. OurAs part of our audits, included considerationwe are required to obtain an understanding of internal control over financial reporting as a basis for designing audit procedures that are appropriate in the circumstances, but not for the purpose of expressing an opinion on the effectiveness of the Company’s internal control over financial reporting. Accordingly, we express no such opinion. An audit also includes
Our audits included performing procedures to assess the risks of material misstatement of the financial statements, whether due to error or fraud, and performing procedures that respond to those risks. Such procedures included examining, on a test basis, evidence supportingregarding the amounts and disclosures in the financial statements, assessingstatements. Our audits also included evaluating the accounting principles used and significant estimates made by management, as well as evaluating the overall presentation of the financial statement presentation.statements. We believe that our audits provide a reasonable basis for our opinion.
Critical Audit Matter
The critical audit matter communicated below is a matter arising from the current-period audit of the financial statements that was communicated or required to be communicated to the audit committee and that (1) relates to accounts or disclosures that are material to the financial statements and (2) involved our especially challenging, subjective, or complex judgments. The communication of critical audit matters does not alter in any way our opinion suchon the financial statements, present fairly, in all material respects,taken as a whole, and we are not, by communicating the critical audit matter below, providing a separate opinion on the critical audit matter or on the accounts or disclosures to which it relates.
Regulatory Matters – Impact of Rate Regulation on the Financial Statements – Refer to Note 15 to the financial positionstatements
Critical Audit Matter Description
The Company accounts for their regulated operations in accordance with Financial Accounting Standards Board Accounting Standards Codification Topic 980, Regulated Operations. The provisions of Spirethis accounting guidance require, among other things, that financial statements of a rate-regulated enterprise reflect the actions of regulators, where appropriate. These actions may result in the recognition of revenues and expenses in time periods that are different than non-rate-regulated enterprises. When this occurs, costs are deferred as assets in the balance sheet (regulatory assets) and recorded as expenses when those amounts are reflected in rates. Also, regulators can impose
liabilities upon a regulated company for amounts previously collected from customers and for recovery of costs that are expected to be incurred in the future (regulatory liabilities).
The Company is subject to rate regulation by the Alabama Inc.Public Service Commission (the “Commission”), which has jurisdiction with respect to the rates of natural gas companies within their geography. The Company has stated that all regulatory assets and regulatory liabilities are recoverable or refundable through the regulatory process.
Accounting for the economics of rate regulation affects multiple financial statement line items, including property, plant, and equipment; regulatory assets and liabilities; operating revenues; and depreciation expense, and affects multiple disclosures in the Company’s financial statements. There is a risk that the Commission will not approve full recovery of the costs of providing utility service or recovery of all amounts invested in the utility business and a reasonable return on that investment. As a result, we identified the impact of rate regulation as a critical audit matter due to the high degree of subjectivity involved in assessing the impact of current and future regulatory orders on events that have occurred as of September 30, 2017 and 2016,2021, and the resultsjudgments made by management to support their assertions about impacted account balances and disclosures. Management judgments included assessing the likelihood of its operations(1) recovery in future rates of incurred costs or (2) refunds to customers or future reduction in rates. Given that management’s accounting judgments are based on assumptions about the outcome of future decisions by the Commission, auditing these rate-impacted account balances and its cash flowsdisclosures, and the related judgments, requires specialized knowledge of accounting for eachrate regulation due to the inherent complexities associated with the specialized rules related to accounting for the effects of cost-based regulation.
How the three yearsCritical Audit Matter Was Addressed in the period ended September 30, 2017, in conformity with accounting principles generally accepted inAudit
Our audit procedures related to the United Statesuncertainty of America.future decisions by the Commission included the following, among others:
• | We tested the effectiveness of management’s controls over evaluating the likelihood of (1) the recovery in future rates of costs incurred as property, plant, and equipment and deferred as regulatory assets, and (2) a refund or a future reduction in rates that should be reported as regulatory liabilities. We tested the effectiveness of management’s controls over the initial recognition of amounts as property, plant, and equipment; regulatory assets or liabilities; and the monitoring and evaluation of regulatory developments that may affect the likelihood of recovering costs in future rates or of a future reduction in rates. |
• | We evaluated the Company’s disclosures related to the impacts of rate regulation, including the balances recorded and regulatory developments, in the financial statements. |
• | We read relevant regulatory orders issued by the Commission for the Company in Alabama; regulatory statutes, interpretations, procedural memorandums, and filings made by interveners; and other publicly available information to assess the likelihood of recovery in future rates or of a future reduction in rates based on precedents of the Commission’s treatment of similar costs under similar circumstances. |
• | We obtained from management the regulatory orders that support the probability of recovery, refund, and/or future reduction in rates for regulatory assets and liabilities and assessed management’s assertion that amounts are probable of recovery, refund, or a future reduction in rates. |
/s/ Deloitte & Touche LLP
St. Louis, Missouri
November 22, 2021
We have served as the Company’s auditor since 2014.
SPIRE INC.
CONSOLIDATED STATEMENTS OF INCOME
|
| Years Ended September 30 |
| |||||||||
(In millions, except per share amounts) |
| 2021 |
|
| 2020 |
|
| 2019 |
| |||
Operating Revenues |
| $ | 2,235.5 |
|
| $ | 1,855.4 |
|
| $ | 1,952.4 |
|
Operating Expenses: |
|
|
|
|
|
|
|
|
|
|
|
|
Natural gas |
|
| 946.3 |
|
|
| 696.1 |
|
|
| 840.3 |
|
Operation and maintenance |
|
| 465.8 |
|
|
| 458.6 |
|
|
| 474.1 |
|
Depreciation and amortization |
|
| 213.1 |
|
|
| 197.3 |
|
|
| 181.7 |
|
Taxes, other than income taxes |
|
| 160.1 |
|
|
| 148.4 |
|
|
| 154.0 |
|
Impairments |
|
| — |
|
|
| 148.6 |
|
|
| — |
|
Total Operating Expenses |
|
| 1,785.3 |
|
|
| 1,649.0 |
|
|
| 1,650.1 |
|
Operating Income |
|
| 450.2 |
|
|
| 206.4 |
|
|
| 302.3 |
|
Interest Expense, Net |
|
| 106.6 |
|
|
| 105.5 |
|
|
| 104.4 |
|
Other (Expense) Income, Net |
|
| (3.4 | ) |
|
| 0.1 |
|
|
| 21.2 |
|
Income Before Income Taxes |
|
| 340.2 |
|
|
| 101.0 |
|
|
| 219.1 |
|
Income Tax Expense |
|
| 68.5 |
|
|
| 12.4 |
|
|
| 34.5 |
|
Net Income |
|
| 271.7 |
|
|
| 88.6 |
|
|
| 184.6 |
|
Provision for preferred dividends |
|
| 14.8 |
|
|
| 14.8 |
|
|
| 5.3 |
|
Income allocated to participating securities |
|
| 0.4 |
|
|
| 0.1 |
|
|
| 0.4 |
|
Net Income Available to Common Shareholders |
| $ | 256.5 |
|
| $ | 73.7 |
|
| $ | 178.9 |
|
|
|
|
|
|
|
|
|
|
|
|
|
|
Weighted Average Number of Common Shares Outstanding: |
|
|
|
|
|
|
|
|
|
|
|
|
Basic |
|
| 51.6 |
|
|
| 51.2 |
|
|
| 50.7 |
|
Diluted |
|
| 51.7 |
|
|
| 51.3 |
|
|
| 50.8 |
|
Basic Earnings Per Share of Common Stock |
| $ | 4.97 |
|
| $ | 1.44 |
|
| $ | 3.53 |
|
Diluted Earnings Per Share of Common Stock |
| $ | 4.96 |
|
| $ | 1.44 |
|
| $ | 3.52 |
|
| SPIRE INC. | |||||||||||
| CONSOLIDATED STATEMENTS OF INCOME | |||||||||||
| (In millions, except per share amounts) | |||||||||||
| Years Ended September 30 | 2017 | 2016 | 2015 | ||||||||
| Operating Revenues: | |||||||||||
| Gas Utility | $ | 1,660.0 | $ | 1,457.2 | $ | 1,891.8 | |||||
| Gas Marketing and other | 80.7 | 80.1 | 84.6 | ||||||||
| Total Operating Revenues | 1,740.7 | 1,537.3 | 1,976.4 | ||||||||
| Operating Expenses: | |||||||||||
| Gas Utility | |||||||||||
| Natural and propane gas | 570.5 | 492.2 | 882.4 | ||||||||
| Other operation and maintenance expenses | 405.0 | 377.5 | 390.6 | ||||||||
| Depreciation and amortization | 153.5 | 136.9 | 129.9 | ||||||||
| Taxes, other than income taxes | 137.8 | 125.2 | 142.1 | ||||||||
| Total Gas Utility Operating Expenses | 1,266.8 | 1,131.8 | 1,545.0 | ||||||||
| Gas Marketing and other | 152.2 | 123.2 | 158.9 | ||||||||
| Total Operating Expenses | 1,419.0 | 1,255.0 | 1,703.9 | ||||||||
| Operating Income | 321.7 | 282.3 | 272.5 | ||||||||
| Other Income – Net | 6.6 | 8.6 | 1.2 | ||||||||
| Interest Charges: | |||||||||||
| Interest on long-term debt | 76.8 | 67.6 | 66.6 | ||||||||
| Other interest charges | 12.3 | 9.6 | 8.0 | ||||||||
| Total Interest Charges | 89.1 | 77.2 | 74.6 | ||||||||
| Income Before Income Taxes | 239.2 | 213.7 | 199.1 | ||||||||
| Income Tax Expense | 77.6 | 69.5 | 62.2 | ||||||||
| Net Income | $ | 161.6 | $ | 144.2 | $ | 136.9 | |||||
| Weighted Average Number of Common Shares Outstanding: | |||||||||||
| Basic | 46.9 | 44.1 | 43.2 | ||||||||
| Diluted | 47.0 | 44.3 | 43.3 | ||||||||
| Basic Earnings Per Share of Common Stock | $ | 3.44 | $ | 3.26 | $ | 3.16 | |||||
| Diluted Earnings Per Share of Common Stock | $ | 3.43 | $ | 3.24 | $ | 3.16 | |||||
See the accompanying
Notes to Financial Statements.SPIRE INC.
CONSOLIDATED STATEMENTS OF COMPREHENSIVE INCOME
|
| Years Ended September 30 |
| |||||||||
(In millions) |
| 2021 |
|
| 2020 |
|
| 2019 |
| |||
Net Income |
| $ | 271.7 |
|
| $ | 88.6 |
|
| $ | 184.6 |
|
Other Comprehensive Income (Loss), Before Tax: |
|
|
|
|
|
|
|
|
|
|
|
|
Cash flow hedging derivative instruments: |
|
|
|
|
|
|
|
|
|
|
|
|
Net hedging gain (loss) arising during the period |
|
| 61.2 |
|
|
| (8.9 | ) |
|
| (46.4 | ) |
Amounts reclassified into net income |
|
| (1.3 | ) |
|
| (3.2 | ) |
|
| (1.3 | ) |
Net gain (loss) on cash flow hedging derivative instruments |
|
| 59.9 |
|
|
| (12.1 | ) |
|
| (47.7 | ) |
Net loss on defined benefit pension and other postretirement plans |
|
| (1.3 | ) |
|
| (0.5 | ) |
|
| (0.9 | ) |
Net unrealized (loss) gain on available-for-sale debt securities |
|
| (0.2 | ) |
|
| — |
|
|
| 0.1 |
|
Other Comprehensive Income (Loss), Before Tax |
|
| 58.4 |
|
|
| (12.6 | ) |
|
| (48.5 | ) |
Income Tax Expense (Benefit) Related to Items of Other Comprehensive Income (Loss) |
|
| 13.6 |
|
|
| (2.7 | ) |
|
| (10.8 | ) |
Other Comprehensive Income (Loss), Net of Tax |
|
| 44.8 |
|
|
| (9.9 | ) |
|
| (37.7 | ) |
Comprehensive Income |
| $ | 316.5 |
|
| $ | 78.7 |
|
| $ | 146.9 |
|
| SPIRE INC. | |||||||||||
| CONSOLIDATED STATEMENTS OF COMPREHENSIVE INCOME | |||||||||||
| (In millions) | |||||||||||
| Years Ended September 30 | 2017 | 2016 | 2015 | ||||||||
| Net Income | $ | 161.6 | $ | 144.2 | $ | 136.9 | |||||
| Other Comprehensive Income (Loss), Before Tax: | |||||||||||
| Cash flow hedging derivative instruments: | |||||||||||
| Net hedging gain (loss) arising during the period | 11.5 | (4.0 | ) | (5.5 | ) | ||||||
| Reclassification adjustment for loss included in net income | — | 1.1 | 4.4 | ||||||||
| Net unrealized gain (loss) on cash flow hedging derivative instruments | 11.5 | (2.9 | ) | (1.1 | ) | ||||||
| Defined benefit pension and other postretirement benefit plans: | |||||||||||
| Net actuarial gain arising during the period | — | — | 0.1 | ||||||||
| Amortization of actuarial loss (gain) included in net periodic pension and postretirement benefit cost | 0.4 | (0.3 | ) | 0.4 | |||||||
| Net defined benefit pension and other postretirement benefit plans | 0.4 | (0.3 | ) | 0.5 | |||||||
| Loss on available for sale securities | (0.1 | ) | — | — | |||||||
| Other Comprehensive Income (Loss), Before Tax | 11.8 | (3.2 | ) | (0.6 | ) | ||||||
| Income Tax Expense (Benefit) Related to Items of Other Comprehensive Income (Loss) | 4.4 | (1.0 | ) | (0.3 | ) | ||||||
| Other Comprehensive Income (Loss), Net of Tax | 7.4 | (2.2 | ) | (0.3 | ) | ||||||
| Comprehensive Income | $ | 169.0 | $ | 142.0 | $ | 136.6 | |||||
See the accompanying
Notes to Financial Statements.SPIRE INC.
CONSOLIDATED BALANCE SHEETS
|
| September 30 |
| ||||||
(In millions) |
| 2021 |
|
| 2020 |
| |||
ASSETS |
|
|
|
|
|
|
|
| |
Utility Plant |
| $ | 7,225.0 |
|
| $ | 6,766.3 |
| |
Less: Accumulated depreciation and amortization |
|
| 2,169.3 |
|
|
| 2,086.2 |
| |
Net Utility Plant |
|
| 5,055.7 |
|
|
| 4,680.1 |
| |
Non-utility Property (net of accumulated depreciation and amortization of $32.1 and $19.0 at September 30, 2021 and 2020, respectively) |
|
| 471.1 |
|
|
| 432.3 |
| |
Other Investments |
|
| 83.1 |
|
|
| 71.7 |
| |
Total Other Property and Investments |
|
| 554.2 |
|
|
| 504.0 |
| |
Current Assets: |
|
|
|
|
|
|
|
| |
Cash and cash equivalents |
|
| 4.3 |
|
|
| 4.1 |
| |
Accounts receivable: |
|
|
|
|
|
|
|
| |
Utility |
|
| 338.4 |
|
|
| 131.8 |
| |
Other |
|
| 288.2 |
|
|
| 146.4 |
| |
Allowance for credit losses |
|
| (30.3 | ) |
|
| (24.9 | ) | |
Delayed customer billings |
|
| 9.2 |
|
|
| 10.0 |
| |
Inventories: |
|
|
|
|
|
|
|
| |
Natural gas |
|
| 267.7 |
|
|
| 154.3 |
| |
Propane gas |
|
| 8.7 |
|
|
| 10.7 |
| |
Materials and supplies |
|
| 28.6 |
|
|
| 26.5 |
| |
Regulatory assets |
|
| 306.5 |
|
|
| 69.5 |
| |
Prepayments |
|
| 29.0 |
|
|
| 29.2 |
| |
Other |
|
| 66.2 |
|
|
| 33.0 |
| |
Total Current Assets |
|
| 1,316.5 |
|
|
| 590.6 |
| |
Deferred Charges and Other Assets: |
|
|
|
|
|
|
|
| |
Goodwill |
|
| 1,171.6 |
|
|
| 1,171.6 |
| |
Regulatory assets |
|
| 993.5 |
|
|
| 1,069.4 |
| |
Other |
|
| 264.9 |
|
|
| 225.5 |
| |
Total Deferred Charges and Other Assets |
|
| 2,430.0 |
|
|
| 2,466.5 |
| |
Total Assets |
| $ | 9,356.4 |
|
| $ | 8,241.2 |
| |
SPIRE INC.
CONSOLIDATED BALANCE SHEETS (Continued)
|
| September 30 |
| |||||
|
| 2021 |
|
| 2020 |
| ||
CAPITALIZATION AND LIABILITIES |
|
|
|
|
|
|
|
|
Capitalization: |
|
|
|
|
|
|
|
|
Preferred stock ($25.00 par value per share; 10.0 million depositary shares authorized, issued and outstanding at September 30, 2021 and 2020) |
| $ | 242.0 |
|
| $ | 242.0 |
|
Common stock (par value $1.00 per share; 70.0 million shares authorized; 51.7 million issued and outstanding at September 30, 2021, and 51.6 million shares issued and outstanding September 30, 2020) |
|
| 51.7 |
|
|
| 51.6 |
|
Paid-in capital |
|
| 1,517.9 |
|
|
| 1,549.2 |
|
Retained earnings |
|
| 843.0 |
|
|
| 720.7 |
|
Accumulated other comprehensive income (loss) |
|
| 3.6 |
|
|
| (41.2 | ) |
Total Shareholders' Equity |
|
| 2,658.2 |
|
|
| 2,522.3 |
|
Temporary equity |
|
| 9.8 |
|
|
| 3.4 |
|
Long-term debt (less current portion) |
|
| 2,939.1 |
|
|
| 2,423.7 |
|
Total Capitalization |
|
| 5,607.1 |
|
|
| 4,949.4 |
|
Current Liabilities: |
|
|
|
|
|
|
|
|
Current portion of long-term debt |
|
| 55.8 |
|
|
| 60.4 |
|
Notes payable |
|
| 672.0 |
|
|
| 648.0 |
|
Accounts payable |
|
| 409.9 |
|
|
| 243.3 |
|
Advance customer billings |
|
| 32.1 |
|
|
| 45.3 |
|
Wages and compensation accrued |
|
| 59.5 |
|
|
| 46.3 |
|
Customer deposits |
|
| 28.9 |
|
|
| 30.6 |
|
Taxes accrued |
|
| 78.8 |
|
|
| 71.4 |
|
Regulatory liabilities |
|
| 34.6 |
|
|
| 113.0 |
|
Other |
|
| 236.7 |
|
|
| 190.9 |
|
Total Current Liabilities |
|
| 1,608.3 |
|
|
| 1,449.2 |
|
Deferred Credits and Other Liabilities: |
|
|
|
|
|
|
|
|
Deferred income taxes |
|
| 612.3 |
|
|
| 511.4 |
|
Pension and postretirement benefit costs |
|
| 235.9 |
|
|
| 309.0 |
|
Asset retirement obligations |
|
| 519.6 |
|
|
| 540.1 |
|
Regulatory liabilities |
|
| 620.9 |
|
|
| 343.7 |
|
Other |
|
| 152.3 |
|
|
| 138.4 |
|
Total Deferred Credits and Other Liabilities |
|
| 2,141.0 |
|
|
| 1,842.6 |
|
Commitments and Contingencies (Note 16) |
|
|
|
|
|
|
|
|
Total Capitalization and Liabilities |
| $ | 9,356.4 |
|
| $ | 8,241.2 |
|
| SPIRE INC. | |||||||
| CONSOLIDATED BALANCE SHEETS | |||||||
| (In millions) | |||||||
| September 30 | 2017 | 2016 | |||||
| ASSETS | |||||||
| Utility Plant | $ | 5,278.4 | $ | 4,793.6 | |||
| Less: Accumulated depreciation and amortization | 1,613.2 | 1,506.4 | |||||
| Net Utility Plant | 3,665.2 | 3,287.2 | |||||
| Non-utility property (net of accumulated depreciation and amortization, $8.6 and $8.1 at September 30, 2017 and 2016, respectively) | 52.0 | 13.7 | |||||
| Goodwill | 1,171.6 | 1,164.9 | |||||
| Other investments | 64.2 | 62.1 | |||||
| Other Property and Investments | 1,287.8 | 1,240.7 | |||||
| Current Assets: | |||||||
| Cash and cash equivalents | 7.4 | 5.2 | |||||
| Accounts receivable: | |||||||
| Utility | 140.5 | 127.8 | |||||
| Other | 149.2 | 113.4 | |||||
| Allowance for doubtful accounts | (18.3 | ) | (20.5 | ) | |||
| Delayed customer billings | 3.4 | 1.6 | |||||
| Inventories: | |||||||
| Natural gas | 194.9 | 174.0 | |||||
| Propane gas | 12.0 | 12.0 | |||||
| Materials and supplies | 18.9 | 16.3 | |||||
| Natural gas receivable | 1.9 | 9.7 | |||||
| Derivative instrument assets | 5.9 | 11.4 | |||||
| Unamortized purchased gas adjustments | 102.6 | 49.7 | |||||
| Other regulatory assets | 72.9 | 44.2 | |||||
| Prepayments and other | 34.2 | 24.8 | |||||
| Total Current Assets | 725.5 | 569.6 | |||||
| Deferred Charges: | |||||||
| Regulatory assets | 791.1 | 838.0 | |||||
| Other | 77.1 | 128.9 | |||||
| Total Deferred Charges | 868.2 | 966.9 | |||||
| Total Assets | $ | 6,546.7 | $ | 6,064.4 | |||
| SPIRE INC. | |||||||
| CONSOLIDATED BALANCE SHEETS (Continued) | |||||||
| September 30 | 2017 | 2016 | |||||
| CAPITALIZATION AND LIABILITIES | |||||||
| Capitalization: | |||||||
| Common stock equity | $ | 1,991.3 | $ | 1,768.2 | |||
| Long-term debt | 1,995.0 | 1,820.7 | |||||
| Total Capitalization | 3,986.3 | 3,588.9 | |||||
| Current Liabilities: | |||||||
| Current portion of long-term debt | 100.0 | 250.0 | |||||
| Notes payable | 477.3 | 398.7 | |||||
| Accounts payable | 257.1 | 210.9 | |||||
| Advance customer billings | 32.0 | 70.2 | |||||
| Wages and compensation accrued | 38.7 | 39.8 | |||||
| Dividends payable | 26.6 | 23.5 | |||||
| Customer deposits | 34.9 | 34.9 | |||||
| Interest accrued | 14.6 | 14.8 | |||||
| Unamortized purchased gas adjustments | 1.0 | 1.7 | |||||
| Taxes accrued | 61.0 | 55.2 | |||||
| Other regulatory liabilities | 21.6 | 28.9 | |||||
| Other | 33.1 | 32.7 | |||||
| Total Current Liabilities | 1,097.9 | 1,161.3 | |||||
| Deferred Credits and Other Liabilities: | |||||||
| Deferred income taxes | 707.5 | 607.3 | |||||
| Pension and postretirement benefit costs | 237.4 | 303.7 | |||||
| Asset retirement obligations | 296.6 | 206.4 | |||||
| Regulatory liabilities | 157.2 | 130.7 | |||||
| Other | 63.8 | 66.1 | |||||
| Total Deferred Credits and Other Liabilities | 1,462.5 | 1,314.2 | |||||
Commitments and Contingencies (Note 16) | |||||||
| Total Capitalization and Liabilities | $ | 6,546.7 | $ | 6,064.4 | |||
See the accompanying
Notes to Financial Statements.SPIRE INC.
(Dollars in millions, |
| Common Stock |
|
| Preferred |
|
| Paid-in |
|
| Retained |
|
|
|
|
|
|
|
|
| ||||||||
except per share amounts) |
| Shares |
|
| Par |
|
| Stock |
|
| Capital |
|
| Earnings |
|
| AOCI* |
|
| Total |
| |||||||
Balance at September 30, 2018 |
|
| 50,671,903 |
|
| $ | 50.7 |
|
| $ | — |
|
| $ | 1,482.7 |
|
| $ | 715.6 |
|
| $ | 6.4 |
|
| $ | 2,255.4 |
|
Net income |
|
| — |
|
|
| — |
|
|
| — |
|
|
| — |
|
|
| 184.6 |
|
|
| — |
|
|
| 184.6 |
|
Common stock issued |
|
| 179,630 |
|
|
| 0.2 |
|
|
| — |
|
|
| 14.2 |
|
|
| — |
|
|
| — |
|
|
| 14.4 |
|
Dividend reinvestment plan |
|
| 62,735 |
|
|
| — |
|
|
| — |
|
|
| 5.1 |
|
|
| — |
|
|
| — |
|
|
| 5.1 |
|
Stock-based compensation costs |
|
| — |
|
|
| — |
|
|
| — |
|
|
| 6.2 |
|
|
| — |
|
|
| — |
|
|
| 6.2 |
|
Stock issued under stock-based compensation plans |
|
| 87,978 |
|
|
| 0.1 |
|
|
| — |
|
|
| (0.1 | ) |
|
| — |
|
|
| — |
|
|
| — |
|
Employees’ tax withholding for stock-based compensation |
|
| (28,731 | ) |
|
| — |
|
|
| — |
|
|
| (2.3 | ) |
|
| — |
|
|
| — |
|
|
| (2.3 | ) |
Temporary equity adjustment to redemption value |
|
| — |
|
|
| — |
|
|
| — |
|
|
| — |
|
|
| (0.8 | ) |
|
| — |
|
|
| (0.8 | ) |
Preferred stock issued |
|
| — |
|
|
| — |
|
|
| 242.0 |
|
|
| — |
|
|
| — |
|
|
| — |
|
|
| 242.0 |
|
Dividends declared: |
|
|
|
|
|
|
|
|
|
|
|
|
|
|
|
|
|
|
|
|
|
|
|
|
|
|
|
|
Common stock ($2.37 per share) |
|
| — |
|
|
| — |
|
|
| — |
|
|
| — |
|
|
| (120.5 | ) |
|
| — |
|
|
| (120.5 | ) |
Preferred stock ($0.344 per depositary share) |
|
| — |
|
|
| — |
|
|
| — |
|
|
| — |
|
|
| (3.4 | ) |
|
| — |
|
|
| (3.4 | ) |
Other comprehensive loss, net of tax |
|
| — |
|
|
| — |
|
|
| — |
|
|
| — |
|
|
| — |
|
|
| (37.7 | ) |
|
| (37.7 | ) |
Balance at September 30, 2019 |
|
| 50,973,515 |
|
| $ | 51.0 |
|
| $ | 242.0 |
|
| $ | 1,505.8 |
|
| $ | 775.5 |
|
| $ | (31.3 | ) |
| $ | 2,543.0 |
|
Net income |
|
| — |
|
|
| — |
|
|
| — |
|
|
| — |
|
|
| 88.6 |
|
|
| — |
|
|
| 88.6 |
|
Common stock issued |
|
| 446,619 |
|
|
| 0.4 |
|
|
| — |
|
|
| 31.6 |
|
|
| — |
|
|
| — |
|
|
| 32.0 |
|
Dividend reinvestment plan |
|
| 122,545 |
|
|
| 0.1 |
|
|
| — |
|
|
| 9.1 |
|
|
| — |
|
|
| — |
|
|
| 9.2 |
|
Stock-based compensation costs |
|
| — |
|
|
| — |
|
|
| — |
|
|
| 6.0 |
|
|
| — |
|
|
| — |
|
|
| 6.0 |
|
Stock issued under stock-based compensation plans |
|
| 110,463 |
|
|
| 0.1 |
|
|
| — |
|
|
| (0.1 | ) |
|
| — |
|
|
| — |
|
|
| — |
|
Employees’ tax withholding for stock-based compensation |
|
| (41,353 | ) |
|
| — |
|
|
| — |
|
|
| (3.2 | ) |
|
| — |
|
|
| — |
|
|
| (3.2 | ) |
Temporary equity adjustment to redemption value |
|
| — |
|
|
| — |
|
|
| — |
|
|
| — |
|
|
| 3.4 |
|
|
| — |
|
|
| 3.4 |
|
Dividends declared: |
|
|
|
|
|
|
|
|
|
|
|
|
|
|
|
|
|
|
|
|
|
|
|
|
|
|
|
|
Common stock ($2.49 per share) |
|
| — |
|
|
| — |
|
|
| — |
|
|
| — |
|
|
| (128.4 | ) |
|
| — |
|
|
| (128.4 | ) |
Preferred stock ($1.84375 per depositary share) |
|
| — |
|
|
| — |
|
|
| — |
|
|
| — |
|
|
| (18.4 | ) |
|
| — |
|
|
| (18.4 | ) |
Other comprehensive loss, net of tax |
|
| — |
|
|
| — |
|
|
| — |
|
|
| — |
|
|
| — |
|
|
| (9.9 | ) |
|
| (9.9 | ) |
Balance at September 30, 2020 |
|
| 51,611,789 |
|
| $ | 51.6 |
|
| $ | 242.0 |
|
| $ | 1,549.2 |
|
| $ | 720.7 |
|
| $ | (41.2 | ) |
| $ | 2,522.3 |
|
Net income |
|
| — |
|
|
| — |
|
|
| — |
|
|
| — |
|
|
| 271.7 |
|
|
| — |
|
|
| 271.7 |
|
Dividend reinvestment plan |
|
| 24,565 |
|
|
| — |
|
|
| — |
|
|
| 1.6 |
|
|
| — |
|
|
| — |
|
|
| 1.6 |
|
Stock-based compensation costs |
|
| — |
|
|
| — |
|
|
| — |
|
|
| 9.1 |
|
|
| — |
|
|
| — |
|
|
| 9.1 |
|
Stock issued under stock-based compensation plans |
|
| 65,316 |
|
|
| 0.1 |
|
|
| — |
|
|
| (0.1 | ) |
|
| — |
|
|
| — |
|
|
| — |
|
Employees’ tax withholding for stock-based compensation |
|
| (16,787 | ) |
|
| — |
|
|
| — |
|
|
| (1.1 | ) |
|
| — |
|
|
| — |
|
|
| (1.1 | ) |
Equity units issued |
|
| — |
|
|
| — |
|
|
| — |
|
|
| (40.8 | ) |
|
| — |
|
|
| — |
|
|
| (40.8 | ) |
Temporary equity adjustment to redemption value |
|
| — |
|
|
| — |
|
|
| — |
|
|
| — |
|
|
| 1.3 |
|
|
| — |
|
|
| 1.3 |
|
Dividends declared: |
|
|
|
|
|
|
|
|
|
|
|
|
|
|
|
|
|
|
|
|
|
|
|
|
|
|
|
|
Common stock ($2.60 per share) |
|
| — |
|
|
| — |
|
|
| — |
|
|
| — |
|
|
| (135.9 | ) |
|
| — |
|
|
| (135.9 | ) |
Preferred stock ($1.475 per depositary share) |
|
| — |
|
|
| — |
|
|
| — |
|
|
| — |
|
|
| (14.8 | ) |
|
| — |
|
|
| (14.8 | ) |
Other comprehensive income, net of tax |
|
| — |
|
|
| — |
|
|
| — |
|
|
| — |
|
|
| — |
|
|
| 44.8 |
|
|
| 44.8 |
|
Balance at September 30, 2021 |
|
| 51,684,883 |
|
| $ | 51.7 |
|
| $ | 242.0 |
|
| $ | 1,517.9 |
|
| $ | 843.0 |
|
| $ | 3.6 |
|
| $ | 2,658.2 |
|
| SPIRE INC. | |||||||
| CONSOLIDATED STATEMENTS OF CAPITALIZATION | |||||||
| (Dollars in millions, except per share amounts) | |||||||
| September 30 | 2017 | 2016 | |||||
| Common Stock Equity: | |||||||
| Common stock, par value $1 per share: | |||||||
| Authorized – 70,000,000 shares | |||||||
| Outstanding – 48,263,243 shares and 45,650,642 shares, respectively | $ | 48.3 | $ | 45.6 | |||
| Paid-in capital | 1,325.6 | 1,175.9 | |||||
| Retained earnings | 614.2 | 550.9 | |||||
| Accumulated other comprehensive income (loss) | 3.2 | (4.2 | ) | ||||
| Total Common Stock Equity | 1,991.3 | 1,768.2 | |||||
| Long-Term Debt - Spire: | |||||||
| 2.55% Senior Notes, due August 15, 2019 | 125.0 | 125.0 | |||||
| 2.52% Senior Notes, due September 1, 2021 | 35.0 | 35.0 | |||||
| 2.0% Series A Remarketable Subordinated Notes, due April 1, 2022 | — | 143.8 | |||||
| 3.31% Notes Payable, due December 15, 2022 | 25.0 | 25.0 | |||||
| 3.54% Senior Notes, due February 27, 2024 | 150.0 | — | |||||
| 3.13% Senior Notes, due September 1, 2026 | 130.0 | 130.0 | |||||
| 3.93% Senior Notes, due March 15, 2027 | 100.0 | — | |||||
| 4.70% Senior Notes, due August 15, 2044 | 250.0 | 250.0 | |||||
| Long-Term Debt - Spire Missouri: | |||||||
| First Mortgage Bonds: | |||||||
| 2.0% Series, due August 15, 2018 | — | 100.0 | |||||
| 5.5% Series, due May 1, 2019 | 50.0 | 50.0 | |||||
| 3.0% Series, due March 15, 2023 | 55.0 | 55.0 | |||||
| 3.4% Series, due August 15, 2023 | 250.0 | 250.0 | |||||
| 3.4% Series, due March 15, 2028 | 45.0 | 45.0 | |||||
| 7.0% Series, due June 1, 2029 | 25.0 | 25.0 | |||||
| 7.9% Series, due September 15, 2030 | 30.0 | 30.0 | |||||
| 3.68% Series, due September 15, 2032 | 50.0 | — | |||||
| 6.0% Series, due May 1, 2034 | 100.0 | 100.0 | |||||
| 6.15% Series, due June 1, 2036 | 55.0 | 55.0 | |||||
| 4.625% Series, due August 15, 2043 | 100.0 | 100.0 | |||||
| 4.23% Series, due September 15, 2047 | 70.0 | — | |||||
| 4.38% Series, due September 15, 2057 | 50.0 | — | |||||
| Long-Term Debt - Spire Alabama: | |||||||
| 5.2% Notes, due January 15, 2020 | 40.0 | 40.0 | |||||
| 3.86% Notes, due December 23, 2021 | 50.0 | 50.0 | |||||
| 3.21% Notes, due September 15, 2025 | 35.0 | 35.0 | |||||
| 5.9% Notes, due January 15, 2037 | 45.0 | 45.0 | |||||
| 4.31% Notes, due December 1, 2045 | 80.0 | 80.0 | |||||
| Long-Term Debt - Other: | |||||||
| 3.10% Note, due December 30, 2018 | 5.0 | 5.0 | |||||
| 4.14% First Mortgage Bonds, due September 30, 2021 | 20.0 | 20.0 | |||||
| 5.00% First Mortgage Bonds, due September 30, 2031 | 42.0 | 42.0 | |||||
| Total Principal of Long-Term Debt | 2,012.0 | 1,835.8 | |||||
| Unamortized debt issuance costs | (15.2 | ) | (13.0 | ) | |||
| Unamortized discounts on long-term debt | (1.8 | ) | (2.1 | ) | |||
| Total Long-Term Debt | 1,995.0 | 1,820.7 | |||||
| Total Capitalization | $ | 3,986.3 | $ | 3,588.9 | |||
SPIRE INC.
CONSOLIDATED STATEMENTS OF CASH FLOWS
|
| Years Ended September 30 |
| |||||||||
(In millions) |
| 2021 |
|
| 2020 |
|
| 2019 |
| |||
Operating Activities: |
|
|
|
|
|
|
|
|
|
|
|
|
Net Income |
| $ | 271.7 |
|
| $ | 88.6 |
|
| $ | 184.6 |
|
Adjustments to reconcile net income to net cash provided by operating activities: |
|
|
|
|
|
|
|
|
|
|
|
|
Depreciation and amortization |
|
| 213.1 |
|
|
| 197.3 |
|
|
| 181.7 |
|
Impairments |
|
| — |
|
|
| 148.6 |
|
|
| — |
|
Deferred income taxes and investment tax credits |
|
| 67.0 |
|
|
| 9.0 |
|
|
| 31.8 |
|
Changes in assets and liabilities: |
|
|
|
|
|
|
|
|
|
|
|
|
Accounts receivable |
|
| (343.0 | ) |
|
| 36.2 |
|
|
| 2.7 |
|
Inventories |
|
| (111.0 | ) |
|
| 2.6 |
|
|
| 13.6 |
|
Regulatory assets and liabilities |
|
| 76.6 |
|
|
| 0.6 |
|
|
| — |
|
Accounts payable |
|
| 177.7 |
|
|
| (43.1 | ) |
|
| (6.4 | ) |
Delayed/advance customer billings, net |
|
| (12.4 | ) |
|
| 7.0 |
|
|
| 12.4 |
|
Taxes accrued |
|
| 8.9 |
|
|
| 2.9 |
|
|
| 3.5 |
|
Other assets and liabilities |
|
| (116.1 | ) |
|
| 12.0 |
|
|
| 31.0 |
|
Other |
|
| 17.3 |
|
|
| 8.2 |
|
|
| (4.0 | ) |
Net cash provided by operating activities |
|
| 249.8 |
|
|
| 469.9 |
|
|
| 450.9 |
|
Investing Activities: |
|
|
|
|
|
|
|
|
|
|
|
|
Capital expenditures |
|
| (624.8 | ) |
|
| (638.4 | ) |
|
| (823.3 | ) |
Other business acquisitions |
|
| — |
|
|
| — |
|
|
| (7.9 | ) |
Other |
|
| 2.8 |
|
|
| 6.8 |
|
|
| (7.1 | ) |
Net cash used in investing activities |
|
| (622.0 | ) |
|
| (631.6 | ) |
|
| (838.3 | ) |
Financing Activities: |
|
|
|
|
|
|
|
|
|
|
|
|
Issuance of preferred stock |
|
| — |
|
|
| — |
|
|
| 242.0 |
|
Issuance of long-term debt |
|
| 629.1 |
|
|
| 510.0 |
|
|
| 230.0 |
|
Repayment of long-term debt |
|
| (115.4 | ) |
|
| (147.0 | ) |
|
| (184.1 | ) |
Issuance (repayment) of short-term debt, net |
|
| 24.0 |
|
|
| (95.2 | ) |
|
| 189.6 |
|
Issuance of common stock |
|
| 1.0 |
|
|
| 41.1 |
|
|
| 19.5 |
|
Dividends paid on common stock |
|
| (133.2 | ) |
|
| (128.0 | ) |
|
| (119.0 | ) |
Dividends paid on preferred stock |
|
| (14.8 | ) |
|
| (14.8 | ) |
|
| (3.4 | ) |
Other |
|
| (11.3 | ) |
|
| (6.1 | ) |
|
| (2.8 | ) |
Net cash provided by financing activities |
|
| 379.4 |
|
|
| 160.0 |
|
|
| 371.8 |
|
Net Increase (Decrease) in Cash, Cash Equivalents, and Restricted Cash |
|
| 7.2 |
|
|
| (1.7 | ) |
|
| (15.6 | ) |
Cash, Cash Equivalents, and Restricted Cash at Beginning of Year |
|
| 4.1 |
|
|
| 5.8 |
|
|
| 21.4 |
|
Cash, Cash Equivalents, and Restricted Cash at End of Year |
| $ | 11.3 |
|
| $ | 4.1 |
|
| $ | 5.8 |
|
|
|
|
|
|
|
|
|
|
|
|
|
|
Supplemental disclosure of cash paid for: |
|
|
|
|
|
|
|
|
|
|
|
|
Interest, net of amounts capitalized |
| $ | (98.7 | ) |
| $ | (100.0 | ) |
| $ | (102.4 | ) |
Income taxes |
|
| (1.5 | ) |
|
| (2.9 | ) |
|
| (2.7 | ) |
| SPIRE INC. | ||||||||||||||||||||||
| CONSOLIDATED STATEMENTS OF COMMON SHAREHOLDERS’ EQUITY | ||||||||||||||||||||||
| Common Stock Outstanding | Paid-in Capital | Retained Earnings | AOCI* | |||||||||||||||||||
| (Dollars in millions, except per share amounts) | Shares | Amount | Total | |||||||||||||||||||
| Balance at September 30, 2014 | 43,178,405 | $ | 43.2 | $ | 1,029.4 | $ | 437.5 | $ | (1.7 | ) | $ | 1,508.4 | ||||||||||
| Net income | — | — | — | 136.9 | — | 136.9 | ||||||||||||||||
| Dividend reinvestment plan | 31,166 | — | 1.6 | — | — | 1.6 | ||||||||||||||||
| Stock-based compensation costs | — | — | 6.7 | — | — | 6.7 | ||||||||||||||||
| Stock issued under stock-based compensation plans | 156,925 | 0.1 | 1.3 | — | — | 1.4 | ||||||||||||||||
| Employees’ tax withholding for stock-based compensation | (31,484 | ) | — | (1.6 | ) | — | — | (1.6 | ) | |||||||||||||
| Tax benefit – stock compensation | — | — | 0.7 | — | — | 0.7 | ||||||||||||||||
| Dividends declared: | ||||||||||||||||||||||
| Common stock ($1.84 per share) | — | — | — | (80.2 | ) | — | (80.2 | ) | ||||||||||||||
| Other comprehensive loss, net of tax | — | — | — | — | (0.3 | ) | (0.3 | ) | ||||||||||||||
| Balance at September 30, 2015 | 43,335,012 | $ | 43.3 | $ | 1,038.1 | $ | 494.2 | $ | (2.0 | ) | $ | 1,573.6 | ||||||||||
| Net income | — | — | — | 144.2 | — | 144.2 | ||||||||||||||||
| Common stock offering | 2,185,000 | 2.2 | 131.0 | — | — | 133.2 | ||||||||||||||||
| Dividend reinvestment plan | 22,878 | — | 1.4 | — | — | 1.4 | ||||||||||||||||
| Stock-based compensation costs | — | — | 6.7 | — | — | 6.7 | ||||||||||||||||
| Stock issued under stock-based compensation plans | 136,979 | 0.1 | 0.4 | — | — | 0.5 | ||||||||||||||||
| Employees’ tax withholding for stock-based compensation | (29,227 | ) | — | (1.7 | ) | — | — | (1.7 | ) | |||||||||||||
| Dividends declared: | ||||||||||||||||||||||
| Common stock ($1.96 per share) | — | — | — | (87.5 | ) | — | (87.5 | ) | ||||||||||||||
| Other comprehensive loss, net of tax | — | — | — | — | (2.2 | ) | (2.2 | ) | ||||||||||||||
| Balance at September 30, 2016 | 45,650,642 | $ | 45.6 | $ | 1,175.9 | $ | 550.9 | $ | (4.2 | ) | $ | 1,768.2 | ||||||||||
| Net income | — | — | — | 161.6 | — | 161.6 | ||||||||||||||||
| Common stock offering | 2,504,684 | 2.5 | 143.0 | — | — | 145.5 | ||||||||||||||||
| Dividend reinvestment plan | 23,731 | — | 1.6 | — | — | 1.6 | ||||||||||||||||
| Stock-based compensation costs | — | — | 7.4 | 0.9 | — | 8.3 | ||||||||||||||||
| Stock issued under stock-based compensation plans | 119,700 | 0.2 | (0.1 | ) | — | — | 0.1 | |||||||||||||||
| Employees’ tax withholding for stock-based compensation | (35,514 | ) | — | (2.2 | ) | — | — | (2.2 | ) | |||||||||||||
| Dividends declared: | ||||||||||||||||||||||
| Common stock ($2.10 per share) | — | — | — | (99.2 | ) | — | (99.2 | ) | ||||||||||||||
| Other comprehensive income, net of tax | — | — | — | — | 7.4 | 7.4 | ||||||||||||||||
| Balance at September 30, 2017 | 48,263,243 | $ | 48.3 | $ | 1,325.6 | $ | 614.2 | $ | 3.2 | $ | 1,991.3 | |||||||||||
See the accompanying Notes to Financial Statements.
SPIRE MISSOURI INC.
STATEMENTS OF COMPREHENSIVE INCOME
|
| Years Ended September 30 |
| |||||||||
(In millions) |
| 2021 |
|
| 2020 |
|
| 2019 |
| |||
Operating Revenues |
| $ | 1,516.6 |
|
| $ | 1,193.6 |
|
| $ | 1,291.8 |
|
Operating Expenses: |
|
|
|
|
|
|
|
|
|
|
|
|
Natural gas |
|
| 786.8 |
|
|
| 515.8 |
|
|
| 629.8 |
|
Operation and maintenance |
|
| 261.1 |
|
|
| 251.0 |
|
|
| 268.1 |
|
Depreciation and amortization |
|
| 129.2 |
|
|
| 118.0 |
|
|
| 111.5 |
|
Taxes, other than income taxes |
|
| 110.9 |
|
|
| 103.2 |
|
|
| 107.6 |
|
Total Operating Expenses |
|
| 1,288.0 |
|
|
| 988.0 |
|
|
| 1,117.0 |
|
Operating Income |
|
| 228.6 |
|
|
| 205.6 |
|
|
| 174.8 |
|
Interest Expense, Net |
|
| 50.3 |
|
|
| 49.4 |
|
|
| 49.2 |
|
Other (Expense) Income, Net |
|
| (8.9 | ) |
|
| (8.7 | ) |
|
| 2.7 |
|
Income Before Income Taxes |
|
| 169.4 |
|
|
| 147.5 |
|
|
| 128.3 |
|
Income Tax Expense |
|
| 25.3 |
|
|
| 17.3 |
|
|
| 13.3 |
|
Net Income |
|
| 144.1 |
|
|
| 130.2 |
|
|
| 115.0 |
|
Other Comprehensive Loss, Net of Tax |
|
| (1.3 | ) |
|
| (0.5 | ) |
|
| (0.8 | ) |
Comprehensive Income |
| $ | 142.8 |
|
| $ | 129.7 |
|
| $ | 114.2 |
|
See the accompanying Notes to Financial Statements.
SPIRE MISSOURI INC.
BALANCE SHEETS
|
| September 30 |
| |||||
(In millions) |
| 2021 |
|
| 2020 |
| ||
ASSETS |
|
|
|
|
|
|
|
|
Utility Plant |
| $ | 4,266.6 |
|
| $ | 3,931.2 |
|
Less: Accumulated depreciation and amortization |
|
| 905.1 |
|
|
| 825.7 |
|
Net Utility Plant |
|
| 3,361.5 |
|
|
| 3,105.5 |
|
Other Property and Investments |
|
| 60.2 |
|
|
| 56.7 |
|
Current Assets: |
|
|
|
|
|
|
|
|
Accounts receivable: |
|
|
|
|
|
|
|
|
Utility |
|
| 279.0 |
|
|
| 92.5 |
|
Associated companies |
|
| 4.7 |
|
|
| 2.7 |
|
Other |
|
| 57.5 |
|
|
| 34.1 |
|
Allowance for credit losses |
|
| (22.6 | ) |
|
| (18.1 | ) |
Delayed customer billings |
|
| 2.4 |
|
|
| 2.4 |
|
Inventories: |
|
|
|
|
|
|
|
|
Natural gas |
|
| 176.7 |
|
|
| 95.1 |
|
Propane gas |
|
| 8.7 |
|
|
| 10.7 |
|
Materials and supplies |
|
| 15.0 |
|
|
| 15.6 |
|
Regulatory assets |
|
| 276.3 |
|
|
| 32.1 |
|
Prepayments |
|
| 19.7 |
|
|
| 20.7 |
|
Other |
|
| 0.1 |
|
|
| 0 |
|
Total Current Assets |
|
| 817.5 |
|
|
| 287.8 |
|
Deferred Charges and Other Assets: |
|
|
|
|
|
|
|
|
Goodwill |
|
| 210.2 |
|
|
| 210.2 |
|
Regulatory assets |
|
| 483.1 |
|
|
| 548.7 |
|
Other |
|
| 125.6 |
|
|
| 96.0 |
|
Total Deferred Charges and Other Assets |
|
| 818.9 |
|
|
| 854.9 |
|
Total Assets |
| $ | 5,058.1 |
|
| $ | 4,304.9 |
|
SPIRE MISSOURI INC.
BALANCE SHEETS (continued)
|
| September 30 |
| |||||
|
| 2021 |
|
| 2020 |
| ||
CAPITALIZATION AND LIABILITIES |
|
|
|
|
|
|
|
|
Capitalization: |
|
|
|
|
|
|
|
|
Common stock (par value $1.00 per share; 50.0 million shares authorized; 24,577 issued and outstanding at September 30, 2021 and 2020) |
| $ | 0.1 |
|
| $ | 0.1 |
|
Paid-in capital |
|
| 765.0 |
|
|
| 765.0 |
|
Retained earnings |
|
| 817.0 |
|
|
| 672.9 |
|
Accumulated other comprehensive loss |
|
| (4.2 | ) |
|
| (2.9 | ) |
Total Shareholders' Equity |
|
| 1,577.9 |
|
|
| 1,435.1 |
|
Long-term debt |
|
| 1,338.4 |
|
|
| 1,092.0 |
|
Total Capitalization |
|
| 2,916.3 |
|
|
| 2,527.1 |
|
Current Liabilities: |
|
|
|
|
|
|
|
|
Notes payable |
|
| 250.0 |
|
|
| 0 |
|
Notes payable – associated companies |
|
| 240.9 |
|
|
| 301.2 |
|
Accounts payable |
|
| 89.7 |
|
|
| 66.7 |
|
Accounts payable – associated companies |
|
| 10.2 |
|
|
| 9.3 |
|
Advance customer billings |
|
| 19.7 |
|
|
| 32.7 |
|
Wages and compensation accrued |
|
| 40.3 |
|
|
| 33.3 |
|
Customer deposits |
|
| 8.0 |
|
|
| 9.3 |
|
Taxes accrued |
|
| 41.2 |
|
|
| 39.1 |
|
Regulatory liabilities |
|
| 17.1 |
|
|
| 103.2 |
|
Other |
|
| 47.4 |
|
|
| 39.9 |
|
Total Current Liabilities |
|
| 764.5 |
|
|
| 634.7 |
|
Deferred Credits and Other Liabilities: |
|
|
|
|
|
|
|
|
Deferred income taxes |
|
| 480.0 |
|
|
| 434.7 |
|
Pension and postretirement benefit costs |
|
| 159.5 |
|
|
| 217.2 |
|
Asset retirement obligations |
|
| 143.4 |
|
|
| 153.4 |
|
Regulatory liabilities |
|
| 538.8 |
|
|
| 274.8 |
|
Other |
|
| 55.6 |
|
|
| 63.0 |
|
Total Deferred Credits and Other Liabilities |
|
| 1,377.3 |
|
|
| 1,143.1 |
|
Commitments and Contingencies (Note 16) |
|
|
|
|
|
|
|
|
Total Capitalization and Liabilities |
| $ | 5,058.1 |
|
| $ | 4,304.9 |
|
See the accompanying Notes to Financial Statements.
SPIRE MISSOURI INC.
|
| Common Stock |
|
| Paid-in |
|
| Retained |
|
|
|
|
|
|
|
|
| |||||||
(Dollars in millions) |
| Shares |
|
| Par |
|
| Capital |
|
| Earnings |
|
| AOCI* |
|
| Total |
| ||||||
Balance at September 30, 2018 |
|
| 24,577 |
|
| $ | 0.1 |
|
| $ | 760.3 |
|
| $ | 501.1 |
|
| $ | (1.6 | ) |
| $ | 1,259.9 |
|
Net income |
|
| — |
|
|
| — |
|
|
| — |
|
|
| 115.0 |
|
|
| — |
|
|
| 115.0 |
|
Stock-based compensation costs |
|
| — |
|
|
| — |
|
|
| 4.7 |
|
|
| — |
|
|
| — |
|
|
| 4.7 |
|
Dividends declared |
|
| — |
|
|
| — |
|
|
| — |
|
|
| (39.5 | ) |
|
| — |
|
|
| (39.5 | ) |
Other comprehensive loss, net of tax |
|
| — |
|
|
| — |
|
|
| — |
|
|
| — |
|
|
| (0.8 | ) |
|
| (0.8 | ) |
Balance at September 30, 2019 |
|
| 24,577 |
|
|
| 0.1 |
|
|
| 765.0 |
|
|
| 576.6 |
|
|
| (2.4 | ) |
|
| 1,339.3 |
|
Net income |
|
| — |
|
|
| — |
|
|
| — |
|
|
| 130.2 |
|
|
| — |
|
|
| 130.2 |
|
Dividends declared |
|
| — |
|
|
| — |
|
|
| — |
|
|
| (33.9 | ) |
|
| — |
|
|
| (33.9 | ) |
Other comprehensive loss, net of tax |
|
| — |
|
|
| — |
|
|
| — |
|
|
| — |
|
|
| (0.5 | ) |
|
| (0.5 | ) |
Balance at September 30, 2020 |
|
| 24,577 |
|
|
| 0.1 |
|
|
| 765.0 |
|
|
| 672.9 |
|
|
| (2.9 | ) |
|
| 1,435.1 |
|
Net income |
|
| — |
|
|
| — |
|
|
| — |
|
|
| 144.1 |
|
|
| — |
|
|
| 144.1 |
|
Other comprehensive loss, net of tax |
|
| — |
|
|
| — |
|
|
| — |
|
|
| — |
|
|
| (1.3 | ) |
|
| (1.3 | ) |
Balance at September 30, 2021 |
|
| 24,577 |
|
| $ | 0.1 |
|
| $ | 765.0 |
|
| $ | 817.0 |
|
| $ | (4.2 | ) |
| $ | 1,577.9 |
|
*Accumulated other comprehensive income (loss)
See the accompanying
| SPIRE INC. | |||||||||||
| CONSOLIDATED STATEMENTS OF CASH FLOWS | |||||||||||
| (In millions) | |||||||||||
| Years Ended September 30 | 2017 | 2016 | 2015 | ||||||||
| Operating Activities: | |||||||||||
| Net Income | $ | 161.6 | $ | 144.2 | $ | 136.9 | |||||
Adjustments to reconcile net income to net cash provided by operating activities: | |||||||||||
| Depreciation and amortization | 154.1 | 137.5 | 130.8 | ||||||||
| Deferred income taxes and investment tax credits | 77.0 | 68.8 | 65.5 | ||||||||
| Changes in assets and liabilities: | |||||||||||
| Accounts receivable – net | (63.0 | ) | (12.3 | ) | (4.8 | ) | |||||
| Unamortized purchased gas adjustments | (50.9 | ) | (52.8 | ) | 27.1 | ||||||
| Accounts payable | 51.1 | 30.0 | (30.0 | ) | |||||||
| Delayed/advance customer billings – net | (40.0 | ) | 26.9 | 20.3 | |||||||
| Taxes accrued | 5.8 | (0.4 | ) | (17.0 | ) | ||||||
| Inventories | (23.5 | ) | 16.5 | 54.8 | |||||||
| Other assets and liabilities | 11.9 | (35.0 | ) | (67.6 | ) | ||||||
| Other | 4.2 | 4.9 | 6.4 | ||||||||
| Net cash provided by operating activities | 288.3 | 328.3 | 322.4 | ||||||||
| Investing Activities: | |||||||||||
| Capital expenditures | (438.1 | ) | (293.3 | ) | (289.8 | ) | |||||
| Acquisition of Spire EnergySouth (net of $2.0 cash acquired) and final settlement | 3.8 | (317.7 | ) | — | |||||||
| Final settlement related to acquisition of Spire Alabama | — | — | (8.2 | ) | |||||||
| Other | 0.8 | (1.7 | ) | (0.7 | ) | ||||||
| Net cash used in investing activities | (433.5 | ) | (612.7 | ) | (298.7 | ) | |||||
| Financing Activities: | |||||||||||
| Issuance of long-term debt | 420.0 | 245.0 | 35.0 | ||||||||
| Repayment of long-term debt | (393.8 | ) | (80.0 | ) | (34.8 | ) | |||||
| Issuance of short-term debt - net | 78.6 | 60.7 | 50.8 | ||||||||
| Issuance of common stock | 146.9 | 137.1 | 3.1 | ||||||||
| Dividends paid | (96.2 | ) | (85.2 | ) | (79.0 | ) | |||||
| Other | (8.1 | ) | (1.8 | ) | (1.1 | ) | |||||
| Net cash provided by (used in) financing activities | 147.4 | 275.8 | (26.0 | ) | |||||||
| Net Increase (Decrease) in Cash and Cash Equivalents | 2.2 | (8.6 | ) | (2.3 | ) | ||||||
| Cash and Cash Equivalents at Beginning of Year | 5.2 | 13.8 | 16.1 | ||||||||
| Cash and Cash Equivalents at End of Year | $ | 7.4 | $ | 5.2 | $ | 13.8 | |||||
| Supplemental disclosure of cash (paid) refunded for: | |||||||||||
| Interest | $ | (85.5 | ) | $ | (72.5 | ) | $ | (65.3 | ) | ||
| Income taxes | (1.3 | ) | 2.9 | 1.3 | |||||||
SPIRE MISSOURI INC.
STATEMENTS OF CASH FLOWS
|
| Years Ended September 30 |
| |||||||||
(In millions) |
| 2021 |
|
| 2020 |
|
| 2019 |
| |||
Operating Activities: |
|
|
|
|
|
|
|
|
|
|
|
|
Net Income |
| $ | 144.1 |
|
| $ | 130.2 |
|
| $ | 115.0 |
|
Adjustments to reconcile net income to net cash provided by operating activities: |
|
|
|
|
|
|
|
|
|
|
|
|
Depreciation and amortization |
|
| 129.2 |
|
|
| 118.0 |
|
|
| 111.5 |
|
Deferred income taxes and investment tax credits |
|
| 25.3 |
|
|
| 17.1 |
|
|
| 13.2 |
|
Changes in assets and liabilities: |
|
|
|
|
|
|
|
|
|
|
|
|
Accounts receivable |
|
| (207.4 | ) |
|
| (3.7 | ) |
|
| (0.3 | ) |
Inventories |
|
| (79.0 | ) |
|
| 2.7 |
|
|
| 29.0 |
|
Regulatory assets and liabilities |
|
| 35.9 |
|
|
| 27.3 |
|
|
| 32.7 |
|
Accounts payable |
|
| 23.1 |
|
|
| 2.3 |
|
|
| (8.4 | ) |
Delayed/advance customer billings, net |
|
| (13.0 | ) |
|
| 13.7 |
|
|
| 13.9 |
|
Taxes accrued |
|
| 2.1 |
|
|
| 2.7 |
|
|
| 4.4 |
|
Other assets and liabilities |
|
| (115.0 | ) |
|
| (6.1 | ) |
|
| (2.6 | ) |
Other |
|
| 0.7 |
|
|
| 0.6 |
|
|
| 5.2 |
|
Net cash (used in) provided by operating activities |
|
| (54.0 | ) |
|
| 304.8 |
|
|
| 313.6 |
|
Investing Activities: |
|
|
|
|
|
|
|
|
|
|
|
|
Capital expenditures |
|
| (382.6 | ) |
|
| (356.0 | ) |
|
| (356.9 | ) |
Other |
|
| 1.3 |
|
|
| 1.3 |
|
|
| 1.3 |
|
Net cash used in investing activities |
|
| (381.3 | ) |
|
| (354.7 | ) |
|
| (355.6 | ) |
Financing Activities: |
|
|
|
|
|
|
|
|
|
|
|
|
Issuance of long-term debt |
|
| 304.1 |
|
|
| 275.0 |
|
|
| 100.0 |
|
Repayment of long-term debt |
|
| (55.0 | ) |
|
| (107.0 | ) |
|
| (50.0 | ) |
Issuance of short-term debt, net |
|
| 250.0 |
|
|
| — |
|
|
| — |
|
(Repayment of) borrowings from Spire, net |
|
| (60.3 | ) |
|
| (85.2 | ) |
|
| 41.1 |
|
Dividends paid |
|
| — |
|
|
| (33.9 | ) |
|
| (48.5 | ) |
Other |
|
| (3.5 | ) |
|
| (1.6 | ) |
|
| — |
|
Net cash provided by financing activities |
|
| 435.3 |
|
|
| 47.3 |
|
|
| 42.6 |
|
Net (Decrease) Increase in Cash and Cash Equivalents |
|
| — |
|
|
| (2.6 | ) |
|
| 0.6 |
|
Cash and Cash Equivalents at Beginning of Year |
|
| — |
|
|
| 2.6 |
|
|
| 2.0 |
|
Cash and Cash Equivalents at End of Year |
| $ | — |
|
| $ | — |
|
| $ | 2.6 |
|
Supplemental disclosure of cash paid for: |
|
|
|
|
|
|
|
|
|
|
|
|
Interest, net of amounts capitalized |
| $ | (45.9 | ) |
| $ | (46.0 | ) |
| $ | (48.7 | ) |
Income taxes |
|
| 0 |
|
|
| 0 |
|
|
| 0 |
|
| SPIRE MISSOURI INC. | |||||||||||
| STATEMENTS OF INCOME | |||||||||||
| (In millions) | |||||||||||
| Years Ended September 30 | 2017 | 2016 | 2015 | ||||||||
| Operating Revenues: | |||||||||||
| Utility | $ | 1,171.9 | $ | 1,087.5 | $ | 1,416.6 | |||||
| Total Operating Revenues | 1,171.9 | 1,087.5 | 1,416.6 | ||||||||
| Operating Expenses: | |||||||||||
| Utility | |||||||||||
| Natural and propane gas | 538.3 | 471.3 | 786.1 | ||||||||
| Other operation and maintenance expenses | 243.8 | 244.4 | 253.6 | ||||||||
| Depreciation and amortization | 93.1 | 88.6 | 82.6 | ||||||||
| Taxes, other than income taxes | 99.8 | 96.3 | 108.9 | ||||||||
| Total Operating Expenses | 975.0 | 900.6 | 1,231.2 | ||||||||
| Operating Income | 196.9 | 186.9 | 185.4 | ||||||||
| Other Income and (Income Deductions) - Net | 2.7 | 1.8 | (0.5 | ) | |||||||
| Interest Charges: | |||||||||||
| Interest on long-term debt | 32.9 | 32.9 | 33.1 | ||||||||
| Other interest charges | 6.2 | 4.5 | 3.3 | ||||||||
| Total Interest Charges | 39.1 | 37.4 | 36.4 | ||||||||
| Income Before Income Taxes | 160.5 | 151.3 | 148.5 | ||||||||
| Income Tax Expense | 47.5 | 45.4 | 43.2 | ||||||||
| Net Income | $ | 113.0 | $ | 105.9 | $ | 105.3 | |||||
SPIRE ALABAMA INC.
STATEMENTS OF INCOME
|
| Years Ended September 30 |
| |||||||||
(In millions) |
| 2021 |
|
| 2020 |
|
| 2019 |
| |||
Operating Revenues |
| $ | 494.0 |
|
| $ | 455.0 |
|
| $ | 465.5 |
|
Operating Expenses: |
|
|
|
|
|
|
|
|
|
|
|
|
Natural gas |
|
| 145.3 |
|
|
| 118.9 |
|
|
| 135.5 |
|
Operation and maintenance |
|
| 132.5 |
|
|
| 139.1 |
|
|
| 142.6 |
|
Depreciation and amortization |
|
| 62.1 |
|
|
| 59.3 |
|
|
| 56.2 |
|
Taxes, other than income taxes |
|
| 37.1 |
|
|
| 34.8 |
|
|
| 35.7 |
|
Total Operating Expenses |
|
| 377.0 |
|
|
| 352.1 |
|
|
| 370.0 |
|
Operating Income |
|
| 117.0 |
|
|
| 102.9 |
|
|
| 95.5 |
|
Interest Expense, Net |
|
| 20.2 |
|
|
| 20.6 |
|
|
| 21.7 |
|
Other Income, Net |
|
| 2.0 |
|
|
| 5.4 |
|
|
| 7.0 |
|
Income Before Income Taxes |
|
| 98.8 |
|
|
| 87.7 |
|
|
| 80.8 |
|
Income Tax Expense |
|
| 25.0 |
|
|
| 22.0 |
|
|
| 20.5 |
|
Net Income |
| $ | 73.8 |
|
| $ | 65.7 |
|
| $ | 60.3 |
|
| SPIRE MISSOURI INC. | |||||||||||
| STATEMENTS OF COMPREHENSIVE INCOME | |||||||||||
| (In millions) | |||||||||||
| Years Ended September 30 | 2017 | 2016 | 2015 | ||||||||
| Net Income | $ | 113.0 | $ | 105.9 | $ | 105.3 | |||||
| Other Comprehensive Income, Before Tax: | |||||||||||
| Cash flow hedging derivative instruments: | |||||||||||
| Net hedging gain (loss) arising during the period | 0.1 | — | (1.2 | ) | |||||||
| Reclassification adjustment for (gain) loss included in net income | (0.2 | ) | 0.5 | 0.9 | |||||||
| Net unrealized (loss) gain on cash flow hedging derivative instruments | (0.1 | ) | 0.5 | (0.3 | ) | ||||||
| Defined benefit pension and other postretirement benefit plans: | |||||||||||
| Net actuarial gain arising during the period | — | — | 0.1 | ||||||||
| Amortization of actuarial loss (gain) included in net periodic pension and postretirement benefit cost | 0.3 | (0.3 | ) | 0.4 | |||||||
| Net defined benefit pension and other postretirement benefit plans | 0.3 | (0.3 | ) | 0.5 | |||||||
| Loss on available for sale securities | (0.1 | ) | (0.1 | ) | — | ||||||
| Other Comprehensive Income, Before Tax | 0.1 | 0.1 | 0.2 | ||||||||
| Income Tax Expense Related to Items of Other Comprehensive Income | — | 0.2 | — | ||||||||
| Other Comprehensive Income (Loss), Net of Tax | 0.1 | (0.1 | ) | 0.2 | |||||||
| Comprehensive Income | $ | 113.1 | $ | 105.8 | $ | 105.5 | |||||
See the accompanying
Notes to Financial Statements.SPIRE ALABAMA INC.
BALANCE SHEETS
|
| September 30 |
| |||||
(In millions) |
| 2021 |
|
| 2020 |
| ||
ASSETS |
|
|
|
|
|
|
|
|
Utility Plant |
| $ | 2,586.5 |
|
| $ | 2,469.9 |
|
Less: Accumulated depreciation and amortization |
|
| 1,124.8 |
|
|
| 1,117.0 |
|
Net Utility Plant |
|
| 1,461.7 |
|
|
| 1,352.9 |
|
Current Assets: |
|
|
|
|
|
|
|
|
Accounts receivable: |
|
|
|
|
|
|
|
|
Utility |
|
| 49.8 |
|
|
| 31.4 |
|
Associated companies |
|
| 0.6 |
|
|
| 0.6 |
|
Other |
|
| 6.4 |
|
|
| 5.8 |
|
Allowance for credit losses |
|
| (6.6 | ) |
|
| (5.5 | ) |
Delayed customer billings |
|
| 6.7 |
|
|
| 7.5 |
|
Inventories: |
|
|
|
|
|
|
|
|
Natural gas |
|
| 35.5 |
|
|
| 22.5 |
|
Materials and supplies |
|
| 10.8 |
|
|
| 8.4 |
|
Regulatory assets |
|
| 18.8 |
|
|
| 20.4 |
|
Prepayments |
|
| 5.4 |
|
|
| 4.3 |
|
Other |
|
| 0 |
|
|
| 0.2 |
|
Total Current Assets |
|
| 127.4 |
|
|
| 95.6 |
|
Deferred Charges and Other Assets: |
|
|
|
|
|
|
|
|
Regulatory assets |
|
| 483.3 |
|
|
| 489.9 |
|
Deferred income tax |
|
| 34.2 |
|
|
| 59.3 |
|
Other |
|
| 63.9 |
|
|
| 53.7 |
|
Total Deferred Charges and Other Assets |
|
| 581.4 |
|
|
| 602.9 |
|
Total Assets |
| $ | 2,170.5 |
|
| $ | 2,051.4 |
|
SPIRE ALABAMA INC.
BALANCE SHEETS (continued)
|
| September 30 |
| |||||
|
| 2021 |
|
| 2020 |
| ||
CAPITALIZATION AND LIABILITIES |
|
|
|
|
|
|
|
|
Capitalization: |
|
|
|
|
|
|
|
|
Common stock and paid-in capital (par value $0.01 per share; 3,000,000 shares authorized; 1,972,052 issued and outstanding at September 30, 2021 and 2020) |
| $ | 328.9 |
|
| $ | 350.9 |
|
Retained earnings |
|
| 552.6 |
|
|
| 500.8 |
|
Total Shareholders' Equity |
|
| 881.5 |
|
|
| 851.7 |
|
Long-term debt (less current portion) |
|
| 571.2 |
|
|
| 471.8 |
|
Total Capitalization |
|
| 1,452.7 |
|
|
| 1,323.5 |
|
Current Liabilities: |
|
|
|
|
|
|
|
|
Current portion of long-term debt |
|
| 50.0 |
|
|
| 0 |
|
Notes payable – associated companies |
|
| 49.0 |
|
|
| 121.3 |
|
Accounts payable |
|
| 52.3 |
|
|
| 43.7 |
|
Accounts payable – associated companies |
|
| 6.0 |
|
|
| 4.2 |
|
Advance customer billings |
|
| 11.2 |
|
|
| 11.5 |
|
Wages and compensation accrued |
|
| 9.3 |
|
|
| 8.0 |
|
Customer deposits |
|
| 18.4 |
|
|
| 18.7 |
|
Taxes accrued |
|
| 30.4 |
|
|
| 28.0 |
|
Regulatory liabilities |
|
| 13.4 |
|
|
| 3.9 |
|
Other |
|
| 17.3 |
|
|
| 11.8 |
|
Total Current Liabilities |
|
| 257.3 |
|
|
| 251.1 |
|
Deferred Credits and Other Liabilities: |
|
|
|
|
|
|
|
|
Pension and postretirement benefit costs |
|
| 66.7 |
|
|
| 74.9 |
|
Asset retirement obligations |
|
| 362.8 |
|
|
| 374.3 |
|
Regulatory liabilities |
|
| 23.4 |
|
|
| 18.5 |
|
Other |
|
| 7.6 |
|
|
| 9.1 |
|
Total Deferred Credits and Other Liabilities |
|
| 460.5 |
|
|
| 476.8 |
|
Commitments and Contingencies (Note 16) |
|
|
|
|
|
|
|
|
Total Capitalization and Liabilities |
| $ | 2,170.5 |
|
| $ | 2,051.4 |
|
| SPIRE MISSOURI INC. | |||||||
| BALANCE SHEETS | |||||||
| (In Millions) | |||||||
| September 30 | 2017 | 2016 | |||||
| ASSETS | |||||||
| Utility Plant | $ | 3,091.8 | $ | 2,718.5 | |||
| Less: Accumulated depreciation and amortization | 681.6 | 604.5 | |||||
| Net Utility Plant | 2,410.2 | 2,114.0 | |||||
| Goodwill | 210.2 | 210.2 | |||||
| Other Property and Investments | 59.4 | 57.3 | |||||
| Other Property and Investments | 269.6 | 267.5 | |||||
| Current Assets: | |||||||
| Cash and cash equivalents | 2.5 | 2.1 | |||||
| Accounts receivable: | |||||||
| Utility | 101.7 | 87.9 | |||||
| Associated companies | 3.3 | 2.2 | |||||
| Other | 15.0 | 11.4 | |||||
| Allowance for doubtful accounts | (14.1 | ) | (16.1 | ) | |||
| Delayed customer billings | 3.4 | 1.6 | |||||
| Inventories: | |||||||
| Natural gas | 138.2 | 127.3 | |||||
| Propane gas | 12.0 | 12.0 | |||||
| Materials and supplies | 11.3 | 9.2 | |||||
| Derivative instrument assets | 0.1 | 4.9 | |||||
| Unamortized purchased gas adjustments | 57.4 | 43.1 | |||||
| Other regulatory assets | 38.2 | 23.9 | |||||
| Prepayments and other | 19.6 | 14.5 | |||||
| Total Current Assets | 388.6 | 324.0 | |||||
| Deferred Charges: | |||||||
| Regulatory assets | 557.8 | 589.8 | |||||
| Other | 5.3 | 1.1 | |||||
| Total Deferred Charges | 563.1 | 590.9 | |||||
| Total Assets | $ | 3,631.5 | $ | 3,296.4 | |||
| SPIRE MISSOURI INC. | |||||||
| BALANCE SHEETS (continued) | |||||||
| September 30 | 2017 | 2016 | |||||
| CAPITALIZATION AND LIABILITIES | |||||||
| Capitalization: | |||||||
| Common stock equity | $ | 1,171.0 | $ | 1,068.5 | |||
| Long-term debt | 873.9 | 804.1 | |||||
| Total Capitalization | 2,044.9 | 1,872.6 | |||||
| Current Liabilities: | |||||||
| Current portion of long-term debt | 100.0 | — | |||||
| Notes payable | — | 243.7 | |||||
| Notes payable – associated companies | 203.0 | — | |||||
| Accounts payable | 89.9 | 67.6 | |||||
| Accounts payable to associated companies | 5.4 | 5.4 | |||||
| Advance customer billings | 13.3 | 49.1 | |||||
| Wages and compensation accrued | 29.6 | 29.9 | |||||
| Dividends payable | — | 14.0 | |||||
| Customer deposits | 13.3 | 13.5 | |||||
| Interest accrued | 8.0 | 7.7 | |||||
| Taxes accrued | 34.1 | 29.1 | |||||
| Regulatory liabilities | 2.7 | 1.3 | |||||
| Other | 8.5 | 9.9 | |||||
| Total Current Liabilities | 507.8 | 471.2 | |||||
| Deferred Credits and Other Liabilities: | |||||||
| Deferred income taxes | 623.8 | 556.9 | |||||
| Pension and postretirement benefit costs | 173.0 | 211.8 | |||||
| Asset retirement obligations | 158.6 | 75.2 | |||||
| Regulatory liabilities | 81.2 | 67.3 | |||||
| Other | 42.2 | 41.4 | |||||
| Total Deferred Credits and Other Liabilities | 1,078.8 | 952.6 | |||||
Commitments and Contingencies (Note 16) | |||||||
| Total Capitalization and Liabilities | $ | 3,631.5 | $ | 3,296.4 | |||
See the accompanying
Notes to Financial Statements.SPIRE ALABAMA INC.
|
| Common Stock |
|
| Paid-in |
|
| Retained |
|
|
|
|
| |||||||
(Dollars in millions) |
| Shares |
|
| Par |
|
| Capital |
|
| Earnings |
|
| Total |
| |||||
Balance at September 30, 2018 |
|
| 1,972,052 |
|
| $ | — |
|
| $ | 390.9 |
|
| $ | 417.8 |
|
| $ | 808.7 |
|
Net income |
|
| — |
|
|
| — |
|
|
| — |
|
|
| 60.3 |
|
|
| 60.3 |
|
Dividends declared |
|
| — |
|
|
| — |
|
|
| — |
|
|
| (19.0 | ) |
|
| (19.0 | ) |
Return of capital to Spire |
|
| — |
|
|
| — |
|
|
| (20.0 | ) |
|
| — |
|
|
| (20.0 | ) |
Balance at September 30, 2019 |
|
| 1,972,052 |
|
|
| — |
|
|
| 370.9 |
|
|
| 459.1 |
|
|
| 830.0 |
|
Net income |
|
| — |
|
|
| — |
|
|
| — |
|
|
| 65.7 |
|
|
| 65.7 |
|
Dividends declared |
|
| — |
|
|
| — |
|
|
| — |
|
|
| (24.0 | ) |
|
| (24.0 | ) |
Return of capital to Spire |
|
| — |
|
|
| — |
|
|
| (20.0 | ) |
|
| — |
|
|
| (20.0 | ) |
Balance at September 30, 2020 |
|
| 1,972,052 |
|
|
| — |
|
|
| 350.9 |
|
|
| 500.8 |
|
|
| 851.7 |
|
Net income |
|
| — |
|
|
| — |
|
|
| — |
|
|
| 73.8 |
|
|
| 73.8 |
|
Dividends declared |
|
| — |
|
|
| — |
|
|
| — |
|
|
| (22.0 | ) |
|
| (22.0 | ) |
Return of capital to Spire |
|
| — |
|
|
| — |
|
|
| (22.0 | ) |
|
| — |
|
|
| (22.0 | ) |
Balance at September 30, 2021 |
|
| 1,972,052 |
|
| $ | — |
|
| $ | 328.9 |
|
| $ | 552.6 |
|
| $ | 881.5 |
|
| SPIRE MISSOURI INC. | |||||||
| STATEMENTS OF CAPITALIZATION | |||||||
| (Dollars in millions, except per share amounts) | |||||||
| September 30 | 2017 | 2016 | |||||
| Common Stock Equity: | |||||||
| Common stock, par value $1 per share: | |||||||
| Authorized – 50,000,000 shares | |||||||
| Outstanding – 24,577 shares | $ | 0.1 | $ | 0.1 | |||
| Paid-in capital | 756.1 | 751.9 | |||||
| Retained earnings | 416.5 | 318.3 | |||||
| Accumulated other comprehensive loss | (1.7 | ) | (1.8 | ) | |||
| Total Common Stock Equity | 1,171.0 | 1,068.5 | |||||
| Long-Term Debt: | |||||||
| First Mortgage Bonds: | |||||||
| 2.0% Series, due August 15, 2018 | — | 100.0 | |||||
| 5.5% Series, due May 1, 2019 | 50.0 | 50.0 | |||||
| 3.0% Series, due March 15, 2023 | 55.0 | 55.0 | |||||
| 3.4% Series, due August 15, 2023 | 250.0 | 250.0 | |||||
| 3.4% Series, due March 15, 2028 | 45.0 | 45.0 | |||||
| 7.0% Series, due June 1, 2029 | 25.0 | 25.0 | |||||
| 7.9% Series, due September 15, 2030 | 30.0 | 30.0 | |||||
| 3.68% Series, due September 15, 2032 | 50.0 | — | |||||
| 6.0% Series, due May 1, 2034 | 100.0 | 100.0 | |||||
| 6.15% Series, due June 1, 2036 | 55.0 | 55.0 | |||||
| 4.625% Series, due August 15, 2043 | 100.0 | 100.0 | |||||
| 4.23% Series, due September 15, 2047 | 70.0 | — | |||||
| 4.38% Series, due September 15, 2057 | 50.0 | — | |||||
| Total Principal of Long-Term Debt | 880.0 | 810.0 | |||||
| Unamortized debt issuance costs | (4.6 | ) | (4.2 | ) | |||
| Unamortized discounts on long-term debt | (1.5 | ) | (1.7 | ) | |||
| Total Long-Term Debt | 873.9 | 804.1 | |||||
| Total Capitalization | $ | 2,044.9 | $ | 1,872.6 | |||
See the accompanying
Notes to Financial Statements.SPIRE ALABAMA INC.
STATEMENTS OF CASH FLOWS
|
| Years Ended September 30 |
| |||||||||
(In millions) |
| 2021 |
|
| 2020 |
|
| 2019 |
| |||
Operating Activities: |
|
|
|
|
|
|
|
|
|
|
|
|
Net Income |
| $ | 73.8 |
|
| $ | 65.7 |
|
| $ | 60.3 |
|
Adjustments to reconcile net income to net cash provided by operating activities: |
|
|
|
|
|
|
|
|
|
|
|
|
Depreciation and amortization |
|
| 62.1 |
|
|
| 59.3 |
|
|
| 56.2 |
|
Deferred income taxes |
|
| 25.0 |
|
|
| 22.0 |
|
|
| 20.5 |
|
Changes in assets and liabilities: |
|
|
|
|
|
|
|
|
|
|
|
|
Accounts receivable |
|
| (17.8 | ) |
|
| 7.3 |
|
|
| 0.8 |
|
Inventories |
|
| (15.4 | ) |
|
| 11.9 |
|
|
| (1.2 | ) |
Regulatory assets and liabilities |
|
| 29.2 |
|
|
| (23.5 | ) |
|
| (28.2 | ) |
Accounts payable |
|
| 14.0 |
|
|
| (15.1 | ) |
|
| 4.5 |
|
Delayed/advance customer billings |
|
| 0.5 |
|
|
| (6.6 | ) |
|
| (2.5 | ) |
Taxes accrued |
|
| 2.5 |
|
|
| 0.6 |
|
|
| (0.9 | ) |
Other assets and liabilities |
|
| (37.8 | ) |
|
| 18.9 |
|
|
| 34.8 |
|
Other |
|
| 0.3 |
|
|
| 0.2 |
|
|
| (3.2 | ) |
Net cash provided by operating activities |
|
| 136.4 |
|
|
| 140.7 |
|
|
| 141.1 |
|
Investing Activities: |
|
|
|
|
|
|
|
|
|
|
|
|
Capital expenditures |
|
| (169.8 | ) |
|
| (150.4 | ) |
|
| (174.5 | ) |
Other |
|
| 0.7 |
|
|
| 1.6 |
|
|
| (3.3 | ) |
Net cash used in investing activities |
|
| (169.1 | ) |
|
| (148.8 | ) |
|
| (177.8 | ) |
Financing Activities: |
|
|
|
|
|
|
|
|
|
|
|
|
Issuance of long-term debt |
|
| 150.0 |
|
|
| 100.0 |
|
|
| 90.0 |
|
Repayment of long-term debt, net |
|
| 0 |
|
|
| (40.0 | ) |
|
| 0 |
|
Repayment of borrowings from Spire, net |
|
| (72.4 | ) |
|
| (7.4 | ) |
|
| (13.8 | ) |
Return of capital to Spire |
|
| (22.0 | ) |
|
| (20.0 | ) |
|
| (20.0 | ) |
Dividends paid |
|
| (22.0 | ) |
|
| (24.0 | ) |
|
| (19.0 | ) |
Other |
|
| (0.9 | ) |
|
| (0.5 | ) |
|
| (0.5 | ) |
Net cash provided by financing activities |
|
| 32.7 |
|
|
| 8.1 |
|
|
| 36.7 |
|
Net Change in Cash and Cash Equivalents |
|
| 0 |
|
|
| 0 |
|
|
| 0 |
|
Cash and Cash Equivalents at Beginning of Year |
|
| 0 |
|
|
| 0 |
|
|
| 0 |
|
Cash and Cash Equivalents at End of Year |
| $ | 0 |
|
| $ | 0 |
|
| $ | 0 |
|
|
|
|
|
|
|
|
|
|
|
|
|
|
Supplemental disclosure of cash paid for: |
|
|
|
|
|
|
|
|
|
|
|
|
Interest, net of amounts capitalized |
| $ | (17.9 | ) |
| $ | (19.0 | ) |
| $ | (19.2 | ) |
Income taxes |
|
| 0 |
|
|
| 0 |
|
|
| 0 |
|
| SPIRE MISSOURI INC. | ||||||||||||||||||||||
| STATEMENTS OF COMMON SHAREHOLDER’S EQUITY | ||||||||||||||||||||||
| Common Stock Outstanding | Paid-in Capital | Retained Earnings | AOCI* | |||||||||||||||||||
| (Dollars in millions) | Shares | Amount | Total | |||||||||||||||||||
| Balance at September 30, 2014 | 24,577 | $ | 0.1 | $ | 744.0 | $ | 265.6 | $ | (1.9 | ) | $ | 1,007.8 | ||||||||||
| Net income | — | — | — | 105.3 | — | 105.3 | ||||||||||||||||
| Stock-based compensation costs | — | — | 3.7 | — | — | 3.7 | ||||||||||||||||
| Tax benefit – stock compensation | — | — | 0.5 | — | — | 0.5 | ||||||||||||||||
| Dividends declared | — | — | — | (79.7 | ) | — | (79.7 | ) | ||||||||||||||
| Other comprehensive income, net of tax | — | — | — | — | 0.2 | 0.2 | ||||||||||||||||
| Balance at September 30, 2015 | 24,577 | $ | 0.1 | $ | 748.2 | $ | 291.2 | $ | (1.7 | ) | $ | 1,037.8 | ||||||||||
| Net income | — | — | — | 105.9 | — | 105.9 | ||||||||||||||||
| Stock-based compensation costs | — | — | 3.7 | — | — | 3.7 | ||||||||||||||||
| Dividends declared | — | — | — | (78.8 | ) | — | (78.8 | ) | ||||||||||||||
| Other comprehensive loss, net of tax | — | — | — | — | (0.1 | ) | (0.1 | ) | ||||||||||||||
| Balance at September 30, 2016 | 24,577 | $ | 0.1 | $ | 751.9 | $ | 318.3 | $ | (1.8 | ) | $ | 1,068.5 | ||||||||||
| Net income | — | — | — | 113.0 | — | 113.0 | ||||||||||||||||
| Stock-based compensation costs | — | — | 4.2 | — | — | 4.2 | ||||||||||||||||
| Dividends declared | — | — | — | (14.8 | ) | — | (14.8 | ) | ||||||||||||||
| Other comprehensive income, net of tax | — | — | — | — | 0.1 | 0.1 | ||||||||||||||||
| Balance at September 30, 2017 | 24,577 | $ | 0.1 | $ | 756.1 | $ | 416.5 | $ | (1.7 | ) | $ | 1,171.0 | ||||||||||
See the accompanying
| SPIRE MISSOURI INC. | |||||||||||
| STATEMENTS OF CASH FLOWS | |||||||||||
| (In millions) | |||||||||||
| Years Ended September 30 | 2017 | 2016 | 2015 | ||||||||
| Operating Activities: | |||||||||||
| Net Income | $ | 113.0 | $ | 105.9 | $ | 105.3 | |||||
Adjustments to reconcile net income to net cash provided by operating activities: | |||||||||||
| Depreciation and amortization | 93.1 | 88.6 | 82.6 | ||||||||
| Deferred income taxes and investment tax credits | 47.5 | 45.3 | 45.4 | ||||||||
| Changes in assets and liabilities: | |||||||||||
| Accounts receivable – net | (20.5 | ) | 35.7 | 9.9 | |||||||
| Unamortized purchased gas adjustments | (11.6 | ) | (18.7 | ) | 21.3 | ||||||
| Accounts payable | 16.8 | 0.9 | (11.4 | ) | |||||||
| Delayed/advance customer billings – net | (37.6 | ) | 24.9 | 17.9 | |||||||
| Taxes accrued | 5.0 | 4.9 | (14.6 | ) | |||||||
| Inventories | (13.0 | ) | 11.0 | 51.2 | |||||||
| Other assets and liabilities | (11.6 | ) | (29.6 | ) | (32.8 | ) | |||||
| Other | 1.6 | 2.3 | 2.8 | ||||||||
| Net cash provided by operating activities | 182.7 | 271.2 | 277.6 | ||||||||
| Investing Activities: | |||||||||||
| Capital expenditures | (282.2 | ) | (197.8 | ) | (198.6 | ) | |||||
| Other | 1.1 | 1.1 | 2.9 | ||||||||
| Net cash used in investing activities | (281.1 | ) | (196.7 | ) | (195.7 | ) | |||||
| Financing Activities: | |||||||||||
| Issuance of first mortgage bonds | 170.0 | — | — | ||||||||
| (Repayment) issuance of short-term debt - net | (243.7 | ) | 10.7 | (5.7 | ) | ||||||
| Borrowings from Spire | 203.0 | — | 18.4 | ||||||||
| Repayment of borrowings from Spire | — | — | (18.4 | ) | |||||||
| Dividends paid | (28.7 | ) | (84.8 | ) | (78.7 | ) | |||||
| Other | (1.8 | ) | — | 0.5 | |||||||
| Net cash provided by (used in) financing activities | 98.8 | (74.1 | ) | (83.9 | ) | ||||||
| Net Increase (Decrease) in Cash and Cash Equivalents | 0.4 | 0.4 | (2.0 | ) | |||||||
| Cash and Cash Equivalents at Beginning of Year | 2.1 | 1.7 | 3.7 | ||||||||
| Cash and Cash Equivalents at End of Year | $ | 2.5 | $ | 2.1 | $ | 1.7 | |||||
| Supplemental disclosure of cash (paid) refunded for: | |||||||||||
| Interest | $ | (38.6 | ) | $ | (35.7 | ) | $ | (31.0 | ) | ||
| Income taxes | — | 2.1 | 0.7 | ||||||||
| SPIRE ALABAMA INC. | |||||||||||
| STATEMENTS OF INCOME | |||||||||||
| (In millions) | |||||||||||
| Years Ended September 30 | 2017 | 2016 | 2015 | ||||||||
| Operating Revenues: | |||||||||||
| Utility | $ | 400.5 | $ | 368.5 | $ | 479.2 | |||||
| Total Operating Revenues | 400.5 | 368.5 | 479.2 | ||||||||
| Operating Expenses: | |||||||||||
| Utility | |||||||||||
| Natural and propane gas | 84.5 | 67.3 | 171.5 | ||||||||
| Other operation and maintenance expenses | 130.4 | 133.5 | 138.0 | ||||||||
| Depreciation and amortization | 49.9 | 47.8 | 47.3 | ||||||||
| Taxes, other than income taxes | 29.9 | 28.4 | 33.2 | ||||||||
| Total Operating Expenses | 294.7 | 277.0 | 390.0 | ||||||||
| Operating Income | 105.8 | 91.5 | 89.2 | ||||||||
| Other Income - Net | 2.5 | 7.9 | 2.0 | ||||||||
| Interest Charges: | |||||||||||
| Interest on long-term debt | 11.2 | 11.4 | 11.6 | ||||||||
| Other interest charges | 3.2 | 2.4 | 2.3 | ||||||||
| Total Interest Charges | 14.4 | 13.8 | 13.9 | ||||||||
| Income Before Income Taxes | 93.9 | 85.6 | 77.3 | ||||||||
| Income Tax Expense | 35.8 | 32.4 | 29.3 | ||||||||
| Net Income | $ | 58.1 | $ | 53.2 | $ | 48.0 | |||||
| SPIRE ALABAMA INC. | |||||||
| BALANCE SHEETS | |||||||
| (In millions) | |||||||
| September 30 | 2017 | 2016 | |||||
| ASSETS | |||||||
| Utility Plant | $ | 1,838.0 | $ | 1,729.6 | |||
| Less: Accumulated depreciation and amortization | 782.0 | 756.6 | |||||
| Net Utility Plant | 1,056.0 | 973.0 | |||||
| Current Assets: | |||||||
| Cash and cash equivalents | 0.1 | — | |||||
| Accounts receivable: | |||||||
| Utility | 32.0 | 34.0 | |||||
| Other | 6.2 | 7.2 | |||||
| Allowance for doubtful accounts | (2.6 | ) | (3.3 | ) | |||
| Inventories: | |||||||
| Natural gas | 33.9 | 34.6 | |||||
| Materials and supplies | 6.5 | 5.9 | |||||
| Unamortized purchased gas adjustments | 45.2 | 5.6 | |||||
| Other regulatory assets | 19.4 | 14.9 | |||||
| Prepayments and other | 6.7 | 5.1 | |||||
| Total Current Assets | 147.4 | 104.0 | |||||
| Deferred Charges: | |||||||
| Regulatory assets | 197.0 | 230.7 | |||||
| Deferred income tax | 185.6 | 221.4 | |||||
| Other | 57.0 | 60.8 | |||||
| Total Deferred Charges | 439.6 | 512.9 | |||||
| Total Assets | $ | 1,643.0 | $ | 1,589.9 | |||
| SPIRE ALABAMA INC. | |||||||
| BALANCE SHEETS (continued) | |||||||
| September 30 | 2017 | 2016 | |||||
| CAPITALIZATION AND LIABILITIES | |||||||
| Capitalization: | |||||||
| Common stock equity | $ | 867.4 | $ | 867.3 | |||
| Long-term debt | 247.8 | 247.6 | |||||
| Total Capitalization | 1,115.2 | 1,114.9 | |||||
| Current Liabilities: | |||||||
| Notes payable | — | 82.0 | |||||
| Notes payable – associated companies | 169.9 | — | |||||
| Accounts payable | 44.4 | 34.3 | |||||
| Accounts payable to associated companies | 1.6 | 0.4 | |||||
| Advance customer billings | 18.6 | 21.1 | |||||
| Wages and compensation accrued | 7.4 | 7.8 | |||||
| Customer deposits | 17.9 | 18.2 | |||||
| Interest accrued | 3.3 | 3.3 | |||||
| Taxes accrued | 23.4 | 21.6 | |||||
| Other regulatory liabilities | 12.0 | 22.7 | |||||
| Other | 2.9 | 6.3 | |||||
| Total Current Liabilities | 301.4 | 217.7 | |||||
| Deferred Credits and Other Liabilities: | |||||||
| Pension and postretirement benefit costs | 50.2 | 74.3 | |||||
| Asset retirement obligations | 128.4 | 120.1 | |||||
| Regulatory liabilities | 39.6 | 41.7 | |||||
| Other | 8.2 | 21.2 | |||||
| Total Deferred Credits and Other Liabilities | 226.4 | 257.3 | |||||
Commitments and Contingencies (Note 16) | |||||||
| Total Capitalization and Liabilities | $ | 1,643.0 | $ | 1,589.9 | |||
| SPIRE ALABAMA INC. | |||||||
| STATEMENTS OF CAPITALIZATION | |||||||
| (Dollars in millions, except per share amounts) | |||||||
| September 30 | 2017 | 2016 | |||||
| Common Stock Equity: | |||||||
| Common stock, par value $0.01 per share, and paid-in capital: | |||||||
| Authorized – 3,000,000 shares | |||||||
| Outstanding – 1,972,052 shares | $ | 420.9 | $ | 451.9 | |||
| Retained earnings | 446.5 | 415.4 | |||||
| Total Common Stock Equity | 867.4 | 867.3 | |||||
| Long-Term Debt: | |||||||
| 5.2% Notes, due January 15, 2020 | 40.0 | 40.0 | |||||
| 3.86% Notes, due December 23, 2021 | 50.0 | 50.0 | |||||
| 3.21% Notes, due September 15, 2025 | 35.0 | 35.0 | |||||
| 5.9% Notes, due January 15, 2037 | 45.0 | 45.0 | |||||
| 4.31% Notes, due December 1, 2045 | 80.0 | 80.0 | |||||
| Total Principal of Long-Term Debt | 250.0 | 250.0 | |||||
| Unamortized debt issuance costs | (2.2 | ) | (2.4 | ) | |||
| Total Long-Term Debt | 247.8 | 247.6 | |||||
| Total Capitalization | $ | 1,115.2 | $ | 1,114.9 | |||
| SPIRE ALABAMA INC. | ||||||||||||||||||
| STATEMENTS OF COMMON SHAREHOLDER’S EQUITY | ||||||||||||||||||
| Common Stock Outstanding | Paid-in Capital | Retained Earnings | ||||||||||||||||
| (Dollars in millions) | Shares | Amount | Total | |||||||||||||||
| Balance at September 30, 2014 | 1,972,052 | $ | — | $ | 503.9 | $ | 345.7 | $ | 849.6 | |||||||||
| Net income | — | — | — | 48.0 | 48.0 | |||||||||||||
| Return of capital to Spire | — | — | (27.0 | ) | — | (27.0 | ) | |||||||||||
| Purchase accounting adjustments | — | — | 4.0 | — | 4.0 | |||||||||||||
| Balance at September 30, 2015 | 1,972,052 | — | 480.9 | 393.7 | 874.6 | |||||||||||||
| Net income | — | — | — | 53.2 | 53.2 | |||||||||||||
| Dividends declared | — | — | — | (31.5 | ) | (31.5 | ) | |||||||||||
| Return of capital to Spire | — | — | (29.0 | ) | — | (29.0 | ) | |||||||||||
| Balance at September 30, 2016 | 1,972,052 | — | 451.9 | 415.4 | 867.3 | |||||||||||||
| Net income | — | — | — | 58.1 | 58.1 | |||||||||||||
| Dividends declared | — | — | — | (27.0 | ) | (27.0 | ) | |||||||||||
| Return of capital to Spire | — | — | (31.0 | ) | — | (31.0 | ) | |||||||||||
| Balance at September 30, 2017 | 1,972,052 | $ | — | $ | 420.9 | $ | 446.5 | $ | 867.4 | |||||||||
| SPIRE ALABAMA INC. | |||||||||||
| STATEMENTS OF CASH FLOWS | |||||||||||
| (In millions) | |||||||||||
| Years Ended September 30 | 2017 | 2016 | 2015 | ||||||||
| Operating Activities: | |||||||||||
| Net Income | $ | 58.1 | $ | 53.2 | $ | 48.0 | |||||
| Adjustments to reconcile net income to net cash provided by operating activities: | |||||||||||
| Depreciation and amortization | 49.9 | 47.8 | 47.3 | ||||||||
| Deferred income taxes | 35.8 | 33.2 | 29.2 | ||||||||
| Changes in assets and liabilities: | |||||||||||
| Accounts receivable – net | (10.0 | ) | (11.1 | ) | (9.1 | ) | |||||
| Unamortized purchased gas adjustments | (39.6 | ) | (33.8 | ) | 5.8 | ||||||
| Accounts payable | 8.8 | 9.1 | (10.4 | ) | |||||||
| Advance customer billings | (2.5 | ) | 2.0 | 2.4 | |||||||
| Taxes accrued | 1.8 | (5.2 | ) | (4.0 | ) | ||||||
| Inventories | 0.1 | 5.3 | 7.2 | ||||||||
| Other assets and liabilities | (16.6 | ) | (3.2 | ) | (18.0 | ) | |||||
| Other | (1.3 | ) | 0.9 | 2.0 | |||||||
| Net cash provided by operating activities | 84.5 | 98.2 | 100.4 | ||||||||
| Investing Activities: | |||||||||||
| Capital expenditures | (113.9 | ) | (93.4 | ) | (85.8 | ) | |||||
| Other | (0.4 | ) | (2.5 | ) | (1.0 | ) | |||||
| Net cash used in investing activities | (114.3 | ) | (95.9 | ) | (86.8 | ) | |||||
| Financing Activities: | |||||||||||
| Issuance of long-term debt | — | 80.0 | 35.0 | ||||||||
| Repayment of long-term debt | — | (80.0 | ) | (34.8 | ) | ||||||
| (Repayment) issuance of short-term debt - net | (82.0 | ) | 51.0 | 15.0 | |||||||
| Borrowings from Spire | 169.9 | — | — | ||||||||
| Return of capital to Spire | (31.0 | ) | (29.0 | ) | (27.0 | ) | |||||
| Dividends paid | (27.0 | ) | (31.5 | ) | — | ||||||
| Other | — | — | (0.2 | ) | |||||||
| Net cash provided by (used in) financing activities | 29.9 | (9.5 | ) | (12.0 | ) | ||||||
| Net Increase (Decrease) in Cash and Cash Equivalents | 0.1 | (7.2 | ) | 1.6 | |||||||
| Cash and Cash Equivalents at Beginning of Period | — | 7.2 | 5.6 | ||||||||
| Cash and Cash Equivalents at End of Period | $ | 0.1 | $ | — | $ | 7.2 | |||||
| Supplemental disclosure of cash (paid) refunded for: | |||||||||||
| Interest | $ | (12.8 | ) | $ | (12.4 | ) | $ | (12.3 | ) | ||
| Income taxes | — | 0.8 | — | ||||||||
SPIRE INC., SPIRE MISSOURI INC., AND SPIRE ALABAMA INC.
NOTES TO FINANCIAL STATEMENTS
(Dollars in millions, except per share, per unit and per gallon amounts)
1. SUMMARY OF SIGNIFICANT ACCOUNTING POLICIES
BASIS OF PRESENTATION
–These notes are an integral part of the accompanying audited financial statements of Spire Inc. (“Spire” or the “Company”) presented on a consolidated basis,The accompanying audited financial statements have been prepared in accordance with accounting principles generally accepted in the United States of America (GAAP).
NATURE OF OPERATIONS
– SpireUSE OF ESTIMATES
– The preparation of financial statements in conformity with GAAP requires management to make estimates and assumptions that affect the reported amounts of assets and liabilities and disclosure of contingent assets and liabilities at the date of the financial statements and the reported amounts of revenues and expenses during the reporting periods. Actual results could differ from those estimates.SYSTEM OF ACCOUNTS –
The accounts of the Utilities are maintained in accordance with the Uniform System of Accounts prescribed by the applicable state public service commissions, which systems substantially conform to that prescribed by the Federal Energy Regulatory Commission (FERC).| September 30 | 2017 | 2016 | 2015 | ||||||||
| Spire | $ | 41.0 | $ | 30.4 | $ | 13.4 | |||||
| Spire Missouri | 28.9 | 14.8 | 9.6 | ||||||||
| Spire Alabama | 9.4 | 6.8 | 3.1 | ||||||||
| Spire | Spire Missouri | Spire Alabama | |||||||||||||||||||||
| 2017 | 2016 | 2017 | 2016 | 2017 | 2016 | ||||||||||||||||||
| Asset retirement obligations, beginning of year | $ | 206.4 | $ | 159.2 | $ | 75.2 | $ | 72.4 | $ | 120.1 | $ | 86.6 | |||||||||||
| Liabilities incurred during the period | 5.5 | 4.1 | 0.3 | 1.2 | 5.2 | 2.9 | |||||||||||||||||
| Liabilities settled during the period | (4.6 | ) | (9.5 | ) | (1.1 | ) | (1.9 | ) | (1.9 | ) | (6.8 | ) | |||||||||||
| Accretion | 9.1 | 13.2 | 3.6 | 3.5 | 5.0 | 9.7 | |||||||||||||||||
| Revisions in estimated cash flows | 80.2 | 27.5 | 80.6 | — | — | 27.7 | |||||||||||||||||
| Addition of Spire EnergySouth asset retirement obligations | — | 11.9 | — | — | — | — | |||||||||||||||||
| Asset retirement obligations, end of year | $ | 296.6 | $ | 206.4 | $ | 158.6 | $ | 75.2 | $ | 128.4 | $ | 120.1 | |||||||||||
REGULATED OPERATIONS
– The Utilities account for their regulated operations in accordance with Financial Accounting Standards Board (FASB) Accounting Standards Codification (ASC) Topic 980,PROPERTY, PLANT, AND EQUIPMENT –
Utility Plant – Utility plant is stated at original cost. The cost of additions to utility plant includes contracted work, direct labor and materials, allocable overheads and an allowance for funds used during construction. The costs of units of property retired, replaced or renewed are removed from utility plant and are charged to accumulated depreciation. Maintenance and repairs of property and replacement and renewal of items determined to be less than units of property are charged to maintenance expenses.
Utility plant is depreciated using the composite method on a straight-line basis over the estimated service lives of the various classes of property at rates approved by the applicable regulatory commission. For Spire Missouri and for Spire Alabama, the annual depreciation and amortization expense in fiscal years 2021, 2020 and 2019 averaged approximately 3% of the original cost of depreciable and amortizable property.
Non-utility Property – Non-utility property is recorded at the original cost of acquisition or construction, which includes material, labor, contractor services and, for FERC-regulated projects, an allowance for funds used during construction. Repairs, replacements and renewals of items of property determined to be less than a unit of property or that do not increase the property’s life or functionality are charged to maintenance expense. Upon retirement or sale of non-utility property, the original cost and related accumulated depreciation are removed from the accounts and any gain or loss is included in the income statements. Costs related to software developed or obtained for internal use are capitalized and amortized on a straight-line basis over the estimated useful life of the related software. If software is retired prior to being fully amortized, the difference is recorded as a loss in the income statements.
Accrued Capital Expenditures – Accrued capital expenditures, shown in the following table, are excluded from capital expenditures in the statements of cash flows until paid.
September 30 |
| 2021 |
|
| 2020 |
|
| 2019 |
| |||
Spire |
| $ | 59.5 |
|
| $ | 67.6 |
|
| $ | 80.6 |
|
Spire Missouri |
|
| 37.1 |
|
|
| 34.3 |
|
|
| 40.1 |
|
Spire Alabama |
|
| 13.6 |
|
|
| 17.0 |
|
|
| 11.9 |
|
ASSET RETIREMENT OBLIGATIONS – Spire, Spire Missouri and Spire Alabama record legal obligations associated with the Purchased Gas Adjustment (PGA) clauses and Gas Supply Adjustment (GSA) riders allowretirement of long-lived assets in the Utilitiesperiod in which the obligations are incurred, if sufficient information exists to pass through to customersreasonably estimate the fair value of the obligations. Obligations are recorded as both a cost of purchasedthe related long-lived asset and as a corresponding liability. Subsequently, the asset retirement costs are depreciated over the life of the asset and the asset retirement obligations are accreted to the expected settlement amounts. The Company, Spire Missouri and Spire Alabama record asset retirement obligations associated with certain safety requirements to purge and seal gas supplies. Regulatory assetsdistribution mains upon retirement, the plugging and regulatory liabilitiesabandonment of storage wells and other storage facilities, specific service line obligations, and certain removal and disposal obligations related to the PGA clausescomponents of Spire Missouri’s, Spire Alabama’s and the GSA riderSpire Gulf’s distribution systems and general plant. Asset retirement obligations recorded by Spire’s other subsidiaries are both labeled Unamortized Purchased Gas Adjustments herein.
In fiscal 2020, Spire Alabama refined certain assumptions and estimates used in calculating its asset retirement obligations, resulting in both an annual period commencingincrease in cost to retire gas distribution assets and a change in the subsequent November. The customer sharetiming of such income is determinedthe related cash outflows. As a result of this change in accordance with the following tables, shown for each service territory forestimate, which the PGA clausesCompany believes is more precise, Spire Alabama recorded a $221.1 increase to its asset retirement obligations in fiscal 2020. Related adjustments were approved bymade to regulatory assets and utility plant, with no impact on earnings. The following table presents a reconciliation of the MoPSC.
| Customer Share | Company Share | |
| Spire Missouri East | ||
| First $2.0 of pre-tax income* | 85% | 15% |
| Next $2.0 of pre-tax income | 80% | 20% |
| Next $2.0 of pre-tax income | 75% | 25% |
| Amounts of pre-tax income exceeding $6.0 | 70% | 30% |
| * Customer share was set to 85% and company share set to 15% in fiscal 2017. For fiscal 2016 and 2015, the customer share and company share were 100% and 0%, respectively. | ||
| Spire Missouri West | ||
| First $1.2 of pre-tax income | 85% | 15% |
| Next $1.2 of pre-tax income | 80% | 20% |
| Next $1.2 of pre-tax income | 75% | 25% |
| Amounts of pre-tax income exceeding $3.6 | 70% | 30% |
|
| Spire |
|
| Spire Missouri |
|
| Spire Alabama |
| |||||||||||||||
|
| 2021 |
|
| 2020 |
|
| 2021 |
|
| 2020 |
|
| 2021 |
|
| 2020 |
| ||||||
Asset retirement obligations, beginning of year |
| $ | 540.1 |
|
| $ | 337.6 |
|
| $ | 153.4 |
|
| $ | 173.5 |
|
| $ | 374.3 |
|
| $ | 148.7 |
|
Liabilities incurred during the period |
|
| 11.1 |
|
|
| 3.0 |
|
|
| 1.4 |
|
|
| 2.6 |
|
|
| 7.4 |
|
|
| 0 |
|
Liabilities settled during the period |
|
| (21.9 | ) |
|
| (6.9 | ) |
|
| (9.7 | ) |
|
| (4.0 | ) |
|
| (10.7 | ) |
|
| (1.6 | ) |
Accretion |
|
| 21.8 |
|
|
| 14.0 |
|
|
| 6.2 |
|
|
| 7.2 |
|
|
| 15.0 |
|
|
| 6.1 |
|
Revisions in estimated cash flows |
|
| (31.5 | ) |
|
| 192.4 |
|
|
| (7.9 | ) |
|
| (25.9 | ) |
|
| (23.2 | ) |
|
| 221.1 |
|
Asset retirement obligations, end of year |
| $ | 519.6 |
|
| $ | 540.1 |
|
| $ | 143.4 |
|
| $ | 153.4 |
|
| $ | 362.8 |
|
| $ | 374.3 |
|
NATURAL GAS AND PROPANE GAS
– For SpireBUSINESS COMBINATIONS
AND GOODWILL –| Gas Utility | Gas Marketing | Other | Total | ||||||||||||
| Balance as of September 30, 2014 | $ | 210.2 | $ | — | $ | 727.6 | $ | 937.8 | |||||||
| Adjustments to finalize the acquisition of Spire Alabama | — | — | 8.2 | 8.2 | |||||||||||
| Balance as of September 30, 2015 | 210.2 | — | 735.8 | 946.0 | |||||||||||
| Acquisition of Spire EnergySouth | — | — | 218.9 | 218.9 | |||||||||||
| Balance as of September 30, 2016 | 210.2 | — | 954.7 | 1,164.9 | |||||||||||
| Adjustments to finalize the acquisition of Spire EnergySouth | — | — | 6.7 | 6.7 | |||||||||||
| Balance as of September 30, 2017 | $ | 210.2 | $ | — | $ | 961.4 | $ | 1,171.6 | |||||||
IMPAIRMENT OF LONG-LIVED ASSETS
– Long-lived assets classified as held and used are evaluated for impairment when events or changes in circumstances indicate that the carrying value of such assets may not be recoverable. Whether impairment has occurred is determined by comparing the estimated undiscounted cash flows attributable to the assets with the carrying value of the assets. If the carrying value exceeds the undiscounted cash flows, the Company recognizes an impairment charge equal to the amount of the carrying value that exceeds the estimated fair value of the assets. In the period in which the Company determines an asset meets held-for-sale criteria, an impairment charge is recorded to the extent the book value exceeds its fair value less cost to sell.On July 1, 2020, Spire’s Board of Directors, based upon the recommendation of senior management, revised the development plan for Spire Storage, resulting in an impairment charge of $140.8 related to Spire Storage assets (non-utility property on monthly cycles. The Missouri Utilities, Spire Gulf and Spire Mississippi record their gas utility revenues from gas sales and transportation services on an accrual basis that includes estimated amounts for gas delivered, but not yet billed. The accruals for unbilled revenues are reversedthe balance sheet) in the subsequent accounting period when meters are actually readquarter ended June 30, 2020. The revision was driven by the realization that a longer time horizon will be required for optimization and customers are billed.positioning of the storage facility to serve energy markets in the western United States. Among other factors, evaluations of the continuing evolution of market dynamics in the region led management to update models of various development alternatives. Separately in the quarter ended June 30, 2020, Spire recorded impairment charges totaling $7.8 related to 2 commercial compressed natural gas fueling stations (also non-utility property) as a result of revised projections reflecting lower diesel prices and slower conversions of Class 8 vehicles. The amounts of accrued unbilled revenues for Spire Missouri atfair values used in measuring the impairment charges were determined with an expected present value technique using a discounted cash flow method under an income approach. In the quarter ended September 30, 20172021, Spire sold 1 of the fueling stations and 2016 were $30.1 and $26.1, respectively. Spire Alabama records natural gas distribution revenues in accordance with the tariff established by the APSC. Unbilled revenue is accrued in an amount equal to the related gas cost, as profit margin is not considered earned until billed. The amountsrecorded a gain of accrued unbilled revenues for Spire Alabama at September 30, 2017 and 2016 were $1.9 and $5.9. Spire’s other subsidiaries, including Spire Marketing, record revenues when earned, either when the product is delivered or when services are performed.
DERIVATIVES – In the course of itstheir business, certain subsidiaries of Spire Marketing entersenter into commitments associated with the purchase or sale of natural gas. Certain of itstheir derivative natural gas contracts are designated as normal purchases or normal sales and, as such, are excluded from the scope of FASB ASC Topic 815, “DerivativesDerivatives and Hedging.”Hedging. Those contracts are accounted for as executory contracts and recorded on an accrual basis. Revenues and expenses from such contracts are recorded using a gross presentation.gross. Contracts not designated as normal purchases or normal sales are recorded as derivatives with changes in fair value recognized in earnings in the periods prior to physical delivery. For additional information on derivative instruments, refer to
INCOME TAXES
– Spire and its subsidiaries account for income taxes under the asset and liability method. Deferred tax assets and liabilities are recognized for the future tax consequences attributable to differences between the financial statement carrying amount of existing assets and liabilities and the respective tax basis and for tax credit carryforwards. Deferred tax assets and liabilities are measured using enacted tax rates expected to apply to taxable income in the years in which those temporary differences are expected to beThe Company accounts for uncertain tax positions in accordance with authoritative guidance. The authoritative guidance addresses the determination of whether tax benefits claimed, or expected to be claimed, on a tax return should be recorded in the financial statements. Spire may recognize the tax benefit from an uncertain tax position only if it is more likely than not that the position will be sustained upon examination by the taxing authority, based on the technical merits of the position. Tax-related interest and penalties, if any, are classified as a liability on the balance sheets.
CASH, AND CASH EQUIVALENTS,
NATURAL GAS RECEIVABLE
– Spire Marketing enters into natural gas transactions with natural gas pipeline and storage companies known as park and loan arrangements. Under the terms of the arrangements, Spire Marketing purchases natural gas from a third party and delivers that natural gas to the pipeline or storage company for the right to receive the same quantity of natural gas fromEARNINGS PER COMMON SHARE
– GAAP requires dual presentation of basic and diluted earnings per share (EPS). EPS is computed using the two-class method, which is an earnings allocation method for computing EPS that treats a participating security as having rights to earnings that would otherwise have been available to common shareholders. Certain of the Company’s stock-based compensation awards pay non-forfeitable dividends to the participants during the vesting period and, as such, are deemed participating securities. Basic EPS is computed by dividing net income available to common shareholders by the weighted average number of common shares outstanding during the period. Diluted EPS is computed by dividing net income available to common shareholders by the weighted average number of common shares outstanding that are increased for additional shares that would be outstanding if potentially dilutive non-participating securities were converted to common shares, pursuant to the treasury stock method. Shares attributable to equity units, non-participating stock options and time-vested restricted stock/units are excluded from the calculation of diluted earnings per share if the effect would be antidilutive. Shares attributable to non-participating performance-contingent restricted stock awards are only included in the calculation of diluted earnings per share to the extent the underlying performance and/or market conditions are satisfied (a) prior to the end of the reporting period or (b) would be satisfied if the end of the reporting period were the end of the related contingency period and the result would be dilutive. The Company’s EPS computations are presented in Note 4, Earnings Per Common Share.| 2017 | 2016 | 2015 | |||||||||
| Spire | $ | 84.6 | $ | 75.5 | $ | 97.3 | |||||
| Spire Missouri | 60.7 | 57.4 | 74.5 | ||||||||
| Spire Alabama | 19.5 | 17.9 | 22.6 | ||||||||
TRANSACTIONS WITH AFFILIATES
–Transactions between affiliates of the Company have been eliminated from the consolidated financial statements of Spire. Spire Missouri and Spire Alabama borrowed funds from the Company and incurred related interest, as reflected in their separate financial statements, and they participated in normal intercompany shared services transactions. In addition, Spire Missouri’s and Spire Alabama’s other transactions with affiliates included:
|
| Spire Missouri |
|
| Spire Alabama |
| ||||||||||||||||||
|
| 2021 |
|
| 2020 |
|
| 2019 |
|
| 2021 |
|
| 2020 |
|
| 2019 |
| ||||||
Natural gas purchases from Spire Marketing |
| $ | 92.5 |
|
| $ | 56.9 |
|
| $ | 95.3 |
|
| $ | 10.4 |
|
| $ | 6.3 |
|
| $ | — |
|
Natural gas sales to Spire Marketing |
|
| 1.1 |
|
|
| 0.1 |
|
|
| 1.7 |
|
|
| 0.1 |
|
|
| 0.3 |
|
|
| — |
|
Transportation services from Spire STL Pipeline LLC |
|
| 32.0 |
|
|
| 27.9 |
|
|
| — |
|
|
| — |
|
|
| — |
|
|
| — |
|
Transportation services from Spire NGL Inc. |
|
| 0.5 |
|
|
| 1.0 |
|
|
| 1.0 |
|
|
| — |
|
|
| — |
|
|
| — |
|
| 2017 | 2016 | 2015 | |||||||||
| Purchases of natural gas from Spire Marketing | $ | 74.4 | $ | 46.3 | $ | 74.1 | |||||
| Sales of natural gas to Spire Marketing | 7.8 | 1.9 | 4.0 | ||||||||
| Transportation services received from Spire NGL Inc. | 1.0 | 1.0 | 1.0 | ||||||||
ACCOUNTS RECEIVABLE AND ALLOWANCE FOR DOUBTFUL ACCOUNTS
|
| Spire |
|
| Spire Missouri |
|
| Spire Alabama |
| |||||||||||||||||||||||||||
|
| 2021 |
|
| 2020 |
|
| 2019 |
|
| 2021 |
|
| 2020 |
|
| 2019 |
|
| 2021 |
|
| 2020 |
|
| 2019 |
| |||||||||
Allowance at beginning of year |
| $ | 24.9 |
|
| $ | 23.0 |
|
| $ | 22.4 |
|
| $ | 18.1 |
|
| $ | 14.9 |
|
| $ | 16.0 |
|
| $ | 5.5 |
|
| $ | 6.3 |
|
| $ | 3.9 |
|
Provision for expected credit losses |
|
| 14.7 |
|
|
| 14.0 |
|
|
| 16.9 |
|
|
| 11.1 |
|
|
| 12.7 |
|
|
| 12.3 |
|
|
| 3.1 |
|
|
| 0.9 |
|
|
| 4.7 |
|
Write-offs, net of recoveries |
|
| (9.3 | ) |
|
| (12.1 | ) |
|
| (16.3 | ) |
|
| (6.6 | ) |
|
| (9.5 | ) |
|
| (13.4 | ) |
|
| (2.0 | ) |
|
| (1.7 | ) |
|
| (2.3 | ) |
Allowance at end of year |
| $ | 30.3 |
|
| $ | 24.9 |
|
| $ | 23.0 |
|
| $ | 22.6 |
|
| $ | 18.1 |
|
| $ | 14.9 |
|
| $ | 6.6 |
|
| $ | 5.5 |
|
| $ | 6.3 |
|
FINANCE RECEIVABLES
– Spire Alabama finances third party contractor sales of merchandise including gas furnaces and appliances. At September 30,GROUP MEDICAL AND WORKERS’ COMPENSATION RESERVES
– The Company self-insures its group medical and workers’ compensation costs and carries stop-loss coverage in relation to medical claims and workers’ compensation claims. Reserves for amounts incurred but not reported are established based on historical cost levels and lags between occurrences and reporting.FAIR VALUE MEASUREMENTS
– Certain assets and liabilities are recognized or disclosed at fair value, which is defined as the price that would be received to sell an asset or paid to transfer a liability in an orderly transaction between market participants at the measurement date (exit price). GAAP establishes a fair value hierarchy that prioritizes the inputs used to measure fair value.The levels of the hierarchy are described below:
• | Level 1 – Unadjusted quoted prices in active markets for identical assets or liabilities. |
• | Level 2 – Pricing inputs other than quoted prices included within Level 1, which are either directly or indirectly observable for the asset or liability as of the reporting date. These inputs are derived principally from, or corroborated by, observable market data. |
• | Level 3 – Pricing that is based upon inputs that are generally unobservable that are based on the best information available and reflect management’s assumptions about how market participants would price the asset or liability. |
Assessment of the significance of a particular input to the fair value measurements may require judgment and may affect the valuation of the asset or liability and its placement within the fair value hierarchy. Additional information about fair value measurements is provided in
Note 8, Fair Value of Financial Instruments, Note 9, Fair Value Measurements, and Note 13, Pension Plans and Other Postretirement Benefits.STOCK-BASED COMPENSATION
– The Company accounts for share-based compensation arrangements in accordance with ASC Topic 718, Compensation - Stock Compensation. The Company measures stock-based compensation awards at fair value at the date of grant and recognizes the compensation cost of the awards over the requisite service period.NEW ACCOUNTING PRONOUNCEMENTS
–Spire, Spire Missouri and Spire Alabama are currently assessingadopted the timing and impacts of adopting this standard, which must be adopted by the first quarter of fiscal 2020.
In June 2016, the FASB issued ASU No. 2016-13, Financial Instruments – Credit Losses: Measurement of Credit Losses on Financial Instruments, which was later supplemented by ASU Nos. 2018-19, 2019-04, 2019-05 and 2019-11. The standard replaces the current “incurred loss” model with an “expected loss” model for certain instruments, including trade receivables, requiring measurement of all expected credit losses for financial assets held at the reporting date based on historical experience, current conditions, and reasonable and supportable forecasts. It also requires entities to record credit loss allowances for available-for-sale securities rather than impair the carrying amount of the securities. Spire, Spire Missouri and Spire Alabama adopted the new standard for the quarter ending December 31, 2020. Based on the credit quality of the existing available-for sale securities portfolio, 0 allowance for credit losses were recognized at adoption for those investments. Application of the new guidance did not result in any significant modifications to the Company’s policies related to recognizing an allowance on trade receivables, and the adoption of the new standard did not have a material impact on Spire’s, Spire Missouri’s and Spire Alabama’s financial statements.
2. REVENUE
The following tables show revenue disaggregated by source and customer type.
|
| 2021 |
|
| 2020 |
|
| 2019 |
| |||
Spire |
|
|
|
|
|
|
|
|
|
|
|
|
Gas Utility: |
|
|
|
|
|
|
|
|
|
|
|
|
Residential |
| $ | 1,234.0 |
|
| $ | 1,184.3 |
|
| $ | 1,267.3 |
|
Commercial & industrial |
|
| 586.0 |
|
|
| 383.0 |
|
|
| 433.9 |
|
Transportation |
|
| 122.9 |
|
|
| 115.8 |
|
|
| 112.1 |
|
Off-system & other incentive |
|
| 152.7 |
|
|
| 38.4 |
|
|
| 41.9 |
|
Other customer revenue |
|
| 22.2 |
|
|
| 26.2 |
|
|
| 22.5 |
|
Total revenue from contracts with customers |
|
| 2,117.8 |
|
|
| 1,747.7 |
|
|
| 1,877.7 |
|
Changes in accrued revenue under alternative revenue programs |
|
| 1.5 |
|
|
| 4.3 |
|
|
| (16.9 | ) |
Total Gas Utility operating revenues |
|
| 2,119.3 |
|
|
| 1,752.0 |
|
|
| 1,860.8 |
|
Gas Marketing |
|
| 96.5 |
|
|
| 87.9 |
|
|
| 83.7 |
|
Other |
|
| 67.7 |
|
|
| 57.8 |
|
|
| 21.5 |
|
Total before eliminations |
|
| 2,283.5 |
|
|
| 1,897.7 |
|
|
| 1,966.0 |
|
Intersegment eliminations (see Note 14, Information by Operating Segment) |
|
| (48.0 | ) |
|
| (42.3 | ) |
|
| (13.6 | ) |
Total Operating Revenues |
| $ | 2,235.5 |
|
| $ | 1,855.4 |
|
| $ | 1,952.4 |
|
Spire Missouri |
|
|
|
|
|
|
|
|
|
|
|
|
Residential |
| $ | 882.1 |
|
| $ | 859.6 |
|
| $ | 945.9 |
|
Commercial & industrial |
|
| 436.1 |
|
|
| 241.4 |
|
|
| 283.8 |
|
Transportation |
|
| 33.5 |
|
|
| 32.9 |
|
|
| 33.1 |
|
Off-system & other incentive |
|
| 145.6 |
|
|
| 35.1 |
|
|
| 41.9 |
|
Other customer revenue |
|
| 16.3 |
|
|
| 22.3 |
|
|
| — |
|
Total revenue from contracts with customers |
|
| 1,513.6 |
|
|
| 1,191.3 |
|
|
| 1,304.7 |
|
Changes in accrued revenue under alternative revenue programs |
|
| 3.0 |
|
|
| 2.3 |
|
|
| (12.9 | ) |
Total Operating Revenues |
| $ | 1,516.6 |
|
| $ | 1,193.6 |
|
| $ | 1,291.8 |
|
Spire Alabama |
|
|
|
|
|
|
|
|
|
|
|
|
Residential |
| $ | 288.0 |
|
| $ | 267.8 |
|
| $ | 265.3 |
|
Commercial & industrial |
|
| 114.9 |
|
|
| 109.4 |
|
|
| 113.5 |
|
Transportation |
|
| 78.7 |
|
|
| 72.9 |
|
|
| 69.5 |
|
Off-system & other incentive |
|
| 7.1 |
|
|
| 3.2 |
|
|
| — |
|
Other customer revenue |
|
| 1.9 |
|
|
| 1.9 |
|
|
| 20.7 |
|
Total revenue from contracts with customers |
|
| 490.6 |
|
|
| 455.2 |
|
|
| 469.0 |
|
Changes in accrued revenue under alternative revenue programs |
|
| 3.4 |
|
|
| (0.2 | ) |
|
| (3.5 | ) |
Total Operating Revenues |
| $ | 494.0 |
|
| $ | 455.0 |
|
| $ | 465.5 |
|
The Utilities sell natural gas to residential and other customers. The sale of natural gas is governed by the various state utility commissions, which set rates, charges, and terms and conditions of service, collectively included in a “tariff.” The performance obligation, which relates to the promise to provide natural gas, is satisfied over time as the customer simultaneously receives and consumes the natural gas, and revenue is recognized accordingly.
The Utilities’ transportation revenue relates to the promise to transport the specified quantities of natural gas at tariff rates. This performance obligation is satisfied over time as the gas is transported, and revenue is recognized as invoiced monthly.
The Utilities have alternative revenue programs (ARPs), which represent an agreement between the utility and its regulator, currently consisting of decoupling mechanisms (also known as weather normalization adjustments) and incentive programs (primarily Alabama’s Cost Control Measure). When the criteria to recognize additional (or reduced) revenue from ARPs have been met, the Utilities establish a regulatory asset (or liability). When amounts previously recognized for ARPs are effectivebilled, the Utilities reduce the regulatory asset (or liability) and increase (or decrease) accounts receivable. Billed amounts, which are part of the overall tariff paid by customers, are included in revenue from contracts with customers, while the change in the related regulatory asset or liability is presented as revenue from ARPs. Depending on whether the beginning accrued ARP balance was a regulatory asset or liability and depending on the size and direction of the current period accrual, the amount presented as revenue from ARPs could be negative.
The Utilities read meters and bill customers on monthly cycles. Spire Missouri, Spire Gulf and Spire Mississippi record their gas utility revenues from gas sales and transportation services on an accrual basis that includes estimated amounts for fiscal years beginning after December 15, 2018,gas delivered but not yet billed. The accruals for unbilled revenues are reversed in the subsequent accounting period when meters are actually read and interim periodscustomers are billed. Spire Alabama records natural gas distribution revenues in accordance with the tariff established by the APSC. Unbilled revenue is accrued in an amount equal to the related gas cost, as profit margin is not considered earned until billed. Spire’s other subsidiaries, including Spire Marketing, record revenues when earned, as the product is delivered or as services are performed.
Gas Marketing’s contracts are derivatives. Wholesale contracts (with producers, municipalities, and utility companies) are subject to derivative accounting. Retail contracts (with large commercial and industrial customers) are designated as “normal purchase, normal sale” arrangements and are therefore accounted for as revenue from contracts with customers. The performance obligation is satisfied over time by the transfer of control of natural gas to the customer, and revenue is recognized as invoiced monthly.
Payments are generally required within those fiscal years,30 days of billing, and early applicationcontracts generally do not have a significant financing component. Spire’s revenues are not subject to significant returns, refunds, or warranty obligations.
Spire, Spire Missouri, and Spire Alabama have elected to apply a “right to invoice” practical expedient, recognizing revenue for volumes delivered for which they have a right to invoice, as long as that amount corresponds with the value to the customer. Disclosures about remaining performance obligations are not required because either contracts have an original expected duration of one year or less, or revenue is permitted. Therecognized under the right to invoice practical expedient, or both.
Sales taxes imposed on applicable Spire Alabama and Spire Missouri sales are billed to customers. These amounts are not recorded in the statements of income but are recorded as tax collections payable and included in the “Other” line of the Current Liabilities section of the balance sheets.
Gross receipts taxes associated with the Company’s natural gas utility services are imposed on the Company, Spire Missouri, and Spire Alabama are currently assessing the effects of this new guidance, as well as the timing of adoption.
| As originally recorded | Measurement period adjustments | As adjusted | |||||||||
Recognized amounts of identifiable assets acquired and liabilities assumed: | |||||||||||
| Utility plant | $ | 199.5 | $ | — | $ | 199.5 | |||||
| Cash | 2.0 | — | 2.0 | ||||||||
| Other current assets | 17.5 | 0.2 | 17.7 | ||||||||
| Other assets | 79.8 | (10.7 | ) | 69.1 | |||||||
| Long-term debt | (67.0 | ) | — | (67.0 | ) | ||||||
| Other current liabilities | (42.7 | ) | — | (42.7 | ) | ||||||
| Deferred tax liabilities | (35.5 | ) | — | (35.5 | ) | ||||||
| Other liabilities | (52.8 | ) | — | (52.8 | ) | ||||||
| Total identifiable net assets | 100.8 | (10.5 | ) | 90.3 | |||||||
| Goodwill | 218.9 | 6.7 | 225.6 | ||||||||
| Consideration (cash) | $ | 319.7 | $ | (3.8 | ) | $ | 315.9 | ||||
|
| 2021 |
|
| 2020 |
|
| 2019 |
| |||
Spire |
| $ | 94.0 |
|
| $ | 91.5 |
|
| $ | 99.3 |
|
Spire Missouri |
|
| 64.3 |
|
|
| 63.5 |
|
|
| 71.1 |
|
Spire Alabama |
|
| 25.1 |
|
|
| 23.3 |
|
|
| 23.7 |
|
| 2017 | 2016 | ||||||
| Total Operating Revenues | $ | 95.5 | $ | 3.3 | |||
| Net Income (Loss) | 9.4 | (0.2 | ) | ||||
| Earnings Per Share | $ | 0.20 | $ | — | |||
| 2017 | 2016 | 2015 | |||||||||
| Total Operating Revenues | $ | 1,740.7 | $ | 1,632.4 | $ | 2,081.6 | |||||
| Net Income | 161.6 | 153.9 | 143.6 | ||||||||
| Basic Earnings Per Share | $ | 3.44 | $ | 3.48 | $ | 3.32 | |||||
| Diluted Earnings Per Share | 3.43 | 3.46 | 3.31 | ||||||||
3. STOCK-BASED COMPENSATION
The Laclede GroupSpire 2015 Equity Incentive Plan (the 2015 Plan),(EIP) was approved at the annual meeting ofby shareholders of Spire on January 29, 2015.2015 and amended on November 9, 2018. The purpose of the 2015 PlanEIP is to encourage directors, officers, and key employees of the Company and its subsidiaries to contribute to the Company’s success and align their interests with that of shareholders. To accomplish this purpose, the Compensation Committee (Committee)(“Committee”) of theSpire’s Board of Directors (the “Board”) may grant awards under the 2015 PlanEIP that may be earned by achieving performance objectives and/or other criteria as determined by the Committee. Under the terms of the 2015 Plan,EIP, officers and employees of the Company and its subsidiaries, as determined by the Committee, are eligible to be selected for awards. The 2015 PlanEIP provides for restricted stock, restricted stock units, qualified and non-qualified stock options, stock appreciation rights, and performance shares payable in stock, cash, or a combination of both. The 2015 PlanEIP generally provides a minimum vesting period of at least three years for each type of award, with pro rata vesting permitted during the minimum three-year vesting period. The maximum number of shares reserved for issuance under the 2015 PlanEIP is 1,000,000. The 2015 Plan replaced The Laclede Group 2006 Equity Incentive Plan (the 2006 Plan), which in turn replaced The Laclede Group, Inc. 2002 Equity Incentive Plan (the 2002 Plan). Shares reserved under the 2006 Plan and the 2002 Plan, other than those needed for outstanding awards, were canceled upon shareholder approval of the 2015 Plan.
The Company issues new shares to satisfy employee restricted stock awards and stock option exercises.
Restricted Stock Awards
During fiscal 2017,2021, the Company granted 196,400133,726 performance-contingent restricted share units to executive officers and key employees at a weighted average grant date fair value of $45.01$68.69 per share. This number represents the maximumtarget shares that can be earned pursuant to the terms of the awards. The share units have a performance period ending September 30, 2019.2024. While the participants have no interim voting rights on these share units, dividends accrue during the performance period and are paid to the participants upon vesting but are subject to forfeiture if the underlying share units do not vest.
The number of share units that will ultimately vest is dependent upon the attainment of certain levels of earnings and other strategic goals, as well as the Company’s level of total shareholder return (TSR) during the performance period relative to a comparator group of peer companies. This TSR provision is considered a market condition under GAAP and is discussed further below.
The weighted average grant date fair value of performance-contingent restricted shares and share units granted during fiscal years 20162020 and 20152019 was $45.95$76.19 and $36.69$80.72 per share, respectively.
Fiscal 20172021 activity of restricted stock and restricted stock units subject to performance and/or market conditions is presented below:
|
| Units |
|
| Weighted Average Grant Date Fair Value Per Unit |
| ||
Nonvested at September 30, 2020 |
|
| 259,944 |
|
| $ | 78.92 |
|
Granted |
|
| 133,726 |
|
| $ | 68.69 |
|
Vested |
|
| (55,619 | ) |
| $ | 80.06 |
|
Forfeited |
|
| (25,455 | ) |
| $ | 72.98 |
|
Nonvested at September 30, 2021 |
|
| 312,596 |
|
| $ | 74.33 |
|
For the year ended September 30, 2021, the total number of shares that could be issued if all outstanding award grants attain maximum performance payout is 625,192.
Shares/ Units | Weighted Average Grant Date Fair Value Per Share | |||||
| Nonvested at September 30, 2016 | 510,583 | $ | 40.37 | |||
| Granted (maximum shares that can be earned) | 196,400 | $ | 45.01 | |||
| Vested | (78,825 | ) | $ | 42.37 | ||
| Forfeited | (64,128 | ) | $ | 33.03 | ||
| Nonvested at September 30, 2017 (at maximum) | 564,030 | $ | 42.51 | |||
| Nonvested at September 30, 2017 (at target) | 282,015 | $ | 56.32 | |||
During fiscal 2017,2021, the Company granted 33,24048,340 shares of time-vested restricted stock to executive officers and key employees at a weighted average grant date fair value of $63.05$64.29 per share. Unless forfeited based on terms of the agreements, these shares will vest in fiscal 2020.2024. In the interim, participants receive full voting rights and dividends, which are not subject to forfeiture. The weighted average grant date fair value of time-vested restricted stock and restricted stock units awarded to employees during fiscal years 20162020 and 20152019 was $59.40$76.13 and $50.90$76.66 per share, respectively.
During fiscal 2017,2021, the Company granted 10,85014,080 shares of time-vested restricted stock to non-employee directors at a weighted average grant date fair value of $63.45$62.35 per share. These shares vested in fiscal 2017,2021, six months after the grant date. The weighted average grant date fair value of restricted stock awarded to non-employee directors during fiscal years 20162020 and 20152019 was $63.93$84.58 and $54.66$78.69 per share, respectively.
Time-vested restricted stock and stock unit activity for fiscal 20172021 is presented below:
|
| Shares/ Units |
|
| Weighted Average Grant Date Fair Value Per Share |
| ||
Nonvested at September 30, 2020 |
|
| 93,673 |
|
| $ | 76.45 |
|
Granted |
|
| 48,340 |
|
| $ | 64.29 |
|
Vested |
|
| (30,313 | ) |
| $ | 77.15 |
|
Forfeited |
|
| (1,400 | ) |
| $ | 72.70 |
|
Nonvested at September 30, 2021 |
|
| 110,300 |
|
| $ | 70.98 |
|
Shares/ Units | Weighted Average Grant Date Fair Value Per Share | |||||
| Nonvested at September 30, 2016 | 132,779 | $ | 49.83 | |||
| Granted | 44,090 | $ | 63.15 | |||
| Vested | (58,200 | ) | $ | 47.67 | ||
| Forfeited | (7,729 | ) | $ | 55.58 | ||
| Nonvested at September 30, 2017 | 110,940 | $ | 55.85 | |||
For restricted stock and stock units (performance-contingent and time-vested) that vested during fiscal years 2017, 2016,2021, 2020, and 2015,2019, the Company withheld 35,51416,787 shares, 30,71241,353 shares and 31,688,28,731 shares, respectively, at weighted average prices of $63.83, $57.29,$65.99, $77.07 and $50.65$79.23 per share, respectively, pursuant to elections by employees to satisfy tax withholding obligations. The total fair value of restricted stock (performance-contingent and time-vested) that vested during fiscal years 2017, 2016,2021, 2020, and 20152019 was $8.9, $6.3,$6.5, $9.8, and $6.4,$7.6, respectively, and the related tax benefit was $3.3, $2.4,$2.5, $3.7, and $2.4,$2.9, respectively. None of the tax benefits have been realized.
In fiscal 2019, the Company gave participants in the EIP the ability to defer a portion or all of their award. Participants have elected to defer 88,927, 59,408 and 80,760 shares (at target payout) in fiscal years 2017, 2016,2021, 2020 and 2015. There was no stock option activity2019, respectively. Based on actual performance, these awards will be issued in fiscal 2017,cash, not shares, once the performance requirements have been achieved, so related amounts are reflected as all outstanding stock options either vested or forfeited in fiscal 2016. During fiscal 2016, cash received fromtemporary equity on the exercise of stock options was $0.7 and the related intrinsic value was $0.7. During fiscal 2015, cash received from the exercise of stock options was $1.5 and the related intrinsic value was $0.9. Related tax benefits were not material in any of those years.consolidated balance sheet.
Equity Compensation Costs
Compensation cost for performance-contingent restricted stock and stock unit awards is based upon the probable outcome of the performance conditions. For shares or units that do not vest or that are not expected to vest due to the outcome of the performance conditions (excluding market conditions), no compensation cost is recognized and any previously recognized compensation cost is reversed.
The fair value of awards of performance-contingent and time-vested restricted stock and restricted stock units, not subject to the TSR provision, are estimated using the closing price of the Company’s stock on the grant date. For those awards that do not pay dividends during the vesting period, the estimate of fair value is reduced by the present value of the dividends expected to be paid on the Company’s common stock during the performance period, discounted using an appropriate United States (US)U.S. Treasury yield. For shares subject to the TSR provision, the estimated impact of this market condition is reflected in the grant date fair value per share of the awards. Accordingly, compensation cost is not reversed to reflect any actual reductions in the awards that may result from the TSR provision. However, if the Company’s TSR during the performance period ranks below the level specified in the award agreements, relative to a comparator group of companies, and the Committee elects not to reduce the award (or reduce by a lesser amount), this election would be accounted for as a modification of the original award and additional compensation cost would be recognized at that time. The grant date fair value of the awards subject to the TSR provision awarded during fiscal years 2017, 2016,2021, 2020 and 20152019 was valued by a Monte Carlo simulation model that assessed the probabilities of various TSR outcomes. The significant assumptions used in the Monte Carlo simulations are as follows:
|
| 2021 |
|
| 2020 |
|
| 2019 |
| |||
Risk-free interest rate |
| 0.22% |
|
| 1.57% |
|
| 2.88% |
| |||
Expected dividend yield of stock |
|
| 0 |
|
|
| 0 |
|
|
| 0 |
|
Expected volatility of stock |
| 31.4% |
|
| 16.8% |
|
| 17.0% |
| |||
Vesting period |
| 3.0 years |
|
| 3.0 years |
|
| 3.0 years |
| |||
| 2017 | 2016 | 2015 | |||
| Risk-free interest rate | 1.39% | 1.14% | 0.83% | ||
| Expected dividend yield of stock | — | — | — | ||
| Expected volatility of stock | 16.3% | 15.0% | 14.0% | ||
| Vesting period | 2.8 years | 2.8 years | 2.8 years | ||
The risk-free interest rate was based on the yield on USU.S. Treasury securities matching the vesting period. A zero percent0-percent dividend yield was used, which is mathematically equivalent to the assumption that dividends are reinvested as they are paid. The expected volatility is based on the historical volatility of the Company’s stock. Volatility assumptions were also made for each of the companies included in the comparator group. The vesting period is equal to the performance period set forth in the terms of the award.
The amounts of compensation cost recognized for share-based compensation arrangements are presented below:
|
| 2021 |
|
| 2020 |
|
| 2019 |
| |||
Total compensation cost |
| $ | 16.6 |
|
| $ | 9.4 |
|
| $ | 8.6 |
|
Compensation cost capitalized |
|
| (2.7 | ) |
|
| (0.6 | ) |
|
| (1.4 | ) |
Compensation cost recognized in net income |
|
| 13.9 |
|
|
| 8.8 |
|
|
| 7.2 |
|
Income tax benefit recognized in net income |
|
| (3.2 | ) |
|
| (2.1 | ) |
|
| (1.7 | ) |
Compensation cost recognized in net income, net of income tax |
| $ | 10.7 |
|
| $ | 6.7 |
|
| $ | 5.5 |
|
| 2017 | 2016 | 2015 | |||||||||
| Total compensation cost | $ | 7.4 | $ | 6.7 | $ | 6.7 | |||||
| Compensation cost capitalized | (3.3 | ) | (2.2 | ) | (1.8 | ) | |||||
| Compensation cost recognized in net income | $ | 4.1 | $ | 4.5 | $ | 4.9 | |||||
| Income tax benefit recognized in net income | (1.5 | ) | (1.7 | ) | (1.9 | ) | |||||
| Compensation cost recognized in net income, net of income tax | $ | 2.6 | $ | 2.8 | $ | 3.0 | |||||
As of September 30, 2017,2021, there was $8.9$17.4 of total unrecognized compensation cost related to non-vested share-based compensation arrangements. That costarrangements, which is expected to be recognized over a weighted average period of 1.8 years.
|
| 2021 |
|
| 2020 |
|
| 2019 |
| |||
Basic Earnings Per Common Share: |
|
|
|
|
|
|
|
|
|
|
|
|
Net Income |
| $ | 271.7 |
|
| $ | 88.6 |
|
| $ | 184.6 |
|
Less: Provision for preferred dividends |
|
| 14.8 |
|
|
| 14.8 |
|
|
| 5.3 |
|
Income allocated to participating securities |
|
| 0.4 |
|
|
| 0.1 |
|
|
| 0.4 |
|
Net Income Available to Common Shareholders |
| $ | 256.5 |
|
| $ | 73.7 |
|
| $ | 178.9 |
|
Weighted Average Common Shares Outstanding (in millions) |
|
| 51.6 |
|
|
| 51.2 |
|
|
| 50.7 |
|
Basic Earnings Per Share of Common Stock |
| $ | 4.97 |
|
| $ | 1.44 |
|
| $ | 3.53 |
|
Diluted Earnings per Common Share: |
|
|
|
|
|
|
|
|
|
|
|
|
Net Income |
| $ | 271.7 |
|
| $ | 88.6 |
|
| $ | 184.6 |
|
Less: Provision for preferred dividends |
|
| 14.8 |
|
|
| 14.8 |
|
|
| 5.3 |
|
Income allocated to participating securities |
|
| 0.4 |
|
|
| 0.1 |
|
|
| 0.4 |
|
Net Income Available to Common Shareholders |
| $ | 256.5 |
|
| $ | 73.7 |
|
| $ | 178.9 |
|
Weighted Average Common Shares Outstanding (in millions) |
|
| 51.6 |
|
|
| 51.2 |
|
|
| 50.7 |
|
Dilutive Effect of Restricted Stock and Restricted Stock Units (in millions)* |
|
| 0.1 |
|
|
| 0.1 |
|
|
| 0.1 |
|
Weighted Average Diluted Common Shares (in millions) |
|
| 51.7 |
|
|
| 51.3 |
|
|
| 50.8 |
|
Diluted Earnings Per Share of Common Stock |
| $ | 4.96 |
|
| $ | 1.44 |
|
| $ | 3.52 |
|
|
|
|
|
|
|
|
|
|
|
|
|
|
* Calculation excludes certain outstanding common shares (shown in millions by period at the right) attributable to stock units subject to performance or market conditions and restricted stock, which could have a dilutive effect in the future |
|
| 0.1 |
|
|
| 0.1 |
|
|
| 0.1 |
|
| 2017 | 2016 | 2015 | |||||||||
| Basic EPS: | |||||||||||
| Net Income | $ | 161.6 | $ | 144.2 | $ | 136.9 | |||||
| Less: Income allocated to participating securities | 0.4 | 0.5 | 0.5 | ||||||||
| Net Income Available to Common Shareholders | $ | 161.2 | $ | 143.7 | $ | 136.4 | |||||
| Weighted Average Shares Outstanding (millions) | 46.9 | 44.1 | 43.2 | ||||||||
| Earnings Per Share of Common Stock | $ | 3.44 | $ | 3.26 | $ | 3.16 | |||||
| Diluted EPS: | |||||||||||
| Net Income | $ | 161.6 | $ | 144.2 | $ | 136.9 | |||||
| Less: Income allocated to participating securities | 0.4 | 0.5 | 0.5 | ||||||||
| Net Income Available to Common Shareholders | $ | 161.2 | $ | 143.7 | $ | 136.4 | |||||
| Weighted Average Shares Outstanding (millions) | 46.9 | 44.1 | 43.2 | ||||||||
| Dilutive Effect of Stock Options, Restricted Stock, and Restricted Stock Units (millions) | 0.1 | 0.2 | 0.1 | ||||||||
| Weighted Average Diluted Shares (millions) | 47.0 | 44.3 | 43.3 | ||||||||
| Earnings Per Share of Common Stock | $ | 3.43 | $ | 3.24 | $ | 3.16 | |||||
| Outstanding Shares (in millions) Excluded from the Calculation of Diluted EPS Attributable to: | |||||||||||
| Restricted stock and stock units subject to performance and/or market conditions | 0.5 | 0.3 | 0.3 | ||||||||
Spire
Preferred Stock
At September 30, 2021 and 2020, Spire had authorized 5,000,000 shares of preferred stock.
On May 21, 2019, Spire completed the public offering of 10,000,000 depositary shares (the “Depositary Shares”), each representing a 1/1,000th interest in a share of the Company’s 5.90% Series A Cumulative Redeemable Perpetual Preferred Stock, par value $25.00 per share, with a liquidation preference of $25,000 per share (the “Preferred Stock”). The transaction resulted in $242.0 of net proceeds, after deducting commissions and sale expenses, which proceeds were used to (i) refinance long-term and short-term Spire debt and (ii) fund capital expenditures at both the Utilities and Spire’s 2.875 million equity units issuedgas-related businesses.
Dividends on the Preferred Stock, when declared by the Board, are payable on the liquidation preference amount, on a cumulative basis, quarterly in June 2014 were anti-dilutivearrears on the 15th day of February, May, August and November of each year, beginning on August 15, 2019. Dividends are payable out of amounts legally available for the periods they were outstanding. Accordingly, they were also excludedpayment of dividends at an annual rate equal to 5.90% of the liquidation preference per share of Preferred Stock (equivalent to $25.00 per Depositary Share). Dividends accumulate daily and are cumulative from May 21, 2019.
Under the calculationterms of weighted average diluted shares for those periods. On April 3, 2017, Spire settled the Preferred Stock, the Company’s ability to declare or pay dividends on, or purchase contracts underlying those equity units by issuing approximately 2.5 millionor redeem, shares of its common stock. See
Spire may, at its option, redeem the Preferred Stock (i) in whole, but not in part, at any time prior to August 15, 2024, within 120 days after a ratings event where a rating agency amends, clarifies or changes the criteria it uses to assign equity credit for more information.
Shareholders of the Preferred Stock generally have no voting rights with respect to matters that generally require the approval of voting stockholders. The limited voting rights of holders of the Preferred Stock include the right to vote on certain matters that may affect the preference or special rights of the Preferred Stock. In 2014,addition, if and whenever dividends on any shares of Preferred Stock have not been declared and paid for at least six dividend periods, whether or not consecutive, the number of directors then constituting the Board shall automatically be increased by two (to be elected by the holders of the Preferred Stock) until all accumulated and unpaid dividends on the Preferred Stock have been paid in full.
Equity Units
In February 2021, Spire issued 2.8753.5 million equity units, asinitially in the form of Corporate Units, for an aggregate stated amount of $175.0, resulting in net proceeds (after underwriting fees and other issuance costs) of $169.3. Each “Corporate Unit” has a portionstated amount of the Spire Alabama acquisition financing. The equity units were originally issued at $50 per unit pursuant to the Purchase Contractfifty dollars and Pledge Agreement (Purchase Contract) dated asconsists of June 11, 2014 between Spire and U.S. Bank National Association, as(i) a stock purchase contract agent, collateral agent, custodial agent and securities intermediary. These units consisted of $143.8 aggregate(ii) a 1/20, or 5%, undivided beneficial ownership interest in 1 thousand dollars principal amount of 2014Spire’s 2021 Series A 2.00% remarketable junior subordinated notes0.75% Remarketable Senior Notes due 2022 andMarch 1, 2026 (RSNs). The RSNs are pledged as collateral to secure the Purchase Contract obligatingholder’s obligation under the related stock purchase contracts. Each stock purchase contract obligates the holder to purchase, common shares atand Spire to issue and deliver, on March 1, 2024, for a future settlement date. The equity unit investments were effectively replaced as plannedprice of fifty dollars in cash, a seriesvariable number of transactions outlined in
If the applicable market value* per share of Spire common stock is: | Number of shares to be purchased per stock purchase contract is: | |
Equal to or greater than $78.6906 (“threshold appreciation price”) | 0.6354 (“minimum settlement rate”) | |
Less than $78.6906, but greater than $64.24 | $50.00 ÷ applicable market value* | |
Less than or equal to $64.24 (“reference price”) | 0.7783 (“maximum settlement rate”) |
*Based on the volume-weighted average price of $57.3921Spire common stock during the 20 trading days before settlement.
If a holder elects to settle purchase contracts early, the holder would pay fifty dollars per share. Underunit and receive 0.6354 shares per unit.
The Company makes quarterly interest payments on the contract terms, the equity units were converted to common stockRSNs at the rate of 0.87120.75% per year and quarterly contract adjustment payments on the stock purchase contracts at the rate of 6.75%. The RSNs and the contract adjustment payments are structurally subordinated to all liabilities of Spire’s subsidiaries.
At issuance, the Company recorded the $35.0 present value of the stock purchase contract payments as a liability (reflected in “Other” current and noncurrent liabilities on the balance sheet) offset by a charge to additional paid-in capital in equity. This noncash financing activity has been excluded from the statement of cash flows. Interest payments on the RSNs are recorded as interest expense and stock purchase contract payments are charged against the liability. Accretion of the stock purchase contract liability is recorded as imputed interest expense. In calculating diluted EPS, the Company applies the treasury stock method to the Corporate Units. These securities have not had an effect on diluted EPS.
In order to secure funds necessary for the holders to pay the purchase price of the common stock on the purchase contract settlement date, the remarketing agent will remarket the RSNs on behalf of the current holders to new third-party investors. Following any successful remarketing of the RSNs, the interest rate on the RSNs will be reset, interest will be payable on a semi-annual basis, and Spire will cease to have the option to redeem the RSNs, other than in connection with the occurrence or continuance of certain special events.
ATM Program
On February 6, 2019, Spire entered into an at-the-market (ATM) equity distribution agreement, supplemented as of May 14, 2019, pursuant to which the Company may offer and sell, from time to time, shares per unit, withof its common stock having an aggregate offering price of up to $150.0. Proceeds from this program are intended to be used (i) to fund, in part, investments related to the construction of infrastructure and infrastructure improvements in the Utilities, as well as pipelines and storage, and (ii) for general corporate purposes, including repayment of short-term debt and the adjustment from time to time of the Company’s capital structure. There was no activity under this program during the year ended September 30, 2021. Cumulatively, since the inception of the ATM program, Spire has issued 626,249 shares, and as of September 30, 2021, can still issue shares having an aggregate offering price of up to $102.2.
Other Equity Information
Spire has a corresponding adjustment to purchase price.
Spire Missouri
Substantially all of Spire Missouri’s plant is subject to the liens of its first mortgage bonds. The mortgage contains several restrictions on Spire Missouri’s ability to pay cash dividends on its common stock or to make loans to its parent company. These mortgage restrictions are applicable regardless of whether the stock is publicly held or held solely by Spire Missouri’s parent company. Under the most restrictive of these provisions, no cash dividend may be declared or paid if, after the dividend, the aggregate net amount spent for all dividends after September 30, 1953 would exceed a maximum amount determined by a formula set out in the mortgage. Under that formula, the maximum amount is the sum of $8.0 plus earnings applicable to common stock (adjusted for stock repurchases and issuances) for the period from September 30, 1953 to the last day of the quarter before the declaration or payment date for the dividends. As of September 30, 20172021 and 2016,2020, the amount under the mortgage’s formula that was available to pay dividends was $1,010.8$1,413.4 and $916.8,$1,269.4, respectively. Thus, all of Spire Missouri’s retained earnings were free from such dividend restrictions as of those dates.
Spire Missouri filed with the SEChas a jointuniversal shelf registration statement on Form S-3 on file with the SEC for the issuance of various types ofequity and debt and equity securities, which registration statement will expire September 22, 2019. The amount, timing, and type of additional financing to be issued under this shelf registration statement will dependexpires on cash requirements and market conditions, as well as future MoPSC authorizations.
At September 30, 20172021 and 2016,2020, Spire Missouri had authorized 1,480,000 shares of preferred stock, but noneNaN were issued and outstanding.
Spire Alabama
At September 30, 20172021 and 2016,2020, Spire Alabama had authorized 120,000 shares of preferred stock, but noneNaN were issued and outstanding.
Accumulated Other Comprehensive Income
The components of accumulated other comprehensive income (loss)(AOCI), net of income taxes, recognized in the balance sheets at September 30 were as follows:
|
| Net Unrealized Gain (Loss) on Cash Flow Hedges |
|
| Defined Benefit Pension and Other Postretirement Benefit Plans |
|
| Net Unrealized Gain (Loss) on Available-for- Sale Debt Securities |
|
| Total |
| ||||
Spire |
|
|
|
|
|
|
|
|
|
|
|
|
|
|
|
|
Balance at September 30, 2019 |
| $ | (29.0 | ) |
| $ | (2.4 | ) |
| $ | 0.1 |
|
| $ | (31.3 | ) |
Other comprehensive loss |
|
| (9.4 | ) |
|
| (0.5 | ) |
|
| 0 |
|
|
| (9.9 | ) |
Balance at September 30, 2020 |
|
| (38.4 | ) |
|
| (2.9 | ) |
|
| 0.1 |
|
|
| (41.2 | ) |
Other comprehensive income (loss) |
|
| 46.3 |
|
|
| (1.3 | ) |
|
| (0.2 | ) |
|
| 44.8 |
|
Balance at September 30, 2021 |
| $ | 7.9 |
|
| $ | (4.2 | ) |
| $ | (0.1 | ) |
| $ | 3.6 |
|
|
|
|
|
|
|
|
|
|
|
|
|
|
|
|
|
|
Spire Missouri |
|
|
|
|
|
|
|
|
|
|
|
|
|
|
|
|
Balance at September 30, 2019 |
| $ | 0 |
|
| $ | (2.4 | ) |
| $ | 0 |
|
| $ | (2.4 | ) |
Other comprehensive loss |
|
| 0 |
|
|
| (0.5 | ) |
|
| 0 |
|
|
| (0.5 | ) |
Balance at September 30, 2020 |
|
| 0 |
|
|
| (2.9 | ) |
|
| 0 |
|
|
| (2.9 | ) |
Other comprehensive loss |
|
| 0 |
|
|
| (1.3 | ) |
|
| 0 |
|
|
| (1.3 | ) |
Balance at September 30, 2021 |
| $ | 0 |
|
| $ | (4.2 | ) |
| $ | 0 |
|
| $ | (4.2 | ) |
| Net Unrealized Gains (Losses) on Cash Flow Hedges | Defined Benefit Pension and Other Postretirement Benefit Plans | Net Unrealized Losses on Available for Sale Securities | Total | |||||||||||||
| Spire | ||||||||||||||||
| Balance at September 30, 2015 | $ | (0.4 | ) | $ | (1.5 | ) | $ | (0.1 | ) | $ | (2.0 | ) | ||||
| Other comprehensive loss | (1.9 | ) | (0.3 | ) | — | (2.2 | ) | |||||||||
| Balance at September 30, 2016 | (2.3 | ) | (1.8 | ) | (0.1 | ) | (4.2 | ) | ||||||||
| Other comprehensive income (loss) | 7.2 | 0.3 | (0.1 | ) | 7.4 | |||||||||||
| Balance at September 30, 2017 | $ | 4.9 | $ | (1.5 | ) | $ | (0.2 | ) | $ | 3.2 | ||||||
| Spire Missouri | ||||||||||||||||
| Balance at September 30, 2015 | (0.2 | ) | (1.5 | ) | — | $ | (1.7 | ) | ||||||||
| Other comprehensive income (loss) | 0.3 | (0.3 | ) | (0.1 | ) | (0.1 | ) | |||||||||
| Balance at September 30, 2016 | 0.1 | (1.8 | ) | (0.1 | ) | (1.8 | ) | |||||||||
| Other comprehensive income (loss) | — | 0.2 | (0.1 | ) | 0.1 | |||||||||||
| Balance at September 30, 2017 | $ | 0.1 | $ | (1.6 | ) | $ | (0.2 | ) | $ | (1.7 | ) | |||||
Income tax expense (benefit) recorded for items of other comprehensive income (loss) reported in the statements of comprehensive income is calculated by applying statutory federal, state, and local income tax rates applicable to ordinary income. The tax rates applied to individual items of other comprehensive income (loss) are similar within each reporting period. For the periods presented, Spire Alabama had no accumulated other comprehensive income (loss)AOCI balances.
6. LONG-TERM DEBT
The composition of long-term debt for Spire, Spire Missouri and Spire Alabama areas of September 30 is shown in each registrant’s statements of capitalization as part of the financial statements. following tables.
|
| 2021 |
|
| 2020 |
| ||
Spire |
|
|
|
|
|
|
|
|
2.52% Senior Notes, due September 1, 2021 |
| $ | — |
|
| $ | 35.0 |
|
3.31% Notes Payable, due December 15, 2022 |
|
| 25.0 |
|
|
| 25.0 |
|
3.54% Senior Notes, due February 27, 2024 |
|
| 150.0 |
|
|
| 150.0 |
|
0.75% Remarketable Senior Notes, due March 1, 2026 |
|
| 175.0 |
|
|
| — |
|
3.13% Senior Notes, due September 1, 2026 |
|
| 130.0 |
|
|
| 130.0 |
|
3.93% Senior Notes, due March 15, 2027 |
|
| 100.0 |
|
|
| 100.0 |
|
4.70% Senior Notes, due August 15, 2044 |
|
| 250.0 |
|
|
| 250.0 |
|
Total principal of Spire Missouri long-term debt (see below) |
|
| 1,348.0 |
|
|
| 1,098.0 |
|
Total principal of Spire Alabama long-term debt (see below) |
|
| 625.0 |
|
|
| 475.0 |
|
Other subsidiaries' long-term debt: |
|
|
|
|
|
|
|
|
4.14% First Mortgage Bonds, due September 30, 2021 |
|
| — |
|
|
| 20.0 |
|
5.00% First Mortgage Bonds, due September 30, 2031 |
|
| 42.0 |
|
|
| 42.0 |
|
2.95% Notes, with annual principal payments through December 2034 |
|
| 129.6 |
|
|
| 135.0 |
|
3.52% First Mortgage Bonds, due September 30, 2049 |
|
| 40.0 |
|
|
| 40.0 |
|
Total principal of long-term debt |
|
| 3,014.6 |
|
|
| 2,500.0 |
|
Less: Unamortized discounts and debt issuance costs |
|
| (19.7 | ) |
|
| (15.9 | ) |
Less: Current portion |
|
| (55.8 | ) |
|
| (60.4 | ) |
Long-term debt, excluding current portion |
| $ | 2,939.1 |
|
| $ | 2,423.7 |
|
Spire Missouri |
|
|
|
|
|
|
|
|
First Mortgage Bonds: |
|
|
|
|
|
|
|
|
3.00% Series, due March 15, 2023 |
| $ | — |
|
| $ | 55.0 |
|
3.40% Series, due August 15, 2023 |
|
| 250.0 |
|
|
| 250.0 |
|
3.40% Series, due March 15, 2028 |
|
| 45.0 |
|
|
| 45.0 |
|
7.00% Series, due June 1, 2029 |
|
| 19.3 |
|
|
| 19.3 |
|
2.84% Series, due November 15, 2029 |
|
| 275.0 |
|
|
| 275.0 |
|
7.90% Series, due September 15, 2030 |
|
| 30.0 |
|
|
| 30.0 |
|
3.68% Series, due September 15, 2032 |
|
| 50.0 |
|
|
| 50.0 |
|
6.00% Series, due May 1, 2034 |
|
| 99.3 |
|
|
| 99.3 |
|
6.15% Series, due June 1, 2036 |
|
| 54.5 |
|
|
| 54.5 |
|
4.63% Series, due August 15, 2043 |
|
| 99.9 |
|
|
| 99.9 |
|
4.23% Series, due September 15, 2047 |
|
| 70.0 |
|
|
| 70.0 |
|
3.30% Series, due June 1, 2051 |
|
| 305.0 |
|
|
| — |
|
4.38% Series, due September 15, 2057 |
|
| 50.0 |
|
|
| 50.0 |
|
Total principal of Spire Missouri long-term debt |
|
| 1,348.0 |
|
|
| 1,098.0 |
|
Less: Unamortized discounts and debt issuance costs |
|
| (9.6 | ) |
|
| (6.0 | ) |
Spire Missouri long-term debt |
| $ | 1,338.4 |
|
| $ | 1,092.0 |
|
Spire Alabama |
|
|
|
|
|
|
|
|
3.86% Notes, due December 22, 2021 |
| $ | 50.0 |
|
| $ | 50.0 |
|
3.21% Notes, due September 15, 2025 |
|
| 35.0 |
|
|
| 35.0 |
|
2.88% Notes, due December 1, 2029 |
|
| 100.0 |
|
|
| 100.0 |
|
2.04% Notes, due December 15, 2030 |
|
| 150.0 |
|
|
| — |
|
5.90% Notes, due January 15, 2037 |
|
| 45.0 |
|
|
| 45.0 |
|
4.31% Notes, due December 1, 2045 |
|
| 80.0 |
|
|
| 80.0 |
|
3.92% Notes, due January 15, 2048 |
|
| 45.0 |
|
|
| 45.0 |
|
4.64% Notes, due January 15, 2049 |
|
| 90.0 |
|
|
| 90.0 |
|
4.02% Notes, due January 15, 2058 |
|
| 30.0 |
|
|
| 30.0 |
|
Total principal of Spire Alabama long-term debt |
|
| 625.0 |
|
|
| 475.0 |
|
Less: Unamortized discounts and debt issuance costs |
|
| (3.8 | ) |
|
| (3.2 | ) |
Less: Current portion |
|
| (50.0 | ) |
|
| — |
|
Spire Alabama long-term debt, excluding current portion |
| $ | 571.2 |
|
| $ | 471.8 |
|
Maturities of long-term debt for Spire on a consolidated basis, Spire Missouri and Spire Alabama for the five fiscal years subsequent toafter September 30, 20172021 are as follows:
|
| 2022 |
|
| 2023 |
|
| 2024 |
|
| 2025 |
|
| 2026 |
| |||||
Spire |
| $ | 55.8 |
|
| $ | 281.2 |
|
| $ | 156.6 |
|
| $ | 42.0 |
|
| $ | 312.5 |
|
Spire Missouri |
|
| 0 |
|
|
| 250.0 |
|
|
| 0 |
|
|
| 0 |
|
|
| 0 |
|
Spire Alabama |
|
| 50.0 |
|
|
| 0 |
|
|
| 0 |
|
|
| 35.0 |
|
|
| 0 |
|
| Spire | Spire Missouri | Spire Alabama | |||||||||
| 2018 | $ | 100.0 | $ | 100.0 | $ | — | |||||
| 2019 | 180.0 | 50.0 | — | ||||||||
| 2020 | 40.0 | — | 40.0 | ||||||||
| 2021 | 55.0 | — | — | ||||||||
| 2022 | 50.0 | — | 50.0 | ||||||||
The long-term debt agreements of Spire, Spire Missouri and Spire Alabama contain customary financial covenants and default provisions. As of September 30, 2017,2021, there were no events of default under these financial covenants.
Spire Missouri’s and Spire Alabama’s access to capital markets, including the commercial paper market, and their respective financing costs, may depend on the credit rating of the entity that is accessing the capital markets. The credit ratings of the Company, Spire Missouri and Spire Alabama remain at investment grade, but are subject to review and change by the rating agencies.
At September 30, 2017,2021, including the current portion but excluding unamortized discounts and debt issuance costs, Spire had long-term debt totaling $2,112.0,$3,014.6, of which $980.0$1,348.0 was issued by Spire Missouri, $250.0$625.0 was issued by Spire Alabama and $67.0$211.6 was issued by other subsidiaries. All long-term debt bears fixed rates and is subject to changes in fair value as market interest rates change. However, increases and decreases in fair value would impact earnings and cash flows only if the Company were to reacquire any of these issues in the open market prior to maturity. Under GAAP applicable to the Utilities’ regulated operations, losses or gains on early redemption of long-term debt would typically be deferred as regulatory assets or regulatory liabilities and amortized over a future period.
As indicated in
Note 5, Shareholders’ Equity, Spire has a shelf registration statement on Form S-3 on file with the SEC for the issuance of equity and debt securities.Spire Missouri
At September 30, 2021, including the current portion of long-term debt, the Company’s capitalization at September 30, 2017 consisted of 48.7% of common stock equity and 51.3% long-term debt, compared to 46.1% of common stock equity and 53.9% of long-term debt at September 30, 2016.
As indicated in
Note 5, Shareholders’ Equity, Spire Missouri has a shelf registration on Form S-3 on file with the SEC for issuance of first mortgage bonds, unsecured debt and preferred stock, which expires on May 14, 2022. Spire Missouri was authorized by the MoPSC to issue registered securities (first mortgage bonds, unsecured debt and preferred stock), common stock, and private placement debt in an aggregate amount of up to $660.0 for financings placed any time before SeptemberSubstantially all of Spire Missouri’s plant is subject to the liens of its first mortgage bonds. The mortgage contains several restrictions on Spire Missouri’s ability to pay cash dividends on its common stock, which are described in
Note 5, Shareholders’ Equity.Spire Alabama
At September 30, 2021, including the current portion of long-term debt, Spire Missouri’s capitalization at September 30, 2017 consisted of 54.6% of common stock equity and 45.4% long-term debt compared to 57.1% of common stock equity and 42.9% of long-term debt at September 30, 2016.
Because Spire Alabama has no standing authority to issue long-term debt, it must petition the APSC for each planned issuance. On October 3, 2017, Spire Alabama received authorization and approval from the APSC to borrow up to $75.0 for general corporate purposes and to retire short-term debt.
7. NOTES PAYABLE AND CREDIT AGREEMENTS
Spire, Spire Missouri and Spire Alabama entered intohave a new syndicated revolving credit facility pursuant to a loan agreement with 11 banks, expiring December 14, 2021. The largest portion provided by a single bank under the line is 12.3%. The loan agreement replaced Spire’s and Spire Missouri’s existing loan agreements dated as of September 3, 2013 and amended September 3, 2014, which were set to expire on September 3, 2019, and Spire Alabama’s existing loan agreement dated September 2, 2014, which was set to expire September 2, 2019. All three previous agreements were terminated on December 14, 2016.
Spire establishedhas a commercial paper program (Program)(“CP Program”) pursuant to which Spireit may issue short-term, unsecured commercial paper notes (Notes).notes. Amounts available under the CP Program may be borrowed, repaid and re-borrowed from time to time, with the aggregate face or principal amount of the Notesnotes outstanding under the CP Program at any time not to exceed $975.0. The Notesnotes may have maturities of up to 365 days from date of issue.
On March 26, 2020, Spire entered into a loan agreement with 2 banks providing for a term loan of $150.0, which was immediately fully funded. It was repaid on December 16, 2020. The net proceeds ofterm loan bore interest at the issuances ofLIBOR Rate (as defined in the Notes are expected to be usedloan agreement) plus 0.85% per annum.
On March 23, 2021, Spire Missouri entered into a loan agreement with several banks for general corporate purposes,a $250.0, 364-day unsecured term loan with an interest rate based on LIBOR plus 65 basis points. The loan carries 0 prepayment penalty and has the same covenants as the revolving credit facility.
Information about short-term borrowings, including to provide working capital for both utilitySpire Missouri’s and non-utility subsidiaries.Spire Alabama’s borrowings from Spire, is presented in the following table. As of September 30, 2017, Notes outstanding under the Program totaled $477.3.
|
| Spire (Parent Only) |
|
| Spire Missouri |
|
| Spire Alabama |
|
| Spire |
| ||||||||||||
|
| CP |
|
| Term |
|
| Term |
|
| Spire |
|
| Spire |
|
| Consol- |
| ||||||
|
| Program |
|
| Loan |
|
| Loan |
|
| Note |
|
| Note |
|
| idated |
| ||||||
Year Ended September 30, 2021 |
|
|
|
|
|
|
|
|
|
|
|
|
|
|
|
|
|
|
|
|
|
|
|
|
Highest borrowings outstanding |
| $ | 775.0 |
|
| $ | 150.0 |
|
| $ | 250.0 |
|
| $ | 441.9 |
|
| $ | 152.2 |
|
| $ | 850.5 |
|
Lowest borrowings outstanding |
|
| 140.0 |
|
|
| — |
|
|
| — |
|
|
| 95.3 |
|
|
| — |
|
|
| 390.0 |
|
Weighted average borrowings |
|
| 448.1 |
|
|
| 31.6 |
|
|
| 130.8 |
|
|
| 303.2 |
|
|
| 33.2 |
|
|
| 610.5 |
|
Weighted average interest rate |
|
| 0.2 | % |
|
| 1.1 | % |
|
| 0.7 | % |
|
| 0.2 | % |
|
| 0.2 | % |
|
| 0.4 | % |
As of September 30, 2021 |
|
|
|
|
|
|
|
|
|
|
|
|
|
|
|
|
|
|
|
|
|
|
|
|
Borrowings outstanding |
| $ | 422.0 |
|
| $ | — |
|
| $ | 250.0 |
|
| $ | 240.9 |
|
| $ | 49.0 |
|
| $ | 672.0 |
|
Weighted average interest rate |
|
| 0.2 | % |
| n/a |
|
|
| 0.7 | % |
|
| 0.2 | % |
|
| 0.2 | % |
|
| 0.4 | % | |
As of September 30, 2020 |
|
|
|
|
|
|
|
|
|
|
|
|
|
|
|
|
|
|
|
|
|
|
|
|
Borrowings outstanding |
| $ | 498.0 |
|
| $ | 150.0 |
|
| $ | — |
|
| $ | 301.2 |
|
| $ | 121.3 |
|
| $ | 648.0 |
|
Weighted average interest rate |
|
| 0.2 | % |
|
| 1.1 | % |
| n/a |
|
|
| 0.2 | % |
|
| 0.2 | % |
|
| 0.6 | % | |
Spire Short‑term Borrowings1 | Spire Missouri Commercial Paper Borrowings2 | Spire Alabama Bank Line Borrowings | Total Short‑term Borrowings | |
| Year Ended September 30, 2017 | ||||
| Weighted average borrowings outstanding | $369.0 | $88.5 | $28.3 | $485.8 |
| Weighted average interest rate | 1.3% | 0.9% | 1.6% | 1.2% |
| Range of borrowings outstanding | $73.0 - $675.6 | $0.0 - $329.7 | $0.0 - $102.5 | $395.5 - $675.6 |
| As of September 30, 2017 | ||||
| Borrowings outstanding | $477.3 | $— | $— | $477.3 |
| Weighted average interest rate | 1.5% | —% | —% | 1.5% |
| Year Ended September 30, 2016 | ||||
| Weighted average borrowings outstanding | $42.7 | $201.0 | $30.2 | $273.9 |
| Weighted average interest rate | 1.6% | 0.7% | 1.4% | 0.9% |
| Range of borrowings outstanding | $0.0 - $82.0 | $43.0 - $307.2 | $0.0 - $82.0 | $73.1 - $427.2 |
| As of September 30, 2016 | ||||
| Borrowings outstanding | $73.0 | $243.7 | $82.0 | $398.7 |
| Weighted average interest rate | 1.8% | 0.8% | 1.5% | 1.1% |
| Commercial Paper Borrowings | Borrowings from Spire | Total Short-term Borrowings | |
| Year Ended September 30, 2017 | |||
| Weighted average borrowings outstanding | $88.5 | $195.5 | $284.0 |
| Weighted average interest rate | 0.9% | 1.3% | 1.2% |
| Range of borrowings outstanding | $0.0 - $329.7 | $0.0 - $338.6 | $168.3 - $358.9 |
| As of September 30, 2017 | |||
| Borrowings outstanding | $— | $203.0 | $203.0 |
| Weighted average interest rate | —% | 1.5% | 1.5% |
| Year Ended September 30, 2016 | |||
| Weighted average borrowings outstanding | $201.0 | $14.7 | $215.7 |
| Weighted average interest rate | 0.7% | 0.8% | 0.7% |
| Range of borrowings outstanding | $43.0 - $307.2 | $0.0 - $114.2 | $127.8 - $ 307.2 |
| As of September 30, 2016 | |||
| Borrowings outstanding | $243.7 | $— | $243.7 |
| Weighted average interest rate | 0.8% | —% | 0.8% |
Bank Line Borrowings | Borrowings from Spire | Total Short-term Borrowings | |
| Year Ended September 30, 2017 | |||
| Weighted average borrowings outstanding | $28.3 | $78.6 | $106.9 |
| Weighted average interest rate | 1.6% | 1.4% | 1.5% |
| Range of borrowings outstanding | $0.0 - $102.5 | $0.0 - $171.0 | $74.0 - $171.0 |
| As of September 30, 2017 | |||
| Borrowings outstanding | $— | $169.9 | $169.9 |
| Weighted average interest rate | —% | 1.5% | 1.5% |
| Year Ended September 30, 2016 | |||
| Weighted average borrowings outstanding | $30.2 | $12.4 | $42.6 |
| Weighted average interest rate | 1.4% | 1.4% | 1.4% |
| Range of borrowings outstanding | $0.0 - $82.0 | $0.0 - $61.9 | $19.0 - $82.0 |
| As of September 30, 2016 | |||
| Borrowings outstanding | $82.0 | $— | $82.0 |
| Weighted average interest rate | 1.5% | —% | 1.5% |
8. FAIR VALUE OF FINANCIAL INSTRUMENTS
The carrying amounts and estimated fair values of financial instruments not measured at fair value on a recurring basis for the Company arewere as follows:
|
|
|
|
|
|
|
|
|
| Classification of Estimated Fair Value |
| |||||
|
| Carrying Amount |
|
| Fair Value |
|
| Quoted Prices in Active Markets (Level 1) |
|
| Significant Observable Inputs (Level 2) |
| ||||
Spire |
|
|
|
|
|
|
|
|
|
|
|
|
|
|
|
|
As of September 30, 2021 |
|
|
|
|
|
|
|
|
|
|
|
|
|
|
|
|
Cash and cash equivalents |
| $ | 4.3 |
|
| $ | 4.3 |
|
| $ | 4.3 |
|
| $ | — |
|
Notes payable |
|
| 672.0 |
|
|
| 672.0 |
|
|
| — |
|
|
| 672.0 |
|
Long-term debt, including current portion |
|
| 2,994.9 |
|
|
| 3,375.9 |
|
|
| — |
|
|
| 3,375.9 |
|
As of September 30, 2020 |
|
|
|
|
|
|
|
|
|
|
|
|
|
|
|
|
Cash and cash equivalents |
| $ | 4.1 |
|
| $ | 4.1 |
|
| $ | 4.1 |
|
| $ | — |
|
Notes payable |
|
| 648.0 |
|
|
| 648.0 |
|
|
| — |
|
|
| 648.0 |
|
Long-term debt, including current portion |
|
| 2,484.1 |
|
|
| 2,908.6 |
|
|
| — |
|
|
| 2,908.6 |
|
Spire Missouri |
|
|
|
|
|
|
|
|
|
|
|
|
|
|
|
|
As of September 30, 2021 |
|
|
|
|
|
|
|
|
|
|
|
|
|
|
|
|
Note Payable |
| $ | 250.0 |
|
| $ | 250.0 |
|
| $ | — |
|
| $ | 250.0 |
|
Notes payable - associated companies |
|
| 240.9 |
|
|
| 240.9 |
|
|
| — |
|
|
| 240.9 |
|
Long-term debt |
|
| 1,338.4 |
|
|
| 1,540.4 |
|
|
| — |
|
|
| 1,540.4 |
|
As of September 30, 2020 |
|
|
|
|
|
|
|
|
|
|
|
|
|
|
|
|
Notes payable - associated companies |
| $ | 301.2 |
|
| $ | 301.2 |
|
| $ | — |
|
| $ | 301.2 |
|
Long-term debt |
|
| 1,092.0 |
|
|
| 1,313.5 |
|
|
| — |
|
|
| 1,313.5 |
|
Spire Alabama |
|
|
|
|
|
|
|
|
|
|
|
|
|
|
|
|
As of September 30, 2021 |
|
|
|
|
|
|
|
|
|
|
|
|
|
|
|
|
Notes payable - associated companies |
| $ | 49.0 |
|
| $ | 49.0 |
|
| $ | — |
|
| $ | 49.0 |
|
Long-term debt, including current portion |
|
| 621.2 |
|
|
| 707.5 |
|
|
| — |
|
|
| 707.5 |
|
As of September 30, 2020 |
|
|
|
|
|
|
|
|
|
|
|
|
|
|
|
|
Notes payable - associated companies |
| $ | 121.3 |
|
| $ | 121.3 |
|
| $ | — |
|
| $ | 121.3 |
|
Long-term debt, including current portion |
|
| 471.8 |
|
|
| 576.9 |
|
|
| — |
|
|
| 576.9 |
|
| Classification of Estimated Fair Value | |||||||||||||||
Carrying Amount | Fair Value | Quoted Prices in Active Markets (Level 1) | Significant Observable Inputs (Level 2) | ||||||||||||
| As of September 30, 2017 | |||||||||||||||
| Cash and cash equivalents | $ | 7.4 | $ | 7.4 | $ | 7.4 | $ | — | |||||||
| Short-term debt | 477.3 | 477.3 | — | 477.3 | |||||||||||
| Long-term debt, including current portion | 2,095.0 | 2,210.3 | — | 2,210.3 | |||||||||||
| As of September 30, 2016 | |||||||||||||||
| Cash and cash equivalents | $ | 5.2 | $ | 5.2 | $ | 5.2 | $ | — | |||||||
| Short-term debt | 398.7 | 398.7 | — | 398.7 | |||||||||||
| Long-term debt, including current portion | 2,070.7 | 2,257.1 | — | 2,257.1 | |||||||||||
| Classification of Estimated Fair Value | |||||||||||||||
Carrying Amount | Fair Value | Quoted Prices in Active Markets (Level 1) | Significant Observable Inputs (Level 2) | ||||||||||||
| As of September 30, 2017 | |||||||||||||||
| Cash and cash equivalents | $ | 2.5 | $ | 2.5 | $ | 2.5 | $ | — | |||||||
| Short-term debt | 203.0 | 203.0 | — | 203.0 | |||||||||||
| Long-term debt, including current portion | 973.9 | 1,056.9 | — | 1,056.9 | |||||||||||
| As of September 30, 2016 | |||||||||||||||
| Cash and cash equivalents | $ | 2.1 | $ | 2.1 | $ | 2.1 | $ | — | |||||||
| Short-term debt | 243.7 | 243.7 | — | 243.7 | |||||||||||
| Long-term debt | 804.1 | 900.4 | — | 900.4 | |||||||||||
| Classification of Estimated Fair Value | |||||||||||||||
Carrying Amount | Fair Value | Quoted Prices in Active Markets (Level 1) | Significant Observable Inputs (Level 2) | ||||||||||||
| As of September 30, 2017 | |||||||||||||||
| Cash and cash equivalents | $ | 0.1 | $ | 0.1 | $ | 0.1 | $ | — | |||||||
| Short-term debt | 169.9 | 169.9 | — | 169.9 | |||||||||||
| Long-term debt | 247.8 | 269.4 | — | 269.4 | |||||||||||
| As of September 30, 2016 | |||||||||||||||
| Short-term debt | $ | 82.0 | $ | 82.0 | $ | — | $ | 82.0 | |||||||
| Long-term debt, including current portion | 247.6 | 275.5 | — | 275.5 | |||||||||||
9. FAIR VALUE MEASUREMENTS
The information presented below categorizes the assets and liabilities in the balance sheets that are accounted for at fair value on a recurring basis in periods subsequent to initial recognition.
The mutual funds included in Level 1 are valued based on exchange-quoted market prices of individual securities. The mutual funds included in Level 2 are valued based on the closing net asset value per unit.
Derivative instruments included in Level 1 are valued using quoted market prices on the NYMEX.NYMEX or the Intercontinental Exchange (ICE). Derivative instruments classified asin Level 2 include physical commodity derivatives that are valued using Over-the-Counter Bulletin Board (OTCBB), broker or dealer quotation services whose prices are derived principally from, or are corroborated by, observable market inputs. Also included in Level 2 are certain derivative instruments that have values that are similar to, and correlate with, quoted prices for exchange-traded instruments in active markets. Derivative instruments included in Level 3 are valued using generally unobservable inputs that are based upon the best information available and reflect management’s assumptions about how market participants would price the asset or liability. There were no material Level 3 balances as of September 30, 20172021 or 2016.2020. The Company’s and the Utilities’ policy is to recognize transfers between the levels of the fair value hierarchy, if any, as of the beginning of the interim reporting period in which circumstances change or events occur to cause the transfer.
The mutual funds are included in “Other investments” on the Company’s balance sheets and in “Property“Other Property and other investments”Investments” on Spire Missouri’s balance sheets. Derivative assets and liabilities, including receivables and payables associated with cash margin requirements, are presented net on the balance sheets when a legally enforceable netting agreement exist between the Company, Spire Missouri or Spire MissouriAlabama and the counterparty to the derivative contract. For additional information on derivative instruments, see
Spire
|
| Quoted Prices in Active Markets (Level 1) |
|
| Significant Observable Inputs (Level 2) |
|
| Significant Unobservable Inputs (Level 3) |
|
| Effects of Netting and Cash Margin Receivables /Payables |
|
| Total |
| |||||
As of September 30, 2021 |
|
|
|
|
|
|
|
|
|
|
|
|
|
|
|
|
|
|
|
|
ASSETS |
|
|
|
|
|
|
|
|
|
|
|
|
|
|
|
|
|
|
|
|
Gas Utility: |
|
|
|
|
|
|
|
|
|
|
|
|
|
|
|
|
|
|
|
|
U.S. stock/bond mutual funds |
| $ | 23.8 |
|
| $ | 0 |
|
| $ | 0 |
|
| $ | 0 |
|
| $ | 23.8 |
|
NYMEX/ICE natural gas contracts |
|
| 104.0 |
|
|
| 0 |
|
|
| 0 |
|
|
| (104.0 | ) |
|
| 0 |
|
Gas Marketing: |
|
|
|
|
|
|
|
|
|
|
|
|
|
|
|
|
|
|
|
|
NYMEX/ICE natural gas contracts |
|
| 0 |
|
|
| 114.7 |
|
|
| 0 |
|
|
| (93.7 | ) |
|
| 21.0 |
|
Natural gas commodity contracts |
|
| 0 |
|
|
| 35.2 |
|
|
| 0 |
|
|
| (5.5 | ) |
|
| 29.7 |
|
Other: |
|
|
|
|
|
|
|
|
|
|
|
|
|
|
|
|
|
|
|
|
U.S. stock/bond mutual funds |
|
| 26.2 |
|
|
| 0 |
|
|
| 0 |
|
|
| 0 |
|
|
| 26.2 |
|
Interest rate swaps |
|
| 12.6 |
|
|
| 0 |
|
|
| 0 |
|
|
| (5.2 | ) |
|
| 7.4 |
|
Total |
| $ | 166.6 |
|
| $ | 149.9 |
|
| $ | 0 |
|
| $ | (208.4 | ) |
| $ | 108.1 |
|
LIABILITIES |
|
|
|
|
|
|
|
|
|
|
|
|
|
|
|
|
|
|
|
|
Gas Utility: |
|
|
|
|
|
|
|
|
|
|
|
|
|
|
|
|
|
|
|
|
NYMEX/ICE natural gas contracts |
| $ | 0.3 |
|
| $ | 0 |
|
| $ | 0 |
|
| $ | (0.3 | ) |
| $ | 0 |
|
Gas Marketing: |
|
|
|
|
|
|
|
|
|
|
|
|
|
|
|
|
|
|
|
|
NYMEX/ICE natural gas contracts |
|
| 0 |
|
|
| 62.0 |
|
|
| 0 |
|
|
| (62.0 | ) |
|
| 0 |
|
Natural gas commodity contracts |
|
| 0 |
|
|
| 96.7 |
|
|
| 0 |
|
|
| (5.5 | ) |
|
| 91.2 |
|
Other: |
|
|
|
|
|
|
|
|
|
|
|
|
|
|
|
|
|
|
|
|
Interest rate swaps |
|
| 5.7 |
|
|
| 0 |
|
|
| 0 |
|
|
| (5.2 | ) |
|
| 0.5 |
|
Total |
| $ | 6.0 |
|
| $ | 158.7 |
|
| $ | 0 |
|
| $ | (73.0 | ) |
| $ | 91.7 |
|
|
|
|
|
|
|
|
|
|
|
|
|
|
|
|
|
|
|
|
|
|
As of September 30, 2020 |
|
|
|
|
|
|
|
|
|
|
|
|
|
|
|
|
|
|
|
|
ASSETS |
|
|
|
|
|
|
|
|
|
|
|
|
|
|
|
|
|
|
|
|
Gas Utility: |
|
|
|
|
|
|
|
|
|
|
|
|
|
|
|
|
|
|
|
|
U.S. stock/bond mutual funds |
| $ | 21.9 |
|
| $ | 0 |
|
| $ | 0 |
|
| $ | 0 |
|
| $ | 21.9 |
|
Gasoline and heating oil contracts |
|
| 0.3 |
|
|
| 0 |
|
|
| 0 |
|
|
| (0.3 | ) |
|
| 0 |
|
NYMEX/ICE natural gas contracts |
|
| 6.3 |
|
|
| 0 |
|
|
| 0 |
|
|
| (6.3 | ) |
|
| 0 |
|
Gas Marketing: |
|
|
|
|
|
|
|
|
|
|
|
|
|
|
|
|
|
|
|
|
NYMEX/ICE natural gas contracts |
|
| 0 |
|
|
| 27.7 |
|
|
| 0 |
|
|
| (25.4 | ) |
|
| 2.3 |
|
Natural gas commodity contracts |
|
| 0 |
|
|
| 14.5 |
|
|
| 0.4 |
|
|
| 0 |
|
|
| 14.9 |
|
Other: |
|
|
|
|
|
|
|
|
|
|
|
|
|
|
|
|
|
|
|
|
U.S. stock/bond mutual funds |
|
| 18.6 |
|
|
| 0 |
|
|
| 0 |
|
|
| 0 |
|
|
| 18.6 |
|
Total |
| $ | 47.1 |
|
| $ | 42.2 |
|
| $ | 0.4 |
|
| $ | (32.0 | ) |
| $ | 57.7 |
|
LIABILITIES |
|
|
|
|
|
|
|
|
|
|
|
|
|
|
|
|
|
|
|
|
Gas Utility: |
|
|
|
|
|
|
|
|
|
|
|
|
|
|
|
|
|
|
|
|
NYMEX/ICE natural gas contracts |
| $ | 0.9 |
|
| $ | 0 |
|
| $ | 0 |
|
| $ | (0.9 | ) |
| $ | 0 |
|
Gas Marketing: |
|
|
|
|
|
|
|
|
|
|
|
|
|
|
|
|
|
|
|
|
NYMEX/ICE natural gas contracts |
|
| 0.7 |
|
|
| 21.4 |
|
|
| 0 |
|
|
| (22.1 | ) |
|
| 0 |
|
Natural gas commodity contracts |
|
| 0 |
|
|
| 22.3 |
|
|
| 0 |
|
|
| 0 |
|
|
| 22.3 |
|
Other: |
|
|
|
|
|
|
|
|
|
|
|
|
|
|
|
|
|
|
|
|
Interest rate swaps |
|
| 0 |
|
|
| 54.2 |
|
|
| 0 |
|
|
| 0 |
|
|
| 54.2 |
|
Total |
| $ | 1.6 |
|
| $ | 97.9 |
|
| $ | 0 |
|
| $ | (23.0 | ) |
| $ | 76.5 |
|
Quoted Prices in Active Markets (Level 1) | Significant Observable Inputs (Level 2) | Significant Unobservable Inputs (Level 3) | Effects of Netting and Cash Margin Receivables /Payables | Total | |||||||||||||||
| As of September 30, 2017 | |||||||||||||||||||
| ASSETS | |||||||||||||||||||
| Gas Utility: | |||||||||||||||||||
| US stock/bond mutual funds | $ | 18.3 | $ | 4.1 | $ | — | $ | — | $ | 22.4 | |||||||||
| NYMEX/ICE natural gas contracts | 3.4 | — | — | (3.4 | ) | — | |||||||||||||
| Gasoline and heating oil contracts | 0.1 | — | — | — | 0.1 | ||||||||||||||
| Gas Marketing: | |||||||||||||||||||
| NYMEX/ICE natural gas contracts | 1.3 | 1.3 | — | (2.1 | ) | 0.5 | |||||||||||||
| Natural gas commodity contracts | — | 6.8 | 0.1 | (1.2 | ) | 5.7 | |||||||||||||
| Total | $ | 23.1 | $ | 12.2 | $ | 0.1 | $ | (6.7 | ) | $ | 28.7 | ||||||||
| LIABILITIES | |||||||||||||||||||
| Gas Utility: | |||||||||||||||||||
| NYMEX/ICE natural gas contracts | $ | 1.9 | $ | — | $ | — | $ | (1.9 | ) | $ | — | ||||||||
| Gas Marketing: | |||||||||||||||||||
| NYMEX/ICE natural gas contracts | 1.8 | 0.3 | — | (2.1 | ) | — | |||||||||||||
| Natural gas commodity contracts | — | 8.4 | — | (1.2 | ) | 7.2 | |||||||||||||
| Other: | |||||||||||||||||||
| Interest rate swaps | — | 0.9 | — | — | 0.9 | ||||||||||||||
| Total | $ | 3.7 | $ | 9.6 | $ | — | $ | (5.2 | ) | $ | 8.1 | ||||||||
| As of September 30, 2016 | |||||||||||||||||||
| ASSETS | |||||||||||||||||||
| Gas Utility: | |||||||||||||||||||
| US stock/bond mutual funds | $ | 16.8 | $ | 4.1 | $ | — | $ | — | $ | 20.9 | |||||||||
| NYMEX/ICE natural gas contracts | 5.3 | — | — | (0.4 | ) | 4.9 | |||||||||||||
| Gasoline and heating oil contracts | 0.4 | — | — | (0.3 | ) | 0.1 | |||||||||||||
| Gas Marketing: | |||||||||||||||||||
| NYMEX/ICE natural gas contracts | 0.4 | 3.4 | — | (3.4 | ) | 0.4 | |||||||||||||
| Natural gas commodity contracts | — | 8.7 | 0.2 | (0.9 | ) | 8.0 | |||||||||||||
| Total | $ | 22.9 | $ | 16.2 | $ | 0.2 | $ | (5.0 | ) | $ | 34.3 | ||||||||
| LIABILITIES | |||||||||||||||||||
| Gas Utility: | |||||||||||||||||||
| NYMEX/ICE natural gas contracts | $ | 1.6 | $ | — | $ | — | $ | (1.6 | ) | $ | — | ||||||||
| OTCBB natural gas contracts | — | 0.2 | — | — | 0.2 | ||||||||||||||
| Gas Marketing: | |||||||||||||||||||
| NYMEX/ICE natural gas contracts | 3.5 | 1.6 | — | (5.1 | ) | — | |||||||||||||
| Natural gas commodity contracts | — | 2.6 | — | (0.9 | ) | 1.7 | |||||||||||||
| Other: | |||||||||||||||||||
| Interest rate swaps | — | 3.0 | — | — | 3.0 | ||||||||||||||
| Total | $ | 5.1 | $ | 7.4 | $ | — | $ | (7.6 | ) | $ | 4.9 | ||||||||
Spire Missouri
|
| Quoted Prices in Active Markets (Level 1) |
|
| Significant Observable Inputs (Level 2) |
|
| Significant Unobservable Inputs (Level 3) |
|
| Effects of Netting and Cash Margin Receivables /Payables |
|
| Total |
| |||||
As of September 30, 2021 |
|
|
|
|
|
|
|
|
|
|
|
|
|
|
|
|
|
|
|
|
ASSETS |
|
|
|
|
|
|
|
|
|
|
|
|
|
|
|
|
|
|
|
|
U.S. stock/bond mutual funds |
| $ | 23.8 |
|
| $ | 0 |
|
| $ | 0 |
|
| $ | 0 |
|
| $ | 23.8 |
|
NYMEX/ICE natural gas contracts |
|
| 104.0 |
|
|
| 0 |
|
|
| 0 |
|
|
| (104.0 | ) |
|
| 0 |
|
Total |
| $ | 127.8 |
|
| $ | 0 |
|
| $ | 0 |
|
| $ | (104.0 | ) |
| $ | 23.8 |
|
LIABILITIES |
|
|
|
|
|
|
|
|
|
|
|
|
|
|
|
|
|
|
|
|
NYMEX/ICE natural gas contracts |
| $ | 0.3 |
|
| $ | 0 |
|
| $ | 0 |
|
| $ | (0.3 | ) |
| $ | 0 |
|
|
|
|
|
|
|
|
|
|
|
|
|
|
|
|
|
|
|
|
|
|
As of September 30, 2020 |
|
|
|
|
|
|
|
|
|
|
|
|
|
|
|
|
|
|
|
|
ASSETS |
|
|
|
|
|
|
|
|
|
|
|
|
|
|
|
|
|
|
|
|
U.S. stock/bond mutual funds |
| $ | 21.9 |
|
| $ | 0 |
|
| $ | 0 |
|
| $ | 0 |
|
| $ | 21.9 |
|
Gasoline and heating oil contracts |
|
| 0.3 |
|
|
| 0 |
|
|
| 0 |
|
|
| (0.3 | ) |
|
| 0 |
|
NYMEX/ICE natural gas contracts |
|
| 6.3 |
|
|
| 0 |
|
|
| 0 |
|
|
| (6.3 | ) |
|
| 0 |
|
U.S. stock/bond mutual funds |
| $ | 28.5 |
|
| $ | 0 |
|
| $ | 0 |
|
| $ | (6.6 | ) |
| $ | 21.9 |
|
LIABILITIES |
|
|
|
|
|
|
|
|
|
|
|
|
|
|
|
|
|
|
|
|
NYMEX/ICE natural gas contracts |
| $ | 0.9 |
|
| $ | 0 |
|
| $ | 0 |
|
| $ | (0.9 | ) |
| $ | 0 |
|
Quoted Prices in Active Markets (Level 1) | Significant Observable Inputs (Level 2) | Significant Unobservable Inputs (Level 3) | Effects of Netting and Cash Margin Receivables /Payables | Total | |||||||||||||||
| As of September 30, 2017 | |||||||||||||||||||
| ASSETS | |||||||||||||||||||
| US stock/bond mutual funds | $ | 18.3 | $ | 4.1 | $ | — | $ | — | $ | 22.4 | |||||||||
| NYMEX/ICE natural gas contracts | 3.4 | — | — | (3.4 | ) | — | |||||||||||||
| Gasoline and heating oil contracts | 0.1 | — | — | — | 0.1 | ||||||||||||||
| Total | $ | 21.8 | $ | 4.1 | $ | — | $ | (3.4 | ) | $ | 22.5 | ||||||||
| LIABILITIES | |||||||||||||||||||
| NYMEX/ICE natural gas contracts | $ | 1.9 | $ | — | $ | — | $ | (1.9 | ) | $ | — | ||||||||
| Total | $ | 1.9 | $ | — | $ | — | $ | (1.9 | ) | $ | — | ||||||||
| As of September 30, 2016 | |||||||||||||||||||
| ASSETS | |||||||||||||||||||
| US stock/bond mutual funds | $ | 16.8 | $ | 4.1 | $ | — | $ | — | $ | 20.9 | |||||||||
| NYMEX/ICE natural gas contracts | 5.3 | — | — | (0.4 | ) | 4.9 | |||||||||||||
| Gasoline and heating oil contracts | 0.3 | — | — | (0.3 | ) | — | |||||||||||||
| Total | $ | 22.4 | $ | 4.1 | $ | — | $ | (0.7 | ) | $ | 25.8 | ||||||||
| LIABILITIES | |||||||||||||||||||
| NYMEX/ICE natural gas contracts | $ | 1.6 | $ | — | $ | — | $ | (1.6 | ) | $ | — | ||||||||
| OTCBB natural gas contracts | — | 0.2 | — | — | 0.2 | ||||||||||||||
| Total | $ | 1.6 | $ | 0.2 | $ | — | $ | (1.6 | ) | $ | 0.2 | ||||||||
Spire Alabama
Spire Alabama commencedoccasionally utilizes a gasoline derivative program to stabilize the cost of fuel used in operations. As of September 30, 2017, the fair value of related2021, and September 30, 2020, there were 0 gasoline contracts was not significant.
10. DERIVATIVE INSTRUMENTS AND HEDGING ACTIVITIES
Spire
Spire Missouri has a risk management policy to utilize various derivatives, including futures contracts, exchange-traded options and swaps for the explicit purpose of managing price risk associated with purchasing and delivering natural gas on a regular basis to customers in accordance with its tariffs. The objective of this policy is to limit Spire Missouri’s exposure to natural gas price volatility and to manage, hedge and mitigate substantial price risk. Further discussion of this policy can be found in the Spire Missouri section.
From time to time Spire Missouri and Spire Alabama purchase NYMEX futures and options contracts to help stabilize operating costs associated with forecasted purchases of gasoline and diesel fuels used to power vehicles and equipment used in the course of their business.equipment. Further information on these derivatives can be found in the Spire Missouri and Spire Alabama sections, respectively.
In the course of its business, Spire’s gas marketing subsidiary, Spire Marketing which includes its(including a wholly owned subsidiary Spire Storage Inc.subsidiary), enters into commitments associated with the purchase or sale of natural gas. Certain of Spire Marketing’s derivative natural gas contracts are designated as normal purchases or normal sales and, as such, are excluded from the scope of ASC Topic 815 and are accounted for as executory contracts on an accrual basis. Any of Spire Marketing’s derivative natural gas contracts that are not designated as normal purchases or normal sales are accounted for at fair value. At September 30, 2017,2021, the fair values of 202.1518.9 million MMBtu of non-exchange tradednon-exchange-traded natural gas commodity contracts were reflected in the Consolidated Balance Sheet. Of these contracts, 156.8363.0 million MMBtu will settle during fiscal 2018,2022, and 34.367.7 million MMBtu, 5.943.4 million MMBtu, 4.1 million MMBtu, 0.940.4 million MMBtu, and 0.14.3 million MMBtu will settle during fiscal years 2019, 2020, 2021, 2022,2023, 2024, 2025, and 2023,2026, respectively. These contracts have not been designated as hedges; therefore, changes in the fair value of these contracts are reported in earnings each period.
Furthermore, Spire Marketing manages the price risk associated with its fixed-priced commitments by either closely matching the offsetting physical purchase or sale of natural gas at fixed prices or through the use of NYMEX or ICE futures, swap, and option contracts to lock in margins.
At September 30, 2017,2021, Spire Marketing’s unmatched fixed-price positions were not material to Spire’s financial position or results of operations. Spire Marketing’s NYMEX and ICE natural gas futures, swap and option contracts used to lock in margins may be designated as cash flow hedges of forecasted transactions for financial reporting purposes.
During the first quarter of fiscal 2015, Spire Alabama entered into interest rate swap transactions to protect itself against adverse movement in interest rates in anticipation of its issuance of $115.0 of long-term debt. The notional amount of these interest rate swaps was$104.5. These derivative instruments were designated as cash flow hedges of forecasted transactions. These forward starting swaps involved2019, the payment of a fixed interest rate and the receipt of the London Interbank Offered Rate (LIBOR) over the terms specified in the contracts. Termination of these interest rate swap agreements later in fiscal 2015 resulted in a $2.7 gain which was recorded as a regulatory liability. Of the total issuance of long-term debt, $35.0 was issued on September 15, 2015 and $80.0 was issued on December 1, 2015, and the gain is being amortized to reduce interest expense over the hedged periods.
In the second quarter of 2020, the Company entered into multiple ten-year interest rate swaps with fixed interest rates ranging from 0.934% to 1.2975% for a total notional amount of $75.0 to protect itself against adverse movements in interest rates on future interest rate payments. The Company recorded a $0.9$5.5 mark-to-market lossgain in accumulated other comprehensive income on these swaps as partfor the twelve months ended September 30, 2021. In the third quarter of 2021 the Company entered into multiple ten-year interest rate swaps with fixed interest rates ranging from 2.008% to 2.1075% for a total notional amount of $150.0 to protect itself against adverse movements in interest rates on future interest rate payments. The Company recorded a $1.2 mark-to-market loss in accumulated other comprehensive income on these swaps for the yeartwelve months ended September 30, 2017.
In the fourth quarter of 2021, the Company entered into two swap contracts. Both contracts are ten-year interest rate swaps; the first swap has a notional amount of $50.0 with a fixed interest rate of 1.597%, while the second swap has a notional amount of $50.0 with a fixed interest rate of 1.821%. The Company recorded a $2.7 mark-to-market gain accumulated other comprehensive income on these swaps for the twelve months ended September 30, 2021.
As of September 30, 2021, the Company has recorded through other comprehensive income a cumulative mark-to-market net asset of $6.9 on open swaps.
The Company’s and Spire Missouri’s exchange-traded/cleared derivative instruments consist primarily of NYMEX and ICE positions. The NYMEX is the primary national commodities exchange on which natural gas derivatives are traded. Open NYMEX/NYMEX and ICE natural gas futures and swap positions at September 30, 20172021 and 2020 were as follows:
|
| September 30, 2021 |
|
| September 30, 2020 |
| ||||||||||
Gas Marketing |
| Notional (MMBtu millions) |
|
| Maximum Term (Months) |
|
| Notional (MMBtu millions) |
|
| Maximum Term (Months) |
| ||||
Natural gas futures purchased |
|
| 103.3 |
|
|
| 51 |
|
|
| 22.9 |
|
|
| 41 |
|
Natural gas options purchased, net |
|
| 7.1 |
|
|
| 15 |
|
|
| 4.8 |
|
|
| 6 |
|
Natural gas basis swaps purchased |
|
| 101.7 |
|
|
| 27 |
|
|
| 6.2 |
|
|
| 24 |
|
|
|
|
|
|
|
|
|
|
|
|
|
|
|
|
|
|
Gas Utility |
|
|
|
|
|
|
|
|
|
|
|
|
|
|
|
|
Natural gas futures purchased |
|
| 52.8 |
|
|
| 12 |
|
|
| 25.9 |
|
|
| 12 |
|
| Gas Utility | Gas Marketing | ||||||||||||
MMBtu (millions) | Avg. Price Per MMBtu | MMBtu (millions) | Avg. Price Per MMBtu | ||||||||||
| NYMEX/ICE open short futures positions/swap positions | |||||||||||||
| Fiscal 2018 | — | $ | — | 8.66 | $ | 3.34 | |||||||
| Fiscal 2019 | — | — | 2.07 | 3.13 | |||||||||
| NYMEX/ICE open long futures/swap positions | |||||||||||||
| Fiscal 2018 | 14.18 | 2.98 | 3.78 | 3.16 | |||||||||
| Fiscal 2019 | 1.68 | 2.89 | 1.84 | 3.02 | |||||||||
| Fiscal 2020 | — | — | 0.66 | 2.91 | |||||||||
| Fiscal 2021 | — | — | 0.28 | 2.90 | |||||||||
| Fiscal 2022 | — | — | 0.22 | 3.00 | |||||||||
| ICE open short daily swap positions | |||||||||||||
| Fiscal 2018 | — | — | 1.32 | 2.87 | |||||||||
| ICE open long daily swap positions | |||||||||||||
| Fiscal 2018 | — | — | 0.78 | 2.79 | |||||||||
| ICE open short basis swap positions | |||||||||||||
| Fiscal 2018 | — | — | 14.04 | 0.10 | |||||||||
| Fiscal 2019 | — | — | 3.35 | 0.27 | |||||||||
| Fiscal 2020 | — | — | 0.31 | 0.36 | |||||||||
| ICE open long basis swap positions | |||||||||||||
| Fiscal 2018 | — | — | 11.12 | 0.38 | |||||||||
| Fiscal 2019 | — | — | 4.51 | 0.45 | |||||||||
| Fiscal 2020 | — | — | 0.62 | 0.45 | |||||||||
At September 30, 2017,2021, neither Spire Missouri alsonor Spire Marketing had 33.9 million MMBtu of otherany further price mitigation in place through the use of NYMEX natural gas option-based strategies while Spire Marketing had none.place.
Derivative instruments designated as cash flow hedges of forecasted transactions are recognized on the balance sheets of the Company at fair value, and the change in fair value of the effective portion of these hedge instruments is recorded, net of income tax, in other comprehensive income or loss (OCI). Accumulated other comprehensive income or loss (AOCI) is a component of Total Common Stock Equity. Amounts are reclassified from AOCI into earnings when the hedged items affect net income, using the same revenue or expense category that the hedged item impacts. Based on market prices at September 30, 2017,2021, it is expected that an immaterial amount of unrealized gains will be reclassified into the Consolidated Statements of Income of the Company during the next twelve months. Cash flows from hedging transactions are classified in the same category as the cash flows from the items that are being hedged in the Consolidated Statements of Cash Flows.
Effect of Derivative Instruments on the Consolidated Statements of Income and Comprehensive Income |
| |||||||||||||
|
| Location of Gain (Loss) |
|
|
|
|
|
|
|
|
|
|
|
|
|
| Recorded in Income |
| 2021 |
|
| 2020 |
|
| 2019 |
| |||
Derivatives in Cash Flow Hedging Relationships |
|
|
|
|
|
|
|
|
|
|
|
| ||
Effective portion of gain (loss) recognized in OCI on derivatives: |
|
|
|
|
|
|
|
|
|
|
|
| ||
Interest rate swaps |
|
|
| $ | 61.2 |
|
| $ | (8.9 | ) |
| $ | (46.4 | ) |
Total |
|
|
| $ | 61.2 |
|
| $ | (8.9 | ) |
| $ | (46.4 | ) |
Effective portion of (loss) gain reclassified from AOCI to income: |
|
|
|
|
|
|
|
|
|
|
|
| ||
Interest rate swaps |
| Interest Expense |
| $ | (1.3 | ) |
| $ | (3.2 | ) |
| $ | 1.3 |
|
Total |
|
|
| $ | (1.3 | ) |
| $ | (3.2 | ) |
| $ | 1.3 |
|
|
|
|
|
|
|
|
|
|
|
|
|
|
|
|
Derivatives Not Designated as Hedging Instruments* |
|
|
|
|
|
|
|
|
|
|
|
| ||
Gain (loss) recognized in income on derivatives: |
|
|
|
|
|
|
|
|
|
|
|
| ||
Natural gas commodity contracts |
| Gas Marketing Operating Revenues |
| $ | 54.1 |
|
| $ | 9.2 |
|
| $ | 2.5 |
|
|
| Gas Marketing Operating Expenses |
|
| 0 |
|
|
| 0 |
|
|
| (8.4 | ) |
NYMEX / ICE natural gas contracts |
| Gas Marketing Operating Revenues |
|
| (77.5 | ) |
|
| (11.8 | ) |
|
| 0 |
|
Total |
|
|
| $ | (23.4 | ) |
| $ | (2.6 | ) |
| $ | (5.9 | ) |
| Effect of Derivative Instruments on the Consolidated Statements of Income and Consolidated Statements of Comprehensive Income | ||||||||||||
| Location of Gain (Loss) | ||||||||||||
| Recorded in Income | 2017 | 2016 | 2015 | |||||||||
| Derivatives in Cash Flow Hedging Relationships | ||||||||||||
| Effective portion of gain (loss) recognized in OCI on derivatives: | ||||||||||||
| Gas Marketing natural gas contracts | $ | — | $ | (0.6 | ) | $ | (4.3 | ) | ||||
| Gas Utility gasoline and heating oil contracts | 0.1 | — | (1.2 | ) | ||||||||
| Interest rate swaps | 11.4 | (3.4 | ) | — | ||||||||
| Total | $ | 11.5 | $ | (4.0 | ) | $ | (5.5 | ) | ||||
| Effective portion of gain (loss) reclassified from AOCI to income: | ||||||||||||
| Natural gas contracts | Gas Marketing Operating Revenues | $ | (0.4 | ) | $ | 4.3 | $ | 1.7 | ||||
| Gas Marketing Operating Expenses | 0.1 | (4.9 | ) | (5.2 | ) | |||||||
| Subtotal | (0.3 | ) | (0.6 | ) | (3.5 | ) | ||||||
| Gasoline and heating oil contracts | Gas Utility Other Operating Expenses | 0.2 | (0.5 | ) | (0.9 | ) | ||||||
| Interest rate swaps | Interest Expense | 0.1 | — | — | ||||||||
| Total | $ | — | $ | (1.1 | ) | $ | (4.4 | ) | ||||
| Ineffective portion of gain (loss) on derivatives recognized in income: | ||||||||||||
| Natural gas contracts | Gas Marketing Operating Revenues | $ | — | $ | 0.1 | $ | — | |||||
| Gas Marketing Operating Expenses | — | 0.1 | (0.5 | ) | ||||||||
| Subtotal | — | 0.2 | (0.5 | ) | ||||||||
| Gasoline and heating oil contracts | Gas Utility Other Operating Expenses | — | 0.1 | 0.1 | ||||||||
| Interest rate swaps | Interest Expense | 0.5 | — | — | ||||||||
| Total | $ | 0.5 | $ | 0.3 | $ | (0.4 | ) | |||||
| Derivatives Not Designated as Hedging Instruments* | ||||||||||||
| Gain (loss) recognized in income on derivatives: | ||||||||||||
| Natural gas commodity contracts | Gas Marketing Operating Revenues | $ | 0.7 | $ | 12.3 | $ | (1.3 | ) | ||||
| NYMEX / ICE natural gas contracts | Gas Marketing Operating Revenues | (4.4 | ) | (1.7 | ) | (9.6 | ) | |||||
| Gasoline and heating oil contracts | Other Income and (Income Deductions) - Net | — | — | (0.2 | ) | |||||||
| Total | $ | (3.7 | ) | $ | 10.6 | $ | (11.1 | ) | ||||
* | |
Gains and losses on Spire Missouri’s natural gas derivative instruments, which are not designated as hedging instruments for financial reporting purposes, are deferred pursuant to the Missouri Utilities’ PGA clauses and initially recorded as regulatory assets or regulatory liabilities. These gains and losses are excluded from the table above because they have no direct impact on the statements of income. Such amounts are recognized in the statements of income as a component of |
Fair Value of Derivative Instruments in the Consolidated Balance Sheets |
| |||||||||||
|
| Derivative Assets* |
|
| Derivative Liabilities* |
| ||||||
September 30, 2021 |
| Balance Sheet Location |
| Fair Value |
|
| Balance Sheet Location |
| Fair Value |
| ||
Derivatives designated as hedging instruments |
|
|
|
|
|
|
|
|
|
| ||
Other: Interest rate swaps |
| Derivative Instrument Asset |
| $ | 12.6 |
|
| Derivative Instrument Liability |
| $ | 5.7 |
|
Subtotal |
|
|
|
| 12.6 |
|
|
|
|
| 5.7 |
|
|
|
|
|
|
|
|
|
|
|
|
|
|
Derivatives not designated as hedging instruments |
|
|
|
|
|
|
|
|
|
| ||
Gas Utility: |
|
|
|
|
|
|
|
|
|
|
|
|
Natural gas contracts |
| Accounts Receivable – Other |
|
| 104.0 |
|
| Accounts Receivable – Other |
|
| 0.3 |
|
Gas Marketing: |
|
|
|
|
|
|
|
|
|
|
|
|
NYMEX / ICE natural gas contracts |
| Derivative Instrument Assets |
|
| 93.9 |
|
| Derivative Instrument Liability |
|
| 50.1 |
|
|
| Deferred Charges – Other |
|
| 20.8 |
|
| Deferred Charges – Other |
|
| 11.9 |
|
Natural gas commodity |
| Derivative Instrument Assets |
|
| 34.1 |
|
| Current Liabilities – Other |
|
| 82.5 |
|
|
| Deferred Charges – Other |
|
| 1.1 |
|
| Deferred Credits – Other |
|
| 14.2 |
|
Subtotal |
|
|
|
| 253.9 |
|
|
|
|
| 159.0 |
|
Total derivatives |
|
|
| $ | 266.5 |
|
|
|
| $ | 164.7 |
|
|
|
|
|
|
|
|
|
|
|
|
|
|
September 30, 2020 |
|
|
|
|
|
|
|
|
|
|
|
|
Derivatives designated as hedging instruments |
|
|
|
|
|
|
|
|
|
| ||
Other: Interest rate swaps |
| Derivative Instrument Liability |
| $ | 0 |
|
| Derivative Instrument Liability |
| $ | 54.2 |
|
Subtotal |
|
|
|
| 0 |
|
|
|
|
| 54.2 |
|
|
|
|
|
|
|
|
|
|
|
|
|
|
Derivatives not designated as hedging instruments |
|
|
|
|
|
|
|
|
|
| ||
Gas Utility: |
|
|
|
|
|
|
|
|
|
|
|
|
Natural gas contracts |
| Accounts Receivable – Other |
|
| 6.3 |
|
| Accounts Receivable – Other |
|
| 0.9 |
|
Gasoline and heating oil contracts |
| Derivative Instrument Assets |
|
| 0.3 |
|
|
|
|
|
|
|
Gas Marketing: |
|
|
|
|
|
|
|
|
|
|
|
|
NYMEX / ICE natural gas contracts |
| Derivative Instrument Assets |
|
| 20.5 |
|
| Derivative Instrument Assets |
|
| 21.3 |
|
|
| Deferred Charges – Other |
|
| 7.2 |
|
| Deferred Charges – Other |
|
| 0.8 |
|
Natural gas commodity |
| Derivative Instrument Assets |
|
| 13.5 |
|
| Derivative Instrument Assets |
|
| 0 |
|
|
| Deferred Charges – Other |
|
| 1.4 |
|
| Deferred Charges – Other |
|
| 0 |
|
|
| Current Liabilities – Other |
|
| 0 |
|
| Current Liabilities – Other |
|
| 16.8 |
|
|
| Deferred Credits – Other |
|
| 0 |
|
| Deferred Credits – Other |
|
| 5.5 |
|
Subtotal |
|
|
|
| 49.2 |
|
|
|
|
| 45.3 |
|
Total derivatives |
|
|
| $ | 49.2 |
|
|
|
| $ | 99.5 |
|
| Fair Value of Derivative Instruments in the Consolidated Balance Sheets | |||||||||
| Asset Derivatives* | Liability Derivatives* | ||||||||
| September 30, 2017 | Balance Sheet Location | Fair Value | Balance Sheet Location | Fair Value | |||||
| Derivatives designated as hedging instruments | |||||||||
| Gas Utility: | |||||||||
| Gasoline and heating oil contracts | Derivative Instrument Assets | $ | 0.1 | Derivative Instrument Assets | $ | — | |||
| Gas Marketing: | |||||||||
| Natural gas contracts | Derivative Instrument Assets | 0.3 | Derivative Instrument Assets | 0.2 | |||||
| Deferred Charges – Other | 0.3 | Deferred Charges – Other | — | ||||||
| Other: | |||||||||
| Interest rate swaps | Current Liabilities - Other | — | Current Liabilities - Other | 0.9 | |||||
| Subtotal | 0.7 | 1.1 | |||||||
| Derivatives not designated as hedging instruments | |||||||||
| Gas Utility: | |||||||||
| Natural gas contracts | Accounts Receivable – Other | 3.4 | Accounts Receivable – Other | 1.9 | |||||
| Gas Marketing: | |||||||||
| NYMEX / ICE natural gas contracts | Derivative Instrument Assets | 1.7 | Derivative Instrument Assets | 1.4 | |||||
| Deferred Charges – Other | 0.3 | Deferred Charges – Other | 0.5 | ||||||
| Natural gas commodity | Derivative Instrument Assets | 5.3 | Derivative Instrument Assets | 0.1 | |||||
| Other Deferred Charges | 0.4 | Other Deferred Charges | — | ||||||
| Current Liabilities – Other | 0.8 | Current Liabilities – Other | 5.0 | ||||||
| Deferred Credits – Other | 0.4 | Deferred Credits – Other | 3.3 | ||||||
| Subtotal | 12.3 | 12.2 | |||||||
| Total derivatives | $ | 13.0 | $ | 13.3 | |||||
| September 30, 2016 | |||||||||
| Derivatives designated as hedging instruments | |||||||||
| Gas Utility: | |||||||||
| Gasoline and heating oil contracts | Derivative Instrument Assets | $ | 0.3 | Derivative Instrument Assets | $ | — | |||
| Gas Marketing: | |||||||||
| Natural gas contracts | Derivative Instrument Assets | 2.5 | Derivative Instrument Assets | 0.8 | |||||
| Deferred Charges - Other | 0.4 | Deferred Charges - Other | 0.1 | ||||||
Other: Interest rate swaps | Derivative Instrument Assets | — | Derivative Instrument Assets | 3.0 | |||||
| Subtotal | 3.2 | 3.9 | |||||||
| Derivatives not designated as hedging instruments | |||||||||
| Gas Utility: | |||||||||
| Natural gas contracts | Accounts Receivable – Other | 5.4 | Accounts Receivable – Other | 1.6 | |||||
| Derivative Instrument Assets | — | Derivative Instrument Assets | 0.2 | ||||||
| Gas Marketing: | |||||||||
| NYMEX / ICE natural gas contracts | Derivative Instrument Assets | 0.8 | Derivative Instrument Assets | 4.1 | |||||
| Deferred Charges – Other | — | Deferred Charges – Other | 0.1 | ||||||
| Natural gas commodity | Derivative Instrument Assets | 6.5 | Derivative Instrument Assets | 0.2 | |||||
| Other Deferred Charges | 2.1 | Other Deferred Charges | 0.3 | ||||||
| Current Liabilities – Other | 0.2 | Current Liabilities – Other | 2.0 | ||||||
| Deferred Credits – Other | 0.2 | Deferred Credits – Other | 0.1 | ||||||
| Subtotal | 15.2 | 8.6 | |||||||
| Total derivatives | $ | 18.4 | $ | 12.5 | |||||
* | |
The fair values of |
Following is a reconciliation of the amounts in the tables above to the amounts presented in the Consolidated Balance Sheets:
|
| 2021 |
|
| 2020 |
| ||
Fair value of derivative assets presented above |
| $ | 266.5 |
|
| $ | 49.2 |
|
Fair value of cash margin receivable offset with derivatives |
|
| (135.4 | ) |
|
| (9.0 | ) |
Netting of assets and liabilities with the same counterparty |
|
| (73.0 | ) |
|
| (23.0 | ) |
Total |
| $ | 58.1 |
|
| $ | 17.2 |
|
Derivative Instrument Assets, per Consolidated Balance Sheets: |
|
|
|
|
|
|
|
|
Current Assets – Other |
| $ | 57.0 |
|
| $ | 15.8 |
|
Deferred Charges and Other Assets – Other |
|
| 1.1 |
|
|
| 1.4 |
|
Total |
| $ | 58.1 |
|
| $ | 17.2 |
|
|
|
|
|
|
|
|
|
|
Fair value of derivative liabilities presented above |
| $ | 164.7 |
|
| $ | 99.5 |
|
Netting of assets and liabilities with the same counterparty |
|
| (73.0 | ) |
|
| (23.0 | ) |
Total |
| $ | 91.7 |
|
| $ | 76.5 |
|
Derivative Instrument Liabilities, per Consolidated Balance Sheets: |
|
|
|
|
|
|
|
|
Current Liabilities – Other |
| $ | 77.5 |
|
| $ | 71.0 |
|
Deferred Credits and Other Liabilities – Other |
|
| 14.2 |
|
|
| 5.5 |
|
Total |
| $ | 91.7 |
|
| $ | 76.5 |
|
| 2017 | 2016 | ||||||
| Fair value of asset derivatives presented above | $ | 13.0 | $ | 18.4 | |||
| Fair value of cash margin (payable) receivable offset with derivatives | (1.5 | ) | 2.5 | ||||
| Netting of assets and liabilities with the same counterparty | (5.3 | ) | (7.6 | ) | |||
| Total | $ | 6.2 | $ | 13.3 | |||
| Derivative Instrument Assets, per Consolidated Balance Sheets: | |||||||
| Derivative instrument assets | $ | 5.9 | $ | 11.4 | |||
| Deferred Charges – Other | 0.3 | 1.9 | |||||
| Total | $ | 6.2 | $ | 13.3 | |||
| Fair value of liability derivatives presented above | $ | 13.3 | $ | 12.5 | |||
| Netting of assets and liabilities with the same counterparty | (5.3 | ) | (7.6 | ) | |||
| Total | $ | 8.0 | $ | 4.9 | |||
| Derivative Instrument Liabilities, per Consolidated Balance Sheets: | |||||||
| Current Liabilities – Other | $ | 4.9 | $ | 4.8 | |||
| Deferred Credits – Other | 3.1 | 0.1 | |||||
| Total | $ | 8.0 | $ | 4.9 | |||
Additionally, at September 30, 20172021 and 2016,2020, the Company had $4.0$40.8 and $2.9,$7.6, respectively, in cash margin receivables not offset with derivatives, which are presented in Accounts Receivable – Other.
Spire Missouri
Spire Missouri has a risk management policy to utilize various derivatives, including futures contracts, exchange-traded options, swaps and over-the-counter instruments for the explicit purpose of managing price risk associated with purchasing and delivering natural gas on a regular basis to customers in accordance with its tariffs. The objective of this policy is to limit Spire Missouri’s exposure to natural gas price volatility and to manage, hedge and mitigate substantial price risk. This policy strictly prohibits speculation and permits Spire Missouri to hedge current physical natural gas purchase commitments or forecasted or anticipated future peak (maximum) physical need for natural gas delivered. Costs and cost reductions, including carrying costs, associated with Spire Missouri’s use of natural gas derivative instruments are allowed to be passed on to Spire Missouri customers through the operation of its PGA clause, through which the MoPSC allows Spire Missouri to recover gas supply costs, subject to prudence review by the MoPSC. Accordingly, Spire Missouri does not expect any adverse earnings impact as a result of the use of these derivative instruments.
Spire Missouri does not designate these instruments as hedging instruments for financial reporting purposes because gains or losses associated with the use of these derivative instruments are deferred and recorded as regulatory assets or regulatory liabilities pursuant to ASC Topic 980, “RegulatedRegulated Operations”, and, as a result, have no direct impact on the statements of income.
The timing of the operation of the PGA clause may cause interim variations in short-term cash flows, because Spire Missouri is subject to cash margin requirements associated with changes in the values of these instruments. Nevertheless, carrying costs associated with such requirements are recovered through the PGA clause.
From time to time, Spire Missouri purchases NYMEX futures and options contracts to help stabilize operating costs associated with forecasted purchases of gasoline and diesel fuels used to power vehicles and equipment used in the course of its business. At September 30, 2017, Spire Missouri held 0.3 million gallons of gasoline futuresThese contracts at an average price of $1.27 per gallon. Most of these contracts, the longest of which extends to December 2017, are designated as cash flow hedges of forecasted transactions pursuant to ASC Topic 815, “DerivativesDerivatives and Hedging.”Hedging. The gains or losses on these derivative instruments are not subject to Spire Missouri’s PGA clause.
Derivative instruments designated as cash flow hedges of forecasted transactions are recognized on the balance sheets at fair value and the change in the fair value of the effective portion of these hedge instruments is recorded, net of income tax, in OCI. AOCI is a component of Total Common Stock Equity. Amounts are reclassified from AOCI into earnings when the hedged items affect net income, using the same revenue or expense category that the hedged item impacts. Based on market prices at September 30, 2017, it is expected that an immaterial amount of pre-tax gainsAs in both 2020 and 2019, there will be reclassifiedno reclassifications into the statements of income during fiscal 2018.2022. Cash flows from hedging transactions are classified in the same category as the cash flows from the items that are being hedged in the statements of cash flows.
Spire Missouri’s derivative instruments consist primarily of NYMEX positions. The NYMEX is the primary national commodities exchange on which natural gas derivatives are traded. Open NYMEX natural gas futures positions at September 30, 20172021 and 2020 were as follows:
|
| September 30, 2021 |
|
| September 30, 2020 |
| ||||||||||
|
| Notional (MMBtu millions) |
|
| Maximum Term (Months) |
|
| Notional (MMBtu millions) |
|
| Maximum Term (Months) |
| ||||
Natural gas futures purchased |
|
| 52.8 |
|
|
| 12 |
|
|
| 25.9 |
|
|
| 12 |
|
MMBtu (millions) | Avg. Price Per MMBtu | |||||
| NYMEX/ICE open long futures/swap positions | ||||||
| Fiscal 2018 | 14.18 | $ | 2.98 | |||
| Fiscal 2019 | 1.68 | 2.89 | ||||
At September 30, 2017,2021, Spire Missouri also had 33.9 million MMBtu ofno other price mitigation derivatives in placeplace.
Gains and losses on Spire Missouri’s natural gas derivative instruments, which are not designated as hedging instruments for financial reporting purposes, are deferred pursuant to the Spire Missouri’s PGA clauses and initially recorded as regulatory assets or regulatory liabilities. Such amounts are recognized in the statements of income as a component of natural gas operating expenses when they are recovered through the use of NYMEX natural gas option-based strategies.PGA clause and reflected in customer billings.
Fair Value of Derivative Instruments in the Balance Sheets |
| |||||||||||
|
| Derivative Assets* |
|
| Derivative Liabilities* |
| ||||||
September 30, 2021 |
| Balance Sheet Location |
| Fair Value |
|
| Balance Sheet Location |
| Fair Value |
| ||
Derivatives not designated as hedging instruments |
|
|
|
|
|
|
|
|
|
| ||
Natural gas contracts |
| Accounts Receivable – Other |
| $ | 104.0 |
|
| Accounts Receivable – Other |
| $ | 0.3 |
|
Total derivatives |
|
|
| $ | 104.0 |
|
|
|
| $ | 0.3 |
|
|
|
|
|
|
|
|
|
|
|
|
|
|
September 30, 2020 |
|
|
|
|
|
|
|
|
|
|
|
|
Derivatives not designated as hedging instruments |
|
|
|
|
|
|
|
|
|
| ||
Natural gas contracts |
| Accounts Receivable – Other |
| $ | 6.3 |
|
| Accounts Receivable – Other |
| $ | 0.9 |
|
Gasoline and heating oil contracts |
| Derivative Instrument Assets |
|
| 0.3 |
|
|
|
|
|
|
|
Total derivatives |
|
|
| $ | 6.6 |
|
|
|
| $ | 0.9 |
|
| Effect of Derivative Instruments on the Statements of Income and Statements of Comprehensive Income | ||||||||||||
| Location of Gain (Loss) | ||||||||||||
| Recorded in Income | 2017 | 2016 | 2015 | |||||||||
| Derivatives in Cash Flow Hedging Relationships | ||||||||||||
| Effective portion of gain (loss) recognized in OCI on derivatives: | ||||||||||||
| Gasoline and heating oil contracts | $ | 0.1 | $ | — | $ | (1.2 | ) | |||||
| Effective portion of gain (loss) reclassified from AOCI to income: | ||||||||||||
| Gasoline and heating oil contracts | Gas Utility Other Operating Expenses | $ | 0.2 | $ | (0.5 | ) | $ | (0.9 | ) | |||
| Ineffective portion of gain (loss) on derivatives recognized in income: | ||||||||||||
| Gasoline and heating oil contracts | Gas Utility Other Operating Expenses | $ | — | $ | 0.1 | $ | 0.1 | |||||
| Derivatives Not Designated as Hedging Instruments* | ||||||||||||
| Gain (loss) recognized in income on derivatives: | ||||||||||||
| Gasoline and heating oil contracts | Other Income and (Income Deductions) - Net | $ | — | $ | — | $ | (0.2 | ) | ||||
* | |
| Fair Value of Derivative Instruments in the Balance Sheets | |||||||||
| Asset Derivatives* | Liability Derivatives* | ||||||||
| September 30, 2017 | Balance Sheet Location | Fair Value | Balance Sheet Location | Fair Value | |||||
| Derivatives designated as hedging instruments | |||||||||
| Gasoline and heating oil contracts | Derivative Instrument Assets | $ | 0.1 | Derivative Instrument Assets | $ | — | |||
| Derivatives not designated as hedging instruments | |||||||||
| Natural gas contracts | Accounts Receivable – Other | 3.4 | Accounts Receivable – Other | 1.9 | |||||
| Total derivatives | $ | 3.5 | $ | 1.9 | |||||
| September 30, 2016 | |||||||||
| Derivatives designated as hedging instruments | |||||||||
| Gasoline and heating oil contracts | Derivative Instrument Assets | $ | 0.3 | Derivative Instrument Assets | $ | — | |||
| Subtotal | 0.3 | — | |||||||
| Derivatives not designated as hedging instruments | |||||||||
| Natural gas contracts | Accounts Receivable – Other | 5.4 | Accounts Receivable – Other | 1.6 | |||||
| OTCBB natural gas contracts | Derivative Instrument Assets | — | Derivative Instrument Assets | 0.2 | |||||
| Subtotal | 5.4 | 1.8 | |||||||
| Total derivatives | $ | 5.7 | $ | 1.8 | |||||
The fair values of |
Following is a reconciliation of the amounts in the tables above to the amounts presented in Spire Missouri’s Balance Sheets:
|
| 2021 |
|
| 2020 |
| ||
Fair value of derivative assets presented above |
| $ | 104.0 |
|
| $ | 6.6 |
|
Fair value of cash margin (payable) receivable offset with derivatives |
|
| (103.7 | ) |
|
| (5.7 | ) |
Netting of assets and liabilities with the same counterparty |
|
| (0.3 | ) |
|
| (0.9 | ) |
Total |
| $ | 0 |
|
| $ | 0 |
|
|
|
|
|
|
|
|
|
|
Fair value of derivative liabilities presented above |
| $ | 0.3 |
|
| $ | 0.9 |
|
Netting of assets and liabilities with the same counterparty |
|
| (0.3 | ) |
|
| (0.9 | ) |
Total |
| $ | 0 |
|
| $ | 0 |
|
| 2017 | 2016 | ||||||
| Fair value of asset derivatives presented above | $ | 3.5 | $ | 5.7 | |||
| Fair value of cash margin (payable) receivable offset with derivatives | (1.5 | ) | 0.8 | ||||
| Netting of assets and liabilities with the same counterparty | (1.9 | ) | (1.6 | ) | |||
| Total | $ | 0.1 | $ | 4.9 | |||
| Derivative Instrument Assets, per Balance Sheets: | |||||||
| Derivative instrument assets | $ | 0.1 | $ | 4.9 | |||
| Total | $ | 0.1 | $ | 4.9 | |||
| Fair value of liability derivatives presented above | $ | 1.9 | $ | 1.8 | |||
| Netting of assets and liabilities with the same counterparty | (1.9 | ) | (1.6 | ) | |||
| Total | $ | — | $ | 0.2 | |||
| Derivative Instrument Liabilities, per Balance Sheets: | |||||||
| Current Liabilities – Other | $ | — | $ | 0.2 | |||
| Total | $ | — | $ | 0.2 | |||
Additionally, at September 30, 20172021 and 2016,2020, Spire Missouri had $4.0$40.3 and $0.5,$7.2, respectively, in cash margin receivables not offset with derivatives, which are presented in Accounts Receivable – Other.
Spire Alabama
Spire Alabama entered into cash flow derivative commodity instruments to hedge its exposure to price fluctuations on its gas supply. Spire Alabama recognizes all derivatives at fair value as either assets or liabilities on the balance sheet. Any realized gains or losses are passed through to customers using the mechanisms of the GSA rider in accordance with Spire Alabama’s APSC approved tariff.
11. CONCENTRATIONS OF CREDIT RISK
Spire’s Gas Utility segment serves 1.7 million customers in Spire Marketing, Spire has no3 states across multiple rate classes resulting in a significant concentrationamount of credit risk.
Spire Marketing’s transactions are with (or are associated with) energy producers,accounts receivable attributable to utility companies and pipelines.their marketing affiliates totaled $153.5 at September 30, 2021. The concentration of transactions with these counterparties has the potential to affect the Company’s overall exposure to credit risk, either positively or negatively, in that each of these three groupscustomers in this group may be affected similarly by changes in economic, industry, or other conditions. Spire Marketing also has concentrations of credit risk with certain individually significant counterparties. At September 30, 2021, the amounts included in accounts receivable from its 5 largest counterparties (in terms of net accounts receivable exposure) totaled $67.0.NaN of these five counterparties are investment-grade rated integrated utilities, while the fifth is not rated but is a subsidiary of an investment-grade rated company.
To manage this risk, as well as credit risk from significant counterparties in these and other industries,risks, Spire Marketing has established procedures to determine the creditworthiness of its counterparties. These procedures include obtaining credit ratings and credit reports, analyzing counterparty financial statements to assess financial condition, and considering the industry environment in which the counterparty operates. This information is monitored on an ongoing basis. In some instances, Spire Marketing may require credit assurances such as prepayments, letters of credit, or parental guarantees.guaranties. In addition, Spire Marketing may enter into netting arrangements to mitigate credit risk with counterparties in the energy industry with whom it conducts both sales and purchases of natural gas. Where there is no netting arrangement, Spire Marketing records accounts receivable, accounts payable, and prepayments for physical sales and purchases of natural gas on a gross basis. Sales are typically made on an unsecured credit basis with payment due the month following delivery. Accounts receivable amounts are closely monitored and provisions for uncollectible amounts are accrued when losses are probable.
12. INCOME TAXES
The Company, Spire Marketing records accounts receivable, accounts payable,Missouri, and prepayments for physical salesSpire Alabama are subject to federal income tax as well as income tax in various state and purchases of natural gas onlocal jurisdictions. Spire files a gross basis. consolidated federal income tax return and various state income tax returns and allocates income taxes to Spire Missouri, Spire Alabama and its other subsidiaries as if each entity were a separate taxpayer.
The amount included in accounts receivable attributable to energy producers and their marketing affiliates amounted to $17.9 at September 30, 2017 ($8.9 reflecting netting arrangements). Spire Marketing’s accounts receivable attributable to utility companies and their marketing affiliates comprised $58.2 of total accounts receivable at September 30, 2017 ($55.8 reflecting netting arrangements).
|
| Spire |
|
| Spire Missouri |
|
| Spire Alabama |
| |||||||||||||||||||||||||||
|
| 2021 |
|
| 2020 |
|
| 2019 |
|
| 2021 |
|
| 2020 |
|
| 2019 |
|
| 2021 |
|
| 2020 |
|
| 2019 |
| |||||||||
Federal: |
|
|
|
|
|
|
|
|
|
|
|
|
|
|
|
|
|
|
|
|
|
|
|
|
|
|
|
|
|
|
|
|
|
|
|
|
Current |
| $ | 0.2 |
|
| $ | 0.4 |
|
| $ | 0.6 |
|
| $ | 0 |
|
| $ | 0 |
|
| $ | 0 |
|
| $ | 0 |
|
| $ | 0 |
|
| $ | 0 |
|
Deferred |
|
| 49.5 |
|
|
| 5.8 |
|
|
| 27.4 |
|
|
| 22.0 |
|
|
| 14.9 |
|
|
| 11.5 |
|
|
| 19.8 |
|
|
| 17.4 |
|
|
| 16.3 |
|
Investment tax credits |
|
| (0.2 | ) |
|
| (0.2 | ) |
|
| (0.2 | ) |
|
| (0.2 | ) |
|
| (0.2 | ) |
|
| (0.2 | ) |
|
| 0 |
|
|
| 0 |
|
|
| 0 |
|
State and local: |
|
|
|
|
|
|
|
|
|
|
|
|
|
|
|
|
|
|
|
|
|
|
|
|
|
|
|
|
|
|
|
|
|
|
|
|
Current |
|
| 1.3 |
|
|
| 3.0 |
|
|
| 2.1 |
|
|
| 0 |
|
|
| 0.1 |
|
|
| 0 |
|
|
| 0 |
|
|
| 0 |
|
|
| 0 |
|
Deferred |
|
| 17.7 |
|
|
| 3.4 |
|
|
| 4.6 |
|
|
| 3.5 |
|
|
| 2.5 |
|
|
| 2.0 |
|
|
| 5.2 |
|
|
| 4.6 |
|
|
| 4.2 |
|
Total income tax expense |
| $ | 68.5 |
|
| $ | 12.4 |
|
| $ | 34.5 |
|
| $ | 25.3 |
|
| $ | 17.3 |
|
| $ | 13.3 |
|
| $ | 25.0 |
|
| $ | 22.0 |
|
| $ | 20.5 |
|
| 2017 | 2016 | 2015 | |||||||||
| Federal | |||||||||||
| Current | $ | 0.1 | $ | 0.1 | $ | (3.3 | ) | ||||
| Deferred | 67.7 | 62.0 | 58.8 | ||||||||
| Investment tax credits | (0.2 | ) | (0.2 | ) | (0.2 | ) | |||||
| State and local | |||||||||||
| Current | 0.5 | 0.6 | — | ||||||||
| Deferred | 9.5 | 7.0 | 6.9 | ||||||||
| Total income tax expense | $ | 77.6 | $ | 69.5 | $ | 62.2 | |||||
The Company’s effective income tax rate varied from the federal statutory income tax rate for each year due to the following:
|
| Spire |
|
| Spire Missouri |
|
| Spire Alabama |
| |||||||||||||||||||||||||||
|
| 2021 |
|
| 2020 |
|
| 2019 |
|
| 2021 |
|
| 2020 |
|
| 2019 |
|
| 2021 |
|
| 2020 |
|
| 2019 |
| |||||||||
Federal income tax statutory rate |
|
| 21.0 | % |
|
| 21.0 | % |
|
| 21.0 | % |
|
| 21.0 | % |
|
| 21.0 | % |
|
| 21.0 | % |
|
| 21.0 | % |
|
| 21.0 | % |
|
| 21.0 | % |
State and local income taxes, net of federal income tax benefits |
|
| 3.6 |
|
|
| 9.0 |
|
|
| 3.6 |
|
|
| 2.6 |
|
|
| 2.6 |
|
|
| 2.6 |
|
|
| 4.1 |
|
|
| 4.1 |
|
|
| 4.1 |
|
Certain expenses capitalized on books and deducted on tax return |
|
| (1.6 | ) |
|
| (6.6 | ) |
|
| (3.8 | ) |
|
| (3.3 | ) |
|
| (4.6 | ) |
|
| (6.5 | ) |
|
| 0 |
|
|
| 0 |
|
|
| 0 |
|
Taxes related to prior years |
|
| (0.5 | ) |
|
| (1.8 | ) |
|
| 0.2 |
|
|
| (0.2 | ) |
|
| (1.4 | ) |
|
| 0.1 |
|
|
| 0 |
|
|
| 0.1 |
|
|
| 0 |
|
Amortization of excess deferred taxes |
|
| (2.5 | ) |
|
| (8.3 | ) |
|
| (3.8 | ) |
|
| (5.0 | ) |
|
| (5.7 | ) |
|
| (6.6 | ) |
|
| 0 |
|
|
| 0 |
|
|
| 0 |
|
Other items – net * |
|
| 0.1 |
|
|
| (1.0 | ) |
|
| (1.4 | ) |
|
| (0.2 | ) |
|
| (0.2 | ) |
|
| (0.3 | ) |
|
| 0.2 |
|
|
| (0.1 | ) |
|
| 0.2 |
|
Effective income tax rate |
|
| 20.1 | % |
|
| 12.3 | % |
|
| 15.8 | % |
|
| 14.9 | % |
|
| 11.7 | % |
|
| 10.3 | % |
|
| 25.3 | % |
|
| 25.1 | % |
|
| 25.3 | % |
* | Other consists primarily of property adjustments. |
| 2017 | 2016 | 2015 | ||||||
| Federal income tax statutory rate | 35.0 | % | 35.0 | % | 35.0 | % | ||
| State and local income taxes, net of federal income tax benefits | 2.8 | 2.8 | 3.0 | |||||
| Certain expenses capitalized on books and deducted on tax return | (2.3 | ) | (3.4 | ) | (3.7 | ) | ||
| Taxes related to prior years | (0.9 | ) | (0.2 | ) | (0.6 | ) | ||
| Other items – net * | (2.2 | ) | (1.7 | ) | (2.5 | ) | ||
| Effective income tax rate | 32.4 | % | 32.5 | % | 31.2 | % | ||
The Company’s significant items comprising the net deferred tax liability recorded in the Consolidated Balance Sheetsor asset as of September 30 arewere as follows:
|
| Spire |
|
| Spire Missouri |
|
| Spire Alabama |
| |||||||||||||||
|
| 2021 |
|
| 2020 |
|
| 2021 |
|
| 2020 |
|
| 2021 |
|
| 2020 |
| ||||||
Deferred tax assets: |
|
|
|
|
|
|
|
|
|
|
|
|
|
|
|
|
|
|
|
|
|
|
|
|
Reserves not currently deductible |
| $ | 18.3 |
|
| $ | 24.8 |
|
| $ | 8.5 |
|
| $ | 16.7 |
|
| $ | 6.6 |
|
| $ | 5.9 |
|
Pension and other postretirement benefits |
|
| 77.4 |
|
|
| 108.3 |
|
|
| 53.4 |
|
|
| 78.5 |
|
|
| 0 |
|
|
| 0 |
|
Goodwill |
|
| 0 |
|
|
| 0 |
|
|
| 0 |
|
|
| 0 |
|
|
| 87.2 |
|
|
| 101.3 |
|
Operating losses |
|
| 264.5 |
|
|
| 170.4 |
|
|
| 110.3 |
|
|
| 36.0 |
|
|
| 130.3 |
|
|
| 111.3 |
|
Regulatory amount due to customers, net |
|
| 33.2 |
|
|
| 36.1 |
|
|
| 29.4 |
|
|
| 32.3 |
|
|
| 0 |
|
|
| 0 |
|
Other |
|
| 32.4 |
|
|
| 44.7 |
|
|
| 0 |
|
|
| 0 |
|
|
| 0 |
|
|
| 0 |
|
Deferred tax assets |
|
| 425.8 |
|
|
| 384.3 |
|
|
| 201.6 |
|
|
| 163.5 |
|
|
| 224.1 |
|
|
| 218.5 |
|
Less: Valuation allowance |
|
| (0.5 | ) |
|
| (0.9 | ) |
|
| (0.4 | ) |
|
| (0.9 | ) |
|
| 0 |
|
|
| 0 |
|
Total deferred tax assets |
|
| 425.3 |
|
|
| 383.4 |
|
|
| 201.2 |
|
|
| 162.6 |
|
|
| 224.1 |
|
|
| 218.5 |
|
Deferred tax liabilities: |
|
|
|
|
|
|
|
|
|
|
|
|
|
|
|
|
|
|
|
|
|
|
|
|
Relating to property |
|
| (693.9 | ) |
|
| (614.0 | ) |
|
| (464.0 | ) |
|
| (427.1 | ) |
|
| (182.7 | ) |
|
| (151.4 | ) |
Regulatory pension and other postretirement benefits |
|
| (95.6 | ) |
|
| (138.4 | ) |
|
| (71.2 | ) |
|
| (107.4 | ) |
|
| (1.6 | ) |
|
| (3.4 | ) |
Deferred gas costs |
|
| (81.1 | ) |
|
| 0 |
|
|
| (79.5 | ) |
|
| 0 |
|
|
| 0 |
|
|
| 0 |
|
Other** |
|
| (167.0 | ) |
|
| (142.4 | ) |
|
| (66.5 | ) |
|
| (62.8 | ) |
|
| (5.6 | ) |
|
| (4.4 | ) |
Total deferred tax liabilities |
|
| (1,037.6 | ) |
|
| (894.8 | ) |
|
| (681.2 | ) |
|
| (597.3 | ) |
|
| (189.9 | ) |
|
| (159.2 | ) |
Net deferred tax (liability) asset |
| $ | (612.3 | ) |
| $ | (511.4 | ) |
| $ | (480.0 | ) |
| $ | (434.7 | ) |
| $ | 34.2 |
|
| $ | 59.3 |
|
| 2017 | 2016 | ||||||
| Deferred tax assets: | |||||||
| Reserves not currently deductible | $ | 31.5 | $ | 21.3 | |||
| Pension and other postretirement benefits | 58.6 | 68.3 | |||||
| Operating losses | 169.6 | 102.3 | |||||
| Other | 26.0 | — | |||||
| Deferred tax assets | 285.7 | 191.9 | |||||
| Less: valuation allowance | 0.5 | 0.9 | |||||
| Total deferred tax assets | 285.2 | 191.0 | |||||
| Deferred tax liabilities: | |||||||
| Relating to property | 728.3 | 623.1 | |||||
| Regulatory pension and other postretirement benefits | 108.0 | 106.8 | |||||
| Deferred gas costs | 30.6 | 20.0 | |||||
| Other** | 125.8 | 48.4 | |||||
| Total deferred tax liabilities | 992.7 | 798.3 | |||||
| Net deferred tax liability | $ | 707.5 | $ | 607.3 | |||
** | For Spire, Other consists primarily of goodwill-related liabilities. |
As indicated in Note 1, Summary of Goodwill related liabilities.
In assessing whether deferred tax assets are realizable, management considers whether it is more likely than not that some portion or all of the deferred tax assets will not be realized. Management considers all significant available positive and negative evidence, including the existence of losses in recent years, the timing of deferred tax liability reversals, projected future taxable income, taxable income in carryback years, and tax planning strategies to assess the need for a valuation allowance. Based upon this evidence, management believes it is more likely than not the Company, Spire Missouri and Spire Alabama will realize the benefits of these deferred tax assets, except for the contribution carryforward valuation allowanceallowances noted below.
As of September 30, 2021, Spire, and on a separate company basis, Spire Missouri and Spire Alabama, had federal and state loss carryforwards, of approximately $478.6 at September 30, 2017. The Company also has contribution carryforwards, and various tax credit carryforwards as shown below.
|
| Spire |
|
| Spire Missouri |
|
| Spire Alabama |
| |||
Federal and state loss carryforwards |
| $ | 1,079.5 |
|
| $ | 467.3 |
|
| $ | 517.5 |
|
Contribution carryforwards |
|
| 16.4 |
|
|
| 12.2 |
|
|
| 0.5 |
|
Tax credit carryforwards |
|
| 4.5 |
|
|
| 3.4 |
|
|
| — |
|
For federal tax purposes, Spire Missouri’s and Spire Alabama’s loss carryforwards may be utilized against income from another member of approximately $12.1 at September 30, 2017.the consolidated group. The loss carryforwards begin to expire in fiscal 2030 for certain state purposes and fiscal 2035 for federal and other statesstate purposes. The contributionContribution carryforwards beginare already starting to expire in fiscal 2018. The Company has a valuation allowance of $0.5 asexpire. Because a portion of the contribution carryforward willcarryforwards are not likely to be realized prior to its expiration. expiration, valuation allowances have been established by Spire and Spire Missouri for $1.9 and $1.5 of carryforwards, respectively, as of September 30, 2021.
The Company, also has various tax credit carryforwards of approximately $2.5 that begin to expire in 2020.
|
| Spire |
|
| Spire Missouri |
| ||||||||||||||||||
|
| 2021 |
|
| 2020 |
|
| 2019 |
|
| 2021 |
|
| 2020 |
|
| 2019 |
| ||||||
Unrecognized tax benefits, beginning of year |
| $ | 13.2 |
|
| $ | 10.7 |
|
| $ | 8.1 |
|
| $ | 13.0 |
|
| $ | 10.4 |
|
| $ | 7.8 |
|
Increases related to tax positions taken in current year |
|
| 3.2 |
|
|
| 2.6 |
|
|
| 4.5 |
|
|
| 3.1 |
|
|
| 2.6 |
|
|
| 4.5 |
|
Reductions related to tax positions taken in prior year |
|
| 0 |
|
|
| 0 |
|
|
| (1.9 | ) |
|
| 0 |
|
|
| 0 |
|
|
| (1.9 | ) |
Reductions due to lapse of applicable statute of limitations |
|
| 0 |
|
|
| (0.1 | ) |
|
| 0 |
|
|
| 0 |
|
|
| 0 |
|
|
| 0 |
|
Unrecognized tax benefits, end of year |
| $ | 16.4 |
|
| $ | 13.2 |
|
| $ | 10.7 |
|
| $ | 16.1 |
|
| $ | 13.0 |
|
| $ | 10.4 |
|
| 2017 | 2016 | 2015 | |||||||||
| Unrecognized tax benefits, beginning of year | $ | 10.0 | $ | 7.1 | $ | 4.6 | |||||
| Increases related to tax positions taken in current year | 2.4 | 3.4 | 2.9 | ||||||||
| Reductions due to lapse of applicable statute of limitations | (1.4 | ) | (0.5 | ) | (0.4 | ) | |||||
| Unrecognized tax benefits, end of year | $ | 11.0 | $ | 10.0 | $ | 7.1 | |||||
As of September 30, 2021 and 2020, the amounts of unrecognized tax benefits which, if recognized, would affect the Company’s effective tax rate were $5.1$3.6 and $2.9, respectively, for the Company and $3.3 as of September 30, 2017 and 2016, respectively.$2.7, respectively, for Spire Missouri. It is reasonably possible that events will occur in the next 12 months that could increase or decrease the amount of the Company’s unrecognized tax benefits. The Company doesand Spire Missouri do not expect that any such change will be significant to the Consolidated Balance Sheets.
The impact of any adjustments made to these returns by the relevant taxing authorities would be addressed by the indemnification provisions of the stock purchase agreement with Sempra Global.
| 2017 | 2016 | 2015 | |||||||||
| Federal | |||||||||||
| Current | $ | — | $ | — | $ | (2.1 | ) | ||||
| Deferred | 42.0 | 37.5 | 40.9 | ||||||||
| Investment tax credits | (0.2 | ) | (0.2 | ) | (0.2 | ) | |||||
| State and local | |||||||||||
| Current | — | 0.1 | (0.1 | ) | |||||||
| Deferred | 5.7 | 8.0 | 4.7 | ||||||||
| Total income tax expense | $ | 47.5 | $ | 45.4 | $ | 43.2 | |||||
| 2017 | 2016 | 2015 | ||||||
| Federal income tax statutory rate | 35.0 | % | 35.0 | % | 35.0 | % | ||
| State and local income taxes, net of federal income tax benefits | 2.8 | 2.8 | 2.8 | |||||
| Certain expenses capitalized on books and deducted on tax return | (3.5 | ) | (4.8 | ) | (4.9 | ) | ||
| Taxes related to prior years | (1.4 | ) | (0.2 | ) | (0.8 | ) | ||
| Other items – net * | (3.3 | ) | (2.8 | ) | (3.0 | ) | ||
| Effective income tax rate | 29.6 | % | 30.0 | % | 29.1 | % | ||
| 2017 | 2016 | ||||||
| Deferred tax assets: | |||||||
| Reserves not currently deductible | $ | 25.3 | $ | 14.9 | |||
| Pension and other postretirement benefits | 52.7 | 56.9 | |||||
| Operating losses | 52.0 | 29.9 | |||||
| Deferred tax assets | 130.0 | 101.7 | |||||
| Less: valuation allowance | 0.5 | 0.9 | |||||
| Total deferred tax assets | 129.5 | 100.8 | |||||
| Deferred tax liabilities: | |||||||
| Relating to utility property | 563.2 | 497.0 | |||||
| Regulatory pension and other postretirement benefits | 108.0 | 106.8 | |||||
| Deferred gas costs | 25.0 | 20.0 | |||||
| Other | 57.1 | 33.9 | |||||
| Total deferred tax liabilities | 753.3 | 657.7 | |||||
| Net deferred tax liability | $ | 623.8 | $ | 556.9 | |||
| 2017 | 2016 | 2015 | |||||||||
| Unrecognized tax benefits, beginning of year | $ | 9.7 | $ | 6.9 | $ | 4.2 | |||||
| Increases related to tax positions taken in current year | 2.4 | 3.3 | 2.9 | ||||||||
| Reductions due to lapse of applicable statute of limitations | (1.4 | ) | (0.5 | ) | (0.2 | ) | |||||
| Unrecognized tax benefits, end of year | $ | 10.7 | $ | 9.7 | $ | 6.9 | |||||
The Company, Spire Missouri, is subject to US federal income tax as well as income tax in various state and local jurisdictions, and isSpire Alabama are no longer subject to examination for fiscal years prior to 2014.
| 2017 | 2016 | 2015 | |||||||||
| Federal | |||||||||||
| Current | $ | — | $ | (0.8 | ) | $ | — | ||||
| Deferred | 31.6 | 29.4 | 25.9 | ||||||||
| State and local | |||||||||||
| Current | — | — | 0.1 | ||||||||
| Deferred | 4.2 | 3.8 | 3.3 | ||||||||
| Total income tax expense | $ | 35.8 | $ | 32.4 | $ | 29.3 | |||||
| 2017 | 2016 | 2015 | ||||||
| Federal income tax statutory rate | 35.0 | % | 35.0 | % | 35.0 | % | ||
| State and local income taxes, net of federal income tax benefits | 2.8 | 2.8 | 2.8 | |||||
| Other items – net | 0.3 | 0.1 | 0.1 | |||||
| Effective income tax rate | 38.1 | % | 37.9 | % | 37.9 | % | ||
| 2017 | 2016 | ||||||
| Deferred tax assets: | |||||||
| Reserves not currently deductible | $ | 6.0 | $ | 6.3 | |||
| Pension and other postretirement benefits | 4.4 | 11.4 | |||||
| Goodwill | 214.4 | 233.4 | |||||
| Operating losses | 88.3 | 60.2 | |||||
| Total deferred tax assets | 313.1 | 311.3 | |||||
| Deferred tax liabilities: | |||||||
| Relating to utility property | 119.3 | 87.6 | |||||
| Other | 8.2 | 2.3 | |||||
| Total deferred tax liabilities | 127.5 | 89.9 | |||||
| Net deferred tax asset | $ | 185.6 | $ | 221.4 | |||
13. PENSION PLANS AND OTHER POSTRETIREMENT BENEFITS
Pension Plans
The pension plans of Spire consist of plans for employees at theSpire Missouri, Utilities, plans covering the employees of Spire Alabama and plans covering employees of the subsidiaries of Spire EnergySouth.
Spire Missouri Utilitiesand Spire Alabama have non-contributory, defined benefit, trusteed forms of pension plans covering the majority of their employees. Plan assets consist primarily of corporate and USU.S. government obligations and a growth segment consisting of exposure to equity markets, commodities, real estate and inflation-indexed securities, achieved through derivative instruments.
The net periodic pension costs include the following components:
|
| Spire |
|
| Spire Missouri |
|
| Spire Alabama |
| |||||||||||||||||||||||||||
|
| 2021 |
|
| 2020 |
|
| 2019 |
|
| 2021 |
|
| 2020 |
|
| 2019 |
|
| 2021 |
|
| 2020 |
|
| 2019 |
| |||||||||
Service cost – benefits earned during the period |
| $ | 21.7 |
|
| $ | 22.5 |
|
| $ | 19.3 |
|
| $ | 15.4 |
|
| $ | 15.7 |
|
| $ | 12.4 |
|
| $ | 5.5 |
|
| $ | 6.1 |
|
| $ | 6.2 |
|
Interest cost on projected benefit obligation |
|
| 20.7 |
|
|
| 22.6 |
|
|
| 28.2 |
|
|
| 14.2 |
|
|
| 15.8 |
|
|
| 19.8 |
|
|
| 4.6 |
|
|
| 4.9 |
|
|
| 6.0 |
|
Expected return on plan assets |
|
| (31.6 | ) |
|
| (35.0 | ) |
|
| (36.3 | ) |
|
| (22.5 | ) |
|
| (24.6 | ) |
|
| (25.5 | ) |
|
| (5.8 | ) |
|
| (6.9 | ) |
|
| (7.3 | ) |
Amortization of prior service (credit) cost |
|
| (3.1 | ) |
|
| (2.5 | ) |
|
| (1.1 | ) |
|
| (0.6 | ) |
|
| 0.1 |
|
|
| 0.9 |
|
|
| (2.3 | ) |
|
| (2.4 | ) |
|
| (1.8 | ) |
Amortization of actuarial loss |
|
| 14.9 |
|
|
| 14.4 |
|
|
| 9.3 |
|
|
| 11.0 |
|
|
| 11.3 |
|
|
| 8.7 |
|
|
| 3.9 |
|
|
| 3.1 |
|
|
| 0.8 |
|
Loss on lump-sum settlements and curtailments |
|
| 18.2 |
|
|
| 31.6 |
|
|
| 0 |
|
|
| 11.6 |
|
|
| 26.6 |
|
|
| 0 |
|
|
| 6.6 |
|
|
| 5.0 |
|
|
| 0 |
|
Subtotal |
|
| 40.8 |
|
|
| 53.6 |
|
|
| 19.4 |
|
|
| 29.1 |
|
|
| 44.9 |
|
|
| 16.3 |
|
|
| 12.5 |
|
|
| 9.8 |
|
|
| 3.9 |
|
Regulatory adjustment |
|
| 20.6 |
|
|
| 6.6 |
|
|
| 39.6 |
|
|
| 19.0 |
|
|
| 3.9 |
|
|
| 31.8 |
|
|
| 0.7 |
|
|
| 1.8 |
|
|
| 6.9 |
|
Net pension cost |
| $ | 61.4 |
|
| $ | 60.2 |
|
| $ | 59.0 |
|
| $ | 48.1 |
|
| $ | 48.8 |
|
| $ | 48.1 |
|
| $ | 13.2 |
|
| $ | 11.6 |
|
| $ | 10.8 |
|
| Spire | Spire Missouri | Spire Alabama | |||||||||||||||||||||||||||||||||
| 2017 | 2016 | 2015 | 2017 | 2016 | 2015 | 2017 | 2016 | 2015 | |||||||||||||||||||||||||||
| Service cost – benefits earned during the period | $ | 20.5 | $ | 15.3 | $ | 17.3 | $ | 12.7 | $ | 10.0 | $ | 11.5 | $ | 6.2 | $ | 5.3 | $ | 5.8 | |||||||||||||||||
| Interest cost on projected benefit obligation | 27.9 | 28.0 | 29.5 | 19.5 | 21.7 | 23.3 | 6.1 | 6.3 | 6.2 | ||||||||||||||||||||||||||
| Expected return on plan assets | (38.5 | ) | (34.9 | ) | (37.4 | ) | (28.1 | ) | (26.7 | ) | (29.2 | ) | (7.2 | ) | (8.2 | ) | (8.2 | ) | |||||||||||||||||
| Amortization of prior service cost | 1.0 | 0.4 | 0.5 | 1.0 | 0.4 | 0.5 | — | — | — | ||||||||||||||||||||||||||
| Amortization of actuarial loss | 12.5 | 8.0 | 7.5 | 10.7 | 7.9 | 7.5 | 1.8 | 0.1 | — | ||||||||||||||||||||||||||
| Loss on lump-sum settlements and curtailments | 17.9 | 3.3 | 19.6 | 13.5 | — | 18.0 | 4.6 | 3.3 | 1.6 | ||||||||||||||||||||||||||
| Special termination benefits | 0.9 | 1.6 | — | — | 1.6 | — | — | — | — | ||||||||||||||||||||||||||
| Subtotal | 42.2 | 21.7 | 37.0 | 29.3 | 14.9 | 31.6 | 11.5 | 6.8 | 5.4 | ||||||||||||||||||||||||||
| Regulatory adjustment | (2.4 | ) | 17.8 | (2.1 | ) | (4.1 | ) | 11.7 | (5.2 | ) | 1.8 | 6.1 | 3.1 | ||||||||||||||||||||||
| Net pension cost | $ | 39.8 | $ | 39.5 | $ | 34.9 | $ | 25.2 | $ | 26.6 | $ | 26.4 | $ | 13.3 | $ | 12.9 | $ | 8.5 | |||||||||||||||||
Other changes in plan assets and pension benefit obligations recognized in other comprehensive income or loss include the following:
|
| Spire |
|
| Spire Missouri |
|
| Spire Alabama |
| |||||||||||||||||||||||||||
|
| 2021 |
|
| 2020 |
|
| 2019 |
|
| 2021 |
|
| 2020 |
|
| 2019 |
|
| 2021 |
|
| 2020 |
|
| 2019 |
| |||||||||
Current year actuarial (gain) loss |
| $ | (8.1 | ) |
| $ | 68.0 |
|
| $ | 90.9 |
|
| $ | (0.9 | ) |
| $ | 37.8 |
|
| $ | 59.0 |
|
| $ | (1.5 | ) |
| $ | 24.4 |
|
| $ | 26.3 |
|
Amortization of actuarial loss |
|
| (14.9 | ) |
|
| (14.4 | ) |
|
| (9.3 | ) |
|
| (11.0 | ) |
|
| (11.3 | ) |
|
| (8.7 | ) |
|
| (3.9 | ) |
|
| (3.1 | ) |
|
| (0.8 | ) |
Acceleration of loss recognized due to settlement |
|
| (18.2 | ) |
|
| (31.7 | ) |
|
| 0 |
|
|
| (11.6 | ) |
|
| (26.6 | ) |
|
| 0 |
|
|
| (6.6 | ) |
|
| (5.1 | ) |
|
| 0 |
|
Current year service credit |
|
| (17.9 | ) |
|
| (4.4 | ) |
|
| (10.2 | ) |
|
| (17.9 | ) |
|
| (4.4 | ) |
|
| (3.7 | ) |
|
| 0 |
|
|
| 0 |
|
|
| (6.5 | ) |
Amortization of prior service credit (cost) |
|
| 3.1 |
|
|
| 2.5 |
|
|
| 1.1 |
|
|
| 0.6 |
|
|
| (0.1 | ) |
|
| (0.9 | ) |
|
| 2.3 |
|
|
| 2.4 |
|
|
| 1.8 |
|
Subtotal |
|
| (56.0 | ) |
|
| 20.0 |
|
|
| 72.5 |
|
|
| (40.8 | ) |
|
| (4.6 | ) |
|
| 45.7 |
|
|
| (9.7 | ) |
|
| 18.6 |
|
|
| 20.8 |
|
Regulatory adjustment |
|
| 57.3 |
|
|
| (19.5 | ) |
|
| (71.7 | ) |
|
| 42.1 |
|
|
| 5.1 |
|
|
| (44.9 | ) |
|
| 9.7 |
|
|
| (18.6 | ) |
|
| (20.8 | ) |
Total recognized in OCI |
| $ | 1.3 |
|
| $ | 0.5 |
|
| $ | 0.8 |
|
| $ | 1.3 |
|
| $ | 0.5 |
|
| $ | 0.8 |
|
| $ | 0 |
|
| $ | 0 |
|
| $ | 0 |
|
| Spire | Spire Missouri | Spire Alabama | |||||||||||||||||||||||||||||||||
| 2017 | 2016 | 2015 | 2017 | 2016 | 2015 | 2017 | 2016 | 2015 | |||||||||||||||||||||||||||
| Current year actuarial loss | $ | 14.1 | $ | 46.8 | $ | 48.3 | $ | 14.8 | $ | 21.6 | $ | 26.0 | $ | 3.3 | $ | 25.2 | $ | 22.3 | |||||||||||||||||
| Amortization of actuarial loss | (12.5 | ) | (8.0 | ) | (7.5 | ) | (10.7 | ) | (7.9 | ) | (7.5 | ) | (1.8 | ) | (0.1 | ) | — | ||||||||||||||||||
| Acceleration of loss recognized due to settlement | (18.2 | ) | (3.3 | ) | (19.6 | ) | (13.5 | ) | — | (18.0 | ) | (4.5 | ) | (3.3 | ) | (1.6 | ) | ||||||||||||||||||
| Current year service cost | — | 5.0 | — | — | 5.0 | — | — | — | — | ||||||||||||||||||||||||||
| Current year prior year service cost | (20.7 | ) | — | — | — | — | — | (20.7 | ) | — | — | ||||||||||||||||||||||||
| Amortization of prior service cost | (1.0 | ) | (0.4 | ) | (0.5 | ) | (1.0 | ) | (0.4 | ) | (0.5 | ) | — | — | — | ||||||||||||||||||||
| Subtotal | (38.3 | ) | 40.1 | 20.7 | (10.4 | ) | 18.3 | — | (23.7 | ) | 21.8 | 20.7 | |||||||||||||||||||||||
| Regulatory adjustment | 38.0 | (39.8 | ) | (21.2 | ) | 10.1 | (18.0 | ) | (0.5 | ) | 23.7 | (21.8 | ) | (20.7 | ) | ||||||||||||||||||||
| Total recognized in OCI | $ | (0.3 | ) | $ | 0.3 | $ | (0.5 | ) | $ | (0.3 | ) | $ | 0.3 | $ | (0.5 | ) | $ | — | $ | — | $ | — | |||||||||||||
Spire pension obligations are driven by separate plan and regulatory provisions governing Spire Missouri, Spire Alabama and Spire EnergySouth pension plans.
Pursuant to the provisions of the Missouri Utilities’Spire Missouri’s and Spire Alabama’s pension plans, pension obligations may be satisfied by monthly annuities, lump-sum cash payments, or special termination benefits. Lump-sum payments are recognized as settlements (which can result in gains or losses) only if the total of such payments exceeds 100% of the sum of service and interest costs in a specific year. Special termination benefits, when offered, are also recognized as settlements which can result in gains or losses. Two
In the fiscal year ended September 30, 2021, 2 Spire AlabamaMissouri plans and one1 Spire MissouriAlabama plan met the criteria for settlement recognition, in the fiscal year ended September 30, 2017, requiring re-measurement of the obligation under those plans using updated census data and assumptions for discount rate and mortality. For the remeasurements, the discount rates for the Missouri plans were updated to 3.00% at September 30, 2021 (from 2.85% at September 30, 2020), and the discount rate for the Alabama plan was updated to 3.10% (from 2.95%).Lump-sum payments recognized as settlements during fiscal years 2017, 2016, and 2015 were $62.2year 2021 was $67.5 ($43.544.6 attributable to Spire Missouri and $18.7$22.9 to Spire Alabama), $16.6 (attributable. The Alabama regulatory tariff requires that settlement losses be amortized over the remaining actuarial life of the individuals in the plan, and in fiscal 2021 the amortization periods range from 11.4 years to 11.7 years. Therefore, 0 lump sum settlement expenses were recorded in the fiscal year ended September 30, 2021.
In the fiscal year ended September 30, 2020, 2 Spire Alabama)Missouri plans and 1 Spire Alabama plan met the criteria for settlement recognition, requiring re-measurement of the obligation under those plans using updated census data and assumptions for discount rate and mortality. For the remeasurements, the discount rates for the Missouri plans were updated to 2.85% at September 30, 2020 (from 3.2% at September 30, 2019), and $71.1the discount rate for the Alabama plan was updated to 2.95% (from 3.20%). Lump-sum payments recognized as settlements during fiscal year 2020 was $89.3 ($58.274.5 attributable to Spire Missouri and $12.9$14.8 to Spire Alabama), respectively..
Pursuant to a MoPSC Order, the return on plan assets is based on the market-related value of plan assets implemented prospectively over a four-year period. Gains or losses not yet includible in pension cost are amortized only to the extent that such gain or loss exceeds 10% of the greater of the projected benefit obligation or the market-related value of plan assets. Such excess is amortized over the average remaining service life of active participants. The recovery in rates
Effective April 19, 2018, the pension cost for Spire Missouri’s western territory (Missouri West) included in customer rates was reduced from $9.9 to $5.5 per year, the pension cost included in Spire Missouri’s eastern territory (Missouri East) customer rates was increased from $15.5 to $29.0 per year. Over an amortization period of eight years, Missouri East’s qualifiedEast rates also include the amortization of $173.0 of assets for pension plan is based on an annual allowanceand other postretirement benefits, and Missouri West rates will be reduced by the amortization of $15.5 effective January 1, 2011. The recovery in ratesa $26.2 net liability for Spire Missouri West’s qualified pension plan is based on an annual allowance of approximately $10 effective February 20, 2010. and other postretirement benefits.
The difference between these amounts and pension expense as calculated pursuant to the above and that otherwise would be included in the statements of income and statements of comprehensive income is deferred as a regulatory asset or regulatory liability.
The following table shows the reconciliation of the beginning and ending balances of the pension benefit obligation at September 30:
|
| Spire |
|
| Spire Missouri |
|
| Spire Alabama |
| |||||||||||||||
|
| 2021 |
|
| 2020 |
|
| 2021 |
|
| 2020 |
|
| 2021 |
|
| 2020 |
| ||||||
Benefit obligation, beginning of year |
| $ | 732.6 |
|
| $ | 751.4 |
|
| $ | 505.2 |
|
| $ | 538.4 |
|
| $ | 163.5 |
|
| $ | 152.5 |
|
Service cost |
|
| 21.7 |
|
|
| 22.5 |
|
|
| 15.4 |
|
|
| 15.7 |
|
|
| 5.5 |
|
|
| 6.1 |
|
Interest cost |
|
| 20.7 |
|
|
| 22.6 |
|
|
| 14.2 |
|
|
| 15.8 |
|
|
| 4.6 |
|
|
| 4.9 |
|
Actuarial loss (gain) |
|
| 6.6 |
|
|
| 37.5 |
|
|
| 11.0 |
|
|
| 15.6 |
|
|
| (1.8 | ) |
|
| 18.4 |
|
Plan amendments |
|
| (17.9 | ) |
|
| (4.4 | ) |
|
| (17.9 | ) |
|
| (4.4 | ) |
|
| — |
|
|
| — |
|
Settlement loss |
|
| 12.3 |
|
|
| 16.5 |
|
|
| 8.2 |
|
|
| 16.5 |
|
|
| 4.1 |
|
|
| — |
|
Settlement benefits paid |
|
| (67.6 | ) |
|
| (89.3 | ) |
|
| (44.6 | ) |
|
| (74.5 | ) |
|
| (22.9 | ) |
|
| (14.8 | ) |
Regular benefits paid |
|
| (18.8 | ) |
|
| (24.2 | ) |
|
| (12.5 | ) |
|
| (17.9 | ) |
|
| (3.6 | ) |
|
| (3.6 | ) |
Benefit obligation, end of year |
| $ | 689.6 |
|
| $ | 732.6 |
|
| $ | 479.0 |
|
| $ | 505.2 |
|
| $ | 149.4 |
|
| $ | 163.5 |
|
Accumulated benefit obligation, end of year |
| $ | 673.3 |
|
| $ | 699.3 |
|
| $ | 465.4 |
|
| $ | 473.7 |
|
| $ | 146.9 |
|
| $ | 161.8 |
|
| Spire | Spire Missouri | Spire Alabama | |||||||||||||||||||||
| 2017 | 2016 | 2017 | 2016 | 2017 | 2016 | ||||||||||||||||||
| Benefit obligation, beginning of year | $ | 794.7 | $ | 652.3 | $ | 560.0 | $ | 497.6 | $ | 174.3 | $ | 154.7 | |||||||||||
| Service cost | 20.5 | 15.3 | 12.7 | 10.0 | 6.2 | 5.3 | |||||||||||||||||
| Interest cost | 27.9 | 28.0 | 19.5 | 21.7 | 6.1 | 6.3 | |||||||||||||||||
| Actuarial (gain) loss | (0.9 | ) | 85.8 | (0.5 | ) | 59.2 | 1.6 | 26.6 | |||||||||||||||
| Plan amendments | (20.7 | ) | 5.1 | — | 5.1 | (20.7 | ) | — | |||||||||||||||
| Spire EnergySouth acquisition | — | 60.4 | — | — | — | — | |||||||||||||||||
| Settlement loss | 14.6 | 1.1 | 12.2 | — | 2.4 | 1.1 | |||||||||||||||||
| Special termination benefits | 0.9 | 1.6 | — | 1.6 | — | — | |||||||||||||||||
| Settlement benefits paid | (62.2 | ) | (16.6 | ) | (43.5 | ) | — | (18.7 | ) | (16.6 | ) | ||||||||||||
| Regular benefits paid | (26.0 | ) | (38.3 | ) | (20.8 | ) | (35.2 | ) | (3.0 | ) | (3.1 | ) | |||||||||||
| Benefit obligation, end of year | $ | 748.8 | $ | 794.7 | $ | 539.6 | $ | 560.0 | $ | 148.2 | $ | 174.3 | |||||||||||
| Accumulated benefit obligation, end of year | $ | 701.4 | $ | 724.5 | $ | 500.4 | $ | 517.7 | $ | 142.8 | $ | 149.8 | |||||||||||
Actuarial losses in both 2021 and 2020 were primarily due to the decrease in lump sum discount rates in 1 Spire Missouri plan and the losses on actual lump sum benefit payments compared to assumed amounts across all the plans. Except for Spire Alabama in 2021, these losses more than offset the gains that resulted from the increase in discount rates used to calculate the benefit obligations for each year.
The following table sets forth the reconciliation of the beginning and ending balances of the fair value of plan assets at September 30:
|
| Spire |
|
| Spire Missouri |
|
| Spire Alabama |
| |||||||||||||||
|
| 2021 |
|
| 2020 |
|
| 2021 |
|
| 2020 |
|
| 2021 |
|
| 2020 |
| ||||||
Fair value of plan assets, beginning of year |
| $ | 473.1 |
|
| $ | 521.8 |
|
| $ | 336.2 |
|
| $ | 379.2 |
|
| $ | 88.6 |
|
| $ | 93.3 |
|
Actual return on plan assets |
|
| 58.8 |
|
|
| 21.1 |
|
|
| 42.7 |
|
|
| 19.1 |
|
|
| 9.6 |
|
|
| 1.0 |
|
Employer contributions |
|
| 53.4 |
|
|
| 43.7 |
|
|
| 42.2 |
|
|
| 30.3 |
|
|
| 11.1 |
|
|
| 12.7 |
|
Settlement benefits paid |
|
| (67.6 | ) |
|
| (89.3 | ) |
|
| (44.6 | ) |
|
| (74.5 | ) |
|
| (22.9 | ) |
|
| (14.8 | ) |
Regular benefits paid |
|
| (18.8 | ) |
|
| (24.2 | ) |
|
| (12.5 | ) |
|
| (17.9 | ) |
|
| (3.6 | ) |
|
| (3.6 | ) |
Fair value of plan assets, end of year |
| $ | 498.9 |
|
| $ | 473.1 |
|
| $ | 364.0 |
|
| $ | 336.2 |
|
| $ | 82.8 |
|
| $ | 88.6 |
|
Funded status of plans, end of year |
| $ | (190.7 | ) |
| $ | (259.5 | ) |
| $ | (115.0 | ) |
| $ | (169.0 | ) |
| $ | (66.6 | ) |
| $ | (74.9 | ) |
| Spire | Spire Missouri | Spire Alabama | |||||||||||||||||||||
| 2017 | 2016 | 2017 | 2016 | 2017 | 2016 | ||||||||||||||||||
| Fair value of plan assets, beginning of year | $ | 540.5 | $ | 448.9 | $ | 395.7 | $ | 339.9 | $ | 100.0 | $ | 109.0 | |||||||||||
| Actual return on plan assets | 38.0 | 75.1 | 25.1 | 64.4 | 7.7 | 10.7 | |||||||||||||||||
| Employer contributions | 41.3 | 26.6 | 29.4 | 26.6 | 11.9 | — | |||||||||||||||||
| Spire EnergySouth acquisition | — | 44.8 | — | — | — | — | |||||||||||||||||
| Settlement benefits paid | (62.2 | ) | (16.6 | ) | (43.5 | ) | — | (18.7 | ) | (16.6 | ) | ||||||||||||
| Regular benefits paid | (26.0 | ) | (38.3 | ) | (20.8 | ) | (35.2 | ) | (3.0 | ) | (3.1 | ) | |||||||||||
| Fair value of plan assets, end of year | $ | 531.6 | $ | 540.5 | $ | 385.9 | $ | 395.7 | $ | 97.9 | $ | 100.0 | |||||||||||
| Funded status of plans, end of year | $ | (217.2 | ) | $ | (254.2 | ) | $ | (153.7 | ) | $ | (164.3 | ) | $ | (50.3 | ) | $ | (74.3 | ) | |||||
The following table sets forth the amounts recognized in the balance sheets at September 30:
|
| Spire |
|
| Spire Missouri |
|
| Spire Alabama |
| |||||||||||||||
|
| 2021 |
|
| 2020 |
|
| 2021 |
|
| 2020 |
|
| 2021 |
|
| 2020 |
| ||||||
Current liabilities |
| $ | (0.8 | ) |
| $ | (0.6 | ) |
| $ | (0.8 | ) |
| $ | (0.6 | ) |
| $ | 0 |
|
| $ | 0 |
|
Noncurrent liabilities |
|
| (189.9 | ) |
|
| (258.9 | ) |
|
| (114.2 | ) |
|
| (168.4 | ) |
|
| (66.6 | ) |
|
| (74.9 | ) |
Total |
| $ | (190.7 | ) |
| $ | (259.5 | ) |
| $ | (115.0 | ) |
| $ | (169.0 | ) |
| $ | (66.6 | ) |
| $ | (74.9 | ) |
| Spire | Spire Missouri | Spire Alabama | |||||||||||||||||||||
| 2017 | 2016 | 2017 | 2016 | 2017 | 2016 | ||||||||||||||||||
| Current liabilities | $ | (0.5 | ) | $ | (0.6 | ) | $ | (0.5 | ) | $ | (0.6 | ) | $ | — | $ | — | |||||||
| Noncurrent liabilities | (216.7 | ) | (253.6 | ) | (153.2 | ) | (163.7 | ) | (50.3 | ) | (74.3 | ) | |||||||||||
| Total | $ | (217.2 | ) | $ | (254.2 | ) | $ | (153.7 | ) | $ | (164.3 | ) | $ | (50.3 | ) | $ | (74.3 | ) | |||||
Pre-tax amounts recognized in accumulated other comprehensive loss not yet recognized as components of net periodic pension cost consist of:
|
| Spire |
|
| Spire Missouri |
|
| Spire Alabama |
| |||||||||||||||
|
| 2021 |
|
| 2020 |
|
| 2021 |
|
| 2020 |
|
| 2021 |
|
| 2020 |
| ||||||
Net actuarial loss |
| $ | 194.6 |
|
| $ | 235.6 |
|
| $ | 129.6 |
|
| $ | 152.9 |
|
| $ | 66.1 |
|
| $ | 78.1 |
|
Prior service credit |
|
| (40.3 | ) |
|
| (25.6 | ) |
|
| (20.1 | ) |
|
| (2.8 | ) |
|
| (18.7 | ) |
|
| (21.1 | ) |
Subtotal |
|
| 154.3 |
|
|
| 210.0 |
|
|
| 109.5 |
|
|
| 150.1 |
|
|
| 47.4 |
|
|
| 57.0 |
|
Adjustments for amounts included in regulatory assets |
|
| (149.5 | ) |
|
| (206.7 | ) |
|
| (104.7 | ) |
|
| (146.8 | ) |
|
| (47.4 | ) |
|
| (57.0 | ) |
Total |
| $ | 4.8 |
|
| $ | 3.3 |
|
| $ | 4.8 |
|
| $ | 3.3 |
|
| $ | 0 |
|
| $ | 0 |
|
| Spire | Spire Missouri | Spire Alabama | |||||||||||||||||||||
| 2017 | 2016 | 2017 | 2016 | 2017 | 2016 | ||||||||||||||||||
| Net actuarial loss | $ | 163.0 | $ | 179.4 | $ | 126.2 | $ | 135.5 | $ | 40.9 | $ | 43.9 | |||||||||||
| Prior service (credit) cost | (13.4 | ) | 8.2 | 7.3 | 8.2 | (20.7 | ) | — | |||||||||||||||
| Subtotal | 149.6 | 187.6 | 133.5 | 143.7 | 20.2 | 43.9 | |||||||||||||||||
| Adjustments for amounts included in regulatory assets | (147.1 | ) | (184.8 | ) | (131.0 | ) | (140.9 | ) | (20.2 | ) | (43.9 | ) | |||||||||||
| Total | $ | 2.5 | $ | 2.8 | $ | 2.5 | $ | 2.8 | $ | — | $ | — | |||||||||||
| Spire | Spire Missouri | Spire Alabama | |||||||||
| Amortization of net actuarial loss | $ | 12.6 | $ | 10.5 | $ | 2.1 | |||||
| Amortization of prior service (credit) cost | (0.9 | ) | 0.9 | (1.8 | ) | ||||||
| Subtotal | 11.7 | 11.4 | 0.3 | ||||||||
| Regulatory adjustment | (11.4 | ) | (11.1 | ) | (0.3 | ) | |||||
| Total | $ | 0.3 | $ | 0.3 | $ | — | |||||
The assumptions used to calculate net periodic pension costs for Spire Missouri are as follows:
|
| 2021 |
|
| 2020 |
|
| 2019 |
|
Weighted average discount rate - Spire Missouri East plan |
| 2.85% |
|
| 3.20% |
|
| 4.30% |
|
Weighted average discount rate - Spire Missouri West plan |
| 2.75% |
|
| 3.15% |
|
| 4.35% |
|
Weighted average rate of future compensation increase |
| 3.00% |
|
| 3.00% |
|
| 3.00% |
|
Expected long-term rate of return on plan assets |
| 6.75% |
|
| 7.25% |
|
| 7.50% |
|
| 2017 | 2016 | 2015 | |||
| Weighted average discount rate - Spire Missouri East plans | 3.50% | 4.40% | 4.30% | ||
| Weighted average discount rate - Spire Missouri West plans | 3.50% | 4.50% | 4.45% | ||
| Weighted average rate of future compensation increase | 3.00% | 3.00% | 3.00% | ||
| Expected long-term rate of return on plan assets | 7.75% | 7.75% | 7.75% | ||
The assumptions used to calculate net periodic pension costs for Spire Alabama are as follows:
|
| 2021 |
|
| 2020 |
|
| 2019 |
|
Weighted average discount rate |
| 2.95%/2.80% |
|
| 3.25%/3.20% |
|
| 4.35% |
|
Weighted average rate of future compensation increase |
| 3.00% |
|
| 3.00% |
|
| 3.00% |
|
Expected long-term rate of return on plan assets |
| 6.75% |
|
| 7.25% |
|
| 7.25% |
|
| 2017 | 2016 | 2015 | |||
| Weighted average discount rate | 3.45%/3.50% | 4.25%/4.30% | 4.15%/4.25% | ||
| Weighted average rate of future compensation increase | 3.00% | 3.00% | 2.92% | ||
| Expected long-term rate of return on plan assets | 7.25% | 7.50% | 7.00%/7.25% | ||
The weighted average discount rate is based on long-term, high quality bond indices at the measurement date. The expected long-term rate of return on plan assets is based on historical and projected rates of return for current and planned asset classes in the investment portfolio. Assumed projected rates of return for each asset class were selected after analyzing historical experience and future expectations of the returns. The overall expected rate of return for the portfolio was developed based on the target allocation for each class.
The assumptions used to calculate the benefit obligations are as follows:
|
| 2021 |
|
| 2020 |
|
Weighted average discount rate - Spire Missouri East plan |
| 3.00% |
|
| 2.85% |
|
Weighted average discount rate - Spire Missouri West plan |
| 3.00% |
|
| 2.75% |
|
Weighted average discount rate - Spire Alabama plans |
| 3.1%/3.0% |
|
| 2.95%/2.80% |
|
Weighted average rate of future compensation increase |
| 3.00% |
|
| 3.00% |
|
Cash balance interest crediting rate - Spire Alabama / Spire Missouri |
| 4.25% |
|
| 4.50% |
|
| 2017 | 2016 | ||
| Weighted average discount rate - Spire Missouri East plans | 3.75% | 3.50% | |
| Weighted average discount rate - Spire Missouri West plans | 3.70% | 3.50% | |
| Weighted average discount rate - Spire Alabama plans | 3.65%/3.70% | 3.45%/3.50% | |
| Weighted average rate of future compensation increase | 3.00% | 3.00% | |
Following are the year-end projected benefit obligation, accumulated benefit obligation, and fair value of plan assets for plans that have a projected benefit obligation and an accumulated benefit obligation in excess of plan assets:
|
| Spire |
|
| Spire Missouri |
|
| Spire Alabama |
| |||||||||||||||
|
| 2021 |
|
| 2020 |
|
| 2021 |
|
| 2020 |
|
| 2021 |
|
| 2020 |
| ||||||
Projected benefit obligation |
| $ | 689.6 |
|
| $ | 732.6 |
|
| $ | 479.0 |
|
| $ | 505.2 |
|
| $ | 149.4 |
|
| $ | 163.5 |
|
Accumulated benefit obligation |
|
| 673.3 |
|
|
| 699.3 |
|
|
| 465.4 |
|
|
| 473.7 |
|
|
| 146.9 |
|
|
| 161.8 |
|
Fair value of plan assets |
|
| 498.9 |
|
|
| 473.1 |
|
|
| 364.0 |
|
|
| 336.2 |
|
|
| 82.8 |
|
|
| 88.6 |
|
| Spire | Spire Missouri | Spire Alabama | |||||||||||||||||||||
| 2017 | 2016 | 2017 | 2016 | 2017 | 2016 | ||||||||||||||||||
| Projected benefit obligation | $ | 748.8 | $ | 794.7 | $ | 539.6 | $ | 560.0 | $ | 148.2 | $ | 174.3 | |||||||||||
| Accumulated benefit obligation | 701.4 | 724.5 | 500.4 | 517.7 | 142.8 | 149.8 | |||||||||||||||||
| Fair value of plan assets | 531.6 | 540.5 | 385.9 | 395.7 | 97.9 | 100.0 | |||||||||||||||||
Following are the targeted and actual plan assets by category as of September 30 of each year for Spire Missouri and Spire Alabama:
Spire Missouri |
| 2021 Target |
|
| 2021 Actual |
|
| 2020 Target |
|
| 2020 Actual |
| ||||
Return seeking assets |
|
| 70.0 | % |
|
| 74.5 | % |
|
| 70.0 | % |
|
| 70.0 | % |
Liability hedging assets |
|
| 30.0 | % |
|
| 23.1 | % |
|
| 30.0 | % |
|
| 27.0 | % |
Other |
|
| 0 | % |
|
| 2.4 | % |
|
| 0 | % |
|
| 3.0 | % |
Total |
|
| 100.0 | % |
|
| 100.0 | % |
|
| 100.0 | % |
|
| 100.0 | % |
Spire Alabama |
| 2021 Target |
|
| 2021 Actual |
|
| 2020 Target |
|
| 2020 Actual |
| ||||
Return seeking assets |
|
| 70.0 | % |
|
| 72.8 | % |
|
| 70.0 | % |
|
| 71.0 | % |
Liability hedging assets |
|
| 30.0 | % |
|
| 25.5 | % |
|
| 30.0 | % |
|
| 27.0 | % |
Other* |
|
| 0 | % |
|
| 1.7 | % |
|
| 0 | % |
|
| 2.0 | % |
Total |
|
| 100.0 | % |
|
| 100.0 | % |
|
| 100.0 | % |
|
| 100.0 | % |
| Spire Missouri | 2017 Target | 2017 Actual | 2016 Target | 2016 Actual | |||||||
| Equity markets | 56.4 | % | 56.8 | % | 56.2 | % | 56.9 | % | |||
| Debt securities | 43.6 | % | 42.0 | % | 43.8 | % | 43.1 | % | |||
| Cash equivalents | — | % | 1.2 | % | — | % | — | % | |||
| Total | 100.0 | % | 100.0 | % | 100.0 | % | 100.0 | % | |||
| Spire Alabama | 2017 Target | 2017 Actual | 2016 Target | 2016 Actual | |||||||
| Equity markets | 60.0 | % | 58.5 | % | 60.0 | % | 59.2 | % | |||
| Debt securities | 29.0 | % | 28.7 | % | 29.0 | % | 28.8 | % | |||
| Other* | 11.0 | % | 12.8 | % | 11.0 | % | 12.0 | % | |||
| Total | 100.0 | % | 100.0 | % | 100.0 | % | 100.0 | % | |||
* | |
Includes cash |
The Spire Missouri’s investment policies are designed to maximize, toInc. Retirement Plans Committee is responsible for the extent possible, the funded statusadministration of the various plans, over time, and minimize volatilityall payments under the plans require direction of funding and costs.that committee. The policy seeksSpire Inc. Defined Benefit Plan Investment Review Committee utilizes an Outsourced Chief Investment Officer (OCIO) model where investment decisions are outsourced to maximize investment returns consistent with these objectives and Spire Missouri’s tolerance for risk. The duration of plan liabilities and the impact of potential changesconsultants (Willis Towers Watson), who in asset values on the funded status are fundamental considerations in the selection of plan assets. Outside investment management specialists are utilized in each asset class. Such specialists are provided with guidelines, where appropriate, designed to ensure that the investment portfolio is managed in accordanceturn become co-fiduciaries with the policy. The policy seeks to avoid significant concentrations of risk by investing in a diversified portfolio of assets, currently including a growth (equity) component and a liability-driven (debt) component. Investments in corporate, US government and agencies, and, to a lesser extent, international debt securities seek to provide duration matching with plan liabilities, and typically have investment grade ratings and reflect allocations across various entities and industries. There are also exposures to additional asset types incommittee.
For all plans, the target portfolio: commodities, real estate and inflation-indexed securities. For the Missouri East plan, the investment policy permits the use of derivative instruments, which may be used to achieve the desired market exposure of an index, adjust portfolio duration, or rebalance the total portfolio to the target asset allocation. The growth strategy utilizes a combination of derivative instruments and debt securities to achieve diversified exposure to equity and other markets while generating returns from the fixed-income investments and providing further duration matching with the liabilities. Performance and compliance with the guidelines is regularly monitored. The policy calls for increased allocations to debt securities as the funded status improves.
Following are expected pension benefit payments for the succeeding five fiscal years, and in aggregate for the five fiscal years thereafter, for Spire, Spire Missouri, and Spire Alabama:
|
| 2022 |
|
| 2023 |
|
| 2024 |
|
| 2025 |
|
| 2026 |
|
| 2027- 2031 |
| ||||||
Spire |
| $ | 64.3 |
|
| $ | 59.2 |
|
| $ | 57.8 |
|
| $ | 52.4 |
|
| $ | 50.6 |
|
| $ | 236.8 |
|
Spire Missouri |
|
| 46.6 |
|
|
| 42.2 |
|
|
| 41.9 |
|
|
| 36.9 |
|
|
| 34.9 |
|
|
| 164.3 |
|
Spire Alabama |
|
| 14.7 |
|
|
| 13.9 |
|
|
| 12.7 |
|
|
| 12.2 |
|
|
| 12.3 |
|
|
| 54.0 |
|
| 2018 | 2019 | 2020 | 2021 | 2022 | 2023- 2027 | ||||||||||||||||||
| Spire | $ | 63.5 | $ | 63.2 | $ | 63.2 | $ | 58.1 | $ | 57.9 | $ | 281.1 | |||||||||||
| Spire Missouri | 50.7 | 49.5 | 49.1 | 43.5 | 42.1 | 198.1 | |||||||||||||||||
| Spire Alabama | 10.3 | 11.1 | 11.5 | 11.9 | 13.0 | 67.8 | |||||||||||||||||
The funding policy of Spire Missouri and Spire Alabama is to contribute an amount not less than the minimum required by government funding standards nor more than the maximum deductible amount for federal income tax purposes. Spire MissouriMissouri’s contributions to the pension plans in fiscal 20182022 are anticipated to be $35.5$37.6 into the qualified trusts, and $0.5$0.8 into the non-qualified plans. Spire Alabama had no requiredAlabama’s contributions to the qualified pension plans during 2017. Additionally, it is notin fiscal 2021 are anticipated that the funded status ofto be $14.4 into the qualified pension plans will fall below statutory thresholds requiring accelerated funding or constraints on benefit levels or plan administration. During fiscal 2017, Spire Alabama made discretionary contributions to the qualified pension plans totaling $11.9; none are expected in fiscal 2018.
Other Postretirement Benefits
Spire and the Utilities provide certain life insurance benefits at retirement. Spire Missouri plans provide for medical insurance after early retirement until age 65. For retirements prior to January 1, 2015, the Spire Missouri West plans provided medical insurance after retirement until death. For retirements after January 1, 2015, theThe Spire Missouri WestAlabama plans provide medical insurance after early retirement until age 65. Under the Spire Alabama plans, medical insurance is currently available upon retirement until death for certain retirees depending on the type of employee and the date the employee was originally hired.
Net periodic postretirement benefit costs consist of the following components:
|
| Spire |
|
| Spire Missouri |
|
| Spire Alabama |
| |||||||||||||||||||||||||||
|
| 2021 |
|
| 2020 |
|
| 2019 |
|
| 2021 |
|
| 2020 |
|
| 2019 |
|
| 2021 |
|
| 2020 |
|
| 2019 |
| |||||||||
Service cost – benefits earned during the period |
| $ | 7.3 |
|
| $ | 5.9 |
|
| $ | 7.4 |
|
| $ | 6.2 |
|
| $ | 5.3 |
|
| $ | 6.8 |
|
| $ | 0.9 |
|
| $ | 0.4 |
|
| $ | 0.4 |
|
Interest cost on accumulated postretirement benefit obligation |
|
| 6.0 |
|
|
| 6.3 |
|
|
| 9.0 |
|
|
| 4.5 |
|
|
| 4.7 |
|
|
| 6.9 |
|
|
| 1.3 |
|
|
| 1.4 |
|
|
| 1.8 |
|
Expected return on plan assets |
|
| (16.1 | ) |
|
| (16.7 | ) |
|
| (16.2 | ) |
|
| (10.9 | ) |
|
| (11.4 | ) |
|
| (11.1 | ) |
|
| (4.9 | ) |
|
| (5.0 | ) |
|
| (4.8 | ) |
Amortization of prior service cost (credit) |
|
| 1.0 |
|
|
| (0.5 | ) |
|
| (0.1 | ) |
|
| 0.7 |
|
|
| (0.2 | ) |
|
| 0.3 |
|
|
| 0.3 |
|
|
| (0.3 | ) |
|
| (0.4 | ) |
Amortization of actuarial gain |
|
| (1.6 | ) |
|
| (2.0 | ) |
|
| (0.5 | ) |
|
| (1.5 | ) |
|
| (2.0 | ) |
|
| (0.5 | ) |
|
| 0 |
|
|
| 0 |
|
|
| 0 |
|
Subtotal |
|
| (3.4 | ) |
|
| (7.0 | ) |
|
| (0.4 | ) |
|
| (1.0 | ) |
|
| (3.6 | ) |
|
| 2.4 |
|
|
| (2.4 | ) |
|
| (3.5 | ) |
|
| (3.0 | ) |
Regulatory adjustment |
|
| 13.2 |
|
|
| 16.0 |
|
|
| 10.0 |
|
|
| 15.0 |
|
|
| 17.7 |
|
|
| 11.7 |
|
|
| (1.8 | ) |
|
| (1.8 | ) |
|
| (1.8 | ) |
Net postretirement benefit cost |
| $ | 9.8 |
|
| $ | 9.0 |
|
| $ | 9.6 |
|
| $ | 14.0 |
|
| $ | 14.1 |
|
| $ | 14.1 |
|
| $ | (4.2 | ) |
| $ | (5.3 | ) |
| $ | (4.8 | ) |
| Spire | Spire Missouri | Spire Alabama | |||||||||||||||||||||||||||||||||
| 2017 | 2016 | 2015 | 2017 | 2016 | 2015 | 2017 | 2016 | 2015 | |||||||||||||||||||||||||||
| Service cost – benefits earned during the period | $ | 11.0 | $ | 10.9 | $ | 12.8 | $ | 10.4 | $ | 10.6 | $ | 12.3 | $ | 0.3 | $ | 0.3 | $ | 0.5 | |||||||||||||||||
| Interest cost on accumulated postretirement benefit obligation | 8.6 | 10.2 | 11.2 | 6.8 | 8.1 | 8.6 | 1.6 | 2.1 | 2.6 | ||||||||||||||||||||||||||
| Expected return on plan assets | (13.6 | ) | (13.5 | ) | (13.2 | ) | (9.0 | ) | (8.5 | ) | (8.1 | ) | (4.4 | ) | (5.0 | ) | (5.1 | ) | |||||||||||||||||
| Amortization of prior service cost (credit) | — | 0.3 | 0.8 | 0.2 | 0.3 | 0.8 | (0.2 | ) | — | — | |||||||||||||||||||||||||
| Amortization of actuarial loss (gain) | 2.5 | 3.6 | 5.1 | 2.6 | 3.8 | 5.1 | (0.1 | ) | (0.2 | ) | — | ||||||||||||||||||||||||
| Special termination benefits | — | 2.6 | — | — | 2.6 | — | — | — | — | ||||||||||||||||||||||||||
| Subtotal | 8.5 | 14.1 | 16.7 | 11.0 | 16.9 | 18.7 | (2.8 | ) | (2.8 | ) | (2.0 | ) | |||||||||||||||||||||||
| Regulatory adjustment | (3.2 | ) | (6.6 | ) | (11.0 | ) | (1.5 | ) | (4.8 | ) | (9.2 | ) | (1.8 | ) | (1.8 | ) | (1.8 | ) | |||||||||||||||||
| Net postretirement benefit cost | $ | 5.3 | $ | 7.5 | $ | 5.7 | $ | 9.5 | $ | 12.1 | $ | 9.5 | $ | (4.6 | ) | $ | (4.6 | ) | $ | (3.8 | ) | ||||||||||||||
Other changes in plan assets and postretirement benefit obligations recognized in OCI include the following:
|
| Spire |
|
| Spire Missouri |
|
| Spire Alabama |
| |||||||||||||||||||||||||||
|
| 2021 |
|
| 2020 |
|
| 2019 |
|
| 2021 |
|
| 2020 |
|
| 2019 |
|
| 2021 |
|
| 2020 |
|
| 2019 |
| |||||||||
Current year actuarial (gain) loss |
| $ | (41.0 | ) |
| $ | (7.3 | ) |
| $ | (12.2 | ) |
| $ | (29.0 | ) |
| $ | (7.6 | ) |
| $ | (17.3 | ) |
| $ | (9.9 | ) |
| $ | 1.1 |
|
| $ | 5.5 |
|
Amortization of actuarial gain |
|
| 1.6 |
|
|
| 2.0 |
|
|
| 0.5 |
|
|
| 1.5 |
|
|
| 2.0 |
|
|
| 0.5 |
|
|
| 0 |
|
|
| 0 |
|
|
| 0 |
|
Current year prior service credit |
|
| 0 |
|
|
| 15.8 |
|
|
| 5.5 |
|
|
| 0 |
|
|
| 9.5 |
|
|
| 4.9 |
|
|
| 0 |
|
|
| 6.3 |
|
|
| 0.6 |
|
Amortization of current year service cost |
|
| 0 |
|
|
| 0 |
|
|
| 0.4 |
|
|
| 0 |
|
|
| 0 |
|
|
| 0 |
|
|
| 0 |
|
|
| 0 |
|
|
| 0.4 |
|
Amortization of prior service (cost) credit |
|
| (1.0 | ) |
|
| 0.5 |
|
|
| (0.3 | ) |
|
| (0.7 | ) |
|
| 0.2 |
|
|
| (0.3 | ) |
|
| (0.3 | ) |
|
| 0.3 |
|
|
| 0 |
|
Subtotal |
|
| (40.4 | ) |
|
| 11.0 |
|
|
| (6.1 | ) |
|
| (28.2 | ) |
|
| 4.1 |
|
|
| (12.2 | ) |
|
| (10.2 | ) |
|
| 7.7 |
|
|
| 6.5 |
|
Regulatory adjustment |
|
| 40.4 |
|
|
| (11.0 | ) |
|
| 6.1 |
|
|
| 28.2 |
|
|
| (4.1 | ) |
|
| 12.2 |
|
|
| 10.2 |
|
|
| (7.7 | ) |
|
| (6.5 | ) |
Total recognized in OCI |
| $ | 0 |
|
| $ | 0 |
|
| $ | 0 |
|
| $ | 0 |
|
| $ | 0 |
|
| $ | 0 |
|
| $ | 0 |
|
| $ | 0 |
|
| $ | 0 |
|
| Spire | Spire Missouri | Spire Alabama | |||||||||||||||||||||||||||||||||
| 2017 | 2016 | 2015 | 2017 | 2016 | 2015 | 2017 | 2016 | 2015 | |||||||||||||||||||||||||||
| Current year actuarial (gain) loss | $ | (34.1 | ) | $ | 0.8 | $ | (8.5 | ) | $ | (28.5 | ) | $ | 1.4 | $ | (2.4 | ) | $ | (4.5 | ) | $ | (0.6 | ) | $ | (6.1 | ) | ||||||||||
| Amortization of actuarial (loss) gain | (2.5 | ) | (3.6 | ) | (5.1 | ) | (2.6 | ) | (3.8 | ) | (5.1 | ) | 0.1 | 0.2 | — | ||||||||||||||||||||
| Current year prior service credit | (1.4 | ) | (1.8 | ) | (4.9 | ) | — | — | (4.9 | ) | (1.4 | ) | (1.8 | ) | — | ||||||||||||||||||||
| Amortization of prior service (cost) credit | — | (0.3 | ) | (0.8 | ) | (0.2 | ) | (0.3 | ) | (0.8 | ) | 0.2 | — | — | |||||||||||||||||||||
| Subtotal | (38.0 | ) | (4.9 | ) | (19.3 | ) | (31.3 | ) | (2.7 | ) | (13.2 | ) | (5.6 | ) | (2.2 | ) | (6.1 | ) | |||||||||||||||||
| Regulatory adjustment | 38.0 | 4.9 | 19.3 | 31.3 | 2.7 | 13.2 | 5.6 | 2.2 | 6.1 | ||||||||||||||||||||||||||
| Total recognized in OCI | $ | — | $ | — | $ | — | $ | — | $ | — | $ | — | $ | — | $ | — | $ | — | |||||||||||||||||
Pursuant to a MoPSC Order, the return on plan assets is based on the market-related value of plan assets implemented prospectively over a four-year period. Gains and losses not yet includible in postretirement benefit cost are amortized only to the extent that such gain or loss exceeds 10% of the greater of the accumulated postretirement benefit obligation or the market-related value of plan assets. Such excess is amortized over the average remaining service life of active participants. TheEffective April 18, 2018, the recovery in rates for Spire Missouri’s postretirement benefit plans is based on an annual allowance of $9.5 effective January 1, 2011. $8.6.The difference between these amounts and postretirement benefit cost based on the above and that otherwise would be included in the statements of income and statements of comprehensive income is deferred as a regulatory asset or regulatory liability.
The following table sets forth the reconciliation of the beginning and ending balances of the postretirement benefit obligation at September 30:
|
| Spire |
|
| Spire Missouri |
|
| Spire Alabama |
| |||||||||||||||
|
| 2021 |
|
| 2020 |
|
| 2021 |
|
| 2020 |
|
| 2021 |
|
| 2020 |
| ||||||
Benefit obligation, beginning of year |
| $ | 212.3 |
|
| $ | 197.3 |
|
| $ | 158.4 |
|
| $ | 147.9 |
|
| $ | 48.3 |
|
| $ | 43.4 |
|
Service cost |
|
| 7.3 |
|
|
| 5.9 |
|
|
| 6.2 |
|
|
| 5.3 |
|
|
| 0.9 |
|
|
| 0.4 |
|
Interest cost |
|
| 6.0 |
|
|
| 6.3 |
|
|
| 4.5 |
|
|
| 4.7 |
|
|
| 1.3 |
|
|
| 1.4 |
|
Actuarial (gain) loss |
|
| (7.5 | ) |
|
| 0.2 |
|
|
| (6.7 | ) |
|
| 1.7 |
|
|
| 0.7 |
|
|
| (0.7 | ) |
Plan amendments |
|
| — |
|
|
| 15.8 |
|
|
| — |
|
|
| 9.5 |
|
|
| — |
|
|
| 6.3 |
|
Benefits paid |
|
| (13.9 | ) |
|
| (13.2 | ) |
|
| (10.7 | ) |
|
| (10.7 | ) |
|
| (3.2 | ) |
|
| (2.5 | ) |
Benefit obligation, end of year |
| $ | 204.2 |
|
| $ | 212.3 |
|
| $ | 151.7 |
|
| $ | 158.4 |
|
| $ | 48.0 |
|
| $ | 48.3 |
|
In fiscal 2021, the actuarial gains for Spire and Spire Missouri were driven by the increase in the discount rate used to calculate the benefit obligation. For Spire Alabama, this gain was more than offset by the loss associated with an update to the trend assumption. In fiscal 2020 the actuarial losses for Spire and Spire Missouri were driven by the decrease in the discount rate used to calculate the benefit obligation. For Spire Alabama, this loss was more than offset by the gain due to the elimination of the assumed liability load from the Cadillac Plan excise tax.
| Spire | Spire Missouri | Spire Alabama | |||||||||||||||||||||
| 2017 | 2016 | 2017 | 2016 | 2017 | 2016 | ||||||||||||||||||
| Benefit obligation, beginning of year | $ | 259.2 | $ | 239.2 | $ | 207.9 | $ | 191.9 | $ | 45.4 | $ | 47.3 | |||||||||||
| Service cost | 11.0 | 10.9 | 10.4 | 10.6 | 0.3 | 0.3 | |||||||||||||||||
| Interest cost | 8.6 | 10.2 | 6.8 | 8.1 | 1.6 | 2.1 | |||||||||||||||||
| Actuarial (gain) loss | (22.1 | ) | 7.1 | (20.9 | ) | 6.7 | — | 0.4 | |||||||||||||||
| Plan amendments | (1.4 | ) | (1.8 | ) | — | — | (1.4 | ) | (1.8 | ) | |||||||||||||
| Spire EnergySouth acquisition | — | 5.9 | — | — | — | — | |||||||||||||||||
| Special termination benefits | — | 2.6 | — | 2.6 | — | — | |||||||||||||||||
| Curtailments | 0.4 | — | — | — | — | — | |||||||||||||||||
| Retiree drug subsidy program | 0.3 | 0.2 | 0.3 | — | — | 0.2 | |||||||||||||||||
| Gross benefits paid | (17.5 | ) | (15.1 | ) | (12.0 | ) | (12.0 | ) | (5.3 | ) | (3.1 | ) | |||||||||||
| Benefit obligation, end of year | $ | 238.5 | $ | 259.2 | $ | 192.5 | $ | 207.9 | $ | 40.6 | $ | 45.4 | |||||||||||
The following table sets forth the reconciliation of the beginning and ending balances of the fair value of plan assets at September 30:
|
| Spire |
|
| Spire Missouri |
|
| Spire Alabama |
| |||||||||||||||
|
| 2021 |
|
| 2020 |
|
| 2021 |
|
| 2020 |
|
| 2021 |
|
| 2020 |
| ||||||
Fair value of plan assets at beginning of year |
| $ | 291.0 |
|
| $ | 279.8 |
|
| $ | 199.2 |
|
| $ | 188.9 |
|
| $ | 87.0 |
|
| $ | 86.4 |
|
Actual return on plan assets |
|
| 49.7 |
|
|
| 24.2 |
|
|
| 33.1 |
|
|
| 20.8 |
|
|
| 15.6 |
|
|
| 3.1 |
|
Employer contributions |
|
| 0.1 |
|
|
| 0.2 |
|
|
| 0.1 |
|
|
| 0.2 |
|
|
| — |
|
|
| — |
|
Benefits paid |
|
| (13.9 | ) |
|
| (13.2 | ) |
|
| (10.7 | ) |
|
| (10.7 | ) |
|
| (3.2 | ) |
|
| (2.5 | ) |
Fair value of plan assets, end of year |
| $ | 326.9 |
|
| $ | 291.0 |
|
| $ | 221.7 |
|
| $ | 199.2 |
|
| $ | 99.4 |
|
| $ | 87.0 |
|
Funded status of plans, end of year |
| $ | 122.7 |
|
| $ | 78.7 |
|
| $ | 70.0 |
|
| $ | 40.8 |
|
| $ | 51.4 |
|
| $ | 38.7 |
|
| Spire | Spire Missouri | Spire Alabama | |||||||||||||||||||||
| 2017 | 2016 | 2017 | 2016 | 2017 | 2016 | ||||||||||||||||||
| Fair value of plan assets at beginning of year | $ | 246.4 | $ | 223.3 | $ | 159.7 | $ | 143.6 | $ | 82.8 | $ | 79.7 | |||||||||||
| Actual return on plan assets | 26.2 | 19.9 | 16.8 | 13.8 | 8.9 | 6.2 | |||||||||||||||||
| Employer contributions | 10.4 | 14.3 | 10.4 | 14.3 | — | — | |||||||||||||||||
| Spire EnergySouth acquisition | — | 4.0 | — | — | — | — | |||||||||||||||||
| Gross benefits paid | (17.5 | ) | (15.1 | ) | (12.0 | ) | (12.0 | ) | (5.3 | ) | (3.1 | ) | |||||||||||
| Fair value of plan assets, end of year | $ | 265.5 | $ | 246.4 | $ | 174.9 | $ | 159.7 | $ | 86.4 | $ | 82.8 | |||||||||||
| Funded status of plans, end of year | $ | 27.0 | $ | (12.8 | ) | $ | (17.6 | ) | $ | (48.2 | ) | $ | 45.8 | $ | 37.4 | ||||||||
The following table sets forth the amounts recognized in the balance sheets at September 30:
|
| Spire |
|
| Spire Missouri |
|
| Spire Alabama |
| |||||||||||||||
|
| 2021 |
|
| 2020 |
|
| 2021 |
|
| 2020 |
|
| 2021 |
|
| 2020 |
| ||||||
Noncurrent assets |
| $ | 170.2 |
|
| $ | 129.0 |
|
| $ | 117.5 |
|
| $ | 90.3 |
|
| $ | 51.4 |
|
| $ | 38.7 |
|
Current liabilities |
|
| (0.5 | ) |
|
| (0.5 | ) |
|
| (0.5 | ) |
|
| (0.5 | ) |
|
| 0 |
|
|
| 0 |
|
Noncurrent liabilities |
|
| (47.0 | ) |
|
| (49.8 | ) |
|
| (47.0 | ) |
|
| (49.0 | ) |
|
| 0 |
|
|
| 0 |
|
Total |
| $ | 122.7 |
|
| $ | 78.7 |
|
| $ | 70.0 |
|
| $ | 40.8 |
|
| $ | 51.4 |
|
| $ | 38.7 |
|
| Spire | Spire Missouri | Spire Alabama | |||||||||||||||||||||
| 2017 | 2016 | 2017 | 2016 | 2017 | 2016 | ||||||||||||||||||
| Current assets | $ | 1.4 | $ | 0.3 | $ | 1.4 | $ | 0.3 | $ | — | $ | — | |||||||||||
| Noncurrent assets | 47.0 | 37.4 | 1.2 | — | 45.8 | 37.4 | |||||||||||||||||
| Current liabilities | (0.4 | ) | (0.4 | ) | (0.4 | ) | (0.4 | ) | — | — | |||||||||||||
| Noncurrent liabilities | (21.0 | ) | (50.1 | ) | (19.8 | ) | (48.1 | ) | — | — | |||||||||||||
| Total | $ | 27.0 | $ | (12.8 | ) | $ | (17.6 | ) | $ | (48.2 | ) | $ | 45.8 | $ | 37.4 | ||||||||
Pre-tax amounts recognized in accumulated other comprehensive loss not yet recognized as components of net periodic postretirement benefit cost consist of:
|
| Spire |
|
| Spire Missouri |
|
| Spire Alabama |
| |||||||||||||||
|
| 2021 |
|
| 2020 |
|
| 2021 |
|
| 2020 |
|
| 2021 |
|
| 2020 |
| ||||||
Net actuarial gain |
| $ | (101.2 | ) |
| $ | (61.7 | ) |
| $ | (85.8 | ) |
| $ | (58.3 | ) |
| $ | (11.5 | ) |
| $ | (1.5 | ) |
Prior service (credit) cost |
|
| 14.6 |
|
|
| 15.5 |
|
|
| 9.7 |
|
|
| 10.4 |
|
|
| 4.9 |
|
|
| 5.1 |
|
Subtotal |
|
| (86.6 | ) |
|
| (46.2 | ) |
|
| (76.1 | ) |
|
| (47.9 | ) |
|
| (6.6 | ) |
|
| 3.6 |
|
Adjustments for amounts included in regulatory assets |
|
| 86.6 |
|
|
| 46.2 |
|
|
| 76.1 |
|
|
| 47.9 |
|
|
| 6.6 |
|
|
| (3.6 | ) |
Total |
| $ | — |
|
| $ | — |
|
| $ | — |
|
| $ | — |
|
| $ | — |
|
| $ | — |
|
| Spire | Spire Missouri | Spire Alabama | |||||||||||||||||||||
| 2017 | 2016 | 2017 | 2016 | 2017 | 2016 | ||||||||||||||||||
| Net actuarial loss (gain) | $ | 1.5 | $ | 38.0 | $ | 12.3 | $ | 43.4 | $ | (9.7 | ) | $ | (5.4 | ) | |||||||||
| Prior service credit | (6.6 | ) | (5.2 | ) | (3.7 | ) | (3.4 | ) | (2.9 | ) | (1.8 | ) | |||||||||||
| Subtotal | (5.1 | ) | 32.8 | 8.6 | 40.0 | (12.6 | ) | (7.2 | ) | ||||||||||||||
| Adjustments for amounts included in regulatory assets | 5.1 | (32.8 | ) | (8.6 | ) | (40.0 | ) | 12.6 | 7.2 | ||||||||||||||
| Total | $ | — | $ | — | $ | — | $ | — | $ | — | $ | — | |||||||||||
| Spire | Spire Missouri | Spire Alabama | |||||||||
| Amortization of net actuarial loss | $ | 0.9 | $ | 0.9 | $ | — | |||||
| Amortization of prior service (credit) cost | (0.1 | ) | 0.3 | (0.4 | ) | ||||||
| Subtotal | 0.8 | 1.2 | (0.4 | ) | |||||||
| Regulatory adjustment | (0.8 | ) | (1.2 | ) | 0.4 | ||||||
| Total | $ | — | $ | — | $ | — | |||||
The assumptions used to calculate net periodic postretirement benefit costs for Spire Missouri are as follows:
|
| 2021 |
|
| 2020 |
|
| 2019 |
|
Weighted average discount rate - Spire Missouri plans |
| 2.75% |
|
| 3.15% |
|
| 4.30% |
|
Weighted average rate of future compensation increase |
| 3.00% |
|
| 3.00% |
|
| 3.00% |
|
Expected long-term rate of return on plan assets - Spire Missouri plans |
| 5.75% |
|
| 6.25% |
|
| 6.25% |
|
| 2017 | 2016 | 2015 | |||
| Weighted average discount rate - Spire Missouri East plans | 3.15% | 4.00% | 4.15% | ||
| Weighted average discount rate - Spire Missouri West plans | 3.45% | 4.30% | 4.40% | ||
| Weighted average rate of future compensation increase | 3.00% | 3.00% | 3.00% | ||
| Expected long-term rate of return on plan assets - Spire Missouri East plans | 5.75%/7.75% | 6.00%/7.75% | 6.25%/7.75% | ||
| Expected long-term rate of return on plan assets - Spire Missouri West plans | 5.50% | 4.75% | 5.00% | ||
The assumptions used to calculate net periodic postretirement benefit costs for Spire Alabama are as follows:
|
| 2021 |
|
| 2020 |
|
| 2019 |
|
Weighted average discount rate |
| 2.75% |
|
| 3.15% |
|
| 4.30% |
|
Expected long-term rate of return on plan assets |
| 5.00%/6.25% |
|
| 5.00%/6.25% |
|
| 5.00%/6.25% |
|
| 2017 | 2016 | 2015 | |||
| Weighted average discount rate | 3.60% | 4.50% | 4.40% | ||
| Expected long-term rate of return on plan assets | 4.00%/6.25% | 4.50%/7.25% | 4.75%/7.50% | ||
The weighted average discount rate is based on long-term, high quality bond indices at the measurement date. The expected long-term rate of return on plan assets is based on historical and projected rates of return for current and planned asset classes in the investment portfolio. Assumed projected rates of return for each asset class were selected after analyzing historical experience and future expectations of the returns. The overall expected rate of return for the portfolio was developed based on the target allocation for each class.
The assumptions used to calculate the accumulated postretirement benefit obligations are as follows:
|
| 2021 |
|
| 2020 |
|
Weighted average discount rate - Spire Alabama plans |
| 2.95% |
|
| 2.75% |
|
Weighted average discount rate - Spire Missouri plans |
| 2.95% |
|
| 2.75% |
|
Weighted average rate of future compensation increase - Spire Missouri East plans |
| 3.00% |
|
| 3.00% |
|
| 2017 | 2016 | ||
| Weighted average discount rate - Spire Alabama plans | 3.80% | 3.60% | |
| Weighted average discount rate - Spire Missouri East plans | 3.60% | 3.15% | |
| Weighted average discount rate - Spire Missouri West plans | 3.60% | 3.45% | |
| Weighted average rate of future compensation increase - Spire Missouri East plans | 3.00% | 3.00% | |
The assumed medical cost trend rates at September 30 are as follows:
|
| 2021 |
|
| 2020 |
|
Medical cost trend assumed for next year - Spire Missouri |
| 7.00% |
|
| 6.50% |
|
Medical cost trend assumed for next year - Spire Alabama |
| 7.00% |
|
| 6.50% |
|
Rate to which the medical cost trend rate is assumed to decline (the ultimate medical cost trend rate) |
| 5.00% |
|
| 5.00% |
|
Year the rate reaches the ultimate trend |
| 2028 |
|
| 2025 |
|
| 2017 | 2016 | ||
| Medical cost trend assumed for next year - Spire Missouri | 7.25% | 7.50% | |
| Medical cost trend assumed for next year - Spire Alabama | 7.25% | 7.50% | |
| Rate to which the medical cost trend rate is assumed to decline (the ultimate medical cost trend rate) | 5.00% | 5.00% | |
| Year the rate reaches the ultimate trend | 2023 | 2023 | |
| Spire | Spire Missouri | Spire Alabama | |||||||||||||||||||||
| 1% Increase | 1% Decrease | 1% Increase | 1% Decrease | 1% Increase | 1% Decrease | ||||||||||||||||||
| Net periodic postretirement benefit cost | $ | 1.7 | $ | (1.4 | ) | $ | 1.6 | $ | (1.3 | ) | $ | 0.1 | $ | (0.1 | ) | ||||||||
| Accumulated postretirement benefit obligation | 10.0 | (9.2 | ) | 8.0 | (7.4 | ) | 1.4 | (1.3 | ) | ||||||||||||||
Following are the targeted and actual plan assets by category as of September 30 of each year for Spire Missouri and Spire Alabama:
Spire Missouri |
| Target |
|
| 2021 Actual |
|
| 2020 Actual |
| |||
Equity securities |
|
| 60.0 | % |
|
| 59.2 | % |
|
| 57.4 | % |
Debt securities |
|
| 40.0 | % |
|
| 38.9 | % |
|
| 37.8 | % |
Other (cash and cash equivalents held to make benefit payments) |
|
| — | % |
|
| 1.9 | % |
|
| 4.8 | % |
Total |
|
| 100.0 | % |
|
| 100.0 | % |
|
| 100.0 | % |
Spire Alabama |
| Target |
|
| 2021 Actual |
|
| 2020 Actual |
| |||
Equity securities |
|
| 60.0 | % |
|
| 60.5 | % |
|
| 61.8 | % |
Debt securities |
|
| 40.0 | % |
|
| 39.5 | % |
|
| 38.2 | % |
Total |
|
| 100.0 | % |
|
| 100.0 | % |
|
| 100.0 | % |
| Spire Missouri | Target | 2017 Actual | 2016 Actual | |||||
| Equity securities | 60.0 | % | 59.0 | % | 59.1 | % | ||
| Debt securities | 40.0 | % | 39.4 | % | 39.4 | % | ||
| Other (cash and cash equivalents held to make benefit payments) | — | % | 1.6 | % | 1.5 | % | ||
| Total | 100.0 | % | 100.0 | % | 100.0 | % | ||
| Spire Alabama | Target | 2017 Actual | 2016 Actual | |||||
| Equity securities | 60.0 | % | 60.1 | % | 60.5 | % | ||
| Debt securities | 40.0 | % | 39.9 | % | 39.5 | % | ||
| Total | 100.0 | % | 100.0 | % | 100.0 | % | ||
Missouri and Alabama state laws provide for the recovery in rates of costs accrued pursuant to GAAP provided that such costs are funded through an independent, external funding mechanism. Spire Missouri and Spire AlabamaThe Utilities have established Voluntary Employees’ Beneficiary Association and Rabbi Trusts as external funding mechanisms. Their investment policies seek to maximize investment returns consistent with their tolerance for risk. Outside investment management specialists are utilized in each asset class. Such specialists are provided with guidelines, where appropriate, designed to ensure that the investment portfolio is managed in accordance with policy. Performance and compliance with the guidelines is regularly monitored. Spire Missouri and Spire Alabama currently invest in mutual funds which are rebalanced periodically to the target allocation. The mutual funds are diversified across USU.S. stock and bond markets, and for Spire Alabama, international stock markets.
Following are expected postretirement benefit payments for the succeeding five fiscal years, and in aggregate for the five fiscal years thereafter for Spire, Spire Missouri, and Spire Alabama:
|
| 2022 |
|
| 2023 |
|
| 2024 |
|
| 2025 |
|
| 2026 |
|
| 2027- 2031 |
| ||||||
Spire |
| $ | 14.1 |
|
| $ | 14.9 |
|
| $ | 15.6 |
|
| $ | 15.9 |
|
| $ | 15.8 |
|
| $ | 76.1 |
|
Spire Missouri |
|
| 11.2 |
|
|
| 11.9 |
|
|
| 12.5 |
|
|
| 12.7 |
|
|
| 12.7 |
|
|
| 59.9 |
|
Spire Alabama |
|
| 2.7 |
|
|
| 2.8 |
|
|
| 2.9 |
|
|
| 2.9 |
|
|
| 2.9 |
|
|
| 14.3 |
|
| 2018 | 2019 | 2020 | 2021 | 2022 | 2023- 2027 | ||||||||||||||||||
| Spire | $ | 15.0 | $ | 16.0 | $ | 17.1 | $ | 18.3 | $ | 18.9 | $ | 101.3 | |||||||||||
| Spire Missouri | 11.8 | 12.8 | 14.0 | 15.2 | 15.9 | 86.5 | |||||||||||||||||
| Spire Alabama | 2.8 | 2.8 | 2.8 | 2.8 | 2.7 | 13.0 | |||||||||||||||||
The Utilities’ funding policy is to contribute amounts to the trusts equal to the periodic benefit cost calculated pursuant to GAAP as recovered in rates. For both Spire Missouri and Spire Alabama there are 0 anticipated contributions to the postretirement plans in fiscal 2018 are anticipated to be $7.2 to the qualified trusts and $0.2 paid directly to participants from Spire Missouri funds. It is not anticipated that contributions will be made to the Spire Alabama postretirement plans in fiscal 2018.2022.
Other Plans
Spire Missouri and Spire Alabama sponsorServices Inc. sponsors a 401(k) plansplan that cover substantially all employees.employees of Spire Inc. and its subsidiaries. The plans allowplan allows employees to contribute a portion of their base pay in accordance with specific guidelines. The cost of the defined contribution plan for Spire Inc. totaled $15.5, $13.6, and $13.8 for fiscal years 2021, 2020, and 2019, respectively. Spire Missouri provides a match of such contributions within specific limits. The cost of the defined contribution plans ofplan for Spire Missouri amounted to $8.4, $8.2,$10.9, $9.5, and $8.0$10.0 for fiscal years 2017, 2016,2021, 2020, and 2015,2019, respectively. Spire Alabama also provides a match of employee contributions within specific limits. The cost of the defined contribution plans ofplan for Spire Alabama amounted to $2.7, $2.3,$2.9, $3.4, and $3.0$3.1 for fiscal years 2017, 2016,2021, 2020, and 2015,2019, respectively.
Fair Value Measurements of Pension and Other Postretirement Plan Assets
Spire
The table below categorizes the fair value measurements of the Spire pension plan assets:
|
| Quoted Prices in Active Markets (Level 1) |
|
| Significant Observable Inputs (Level 2) |
|
| Significant Unobservable Inputs (Level 3) |
|
| Total |
| ||||
As of September 30, 2021 |
|
|
|
|
|
|
|
|
|
|
|
|
|
|
|
|
Cash and cash equivalents |
| $ | 10.6 |
|
| $ | 0 |
|
| $ | 0 |
|
| $ | 10.6 |
|
Equity funds - global (including U.S.) |
|
| 0 |
|
|
| 201.2 |
|
|
| 0 |
|
|
| 201.2 |
|
Real asset funds |
|
| 0 |
|
|
| 87.7 |
|
|
| 0 |
|
|
| 87.7 |
|
Debt securities: |
|
|
|
|
|
|
|
|
|
|
|
|
|
|
|
|
U.S. bond funds |
|
| 58.4 |
|
|
| 0 |
|
|
| 0 |
|
|
| 58.4 |
|
U.S. government index funds |
|
| 60.1 |
|
|
| 0 |
|
|
| 0 |
|
|
| 60.1 |
|
Global funds (including U.S.) |
|
| 0 |
|
|
| 80.9 |
|
|
| 0 |
|
|
| 80.9 |
|
Total |
| $ | 129.1 |
|
| $ | 369.8 |
|
| $ | 0 |
|
| $ | 498.9 |
|
|
|
|
|
|
|
|
|
|
|
|
|
|
|
|
|
|
As of September 30, 2020 |
|
|
|
|
|
|
|
|
|
|
|
|
|
|
|
|
Cash and cash equivalents |
| $ | 11.5 |
|
| $ | 0 |
|
| $ | 0 |
|
| $ | 11.5 |
|
Equity funds - global (including U.S.) |
|
| 31.4 |
|
|
| 195.6 |
|
|
| 0 |
|
|
| 227.0 |
|
Equity index funds - global (including U.S.) |
|
| 32.6 |
|
|
| 0 |
|
|
| 0 |
|
|
| 32.6 |
|
Debt securities: |
|
|
|
|
|
|
|
|
|
|
|
|
|
|
|
|
U.S. bond funds |
|
| 48.9 |
|
|
| 0 |
|
|
| 0 |
|
|
| 48.9 |
|
U.S. government index funds |
|
| 78.3 |
|
|
| 0 |
|
|
| 0 |
|
|
| 78.3 |
|
Global funds (including U.S.) |
|
| 0 |
|
|
| 74.8 |
|
|
| 0 |
|
|
| 74.8 |
|
Total |
| $ | 202.7 |
|
| $ | 270.4 |
|
| $ | 0 |
|
| $ | 473.1 |
|
Quoted Prices in Active Markets (Level 1) | Significant Observable Inputs (Level 2) | Significant Unobservable Inputs (Level 3) | Total | ||||||||||||
| As of September 30, 2017 | |||||||||||||||
| Cash and cash equivalents | $ | 37.3 | $ | — | $ | — | $ | 37.3 | |||||||
| Equity mutual funds - domestic | 42.1 | 25.4 | — | 67.5 | |||||||||||
| Equity mutual funds - international | 37.4 | 11.2 | — | 48.6 | |||||||||||
| Debt securities: | |||||||||||||||
| US bond mutual funds | 34.4 | 68.5 | — | 102.9 | |||||||||||
| US government | 33.2 | 4.5 | — | 37.7 | |||||||||||
| US corporate | 183.7 | — | — | 183.7 | |||||||||||
| US municipal | 4.2 | — | — | 4.2 | |||||||||||
| International | 45.1 | 7.2 | — | 52.3 | |||||||||||
| Derivatives and margin (payable) | (2.6 | ) | — | — | (2.6 | ) | |||||||||
| Total | $ | 414.8 | $ | 116.8 | $ | — | $ | 531.6 | |||||||
| As of September 30, 2016 | |||||||||||||||
| Cash and cash equivalents | $ | 51.2 | $ | — | $ | — | $ | 51.2 | |||||||
| Stock/bond mutual funds | 99.3 | 26.7 | 0.1 | 126.1 | |||||||||||
| Debt securities: | |||||||||||||||
| US bond mutual funds | 23.0 | 126.0 | — | 149.0 | |||||||||||
| US government | 42.1 | 3.0 | — | 45.1 | |||||||||||
| US corporate | 137.4 | — | — | 137.4 | |||||||||||
| US municipal | 6.3 | — | — | 6.3 | |||||||||||
| International | 25.3 | — | — | 25.3 | |||||||||||
| Derivatives and margin (payable) | (1.0 | ) | 1.1 | — | 0.1 | ||||||||||
| Total | $ | 383.6 | $ | 156.8 | $ | 0.1 | $ | 540.5 | |||||||
The table below categorizes the fair value measurements of Spire’s postretirement plan assets:
|
| Quoted Prices in Active Markets (Level 1) |
|
| Significant Observable Inputs (Level 2) |
|
| Significant Unobservable Inputs (Level 3) |
|
| Total |
| ||||
As of September 30, 2021 |
|
|
|
|
|
|
|
|
|
|
|
|
|
|
|
|
Cash and cash equivalents |
| $ | 3.1 |
|
| $ | 0 |
|
| $ | 0 |
|
| $ | 3.1 |
|
U.S. stock/bond mutual funds |
|
| 223.2 |
|
|
| 82.5 |
|
|
| 0 |
|
|
| 305.7 |
|
International fund |
|
| 1.2 |
|
|
| 16.9 |
|
|
| 0 |
|
|
| 18.1 |
|
Total |
| $ | 227.5 |
|
| $ | 99.4 |
|
| $ | 0 |
|
| $ | 326.9 |
|
|
|
|
|
|
|
|
|
|
|
|
|
|
|
|
|
|
As of September 30, 2020 |
|
|
|
|
|
|
|
|
|
|
|
|
|
|
|
|
Cash and cash equivalents |
| $ | 3.6 |
|
| $ | 0 |
|
| $ | 0 |
|
| $ | 3.6 |
|
U.S. stock/bond mutual funds |
|
| 199.4 |
|
|
| 72.2 |
|
|
| 0 |
|
|
| 271.6 |
|
International fund |
|
| 1.0 |
|
|
| 14.8 |
|
|
| — |
|
|
| 15.8 |
|
Total |
| $ | 204.0 |
|
| $ | 87.0 |
|
| $ | 0 |
|
| $ | 291.0 |
|
Quoted Prices in Active Markets (Level 1) | Significant Observable Inputs (Level 2) | Significant Unobservable Inputs (Level 3) | Total | ||||||||||||
| As of September 30, 2017 | |||||||||||||||
| Cash and cash equivalents | $ | 4.0 | $ | — | $ | — | $ | 4.0 | |||||||
| US stock/bond mutual funds | 174.1 | 71.7 | — | 245.8 | |||||||||||
| International fund | 1.0 | 14.7 | — | 15.7 | |||||||||||
| Total | $ | 179.1 | $ | 86.4 | $ | — | $ | 265.5 | |||||||
| As of September 30, 2016 | |||||||||||||||
| Cash and cash equivalents | $ | 4.8 | $ | — | $ | — | $ | 4.8 | |||||||
| US stock/bond mutual funds | 157.9 | 68.5 | — | 226.4 | |||||||||||
| International fund | 0.9 | 14.3 | — | 15.2 | |||||||||||
| Total | $ | 163.6 | $ | 82.8 | $ | — | $ | 246.4 | |||||||
Cash and cash equivalents include money market mutual funds valued based on quoted market prices. Fair values of derivative instruments are calculated by investment managers who use valuation models that incorporate observable market inputs. Debt securities are valued based on broker/dealer quotations or by using observable market inputs. The stock and bond mutual funds are valued at the quoted market price of the identical securities.
Spire Missouri
The table below categorizes the fair value measurements of Spire Missouri’s pension plan assets:
|
| Quoted Prices in Active Markets (Level 1) |
|
| Significant Observable Inputs (Level 2) |
|
| Significant Unobservable Inputs (Level 3) |
|
| Total |
| ||||
As of September 30, 2021 |
|
|
|
|
|
|
|
|
|
|
|
|
|
|
|
|
Cash and cash equivalents |
| $ | 8.3 |
|
| $ | 0 |
|
| $ | 0 |
|
| $ | 8.3 |
|
Equity funds - global (including U.S.) |
|
| 0 |
|
|
| 148.6 |
|
|
| 0 |
|
|
| 148.6 |
|
Real asset funds |
|
| 0 |
|
|
| 59.2 |
|
|
| 0 |
|
|
| 59.2 |
|
Debt securities: |
|
|
|
|
|
|
|
|
|
|
|
|
|
|
|
|
U.S. bond funds |
|
| 38.4 |
|
|
| 0 |
|
|
| 0 |
|
|
| 38.4 |
|
U.S. government index funds |
|
| 45.6 |
|
|
| 0 |
|
|
| 0 |
|
|
| 45.6 |
|
Global funds (including U.S.) |
|
| 0 |
|
|
| 63.9 |
|
|
| 0 |
|
|
| 63.9 |
|
Total |
| $ | 92.3 |
|
| $ | 271.7 |
|
| $ | 0 |
|
| $ | 364.0 |
|
|
|
|
|
|
|
|
|
|
|
|
|
|
|
|
|
|
As of September 30, 2020 |
|
|
|
|
|
|
|
|
|
|
|
|
|
|
|
|
Cash and cash equivalents |
| $ | 9.5 |
|
| $ | 0 |
|
| $ | 0 |
|
| $ | 9.5 |
|
Equity funds - global (including U.S.) |
|
| 22.1 |
|
|
| 137.8 |
|
|
| 0 |
|
|
| 159.9 |
|
Equity index funds - global (including U.S.) |
|
| 22.8 |
|
|
| 0 |
|
|
| 0 |
|
|
| 22.8 |
|
Debt securities: |
|
|
|
|
|
|
|
|
|
|
|
|
|
|
|
|
U.S. bond funds |
|
| 31.0 |
|
|
| 0 |
|
|
| 0 |
|
|
| 31.0 |
|
U.S. government index funds |
|
| 59.6 |
|
|
| 0 |
|
|
| 0 |
|
|
| 59.6 |
|
Global funds (including U.S.) |
|
| 0 |
|
|
| 53.4 |
|
|
| 0 |
|
|
| 53.4 |
|
Total |
| $ | 145.0 |
|
| $ | 191.2 |
|
| $ | 0 |
|
| $ | 336.2 |
|
Quoted Prices in Active Markets (Level 1) | Significant Observable Inputs (Level 2) | Significant Unobservable Inputs (Level 3) | Total | ||||||||||||
| As of September 30, 2017 | |||||||||||||||
| Cash and cash equivalents | $ | 31.7 | $ | — | $ | — | $ | 31.7 | |||||||
| Equity mutual funds - domestic | — | 11.9 | — | 11.9 | |||||||||||
| Equity mutual funds - international | — | 5.7 | — | 5.7 | |||||||||||
| Debt securities: | |||||||||||||||
| US bond mutual funds | — | 68.5 | — | 68.5 | |||||||||||
| US government | 33.2 | 4.5 | — | 37.7 | |||||||||||
| US corporate | 183.7 | — | — | 183.7 | |||||||||||
| US municipal | 4.2 | — | — | 4.2 | |||||||||||
| International | 45.1 | — | — | 45.1 | |||||||||||
| Derivatives and margin (payable) | (2.6 | ) | — | — | (2.6 | ) | |||||||||
| Total | $ | 295.3 | $ | 90.6 | $ | — | $ | 385.9 | |||||||
| As of September 30, 2016 | |||||||||||||||
| Cash and cash equivalents | $ | 46.5 | $ | — | $ | — | $ | 46.5 | |||||||
| Stock/bond mutual funds | — | 14.8 | 0.1 | 14.9 | |||||||||||
| Debt securities: | |||||||||||||||
| US bond mutual funds | — | 120.2 | — | 120.2 | |||||||||||
| US government | 42.1 | 3.0 | — | 45.1 | |||||||||||
| US corporate | 137.4 | — | — | 137.4 | |||||||||||
| US municipal | 6.3 | — | — | 6.3 | |||||||||||
| International | 25.2 | — | — | 25.2 | |||||||||||
| Derivatives and margin (payable) | (1.0 | ) | 1.1 | — | 0.1 | ||||||||||
| Total | $ | 256.5 | $ | 139.1 | $ | 0.1 | $ | 395.7 | |||||||
The table below categorizes the fair value measurements of Spire Missouri’s postretirement plan assets:
|
| Quoted Prices in Active Markets (Level 1) |
|
| Significant Observable Inputs (Level 2) |
|
| Significant Unobservable Inputs (Level 3) |
|
| Total |
| ||||
As of September 30, 2021 |
|
|
|
|
|
|
|
|
|
|
|
|
|
|
|
|
Cash and cash equivalents |
| $ | 2.4 |
|
| $ | 0 |
|
| $ | 0 |
|
| $ | 2.4 |
|
U.S. stock/bond mutual funds |
|
| 219.3 |
|
|
| 0 |
|
|
| 0 |
|
|
| 219.3 |
|
Total |
| $ | 221.7 |
|
| $ | 0 |
|
| $ | 0 |
|
| $ | 221.7 |
|
|
|
|
|
|
|
|
|
|
|
|
|
|
|
|
|
|
As of September 30, 2020 |
|
|
|
|
|
|
|
|
|
|
|
|
|
|
|
|
Cash and cash equivalents |
| $ | 3.0 |
|
| $ | 0 |
|
| $ | 0 |
|
| $ | 3.0 |
|
U.S. stock/bond mutual funds |
|
| 196.2 |
|
|
| 0 |
|
|
| 0 |
|
|
| 196.2 |
|
Total |
| $ | 199.2 |
|
| $ | 0 |
|
| $ | 0 |
|
| $ | 199.2 |
|
Quoted Prices in Active Markets (Level 1) | Significant Observable Inputs (Level 2) | Significant Unobservable Inputs (Level 3) | Total | ||||||||||||
| As of September 30, 2017 | |||||||||||||||
| Cash and cash equivalents | $ | 3.9 | $ | — | $ | — | $ | 3.9 | |||||||
| US stock/bond mutual funds | 171.0 | — | — | 171.0 | |||||||||||
| Total | $ | 174.9 | $ | — | $ | — | $ | 174.9 | |||||||
| As of September 30, 2016 | |||||||||||||||
| Cash and cash equivalents | $ | 4.6 | $ | — | $ | — | $ | 4.6 | |||||||
| US stock/bond mutual funds | 155.1 | — | — | 155.1 | |||||||||||
| Total | $ | 159.7 | $ | — | $ | — | $ | 159.7 | |||||||
Cash and cash equivalents include money market mutual funds valued based on quoted market prices. Fair values of derivative instruments are calculated by investment managers who use valuation models that incorporate observable market inputs. Debt securities are valued based on broker/dealer quotations or by using observable market inputs. The stock and bond mutual funds are valued at the quoted market price of the identical securities.
Spire Alabama
The table below categorizes the fair value measurements of Spire Alabama’s pension plan assets:
|
| Quoted Prices in Active Markets (Level 1) |
|
| Significant Observable Inputs (Level 2) |
|
| Significant Unobservable Inputs (Level 3) |
|
| Total |
| ||||
As of September 30, 2021 |
|
|
|
|
|
|
|
|
|
|
|
|
|
|
|
|
Cash and cash equivalents |
| $ | 1.4 |
|
| $ | 0 |
|
| $ | 0 |
|
| $ | 1.4 |
|
Equity funds - global (including U.S.) |
|
| 0 |
|
|
| 32.3 |
|
|
| 0 |
|
|
| 32.3 |
|
Real asset funds |
|
| 0 |
|
|
| 14.6 |
|
|
| 0 |
|
|
| 14.6 |
|
Debt securities: |
|
|
|
|
|
|
|
|
|
|
|
|
|
|
|
|
U.S. bond funds |
|
| 12.3 |
|
|
| 0 |
|
|
| 0 |
|
|
| 12.3 |
|
U.S. government index funds |
|
| 8.9 |
|
|
| 0 |
|
|
| 0 |
|
|
| 8.9 |
|
Global funds (including U.S.) |
|
| 0 |
|
|
| 13.3 |
|
|
| 0 |
|
|
| 13.3 |
|
Total |
| $ | 22.6 |
|
| $ | 60.2 |
|
| $ | 0 |
|
| $ | 82.8 |
|
|
|
|
|
|
|
|
|
|
|
|
|
|
|
|
|
|
As of September 30, 2020 |
|
|
|
|
|
|
|
|
|
|
|
|
|
|
|
|
Cash and cash equivalents |
| $ | 0.9 |
|
| $ | 0 |
|
| $ | 0 |
|
| $ | 0.9 |
|
Equity funds - global (including U.S.) |
|
| 6.1 |
|
|
| 37.5 |
|
|
| 0 |
|
|
| 43.6 |
|
Equity index funds - global (including U.S.) |
|
| 6.4 |
|
|
| 0 |
|
|
| 0 |
|
|
| 6.4 |
|
Debt securities: |
|
|
|
|
|
|
|
|
|
|
|
|
|
|
|
|
U.S. bond funds |
|
| 11.7 |
|
|
| 0 |
|
|
| 0 |
|
|
| 11.7 |
|
U.S. government index funds |
|
| 12.1 |
|
|
| 0 |
|
|
| 0 |
|
|
| 12.1 |
|
Global funds (including U.S.) |
|
| 0 |
|
|
| 13.9 |
|
|
| 0 |
|
|
| 13.9 |
|
Total |
| $ | 37.2 |
|
| $ | 51.4 |
|
| $ | 0 |
|
| $ | 88.6 |
|
Quoted Prices in Active Markets (Level 1) | Significant Observable Inputs (Level 2) | Significant Unobservable Inputs (Level 3) | Total | ||||||||||||
| As of September 30, 2017 | |||||||||||||||
| Cash and cash equivalents | $ | 3.4 | $ | — | $ | — | $ | 3.4 | |||||||
| Equity mutual funds - domestic | 28.4 | 9.1 | — | 37.5 | |||||||||||
| Equity mutual funds - international | 25.2 | 3.7 | — | 28.9 | |||||||||||
| Debt securities: | |||||||||||||||
| US bond mutual funds | 23.2 | — | — | 23.2 | |||||||||||
| International | — | 4.9 | — | 4.9 | |||||||||||
| Total | $ | 80.2 | $ | 17.7 | $ | — | $ | 97.9 | |||||||
| As of September 30, 2016 | |||||||||||||||
| Cash and cash equivalents | $ | 0.4 | $ | — | $ | — | $ | 0.4 | |||||||
| Stock/bond mutual funds | 59.0 | 11.9 | — | 70.9 | |||||||||||
| Debt securities: | |||||||||||||||
| US bond mutual funds | 23.0 | 5.7 | — | 28.7 | |||||||||||
| Total | $ | 82.4 | $ | 17.6 | $ | — | $ | 100.0 | |||||||
The table below categorizes the fair value measurements of Spire Alabama’s postretirement plan assets:
|
| Quoted Prices in Active Markets (Level 1) |
|
| Significant Observable Inputs (Level 2) |
|
| Significant Unobservable Inputs (Level 3) |
|
| Total |
| ||||
As of September 30, 2021 |
|
|
|
|
|
|
|
|
|
|
|
|
|
|
|
|
U.S. stock/bond mutual funds |
| $ | 0 |
|
| $ | 82.5 |
|
| $ | 0 |
|
| $ | 82.5 |
|
International fund |
|
| 0 |
|
|
| 16.9 |
|
|
| 0 |
|
|
| 16.9 |
|
Total |
| $ | 0 |
|
| $ | 99.4 |
|
| $ | 0 |
|
| $ | 99.4 |
|
|
|
|
|
|
|
|
|
|
|
|
|
|
|
|
|
|
As of September 30, 2020 |
|
|
|
|
|
|
|
|
|
|
|
|
|
|
|
|
U.S. stock/bond mutual funds |
| $ | 0 |
|
| $ | 72.2 |
|
| $ | 0 |
|
| $ | 72.2 |
|
International fund |
|
| 0 |
|
|
| 14.8 |
|
|
| 0 |
|
|
| 14.8 |
|
Total |
| $ | 0 |
|
| $ | 87.0 |
|
| $ | 0 |
|
| $ | 87.0 |
|
Quoted Prices in Active Markets (Level 1) | Significant Observable Inputs (Level 2) | Significant Unobservable Inputs (Level 3) | Total | ||||||||||||
| As of September 30, 2017 | |||||||||||||||
| US stock/bond mutual funds | $ | — | $ | 71.7 | $ | — | $ | 71.7 | |||||||
| International fund | — | 14.7 | — | 14.7 | |||||||||||
| Total | $ | — | $ | 86.4 | $ | — | $ | 86.4 | |||||||
| As of September 30, 2016 | |||||||||||||||
| US stock/bond mutual funds | $ | — | $ | 68.5 | $ | — | $ | 68.5 | |||||||
| International fund | — | 14.3 | — | 14.3 | |||||||||||
| Total | $ | — | $ | 82.8 | $ | — | $ | 82.8 | |||||||
Cash and cash equivalents include money market mutual funds valued based on quoted market prices. Fair values of derivative instruments are calculated by investment managers who use valuation models that incorporate observable market inputs. Debt securities are valued based on broker/dealer quotations or by using observable market inputs. The stock and bond mutual funds are valued at the quoted market price of the identical securities.
14. INFORMATION BY OPERATING SEGMENT
The Company has two2 reportable segments: Gas Utility and Gas Marketing. The Gas Utility segment is the aggregation of the operations of the Utilities. The Gas Marketing segment includes the results of Spire Marketing, a subsidiary engaged in the non-regulated marketing of natural gas and related activities, and Spire Storage Inc., which utilizesincluding utilizing natural gas storage contracts for providing natural gas sales. Other includes:
• | unallocated corporate items, including certain debt and associated interest costs; |
• | Spire STL Pipeline, a subsidiary of Spire providing interstate natural gas pipeline transportation services; |
• | Spire Storage, a subsidiary of Spire providing interstate natural gas storage services; and |
• | Spire’s subsidiaries engaged in the operation of a propane pipeline, the compression of natural gas, and risk management, among other activities. |
Accounting policies are described in Note 1, Summary of Significant Accounting Policies. Intersegment transactions include sales of natural gas from Spire Marketing to Spire Missouri and Spire Alabama, sales of natural gas from Spire Missouri to Spire Marketing, sales of natural gas from Spire Alabama to Spire Marketing, propane transportation services provided by Spire NGL Inc. (formerly Laclede Pipeline Company) to Spire Missouri, and propane storage services provided by Spire Missouri to Spire NGL Inc.
Management evaluates the performance of the operating segments based on the computation of net economic earnings. Net economic earnings exclude from reported net income the after-tax impacts of net unrealized gainsfair value accounting and losses and other timing differencesadjustments associated with energy-related transactions. Net economic earnings also excludetransactions, the after-tax impacts related toof acquisition, divestiture and restructuring activities.activities, and the largely non-cash impacts of other non-recurring or unusual items such as certain regulatory, legislative or GAAP standard-setting actions.
2021 |
| Gas Utility |
|
| Gas Marketing |
|
| Other |
|
| Eliminations |
|
| Consolidated |
| |||||
Revenues from external customers |
| $ | 2,118.2 |
|
| $ | 96.5 |
|
| $ | 20.8 |
|
| $ | — |
|
| $ | 2,235.5 |
|
Intersegment revenues |
|
| 1.1 |
|
|
| — |
|
|
| 46.9 |
|
|
| (48.0 | ) |
|
| — |
|
Total Operating Revenues |
|
| 2,119.3 |
|
|
| 96.5 |
|
|
| 67.7 |
|
|
| (48.0 | ) |
|
| 2,235.5 |
|
Operating Expenses |
|
|
|
|
|
|
|
|
|
|
|
|
|
|
|
|
|
|
|
|
Natural gas |
|
| 961.7 |
|
|
| 18.8 |
|
|
| 0.1 |
|
|
| (34.3 | ) |
|
| 946.3 |
|
Other operation and maintenance |
|
| 422.2 |
|
|
| 17.1 |
|
|
| 40.2 |
|
|
| (13.7 | ) |
|
| 465.8 |
|
Depreciation and amortization |
|
| 204.4 |
|
|
| 1.2 |
|
|
| 7.5 |
|
|
| — |
|
|
| 213.1 |
|
Taxes, other than income taxes |
|
| 157.0 |
|
|
| 0.9 |
|
|
| 2.2 |
|
|
| — |
|
|
| 160.1 |
|
Total Operating Expenses |
|
| 1,745.3 |
|
|
| 38.0 |
|
|
| 50.0 |
|
|
| (48.0 | ) |
|
| 1,785.3 |
|
Operating Income |
| $ | 374.0 |
|
| $ | 58.5 |
|
| $ | 17.7 |
|
| $ | — |
|
| $ | 450.2 |
|
Net Economic Earnings (Loss) |
| $ | 230.6 |
|
| $ | 47.0 |
|
| $ | (11.3 | ) |
| $ | — |
|
| $ | 266.3 |
|
Capital Expenditures |
| $ | 590.4 |
|
| $ | 0.7 |
|
| $ | 33.7 |
|
| $ | — |
|
| $ | 624.8 |
|
| Gas Utility | Gas Marketing | Other | Eliminations | Consolidated | |||||||||||||||
| 2017 | |||||||||||||||||||
| Revenues from external customers | $ | 1,660.0 | $ | 79.3 | $ | 1.4 | $ | — | $ | 1,740.7 | |||||||||
| Intersegment revenues | 7.9 | — | 6.3 | (14.2 | ) | — | |||||||||||||
| Total Operating Revenues | 1,667.9 | 79.3 | 7.7 | (14.2 | ) | 1,740.7 | |||||||||||||
| Operating Expenses | |||||||||||||||||||
| Gas Utility | |||||||||||||||||||
| Natural and propane gas | 645.9 | — | — | (75.4 | ) | 570.5 | |||||||||||||
| Other operation and maintenance | 409.1 | — | — | (4.1 | ) | 405.0 | |||||||||||||
| Depreciation and amortization | 153.5 | — | — | — | 153.5 | ||||||||||||||
| Taxes, other than income taxes | 137.8 | — | — | — | 137.8 | ||||||||||||||
| Total Gas Utility Operating Expenses | 1,346.3 | — | — | (79.5 | ) | 1,266.8 | |||||||||||||
| Gas Marketing and Other * | — | 74.1 | 12.8 | 65.3 | 152.2 | ||||||||||||||
| Total Operating Expenses | 1,346.3 | 74.1 | 12.8 | (14.2 | ) | 1,419.0 | |||||||||||||
| Operating Income (Loss) | $ | 321.6 | $ | 5.2 | $ | (5.1 | ) | $ | — | $ | 321.7 | ||||||||
| Net Economic Earnings (Loss) | $ | 181.5 | $ | 6.8 | $ | (20.7 | ) | $ | — | $ | 167.6 | ||||||||
| Capital Expenditures | $ | 412.6 | $ | — | $ | 25.5 | $ | — | $ | 438.1 | |||||||||
| Gas Utility | Gas Marketing | Other | Eliminations | Consolidated | |||||||||||||||||||||||||||||||||||
| 2016 | |||||||||||||||||||||||||||||||||||||||
2020 |
| Gas Utility |
|
| Gas Marketing |
|
| Other |
|
| Eliminations |
|
| Consolidated |
| ||||||||||||||||||||||||
| Revenues from external customers | $ | 1,457.2 | $ | 78.5 | $ | 1.6 | $ | — | $ | 1,537.3 |
| $ | 1,751.8 |
|
| $ | 87.9 |
|
| $ | 15.7 |
|
| $ | — |
|
| $ | 1,855.4 |
| |||||||||
| Intersegment revenues | 2.2 | — | 3.2 | (5.4 | ) | — |
|
| 0.2 |
|
|
| — |
|
|
| 42.1 |
|
|
| (42.3 | ) |
|
| — |
| |||||||||||||
| Total Operating Revenues | 1,459.4 | 78.5 | 4.8 | (5.4 | ) | 1,537.3 |
|
| 1,752.0 |
|
|
| 87.9 |
|
|
| 57.8 |
|
|
| (42.3 | ) |
|
| 1,855.4 |
| |||||||||||||
| Operating Expenses |
|
|
|
|
|
|
|
|
|
|
|
|
|
|
|
|
|
|
|
| |||||||||||||||||||
| Gas Utility | |||||||||||||||||||||||||||||||||||||||
| Natural and propane gas | 539.7 | — | — | (47.5 | ) | 492.2 | |||||||||||||||||||||||||||||||||
Natural gas |
|
| 660.2 |
|
|
| 65.1 |
|
|
| 0.4 |
|
|
| (29.6 | ) |
|
| 696.1 |
| |||||||||||||||||||
| Other operation and maintenance | 379.3 | — | — | (1.8 | ) | 377.5 |
|
| 421.3 |
|
|
| 11.8 |
|
|
| 38.2 |
|
|
| (12.7 | ) |
|
| 458.6 |
| |||||||||||||
| Depreciation and amortization | 136.9 | — | — | — | 136.9 |
|
| 189.7 |
|
|
| 0.6 |
|
|
| 7.0 |
|
|
| — |
|
|
| 197.3 |
| ||||||||||||||
| Taxes, other than income taxes | 125.2 | — | — | — | 125.2 |
|
| 146.5 |
|
|
| 1.1 |
|
|
| 0.8 |
|
|
| — |
|
|
| 148.4 |
| ||||||||||||||
| Total Gas Utility Operating Expenses | 1,181.1 | — | — | (49.3 | ) | 1,131.8 | |||||||||||||||||||||||||||||||||
| Gas Marketing and Other * | — | 66.7 | 12.6 | 43.9 | 123.2 | ||||||||||||||||||||||||||||||||||
Impairments |
|
| — |
|
|
| — |
|
|
| 148.6 |
|
|
| — |
|
|
| 148.6 |
| |||||||||||||||||||
| Total Operating Expenses | 1,181.1 | 66.7 | 12.6 | (5.4 | ) | 1,255.0 |
|
| 1,417.7 |
|
|
| 78.6 |
|
|
| 195.0 |
|
|
| (42.3 | ) |
|
| 1,649.0 |
| |||||||||||||
| Operating Income (Loss) | $ | 278.3 | $ | 11.8 | $ | (7.8 | ) | $ | — | $ | 282.3 |
| $ | 334.3 |
|
| $ | 9.3 |
|
| $ | (137.2 | ) |
| $ | — |
|
| $ | 206.4 |
| ||||||||
| Net Economic Earnings (Loss) | $ | 160.3 | $ | 6.4 | $ | (17.6 | ) | $ | — | $ | 149.1 |
| $ | 213.4 |
|
| $ | 9.1 |
|
| $ | (14.7 | ) |
| $ | — |
|
| $ | 207.8 |
| ||||||||
| Capital Expenditures | $ | 291.7 | $ | — | $ | 1.6 | $ | — | $ | 293.3 |
| $ | 547.8 |
|
| $ | 3.6 |
|
| $ | 87.0 |
|
| $ | — |
|
| $ | 638.4 |
| |||||||||
2019 |
| Gas Utility |
|
| Gas Marketing |
|
| Other |
|
| Eliminations |
|
| Consolidated |
| |||||
Revenues from external customers |
| $ | 1,859.2 |
|
| $ | 83.7 |
|
| $ | 9.5 |
|
| $ | — |
|
| $ | 1,952.4 |
|
Intersegment revenues |
|
| 1.6 |
|
|
| — |
|
|
| 12.0 |
|
|
| (13.6 | ) |
|
| — |
|
Total Operating Revenues |
|
| 1,860.8 |
|
|
| 83.7 |
|
|
| 21.5 |
|
|
| (13.6 | ) |
|
| 1,952.4 |
|
Operating Expenses |
|
|
|
|
|
|
|
|
|
|
|
|
|
|
|
|
|
|
|
|
Natural gas |
|
| 794.6 |
|
|
| 47.9 |
|
|
| 0.5 |
|
|
| (2.7 | ) |
|
| 840.3 |
|
Other operation and maintenance |
|
| 441.7 |
|
|
| 11.7 |
|
|
| 31.6 |
|
|
| (10.9 | ) |
|
| 474.1 |
|
Depreciation and amortization |
|
| 179.4 |
|
|
| 0.1 |
|
|
| 2.2 |
|
|
| — |
|
|
| 181.7 |
|
Taxes, other than income taxes |
|
| 151.7 |
|
|
| 0.8 |
|
|
| 1.5 |
|
|
| — |
|
|
| 154.0 |
|
Total Operating Expenses |
|
| 1,567.4 |
|
|
| 60.5 |
|
|
| 35.8 |
|
|
| (13.6 | ) |
|
| 1,650.1 |
|
Operating Income (Loss) |
| $ | 293.4 |
|
| $ | 23.2 |
|
| $ | (14.3 | ) |
| $ | — |
|
| $ | 302.3 |
|
Net Economic Earnings (Loss) |
| $ | 199.8 |
|
| $ | 19.4 |
|
| $ | (24.1 | ) |
| $ | — |
|
| $ | 195.1 |
|
Capital Expenditures |
| $ | 565.4 |
|
| $ | 3.1 |
|
| $ | 254.8 |
|
| $ | — |
|
| $ | 823.3 |
|
Total Assets at End of Year |
| 2021 |
|
| 2020 |
|
| 2019 |
| |||
Gas Utility |
| $ | 7,615.4 |
|
| $ | 6,716.2 |
|
| $ | 6,094.6 |
|
Gas Marketing |
|
| 466.1 |
|
|
| 182.7 |
|
|
| 212.3 |
|
Other |
|
| 2,351.7 |
|
|
| 2,443.5 |
|
|
| 2,692.7 |
|
Eliminations |
|
| (1,076.8 | ) |
|
| (1,101.2 | ) |
|
| (1,380.4 | ) |
Total Assets |
| $ | 9,356.4 |
|
| $ | 8,241.2 |
|
| $ | 7,619.2 |
|
Reconciliation of Consolidated Net Income to Consolidated Net Economic Earnings |
| 2021 |
|
| 2020 |
|
| 2019 |
| |||
Net Income |
| $ | 271.7 |
|
| $ | 88.6 |
|
| $ | 184.6 |
|
Adjustments, pre-tax: |
|
|
|
|
|
|
|
|
|
|
|
|
Impairments |
|
| 0 |
|
|
| 148.6 |
|
|
| 0 |
|
Provision for ISRS rulings |
|
| 0 |
|
|
| 0 |
|
|
| 12.2 |
|
Missouri regulatory adjustments |
|
| (9.0 | ) |
|
| 0 |
|
|
| 0 |
|
Fair value and timing adjustments |
|
| 3.3 |
|
|
| 2.5 |
|
|
| 1.2 |
|
Acquisition, divestiture and restructuring activities |
|
| (1.3 | ) |
|
| 0 |
|
|
| 0.4 |
|
Income tax effect of adjustments |
|
| 1.6 |
|
|
| (31.9 | ) |
|
| (3.3 | ) |
Net Economic Earnings |
| $ | 266.3 |
|
| $ | 207.8 |
|
| $ | 195.1 |
|
| Gas Utility | Gas Marketing | Other | Eliminations | Consolidated | |||||||||||||||
| 2015 | |||||||||||||||||||
| Revenues from external customers | $ | 1,891.8 | $ | 82.9 | $ | 1.7 | $ | — | $ | 1,976.4 | |||||||||
| Intersegment revenues | 4.0 | 70.5 | 2.0 | (76.5 | ) | — | |||||||||||||
| Total Operating Revenues | 1,895.8 | 153.4 | 3.7 | (76.5 | ) | 1,976.4 | |||||||||||||
| Operating Expenses | |||||||||||||||||||
| Gas Utility | |||||||||||||||||||
| Natural and propane gas | 957.6 | — | — | (75.2 | ) | 882.4 | |||||||||||||
| Other operation and maintenance | 391.6 | — | — | (1.0 | ) | 390.6 | |||||||||||||
| Depreciation and amortization | 129.9 | — | — | — | 129.9 | ||||||||||||||
| Taxes, other than income taxes | 142.1 | — | — | — | 142.1 | ||||||||||||||
| Total Gas Utility Operating Expenses | 1,621.2 | — | — | (76.2 | ) | 1,545.0 | |||||||||||||
| Gas Marketing and Other * | — | 146.6 | 12.6 | (0.3 | ) | 158.9 | |||||||||||||
| Total Operating Expenses | 1,621.2 | 146.6 | 12.6 | (76.5 | ) | 1,703.9 | |||||||||||||
| Operating Income (Loss) | $ | 274.6 | $ | 6.8 | $ | (8.9 | ) | $ | — | $ | 272.5 | ||||||||
| Net Economic Earnings (Loss) | $ | 150.4 | $ | 4.2 | $ | (16.3 | ) | $ | — | $ | 138.3 | ||||||||
| Capital Expenditures | $ | 284.4 | $ | — | $ | 5.4 | $ | — | $ | 289.8 | |||||||||
| Total Assets at End of Year | 2017 | 2016 | 2015 | ||||||||
| Gas Utility | $ | 5,551.2 | $ | 5,184.7 | $ | 4,679.3 | |||||
| Gas Marketing | 246.2 | 205.0 | 160.6 | ||||||||
| Other | 2,239.5 | 1,836.6 | 1,554.5 | ||||||||
| Eliminations | (1,490.2 | ) | (1,161.9 | ) | (1,116.8 | ) | |||||
| Total Assets | $ | 6,546.7 | $ | 6,064.4 | $ | 5,277.6 | |||||
Reconciliation of Consolidated Net Income to Consolidated Net Economic Earnings | 2017 | 2016 | 2015 | ||||||||
| Net Income | $ | 161.6 | $ | 144.2 | $ | 136.9 | |||||
| Adjustments, pre-tax: | |||||||||||
| Unrealized loss (gain) on energy-related derivatives | 6.0 | (0.1 | ) | (2.8 | ) | ||||||
| Lower of cost or market inventory adjustments | — | 0.2 | 0.4 | ||||||||
Realized (gain) loss on economic hedges prior to the sale of the physical commodity | (0.3 | ) | (1.6 | ) | 2.4 | ||||||
| Acquisition, divestiture and restructuring activities | 4.0 | 9.2 | 9.8 | ||||||||
| Gain on sale of property | — | — | (7.6 | ) | |||||||
| Income tax effect of adjustments | (3.7 | ) | (2.8 | ) | (0.8 | ) | |||||
| Net Economic Earnings | $ | 167.6 | $ | 149.1 | $ | 138.3 | |||||
15. REGULATORY MATTERS
As discussed below for Spire Missouri and Spire Alabama, the Purchased Gas Adjustment (PGA) clauses and Gas Supply Adjustment (GSA) riders allow the Utilities to pass through to customers the cost of purchased gas supplies. Regulatory assets and regulatory liabilities related to the PGA clauses and the GSA rider are both labeled Unamortized Purchased Gas Adjustments herein.
The following regulatory assets and regulatory liabilities were reflected in the Balance Sheets as of September 30, 20172021 and 2016. Unamortized Purchased Gas Adjustments are also included below, which are reported separately in the current assets and liabilities sections of each balance sheet.2020.
|
| Spire |
|
| Spire Missouri |
|
| Spire Alabama |
| |||||||||||||||
September 30 |
| 2021 |
|
| 2020 |
|
| 2021 |
|
| 2020 |
|
| 2021 |
|
| 2020 |
| ||||||
Regulatory Assets: |
|
|
|
|
|
|
|
|
|
|
|
|
|
|
|
|
|
|
|
|
|
|
|
|
Current: |
|
|
|
|
|
|
|
|
|
|
|
|
|
|
|
|
|
|
|
|
|
|
|
|
Pension and postretirement benefit costs |
| $ | 31.1 |
|
| $ | 30.6 |
|
| $ | 21.9 |
|
| $ | 21.9 |
|
| $ | 8.2 |
|
| $ | 7.7 |
|
Unamortized purchased gas adjustments |
|
| 243.5 |
|
|
| 5.5 |
|
|
| 242.8 |
|
|
| 0 |
|
|
| 0 |
|
|
| 5.5 |
|
Other |
|
| 31.9 |
|
|
| 33.4 |
|
|
| 11.6 |
|
|
| 10.2 |
|
|
| 10.6 |
|
|
| 7.2 |
|
Total Current Regulatory Assets |
|
| 306.5 |
|
|
| 69.5 |
|
|
| 276.3 |
|
|
| 32.1 |
|
|
| 18.8 |
|
|
| 20.4 |
|
Noncurrent: |
|
|
|
|
|
|
|
|
|
|
|
|
|
|
|
|
|
|
|
|
|
|
|
|
Future income taxes due from customers |
|
| 132.9 |
|
|
| 123.5 |
|
|
| 124.2 |
|
|
| 114.6 |
|
|
| 2.2 |
|
|
| 2.2 |
|
Pension and postretirement benefit costs |
|
| 313.8 |
|
|
| 439.3 |
|
|
| 226.0 |
|
|
| 332.6 |
|
|
| 82.9 |
|
|
| 98.2 |
|
Cost of removal |
|
| 431.9 |
|
|
| 395.6 |
|
|
| 34.9 |
|
|
| 7.1 |
|
|
| 397.0 |
|
|
| 388.6 |
|
Unamortized purchased gas adjustments |
|
| 0 |
|
|
| 12.1 |
|
|
| 0 |
|
|
| 12.1 |
|
|
| 0 |
|
|
| 0 |
|
Energy efficiency |
|
| 47.6 |
|
|
| 39.6 |
|
|
| 47.6 |
|
|
| 39.6 |
|
|
| 0 |
|
|
| 0 |
|
Other |
|
| 67.3 |
|
|
| 59.3 |
|
|
| 50.4 |
|
|
| 42.7 |
|
|
| 1.2 |
|
|
| 0.9 |
|
Total Noncurrent Regulatory Assets |
|
| 993.5 |
|
|
| 1,069.4 |
|
|
| 483.1 |
|
|
| 548.7 |
|
|
| 483.3 |
|
|
| 489.9 |
|
Total Regulatory Assets |
| $ | 1,300.0 |
|
| $ | 1,138.9 |
|
| $ | 759.4 |
|
| $ | 580.8 |
|
| $ | 502.1 |
|
| $ | 510.3 |
|
Regulatory Liabilities: |
|
|
|
|
|
|
|
|
|
|
|
|
|
|
|
|
|
|
|
|
|
|
|
|
Current: |
|
|
|
|
|
|
|
|
|
|
|
|
|
|
|
|
|
|
|
|
|
|
|
|
Pension and postretirement benefit costs |
| $ | 5.8 |
|
| $ | 5.8 |
|
| $ | 3.6 |
|
| $ | 3.6 |
|
| $ | 2.2 |
|
| $ | 2.2 |
|
Unamortized purchased gas adjustments |
|
| 11.0 |
|
|
| 73.1 |
|
|
| 0 |
|
|
| 72.3 |
|
|
| 10.2 |
|
|
| 0 |
|
Other |
|
| 17.8 |
|
|
| 34.1 |
|
|
| 13.5 |
|
|
| 27.3 |
|
|
| 1.0 |
|
|
| 1.7 |
|
Total Current Regulatory Liabilities |
|
| 34.6 |
|
|
| 113.0 |
|
|
| 17.1 |
|
|
| 103.2 |
|
|
| 13.4 |
|
|
| 3.9 |
|
Noncurrent: |
|
|
|
|
|
|
|
|
|
|
|
|
|
|
|
|
|
|
|
|
|
|
|
|
Deferred taxes due to customers |
|
| 127.5 |
|
|
| 138.8 |
|
|
| 110.2 |
|
|
| 121.4 |
|
|
| 0 |
|
|
| 0 |
|
Pension and postretirement benefit costs |
|
| 159.3 |
|
|
| 157.6 |
|
|
| 131.4 |
|
|
| 140.4 |
|
|
| 19.8 |
|
|
| 14.8 |
|
Accrued cost of removal |
|
| 36.2 |
|
|
| 28.6 |
|
|
| 4.9 |
|
|
| 0 |
|
|
| 0 |
|
|
| 0 |
|
Unamortized purchased gas adjustments |
|
| 284.3 |
|
|
| 4.4 |
|
|
| 284.3 |
|
|
| 4.4 |
|
|
| 0 |
|
|
| 0 |
|
Other |
|
| 13.6 |
|
|
| 14.3 |
|
|
| 8.0 |
|
|
| 8.6 |
|
|
| 3.6 |
|
|
| 3.7 |
|
Total Noncurrent Regulatory Liabilities |
|
| 620.9 |
|
|
| 343.7 |
|
|
| 538.8 |
|
|
| 274.8 |
|
|
| 23.4 |
|
|
| 18.5 |
|
Total Regulatory Liabilities |
| $ | 655.5 |
|
| $ | 456.7 |
|
| $ | 555.9 |
|
| $ | 378.0 |
|
| $ | 36.8 |
|
| $ | 22.4 |
|
| Spire | Spire Missouri | Spire Alabama | |||||||||||||||||||||
| September 30 | 2017 | 2016 | 2017 | 2016 | 2017 | 2016 | |||||||||||||||||
| Regulatory Assets: | |||||||||||||||||||||||
| Current: | |||||||||||||||||||||||
| Pension and postretirement benefit costs | $ | 42.2 | $ | 27.0 | $ | 34.9 | $ | 20.2 | $ | 7.2 | $ | 6.8 | |||||||||||
| Unamortized purchased gas adjustments | 102.6 | 49.7 | 57.4 | 43.1 | 45.2 | 5.6 | |||||||||||||||||
| Other | 30.7 | 17.2 | 3.3 | 3.7 | 12.2 | 8.1 | |||||||||||||||||
| Total Current Regulatory Assets | 175.5 | 93.9 | 95.6 | 67.0 | 64.6 | 20.5 | |||||||||||||||||
| Noncurrent: | |||||||||||||||||||||||
| Future income taxes due from customers | 170.5 | 151.3 | 170.5 | 151.3 | — | — | |||||||||||||||||
| Pension and postretirement benefit costs | 404.7 | 487.9 | 322.7 | 375.7 | 72.6 | 98.9 | |||||||||||||||||
| Cost of removal | 123.3 | 130.6 | — | — | 123.3 | 130.6 | |||||||||||||||||
| Unamortized purchased gas adjustments | 9.9 | 12.6 | 9.9 | 12.6 | — | — | |||||||||||||||||
| Energy efficiency | 29.0 | 25.5 | 29.0 | 25.5 | — | — | |||||||||||||||||
| Other | 53.7 | 30.1 | 25.7 | 24.7 | 1.1 | 1.2 | |||||||||||||||||
| Total Noncurrent Regulatory Assets | 791.1 | 838.0 | 557.8 | 589.8 | 197.0 | 230.7 | |||||||||||||||||
| Total Regulatory Assets | $ | 966.6 | $ | 931.9 | $ | 653.4 | $ | 656.8 | $ | 261.6 | $ | 251.2 | |||||||||||
| Regulatory Liabilities: | |||||||||||||||||||||||
| Current: | |||||||||||||||||||||||
| RSE adjustment | $ | 1.4 | $ | 7.5 | $ | — | $ | — | $ | 1.4 | $ | 5.0 | |||||||||||
| Unbilled service margin | — | 5.9 | — | — | — | 5.9 | |||||||||||||||||
| Refundable negative salvage | 8.2 | 9.3 | — | — | 8.2 | 9.3 | |||||||||||||||||
| Unamortized purchased gas adjustments | 1.0 | 1.7 | — | — | — | — | |||||||||||||||||
| Other | 12.0 | 6.2 | 2.7 | 1.3 | 2.4 | 2.5 | |||||||||||||||||
| Total Current Regulatory Liabilities | 22.6 | 30.6 | 2.7 | 1.3 | 12.0 | 22.7 | |||||||||||||||||
| Noncurrent: | |||||||||||||||||||||||
| Pension and postretirement benefit costs | 32.2 | 28.9 | — | — | 32.2 | 28.9 | |||||||||||||||||
| Refundable negative salvage | 4.1 | 9.4 | — | — | 4.1 | 9.4 | |||||||||||||||||
| Accrued cost of removal | 83.8 | 74.8 | 54.5 | 55.1 | — | — | |||||||||||||||||
| Other | 37.1 | 17.6 | 26.7 | 12.2 | 3.3 | 3.4 | |||||||||||||||||
| Total Noncurrent Regulatory Liabilities | 157.2 | 130.7 | 81.2 | 67.3 | 39.6 | 41.7 | |||||||||||||||||
| Total Regulatory Liabilities | $ | 179.8 | $ | 161.3 | $ | 83.9 | $ | 68.6 | $ | 51.6 | $ | 64.4 | |||||||||||
A portion of the Company’s regulatory assets are not earning a return and are shown in the schedule below:
|
| Spire |
|
| Spire Missouri |
| ||||||||||
September 30 |
| 2021 |
|
| 2020 |
|
| 2021 |
|
| 2020 |
| ||||
Pension and postretirement benefit costs |
| $ | 165.7 |
|
| $ | 232.3 |
|
| $ | 165.7 |
|
| $ | 232.3 |
|
Future income taxes due from customers |
|
| 130.7 |
|
|
| 121.3 |
|
|
| 124.2 |
|
|
| 114.6 |
|
Unamortized purchase gas adjustments |
|
| 242.8 |
|
|
| — |
|
|
| 242.8 |
|
|
| — |
|
Other |
|
| 86.0 |
|
|
| 12.9 |
|
|
| 86.0 |
|
|
| 12.9 |
|
Total Regulatory Assets Not Earning a Return |
| $ | 625.2 |
|
| $ | 366.5 |
|
| $ | 618.7 |
|
| $ | 359.8 |
|
| Spire | Spire Missouri | ||||||||||||||
| September 30 | 2017 | 2016 | 2017 | 2016 | |||||||||||
| Future income taxes due from customers | $ | 170.5 | $ | 151.3 | $ | 170.5 | $ | 151.3 | |||||||
| Pension and postretirement benefit costs | 198.5 | 240.6 | 198.5 | 240.6 | |||||||||||
| Other | 11.3 | 12.9 | 11.3 | 12.9 | |||||||||||
| Total Regulatory Assets Not Earning a Return | $ | 380.3 | $ | 404.8 | $ | 380.3 | $ | 404.8 | |||||||
Like all the Company’s regulatory assets, these regulatory assets are expected to be recovered from customers in future rates. The recovery period for the future income taxes due from customers and pension and other postretirement benefit costs could be as long as 20 years or longer, based on current Internal Revenue Service guidelines and average remaining service life of active participants, respectively. The recovery period for the PGA assets is normally about one year, but a portion will be three years due to the Filing Adjustment Factor discussed below. The other items not earning a return are expected to be recovered over a period not to exceed 15 years, consistent with precedent set by the MoPSC. Spire Alabama does not have any regulatory assets that are not earning a return.
Spire Missouri
As authorized by the MoPSC, the PGA clause allows Spire Missouri to flow through to customers, subject to prudence review by the MoPSC, the cost of purchased gas supplies. To better match customer billings with market natural gas prices, Spire Missouri is allowed to file to modify, on a periodic basis, the level of gas costs in its PGA. Certain provisions of the PGA clause are included below:
• | Spire Missouri has a risk management policy that allows for the purchase of natural gas derivative instruments with the goal of managing price risk associated with purchasing natural gas on behalf of its customers. The MoPSC clarified that costs, cost reductions, and carrying costs associated with the Utility’s use of natural gas derivative instruments are gas costs recoverable through the PGA mechanism. |
• | The tariffs allow Spire Missouri flexibility to make up to 3 discretionary PGA changes during each year, in addition to its mandatory November PGA change, so long as such changes are separated by at least two months. |
• | Spire Missouri is authorized to apply carrying costs to all over- or under-recoveries of gas costs, including costs and cost reductions associated with the use of derivative instruments, including cash payments for margin deposits. |
• | The MoPSC approved a plan applicable to Spire Missouri’s gas supply commodity costs under which it retains a portion of cost savings associated with the acquisition of natural gas below an established benchmark level. This gas supply cost management program allows Spire Missouri to retain 10% of cost savings, up to a maximum of $3.0 annually. Spire Missouri did not record any such incentive compensation under the plan during the three fiscal years reported. Incentives recorded under the plan, if any, are included in Operating Revenues on the Consolidated Statements of Income and on Spire Missouri’s Statements of Comprehensive Income. |
• | Pre-tax income from off-system sales and capacity release revenues is shared with customers (such that customers receive 75% and Spire Missouri receives 25%), with an estimated amount assumed in PGA rates. |
Pursuant to the provisions of the PGA clause, the difference between actual costs incurred and costs recovered through the application of the PGA clause, as well as the difference between the actual amount of off-system sales and capacity release revenues allocated to customers and the estimated amount assumed in PGA rates, are reflected as a deferred charge or credit at the end of the fiscal year. At that time, the balance is classified as a current asset or current liability and recovered from, or credited to, customers over an annual period commencing in the subsequent November. The balance in the current account is amortized as amounts are reflected in customer billings. At September 30, 20162021, the current asset balance was primarily the result of higher gas prices, while the noncurrent liability primarily reflects over $192 of Operational Flow Order penalties not yet collected, as discussed later in this note, and net gains on hedges applicable to purchases beyond the current PGA filing period.
On March 7, 2018, the MoPSC issued its order in two general rate cases (docketed as GR-2017-0215 and GR-2017-0216), approving new tariffs that became effective on April 19, 2018. Certain provisions of the order allowed less future recovery of certain deferred or capitalized costs than estimated based upon previous rate proceedings, and management determined that the related regulatory assets should be written down or off in connection with the preparation of the financial statements for the second quarter of 2018. Spire Missouri filed an appeal of portions of the MoPSC’s order, including the disallowance of certain pension costs. On February 9, 2021, the Missouri Supreme Court issued its decision, reversing the MoPSC’s order with respect to increasecertain pension costs and affirming the MoPSC’s order in all other respects. The case was remanded back to the MoPSC with directions that $9.0 in pension assets that accrued between 1994 and 1996 be added to the Company’s prepaid pension asset. Based on the court’s decision, the Company increased its noncurrent regulatory asset for “Pension and postretirement benefit costs” and reduced operation and maintenance expense for the three months ended March 31, 2021. Like the original write-down in 2018, this adjustment is excluded for the net economic earnings financial measure. Spire Missouri and MoPSC Staff agreed that the remand issue should be considered as part of Spire Missouri’s ongoing general rate case (discussed below), and on July 14, 2021, the MoPSC entered an order approving that procedural treatment.
The Infrastructure System Replacement Surcharge (ISRS) revenues by $5.0 forallows Spire Missouri East and $3.4expedited recovery for Spire Missouri West, relatedits investment to ISRS investments from March
In September 2020, Spire Missouri, the MoPSC staff and the Office of Public Counsel (OPC) reached a Unanimous Stipulation and Agreement regarding Spire Missouri’s request for an Accounting Authority Order (AAO) pertaining to transfer the casecertain costs and lost customer fee revenue related to the Missouri Supreme Court,COVID-19 pandemic. In October 2020, the MoPSC issued an order approving that agreement and on October 5, 2017,granting an AAO for the Missouri Supreme Court declined to hear Spire Missouri’s direct appeal. Onperiod of March 20, 2017,1, 2020 through March 31, 2021. As part of the rate case order discussed below, the settled balance of deferred costs, including foregone late payment fees and reconnect/disconnect fees that Spire Missouri entered intowas authorized to defer, totaled $6.2 and will be recovered through a bond purchase agreement for $170.0 that was funded on September 15, 2017, and applied against the $300.0 authorization.
On December 11, 2020, Spire Missouri West filed fortariffs to initiate a general rate case and did so concurrently as agreed to in GM-2013-0254, as part ofbefore the acquisition of Spire Missouri West by Spire Missouri in fiscal 2013. The request for Spire Missouri East representsMoPSC, with a netrequested base rate increase of $25.5. With the $32.6$111.5, $47.3 of which was already being billedrecovered through ISRS. Those tariffs were suspended to allow for interventions, discovery and an evidentiary hearing on the matter, which occurred in ISRS,August 2021. Following the totalhearing, the MoPSC issued a report and order, and an amended report and order directing the Company to file new tariffs implementing a base rate increase request was $58.1.of $72.2, including re-basing of the $47.3 of prior period ISRS charges. The Company filed tariffs to implement those rates, and other program and tariff changes, on November 10, 2021, with an effective date of December 10, 2021. The decision in this case diverged from prior MoPSC precedent in that it (1) included short-term debt in the Company’s capital structure for the first time and (2) revised its long-standing interpretation, approved in prior cases as far back as we could identify, of Spire Missouri’s compliance with the FERC Uniform System of Accounts (USOA) on the capitalization of prudently incurred non-operational overheads. The order requires Spire Missouri West’s request representsto cease capitalization of these overhead costs at the time new rates go into effect until a net rate increaseMoPSC staff audit of $34.0. Withtheir revised interpretation of compliance with the $16.4 already being billed in ISRS,USOA framework can be completed. The Company filed a motion for rehearing on the total base rate increase request was $50.4. The rates were premised upon a 10.35% return on equityoverheads issue, and the detailsOPC filed a motion for rehearing on capital structure and other issues decided in the case. Those motions have been mooted by the amended report and order, and on November 19, 2021 the Company filed an additional motion for rehearing of the filing canamended report and order on various issues. The amended order on capitalized overheads lacks clarity needed to quantify the impact of the issue with adequate precision. The Company is working with the MoPSC staff to facilitate the ordered audit of capitalized overheads on an expedited basis, including the quantification of the overheads subject to the order, and interpretation of what portion of these costs may be founddeferred into a regulatory asset until capitalization resumes. However, unless the MoPSC’s order is amended further or we gain more assurance on recovery through a regulatory asset, the Company anticipates that the change in GR-2017-0215overhead capitalization methods ordered by the MoPSC will have a material adverse impact on its net income in 2022 and GR-2017-0216 for Spire Missouri Eastfuture periods until the completion of a future rate case. The estimated pre-tax impact is in the range of $20 to $30 annually, shifting prudently incurred overhead costs from capital to O&M expense.
In mid-February 2021, the central U.S. experienced a period of unusually severe cold weather (“Winter Storm Uri”), and Spire Missouri West, respectively. An evidentiary hearing has been setimplemented an Operational Flow Order (OFO) to preserve the integrity of its distribution system. During this time, Spire Missouri was required to purchase additional natural gas supply, both to ensure adequate supply for December 4its firm utility customers, and to cover the shortfall created when third-party marketers failed to deliver natural gas supply to its city gates on behalf of their customers. In accordance with its tariffs, Spire Missouri invoiced the cost of gas and associated penalties totaling $195.8 to non-compliant marketers pursuant to the MoPSC-approved OFO tariff and recorded accounts receivable. Recoveries collected, including $3.2 collected to date, will be an offset to cost of natural gas for firm utility customers through 15, 2017,the PGA and Actual Cost Adjustment (ACA). The three largest counterparties did not remit payment when due, so Spire Missouri filed suit against them in federal court to recover the invoiced amounts. Those suits remain pending. Some marketers have filed complaints with athe MoPSC decision expected by February 2018. Missouri statutes require new rates to be effective within 11 monthsrequesting review of the filing, or bytransactions between them and Spire; at this time, the Company has no reason to believe the MoPSC will not follow the tariff and has determined collection is probable. Evidentiary hearings of those complaints are scheduled for March 8, 2018.
Spire Missouri’s net deferred gas costs and average inventory cost in the second quarter of fiscal 2021 increased by approximately $110 primarily due to Winter Storm Uri, including projected offsets of off-system sales and tariff-based OFO penalties. Spire Missouri filed for and received MoPSC approval for an adjustment to the PGA tariff to increase a Filing Adjustment Factor (FAF) credit for three years. This credit will allow the company to help mitigate rate impacts of Winter Storm Uri costs and the increased gas market from 2020 to 2021. All gas costs will eventually be recovered through the PGA or ACA mechanisms and carrying costs will be applied per the terms of the tariff.
Spire Missouri is able to sell excess natural gas supply and capacity to third parties off-system, resulting in significant savings to its firm utility customers through the gas incentive mechanisms of its PGA as described above. Spire Missouri retains 25% and passes 75% through to its customers as gas cost savings. During Winter Storm Uri, Spire Missouri had an unusually large off-system sale resulting in $100.0 of incremental gross revenue. Due to the nature and magnitude of this particular transaction, Spire Missouri initially deferred recognition of its 25% share and established a regulatory liability to allow time to assess the transaction in light of the open rate proceeding. When the regulatory treatment became clear in the fourth quarter of fiscal 2021, the Company reversed the liability and recorded the amount in operating revenues.
Spire Alabama
In October 2018, the APSC which establishedapproved the renewal of its Rate Stabilization and Equalization (RSE) rate-setting process in 1983.for Spire Alabama’s current RSE order has a term extending beyondAlabama through September 30, 2018, unless the APSC enters an order2022, limiting equity as a percent of total capitalization to the contrary in a manner consistent with law. In the event of unforeseen circumstances, whether physical or economic, of the nature of force majeure and including a change in control, the APSC and Spire Alabama will consult in good faith with respect to modifications, if any. Effective January 1, 2014, Spire Alabama’s allowed range of return on average common equity is 10.5%56.5% to 10.95% with an adjusting point of 10.8%55.5%. Spire Alabama is eligible to receive a performance-based adjustment of 5 basis points to the return on equity adjusting point, based on meeting certain customer satisfaction criteria. Under RSE, the APSC conducts quarterly reviews to determine whether Spire Alabama’s return on average common equity (ROE) at the end of the rate year will be within the allowed range of return. Reductions in rates can be made quarterly to bring the projected returnROE within the allowed range; increases, however, are allowed only once each rate year, effective December 1, and cannot exceed 4% of prior-year revenues. The RSE reduction for the July 31, 2016 quarterlySpire Alabama’s allowed range of ROE is 10.15% to 10.65% with an adjusting point of test was $4.8 and went into effect October 1, 2016, and for the quarterly point of test at September10.4%.
On November 30, 2016,2020, Spire Alabama recorded a $2.7 RSE reductionfiled an increase for rate year 2021 of $8.3, which became effective December 1, 2016. As part2020. On October 26, 2021, Spire Alabama made its annual RSE rate filing with the APSC, presenting the utility’s budget for the fiscal year ending September 30, 2022, including net income and a calculation of allowed ROE.
Spire Alabama’s rate schedules for natural gas distribution charges contain a GSA rider which permits the pass-through to customers of changes in the cost of gas supply. Spire Alabama’s tariff provides a temperature adjustment mechanism, also included in the GSA rider, which is designed to moderate the impact of departures from normal temperatures on Spire Alabama’s earnings. The temperature adjustment applies primarily to residential, small commercial and small industrial customers. Other non-temperature weather-related conditions that may affect customer usage are not included in the temperature adjustment. In November 2019, the APSC approved Spire Alabama’s proposal to establish a mechanism under its GSA rider allowing the utility to create value through off-system sales of excess natural gas supply and capacity and to retain 25% of the annual update for RSE,value created while giving 75% of the value to customers. The mechanism was effective with the establishment of new rates on November 30, 2016,December 1, 2019. Spire Alabama filed a reduction forGSA rate year 2017 of $2.5 that also becameincrease effective December 1, 2016. There was no RSE
The inflation-based Cost Control Measure (CCM), established by the APSC, allows for annual increases tochanges in operation and maintenance (O&M) expense.(“O&M”) expense per customer relative to an index range. The CCMindex range is Spire Alabama’s 2007 actual rate year2018 O&M expense inflation-adjusted usingadjusted for inflation and adjusted by 2/3 and 1/3 of the June Consumer Price Index For All Urban Consumers each rate year2018 CCM differential (amount below the CCM range in 2018) in 2019 and 2020, respectively, plus or minus 1.75% (Index Range)1.50%. If rate year O&M expense falls within the Index Range,index range, no adjustment is required. If rate year O&M expense exceeds the Index Range,index range, three-quarters of the difference is returned to customers through future rate adjustments. To the extent rate year O&M is less than the Index Range,index range, Spire Alabama benefits by one-half of the difference through future rate adjustments. Certain items that fluctuate based on situations demonstrated to be beyond Spire Alabama’s control may be excluded from the CCM calculation. As of September 30, 2017,2021, Spire Alabama recorded an RSE point of test giveback of $2.2 and a CCM benefit of $10.7$8.8 for rate year 2017,2021, which will both be reflected in rates effective December 1, 2017.2021. The CCM benefit was $7.8$5.2 for rate year 20162020 and $4.7$5.9 for rate year 2015.
The APSC approved a reduction in depreciation rates, effective June 1, 2010, and a regulatory liability recorded for Spire Alabama. Refunds from such negative salvage liability will be passed back to eligible customers on a declining basis through lower tariff rates through rate year 2019 pursuant to the terms of the Negative Salvage Rebalancing (NSR) rider. The total amount refundable to customers is subject to adjustments over the remaining period for charges made to thean Enhanced Stability Reserve (ESR) in 1998, which was subsequently modified and expanded in 2010. As currently approved, the ESR provides deferred treatment and recovery for the following: (1) extraordinary O&M expenses related to environmental response costs; (2) extraordinary O&M expenses related to self-insurance costs that exceed $1.0 per occurrence; (3) extraordinary O&M expenses, other than environmental response costs and self-insurance costs, resulting from a single force majeure event or multiple force majeure events greater than $0.3 and $0.4, respectively, during a rate year; and (4) negative individual large commercial and industrial customer budget revenue variances that exceed $0.4 during a rate year. Spire Alabama is tracking costs and other APSC-approved charges. The refundsimpacts of COVID-19 in anticipation that some of these items could be recoverable under its ESR, but no related changes to regulatory assets or liabilities have been recorded to date. Charges to the ESR are duesubject to certain limitations which may disallow deferred treatment and which prescribe the timing of recovery. Funding to the ESR is provided as a re-estimation of future removal costs provided for throughreduction to the prior depreciation rates. For fiscal 2017, approximately $6.3 ofrefundable negative salvage balance over its nine-year term beginning December 1, 2010. Subsequent to the customer refund was returnednine-year period and subject to customers. As of September 30, 2017, $12.3 is remainingAPSC authorization, Spire Alabama expects to be refundedable to customers. The NSR pass backrecover underfunded ESR balances over a five-year amortization period with an annual limitation of $0.7. Amounts in excess of this limitation are deferred for fiscal 2018 is $8.2 and will be reflectedrecovery in rates effective December 1, 2017 through March 31, 2018.
Spire Alabama has APSC approval for an intercompany revolving credit agreement allowing Spire Alabama to borrow from Spire in a principal amount not to exceed $200.0 at any time outstanding in combination with its bank line of credit, and to loan to Spire in a principal amount not to exceed $25.0 at any time outstanding. Borrowings may be used for the following purposes: (a) meeting increased working capital requirements; (b) financing construction requirements related to additions, extensions, and replacements of the distribution systems; and (c) financing other expenditures that may arise from time to time in the normal course of business.
Spire
In addition to those discussed above for Spire Missouri and Spire Alabama, Spire is affected by the following regulatory matters.
Spire Gulf has similar rate regulation to Spire Alabama. Its RSE rate-setting mechanism was renewed in September 2021 for a four-year term through September 2025. The RSE allowed ROE range was 10.45% to 10.95% with an applicationadjusting point of 10.70% in fiscal 2021, while the ROE range is 9.70% to 10.30% with an adjusting point of 9.95% for fiscal 2022 through fiscal 2025. The CCM has similar evaluation and recovery provisions when expenses exceed or are under a band of +/- 1.50% around the CPI-U inflated O&M per customer expense level from 2017, excluding expenses for pensions and gas bad debt, for fiscal 2021. The base year O&M index for fiscal 2022 through fiscal 2025 will be the 2021 O&M level. Additionally, Spire Gulf has a Cast Iron Main Replacement Factor (CIF) that provides an enhanced return on the pro-rata costs associated with cast iron main replacement exceeding 10 miles per year based on a 75% weighting for the equity content. Capital expenditures recovered under the CIF have not increased since fiscal 2019 pursuant to applicable tariff provisions although the Company is continuing to recover costs of service associated with accumulated expenditures under the CIF. Spire Gulf also has an ESR for negative revenue variances over $0.1 or a force majeure event expense of $0.1 (or two events that exceed $0.15), a Self Insurance Reserve for general liability coverage, and an Environmental Cost Recovery Factor that recovers 90% of prudently incurred costs for compliance with environmental laws, rules and regulations. Spire Gulf has an APSC-approved intercompany revolving credit agreement with Spire to borrow in a principal amount not to exceed $50.0, and to loan up to $25.0. Spire Gulf recorded a CCM benefit for rate year 2021 of $2.3 to revenues, resulting in a net income benefit of $1.6. On October 26, 2021, Spire Gulf made its annual RSE rate filing with the APSC based on its budget for fiscal 2022 and an allowed ROE of 9.95%, reflecting an increase in annual revenue of $2.0, pending APSC review.
Spire Mississippi utilizes a formula rate-making process under the Rate Stabilization Adjustment Rider (RSA). An allowed return on equity (currently 10.03%) is computed annually and compared to the actual return on equity based on a rate year ending June 30. If the actual equity return on an end of period rate base is beyond the allowed return on equity by 1.0%, then 75% of any shortfall is recovered through a rate increase and 50% of any excess results in a rate decrease. Updates may include known and measurable adjustments to historic costs from the 12 months ended June 30, submitted September 15 for an effective date of November 1, unless disputed by the Mississippi Public Utilities Staff (MPUS), with any disputes to be resolved by the Mississippi Public Service Commission (MSPSC) by January 15 of the following year. On December 11, 2019, the MSPSC approved an agreement between Spire Mississippi and the MPUS settling its RSA filing that was made on August 30, 2019, resulting in a $0.3 increase in the annual revenues. New rates became effective December 11, 2019. On January 12, 2021, the MSPSC approved an agreement between Spire Mississippi and the MPUS settling its RSA filing that was made on August 28, 2020, resulting in a $0.3 increase in annual revenue. New rates became effective January 13, 2021. On August 23, 2021, Spire Mississippi filed its RSA for the rate year ended June 30, 2021, which reflected an increase to annual revenue totaling $1.1. This RSA filing is being reviewed by the MPUS. A Supplemental Growth Rider (SGR) provides recovery of certain system expansion projects to serve qualified economic development projects.
In August 2018, the FERC approved an order issuing a Certificate of Public Convenience and Necessity for the Spire STL Pipeline (“August 2018 Order”). In November 2018, the FERC issued a Notice to Proceed, and in November 2019, Spire STL Pipeline received FERC authorization to issueplace the pipeline into service. Also, in November 2019, the FERC issued an Order on Rehearing of the August 2018 Order dismissing or denying the outstanding requests for rehearing filed by several parties, dismissing the request for stay filed by one party, and sell $75.0 principal amountnoting the withdrawal of debt and to purchase interest rate derivative instrumentsthe request for rehearing by another party. In January 2020, two of the rehearing parties filed petitions for review of the FERC’s orders with the U.S. Court of Appeals for the purposeDistrict of lockingColumbia Circuit. On June 22, 2021, that court issued an order vacating the Certificate of Public Convenience and Necessity and remanding the matter back to the FERC for further action. Spire STL Pipeline filed on July 26, 2021 with the FERC for a Temporary Emergency Certificate. On September 14, 2021, the FERC issued a Temporary Certificate to allow the pipeline to continue operating through December 13, 2021 while it considers Spire STL Pipeline’s Temporary Emergency Certificate application. The commissioners’ statements at the November 18, 2021 FERC open meeting suggest that they do not intend to allow the pipeline’s authorization to lapse in favorable interest ratesa manner that causes service to be interrupted this winter; however, they have not yet issued an order to extend the temporary authorization through the end of the 2021-2022 winter, and there is no assurance the FERC will act to includedo so. Spire STL Pipeline and Spire Missouri, as the associated interest charges, issuance costs, feesfoundation shipper, will each continue to pursue all legal and any gain or loss resulting fromregulatory avenues to ensure access to reliable, affordable and safe delivery of energy for eastern Missouri. While there is no impairment at this time, if the settlementpipeline is taken out of such interest rate derivative instruments through rates.service, the Company’s financial condition and results of operations may be adversely impacted by impairment of Spire STL Pipeline’s assets, currently carried at over $270, and other effects. If Spire Missouri is unable to obtain sufficient pipeline capacity to meet its customers’ annual and seasonal natural gas demands, Spire Missouri’s financial condition and results of operations may be adversely impacted.
On October 9, 2020,Spire Storage West LLC (“Spire Storage”) filed with the FERC an Abbreviated Application for an Amendment of Certificate of Public Convenience and Necessity, Reaffirmation of Market-Based Rate Authority, and Related Authorizations pursuant to Section 7(c) of the Natural Gas Act. The application, was approved by the APSC October 3, 2017.
16. COMMITMENTS AND CONTINGENCIES
Commitments
The Company and the Utilities have entered into contracts with various counterparties, expiring on dates through 2031,2039, for the storage, transportation, and supply of natural gas. Minimum payments required under the contracts in place at September 30, 20172021, are estimated at $1,281.8, $563.9$1,889.0, $1,414.2 and $285.6$363.0 for the Company, Spire Missouri and Spire Alabama, respectively. Additional contracts are generally entered into prior to or during the heating season of November through April. The Utilities recover their costs from customers in accordance with their PGA clauses or GSA riders.
A consolidated subsidiary is a limited partner in an unconsolidated partnership focusing on sustainability initiatives largely tied to the natural gas utility sector. Spire NGL Inc. is providing liquid propane transportation servicecommitted to contribute a total of $10.0 of capital to the partnership as and when requested by the general partner. As of September 30, 2021, Spire Missouri pursuant to an approved FERC tariff and a contractual arrangement with Spire Missouri. In accordance with the terms of that agreement, Spire Missouri is obligated to pay Spire NGL Inc. approximately $1.0 annually, at current rates. The agreement renews at the end of each contract year, unless terminated by either party upon provision of at least six months’ notice.
A consolidated subsidiary is a general partner in an unconsolidated partnership that invests in real estate partnerships. The subsidiary and third parties are jointly and severally liable for the payment of mortgage loans in the aggregate outstanding amount of approximately $1.3$1.2 incurred in connection with various real estate ventures. Spire has no reason to believe that the other principal liable parties will not be able to meet their proportionate
| Aggregate Rental Expense | Minimum Rental Commitments | ||||||||||||||||||||||||||||||||||||||
| 2017 | 2016 | 2015 | 2018 | 2019 | 2020 | 2021 | 2022 | Later | Total | ||||||||||||||||||||||||||||||
| Spire | $ | 9.7 | $ | 11.9 | $ | 14.1 | $ | 10.1 | $ | 9.3 | $ | 7.8 | $ | 6.1 | $ | 6.0 | $ | 44.4 | $ | 83.7 | |||||||||||||||||||
| Spire Missouri | 4.8 | 4.3 | 7.6 | 2.1 | 1.3 | 0.2 | 0.2 | — | — | 3.8 | |||||||||||||||||||||||||||||
| Spire Alabama | 4.6 | 3.7 | 4.0 | 4.0 | 4.1 | 3.8 | 2.1 | 2.1 | 2.8 | 18.9 | |||||||||||||||||||||||||||||
Contingencies
The Company and the Utilities account for contingencies, including environmental liabilities, and other contingencies in accordance with accounting standards under the loss contingency guidance of ASC Topic 450, “Contingencies,”Contingencies, when it is probable that a liability has been incurred and the amount of the loss can be reasonably estimated.
In addition to matters noted below, the Company and the Utilities are involved in other litigation, claims, and investigations arising in the normal course of business. Management, after discussion with counsel, believes the final outcome will not have a material effect on the statements of income, balance sheets, and statements of cash flows of the Company, Spire Missouri, or Spire Alabama. However, there is uncertainty in the valuation of pending claims and prediction of litigation results.
The Company and the Utilities own and operate natural gas distribution, transmission, and storage facilities, the operations of which are subject to various environmental laws, regulations, and interpretations. While environmental issues resulting from such operations arise in the ordinary course of business, such issues have not materially affected the Company’s or Utilities’ financial position and results of operations. As environmental laws, regulations, and their interpretations change, the Company or the Utilities may incur additional environmental liabilities that may result in additional costs, which may be material.
In the natural gas industry, many gas distribution companies have incurred environmental liabilities associated with sites they or their predecessor companies formerly owned or operated where manufactured gas operations took place. The Utilities each have former manufactured gas plant (MGP) operations in their respective service territories.
To date, costs incurred for all Spire MGP sites for investigation, remediation and monitoring have not been material. However, the Southern Districtamount of Alabama, Civil Action 17-00266-KD-N, seeking a declaratory order that Spire’s SPIRE trademarks do not infringe upon Cellular South’s C-SPIRE trademarks,costs relative to future remedial actions at these and other sites is unknown and may be material. The actual future costs that Spire is entitledMissouri and Spire Alabama may incur could be materially higher or lower depending upon several factors, including whether remediation will be required, final selection and regulatory approval of any remedial actions, changing technologies and government regulations, the ultimate ability of other PRPs to federal registrationpay, and any insurance recoveries.
In 2020, Spire retained an outside consultant to conduct probabilistic cost modeling of its trademarks. In prior proceedings before the United States Patentformer MGP sites in Missouri and Trademark Office, Cellular South filed oppositions to Spire’s attempts to register the SPIRE name, the SPIRE logo and the SPIRE LOGO + HANDSHAKE trademarks. In answer to Spire’s lawsuit, Cellular South filed counterclaims alleging infringement and unfair business practices, and seeking a declaration of infringement and that SPIRE marks are not registrable by Spire. On September 11, 2017, a federal district court judge denied Cellular South’s motion for a temporary restraining order and an injunction that would have prohibited Spire from using the SPIRE trademarks in Alabama and Mississippi. After consultation with counsel, the Company does not believe that the final resolutionAlabama. The purpose of this matter will haveanalysis was to develop an estimated range of probabilistic future liability for each of their MGP sites. That analysis, completed in March 2021, provided a detrimental impact onrange of demonstrated possible future expenditures to investigate, monitor and remediate the Company’s financial condition or results of operations.
Spire Missouri
Spire Missouri has identified four3 former MGP sites in easternthe city of St. Louis, Missouri (the “City”) where costs have been incurred and claims have been asserted: one in Shrewsbury, Missouri and three in the city of St. Louis, Missouri (City).asserted. Spire Missouri has enrolled two2 of the sites in the City in the Missouri Department of Natural Resources (MDNR) Brownfields/Voluntary Cleanup Program (BVCP). The third site in the City is the result of a more recent claiman assertion by the United States Environmental Protection Agency (EPA), and such claim is currently being investigated..
In conjunction with redevelopment of one of the sites located in the City,Carondelet Coke site, Spire Missouri and another former owner of the site entered into an agreement (Remediation Agreement)(the “Remediation Agreement”) with the City development agencies, the developer, and an environmental consultant that obligates one of the City agencies and the environmental consultant to remediate the site and obtain a No Further Action letter from the Missouri Department of Natural Resources (MDNR).MDNR. The Remediation Agreement also provides for a release of Spire Missouri and the other former site owner from certain liabilities related to the past and current environmental condition of the site and requires the developer and the environmental consultant to maintain certain insurance coverage, including remediation cost containment, premises pollution liability, and professional liability. The operative provisions of the Remediation Agreement were triggered on December 20, 2010, on which date Spire Missouri and the other former site owner, as full consideration under the Remediation Agreement, paid a small percentage of the cost of remediation of the site. The amount paid by Spire Missouri did not materially impact the financial condition, results of operations, or cash flows of the Company.
In a letter dated June 29, 2011, the Attorney General for the stateState of Missouri informed Spire Missouri that the MDNR had completed an investigation of the site.second site, Station A. The Attorney General requested that Spire Missouri participate in the follow up investigations of the site. In a letter dated January 10, 2012, Spire Missouri stated that it would participate in future environmental response activities at the site in conjunction with other potentially responsible parties (PRPs) that are willing to contribute to such efforts in a meaningful and equitable fashion.PRPs. Accordingly, Spire Missouri entered into a cost sharing agreement for remedial investigation with other PRPs. Pending MDNR approval, which has not occurred to date,never approved the agreement, so no remedial investigation of the site will begin.
Additionally, in correspondence dated November 30, 2016, Region 7 of the EPA has asserted that Spire Missouri is liable under Section 107(a) of the Comprehensive Environmental Response, Compensation, and Liability Act of 1980 (CERCLA) for alleged coal gas waste contamination at a third site, in the northern portion of the City on which Spire Missouri operated a MGP. Spire Missouri has not owned or operated the site (also known as Station “B”) for over 70 years.B. Spire Missouri and the site owner have met with the EPA and reviewed its assertions. Both Spire Missouri and the site owner have notified the EPA that the information and data provided by the EPA to date does not rise to the level of documenting a threat to the public health or environment. As such, in March 2017 Spire Missouri is requestingrequested more information from the EPA, some of which will also be utilized to identify other former owners and operators of the site that could be added as PRPs. To date,EPA. Spire Missouri has notnever received a response from the EPA.
Spire Missouri has notified its insurers that it seeks reimbursement for costs incurred in the past and future potential liabilities associated with thethese MGP sites. While some of the insurers have denied coverage and reserved their rights, Spire Missouri continuesretains the right to discussseek potential reimbursements withfrom them.
On March 10, 2015, Spire Missouri received a Section 104(e) information request under CERCLA from EPA Region 7 regarding the former Thompson Chemical/Superior Solvents site in the City. In turn, Spire Missouri issued a Freedom of Information Act (FOIA) request to the EPA on April 3, 2015, in an effort to identify the basis of the inquiry. The FOIA response from the EPA was received on July 15, 2015, and a response was provided to the EPA on August 15, 2015. Spire Missouri has received no further inquiry from the EPA regarding this matter.
In its western service area, Spire Missouri has seven6 owned MGP sites enrolled in the BVCP:BVCP, including Joplin MGP #1, St. Joseph MGP #1, Kansas City Coal Gas Station B, Kansas City Station A Railroad area, Kansas City Coal Gas Station A, North, Kansas City Coal Gas Station A South, and Independence MGP #2. Source removal has been conducted at all of the owned sites since 2003 with the exception of Joplin. On September 15, 2016, a request was made with the MDNR for a restrictive covenant use limitation with respect to Joplin. Remediation efforts at the sevensix sites are at various stages of completion, ranging from groundwater monitoring and sampling following source removal activities to the aforementioned request in respect to Joplin.for the Joplin site. As part of its participation in the BVCP, Spire Missouri communicates regularly with the MDNR with respect to its remediation efforts and monitoring activities at these sites. On May 11, 2015, MDNR approved the next phase of investigation at the Kansas City Station A North and Railroad areas.
Spire Alabama
Spire Alabama is in the chain of title of nine9 former MGP sites, four4 of which it still owns, and five5 former manufactured gas distribution sites, one1 of which it still owns. Spire Alabama does not foresee a probable or reasonably estimable loss associated with these nine sites. Spire Alabama and the Company do not expect potential liabilities that may arise from remediating these sites to have a material impact on their future financial conditions or results of operations.
In 2012, Spire Alabama responded to an EPA Request for Information Pursuant to Section 104 of CERCLA relating to the 35th Avenue Superfund Site located in North Birmingham, Jefferson County, Alabama. Spire Alabama was identified as a PRP under CERCLA for the cleanup of the site or costs the EPA incurs in cleaning up the site. At this point, Spire Alabama has not been provided information that would allow it to determine the extent, if any, of its potential liability with respect to the 35th Avenue Superfund Site and vigorously denies its inclusion as a PRP.
Spire
In addition to those discussed above for Spire Missouri and Spire Alabama, Spire is aware of the following contingent matters.
Spire Marketing, along with many natural gas industry participants, faced the unprecedented effects of Winter Storm Uri. Numerous natural gas producers and midstream operators were unable to deliver natural gas to market as they experienced wellhead freeze-offs, power outages and equipment failure due to the extreme weather. These events resulted in supply curtailments, and related notices of force majeure to excuse performance, from and to certain counterparties. Further, these events have made Spire Marketing subject to various commercial disputes (including regarding force majeure) and a regulatory dispute regarding tariff obligations as a shipper on an interstate pipeline. As such, Spire Marketing has recorded an estimate of potential liabilities for damages based on communications with counterparties to date and the facts and circumstances surrounding each transaction. It is expected that the estimate will change as new facts emerge or settlements are reached, and it is possible that final settlement amounts may materially differ from the current estimate.
In February 2018, the Company was made aware of a complaint filed with the U.S. Department of Housing and Urban Development (HUD) by the South Alabama Center for Fair Housing and the National Community Reinvestment Coalition. The complaint alleged that Spire Gulf discriminated against unspecified residents of Eight Mile, Alabama, on the basis of race in violation of the Fair Housing Act by failing to adequately address the odorant release that occurred in 2008. On December 17, 2013,2, 2020, HUD issued a determination that found no reasonable cause exists that Spire Gulf discriminated against residents in Eight Mile, Alabama.
17. LEASES
The lease agreement covering the Company’s primary office space in St. Louis extends through February 2035, with an incident occurred at a Housing Authority apartment complexoption to renew for an additional five years. Spire Alabama’s lease agreement for office space in Birmingham Alabama that resultedextends through January 2024. The lease agreement covering Spire Marketing and Spire Storage office space in one fatality, personal injuriesHouston extends through December 2028, with options to terminate three years earlier or to renew for an additional five years. The renewal options in the St. Louis and property damage.Houston leases are reasonably certain to be exercised and are included in the lease term used to determine the right-of-use assets and lease liabilities. The Company and its subsidiaries have other relatively minor rental arrangements for real estate and equipment with remaining terms of up to nine years.
Operating lease cost, cash flow and noncash information are shown in the following table.
|
| Spire |
|
| Spire Missouri |
|
| Spire Alabama |
| |||||||||||||||
|
| 2021 |
|
| 2020 |
|
| 2021 |
|
| 2020 |
|
| 2021 |
|
| 2020 |
| ||||||
Operating lease cost, including amounts capitalized |
| $ | 7.2 |
|
| $ | 8.7 |
|
| $ | 0.4 |
|
| $ | 0.5 |
|
| $ | 2.1 |
|
| $ | 3.5 |
|
Cash flow and noncash information about operating leases: |
|
|
|
|
|
|
|
|
|
|
|
|
|
|
|
|
|
|
|
|
|
|
|
|
Operating cash flows representing cash paid for amounts included in the measurement of lease liabilities |
|
| 7.2 |
|
|
| 8.5 |
|
|
| 0.4 |
|
|
| 0.5 |
|
|
| 2.1 |
|
|
| 3.3 |
|
Right-of-use assets obtained in exchange for lease liabilities |
|
| — |
|
|
| 71.1 |
|
|
| — |
|
|
| 2.1 |
|
|
| — |
|
|
| 10.0 |
|
The aggregate rental expense for fiscal year 2019 (under ASC 840) was $10.9, $3.7, and $5.2 for Spire, Spire Missouri, and Spire Alabama, cooperatedrespectively.
The following table shows year-end balance sheet and weighted-average information about operating leases.
|
| Spire |
|
| Spire Missouri |
|
| Spire Alabama |
| |||||||||||||||
|
| 2021 |
|
| 2020 |
|
| 2021 |
|
| 2020 |
|
| 2021 |
|
| 2020 |
| ||||||
Right-of-use assets |
| $ | 60.4 |
|
| $ | 65.1 |
|
| $ | 1.4 |
|
| $ | 1.7 |
|
| $ | 4.8 |
|
| $ | 6.7 |
|
Lease liabilities, current |
|
| 6.5 |
|
|
| 6.5 |
|
|
| 0.3 |
|
|
| 0.3 |
|
|
| 1.9 |
|
|
| 1.9 |
|
Lease liabilities, noncurrent |
|
| 53.7 |
|
|
| 58.4 |
|
|
| 1.0 |
|
|
| 1.4 |
|
|
| 2.7 |
|
|
| 4.7 |
|
Weighted-average remaining lease term |
| 15.3 years |
|
| 15.9 years |
|
| 4.5 years |
|
| 5.3 years |
|
| 2.3 years |
|
| 3.3 years |
| ||||||
Weighted-average discount rate |
|
| 4.2 | % |
|
| 4.2 | % |
|
| 2.5 | % |
|
| 2.5 | % |
|
| 2.2 | % |
|
| 2.2 | % |
On the balance sheets, right-of-use assets are included in “Deferred Charges and Other Assets: Other,” current lease liabilities are in “Current Liabilities: Other,” and noncurrent lease liabilities are in “Deferred Credits and Other Liabilities: Other.”
Following is a maturity analysis by fiscal year for operating lease liabilities as of September 30, 2021.
|
| Spire |
|
| Spire Missouri |
|
| Spire Alabama |
| |||
2022 |
| $ | 6.6 |
|
| $ | 0.3 |
|
| $ | 1.9 |
|
2023 |
|
| 7.2 |
|
|
| 0.3 |
|
|
| 2.1 |
|
2024 |
|
| 5.8 |
|
|
| 0.3 |
|
|
| 0.7 |
|
2025 |
|
| 5.1 |
|
|
| 0.3 |
|
|
| — |
|
2026 |
|
| 5.0 |
|
|
| 0.2 |
|
|
| — |
|
Thereafter |
|
| 53.4 |
|
|
| — |
|
|
| — |
|
Total undiscounted lease payments |
|
| 83.1 |
|
|
| 1.4 |
|
|
| 4.7 |
|
Less present value discount |
|
| (22.9 | ) |
|
| (0.1 | ) |
|
| (0.1 | ) |
Total current and noncurrent lease liabilities |
| $ | 60.2 |
|
| $ | 1.3 |
|
| $ | 4.6 |
|
There are no significant finance leases, short-term leases, subleases, variable lease payments, residual value guarantees, restrictions or covenants pertaining to leases.
The Company elected, for all asset classes, not to recognize right-of-use assets and lease liabilities for short-term leases. Instead, the lease payments for short-term leases are recognized in profit or loss on a straight-line basis over the lease term and variable lease payments are recognized in the period in which the obligation for those payments is incurred. The Company elected, for all asset classes, not to separate nonlease components from lease components and instead to account for each separate lease component and the nonlease components associated with the National Transportation Safety Board (NTSB) which investigated the incident. The NTSB report of findings was issued on March 30, 2016 and no safety recommendations, fines, or penalties were contained therein. Spire Alabama has been namedthat lease component as a defendant in several lawsuits arising fromsingle lease component.
The discount rate used for all the incident, and additional lawsuits and claims may be filed against Spire Alabama.
| Three Months Ended | Dec. 31 | March 31 | June 30 | Sept. 30 | |||||||||||
| Fiscal Year 2017 | |||||||||||||||
| Total Operating Revenues | $ | 495.1 | $ | 663.4 | $ | 323.5 | $ | 258.7 | |||||||
| Operating Income | 89.1 | 180.4 | 50.3 | 1.9 | |||||||||||
| Net Income (Loss) | 45.2 | 108.0 | 21.7 | (13.3 | ) | ||||||||||
| Basic Earnings (Loss) Per Share of Common Stock | $ | 0.99 | $ | 2.36 | $ | 0.45 | $ | (0.28 | ) | ||||||
| Diluted Earnings (Loss) Per Share of Common Stock | $ | 0.99 | $ | 2.36 | $ | 0.45 | $ | (0.28 | ) | ||||||
| Fiscal Year 2016 | |||||||||||||||
| Total Operating Revenues | $ | 399.4 | $ | 609.3 | $ | 249.3 | $ | 279.3 | |||||||
| Operating Income (Loss) | 87.0 | 167.7 | 35.3 | (7.7 | ) | ||||||||||
| Net Income (Loss) | 46.9 | 100.8 | 10.7 | (14.2 | ) | ||||||||||
| Basic Earnings (Loss) Per Share of Common Stock | $ | 1.08 | $ | 2.32 | $ | 0.24 | $ | (0.31 | ) | ||||||
| Diluted Earnings (Loss) Per Share of Common Stock | $ | 1.08 | $ | 2.31 | $ | 0.24 | $ | (0.31 | ) | ||||||
| Three Months Ended | Dec. 31 | March 31 | June 30 | Sept. 30 | |||||||||||
| Fiscal Year 2017 | |||||||||||||||
| Total Operating Revenues | $ | 363.6 | $ | 447.2 | $ | 198.5 | $ | 162.6 | |||||||
| Operating Income | 64.5 | 90.2 | 30.5 | 11.7 | |||||||||||
| Net Income | 38.0 | 57.0 | 15.5 | 2.5 | |||||||||||
| Fiscal Year 2016 | |||||||||||||||
| Total Operating Revenues | $ | 317.2 | $ | 446.7 | $ | 179.3 | $ | 144.3 | |||||||
| Operating Income | 65.1 | 87.0 | 29.4 | 5.4 | |||||||||||
| Net Income (Loss) | 39.4 | 54.3 | 13.9 | (1.7 | ) | ||||||||||
| Three Months Ended | Dec. 31 | March 31 | June 30 | Sept. 30 | |||||||||||
| Fiscal Year 2017 | |||||||||||||||
| Total Operating Revenues | $ | 86.7 | $ | 158.8 | $ | 90.5 | $ | 64.5 | |||||||
| Operating Income (Loss) | 19.8 | 78.9 | 15.5 | (8.4 | ) | ||||||||||
| Net Income (Loss) | 10.3 | 47.6 | 7.4 | (7.2 | ) | ||||||||||
| Fiscal Year 2016 | |||||||||||||||
| Total Operating Revenues | $ | 82.3 | $ | 166.0 | $ | 74.0 | $ | 46.2 | |||||||
| Operating Income (Loss) | 18.9 | 80.4 | 9.3 | (17.1 | ) | ||||||||||
| Net Income (Loss) | 9.9 | 48.1 | 4.0 | (8.8 | ) | ||||||||||
Item 9. Changes in and Disagreements with Accountants on Accounting and Financial Disclosure
There have been no changes in or disagreements on accounting and financial disclosure with Spire’s, Spire Missouri’s, or Spire Alabama’s outside auditors that are required to be disclosed.
Item 9A. Controls and Procedures
Spire
Evaluation of Disclosure Controls and Procedures
As of the end of the period covered by this report, we carried out an evaluation, under the supervision and with participation of our management, including our Chief Executive Officer and Chief Financial Officer, of the effectiveness of the design and operation of our disclosure controls and procedures pursuant to Rule 13a-15(e) and Rule 15d-15(e) under the Securities Exchange Act of 1934, as amended. Based upon such evaluation, the Chief Executive Officer and Chief Financial Officer concluded that our disclosure controls and procedures are effective.
Change in Internal Control over Financial Reporting
There were no changes in our internal control over financial reporting that occurred during our fourth fiscal quarter that have materially affected, or are reasonablereasonably likely to materially affect, our internal control over financial reporting.
Spire Missouri
Evaluation of Disclosure Controls and Procedures
As of the end of the period covered by this report, we carried out an evaluation, under the supervision and with participation of our management, including our Chief Executive Officer and Chief Financial Officer, of the effectiveness of the design and operation of our disclosure controls and procedures pursuant to Rule 13a-15(e) and Rule 15d-15(e) under the Securities Exchange Act of 1934, as amended. Based upon that evaluation, the Chief Executive Officer and Chief Financial Officer concluded that our disclosure controls and procedures are effective.
Changes in Internal Control over Financial Reporting
There were no changes in our internal control over financial reporting that occurred during our fourth fiscal quarter that have materially affected, or are reasonablereasonably likely to materially affect, our internal control over financial reporting.
Spire Alabama
Evaluation of Disclosure Controls and Procedures
As of the end of the period covered by this report, we carried out an evaluation, under the supervision and with participation of our management, including our Chief Executive Officer and Chief Financial Officer, of the effectiveness of the design and operation of the disclosure controls and procedures pursuant to Rule 13a-15(e) and Rule 15d-15(e) under the Securities Exchange Act of 1934, as amended. Based upon that evaluation, the Chief Executive Officer and Chief Financial Officer concluded that our disclosure controls and procedures are effective.
Changes in Internal Control over Financial Reporting
There were no changes in our internal control over financial reporting that occurred during our fourth fiscal quarter that have materially affected, or are reasonably likely to materially affect, our internal control over financial reporting.
The Management Reports on Internal Control Over Financial Reporting and the Reports of Independent Registered Public Accounting Firm are included under
Item 9B. Other Information
None.
PART III
Item 10. Directors, Executive Officers and Corporate Governance
Information about:
• | our directors is incorporated by reference from the discussion under Proposal 1 of our proxy statement to be filed on or about December 15, 2021 (“2021 proxy statement”); |
• | our executive officers is reported in Part I of this Form 10-K; |
• | our Financial Code of Ethics is posted on our website, www.SpireEnergy.com, under Investors/Governance/Governance documents (http://investors.spireenergy.com/governance/governance-documents); and |
• | our Audit Committee, our Audit Committee financial experts, and submitting nominations to the Corporate Governance Committee |
is incorporated by reference from the discussion in our 20172021 proxy statement under the heading “Section 16(a) Beneficial Ownership Reporting Compliance”;
In addition, our Code of Business Conduct, Corporate Governance Guidelines, and charters for our Audit, Compensation and Corporate Governance Committees are available under “Governance documents” on our website, as indicated above, and a copy will be sent to any shareholder upon written request.
Item 11. Executive Compensation
Information about director and executive compensation is incorporated by reference from the discussion in our 20172021 proxy statement under the headings:headings “Directors’ Compensation,” “Compensation Discussion and Analysis,”compensation” and “Executive Compensation.compensation.” The 2017 proxy statement also includes the “Compensation Committee Report,” which is deemed furnished and not filed.
Item 12. Security Ownership of Certain Beneficial Owners and Management and Related Stockholder Matters
Information about about:
• | security ownership of certain beneficial owners and management and |
• | aggregate information regarding the Company’s equity compensation plan |
is incorporated by reference from the discussion in our 20172021 proxy statement under “Beneficial Ownershipownership of Spire Common Stock.stock.”
| Plan category | Number of securities to be issued upon exercise of outstanding options, warrants and rights | Weighted average exercise price of outstanding options, warrants and rights | Number of securities remaining available for future issuance under equity compensation plans (excluding securities reflected in column (a)) | ||
| (a) | (b) | (c) | |||
| Equity compensation plans approved by security holders (1) | 674,970 | $— | 505,545 | ||
| Equity compensation plans not approved by security holders | — | — | — | ||
| Total | 674,970 | $— | 505,545 | ||
Item 13. Certain Relationships and Related Transactions, and Director Independence
Information about:
• | our policy and procedures for related party transactions and |
• | the independence of our directors |
is included in our 20172021 proxy statement under “Corporate Governance”“Governance” and is incorporated by reference. There were no related party transactions in fiscal 2017.
Item 14. Principal Accounting Fees and Services
Information about fees paid to our independent registered public accountant and our policy for pre-approval of services provided by our independent registered public accountant is incorporated by reference from our 20172021 proxy statement under “Fees of Independent Registered Public Accountant”independent registered public accountant” and “Corporate Governance,“Governance,” respectively.
PART IV
Item 15. Exhibits, Financial Statement Schedules
See Item 8, Financial Statements and Supplementary Data, filed herewith, for a list of financial statements.
Schedules have been omitted because they are not applicable, related significance tests were not met, or the required data has been included in the financial statements or notes to financial statements.
Bold items reflect management Item 16. Form 10-K Summary None. SIGNATURES Pursuant to the requirements of Section 13 or 15(d) of the Securities Exchange Act of 1934, the registrant has duly caused this report to be signed on its behalf by the undersigned, thereunto duly authorized.
Pursuant to the requirements of the Securities Exchange Act of 1934, this report has been signed below by the following persons on behalf of the registrant and in the capacities and on the dates indicated.
Pursuant to the requirements of Section 13 or 15(d) of the Securities Exchange Act of 1934, the registrant has duly caused this report to be signed on its behalf by the undersigned, thereunto duly authorized.
Pursuant to the requirements of the Securities Exchange Act of 1934, this report has been signed below by the following persons on behalf of the registrant and in the capacities and on the dates indicated.
140 | |||||||||||||||||||||||||||||||||||||||||||||||||||||||||||||||||||||||||||||||||||||||||||||||||||||||||||||||||||||||||||||||||||||||||||||||||||||||||||||||||||||||||||||||||||||||||||||||||||||||||||||||||||||||||||||||||||||||||||||||||||||||||||||||||||||||||||||||||||||||||||||||||||||||||||||||||||||||||||||||||||||||||||||||||||||||||||||||||||||||||||||||||||||||||||||||||||||||||||||||||||||||||||||||||||||||||||||||||||||||||||||||||||||||||||||||||||||||||||||||||||||||||||||||||||||||||||||||||||||||||||||||||||||||||||||||||||||||||||||||||||||||||||||||||||||||||||||||||||||||||||||||||||||||||||||||||||||||||||||||||||||||||||||||||||||||||||||||||||||||||||||||||||||||||||||||||||||||||||||||||||||||||||||||||||||||||||||||||||||||||||||||||||||||||||||||||||||||||||||||||||||||||||||||||||||||||||||||||||||||||||||||||||||||||||||||||||||||||||||||||||||||||||||||||||||||||||||||||||||||||||||||||||||||||||||||||||||||||||||||||||||||||||||||||||||||||||||||||||||||