Table of the registrant's Proxy Statement for its 2018 Annual Meeting of Stockholders are incorporated by reference in Part III of this report. Such proxy statement will be filed with the Securities and Exchange Commission within 120 days of the registrant's fiscal year ended December 31, 2017.Contents
VOCERA COMMUNICATIONS, INC.
ANNUAL REPORT ON FORM 10-K
FOR THE ANNUAL PERIOD ENDED DECEMBER 31, 20172021
INDEX
| Page | ||||||||||||||
| PART I | ||||||||||||||
| Item 1. | Business | |||||||||||||
| Item 1A. | Risk | |||||||||||||
| Item 1B. | Unresolved Staff Comments | |||||||||||||
| Item 2. | Properties | |||||||||||||
| Item 3. | Legal Proceedings | |||||||||||||
| Item 4. | Mine Safety Disclosures | |||||||||||||
| PART II | ||||||||||||||
| Item 5. | Market for Registrant's Common Equity, Related Stockholder Matters and Issuer Purchases of Equity Securities | |||||||||||||
| Item 6. | ||||||||||||||
| Item 7. | Management's Discussion and Analysis of Financial Condition and Results of Operations | |||||||||||||
| Item 7A. | Quantitative and Qualitative Disclosures About Market Risk | |||||||||||||
| Item 8. | Financial Statements and Supplementary Data | |||||||||||||
| Item 9. | Changes in and Disagreements with Accountants on Accounting and Financial Disclosure | |||||||||||||
| Item 9A. | Controls and Procedures | |||||||||||||
| Item 9B. | Other Information | |||||||||||||
| Disclosure Regarding Foreign Jurisdictions that prevent Inspections | ||||||||||||||
| PART III | ||||||||||||||
| Item 10. | Directors, Executive Officers and Corporate Governance | |||||||||||||
| Item 11. | Executive Compensation | |||||||||||||
| Item 12. | Security Ownership of Certain Beneficial Owners and Management and Related Stockholder Matters | |||||||||||||
| Item 13. | Certain Relationships and Related Transactions, and Director Independence | |||||||||||||
| Item 14. | Principal Accounting Fees and Services | |||||||||||||
| PART IV | ||||||||||||||
| Item 15. | Exhibits and Financial Statement Schedule | |||||||||||||
| Item 16. | Form 10-K Summary | |||||||||||||
Index to Exhibits | ||||||||||||||
| Signatures | ||||||||||||||
2
PART I
This Annual Report on Form 10-K contains forward-looking statements that are based on our beliefs and assumptions regarding future events and circumstances, including statements regarding our strategies, our opportunities, developments in the healthcare market, acquisitions, our relationships with our customers and contract manufacturer and other matters. These statements are principally contained in Item 1, Business; Item 1A, Risk Factors; Item 7, Management's Discussion and Analysis of Financial Condition and Results of Operations; and other sections of this Annual Report on Form 10-K. Forward-looking statements include statements that are not historical facts and can be identified by words such as “project,” “believe,” “anticipate,” “plan,” “expect,” “estimate,” “intend,”, "seeks", “continue,” “should,” “would,” “could,” “potentially,” “will” or “may,” or other similar words and phrases.
Forward-looking statements are subject to known and unknown risks, uncertainties and other factors that could cause actual results to differ materially from the results anticipated by these forward-looking statements. These risks, uncertainties and factors include those we discuss in this annual report in Item 1A, Risk Factors. You should read these risk factors and the other cautionary statements made in this Annual Report on Form 10-K as being applicable to all related forward-looking statements wherever they appear in this Annual Report on Form 10-K. It is not possible for us to predict all risks that could affect us, nor can we assess the impact of all factors on our business or the extent to which any factor, or combination of factors, may cause actual results to differ materially from those contained in any forward-looking statements we may make. Moreover, new risks emerge from time to time.
The forward-looking statements made in this Annual Report on Form 10-K relate only to events as of the date on which the statements are made. We undertake no obligation to update publicly any forward-looking statements, whether as a result of new information, future events or otherwise, except as required by law.
Item 1.Business
Overview
We are a provider of secure, integrated, intelligent communication and clinical workflow solutions, focused on empowering mobile workers in healthcare, hospitality, retail, energy, education and other mission-critical mobile work environments in the United States and internationally. Today, theThe significant majority of our business is generated from sales of our solutions in the healthcare market to help our customers improveenhance quality of care, safety, patient and staff experience, staff resiliency and improve operational efficiency. Care teams at nearly 1,500over 2,300 healthcare facilities worldwide have selected our solutions to call and text securely,communicate with others, reduce alarm fatigue, and toimprove staff safety, enhance workflow, and help improve patient experience. Our solutions can also be found in hotels, nuclear power facilities, schools, libraries, retail stores and other environments where mobile workers need to communicate and access resources instantly.
Our communication and collaboration solution which includes an intelligent enterprise software platform; a lightweight, wearable, voice-controlled communication badge; and smartphone applications, enables users to connect instantly with other staff simply by saying the name, function or group name of the desired recipient. Our solution includes an intelligent enterprise software platform; lightweight, wearable, voice-controlled communication devices; as well as smartphone applications. It also delivers HIPAA-compliant secure text messages, alerts and alarms directly to a range ofthe Vocera Badge, Vocera Smartbadge, smartphones and other mobile communication devices both inside and outside the hospital in order of priority, replacing legacy processes and technologies including pagers and in-building wireless and landline phones.
At the core of this solution is a patent-protected, enterprise-class server software platform. Our software platform is built uponon a scalable architecture and recognizes more than 100 spoken commands. Users can instantly communicate with others using the Vocera CommunicationSmartbadge or Vocera Badge, or through clientsmartphone applications developed for iOS and Android mobile devices. Our platform solution lets users communicate and collaborate with each other using real time voice or HIPAA-compliant secure texting, and unlike other solutions, allows users to reach people by their role, room assignment, functional group or department, without needing to know a person’s name or phone number. The system can also broadcast emergency messages to a single department or to an entire organization. Our solution can be integrated with other clinical systems, including Electronic Health Records (EHR), nurse call, patient monitoring and even some medical devices, to provide critical data, alerts, alarms and clinical context that enables better workflow. Our enterprise-class software platform also features an advanced clinical rules engine that unifies data from multiple sources simultaneously, enables prioritization of notifications, adds patient context, and sends messages to the right care team members on their mobile devices. Our platform allows clinicians to be away from the bedside while staying informed about their patients. Our portfolio of over 120150 unique integrations enhances clinical workflow by enabling the interoperability of our solution with a significant number of clinical and operational systems used in hospitals today.
Beyond healthcare, our solutions are used to quickly and contextually connect staff in other mission-critical mobile-worker environments. In the hospitality industry, it is used to enhance guest experience, as well as staff safety, productivity, and responsiveness. In the nuclear power industry, our solutions are used to instantly connect people and resources. In education,
3
schools use our solutions to increase security, safety and staff communication and libraries use itour solutions to enable their staff to be more mobile and attentive to patrons.
And, in retail, our solutions are used to enhance the customer experience by enabling store personnel to quickly connect in and across various locations.
Over our 18-year22-year history, we have significantly enhanced and added features and functionality to these solutions through ongoing development based on frequent interactions with our customers.
Vocera Ease is Vocera Care Experience, a hosted software suite that coordinatesour cloud-based communication platform and streamlines provider-to-patient and provider-to-provider communicationmobile application built to improve qualitythe patient experience by enabling friends and family members to receive timely updates about the progress of their loved one in the hospital. The Vocera Ease app enables nurses and other care team members to send HIPAA-compliant texts, photos, and video updates to patients’ loved ones, putting them at ease and saving valuable time.
In May 2021, we acquired PatientSafe Solutions, Inc. (now marketed and sold under the Vocera Edge brand). Vocera Edge provides a clinical communication and collaboration (CC&C) solution for smartphones that is engineered to run either on-premises or in the cloud. The solution is designed for hospitals and health systems that have invested in their electronic health record (EHR) mobile workflow software, are smartphone centric, and prefer a cloud-based CC&C solution. The solution enhances care team mobility and efficiency at the point of care patientthrough effective, reliable communication and staff experience, reduce care provider's riskclinical workflows. Nurses can document to the EHR while receiving filtered, prioritized alarm and improve reimbursements. The solution provides personalized patient instructionstask notifications. Physicians can communicate with the nurses and education; provides alertsteam members supporting their patients. Two-way communication with a hospital’s EHR system enables clinicians to complete certain documentation and notifications to physicians and caregivers of patients’ changing care plans or status; and tracks patient experience before, during and after hospitalization.
As of December 31, 2017,2021, our solutions were selected by nearly 1,500over 2,300 healthcare facilities, including large hospital systems, small and medium-sized local hospitals, clinics, surgery centers and aged-care facilities. We sell our solutions to our healthcare customers primarily through our direct sales force in the United States, with resellers for certain vertical markets as well as our U.S. Government business, and through both direct sales and select distribution channels in international markets.
We were incorporated in Delaware on February 16, 2000. Our corporate headquarters are located at 525 Race Street,3030 Orchard Parkway, San Jose, California, 95126,95134, and our main telephone number is (408) 882‑5100. We maintain a website at www.vocera.com. The contents of our website are not incorporated into, or otherwise to be regarded as part of, this Annual Report on Form 10-K.
Vocera® is our primary registered trademark in the United States. Other trademarks appearing in this document are the property of their respective holders.
Industry overview
Vocera provides communication and workflow solutions for mobile workers in healthcare, hospitality, retail, energy, education and other industries. Healthcare is our largest vertical market.
Hospital communication is still predominantly conducted through multiple disparate, non-integrated systems, including pagers, overhead paging, portable in-building wireless phones and individuals’ personal mobile phones. These non-integrated communication methods are inefficient and often unreliable; not providinglacking “closed loop” communication, workflow standardization, or the scale required by health systems. Further, they often contribute to noisy environments for patients and negatively impact healing, safety, quality of care and operational efficiency.
Broadly, we believe the healthcare industry is placing greater emphasis on the need for better communication and workflow to meet increasing requirements for care quality, efficiency, patient satisfaction and staff safety and resiliency. Hospitals are struggling to attract and retain the needed nurses and other frontline caregivers to meet their demands.The pandemic has resulted in many nurses leaving the profession and hospital administrators are looking for tools and technologies that can help connect and protect frontline caregivers.The need for clinical communication and workflow solutions is being identified as a key technology to improve staff and patient safety, efficiencythroughput, and patient satisfaction. Healthcare providers also require greater coordination of care among clinicians for the industry’s shift towards population health and paying for value instead of the traditional fee-for-service reimbursement model. This shift to value-based purchasing incorporates financial incentives for hospitals to improve the quality of care and patient satisfaction.retention. A number of non-government organizations, such as The Joint Commission, are also requiring improvements in patient safety and quality of care. These forces are driving hospitals to invest in technology and process improvements to manage their operations more efficiently, improve quality of care, and increase patient satisfaction and staff resiliency. Our solutions help hospitals increase productivity and reduce costs by enhancing workflow and improving patient and staff satisfaction through secure, integrated and intelligent communication.
4
Our strategy
Our goal is to extend our leadership position as a provider of communication and workflow solutions in the healthcare market and add new customers in non-healthcare markets.
Key elements of our strategy include:
•Expand our business to new U.S. healthcare customers. We believe our solutions can provide significant value to health systems, hospitals and smaller healthcare facilities. We plan to continue to add new customers among hospitals of all sizes, and expand to outpatient clinics, aged-care and skilled nursing facilities.
We are increasingly selling enterprise level deployments across entire health systems which is resulting in higher average selling prices.•Further expand our footprint within our existing installed customer base. Typically, Many of our customers initially deploy our solutions in a fewseveral departments of a hospital and gradually expand to additional departments as they come to fully appreciate its value.the value of the solutions. We have a significant opportunity to up-sell and cross-sell to our existing customers, including into new hospitals that are part of an existing healthcare system customer. Key sales strategies include expanding our footprint at existing customer facilities and capturing additional revenue by cross selling additional solutions.some of our newer solutions like Engage, Ease, Edge, and the Smartbadge. We plan to continue expanding within our existing customers in order to grow our revenue and maintain and improve the customer experience.
•Extend our technology advantage and create new product solutions. We intend to continue our investment in research and development to enhance the functionality of our solutions and further differentiate them from other competing solutions. WeAs we did with the COVID-19 related enhancements and features, introduction of the Smartbadge in January 2019, and the introduction of the new Vina Smartphone Application in September 2019, we plan to continue to invest in product upgrades, product line extensions and new solutions to enhance our portfolio, including further development of applications for iOS and Android devices.
•Increase our health system selling efforts. Our increasingly comprehensive product suite is enabling us to sell to more large health systems. These sales efforts typically involve conversations with more senior decision makers and result in larger deal sizesdeals with complex and elongated sales cycles. We have organized a nationalinvested and will continue to invest in our sales accounts teamforce and marketing to enhance our ability to pursue more of these opportunities in the future.
•Invest in partnerships. In order to gain access to clinical data and patient context needed to To create a highlymore efficient communication and workflow system for the entire care team our solution needs to access clinical data and patient context. To enhance that access, we plan to continue to broaden our ecosystem of technology partners, including vendors that provide nurse call systems, patient monitoring systems, analytics and EHRs. We are developing a range of businessadded new partnerships in 2021 and will continue to explore new relationships that broaden our overall market presence and accelerate the sales of our offerings.
•Pursue acquisitions of complementary businesses, technologies and assets. Over the last sevenseveral years we have completed a number of acquisitions to help us achieve our strategic vision by enhancing our product offeringproducts and enabling us to enter new markets. Our acquisitions have expanded our solutions, offering, demonstrating that we can successfully source, acquire and integrate complementary businesses, technologies and assets. With the acquisition of PatientSafe Solutions, Inc. in May 2021, we further strengthened our ability to improve the lives of patients, families and care teams. We intend to continue to pursue acquisition opportunities that we believe can accelerate the growth of our business.
•Grow our international healthcare presence. Today, in addition to our core U.S. market, we sell into other English-speaking markets, including Canada, the United Kingdom, Australia, New Zealand, and Middle Eastern countries including the United Arab Emirates, Saudi Arabia, Oman and Qatar. We believe that the rapid pace of investment in new healthcare facilities in these developing international markets provides a significant opportunity for growth. As of December 31, 2017,2021, our solutions were selected by approximately 250nearly 400 healthcare facilities outside the United States. We plan to utilize both our direct sales force and leverage channel partners to expand our presence into other markets over time.
•Expand our solutions in non-healthcare markets. While our primary focus is on the healthcare market, our solutions also provide great value in non-healthcare markets. Our solutions have been selected by facilities in markets beyond healthcare including hospitality, retail, energy, education, and other mission critical mobile worker environments. Currently, this is not a material portion of our revenue, but longerin the long term, we believe these markets could represent potential opportunities for growth.
5
Our products, technology and services
Our solutions include the Vocera Communication and Workflow System, Vocera Ease, Vocera Edge, and Vocera Care Experience and our Experience Innovation Network, a thought leadership collaborative.Experience. To complement our solutions, we provide services, support and education to help our customers optimize the benefits of our solutions.
Vocera Communication and Workflow System
The Vocera Communication and Workflow System is comprised of a unique software platform that connects communication devices, including our hands-free, wearable, voice-controlled communication badges,voice controlled Smartbadge and Badge, and third-party mobile devices that use our mobile software applications to become our enterprise-class software platform.applications. The system transforms the way mobile workers communicate by enabling them to instantly connect via voice or secure text messaging. With a portfolio of over 120150 third-party party clinical integrations, our system also enables the intelligent delivery of alerts and alarms to a variety of mobile devices, providing real time situation awareness to care providers. Our hands-free voice capability allows mobile workers to connect with the right person simply by saying or selecting the name, function or group name of the person they want to reach, often while remaining at the point-of-care. Our system responds to over 100 spoken commands.
Some examples of common commands are shown below.
| Action | Spoken commands | |||||||
| Call by name | Call John Smith. | |||||||
| Call a group member | Call an Anesthesiologist. | |||||||
| Dial a phone number or extension | Dial extension 3145. | |||||||
| Initiate a broadcast to a group | Broadcast to Emergency Response Team. | |||||||
| Locate nearest member of a group | Where is the nearest member of Security? | |||||||
| Send a voice message | Record a message for Pediatric Nursing. | |||||||
Components of the Vocera Communication and Workflow System include:
•Vocera Software Platform. At the heart of our Vocera Communication and Workflow System is a patent-protected, enterprise-class software platform. The intelligence of our client-server system is contained primarily within our server-software. This platform contains an optimized speech recognition engine, intelligent call routing and management functionality, reporting and analytics tools, clinical directories and user profiles. As part of this software platform, the Engage intelligent workflow engine allows routing, escalation and prioritization of communication and alert and alarm notifications that include patient content. In addition, our platform has the ability to integrate with a significant number of third-party clinical systems, including telephony, nurse call, patient monitoring and EHR systems. Our software platform features an advanced clinical rules engine that unifies data from multiple sources simultaneously, enables prioritization of notifications, adds patient context, and sends messages to the right care team members on their mobile devices, helping to improve patient safety and satisfaction and increase operational efficiency. By providing real-time situational awareness about the patients and care teams, we enable healthcare workers to be more effective and suffer less from alarm and alert fatigue. Recognizing the rapidly expanding footprint of care, our scalable software platform can support multiple geographic sites and multiple facilities within a healthcare system to help clinicians stay connected to the current status of their patients.
•Vocera BadgeSmartbadge. Our badgeSmartbadge is athe only wearable communication device weighing less than two ounces thatpurpose-built for patient care and can be used under PPE. Our Smartbadge is powered by the Vocera Software Platform and operates over customers’customers' industry-standard Wi-Fi networks. The badgeSmartbadge has a 2.4” touchscreen that enables the user to receive prioritized alert and alarm notifications with additional patient context. Additionally, users can make and answer calls hands-free or by holding it up to the ear for privacy, and send and receive secured text messages, using the touchscreen keyboard with no character limit. The Smartbadge also has a dedicated panic button and enhanced "do not disturb" functionality. The Smartbadge has received the FIPS 140-2 certification from the National Institute of Standards and Technology.
•Vocera Badge. Our Badge is worn clipped to a shirt or on a lanyard. It can be used to conductsmaller and lighter hands-free communication and iswearable device that allows the only hands-free device of its kind. It enablesusers instant two-way voice conversations without the need to remember a phone number or use a handset. An over-the-air update mechanism seamlessly updates device software. Our badge also incorporates automatic diagnostic mechanisms that feed data on wireless network performance backSimilar to the software platform for reportingSmartbadge, it is powered by the Vocera Software Platform and diagnosisoperates over the customers' industry-standard Wi-Fi networks and can be used underneath PPE. It has a small display that provides a concise amount of problems. Our newest B3000n badgeinformation and allows the user to receive prioritized alarm and alert notifications with limited context. The Badge has received the FIPS 140-2 certification from the National Institute of Standards and Technology. We have also received an Authority to Operate (ATO) certification from
6
the U.S. Department of Defense.Defense for the Vocera software platform and badges. Both of these certifications are requirements to sell our solutions to U.S. government and military hospital and medical facilities.
•Vocera Smartphone Applications. Vocera's suite of smartphone applications enable a seamless multi-mode communications and collaboration experience; combining the unique calling, texting, alerting and content distribution capabilities of Vocera into a secure, easy-to-use smartphone application.application that presents incoming communication in order of importance. Available and certified for use on commercially-availablecommercially available iOS and Android devices, our smartphone applications support both personal (BYOD)(bring your own device or BYOD) and shared device usage models. A specific versionPowered by the Vocera Software Platform, our new Vina Smartphone application delivers relevant context about clinical events, patient status and clinician availability, helping care teams improve safety, quality of our smartphone software includes our instant voice communication solutioncare and our secure enterprise messaging and alerting solution that enable the robust, reliable and HIPAA-compliant delivery of critical pages, text, messages, alarms and alerts. Users can receive and send messages from smartphones, through a web-based console, or through integrated third-party clinical systems. We also offer Vocera Secure Texting, an easy to use alternative to non-secure SMS texting that enables HIPAA-compliance, extending the power of our solution to physiciansexperience for patients and care teams that are located bothteams. The customizable communication application presents prioritized patient-centric calls, secure messages and alerts in a unified inbox and provides an intuitive user experience for clinicians inside and outside the hospital. Vocera Secure Texting balances security and convenience by providing an easy-to-use, HIPAA-compliant messaging application. Vocera Secure Texting is available at no additional cost to existing Vocera customers who are current with their software maintenance contract.
•Choice of Mobile Devices. We resell the Spectralink Versity Smartphone and Zebra Technologies MC40-HC and TC51TC52 Android mobile computers.computer. These devices are offered as a bundled solution with our smartphone applications to provide a complete, turnkey solution for our customers’ clinical communication needs. We also deliver our solution on iOS devices. This gives our customers a choice of different devices to access the power of the Vocera software platform.
Vocera Ease
Vocera Ease is our cloud-based SaaS communication platform and mobile application built to improve the patient experience and reduce the workload on nurses by enabling friends and family members to receive timely updates about the progress of their loved one in the hospital. The Vocera Ease app enables nurses and other care team members to send HIPAA-compliant texts, photos, and video updates to patients’ loved ones, putting them at ease and saving valuable time.
Vocera Edge
Our communication solution for smartphones which is either on-premises or cloud-based, Vocera Edge, enhances care team mobility and simplifies work at the point of care through effective, reliable workflows. Vocera Edge is ideal for smartphone-centric hospitals and health systems that are invested in EHR mobile applications and prefer a cloud-based CC&C solution. With Edge, nurses can save time by unifying the most common EHR documentation workflows and urgent, event-based communication from a single smartphone app. They can securely access patient data from the EHR at the point of care and write back directly to the patient record through closed-loop, bi-directional communication.
Vocera Care Experience
Our Care Experience solution is a hosted software suite we developed to improve patient and staff experience.experience, safety and operational quality in near-real time. Vocera Care Experience suite offers caregivers communication solutions that span the entire care continuum - before admission, during treatment and after discharge. This patient-centric solution is designed to enable hospitals and health systems to improve care quality and safety, enhance patient experience and satisfaction, simplify and automate manual tasks and procedures, improve patient satisfaction
Vocera Care Experience includes the following modules:
Services
Our customer-centric strategy is supported by our services and support capabilities, which help customers optimize their use of Vocera solutions and enhance users' experience with our products. Our services organization consists of the following:
•Professional services. Our professional services help customers successfully deploy, manage, update and/or expand their Vocera systems in order to gain the full benefits of our solutions. As of December 31, 2017,2021, our professional services team consisted of 114134 professionals with expertise in wireless communication, clinical workflow, end-user training, speech science and project management. We offer a full suite of services, including clinical workflow design, wireless assessment, solution configuration, training and project management, enabling customers to integrate our solutions and improve workflow efficiency and staff productivity. We also provide classroom and distance learning curricula for systems administrators, information technology professionals and clinical educators.
•Software Maintenancemaintenance and Technical support. We provide 24x7 technical support to our customers through our support centers in San Jose, California; Fort Wayne, Indiana; Toronto, Canada; Knoxville, TennesseeCanada and Reading, United Kingdom. As of December 31, 2017,2021, our technical support team consisted of 6090 technical support professionals with expertise in wireless, telephony, integration, servers and client devices. Our team utilizes remote diagnostic tools to proactively assess the performance of customer systems. We assign technical account management resources to our largest accounts to help them expand the use of our solutions and facilitate adoption of new functionality. Software maintenance entitles customers to unspecified upgrades, bug fixes and patch releases. Additional services, including an annual Remote System Health Assessment and biweekly technical webinar education, are offered as project-based consulting or through our membership collaborative.
7
•Vocera University. We provide hands-on, interactive educational experience through classroom training, distance learning or customized courseware covering best practices, implementation and use of our solutions. Training courses are provided for systems administrators, IT professionals and industry-specific, end-user educators.
Sales and marketing
Sales
Our sales employees call on hospitals and healthcare systems in the United States, Canada, the United Kingdom, Australia, New Zealand and several countries in the Middle East. As of December 31, 2017,2021, we had 153179 sales and account support employees. The sales team is organized to allow us to better serve our customers and to support the different elements of our sales strategy. We supplement our sales organization by utilizing a U.S. government-authorized resellerresellers to facilitate our sales to Veterans Administration and Department of Defense healthcare facilities. We also use resellers in certain vertical markets in the United States, as well as in international markets to supplement our sales efforts. Certain membersA specialized group of theour sales team focusfocuses on the development of new customer relationships with large integrated health systems and government healthcare facilities. We enhance our sales efforts by including individuals with nursing backgrounds in our sales staff individuals with nursing backgrounds to address clinical uses with, and provide utilization advice to, customers and potential customers. We have also staffed our sales team with system engineers who focus on the technical elements of system optimization, particularly wireless, and overall product configuration. We have a small direct sales team to focus on developing our non-healthcare business, including hospitality, energy, education and other mission-critical mobile work environments.
Marketing
Our marketing efforts focus on building awareness and generating demand. We believe that continuing to increase our brand recognition is important for the growth of our business as well as generating demand for our solutions. As of December 31, 2017,2021, we had 3040 employees in marketing, product management and business development.
Our customer-centric marketing strategy is important toin generating new sales leads as word of mouth promotion and testimonials are some of our most valuable marketing tools. A number of our customers have agreed to participate in video testimonials, white papers and case studies that validate the efficacy and the financial benefits of our solutions. We have been featured in numerous articles and on network television demonstrating increased patient satisfaction, streamlined hospital operations and enhanced employee satisfaction and safety. Additionally, we sponsor numerous customer-led webinars to demonstrate customer success and to let prospective customers hear from their peer group about the positive impact that our solutions have made on their hospitals. Many of our sales leads come from referrals of existing customers or users who have moved from a hospital already using Vocera to a new facility or health system. We also invest in digital outreach to better influence buyers early on in their decision-making to take advantage of changes in buying behavior within our target market.decision-making.
We have an integrated product management organization that manages the full lifecycle of our products and services; from strategy through execution to end-of-life. Our product roadmaps are driven by current and prospective customers and continually validated using primary and secondary research. We collect customer feedback through surveys and focus groups, customer visits, a customer advisory board, user forums and participation in industry standards organizations. Integral to this team are product managers and user experience designers skilled in clinical and operating workflows, and business development resources that create and manage the ecosystems of clinical and technology system partners.
Customers
Our solutions have been selected by nearly 2,800 facilities worldwide. Of these, over 1,700 facilities worldwide, of which nearly 1,5002,300 are hospitals and other healthcare facilities, and approximately 250 of thoseover 400 are outside of the United States. Our healthcare customers include national and international health and hospital systems, large and medium-sized independent and academic hospitals, small hospitals and healthcare facilities, and U.S. governmental hospitals and care facilities. With our diverse customer base we have very low customer revenue concentration.
Competition
We do not believe any single competitor offers a similar intelligent communication system to the healthcare market that allows instant, hands-free communication through voice-activated, role-based and activity-based calling, secure texting, and clinical integrations and workflows, and that features an advanced clinical rules engine that unifies data from multiple sources simultaneously on a combination of dedicated, proprietary devices, as well as third-party smartphones and other devices.
At this time, the primary alternative to our system consists of a combination of traditional communication methods utilizing wired phones, wireless in-building phones, smartphones, pagers and overhead paging systems.
8
The most significant alternative with which we compete for new sales in the hospital are in-building wireless telephones andhospitals is smartphone applications. While we compete with the providers of these wireless phones in making sales to hospitals, theyThese smartphone applications do not at this time purport to containhave the system intelligence, integrated workflow and convenience of our communication and workflow solutions. The marketsolutions and are primarily focused on basic text messaging and simple communications.
Additionally, we compete against EHR companies, which have their own smartphone application for in-building wireless phones is dominatedsecure texting that they continue to enhance. We differentiate our solutions from these vendors by large communications companies such as Cisco Systems, Ascomenabling hands-free communication via our Smartbadge and Spectralink.
Badge and offering a sophisticated rules engine to support more advanced clinical workflows with more than 150 system integrations.
We believe that the use of mobile smartphone apps for healthcare will continue to expand in our target market and may represent a source of competition, but this trend also represents an opportunity to expand our communication solutions with our smartphone applications, which enable all members of the patient's care team to connect to our software platform and participate as users on our Communication system.
We believe that the primary competitive factors at work in our market include:
•comprehensiveness of the solution, and the features provided and the ability to purchase the complete solution from a single vendor
•product performance and reliability
•the initial cost and ongoing cost of ownership
•customer service and support capabilities
•clinical expertise and our deep understanding of clinical workflows and communications challenges
We may face increased competition in the future, including from large, multinational companies or private equity backed organizations with significant resources. Potential competitors may have existing relationships with purchasers of other products and services within the hospital, which may enhance their ability to gain a foothold in our market. In addition, the continuing expansion of our communication and workflow collaboration capabilities may introduce us to a broader set of competitors. These competitors may include companies that provide clinical workflow solutions, enterprise software, cloud-based solutions and electronic health records.
Research and development
Our continued investment in research and development is critical to our business. We have assembled teams of engineers with expertise in various fields, including software, firmware, database design, applications, speech recognition, wireless communication and hardware design. We employ research and development personnel in San Jose, California; San Diego, California; Fort Wayne, Indiana; Knoxville, Tennessee;Orlando, Florida; Toronto, CanadaCanada; Reading, United Kingdom, and Bangalore, India. There were 152211 full-time research and development employees as of December 31, 2017. We also utilized small teams of2021. Finally, we have periodically engaged outsourced development firms and contractors in Indiato help us with the development and Ukraine to assist with quality assurance testing and automation, and targeted development efforts. Our research and development expenditures were $27.7 million, $18.3 million and $17.0 million in 2017, 2016 and 2015, respectively.of certain elements of our software offerings.
Intellectual property
Our success depends, in part, upon our ability to protect our core technology and intellectual property. To accomplish this, we rely on a combination of intellectual property rights, including patents, trade secrets, copyrights and trademarks, as well as customary contractual protections.
We held 3033 U.S. patents as of December 31, 2017,2021, including patents on many capabilities of our software platform and communication badge.wearable devices. The expiration dates of these patents range from 20182022 through 2032.2036. One or more utility patents have also been issued in Australia, Canada, India, Japan and the European Patent Office (with validation in Germany, the United Kingdom and the Netherlands). A European Community design patent has been issued that protects the design in multiple European jurisdictions.
In addition to the foregoing protections, we generally control access to and use of our proprietary software and other confidential information through the use of internal and external controls, including non-disclosure agreements and other statutory and contractual protections applicable to employees, contractors, customers and partners. These protections include U.S. and international copyright laws.
Our solutions include software developed and owned by us as well as software components we have licensed. These non-exclusive licenses are terminable by the licensor for cause. Certain of these licenses are for a contractually specified term and cannot be renewed without the assent of the licensor. In the event one or more of these licenses is terminated or is not renewed, we could be required to redesign substantial portions of our software in order to incorporate software components from alternative sources. An unplanned redesign of our software could materially and adversely affect our business.
9
Manufacturing operations and suppliers
We outsource the manufacturing of our wearable device products to original design manufacturers and contract manufacturers, including Sercomm and SMTC Corporation (SMTC). Our communication badgeVocera Smartbadge is currently built in Taiwan and our Vocera Badge is made in Mexico using custom tools and test equipment owned by us. Initial volumes of new products may be manufactured by our contract manufacturer in U.S. facilities. Most of our accessories, including batteries, chargers and attachments, are built by original design manufacturers (ODMs) in Asia.
These manufacturers are responsible for procuring all the components included in our products, as specified and approved by us. Some of these components are sole-sourced off-the-shelf and some are custom components built exclusively for our products. In the event we are unable to procure certain components, we could be required to redesign some of our products in order to incorporate technology from alternative sources. An unplanned redesign of our products could materially and adversely affect our business.
We require our suppliers to perform both incoming and outgoing product inspections. In addition, we perform in-house quality control and ongoing reliability testing.
We also resell the Spectralink Versity Smartphone and Zebra Technologies MC40-HC and TC51TC52 Android mobile computers.computer. These devices are offered as a bundled solution with our smartphone applications to provide a complete, turnkey solution for our customers’ clinical communication needs.
Employees and Workforce Management
As of December 31, 2017,2021, we had 590745 employees consistingdedicated to our mission of 22improving the lives of healthcare professionals and patients. These consist of 20 in manufacturing and quality operations, 152211 in research and development, 183219 in sales and marketing, 174224 in services and support and 5971 in general and administrative. Our workforce is distributed globally across 6 countries with 586 employees located in the U.S. and 159 located outside the U.S. None of our employees are covered by a collective bargaining agreement or are represented by a labor union. We consider current employee relationsour company culture to be good.a unique asset, and we believe we have maintained excellent relations with our employees.
Vocera’s workforce is governed by various federal, state, and local regulations. We monitor all key employment activities such as hiring, termination, and pay practices for compliance with established regulations globally. The Compensation Committee of our Board of Directors is responsible for monitoring our workforce management, including, among other aspects, management depth and strength assessment, leadership development, talent assessment, diversity, equity, inclusion, and belonging, and our employee experience survey results. While workforce management is overseen at the highest level of our company, it is woven into the everyday fabric of Vocera’s culture.
At Vocera, our people are our greatest asset, a competitive advantage, and are the core component behind our every success. The cultural values we put into action are: build with respect, embrace innovation, think customer first, drive for results and lead with passion. These values are the framework we align with to hire, train, manage and assess the performance of our global employees. We believe these values differentiate us and, in part, allowed us to consistently retain our employees throughout fiscal year 2021, as our attrition rate continues to be lower than benchmark data. Our employee average tenure globally is 4.8 years.
We foster a culture where our employees can thrive both at work and at home. We apply a systemic approach to culture and people and align performance with pay and rewards. As part of Vocera’s dedication to and investment in its employees, we conduct organizational health surveys designed to assess employee engagement, leadership, work environment, and culture.
Diversity, Equity, Inclusion, and Belonging: We embrace diversity and inclusion and strive to provide a rich environment with diverse skills, backgrounds, and perspectives. As of December 31, 2021, 34% of global employees, 28% of leadership positions, and 33% of our board of directors identified as female. In terms of racial and ethnic diversity, 34% of our employees in the United States self-identified as part of a minority group. At Vocera we are committed to diversity, equity, and inclusion. In 2021, we measured our employees' perceptions on this topic and scored at or above industry benchmark. 2021 was a year of program development and growth around this topic including: a comprehensive internal assessment, internal communications campaign, global listening tour, multiple diversity, equity, inclusion, and belonging virtual events, employee resource group development, required management training, and the publishing of our diversity, equity, inclusion, and belonging statement and commitment.
Employee Well-being and Resilience: We provide comprehensive benefits related to health, wellness, mental health and family resources designed to meet the needs of our diverse global workforce. Employee resilience, physical and psychological safety is of paramount importance to us in any year and was of particular focus in 2021 in light of the ongoing COVID-19 pandemic. We enhanced and promoted programs, events, and resources to support our employees' physical, financial, social, emotional, and family’s well-being through our Vocera on Wellness and Employee Assistance Programs. As part of our ongoing response to the pandemic, we provide PPE to our frontline employees, continue to implement new safety protocols, enhance utilization of existing productivity and collaboration tools, and establish structures for timely communication and decision making
10
throughout the changing environment. As a partner to healthcare providers, we connect our purpose and align our safety requirements to stand shoulder to shoulder with our customers. We facilitate frequent town halls to clearly articulate expectations and engage in meaningful dialogue with all employees. As a result of these efforts, we maintain high employee satisfaction results.
People Development: We believe in investing in our employees, and their professional growth and development is a priority for our company. We engage in detailed discussions around succession planning and talent development to achieve business results at all levels. We have robust employee development review discussions where high-performing and high potential employees are identified for future growth opportunities, as well as succession planning for future critical leadership positions. Actions and development plans as a result of this work are ongoing throughout the year. With an emphasis on supporting women in navigating and accelerating their careers, a cohort of employees participated in a career advancement program. With an added focus on developing our leaders, our people managers attended management essentials sessions, and we hosted a customized year-long leadership development program focused on our top talent and future leaders. Due to the prolonged nature of the pandemic, we offered leaders additional training to maintain high employee engagement in a largely remote working environment.
Community and Social Impact: Vocera strongly believes in giving back to local communities by volunteering and making direct donations where our employees live and work. While the global pandemic continued to limit our ability to volunteer in-person in certain regions, our employee-run community involvement council held some in-person and virtual charitable events and was able to make multiple donations to food banks and other regional and national non-profit agencies.
Backlog
Our backlog of undelivered orders, which includes non-cancellable and cancellable amounts, was $64.4$162.1 million and $69.5$109.2 million at December 31, 20172021 and 2016,2020, respectively. Of the current backlog, all but $13.4$84.2 million is expected to be delivered in 2018.2022.
Government regulations and standards
HIPAA privacy and security standards
In connection with our healthcare communications business, we access personal health information on behalf of our customers. Accordingly, in the United States, we are subject to the Health Insurance Portability and Accountability Act of 1996 (HIPAA), and its implementing regulations, which established uniform standards for certain “covered entities” (healthcare providers engaged in electronic transactions, health plans and healthcare clearinghouses) governing the conduct of certain electronic healthcare transactions and protecting the security and privacy of protected health information. The American Recovery and Reinvestment Act of 2009 included sweeping expansion of HIPAA’s privacy and security standards as reflected in the Health Information Technology for Economic and Clinical Health Act, (HITECH). Among other things, the new law makes certain HIPAA privacy and security standards directly applicable to “business associates” - independent contractors or agents of covered entities that receive or obtain protected health information in connection with providing a service on behalf of a covered entity. HITECH also increased the civil and criminal penalties that may be imposed against covered entities, business associates and possibly other persons, and gave state attorneys general new authority to file civil actions for damages or injunctions in federal courts to enforce the federal HIPAA laws and seek attorney’s fees and costs associated with pursuing federal civil actions. Most of our customers are covered entities under HIPAA and, to the extent that we access personal health information on their behalf, we are their “business associates” and are subject to HIPAA and associated contractual obligations, as well as comparable state privacy and security laws.
In addition, we are subject to privacy and security regulations in other jurisdictions. For example, the European Union (EU) adopted the Data Protection Directive (DPD) (officially Directive 95/46/EC), imposing strict regulations and establishing a series of requirements regarding the storage of personally identifiable information on computers or recorded on other electronic media. This has been implemented by all EU member states through national laws. DPD provides for specific regulations requiring all non-EU countries doing business with EU member states to provide adequate data privacy protection when receiving personal data from any of the EU member states. Inin May 2016, the EU formally adopted the General Data Protection Regulation, or GDPR, which will apply to all EU member states beginningbecame effective in May 2018 and will replace the current DPD.2018. The regulation introducesintroduced new data protection requirements in the EU and substantial fines for breaches of the data protection rules. It will increaseincreased our responsibility and liability in relation to personal datainformation that we process and we expect to put in place additional mechanisms ensuringto enhance our compliance with the new EU data protection rules. Additionally, Canada’s Personal Information and Protection of Electronic Documents Act provides Canadian residents with privacy protections in regard to transactions with businesses and organizations in the private sector and sets out ground rules for how private sector organizations may collect, use and disclose
11
personal information in the course of commercial activities. While the United States does not yet have an overarching federal privacy law, several states have enacted or are in the process of enacting state privacy laws. For example, the California Consumer Privacy Act of 2018, or the CCPA, came into effect on January 1, 2020, and became enforceable by the California Attorney General on July 1, 2020, along with related regulations which came into force on August 14, 2020. Additionally, although not effective until January 1, 2023, the California Privacy Rights Act, or the CPRA, which expands upon the CCPA, was passed in the recent election on November 3, 2020. The CCPA requires covered companies to provide new disclosures to California consumers about their data collection, use and sharing practices and provide such consumers new data protection and privacy rights. The CCPA does have an exemption for HIPAA-covered protected health information, however, the CCPA may still apply to other personal information that we collect and process.
These statutes, regulations and contractual obligations impose numerous requirements regarding the use and disclosure of personal health information with which we must comply, and subject us to material liability and other adverse impacts to our business in the event we fail to do so. These include, without limitation, civil fines, criminal sanctions in certain circumstances, contractual liability to our customer,customers, and damage to our brand and reputation. We endeavor to mitigate these risks through measures we believe to be appropriate for the specific circumstances, including storing personal datainformation under our control on password-protected systems in secure facilities, counseling our customers as to best practices in using our solutions, and encrypting such information.information, and training our personnel. We are committed to protecting the confidentiality, integrity, and availability of personal health information we may encounter in the course of our business activities. Accordingly, we have adopted specific policies and procedures addressing the conduct of the company, employees and specific other third parties regarding how to appropriately safeguard such information in the course of daily activities, and our mandatory annual training includes courses on data security and our code of conduct and policies. All employees are required to sign a certification of completion with respect to such training on an annual basis.
Medical device regulation
The U.S. Food and Drug Administration (FDA) regulates certain products, including software-based products, as “medical devices” based, in part, on the intended use of the product and the risk the device poses to the patient should the device fail to perform properly. We have concluded that our communication products are general-purpose communication solutions and are not subject to FDA regulation. However, either the FDA could disagree with our conclusion or changes in our product or the FDA’s evolving regulations could lead to the imposition of medical device regulation on more of our products. In this event, we would be subject to additional regulatory requirements, including the expense of compliance with Medical Device Reporting and Quality System regulation and the potential of liability for failure to comply, and we could be required to obtain 510(k) clearance
or premarket approval of those products from the FDA prior to commercial distribution. Some of the new products acquired as a result of the Extension Healthcare and mVisum acquisitions are regulated by the FDA as Class II medical devices under applicable law and FDA regulations. This includes potentially being subject to the 2.3% excise tax that was initially legislated under the Affordable Care Act, but which has been delayed through 2019 by a moratorium on the tax included in recent Congressional budget legislation passed in January of 2018. Class II devices are devices classified by the FDA as posing a moderate to high risk and therefore subject to both “general controls” and “special controls,” as such terms are defined in the Food, Drug and Cosmetics Act. Further, our other products could become subject to the 2.3% excise tax when it becomes effective, if the FDA were to determine in the future that they constitute medical devices.
Electrical standards and FCC regulations
Our products emit radio frequency energy in the 2.4 and 5.0 GHz spectrum bands for which licensing by U.S. and other regulatory authorities is not required, provided that the products conform to certain requirements, e.g., maximum power output and tolerance of interference from other devices sharing that spectrum band. We subject our products to testing by independent testing laboratories for compliance with the relevant standards issued by various U.S. and international bodies, including the EU (with respect to the “CE” mark), the International Electrotechnical Commission, the Australian Communications and Media Authority, Underwriters Laboratories and CSA International.
Available information
We make available our Annual Reports on Form 10-K, Quarterly Reports on Form 10-Q, Current Reports on Form 8-K and amendments to those reports filed or furnished pursuant to Section 13(a) or Section 15(d) of the Securities Exchange Act of 1934 (Exchange Act), as amended, free of charge on the SEC's website at www.sec.gov and on our website at www.vocera.com, as soon as reasonably practicable after they are electronically filed with or furnished to the Securities and Exchange Commission (SEC).
The contents of our corporate website are not incorporated into, or SEC. Additionally, copiesotherwise to be regarded as part of, materials filed by us with the SEC may be accessed at the SEC's Public Reference Room at 100 F Street, N.E., Washington, D.C. 20549 or at www.sec.gov. For information about the SEC's Public Reference Room, contact 1-800-SEC-0330.this Annual Report on Form 10-K.
12
Item 1A.Risk Factors
Investing in our common stock involves a high degree of risk. You should carefully consider the risks and uncertainties described below, together with all of the other information set forth in this Annual Report on Form 10-K. Our business, financial condition, results of operations or future prospects could be materially and adversely harmed if any of the following risks, or other risks or uncertainties that are not yet identified or that we currently believe are immaterial, actually occur. The trading price of our common stock could decline due to any of these risks or uncertainties, and, as a result, you may lose all or part of your investment.
Summary of Risk Factors
Our business is subject to a number of risks and uncertainties, including those risks discussed at-length below. These risks include, among others, the following:
•The Transaction (as defined herein), the pendency of the Transaction or our failure to complete the Transaction could have a material adverse effect on our business, results of operations, financial condition and stock price.
•We have incurred significant losses in the past and will likely experience losses in the future.
•We depend on sales in the healthcare market for the majority of our revenue, and a decrease in sales in the healthcare market would harm our business.
•Our sales cycle and our deployment timelines can be lengthy and unpredictable, which may cause our revenue and operating results to fluctuate significantly.
•If we fail to offer high-quality products and services, our operating results and our ability to sell these in the future will be harmed.
•We primarily compete in the rapidly evolving and competitive healthcare market, and if we fail to effectively respond to competitive pressures, our business and operating results could be harmed.
•We depend on some sole source and limited source suppliers, and if we are unable to source our components from them, our business and operating results could be harmed.
•Because we depend on contract manufacturers and original design manufacturers, our operations could be harmed and we could lose sales if we encounter problems with these manufacturers.
•If we fail to forecast our manufacturing requirements accurately or fail to properly manage our inventory with our contract manufacturers, we could incur additional costs or experience manufacturing delays that could impact the timing of our revenue recognition and adversely affect our operating results.
•If we fail to successfully develop and introduce new solutions and features to existing solutions, our revenue, operating results, and reputation could suffer.
•The COVID-19 outbreak has had a material impact on the U.S. and global economies and could have a material adverse impact on our employees, suppliers, manufacturing and customers, which could adversely and materially impact our business, financial condition and results of operations.
•Our business has gone through cycles of expansion, relative stability and contraction, and if we are not able to manage such cycles effectively, our operating results may suffer.
•Our revenue and operating results have fluctuated, and are likely to continue to fluctuate, making our quarterly results difficult to predict, which may cause us to miss analyst expectations and may cause the price of our common stock to decline.
•Developments in the healthcare industry and governing regulations have negatively affected and may continue to negatively affect our business.
•If we fail to increase market awareness of our brand and solutions, and expand our sales and marketing operations, our business could be harmed.
•Failure to protect our information technology infrastructure against cyber-based attacks, network security breaches, service interruptions, or data corruption could significantly disrupt our operations and adversely affect our business and operating results.
•Our international operations subject us, and may increasingly subject us in the future, to operational, financial, economic and political risks abroad.
•Our efforts to sell our solutions in non-healthcare markets may not be successful.
•If we are unable to protect our intellectual property rights, our competitive position could be harmed, or we could be required to incur significant expenses to enforce our rights.
•We have indebtedness in the form of convertible senior notes. The provisions of indenture for the 2023 notes and 2026 notes (the Notes), accounting method for the Notes and capped call transactions entered into related to the Notes could have a material effect on our operating results, value of the Notes and our common stock or may deter or prevent a business combination.
13
Risks related to our business and industry
The Transaction, the pendency of the Transaction or our failure to complete the Transaction could have a material adverse effect on our business, results of operations, financial condition and stock price.
On January 6, 2022, we entered into an Agreement and Plan of Merger (the “Merger Agreement”), with Stryker Corporation, a Michigan corporation (“Parent” or “Stryker”), and Voice Merger Sub Corp., a Delaware corporation and a direct or indirect wholly owned subsidiary of Parent (“Merger Sub” or “Purchaser”). The Merger Agreement provides that, subject to the terms and conditions of the Merger Agreement, Merger Sub would commence a cash tender offer (the “Offer”) to purchase all of the outstanding shares of our common stock at a price per share equal to $79.25 (the “merger consideration”), net to the seller in cash, without interest, and subject to withholding taxes required by applicable law (the “Offer Price”).
Following the expiration of the Offer and the acceptance by Merger Sub of the tendered shares in the Offer, on the terms and subject to the conditions in the Merger Agreement, Merger Sub would merge with and into Vocera, with Vocera continuing as the surviving corporation and becoming a wholly owned subsidiary of Stryker (the “Merger” and collectively with the Offer, the “Transaction”), and each then-outstanding share of our common stock (with certain limited exceptions) would be converted into the right to receive the Offer Price. Consummation of the Transaction is subject to various conditions, including, in respect of Merger Sub’s obligation to purchase and accept the tendered shares in the Offer, the condition that the number of shares validly tendered and not properly withdrawn prior to the Expiration Time (as defined in the Merger Agreement) is, when added to the shares, if any, owned by Parent, Merger Sub, or any subsidiary of Parent, represents at least a majority of all shares of our common stock then outstanding. The tender offer expires at one minute after 11:59 p.m., Eastern time, on February 22, 2022. The Transaction is expected to close in the first quarter of 2022, subject to the satisfaction of customary closing conditions. However, there is no assurance that all of the various conditions to the Transactions will be satisfied, or that the Transaction will be completed on the proposed terms pursuant to the Merger Agreement, within the expected timeframe, or at all. Furthermore, there are additional inherent risks to the Transaction, including the risks detailed below.
During the period prior to the closing of the Transaction, our business is exposed to certain inherent risks due to the effect of the announcement or pendency of the Transaction on our business relationships, financial condition, operating results and business, including:
•potential uncertainty in the marketplace, which could lead current and prospective customers to purchase offerings from other providers or delay purchasing from us.
•the possibility of disruption to our business and operations, including diversion of management attention and resources from ongoing business operations.
•the inability to attract, hire and retain key personnel, and the possibility that our current employees could be distracted, and that their productivity may decline as a result, due to uncertainty regarding the Transaction.
•the inability to pursue alternative business opportunities or make changes to our business pending the completion of the Transaction, and other restrictions on our ability to conduct our business contained in the Merger Agreement.
•unexpected costs, fees, expenses and charges related to the Merger Agreement and the Transaction.
•other developments beyond our control, including, but not limited to, changes in domestic or global economic conditions, political conditions, regulatory requirements, licensing requirements and tax matters.
The Transaction may be delayed, and may ultimately not be completed, due to a number of factors, including:
•less than the requisite percentage of our stockholders support the proposed Transaction and tender their shares.
•the possibility that competing offers or acquisition proposals for our business will be made.
•stockholder litigation, which could result in significant costs of defense, indemnification and liability.
•the failure by Parent and Merger Sub to obtain the necessary financing to complete the Transaction.
•the failure to satisfy any or all conditions to the completion of the Transaction, including the possibility that a Company Material Adverse Effect (as defined in the Merger Agreement) would permit Parent not to close the Transaction.
•the occurrence of any other event, change or other circumstance that could give rise to the termination of the Merger Agreement, including in circumstances that would require us to pay a termination fee or other expenses.
If the Transaction does not close, our business and stockholders would be exposed to additional risks, including:
•to the extent that the current market price of our stock reflects an assumption that the Transaction will be completed, the price of our common stock could decrease if the Transaction is not completed.
•investor confidence could decline, additional stockholder litigation could be brought against us, relationships with existing and prospective customers, service providers, investors, lenders and other business partners may be adversely impacted, we may be unable to retain key personnel, and profitability may be adversely impacted due to costs incurred in connection with the pending Transaction.
14
•the requirement that we pay a termination fee of $108.7 million to Parent if the Merger Agreement is terminated in certain circumstances.
Even if successfully completed, the Transaction has certain consequences and poses certain risks to our stockholders, including:
•the fact that receipt of the all-cash per share consideration under the Merger Agreement will generally be taxable to stockholders that are treated as U.S. holders for U.S. federal income tax purposes.
•the fact that, if the Transaction is completed, we will no longer operate as an independent public company and our stockholders will forgo the opportunity to realize potential growth and profits, including any potential growth in sales and revenues that could have resulted if we had remained independent, in future prices for our common stock in excess of the $79.25 per share offer price.
We have incurred significant losses in the past and will likely experience losses in the future.
We have incurred significant losses in the past and reported a net loss of $14.2$8.5 million for the year ended December 31, 2017.2021. As of December 31, 2017,2021, we had an accumulated deficit of $141.7$153.3 million. If we cannot make consistent progress toward future profitability, our business and our stock price may be adversely affected.
Our ability to be profitable in the future depends upon continued demand for our solutions from existing and new customers. Further market adoption of our solutions including increased penetration within our existing customers, depends upon our ability to improve quality of care, andenhance patient and staff satisfaction, and increase hospital efficiency and productivity, and bring value to customers outside of healthcare. In addition, our profitability will be affected by, among other things, our ability to execute on our business strategy, the timing and size of orders, the pricing and costs of our solutions, competitive offerings, macroeconomic conditions affecting the health care industry and the extent to which we invest in sales and marketing, research and development and general and administrative resources.
We depend on sales in the healthcare market for substantially allthe majority of our revenue, and a decrease in sales in the healthcare market would harm our business.
To date, substantially all of our revenue has been derived from sales to the healthcare market and, in particular, hospitals. Sales to the healthcare market accounted for 98%, 97%98% and 98%96% of our revenue for the years ended December 31, 2017, 20162021, 2020 and 2015,2019, respectively. We anticipate that sales to the healthcare market will represent a significant portion of our revenue for the foreseeable future.
Most of our solutions require a substantial upfront investment by new customers. The cost of the initial deployment depends on the number of users and departments involved, the size and age of the hospital and the condition of the existing wireless and technology infrastructure, if any, within the hospital. Even if hospital personnel determine that our solutions provide compelling benefits over their existing communications methods, their hospitals may not have, or may not be willing to spend, the resources necessary to install and maintain wireless and technology infrastructure to initially deploy and support our solutions or expand our solutions to other departments or users. Hospitals face significant budget constraints from the COVID-19 pandemic, as they have had to postpone elective procedures that provide a significant portion of their revenue. Hospital budgets are also constrained by unpredictable patient population trends and commercial reimbursements, and increasing demands from, and competition for, patients. In addition, both governmental and commercial hospitals are experiencing lower Medicare reimbursement rates and higher compliance demands, and penalties fromwhich add to these budget pressures. Also as part of the implementation oftax reform law that came into effect in December 2017, the tax penalty for violating the individual health insurance mandate under the Patient Protection and Affordable Care Act of 2010 (ACA) and now face uncertainty aswas set to zero effective in 2019, essentially repealing it. It is uncertain if there will be changes to the President ofACA, but there have been attempts in the United States and members of the legislature have announced their intention to attemptpast to repeal or reformamend the ACA, as well as continue to undertake other healthcare reform.reforms. As a consequence weof these regulatory and other factors, hospitals may experiencedelay or reduce their spending, which may cause slowdowns and deferral of orders for our solutions, thator customers may choose other less expensive solutions, both of which could negatively impact our sales. We might not be able to sustain or increase our revenue from sales of our solutions, or achieve the growth rates that we envision, if hospitals continue to face significant budgetary constraints and reduce their spending on communications systems.
Our sales cycle and our deployment timelines can be lengthy and unpredictable, which may cause our revenue and operating results to increasefluctuate significantly.
Our sales cycles and our deployment timelines can be lengthy and unpredictable. Our sales efforts involve educating our customers about the use and benefits of our solutions, to non-healthcare customers, we do not anticipate non-healthcare markets to representincluding the technical capabilities of our solutions and the potential cost savings and productivity gains achievable by deploying them. Customers typically undertake a significant portionevaluation process, which frequently involves not only our solutions but also their existing communications methods and those of our competitors and can result in a lengthy sales cycle that sometimes exceeds twelve months. We spend substantial time, effort and money in our sales efforts without any assurance that our efforts will produce sales. Similarly, our increasing dependence on larger,
15
hospital-wide and health system-wide deployments may increase fluctuations in our revenue forand operating results because the foreseeable future.failure to complete a significant sale, or the loss of a large customer, will have a greater impact on those results.In addition, purchases of our solutions are frequently subject to budget constraints and shifts, multiple approvals, and unplanned administrative, processing and other delays. We have experienced and may continue to experience elongated sales cycles due to ongoing uncertainty caused by the COVID-19 pandemic, as well as past and future healthcare reform legislation, the impact of shifting federal government budgets, changes to Medicare and Medicaid reimbursement and potential future statutes and rule making.
If we fail to offer high-quality servicesproducts and support for any of our solutions,services, our operating results and our ability to sell those solutionsthese in the future will be harmed.
Our ability to sell our solutions is dependent upondepends on our professional servicesability to offer high-quality product and technical support teams providing high-quality servicesservices. Our solutions incorporate complex technology, are deployed in a variety of complex hospital environments and support. must interoperate with many different types of devices and hospital systems. While we test the components of our solutions for defects and errors prior to release, we or our customers may not discover a defect or error until after we have deployed our solution, integrated it into the hospital environment and our customer has commenced general use of the solution. In addition, our solutions in some cases are integrated with hardware and software offered by “middleware” vendors to interoperate with nurse call systems, device alarms and other hospital systems. Our software may be partnered with third party software to provide for potential joint solutions with such third party. Our software may also be deployed on third party devices, including devices we resell, which creates additional complexity because we share control of the customer experience. If we cannot successfully integrate our solutions with these vendors as needed or if any hardware or software of these vendors contains any defect or error, then our solutions may not perform as designed, or may exhibit a defect or error.
Our professional services team assists our customers with their wireless infrastructure assessment, clinical workflow design, communication solution configuration, clinical integration, training and project management during the pre-deployment and deployment stages. Once our solutions are deployed within a customer’s facility, the customer typically depends on our technical support team to help resolve technical issues, assist in optimizing the use of our solutions and facilitate adoption of new functionality. In some cases, we also use third parties to provide professional services to our customers, which means that we have less control over how these services are performed. If we do not effectively assist our customers in deploying our solutions, succeed in helping our customers quickly resolve technical and other post-deployment issues, or provide effective ongoing support services, our ability to expand the use of our solutions with existing customers and to sell our solutions to new customers will be harmed. If deployment of our solutions is deemed unsatisfactory, we may incur significant costs to attain and sustain customer satisfaction or, in extreme cases, our customers may choose not to deploy our solutions. As we rapidly hire new services and support personnel, we may inadvertently hire underperforming people who will have to be replaced, or fail to effectively train such employees, leading in some instances to slower growth, additional costs and poor customer relations. In addition, the failure of channel partners or other outsourced professional support contractors to provide high-quality services and support in markets outside the United States could also harm sales of our solutions.
Any defects or errors in, or which are attributed to our solutions, or to products or services we resell, could result in:
•delayed market acceptance of our affected solutions;
•loss of revenue or delay in revenue recognition;
•loss of customers or inability to attract new customers;
•diversion of engineering or other resources for remedying the defect or error;
•damage to our brand and reputation;
•delay in delivery of information;
•increased service and warranty costs, including potential replacement costs for product recalls or returns; and
•legal actions by our customers and hospital patients, including product liability claims.
If any of these occur, our operating results and reputation could be harmed.
As we continue to pursue opportunities for larger deals that have greater technical complexity, including deals that include the Engage software,require more complex integrations with our customers' workflows, we may experience a longer time period for the dealsour solutions to deploy and as a result, our revenue recognition for these deals may be delayed. Additionally, as we enter agreements with new and existing customers for larger and more complex deals across multiple sites, we have been, and may continue to be, required to agree to customer acceptance and cancellation clauses. DelaysWith acceptance clauses, delays may occur in obtaining customer acceptance regardless of the quality of our products and services, and may cause us to defer revenue recognition where such acceptance provisions are substantive in nature, or they may require us to incur additional professional services or other costs in an effort to obtain such customer acceptance.
16
We primarily compete in the rapidly evolving and competitive healthcare market, and if we fail to effectively respond to competitive pressures, our business and operating results could be harmed.
methods. Manufacturers and distributors of product categories such as cellular phones, smartphone applications, pagers, mobile radios and in-building wireless telephones alsocontinue to sell their products to hospitals as components of communication solutions. Of these product categories, in-building wireless telephones and pagers represent the most significant current competition for the sale of our solutions. The market for in-building wireless phones is dominated by communications companies such as Cisco Systems, Ascom and Spectralink.hospitals. In addition, the growing proliferation of smartphones and related applications, including cloud-based applications, represents another category of competitive offerings. While we consider secure text-messaging using smartphones a feature valued by many customers, we do not believe most ofFurthermore, our potential customers would consider that feature alone an adequate substitute for a comprehensive multi-mode communication solution. Some customers may choose solutions that are not HIPAA-compliant, given their budget constraints. Furthermore, in clinical integrations and middleware wesolutions compete with a variety of companies including Connexallthat offer clinical integration technology. Similarly we may face a different set of competitors in our patient and Philips Healthcare.family engagement solutions.
We depend on a number ofsome sole source and limited source suppliers, and if we are unable to source our components from them, our business and operating results could be harmed.
We depend on sole and limited source suppliers for several hardware components of our solutions, including our batteries and integrated circuits. We purchase inventory generally through individual purchase orders. Any of these suppliers could cease production of our components, cease to provide the necessary levels of support for our use of their components, experience capacity constraints, material shortages, work stoppages, epidemics or contagious diseases, such as the coronavirus outbreak, that negatively impact them and their suppliers, financial difficulties, cost increases or other reductions or disruptions in output, cease operations or be acquired by or enter into exclusive arrangements with, a competitor. For example, we have experienced, and may continue to experience periodic delays in deliveries from our suppliers as a result of the COVID-19 pandemic. These suppliers typically rely on purchase orders rather than long-term contracts with their suppliers, and as a result, even if available, the supplier may not be able to secure sufficient materials at reasonable prices or of acceptable quality to build our components in a timely manner.
Any of these circumstances could cause interruptions or delays in the delivery of our solutions to our customers, and this may force us to seek components from alternative sources, which may not have the required specifications, or be available in time to meet demand or on commercially reasonable terms, if at all. Any of these circumstances may also force us to redesign our solutions if a component becomes unavailable in order to incorporate a component from an alternative source.source if a component becomes unavailable.
Our solutions incorporate multiple software components obtained from licensors on a non-exclusive basis, such as voice recognition software, software supporting the runtime execution of our software platform, and database and reporting software. Our license
agreements can be terminated for cause. In many cases, these license agreements specify a limited term and are only renewable beyond that term with the consent of the licensor. If a licensor terminates a license agreement for cause, objects to its renewal or conditions renewal on modified terms and conditions, we may be unable to obtain licenses for equivalent software components on reasonable terms and conditions, including licensing fees, warranties or protection from infringement claims. Some licensors may discontinue licensing their software to us or support of the software version used in our solutions. In such circumstances, we may need to redesign our solutions atwith substantial cost and time investments to incorporate alternative software components or be subject to higher royalty costs. Any of these circumstances could adversely affect the cost and availability of our solutions.
Third-party licensors generally require us to incorporate specific license terms and conditions in our agreements with our customers. If we are alleged to have failed to incorporate these license terms and conditions, we may be subject to claims by these licensors, incur significant legal costs defending ourselves against such claims and, if such claims are successful, be subject to termination of licenses, monetary damages, or an injunction against the continued distribution of one or more of our solutions.
17
Because we depend on contract manufacturers and original design manufacturers, our operations could be harmed and we could lose sales if we encounter problems with these manufacturers.
We do not have internal manufacturing capabilities and rely upon atwo contract manufacturer,manufacturers, Sercomm and SMTC, to produce the primary hardware component ofmake our solutions.wearable devices. We have entered into a manufacturing agreementagreements with Sercomm and SMTC that isare terminable by either party with advance notice and that may also be terminated for a material uncured breach. We expect to enter into additional contract manufacturing agreements as we expand our business. We also rely on original design manufacturers or ODMs,(ODMs) to produce accessories, including batteries, chargers and attachments. Any of these suppliers could cease production of our components, cease to provide the necessary levels of support for our use of their components, experience capacity constraints, material shortages, work stoppages, epidemics or contagious diseases that negatively impact them and their suppliers, financial difficulties, cost increases or other reductions or disruptions in output, cease operations or be acquired by, or enter into exclusive arrangements with, a competitor. If Sercomm, SMTC, or another contract manufacturer or an ODM is unable or unwilling to continue manufacturing components of our solutions in the volumes and timeframes that we require, fails to meet our quality specifications or significantly increases its prices, we may not be able to deliver our solutions to our customers with the quantities, quality and performance that they expect in a timely manner. As a result, we could lose sales and our operating results could be harmed.
Sercomm, SMTC, other contract manufacturers or ODMs may experience problems that could impact the quantity and quality of hardware components of our Vocera Communication and Workflow System,solution, including disruptions in their manufacturing operations due to equipment breakdowns, labor strikes or shortages, component or material shortages and cost increases. SMTC, other contract manufacturers and these ODMs generally rely on purchase orders rather than long-term contracts with their suppliers, and as a result, may not be able to secure sufficient components or other materials at reasonable prices or of acceptable quality to build components of our solutions in a timely manner. The majority of the hardware components of our Vocera Communication and Workflow Systemsolution are manufactured in Asia or Mexico, and adverse changes in political or economic circumstances, or health related issues such as epidemics or contagious diseases, in those locations could also disrupt our supply and quality of components of our solutions. For example, there is currently a global shortage of semiconductors that are used in a wide variety of products, including ours. Our contract manufacturers currently have an adequate supply of semiconductors to satisfy our expected demand for 2022, but a prolonged shortage could result in manufacturing delays for our products. In addition, U.S. government officials have recently proposedimposed changes in trade, tariffs, fiscal orand tax policies and may do so in the future, and any such changes in the U.S. or in other countries from which we source components of our products could adversely affect our business.
Companies occasionally encounter unexpected difficulties in ramping up production of new products, and we may experience such difficulties with future generations of our products. Sercomm, SMTC, other contract manufacturers and our ODMs also manufacture products for other companies. Generally, our orders represent a relatively small percentage of the overall orders received by Sercomm, SMTC, other contract manufacturers and these ODMs from their customers; therefore, fulfilling our orders may not be a priority in the event Sercomm, SMTC, other contract manufacturers or an ODM is constrained in its ability to fulfill all of its customer obligations. In addition, if Sercomm, SMTC, other contract manufacturers or an ODM is unable or unwilling to continue manufacturing components of our solutions, we may have to identify one or more alternative manufacturers. The process of identifying and qualifying a new contract manufacturer or ODM can be time consuming, and we may not be able to substitute suitable alternative manufacturers in a timely manner or at an acceptable cost. Additionally, transitioning to a new manufacturer may cause us to incur additional costs and delays if the new manufacturer has difficulty manufacturing components of our solutions to our specifications or quality standards.
If we fail to forecast our manufacturing requirements accurately or fail to properly manage our inventory with our contract manufacturer, we could incur additional costs andor experience manufacturing delays which canthat could impact the timing of our revenue recognition and adversely affect our operating results.
We place orders with our contract manufacturers, including Sercomm and SMTC, and we and our contract managersmanufacturers place orders with suppliers based on forecasts of customer demand. Because of our international low costlow-cost sourcing strategy, our lead times are long and cause substantially more risk to forecasting accuracy than would result were lead times shorter. Our forecasts are based on multiple assumptions, each of which may introduce errors into our estimates affecting our ability to meet our customers’ demands for our solutions. We also may face additional forecasting challenges due to new product introductions, product transitions in the components of our solutions, or to
our suppliers discontinuing production of materials and subcomponents required for our solutions. If demand for our solutions increases significantly, we may not be able to meet demand on a timely basis, and we may need to expend a significant amount of time working with our customers to allocate limited supply and maintain positive customer relations, or we may incur additional costs in order to source additional materials and subcomponents to produce components of our solutions or to expedite the manufacture and delivery of additional inventory. If we underestimate customer demand, we and our contract manufacturer may have inadequate materials and subcomponents on hand to produce components of our solutions, which could result in manufacturing interruptions, shipment delays, deferral or loss of revenue, and damage to our customer relationships. Conversely, if we overestimate customer demand,
18
we and SMTCour contract manufacturers may purchase more inventory than required for actual customer orders, resulting in excess or obsolete inventory, thereby increasing our costs and harming our operating results.
If we fail to successfully develop and introduce new solutions and features to existing solutions, our revenue, operating results and reputation could suffer.
Our success depends, in part, upon our ability to develop and introduce new solutions and to add features to existing solutions that meet existing and new customer requirements. We may not be able to develop and introduce new solutions or features on a timely basis or in response to customers’ changing requirements, or thatrequirements. Similarly, our new solutions and features may not sufficiently differentiate us from competing solutions such that
customers can justify deploying our solutions. We expect to incur costs associated with the development and introduction of new solutions before the anticipated benefits or the returns are realized, if at all. We may experience technical problems and additional costs as we introduce new features to our software platform, deploy future models of our wireless badges, or deploy new smartphone apps, which can require customers to perform software upgrades to their systems, and integrate new solutions with existing customer clinical systems and workflows. In addition, we may face technical difficulties as we expand into non-English speaking countries and incorporate non-English speech recognition capabilities into our solutions. We also may incur substantial costs or delays in the manufacture of any additional new products or models as we seek to optimize production methods and processes at our contract manufacturer.manufacturers. In addition, we expect that we willmay at least initially achieve lower gross margins on new models, while endeavoring to reduce manufacturing costs over time. If any of these problems were to arise, our revenue, operating results and reputation could suffer.
The COVID-19 outbreak has had a material impact on the U.S. and global economies and could have a material adverse impact on our employees, suppliers, manufacturing and customers, which could adversely and materially impact our business, financial condition and results of operations.
The pandemic has affected, and may continue to adversely affect, our customers’ operations, our employees and our employee productivity. It may impact the ability of our customers, subcontractors, partners, and suppliers to operate and fulfill their contractual obligations, and result in an increase in payment defaults, collection costs and/or delays or disruptions in performance. In particular, hospitals and healthcare facilities have prioritized the care and treatment of COVID-19 patients and may have restricted access for most visitors and reduced spending unrelated to COVID-19. These customers have also had to suspend elective procedures in some cases, which generate a majority of their profits, adding to their financial difficulties. While many elective procedures have resumed, it is uncertain whether consumers will seek those procedures due to concerns about COVID-19 and its variants, including Delta and Omicron, and it is also uncertain if elective procedures will be suspended again if cases increase. In response, some have furloughed staff, including those we ordinarily work with to sell and implement our offerings.
Outside of healthcare, some of our clients in the hospitality and retail industries have suspended or modified operations until stay-at-home orders are lifted, and potentially beyond. Although stay-at-home orders have been lifted in many areas, it is uncertain whether consumers will return to those establishments and how successful these businesses will be. As a result, we have experienced delays in planned deployments and changes in customer demand, and could experience additional delays, discounts, customer payment issues, bad debt, potential terminations and unpredictability as our customers continue to respond to the challenges of treating and containing the COVID-19 pandemic.
We have also experienced some disruptions in our supply chain and our manufacturers have similarly experienced disruptions in their supply chains. To the extent our suppliers prioritize the manufacturing of other products or experience facility or business disruptions due to sick employees, stay-at-home orders, supply chain disruptions or otherwise, we may be unable to maintain a sufficient supply of our products to meet demand. Additionally, our employees, in many cases, are working remotely and using various technologies to perform their functions, which may create security risks, inefficiencies and reduced productivity, and reduce the effectiveness of our sales team.
19
These effects on our business, and the direct effect of the virus and the disruption on our employees and operations, may negatively impact our revenue, profit margins and liquidity. Additionally, the disruption and volatility in the global and domestic capital markets may increase the cost of capital and limit our ability to access capital.
The ongoing COVID-19 pandemic has also caused us to modify our business practices including employee travel, customer visits, employee work locations, and cancellation of physical participation in meetings, events and conferences which are important to support our sales approach. We also are requiring our employees to be vaccinated against COVID-19 unless they qualify for an exemption. We may take further actions as may be required by government authorities or that we determine are in the best interests of our employees, customers and business partners. A prolonged disruption or any further unforeseen delay in our operations or within any of our business activities could result in reduced revenue. We could also be adversely affected if government authorities impose additional restrictions or extend the length of restrictions on public gatherings, human interactions, mandatory closures, seek voluntary closures, restrict hours of operations or impose curfews, restrict the import or export of products or if suppliers issue mass recalls of products. There is no certainty that such measures will be sufficient to mitigate the risks posed by the virus or otherwise be satisfactory to government authorities.
Both the health and economic aspects of the COVID-19 virus are highly fluid and the future course of each is uncertain. For these reasons and other reasons that may come to light as the coronavirus pandemic and associated protective or preventative measures develop, we may experience a material adverse effect on our business operations, revenues and financial condition; however, its ultimate impact is highly uncertain and subject to change.
Our business has gone through cycles of expansion, relative stability and contraction, and if we are not able to manage such cycles effectively, our operating results may suffer.
We have experienced periods of expansion, relative stability and contraction in our revenues and operations in the past. Such fluctuations have placed, and may continue to place, strains on our management systems, infrastructure and other resources. Especially during growth periods, we hire additional direct sales, professional services and marketing personnel domestically and internationally, acquire complementary businesses, technologies or assets, and increase our investment in research and development. Our future operating results depend to a large extent on our ability to successfully implement such plans and manage such investments. To do so successfully we must, among other things:
•manage our expenses in line with our operating plans and current business environment;
•maintain and enhance our operational, financial and management controls, reporting systems and procedures;
•integrate acquired businesses, technologies or assets;
•manage operations in multiple locations and time zones; and
•develop and deliver new solutions and enhancements to existing solutions efficiently and reliably.
We expect to incur costs associated with the investments made to support our business strategy before the anticipated benefits or the returns are realized, if any. If we are unable to grow our business or manage our future growth effectively, we may not be immediately reflectedable to take advantage of market opportunities or develop new solutions or enhancements to existing solutions. We may also fail to satisfy customer requirements, maintain quality, execute our business plan or respond to competitive pressures, which could result in lower revenue and a decline in the share price of our common stock.
Our revenue and operating results.results have fluctuated, and are likely to continue to fluctuate, making our quarterly results difficult to predict, which may cause us to miss analyst expectations and may cause the price of our common stock to decline.
Comparisons of our revenue for the years ended December 31, 2017, 2016 and 2015, respectively. A portion of the revenue we report in each quarter is derived from the recognition of deferred revenue relating to maintenance and support contracts entered into during previous quarters. Consequently,operating results on a decline in new or renewed maintenance and support, extended warranty contracts or subscription agreements by our customers in any one quarterperiod-to-period basis may not be immediately reflectedmeaningful. You should not rely on our past results as an indication of our future performance. Each of the following factors, among others, could cause our operating results to fluctuate from quarter to quarter:
•the ongoing impact of the COVID-19 pandemic;
•the financial health of our healthcare customers and budgetary constraints on their ability to upgrade their communications, particularly in our revenuelight of the pandemic;
•the availability of government funding for that quarter. Such a decline, however, will negatively affect our revenuehealthcare facilities operated by the United States federal, state and local governments;
•changes in future quarters. Accordingly, the effect of significant downturns incustomer purchasing patterns or sales and cycles;
•market acceptance of our Smartbadge and its impact on orders for our existing Badge and related software;
20
•changes in the regulatory environment affecting our healthcare customers, including impediments to their ability to obtain reimbursement for their services;
•our ability to expand and improve our sales and marketing operations;
•our ability to successfully integrate acquired businesses, technologies or assets;
•the announcement of new significant contracts or relationships;
•the procurement and deployment cycles of our healthcare customers and the length of our sales cycles;
•changes in how healthcare operating and capital budgets are administered by our customers;
•changes in customer deployment timelines;
•variations in the amount of orders booked in a prior quarter but not delivered until later quarters;
•our mix of solutions and the varying revenue recognition rules that apply;
•pricing, including discounts by us or our competitors;
•our ability to expand into non-healthcare markets;
•our ability to develop significant new reseller relationships and maintain existing reseller relationships;
•the financial health of our resellers;
•our ability to successfully deploy our solutions in a timely manner;
•our ability to sell and integrate third-party products and services, and our customer’s satisfaction with those third-party products and services;
•our ability to forecast demand and manage lead times for the manufacture of our solutions;
•our ability to develop and introduce new solutions and features to existing solutions that achieve market acceptance;
•the announcement of a new product, which may cause sales cycles to lengthen;
•federal government shutdowns;
•occurrence of health epidemics or contagious diseases and potential effects on our business and manufacturing operations;
•fluctuations in foreign currencies in the international markets in which we operate; and
•future accounting pronouncements and changes in accounting policies.
If we do not achieve the anticipated strategic or financial benefits from our rate of renewalsacquisitions or if we cannot successfully integrate them, our business and operating results could be harmed.
We have acquired, and in the future may acquire, complementary businesses, technologies or assets that we believe to be strategic. For example, in the prior fiscal year we acquired EASE, a cloud-based communication platform and mobile application, to help enhance care team communication with patients and families, and in the current year, we acquired PatientSafe, a clinical communication and collaboration (CC&C) solution designed for hospitals and health systems that have invested in their EHR mobile workflow software, are smartphone centric, and may prefer a cloud-based CC&C solution. We may not achieve the anticipated strategic or financial benefits, or be fully reflectedsuccessful in integrating EASE or PatientSafe or any acquired businesses, technologies or assets. If we cannot effectively integrate the acquired business and products into our business, we may not achieve market acceptance for, or derive significant revenue from, these new solutions.
Integrating newly acquired businesses, technologies and assets could strain our resources, could be expensive and time consuming, and might not be successful. Our recent acquisitions expose us, and we will be further exposed, if we acquire or invest in additional businesses, technologies or assets, to a number of risks, including that we may:
•experience technical issues as we integrate acquired businesses, technologies or assets into our existing solutions;
•encounter difficulties leveraging our existing sales and marketing organizations, and direct sales channels, to increase our revenue from acquired businesses, technologies or assets;
•find that the acquisition does not further our business strategy, we overpaid for the acquisition or the economic conditions underlying our acquisition decision have changed;
•have difficulty retaining key personnel of acquired businesses;
•suffer disruption to our ongoing business and diversion of our management’s attention as a result of transition or integration issues and the challenges of managing geographically or culturally diverse enterprises;
•experience unforeseen and significant problems or liabilities associated with quality, technology and legal contingencies relating to the acquisition, such as intellectual property or employment matters; and
•incur substantial costs to integrate the acquired business.
If we were to proceed with one or more additional significant acquisitions in which the consideration included cash, we could be required to use a substantial portion of our available cash. To the extent we issue shares of capital stock or other rights to purchase capital stock, including options and warrants, the ownership of existing stockholders would be diluted. In addition, acquisitions may result in the incurrence of debt, contingent liabilities, large write-offs, or other unanticipated costs, events or circumstances, any of which could harm our operating results until future periods.results.
21
In addition, from time to time we may enter into negotiations for acquisitions that are not ultimately consummated. These negotiations could result in significant diversion of management time, as well as substantial out-of-pocket costs.
Our success depends upon our ability to attract, integrate and retain key personnel, and our failure to do so could harm our ability to grow our business.
Our success depends, in part, on the continuing services of our senior management and other key personnel, and our ability to continue to attract, integrate and retain highly skilled personnel, particularly in engineering, sales and marketing. Competition for highly skilled personnel is intense, particularly in the Silicon Valley where our headquarters are located.technology field. If we fail to attract,create work environments viewed as attractive and integrate and retain key personnel our ability to grow our business could be harmed.
The members of our senior management and other key personnel are at-will employees and may terminate their employment at any time without notice. If one or more members of our senior management terminate their employment, we may not be able to find qualified individuals to replace them on a timely basis or at all, and our senior management may need to divert their attention from other aspects of our business. Former employees may also become employees of a competitor. We may also have to pay additional compensation to attract and retain key personnel. We also anticipate hiring additional engineering, marketing and sales, and services personnel to grow our business. Often, significant amounts of time and resources are required to train these personnel. We may incur significant costs to attract, integrate and retain them, and we may lose them to a competitor or another company before we realize the benefit of our investments in them.
We could be required to record adjustments to our recorded asset balance for intangible assets, including goodwill, that could significantly impact our operating results.
Our balance sheet includes significant intangible assets, including goodwill and other acquired intangible assets. The determination of related estimated useful lives and whether these assets have been impaired involves significant judgment and is subject to certain factors and events over which we have no control. The introduction of new competitive products or services into our markets could impair the value of our intangible assets if they create market conditions that adversely affect the competitiveness of our products and services. Further, declines in our market capitalization may be an indicator that our intangible assets or goodwill carrying values exceed their fair values, which could lead to potential impairment charges that could impact our operating results.
Developments in the healthcare industry and governing regulations have negatively affected and may continue to negatively affect our business.
Substantially all of our revenue is derived from customers in the healthcare industry, in particular, hospitals. The healthcare industry is highly regulated and is subject to changing political, legislative, regulatory and other influences. Developments generally affecting the healthcare industry, including new regulations or new interpretations of existing regulations, could adversely affect spending on information technology and capital equipment by reducing funding, changing healthcare pricing or delivery or creating impediments for obtaining healthcare reimbursements, which together with declining admission trends, could cause our sales to decline and negatively impact our business. For example, the margins of our hospital customers are modest, and potential decreases in reimbursement for healthcare costs may reduce the overall solvency of our customers or cause further deterioration in their financial or business condition.
In the past bills were signed into law that impact the U.S. healthcare system, including the ACA. Uncertainty surrounding the status of the ACA and its regulations may impact the spending of our healthcare customers, and we cannot predict the effect on our business of any new legislation and regulations that may be adopted if the ACA is significantly changed or repealed or of additional regulations.
Federal budget activities also impact our customers. Our customers include healthcare facilities run by the Department of Defense and the U.S. Department of Veterans Affairs. During the years ended December 31, 2021, 2020 and 2019, we generated approximately 20%, 18% and 17%, respectively, of our revenue from these customers. Our reseller to the Department of Defense and the U.S. Department of Veterans Affairs represented 17% and 33% of our accounts receivable as of December 31, 2021 and 2020, respectively. These customers have been and may continue to be impacted by budgetary and legislative actions.
In the past certain departments of the U.S. federal government temporarily stopped operating as a result of failure by the legislative and executive branches of the government to pass bills to keep them operating. In the current political climate there is a risk that the government could be shut down again. Any past or future shutdown may impact our US government customers’ spending decisions, as well as those of our non-US government customers. Any reduction or delay in our customers’, or potential customers’ spending decisions may result in a delay, or reduction, to our revenue.
22
In addition, many state governments are changing or expanding their healthcare laws, adding additional complexity to understanding the potential impacts.
We are unable to predict the full impact of these new and changing rules on our hospital customers and others in the healthcare industry. Impacts of these rules have affected and could continue to affect materially our customers’ ability to budget for or purchase our products. The healthcare industry has changed significantly in recent years and we expect that significant changes will continue to occur. We cannot provide assurance that the markets for our solutions will continue to exist at current levels or that we will have adequate technical, financial and marketing resources to react to changes in those markets.
If we fail to increase market awareness of our brand and solutions, and expand our sales and marketing operations, our business could be harmed.
We intend to continue to add personnel and resources in sales and marketing as we focus on expanding awareness of our brand and solutions and capitalize on sales opportunities with new and existing customers. Our efforts to improve sales of our solutions will result in an increase in our sales and marketing expense and general and administrative expense, and these efforts may not be successful. Some newly hired sales and marketing personnel may subsequently be determined to be unproductive and have to be replaced, resulting in operational and sales delays and incremental costs. If we are unable to significantly increase the awareness of our brand and solutions or effectively manage the costs associated with these efforts, our business, financial condition and operating results could be harmed.
Failure to protect our information technology infrastructure against cyber-based attacks, network security breaches, service interruptions, or data corruption could significantly disrupt our operations and adversely affect our business and operating results.
We rely on information technology and telephone networks and systems, including the Internet, to process and transmit sensitive electronic information and to manage or support a variety of business processes and activities, including sales, billing, customer service, procurement and our supply chain. We use enterprise information technology systems to record, process, and summarize financial information and results of operations for internal reporting purposes and to comply with regulatory financial reporting, legal, and tax requirements. In the ordinary course of our business, we also collect, store, process, use and transmit large amounts of confidential information, including intellectual property, protected health information, proprietary business information and personal information. Our information technology systems, some of which are managed by third-parties, may be susceptible to damage, disruptions or shutdowns due to computer viruses, attacks by computer hackers, failures during the process of upgrading or replacing software, databases or components thereof, power outages, hardware failures, telecommunication failures, user errors or catastrophic events. Most of our workforce is currently working remotely as a result of the COVID-19 pandemic, which also increases risks related to information security. Although we have developed systems and processes that are designed to protect confidential information and prevent data loss and other security breaches, including systems and processes designed to reduce the impact of a security breach, such measures cannot provide absolute security. The risk of a security breach or disruption or data loss, particularly through cyber-attacks or cyber intrusion, including by computer hackers, foreign governments and cyber terrorists, has generally increased as the number, intensity and sophistication of attempted attacks and intrusions from around the world have increased. We may not be able to anticipate all types of security threats, and we may not be able to implement preventive measures effective against all such security threats. Although we maintain cybersecurity insurance, if our systems are breached or suffer severe damage, disruption or shutdown and we are unable to effectively resolve the issues in a timely manner, our business and operating results may significantly suffer and we may be subject to litigation, government enforcement actions or potential liability beyond our insurance coverage. In addition, such a breach may require notification to governmental agencies, the media and/or affected individuals pursuant to various federal, state (including regulations promulgated by the Federal Trade Commission and state breach notification laws) and international privacy (including GDPR) and security laws, if applicable, including HIPAA or HITECH and its implementing rules and regulations. Security breaches could also cause us to incur significant remediation costs, result in product development delays, disrupt key business operations, adversely impact customer relationships, damage our reputation and divert attention of management and key information technology resources.
During fiscal year 2020, one of our vendors, SolarWinds, was the victim of a cyberattack that inserted a vulnerability in their platform. We use SolarWinds services for our internal corporate network so this introduced a potential vulnerability in our internal systems. We have removed the vulnerable software from our network and have not found any indication that the
23
vulnerability was exploited. There are still uncertainties about the full scope of this cyberattack and we may learn of other vulnerabilities and potential network intrusions by third parties.
If hospitals do not have and are not willing to install, upgrade and maintain the wireless and other information technology infrastructure required to effectively operate our solutions, then they may experience technical problems or not purchase our solutions at all.
The effectiveness of our solutions depends upon the quality and compatibility of the communications environment that our healthcare customers maintain. Our solutions require voice-grade wireless (Wi-Fi) installed through large enterprise environments, which can vary from hospital to hospital and from department to department within a hospital. Many hospitals have not installed a voice-grade wireless infrastructure. If potential customers do not have a wireless network that can properly and fully interoperate with our solutions, then such a network must be installed, or an existing Wi-Fi network must be upgraded or modified, for example, by adding access points in stairwells, for our solutions to be fully functional. The additional costs of installing or upgrading a Wi-Fi network may dissuade potential customers from installing our solutions. Furthermore, if changes to a customer’s physical or information technology environment cause integration issues or degrade the effectiveness of our solutions, or if the customer fails to upgrade or maintain its environment as may be required for software deployments, releases and updates, the customer may not be able to fully utilize our solutions or may experience technical problems, or these changes may impact the performance of other wireless equipment being used. If such circumstances arise, prospective customers may not purchase or existing customers may not expand their use of or deploy upgraded versions of our solutions, thereby harming our business and operating results.
If we fail to achieve and maintain certification for certain U.S. federal standards, our sales to U.S. government customers will suffer.
We believe that a significant opportunity exists to continue to sell our products to healthcare facilities in the Veterans Administration and Department of Defense (DoD). These customers require independent certification of compliance with specific requirements relating to encryption, security, interoperability and scalability, including Federal Information Processing Standard (FIPS) 140-2 and, as to DoD, certification by its Joint Interoperability and Test Command and under its Information Assurance Certification and Accreditation Process. We have received certification under certain of these standards for military-specific configurations of our solution incorporating our Badge and Smartbadge. We continue to carry out further compliance activities and recertifications, as required. A failure on our part to achieve and maintain compliance and to respond to new threats and vulnerabilities, both as to current products and as to new product versions, could adversely impact our revenue.
Our international operations subject us, and may increasingly subject us in the future, to operational, financial, economic and political risks abroad.
Although we derive a relatively small portion of our revenue from customers outside the United States, we believe that non-U.S. customers could represent an increasing share of our revenue in the future. During the years ended December 31, 2017, 20162021, 2020 and 2015,2019, we generated 10.5%9.4%, 10.6%10.7% and 8.8%8.7% of our revenue, respectively, from customers outside of the United States, including Canada, the United Kingdom, Australia, New Zealand and Middle Eastern countries including the United Arab Emirates, Saudi Arabia and Qatar. In 2014, we opened a newWe also operate an innovation center in India and a sales office in Dubai, United Arab Emirates. Accordingly, we are subject to risks and challenges that we would not otherwise face if we conducted our business solely in the United States, including:
•challenges incorporating non-English speech recognition capabilities into our solutions asif we expand into non-English speaking jurisdictions;markets;
•difficulties integrating our solutions with wireless infrastructures with which we do not have experience;
•difficulties integrating local dialing plans and applicable PBX standards;
•challenges associated with delivering support, training and documentation in several languages;
•difficulties in staffing and managing personnel and resellers;
•the need to comply with a wide variety of foreign laws and regulations, including increasingly stringent data privacy regulations, requirements for export controls for encryption technology, employment laws, changes in tax laws and tax audits by government agencies;
•political and economic instability in, or foreign conflicts that involve or affect, the countries of our customers;
•the impacts associated with epidemics or contagious diseases;
•adverse effects on us directly, or on our customers and suppliers, of changes in trade, fiscal or tax policies;policies, including the imposition of tariffs;
•difficulties in collecting accounts receivable and longer accounts receivable payment cycles;
•exposure to competitors who are more familiar with local markets;
24
•risks associated with the Foreign Corrupt Practices Act and local anti-bribery law compliance;
•difficulties associated with resolving contract disputes in foreign countries with varied legal systems;
•limited or unfavorable intellectual property protection in some countries; and
•currency exchange rate fluctuations, which could affect the price of our solutions relative to locally produced solutions.
Any of these factors could harm our existing international business, impair our ability to expand into international markets or harm our operating results.
Our efforts to sell our solutions in non-healthcare markets may not be successful.
In recent years, we have actively engaged in sales efforts to customers outside the healthcare markets, including hospitality, retail, energy, education and other mobile work environments. We may not be successful in further penetrating the non-healthcare markets upon which we are highly complexinitially focusing, or other new markets. To date, our solutions have been selected by over 450 customers in non-healthcare markets. Total revenue from non-healthcare customers accounted for 2%, 2% and 4% of our revenue for the years ended December 31, 2021, 2020 and 2019, respectively. If we cannot maintain these customers by providing solutions that meet their requirements, if we cannot successfully expand our solutions in non-healthcare markets, or if adoption of our solutions remains slow, we may not obtain significant revenue from these markets. We may experience challenges as we expand in non-healthcare markets, including pricing pressure on our solutions, budget constraints, and technical issues as we adapt our solutions for the requirements of new markets. For example, some of our hospitality and retail customers have been significantly impacted by the COVID-19 pandemic and they have been forced to close locations and face significant revenue declines. Our solutions also may not contain softwarethe functionality required by these non-healthcare markets, may be too expensive or hardware defectsmay not sufficiently differentiate us from competing solutions such that could harmcustomers can justify deploying our reputationsolutions.
We generally recognize revenue from maintenance and support contracts and subscription arrangements over the contract term, and changes in sales may not be immediately reflected in our operating results.
We face potential liability related to the privacy and security of personal information collected through our solutions.
In connection with our healthcare business, we handle and have access to personal health information“Protected Health Information” (PHI) subject in the United States to HIPAA or HITECH,the Health Insurance Portability and Accountability Act of 1996 (HIPAA) as amended and supplemented by the Health Information Technology for Economic and Clinical Health Act of 2009 (HITECH) , regulations issued pursuant to these statutes, state privacy and security laws and regulations, and associated contractual obligations as a “business associate” of healthcare providers. These statutes, regulations and contractual obligations impose numerous requirements regarding the use and disclosure of personal health informationPHI with which we must comply. Among other things, HITECH made certain aspects of HIPAA’s rules, notably the “HIPAA Security Rule,” directly applicable to business associates, independent contractors or agents of covered entities that create, receive, maintain or transmit PHI in connection with providing a function on behalf of, or a service to, a covered entity (e.g., health care communication solutions). HITECH also created four new tiers of civil monetary penalties, amended HIPAA to make civil and criminal penalties directly applicable to business associates and gave state attorneys general new authority to file civil actions for damages or injunctions in federal court to enforce the federal HIPAA regulation and seek attorney’s fees and costs associated with pursuing federal civil actions. The U.S. Department of Health & Human Services Office for Civil Rights (OCR) has increased its focus on compliance and continues to train state attorneys general for enforcement purposes. The OCR has recently increased both its efforts to audit HIPAA compliance and its level of enforcement, with one recent penalty exceeding $16 million. Our failure to accurately anticipate the application or interpretation of these statutes, regulations and contractual obligations as we develop our solutions, a failure by us to comply with their requirements (e.g., evolving encryption and security requirements) or an allegation that defects in our products have resulted in noncompliance by our customers could create material civil and/or criminal liability for us, resulting in adverse publicity and negatively affecting our business.
25
In addition, the use and disclosure of personal health information, non-health personal information is also subject to laws and regulations in other jurisdictions in which we do business or expect to do business in the future. Any developments stemming from enactment or modification of these laws and regulations, or the failure by us to comply with their requirements or to accurately anticipate the application or interpretation of these laws could create material liability to us (including but not limited to regulatory enforcement actions), which may result in adverse publicity and negatively affect our business.
For example, the EU adopted the DPD, imposing strict regulations and establishing a series of requirements regarding the storage of personally identifiable information on computers or recorded on other electronic media. This has been implemented by all EU member states through national laws. DPD provides for specific regulations requiring all non-EU countries doing business with EU member states to provide adequate data privacy protection when receiving personal data from any of the EU member states. Inin May 2016, the EU formally adopted the General Data Protection Regulation (GDPR), which will applybecame effective in May 2018. The GDPR greatly increased the European Commission’s jurisdictional reach of its laws and adds a broad array of requirements for handling personal information, including, for example, requirements to allestablish a legal basis for processing, higher standards for obtaining consent from individuals to process their personal information, more robust disclosures to individuals and a strengthened individual data rights regime, requirements to implement safeguards to protect the security and confidentiality of personal information that requires the adoption of administrative, physical and technical safeguards, shortened timelines for data breach notifications to appropriate data protection authorities or data subjects, limitations on retention and secondary use of information, increased requirements pertaining to health data and additional requirements that we impose certain contractual obligations on third-party processors in connection with the processing of the personal information. EU member states beginningare tasked under the GDPR to enact, and have enacted, certain implementing legislation that adds to and/or further interprets the GDPR requirements and potentially extends our obligations and potential liability for failing to meet such obligations. The GDPR, together with national legislation, regulations and guidelines of the EU member states governing the processing of personal information, impose strict obligations and restrictions on the ability to collect, use, retain, protect, disclose, transfer and otherwise process personal information. In particular, the GDPR includes obligations and restrictions concerning the consent and rights of individuals to whom the personal information relates, the transfer of personal information out of the European Economic Area, security breach notifications and the security and confidentiality of personal information. The GDPR authorizes fines for certain violations of up to 4% of global annual revenue or €20 million, whichever is greater, and other administrative penalties. Additionally, the United Kingdom (UK) implemented the Data Protection Act effective in May 2018 and will replacestatutorily amended in 2019, that substantially implements the current DPD.GDPR and contains provisions, including UK-specific derogations, for how GDPR is applied in the UK. Since the beginning of 2021 (when the transitional period following Brexit expired), we also have to continue to comply with the GDPR and the Data Protection Act, with each regime having the ability to fine up to the greater of €20 million (£17 million) or 4% of global revenue. The regulation introduces newrelationship between the UK and the EU remains uncertain, for example how data protection requirements intransfers between the UK and the EU and substantial fines for breachesother jurisdictions will be treated and the role of the UK’s supervisory authority. For example, on June 28, 2021, the European Commission adopted the adequacy decision (the “UK Adequacy Decision”) in the wake of a non-binding vote by the European Parliament against the then-draft UK Adequacy Decision the month prior. Consequently, personal data can continue to flow from the EEA to the UK without the need for appropriate safeguards. The UK Adequacy Decision includes a “sunset clause”, rendering the decision valid for four years only, after which it will be reviewed by the European Commission and renewed only if the European Commission considers that the UK continues to ensure an adequate level of data protection. The European Commission also stated that it would intervene at any point within the four years if the UK deviates from the level of protection rules. Itpresently in place. If this adequacy decision reversed by the European Commission, it would require that companies implement protection measures such as the standard contractual clauses, or “Standard contractual Clauses,” for data transfers between the EU and the UK. These changes will lead to additional costs as we try to ensure compliance with new privacy legislation and will increase our responsibility and liability in relation to personal data that we process and we may be required to put in place additional mechanisms ensuringoverall risk exposure.
The costs of compliance with, the new EU data protection rules. Additionally, Canada’s Personal Information and Protection of Electronic Documents Act, as well as a variety of provincial
Any legislation or regulation in the area of privacy and security of personal information could affect the way we operate our services and could harm our business. For example, the EuropeanGDPR imposes strict rules on the transfer of personal information out of the EU to the United States. These obligations may be interpreted and applied in a manner that is inconsistent from one jurisdiction to another and may conflict with other requirements or our practices. In addition, these rules are consistently under scrutiny. For example, on July 16, 2020, the Court of Justice of the European Union (the Court of Justice) invalidated the U.S.-EU Safe Harbor frameworkEuropean Union-United States (EU-U.S.) Privacy Shield on the grounds that had beenthe EU-U.S. Privacy Shield failed to offer adequate protections to EU personal information transferred to the United States. While the Court of Justice upheld the use of other data transfer mechanisms, such as the Standard Contractual Clauses, the decision has led to some uncertainty regarding the use of such mechanisms for data transfers to the United States, and the court made clear that reliance on Standard Contractual Clauses alone may not necessarily be sufficient in place since 2000, which allowed companies to meet certain EU legal requirementsall circumstances. The use of Standard Contractual Clauses for the transfer of personal information specifically to the United States also remains under review by a number of European data protection supervisory authorities. For example, German and Irish supervisory authorities have indicated that the Standard Contractual Clauses alone provide inadequate protection for EU-U.S. data transfers. Use of the data transfer mechanisms must
26
now be assessed on a case-by-case basis taking into account the legal regime applicable in the destination country, in particular applicable surveillance laws and rights of individuals.
On June 4, 2021, the European Commission finalized new versions of the Standard Contractual Clauses, with the implementing decision, or “Implementing Decision,” now in effect as of June 27, 2021. Under the Implementing Decision, the revised clauses must be used for relevant new data transfers from September 27, 2021 and existing standard contractual clauses arrangements must be migrated to the revised clauses by December 27, 2022. To comply with the Implementing Decision and the new Standard Contractual Clauses, we may need to implement additional safeguards to further enhance the security of data transferred out of the European Economic Area, which could increase our compliance costs, expose us to further regulatory scrutiny and liability, and adversely affect our business.
Additionally, other countries (e.g., Australia and Japan) have adopted certain legal requirements for cross-border transfers of personal information. These obligations may be interpreted and applied in a manner that is inconsistent from one jurisdiction to another and may conflict with other requirements or our practices. Further, since the transition period for Brexit ended December 31, 2020, there remains some uncertainty regarding cross-border data transfers from the EU to the United States. While other adequate legal mechanisms to lawfully transfer such data remain,Kingdom following the invalidation of the U.S.-EU Safe Harbor framework may result in different European data protection regulators applying differing standards for the transfer of personal data, which could result in increased regulation, cost of compliance and limitations on data transfer for us and our customers.June 2021 UK Adequacy Decision. The costs of compliance with, and the other burdens imposed by, these and other laws or regulatory actions may prevent us from selling our solutions or increase the costs associated with selling our solutions and may affect our ability to invest in or jointly develop solutions in the United States and in foreign jurisdictions. If we are required to implement additional measures to transfer data from foreign jurisdictions, such as the EU, this could increase our compliance costs, and could adversely affect our business, financial condition and results of operations. Further, we cannot assure youguarantee that our privacy and security policies and practices will be found sufficient to protect us from liability or adverse publicity relating to the privacy and security of personal information.
Additionally, several states have begun enacting new data privacy laws. For example, California recently enacted legislation, the California Consumer Privacy Act (CCPA), that, among other things, requires covered companies to provide new disclosures to California consumers, and afford such consumers new abilities to opt out of certain sales of personal information. The CCPA took effect on January 1, 2020 and became enforceable by the California Attorney General on July 1, 2020. The CCPA has been amended on multiple occasions and additional regulations of the California Attorney General came into effect on August 14, 2020 and were most recently amended on March 15, 2021. However, aspects of the CCPA and its interpretation remain unclear. The effects of the CCPA are significant and may require us to modify our data processing practices and policies and to incur substantial costs and expenses in an effort to comply. Moreover, a new privacy law, the California Privacy Rights Act (CPRA) was recently approved by California voters in connection with the election on November 3, 2020. The CPRA creates obligations relating to consumer data beginning on January 1, 2022, with implementing regulations expected on or before July 1, 2022, and enforcement beginning July 1, 2023. The CCPA requires (and the CPRA will require) covered companies to, among other things, provide new disclosures to California consumers, and affords such consumers new privacy rights such as the ability to opt-out of certain sales of personal information and expanded rights to access and require deletion of their personal information, opt out of certain personal information sharing, and receive detailed information about how their personal information is collected, used and shared. The CCPA provides for civil penalties for violations, as well as a private right of action for security breaches that may increase security breach litigation. Potential uncertainty surrounding the CCPA and CPRA may increase our compliance costs and potential liability, particularly in the event of a data breach, and could have a material adverse effect on our business, including how we use personal information, our financial condition, the results of our operations or prospects. The CCPA has also prompted a number of proposals for new federal and state privacy legislation that, if passed, could increase our potential liability, increase our compliance costs and adversely affect our business. Two states have recently passed personal information laws: the Colorado Privacy Act, which goes into effect on July 1, 2023; and Virginia’s Consumer Data Protection Act, which goes into effect on January 1, 2023.
The interplay of federal and state laws (e.g., in addition to California, Massachusetts and Nevada have adopted laws requiring the implementation of certain security measures to protect personal information, and all 50 states and the District of Columbia, Puerto Rico and Guam, have adopted breach notification laws) may be subject to varying interpretations by courts and government agencies, creating complex compliance issues for us and our customers and potentially exposing us to additional expense, adverse publicity and liability. Further, as regulatory focus on privacy, security and data use issues continues to increase and laws and regulations concerning the protection of personal information expand and become more complex, these potential risks to products and services could intensify.
As mentioned, changing definitions of personal data and information may also limit or inhibit our ability to operate or expand our business, including limiting strategic partnerships that may involve the sharing of data. Also, some jurisdictions require that certain types of data be retained on servers within these jurisdictions. Our failure to comply with applicable laws, directives, and regulations may result in enforcement action against us, including fines, and damage to our reputation, any of which may have an adverse effect on our equipment lease customers to pay us under leasing agreements with them that we do not sell to third party lease finance companies could harm our revenuebusiness and operating results.
27
Table of the lease payment stream once our obligations related to such sale have been met. We plan to sell the bulk of these leases, including the related accounts receivables, to third party lease finance companies on a non-recourse basis. We will have to retain unsold leases in-house, which will expose us to the creditworthiness of such lease customers over the lease term. For the leases that we retain in-house, our ability to collect payments from a customer or to recognize revenue for the sale could be impaired if the customer fails to meet its obligations to us such as in the case of its bankruptcy filing or deterioration in its financial position, or has other creditworthiness issues, any of which could harm our revenue and operating results.Contents
If our efforts to protect the security of information collected by our customers are unsuccessful, we could become subject to costly government enforcement actions and private litigation, and our sales and reputation could suffer.
The nature of our business involves the receipt and storage of information about our customers.customers, including personal information and PHI. We have implemented programs to detect and alert us to data security incidents. However, because the techniques used to obtain unauthorized access, disable or degrade service, or sabotage systems change frequently and may be difficult to detect for long periods of time, we may be unable to anticipate these techniques or implement adequate preventive measures. Companies are increasingly subject to a wide variety of security incidents, cyber-attacks and other attempts to gain unauthorized access. These threats can come from a variety of sources, ranging in sophistication from an individual hacker to malfeasance by employees, consultants or other service providers to state-sponsored attacks. Cyber threats may be generic, or they may be custom-craftedcustom crafted against our information systems. In recent times, cyber-attacks have become more prevalent and much harder to detect and defend against. Our network and storage applications may be vulnerable to cyber-attack, malicious intrusion, malfeasance, loss of data privacy or other significant disruption and may be subject to unauthorized access by hackers, employees, consultants or other service providers. In addition, hardware, software or applications we develop or procure from third parties may contain defects in design or manufacture or other problems that could unexpectedly compromise information security. Unauthorized parties may also attempt to gain access to our systems or facilities through fraud, trickery or other forms of deceiving our employees, contractors and temporary staff. If we experience significant data security breaches or fail to detect and appropriately respond to significant data security breaches, we could be exposed to government enforcement actions and private litigation.litigation, as well as potentially incur significant costs and diversion of resources to comply with our contractual obligations to notify our customers of such security breaches, particularly with respect to any protected health information affected. Moreover, if a computer security breach affects our systems or results in the unauthorized access, use or disclosure of personal information, our reputation could be materially damaged. In addition, such a breach may require notification to governmental agencies, the media and/or affected individuals pursuant to various federal, state and international privacy and security laws, if applicable, including HIPAA or HITECH and its implementing rules and regulations, as well as regulations promulgated by the Federal Trade Commission and state breach notification laws. We would also be exposed to a risk of loss or litigation and potential liability under laws, regulations and contracts that protect the privacy and security of personal information. For example, as stated above, the CCPA imposes a private right of action for security breaches that could lead to some form of remedy including regulatory scrutiny, fines, private right of action settlements, and other consequences. The financial exposure from the events referenced above could either not be insured against or not be fully covered through any insurance that we may maintain, and there can be no assurance that the limitations of liability in any of our contracts would be enforceable or adequate or would otherwise protect us from liabilities or damages as a result of the events referenced above. Any of the foregoing could have a material adverse effect on our business, reputation, results of operations, financial condition and prospects. In addition, our customers could further lose confidence in our ability to protect their information, which could cause them to discontinue using our products or purchasing from us altogether.
The failure of our equipment lease customers to pay us under leasing agreements with them that we do not sell to third party lease finance companies could harm our revenue and operating results.
In 2012, we began offering our solutions to our customers through multi-year equipment lease agreements. We sell the bulk of these leases, including the related accounts receivables, to third party lease finance companies on a non-recourse basis. We retain unsold leases in-house, which exposes us to the creditworthiness of such lease customers over the lease term. For the leases that we retain in-house, our ability to collect payments from a customer or to recognize revenue for the sale could be impaired if the customer fails to meet its obligations to us such as in the case of its bankruptcy filing or deterioration in its financial position, or has other creditworthiness issues, any of which could harm our revenue and operating results.
Our use of open source and non-commercial software components could impose risks and limitations on our ability to commercialize our solutions.
Our solutions contain software modules licensed under open source and other types of non-commercial licenses, including the GNU Public License, the Apache License and others. We also may incorporate open source and other licensed software into our solutions in the future. Use and distribution of such software may entail greater risks than use of third-party commercial software, as licenses of these types generally do not provide warranties or other contractual protections regarding infringement claims or the quality of the code. Some of these licenses require the release of our proprietary source code to the public if we combine our
proprietary software with open source software in certain manners. This could allow competitors to create similar products with lower development effort and time and ultimately result in a loss of sales for us.
The terms of many open source and other non-commercial licenses have not been judicially interpreted, and there is a risk that such licenses could be construed in a manner that could impose unanticipated conditions or restrictions on our ability to commercialize our solutions. In such event, in order to continue offering our solutions, we could be required to seek licenses
28
from alternative licensors, which may not be available on a commercially reasonable basis or at all, to re-engineer our solutions or to discontinue the sale of our solutions in the event we cannot obtain a license or re-engineer our solutions on a timely basis, any of which could harm our business and operating results. In addition, if an owner of licensed software were to allege that we had not complied with the conditions of the corresponding license agreement, we could incur significant legal costs defending ourselves against such allegations. In the event such claims were successful, we could be subject to significant damages, be required to disclose our source code, or be enjoined from the distribution of our solutions.
Claims of intellectual property infringement could harm our business.
Vigorous protection and pursuit of intellectual property rights has resulted in protracted and expensive litigation for many companies in our industry. Although claims of this kind have not materially affected our business to date, there can be no assurance of the absence of such claims in the future. Any claims or proceedings against us, whether meritorious or not, could be time consuming, result in costly litigation, require significant amounts of management time, result in the diversion of significant operational resources, or require us to enter into royalty or licensing agreements, any of which could harm our business and operating results.
Intellectual property lawsuits are subject to inherent uncertainties due to the complexity of the technical issues involved, and we cannot be certain that we will be successful in defending ourselves against intellectual property claims. In addition, we currently have a limited portfolio of issued patents compared to many other industry participants, and therefore may not be able to effectively utilize our intellectual property portfolio to assert defenses or counterclaims in response to patent infringement claims or litigation brought against us by third parties. Further, litigation may involve patent holding companies or other adverse patent owners who have no relevant products and against whom our potential patents may provide little or no deterrence.
Many potential litigants have the capability to dedicate substantially greater resources to enforce their intellectual property rights and to defend claims that may be brought against them. Furthermore, a successful claimant could secure a judgment that requires us to pay substantial damages or prevents us from distributing certain solutions or performing certain services. We might also be required to seek a license and pay royalties for the use of such intellectual property, which may not be available on commercially acceptable terms or at all. Alternatively, we may be required to develop non-infringing technology, which could require significant effort and expense and may ultimately not be successful.
If we are unable to protect our intellectual property rights, our competitive position could be harmed, or we could be required to incur significant expenses to enforce our rights.
Our success depends, in part, on our ability to protect our proprietary technology. We protect our proprietary technology through patent, copyright, trade secret and trademark laws in the United States and similar laws in other countries. We also protect our proprietary technology through licensing agreements, nondisclosure agreements and other contractual provisions. These protections may not be available in all cases or may be inadequate to prevent our competitors from copying, reverse engineering or otherwise obtaining and using our technology, proprietary rights or solutions in an unauthorized manner. The laws of some foreign countries may not be as protective of intellectual property rights as those in the United States, and mechanisms for enforcement of intellectual property rights may be inadequate. In addition, third parties may seek to challenge, invalidate or circumvent our patents, trademarks, copyrights and trade secrets, or applications for any of the foregoing. Our competitors may independently develop technologies that are substantially equivalent, or superior, to our technology or design around our proprietary rights. In each case, our ability to compete could be significantly impaired.
To prevent unauthorized use of our intellectual property rights, it may be necessary to prosecute actions for infringement or misappropriation of our proprietary rights. Any such action could result in significant costs and diversion of our resources and management’s attention, and there can be no assurance that we will be successful in such action. Furthermore, many of our current and potential competitors have the ability to dedicate substantially greater resources to enforce their intellectual property rights than us. Accordingly, despite our efforts, we may not be able to prevent third parties from infringing or misappropriating our intellectual property. While we plan to continue to protect our intellectual property with, among other things, patent protection, there can be no assurance that:
•current or future U.S. or foreign patent applications will be approved;
•our issued patents will protect our intellectual property and not be held invalid or unenforceable if challenged by third parties;
•we will succeed in protecting our technology adequately in all key jurisdictions in which we develop technology, or we or our competitors operate; or
•others will not independently develop similar or competing products or methods or design around any patents that may be issued to us.
29
Our failure to obtain patents with claims of a scope necessary to cover our technology, or the invalidation of our patents, or our inability to protect any of our intellectual property, may weaken our competitive position and harm our business and operating results. We might be required to spend significant resources to monitor and protect our intellectual property rights. We may initiate claims or litigation against third parties for infringement of our proprietary rights or to establish the validity of our proprietary rights. Any litigation, whether or not it is resolved in our favor, could result in significant expense to us and divert the efforts of our technical and management personnel, which may harm our business, operating results and financial condition.
Product liability or other liability claims could cause us to incur significant costs, adversely affect the sales of our solutions and harm our reputation.
Our solutions are utilized by healthcare professionals and others in the course of providing patient care. As a result, patients, family members, physicians, nurses or others may allege we are responsible for harm to patients or healthcare professionals due to defects in, the malfunction of, the characteristics of, or the operation of, our solutions. Any such allegations could harm our reputation and ability to sell our solutions. For example, we are currently a defendant, along with several other healthcare and equipment providers, in a litigation involving the death of a patient undergoing surgery at a hospital of one of our customers. The Company plans to defend itself vigorously in this matter, but the outcome of any litigation is inherently uncertain.
Our solutions utilize lithium-ion batteries and electronic components that may overheat or otherwise malfunction as a result of physical or environmental damage. Components of our solutions emit radio frequency (RF) emissions which have been alleged, in connection with cellular phones, to have adverse health consequences. Magnets in our badgesBadges may emit electromagnetic radiation and may be alleged to interfere with implanted medical or other devices. While these components of our solutions comply with applicable guidelines, some may allege that these components of our solutions cause adverse health consequences. Also, applicable guidelines may change making these components of our solutions non-compliant. Any such allegations or non-compliance, or any regulatory developments, could negatively impact the sales of our solutions, require costly modifications to our solutions, and harm our reputation.
Although our customer agreements contain terms and conditions, including disclaimers of liability, that are intended to reduce or eliminate our potential liability, we could be required to spend significant amounts of management time and resources to defend ourselves against product liability, tort, warranty or other claims. If any such claims were to prevail, we could be forced to pay damages, comply with injunctions or stop distributing our solutions. Even if potential claims do not result in liability to us, investigating and defending against these claims could be expensive and time consuming and could divert management’s attention away from our business. We maintain general liability insurance coverage, including coverage for errors and omissions; however, this coverage may not be sufficient to cover large claims against us or otherwise continue to be available on acceptable terms. Further, the insurer could attempt to disclaim coverage as to any particular claim.
We may require additional capital to support our business growth, and such capital may not be available.
We intend to continue to make investments to support business growth and may require additional funds to respond to business challenges, which include the need to develop new solutions or enhance existing solutions, enhance our operating infrastructure, expand our sales and marketing capabilities, expand into non-healthcare markets, and acquire complementary businesses, technologies or assets. Accordingly, we may need to engage in additional equity or debt financing to secure funds. Equity and debt financing, however, might not be available when needed or, if available, might not be available on terms satisfactory to us. If we raise additional funds through equity financing, our stockholders may experience dilution. Debt financing, if available, may involve covenants restricting our operations or our ability to incur additional debt. If we are unable to obtain adequate financing or financing on terms satisfactory to us in the future, our ability to continue to support our business growth and to respond to business challenges could be significantly limited as we may have to delay, reduce the scope of or eliminate some or all of our initiatives, which could harm our operating results.
Some of our solutions are, and others could become, subject to regulation by the U.S. Food and Drug Administration or similar foreign agencies, which could increase our operating costs.
We provide certain products that are, and others that may become, subject to regulation by the FDAFood and Drug Administration (FDA) and similar agencies in other countries, or the jurisdiction of these agencies could be expanded in the future to include our solutions. The FDA regulates certain products, including software-based products, as “medical devices” based, in part, on the intended use of the product and the risk the device poses to the patient should the device fail to perform properly. For example, the clinical alert notification solution we acquired as part of our acquisition of Extension Healthcare and the clinical communications product we acquired from mVisum are regulated by the FDA as Class II medical devices. Although we have concluded that our wireless badgeBadge is
a general-purpose communications device not subject to FDA regulation, the FDA could disagree with our conclusion, or changes in our solutions or the FDA’s evolving regulation could lead to FDA regulation of our solutions. Any of our products deemed to be medical devices would be subject to the 2.3% excise tax under the ACA. Canada and many other countries in which we sell or may sell our solutions could also have similar regulations applicable to our solutions, some of which may be subject to change or interpretation. We may incur substantial operating costs if we are required to register our solutions or components of our solutions as regulated medical devices under U.S. or foreign
30
regulations, obtain premarket approval from the FDA or foreign regulatory agencies, and satisfy the extensive reporting requirements. In addition, failure to comply with these regulations could result in enforcement actions and monetary penalties. The clinical alert notification solution
Environmental and social (E&S) regulations, policies and provisions, as well as customer demand, may make our supply chain more complex and may adversely affect our relationships with customers.
There is an increasing focus on the governance of environmental and social risks in our industry. A number of our customers have adopted, or may adopt, procurement policies that include E&S provisions that their suppliers must comply with, or they may seek to include such provisions in their procurement terms and conditions. An increasing number of participants in the industry are also joining voluntary E&S initiatives, such as the Responsible Business Alliance. These E&S provisions and initiatives are subject to change, can be unpredictable, and may be difficult and expensive for us to comply with, given the complexity of our supply chain and our outsourced manufacturing. If we acquiredare unable to comply or are unable to cause our suppliers or contract manufacturers to comply, with such policies or provisions, a customer may stop purchasing products from us, and may take legal action against us, which could harm our reputation, revenue and results of operations.
In addition, as part of their E&S programs, an increasing number of customers are seeking to source products that do not contain minerals sourced from areas where proceeds from the sale of such minerals are likely to be used to fund armed conflict, such as in the Democratic Republic of the Congo. This could adversely affect the sourcing, availability and pricing of minerals used in the manufacture of our acquisitionequipment. Since our supply chain is complex, we are not currently able to definitively ascertain the origins of Extension Healthcareall of the minerals and metals used in our products. As a result, we may face difficulties in satisfying these customers’ demands, which may harm our sales and operating results.
Risks Related to our Notes
We have indebtedness in the form of convertible senior notes.
As a result of the Notes offerings, we incurred $265.3 million principal amount of indebtedness, the principal amount of which we may be required to pay at maturity in 2023 and 2026. Holders of the Notes will have the right to require us to repurchase their Notes upon the occurrence of a “fundamental change” (as defined in the indenture governing the Notes) at a purchase price equal to 100% of the principal amount of the Notes to be purchased, plus accrued and unpaid interest, if any. In addition, the indenture for the Notes provides that we are required to repay amounts due under the indenture in the event that there is an event of default for the Notes that results in the principal, premium, if any, and interest, if any, becoming due prior to maturity date of the Notes. There can be no assurance that we will be able to repay this indebtedness when due, or that we will be able to refinance this indebtedness on acceptable terms or at all. In addition, this indebtedness could, among other things:
•heighten our vulnerability to adverse general economic conditions and heightened competitive pressures;
•require us to dedicate a larger portion of our cash flow from operations to interest payments, limiting the availability of cash for other purposes;
•limit our flexibility in planning for, or reacting to, changes in our business and industry; and
•impair our ability to obtain additional financing in the future for working capital, capital expenditures, acquisitions, general corporate purposes or other purposes.
In addition, our ability to purchase the Notes or repay prior to maturity any accelerated amounts under the Notes upon an event of default or pay cash upon conversions of the Notes may be limited by law, by regulatory authority or by agreements governing our indebtedness outstanding at the time. Our failure to repurchase Notes at a time when the repurchase is required by the indenture (whether upon a fundamental change or otherwise under the indenture) or pay cash payable on future conversions of the Notes (unless we elect to deliver solely shares of our common stock to settle such conversion) as required by the indenture would constitute a default under the indenture. A default under the indenture or the fundamental change itself could also lead to a default under agreements governing any future indebtedness. If the repayment of any related indebtedness were to be accelerated after any applicable notice or grace periods, we may not have sufficient funds to repay the indebtedness, repurchase the Notes or make cash payments upon conversions thereof.
Although the Notes are referred to as convertible senior notes, they are effectively subordinated to any of our secured debt and any liabilities of our subsidiaries.
The Notes rank senior in right of payment to any of our indebtedness that is expressly subordinated in right of payment to the Notes; equal in right of payment to all of our existing and future liabilities that are not so subordinated; effectively junior in right of payment to any of our secured indebtedness to the extent of the value of the assets securing such indebtedness; and structurally junior to all indebtedness and other liabilities (including trade payables) of our current or future subsidiaries. In the
31
event of our bankruptcy, liquidation, reorganization, or other winding up, our assets that secure debt ranking senior or equal in right of payment to the Notes will be available to pay obligations on the Notes only after the secured debt has been repaid in full from these assets, and the clinical communications productassets of our subsidiaries will be available to pay obligations on the Notes only after all claims senior to the Notes have been repaid in full. There may not be sufficient assets remaining to pay amounts due on any or all of the Notes then outstanding. The indentures governing the Notes do not prohibit us from incurring additional senior debt or secured debt, nor do they prohibit any of our current or future subsidiaries from incurring additional liabilities.
Servicing our debt requires, and will require, a significant amount of cash. We may not have sufficient cash flow to make payments on our debt, which could adversely affect our business, financial condition and results of operations.
Our ability to make scheduled payments of the principal of, to pay interest on or to refinance our indebtedness, including the Notes, depends on our future performance, which is subject to economic, financial, competitive and other factors beyond our control. Our business may not continue to generate cash flow from operations in the future sufficient to service our debt and make necessary capital expenditures. If we acquired from mVisum are regulatedunable to generate such cash flow, we may be required to adopt one or more alternatives, such as selling assets, restructuring debt or obtaining additional equity capital on terms that may be onerous or highly dilutive. Our ability to refinance our indebtedness will depend on the capital markets and our financial condition at such time. We may not be able to engage in any of these activities or engage in these activities on desirable terms, which could result in a default on our debt obligations, including the Notes or otherwise.
In addition, our significant indebtedness, combined with our other financial obligations and contractual commitments, could have other important consequences. For example, it could:
•make us more vulnerable to adverse changes in general U.S. and worldwide economic, industry and competitive conditions and adverse changes in government regulation;
•limit our flexibility in planning for, or reacting to, changes in our business and our industry;
•place us at a disadvantage compared to our competitors who have less debt; and
•limit our ability to borrow additional amounts for working capital and other general corporate purposes, including to fund possible acquisitions of, or investments in, complementary businesses, products, services and technologies.
Any of these factors could materially and adversely affect our business, financial condition and results of operations. In addition, if we incur additional indebtedness, the risks related to our business and our ability to service or repay our indebtedness would increase.
Recent and future regulatory actions and other events may adversely affect the trading price and liquidity of the Notes.
We expect that many investors in, and purchasers of, the Notes will employ, or seek to employ, a convertible arbitrage strategy with respect to the Notes. Investors would typically implement such a strategy by selling short the common stock underlying the notes and dynamically adjusting their short position while continuing to hold the notes. Investors may also implement this type of strategy by entering into swaps on our common stock in lieu of or in addition to short selling the common stock.
The SEC and other regulatory and self-regulatory authorities have implemented various rules and taken certain actions, and may in the future adopt additional rules and take other actions, that may impact those engaging in short selling activity involving equity securities (including our common stock). Such rules and actions include Rule 201 of SEC Regulation SHO, the adoption by the FDAFinancial Industry Regulatory Authority, Inc. and the national securities exchanges of a “Limit Up-Limit Down” program, the imposition of market-wide circuit breakers that halt trading of securities for certain periods following specific market declines, and the implementation of certain regulatory reforms required by the Dodd-Frank Wall Street Reform and Consumer Protection Act of 2010. Any governmental or regulatory action that restricts the ability of the holders the Notes to effect short sales of our common stock, borrow our common stock, or enter into swaps on our common stock could adversely affect the trading price and the liquidity of the Notes.
Volatility in the market price and trading volume of our common stock could adversely impact the trading price of the Notes.
We expect that the trading price of the Notes will be significantly affected by the market price of our common stock. The stock market in recent years has experienced significant price and volume fluctuations that have often been unrelated to the operating performance of companies. The market price of our common stock could fluctuate significantly for many reasons. A decrease in the market price of our common stock would likely adversely impact the trading price of the Notes. The market price of our common stock could also be affected by possible sales of our common stock by investors who view the Notes as Class II medical devices.a more attractive means of equity participation in us and by hedging or arbitrage trading activity that we expect to develop involving our common stock. This trading activity could, in turn, affect the trading price of the Notes.
32
We may still incur substantially more debt or take other actions which would intensify the risks discussed above.
We and our subsidiaries may incur substantial additional debt in the future, subject to the restrictions contained in our debt instruments, some of which may be secured debt. We will not be restricted under the terms of the indentures governing the Notes from incurring additional debt, securing existing or future debt, recapitalizing our debt, or taking a number of other actions that are not limited by the terms of the indentures governing the Notes that could have the effect of diminishing our ability to make payments on our debt, including the Notes, when due.
We may not have the ability to raise the funds necessary to settle conversions of the Notes in cash or to repurchase the Notes upon a fundamental change, and our future debt may contain limitations on our ability to pay cash upon conversion or repurchase of the Notes.
Holders of the Notes will have the right, subject to certain conditions and limited exceptions, to require us to repurchase all or a portion of their Notes upon the occurrence of a fundamental change before the maturity date at a fundamental change repurchase price equal to 100% of the principal amount of the Notes to be repurchased, plus accrued and unpaid interest, if any, In addition, upon conversion of the Notes, unless we elect to deliver solely shares of our common stock to settle such conversion (other than paying cash in lieu of delivering any fractional share), we will be required to make cash payments in respect of the Notes being converted. However, we may not have enough available cash or be able to obtain financing at the time we are required to make repurchases of the Notes surrendered therefor or pay cash with respect to Notes being converted.
In addition, our ability to repurchase Notes or to pay cash upon conversions of the Notes may be limited by law, regulatory authority, or any agreements governing our future indebtedness. Our failure to repurchase Notes at a time when the repurchase is required by the indenture or to pay any cash upon conversions of the Notes as required by the indenture would constitute a default under the indenture. A default under the indenture or the fundamental change itself could also lead to a default under agreements governing our future indebtedness. If the payment of the related indebtedness were to be accelerated after any applicable notice or grace periods, we may not have sufficient funds to repay the indebtedness and repurchase the Notes or to pay cash upon conversions of the notes.
Redemption may adversely affect a holder’s return on the 2026 Notes.
We may not redeem the 2026 Notes prior to March 20, 2024. We may redeem for cash all or any portion of the 2026 Notes (subject to the partial redemption limitation (as defined in the indenture governing the notes)), at our option, on or after March 20, 2024 if the last reported sale price of our common stock has been at least 130% of the conversion price then in effect for at least 20 trading days (whether or not consecutive) during any 30 consecutive trading day period (including the last trading day of such period) ending on, and including, the trading day immediately preceding the date on which we provide notice of redemption at a redemption price equal to 100% of the principal amount of the notes to be redeemed, plus accrued and unpaid interest to, but excluding, the redemption date. As a result, we may choose to redeem some or all of the 2026 Notes, including at times when prevailing interest rates are relatively low. As a result, you may not be able to reinvest the proceeds you receive from the redemption in a comparable security at an effective interest rate as high as the interest rate on your 2026 Notes being redeemed. In addition, a redemption of less than all of the outstanding 2026 Notes will likely harm the liquidity of the market for the unredeemed 2026 Notes following the redemption. Accordingly, if your 2026 Notes are not redeemed in a partial redemption, then you may be unable to sell your 2026 Notes at the times you desire or at favorable prices, if at all, and the trading price of your 2026 Notes may decline.
The conditional conversion feature of the Notes, if triggered, may adversely affect our financial condition and operating results
In the event the conditional conversion feature of the Notes is triggered, holders of the Notes will be entitled to convert their Notes at any time during specified periods at their option. If one or more holders elect to convert their Notes, unless we elect to satisfy our conversion obligation by delivering solely shares of our common stock (other than paying cash in lieu of delivering any fractional share), we would be required to settle a portion or all of our conversion obligation through the payment of cash, which could adversely affect our liquidity. In addition, even if holders of the Notes do not elect to convert their Notes, we could be required under applicable accounting rules to reclassify all or a portion of the outstanding principal of the Notes as a current rather than long-term liability, which would result in a material reduction of our net working capital.
During the year ended December 31, 2021, the conditions allowing holders of the 2023 Notes to convert have been met because our stock price traded above the minimum price specified in the Indenture during the year ended December 31, 2021. The 2023
33
Notes are convertible at the option of the holder until at least March 31, 2022 and are classified as current debt as of December 31, 2021.
Changes in the accounting method for convertible debt securities that may be settled in cash, such as the Notes, could have a material effect on our reported financial results.
The accounting method for reflecting the Notes on our balance sheet, accruing amortized interest expense for the Notes and reflecting the underlying shares of our common stock in our reported diluted earnings per share may adversely affect our reported earnings and financial condition. For the fiscal year beginning January 1, 2021, we have elected to early adopt new accounting guidance that was recently released that simplifies the accounting for convertible debt that may be settled in cash (ASU 2020-06), amending Accounting Standards Codification 470-20, Debt with Conversion and Other Options (ASC 470-20). As a result, we recorded the convertible debt securities (including the Notes) entirely as a liability on our balance sheet, net of issuance costs incurred, with interest expense reflecting the cash coupon plus the amortization of the capitalized issuance costs. Additionally, the new guidance modifies the treatment of convertible debt securities that may be settled in cash or shares by requiring the use of the “if-converted” method. Under that method, diluted earnings per share would generally be calculated assuming that all the Notes were converted solely into shares of common stock at the beginning of the reporting period, unless the result would be antidilutive. In addition, in the future, we may, in our sole discretion, irrevocably elect to settle the conversion value of the Notes in cash up to the principal amount being converted. Following such an irrevocable election, we will calculate our diluted earnings per share by assuming that all of the Notes were converted at the beginning of the reporting period and that we issued shares of our common stock to settle the excess, unless the result would be anti-dilutive. The application of the if-converted method may reduce our reported diluted earnings per share. Furthermore, if any of the conditions to the convertibility of the Notes are satisfied, then, under certain conditions, we may be required under applicable accounting standards to reclassify the liability carrying value of the Notes as a current, rather than a long-term, liability. This reclassification could be required even if no noteholders convert their Notes and could materially reduce our reported working capital.
Future sales of our common stock or equity-linked securities in the public market could lower the market price for our common stock and adversely impact the trading price of the Notes.
In the future, we may sell additional shares of our common stock or equity-linked securities to raise capital. In addition, a substantial number of shares of our common stock is reserved for issuance upon the exercise of stock options and upon conversion of the Notes. We cannot predict the size of future issuances or the effect, if any, that they may have on the market price for our common stock. The issuance and sale of substantial amounts of our common stock or equity-linked securities, or the perception that such issuances and sales may occur, could adversely affect the trading price of the Notes and the market price of our common stock and impair our ability to raise capital through the sale of additional equity or equity-linked securities.
Holders of the Notes will not be entitled to any rights with respect to our common stock, but they will be subject to all changes affecting our common stock to the extent satisfaction of our conversion obligation includes shares of our common stock.
Holders of the Notes will not be entitled to any rights with respect to our common stock (including, without limitation, voting rights and rights to receive any dividends or other distributions on our common stock) prior to the conversion date relating to such Notes (if we have elected to settle the relevant conversion by delivering solely shares of our common stock (other than paying cash in lieu of delivering any fractional share)) or the last trading day of the relevant observation period (if we elect to pay and deliver, as the case may be, a combination of cash and shares of our common stock in respect of the relevant conversion), but holders of the Notes will be subject to all changes affecting our common stock. For example, if an amendment is proposed to our restated certificate of incorporation or restated bylaws requiring stockholder approval and the record date for determining the stockholders of record entitled to vote on the amendment occurs prior to the conversion date related to a holder’s conversion of its Notes (if we have elected to settle the relevant conversion by delivering solely shares of our common stock (other than paying cash in lieu of delivering any fractional share)) or the last trading day of the relevant observation period (if we elect to pay and deliver, as the case may be, a combination of cash and shares of our common stock in respect of the relevant conversion), such holder will not be entitled to vote on the amendment, although such holder will nevertheless be subject to any changes affecting our common stock.
34
The conditional conversion feature of the Notes could result in holders of our Notes receiving less than the value of our common stock into which the Notes would otherwise be convertible.
Prior to the close of business on the business day immediately preceding June 15, 2026, a holder may convert 2026 Notes only if specified conditions are met. If the specific conditions for conversion are not met, a holder will not be able to convert 2026 Notes, and a holder may not be able to receive the value of the cash, common stock or a combination of cash and common stock, as applicable, into which the 2026 Notes would otherwise be convertible.
Upon conversion of the Notes, our Note holders may receive less valuable consideration than expected because the value of our common stock may decline after the exercise of conversion rights but before we settle our conversion obligation.
Under the Notes, a converting holder will be exposed to fluctuations in the value of our common stock during the period from the date such holder surrenders Notes for conversion until the date we settle our conversion obligation. For example, upon conversion of the 2026 Notes, we have the option to pay or deliver, as the case may be, cash, shares of our common stock, or a combination of cash and shares of our common stock. If we elect to satisfy our conversion obligation in cash or a combination of cash and shares of our common stock, the amount of consideration that our Note holders will receive upon conversion of their 2026 Notes will be determined by reference to the volume weighted average prices of our common stock for each trading day in a 40 trading day observation period. This period would be: (i), subject to clause (ii), if the relevant conversion date occurs prior to June 15, 2026, the 40 consecutive trading days beginning on, and including, the second trading day immediately succeeding such conversion date; (ii) with respect to any 2026 Notes called for redemption (or deemed called for redemption) and prior to the relevant redemption date, the 40 consecutive trading days beginning on, and including the 41st scheduled trading day immediately preceding such redemption date; and (iii) subject to clause (ii) if the relevant conversion date occurs on or after June 15, 2026, the 40 consecutive trading days beginning on, and including, the 41st scheduled trading day immediately preceding the maturity date. Accordingly, if the price of our common stock decreases during this period, the amount and/or value of consideration a Note holder receives will be adversely affected. In addition, if the market price of our common stock at the end of such period is below the average of the daily volume weighted average prices of our common stock during such period, the value of any shares of our common stock that a Note holder will receive in satisfaction of our conversion obligation will be less than the value used to determine the number of shares that the Note holder will receive. If we elect to satisfy our conversion obligation solely in shares of our common stock upon conversion of the 2026 Notes, we will be required to deliver the shares of our common stock, together with cash for any fractional share, on the second business day following the relevant conversion date. Accordingly, if the price of our common stock decreases during this period, the value of the shares that a Note holder receives will be adversely affected and would be less than the conversion value of the 2026 Notes on the conversion date.
The Notes are not protected by restrictive covenants.
The indentures governing the Notes do not contain any financial or operating covenants or restrictions on the payments of dividends, the incurrence of indebtedness, or the issuance or repurchase of securities by us or any of our subsidiaries. The indentures do not contain any covenants or other provisions to afford protection to holders of the Notes in the event of a fundamental change or other corporate transaction involving us except to the extent described in the indentures governing the Notes.
The increase in the conversion rate for Notes converted in connection with a make-whole fundamental change or a notice of redemption may not adequately compensate Note holders for any lost value of their Notes as a result of such transaction or redemption.
If a make-whole fundamental change occurs prior to the maturity date or if we deliver a notice of redemption, we will, under certain circumstances, increase the conversion rate by a number of additional shares of our common stock for Notes converted in connection with such make-whole fundamental change or Notes called (or deemed called) for redemption that are converted during the related redemption period. The increase in the conversion rate will be determined based on the date on which the make-whole fundamental change occurs or the date we deliver the notice of redemption, as the case may be, and the price paid (or deemed to be paid) per share of our common stock in the make-whole fundamental change or determined with respect to the notice of redemption, as the case may be. The increase in the conversion rate for Notes converted in connection with a make-whole fundamental change or called (or deemed called) for redemption that are converted during the related redemption period may not adequately compensate a Note holder for any lost value of the Notes as a result of such transaction or redemption. Furthermore, if we call only a portion of the outstanding Notes for redemption, only those Notes called (or deemed called) for redemption will become convertible as a result of such call for redemption and only the conversion rate of the Notes converted in connection with such notice of redemption will be increased. Accordingly, Notes not called for redemption will not become
35
convertible if not otherwise convertible at such time and will remain outstanding, and may have reduced liquidity and a resulting reduced trading price.
In addition, for the 2026 Notes, if the price per share of our common stock is greater than $325.00 per share or less than $44.55 per share (in each case, subject to adjustment), no additional shares will be added to the conversion rate. Moreover, in no event will the conversion rate per $1,000 principal amount of 2026 Notes as a result of this adjustment exceed 22.4466 shares of common stock, subject to adjustment. The 2023 Notes contain substantially similar conversion features.
Our obligation to increase the conversion rate for Notes converted in connection with a make-whole fundamental change or Notes called (or deemed called) for redemption that are converted during the related redemption period could be considered a penalty, in which case the enforceability thereof would be subject to general principles of reasonableness and equitable remedies.
The conversion rate of the Notes may not be adjusted for all dilutive events.
The conversion rate of the Notes is subject to adjustment for certain events, including, but not limited to, the issuance of certain stock dividends on our common stock, the issuance of certain rights or warrants, subdivisions, combinations, distributions of capital stock, indebtedness, or assets, cash dividends, and certain issuer tender or exchange offers. However, the conversion rate will not be adjusted for other events, such as a third-party tender or exchange offer or an issuance of our common stock for cash, that may adversely affect the trading price of the Notes or our common stock. An event that adversely affects the value of the Notes may occur, and that event may not result in an adjustment to the conversion rate.
Provisions in the indentures for the Notes may deter or prevent a business combination that may be favorable to our security holders.
If a fundamental change occurs prior to the maturity date, holders of the Notes will have the right, at their option, to require us to repurchase all or a portion of their Notes. In addition, if a make-whole fundamental change occurs prior the maturity date, we will in some cases be required to increase the conversion rate for a holder that elects to convert its Notes in connection with such make-whole fundamental change. Furthermore, the indentures for the Notes will prohibit us from engaging in certain mergers or acquisitions unless, among other things, the surviving entity assumes our obligations under the Notes. These and other provisions in the indentures could deter or prevent a third party from acquiring us even when the acquisition may be favorable to our security holders.
Some significant restructuring transactions may not constitute a fundamental change, in which case we would not be obligated to offer to repurchase the Notes.
Upon the occurrence of a fundamental change, our Note holders have the right to require us to repurchase all or a portion of their Notes. However, the fundamental change provisions will not afford protection to holders of the Notes in the event of other transactions that could adversely affect the Notes. For example, a significant change in the composition of our board of directors or transactions such as leveraged recapitalizations, refinancings, restructurings, or acquisitions initiated by us may not constitute a fundamental change requiring us to offer to repurchase the Notes. In the event of any such transaction, the holders would not have the right to require us to repurchase the Notes, even though each of these transactions could increase the amount of our indebtedness, or otherwise adversely affect our capital structure or any credit ratings, thereby adversely affecting the holders of the Notes.
We have not registered, and are not required to register, the Notes or the common stock issuable upon conversion of the Notes, if any, which will limit our Note holders’ ability to resell them.
The Notes and the shares of common stock issuable upon conversion of the Notes, if any, have not been, and are not required to be, registered under the Securities Act or any state securities laws. Unless the Notes and any shares of common stock issuable upon conversion of the Notes, if any, have been registered, the Notes and such shares may not be transferred or resold except in a transaction exempt from or not subject to the registration requirements of the Securities Act and applicable state securities laws. We do not intend to file a registration statement for the resale of the Notes and the common stock, if any, into which the Notes are convertible.
We cannot assure you that an active trading market will develop for the Notes.
We do not intend to apply to list the Notes on any securities exchange or to arrange for quotation on any automated dealer quotation system. The liquidity of the trading market in the Notes, and the market price quoted for the Notes, may be adversely
36
affected by changes in the overall market for this type of security and by changes in our financial performance or prospects or in the prospects for companies in our industry generally. As a result, an active trading market may not develop for the Notes. If an active trading market does not develop or is not maintained, the market price and liquidity of the Notes may be adversely affected. In that case Note holders may not be able to sell their Notes at a particular time or may not be able to sell their Notes at a favorable price.
Any adverse rating of the Notes may cause their trading price to fall.
We do not intend to seek a rating on the Notes. However, if a rating service were to rate the Notes and if such rating service were to lower its rating on the Notes below the rating initially assigned to the Notes or otherwise announces its intention to put the Notes on credit watch, the trading price of the Notes could decline.
Note holders may be subject to tax if we make or fail to make certain adjustments to the conversion rate of the Notes even though they do not receive a corresponding cash distribution.
The conversion rate of the Notes is subject to adjustment in certain circumstances, including the payment of cash dividends. If the conversion rate is adjusted as a result of a distribution that is taxable to our common stockholders, such as a cash dividend, Note holders may be deemed to have received a dividend subject to U.S. federal income tax without the receipt of any cash. In addition, a failure to adjust (or to adjust adequately) the conversion rate after an event that increases a Note holder’s proportionate interest in us could be treated as a deemed taxable dividend to the holder. If a make-whole fundamental change occurs prior to the maturity date or if we deliver a notice of redemption, we will, under some circumstances, increase the conversion rate for Notes converted in connection with the make-whole fundamental change or called (or deemed called) for redemption that are converted during the related redemption period. Such increase may also be treated as a distribution subject to U.S. federal income tax as a dividend. If a Note holder is a non-U.S. holder, any deemed dividend would generally be subject to U.S. federal withholding tax, which may be set off against subsequent payments on the Notes or other amounts received by the holder.
Because the Notes are held in book-entry form, holders must rely on The Depository Trust Company (DTC) procedures to receive communications relating to the Notes and exercise their rights and remedies.
We have issued the Notes in the form of one or more global notes registered in the name of Cede & Co., as nominee of DTC. Beneficial interests in global notes will be shown on, and transfers of global notes will be effected only through, the records maintained by DTC. Except in limited circumstances, we will not issue certificated notes.
Accordingly, if a Note holder owns a beneficial interest in a global note, then it will not be considered an owner or holder of the Notes. Instead, DTC or its nominee will be the sole holder of the Notes. Unlike persons who have certificated notes registered in their names, owners of beneficial interests in global notes will not have the direct right to act on our solicitations for consents or requests for waivers or other actions from holders. Instead, those beneficial owners will be permitted to act only to the extent that they have received appropriate proxies to do so from DTC or, if applicable, a DTC participant. The applicable procedures for the granting of these proxies may not be sufficient to enable owners of beneficial interests in global notes to vote on any requested actions on a timely basis. In addition, notices and other communications relating to the Notes will be sent to DTC. We expect DTC to forward any such communications to DTC participants, which in turn would forward such communications to indirect DTC participants. However, we can make no assurances that Note holders will timely receive any such communications.
37
The capped call transactions may affect the value of the Notes and our common stock.
In connection with the issuance of the Notes, we entered into capped call transactions with certain financial institutions (the option counterparties). The capped call transactions are expected generally to reduce the potential dilution upon any conversion of the Notes and/or offset any cash payments we are required to make in excess of the principal amount upon conversion of the Notes, with such reduction and/or offset subject to a cap. In connection with establishing their initial hedges of the capped call transactions, the option counterparties and/or their respective affiliates purchased shares of our common stock and/or entered into various derivative transactions with respect to our common stock. This activity could have increased (or reduced the size of any decrease in) the market price of our common stock or the Notes at that time. In addition, the option counterparties and/or their respective affiliates may modify their hedge positions by entering into or unwinding various derivatives with respect to our common stock and/or purchasing or selling our common stock in secondary market transactions (and are likely to do so during any observation period related to a conversion of the Notes or following any repurchase of the Notes by us on any fundamental change repurchase date or otherwise). This activity could also cause or avoid an increase or a decrease in the price of our common stock or the Notes. The potential effect, if any, of these transactions and activities on the price of our common stock or the Notes will depend in part on market conditions and cannot be ascertained at this time. Any of these activities could adversely affect the value of our common stock.
Risks related to our common stock
We have never paid cash dividends on our capital stock, and we do not anticipate paying any dividends in the foreseeable future.
We have never paid cash dividends on any of our capital stock and currently intend to retain our future earnings to fund the development and growth of our business. As a result, capital appreciation, if any, of our common stock will be the sole source of gain for the foreseeable future.
Our charter documents and Delaware law could discourage, delay or prevent a change of control of our company or change in our management that stockholders consider favorable and cause our stock price to decline.
Certain provisions of our restated certificate of incorporation and restated bylaws and Delaware law could discourage, delay or prevent a change of control of our company or change in our management that the stockholders of our company consider favorable. These provisions:
•authorize the issuance of “blank check” preferred stock that our board of directors could issue to increase the number of outstanding shares and to discourage a takeover attempt;
•prohibit stockholder action by written consent, requiring all stockholder actions to be taken at a meeting of stockholders;
•establish advance notice procedures for nominating candidates to our board of directors or proposing matters that can be acted upon by stockholders at stockholder meetings;
•limit the ability of our stockholders to call special meetings of stockholders;
•prohibit stockholders from cumulating their votes for the election of directors;
•permit newly created directorships resulting from an increase in the authorized number of directors or vacancies on our board of directors to be filled only by majority vote of our remaining directors, even if less than a quorum is then in office;
•provide that our board of directors is expressly authorized to make, alter or repeal our bylaws;
•establish a classified board of directors so that not all members of our board are elected at one time;
•provide that our directors may be removed only for “cause” and only with the approval of the holders of at least 66 2/3rds percent of our outstanding stock; and
•require super-majority voting to amend certain provisions in our certificate of incorporation and bylaws.
Section 203 of the Delaware General Corporation Law may also discourage, delay or prevent a change of control of our company.
38
The exclusive forum provision in our amended and restated bylaws may limit a stockholder’s ability to bring a claim in a judicial forum that it finds favorable for disputes with us or any of our directors, officers, or other employees, which may discourage lawsuits with respect to such claims.
Section 22 of the Securities Act creates concurrent jurisdiction for federal and state courts over all claims brought to enforce any duty or liability created by the Securities Act or the rules and regulations thereunder. In April 2020, we amended and restated our restated bylaws to provide that the federal district courts of the United States of America will, to the fullest extent permitted by law, be the exclusive forum for resolving any complaint asserting a cause of action arising under the Securities Act (a Federal Forum Provision). Our decision to adopt a Federal Forum Provision followed a decision by the Supreme Court of the State of Delaware holding that such provisions are facially valid under Delaware law. While there can be no assurance that federal courts or other state courts will follow the holding of the Delaware Supreme Court or determine that the Federal Forum Provision should be enforced in a particular case, application of the Federal Forum Provision generally means that suits brought by our stockholders to enforce any duty or liability created by the Securities Act must be brought in federal court and cannot be brought in state court. While neither the exclusive forum provision nor the Federal Forum Provision applies to suits brought to enforce any duty or liability created by the Exchange Act, Section 27 of the Exchange Act creates exclusive federal jurisdiction over all claims brought to enforce any duty or liability created by the Exchange Act or the rules and regulations thereunder. Accordingly, actions by our stockholders to enforce any duty or liability created by the Exchange Act or the rules and regulations thereunder also must be brought in federal court. Our stockholders will not be deemed to have waived our compliance with the federal securities laws and the regulations promulgated thereunder.
Any person or entity purchasing or otherwise acquiring or holding any interest in any of our securities shall be deemed to have notice of and consented to our exclusive forum provisions, including the Federal Forum Provision. These provisions may limit a stockholder’s ability to bring a claim in a judicial forum of their choosing for disputes with us or our directors, officers, or other employees, which may discourage lawsuits against us and our directors, officers, and other employees.
General risk factors
The market price of our common stock has been, and may continue to be, volatile, and your investment in our stock could suffer a decline in value.
There has been significant volatility in the market price and trading volume of equity securities, which is often unrelated or disproportionate to the financial performance of the companies issuing the securities. These broad market fluctuations may negatively affect the market price of our common stock. The market price of our common stock could fluctuate significantly in response to the factors described in this “Risk Factors” section and elsewhere in this Form 10-K and other factors, many of which are beyond our control, including:
•actual or anticipated variation in anticipated operating results of us or our competitors;
•the financial projections we may provide to the public, any changes in these projections or our failure to meet these projections;
•announcements by us or our competitors of new solutions, new or terminated significant contracts, commercial relationships or capital commitments;
•changes in the regulatory environment affecting our healthcare customers, including impediments to their ability to obtain reimbursement for their services, and other actual or anticipated legal or regulatory developments in the United States or foreign countries;
•actual or anticipated developments in our competitors’ businesses or the competitive landscape generally;
•failure of securities analysts to maintain coverage of us, changes in financial estimates by any securities analysts who follow our company, or our failure to meet these estimates or the expectations of investors;
•developments or disputes concerning our intellectual property or other proprietary rights;
•commencement of, or our involvement in, litigation;
•announced or completed acquisitions of businesses, technologies or assets by us or our competitor;
•changes in operating performance and stock market valuations of other technology companies generally, or those in our industry in particular;
•price and volume fluctuations attributable to inconsistent trading volume levels of our common stock;
•our decision to seek additional equity or debt financing;
•our public float relative to the total number of shares of our common stock that are issued and outstanding;
•price and volume fluctuations in the overall stock market, including as a result of trends in the economy as a whole;
•rumors and market speculation involving us or other companies in our industry;
•the dissemination of adverse or misleading reports or opinions about our business;
•any major change in our management;
39
•unfavorable economic conditions and slow or negative growth of our markets; and
•other events or factors, including those resulting from war, incidents of terrorism or health epidemics or contagious diseases.
Our business is subject to the risks of earthquakes, fire, floods and other natural catastrophic events, and to interruption by man-made problems such as power disruptions or terrorism.
Our corporate headquarters are located in the San Francisco Bay Area, a region known for seismic activity, and many critical components of our solutions are sourced in Asia and Mexico, regions known to suffer natural disasters.disasters and epidemics or contagious diseases. A significant natural disaster, such as an earthquake, fire or a flood, or epidemic or contagious disease, occurring at our headquarters, our other facilities or where our contract manufacturer or its suppliers are located, could harm our business, operating results and financial condition. In addition, acts of terrorism could cause disruptions in our business, the businesses of our customers and suppliers, or the economy as a whole. We also rely on information technology systems to communicate among our workforce located worldwide, and in particular, our senior management, general and administrative, and research and development activities that are coordinated with our corporate headquarters in the San Francisco Bay Area. Any disruption to our internal communications, whether caused by a natural disaster, an epidemic or contagious disease, or by man-made problems, such as power disruptions, in the San Francisco Bay Area, Asia or Mexico could delay our research and development efforts, cause delays or cancellations of customer orders or delay deployment of our solutions, which could harm our business, operating results and financial condition.
If we do not maintain effective internal control over financial reporting or disclosure controls and procedures in the future, the accuracy and timeliness of our financial reporting may be adversely affected.
The Sarbanes-Oxley Act requires, among other things, that we assess the effectiveness of our internal control over financial reporting annually and disclosure controls and procedures quarterly. In particular, we must obtain confidence in our internal control over financial reporting to allow management to report on the effectiveness of our internal control over financial reporting as required by Section 404 of the Sarbanes-Oxley Act. To the extent we find a material weakness or other deficiency in our internal control over financial reporting, the accuracy and timeliness of our financial reporting may be adversely affected.
Multiple negative consequences could ensue if a material weakness in our internal control over financial reporting is identified in the future, or we are not able to comply with the requirements of Section 404 in a timely manner, or we do not maintain effective controls. For example, our reported financial results could be materially misstated or could be restated, we could receive an adverse opinion regarding our controls from our independent registered public accounting firm, or we could be subject to investigations or sanctions by regulatory authorities. All of these outcomes would require additional financial and management resources, and the market price of our stock could decline.
We will continue to incur substantial costs as a result of operating as a public company and our management devotes substantial time to public company compliance obligations.
As a public company, we incur substantial legal, accounting and other expenses. The Sarbanes-Oxley Act, Dodd-Frank Wall Street Reform and Consumer Protection Act of 2010 and rules subsequently implemented by the SEC and our stock exchange, impose various requirements on public companies, including certain corporate governance practices. Our management and other personnel devote a substantial amount of time to these compliance requirements. Moreover, these rules and regulations, along with compliance with accounting principles and regulatory interpretations of such principles, as amended by the JOBS Act, have increased and will continue to increase our legal, accounting and financial compliance costs and have made and will continue to make some activities more time-consuming and costly.costly to the extent we remain a public company.
We face risks related to securities litigation that could result in significant legal expenses and settlement or damage awards.
We have in the past been, and may in the future become, subject to claims and litigation alleging violations of the securities laws or other related claims, which could harm our business and require us to incur significant costs. For example, a purported securities class action was filed in August 2013 in the United States District Court for the Northern District of California against us and certain of our officers and directors. The suit purported to allege claims for allegedly misleading statements regarding our business
40
legal expenses, settlement costs or damage awards that could have a material impact on our financial position, results of operations and cash flows.
If securities or industry analysts issue an adverse or misleading opinion regarding our stock or do not publish research or reports about our business, our stock price could decline.
The trading market for our common stock depends in part on the research and reports that securities or industry analysts publish about us and our business. We do not control these analysts or the content and opinions included in their reports. The price of our common stock could decline if one or more analysts downgrade our common stock or if those analysts issue other unfavorable commentary or cease publishing reports about us or our business. If one or more analysts cease coverage of our company or fail to regularly publish reports about our company, we could lose visibility in the financial market, which in turn could cause our stock price to decline. Further, securities or industry analysts may elect not to provide research coverage of our common stock and such lack of research coverage may adversely affect the market price of our common stock.
None
Item 2.Properties
We do not currently own any of our facilities. The following table sets forth the location, approximate size, primary use and lease expiration dates of our material leased facilities. Our facilities are in good operating condition and adequately serve our business needs.
| Location | Approximate square feet | Primary use | Lease expiration date | ||||||||||||||||||
| San Jose, California | 70,000 | Corporate headquarters and product warehousing | March 31, 2022 | ||||||||||||||||||
| San Jose, California | 77,822 | Future corporate headquarters and product warehousing | June 30, 2029 | ||||||||||||||||||
| Fort Wayne, Indiana | 27,860 | Development, sales and support | February 28, 2023 | ||||||||||||||||||
| Development | June 18, 2022 | ||||||||||||||||||||
| Bengaluru, India | 20,734 | Development | October 31, 2024 | ||||||||||||||||||
| San Diego, California | 9,944 | Development, sales and support | |||||||||||||||||||
| May 31, | |||||||||||||||||||||
| Toronto, Canada | Development, sales and support | April 30, | |||||||||||||||||||
| Reading, United Kingdom | Sales and support | ||||||||||||||||||||
| Dubai, United Arab Emirates | Sales and support | December 20, | |||||||||||||||||||
| Queensland, Australia | 1,100 | Sales and support | June 23, 2022 | ||||||||||||||||||
| Pleasanton, California | 842 | Development, sales and support | January 31, 2024 | ||||||||||||||||||
Item 3.Legal Proceedings
We are currently, and may from time to time be, involved in lawsuits, claims, investigations and proceedings, consisting of intellectual property, commercial, employment and other matters which arise in the ordinary course of business.
Item 4.Mine Safety Disclosures
None.
41
PART II
Item 5.Market for Registrant’s Common Equity, Related Stockholder Matters and Issuer Purchases of Equity Securities
Market Information
Our common stock has been listed on the New York Stock Exchange under the symbol “VCRA” since March 28, 2012. Prior to that date, there was no public trading market for our common stock. The following table sets forth for the periods indicated the high and low sales prices per share of our common stock as reported on the New York Stock Exchange:
| High | Low | ||||||
| Year ending December 31, 2017 | |||||||
| First Quarter | $ | 25.12 | $ | 17.69 | |||
| Second Quarter | $ | 28.15 | $ | 22.85 | |||
| Third Quarter | $ | 31.82 | $ | 24.54 | |||
| Fourth Quarter | $ | 32.23 | $ | 24.84 | |||
| High | Low | ||||||
| Year ending December 31, 2016 | |||||||
| First Quarter | $ | 16.02 | $ | 11.36 | |||
| Second Quarter | $ | 13.42 | $ | 10.46 | |||
| Third Quarter | $ | 17.48 | $ | 12.68 | |||
| Fourth Quarter | $ | 20.00 | $ | 16.10 | |||
Holders of Common Stock
As of March 1, 2018,February 22, 2022, we had 4925 holders of record of our common stock. The actual number of stockholders is greater than this number of record holders, and includes stockholders who are beneficial owners, but whose shares are held in street name by brokers and other nominees. This number of holders of record also does not include stockholders whose shares may be held in trust by other entities.
Dividend policy
We have never declared or paid any cash dividends on our capital stock, and we do not currently intend to pay any cash dividends on our common stock for the foreseeable future. We expect to retain future earnings, if any, to fund the development and growth of our business. Any future determination to pay dividends on our common stock will be at the discretion of our board of directors and will depend upon, among other factors, our financial condition, operating results, current and anticipated cash needs, plans for expansion and other factors that our board of directors may deem relevant.
Stock Performance
This stock performance graph shall not be deemed “soliciting material” or to be “filed” with the SEC for purposes of Section 18 of the Exchange Act, or otherwise subject to the liabilities under that Section, and shall not be deemed to be incorporated by reference into any filing of Vocera Communications, Inc. under the Securities Act or the Exchange Act.
The following stock performance graph compares the cumulative total return provided to holders of the common stock of Vocera Communications, Inc. relative to the cumulative total returns of the New York Stock Exchange Composite Index and the Standard & Poor's 1500 Health Care Technology Index over a five yearfive-year period. An investment of $100 is assumed to have been made in our common stock and in each of the indexes on December 31, 2012,2016, including reinvestment of dividends, and its relative performance is tracked through December 31, 2017.
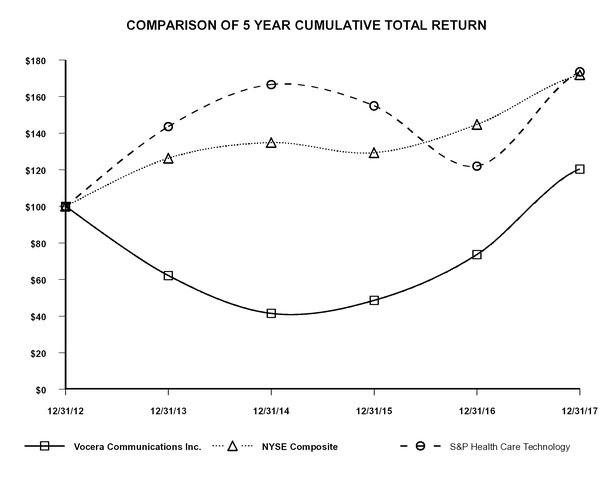
42
| 12/31/12 | 12/31/13 | 12/31/14 | 12/31/15 | 12/31/16 | 12/31/17 | ||||||||||||
| Vocera Communications Inc. | 100.00 | 62.19 | 41.51 | 48.61 | 73.67 | 120.40 | |||||||||||
| NYSE Composite | 100.00 | 126.28 | 134.81 | 129.29 | 144.73 | 171.83 | |||||||||||
| S&P Health Care Technology | 100.00 | 143.59 | 166.56 | 155.00 | 122.02 | 173.60 | |||||||||||
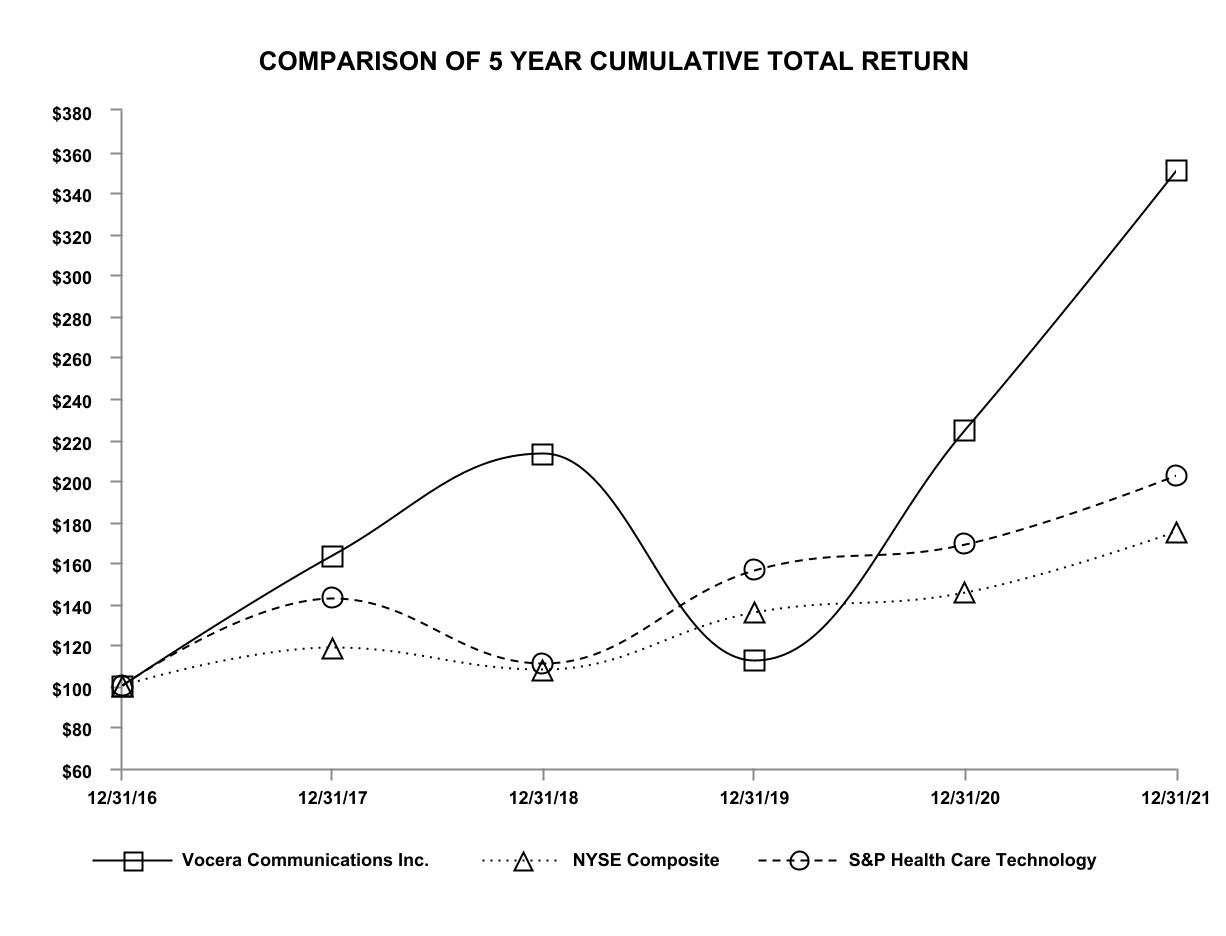
| 12/31/16 | 12/31/17 | 12/31/18 | 12/31/19 | 12/31/20 | 12/31/21 | ||||||||||||||||||||||||||||||
| Vocera Communications Inc. | $ | 100.00 | $ | 163.44 | $ | 212.82 | $ | 112.28 | $ | 224.61 | $ | 350.68 | |||||||||||||||||||||||
| NYSE Composite | $ | 100.00 | $ | 118.73 | $ | 108.10 | $ | 135.68 | $ | 145.16 | $ | 175.18 | |||||||||||||||||||||||
| S&P Health Care Technology | $ | 100.00 | $ | 142.26 | $ | 110.70 | $ | 156.11 | $ | 168.77 | $ | 202.07 | |||||||||||||||||||||||
Purchases of Equity Securities by the Issuer and Affiliated Purchases
During the three months ended December 31, 2017,2021, we did not repurchase any of our securities.
Securities Authorized for Issuance under Equity Compensation Plans
The following selected consolidated financial data should be readinformation required for this Item is included in conjunctionPart III of this document.
Recent Sales of Unregistered Securities
In March 2021, we issued $200.0 million in aggregate principal amount of 0.50% convertible senior notes (the “2026 Notes”), in a private placement to qualified institutional buyers pursuant to Rule 144A of the Securities Act, as amended. The 2026 Notes are convertible into shares of our common stock on the terms set forth in the indenture governing the notes.
We used part of the net proceeds from the issuance of the 2026 Notes to retire approximately $102.9 million aggregate principal amount of our 1.50% convertible senior notes due May 15, 2023. In addition, in April 2021, the purchasers partially exercised the overallotment option and we issued an additional $24.5 million aggregate principal amount of the 2026 Notes. Information relating to the issuance of the notes was provided in a Current Report on Form 8-K filed with Item 7, “Management’s Discussionthe Securities and AnalysisExchange Commission on March 15, 2021.See Note 8, “Convertible Senior Notes due 2026,” of Financial Condition and Results of Operations” and theour consolidated financial statements and related notes included in Part II, Item 8, “Financial Statements and Supplementary Data” of this Annual Report on Form 10-K. The selected consolidated financial data in this section are not intended to replace the consolidated financial statements10-K for more information.
43
Item 6. [Reserved]
44
Item 7.Management's Discussion and are qualified in their entirety by the consolidated financial statementsAnalysis of Financial Condition and related notes included elsewhere in this Annual Report on Form 10-K.
| Years ended December 31, | ||||||||||||||||||||
| (in thousands, except per share data) | 2017 | 2016 | 2015 | 2014 | 2013 | |||||||||||||||
| Consolidated statements of operations data: | ||||||||||||||||||||
| Total revenue | $ | 162,548 | $ | 127,696 | $ | 104,086 | $ | 95,421 | $ | 102,498 | ||||||||||
| Gross profit | 97,621 | 78,621 | 64,576 | 58,185 | 64,189 | |||||||||||||||
| Net (loss) income | (14,217 | ) | (17,267 | ) | (17,106 | ) | (28,297 | ) | (10,465 | ) | ||||||||||
| Net (loss) income attributable to common stockholders | $ | (14,217 | ) | $ | (17,267 | ) | $ | (17,106 | ) | $ | (28,297 | ) | $ | (10,465 | ) | |||||
| Net (loss) income per share attributable to common stockholders | ||||||||||||||||||||
| Basic and diluted | $(0.50) | $(0.64) | $(0.66) | $(1.12) | $(0.43) | |||||||||||||||
| Weighted average shares used to compute net (loss) income per share attributable to common stockholders | ||||||||||||||||||||
| Basic and diluted | 28,655 | 26,859 | 25,971 | 25,329 | 24,621 | |||||||||||||||
| As of December 31, | ||||||||||||||||||||
| (in thousands) | 2017 | 2016 | 2015 | 2014 | 2013 | |||||||||||||||
| Consolidated balance sheet data: | ||||||||||||||||||||
| Cash, cash equivalents and short-term investments | $ | 81,233 | $ | 74,066 | $ | 116,774 | $ | 116,261 | $ | 127,676 | ||||||||||
| Total assets | 194,511 | 182,073 | 162,261 | 159,628 | 173,107 | |||||||||||||||
| Total stockholders’ equity | 108,975 | 103,441 | 104,431 | 109,712 | 125,563 | |||||||||||||||
The following discussion and analysis of our financial condition and results of operations should be read together with our consolidated financial statements and related notes included in Item 8, “Financial Statements and Supplementary Data” included in this Annual Report on Form 10-K. This discussion and analysis contains forward-looking statements reflecting our current expectations that involve risks and uncertainties which are subject to safe harbors under the Securities Act of 1933, as amended, or the Securities Act, and assumptions, suchthe Securities Exchange Act of 1934, as amended, or the Exchange Act. These forward-looking statements ofinclude, but are not limited to, statements concerning our plans, objectives, expectations and intentions.intentions, future financial position, future revenues, projected costs, expectations regarding demand and acceptance for our technologies, growth opportunities and trends in the market in which we operate, prospects and plans and objectives of management, and the expected impact of the COVID-19 pandemic on our operations. The words “anticipates,” “believes,” “estimates,” “expects,” “intends,” “may,” “plans,” “projects,” “will,” “would” and similar expressions are intended to identify forward-looking statements, although not all forward-looking statements contain these identifying words. We may not actually achieve the plans, intentions or expectations disclosed in our forward-looking statements, and you should not place undue reliance on our forward-looking statements. The cautionary statements made in this Annual Report on Form 10-K should be read as applying to all related forward-looking statements wherever they appear in this Annual Report on Form 10-K. Our actual results may differ materially from those anticipated in these forward-looking statements as a result of many factors, including but not limited to those set forth under Item 1A, “Risk factors” and elsewhere in this Annual Report on Form 10-K.
Business overview
We are a provider of secure, integrated, intelligent communication and clinical workflow solutions, focused on empowering mobile workers in healthcare, hospitality, retail, energy, education and other mission-critical mobile work environments, in the United States and internationally. Today, theThe significant majority of our business is generated from sales of our solutions in the healthcare market to help our customers enhance quality of care, safety, patient safety and staff experience improve staff resiliency and increaseimprove operational efficiency. As of December 31, 2017,2021, care teams at approximately 1,500over 2,300 healthcare facilities worldwide have selected our solutions.
We primarily sell products, software maintenancesubscriptions and support and professional services directly to end users.our customers. Total revenue increased 27.3%18.0% to $162.5$234.2 million in 20172021 from $127.7$198.4 million in 2016,2020, and our 20162020 revenue increased 22.7%9.9% from $104.1$180.5 million in 2015.2019. For the year ended December 31, 2017,2021, we recorded a net loss of $14.2$8.5 million compared to a net loss of $17.3$9.7 million for the year ended December 31, 2016.2020.
Our diverse customer base ranges from large hospital systems to small local hospitals, as well as other healthcare facilities and customers in non-healthcare markets. We do not rely on any one customer for a substantial portion of our revenue. While we have international customers in other English-speaking countries such as Canada, the United Kingdom, Australia, New Zealand and parts of the Middle East, most of our customers are located in the United States. International customers represented 10.5%9.4% and 10.6%10.7% of our revenue in 20172021 and in 2016,2020, respectively. We believe certain international markets represent attractive growth opportunities. We are exploringconsidering plans to expand our presence in other English-speaking markets and enter non-English speaking markets.international presence.
We outsource the manufacturing of our hardware products. Our outsourced manufacturing model allows us to scale our business without the significant capital investment and on-going expenses required to establish and maintain manufacturing operations. We work closely with our contract manufacturers, including Sercomm and SMTC Corporation, and key suppliers to manage the procurement, quality and cost of components. We seek to maintain an optimal level of finished goods inventory to meet our forecast for sales and unanticipated shifts in sales volume and mix.
In the fourthsecond quarter of 2016,2021, we acquired allPatientSafe for $36.0 million, net of $0.2 million of cash acquired. PatientSafe provides a clinical communication and collaboration (“CC&C”) solution for smartphones that is engineered to run either on-premises or in the cloud. For further discussion on the acquisition, please refer to Note 12 in the notes to the consolidated financial statements.
A discussion and analysis of our financial condition and results of operations for the year ended December 31, 2019 is included in Item 7 of Part II, "Management's Discussion and Analysis of Financial Condition and Results of Operations" in our Annual Report on Form 10-K for the year ended December 31, 2020 filed with the SEC on February 25, 2021.
Transaction with Stryker
Under the terms of the Agreement and Plan of Merger, dated as of January 6, 2022 (together with any amendments and supplements thereto, the “merger agreement”) among Stryker Corporation (“Stryker”), Voice Merger Sub Corp. and Vocera, Stryker, through a wholly owned subsidiary, commenced a cash tender offer to purchase all outstanding equity interestshares of Extension Healthcarecommon stock of Vocera for $52.5$79.25 per share. The tender offer is scheduled to expire at one minute after 11:59 p.m. Eastern time, on February 22, 2022, unless extended in accordance with the terms of the merger agreement. The tender offer is subject to various conditions, including a minimum tender of at least a majority of outstanding shares of Vocera common stock, and other
45
customary conditions. The transaction is expected to close in the first quarter of 2022. Upon closing of the transaction, Vocera’s common stock will no longer be listed on any public market.
COVID-19 Pandemic
The ongoing outbreak of coronavirus, SARS-CoV-2, or COVID-19, continues to be a global pandemic and public health emergency. Many federal, state and local governments and private entities have mandated various restrictions, including travel restrictions, restrictions on public gatherings, stay at home orders and advisories and quarantining of people who may have been exposed to the virus. Since our last filing, COVID-19 infections have continued and are increasing in many geographies of the world as new variants arise and these rates may continue to increase. Over the course of the COVID-19 pandemic, our business has been impacted in several ways, including the following:
•We have taken measures to protect the health and safety of our employees, primarily by shifting the majority of our employees to remote work.
•Our access to our healthcare customers’ locations for sales and implementation activities was limited in many cases. The sales cycle and implementation timeline for broader strategic deals in some cases has been elongated as they shifted their primary focus to preparing for and responding to the pandemic.
•We have experienced some delays in receiving parts due to supplier and shipping issues.
Overall, the outbreak did not have a material impact on our operating results or business in the year ended December 31, 2021. While future impacts cannot be predicted at this time, the shift in hospital resources, attention to treatment of COVID-19 patients and declines in hospital revenues may result in reduced demand for our products and solutions, longer sales cycles, and/or delays of customer implementations, which could negatively impact our financial condition.
We have generated operating cash flows in the past and our $332.4 million in cash. In addition, $2.5 million has been set aside for retention bonuses for key employeescash and short-term investments provides us with ample liquidity to meet our current needs. However, given the dynamic nature of which $0.5 million and $1.0 million was paid in December 2016 and October 2017, respectively and $1.0 million will be paid in October 2018.this situation, we cannot accurately estimate the impacts of COVID-19 on our financial condition, results of operations or cash flows.
Components of operating results
Revenue. We generate revenue from contracts with customers should be recognized. Under the new guidance, an entity should recognizesale of products and services. As discussed further in the section titled “Critical accounting policies and estimates—Revenue recognition”, revenue to depictis recognized utilizing a five-step approach which depicts the transfer of promised goods or services to customers in an amount that reflects the consideration to which the entity expects to be entitled in exchange for those goods or services.
Revenue is comprised of the following:
•Product. Our solutions include both hardware and software. We refer to hardware revenue as device revenue, which includes revenue from sales of our communication badges and badge accessories, which include batteries, battery chargers, lanyards, clips and other ancillary badge components as well as revenue from the resale of MC40third-party devices and related accessories. Software revenue is derived primarily from the sale of perpetual or term-based licenses to our Vocera Communication and Workflow System. We derive additional software revenue from the sale of termTerm based licenses and hosted software subscriptions, whichdelivered on-premises can be renewed on a subscription basis. Product revenue is generally recognized upon shipment of hardware and perpetual licenses and, in the casedelivering of term licenses or subscription services, ratably over the applicable term.
licenses.•Service. We receive service revenue from sales of software maintenance, sales of cloud-based software subscriptions, extended hardware warranties and professional services. SoftwareSubscription revenue is generally recognized ratably over the application term. Cloud-based software subscription and software maintenance isare typically invoiced annually in advance, recorded as deferred revenue, and recognized as revenue ratably over the service period. Our professional services revenue is based on both time and materials, and fixed price contracts, and is recognized as the services are provided. Extended warranties are invoiced in advance, recorded as deferred revenue, and recognized ratably over the extended warranty period.
Cost of revenue. Cost of revenue is comprised of the following:
•Cost of product. Cost of product is comprised primarily of materials costs, software license costs, write-offsprovisions for excess and obsolete inventory, warranty, and manufacturing overhead costs for test engineering, material requirements planning and our shipping and receiving functions. These overhead costs also include facilities, equipment depreciation, amortization of developed technology and stock-based compensation expenses. We expect material costs to vary with the product life cycle of our devices.
•Cost of service. Cost of service is comprised primarily of employee wages, benefits and related personnel expenses of our technical support team, our professional consulting personnel and our training teams. Cost of service also includes facility
46
and information technology costs. We expect our cost of service will increase as we continue to invest in support services to meet the needs of our customer base.
Operating expenses. Operating expenses are comprised of the following:
•Research and development. Research and development expenses consist primarily of employee wages, benefits and related personnel expenses, hardware materials, and consultant fees and expenses related to the design, development, testing and enhancements of our solutions. We intend to continue to invest in improving the functionality of our solutions and the development of new solutions.
•Sales and marketing. Sales and marketing expenses consist primarily of employee wages, benefits and related personnel expenses, as well as trade shows, marketing programs and collateral and public relations programs. Sales commissions are earned when an order is received from a customer, and as a result, in some cases these commissions are expensed in an earlier period than the period in which the related revenue is recognized. Historically, our bookings have tended to peak in the fourth quarter of each year, driving higher sales commissions, and to be lowest in the first quarter. We intend to continue to expand our direct sales force and invest in sales support functions and new marketing programs for the foreseeable future.
•General and administrative. General and administrative expenses consist primarily of employee wages, benefits and related personnel expenses, consulting, accounting fees, legal fees and other general corporate expenses.
Interest income and other income (expense), net.
•Interest income. Interest income consists primarily of interest income earned on our cash, cash equivalent and short-term investment balances. Our interest income will vary each reporting period depending on our average cash, cash equivalent and short-term investment balances during the period and market interest rates.
•Interest expense. Interest expense consists of amortization of debt discount and debt issuance costs as well as the contractual interest incurred due to the issuance of the Convertible Senior Notes which are discussed in further detail in Note 8 of the Notes to Consolidated Financial Statements.
•Other income (expense), net. Other income (expense), net consists primarily of foreign exchange gains and losses.
Provision for income taxes. We are subject to income taxes in the countries where we sell our solutions. We anticipate that in the future as we expand our sale of solutions to customers outside the United States, we will become subject to taxation based on the foreign statutory rates in the countries where these sales took place and our effective tax rate could fluctuate accordingly. Currently, each of our international subsidiaries is operating under cost plus agreements where the U.S. parent company reimburses the international subsidiary for its costs plus an arm's length profit.
Income taxes are computed using the asset and liability method, under which deferred tax assets and liabilities are determined based on the difference between the financial statement and tax bases of assets and liabilities using enacted tax rates in effect for the year in which the differences are expected to affect taxable income. Valuation allowances have been established to reduce deferred tax assets to the amount reasonably expected to be realized. Changes in valuation allowances are reflected as a component of provision for income taxes.
At December 31, 2017,2021, we held a $45.3$61.5 million valuation allowance against our deferred tax assets. We review on a quarterly basis our conclusions about the appropriate amount of our deferred income tax asset valuation allowance.
47
Results of operations
The following table is a summary of our consolidated statements of operations for the years ended December 31, 2017, 20162021 and 2015.2020. The period-to-period comparisons of results are not necessarily indicative of results for future periods.
| Years ended December 31, | |||||||||||||||||||||||||||||||||||||||||
| 2021 | 2020 | ||||||||||||||||||||||||||||||||||||||||
| (in thousands, except percentages) | Amount | % Revenue | Amount | % Revenue | |||||||||||||||||||||||||||||||||||||
| Consolidated statements of operations data: | |||||||||||||||||||||||||||||||||||||||||
| Revenue | |||||||||||||||||||||||||||||||||||||||||
| Product | $ | 118,170 | 50.5 | % | $ | 100,567 | 50.7 | % | |||||||||||||||||||||||||||||||||
| Service | 116,015 | 49.5 | 97,853 | 49.3 | |||||||||||||||||||||||||||||||||||||
| Total revenue | 234,185 | 100.0 | 198,420 | 100.0 | |||||||||||||||||||||||||||||||||||||
| Cost of revenue | |||||||||||||||||||||||||||||||||||||||||
| Product | 31,675 | 13.5 | 28,805 | 14.5 | |||||||||||||||||||||||||||||||||||||
| Service | 47,657 | 20.4 | 40,998 | 20.7 | |||||||||||||||||||||||||||||||||||||
| Total cost of revenue | 79,332 | 33.9 | 69,803 | 35.2 | |||||||||||||||||||||||||||||||||||||
| Gross profit | 154,853 | 66.1 | 128,617 | 64.8 | |||||||||||||||||||||||||||||||||||||
| Operating expenses | |||||||||||||||||||||||||||||||||||||||||
| Research and development | 45,850 | 19.5 | 38,820 | 19.6 | |||||||||||||||||||||||||||||||||||||
| Sales and marketing | 74,551 | 31.8 | 65,494 | 33.0 | |||||||||||||||||||||||||||||||||||||
| General and administrative | 38,537 | 16.5 | 28,382 | 14.3 | |||||||||||||||||||||||||||||||||||||
| Total operating expenses | 158,938 | 67.8 | 132,696 | 66.9 | |||||||||||||||||||||||||||||||||||||
| Loss from operations | (4,085) | (1.7) | (4,079) | (2.1) | |||||||||||||||||||||||||||||||||||||
| Interest income | 1,032 | 0.4 | 3,169 | 1.6 | |||||||||||||||||||||||||||||||||||||
| Interest expense | (3,198) | (1.3) | (9,354) | (4.7) | |||||||||||||||||||||||||||||||||||||
| Other expense, net | (1,550) | (0.7) | (640) | (0.3) | |||||||||||||||||||||||||||||||||||||
| Loss before income taxes | (7,801) | (3.3) | (10,904) | (5.5) | |||||||||||||||||||||||||||||||||||||
| (Provision for) benefit from income taxes | (694) | (0.3) | 1,248 | 0.6 | |||||||||||||||||||||||||||||||||||||
| Net loss | $ | (8,495) | (3.6) | % | $ | (9,656) | (4.9) | % | |||||||||||||||||||||||||||||||||
| Years ended December 31, | ||||||||||||||||||||||
| 2017 | 2016 | 2015 | ||||||||||||||||||||
| (in thousands, except percentages) | Amount | % Revenue | Amount | % Revenue | Amount | % Revenue | ||||||||||||||||
| Consolidated statements of operations data: | ||||||||||||||||||||||
| Revenue | ||||||||||||||||||||||
| Product | $ | 88,865 | 54.7 | % | $ | 70,667 | 55.3 | % | $ | 55,716 | 53.5 | % | ||||||||||
| Service | 73,683 | 45.3 | 57,029 | 44.7 | 48,370 | 46.5 | ||||||||||||||||
| Total revenue | 162,548 | 100.0 | 127,696 | 100.0 | 104,086 | 100.0 | ||||||||||||||||
| Cost of revenue | ||||||||||||||||||||||
| Product | 27,244 | 16.7 | 22,788 | 17.8 | 19,666 | 18.9 | ||||||||||||||||
| Service | 37,683 | 23.2 | 26,287 | 20.6 | 19,844 | 19.1 | ||||||||||||||||
| Total cost of revenue | 64,927 | 39.9 | 49,075 | 38.4 | 39,510 | 38.0 | ||||||||||||||||
| Gross profit | 97,621 | 60.1 | 78,621 | 61.6 | 64,576 | 62.0 | ||||||||||||||||
| Operating expenses | ||||||||||||||||||||||
| Research and development | 27,685 | 17.1 | 18,266 | 14.3 | 16,990 | 16.3 | ||||||||||||||||
| Sales and marketing | 59,986 | 36.9 | 52,811 | 41.4 | 47,647 | 45.8 | ||||||||||||||||
| General and administrative | 23,970 | 14.7 | 24,499 | 19.2 | 16,734 | 16.1 | ||||||||||||||||
| Total operating expenses | 111,641 | 68.7 | 95,576 | 74.9 | 81,371 | 78.2 | ||||||||||||||||
| Loss from operations | (14,020 | ) | (8.6 | ) | (16,955 | ) | (13.3 | ) | (16,795 | ) | (16.2 | ) | ||||||||||
| Interest income | 604 | 0.3 | 684 | 0.5 | 509 | 0.5 | ||||||||||||||||
| Other expense, net | (42 | ) | — | (467 | ) | (0.3 | ) | (347 | ) | (0.3 | ) | |||||||||||
| Loss before income taxes | (13,458 | ) | (8.3 | ) | (16,738 | ) | (13.1 | ) | (16,633 | ) | (16.0 | ) | ||||||||||
| Provision for income taxes | (759 | ) | (0.4 | ) | (529 | ) | (0.4 | ) | (473 | ) | (0.5 | ) | ||||||||||
| Net loss | $ | (14,217 | ) | (8.7 | )% | $ | (17,267 | ) | (13.5 | )% | $ | (17,106 | ) | (16.5 | )% | |||||||
Year ended December 31, 20172021 compared to year ended December 31, 20162020
Revenue:
| Years ended December 31, | ||||||||||||||||||||||||||
| 2021 | 2020 | Change | ||||||||||||||||||||||||
| (in thousands, except percentages) | Amount | Amount | Amount | % | ||||||||||||||||||||||
| Product Revenue | ||||||||||||||||||||||||||
| Device | $ | 72,473 | $ | 69,321 | $ | 3,152 | 4.5 | % | ||||||||||||||||||
| Software | 45,697 | 31,246 | 14,451 | 46.2 | ||||||||||||||||||||||
| Total product revenue | 118,170 | 100,567 | 17,603 | 17.5 | ||||||||||||||||||||||
| Service Revenue | ||||||||||||||||||||||||||
| Subscription and support | 94,246 | 78,532 | 15,714 | 20.0 | ||||||||||||||||||||||
| Professional services and training | 21,769 | 19,321 | 2,448 | 12.7 | ||||||||||||||||||||||
| Total service revenue | 116,015 | 97,853 | 18,162 | 18.6 | ||||||||||||||||||||||
| Total revenue | $ | 234,185 | $ | 198,420 | $ | 35,765 | 18.0 | % | ||||||||||||||||||
48
| Years ended December 31, | |||||||||||||||
| 2017 | 2016 | Change | |||||||||||||
| (in thousands, except percentages) | Amount | Amount | Amount | % | |||||||||||
| Product Revenue | |||||||||||||||
| Device | $ | 60,869 | $ | 50,061 | $ | 10,808 | 21.6 | % | |||||||
| Software | 27,996 | 20,606 | 7,390 | 35.9 | |||||||||||
| Total product revenue | 88,865 | 70,667 | 18,198 | 25.8 | |||||||||||
| Service revenue | |||||||||||||||
| Maintenance and support | 52,542 | 43,438 | 9,104 | 21.0 | |||||||||||
| Professional services and training | 21,141 | 13,591 | 7,550 | 55.6 | |||||||||||
| Total service revenue | 73,683 | 57,029 | 16,654 | 29.2 | |||||||||||
| Total revenue | $ | 162,548 | $ | 127,696 | $ | 34,852 | 27.3 | ||||||||
Total revenue increased $34.9$35.8 million, or 27.3%18.0%, for the year ended December 31, 20172021 compared to the year ended December 31, 2016.2020. The increase in total revenue was a result of increasesan increase in bothrevenue across all product lines, with significant growth in software and services revenue.subscription and support.
Product revenue increased $18.2$17.6 million, or 25.8%17.5%, for the year ended December 31, 20172021 compared to the year ended December 31, 2016.2020. Device revenue increased $10.8$3.2 million, or 21.6%4.5%, and software revenue increased $7.4$14.5 million, or 35.9%46.2%, for the year ended December 31, 2017,2021, compared to the year ended December 31, 2016.2020. The increase in device revenue which related entirely to our Communication and Workflow System, was driven primarily by an increase in unit sales of badges and related hardware and accessories to new customers making initial purchases and existing customers expanding deployments within their facilities to departments and users.customers. The increase in software revenue was mainly a result ofdue to an increase in unit salesthe number of software licenses ofdelivered to our software platform.customers and the additional revenue from Edge products.
Service revenue increased $16.7$18.2 million, or 29.2%18.6%, for the year ended December 31, 20172021 compared to the year ended December 31, 2016. Software maintenance2020. Subscription and support revenue increased $9.1$15.7 million, or 21.0%20.0%, and professional services and training revenue increased $7.6$2.4 million, or 55.6%12.7%, for the year ended December 31, 20172021 compared to the year ended December 31, 2016.2020. The increase in software maintenancesubscription and support revenue was primarily athe result of having a larger customer base.an increased number of customers who purchased software maintenance contracts, and the additional subscription revenue from the Ease products of $4.0 million. The increase in professional services and training revenue was due to an increase ofin implementation services for our solutions.
Cost of revenue:
| Years ended December 31, | Years ended December 31, | ||||||||||||||||||||||||||||||||||||||||
| 2017 | 2016 | Change | 2021 | 2020 | Change | ||||||||||||||||||||||||||||||||||||
| (in thousands, except percentages) | Amount | Amount | Amount | % | (in thousands, except percentages) | Amount | Amount | Amount | % | ||||||||||||||||||||||||||||||||
| Cost of revenue | Cost of revenue | ||||||||||||||||||||||||||||||||||||||||
| Product | $ | 27,244 | $ | 22,788 | $ | 4,456 | 19.6 | % | Product | $ | 31,675 | $ | 28,805 | $ | 2,870 | 10.0 | % | ||||||||||||||||||||||||
| Service | 37,683 | 26,287 | 11,396 | 43.4 | Service | 47,657 | 40,998 | 6,659 | 16.2 | ||||||||||||||||||||||||||||||||
| Total cost of revenue | $ | 64,927 | $ | 49,075 | $ | 15,852 | 32.3 | Total cost of revenue | $ | 79,332 | $ | 69,803 | $ | 9,529 | 13.7 | % | |||||||||||||||||||||||||
| Gross margin | Gross margin | ||||||||||||||||||||||||||||||||||||||||
| Product | 69.3 | % | 67.8 | % | 1.5 | % | Product | 73.2 | % | 71.4 | % | 1.8 | % | ||||||||||||||||||||||||||||
| Service | 48.9 | 53.9 | (5.0 | ) | Service | 58.9 | 58.1 | 0.8 | |||||||||||||||||||||||||||||||||
| Total gross margin | 60.1 | 61.6 | (1.5 | ) | Total gross margin | 66.1 | % | 64.8 | % | 1.3 | % | ||||||||||||||||||||||||||||||
Cost of product revenue increased $4.5$2.9 million, or 19.6%10.0%, for the year ended December 31, 20172021 compared to the year ended December 31, 2016.2020. The cost of product revenue increased primarily due to a higher number of communication badges and related accessories sold, and a full year ofan increase in the amortization of intangiblesdeveloped technology related to the acquisition in October 2016.acquisitions of Ease and the PatientSafe. Product gross margin as a percentage of product revenue increased in the year ended December 31, 20172021 compared to the year ended December 31, 20162020 primarily due to decreased production costs related to our hardware products, a larger mixhigher proportion of software revenue and higher absorption of fixed overhead costs.
revenue.
Cost of service revenue increased $11.4$6.7 million, or 43.4%16.2%, for the year ended December 31, 20172021 compared to the year ended December 31, 2016. The cost2020. Cost of service revenue increased primarily due to an increase inhigher compensation and benefits costs as a result of increased headcount related to core business and the numberacquisitions of deployments of our solutionsEase and higher headcount resulting from the acquisition in October 2016.PatientSafe. Service gross margin as a percentage of service revenue decreasedincreased for the year ended December 31, 20172021 compared to the year ended December 31, 2016.2020 primarily due to an increase in service revenue while costs saw the benefit of scale.
Operating expenses:
| Years ended December 31, | ||||||||||||||||||||||||||
| 2021 | 2020 | Change | ||||||||||||||||||||||||
| (in thousands, except percentages) | Amount | Amount | Amount | % | ||||||||||||||||||||||
| Operating expenses: | ||||||||||||||||||||||||||
| Research and development | $ | 45,850 | $ | 38,820 | $ | 7,030 | 18.1 | % | ||||||||||||||||||
| Sales and marketing | 74,551 | 65,494 | 9,057 | 13.8 | ||||||||||||||||||||||
| General and administrative | 38,537 | 28,382 | 10,155 | 35.8 | ||||||||||||||||||||||
| Total operating expenses | $ | 158,938 | $ | 132,696 | $ | 26,242 | 19.8 | % | ||||||||||||||||||
49
| Years ended December 31, | |||||||||||||||
| 2017 | 2016 | Change | |||||||||||||
| (in thousands, except percentages) | Amount | Amount | Amount | % | |||||||||||
| Operating expenses: | |||||||||||||||
| Research and development | $ | 27,685 | $ | 18,266 | $ | 9,419 | 51.6 | % | |||||||
| Sales and marketing | 59,986 | 52,811 | 7,175 | 13.6 | |||||||||||
| General and administrative | 23,970 | 24,499 | (529 | ) | (2.2 | ) | |||||||||
| Total operating expenses | $ | 111,641 | $ | 95,576 | $ | 16,065 | 16.8 | ||||||||
Research and development expense. Research and development expense increased $9.4$7.0 million, or 51.6%18.1%, for the year ended December 31, 20172021 compared to the year ended December 31, 2016.2020. This increase was primarily due to a $7.3an increase of $5.2 million increase in compensation, benefits, and benefits associated with increasedhiring costs including bonuses and headcount resulting from the acquisitionrelated to acquisitions, an increase of $1.5 million in October 2016.outside services and development, and an increase of $0.3 million in equipment and supplies cost.
Sales and marketing expense. Sales and marketing expense increased $7.2$9.1 million, or 13.6%13.8%, for the year ended December 31, 20172021 compared to the year ended December 31, 2016.2020. This was primarily due to a $5.3an increase of $7.1 million increase in compensation, benefits, and benefits associated with increased headcount. The saleshiring costs including bonuses and marketing expenseheadcount related to acquisitions, an increase was also due to aof $0.8 million in amortization related to the acquisitions of Ease and PatientSafe, an increase of $0.5 million in outside services, an increase of $0.5 million in marketing development, and a $1.1an increase of $0.2 million increase in amortizationother expenses, primarily comprised of intangibles related to a full year of amortization from the acquisition of in October 2016.travel costs.
General and administrative expense. General and administrative expense decreased $0.5increased $10.2 million, or 2.2%35.8%, fromfor the year ended December 31, 20172021 compared to the year ended December 31, 2016.2020. This resultedwas primarily from a decreasedue to an increase of $7.1 million in acquisition related expensesoutside services, $5.8 million of $4.2 million partially offsetwhich relate to transaction costs associated with the transactions contemplated by a $3.1 millionthe merger agreement. Additionally, there was an increase in compensation, benefits, and benefits, a $0.2hiring costs of $3.5 million increase in travel and entertainment expenses due to increasedchanges in headcount and a $0.4 million increase in outside services.throughout the year, achievement of performance related compensation targets.
| Years ended December 31, | ||||||||||||||||||||
| (in thousands, except percentages) | 2021 | 2020 | Change | |||||||||||||||||
| Non-operating income (expense) elements: | ||||||||||||||||||||
| Interest income | $ | 1,032 | $ | 3,169 | $ | (2,137) | ||||||||||||||
| Interest expense | $ | (3,198) | $ | (9,354) | $ | 6,156 | ||||||||||||||
| Other expense, net | $ | (1,550) | $ | (640) | $ | (910) | ||||||||||||||
| Income taxes: | ||||||||||||||||||||
| Benefit from (provision for) income taxes | $ | (694) | $ | 1,248 | $ | (1,942) | ||||||||||||||
| Loss before income taxes | $ | (7,801) | $ | (10,904) | $ | 3,103 | ||||||||||||||
| Effective tax rate % | (8.9) | % | 11.4 | % | (20.3) | % | ||||||||||||||
| Years ended December 31, | ||||||||||||
| (in thousands, except percentages) | 2017 | 2016 | Change | |||||||||
| Non-operating income (expense) elements: | ||||||||||||
| Interest income | $ | 604 | $ | 684 | $ | (80 | ) | |||||
| Other expense, net | (42 | ) | (467 | ) | 425 | |||||||
| Income taxes: | ||||||||||||
| Provision for income taxes | (759 | ) | (529 | ) | (230 | ) | ||||||
| Loss before income taxes | (13,458 | ) | (16,738 | ) | 3,280 | |||||||
| Effective tax rate % | (5.6 | )% | (3.2 | )% | (2.4 | )% | ||||||
Interest income. Interest income decreased $0.1$2.1 million for the year ended December 31, 20172021, compared to the year ended December 31, 20162020. This decrease was due to earning a lower rate of return on our investments.
Interest expense. Interest expense decreased $6.2 million for the year ended December 31, 2021, compared to the year ended December 31, 2020. The decrease was primarily due to the impact of the adoption of ASU 2020-06 Accounting for Convertible Instruments and Contracts in cash, cash equivalentsan Entity’s Own Equity which eliminated the debt discount amortization for 2021. The amortization of the debt discount was previously accounted for as part of interest expense and short-term investments partially offset by higher yields onrepresented $6.5 million of the total interest bearing instruments.expense for the year ended December 31, 2020.
Other expense, net. The change in other expense, net for the year ended December 31, 20172021, compared to the year ended December 31, 20162020, was primarily due to the $2.1 million inducement loss resulting from the repurchase of the 2023 Notes and a one-time payment of $1.7 million to the acquired company's shareholders partially offset by the change in the fair value adjustment of the Ease contingent consideration included in earnings of $2.9 million for the year ended December 31, 2021, as well as the impact of foreign exchange fluctuations.
| Years ended December 31, | |||||||||||||||
| 2016 | 2015 | Change | |||||||||||||
| (in thousands, except percentages) | Amount | Amount | Amount | % | |||||||||||
| Product Revenue | |||||||||||||||
| Device | $ | 50,061 | $ | 40,548 | $ | 9,513 | 23.5 | % | |||||||
| Software | 20,606 | 15,168 | 5,438 | 35.9 | |||||||||||
| Total product revenue | 70,667 | 55,716 | 14,951 | 26.8 | |||||||||||
| Service revenue | |||||||||||||||
| Maintenance and support | 43,438 | 38,443 | 4,995 | 13.0 | |||||||||||
| Professional services and training | 13,591 | 9,927 | 3,664 | 36.9 | |||||||||||
| Total service revenue | 57,029 | 48,370 | 8,659 | 17.9 | |||||||||||
| Total revenue | $ | 127,696 | $ | 104,086 | $ | 23,610 | 22.7 | ||||||||
| Years ended December 31, | |||||||||||||||
| 2016 | 2015 | Change | |||||||||||||
| (in thousands, except percentages) | Amount | Amount | Amount | % | |||||||||||
| Cost of revenue | |||||||||||||||
| Product | $ | 22,788 | $ | 19,666 | $ | 3,122 | 15.9 | % | |||||||
| Service | 26,287 | 19,844 | 6,443 | 32.5 | |||||||||||
| Total cost of revenue | $ | 49,075 | $ | 39,510 | $ | 9,565 | 24.2 | ||||||||
| Gross margin | |||||||||||||||
| Product | 67.8 | % | 64.7 | % | 3.1 | % | |||||||||
| Service | 53.9 | 59.0 | (5.1 | ) | |||||||||||
| Total gross margin | 61.6 | 62.0 | (0.4 | ) | |||||||||||
| Years ended December 31, | |||||||||||||||
| 2016 | 2015 | Change | |||||||||||||
| (in thousands, except percentages) | Amount | Amount | Amount | % | |||||||||||
| Operating expenses | |||||||||||||||
| Research and development | $ | 18,266 | $ | 16,990 | $ | 1,276 | 7.5 | % | |||||||
| Sales and marketing | 52,811 | 47,647 | 5,164 | 10.8 | |||||||||||
| General and administrative | 24,499 | 16,734 | 7,765 | 46.4 | |||||||||||
| Total operating expenses | $ | 95,576 | $ | 81,371 | $ | 14,205 | 17.5 | ||||||||
| Years ended December 31, | ||||||||||||
| (in thousands, except percentages) | 2016 | 2015 | Change | |||||||||
| Non-operating income (expense) elements: | ||||||||||||
| Interest income | $ | 684 | $ | 509 | $ | 175 | ||||||
| Other expense, net | (467 | ) | (347 | ) | (120 | ) | ||||||
| Income taxes: | ||||||||||||
| Provision for income taxes | (529 | ) | (473 | ) | (56 | ) | ||||||
| Loss before income taxes | (16,738 | ) | (16,633 | ) | (105 | ) | ||||||
| Effective tax rate % | (3.2 | )% | (2.8 | )% | (0.4 | )% | ||||||
50
Table of pre-tax losses in the U.S. operations, offset by income taxes from foreign operations.Contents
Liquidity and capital resources
| Years ended December 31, | Years ended December 31, | |||||||||||||||||||||||||||||||
| (in thousands) | 2017 | 2016 | 2015 | (in thousands) | 2021 | 2020 | ||||||||||||||||||||||||||
| Consolidated statements of cash flow data: | Consolidated statements of cash flow data: | |||||||||||||||||||||||||||||||
| Net cash provided by (used in) operating activities | $ | 7,736 | $ | 11,266 | $ | (135 | ) | |||||||||||||||||||||||||
| Net cash provided by (used in) investing activities | (16,429 | ) | 112 | (3,751 | ) | |||||||||||||||||||||||||||
| Net cash provided by operating activities | Net cash provided by operating activities | $ | 53,975 | $ | 26,858 | |||||||||||||||||||||||||||
| Net cash used in investing activities | Net cash used in investing activities | (83,710) | (20,441) | |||||||||||||||||||||||||||||
| Net cash provided by financing activities | 2,386 | 3,083 | 1,843 | Net cash provided by financing activities | 91,063 | 2,855 | ||||||||||||||||||||||||||
| Net (decrease) increase in cash and cash equivalents | $ | (6,307 | ) | $ | 14,461 | $ | (2,043 | ) | ||||||||||||||||||||||||
| Net increase in cash and cash equivalents | Net increase in cash and cash equivalents | $ | 61,328 | $ | 9,272 | |||||||||||||||||||||||||||
As of December 31, 2017,2021, we had cash and cash equivalents and short-term investments of $81.2$332.4 million.
In March 2021, we issued $200.0 million in aggregate principal amount of 0.50% Convertible Senior Notes and no debt.we used part of the net proceeds from the issuance of the 2026 Notes to retire approximately $102.9 million aggregate principal amount of the 2023 Notes. In addition, in April 2021, the purchasers partially exercised the overallotment option and we issued an additional $24.5 million aggregate principal amount of the 2026 Notes. For additional information, see Note 8 of the Notes to the consolidated financial statements.
During 2017, 20162021 and 2015,2020, our purchases of property and equipment were $2.8 million, $4.7$3.8 million and $1.2$4.2 million, respectively. The expenditures in 20172021 primarily relaterelated to purchases associated with the new company headquarters and other leasehold improvements, manufacturing tools and equipment, and computer equipment. The expenditures in 2016 primarily relate to leasehold improvements related to the renovation of our corporate offices. The expenditures in 20152020 primarily related to leasehold improvements, manufacturing tools and equipment, and computer equipment.
We believe that our existing sources of liquidity will satisfy our anticipated working capital and capital requirements for at least the next twelve months. Our future liquidity and capital requirements will depend upon numerous factors, including our rate of growth, the rate at which we add personnel to generate and support future growth, and potential future acquisitions.
In the future, we may seek to sell additional equity securities or borrow funds. The sale of additional equity or convertible securities may result in additional dilution to our stockholders. If we raise additional funds through the issuance of debt securities or other borrowings, these securities or borrowings could have rights senior to those of our common stock and could contain covenants that could restrict our operations. Any required additional capital may not be available on reasonable terms, if at all.
Operating activities
Cash provided by operating activities was $7.7$54.0 million in 2017,2021. Cash provided by operating activities was the result of non-cash items such as stock-based compensation of $31.3 million, non-cash lease expense of $3.8 million, amortization of debt issuance costs of $1.4 million, depreciation of $4.9 million for property and equipment and amortization of $5.4 million for acquired intangible assets, an inducement loss of $2.1 million resulting from the repurchase of our 2023 Notes, accretion of investments of $2.6 million and $0.7 million of other items, partially offset by the change in fair value of contingent consideration of $2.9 million and a net loss of $8.5 million. With respect to changes in assets and liabilities, we experienced an increase in accounts receivable of $1.6 million, an increase of $0.8 million in other receivables, a decrease of $2.9 million in inventories, a decrease of $1.3 million in prepaid expenses and other assets, an increase in deferred commissions of $4.3 million, an increase of $1.7 million in accounts payable, a decrease of $2.1 million in accrued payroll and other liabilities, a decrease of $1.1 million in lease-related performance liabilities and a $17.4 million increase in deferred revenue.
Cash provided by operating activities was $26.9 million in 2020, due in part to non-cash items such as stock-based compensation of $18.2$25.7 million, amortization of debt discount and issuance costs of $7.2 million, and depreciation and amortization of $7.6$6.4 million for property and equipment and acquired intangible assets, partially offset by a decrease in lease-related performance liabilities of $1.2 million and the 20172020 net loss of $14.2$9.7 million. With respect to changes in assets and liabilities, cash was provided through a decrease of $1.4 million in inventory and a $8.7 million increase in deferred revenue. These factors were offset by certain cash outflows, includingwe experienced an increase in accounts receivable of $11.0$2.7 million, which is attributable to current period's billings exceeding collection on prior periods' invoices, an increase of $5.3 million in inventories, an increase of $1.2 million in prepaid expenses and other assets, an increase in deferred commissions of $0.9$1.8 million, a decrease of $0.6$2.6 million in accounts payable, and a decreasean increase of $1.1$8.3 million in accrued payroll and other liabilities.
Investing activities
Cash used in investing activities was $16.4$83.7 million in 2017, which was primarily attributable2021, due to $53.8$251.8 million in purchases of short-term investments and the acquisition of PatientSafe Inc. for $35.4 million, offset by $204.3 million in short-term investment maturities offset by $67.4and of $3.0 million in purchasessales of short-term investments. An additional $2.8$3.8 million of cash was used for the purchase of property and equipment and leasehold improvements.
51
Cash provided byused in investing activities was $0.1$20.4 million in 2016,2020, which was primarily attributable to $111.8 million in short-term investment maturities and $32.1 million in sales of short-term investments, offset by $86.6$139.7 million in purchases of short-term investments and $52.5 million used to complete the acquisition of Vocera Ease for $24.2 million, offset by $118.3 million in October 2016.short-term investment maturities and of $29.4 million sales of short-term investments. An additional $4.7 million of cash was used for the purchase of property and equipment and leasehold improvements.
Financing activities
Cash provided by financing activities was $2.4$91.1 million in 2017,2021, primarily attributable to $7.9$217.7 million of net proceeds from convertible senior notes, $4.2 million of proceeds from issuance of common stock from our Amended and Restated 2012 Employee Stock Purchase Plan (“ESPP”), $3.2 million of proceeds from stock option exercises, $2.8and $0.5 million of cash from lease-related performance obligations. These items were partially offset by $102.9 million related to the repayment of a portion of our 2023 Notes, a $17.4 million payment for the purchase of capped calls related to our 2026 Notes, and $14.2 million cash paid for employee taxes collected via net share settlement.
Cash provided by financing activities was $2.9 million in 2020, primarily attributable to $3.5 million of proceeds from stock option exercises, $3.7 million of proceeds from issuance of common stock from the employee stock purchase planESPP and $0.7$2.0 million of cash from lease-related performance obligations. These items were partially offset by a $9.0$6.4 million decrease for employee taxes paid on net share settlement on the vesting of restricted stock awards.
| (in thousands) | Total | Less than 1 year | 1-3 years | 3-5 years | More than 5 years | |||||||||||||||
Operating leases(1) | $ | 8,997 | $ | 2,363 | $ | 4,186 | $ | 2,413 | $ | 35 | ||||||||||
Non-cancelable purchase commitments(2) | 4,373 | 4,373 | — | — | — | |||||||||||||||
| Total | $ | 13,370 | $ | 6,736 | $ | 4,186 | $ | 2,413 | $ | 35 | ||||||||||
Critical accounting policies and estimates
The preparation of our consolidated financial statements requires us to make estimates and assumptions that affect the amounts reported in the consolidated financial statements and accompanying notes. We evaluate our estimates on an ongoing basis, including those related to product warranties, goodwill and intangible assets, revenue recognition, stock-based compensation, accounting for business combinations, contingent consideration, and the provision for income taxes. We base our estimates and judgments on our historical experience, knowledge of factors affecting our business and our belief as to what could occur in the future considering available information and assumptions that we believe to be reasonable under the circumstances.
The accounting estimates we use in the preparation of our consolidated financial statements will change as events occur, more experience is acquired, additional information is obtained and our operating environment changes. Changes in estimates are made when circumstances warrant. Such changes in estimates and refinements in estimation methodologies are reflected in our reported results of operations and, if material, the effects of changes in estimates are disclosed in the notes to our consolidated financial statements. By their nature, these estimates and judgments are subject to an inherent degree of uncertainty and actual results could differ materially from the amounts reported based on these estimates.
While our significant accounting policies are more fully described in Note 1 of the “Notes to our consolidated financial statements” included in Item 8, “Financial Statements and Supplementary Data,” we believe the following reflects our critical accounting policies and our more significant judgments and estimates used in the preparation of our financial statements.
Revenue recognitionRecognition
Standard product warranties
We provide for the estimated costs of product warranties at the time the related revenue is recognized. Costs are estimated based on historical and projected product failure rates, historical and projected repairreplacement costs, and knowledge of specific product failures, (if any).if any. The specific product warranty includes parts and labor over a period generally ranging from one to three years. We generally do not provide no warrantyperformance warranties for software. We regularly assess our estimates to evaluate the adequacy of the recorded warranty liabilities and adjust the amounts as necessary. The total warranty expense under our standard warranty in 20172021 was $0.1$0.2 million, compared to $0.3 million in 2020 and $0.2 million in 2016 and $0.9 million in 2015.2019. The key drivers to the warranty reserve calculation are the installed base of products under standard warranty, the estimated return rate of the installed base of products under standard warranty, and the availability of refurbished units to fulfill expected warranty claims.
52
Stock-based compensation
Performance Stock optionsUnits
Goodwill and intangible assets
We allocate the purchase price of any acquisitions to tangible assets and liabilities and identifiable intangible assets acquired. Any residual purchase price is recorded as goodwill. The allocation of the purchase price requires management to make significant estimates in determining the fair values of assets acquired and liabilities assumed, especially with respect to intangible assets. These estimates are based on information obtained from management of the acquired companies and historical experience. These estimates can include, but are not limited to, the cash flows that an asset is expected to generate in the future, and the cost savings expected to be derived from acquiring an asset. These estimates are inherently uncertain and unpredictable, and if different estimates were used the purchase price for the acquisition could be allocated to the acquired assets and liabilities differently from the allocation that we have made. In addition, unanticipated events and circumstances may occur which affect the accuracy or validity of such estimates, and if such events occur we may be required to record a charge against the value ascribed to an acquired asset or an increase in the amounts recorded for assumed liabilities.
Goodwill
Goodwill is tested for impairment at the reporting unit level at least annually, or more often if events or changes in circumstances indicate the carrying value may not be recoverable. Our annual assessment date is October 1st and the results of our assessment performed as of October 1st indicated nothat an impairment had been incurred.was not required. No impairment was recorded in 2017, 20162021, 2020 or 2015.2019. As of December 31, 2017,2021, no changes in circumstances indicate that goodwill carrying values may not be recoverable. Application of the goodwill impairment test requires judgment. Circumstances that could affect the valuation of goodwill include, among other things, a significant change in our business climate and the buying habits of our customers along with changes in the costs to provide our products and services.
Intangible assets
Intangible assets are amortized over their estimated useful lives. Upon completion of development, acquired in-process research and development assets are generally considered amortizable, finite-lived assets and are amortized over their estimated useful lives.
Finite-lived intangible assets consist of customer relationships, developed technology, trademarks, backlog and non-compete agreements. We evaluate our intangible assets for impairment at the asset group level, which means the intangibles grouped with other assets and liabilities at the lowest level for which identifiable cash flows are largely independent of the cash flows of other assets and liabilities. Management has concluded that our asset groups align with our reporting units.unit. The intangible assets are allocated to the Product and Services asset groups, given that the Product and Services asset groups are the lowest level for which discrete cash flow information are identifiable, independent from other assets. We assess the recoverability of these assets whenever adverse events or changes in circumstances or business climate indicate that expected undiscounted future cash flows related to such intangible assets may not be sufficient to support the net book value of such assets. An impairment is recognized in the period of identification to the extent the carrying amount of an asset exceeds the fair value of such asset. No impairment of intangible assets was recorded in 2017, 20162021, 2020 or 2015.2019.
Significant judgments required in assessing the impairment of goodwill and intangible assets include the identification of the reporting units,unit, identifying whether events or changes in circumstances require an impairment assessment, estimating future cash flows,
determining appropriate discount and growth rates and other assumptions. Changes in these estimates and assumptions could materially affect the determination of fair value as to whether an impairment exists and, if so, the amount of that impairment.
53
Income taxes
We use the asset and liability method of accounting for income taxes. Under this method, we record deferred income taxes based on temporary differences between the financial reporting and tax bases of assets and liabilities and use enacted tax rates and laws that we expect will be in effect when we recover those assets or settle those liabilities, as the case may be, to measure those taxes. In cases where the expiration date of tax carryforwards or the projected operating results indicate that realization is not likely, we provide for a valuation allowance. Valuation allowances are established when necessary to reduce deferred tax assets to the amounts expected to be realized.
We have deferred tax assets, resulting from deductible temporary differences that may reduce taxable income in future periods. A valuation allowance is required when it is more likely than not that all or a portion of a deferred tax asset will not be realized. In assessing the need for a valuation allowance, we estimate future taxable income, considering the feasibility of ongoing tax-planning strategies and the realizability of tax loss carryforwards. Valuation allowances related to deferred tax assets can be impacted by changes in tax laws, changes in statutory tax rates and future taxable income levels. If we were to determine that we would be able to realize our deferred tax assets in the future in excess of the net carrying amounts, we would decrease the recorded valuation allowance through an increase to income in the period in which that determination is made. Due to the amount of netrecurring operating losses, available for income tax purposeswe established a full valuation allowance through December 31, 2017,2021, we had a full valuation allowance against our deferred tax assets. We continue to evaluate the realizability of our U.S. and Canadian deferred tax assets. If our financial results improve, we will reassess the need for a full valuation allowance each quarter and, if we determine that it is more likely than not the deferred tax assets will be realized, we will adjust the valuation allowance.
At December 31, 2017,2021, we had a valuation allowance against net deferred tax assets of $45.3$61.5 million. We review on a quarterly basis our conclusions about the appropriate amount of our deferred tax asset valuation allowance. There is inherent uncertainty in evaluating the sustainability of the income tax positions we take on our tax returns. We assess our income tax positions and record tax benefits for all years subject to examination based upon our management’s evaluation of the facts, circumstances and information available at the reporting date. For those tax positions where it is more likely than not that a tax benefit will be sustained, we have recorded the highest amount of tax benefit with a greater than 50% likelihood of being realized upon ultimate settlement with a taxing authority that has full knowledge of all relevant information. For those income tax positions where it is not more likely than not that a tax benefit will be realizable, no tax benefit has been recognized in our financial statements.
We include interest and penalties with income taxes on the accompanying statement of operations. Our tax years after 20102014 are subject to tax authority examinations. Additionally, our net operating losses and research credits after 2010 are subject to tax authority adjustment.
Recently issued accounting guidance
See “Note 1. The Company and Summary of Significant Accounting Policies” of the Notes to Consolidated Financial Statements in “Item 8. Financial Statements and Supplementary Data” for a full description of recent accounting pronouncements including the respective expected dates of adoption and estimated effects, if any on our consolidated financial statements.
Item 7A.Quantitative and Qualitative Disclosures about Market Risk
The primary objective of our investment activities is to preserve principal while maximizing yields without significantly increasing risk. To achieve this objective, historically we have invested in money market funds. With the proceeds from our two public offerings in 2012 and our Notes offerings in 2018 and 2021, we have invested in a broader portfolio of high credit quality short-term securities. To minimize the exposure due to an adverse shift in interest rates, we maintain an average portfolio duration of one year or less.
Our primary exposure to market risk is interest income and expense sensitivity, which is affected by changes in the general level of the interest rates in the United States. However, because of the short-term nature of our interest-bearing securities, a 10% change in market interest rates would not be expected to have a material impact on our consolidated financial condition or results of operations.
Historically, a majority of our operations, have consisted ofincluding research and development, and sales, activitieshave been in the United States. As a result, our financial results have not been materially affected by factors such as changes in foreign currency exchange rates or economic conditions in foreign markets. We are developingconsidering plans to expand our international presence. Accordingly, we expect that our exposure to changes in foreign currency exchange rates and economic conditions may increase in future periods.
Item 8.Financial Statements and Supplementary Data
Index to financial statements
| Page | |||||
| Report of independent registered public accounting firm | |||||
| Consolidated balance sheets | |||||
| Consolidated statements of operations | |||||
| Consolidated statements of comprehensive loss | |||||
| Consolidated statements of stockholders’ equity | |||||
| Consolidated statements of cash flows | |||||
| Notes to consolidated financial statements | |||||
55
REPORT OF INDEPENDENT REGISTERED PUBLIC ACCOUNTING FIRM
To the shareholdersStockholders and the Board of Directors of Vocera Communications, Inc.
Opinion on the Consolidated Financial Statements
We have audited the accompanying consolidated balance sheets of Vocera Communications, Inc. and subsidiaries (the "Company") as of December 31, 20172021 and 2016,2020, the related consolidated statements of operations, comprehensive loss, stockholder’sstockholders' equity, and cash flows for each of the three years in the period ended December 31, 20172021, and the related notes (collectively referred to as the “financial statements”"financial statements"). In our opinion, the financial statements present fairly, in all material respects, the financial position of the Company as of December 31, 20172021 and 2016,2020, and the results of its operations and its cash flows for each of the three years in the period ended December 31, 2017,2021, in conformity with the accounting principles generally accepted in the United States of America.
We have also audited, in accordance with the standards of the Public Company Accounting Oversight Board (United States) (PCAOB), the Company's internal control over financial reporting as of December 31, 2017,2021, based on criteria established in Internal Control -— Integrated Framework (2013)issued by the Committee of Sponsoring Organizations of the Treadway Commission and our report dated March 5, 2018,February 22, 2022, expressed an unqualified opinion on the Company’sCompany's internal control over financial reporting.
Change in Accounting Principle
As discussed in Note 8 to the financial statements, the Company has changed its method of accounting for convertible debt effective January 1, 2021 using a modified retrospective transition approach due to adoption of Accounting Standards Codification No. 2020-06, Accounting for Convertible Instruments and Contracts in an Entity’s Own Equity.
Basis for Opinion
These financial statements are the responsibility of the Company's management. Our responsibility is to express an opinion on the Company's financial statements based on our audits. We are a public accounting firm registered with the PCAOB and are required to be independent with respect to the Company in accordance with the U.S. federal securities laws and the applicable rules and regulations of the Securities and Exchange Commission and the PCAOB.
We conducted our audits in accordance with the standards of the PCAOB. Those standards require that we plan and perform the audit to obtain reasonable assurance about whether the financial statements are free of material misstatement, whether due to error or fraud. Our audits included performing procedures to assess the risks of material misstatement of the financial statements, whether due to error or fraud, and performing procedures that respond to those risks. Such procedures included examining, on a test basis, evidence regarding the amounts and disclosures in the financial statements. Our audits also included evaluating the accounting principles used and significant estimates made by management, as well as evaluating the overall presentation of the financial statements. We believe that our audits provide a reasonable basis for our opinion.
Critical Audit Matters
The critical audit matters communicated below are matters arising from the current-period audit of the financial statements that were communicated or required to be communicated to the audit committee and that (1) relate to accounts or disclosures that are material to the financial statements and (2) involved our especially challenging, subjective, or complex judgments. The communication of critical audit matters does not alter in any way our opinion on the financial statements, taken as a whole, and we are not, by communicating the critical audit matters below, providing separate opinions on the critical audit matters or on the accounts or disclosures to which they relate.
Revenue Recognition - Refer to Note 2 to the Financial Statements
Critical Audit Matter Description
The Company recognizes revenue upon transfer of control of promised products or services to customers in an amount that reflects the consideration the Company expects to receive in exchange for those products or services. The Company offers products and services including its proprietary communication badges, perpetual software licenses, professional services, maintenance and support services, and extended hardware warranties. Product revenue was $118 million and service revenue was $116 million for the year ended December 31, 2021.
56
Significant judgment is exercised by the Company in determining revenue recognition for the Company’s customer contracts, and includes the following:
•Identification and evaluation of terms and conditions within contracts that impact revenue recognition
•Determination of whether promised goods or services, such as hardware and software licenses, are capable of being distinct and are distinct in the context of the Company’s customer contracts which leads to whether they should be accounted for as individual or combined performance obligations
•Determination of stand-alone selling prices for each distinct performance obligation and for products and services that are not sold separately
•Determination of transaction price and allocation of transaction price to identified performance obligations
We identified revenue recognition as a critical audit matter because of these significant judgments required by management. This required a high degree of auditor judgment and an increased extent of effort when performing audit procedures to evaluate whether revenue was recognized to depict the transfer of promised products or services to customers in an amount that reflects the consideration the Company expects to be entitled to in exchange for those goods or services.
How the Critical Audit Matter Was Addressed in the Audit
Our principal audit procedures related to the Company’s revenue recognition for these customer agreements included the following:
•We tested the effectiveness of controls related to the identification and evaluation of terms and conditions in contracts, determination of distinct performance obligations, determination of the standalone selling prices, determination of transaction price, allocation of the transaction price to the performance obligations in the contract, and recognition of revenue when, or as, the Company satisfies a performance obligation.
•We evaluated management’s significant accounting policies related to revenue recognition for reasonableness.
•We selected a sample of recorded revenue transactions and performed the following procedures:
◦Obtained and read customer purchase orders and the underlying contract for each selection, including master agreements and related amendments to evaluate if relevant contractual terms have been appropriately considered by management.
◦Evaluated management’s application of their accounting policy and tested revenue recognition for specific performance obligations by comparing management’s conclusions to the underlying master agreement and any related amendments.
◦Tested the mathematical accuracy of management’s calculations of revenue and the associated timing of revenue recognized in the financial statements.
•We evaluated the reasonableness of management’s estimate of standalone selling prices for products and services that are not sold separately by performing the following:
◦Assessed the appropriateness of the Company’s methodology and mathematical accuracy of the determined standalone selling prices.
◦Tested the completeness and accuracy of the source data utilized in management’s calculations.
Business Acquisitions — Refer to Note 12 to the Financial Statements
Critical Audit Matter Description
As described in Note 12, the Company completed the acquisition of Patient Safe Solution, LLC (“PSS”) for capital consideration of $36 million on May 4, 2021. The Company accounted for the acquisition of PSS under the acquisition method of accounting for business combinations. Accordingly, the purchase price was allocated on a preliminary basis, to the assets acquired and liabilities assumed based on their respective fair values, including developed technology intangible assets with an aggregate fair value of approximately $5.3 million. The Company estimated the fair value of the developed technology intangible assets using an income-based valuation methodology, which is a specific relief-from-royalty method.
Significant judgment is exercised by the Company in determining the fair value of the acquired developed technology intangible assets, including the following:
•Future expected revenue for acquired developed technology,
57
•Useful life of acquired developed technology,
•Valuation methodology, and
•Discount and royalty rates.
Given the fair value determination of developed technology intangible assets acquired requires management to make significant estimates related to the above assumptions, performing audit procedures to evaluate the reasonableness of these assumptions required a high degree of auditor judgment and an increased extent of effort, including the need to involve our fair value specialists. Thus, we deemed this to be a critical audit matter.
How the Critical Audit Matter Was Addressed in the Audit
Our audit procedures related to the fair value of developed technology intangible assets acquired for PSS included the following, among others:
•We tested the effectiveness of controls over the purchase price allocation, including management’s controls over the forecast utilized, and the valuation methodology and inputs for estimating the fair value of developed technology intangible assets acquired.
•Our internal valuation specialists assisted us in evaluating the reasonableness of the (1) valuation techniques used for developed technology intangible assets acquired, (2) valuation assumptions used in the relief-from-royalty method including royalty rate, obsolescence factor, and discount rates, and (3) testing the mathematical accuracy of the calculation of estimated fair value of the developed technology intangible acquired assets, and developing a range of independent estimates and comparing our estimates to those used by management.
•We assessed the reasonableness of management’s projections of economic useful life of developed technology intangible assets acquired, and percentage of revenue attributable to the intangible asset by comparing the assumptions used in the projections to external market sources, existing contracts, historical data, and results from other areas of the audit.
/s/ DELOITTEDeloitte & TOUCHETouche LLP
San Jose, California
We have served as the Company's auditor since 2014.
58
REPORT OF INDEPENDENT REGISTERED PUBLIC ACCOUNTING FIRM
To the shareholdersStockholders and the Board of Directors of Vocera Communications, Inc.
Opinion on Internal Control over Financial Reporting
We have audited the internal control over financial reporting of Vocera Communications, Inc. and subsidiaries (the “Company”) as of December 31, 2017,2021, based on criteria established in Internal Control -— Integrated Framework (2013) issued by the Committee of Sponsoring Organizations of the Treadway Commission (COSO). In our opinion, the Company maintained, in all material respects, effective internal control over financial reporting as of December 31, 2017,2021, based on criteria established in Internal Control -— Integrated Framework (2013) issued by COSO.
We have also audited, in accordance with the standards of the Public Company Accounting Oversight Board (United States) (PCAOB),the consolidated financial statements as of and for the year ended December 31, 2017,2021, of the Company and our report dated March 5, 2018,February 22, 2022 expressed an unqualified opinion on those financial statements.
Basis for Opinion
The Company’s management is responsible for maintaining effective internal control over financial reporting and for its assessment of the effectiveness of internal control over financial reporting, included in the accompanying Management’s Report on Internal Control Over Financial Reporting. Our responsibility is to express an opinion on the Company’s internal control over financial reporting based on our audit. We are a public accounting firm registered with the PCAOB and are required to be independent with respect to the Company in accordance with the U.S. federal securities laws and the applicable rules and regulations of the Securities and Exchange Commission and the PCAOB.
We conducted our audit in accordance with the standards of the PCAOB. Those standards require that we plan and perform the audit to obtain reasonable assurance about whether effective internal control over financial reporting was maintained in all material respects. Our audit included obtaining an understanding of internal control over financial reporting, assessing the risk that a material weakness exists, testing and evaluating the design and operating effectiveness of internal control based on the assessed risk, and performing such other procedures as we considered necessary in the circumstances. We believe that our audit provides a reasonable basis for our opinion.
Definition and Limitations of Internal Control over Financial Reporting
A company’s internal control over financial reporting is a process designed to provide reasonable assurance regarding the reliability of financial reporting and the preparation of financial statements for external purposes in accordance with generally accepted accounting principles. A company’s internal control over financial reporting includes those policies and procedures that (1) pertain to the maintenance of records that, in reasonable detail, accurately and fairly reflect the transactions and dispositions of the assets of the company; (2) provide reasonable assurance that transactions are recorded as necessary to permit preparation of financial statements in accordance with generally accepted accounting principles, and that receipts and expenditures of the company are being made only in accordance with authorizations of management and directors of the company; and (3) provide reasonable assurance regarding prevention or timely detection of unauthorized acquisition, use, or disposition of the company’s assets that could have a material effect on the financial statements.
Because of its inherent limitations, internal control over financial reporting may not prevent or detect misstatements. Also, projections of any evaluation of effectiveness to future periods are subject to the risk that controls may become inadequate because of changes in conditions, or that the degree of compliance with the policies or procedures may deteriorate.
/s/ DELOITTEDeloitte & TOUCHETouche LLP
San Jose, California
59
Vocera Communications, Inc.
Consolidated Balance Sheets
(In Thousands, Except Share and Par Amounts)
| December 31, | |||||||||||
| 2021 | 2020 | ||||||||||
| Assets | |||||||||||
| Current assets | |||||||||||
| Cash and cash equivalents | $ | 96,304 | $ | 34,976 | |||||||
| Short-term investments | 236,089 | 195,227 | |||||||||
| Accounts receivable, net of allowance | 48,213 | 45,653 | |||||||||
| Other receivables | 7,188 | 6,170 | |||||||||
| Inventories | 7,165 | 10,159 | |||||||||
| Prepaid expenses and other current assets | 4,783 | 6,317 | |||||||||
| Total current assets | 399,742 | 298,502 | |||||||||
| Property and equipment, net | 7,789 | 8,103 | |||||||||
| Intangible assets, net | 19,671 | 12,788 | |||||||||
| Goodwill | 94,883 | 69,168 | |||||||||
| Deferred commissions | 16,596 | 12,293 | |||||||||
| Other long-term assets | 17,379 | 5,967 | |||||||||
| Total assets | $ | 556,060 | $ | 406,821 | |||||||
| Liabilities and stockholders' equity | |||||||||||
| Current liabilities | |||||||||||
| Accounts payable | $ | 5,330 | $ | 3,127 | |||||||
| Accrued payroll and other current liabilities | 29,946 | 23,195 | |||||||||
| Deferred revenue, current | 73,223 | 54,785 | |||||||||
| Convertible senior notes, net | 40,411 | — | |||||||||
| Total current liabilities | 148,910 | 81,107 | |||||||||
| Deferred revenue, long-term | 10,732 | 9,948 | |||||||||
| Convertible senior notes, net | 218,635 | 124,376 | |||||||||
| Other long-term liabilities | 15,686 | 10,374 | |||||||||
| Total liabilities | 393,963 | 225,805 | |||||||||
| Stockholders' equity | |||||||||||
| Preferred stock, $0.0003 par value - 5,000,000 shares authorized as of December 31, 2021 and December 31, 2020; zero shares issued and outstanding | — | — | |||||||||
| Common stock, $0.0003 par value - 100,000,000 shares authorized as of December 31, 2021 and December 31, 2020; 34,923,302 and 32,692,561 shares issued and outstanding as of December 31, 2021 and December 31, 2020, respectively | 10 | 10 | |||||||||
| Additional paid-in capital | 315,816 | 340,515 | |||||||||
| Accumulated other comprehensive (loss) income | (470) | 473 | |||||||||
| Accumulated deficit | (153,259) | (159,982) | |||||||||
| Total stockholders’ equity | 162,097 | 181,016 | |||||||||
| Total liabilities and stockholders’ equity | $ | 556,060 | $ | 406,821 | |||||||
| December 31, | |||||||
| 2017 | 2016 | ||||||
| Assets | |||||||
| Current assets | |||||||
| Cash and cash equivalents | $ | 28,726 | $ | 35,033 | |||
| Short-term investments | 52,507 | 39,033 | |||||
| Accounts receivable, net | 35,105 | 24,142 | |||||
| Other receivables | 1,170 | 1,211 | |||||
| Inventories | 2,815 | 4,556 | |||||
| Prepaid expenses and other current assets | 3,957 | 3,364 | |||||
| Total current assets | 124,280 | 107,339 | |||||
| Property and equipment, net | 5,751 | 5,894 | |||||
| Intangible assets, net | 13,567 | 18,200 | |||||
| Goodwill | 49,246 | 49,246 | |||||
| Other long-term assets | 1,667 | 1,394 | |||||
| Total assets | $ | 194,511 | $ | 182,073 | |||
| Liabilities and stockholders' equity | |||||||
| Current liabilities | |||||||
| Accounts payable | $ | 2,678 | $ | 3,231 | |||
| Accrued payroll and other current liabilities | 14,689 | 15,896 | |||||
| Deferred revenue, current | 47,276 | 43,845 | |||||
| Total current liabilities | 64,643 | 62,972 | |||||
| Deferred revenue, long-term | 16,438 | 11,155 | |||||
| Other long-term liabilities | 4,455 | 4,505 | |||||
| Total liabilities | 85,536 | 78,632 | |||||
| Commitments and contingencies (Note 7) | |||||||
| Stockholders' equity | |||||||
| Preferred stock, $0.0003 par value - 5,000,000 shares authorized as of December 31, 2017 and December 31, 2016; zero shares issued and outstanding | — | — | |||||
| Common stock, $0.0003 par value - 100,000,000 shares authorized as of December 31, 2017 and December 31, 2016; 29,412,116 and 27,568,103 shares issued and outstanding as of December 31, 2017 and December 31, 2016, respectively | 9 | 8 | |||||
| Additional paid-in capital | 250,854 | 230,605 | |||||
| Accumulated other comprehensive loss | (191 | ) | (69 | ) | |||
| Accumulated deficit | (141,697 | ) | (127,103 | ) | |||
| Total stockholders’ equity | 108,975 | 103,441 | |||||
| Total liabilities and stockholders’ equity | $ | 194,511 | $ | 182,073 | |||
The accompanying notes are an integral part of these consolidated financial statements.
60
Vocera Communications, Inc.
Consolidated Statements of Operations
(In Thousands, Except Per Share Amounts)
| Years ended December 31, | |||||||||||||||||
| 2021 | 2020 | 2019 | |||||||||||||||
| Revenue | |||||||||||||||||
| Product | $ | 118,170 | $ | 100,567 | $ | 92,561 | |||||||||||
| Service | 116,015 | 97,853 | 87,940 | ||||||||||||||
| Total revenue | 234,185 | 198,420 | 180,501 | ||||||||||||||
| Cost of revenue | |||||||||||||||||
| Product | 31,675 | 28,805 | 29,039 | ||||||||||||||
| Service | 47,657 | 40,998 | 42,363 | ||||||||||||||
| Total cost of revenue | 79,332 | 69,803 | 71,402 | ||||||||||||||
| Gross profit | 154,853 | 128,617 | 109,099 | ||||||||||||||
| Operating expenses | |||||||||||||||||
| Research and development | 45,850 | 38,820 | 34,280 | ||||||||||||||
| Sales and marketing | 74,551 | 65,494 | 63,168 | ||||||||||||||
| General and administrative | 38,537 | 28,382 | 25,774 | ||||||||||||||
| Total operating expenses | 158,938 | 132,696 | 123,222 | ||||||||||||||
| Loss from operations | (4,085) | (4,079) | (14,123) | ||||||||||||||
| Interest income | 1,032 | 3,169 | 5,110 | ||||||||||||||
| Interest expense | (3,198) | (9,354) | (8,789) | ||||||||||||||
| Other expense, net | (1,550) | (640) | (158) | ||||||||||||||
| Loss before income taxes | (7,801) | (10,904) | (17,960) | ||||||||||||||
| (Provision for) benefit from income taxes | (694) | 1,248 | (20) | ||||||||||||||
| Net loss | (8,495) | (9,656) | (17,980) | ||||||||||||||
| Net loss per share: | |||||||||||||||||
| Basic and diluted | $ | (0.25) | $ | (0.30) | $ | (0.57) | |||||||||||
| Weighted average shares used to compute net loss per share: | |||||||||||||||||
| Basic and diluted | 34,295 | 32,215 | 31,273 | ||||||||||||||
| Years ended December 31, | |||||||||||
| 2017 | 2016 | 2015 | |||||||||
| Revenue | |||||||||||
| Product | $ | 88,865 | $ | 70,667 | $ | 55,716 | |||||
| Service | 73,683 | 57,029 | 48,370 | ||||||||
| Total revenue | 162,548 | 127,696 | 104,086 | ||||||||
| Cost of revenue | |||||||||||
| Product | 27,244 | 22,788 | 19,666 | ||||||||
| Service | 37,683 | 26,287 | 19,844 | ||||||||
| Total cost of revenue | 64,927 | 49,075 | 39,510 | ||||||||
| Gross profit | 97,621 | 78,621 | 64,576 | ||||||||
| Operating expenses | |||||||||||
| Research and development | 27,685 | 18,266 | 16,990 | ||||||||
| Sales and marketing | 59,986 | 52,811 | 47,647 | ||||||||
| General and administrative | 23,970 | 24,499 | 16,734 | ||||||||
| Total operating expenses | 111,641 | 95,576 | 81,371 | ||||||||
| Loss from operations | (14,020 | ) | (16,955 | ) | (16,795 | ) | |||||
| Interest income | 604 | 684 | 509 | ||||||||
| Other expense, net | (42 | ) | (467 | ) | (347 | ) | |||||
| Loss before income taxes | (13,458 | ) | (16,738 | ) | (16,633 | ) | |||||
| Provision for income taxes | (759 | ) | (529 | ) | (473 | ) | |||||
| Net loss | (14,217 | ) | (17,267 | ) | (17,106 | ) | |||||
| Net loss per share: | |||||||||||
| Basic and diluted | $(0.50) | $(0.64) | $(0.66) | ||||||||
| Weighted average shares used to compute net loss per share: | |||||||||||
| Basic | 28,655 | 26,859 | 25,971 | ||||||||
| Diluted | 28,655 | 26,859 | 25,971 | ||||||||
The accompanying notes are an integral part of these consolidated financial statements.
61
Vocera Communications, Inc.
Consolidated Statements of Comprehensive Loss
(In Thousands)
| Years ended December 31, | |||||||||||||||||
| 2021 | 2020 | 2019 | |||||||||||||||
| Net loss | $ | (8,495) | $ | (9,656) | $ | (17,980) | |||||||||||
| Other comprehensive loss, net: | |||||||||||||||||
| Change in unrealized (loss) gain on investments, net of tax | (943) | 294 | 622 | ||||||||||||||
| Comprehensive loss | $ | (9,438) | $ | (9,362) | $ | (17,358) | |||||||||||
| Years ended December 31, | |||||||||||
| 2017 | 2016 | 2015 | |||||||||
| Net loss | $ | (14,217 | ) | $ | (17,267 | ) | $ | (17,106 | ) | ||
| Other comprehensive loss, net: | |||||||||||
| Change in unrealized gain (loss) on investments, net of tax | (122 | ) | 93 | (81 | ) | ||||||
| Comprehensive loss | $ | (14,339 | ) | $ | (17,174 | ) | $ | (17,187 | ) | ||
The accompanying notes are an integral part of these consolidated financial statements.
62
Vocera Communications, Inc.
Consolidated Statements of Stockholders' Equity
(In Thousands, except share amounts)
| Common stock | Additional paid-in capital | Accum. other comprehensive income (loss) | Accumulated deficit | Total stockholders’ equity | |||||||||||||||||||||||||||||||||
| Common stock | Additional paid-in capital | Accum. other comprehensive income (loss) | Accumulated deficit | Total stockholders’ equity | Shares | Amount | |||||||||||||||||||||||||||||||
| Shares | Amount | ||||||||||||||||||||||||||||||||||||
| Balance at January 1, 2015 | 25,644,010 | $ | 8 | $ | 202,515 | $ | (81 | ) | $ | (92,730 | ) | $ | 109,712 | ||||||||||||||||||||||||
| Balance at January 1, 2019 | Balance at January 1, 2019 | 30,708,138 | $ | 9 | $ | 295,647 | $ | (443) | $ | (132,346) | $ | 162,867 | |||||||||||||||||||||||||
| Exercise of stock options | 191,906 | — | 1,195 | — | — | 1,195 | Exercise of stock options | 187,174 | — | 2,439 | — | — | 2,439 | ||||||||||||||||||||||||
| RSUs released net of shares withheld for tax settlement | 324,178 | — | (1,719 | ) | — | — | (1,719 | ) | RSUs released net of shares withheld for tax settlement | 610,024 | — | (11,460) | — | — | (11,460) | ||||||||||||||||||||||
| Common stock issued under employee stock purchase plan | 145,487 | — | 1,302 | — | — | 1,302 | Common stock issued under employee stock purchase plan | 155,373 | — | 3,472 | — | — | 3,472 | ||||||||||||||||||||||||
| Vesting of early exercised stock options | — | — | 12 | — | — | 12 | |||||||||||||||||||||||||||||||
| Cash exercise of common stock warrants | 16,741 | — | 111 | — | — | 111 | |||||||||||||||||||||||||||||||
| Employee stock-based compensation expense | — | — | 11,005 | — | — | 11,005 | Employee stock-based compensation expense | — | — | 23,865 | — | — | 23,865 | ||||||||||||||||||||||||
| Net loss | — | — | — | — | (17,106 | ) | (17,106 | ) | Net loss | — | — | — | — | (17,980) | (17,980) | ||||||||||||||||||||||
| Other comprehensive loss | — | — | — | (81 | ) | — | (81 | ) | |||||||||||||||||||||||||||||
| Balance at December 31, 2015 | 26,322,322 | 8 | 214,421 | (162 | ) | (109,836 | ) | 104,431 | |||||||||||||||||||||||||||||
| Other comprehensive gain | Other comprehensive gain | — | — | — | 622 | — | 622 | ||||||||||||||||||||||||||||||
| Balance at December 31, 2019 | Balance at December 31, 2019 | 31,660,709 | 9 | 313,963 | 179 | (150,326) | 163,825 | ||||||||||||||||||||||||||||||
| Exercise of stock options | 643,005 | — | 2,502 | — | — | 2,502 | Exercise of stock options | 305,596 | — | 3,460 | — | — | 3,460 | ||||||||||||||||||||||||
| RSUs released net of shares withheld for tax settlement | 414,404 | — | (2,675 | ) | — | — | (2,675 | ) | RSUs released net of shares withheld for tax settlement | 485,663 | 1 | (6,372) | — | — | (6,371) | ||||||||||||||||||||||
| Common stock issued under employee stock purchase plan | 188,372 | — | 1,690 | — | — | 1,690 | Common stock issued under employee stock purchase plan | 240,593 | — | 3,739 | — | — | 3,739 | ||||||||||||||||||||||||
| Capital contributed by selling shareholders of acquired business | — | — | 2,632 | — | — | 2,632 | |||||||||||||||||||||||||||||||
| Employee stock-based compensation expense | — | — | 12,035 | — | — | 12,035 | Employee stock-based compensation expense | — | — | 25,725 | — | — | 25,725 | ||||||||||||||||||||||||
| Net loss | — | — | — | — | (17,267 | ) | (17,267 | ) | Net loss | — | — | — | — | (9,656) | (9,656) | ||||||||||||||||||||||
| Other comprehensive income | — | — | — | 93 | — | 93 | |||||||||||||||||||||||||||||||
| Balance at December 31, 2016 | 27,568,103 | 8 | 230,605 | (69 | ) | (127,103 | ) | 103,441 | |||||||||||||||||||||||||||||
| Other comprehensive gain | Other comprehensive gain | — | — | — | 294 | — | 294 | ||||||||||||||||||||||||||||||
| Balance at December 31, 2020 | Balance at December 31, 2020 | 32,692,561 | 10 | 340,515 | 473 | (159,982) | 181,016 | ||||||||||||||||||||||||||||||
| Cumulative effect of the adoption of ASU 2020-06 | Cumulative effect of the adoption of ASU 2020-06 | — | — | (32,214) | — | 15,218 | (16,996) | ||||||||||||||||||||||||||||||
| Exercise of stock options | 1,085,041 | 1 | 7,916 | — | — | 7,917 | Exercise of stock options | 194,852 | — | 3,202 | — | — | 3,202 | ||||||||||||||||||||||||
| RSUs released net of shares withheld for tax settlement | 599,440 | — | (8,990 | ) | — | — | (8,990 | ) | RSUs released net of shares withheld for tax settlement | 608,541 | — | (14,216) | — | — | (14,216) | ||||||||||||||||||||||
| Induced conversion of convertible senior notes | Induced conversion of convertible senior notes | 1,277,731 | — | 477 | — | — | 477 | ||||||||||||||||||||||||||||||
| Issuance of capped calls | Issuance of capped calls | — | — | (17,354) | — | — | (17,354) | ||||||||||||||||||||||||||||||
| Common stock issued under employee stock purchase plan | 159,532 | — | 2,750 | — | — | 2,750 | Common stock issued under employee stock purchase plan | 149,617 | — | 4,150 | — | — | 4,150 | ||||||||||||||||||||||||
| Effect of change in accounting principle related to stock-based compensation | — | — | 377 | — | (377 | ) | — | ||||||||||||||||||||||||||||||
| Employee stock-based compensation expense | — | — | 18,196 | — | — | 18,196 | Employee stock-based compensation expense | — | — | 31,256 | — | — | 31,256 | ||||||||||||||||||||||||
| Net loss | — | — | — | — | (14,217 | ) | (14,217 | ) | Net loss | — | — | — | — | (8,495) | (8,495) | ||||||||||||||||||||||
| Other comprehensive loss | — | — | — | (122 | ) | — | (122 | ) | Other comprehensive loss | — | — | — | (943) | — | (943) | ||||||||||||||||||||||
| Balance at December 31, 2017 | 29,412,116 | $ | 9 | $ | 250,854 | $ | (191 | ) | $ | (141,697 | ) | $ | 108,975 | ||||||||||||||||||||||||
| Balance at December 31, 2021 | Balance at December 31, 2021 | 34,923,302 | $ | 10 | $ | 315,816 | $ | (470) | $ | (153,259) | $ | 162,097 | |||||||||||||||||||||||||
The accompanying notes are an integral part of these consolidated financial statements
63
Vocera Communications, Inc.
Consolidated Statements of Cash Flows
(In Thousands)
| Years ended December 31, | |||||||||||||||||
| 2021 | 2020 | 2019 | |||||||||||||||
| Cash flows from operating activities | |||||||||||||||||
| Net loss | $ | (8,495) | $ | (9,656) | $ | (17,980) | |||||||||||
| Adjustments to reconcile net loss to net cash provided by operating activities: | |||||||||||||||||
| Depreciation and amortization | 10,246 | 6,387 | 7,289 | ||||||||||||||
| Accretion of investments | 2,644 | 1,089 | (587) | ||||||||||||||
| Stock-based compensation expense | 31,256 | 25,725 | 23,865 | ||||||||||||||
| Amortization of debt discount and issuance costs | 1,378 | 7,198 | 6,638 | ||||||||||||||
| Release of deferred tax valuation allowance | — | (2,056) | — | ||||||||||||||
| Non-cash lease expense | 3,822 | 2,566 | 1,741 | ||||||||||||||
| Non-cash impact of induced premium | 2,059 | — | — | ||||||||||||||
| Change in fair value of contingent consideration | (2,893) | 797 | — | ||||||||||||||
| Other | 692 | (76) | (71) | ||||||||||||||
| Changes in assets and liabilities, net of effect of acquisitions: | |||||||||||||||||
| Accounts receivable | (1,641) | (2,662) | (2,420) | ||||||||||||||
| Other receivables | (794) | 40 | (2,064) | ||||||||||||||
| Inventories | 2,881 | (5,259) | (293) | ||||||||||||||
| Prepaid expenses and other assets | 1,264 | (1,196) | (880) | ||||||||||||||
| Deferred commissions | (4,304) | (1,816) | (174) | ||||||||||||||
| Accounts payable | 1,660 | (2,615) | 1,475 | ||||||||||||||
| Accrued payroll and other liabilities | (2,102) | 7,528 | (2,431) | ||||||||||||||
| Change in lease-related performance obligations | (1,146) | (1,234) | (1,173) | ||||||||||||||
| Deferred revenue | 17,448 | 2,098 | 2,843 | ||||||||||||||
| Net cash provided by operating activities | 53,975 | 26,858 | 15,778 | ||||||||||||||
| Cash flows from investing activities | |||||||||||||||||
| Payment for property and equipment | (3,846) | (4,236) | (4,576) | ||||||||||||||
| Business acquisitions, net of cash and restricted cash acquired | (35,397) | (24,218) | — | ||||||||||||||
| Purchases of short-term investments | (251,832) | (139,677) | (137,508) | ||||||||||||||
| Maturities of short-term investments | 204,346 | 118,309 | 121,548 | ||||||||||||||
| Sales of short-term investments | 3,019 | 29,381 | — | ||||||||||||||
| Net cash used in investing activities | (83,710) | (20,441) | (20,536) | ||||||||||||||
| Cash flows from financing activities | |||||||||||||||||
| Cash from lease-related performance obligations | 516 | 2,027 | 1,735 | ||||||||||||||
| Repayment of borrowings | (102,946) | — | — | ||||||||||||||
| Proceeds from issuance of the convertible senior notes, net of issuance costs | 217,707 | — | — | ||||||||||||||
| Payment for purchase of capped calls | (17,354) | — | — | ||||||||||||||
| Proceeds from issuance of common stock from the employee stock purchase plan | 4,150 | 3,739 | 3,472 | ||||||||||||||
| Proceeds from exercise of stock options | 3,202 | 3,460 | 2,440 | ||||||||||||||
| Tax withholdings paid on behalf of employees for net share settlement | (14,212) | (6,371) | (11,461) | ||||||||||||||
| Net cash provided by (used in) financing activities | 91,063 | 2,855 | (3,814) | ||||||||||||||
| Net increase (decrease) in cash and cash equivalents | 61,328 | 9,272 | (8,572) | ||||||||||||||
| Cash, cash equivalents, and restricted cash at beginning of period | 34,976 | 25,704 | 34,276 | ||||||||||||||
| Cash, cash equivalents, and restricted cash at end of period | $ | 96,304 | $ | 34,976 | $ | 25,704 | |||||||||||
64
| Years ended December 31, | |||||||||||
| 2017 | 2016 | 2015 | |||||||||
| Cash flows from operating activities | |||||||||||
| Net loss | $ | (14,217 | ) | $ | (17,267 | ) | $ | (17,106 | ) | ||
| Adjustments to reconcile net loss to net cash provided by (used in) operating activities: | |||||||||||
| Depreciation and amortization | 7,643 | 3,770 | 3,271 | ||||||||
| Inventory provision | 380 | 168 | 118 | ||||||||
| Change in lease-related performance obligations | (864 | ) | (811 | ) | (925 | ) | |||||
| Stock-based compensation expense | 18,196 | 12,035 | 11,005 | ||||||||
| Non-cash compensation | — | 2,632 | — | ||||||||
| Other | 26 | 42 | 519 | ||||||||
| Changes in assets and liabilities | |||||||||||
| Accounts receivable | (10,963 | ) | (322 | ) | (5,075 | ) | |||||
| Other receivables | 41 | 120 | (234 | ) | |||||||
| Inventories | 1,361 | (1,985 | ) | 632 | |||||||
| Prepaid expenses and other assets | (866 | ) | (833 | ) | (295 | ) | |||||
| Accounts payable | (611 | ) | 170 | 1,050 | |||||||
| Accrued payroll and other liabilities | (1,104 | ) | 2,355 | 2,761 | |||||||
| Deferred revenue | 8,714 | 11,192 | 4,144 | ||||||||
| Net cash provided by (used in) operating activities | 7,736 | 11,266 | (135 | ) | |||||||
| Cash flows from investing activities | |||||||||||
| Payment for purchase of property and equipment | (2,834 | ) | (4,707 | ) | (1,151 | ) | |||||
| Business acquisitions, net of cash acquired | — | (52,500 | ) | — | |||||||
| Purchase of short-term investments | (67,426 | ) | (86,551 | ) | (109,310 | ) | |||||
| Maturities of short-term investments | 53,831 | 111,809 | 106,670 | ||||||||
| Sales of short-term investments | — | 32,061 | — | ||||||||
| Changes in restricted cash | — | — | 40 | ||||||||
| Net cash provided by (used in) investing activities | (16,429 | ) | 112 | (3,751 | ) | ||||||
| Cash flows from financing activities | |||||||||||
| Cash from lease-related performance obligations | 693 | 1,596 | 932 | ||||||||
| Proceeds from issuance of common stock from the employee stock purchase plan | 2,750 | 1,690 | 1,302 | ||||||||
| Proceeds from exercise of stock options | 7,917 | 2,502 | 1,195 | ||||||||
| Tax withholdings paid on behalf of employees for net share settlement | (8,974 | ) | (2,705 | ) | (1,697 | ) | |||||
| Proceeds from exercise of common stock warrants | — | — | 111 | ||||||||
| Net cash provided by financing activities | 2,386 | 3,083 | 1,843 | ||||||||
| Net increase (decrease) in cash and cash equivalents | (6,307 | ) | 14,461 | (2,043 | ) | ||||||
| Cash and cash equivalents at beginning of period | 35,033 | 20,572 | 22,615 | ||||||||
| Cash and cash equivalents at end of period | $ | 28,726 | $ | 35,033 | $ | 20,572 | |||||
| Supplemental cash flow information | |||||||||||
| Cash paid for income taxes | 342 | 245 | 159 | ||||||||
| Supplemental disclosure of non-cash investing and financing activities | |||||||||||
| Property and equipment in accounts payable and accrued liabilities | 102 | 44 | 64 | ||||||||
| Years ended December 31, | ||||||||||||||||||||||||||
| (in thousands) | 2021 | 2020 | 2019 | |||||||||||||||||||||||
| Supplemental cash flow information | ||||||||||||||||||||||||||
| Cash paid for interest | $ | 1,821 | $ | 2,156 | $ | 2,156 | ||||||||||||||||||||
| Cash paid for income taxes | $ | 704 | $ | 407 | $ | 345 | ||||||||||||||||||||
| Supplemental disclosure of non-cash investing and financing activities: | ||||||||||||||||||||||||||
| Operating lease right-of-use assets exchanged for lease obligations, net of acquired leases | $ | 13,028 | $ | 327 | $ | 2,830 | ||||||||||||||||||||
| Convertible senior notes converted to equity | $ | 477 | $ | — | $ | — | ||||||||||||||||||||
| Property and equipment in accounts payable and accrued liabilities | $ | 693 | $ | 157 | $ | 458 | ||||||||||||||||||||
The accompanying notes are an integral part of these consolidated financial statements.
65
Notes to Consolidated Financial Statements
1.The Company and Summary of Significant Accounting Policies
Background
Vocera Communications, Inc. and its subsidiaries (the(collectively, the "Company" or "Vocera") is a provider of secure, integrated, intelligent communication and clinical workflow solutions, focused on empowering mobile workers in healthcare, hospitality, retail, energy, education and other mission-critical mobile work environments, in the United States and internationally. The significant majority of the Company's business is generated from sales of its solutions in the healthcare market to help its customers improve quality of care, safety, patient and staff experience and increase operational efficiency.
The Vocera Communicationcommunication and Workflow System is comprised ofcollaboration solution includes: an intelligent enterprise software platform; a unique software platform that connects communication devices, including our hands-free,lightweight, wearable, voice-controlled communication badges,Badge and third-party mobile devices that use our software applicationsSmartbadge; and smartphone applications. The solution enables users to our enterprise-class software platform. The system transforms the way mobile workers communicatesimply connect instantly with other staff by enabling them to instantly connect via voice or secure text messaging. With a portfolio of over 120 third-party clinical integrations, our system also enables the intelligent delivery of alerts and alarms to a variety of mobile devices, providing real time situation awareness to care providers. The Company's unique hands-free voice capability allows mobile workers to connect with the right person simply by saying or selecting the name, function or group name of the person they wantdesired recipient. It also delivers HIPAA-compliant secure text messages, alerts and alarms directly to reach, often while remaining ata range of smartphones or the point-of-care. The Company's system responds to over 100 spoken commands.Smartbadge both inside and outside the hospital, replacing legacy pagers and in-building wireless phones.
The Company was incorporated in Delaware on February 16, 2000. The Company formed wholly-owned subsidiaries Vocera Communications UK LtdLtd. and Vocera Communications Australia Pty Ltd. in 2005, Vocera Canada, Ltd. in 2010, Vocera Communications India Private Ltd. in 2013, Vocera Communications Middle East FZ LLC in 2014, and acquired Extension, LLC in 2016.2016, EASE Applications, LLC ("EASE") in 2020 and PatientSafe Solutions, Inc. (“PatientSafe”) in 2021.
Since its inception, the Company has incurred significant losses and, as of December 31, 2017,2021, had an accumulated deficit of $141.7$153.3 million. The Company has funded its operations primarily with customer payments for its products and services, proceeds from the issuance of common stock in connection with its initial public offering ("IPO")(IPO) and follow-on offering.offering and proceeds from the issuance of convertible senior notes. As of December 31, 2017,2021, the Company had cash, cash equivalents and short-term investments of $81.2$332.4 million.
The Company believes that its existing sources of liquidity will satisfy its working capital and capital requirements for at least the next twelve months.
Merger Agreement
On January 6, 2022, the Company entered into an Agreement and Plan of Merger (the “Merger Agreement”), with Stryker Corporation, a Michigan corporation (“Parent”) and Voice Merger Sub Corp., a Delaware corporation and a direct or indirect wholly owned subsidiary of Parent (“Merger Sub”).
The Merger Agreement provides that, subject to the terms and conditions of the Merger Agreement, Merger Sub would commence a cash tender offer (the “Offer”) to purchase all of the outstanding shares of our common stock at a price per share equal to $79.25, net to the seller in cash, without interest, and subject to withholding taxes required by applicable law (the “Offer Price”). Following the expiration of theOffer and the acceptance by Merger Sub of the tendered shares in the Offer, on the terms and subject to the conditions in the Merger Agreement, Merger Sub would merge with and into Vocera, with Vocera continuing as the surviving corporation and becoming a wholly owned subsidiary of Stryker (the “Merger” and collectively with the Offer, the “Transaction”), and each then-outstanding share of our common stock (with certain limited exceptions) would be converted into the right to receive the Offer Price. Consummation of the Transaction is subject to various conditions, including, in respect of Merger Sub’s obligation to purchase and accept the tendered shares in the Offer, the condition that the number of shares validly tendered and not properly withdrawn prior to the Expiration Time (as defined in the Merger Agreement) is, when added to the shares, if any, owned by Parent, Merger Sub, or any subsidiary of Parent, represents at least a majority of all shares of our common stock then outstanding. However, there is no assurance that all of the various conditions to the Transactions will be satisfied, or that the Transaction will be completed on the proposed terms pursuant to the Merger Agreement within the expected timeframe, or at all. Furthermore, there are additional inherent risks to the Transaction, including the risks detailed elsewhere in this Annual Report on Form 10-K. The Transaction is expected to close in the first quarter of 2022, subject to the satisfaction of customary closing conditions.
Basis of presentation
The consolidated financial statements include the accounts of Vocera Communications, Inc. and its wholly owned subsidiaries. All inter-company transactions and balances have been eliminated in consolidation. The accompanying notes are prepared in accordance with accounting principles generally accepted in the United States (GAAP)("GAAP").
66
Use of estimates and reclassifications
The preparation of financial statements in conformity with GAAP requires the Company to make estimates and assumptions that affect the reported amounts of assets and liabilities and disclosure of contingent assets and liabilities at the date of the financial statements and the reported amounts of revenue and expense during the reporting periods. The estimates include, but are not limited to, revenue recognition, warranty reserves, allowance for doubtful accounts, inventory reserves, bonuses, goodwill and intangible assets, stock-based compensation expense, provisions for income taxes, contingent consideration and contingencies. Actual results could differ from these estimates, and such differences could be material to the Company’s financial position and results of operations.
Certain reclassifications have been made to the prior year financial statements to conform to the current year presentation. These reclassifications had no impact on the previously reported net loss or accumulated deficit.
Cash, cash equivalents and short-term investments
The Company’s cash equivalents and short-term investments consist of money market funds, commercial paper, U.S. government agency notes, U.S. Treasury notes, municipal debt and corporate debt. These investments are classified as available-for-sale securities and are carried at fair value with the unrealized gains and losses reported as a component of stockholders’ equity. Management determines the appropriate classification of its investments at the time of purchase and re-evaluates the available-for-sale designations as of each balance sheet date. Investments with an original purchase maturity of three months or less are classified as cash equivalents, all those with longer maturities are classified as short-term investments, which are available-for-sale.
The Company's marketable securities are recorded at their estimated fair value. Unrealized gains or losses on available-for-sale securities are reported in other comprehensive loss. The Company periodically assesses whether its securities are in an unrealized loss position which may become a realized loss in order to determine if an allowance for doubtful accounts reflects the Company’s best estimate of probablecredit losses inherent in the Company’sis required.
Accounts receivable and allowance for credit losses
Accounts receivable primarily include amounts related to receivables portfolio determined on the basis of historical experience, specific allowances for known troubled accounts and other currently available evidence.from customers. The Company has not experienced significant credit losses from itsmonitors collectability of accounts receivable.receivable primarily through review of the accounts receivable aging. The Company performs a regular review of its customers’ payment histories and associated credit risks as it does not require collateral from its customers.
| Years ended December 31, | ||||||||||||
| (in thousands) | 2017 | 2016 | 2015 | |||||||||
| Allowance—beginning of period | $ | — | $ | (451 | ) | $ | (53 | ) | ||||
| Provisions for bad debts | — | — | (479 | ) | ||||||||
| Recoveries from bad debts | — | — | 60 | |||||||||
| Write-offs and other | — | 451 | 21 | |||||||||
| Allowance—end of period | $ | — | $ | — | $ | (451 | ) | |||||
Inventories
Inventories are valuedrecorded at the lower of standard cost (which approximates actual cost on a first-in, first-out basis) or market (netnet realizable value or replacement cost).value. The Company assesses the valuation of inventory and periodically writes down the value for estimated excess and obsolete inventory based upon assumptions about future demand and market conditions.
Concentration of credit risk and other risks and uncertainties
Financial instruments that subject the Company to concentration of credit risk consist primarily of cash, cash equivalents and short-term investments. The Company’s cash and cash equivalents are primarily deposited with high quality financial institutions and in money market funds. Deposits at these institutions and funds may, at times, exceed federally insured limits. Management believes that these financial institutions and funds are financially sound and, accordingly, that minimal credit risk exists. The Company has not experienced any losses on its deposits of cash and cash equivalents. Marketable securities are stated at fair value and accounted for as available-for-sale within short-term investments. The counterparties to the agreements relating to the Company’s investment securities consist of major corporations, financial institutions and government agencies of high credit standing.
The primary hardware componentcomponents of the Company’s products isare currently manufactured by a third-party contractorcontractors in Mexico.Mexico and Taiwan. A significant disruption in the operations of this contractorthese contractors may impact the production of the Company’s products for a substantial period of time, which could harm the Company’s business, financial condition and results of operations.
Concentration of credit risk with respect to trade accounts receivable is considered to be limited due to the diversity of the Company’s customer base and geographic sales areas. At December 31, 20172021 and 2016, no customer accounted for 10% or more of accounts receivable. At December 31, 20172020, one reseller represented 26.3%17.4% and 32.7%, respectively of our accounts receivable. For the years ended December 31, 2017, 20162021, 2020 and 2015,2019, no customer represented 10% or more of revenue.
67
Other risks and uncertainties
The ongoing outbreak of coronavirus, SARS-CoV-2, or COVID-19, continues to be a global pandemic and public health emergency. Many federal, state and local governments and private entities have mandated various restrictions, including travel restrictions, restrictions on public gatherings, stay at home orders and advisories and quarantining of people who may have been exposed to the virus. Since the Company's last filing, COVID-19 infections have continued in many geographies of the world. In response to the ongoing and evolving COVID-19 pandemic, the Company considered the impact of the estimated economic implications on critical and significant accounting estimates, including assessment of collectability of customer contracts and the valuation of accounts receivable. Overall, the COVID-19 pandemic has not had a material impact on the Company's operating results or business in the year ended December 31, 2021. While future impacts cannot be predicted at this time, the shift in hospital resources, attention to treatment of COVID-19 patients and declines in hospital revenues may result in reduced demand for the Company's products and solutions, longer sales cycles and/or delays of customer implementations, which could negatively impact financial condition.
Property and equipment
Property and equipment are stated at cost and depreciated on a straight-line basis over the estimated useful economic lives of the assets. Assets generally have useful economic lives of three years except for leasehold improvements, which are amortized using the straight-line method over the shorter of the remaining lease term or the estimated useful life of the related assets. Purchased or developed software also generally has a three year useful economic life of three years, except for major ERP implementations, for which the Company assumes a five year useful economic life.life of five years. Upon retirement or sale, the cost and related accumulated depreciation and amortization are removed from the consolidated balance sheet and the resulting gain or loss is reflected in operations. Maintenance and repairs which are not considered improvements and do not extend the useful life of the assets are charged to operations as incurred.
The Company periodically reviews property and equipment for impairment whenever events or changes in circumstances indicate that the carrying amount of an asset is impaired or the estimated useful lives are no longer appropriate. Fair value is estimated based on discountedundiscounted future cash flows. If indicators of impairment exist and the undiscounted projected cash flows associated with such assets are less than the carrying amount of the asset, an impairment loss is recorded to write the asset down to its estimated fair values. To date, the Company has not recorded any material impairment charges.
Segment
The Company’s chief operating decision maker ("CODM") receives and regularly reviews financial information on an entity-wide basis. The CODM considers entity-wide financial information in deciding how to allocate resources in assessing performance of the Company’s communication and clinical workflow solutions and services business. There are no segment managers who are held accountable for operations, operating results or plans for levels or components. The Company’s CODM is its Chief Executive Officer. As a result, the Company reports its financial performance consistent with its single reporting segment and operating unit structure.
Goodwill and intangible assets
The Company allocates the purchase price of any acquisitions to tangible assets and liabilities and identifiable intangible assets acquired. Any residual purchase price is recorded as goodwill.
Goodwill
Goodwill is tested for impairment at the reporting unit level at least annually, or more often if events or changes in circumstances indicate the carrying value may not be recoverable. The Company has identified two1 operating segments (Product and Service)segment which management also considers to be a reporting units.unit. In testing for goodwill impairment, the Company may elect to utilize a qualitative assessment to evaluate whether it is more likely than not that the fair value of athe reporting unit is less than its carrying value. If such qualitative assessment indicates that goodwill impairment is more likely than not, the Company performs a two-stepquantitative impairment test. The Company performed its goodwill impairment assessment on October 1, 20172021 using a qualitative assessment and determined that no impairment existed as of the date of the impairment test because the fair value of eachthe Company's reporting unit more likely than not exceeded its carrying value. As of December 31, 2017,2021, no changes in circumstances indicate that goodwill carrying values may not be recoverable.
68
Intangible assets
Intangible assets are amortized over their estimated useful lives. Upon completion of development, acquired in-process research and development assets are generally considered amortizable, finite-lived assets and are amortized over their estimated useful lives. Finite-lived intangible assets consist of customer relationships, developed technology, trademarks, backlog and non-compete agreements. The Company evaluates intangible assets for impairment by assessing the recoverability of these assets whenever adverse events or changes in circumstances or business climate indicate that expected undiscounted future cash flows related to such intangible assets may not be sufficient to support the net book value of such assets. An impairment is recognized in the period of identification to the extent the carrying amount of an asset exceeds the fair value of such asset. No impairment of intangible assets was recorded in the years ended December 31, 2017, 20162021, 2020 or 2015.2019.
Leases
The Company determines if an arrangement is a lease at inception. Operating leases are included in other long-term assets, accrued payroll and other current liabilities and other long-term liabilities on the consolidated balance sheets.
The Company has elected an accounting policy to not recognize short-term leases (one year or less) on the consolidated balance sheet. The Company also elected the package of practical expedients which applies to leases that commenced before the adoption date. By electing the package of practical expedients, the Company did not need to reassess whether any existing contracts are or contained a lease or the lease classification for any existing leases.
Operating lease right-of-use assets and operating lease liabilities are recognized based on the present value of the lease payments over the lease term at commencement date. As most of the Company’s leases do not provide an implicit rate, the incremental borrowing rate is used based on the information available at commencement date in determining the present value of future payments. The Company’s incremental borrowing rate is determined by estimating the cost to the Company to borrow a collateralized amount equal to the total lease payments over a similar lease term and is based on credit-adjusted and term-specific discount rates, using a third-party yield curve. The operating lease right-of-use asset also includes any lease payments made and excludes lease incentives. Lease terms may include options to extend or terminate the lease when it is reasonably certain that the Company will exercise that option. Lease expense for minimum lease payments is recognized on a straight-line basis over the lease term. The Company accounts for lease components and non-lease components as a single lease component.
Business combination
Acquisitions are accounted for using the acquisition method. Goodwill is measured at the acquisition date as the excess of the purchase price over the fair value of the assets acquired and liabilities assumed. Significant estimates and assumptions are made by management to value such assets and liabilities. Although the Company believes that those estimates and assumptions are reasonable and appropriate, they are inherently uncertain and subject to refinement. Additional information related to the acquisition date fair value of acquired assets and assumed liabilities obtained during the measurement period, not to exceed one year, may result in changes to the recorded values of such assets and liabilities, resulting in an offsetting adjustment to the goodwill associated with the business acquired. Uncertain tax positions and tax-related valuation allowances are initially established in connection with a business combination as of the acquisition date. The Company continues to collect information and reevaluate these estimates and assumptions. Any contingent consideration payable is recognized at fair value at the acquisition date. Liability-classified contingent consideration is remeasured each reporting period, with changes in fair value recognized in earnings until the contingent consideration is settled. Acquisition related costs incurred in connection with a business combination are expensed as incurred.
Revenue recognition
The core principle of Accounting Standards Codification ("ASC") 606, Revenue from Contracts with Customers (Topic 606) is to recognize revenue to depict the transfer of promised goods or services to customers in an amount that reflects the consideration to which the entity expects to be entitled in exchange for those goods or services. This principle is achieved through applying the following five-step approach:
•Identification of the contract, or contracts, with a customer - A contract with a customer exists when (i) the Company enters into an enforceable contract with a customer that defines each party’s rights regarding the goods or services to be transferred and identifies the payment terms related to these goods or services, (ii) the contract has commercial substance and, (iii) the Company determines that collection of substantially all consideration for goods or services that are transferred is probable based on the customer’s intent and ability to pay the promised consideration. The Company derives revenue fromapplies judgment in determining the salescustomer’s ability and intention to pay, which is based on a variety of badges, smartphones, perpetual software licenses for software that is essentialfactors including the customer’s historical payment experience or, in the case of a new customer, published credit and financial information pertaining to the functionalitycustomer. Customer payments received by the Company are non-refundable.
•Identification of the communication badges, software maintenance, extended product warranty and professional services. The Company also derives revenue from the sale of licenses for software that is not essential to the functionality of the badges, which may include Clinical Integration and Vocera smartphone applications as well as certain subscription-based revenues including Vocera Care Experience. Sales tax is excluded from reported total revenue.
69
functionally distinct, whereby the customer can benefit from the goods or service either on their own or together with other resources that are readily available from third parties or from the Company, and b) contractually distinct, whereby the transfer of the goods or services is separately identifiable from other promises in the contract. To the extent a contract includes multiple promised goods or services, the Company applies judgment to determine whether promised goods or services are capable of being distinct and unique in the context of the contract. If these criteria are not met the promised goods or services are accounted for as a combined performance obligation.
•Determination of the transaction price - The transaction price is determined based on the consideration to which the Company is entitled in exchange for transferring goods or services to the customer.
•Allocation of the transaction price to the performance obligations in the contract - If the contract contains a single performance obligation, the entire transaction price is allocated to the single performance obligation. Contracts that contain multiple performance obligations require an allocation of the transaction price to each performance obligation based on a relative standalone selling price (SSP) basis. The Company allocates arrangement consideration at the inception of the arrangement to all deliverables using the relativedetermines standalone selling price method. This method requiresbased on the Company to determine the selling price at which each deliverable could be sold if it were sold regularly on a standalone basis. When available, the Company uses vendor-specific objective evidence ("VSOE") of the selling price. VSOE represents the price charged for a deliverable when itperformance obligation is sold separately, or for a deliverable not yet being sold separately,separately. If the price established by management with the relevant authority. The Company has established VSOE of the selling price for software maintenance. When VSOE ofstandalone selling price is not available, third-party evidence ("TPE") ofobservable through past transactions, the Company estimates the standalone selling price for similar products and services is acceptable; however, the Company's offerings and market strategy differ from those of its competitors, such that the Company cannot obtain sufficient comparabletaking into account available information about third parties' prices. If neither VSOE nor TPE are available, the Company uses its best estimates of selling prices ("BESP"). The Company determines BESP considering factors such as market conditions sales channels, internal costs and product margin objectives andinternally approved pricing practices.guidelines related to the performance obligations.
•Recognition of revenue when, or as, the Company satisfies a performance obligation - The Company regularly reviews and update its VSOE and BESP information.satisfies performance obligations either over time or at a point in time as discussed in further detail below. Revenue is recognized at the time the related performance obligation is satisfied by transferring a promised good or service to a customer.
from the saleCompany’s software products is generally recognized upon transfer of badges and perpetual software licensescontrol to the customer. Revenue is generally recognized upon shipment of hardware and software licenses.
Subscription and support revenue - The Company generates subscription and support revenue primarily from post contract support ("PCS") contracts, cloud-based subscription sales, and sales of extended warranties on the Vocera Badge. Subscription revenue is generally recognized ratably over the applicable term. The majority of software sales are in conjunction with PCS contracts, which generally have a one-year term. The Company recognizes revenue from PCS contracts ratably over the contractual service period. The service period typically commences upon transfer of control of the corresponding software products to the customer. The Company recognizes revenue from extended warranty contracts ratably over their contractual service period, which is primarily two years. This period starts one year from the date on which the transfer of control on the underlying hardware occurs because the hardware generally carries a one-year warranty.
Professional services and training revenue - Professional services and training revenue is generated when the Company installs and configures its software and devices at new or deliveryexisting customer sites. The Company recognizes revenue related to professional services as they are performed.
Contracts with multiple performance obligations - Some of the Company’s contracts with customers contain multiple performance obligations. For these contracts, the Company accounts for individual performance obligations separately if they are distinct. The transaction price is allocated to the separate performance obligations on a relative stand-alone selling price (SSP) basis. For deliverables that are routinely sold separately, such as subscription and support on the core offerings, the Company determines SSP by evaluating renewals over the trailing 12-months. For those that are not sold routinely, the Company determines SSP based on its overall pricing trends and objectives, taking into consideration market conditions and other factors, including the value of the contracts and the products sold.
Contract assets - The timing of revenue recognition may differ from the timing of invoicing to customers. Accounts receivable are recorded at the customers’ premises as the contractual provisions governing sales of these products do not include any provisions regarding acceptance, performance or general right of return or cancellation or termination provisions adversely affecting revenue recognition. Revenue from the sale of maintenance services on software licenses is recognized overinvoiced amount and in the period during which the services are provided, which is generally one year. Revenue from professional services is recognized either on a fixed fee basis based on milestones or on a time and materials basis as the services are provided, both of which generally take place over a period of two to twelve weeks, but may take longer depending on the complexity of the work involved.
70
Table of the revenue is deferred until evidence of fair value can be established, or until the items for which evidence of fair value cannot be established are delivered. The Company has established VSOE for software maintenance. The Company's revenue arrangements do not include a general right of return relative to the delivered products. The Company applies the combined services approach for arrangements in which the Company has VSOE for software maintenance but not for professional services. Under this approach, the Company ratably recognizes revenue over the longer of the period over which professional services is expected to be delivered or the contractual software maintenance period.Contents
Revenue from sales-type leases
A portion of the Company's sales are made through multi-year lease agreements with customers. Sales-type leases are included in other receivables, accrued payroll and other current liabilities and other long-term liabilities on the consolidated balance sheets. When these arrangements are considered sales-type leases, upon delivery of leased products to customers, the Company recognizes revenue for such products in an amount equal to the net present value of the minimum lease payments. Unearned income is recognized as part of product revenue under the effective interest method. The Company recognizes revenue related to certain executory costs, including maintenance and extended warranty, ratably over the term of the underlying arrangements. The Company recognizes revenue related to battery refresh executory costs when such executory costs are incurred.
Proceeds from transfers of sales-type leases to third-party financial companies are allocated between the net investment in sales-type leases and the executory cost component for remaining service obligations based on relative present value. The difference between the amount of proceeds allocated to the net investment in lease and the carrying value of the net investment in lease is included in product revenue. Proceeds allocated to the executory cost component are accounted for as financing liabilities.
For the year ended December 31, 2017,2021, the Company transferred $0.9$0.5 million of lease receivables, recording an immateriala net loss of $0.1 million and $0.7$0.5 million of new financing liabilities for future performance of executory service obligations. For the year ended December 31, 2016,2020, the Company transferred $3.6$2.5 million of lease receivables, recording an immateriala net loss of $0.2 million and $1.6$2.0 million of new financing liabilities for future performance of executory service obligations.
For lease receivables retained as of December 31, 20172021 and 2016,2020, the Company recorded $1.3$0.4 million and $1.9$0.7 million, respectively, of net investment in sales-type leases, equivalent to the minimum lease payments for the delivered product.
Shipping and handling costs
Shipping and handling costs charged to customers are included in revenue and the associated expense is recorded in cost of revenue in the consolidated statements of operations for all periods presented.
Research and development expenditures
Research and development costs are charged to operations as incurred. Software development costs incurred for external products prior to the establishment of technological feasibility are included in research and development and are expensed as incurred. After technological feasibility is established, material software development costs up to general availability of the software will beare capitalized and amortized on a straight-line basis over the estimated product life, or based on the ratio of current revenues to total projected product revenues,revenue, whichever is greater. To date, the time between the establishment of technological feasibility and general availability has been very short and therefore no significant costs have been incurred. Accordingly, the Company has not capitalized any software development costs related to research and development expenditures.
Advertising costs
Advertising costs are included in sales and marketing expense and are expensed as incurred. Advertising costs for the years ended December 31, 2017, 20162021, 2020 and 20152019 were immaterial.$0.7 million, $0.6 million, and $0.3 million, respectively.
Product warranties
The Company offers warranties on certain products and records a liability for the estimated future costs associated with warranty claims, which is based upon historical experience and the Company’s estimate of the level of future costs. The Company provides for the estimated costs of hardware warranties at the time the related revenue is recognized. Costs are estimated based on historical and projected product failure rates, historical and projected repair costs, and knowledge of specific product failures (if any). The specific hardware warranty includes parts and labor over a period generally ranging from one to three years. The Company provides no warranty for software. The Company regularly re-evaluates its estimates to assess the adequacy of the recorded warranty liabilities and adjust the amounts as necessary. Warranty costs are reflected in the consolidated statement of operations as cost of revenue.
Income taxes
The Company uses the asset and liability method of accounting for income taxes. Under this method, the Company records deferred income taxes based on temporary differences between the financial reporting and tax bases of assets and liabilities and useuses enacted tax rates and laws that the Company expects will be in effect when they recover those assets or settle those liabilities, as the case may be, to measure those taxes. In cases where the expiration date of tax carryforwards or the projected operating results indicate that realization is not likely, the Company provides for a valuation allowance. Valuation allowances are established when necessary to reduce deferred tax assets to the amounts expected to be realized.
The Company has deferred tax assets, resulting from net operating losses, research and development credits and temporary differences that may reduce taxable income in future periods. A valuation allowance is required when it is more likely than not
71
that all or a portion of a deferred tax asset will not be realized. In assessing the need for a valuation allowance, the Company estimates future taxable income, considering the feasibility of ongoing tax-planning strategies and the realizability of tax loss carryforwards. Valuation allowances related to deferred tax assets can be impacted by changes in tax laws, changes in statutory tax rates and future taxable income levels. If the Company were to determine that it would be able to realize its deferred tax assets in the future in excess of the net carrying amounts, it would decrease the recorded valuation allowance through an increase to income in the period in which that determination is made. Due to the history of losses the Company has generated in the past, the Company believes that it is not more likely than not that all of the deferred tax assets in the U.S. and Canada can be realized as of December 31, 20172021 and 2016,2020, respectively. Accordingly, the Company has recorded a full valuation allowance onagainst its deferred tax assets for these years.
At December 31, 2017,2021, the Company had a valuation allowance against net deferred tax assets of $45.3$61.5 million.
There is inherent uncertainty in evaluating the sustainability of the income tax positions the Company takes on its tax returns. The Company assesses its income tax positions and records tax benefits for all years subject to examination based upon management’s evaluation of the facts, circumstances and information available at the reporting date. For those tax positions where it is more likely than not that a tax benefit will be sustained, the Company has recorded the highest amount of tax benefit with a greater than 50% likelihood of being realized upon ultimate settlement with a taxing authority that has full knowledge of all relevant information. For those income tax positions where it is not more likely than not that a tax benefit will be realizable, no tax benefit has been recognized in the financial statements.
The Company includes interest and penalties with income taxes in the accompanying statement of operations. All of the Company’s net operating losses and research credit carryforwards are subject to adjustment by tax authorities and all years after 20102014 are still subject to tax authority examinations. The Company is currently not subject to any income tax audit examinations by tax authorities in any jurisdictions including U.S. federal, state and local or foreign countries.
Foreign currency translation
The functional currency of the Company’s foreign subsidiaries is the U.S. dollar. Accordingly, monetary assets and liabilities in non-functional currency of these subsidiaries are remeasured using exchange rates in effect at the end of the period. Revenues and costs in local currency are remeasured using average exchange rates for the period, except for costs related to those consolidated balance sheet items that are remeasured using historical exchange rates. The resulting remeasurement gains and losses are included in the Company’s consolidated statements of operations. Translation gains and losses have not been significant to date.
Comprehensive loss
For the years ended December 31, 2017, 20162021, 2020 and 2015,2019, the only component of other comprehensive loss was unrealized (losses) gains on available-for-sale securities.
Related party transactions
During the years ended December 31, 2017, 20162020 and 2015,2019, the Company had revenue transactions with a related party, the University of Chicago Medical Center (UCMC)("UCMC"), for $0.4 million, $0.4$1.0 million and $0.4$1.3 million, respectively, relating to consulting services and technology solutions. One of the Company's board members iswas the President of UCMC.
In May 2014,August 2020, the FASB togetherissued ASU 2020-06 Debt—Debt with Conversion and Other Options (Subtopic 470-20) and Derivatives and Hedging—Contracts in Entity’s Own Equity (Subtopic 815-40): Accounting for Convertible Instruments and Contracts in an Entity’s Own Equity, related to the International Accounting Standards Board issued convergedaccounting for debt with conversion features. The amendments in this update simplify the accounting for convertible instruments by reducing the number of accounting models available for convertible debt instruments and convertible preferred stock. This update also amends the guidance for revenue recognition that will replace most existing guidance, eliminate industry-specific guidance and provide a unified modelthe derivatives scope exception for determining how and when revenue from contracts with customers should be recognized. Under the new guidance, an entity should recognize revenue to depict the transfer of promised goods or services to customers in an entity's own equity to reduce form-over-substance-based accounting conclusions and requires the application of the if-converted method for calculating diluted earnings per share. The update also requires entities to provide expanded disclosures about the terms and features of convertible instruments, how the instruments have been reported in the entity's financial statements and information about events, conditions and circumstances that can affect how to assess the amount that reflects the considerationor timing of an entity's future cash flows related to which the entity expects to be entitled in exchangethose instruments. The guidance is effective for interim and annual periods beginning after December 15, 2021 with early adoption permitted for fiscal years beginning after December 15, 2020, including interim periods within those goods or services.
fiscal years. The Company adopted the new guidance onbeginning January 1, 2018 using the full retrospective method, which requires the Company to present its historical financial information for fiscal years 2016 and 2017 as if the new revenue guidance had been applied to all prior periods.
2021. The adoption of the standard will resultthis guidance resulted in the recognitionan increase of additional revenue of $2.7$17.0 million and $4.3$15.2 million for the years ended December 31, 2017to convertible senior notes, net and 2016,accumulated deficit, respectively, an increasea reduction to additional paid-in capital of $32.2 million, a deferred tax liability of $4.4 million. The related valuation allowance was reversed upon adoption, resulting in gross profitno tax expense impact.
72
Table of $2.7 million and $4.3 million for the years ended December 31, 2017 and 2016, respectively, an increase (decrease) in sales and marketing expense of $0.1 million and $(1.5) million for the years ended December 31, 2017 and 2016, respectively, and a decrease in loss from operations of $2.6 million and $5.8 million for the years ended December 31, 2017 and 2016, respectively. In addition, the adoption of the standard will result in a decrease in total deferred revenue of $7.8 million and $5.2 million as of December 31, 2017 and 2016, respectively, driven primarily by the upfront recognition of software licenses sold with professional services for which the Company does not have VSOE, and an increase in total deferred commissions of $10.3 million and $10.4 million as of December 31, 2017 and 2016, respectively, which will be recognized in sales and marketing expense in future periods. The adoption of the standard will not have a significant impact to the provision for income taxes and will not have an impact on net cash provided by or used in operating, investing, or financing activities on the Company's consolidated statements of cash flows. See Expected Impact to Reported Results below for the impact of adoption of the standard on the Company's consolidated balance sheets and consolidated statements of operations.Contents
| Consolidated Statement of Operations | Year ended December 31, 2017 | |||||||||||
| (in thousands, except per share data) | As Reported | Impact of Adoption | As Adjusted | |||||||||
| Revenue | ||||||||||||
| Product | $ | 88,865 | $ | 2,302 | $ | 91,167 | ||||||
| Service | 73,683 | 410 | 74,093 | |||||||||
| Total Revenue | $ | 162,548 | $ | 2,712 | $ | 165,260 | ||||||
| Gross Profit | $ | 97,621 | $ | 2,712 | $ | 100,333 | ||||||
| Operating Expenses | $ | 111,641 | $ | 121 | $ | 111,762 | ||||||
| Loss from Operations | $ | (14,020 | ) | $ | 2,591 | $ | (11,429 | ) | ||||
| Net Loss | $ | (14,217 | ) | $ | 2,591 | $ | (11,626 | ) | ||||
| Basic and diluted net loss per share | $ | (0.50 | ) | $ | 0.09 | $ | (0.41 | ) | ||||
| Consolidated Statement of Operations | Year ended December 31, 2016 | |||||||||||
| (in thousands, except per share data) | As Reported | Impact of Adoption | As Adjusted | |||||||||
| Revenue | ||||||||||||
| Product | $ | 70,667 | $ | 3,506 | $ | 74,173 | ||||||
| Service | 57,029 | 769 | 57,798 | |||||||||
| Total Revenue | $ | 127,696 | $ | 4,275 | $ | 131,971 | ||||||
| Gross Profit | $ | 78,621 | $ | 4,275 | $ | 82,896 | ||||||
| Operating Expenses | $ | 95,576 | $ | (1,537 | ) | $ | 94,039 | |||||
| Loss from Operations | $ | (16,955 | ) | $ | 5,812 | $ | (11,143 | ) | ||||
| Net Loss | $ | (17,267 | ) | $ | 5,812 | $ | (11,455 | ) | ||||
| Basic and diluted net loss per share | $ | (0.64 | ) | $ | 0.22 | $ | (0.42 | ) | ||||
| Consolidated Balance Sheet | As of December 31, 2017 | |||||||||||
| (in thousands) | As Reported | Impact of Adoption | As Adjusted | |||||||||
| Other receivables | $ | 1,170 | $ | 161 | (2) | $ | 1,331 | |||||
| Deferred commissions | $ | — | $ | 10,301 | (1) | $ | 10,301 | |||||
| Deferred revenue - current | $ | 47,276 | $ | (5,760 | ) | (2) | $ | 41,516 | ||||
| Deferred revenue - long-term | 16,438 | (2,021 | ) | (2) | 14,417 | |||||||
| Total deferred revenue | $ | 63,714 | $ | (7,781 | ) | $ | 55,933 | |||||
| Stockholders' equity | $ | 108,975 | $ | 18,243 | $ | 127,218 | ||||||
| Consolidated Balance Sheet | As of December 31, 2016 | |||||||||||
| (in thousands) | As Reported | Impact of Adoption | As Adjusted | |||||||||
| Deferred commissions | $ | — | $ | 10,422 | (1) | $ | 10,422 | |||||
| Deferred revenue - current | $ | 43,845 | $ | (5,598 | ) | (2) | $ | 38,247 | ||||
| Deferred revenue - long-term | 11,155 | 368 | (2) | 11,523 | ||||||||
| Total deferred revenue | $ | 55,000 | $ | (5,230 | ) | $ | 49,770 | |||||
| Stockholders' equity | $ | 103,441 | $ | 15,652 | $ | 119,093 | ||||||
In February 2016, the FASB amended lease accounting requirements to begin recording assetsMarch 2020 and liabilities arising from leases on the balance sheet. The new guidance will also require significant additional disclosures about the amount, timing and uncertainty of cash flows from leases. This new guidance will be effective beginning on January 1, 2019 using a modified retrospective approach. The modified retrospective approach includes a number of optional practical expedients that entities may elect to apply. The Company has not yet determined the future effect of the standard on its financial position or results of operations.
Recently issued and not yet adopted accounting pronouncements
In January 2017,October 2021, the FASB issued new guidance to simplify the accountingASU No. 2021-08, Business Combinations (Topic 805): Accounting for goodwill impairment. The guidance simplifies the measurement of goodwill impairment by removing step 2 of the goodwill impairment test, Contract Assets and Contract Liabilities from Contracts with Customers which requires the determinationrecognition and measurement of contract assets and contract liabilities acquired in a business combination in accordance with ASC 606, Revenue from Contracts with Customers. Considerations used to determine the amount of contract assets and contract liabilities to record at the acquisition date include the terms of the fair valueacquired contract, such as timing of individual assetspayment, identification of each performance obligation in the contract, and liabilitiesallocation of the contract transaction price to each identified performance obligation on a reporting unit.relative standalone selling price basis as of contract inception. ASU 2021-08 is effective for the Company beginning in the first quarter of fiscal year 2023. The new guidance requires goodwill impairment to be measured as the amount by which a reporting unit’s carrying value exceeds its fair value; however, the loss recognized should not exceed the total amount of goodwill allocated to that reporting unit. The amendments should be applied prospectively for acquisitions occurring on a prospective basis. The new
2.Revenue, deferred revenue and deferred commissions
Disaggregation of modification accounting for share-based payment arrangements. The guidance clarifies the type of changes to terms or conditions of share-based payment awards to which an entity would be required to apply modification accounting. Specifically, under this guidance, an entity would not apply modification accounting if the fair value, vesting conditions, and classification of the awards are the same immediately before and after the modification. The new standard is effective for the Company in the first quarter of 2018. Early adoption is permitted. The guidance will be applied prospectively to awards modified on or after the adoption date. The Company does not expect the guidance to have a material impact on its consolidated financial statements.Revenue
| Years ended December 31, | ||||||||||||||||||||
| (in thousands) | 2021 | 2020 | 2019 | |||||||||||||||||
| Revenue | ||||||||||||||||||||
| Product | ||||||||||||||||||||
| Device | $ | 72,473 | $ | 69,321 | $ | 61,224 | ||||||||||||||
| Software | 45,697 | 31,246 | 31,337 | |||||||||||||||||
| Total product | 118,170 | 100,567 | 92,561 | |||||||||||||||||
| Service | ||||||||||||||||||||
| Subscription and support | 94,246 | 78,532 | 68,846 | |||||||||||||||||
| Professional services and training | 21,769 | 19,321 | 19,094 | |||||||||||||||||
| Total service | 116,015 | 97,853 | 87,940 | |||||||||||||||||
| Total revenue | $ | 234,185 | $ | 198,420 | $ | 180,501 | ||||||||||||||
Costs to obtain and fulfill a contract
The Company capitalizes certain incremental contract acquisition costs consisting primarily of commissions paid and the related payroll taxes when customer contracts are signed. The Company determines whether costs should be deferred based on its sales compensation plans, if the commissions are incremental and would not have been incurred absent the execution of the customer contract. Sales commissions for renewals of customer contracts are not commensurate with the commissions paid for the acquisition of the initial contract given the substantive difference in commission rates in proportion to their respective contract values. Commissions paid upon the initial acquisition of a contract are amortized over the estimated period of benefit, which may exceed the term of the initial contract. Accordingly, amortization of deferred costs is recognized on a systematic basis that is consistent with the pattern of revenue recognition allocated to each performance obligation and is included in sales and marketing expense in the consolidated statements of operations. The Company determines its estimated period of benefit, up to five years, by evaluating the expected renewals of its customer contracts, the duration of its relationships with its
73
customers, average life of the Company's technology, and other factors. Deferred costs are periodically reviewed for impairment. In accordance with Topic 340, an entity may elect a practical expedient that allows the entity to recognize the incremental costs of obtaining a contract as an expense when incurred if the amortization period of the asset that the entity otherwise would have recognized is one year or less. The Company has elected this practical expedient and recognizes costs paid to obtain contracts as expense when incurred. Changes in the balance of total deferred commissions (contract asset) during the year ended December 31, 2021 and 2020 were as follows:
| (in thousands) | December 31, 2020 | Additions | Commissions Recognized | December 31, 2021 | |||||||||||||||||||
| Deferred commissions | $ | 12,293 | $ | 13,640 | $ | (9,337) | $ | 16,596 | |||||||||||||||
| (in thousands) | December 31, 2019 | Additions | Commissions Recognized | December 31, 2020 | |||||||||||||||||||
| Deferred commissions | $ | 10,477 | $ | 10,469 | $ | (8,653) | $ | 12,293 | |||||||||||||||
Deferred revenue
The Company records deferred revenue when cash payments are received in advance of the performance under the contract. The current portion of deferred revenue represents the amounts that are expected to be recognized as revenue within one year of the consolidated balance sheet date.
Revenue recognized during the year ended December 31, 2021 from deferred revenue balances as of December 31, 2020 was $60.4 million. Revenue recognized during the year ended December 31, 2020 from deferred revenue balances as of December 31, 2019 was $53.4 million.
The “contracted but not recognized” performance obligations represent the Company’s deferred revenue and non-cancelable backlog amounts. This balance as of December 31, 2021 was $200.1 million, of which the Company expects to recognize approximately 65% of the revenue over the next 12 months and the remainder thereafter.
3.Fair value of financial instruments
The Company’s cash, cash equivalents and short-term investments approximateare carried at their fair value due tovalues with any differences from their short-term nature.amortized cost recorded in equity as unrealized gains (losses) on marketable securities. As a basis for determining the fair value of its assets and liabilities, the Company utilizesfollows a three-tier fair value hierarchy, which prioritizes the inputs used in measuring fair value as follows: (Level 1) observable inputs such as quoted prices in active markets; (Level 2) inputs other than the quoted prices in active markets that are observable either directly or indirectly; and (Level 3) unobservable inputs in which there is little or no market data which requires the Company to develop its own assumptions. This hierarchy requires the Company to use observable market data, when available, and to minimize the use of unobservable inputs when determining fair value. For the years ended December 31, 2017, 20162021, 2020 and 2015,2019, there have been no transfers between Level 1 and Level 2 fair value instruments and no transfers in or out of Level 3.
The Company'sCompany’s money market funds are classified within Level 1 of the fair value hierarchy because they are valued using quoted market prices. The fair value of the Company'sCompany’s Level 2 fixed income securities areis obtained from independent pricing services, which may use quoted market prices for identical or comparable instruments or model-driven valuations using observable market data or other inputs, corroborated by observable market data.
In addition to its cash, cash equivalents and short-term investments, the Company measures the fair value of its Convertible Senior Notes on a quarterly basis for disclosure purposes. The Company does not have anyconsiders the fair value of the Convertible Senior Notes at December 31, 2021 to be a Level 2 measurement due to limited trading activity of the Convertible Senior Notes. Refer to Note 8 to the consolidated financial instrumentsstatements for further information.
The agreement for the acquisition of EASE includes contingent payments to the owners of EASE, payable based on achievement of post-acquisition financial metrics. This contingent consideration is a Level 3 fair value measurement, and the valuation of the Company’s contingent consideration obligation was estimated as the present value of total expected contingent consideration payments which are valueddetermined using Level 3 inputs.a Monte Carlo simulation. This analysis reflects the contractual terms of the purchase agreements and utilizes assumptions with regard to future sales, probabilities of achieving such future sales, the
74
likelihood and timing of expected payments and a discount rate. Significant increases with respect to assumptions as to future sales and probabilities of achieving such future sales would result in a higher fair value measurement, while an increase in the discount rate would result in a lower fair value measurement. The unobservable inputs in the valuation include revenue volatility of 10%, a risk-free rate of 2.50%. The fair value adjustment for the contingent consideration of $2.9 million for the year ended December 31, 2021 was recorded as other income and expense.
The table below summarizes the Company’s assets that are measured at fair value on a recurring basis, by level, within the fair value hierarchy as of December 31, 20172021 and 2016,2020, respectively. There were no liabilities measured at fair value on a recurring basis for these dates.
| December 31, 2017 | December 31, 2016 | December 31, 2021 | December 31, 2020 | |||||||||||||||||||||||||||||||||||||||||||||
| (in thousands) | Level 1 | Level 2 | Total | Level 1 | Level 2 | Total | (in thousands) | Level 1 | Level 2 | Level 3 | Total | Level 1 | Level 2 | Level 3 | Total | |||||||||||||||||||||||||||||||||
| Assets | Assets | |||||||||||||||||||||||||||||||||||||||||||||||
| Money market funds | $ | 3,232 | $ | — | $ | 3,232 | $ | 4,996 | $ | — | $ | 4,996 | Money market funds | $ | 3,664 | $ | — | $ | — | $ | 3,664 | $ | 363 | $ | — | $ | — | $ | 363 | |||||||||||||||||||
| Commercial paper | — | 1,201 | 1,201 | — | 1,322 | 1,322 | Commercial paper | — | 70,315 | — | 70,315 | — | 21,950 | — | 21,950 | |||||||||||||||||||||||||||||||||
| U.S. government agency securities | — | 8,648 | 8,648 | — | 4,177 | 4,177 | ||||||||||||||||||||||||||||||||||||||||||
| U.S. Treasury securities | — | 5,561 | 5,561 | — | 2,045 | 2,045 | U.S. Treasury securities | — | — | — | — | — | 6,000 | — | 6,000 | |||||||||||||||||||||||||||||||||
| Corporate debt securities | — | 37,530 | 37,530 | — | 33,166 | 33,166 | Corporate debt securities | — | 192,767 | — | 192,767 | — | 173,277 | — | 173,277 | |||||||||||||||||||||||||||||||||
| Total assets measured at fair value | $ | 3,232 | $ | 52,940 | $ | 56,172 | $ | 4,996 | $ | 40,710 | $ | 45,706 | Total assets measured at fair value | $ | 3,664 | $ | 263,082 | $ | — | $ | 266,746 | $ | 363 | $ | 201,227 | $ | — | $ | 201,590 | |||||||||||||||||||
| Liabilities | Liabilities | |||||||||||||||||||||||||||||||||||||||||||||||
| Contingent consideration | Contingent consideration | $ | — | $ | — | $ | 66 | $ | 66 | $ | — | $ | — | $ | 2,959 | $ | 2,959 | |||||||||||||||||||||||||||||||
| Total liabilities measured at fair value | Total liabilities measured at fair value | $ | — | $ | — | $ | 66 | $ | 66 | $ | — | $ | — | $ | 2,959 | $ | 2,959 | |||||||||||||||||||||||||||||||
The financial accounts that are not subject to recurring fair value measurement include trade and other receivables, prepaid expenses and other current assets, total current liabilities, and deferred revenues, both current and long-term. Due to their short maturities, the carrying amounts of these accounts approximate their fair values.
The table below provides a roll-forward of the fair value of the Company's liabilities that use significant unobservable inputs (Level 3).
| Year ended December 31, | |||||||||||||||||
| 2021 | 2020 | ||||||||||||||||
| Beginning balance | $ | 2,959 | $ | — | |||||||||||||
| Issuance of contingent consideration in connection with acquisition | — | 2,162 | |||||||||||||||
| Settlements of contingent consideration liabilities | — | — | |||||||||||||||
| Fair value adjustment for contingent consideration included in earnings | (2,893) | 797 | |||||||||||||||
| Ending balance | $ | 66 | $ | 2,959 | |||||||||||||
75
4.Cash, Cash Equivalents and Short-Term Investments
The following tables display gross unrealized gains and losses for cash, cash equivalents and available-for-sale investments for the periods presented:
| December 31, 2021 | ||||||||||||||||||||||||||
| (in thousands) | Amortized Cost | Unrealized Gains | Unrealized Losses | Fair value | ||||||||||||||||||||||
| Cash and Cash Equivalents: | ||||||||||||||||||||||||||
| Demand deposits and other cash | $ | 65,647 | $ | — | $ | — | $ | 65,647 | ||||||||||||||||||
| Money market funds | 3,664 | — | — | 3,664 | ||||||||||||||||||||||
| Commercial paper | 26,994 | — | (1) | 26,993 | ||||||||||||||||||||||
| Total cash and cash equivalents | 96,305 | — | (1) | 96,304 | ||||||||||||||||||||||
| Short-Term Investments: | ||||||||||||||||||||||||||
| Commercial paper | 43,362 | — | (40) | 43,322 | ||||||||||||||||||||||
| Corporate debt securities | 193,196 | 12 | (441) | 192,767 | ||||||||||||||||||||||
| Total short-term investments | 236,558 | 12 | (481) | 236,089 | ||||||||||||||||||||||
| Total cash, cash equivalents and short-term investments | $ | 332,863 | $ | 12 | $ | (482) | $ | 332,393 | ||||||||||||||||||
December 31, 2017 | ||||||||||||||||
| (in thousands) | Amortized Cost | Unrealized Gains | Unrealized Losses | Fair value | ||||||||||||
| Cash and cash equivalents: | ||||||||||||||||
| Demand deposits and other cash | $ | 25,061 | $ | — | $ | — | $ | 25,061 | ||||||||
| Money market funds | 3,232 | — | — | 3,232 | ||||||||||||
| Commercial paper | — | — | — | — | ||||||||||||
| Corporate debt securities | 433 | — | — | 433 | ||||||||||||
| Total cash and cash equivalents | 28,726 | — | — | 28,726 | ||||||||||||
| Short-Term Investments: | ||||||||||||||||
| Commercial paper | 1,202 | — | (1 | ) | 1,201 | |||||||||||
| U.S. government agency securities | 8,678 | — | (30 | ) | 8,648 | |||||||||||
| U.S. Treasury securities | 5,586 | — | (25 | ) | 5,561 | |||||||||||
| Corporate debt securities | 37,176 | 1 | (80 | ) | 37,097 | |||||||||||
| Total short-term investments | 52,642 | 1 | (136 | ) | 52,507 | |||||||||||
| Total cash, cash equivalents and short-term investments | $ | 81,368 | $ | 1 | $ | (136 | ) | $ | 81,233 | |||||||
| December 31, 2020 | ||||||||||||||||||||||||||||||||||||||||||
| (in thousands) | (in thousands) | Amortized Cost | Unrealized Gains | Unrealized Losses | Fair value | |||||||||||||||||||||||||||||||||||||
| Cash and Cash Equivalents: | Cash and Cash Equivalents: | |||||||||||||||||||||||||||||||||||||||||
| Demand deposits and other cash | Demand deposits and other cash | $ | 28,613 | $ | — | $ | — | $ | 28,613 | |||||||||||||||||||||||||||||||||
| Money market funds | Money market funds | 363 | — | — | 363 | |||||||||||||||||||||||||||||||||||||
| U.S. government agency securities | U.S. government agency securities | 6,000 | — | — | 6,000 | |||||||||||||||||||||||||||||||||||||
| Total cash and cash equivalents | Total cash and cash equivalents | 34,976 | — | — | 34,976 | |||||||||||||||||||||||||||||||||||||
| Short-Term Investments: | Short-Term Investments: | |||||||||||||||||||||||||||||||||||||||||
| Commercial paper | Commercial paper | 21,961 | — | (11) | 21,950 | |||||||||||||||||||||||||||||||||||||
| December 31, 2016 | ||||||||||||||||||||||||||||||||||||||||||
| (in thousands) | Amortized Cost | Unrealized Gains | Unrealized Losses | Fair value | ||||||||||||||||||||||||||||||||||||||
| Cash and cash equivalents: | ||||||||||||||||||||||||||||||||||||||||||
| Demand deposits and other cash | $ | 28,360 | $ | — | $ | — | $ | 28,360 | ||||||||||||||||||||||||||||||||||
| Money market funds | 4,996 | — | — | 4,996 | ||||||||||||||||||||||||||||||||||||||
| Commercial paper | 549 | — | — | 549 | ||||||||||||||||||||||||||||||||||||||
| Corporate debt securities | 1,128 | — | — | 1,128 | ||||||||||||||||||||||||||||||||||||||
| Total cash and cash equivalents | 35,033 | — | — | 35,033 | ||||||||||||||||||||||||||||||||||||||
| Short-Term Investments: | ||||||||||||||||||||||||||||||||||||||||||
| Commercial paper | 773 | — | — | 773 | ||||||||||||||||||||||||||||||||||||||
| U.S. government agency securities | 4,176 | 1 | — | 4,177 | ||||||||||||||||||||||||||||||||||||||
| U.S. Treasury securities | 2,045 | — | — | 2,045 | ||||||||||||||||||||||||||||||||||||||
| Corporate debt securities | 32,052 | 1 | (15 | ) | 32,038 | Corporate debt securities | 172,768 | 543 | (34) | 173,277 | ||||||||||||||||||||||||||||||||
| Total short-term investments | 39,046 | 2 | (15 | ) | 39,033 | Total short-term investments | 194,729 | 543 | (45) | 195,227 | ||||||||||||||||||||||||||||||||
| Total cash, cash equivalents and short-term investments | $ | 74,079 | $ | 2 | $ | (15 | ) | $ | 74,066 | Total cash, cash equivalents and short-term investments | $ | 229,705 | $ | 543 | $ | (45) | $ | 230,203 | ||||||||||||||||||||||||
The Company has determined that the unrealizedno credit losses on its short-term investmentsrelated to marketable securities were required as of as of December 31, 20172021 and 2016 do2020. The Company has not constituterecorded an "other than temporary impairment". Theallowance for credit losses on investments that were in an unrealized losses for the short-term investmentsloss position as of December 31, 20172021 and 2016 have all been in a continuous unrealized loss position for less than twelve months.2020 because they were not material. The Company’s conclusion of no “other than temporary impairment” is based on the high credit quality of the securities, their short remaining maturity and the Company’s intent and ability to hold such loss securities until maturity.
76
Classification of the cash, cash equivalent and short-term investments by contractual maturity was as follows:
| (in thousands) | One year or shorter | Between 1 and 2 years | Total | |||||||||
| Balances as of December 31, 2017 | ||||||||||||
| Cash and cash equivalents (1) | $ | 28,726 | $ | — | $ | 28,726 | ||||||
| Short-term investments | 34,750 | 17,757 | 52,507 | |||||||||
| Cash, cash equivalents and short-term investments | $ | 63,476 | $ | 17,757 | $ | 81,233 | ||||||
| Balances as of December 31, 2016 | ||||||||||||
| Cash and cash equivalents (1) | $ | 35,033 | $ | — | $ | 35,033 | ||||||
| Short-term investments | 39,033 | — | 39,033 | |||||||||
| Cash, cash equivalents and short-term investments | $ | 74,066 | $ | — | $ | 74,066 | ||||||
| (in thousands) | One year or shorter | Between 1 and 2 years | Total | |||||||||||||||||
| Balances as of December 31, 2021 | ||||||||||||||||||||
| Cash and cash equivalents (1) | $ | 96,304 | $ | — | $ | 96,304 | ||||||||||||||
| Short-term investments | 160,158 | 75,931 | 236,089 | |||||||||||||||||
| Cash, cash equivalents and short-term investments | $ | 256,462 | $ | 75,931 | $ | 332,393 | ||||||||||||||
| Balances as of December 31, 2020 | ||||||||||||||||||||
| Cash and cash equivalents (1) | $ | 34,976 | $ | — | $ | 34,976 | ||||||||||||||
| Short-term investments | 141,582 | 53,645 | 195,227 | |||||||||||||||||
| Cash, cash equivalents and short-term investments | $ | 176,558 | $ | 53,645 | $ | 230,203 | ||||||||||||||
| (1) Includes demand deposits and other cash, money market funds and other cash equivalent securities, all with 0-90 day | |||||||||||||||||
5.Net loss per share
The following table presents the calculation of basic and diluted net income (loss)loss per share:
| Years ended December 31, | Years ended December 31, | ||||||||||||||||||||||||||||
| (in thousands, except for share and per share amounts) | 2017 | 2016 | 2015 | (in thousands, except for share and per share amounts) | 2021 | 2020 | 2019 | ||||||||||||||||||||||
| Numerator: | Numerator: | ||||||||||||||||||||||||||||
| Net loss | $ | (14,217 | ) | $ | (17,267 | ) | $ | (17,106 | ) | Net loss | $ | (8,495) | $ | (9,656) | $ | (17,980) | |||||||||||||
| Denominator: | Denominator: | ||||||||||||||||||||||||||||
| Weighted-average shares used to compute net loss per common share - basic and diluted | 28,655 | 26,859 | 25,971 | Weighted-average shares used to compute net loss per common share - basic and diluted | 34,295 | 32,215 | 31,273 | ||||||||||||||||||||||
| Net loss per share | Net loss per share | ||||||||||||||||||||||||||||
| Basic and diluted | $(0.50) | $(0.64) | $(0.66) | Basic and diluted | $ | (0.25) | $ | (0.30) | $ | (0.57) | |||||||||||||||||||
For the years ended December 31, 2017, 2016 and 2015,2021, 2020 or 2019, the following outstanding securities at period end were not included in the calculation of diluted shares outstanding as the effect would have been anti-dilutive:
| December 31, | ||||||||||||||||||||
| (in thousands) | 2021 | 2020 | 2019 | |||||||||||||||||
| Options to purchase common stock | 150 | 496 | 523 | |||||||||||||||||
| Convertible senior notes | 4,998 | — | — | |||||||||||||||||
| Restricted stock units and performance stock units | 2,153 | 2,014 | 1,461 | |||||||||||||||||
6.Goodwill and intangible assets
| December 31, | |||||||||
| (in thousands) | 2017 | 2016 | 2015 | ||||||
| Options to purchase common stock | 1,365 | 2,454 | 3,355 | ||||||
| Warrants to purchase common stock | — | — | 29 | ||||||
| Restricted stock units | 2,046 | 2,129 | 1,322 | ||||||
Goodwill
The Company had $49.2 $94.9 million and $49.2$69.2 million of goodwill as of December 31, 20172021 and 2016,2020, respectively. The addition to goodwill during the year ended December 31, 2021 of $25.7 million was based on the purchase price allocations of the acquisition completed in May of 2021 (See Note 12). Goodwill is tested for impairment at the reporting unit level at least annually or more often if events or changes in circumstances indicate the carrying value may not be recoverable. The Company has two reporting units: Product and Service; as of December 31, 2017 $41.2 million of the Company's goodwill resides in the Product reporting unit and $8.0 million resides in the Servicea single reporting unit. The Company performed an impairment assessment in 2017 which determined that no impairment existed. For 2017existed as of December 31, 2021 and 2016,2020. To assess goodwill for impairment for the years ended December 31, 2021 and 2020, the Company used the qualitative assessment permitted under authoritative accounting guidance. Among the qualitative factors considered were changes since the prior impairment test in the following: industry and competitive environment, business
77
strategy, product mix, buyer and supplier bargaining power, potential market size, consistency in operating margins and cash flows, change in reporting unit or product life cycle stage and earnings quality and sustainability. No impairment was recorded
The changes in the years ended December 31, 2017, 2016 or 2015.carrying amount of goodwill are as follows:
| Balance at December 31, 2020 | $69,168 | |||||||||||||
| Acquired in acquisition | 25,665 | |||||||||||||
| Adjustments to goodwill | 50 | |||||||||||||
| Balance at December 31, 2021 | $94,883 | |||||||||||||
Intangible assets
The fair values for acquired intangible assets were determined by management with consideration of, in part, valuations performed by independent valuation specialists. Acquisition-related intangible assets are amortized over the life of the assets on an accelerated basis that approximates the expected economic benefit of the assets. This assumption results in amortization that is higher in earlier periods of the useful life. To date there has been no impairment of the Company's intangible assets. The estimated useful lives and carrying value of acquired intangible assets are as follows:
| December 31, 2021 | December 31, 2020 | |||||||||||||||||||||||||||||||||||||||||||
| (in thousands) | Weighted average useful life (years) | Gross carrying amount | Accumulated amortization | Net carrying amount | Gross carrying amount | Accumulated amortization | Net carrying amount | |||||||||||||||||||||||||||||||||||||
| Intangible assets: | ||||||||||||||||||||||||||||||||||||||||||||
| Customer relationships | 8.0 | $ | 19,640 | $ | (9,143) | $ | 10,497 | $ | 16,350 | $ | (7,143) | $ | 9,207 | |||||||||||||||||||||||||||||||
| Developed technology | 3.0 | 17,620 | (12,254) | 5,366 | 12,360 | (10,255) | 2,105 | |||||||||||||||||||||||||||||||||||||
| Trademarks | 3.0 | 1,770 | (1,411) | 359 | 1,770 | (1,191) | 579 | |||||||||||||||||||||||||||||||||||||
| Backlog | 4.0 | 5,950 | (2,501) | 3,449 | 2,240 | (1,343) | 897 | |||||||||||||||||||||||||||||||||||||
| Intangible assets, net book value | $ | 44,980 | $ | (25,309) | $ | 19,671 | $ | 32,720 | $ | (19,932) | $ | 12,788 | ||||||||||||||||||||||||||||||||
| December 31, 2017 | December 31, 2016 | |||||||||||||||||||||||||
| (in thousands) | Weighted average useful life (years) | Gross carrying amount | Accumulated amortization | Net carrying amount | Gross carrying amount | Accumulated amortization | Net carrying amount | |||||||||||||||||||
| Intangible assets: | ||||||||||||||||||||||||||
| Customer relationships | 7 to 9 | $ | 10,920 | $ | 3,469 | $ | 7,451 | $ | 10,920 | $ | 2,280 | $ | 8,640 | |||||||||||||
| Developed technology | 3 to 7 | 10,050 | 5,302 | 4,748 | 10,050 | 2,845 | 7,205 | |||||||||||||||||||
| Trademarks | 3 to 7 | 1,110 | 497 | 613 | 1,110 | 148 | 962 | |||||||||||||||||||
| Backlog | 3 | 1,400 | 650 | 750 | 1,400 | 78 | 1,322 | |||||||||||||||||||
| Non-compete Agreements | 2 to 4 | 460 | 455 | 5 | 460 | 389 | 71 | |||||||||||||||||||
| Intangible assets, net book value | $ | 23,940 | $ | 10,373 | $ | 13,567 | $ | 23,940 | $ | 5,740 | $ | 18,200 | ||||||||||||||
Amortization of intangible assets was $4.6$5.4 million, $1.4$1.9 million, and $0.8$3.6 million for the years ended December 31, 2017, 20162021, 2020 and 2015,2019, respectively.
Amortization of acquired intangible assets is reflected in the cost of revenues for developed technology and backlog and in operating expenses for the other intangibles. The estimated future amortization of acquired intangible assets as of December 31, 20172021 was as follows:
| (in thousands) | Future amortization | |||||||
| 2022 | $ | 6,057 | ||||||
| 2023 | 5,537 | |||||||
| 2024 | 3,506 | |||||||
| 2025 | 1,409 | |||||||
| 2026 | 1,090 | |||||||
| Thereafter | 2,072 | |||||||
| Future amortization expense | $ | 19,671 | ||||||
78
| (in thousands) | Future amortization | |||
| 2018 | $ | 4,334 | ||
| 2019 | 3,880 | |||
| 2020 | 1,251 | |||
| 2021 | 1,127 | |||
| 2022 | 1,050 | |||
| Thereafter | 1,925 | |||
| Future amortization expense | $ | 13,567 | ||
7.Consolidated balance sheet components
Inventories
| December 31, | December 31, | |||||||||||||||||||||
| (in thousands) | 2017 | 2016 | (in thousands) | 2021 | 2020 | |||||||||||||||||
| Raw materials | $ | 4 | $ | 103 | Raw materials | $ | 1,200 | $ | 462 | |||||||||||||
| Finished goods | 2,811 | 4,453 | Finished goods | 5,965 | 9,697 | |||||||||||||||||
| Total inventories | $ | 2,815 | $ | 4,556 | Total inventories | $ | 7,165 | $ | 10,159 | |||||||||||||
Property and equipment, net
| December 31, | December 31, | |||||||||||||||||||||
| (in thousands) | 2017 | 2016 | (in thousands) | 2021 | 2020 | |||||||||||||||||
| Computer equipment and software | $ | 8,832 | $ | 8,971 | Computer equipment and software | $ | 16,634 | $ | 15,912 | |||||||||||||
| Furniture, fixtures and equipment | 1,764 | 1,726 | Furniture, fixtures and equipment | 2,856 | 2,570 | |||||||||||||||||
| Leasehold improvements | 4,794 | 4,144 | Leasehold improvements | 5,817 | 5,306 | |||||||||||||||||
| Manufacturing tools and equipment | 2,624 | 3,019 | Manufacturing tools and equipment | 2,696 | 2,506 | |||||||||||||||||
| Construction in process | 157 | 74 | Construction in process | 1,895 | 629 | |||||||||||||||||
| Property and equipment, at cost | 18,171 | 17,934 | Property and equipment, at cost | 29,898 | 26,923 | |||||||||||||||||
| Less: Accumulated depreciation | (12,420 | ) | (12,040 | ) | Less: Accumulated depreciation | (22,109) | (18,820) | |||||||||||||||
| Property and equipment, net | $ | 5,751 | $ | 5,894 | Property and equipment, net | $ | 7,789 | $ | 8,103 | |||||||||||||