0001130464 us-gaap:InterestRateSwapMember us-gaap:AccumulatedNetGainLossFromDesignatedOrQualifyingCashFlowHedgesMember 2018-12-310001130464bkh:PowerGenerationMemberbkh:IntercompanyCustomersMember2019-01-012019-12-31
UNITED STATES
SECURITIES AND EXCHANGE COMMISSION
Washington, DC 20549
Form 10-K
☒ ANNUAL REPORT PURSUANT TO SECTION 13 OR 15(d) OF THE SECURITIES EXCHANGE ACT OF 1934
For the fiscal year ended December 31, 2020
Or
☐ TRANSITION REPORT PURSUANT TO SECTION 13 OR 15(d) OF THE SECURITIES EXCHANGE ACT OF 1934
For the transition period from _______________ to _______________
10-K
Commission File Number 001-31303
BLACK HILLS CORPORATION
Incorporated in South Dakota IRS Identification Number 46-0458824
7001 Mount Rushmore Road
Rapid City, South Dakota 57702
Registrant’s telephone number (605) 721-1700
|
| | |
☒ | ANNUAL REPORT PURSUANT TO SECTION 13 OR 15(d) OF THE SECURITIES EXCHANGE ACT OF 1934 |
| | |
| For the fiscal year ended | December 31, 2019
|
| Or |
☐ | TRANSITION REPORT PURSUANT TO SECTION 13 OR 15(d) OF THE SECURITIES EXCHANGE ACT OF 1934 |
| | |
| For the transition period from ___________________ to __________________ |
| | |
| Commission File Number | 001-31303 |
|
| | | | | | |
BLACK HILLS CORPORATION |
| | | | | | |
Incorporated in | South Dakota | | IRS Identification Number | 46-0458824 |
| | | | | | |
7001 Mount Rushmore Road | Rapid City | | South Dakota | 57702 |
|
| | | | | | |
Registrant’s telephone number, including area code | (605) | 721-1700 | | |
|
| Securities registered pursuant to Section 12(b) of the Act: |
| Title of each class | Trading Symbol(s)Symbol | Name of each exchange on which registered |
| Common stock of $1.00 par value | BKH | New York Stock Exchange |
|
| | | | | | |
Indicate by check mark if the registrant is a well-known seasoned issuer, as defined in Rule 405 of the Securities Act. |
| Yes | ☒ | | No | Indicate by check mark if the registrant is a well-known seasoned issuer, as defined in Rule 405 of the Securities Act. Yes ☒ No ☐ | |
| | | | | | |
Indicate by check mark if the registrant is not required to file reports pursuant to Section 13 or Section 15(d) of the Act. |
| Yes | ☐ | | No | ☒ | |
| | | | | | |
Indicate by check mark whether the registrant (1) has filed all reports required to be filed by Section 13 or 15(d) of the Securities Exchange Act of 1934 during the preceding 12 months (or for such shorter period that the registrant was required to file such reports), and (2) has been subject to such filing requirements for the past 90 days. |
| Yes | ☒ | | No | ☐ | |
| | | | | | |
Indicate by check mark whether the registrant has submitted electronically every Interactive Data File required to be submitted pursuant to Rule 405 of Regulation S-T (§ 232.405 of this chapter) during the preceding 12 months (or for such shorter period that the registrant was required to submit such files). |
| Yes | ☒ | | No | ☐ | |
Indicate by check mark if the registrant is not required to file reports pursuant to Section 13 or Section 15(d) of the Act. Yes ☐ No ☒
Indicate by check mark whether the registrant (1) has filed all reports required to be filed by Section 13 or 15(d) of the Securities Exchange Act of 1934 during the preceding 12 months (or for such shorter period that the registrant was required to file such reports), and (2) has been subject to such filing requirements for the past 90 days. Yes ☒ No ☐
Indicate by check mark whether the registrant has submitted electronically every Interactive Data File required to be submitted pursuant to Rule 405 of Regulation S-T (§ 232.405 of this chapter) during the preceding 12 months (or for such shorter period that the registrant was required to submit such files). Yes ☒ No ☐
Indicate by check mark whether the registrant is a large accelerated filer, an accelerated filer, a non-accelerated filer, smaller reporting company, or an emerging growth company. See the definitions of “large accelerated filer,” “accelerated filer,” “smaller reporting company,” and “emerging growth company” in Rule 12b-2 of the Exchange Act.
| | | | | | | | | | | | | | | | | | | | |
| Large accelerated filer | ☒ | | Accelerated filer | ☐ | |
| | | | | | |
| Large accelerated filer | ☒ | | Accelerated filer | ☐ | |
| | | | | | |
| Non-accelerated filer | ☐ | | Smaller reporting company | ☐ | |
| | | | | | |
| | | | Emerging growth company | ☐ | |
If an emerging growth company, indicate by check mark if the registrantRegistrant has elected not to use the extended transition period for complying with any new or revised financial accounting standards provided pursuant to Section 13(a) of the Exchange Act. ☐
o
Indicate by check mark whether the registrant has filed a report on and attestation to its management’s assessment of the effectiveness of its internal control over financial reporting under Section 404(b) of the Sarbanes-Oxley Act (15 U.S.C.7262(b)) by the registered public accounting firm that prepared or issued its audit report. ☒
Indicate by check mark whether the registrant is a shell company (as defined in Rule 12b-2 of the Exchange Act). Yes ☐ No ☒
The aggregate market value of the voting common equity held by non-affiliates of the registrant on the last business day of the registrant’s most recently completed second fiscal quarter, June 30, 2020, was $3,528,768,075
|
| | | | | | | | | | |
Indicate by check mark whether the registrant is a shell company (as defined in Rule 12b-2 of the Exchange Act). |
| Yes | ☐ | | | No | ☒ | | |
| | | | | | | | |
The aggregate market value of the voting common equity held by non-affiliates of the registrant on the last business day of the registrant’s |
most recently completed second fiscal quarter, June 30, 2019, was | $4,727,278,183 | |
|
| | | | | | | | |
|
| | | | |
| Indicate the number of shares outstanding of each of the registrant’s classes of common stock, as of the latest practicable date. |
| Class | Outstanding at January 31, 20202021 | |
| Common stock, $1.00 par value | 61,475,40362,794,490 |
| shares | |
Documents Incorporated by Reference
Portions of the registrant’s Definitive Proxy Statement being prepared for the solicitation of proxies in connection with the 20202021 Annual Meeting of Stockholders to be held on April 28, 2020,27, 2021, are incorporated by reference in Part III of this Form 10-K.
TABLE OF CONTENTS
GLOSSARY OF TERMS AND ABBREVIATIONS
The following terms and abbreviations appear in the text of this report and have the definitions described below:
|
| | | | |
| AC | Alternating Current |
| AFUDC | Allowance for Funds Used During Construction |
| AOCI | Accumulated Other Comprehensive Income (Loss) |
| Aquila Transaction | Our July 14, 2008 acquisition of five utilities from Aquila, Inc. |
| APSC | Arkansas Public Service Commission |
| Arkansas Gas | Black Hills Energy Arkansas, Inc., an indirect, wholly-owned subsidiary of Black Hills Utility Holdings, providing natural gas services to customers in Arkansas (doing business as Black Hills Energy). |
| ARO | Asset Retirement Obligations |
| ASC | Accounting Standards Codification |
| ASU | Accounting Standards Update as issued by the FASB |
| ATM | At-the-market equity offering program |
| Availability | The availability factor of a power plant is the percentage of the time that it is available to provide energy. |
Basin ElectricBHC | Basin Electric Power Cooperative |
BHC | Black Hills Corporation; the Company |
| BHSC | Black Hills Service Company, LLC, a direct, wholly-owned subsidiary of Black Hills Corporation (doing business as Black Hills Energy) |
| Black Hills Colorado IPP | Black Hills Colorado IPP, LLC, a 50.1% owned subsidiary of Black Hills Electric Generation |
| Black Hills Electric Generation | Black Hills Electric Generation, LLC, a direct, wholly-owned subsidiary of Black Hills Non-regulated Holdings, providing wholesale electric capacity and energy primarily to our affiliate utilities. |
| Black Hills Energy | The name used to conduct the business of our utility companies |
| Black Hills Energy Services | Black Hills Energy Services Company, an indirect, wholly-owned subsidiary of Black Hills Utility Holdings, providing natural gas commodity supply for the Choice Gas Programs (doing business as Black Hills Energy). |
| Black Hills Non-regulated Holdings | Black Hills Non-regulated Holdings, LLC, a direct, wholly-owned subsidiary of Black Hills Corporation |
| Black Hills Utility Holdings | Black Hills Utility Holdings, Inc., a direct, wholly-owned subsidiary of Black Hills Corporation (doing business as Black Hills Energy) |
| Black Hills Wyoming | Black Hills Wyoming, LLC, a direct, wholly-owned subsidiary of Black Hills Electric Generation |
| BLM | United States Bureau of Land Management |
| Btu | British thermal unit |
| Busch Ranch I | The 29 MW wind farm near Pueblo, Colorado, jointly owned by Colorado Electric and Black Hills Electric Generation. Colorado Electric and Black Hills Electric Generation each have a 50% ownership interest in the wind farm. |
| Busch Ranch II | The 60 MW wind farm near Pueblo, Colorado owned by Black Hills Electric Generation to provide wind energy to Colorado Electric through a power purchase agreement expiring in November 2044.
|
CAPPCARES Act | Customer Appliance Protection Plan,Coronavirus Aid, Relief, and Economic Security Act, signed on March 27, 2020, which provides appliance repair servicesis a tax and spending package intended to residential natural gas customers through on-going monthly service agreements. The consolidationprovide additional economic relief and address the impact of the existing Service Guard and CAPP plans into the revamped Service Guard Comfort Plan is currently underway across our service territories.COVID-19 pandemic. |
| CFTC | United States Commodity Futures Trading Commission |
| Cheyenne Prairie | 132 MW natural-gas fired generating facility jointly owned byCheyenne Prairie Generating Station serves the utility customers of South Dakota Electric and Wyoming Electric. The facility includes one simple-cycle, 37 MW combustion turbine that is wholly-owned by Wyoming Electric in Cheyenne, Wyoming. Cheyenne Prairie was placed into commercial service on October 1, 2014.and one combined-cycle, 95 MW unit that is jointly-owned by Wyoming Electric (40 MW) and South Dakota Electric (55 MW). |
| Chief Operating Decision Maker (CODM) | Chief Executive Officer |
| Choice Gas Program | Regulator approved programs in Wyoming and Nebraska that allow certain utility customers to select their natural gas commodity supplier, providing the unbundling of the commodity service from the distribution delivery service. |
CityCIAC | Contribution in Aid of Gillette | Gillette, WyomingConstruction |
| City of Cheyenne | Cheyenne, Wyoming |
|
| | | | |
| City of Colorado Springs | Colorado Springs, Colorado |
| City of Gillette | Gillette, Wyoming |
| Colorado Electric | Black Hills Colorado Electric, LLC, a direct, wholly-owned subsidiary of Black Hills Utility Holdings, providing electric service to customers in Colorado (doing business as Black Hills Energy). |
| Colorado Gas | Black Hills Colorado Gas, Inc., an indirect, wholly-owned subsidiary of Black Hills Utility Holdings, providing natural gas services to customers in Colorado (doing business as Black Hills Energy). |
| Common Use System (CUS) | The Common Use System is a jointjointly operated transmission system we participate in with Basin Electric Power Cooperative and Powder River Energy Corporation. The Common Use System provides transmission service over these utilities' combined 230-kilovolt (kV) and limited 69-kV transmission facilities within areas of southwestern South Dakota and northeastern Wyoming. |
| Consolidated Indebtedness to Capitalization Ratio | Any Indebtedness outstanding at such time, divided by capital at such time. Capital being consolidated net-worth (excluding noncontrolling interest) plus consolidated indebtedness (including letters of credit and certain guarantees issued) as defined within the current Revolving Credit Facility. |
| Cooling Degree Day (CDD) | A cooling degree day is equivalent to each degree that the average of the high and low temperature for a day is above 65 degrees. The warmer the climate, the greater the number of cooling degree days. Cooling degree days are used in the utility industry to measure the relative warmth of weather and to compare relative temperatures between one geographic area and another. Normal degree days are based on the National Weather Service data for selected locations. |
| Corriedale | Wind project near Cheyenne, Wyoming, that will be aThe 52.5 MW wind farm near Cheyenne, Wyoming, jointly owned by South Dakota Electric and Wyoming Electric, and will serveserving as the dedicated wind energy supply to the Renewable Ready program. |
CPCNCOVID-19 | The official name for the 2019 novel coronavirus disease announced on February 11, 2020, by the World Health Organization, that is causing a global pandemic. |
| CPCN | Certificate of Public Convenience and Necessity |
| CPP | Clean Power Plan |
| CP Program | Commercial Paper Program |
| CPUC | Colorado Public Utilities Commission |
| CT | Combustion turbineTurbine |
| CTII | The 40 MW Gillette CT, a simple-cycle, gas-fired combustion turbine owned by the City of Gillette. |
| Cushion Gas | The portion of natural gas necessary to force saleable gas from a storage field into the transmission system and for system balancing, representing a permanent investment necessary to use storage facilities and maintain reliability. |
| CVA | Credit Valuation Adjustment |
| DC | Direct currentCurrent |
| Dividend payout ratio | Annual dividends paid on common stock divided by net income from continuing operations available for common stock |
Dodd-FrankDRSPP | Dodd-Frank Wall Street Reform and Consumer Protection Act |
DSM | Demand Side Management |
DRSPP | Dividend Reinvestment and Stock Purchase Plan |
DthDSM | Demand Side Management |
| Dth | Dekatherm. A unit of energy equal to 10 therms or one million British thermal units (MMBtu). |
| EBITDA | Earnings before interest, taxes, depreciation and amortization, a non-GAAP measurement |
| ECA | Energy Cost Adjustment -- adjustmentsis an adjustment that allowallows us to pass the prudently-incurred cost of fuel and purchased energy through to customers. |
| Economy Energy | Purchased energy that costs less than that produced with the utilities’ owned generation. |
EIAEECR | Energy Efficiency Cost Recovery is an adjustment mechanism that allows us to recover from customers the costs associated with providing energy efficiency programs. |
| EIA | Environmental Improvement Adjustment --is an annual adjustment mechanism that allows us to recover from customers eligible investments in, and expense related to, new environmental measures. |
| EPA | United States Environmental Protection Agency |
| | | | | |
| Equity Unit | Each Equity Unit hashad a stated amount of $50, consisting of a purchase contract issued by BHC to purchase shares of BHC common stock and a 1/20, or 5% undivided beneficial ownership interest in $1,000 principal amount of BHC RSNs due 2028.remarketable junior subordinated notes issued on November 23, 2015 and retired on August 17, 2018. On November 1, 2018, we completed settlement of the stock purchase contracts that are components of the Equity Units issued in November 2015. |
| EWG | Exempt Wholesale Generator |
| FASB | Financial Accounting Standards Board |
|
| |
FDICFERC | Federal Deposit Insurance Corporation |
FERC | United States Federal Energy Regulatory Commission |
| Fitch | Fitch Ratings Inc. |
| GAAP | Accounting principles generally accepted in the United States of America |
| GCA | Gas Cost Adjustment -- adjustmentsis an adjustment that allowallows us to pass the prudently-incurred cost of gas and certain services through to customers. |
| GHG | Greenhouse gases |
| Global Settlement | Settlement with a utilitiesutility’s commission where the revenue requirement is agreed upon, but the specific adjustments used by each party to arrive at the amount are not specified in public rate orders. |
| Happy Jack | Happy Jack Wind Farm, LLC, owned by Duke Energy Generation Services |
| Heating Degree Day (HDD) | A heating degree day is equivalent to each degree that the average of the high and the low temperatures for a day is below 65 degrees. The colder the climate, the greater the number of heating degree days. Heating degree days are used in the utility industry to measure the relative coldness of weather and to compare relative temperatures between one geographic area and another. Normal degree days are based on the National Weather Service data for selected locations. |
| HomeServe | We offer HomeServe products to our natural gas residential customers interested in purchasing additional home repair service plans. |
| ICFR | Internal Controls Over Financial Reporting |
| Iowa Gas | Black Hills Iowa Gas Utility Company, LLC, a direct, wholly-owned subsidiary of Black Hills Utility Holdings, providing natural gas services to customers in Iowa (doing business as Black Hills Energy). |
| IPP | Independent power producerPower Producer |
IRSIRC | Internal Revenue Code |
| IRS | United States Internal Revenue Service |
| ITC | Investment tax creditTax Credit |
| |
| Kansas Gas | Black Hills Kansas Gas Utility Company, LLC, a direct, wholly-owned subsidiary of Black Hills Utility Holdings, providing natural gas services to customers in Kansas (doing business as Black Hills Energy). |
kV | Kilovolt |
LIBORkV | Kilovolt |
| LIBOR | London Interbank Offered Rate |
| Mcf | Thousand cubic feet |
| Mcfd | Thousand cubic feet per day |
| MDU | Montana-Dakota Utilities Co., a subsidiary of MDU Resources Group, Inc. |
| MEAN | Municipal Energy Agency of Nebraska |
| MISO | Midcontinent Independent System Operator, Inc. |
| MMBtu | Million British thermal units |
| Moody’s | Moody’s Investors Service, Inc. |
| MSHA | Mine Safety and Health Administration |
| MTPSC | Montana Public Service Commission |
| MW | Megawatts |
| MWh | Megawatt-hours |
| N/A | Not Applicable |
| NAV | Net Asset Value |
| Nebraska Gas | Black Hills Nebraska Gas, LLC, an indirect, wholly-owned subsidiary of Black Hills Utility Holdings, providing natural gas services to customers in Nebraska (doing business as Black Hills Energy). |
NERCNeil Simpson II | A mine-mouth, coal-fired power plant owned and operated by South Dakota Electric with a total capacity of 90 MW located at our Gillette, Wyoming energy complex. |
| | | | | |
| NERC | North American Electric Reliability Corporation |
NOx | Nitrogen oxide |
| NOL | Net operating lossOperating Loss |
| NPSC | Nebraska Public Service Commission |
| NYSE | New York Stock Exchange |
OPEBOCI | Other Comprehensive Income |
| OPEB | Other Post-Employment Benefits |
| OSHA | Occupational Safety & Health Administration |
| OSM | United States Department of the Interior’s Office of Surface Mining |
|
| PacifiCorp | |
PacifiCorp | PacifiCorp, a wholly owned subsidiary of MidAmerican Energy Holdings Company, itself an affiliate of Berkshire Hathaway. |
| PCA | Power Cost Adjustment --is an annual adjustment mechanism that allows us to pass a portion of prudently-incurred delivered power costs, including fuel, purchased capacity and energy, and transmission costs, through to customers. |
| PCCA | Power Capacity Cost Adjustment --is an annual adjustment that allows us to pass the prudently-incurred purchased capacity costs, incremental to costs included in base rates, through to customers. |
| Peak View | The 60 MW wind generating projectfarm owned by Colorado Electric, placed in service on November 7, 2016 and adjacent to Busch Ranch I.Electric. |
| PPA | Power Purchase Agreement |
| PRPA | Platte River Power Authority |
| PSA | Power Sales Agreement |
PSCo | Public Service Company of Colorado |
| Pueblo Airport Generation | The 420 MW combined cycle gas-fired power generation plants jointly owned by Colorado Electric (220 MW) and Black Hills Colorado IPP (200 MW). Black Hills Colorado IPP owns and operates this facility. The plants commenced operation on January 1, 2012. |
| PTC | Production tax creditTax Credit |
| PUHCA 2005 | Public Utility Holding Company Act of 2005 |
| Ready | The Company’s branding platform which emphasizes that we will 1) prioritize our customers; 2) act as a thoughtful, responsible leader; 3) listen first and lead with a focus on relationships; and 4) be creative in our approach to solutions. |
| Renewable Advantage | The 200 MW solar facility project to be constructed in Pueblo County, Colorado. The project aims to lower customer energy costs and provide economic and environmental benefits to Colorado Electric’s customers and communities. This project, which was approved by the CPUC in September 2020, will be owned by a third-party renewable energy developer with Colorado Electric purchasing all of the energy generated at the facility under the terms of a 15-year PPA. The project is expected to be placed in service in 2023. |
| Renewable Ready | Voluntary renewable energy subscription program for large commercial, industrial and governmental agency customers in South Dakota and Wyoming. |
| RESA | Renewable Energy Standard Adjustment is an incremental retail rate limited to 2% for Colorado Electric customers that provides funding for renewable energy projects and programs to comply with Colorado’s Renewable Energy Standard. |
| Revolving Credit Facility | Our $750 million credit facility used to fund working capital needs, letters of credit and other corporate purposes, which was amended and restated on July 30, 2018, and now terminates on July 30, 2023. |
Renewable ReadyRMNG | Voluntary renewable energy subscription program for large commercial, industrial and governmental agency customers. The Corriedale wind project will provide 52.5 MW of energy for Renewable Ready subscribers in Wyoming and western South Dakota. |
RMNG | Rocky Mountain Natural Gas LLC, an indirect, wholly-owned subsidiary of Black Hills Utility Holdings, providing natural gas transmission and wholesale services in western Colorado (doing business as Black Hills Energy). |
RSNs | Remarketable junior subordinated notes, issued on November 23, 2015 and retired on August 17, 2018. |
SCADASDPUC | Supervisory control and data acquisition
|
SDPUC | South Dakota Public Utilities Commission |
| SEC | United States Securities and Exchange Commission |
| Service Guard Comfort Plan | HomeAppliance protection plan that provides home appliance repair product offering for both natural gas and electric residential customersservices through on-going monthly service agreements. The consolidation of the existing Service Guard and CAPP plans into the revamped Service Guard Comfort Plan is currently underway across our service territories.agreements to residential utility customers. |
Service Guard Comfort Plan | New plan that will consolidate Service Guard and CAPP and provide similar services. |
| Silver Sage | Silver Sage Windpower, LLC, owned by Duke Energy Generation Services |
SO2 | Sulfur dioxide |
| S&P | Standard & Poor’s, a division of The McGraw-Hill Companies, Inc. |
| SPP | Southwest Power Pool, Inc. which oversees the bulk electric grid and wholesale power market in the central United States |
| | | | | |
| SourceGas Transaction | On February 12, 2016, Black Hills Utility Holdings acquired SourceGas pursuant to a purchase and sale agreement executed on July 12, 2015 for approximately $1.89 billion, which included the assumption of $760 million in debt at closing. |
| South Dakota Electric | Black Hills Power, Inc., a direct, wholly-owned subsidiary of Black Hills Corporation, providing electric service to customers in Montana, South Dakota and Wyoming (doing business as Black Hills Energy). |
| SSIR | System Safety and Integrity Rider |
| System Peak Demand | Represents the highest point of retail customer usage for a single hour. |
| TCA | Transmission Cost Adjustment --is an annual adjustment mechanism that allows us to recover from customers eligible transmission investments prior to the next rate review. |
| TCJA | Tax Cuts and Jobs Act enacted on December 22, 2017 |
|
| |
| Tech Services | Non-regulated product lines within Black Hills Corporationdelivered by our Utilities that 1) provide electrical system construction services to large industrial customers of our electric utilities, and 2) serve gas transportation customers throughout its service territory by constructing and maintaining customer-ownercustomer-owned gas infrastructure facilities, typically through one-time contracts. |
TFATop of Iowa | Northern Iowa Windpower, LLC, a 80 MW wind farm located near Joice, Iowa, owned by Black Hills Electric Generation and operated by a third-party. We sell the wind energy generated in the MISO market. |
| TFA | Transmission Facility Adjustment --is an annual adjustment mechanism that allows us to recover charges for qualifying new and modified transmission facilities from customers. |
VEBATransmission Tie | South Dakota Electric owns 35% of a DC transmission tie that interconnects the Western and Eastern transmission grids, which are independently-operated transmission grids serving the western and eastern United States, respectively. Basin Electric Power Cooperative owns the remaining ownership percentage. This transmission tie allows us to buy and sell energy in the Eastern grid without having to isolate and physically reconnect load or generation between the two transmission grids, thus enhancing the reliability of our system. It accommodates scheduling transactions in both directions simultaneously, provides additional opportunities to sell excess generation or to make economic purchases to serve our native load and contract obligations, and enables us to take advantage of power price differentials between the two grids. The total transfer capacity of the tie is 400 MW, including 200 MW from West to East and 200 MW from East to West. |
| Utilities | Black Hills’ Electric and Gas Utilities |
| VEBA | Voluntary Employee Benefit Association |
| VIE | Variable Interest Entity |
WDEQWECC | Wyoming Department of Environmental Quality |
WECC | Western Electricity Coordinating Council |
| Wind Capacity Factor | Measures the amount of electricity a wind turbine produces in a given time period relative to its maximum potential |
| Working Capacity | Total gas storage capacity minus cushion gas |
| WPSC | Wyoming Public Service Commission |
| WRDC | Wyodak Resources Development Corp., a direct, wholly-owned subsidiary of Black Hills Non-regulated Holdings, providing coal supply primarily to five on-site, mine-mouth generating facilities (doing business as Black Hills Energy). |
| Wygen I | A mine-mouth, coal-fired generating facility with a total capacity of 90 MW located at our Gillette, Wyoming energy complex. Black Hills Wyoming owns 76.5% of the facility and Municipal Energy Agency of Nebraska (MEAN) owns the remaining 23.5%. |
| Wygen II | A mine-mouth, coal-fired power plant owned by Wyoming Electric with a total capacity of 95 MW located at our Gillette, Wyoming energy complex. |
| Wygen III | A mine-mouth, coal-fired power plant operated by South Dakota Electric with a total capacity of 110 MW located at our Gillette, Wyoming energy complex. South Dakota Electric owns 52% of the power plant, MDU owns 25% and the City of Gillette owns the remaining 23%. |
| Wyodak Plant | The 362 MW mine-mouth, coal-fired generating facility near Gillette, Wyoming, jointly owned by PacifiCorp (80%) and South Dakota Electric (20%). Our WRDC mine supplies all of the fuel for the facility. |
| Wyoming Electric | Cheyenne Light, Fuel and Power Company, a direct, wholly-owned subsidiary of Black Hills Corporation, providing electric service to customers in the Cheyenne, Wyoming area (doing business as Black Hills Energy). |
| Wyoming Gas | Black Hills Wyoming Gas, LLC, an indirect, wholly-owned subsidiary of Black Hills Utility Holdings, providing natural gas services to customers in Wyoming (doing business as Black Hills Energy). |
Website Access to Reports
The reports we file with the SEC are available free of charge at our website www.blackhillscorp.com as soon as reasonably practicable after they are filed. In addition, the charters of our Audit, Governance and Compensation Committees are located on our website along with our Code of Business Conduct, Code of Ethics for our Chief Executive Officer and Senior Finance Officers, Corporate Governance Guidelines of the Board of Directors and Policy for Director Independence. The information contained on our website is not part of this document.
Forward-Looking Information
This Form 10-K contains forward-looking statements as defined by the SEC. Forward-looking statements are all statements other than statements of historical fact, including, without limitation, those statements that are identified by the words “anticipates,” “estimates,” “expects,” “intends,” “plans,” “predicts” and similar expressions and include statements concerning plans, objectives, goals, strategies, future events or performance, and underlying assumptions and other statements that are other than statements of historical facts. From time to time, the Company may publish or otherwise make available forward-looking statements of this nature, including statements contained within Item 7 - Management’s Discussion & Analysis of Financial Condition and Results of Operations.
Forward-looking statements involve risks and uncertainties, which could cause actual results or outcomes to differ materially from those expressed. The Company’s expectations, beliefs and projections are expressed in good faith and are believed by the Company to have a reasonable basis, including, without limitation, management’s examination of historical operating trends, data contained in the Company’s records and other data available from third parties. Nonetheless, the Company’s expectations, beliefs or projections may not be achieved or accomplished.
Any forward-looking statement contained in this document speaks only as of the date on which the statement is made and the Company undertakes no obligation to update any forward-looking statement or statements to reflect events or circumstances that occur after the date on which the statement is made or to reflect the occurrence of unanticipated events. New factors emerge from time to time, such as the COVID-19 pandemic, and it is not possible for management to predict all of the factors, nor can it assess the effect of each factor on the Company’s business or the extent to which any factor, or combination of factors, may cause actual results to differ materially from those contained in any forward-looking statement. All forward-looking statements, whether written or oral and whether made by or on behalf of the Company, are expressly qualified by the risk factors and cautionary statements in this Form 10-K, including statements contained within Item 1A - Risk Factors.
PART I
| |
ITEMS 1 AND 2. | BUSINESS AND PROPERTIES |
ITEMS 1 AND 2.BUSINESS AND PROPERTIES
History and Organization
Black Hills Corporation, a South Dakota corporation (together with its subsidiaries, referred to herein as the “Company,” “we,” “us” or “our”), is a customer-focused, growth-oriented utility company headquartered in Rapid City, South Dakota. Our predecessor company, Black Hills Power and Light Company, was incorporated and began providing electric utility serviceDakota (incorporated in 1941. It was formed through the purchase and combination of several existing electric utilities and related assets, some of which had served customersSouth Dakota in the Black Hills region since 1883. In 1956, with the purchase of the WRDC mine, we began producing and selling energy through non-regulated businesses.1941).
We operate our business in the United States, reporting our operating results through our regulated Electric Utilities, regulated Gas Utilities, Power Generation and Mining segments. Certain unallocated corporate expenses that support our operating segments are presented as Corporate and Other.
Our Electric Utilities segment generates, transmits and distributes electricity to approximately 214,000216,000 electric utility customers in Colorado, Montana, South Dakota and Wyoming. Our Electric Utilities own 939992 MW of generation and 8,892 miles of electric transmission and distribution lines.
Our Gas Utilities segment serves approximately 1,066,0001,083,000 natural gas utility customers in Arkansas, Colorado, Iowa, Kansas, Nebraska, and Wyoming. Our Gas Utilities own and operate approximately 4,7754,774 miles of intrastate gas transmission pipelines and 41,21041,838 miles of gas distribution mains and service lines, seven natural gas storage sites, nearly 49,000 horsepower of compression and over 500560 miles of gathering lines.
Our Power Generation segment produces electric power from its wind, natural gas and coal-fired generating plants and sells the electric capacity and energy primarily to our utilities under long-term contracts. Our Mining segment produces coal at our mine near Gillette, Wyoming, and sells and delivers it primarily under long-term contracts to adjacent mine-mouth electric generation facilities owned by our Electric Utilities and Power Generation businesses.
Electric Utilities Segment
We conduct electric utility operations through our Colorado, South Dakota and Wyoming subsidiaries. Our electric generating facilities and power purchase agreements provide for the supply of electricity principally to our distribution systems.retail customers. Additionally, we sell excess power to other utilities and marketing companies, including our affiliates. We also provide non-regulated services through ourunder the Service Guard Comfort Plan and Tech Services product lines.Services.
| | | | | | | | | | | |
| As of December 31, |
| Customers at End of Year | 2020 | 2019 | 2018 |
| Residential | 184,872 | | 183,232 | | 181,459 | |
| Commercial | 30,225 | | 29,921 | | 29,299 | |
| Industrial | 83 | | 83 | | 84 | |
| Other | 1,017 | | 1,024 | | 1,030 | |
| Total Electric Customers at End of Year | 216,197 | | 214,260 | | 211,872 | |
| | | | | | | | | | | |
| As of December 31, |
| Customers at End of Year | 2020 | 2019 | 2018 |
| Colorado Electric | 98,735 | | 97,890 | | 96,645 | |
| South Dakota Electric | 73,700 | | 73,052 | | 72,533 | |
| Wyoming Electric | 43,762 | | 43,318 | | 42,694 | |
| Total Electric Customers at End of Year | 216,197 | | 214,260 | | 211,872 | |
Capacity and Demand. System peak demand for the Electric Utilities’ retail customers for each of the last three years are listed below:
| | | | | | | | | | | | | | | | | | | | | | | | | | |
| System Peak Demand (in MW) |
| 2020 | | 2019 | | 2018 |
| Summer | Winter | | Summer | Winter | | Summer | Winter |
| Colorado Electric | 401 | 297 | | 422 | 297 | | 413 | 313 |
| South Dakota Electric | 378 | 304 | | 335 | 320 | | 355 | 314 |
| Wyoming Electric | 271 | 246 | | 265 | 247 | | 254 | 238 |
|
| | | | | | | | |
| | System Peak Demand (in MW) |
| | 2019 | | 2018 | | 2017 |
| | Summer | Winter | | Summer | Winter | | Summer | Winter |
Colorado Electric (a) | 422 | 297 | | 413 | 313 | | 398 | 299 |
| South Dakota Electric | 335 | 320 |
| 355 | 314 |
| 370 | 310 |
Wyoming Electric (b) | 265 | 247 | | 254 | 238 | | 249 | 230 |
________________________
| |
(a) | The Colorado Electric July 2019 summer peak load of 422 surpassed previous summer peak record load of 413 set in June 2018. The October 2018 winter peak load of 313 surpassed previous winter peak load of 310 set in February 2011. |
| |
(b) | The Wyoming Electric July 2019 summer peak load of 265 surpassed previous summer peak record load of 254 set in July 2018. The December 2019 winter peak load of 247 surpassed the previous winter peak record load of 238 set in December 2018. |
Regulated Power Plants. As of December 31, 2019,2020, our Electric Utilities’ ownership interests in electric generating plants were as follows:
| | | Unit | Fuel Type | Location | Ownership Interest % | Owned Capacity (MW) | In Service Date | Unit | Fuel
Type | Location | Ownership Interest % (d) | Owned Capacity (MW) | In Service Date |
| Colorado Electric: | | Colorado Electric: | |
Busch Ranch I (a) | Wind | Pueblo, Colorado | 50% | 14.5 | 2012 | Busch Ranch I (a) | Wind | Pueblo, Colorado | 50% | 14.5 | 2012 |
Peak View (b) | Wind | Pueblo, Colorado | 100% | 60.0 | 2016 | Peak View (b) | Wind | Pueblo, Colorado | 100% | 60.0 | 2016 |
| Pueblo Airport Generation | Gas | Pueblo, Colorado | 100% | 180.0 | 2011 | Pueblo Airport Generation | Gas | Pueblo, Colorado | 100% | 180.0 | 2011 |
| Pueblo Airport Generation CT | Gas | Pueblo, Colorado | 100% | 40.0 | 2016 | Pueblo Airport Generation CT | Gas | Pueblo, Colorado | 100% | 40.0 | 2016 |
| AIP Diesel | Oil | Pueblo, Colorado | 100% | 10.0 | 2001 | AIP Diesel | Oil | Pueblo, Colorado | 100% | 10.0 | 2001 |
| Diesel #1 and #3-5 | Oil | Pueblo, Colorado | 100% | 8.0 | 1964 | Diesel #1 and #3-5 | Oil | Pueblo, Colorado | 100% | 8.0 | 1964 |
| Diesel #1-5 | Oil | Rocky Ford, Colorado | 100% | 10.0 | 1964 | Diesel #1-5 | Oil | Rocky Ford, Colorado | 100% | 10.0 | 1964 |
| South Dakota Electric: | | South Dakota Electric: | |
Cheyenne Prairie (c) | Gas | Cheyenne, Wyoming | 58% | 55.0 | 2014 | |
| Cheyenne Prairie | | Cheyenne Prairie | Gas | Cheyenne, Wyoming | 58% | 55.0 | 2014 |
Corriedale (c) | | Corriedale (c) | Wind | Cheyenne, Wyoming | 62% | 32.5 | 2020 |
Wygen III (d) | Coal | Gillette, Wyoming | 52% | 57.2 | 2010 | Coal | Gillette, Wyoming | 52% | 57.2 | 2010 |
| Neil Simpson II | Coal | Gillette, Wyoming | 100% | 90.0 | 1995 | Neil Simpson II | Coal | Gillette, Wyoming | 100% | 90.0 | 1995 |
Wyodak Plant (e) | Coal | Gillette, Wyoming | 20% | 72.4 | 1978 | Coal | Gillette, Wyoming | 20% | 72.4 | 1978 |
| Neil Simpson CT | Gas | Gillette, Wyoming | 100% | 40.0 | 2000 | Neil Simpson CT | Gas | Gillette, Wyoming | 100% | 40.0 | 2000 |
| Lange CT | Gas | Rapid City, South Dakota | 100% | 40.0 | 2002 | Lange CT | Gas | Rapid City, South Dakota | 100% | 40.0 | 2002 |
| Ben French Diesel #1-5 | Oil | Rapid City, South Dakota | 100% | 10.0 | 1965 | Ben French Diesel #1-5 | Oil | Rapid City, South Dakota | 100% | 10.0 | 1965 |
| Ben French CTs #1-4 | Gas/Oil | Rapid City, South Dakota | 100% | 80.0 | 1977-1979 | Ben French CTs #1-4 | Gas/Oil | Rapid City, South Dakota | 100% | 80.0 | 1977-1979 |
| Wyoming Electric: | | Wyoming Electric: | |
Cheyenne Prairie (c) | Gas | Cheyenne, Wyoming | 42% | 40.0 | 2014 | |
| Cheyenne Prairie | | Cheyenne Prairie | Gas | Cheyenne, Wyoming | 42% | 40.0 | 2014 |
Cheyenne Prairie CT (c) | Gas | Cheyenne, Wyoming | 100% | 37.0 | 2014 | Gas | Cheyenne, Wyoming | 100% | 37.0 | 2014 |
Corriedale (c) | | Corriedale (c) | Wind | Cheyenne, Wyoming | 38% | 20.0 | 2020 |
| Wygen II | Coal | Gillette, Wyoming | 100% | 95.0 | 2008 | Wygen II | Coal | Gillette, Wyoming | 100% | 95.0 | 2008 |
| Total MW Capacity | | 939.1 | | Total MW Capacity | | 991.6 | |
________________________
| |
(a) | (a) In 2013, Busch Ranch I is operated by Colorado Electric. In 2013, the facility was awarded a one-time cash grant in lieu of ITCs under the Section 1603 program created under the American Recovery and Reinvestment Act. Black Hills Electric Generation owns the remaining 50% interest in the wind farm. Colorado Electric has a PPA with Black Hills Electric Generation for its share of power from the wind farm. |
| |
(b) | The Peak View facility qualifies for PTCs at $25/MWh under IRC 45 during the 10-year period beginning on the date the facility was originally placed in service. The PTCs for this facility flow back to customers through a rider mechanism as a reduction to Colorado Electric’s margins. Peak View was placed in service in November 2016. |
| |
(c) | Cheyenne Prairie serves the utility customers of South Dakota Electric and Wyoming Electric. The facility includes one simple-cycle, 37 MW combustion turbine that is wholly-owned by Wyoming Electric and one combined-cycle, 95 MW unit that is jointly-owned by Wyoming Electric (40 MW) and South Dakota Electric (55 MW). |
| |
(d) | Wygen III, a 110 MW mine-mouth coal-fired power plant, is operated by South Dakota Electric. South Dakota Electric owns 52% of the power plant, MDU owns 25% and the City of Gillette owns the remaining 23% interest. Our adjacent WRDC mine supplies all of the fuel for the plant. |
| |
(e) | Wyodak Plant, a 362 MW mine-mouth coal-fired power plant, is owned 80% by PacifiCorp and 20% by South Dakota Electric. This baseload plant is operated by PacifiCorp and our WRDC mine supplies all of the fuel for the plant. |
The Electric Utilities’ annual weighted average cost of fuel utilized to generate electricity and the average price paid for purchased power (excluding contracted capacity) per MWh for the years ended December 31 was as follows:
|
| | | | | | | | | |
| Fuel Source (dollars per MWh) | 2019 | 2018 | 2017 |
| Coal | $ | 11.46 |
| $ | 11.10 |
| $ | 10.95 |
|
| | | | |
| Natural Gas | $ | 25.92 |
| $ | 33.42 |
| $ | 34.05 |
|
| | | | |
Diesel Oil (a) | $ | 209.86 |
| $ | 329.27 |
| $ | 210.11 |
|
| | | | |
| Total Weighted Average Fuel Cost | $ | 13.86 |
| $ | 13.53 |
| $ | 12.80 |
|
| | | | |
| Purchased Power - Coal, Gas and Oil | $ | 43.73 |
| $ | 45.62 |
| $ | 45.63 |
|
| | | | |
| Purchased Power - Renewable Sources | $ | 48.61 |
| $ | 54.31 |
| $ | 53.08 |
|
______________
| |
(a) | Included in the Price per MWh for Diesel Oil are unit start-up costs. The diesel-fueled generating units are generally used as supplemental peaking units and the cost per MWh is reflective of how often the units are started and how long the units are run. |
Our Electric Utilities’ power supply by resource as a percent of the total power supply for our energy needs for the years ended December 31 was as follows:
| | | | | | | | | | | |
| Power Supply | 2020 | 2019 | 2018 |
| Coal | 32.7 | % | 30.1 | % | 32.1 | % |
Natural Gas and Diesel Oil (a) | 8.4 | | 8.2 | | 6.1 | |
| Wind | 3.8 | | 3.2 | | 3.4 | |
| Total Generated | 44.9 | | 41.5 | | 41.6 | |
| Coal, Natural Gas, Oil and Other Market Purchases | 43.3 | | 52.5 | | 52.4 | |
| Wind | 11.8 | | 6.0 | | 6.0 | |
| Total Purchased | 55.1 | | 58.5 | | 58.4 | |
| Total | 100.0 | % | 100.0 | % | 100.0 | % |
|
| | | | | | |
| Power Supply | 2019 | 2018 | 2017 |
| Coal | 30 | % | 32 | % | 32 | % |
| Gas, Oil and Wind | 12 |
| 10 |
| 8 |
|
| Total Generated | 42 |
| 42 |
| 40 |
|
Purchased (a) | 58 |
| 58 |
| 60 |
|
| Total | 100 | % | 100 | % | 100 | % |
______________(a) The diesel-fueled generating units are generally used as supplemental peaking units. Power generated from these units, as a percentage of total power supply, was 0.2%, 0.1% and 0.0% for the years ended December 31, 2020, 2019, and 2018, respectively.
| |
(a) | Wind represents approximately 6%, 6% and 6% of our purchased power in 2019, 2018, and 2017, respectively. |
Our Electric Utilities’ weighted average cost of fuel utilized to generate electricity and the average price paid for purchased power (excluding contracted capacity) per MWh for the years ended December 31 were as follows:
| | | | | | | | | | | |
| Fuel and Purchased Power (dollars per MWh) | 2020 | 2019 | 2018 |
| Coal | $ | 11.00 | | $ | 11.46 | | $ | 11.10 | |
| Natural Gas and Diesel Oil | 21.67 | | 28.26 | | 34.07 | |
| Total Generated Weighted Average Fuel Cost | 12.07 | | 13.86 | | 13.53 | |
| Coal, Natural Gas, Oil and Other Market Purchases | 44.61 | | 43.73 | | 45.62 | |
| Wind Purchases | 32.01 | | 48.61 | | 54.31 | |
| Total Purchased Power Weighted Average Cost | 41.91 | | 44.23 | | 46.51�� | |
| Total Weighted Average Fuel and Purchased Power Cost | $ | 28.52 | | $ | 31.62 | | $ | 32.79 | |
Power Purchase and Power Sales Agreements. We have executed various PPAs to support our Electric Utilities’ capacity and energy needs beyond our regulated power plants’ generation. Our Electric Utilities also have various long-term PSAs. Key contracts are disclosed in Note 193 of the Notes to the Consolidated Financial Statements in this Annual Report on Form 10-K.
Transmission and Distribution. Through our Electric Utilities, we own electric transmission and distribution systems composed of high voltage lines (greater than 69 kV) and low voltage lines (69 kV or less). We also jointly ownoperate an electric transmission system, referred to as the Common Use System, with Basin Electric Power Cooperative and Powder River Energy Corporation. Each participant in the Common Use System individually owns assets that are operated together for a single system. The Common Use System also provides transmission service to our Transmission Tie. South Dakota Electric owns 35% of the Transmission Tie. The Transmission Tie is further discussed in Note 6 of the Notes to Consolidated Financial Statements in this Annual Report on Form 10-K.
At December 31, 2019,2020, our Electric Utilities owned the electric transmission and distribution lines shown below:
| | | | | | | | | | | |
| Utility | State | Transmission (a) (in Line Miles) | Distribution
(in Line Miles) |
| Colorado Electric | Colorado | 572 | | 3,135 | |
| South Dakota Electric | South Dakota, Wyoming | 1,242 | | 2,565 | |
| Wyoming Electric | Wyoming | 58 | | 1,320 | |
| | 1,872 | | 7,020 | |
____________________
(a) Electric transmission line miles include voltages of 69 kV and above.
|
| | | | | |
| Utility | State | Transmission (in Line Miles) | Distribution (in Line Miles) |
| Colorado Electric | Colorado | 598 |
| 3,120 |
|
| South Dakota Electric | South Dakota, Wyoming | 1,219 |
| 2,557 |
|
South Dakota Electric - Jointly Owned (a) | South Dakota, Wyoming | 43 |
| — |
|
| Wyoming Electric | Wyoming | 49 |
| 1,306 |
|
| | | 1,909 |
| 6,983 |
|
__________________________
| |
(a) | South Dakota Electric owns 35% of a DC transmission tie that interconnects the Western and Eastern transmission grids, which are independently-operated transmission grids serving the western and eastern United States, respectively. This transmission tie allows us to buy and sell energy in the Eastern grid without having to isolate and physically reconnect load or generation between the two transmission grids, thus enhancing the reliability of our system. It accommodates scheduling transactions in both directions simultaneously, provides additional opportunities to sell excess generation or to make economic purchases to serve our native load and contract obligations, and enables us to take advantage of power price differentials between the two grids. See Material transmission services agreements are disclosed in Note 3Note 4 of the Notes to the Consolidated Financial Statements in this Annual Report on Form 10-K for additional information. |
Material contracts are disclosed in Note 19 of the Notes to the Consolidated Financial Statements in this Annual Report on Form 10-K. Additional contracts disclosed below are also key to allowing us to serve our customer load:
Colorado Electric is party to a joint dispatch agreement with PSCo and PRPA. This FERC-approved agreement, effective in 2017, is structured to allow PSCo, as administrator, to receive load and generation bid information for all three parties and, on an intra-hour basis, serve the combined utility load utilizing the combined bid generating resources on a least-cost basis. In other words, if one party has excess generation at a lower cost than another party’s generation, the administrator will increase dispatch of the lower-cost generation and decrease dispatch of the higher-cost generation. This results in lower energy costs to customers through more efficient dispatch of low-cost generating resources. Under the agreement, Colorado Electric retains the ability to participate or not participate in the joint dispatch at its discretion.
South Dakota Electric has firm network transmission access to deliver power on PacifiCorp’s system to Sheridan, Wyoming, to serve our power sales contract with MDU through December 31, 2023, with the right to renew pursuant to the terms of PacifiCorp’s transmission tariff.
Wyoming Electric has a firm network transmission agreement with Western Area Power Administration’s Loveland Area Project that allows us to serve our existing load in Cheyenne, Wyoming.
Operating Agreements. Our Electric Utilities have the following material operating agreements:
Shared Services Agreements -
| |
◦ | South Dakota Electric, Wyoming Electric, and Black Hills Wyoming are parties to a shared facilities agreement, whereby each entity is charged for the use of assets located at the Gillette, Wyoming energy complex by the affiliate entity. |
| |
◦ | Black Hills Colorado IPP and Colorado Electric are also parties to a facility fee agreement, whereby Colorado Electric charges Black Hills Colorado IPP for the use of Colorado Electric assets. |
| |
◦ | South Dakota Electric and BHSC are parties to a shared facilities agreement, whereby BHSC is charged for the use of the Horizon Point facility that is owned by South Dakota Electric and BHSC provides certain operations and maintenance services at the facility. |
| |
◦ | South Dakota Electric and Wyoming Electric receive certain staffing and management services from BHSC for Cheyenne Prairie. |
| |
• | Jointly Owned Facilities agreements are discussed in Note 4 of the Notes to the Consolidated Financial Statements in this Annual Report on Form 10-K. |
Seasonal Variations of Business. Our Electric Utilities are seasonal businesses and weather patterns may impact their operating performance. Demand for electricity is sensitive to seasonal cooling, heating and industrial load requirements, as well as market price. In particular, cooling demand is often greater in the summer and winter months for cooling and heating respectively.demand in often greater in the winter.
Competition. We generally have limited competition for the retail generation and distribution of electricity in our service areas. Various legislative or regulatory restructuring and competitive initiatives have been discussed in several of the states in which our utilities operate. These initiatives would be aimed at increasing competition or providing for distributed generation. To date, these initiatives have not had a material impact on our utilities. In Colorado, our electric utility is subject to rules which may require competitive bidding for generation supply. Because of these rules, we face competition from other utilities and non-affiliated independent power producersIPPs for the right to providesupply electric energy and capacity for Colorado Electric when resource plans require additional resources. Additionally, electrification initiatives in our service territories could increase demand for electricity and increase customer growth.
Rates and Regulation. Our Electric Utilities are subject to the jurisdiction of the public utilities commissions in the states where they operate and the FERC for certain assets. These commissions oversee services and facilities, rates and charges, accounting, valuation of property, depreciation rates and various other matters. The public utility commissions determine the rates we are allowed to charge for our utility services. Rate decisions are influenced by many factors, including the cost of providing service, capital expenditures, the prudence of costs we incur, views concerning appropriate rates of return, general economic conditions and the political environment. Certain commissions also have jurisdiction over the issuance of debt or securities and the creation of liens on property located in their states to secure bonds or other securities.
The following table provides regulatory information for each of our Electric Utilities:
| | | Subsidiary | Jurisdic-tion | Authorized Rate of Return on Equity | Authorized Return on Rate Base | Authorized Capital Structure Debt/Equity | Authorized Rate Base (in millions) | Effective Date | Additional Tariffed Mechanisms | Percentage of Power Marketing Profit Shared with Customers | Subsidiary | Jurisdic-tion | Authorized Rate of Return on Equity | Authorized Return on Rate Base | Authorized Capital Structure Debt/Equity | Authorized Rate Base (in millions) | Effective Date | Additional Tariffed Mechanisms | Percentage of Power Marketing Profit Shared with Customers |
| | | | | |
| Colorado Electric | CO | 9.37% | 7.43% | 47.6%/52.4% | $539.6 | 1/2017 | ECA, TCA, PCCA, Energy Efficiency Cost Recovery/DSM, Renewable Energy Standard Adjustment | 90% | |
Colorado Electric (a) | | Colorado Electric (a) | CO | 9.37% | 7.43% | 48%/52% | $539.6 | 1/2017 | ECA, TCA, PCCA, EECR/DSM, RESA | 90% |
| | CO | 9.37% | 6.02% | 67.3%/32.7% | $57.9 | 1/2017 | Clean Air Clean Jobs Act Adjustment Rider | N/A | | CO | 9.37% | 6.02% | 67%/33% | $57.9 | 1/2017 | Clean Air Clean Jobs Act Adjustment Rider | N/A |
| South Dakota Electric | WY | 9.9% | 8.13% | 46.7%/53.3% | $46.8 | 10/2014 | ECA | 65% | South Dakota Electric | WY | 9.90% | 8.13% | 47%/53% | $46.8 | 10/2014 | ECA | 65% |
| | SD | Global Settlement | 7.76% | Global Settlement | $543.9 | 10/2014 | ECA, Energy Efficiency Cost Recovery/DSM, TFA, EIA | 70% | | SD | Global Settlement | 7.76% | Global Settlement | $543.9 | 10/2014 | ECA, TFA, EIA | 70% |
| | FERC | 10.8% | 8.76% | 43%/57% | $138.4 (a) | 2/2009 | FERC Transmission Tariff | N/A | |
| Wyoming Electric | WY | 9.9% | 7.98% | 46%/54% | $376.8 | 10/2014 | PCA, Energy Efficiency Cost Recovery/DSM, Rate Base Recovery on Acquisition Adjustment | N/A | |
| | FERC | 10.6% | 8.51% | 46%/54% | $31.5 | 5/2014 | FERC Transmission Tariff | N/A | |
| | | FERC | 10.80% | 8.76% | 43%/57% | $154.0 (b) | 2/2009 | FERC Transmission Tariff | N/A |
Wyoming Electric (a) | | Wyoming Electric (a) | WY | 9.90% | 7.98% | 46%/54% | $376.8 | 10/2014 | PCA, EECR/DSM, Rate Base Recovery on Acquisition Adjustment | N/A |
|
__________
| |
(a) | Includes $121.3 million in 2019 rate base for the Common Use System formula rate that is updated annually and $17.1 million in rate base for the DC transmission tie that is based on the approved stated rate from 2005. |
(a) For both Colorado Electric and Wyoming Electric, transmission investments are recovered through retail rates rather than FERC Transmission Tariffs.
(b) Includes $136.9 million in 2020 rate base for the 2020 Projected Common Use System formula rate that is updated annually and $17.1 million in rate base for the Transmission Tie that is based on the approved stated rate from 2005.
The regulatory provisions for recovering the costs to supply electricity vary by state. In all states, subject to thresholds noted below, weWe have cost adjustment mechanisms for our Electric Utilities, subject to thresholds noted above, that allow us to pass the prudently-incurred cost of fuel and purchased power through to customers. These mechanisms allow the utility operating in that state to collect, or refund the difference between the cost of commodities and certain services embedded in our base rates and the actual cost of the commodities and certain services without filing a general rate review. In addition, some states allow for recovery of new capital investment placed in service between base rate reviews through approved rider tariffs. These tariffs allow the utility a return on the investment.
A summary of mechanisms we have in place are shown in the table below:
| | | | | | | | | | | | | | | | | | | | | | | |
| Electric Utility Jurisdiction | Cost Recovery Mechanisms |
| Environmental Cost | Energy Efficiency | Transmission Expense | Fuel Cost | Transmission Capital | Purchased Power | RESA |
| Colorado Electric | | þ | þ | þ | þ | þ | þ |
South Dakota Electric (SD) (a) | þ | | þ | þ | þ | þ | |
| South Dakota Electric (WY) | | þ | þ | þ | | þ | |
| | | | | | |
Electric Utility Jurisdiction | Cost Recovery Mechanisms |
Environmental Cost | Energy Efficiency | Transmission Expense | Fuel Cost | Transmission Capital | Purchased Power |
Colorado Electric | | þ | þ | þ | þ | þ |
South Dakota Electric (SD) | þ | þ | þ | þ | þ | þ |
South Dakota Electric (WY) | | þ | þ | þ | | þ |
South Dakota Electric (FERC)(b) | | | | | þ | | |
| Wyoming Electric | | þ | þ | þ | | þ | |
See(a) South Dakota Electric’s Environmental Cost (EIA) and Transmission Capital (TFA) tariffs were suspended for a six-year moratorium period effective July 1, 2017. On January 7, 2020, South Dakota Electric received approval from the SDPUC to extend the 6-year moratorium period by an additional 3 years whereby these recovery mechanisms will not be effective prior to July 1, 2026. For additional information, see Note 132 of the Notes to the Consolidated Financial Statements in this Annual Report on Form 10-K for information regarding current electric rate activity.
The significant mechanisms we have in place include the following by utility:
Colorado Electric has:
A quarterly ECA rider that allows us to recover forecasted increases or decreases in purchased energy and fuel costs, including the recovery for amounts payable to others for the transmission of the utility's electricity over transmission facilities owned by others, and the sharing of off-system sales margins, less certain operating costs (customer receives 90%). The ECA provides for not only direct recovery, but also for the issuance of credits for decreases in purchased energy, fuel costs and eligible energy resources.
An annual TCA rider that includes nine months of actual transmission investment and three months of forecasted investment, with an annual true-up mechanism.
A Clean Air Clean Jobs Act Adjustment rider rate that collects the authorized revenue requirement for the 40 MW combustion turbine placed in service on10-K. On December 31, 2016 with rates effective January 1, 2017.
A Renewable Energy Standard Adjustment rider that is specifically designed for meeting the requirements of Colorado’s renewable energy standard and most recently includes cost recovery for Peak View.
2020, South Dakota Electric has:(SD) terminated its Energy Efficiency program.
| |
• | An approved annual EIA tariff which recovers costs associated with generation plant environmental improvements. South Dakota Electric also has a TFA tariff which recovers the costs associated with transmission facility improvements. The EIA and TFA were suspended for a six-year moratorium period effective July 1, 2017. On January 7, 2020, South Dakota Electric received approval from the SDPUC on a settlement reached with the SDPUC staff agreeing to extend the 6-year moratorium period by an additional 3 years whereby rate increases for these recovery mechanisms will not go into effect prior to July 1, 2026. See Note 13 of the Notes to the Consolidated Financial Statements in this Annual Report on Form 10-K for further information. |
An annual cost adjustment clause which provides for the over or under recovery of fuel, transmission and purchased power cost incurred to serve South Dakota customers. Additionally, this ECA contains an off-system sales sharing mechanism in which South Dakota customers will receive a credit equal to 100% of off-system power marketing operating income from the first $1.0 million of power marketing margin from short-term sales and a credit equal to 70% of power marketing margins from short-term sales in excess of the first $1.0 million.(b) South Dakota Electric retains the remaining 30%. For the period of July 1, 2017 through March 31, 2023, the 100% credit of power marketing margin increased from $1.0 million to $2.0 million. The ECA methodology allows us to directly assign renewable resources and firm purchases to the customer load. In Wyoming, a similar fuel and purchased power cost adjustment is also in place.
Anhas an approved FERC Transmission Tariff based on a formulaic approach that determines the revenue component of South Dakota Electric’s open access transmission tariff.
Wyoming Electric has:
An annual cost adjustment mechanism that allows us to pass the prudently-incurred power costs above costs included in base rates through to electric customers. The annual cost adjustment allows for recovery of 85% of coal and coal-related cost per kWh variances from base and recovery of 95% of purchased power, transmission, and natural gas cost per kWh variances from base.
Tariff Filings. See Note 132 of the Notes to the Consolidated Financial Statements in this Annual Report on Form 10-K for tariff filings and additional information regarding current rateelectric regulatory activity.
Operating Statistics. StatisticsThe following tables summarize information for our . See a summary of key operating statistics in the Electric Utilities:Utilities segment operating results within Management’s Discussion and Analysis of Financial Condition and Results of Operations in Item 7 of this Annual Report on Form 10-K.
|
| | | | | | | | | |
| | For the year ended December 31, |
| Degree Days | 2019 | 2018 | 2017 |
| | Actual | Variance from Normal | Actual | Variance from Normal | Actual | Variance from Normal |
| Heating Degree Days: | | | | | | |
| Colorado Electric | 5,453 |
| (3)% | 5,119 |
| 4% | 4,693 |
| (16)% |
| South Dakota Electric | 8,284 |
| 16% | 7,749 |
| 8% | 6,870 |
| (4)% |
| Wyoming Electric | 7,406 |
| 1% | 7,036 |
| (7)% | 6,623 |
| (12)% |
| | | | | | | |
Combined (a) | 6,813 |
| 5% | 6,405 |
| 3% | 5,826 |
| (11)% |
| | | | | | | |
| Cooling Degree Days: | | | | | | |
| Colorado Electric | 1,226 |
| 37% | 1,420 |
| 58% | 1,027 |
| 14% |
| South Dakota Electric | 404 |
| (36)% | 488 |
| (23)% | 709 |
| 11% |
| Wyoming Electric | 462 |
| 33% | 430 |
| 24% | 429 |
| 23% |
| | | | | | | |
Combined (a) | 791 |
| 14% | 902 |
| 29% | 798 |
| 14% |
________________
| |
(a) | The combined degree days are calculated based on a weighted average of total customers by state. |
|
| | | | | | | | | | | | | | | | | |
| | | Electric Revenue (in thousands) | | Quantities Sold (MWh) |
| | | For the year ended December 31, | | For the year ended December 31, |
| | | 2019 | 2018 | 2017 | | 2019 | 2018 | 2017 |
| Residential | | $ | 216,108 |
| $ | 218,558 |
| $ | 210,172 |
| | 1,440,551 |
| 1,450,585 |
| 1,390,952 |
|
| Commercial | | 246,704 |
| 250,894 |
| 258,754 |
| | 2,055,253 |
| 2,034,917 |
| 2,038,495 |
|
| Industrial | | 131,831 |
| 124,668 |
| 122,958 |
| | 1,787,412 |
| 1,682,074 |
| 1,598,755 |
|
| Municipal | | 17,206 |
| 17,871 |
| 18,144 |
| | 157,298 |
| 160,913 |
| 160,882 |
|
| Subtotal Retail Revenue - Electric | | 611,849 |
| 611,991 |
| 610,028 |
| | 5,440,514 |
| 5,328,489 |
| 5,189,084 |
|
Contract Wholesale (a) | | 19,078 |
| 33,688 |
| 30,435 |
| | 368,360 |
| 900,854 |
| 722,659 |
|
| Off-system/Power Marketing Wholesale | | 25,622 |
| 24,800 |
| 21,111 |
| | 701,633 |
| 673,994 |
| 661,263 |
|
| Other | | 56,203 |
| 40,972 |
| 43,076 |
| | — |
| — |
| — |
|
| Total Revenue and Energy Sold | | 712,752 |
| 711,451 |
| 704,650 |
| | 6,510,507 |
| 6,903,337 |
| 6,573,006 |
|
Other Uses, Losses or Generation, net (b) | | — |
| — |
| — |
| | 393,573 |
| 470,250 |
| 468,179 |
|
| Total Revenue and Energy | | 712,752 |
| 711,451 |
| 704,650 |
| | 6,904,080 |
| 7,373,587 |
| 7,041,185 |
|
Less cost of fuel and purchased power (c) | | 268,297 |
| 283,840 |
| 274,363 |
| | | | |
Gross Margin (non-GAAP) (c) (d) | | $ | 444,455 |
| $ | 427,611 |
| $ | 430,287 |
| | | | |
|
| | | | | | | | | | | | | | | | | | | | | | | | | | | |
| | | Electric Revenue (in thousands) | | Gross Margin (non-GAAP) (d) (in thousands) | | Quantities Sold (MWh) |
| | | For the year ended December 31, | | For the year ended December 31, | | For the year ended December 31, |
| | | 2019 | 2018 | 2017 | | 2019 | 2018 | 2017 | | 2019 | 2018 | 2017 |
Colorado Electric (c) | | $ | 247,332 |
| $ | 251,218 |
| $ | 251,090 |
| | $ | 137,323 |
| $ | 138,901 |
| $ | 140,121 |
| | 2,180,985 |
| 2,151,918 |
| 2,091,676 |
|
South Dakota Electric (a) | | 291,219 |
| 298,080 |
| 288,433 |
| | 218,104 |
| 205,194 |
| 200,795 |
| | 2,798,887 |
| 3,360,396 |
| 3,187,392 |
|
| Wyoming Electric | | 174,201 |
| 162,153 |
| 165,127 |
| | 89,028 |
| 83,516 |
| 89,371 |
| | 1,924,208 |
| 1,861,273 |
| 1,762,117 |
|
| Total Revenue, Gross Margin (non-GAAP), and Quantities Sold | | $ | 712,752 |
| $ | 711,451 |
| $ | 704,650 |
| | $ | 444,455 |
| $ | 427,611 |
| $ | 430,287 |
| | 6,904,080 |
| 7,373,587 |
| 7,041,185 |
|
________________
| |
(a) | 2019 revenue and purchased power, as well as associated quantities, for a certain wholesale contract have been presented on a net basis. Prior year amounts were presented on a gross basis and, due to their immaterial nature, were not revised. This 2019 presentation change has no impact on Gross margin. |
| |
(b) | Total MWh includes Other Uses, Losses or Generation, net, which is approximately 5%, 6%, and 6% for Colorado Electric, South Dakota Electric and Wyoming Electric, respectively. |
| |
(c) | Due to the changes in our segment disclosures discussed in Note 5 of the Notes to the Consolidated Financial Statements in this Annual Report on Form 10-K, cost of fuel and purchased power was revised for the years ended December 31, 2018 and December 31, 2017 which resulted in an increase of $6.7 million and $6.0 million, respectively. There were corresponding decreases to Gross margin for both years. These changes had no impact on consolidated financial results. |
| |
(d) | For further information on Gross Margin, see “Non-GAAP Financial Measure” within Management’s Discussion and Analysis of Financial Condition and Results of Operations in Item 7 of this Annual Report on Form 10-K. |
|
| | | | | | |
| | For the year ended December 31, |
| Quantities Generated and Purchased (MWh) | 2019 | 2018 | 2017 |
| | | | |
| Coal-fired | 2,226,028 |
| 2,368,506 |
| 2,230,617 |
|
| Natural Gas and Oil | 600,002 |
| 446,373 |
| 307,815 |
|
| Wind | 238,999 |
| 253,180 |
| 239,472 |
|
| Total Generated | 3,065,029 |
| 3,068,059 |
| 2,777,904 |
|
Purchased (a) | 3,839,051 |
| 4,305,528 |
| 4,263,281 |
|
| Total Generated and Purchased | 6,904,080 |
| 7,373,587 |
| 7,041,185 |
|
|
| | | | | | |
| | For the year ended December 31, |
| Quantities Generated and Purchased (MWh) | 2019 | 2018 | 2017 |
| Generated: | | | |
| Colorado Electric | 443,770 |
| 481,446 |
| 397,965 |
|
| South Dakota Electric | 1,768,456 |
| 1,734,222 |
| 1,581,915 |
|
| Wyoming Electric | 852,803 |
| 852,391 |
| 798,024 |
|
| Total Generated | 3,065,029 |
| 3,068,059 |
| 2,777,904 |
|
| Purchased: |
|
|
|
| Colorado Electric | 1,737,215 |
| 1,670,472 |
| 1,693,711 |
|
South Dakota Electric (a) | 1,030,431 |
| 1,626,174 |
| 1,605,477 |
|
| Wyoming Electric | 1,071,405 |
| 1,008,882 |
| 964,093 |
|
| Total Purchased | 3,839,051 |
| 4,305,528 |
| 4,263,281 |
|
| |
|
|
|
|
| Total Generated and Purchased | 6,904,080 |
| 7,373,587 |
| 7,041,185 |
|
________________
| |
(a) | 2019 purchased power quantities for a wholesale contract have been presented on a net basis. Prior year amounts were presented on a gross basis and, due to their immaterial nature, were not revised. This 2019 presentation change has no impact on Gross margin. |
|
| | | | | | |
| | As of December 31, |
| Customers at End of Year | 2019 | 2018 | 2017 |
| Residential | 183,232 |
| 181,459 |
| 179,911 |
|
| Commercial | 29,921 |
| 29,299 |
| 29,354 |
|
| Industrial | 83 |
| 84 |
| 86 |
|
| Other | 1,024 |
| 1,030 |
| 914 |
|
| Total Electric Customers at End of Year | 214,260 |
| 211,872 |
| 210,265 |
|
|
| | | | | | |
| | As of December 31, |
| Customers at End of Year | 2019 | 2018 | 2017 |
| Colorado Electric | 97,890 |
| 96,645 |
| 95,951 |
|
| South Dakota Electric | 73,052 |
| 72,533 |
| 72,184 |
|
| Wyoming Electric | 43,318 |
| 42,694 |
| 42,130 |
|
| Total Electric Customers at End of Year | 214,260 |
| 211,872 |
| 210,265 |
|
Gas Utilities Segment
We conduct natural gas utility operations through our Arkansas, Colorado, Iowa, Kansas, Nebraska and Wyoming subsidiaries. Our Gas Utilities transport and distribute natural gas through our distribution network to approximately 1,066,0001,083,000 customers. Additionally, we sell contractual pipeline capacity and gas commodities to other utilities and marketing companies, including our affiliates, on an as-available basis.
We also provide non-regulated services to our regulated customers. Black Hills Energy Services provides natural gas supply to approximately 49,00052,000 retail distribution customers under the Choice Gas Program in Nebraska and Wyoming. Additionally, we provide services under the Service Guard Comfort Plan, and Tech Services and also offer HomeServe products.HomeServe.
| | | | | | | | | | | |
| As of December 31, |
| Customers at End of Year | 2020 | 2019 | 2018 |
| Residential | 844,999 | | 831,351 | | 821,624 | |
| Commercial | 83,135 | | 82,912 | | 82,498 | |
| Industrial | 2,235 | | 2,208 | | 2,221 | |
| Transportation | 152,568 | | 149,971 | | 147,550 | |
| | | |
| Total Natural Gas Customers at End of Year | 1,082,937 | | 1,066,442 | | 1,053,893 | |
| | | | | | | | | | | |
| As of December 31, |
| Customers at End of Year | 2020 | 2019 | 2018 |
| Arkansas | 178,281 | | 174,447 | | 171,978 | |
| Colorado | 197,817 | | 191,950 | | 186,759 | |
| Iowa | 160,952 | | 159,641 | | 158,485 | |
| Kansas | 116,973 | | 115,846 | | 114,840 | |
| Nebraska | 296,778 | | 293,576 | | 291,723 | |
| Wyoming | 132,136 | | 130,982 | | 130,108 | |
| | | |
| Total Natural Gas Customers at End of Year | 1,082,937 | | 1,066,442 | | 1,053,893 | |
We procure natural gas for our distribution customers from a diverse mix of producers, processors and marketers and generally use hedging, physical fixed-price purchases and market-based price purchases to achieve dollar-cost averaging within our natural gas portfolio. The majority of our procured natural gas is transported in interstate pipelines under firm transportation service agreements.
In addition to company-owned natural gas storage assets in Arkansas, Colorado and Wyoming, we also contract with many of the third-party transportation providers noted above for natural gas storage service to provide gas supply during the winter heating season and to meet peak day customer demand for natural gas.
The following table summarizes certain information regarding our regulated underground gas storage facilities as of December 31, 2019:
| | | | | | | | | | | | | | |
| State | Working Capacity (Mcf) | Cushion Gas (Mcf) | Total Capacity (Mcf) | Maximum Daily Withdrawal Capability (Mcfd) |
|
| Arkansas | 8,442,700 | | 13,149,040 | | 21,591,740 | | 196,000 | |
| Colorado | 2,360,895 | | 6,165,315 | | 8,526,210 | | 30,000 | |
| Wyoming | 5,733,900 | | 17,145,600 | | 22,879,500 | | 36,000 | |
| Total | 16,537,495 | | 36,459,955 | | 52,997,450 | | 262,000 | |
The following tables summarizetable summarizes certain operating information forregarding our Gas Utilities.system infrastructure as of December 31, 2020:
| | | | | | | | | | | |
| State | Intrastate Gas
Transmission Pipelines
(in line miles) | Gas Distribution
Mains
(in line miles) | Gas Distribution
Service Lines
(in line miles) |
| Arkansas | 935 | | 5,090 | | 1,223 | |
| Colorado | 693 | | 6,879 | | 2,618 | |
| Iowa | 165 | | 2,839 | | 2,151 | |
| Kansas | 330 | | 2,961 | | 1,366 | |
| Nebraska | 1,312 | | 8,739 | | 3,252 | |
| Wyoming | 1,339 | | 3,495 | | 1,225 | |
| Total | 4,774 | | 30,003 | | 11,835 | |
|
| | | | | | |
| System Infrastructure (in line miles) as of | Intrastate Gas Transmission Pipelines | Gas Distribution Mains | Gas Distribution Service Lines |
| December 31, 2019 |
| Arkansas | 942 |
| 4,880 |
| 1,161 |
|
| Colorado | 693 |
| 6,814 |
| 2,554 |
|
| Iowa | 165 |
| 2,813 |
| 2,138 |
|
| Kansas | 330 |
| 2,910 |
| 1,355 |
|
| Nebraska | 1,311 |
| 8,664 |
| 3,230 |
|
| Wyoming | 1,334 |
| 3,472 |
| 1,219 |
|
| Total | 4,775 |
| 29,553 |
| 11,657 |
|
|
| | | | | | | | | | | |
| | For the year ended December 31, |
| Degree Days | 2019 | | 2018 | | 2017 |
| | Actual | Variance From Normal | | Actual | Variance From Normal | | Actual | Variance From Normal |
| Heating Degree Days: | | | | | | | | |
Arkansas (a) | 3,897 |
| (4)% | | 4,169 |
| 3% | | 3,295 |
| (19)% |
| Colorado | 6,672 |
| 1% | | 6,136 |
| (7)% | | 5,728 |
| (14)% |
| Iowa | 7,200 |
| 6% | | 7,192 |
| 6% | | 6,149 |
| (9)% |
Kansas (a) | 5,190 |
| 6% | | 5,242 |
| 7% | | 4,452 |
| (9)% |
| Nebraska | 6,578 |
| 7% | | 6,563 |
| 6% | | 5,554 |
| (10)% |
| Wyoming | 8,010 |
| 7% | | 7,425 |
| (1)% | | 7,123 |
| (5)% |
Combined (b) | 6,840 |
| 5% | | 6,628 |
| 2% | | 5,862 |
| (10)% |
________________
| |
(a) | Arkansas and Kansas have weather normalization mechanisms that mitigate the weather impact on gross margins. |
| |
(b) | The combined heating degree days are calculated based on a weighted average of total customers by state excluding Kansas due to its weather normalization mechanism. Arkansas Gas is partially excluded based on the weather normalization mechanism in effect from November through April. |
Seasonal Variations of Business. Our Gas Utilities are seasonal businesses and weather patterns may impact their operating performance. Demand for natural gas is sensitive to seasonal heating and industrial load requirements, as well as market price. In particular, demand is often greater in the winter months for heating. Natural gas is used primarily for residential and commercial heating, so the demand for this product depends heavily upon weather throughout our service territories and asterritories. As a result, a significant amount of natural gas revenue is normally recognized in the heating season consisting of the first and fourth quarters. Demand for natural gas can also be impacted by summer weather patterns that are cooler than normal and/or provide higher than normal precipitation; both oftemperatures and precipitation, which can reduce natural gasaffect demand for irrigation.
Competition. We generally have limited competition for the retail distribution of natural gas in our service areas. Various restructuring and competitive initiatives have been discussed in several of the states in which our utilities operate. These initiatives are aimed at increasing competition. Additionally, electrification initiatives in our service territories could negatively impact demand for natural gas and decrease customer growth. To date, these initiatives have not had a material impact on our utilities. Although we face competition from independent marketers for the sale of natural gas to our industrial and commercial customers, in instances where independent marketers displace us as the seller of natural gas, we still collect a distribution charge for transporting the gas through our distribution network.
Rates and Regulation. Our Gas Utilities are subject to the jurisdiction of the public utility commissions in the states where they operate. These commissions oversee services and facilities, rates and charges, accounting, valuation of property, depreciation rates and various other matters. The public utility commissions determine the rates we are allowed to charge for our utility services. Rate decisions are influenced by many factors, including the cost of providing service, capital expenditures, the prudence of costs we incur, views concerning appropriate rates of return, general economic conditions and the political environment. Certain commissions also have jurisdiction over the issuance of debt or securities and the creation of liens on property located in their states to secure bonds or other securities.
Our Gas Utilities are authorized to use natural gas cost recovery mechanisms that allow them to adjust their rates to reflectallowing rate adjustments reflecting changes in the wholesale cost of natural gas and to ensure that they recoverrecovery of all the costs prudently incurred in purchasing gas for their customers. In addition to natural gas cost recovery mechanisms, we have other recovery mechanisms, which vary by utility, but allow us to recover certain costs or earn a return on capital investments, such as energy efficiency plan costs and system safety and integrity investments.
The following table provides regulatory information for each of our natural gas utilities:
| | | Subsidiary | Jurisdic-tion | Authorized Rate of Return on Equity | Authorized Return on Rate Base | Authorized Capital Structure Debt/Equity | Authorized Rate Base (in millions) | Effective Date | Additional Tariffed Mechanisms | Subsidiary | Jurisdic-tion | Authorized Rate of Return on Equity | Authorized Return on Rate Base | Authorized Capital Structure Debt/Equity | Authorized Rate Base (in millions) | Effective Date | Additional Tariffed Mechanisms | |
| Gas Utilities: | | |
| Arkansas Gas | AR | 9.61% | 6.82% (a) | 50.9%/49.1% | $451.5 (b) | 10/2018 | GCA, Main Replacement Program, At-Risk Meter Relocation Program, Legislative or Regulatory Mandated Expenditures, Energy Efficiency, Weather Normalization Adjustment, Billing Determinant Adjustment | Arkansas Gas | AR | 9.61% | 6.82% (a) | 51%/49% | $451.5 (b) | 10/2018 | GCA, Main Replacement Program, At-Risk Meter Relocation Program, Legislative or Regulatory Mandated Expenditures, EECR, Weather Normalization Adjustment, Billing Determinant Adjustment | |
| Colorado Gas | CO | 9.6% | 8.41% | 50%/50% | $57.5 | 12/2012 | GCA, Energy Efficiency Cost Recovery/DSM | Colorado Gas | CO | 9.20% | 6.76% | 50%/50% | $231.2 | 7/2020 | GCA, EECR/DSM | |
| Colorado Gas Dist. | CO | 10.0% | 8.02% | 49.52%/ 50.48% | $127.1 | 12/2010 | GCA, Energy Efficiency Cost Recovery/DSM
| |
| RMNG | CO | 9.9% | 6.71% | 53.37%/ 46.63% | $118.7 | 6/2018 | System Safety Integrity Rider, Liquids/Off-system/Market Center Services Revenue Sharing | RMNG | CO | 9.90% | 6.71% | 53%/ 47% | $118.7 | 6/2018 | System Safety Integrity Rider, Liquids/Off-system/Market Center Services Revenue Sharing | |
| Iowa Gas | IA | Global Settlement | $109.2 | 2/2011 | GCA, Energy Efficiency Cost Recovery, Capital Infrastructure Automatic Adjustment Mechanism, Farm Tap Tracker Adjustment, Gas Supply Optimization revenue sharing | Iowa Gas | IA | Global Settlement | $109.2 | 2/2011 | GCA, EECR, Capital Infrastructure Automatic Adjustment Mechanism, Farm Tap Tracker Adjustment, Gas Supply Optimization revenue sharing | |
| Kansas Gas | KS | Global Settlement | $127.9 | 1/2015 | GCA, Weather Normalization Tariff, Gas System Reliability Surcharge, Ad Valorem Tax Surcharge, Cost of Bad Debt Collected through GCA, Pension Levelized Adjustment | Kansas Gas | KS | Global Settlement | $127.9 | 1/2015 | GCA, Weather Normalization Tariff, Gas System Reliability Surcharge, Ad Valorem Tax Surcharge, Cost of Bad Debt Collected through GCA, Pension Levelized Adjustment | |
| Nebraska Gas | NE | 10.1% | 9.11% | 48%/52% | $161.0 | 9/2010 | GCA, Cost of Bad Debt Collected through GCA, Infrastructure System Replacement Cost Recovery Surcharge, Farm Tap Recovery Mechanism | |
| Nebraska Gas Dist. | NE | 9.6% | 7.67% | 48.84%/ 51.16% | $87.6/ $69.8 (c) | 6/2012 | Choice Gas Program, System Safety and Integrity Rider, Bad Debt expense recovered through Choice Supplier Fee | |
| Wyoming Gas | WY | 9.4% | 6.98 | 49.77%/50.23% | $354.4 | 3/2020 | GCA, Energy Efficiency Cost Recovery, Rate Base Recovery on Acquisition Adjustment, Wyoming Integrity Rider, Choice Gas Program | |
Nebraska Gas (c) (d) | | Nebraska Gas (c) (d) | NE | 9.50% | 6.71% | 50%/50% | $504.2 | 3/2021 | GCA, Cost of Bad Debt Collected through GCA, Infrastructure System Replacement Cost Recovery Surcharge, Choice Gas Program, System Safety and Integrity Rider, Bad Debt expense recovered through Choice Supplier Fee | |
Wyoming Gas (d) | | Wyoming Gas (d) | WY | 9.40% | 6.98% | 50%/50% | $354.4 | 3/2020 | GCA, EECR, Rate Base Recovery on Acquisition Adjustment, Wyoming Integrity Rider, Choice Gas Program | |
__________
| |
(a) | (a) Arkansas Gas return on rate base is adjusted to remove current liabilities from rate review capital structure for comparison with other subsidiaries. |
| |
(b) | Arkansas Gas rate base is adjusted to include current liabilities for comparison with other subsidiaries. |
| |
(c) | Total Nebraska Gas Distribution rate base of $87.6 million includes amounts allocated to serve non-jurisdictional customers. Jurisdictional Nebraska rate base totals $69.8 million and is used for calculation of jurisdictional base rates. |
(b) Arkansas Gas rate base is adjusted to include current liabilities for comparison with other subsidiaries.
(c) Information above reflects the NPSC order received on January 26, 2021. For additional information, see Note 2 of the Notes to Consolidated Financial Statements in this Annual Report on Form 10-K. (d) The Choice Gas Program mechanisms are applicable to only a portion of Nebraska Gas and Wyoming Gas customers.
All of our Gas Utilities, except where the Choice Gas Program is the only option, have GCAs that allow us to pass the prudently-incurred cost of gas and certain services through to the customer between rate reviews. Some of the mechanisms we have in place include the following:
| | | | | | | | | | | | | | | | | | | | | | | |
| Gas Utility Jurisdiction | Cost Recovery Mechanisms |
| DSM/Energy Efficiency | Integrity Additions | Bad Debt | Weather Normal | Pension Recovery | Gas Cost | Revenue Decoupling |
| Arkansas Gas | þ | þ | | þ | | þ | þ |
| | | | | | | |
| Colorado Gas | þ | | | | | þ | |
RMNG(a) | | þ | | | | | |
| Iowa Gas | þ | þ | | | | þ | |
| Kansas Gas | | þ | þ | þ | þ | þ | |
| Nebraska Gas | | þ | þ | | | þ | |
| | | | | | | |
Gas Utility Jurisdiction | Cost Recovery Mechanisms |
Energy Efficiency | Integrity Additions | Bad Debt | Weather Normal | Pension Recovery | Gas Cost | Billing Determinant Adjustment |
Arkansas Gas | þ | þ | | þ | | þ | þ |
Colorado Gas | þ | | | | | þ | |
Colorado Gas Distribution | þ | | | | | þ | |
RMNG | N/A | þ | N/A | N/A | N/A | N/A | N/A |
Iowa Gas | þ | þ | | | | þ | |
Kansas Gas | | þ | þ | þ | þ | þ | |
Nebraska Gas | | þ | þ | | | þ | |
Nebraska Gas Distribution | | þ | þ | | | | |
Wyoming Gas(a) | þ | þ | | | | þ | |
__________
| |
(a) | The Wyoming Gas integrity rider is effective March 1, 2020. |
Tariff Filings. See Note 132 of the Notes to the Consolidated Financial Statements in this Annual Report on Form 10-K for information regarding current ratenatural gas regulatory activity.
Operating Statisticsstatistics. See a summary of key operating statistics in the Gas Utilities segment operating results within Management’s Discussion and Analysis of Financial Condition and Results of Operations in Item 7 of this Annual Report on Form 10-K.
|
| | | | | | | | | | | | | | | | | | | | | | | | | | | |
| | | Revenue (in thousands) | | Gross Margin (non-GAAP) (a) (in thousands) | | Quantities Sold and Transported (Dth) |
| | | For the year ended December 31, | | For the year ended December 31, | | For the year ended December 31, |
| | | 2019 | 2018 | 2017 | | 2019 | 2018 | 2017 | | 2019 | 2018 | 2017 |
| | | | | | | | | | | | | |
| Residential | | $ | 551,701 |
| $ | 567,785 |
| $ | 499,852 |
| | $ | 285,802 |
| $ | 276,858 |
| $ | 255,626 |
| | 66,956,080 |
| 65,352,164 |
| 54,645,598 |
|
| Commercial | | 212,229 |
| 214,718 |
| 197,054 |
| | 88,264 |
| 82,529 |
| 78,249 |
| | 32,241,441 |
| 30,753,361 |
| 27,315,871 |
|
| Industrial | | 24,832 |
| 26,466 |
| 24,454 |
| | 8,053 |
| 7,056 |
| 6,226 |
| | 6,548,023 |
| 6,309,211 |
| 5,855,053 |
|
| Other | | (1,361 | ) | (7,899 | ) | 8,647 |
| | (1,361 | ) | (7,899 | ) | 8,647 |
| | — |
| — |
| — |
|
| Total Distribution | | 787,401 |
| 801,070 |
| 730,007 |
| | 380,758 |
| 358,544 |
| 348,748 |
| | 105,745,544 |
| 102,414,736 |
| 87,816,522 |
|
| | | | | | | | | | | | | |
| Transportation and Transmission | | 144,710 |
| 141,854 |
| 135,824 |
| | 144,710 |
| 141,850 |
| 135,824 |
| | 153,101,264 |
| 148,299,003 |
| 141,600,080 |
|
| | | | | | | | | | | | | |
| Total Regulated | | 932,111 |
| 942,924 |
| 865,831 |
| | 525,468 |
| 500,394 |
| 484,572 |
| | 258,846,808 |
| 250,713,739 |
| 229,416,602 |
|
| | | | | | | | | | | | | |
| Non-regulated Services | | 77,919 |
| 82,383 |
| 81,799 |
| | 58,664 |
| 62,760 |
| 53,455 |
| | — |
| — |
| — |
|
| | | | | | | | | | | | | |
| Total Revenue, Gross Margin (non-GAAP) and Quantities Sold | | $ | 1,010,030 |
| $ | 1,025,307 |
| $ | 947,630 |
| | $ | 584,132 |
| $ | 563,154 |
| $ | 538,027 |
| | 258,846,808 |
| 250,713,739 |
| 229,416,602 |
|
|
| | | | | | | | | | | | | | | | | | | | | | | | | | | |
| | | Revenue (in thousands) | | Gross Margin (non-GAAP) (a) (in thousands) | | Quantities Sold & Transported (Dth) |
| | | For the year ended December 31, | | For the year ended December 31, | | For the year ended December 31, |
| | | 2019 | 2018 | 2017 | | 2019 | 2018 | 2017 | | 2019 | 2018 | 2017 |
| | | | | | | | | | | | | |
| Arkansas | | $ | 185,201 |
| $ | 176,660 |
| $ | 153,691 |
| | $ | 115,899 |
| $ | 100,917 |
| $ | 94,007 |
| | 30,496,243 |
| 30,931,390 |
| 26,491,537 |
|
| Colorado | | 199,369 |
| 188,002 |
| 180,852 |
| | 106,776 |
| 99,851 |
| 100,718 |
| | 33,908,529 |
| 29,857,063 |
| 28,436,744 |
|
| Iowa | | 151,619 |
| 161,843 |
| 143,446 |
| | 70,290 |
| 68,384 |
| 66,619 |
| | 41,795,729 |
| 40,668,682 |
| 37,013,645 |
|
| Kansas | | 105,906 |
| 112,306 |
| 105,576 |
| | 58,020 |
| 55,226 |
| 53,841 |
| | 32,650,854 |
| 31,387,672 |
| 28,251,947 |
|
| Nebraska | | 255,622 |
| 278,969 |
| 252,631 |
| | 155,901 |
| 164,513 |
| 154,259 |
| | 81,481,192 |
| 81,658,938 |
| 73,890,509 |
|
| Wyoming | | 112,313 |
| 107,527 |
| 111,434 |
| | 77,246 |
| 74,263 |
| 68,583 |
| | 38,514,261 |
| 36,209,994 |
| 35,332,220 |
|
| Total Revenue, Gross Margin (non-GAAP) and Quantities Sold | | $ | 1,010,030 |
| $ | 1,025,307 |
| $ | 947,630 |
| | $ | 584,132 |
| $ | 563,154 |
| $ | 538,027 |
| | 258,846,808 |
| 250,713,739 |
| 229,416,602 |
|
________________
| |
(a) | For further information on Gross Margin, see “Non-GAAP Financial Measure” within Management’s Discussion and Analysis of Financial Condition and Results of Operations in Item 7 of this Annual Report on Form 10-K. |
|
| | | | | | |
| | As of December 31, |
| Customers at End of Year | 2019 | 2018 | 2017 |
| | | | |
| Residential | 831,351 |
| 821,624 |
| 806,744 |
|
| Commercial | 82,912 |
| 82,498 |
| 86,461 |
|
| Industrial | 2,208 |
| 2,221 |
| 2,214 |
|
| Transportation/Other | 149,971 |
| 147,550 |
| 146,839 |
|
| Total Customers at End of Year | 1,066,442 |
| 1,053,893 |
| 1,042,258 |
|
|
| | | | | | |
| | As of December 31, |
| Customers at End of Year | 2019 | 2018 | 2017 |
| | | | |
| Arkansas | 174,447 |
| 171,978 |
| 169,303 |
|
| Colorado | 191,950 |
| 186,759 |
| 181,876 |
|
| Iowa | 159,641 |
| 158,485 |
| 157,444 |
|
| Kansas | 115,846 |
| 114,840 |
| 114,082 |
|
| Nebraska | 293,576 |
| 291,723 |
| 290,264 |
|
| Wyoming | 130,982 |
| 130,108 |
| 129,289 |
|
| Total Customers at End of Year | 1,066,442 |
| 1,053,893 |
| 1,042,258 |
|
Utility Regulation Characteristics
State Regulations
Certain states where we conduct electric utility operations have adopted renewable energy portfolio standards that require or encourage our Electric Utilities to source, by a certain future date, a minimum percentage of the electricity delivered to customers from renewable energy generation facilities. As of December 31, 2019,2020, we were subject to the following renewable energy portfolio standards or objectives:
| |
• | •Colorado. Colorado adopted a renewable energy standard in 2004 that has two components: (i) electric resource standards and (ii) a 2% maximum annual retail rate impact for compliance with the electric resource standards. The electric resource standards require our Colorado Electric subsidiary to generate, or cause to be generated, electricity from renewable energy sources equaling: (i) 20% of retail sales from 2015 to 2019; and (ii) 30% of retail sales by 2020. Of these amounts, 3% must be generated from distributed generation sources with one-half of these resources being located at customer facilities. The net annual incremental retail rate impact from these renewable resource acquisitions (as compared to non-renewable resources) is limited to 2%. The standard encourages the CPUC to consider earlier and timely cost recovery for utility investment in renewable resources, including the use of a forward rider mechanism. We have been and currently remain in compliance with these standards. |
On November 26, 2019, Black Hills Electric Generation placed in service Busch Ranch II. Black Hills Electric Generation provides the wind energy generated from Busch Ranch IIdistributed generation sources with one-half of these resources being located at customer facilities. The net annual incremental retail rate impact for these renewable resource acquisitions (as compared to non-renewable resources) is limited to 2%. The standard encourages the CPUC to consider earlier and timely cost recovery for utility investment in renewable resources, including the use of a forward rider mechanism. We have been and currently remain in compliance with these standards.
In 2019, the State of Colorado approved Senate Bill 236, which required qualified retail electric utilities (more than 500,000 customers) to submit a Clean Energy Plan to meet an 80% carbon reduction goal by 2030 based upon 2005 baseline levels. While Colorado Electric is not required to submit a Clean Energy Plan, the state also passed House Bill 1261 which established state-wide emission goals for greenhouse gas emitting activities that apply to Colorado Electric under a 25-year PPA, which expires in November 2044. This renewable energy will enableElectric. Both House Bill 1261 and Senate Bill 236 include provisions that allow Colorado Electric to complysubmit a voluntary Clean Energy Plan with Colorado'sa goal of 80% reduction by 2030. On January 7, 2021, Colorado Electric announced it will file a Clean Energy Plan with the CPUC voluntarily in 2022.
On September 23, 2020, Colorado Electric received approval from the CPUC for its preferred solar bid request in support of its Renewable Energy Standard.
| |
• | Montana. In 2005, Montana established a renewable portfolio standard that requires public utilities to obtain a percentageAdvantage program. The program plans to add up to 200 MW of their retail electricity sales from eligible renewable resources. In March 2013, South Dakota Electric filed a petition with the MTPSC requesting a waiver of the renewable portfolio standards primarily due to exceeding the applicable “cost cap” included in the standards. In March 2013, the Montana Legislature adopted legislation that had the effect of excluding South Dakota Electric from all renewable portfolio standard requirements under State Senate Bill 164, primarily due to the very low number of customers South Dakota Electric has in Montana and the relatively high cost of meeting the renewable requirements.
|
| |
• | South Dakota. South Dakota has adopted a renewable portfolio objective that encourages, but does not mandate utilities to generate, or cause to be generated, at least 10% of their retail electricity supply from renewable energy sources by 2015.
|
| |
• | Wyoming. Wyoming currently has no renewable energy portfolio standard.
|
Absent a specific renewable energy in Colorado by the end of 2023, which will contribute towards the aforementioned 80% carbon reduction goal by 2030. When Renewable Advantage comes online in 2023, more than half of Colorado Electric’s generation mix will be renewable sources, leading to an approximate 70% reduction in GHG emissions by 2024.
•South Dakota. South Dakota adopted a renewable portfolio objective in 2008 that encourages, but does not mandate utilities to generate, or cause to be generated, at least 10% of their retail electricity supply from renewable energy sources by 2015.
•Wyoming. Wyoming currently has not issued a renewable energy portfolio standard.
In November 2020, we announced clean energy goals to reduce GHG emissions that are based on prudent and proven solutions to reduce our emissions while minimizing cost impacts to our customers. See more information in the territories we serve, our current strategy is to proactively integrate alternative and renewable energy into our utility energy supply while mitigating customer rate impacts. Mandatory portfolio standards have increased, and will likely continue to increase, the power supply costsKey Elements of our Electric Utilities’ operations. Although we will seek to recover these higher costsBusiness Strategy within Management’s Discussion and Analysis of Financial Condition and Results of Operations in rates, we can provide no assurance that we will be able to secure full recoveryItem 7 of the costs we pay to be in compliance with standards or objectives. We cannot at this time reasonably forecast the potential costs associated with any new renewable energy standards that have been or may be proposed at the federal or state level.Annual Report on Form 10-K.
Federal Regulation
Energy Policy Act.BHC The Energy Policy Act of 2005 included provisions to create an Electric Reliability Organization, which is a holding company whose assets consist primarilyrequired to promulgate mandatory reliability standards governing the operation of investmentsthe bulk power system in our subsidiaries, including subsidiariesthe U.S. FERC certified NERC as the Electric Reliability Organization and also issued an initial order approving many reliability standards that are public utilitieswent into effect in 2007. Entities that violate standards will be subject to fines and a holding company regulated by FERC undercan also be assessed non-monetary penalties, depending upon the Federal Power Actnature and PUHCA 2005.severity of the violation.
Federal Power Act. The Federal Power Act gives FERC exclusive rate-making jurisdiction over wholesale sales of electricity and the transmission of electricity in interstate commerce. Pursuant to the Federal Power Act, all public utilities subject to FERC’s jurisdiction must maintain tariffs and rate schedules on file with FERC that govern the rates, and terms and conditions for the provision of FERC-jurisdictional wholesale power and transmission services. Public utilities are also subject to accounting, record-keeping and reporting requirements administered by FERC. FERC also places certain limitations on transactions between public utilities and their affiliates. Our public Electric Utilities’ subsidiaries provide FERC-jurisdictional services subject to FERC’s oversight.
Our Electric Utilities and Power Generation entities are authorized by FERC to make wholesale sales of electric capacity and energy at market-based rates under tariffs on file with FERC. As a condition of their market-based rate authority, each files Electric Quarterly Reports with FERC. Our Electric Utilities own and operate FERC-jurisdictional interstate transmission facilities and provide open access transmission service under tariffs on file with FERC. Our Electric Utilities are subject to routine audit by FERC with respect to their compliance with FERC’s regulations.
The Federal Power Act authorizes FERC to certify and oversee a national electric reliability organization with authority to promulgate and enforce mandatory reliability standards applicable to all users, owners and operators of the bulk-power system. FERC has certified NERC as the electric reliability organization. NERC has promulgated mandatory reliability standards and NERC, in conjunction with regional reliability organizations that operate under FERC’s and NERC’s authority and oversight, enforces those mandatory reliability standards.
PUHCA 2005. PUHCA 2005 gives FERC authority with respect to the books and records of a utility holding company. As a utility holding company withwhose assets consist primarily of investments in our subsidiaries, including subsidiaries that are public utilities and also a centralized service company subsidiary, BHSC, we are subject to FERC’s authority under PUHCA 2005.
Power Generation Segment
Our Power Generation segment, which operates through Black Hills Electric Generation and its subsidiaries, acquires, develops, constructs and operates our non-regulated power plants. As of December 31, 2019,2020, we held varying interests in independent power plants with a total net ownership of approximately 423 MW.
We produce electric power from our generating plantsfacilities and sell the electric capacity and energy, primarily to affiliates under a combination of mid- to long-term contracts, which mitigates the impactimpacts of a potential downturnvolatility in future power prices. We currently sell a majority of our non-regulated generating capacity under contracts having terms greater than one year.prices and fluctuations in demand.
As of December 31, 2019,2020, the power plant ownership interests held by our Power Generation segment include:
|
| | | | | | |
| Power Plants | Fuel Type | Location | Ownership Interest | Owned Capacity (MW) | In Service Date |
Wygen I (a) | Coal | Gillette, Wyoming | 76.5% | 68.9 |
| 2003 |
| Pueblo Airport Generation | Gas | Pueblo, Colorado | 50.1% | 200.0 |
| 2012 |
Busch Ranch I (b) | Wind | Pueblo, Colorado | 50.0% | 14.5 |
| 2012 |
Busch Ranch II (c) (e) | Wind | Pueblo, Colorado | 100.0% | 60.0 |
| 2019 |
Top of Iowa (d) (e) | Wind | Joice, Iowa | 100.0% | 80.0 |
| 2019 |
| | | | | 423.4 |
| |
| | | | | | | | | | | | | | | | | |
| Power Plants | Fuel Type | Location | Ownership Interest % (d) | Owned Capacity (MW) | In Service Date |
| Wygen I | Coal | Gillette, Wyoming | 76.5% | 68.9 | | 2003 |
Pueblo Airport Generation (a) | Gas | Pueblo, Colorado | 50.1% | 200.0 | | 2012 |
Busch Ranch I (b) | Wind | Pueblo, Colorado | 50.0% | 14.5 | | 2012 |
Busch Ranch II (c) | Wind | Pueblo, Colorado | 100.0% | 60.0 | | 2019 |
Top of Iowa (c) | Wind | Joice, Iowa | 100.0% | 80.0 | | 2019 |
| | | | 423.4 | | |
_________________________
| |
(a) | The Wygen I generation facility is a mine-mouth, coal-fired power plant with a total capacity of 90 MW located at our Gillette, Wyoming energy complex. We own 76.5% of the plant and MEAN owns the remaining 23.5%. |
| |
(b) | On December 11, 2018, Black Hills Electric Generation purchased a 50% ownership interest in Busch Ranch I. This facility originally qualified under the Section 1603 program grant in lieu of ITCs. |
| |
(c) | On November 26, 2019, Black Hills Electric Generation placed in service Busch Ranch II. |
| |
(d) | On February 5, 2019, Black Hills Electric Generation purchased 80 MW of wind generating assets in Iowa. A third-party operates the facility and we sell the wind energy generated in the MISO market. |
| |
(e) | This facility qualifies for PTCs at $25/MWh under IRC 45 during the 10-year period beginning on the date the facility was originally placed in service. |
Power Sales Agreements. Our Power Generation facilities have various long-term power sales agreements. See Note 19 of the Notes to the Consolidated Financial Statements in this Annual Report on Form 10-K for further information.
Third Party Noncontrolling Interest in Subsidiary. (a) In 2016, Black Hills Electric Generation sold a 49.9%, noncontrolling interest in Black Hills Colorado IPP for $216 million to a third party buyer.party. See Note 1214 of the Notes to the Consolidated Financial Statements in this Annual Report on Form 10-K for additional information.
(c) The following table summarizes Busch Ranch II and Top of Iowa facilities qualify for PTCs at $25/MWh for our Power Generation segment:
|
| | | | | | |
| | For the year ended December 31, |
Quantities Sold, Generated and Purchased (MWh) (a) | 2019 | 2018 | 2017 |
| Sold | | | |
| Black Hills Colorado IPP | 935,997 |
| 1,000,577 |
| 943,618 |
|
Black Hills Wyoming(b) | 629,788 |
| 582,938 |
| 645,810 |
|
Black Hills Electric Generation (c) | 167,296 |
| 5,873 |
| — |
|
| Total Sold | 1,733,081 |
| 1,589,388 |
| 1,589,428 |
|
| | | | |
| Generated | | | |
| Black Hills Colorado IPP | 935,997 |
| 1,000,577 |
| 943,618 |
|
Black Hills Wyoming (b) | 557,119 |
| 501,945 |
| 577,124 |
|
Black Hills Electric Generation (c) | 167,296 |
| 5,873 |
| — |
|
| Total Generated | 1,660,412 |
| 1,508,395 |
| 1,520,742 |
|
| | | | |
| Purchased | | | |
Black Hills Wyoming (b) | 74,199 |
| 83,213 |
| 69,377 |
|
| Total Purchased | 74,199 |
| 83,213 |
| 69,377 |
|
____________________
| |
(a) | Company use and losses are not included in the quantities sold, generated and purchased. |
| |
(b) | Under the 20-year economy energy PPA (discussed in Note 19 of the Notes to the Consolidated Financial Statements in this Annual Report on Form 10-K) with the City of Gillette, Black Hills Wyoming purchases energy on behalf of the City of Gillette and sells that energy to the City of Gillette. MWh sold may not equal MWh generated and purchased due to a dispatch agreement Black Hills Wyoming has with South Dakota Electric to cover energy imbalances. |
| |
(c) | Black Hills Electric Generation amounts in this table are related to wind facilities held by our Power Generation segment. Change from 2018 to 2019 is driven by acquisition, and placing in service, of new wind assets. |
(d) Jointly owned facilities are discussed in Note 6 of the Notes to Consolidated Financial Statements in this Annual Report on Form 10-K.
Power Sales Agreements and Operating Agreements.Our Power Generation segment hasfacilities have various mid- to long-term power sales agreements and operating agreements. Key contracts are disclosed in Note 3 of the following material operating agreements:Notes to Consolidated Financial Statements in this Annual Report on Form 10-K.
18
| |
• | Black Hills Wyoming’s economy energy PPA and other ancillary agreements are discussed in Note 19
Table of Contents of the Notes to the Consolidated Financial Statements in this Annual Report on Form 10-K. |
Operating and Maintenance Services Agreement
| |
◦ | In conjunction with the sale of a noncontrolling interest in 2016, an operating and maintenance services agreement was entered into between Black Hills Electric Generation and Black Hills Colorado IPP. This agreement sets forth the obligations and responsibilities of Black Hills Electric Generation as the operator of the generating facility owned by Black Hills Colorado IPP. This agreement became effective on the date of the noncontrolling interest purchase and remains effective as long as the operator or one of its affiliates is responsible for managing the generating facilities in accordance with the noncontrolling interest agreement, or until termination by owner or operator. |
Shared Services Agreements
| |
◦ | South Dakota Electric, Wyoming Electric and Black Hills Wyoming are parties to a shared facilities agreement, whereby each entity is charged for the use of assets by the affiliate entity. |
| |
◦ | Black Hills Colorado IPP and Colorado Electric are parties to a facility fee agreement, whereby Colorado Electric charges Black Hills Colorado IPP for the use of Colorado Electric’s assets. |
| |
◦ | Black Hills Colorado IPP, Wyoming Electric and South Dakota Electric are parties to a Spare Turbine Use Agreement, whereby Black Hills Colorado IPP charges South Dakota Electric and Wyoming Electric a monthly fee for the availability of a spare turbine to support the operation of Cheyenne Prairie. |
| |
◦ | Black Hills Colorado IPP and Black Hills Wyoming receive certain staffing and management services from BHSC. |
| |
• | Jointly owned facilities agreements are discussed in Note 4 of the Notes to the Consolidated Financial Statements in this Annual Report on Form 10-K. |
Competition. The independent power industry consists of many strong and capable competitors, some of which may have more extensive operations or greater financial resources than we possess.
With respect to the merchant power sector, FERC has taken steps to increase access to the national transmission grid by utility and non-utility purchasers and sellers of electricity and foster competition within the wholesale electricity markets. Our Power Generation business could face greater competition if utilities are permitted to robustly invest in power generation assets. Conversely, state regulatory rules requiring utilities to competitively bid generation resources may provide opportunity for independent power producersIPPs in some regions. To date, these initiatives have not had a material impact on our Power Generation segment.
The Energy Policy Act of 1992. The passage of the Energy Policy1992 and Public Utility Holding Company Act of 1992 encouraged independent power production by providing certain exemptions from regulation for EWGs. EWGs are2005 (PUHCA 2005). PUHCA 2005 reiterated the definition and benefits of Exempt Wholesale Generator (EWG) status. Under PUHCA 2005, an EWG is an entity or generator engaged, directly or indirectly through one or more affiliates, exclusively in the business of owning, or operating or both owning and operating all or part of one or more eligible power facilities and selling electric energy at wholesale. Though EWGs are public utilities within the definition set forth in the Federal Power Act and are subject to FERC regulation including rate regulation. We own five EWGs:of rates and charges, they are exempt from other FERC requirements. Through its subsidiaries, Black Hills Corporation is affiliated with three EWGs, Wygen I, Pueblo Airport Generation, Busch Ranch I, Busch Ranch IIGenerating and Top of Iowa. Our EWGs wereEach of these three EWG’s have been granted market-based rate authority, which allows FERC to waive certain accounting, record-keepingauthority.
Operating statistics. See a summary of key operating statistics in the Power Generation segment operating results within Management’s Discussion and reporting requirements imposedAnalysis of Financial Condition and Results of Operations in Item 7 of this Annual Report on public utilities with cost-based rates.Form 10-K.
Mining Segment
Our Mining segment operates a single coal mine through our WRDC subsidiary. We surface mine, process and sell low-sulfur sub-bituminous coal at our mine near Gillette, Wyoming. The WRDC mine, which we acquired in 1956 from Homestake Mining Company, is located in the Powder River Basin in eastern Wyoming.Basin. We produced approximately 3.7 million tons of coal in 2019.2020.
During our surface mining operations, we strip and store the topsoil. We then remove the overburden (earth and rock covering the coal) with heavy equipment. Removal of the overburden typically requires drilling and blasting. Once the coal is exposed, we drill, fracture and systematically remove it, using front-end loaders and conveyors to transport the coal to the mine-mouth generating facilities. We reclaim disturbed areas as part of our normal mining activities by back-filling the pit with overburden removed during the mining process. Once we have replaced the overburden and topsoil, we reestablish vegetation and plant life in accordance with our approved post-mining topography plan.
In a basin characterized by thick coal seams, our overburden ratio, a comparison of the cubic yards of dirt removed to a ton of coal uncovered, has in recent years trended upwards. Theupwards over the last fifteen years. However, the overburden ratio at December 31, 20192020 was 2.17 which decreased from 2.30 which increased fromin the prior year as we continued miningmined in areas with higherlower overburden. We expect our stripping ratio to beincrease to approximately 2.182.27 by the end of 20202021 as we mine in areas with comparablehigher overburden.
Mining rights to the reserves are based on three federal leases and one state lease. The federal leases expire between March 31, 2021 and September 30, 2025 and the state lease expires on August 1, 2023. The duration of the leases varies; however, the lease terms generally are extended to the exhaustion of economically recoverable reserves, as long as active mining continues. The federal lease expiring March 31, 2021 relates to an area we are no longer mining and will not be renewed. The Biden Administration recently issued an executive order that suspends new oil and gas leases on federal lands and eliminates fossil fuel subsidies. However, this moratorium does not apply to federal mining leases and we have not received federal subsidies.
We pay federal and state royalties of 12.5% of the selling price of all coal. As of December 31, 2019,2020, we estimated our recoverable reserves to be approximately 185182 million tons, based on a life-of-mine engineering study utilizing currently available drilling data and geological information prepared by internal engineering studies. The recoverable reserve life is equal to approximately 5049 years at the current production levels. Our recoverable reserve estimates are periodically updated to reflect past production and other geological and mining data. Changes in mining methods or the utilization of new technologies may increase or decrease the recovery basis for a coal seam. Our recoverable reserves include reserves that can be economically and legally extracted at the time of their determination.
Substantially all of the mine’s production is currently sold under contracts to:
•South Dakota Electric for use at the 90 MW Neil Simpson II plant to which we sell approximately 500,000 tons each year. This contract is for the life of the plant;
•Wyoming Electric for use at the 95 MW Wygen II plant to which we sell approximately 550,000 tons each year. This contract is for the life of the plant;
| |
• | The 362 MW Wyodak Plant owned 80% by PacifiCorp and 20% by South Dakota Electric. PacifiCorp is obligated to purchase a minimum of 1.5 million tons each year of the contract term, subject to adjustments for planned outages. South Dakota Electric is also obligated to purchase a minimum of 375,000 tons per year for its 20% share of the power plant, subject to adjustments for planned outages.
•The 362 MW Wyodak Plant owned 80% by PacifiCorp and 20% by South Dakota Electric. PacifiCorp is obligated to purchase a minimum of 1.5 million tons each year, subject to adjustments for planned outages and other contract terms. This contract expires December 31, 2022 and negotiations to extend the contract are ongoing. South Dakota Electric is also obligated to purchase a minimum of 375,000 tons per year for its 20% share of the power plant, subject to adjustments for planned outages and other contract terms;
•and negotiations are underway to extend the contract; |
The 110 MW Wygen III power plant jointly owned 52% by South Dakota Electric, 25% by MDU and 23% by the City of Gillette to which we sell approximately 600,000 tons each year. This contract expires June 1, 2060;year;
•The 90 MW Wygen I power plant jointly owned 76.5% by Black Hills Wyoming and 23.5% by MEAN to which we sell approximately 500,000 tons each year. This contract expires June 30, 2038;year; and
•Certain regional industrial customers served by truck to which we sell a total of approximately 150,000300,000 tons each year. These contracts have terms of one to five years.
Our Mining segment sells coal to South Dakota Electric and Wyoming Electric for all of their requirements under cost-based agreements that regulate earnings from these affiliate sales to a specified return on our mine’s cost-depreciated investment base. The return calculated annually is 400 basis points above Moody’s A-Rated Utility Bond Index applied to our Mining investment base. South Dakota Electric made a commitment to the SDPUC, the WPSC and the City of Gillette that coal for South Dakota Electric’s operating plants would be furnished and priced as provided by that agreement for the life of the Neil Simpson II plant and through June 1, 2060, for Wygen III. The agreement with Wyoming Electric provides coal for the life of the Wygen II plant.
The price of unprocessed coal sold to PacifiCorp for the Wyodak Plant is determined by the supply agreement described above. The agreement included a price adjustment in 2019. The price adjustment essentially allowed us to retain the full economic advantage of the mine’s location adjacent to the plant. The price adjustment was based on market price plus considerations for the avoided costs of rail transportation and an unloading facility, which PacifiCorp would have to incur if it purchased from another mine. In addition, the agreement also provided for the monthly escalation of price based on an escalation factor.
In October 2019, negotiations were completed for the price re-opener in the contract with the Wyodak Plant. The new price was
reset at $17.94 per ton effective July 1, 2019, compared to the prior contract price of $18.25 per ton. The current contract price is comprised of three components: 1) avoided transportation costs (approximately 20% of current price); 2) avoided costs of an unloading facility (approximately 30% of current price); and 3) a rolling 12-month average of the Coal Daily spot market price of 8,400 Btu Powder River Basin coal (approximately 50% of current price).
WRDC supplies coal to Black Hills Wyoming for the Wygen I generating facility for requirements under an agreement usingthrough June 30, 2038. Currently, this agreement uses a base price that includes price escalators and quality adjustments through June 30, 2038 and includes actual cost per ton plus a margin equal to the yield for Moody’s A-Rated Utility Bond Index plus 400 basis points with the base price being adjusted on a 5-year interval. The agreement stipulates that WRDC will supply coal toEffective January 1, 2022, in conjunction with the 90 MWnew Wygen I plant through June 30, 2038.60 MW PPA, WRDC’s current coal supply agreement will be revised using pricing that will be cost-based to regulate earnings to a specified return on the cost-depreciated investment base. For additional information regarding the new Wygen I 60 MW PPA, see Note 3 of the Notes to Consolidated Financial Statements in this Annual Report on Form 10-K.
Competition. Our strategy is to sell the majority of our production to on-site, mine-mouth generation facilities under long-term supply contracts. Historically, any off-site sales have been to consumers within close proximity to the WRDC mine. Rail transport market opportunities for WRDC are limited due to the lower heating value (Btu) of the coal, combined with the fact that the WRDC mine is served by only one railroad, resulting in less competitive transportation rates. Management continues to explore the limited market opportunities for our product through truck transport.
Additionally, coal competes with other energy sources, such as natural gas, wind, solar and hydropower. Costs and other factors relating to these alternative fuels, such as safety, environmental considerations and availability considerations affect the overall demand for coal as a fuel.
Environmental Matters. We are subject to federal, state and local laws and regulations providing for air, water and solid waste pollution control; state facility-siting regulations; zoning and planning regulations of certain state and local authorities; federal health and safety regulations; and state hazard communication standards. See Environmental Matters section for further information.
Mine Reclamation. Reclamation is requiredcompleted during production and after mining has been completed.finished. Under applicable law, we must submit applications to, and receive approval from, the WDEQWyoming Department of Environmental Quality for any mining and reclamation plans that provide for orderly mining, reclamation and restoration of the WRDC mine. We have approved mining permits and are in compliance with other permitting programs administered by various regulatory agencies. The WRDC mine is permitted to operate under a five-year mining permit issued by the State of Wyoming. In 2016, that five-year permit was re-issued.re-issued and we are currently in the process of renewing this permit. Based on extensive reclamation studies, we have accrued approximately $14$13 million for reclamation costs as of December 31, 2019.2020. See additional information in Note 87 of the Notes to the Consolidated Financial Statements in this Annual Report on Form 10-K.
Operating statistics. See a summary of key operating statistics in the Mining segment operating results within Management’s Discussion and Analysis of Financial Condition and Results of Operations in Item 7 of this Annual Report on Form 10-K.
Environmental Matters
In November 2020, we announced clean energy goals to reduce GHG emissions that are based on prudent and proven solutions to reduce our emissions while minimizing cost impacts to our customers. See more information in Key Elements of our Business Strategy within Management’s Discussion and Analysis of Financial Condition and Results of Operations in Item 7 of this Annual Report on Form 10-K.
Environmental Management System (EMS). We operate an EMS that is composed of environmental policies and procedures, voluntary initiatives, objectives and annual targets, operational controls, training, a sophisticated task scheduling/tracking and document control system, and a continuous improvement process. The program attained Colorado’s highest level in their Environmental Leadership Program (Gold Level status in 2014) and has continued this status through 2020.
Methane Rules (Greenhouse Gas Emissions).. The EPA and the State of Colorado have implemented strict regulatory requirements on hydrocarbon and methane emissions associated with natural gas gathering and transmission systems. The BLM repealed similar hydrocarbon and methane emissions reductions it previously established under the Methane Rule (Venting and Flaring rule).Presently, we have four facilities in our Colorado natural gas transmission operations affected by the hydrocarbon and methane reduction rules.
Our operations are currently in compliance with both EPA and State of Colorado rules. Future modifications to our gathering and transmissions systems are anticipated to trigger EPA methane rules. rules that we will adhere to. We developed aWe plan to develop a corporate-wide methane control strategy to address GHG emissions. As a proactive measure in reducing methane emissions asbeyond current regulatory requirements, we anticipate this will behave entered into the EPA’s Methane Challenge Program. This is a requirement in future rule-making efforts.
Water Issues. Our facilities are subject to a variety of state and federal regulations governing existing and potential water/ wastewater discharges and protection of surface waters from oil pollution. Generally, such regulations are promulgated under the Clean Water Act and govern overall water/wastewater discharges through EPA’s surface water discharge and storm water permits. All of our facilities that are required to have such permits have those permits in place and are in compliance with discharge limitations and plan implementation requirements. The EPA proposed effluent limitation guidelines and standards on June 7, 2013, and published the final rule on November 3, 2015. In 2017,voluntary program founded by the EPA postponed the implementation of the rulein collaboration with oil and set a timeline in 2018natural gas companies that recognizes companies that make specific and transparent commitments to revise the rule. To date, the rule is being reviewed by the Office of Management and Budget. This rule will have an impact on the Wyodak Plant. Until the EPA issues the rule for publication, we cannot quantify what the potential impact may be on the Wyodak Plant. The terms of this new regulation may impact the next permit renewal, which will be in 2020.reduce methane emissions.
Short-term Emission Limits. The EPA and State Air Quality Programs implemented short-term emission limits for coal and natural gas-fired generating units during normal and start-up operating scenarios for SO2, NOxSO2, NOx and opacity. The limits pertain to emissions during start-up periods and upset conditions such as mechanical malfunctions. State and federal regulatory agencies typically excuse short-term emissions exceedances if they are reported and corrected immediately or if it occurs during start-up.
We proactively manage this requirement through maintenance efforts and installing additional pollution control systems to control SO2 SO2 emission short-term excursions during start-up. These actions have nearly eliminated our short-term emission limit compliance risk while plant availability remained above 90% for all four of our coal-fired plants. To eliminate the remaining potential for exceedances, an innovative trip logic mechanism was implemented to shut down the power plant down if a predictedwe anticipate the emission limit is towill be exceeded. Similar effortsThere have been takenlimited instances of the trip logic mechanism being used and similar results achieved with our natural gas fired combustion turbine sites as well.we experienced zero exceedances during 2020.
Regional Haze (Impacts to the Wyodak Plant). The EPA Regional Haze rule was promulgated to improve visibility in our National Parks and Wilderness Areas. The State of Wyoming proposed controls in its Regional Haze State Implementation Plan (SIP) which allowed PacifiCorp to install low-NOx burners in the Wyodak Plant, of which South Dakota Electric owns 20%. The EPA did not agree with the State of Wyoming’s determination, and overruled it in a Federal Implementation Plan (FIP). The and proposed a Selective Catalytic Reactor to be installed to control NOx emissions. This would cost South Dakota Electric approximately $27 million due to its 20% ownership of the Wyodak Plant. PacifiCorp and the State of Wyoming and other interested parties are challengingchallenged the EPA’s determination. If the challenge is unsuccessful, additional capital investment would be necessaryPrior to bring the Wyodak Plant into compliance. South Dakota Electric’s 20% share of this capital investment for the facility would be approximately $27 million if PacifiCorp is required to install a Selective Catalytic Reactor for NOx control. The case is currently held in abeyance at the 10th circuit court as the parties work on a settlement. Basin Electric, who is part of the legal action, settled with the EPA. In lieu of goingproceeding to court, PacifiCorp entered into mediation withand the EPA reached a verbal agreement on December 16, 2020, to limit operating hours and conservation groups. PacifiCorp submitted a “Request for Reconsideration” on October 24, 2019determined that low-NOx burners would be considered appropriate to control NOx emissions. This proposed agreement was published in the EPAFederal Register, but remains in the public comment period until March 1, 2021. The final agreement must be published in the Federal Register and provided a copy toapproved in Wyoming’s State Implementation Plan through the court. The purpose of the submittal is to revisit the emission impacts and cost of additional investment.rule making process.
Mining. Operations at the WRDC mine must regularly address issues related to the proximity of the mine disturbance boundary to the City of Gillette and to residential and industrial properties. Homeowner complaints and challenges to the permits may occur as mining operations move closer to residential areas. Specific concerns could include damage to wells, fugitive dust emissions, vibration and an emissions cloud from blasting. The mine makes every effort to reduce these impacts by monitoring blasts, modifying blast techniques to reduce blast vibration, applying dust suppression controls on roads and reclaiming lands to reduce windblown dust.
Former Manufactured Gas Plants (FMGP). Federal and state laws authorize the EPA and other agencies to issue orders compelling potentially responsible parties to clean up sites that are determined to present an actual or potential threat to human health or the environment. We are currently in discussions with the EPA, state regulators, and/or other third-parties to determine the ultimate resolution to these sites. As of December 31, 2019,2020, our Gas Utilities have two active FMGP sites, which are located in Council Bluffs, Iowa, and McCook, Nebraska. ForAt the Council Bluffs site, the delay in clean-up is dueEPA issued an order for the responsible parties to identifyingproceed with an Engineering Evaluation and Cost Analysis (EECA) to clean up the site. Three viable Potential Responsible Parties (PRPs or Successors(PRP) continue to deny their legal attachment to the Operators) to pay forsite. The Company will continue conducting the clean-up. We areEECA and anticipates pursuing the landowner and not the Successors to the Operator, whom would be responsible for paying for the majority of clean-up. We have been working with the EPA to identify the PRPs. The EPA has sent out information requests to the PRPs seeking transaction documents to determine the Successors to the Operators of the site who created the contamination. ForPRP’s through legal action. There is currently no action being taken at the McCook, Nebraska site, we have been contacted by asite. A third-party who intendsinitially indicated they intend to manage and pay for the clean-up at this site. TheHowever, after further investigation, the third-party is conducting site assessments and working withassessed they owned the Stateproperty after the gas plant ceased operations. We expect to conduct an assessment to determine viable PRPs.
For additional information, see Note 3 of Nebraskathe Notes to Consolidated Financial Statements in this Annual Report on a clean-up plan.Form 10-K.
Affordable Clean Energy Rule. The EPA was directed to repeal, revise and replace the Clean Power Plan rule. On August 31, 2018, the EPA published the proposed Affordable Clean Energy (ACE) rule. This rule focusesfocused on heat-rate improvements on coal-fired boiler units. In July 2019, the rule was finalizedunits and appliesapplied only to our coal-fired plants. TheseThe Company’s coal-fired plants havesubject to the rule had implemented or planplanned to implement a majority of the efficiency requirements listed in the rule. On January 19, 2021, a three-judge panel of the U.S. Court of Appeals for the District of Columbia Circuit vacated the ACE rule. The court remanded the regulation regarding carbon dioxide emissions from existing power plants back to the EPA for reconsideration. Currently, there is no rule governing power plant GHG emissions and it is uncertain when a new rule will be promulgated.
OSM Coal Combustion Residual Rule (CCR). The EPA issued the CCR which is currently effective and establishes requirements to protect surface and groundwater from impacts of coal ash impoundments. WRDC is exempt from the EPA CCR because ash is used for backfill reclamation in areas previously mined. The currentOffice of Surface Mining (OSM) was considering CCR rules that would apply to the mine, but these rules were not proposed during the Trump administration. We will continue to monitor to see if the Biden administration has not pursued further modification of the CCR.pursues these rules.
Environmental risk changes constantly with the implementation of new or modified regulations, changing stakeholder interests and needs, and through the introduction of innovative work practices and technologies. We assess risk annually and develop mitigation strategies to successfully and responsibly manage and ensure compliance across the enterprise. For additional information on environmental matters, see Item 1A and Note 193 of the Notes to the Consolidated Financial Statements in this Annual Report on Form 10-K.
Other Properties
In addition to the facilitiesproperties previously disclosed in Items 1 and 2,the sections above, we own or lease several facilities throughout our service territories. Our owned facilities are as follows:
In Rapid City, South Dakota, we haveterritories including a 220,000 square foot corporate headquarters building Horizon Point, which was completed in 2017.
In Arkansas, Colorado, Iowa, Kansas, Nebraska, and Wyoming we own various office, service center, storage, shop and warehouse space totaling over 1,030,000 square feet utilized by our Gas Utilities.
In Colorado, South Dakota, and Wyoming we own various office, service center, storage, shop and warehouse space totaling approximately 305,000 square feet utilized by our Electric Utilities and Mining segments.
In addition to our owned properties, we lease 92,527 square feet of properties within our service areas.
space. Substantially all of the tangible utility properties of South Dakota Electric and Wyoming Electric are subject to liens securing first mortgage bonds issued by South Dakota Electric and Wyoming Electric, respectively.
Human Capital Resources
Overview
Black Hills Corporation is committed to supporting operational excellence by attracting, motivating, retaining and encouraging the development of highly qualified employees. Our employees’ drive and dedication to their work, and their commitment to the safety of our customers and their fellow employees, allows Black Hills Corporation to successfully grow and manage our business year over year. The impacts of COVID-19 to our businesses and employees are discussed in the Company Highlights within Management’s Discussion and Analysis of Financial Condition and Results of Operations in Item 7 of this Annual Report on Form 10-K.
| | | | | |
| Our Team | As of December 31, 2020 |
| Total employees | 3,011 |
| Gender diversity (women as a % of total employees) | 26% |
Women in executive leadership positions (a) | 31% |
| Ethnic diversity (non-white employees as a % of total) | 11% |
| Military veterans | 16% |
| Represented by a union | 25% |
| |
| For the year ended December 31, 2020 |
| Number of external hires | 299 |
| External hires gender diversity (as a % of total external hires) | 29% |
| External hires ethnic diversity (as a % of total external hires) | 16% |
Turnover rate (b) | 8% |
| Retirement rate | 3% |
__________
(a) Executive leadership positions are defined as positions with Vice President, Senior Vice President or Chief in their title.
(b) Includes voluntary and involuntary separations, but excludes internships.
Total Employees
| | | | | |
| Number of Employees |
| At December 31, 2020 |
| Electric Utilities | 379 | |
| Gas Utilities | 1,237 | |
| |
| Power Generation and Mining | 60 | |
| Corporate and Other | 1,335 | |
| Total | 3,011 | |
At December 31, 2019, we had 2,944 employees. Approximately 25% of our employees are represented by a union. We have not experienced any labor stoppages in recent years. At December 31, 2019,2020, approximately 22%21% of our total employees and 25%23% of our Electric and Gas Utilities employees were eligible for regular (age 65 with at least 5 years of service) or early (ages 55 to 64 with at least 5 years of service) retirement.
The following table sets forth the number of employees included in continuing operations:
|
| | |
| Number of Employees |
| At December 31, 2019 |
Corporate and Shared Services | 1,273 |
|
Electric Utilities and Gas Utilities | 1,609 |
|
Power Generation and Mining | 62 |
|
Total | 2,944 |
|
At December 31, 2019,2020, certain employees of our Electric Utilities and Gas Utilities were covered by the following collective bargaining agreements:
agreements as shown in the table below. We have not experienced any labor stoppages in decades. |
| | | | | | | | | | |
| Utility | Number of Employees | Union Affiliation | Expiration Date of Collective Bargaining Agreement |
| Colorado Electric | 10295 |
| IBEW Local 667 | April 15, 2023 |
| South Dakota Electric | 135137 |
| IBEW Local 1250 | March 31, 20242022 |
| Wyoming Electric | 2326 |
| IBEW Local 111 | June 30, 2024 |
| Total Electric Utilities | 258 | | | |
| | | |
| Iowa Gas | 113121 |
| IBEW Local 204 | JulyJanuary 31, 20202026 |
| Kansas Gas | 1817 |
| Communications Workers of America, AFL-CIO Local 6407 | December 31, 2024 |
| Nebraska Gas | 99100 |
| IBEW Local 244 | March 13, 2022 |
Nebraska Gas(a) | 146147 |
| CWA Local 7476 | October 30, 20192023 |
Wyoming Gas(a) | 10115 |
| IBEW Local 111 | June 30, 2024 |
| Wyoming Gas | 84 | | CWA Local 7476 | October 30, 20192023 |
| Total Gas Utilities | 737484 |
| | |
__________
| |
(a) | In the 2016 negotiations with the CWA Local 7476, the union agreed to disclaim their interest in Colorado Gas employees and to split the remaining bargaining unit into two distinct bargaining units, Nebraska Gas and Wyoming Gas. There are ongoing negotiations with both bargaining units at this time. |
| |
ITEM 1A.Total | RISK FACTORS742 | | | |
Attraction
Continuous attraction of qualified team members is critical to our ability to serve our 1.3 million customers safely and efficiently. We actively recruit diverse candidates and continuously evaluate our interviewing and hiring practices to ensure equitable pay and processes. Our attraction efforts include the use of multiple nation-wide job boards, local college and high school outreach programs, a strong college internship program and participation in national and local job fairs. Another key area of attraction is our commitment to our military personnel and veterans. We have targeted attraction efforts specific to military personnel transitioning into civilian life and for veterans of all types.
Diversity & Inclusion
At Black Hills Corporation, we believe in the benefits of diversity, equity and inclusion. We believe that a diverse workforce will assist us in achieving our goals of becoming the safest utility in the nation, providing exceptional customer service and achieving new levels of growth in a rapidly evolving industry. Workforce diversity trends, including diverse new hires, promotions and turnover, are monitored at regular intervals.
Development and Retention
Retaining and developing team members is critical to our continued success. Our retention efforts include competitive compensation programs, career development resources for all employees and internal training programs. Our compensation programs are designed to be strategically aligned, externally competitive, internally equitable, personally motivating, cost effective and legally compliant. Our career development resources include management onboarding, leadership development programs, mentoring programs, individual development assessments and more. Internal training opportunities include corporate-wide trainings such as our code of conduct and specialized training opportunities for different job functions. Our Field Career Path Program (FCPP) promotes career growth through established standards of knowledge, skills, abilities and performance.
ITEM 1A.RISK FACTORS
The nature of our business subjects us to a number of uncertainties and risks. Risks that may adversely affect the business operations, financial condition, results of operations or cash flows are described below. These risk factors, andalong with other risk factors that we discuss in our periodic reports filed with the SEC should be considered for a better understanding of our Company.
STRATEGIC RISKS
Our continued success is dependent on execution of our strategic business plans andincluding our growth strategy.
Our results of operations depend,success depends, in significant part, on our ability to execute our strategic business plans, andincluding our growth strategy. Technology advancements,Our plans and strategy include reducing GHG emissions for our Electric Utilities and Gas Utilities, transforming the customer experience, growing our electric and natural gas customer load, pursuing operating efficiencies and modernizing our utility infrastructure. Our current plans and strategy may be negatively impacted by disruptive forces and innovations in the marketplace, and changing political, business or regulatory conditions, may negatively impactand technology advancements.
In addition, we have significant capital investment programs planned for the next five years that are key to our current plansstrategic business plans. The successful execution of our capital investment program depends on, or could be affected by, a variety of factors that include, but are not limited to: weather conditions, effective management of projects, availability of qualified construction personnel including contractors, changes in commodity and strategies. other prices, availability of materials, governmental approvals and permitting, regulatory cost recovery and return on investment.
An inability to successfully and timely adapt to changing conditions and execute our strategic plans, andincluding our growth strategy could materially affect our financial operating results including earnings, cash flow and liquidity.
We may be subject to unfavorable federal and state regulatory outcomes.
Each of our Electric and Gas Utilities are permitted to recover certain costs (such as increased fuel and purchased power costs) outside of a base rate review. To the extent we are able to pass through such costs to our customers, and the state utility commission subsequently determines that such costs should not have been paid by the customers, we may be required to refund such costs. Any such costs not recovered through rates, or any such refund, could adversely affect financial operating results including earnings, cash flow and liquidity.
We may be subject to future laws, regulations, or actions associated with fossil-fuel generation and GHG emissions.
We own and operate regulated and unregulated electric power plants that burn fossil fuels (natural gas and coal) and a surface mine that extracts and sells coal. We also purchase and deliver natural gas to our customers. These business activities are subject to evolving public concern regarding fossil fuels, GHG emissions (such as carbon dioxide and methane) and their impact on the climate.
Increased rules and regulations associated with fossil fuels and GHG emissions could result in the impairment or retirement of some of our existing or future transmission, distribution, generation and storage facilities or coal mine. Further, these rules could create the need to purchase or build clean-energy fuel sources to fulfill obligations to our customers. These actions could also result in increased operating costs which could adversely impact customers and our financial operating results including earnings, cash flow and liquidity.
Our financial performance depends on the successful management of our facilities operations, including ongoing operation, construction, expansion, and refurbishment.
Operation, construction, expansion and refurbishment of electric generating facilities, electric and natural gas transmission and distribution systems, natural gas storage facilities, and a coal mine involve risks that could result in fires, explosions, property damage and personal injury, including death. These risks include:
Inherent dangers. Electricity and natural gas are dangerous for employees and the general public; contact with power lines, natural gas pipelines, electrical or natural gas service facilities and equipment can result in fires and explosions, causing significant property damage and personal injuries, including death;
Weather, natural conditions and disasters. Severe weather events could negatively impact operations, including our ability to provide energy safely and reliably and our ability to complete construction, expansion or refurbishment of facilities as planned. Extreme natural conditions and other disasters such as wind, lightning, flooding and winter storms, can cause wildfires, electric transmission or distribution pole failures, natural gas pipeline interruptions, outages, property damage and personal injury;
Operating hazards. Operating hazards such as leaks, mechanical problems and accidents, including fires or explosions could impact employee and public safety, reliability and customer confidence;
Labor and labor relations. The cost of recruiting and retaining skilled technical labor or the unavailability of such resources could have a negative impact on our operations. Our ability to transition and replace our retirement-eligible utility employees is a risk; at December 31, 2019, approximately 25% of our Electric Utilities and Gas Utilities employees were eligible for regular or early retirement. Our ability to avoid or minimize supply interruptions, work stoppages and labor disputes is also a risk; approximately 25% of our employees are represented by a total of eight collective bargaining agreements.
Equipment and processes. Breakdown or failure of equipment or processes, the unavailability or increased cost of equipment, and performance below expected levels of output or efficiency could negatively impact our results of operations. New plants may employ recently developed and technologically complex equipment, including newer environmental emission control technology.
Disrupted transmission and distribution. We depend on transmission and distribution facilities, including those operated by unaffiliated parties, to deliver the electricity and gas that we sell to our retail and wholesale customers. If transmission is interrupted physically, mechanically, or with cyber means, our ability to sell or deliver product and satisfy our contractual obligations may be hindered;
Natural gas supply for generation and distribution. Our utilities purchase natural gas from a number of suppliers for our generating facilities and for distribution to our customers. Our results of operations could be negatively impacted by the lack of availability and cost of natural gas, and disruptions in the delivery of natural gas due to various factors, including but not limited to, transportation delays, labor relations, weather and environmental regulations, which could limit our utilities’ ability to operate their facilities;
Replacement power. The cost of supplying or securing replacement power during scheduled and unscheduled outages of generation facilities could negatively impact our results of operations;
Governmental permits. The inability to obtain required governmental permits and approvals along with the cost of complying with or satisfying conditions imposed upon such approvals could negatively impact our ability to operate and our results of operations;
Operational limitations. Operational limitations imposed by environmental and other regulatory requirements and contractual agreements, including those that restrict the timing of generation plant scheduled outages, could negatively impact our results of operations;
Increased costs. Increased capital and operating costs to comply with increasingly stringent environmental and pipeline safety laws and regulations; unexpected engineering, environmental and geological problems; and unanticipated cost overruns could negatively impact our results of operations;
Public opposition. Opposition by members of public or special-interest groups could negatively impact our ability to operate our businesses.
Disruption in the functioning of our information technology and network infrastructure which is vulnerable to disability, failures and unauthorized access. If our information technology systems were to fail and we were unable to recover in a timely manner, we would be unable to fulfill critical business functions.
The ongoing operation of our business involves the risks described above, in addition to risks associated with threats to our overall business model, such as electrification initiatives. Any of these risks could cause us to experience negative financial results and damage to our reputation and public confidence. These risks could cause us to incur significant costs or be unable to deliver energy and/or operate below expected capacity levels, which in turn could reduce revenues or cause us to incur higher operating and maintenance costs and penalties. While we maintain insurance and obtain warranties from vendors and obligate contractors to meet certain performance levels, the proceeds of such insurance and our rights under contracts, warranties or performance guarantees may not be timely or adequate to cover lost revenues, increased expenses, liability or liquidated damage payments.
Our energy production, transmission and distribution activities, and our storage facilities for our natural gas involve numerous risks that may result in accidents and other catastrophic events.
Inherent in our businesses are a variety of hazards and operating risks, such as leaks, blowouts, fires, releases of hazardous materials, explosions and operational problems. Many of our transmission and distribution assets are located near populated residential areas, commercial business centers and industrial sites.
These hazards could result in injury or loss of human life, cause environmental pollution, significantly damage property or natural resources or impair our ability to operate our facilities. While we maintain liability and property insurance coverage, such policies are subject to certain limits and deductibles. The occurrence of any of these events may not be fully covered by our insurance and could have a material adverse effect on our financial operating results including earnings, cash flow and liquidity.
Customer growth and usage in our service territories may fluctuate with current economic conditions, emerging technologies or responses to price increases.
Our financial operating results are impacted by energy demand in our service territories. Customer growth and usage may be impacted by a number of factors, including the voluntary reduction ofin consumption of electricity and natural gas by our customers in response to increases in prices and energy efficiency programs, electrification initiatives that could negatively impact the demand for natural gas, economic conditions impacting customers’ disposable income and the use of distributed generation resources or other emerging technologies. Continued technological improvements may make customer and third-party distributed generation and energy storage systems, including fuel cells, micro-turbines, wind turbines, solar cells and batteries, more cost effective and feasible for our customers. If more customers utilize their own generation, demand for energy from us would decline. Such developments could affect the price of energy and delivery of energy, require further improvements to our distribution systems to address changing load demands and could make portions of our electric system power supply and transmission and/or distribution facilities obsolete prior to the end of their useful lives. Each of these factors could materially affect our financial operating results including earnings, cash flow and liquidity.
Cyberattacks, terrorism,REGULATORY, LEGISLATIVE AND LEGAL RISKS
We may be subject to future laws, regulations, or actions associated with climate change, including those relating to fossil-fuel generation and GHG emissions, which could increase our operating costs or restrict our market opportunities.
We own and operate regulated and unregulated electric power plants that burn fossil fuels (natural gas and coal) and a surface mine that extracts and sells coal. We also purchase, store and deliver natural gas to our customers. These business activities are subject to evolving public concern regarding fossil fuels, GHG emissions (such as carbon dioxide and methane) and their impact on the climate.
There is uncertainty surrounding climate regulation due to legal challenges to some current regulations and anticipated new federal and/or state climate legislation and regulation. The Biden administration has issued executive orders aimed at reducing GHG emissions and declared climate change a national security policy for the first time. New or more stringent regulations or other malicious actsenergy efficiency requirements could disruptrequire us to incur significant additional costs relating to, among other things, the installation of additional emission control equipment, the acceleration of capital expenditures, the purchase of additional emissions allowances or offsets, the acquisition or development of additional energy supply from renewable resources, the closure or capacity reductions of coal-fired power generation facilities and potential increased production from our operations, or lead to a loss or misuse of confidentialcombined cycle natural gas-fired generating units. Increased rules and proprietary information.
To effectively operate our business, we rely upon a sophisticated electronic control system, SCADA, information technology systemsregulations associated with fossil fuels and network infrastructure to collect and retain sensitive information including personal information about our customers and employees. Cyberattacks, terrorism or other malicious acts targeting electronic control systemsGHG emissions could result in a fullthe impairment or partial disruptionretirement of some of our electric and/existing or future transmission, distribution, generation and natural gas operations. Attacks targeting other key information technology systems, includingstorage facilities or our third-party vendors’ information systems,coal mine. Further, these rules could further addcreate the need to a fullpurchase or partial disruption ofbuild clean-energy fuel sources to fulfill obligations to our operations. Any disruption of these operationscustomers. These actions could also result in a loss of service toincreased operating costs which could adversely impact customers and a significant decrease in revenues, as well as significant expense to repair system damage and remedy security breaches. Any theft, loss and/or fraudulent use of customer, shareowner, employee or proprietary data could subject us to significant litigation, liability and costs, as well as adversely impact our reputation with customers and regulators, among others.
We have instituted security measures and safeguards to protect our operational systems and information technology assets, including certain safeguards required by FERC. The security measures and safeguards we have implemented may not always be effective. Despite our implementation of security measures and safeguards, all of our information technology systems may be vulnerable to disability, failures or unauthorized access
Risks associated with deployment of capital may impact our ability to execute our business plans and growth strategy.
We have significant capital investment programs planned for the next five years. The successful execution of our capital investment strategy depends on, or could be affected by, a variety of factors that include, but are not limited to: extreme weather conditions, effective management of projects, availability of qualified construction personnel including contractors, changes in commodity and other prices, governmental approvals and permitting and regulatory cost recovery.
Weather conditions may cause fluctuation in customer usage as well as service disruptions.
Our utility businesses are seasonal businesses and weather conditions and patterns can have a material impact on our operating performance. Demand for electricity is typically greater in the summer and winter months associated with cooling and heating, respectively. Demand for natural gas depends heavily upon winter-weather patterns throughout our service territory and a significant amount of natural gas revenues are recognized in the first and fourth quarters related to the heating season. Accordingly, our utility operations have historically generated lower revenues and income when weather conditions are cooler than normal in the summer and warmer than normal in the winter. Demand for natural gas is also impacted by summer weather patterns that are cooler than normal and provide higher than normal precipitation; both of which can reduce natural gas demand for irrigation. Unusually mild summers and winters, therefore, could have an adverse effect on our results of operations, financial position or cash flows.
Our businesses are located in areas that could be subject to severe weather events such as snow and ice storms, tornadoes, strong winds, significant thunderstorms, flooding and drought. These events could result in lost operating revenues due to outages, property damage, including inoperable generation facilities and downed transmission and distribution lines, and storm restoration activities. We may not be able to recover the costs incurred following these weather events resulting in a negative impact on our financial operating results including earnings, cash flow and liquidity. We cannot definitively estimate the effect of GHG legislation or regulation on our results of operations, financial condition or cash flows.
Future GHG constraints designed to minimize emissions from natural gas could likewise result in increased costs and affect the demand for natural gas as well as the prices charged to customers and the competitive position of natural gas. Certain cities in our operational footprint are focused on electrification and have adopted initiatives to prohibit the construction of new natural gas distribution facilities. Any such initiatives and legislation could have a material impact on our results of operations, financial condition and cash flows.
We may be subject to unfavorable or untimely federal and state regulatory outcomes.
Our regulated Electric and Gas Utilities are subject to cost-of-service/rate-of-return regulation and earnings oversight from federal and eight state utility commissions. This regulatory treatment does not provide any assurance as to achievement of desired earnings levels. Our customer rates are regulated by either the FERC or the respective state utility regulatory authority based on an analysis of our costs and investments, as reviewed and approved in a regulatory proceeding. While rate regulation is premised on the full recovery of prudently incurred costs and a reasonable rate of return on invested capital, there can be no assurance that our various regulatory authorities will judge all of our costs to have been prudently incurred or that the regulatory process in which rates are determined will result in full or timely recovery of our costs and the allowed return on invested capital. In addition, adverse rate decisions, including rate moratoriums, rate refunds, limits on rate increases, lower allowed returns on investments or rate reductions, could be influenced by competitive, economic, political, legislative, public perception and regulatory pressures and adversely impact results of operations, financial condition and cash flows.
Each of our Electric and Gas Utilities are permitted to recover certain costs (such as increased risksfuel and purchased power costs or integrity capital investments) outside of a base rate review in order to stabilize customer rates and reduce regulatory lag. If regulators decide to discontinue these tariff-based recovery mechanisms, it could negatively impact results of operations, financial condition and cash flows.
Costs could significantly increase to achieve or maintain compliance with existing or future environmental laws, regulations or requirements.
Our business segments are subject to numerous environmental laws and regulations affecting many aspects of present and future operations, including air emissions (i.e. SO2, NOx, volatile organic compounds, particulate matter and GHG), water quality, wastewater discharges, solid waste and hazardous waste. These laws and regulations may result in increased capital, operating and other costs. These laws and regulations generally require the business segments to obtain and comply with a wide variety of environmental licenses, permits, inspections and other approvals. Compliance with environmental laws and regulations may require significant expenditures, including expenditures for cleanup costs and damages arising from contaminated properties. Failure or inability to comply with evolving environmental regulations may result in the imposition of fines, penalties and injunctive measures affecting operating assets.
Our business segments may not be successful in recovering increased capital and operating costs incurred to comply with new environmental regulations through existing regulatory rate structures and contracts with customers. More stringent environmental laws or regulations could result in additional costs of operation for existing facilities or impede the development of new facilities. Although it is not expected that the costs to comply with current environmental regulations will have a material adverse effect on our business segments’ financial position, results of operations or cash flows, future environmental compliance costs could have a significant negative impact.
Legislative and regulatory requirements may lead to increased costs and result in compliance penalties.
Business activities in the energy sector are heavily regulated, primarily by agencies of the federal government. Many agencies employ mandatory civil penalty structures for regulatory violations. The FERC, NERC, CFTC, EPA, OSHA, SEC and MSHA may impose significant civil and criminal penalties to enforce compliance requirements relative to our business, which could have a material adverse effect on our financial operating results including earnings, cash flow and liquidity.
Certain Federal laws provide special protection to certain designated animal species. These laws and any state equivalents provide for significant civil and criminal penalties for non-permitted activities that result in harm to or harassment of certain protected animals, including damage to their habitats. If such species are located in an area in which we conduct operations, or if additional species in those areas become subject to protection, our operations and development projects, particularly transmission, generation, wind and pipeline projects, could be restricted or delayed, or we could be required to implement expensive mitigation measures.
Municipal governments may seek to limit or deny our franchise privileges.
Municipal governments within our utility service territories possess the power of condemnation and could establish a municipal utility within a portion of our current service territories by limiting or denying franchise privileges for our operations and exercising powers of condemnation over all or part of our utility assets within municipal boundaries. We regularly engage in negotiations on renewals of franchise agreements with our municipal governments. We have from time to time faced challenges or ballot initiatives on franchise renewals. To date, we have been successful in resolving or defending each of these challenges. Although condemnation is a process that is subject to constitutional protections requiring just and fair compensation, as with any judicial procedure, the outcome is uncertain. If a municipality sought to pursue this course of action, we cannot assure that we would secure adequate recovery of our investment in assets subject to condemnation. We also cannot quantify the impact that such action would have on the remainder of our business operations.
FINANCINGChanges in Federal tax law may significantly impact our business.
We are subject to taxation by the various taxing authorities at the federal, state and local levels where we do business. Similar to the TCJA, sweeping legislation or regulation could be enacted by any of these governmental authorities which may affect our tax burden. Changes may include numerous provisions that affect businesses, including changes to U.S. corporate tax rates, business-related exclusions, and deductions and credits. The outcome of regulatory proceedings regarding the extent to which the effect of a change in corporate tax rate will impact our utility customers and the time period over which the impact will occur could significantly impact future earnings and cash flows. Separately, a challenge by a taxing authority, changes in taxing authorities’ administrative interpretations, decisions, policies and positions, our ability to utilize tax benefits such as carryforwards or tax credits, or a deviation from other tax-related assumptions may cause actual financial results to deviate from previous estimates.
OPERATING RISKS
Our financial performance depends on the successful operation of electric generating facilities, electric and natural gas transmission and distribution systems, natural gas storage facilities, and a coal mine.
The risks associated with management of these operations include:
•Inherent dangers. Electricity and natural gas can be dangerous to employees and the general public. Failures of or contact with power lines, natural gas pipelines or service facilities and equipment may result in fires, explosions, property damage and personal injuries, including death. While we maintain liability and property insurance coverage, such policies are subject to certain limits and deductibles. The occurrence of any of these events may not be fully covered by our insurance;
•Weather, natural conditions and disasters. Severe weather events, such as snow and ice storms, fires, tornadoes, strong winds, significant thunderstorms, flooding and drought, could negatively impact operations, including our ability to provide energy safely, reliably and profitably and our ability to complete construction, expansion or refurbishment of facilities as planned;
•Acts of sabotage, terrorism or other malicious attacks. Damage to our facilities due to deliberate acts could lead to outages or other adverse effects;
•Operating hazards. Operating hazards such as leaks, mechanical problems and accidents, including fires or explosions could impact employee and public safety, reliability and customer confidence;
•Equipment and processes. Breakdown or failure of equipment or processes, unavailability or increased cost of equipment, and performance below expected levels of output or efficiency could negatively impact our results of operations;
•Disrupted transmission and distribution. We depend on transmission and distribution facilities, including those operated by unaffiliated parties, to deliver the electricity and gas that we sell to our retail and wholesale customers. If transmission is interrupted physically, mechanically, or with cyber means, our ability to sell or deliver utility services and satisfy our contractual obligations may be hindered;
•Natural gas supply for generation and distribution. Our regulated utilities and non-regulated entities purchase natural gas from a number of suppliers for our generating facilities and for distribution to our customers. Our results of operations could be negatively impacted by the lack of availability and cost of natural gas, and disruptions in the delivery of natural gas due to various factors, including but not limited to, transportation delays, labor relations, weather and environmental regulations;
•Replacement power. The cost of supplying or securing replacement power during scheduled and unscheduled outages of generation facilities could negatively impact our results of operations;
•Governmental permits. The inability to obtain required governmental permits and approvals along with the cost of complying with or satisfying conditions imposed upon such approvals could negatively impact our ability to operate
and our results of operations;
•Operational limitations. Operational limitations imposed by environmental and other regulatory requirements and contractual agreements, including those that restrict the timing of generation plant scheduled outages, could negatively impact our results of operations;
•Increased costs. Increased capital and operating costs to comply with increasingly stringent laws and regulations; unexpected engineering, environmental and geological problems; and unanticipated cost overruns could negatively impact our results of operations;
•Labor and labor relations. The cost of recruiting and retaining skilled technical labor or the unavailability of such resources could have a negative impact on our operations. Our ability to transition and replace our retirement-eligible utility employees is a risk; at December 31, 2020, approximately 23% of our Electric Utilities and Gas Utilities employees were eligible for regular or early retirement. Our ability to avoid or minimize supply interruptions, work stoppages and labor disputes is also a risk; approximately 25% of our employees are represented by unions;
•Public opposition. Opposition by members of public or special-interest groups could negatively impact our ability to operate our businesses; and
The ongoing operation of our business involves the risks described above, in addition to risks associated with threats to our overall business model, such as electrification initiatives. Any of these risks could cause us to experience negative financial results and damage to our reputation and public confidence. These risks could cause us to incur significant costs or be unable to deliver energy and/or operate below expected capacity levels, which in turn could reduce revenues or cause us to incur higher operating and maintenance costs and penalties. While we maintain insurance and obtain warranties from vendors and obligate contractors to meet certain performance levels, the proceeds of such insurance and our rights under contracts, warranties or performance guarantees may not be timely or adequate to cover lost revenues, increased expenses, liability or liquidated damage payments.
Cyberattacks, terrorism, or other malicious acts targeting our key technology systems could disrupt our operations, or lead to a loss or misuse of confidential and proprietary information.
To effectively operate our business, we rely upon a sophisticated electronic control system, information and operation technology systems and network infrastructure to generate, distribute and deliver energy, and collect and retain sensitive information including personal information about our customers and employees. Cyberattacks, terrorism or other malicious acts targeting electronic control systems could result in a full or partial disruption of our electric and/or gas operations. Attacks targeting other key technology systems, including our third-party vendors’ information systems, could further add to a full or partial disruption of our operations. Any disruption of these operations could result in a loss of service to customers and associated revenues, as well as significant expense to repair damages and remedy security breaches. In addition, any theft, loss and/or fraudulent use of customer, shareowner, employee or proprietary data could subject us to significant litigation, liability and costs, as well as adversely impact our reputation with customers and regulators, among others.
We have instituted security measures and safeguards to protect our operational systems and information technology assets, including certain safeguards required by FERC. Despite our implementation of security measures and safeguards, all of our technology systems may still be vulnerable to disability, failures or unauthorized access.
Weather conditions, including the impacts of climate change, may cause fluctuation in customer usage.
Our utility businesses are seasonal businesses and weather conditions and patterns can have a material impact on our operating performance. To the extent weather conditions are affected by climate change, customers’ energy use could increase or decrease. Demand for electricity is typically greater in the summer and winter months associated with cooling and heating, respectively. Demand for natural gas depends heavily upon winter-weather patterns throughout our service territory and a significant amount of natural gas revenues are recognized in the first and fourth quarters related to the heating season. Accordingly, our utility operations have historically generated lower revenues and income when weather conditions are cooler than normal in the summer and warmer than normal in the winter. Demand for natural gas is also impacted by summer weather patterns that are cooler than normal and provide higher than normal precipitation; both of which can reduce natural gas demand for irrigation. Unusually mild summers and winters, therefore, could have an adverse effect on our financial operating results, including earnings, cash flow and liquidity.
FINANCIAL RISKS
A sub-investment grade credit rating could impact our ability to access capital markets.
Our issuer credit rating is Baa2 (Stable outlook) by Moody’s; BBB+ (Stable outlook) by S&P; and BBB+ (Stable outlook) by Fitch. Reduction of our investment grade credit ratings could impair our ability to refinance or repay our existing debt and complete new financings on reasonable terms, if at all. A credit rating downgrade, particularly to sub-investment grade, could also result in counterparties requiring us to post additional collateral under existing or new contracts. In addition, a ratings downgrade would increase our interest expense under some of our existing debt obligations, including borrowings under our credit facilities, potentially significantly increasing our cost of capital and other associated operating costs.costs which may not be recoverable through existing regulatory rate structures and contracts with customers.
Derivatives regulations could impede our ability to manage business and financial risks by restricting ourOur use of derivative financial instruments as hedges against fluctuating commodity prices and interest rates.
Dodd-Frank contains significant derivatives regulations, including a requirement that certain transactions be cleared resulting in a requirement to post cash collateral (commonly referred to as “margin”) for such transactions. Dodd-Frank provides for a potential exception from these clearing and cash collateral requirements for commercial end-users such as utilities and it includes a number of defined terms that will be used in determining how this exception applies to particular derivative transactions and the parties to those transactions.
We use derivative instruments for our hedging activities for our Gas and Electric Utilities’ operations. We may also use interest rate derivative instruments to minimize the impact of interest rate fluctuations. As a result of Dodd-Frank regulations promulgated by the CFTC, we may be required to post collateral for certain swap transactions we enter into. In addition, our exchange-traded futures contracts are subject to futures margin posting requirements, which could have a significant impact on our business by reducing our ability to execute derivative transactions to reduce commodity price uncertainty and to protect cash flows. Requirements to post collateral may cause significant liquidity issues by reducing our ability to use cash for investment or other corporate purposes, or may require us to increase our level of debt. In addition, a requirement for our counterparties to post collateral could result in additional costs being passed on to us, thereby decreasing our profitability.
Our hedging activities that are designed to protect against commodity price and financial market risks may cause fluctuationscould result in reportedmaterial financial results due to mark-to-market accounting treatment.losses.
We use various financial contracts and physical derivatives, including futures, forwards, options and swaps to manage commodity price and financial marketinterest rate risks. The timing of the recognition of gains or losses on these economic hedges in accordance with GAAP does not always match up with the gains or losses on the commodities being hedged. FluctuatingFor Black Hills Energy Services under the Choice Gas Program, and in certain instances within our regulated Utilities where unrealized and realized gains and losses from derivative instruments are not approved for regulatory accounting treatment, fluctuating commodity prices could have a negative effect on our liquidity,may cause fluctuations in reported financial condition, and results of operations.due to mark-to-market accounting treatment.
Our use of derivative financial instruments could result in material financial losses.
From time to time, we have sought to limit a portion of the potential adverse effects resulting from changes in commodity prices and interest rates by using derivative financial instruments and other hedging mechanisms. To the extent that we hedge our commodity price and interest rate exposures, we forgo the benefits we would otherwise experience if commodity prices or interest rates were to change in our favor. In addition, even though they are closely monitored by management, our hedging activities can result in losses. Such losses could occur under various circumstances, including if a counterparty does not perform its obligations under the hedge arrangement, the hedge is economically imperfect, commodity prices or interest rates move unfavorably related to our physical or financial positions, or hedging policies and procedures are not followed.
Market performance or changes in key valuation assumptionsAdditionally, our exchange-traded futures contracts are subject to futures margin posting requirements. To the extent we are unable to meet these requirements, this could require us to make significant unplanned contributions to our pension plans and other postretirement benefit plans.
Assumptions related to interest rates, expected return on investments, mortality and other key actuarial assumptions have a significant impact on our funding requirementsbusiness by reducing our ability to execute derivative transactions to reduce commodity price uncertainty and the expense recognized related to these plans. An adverse changeprotect cash flows. Requirements to key assumptions associated withpost collateral may cause significant liquidity issues by reducing our defined benefit retirement plansability to use cash for investment or other corporate purposes, or may require significant unplanned contributionsus to the plans whichincrease our level of debt. Further, a requirement for our counterparties to post collateral could adversely affectresult in additional costs being passed on to us, thereby decreasing our financial operating results including earnings, cash flow and liquidity.profitability.
We have a holding company corporate structure with multiple subsidiaries. Corporate dividends and debt payments are dependent upon cash distributions to the holding company from the subsidiaries.
As a holding company, our investments in our subsidiaries are our primary assets. Our operating cash flow and ability to service our indebtedness depend on the operating cash flow of our subsidiaries and the payment of funds by them to us in the form of dividends or advances. Our subsidiaries are separate legal entities that have no obligation to make any funds available for that purpose, whether by dividends or otherwise. In addition, each subsidiary’s ability to pay dividends to us depends on any applicable contractual or regulatory restrictions that may include requirements to maintain minimum levels of cash, working capital, equity or debt service funds.
There is no assurance as to the amount, if any, of future dividends to the holding company because theythese subsidiaries depend on our future earnings, capital requirements and financial condition and are subject to declaration by the Board of Directors. See “Liquidity and Capital Resources” within Management’s Discussion and Analysis of Financial Condition and Results of Operations in Item 7 and Note 9 of our Notes to Consolidated Financial Statements of this Annual Report on Form 10-K for further information regarding these restrictions and their impact on our liquidity.
We may be unable to obtain financing on reasonable terms needed to refinance debt, fund planned capital expenditures or otherwise execute our operating strategy.
Our ability to execute our operating strategy is highly dependent upon our access to capital. Historically, we have addressed our liquidity needs (including funds required to make scheduled principal and interest payments, refinance debt, pay dividends and fund working capital and planned capital expenditures) with operating cash flow, borrowings under credit facilities, proceeds of debt and equity offerings and proceeds from asset sales. Our ability to access the capital markets and the costs and terms of available financing depend on many factors, including changes in our credit ratings, changes in the federal or state regulatory environment affecting energy companies, volatility in commodity or electricity prices and general economic and market conditions.
In addition, because we are a holding company and our utility assets are owned by our subsidiaries, if we are unable to adequately access the credit markets, we could be required to take additional measures designed to ensure that our utility subsidiaries are adequately capitalized to provide safe and reliable service. Possible additional measures would be evaluated in the context of then-prevailing market conditions, prudent financial management and any applicable regulatory requirements.
National and regional economic conditions may cause increased counterparty credit risk, late payments and uncollectible accounts.
A future recession or pandemic, if one occurs, may lead to an increase in late payments or non-payment from retail residential, commercial and industrial utility customers, as well as from our non-utility customers. If late payments and uncollectible accounts increase, earnings and cash flows from our continuing operations may be reduced.
Our abilityWe may be unable to obtain insurance coverage, and the terms of any available insurance coverage could be adversely affected by international, national, state or local events and company-specific events, as well as the financial condition of insurers. Our insurance coveragewe currently have may not provide protection against allapply or may be insufficient to cover a significant losses.loss.
Our ability to obtain insurance, as well as the cost of such insurance, could be impacted by developments affecting the insurance businesses, international, national, state or local events, as well asindustry and the financial condition of insurers. InsuranceAdditionally insurance providers could deny coverage may not continueor decline to be available at all,extend coverage under the same or at rates or onsimilar terms similar to thosethat are presently available to us. A loss for which we are not fullyadequately insured could materially and adversely affect our financial results. Our insuranceThe coverage we currently have in place may not apply to a particular loss, or it may not be sufficient or effective underto cover all circumstances and against all hazards or liabilities to which the Company may be subject, including but not limited toliability and losses associated with wildfire, natural gas and gas storage field explosions, cyber-security breaches, environmental hazards fire-related liability fromand natural eventsdisasters.
Market performance or inadequate facility maintenance, distribution property losses, cyber-security riskschanges in key valuation assumptions could require us to make significant unplanned contributions to our pension plan and dangers that exist inother postretirement benefit plans.
Assumptions related to interest rates, expected return on investments, mortality and other key actuarial assumptions have a significant impact on our funding requirements and the gatheringexpense recognized related to these plans. An adverse change to key assumptions associated with our defined benefit retirement plans may require significant unplanned contributions to the plans which could adversely affect our financial operating results including earnings, cash flow and transportationliquidity.
Costs associated with our healthcare plans and other benefits could increase significantly.
The costs of providing healthcare benefits to our employees and retirees have increased substantially in recent years. We believe that our employee benefit costs, including costs related to healthcare plans for our employees and former employees, will continue to rise. Significant regulatory developments have required, and likely will continue to require, changes to our current employee benefit plans and in oursupporting administrative and accounting processes. Our electric and gas utility rates are regulated on a state-by-state basis by the relevant state regulatory authorities based on an analysis of our costs, as reviewed and approved in a regulatory proceeding. Within our utility rates we have generally recovered the cost of providing employee benefits. As benefit costs continue to rise, there can beis no assurance that the state public utility commissions will allow recovery.recovery of these increased costs. The increasing cost,rising employee benefit costs, or inadequate recovery of rising employee benefitsuch costs, may adversely affect our financial operating results including earnings, cash flow, or liquidity.
An effective systemPANDEMIC RISK
Our business operations, results of internal control may notoperations, financial condition and cash flows could be maintained, leadingadversely affected by the coronavirus (COVID-19) pandemic.
We have responded to material weaknessesthe global pandemic of COVID-19 by taking steps to mitigate the potential risks to us posed by its spread.
For the year ended December 31, 2020, the COVID-19 pandemic had a limited net financial impact on our business operations, financial condition and cash flows. In particular, we experienced:
•Increased allowance for credit losses and bad debt expense due to anticipated customer non-payment as a result of suspended disconnections;
•Increased costs due to sequestration of mission-critical and essential employees;
•Lower commercial and certain transport volumes partially offset by higher electric and natural gas residential usage;
•Waived customer late payment fees;
•Reduced availability of our employees;
•Increased costs for personal protection equipment and cleaning supplies;
•Minimal disruptions receiving the materials and supplies necessary to maintain operations and continue executing our capital investment plan;
•Minimal impacts to the availability of our contractors;
•Minimal decline in internal control overthe funded status of our pension plan;
•Minimal interest expense increase due to disruptions in the Commercial Paper markets; and
•Reduced training, travel, and outside services related expenses.
Should the COVID-19 pandemic continue for a prolonged period or impact the areas we serve more significantly than it has to date, our business operations, financial reporting.condition and cash flows could be impacted in more significant ways. In addition to exacerbating the impacts described above, we could experience:
Section 404•Adverse impacts on our strategic business plans, growth strategy and capital investments;
•Increased adverse impacts to electricity and natural gas demand from our customers, particularly from commercial and industrial customers;
•Further reduction in the availability of our employees and contractors;
•Increased costs as a result of our preventative measures, such as sequestration of essential employees and facility cleaning services;
•Increased allowance for credit losses and bad debt expense as a result of delayed or non-payment from our customers, both of which could be magnified by Federal or state government legislation that requires us to extend suspensions of disconnections for non-payment;
•Delays and disruptions in the availability, timely delivery and cost of materials and components used in our operations;
•Disruptions in the commercial operation dates of certain projects impacting qualification criteria for certain tax credits and triggering potential damages under our power purchase agreements;
•Deterioration of the Sarbanes-Oxley Actcredit quality of 2002 requires management to make an assessment of the design and effectiveness of internal controls. Our independent registered public accounting firm is required to attest to the effectiveness of these controls. During their assessment of these controls, managementour counterparties, including gas commodity contract counterparties, power purchase agreement counterparties, contractors or our independent registered public accounting firm may identify areas of weakness in control design or effectiveness, which may lead to the conclusionretail customers, that a material weakness in internal control exists. Any control deficiencies we identify in the future could adversely affect our ability to report our financial results on a timely and accurate basis, which could result in a losscredit losses;
•Impairment of investor confidence in our financial reportsgoodwill or have a material adverse effectlong-lived assets;
•Adverse impacts on our ability to construct and operate our business or access sourcesfacilities;
•Inability to meet the requirements of liquidity.
A control system, no matter how well designed and operated, can provide only reasonable, not absolute, assurance that the control system’s objectives will be met. If we are unable to assert that our internal controls over financial reporting are effective, market perception of our business, operating results and stock price could be adversely affected.
ENVIRONMENTAL RISKS
Developments in federal and state laws concerning GHG regulations and air emissions relating to climate could materially increase our generation costs and render some of our generating units uneconomical to operate and maintain.
To the extent climate change occurs, our businesses could be adversely impacted. Warmer temperatures during the heating seasoncovenants in our utility service territories, or cooler temperatures during the cooling seasonexisting credit facilities, including covenants regarding Consolidated Indebtedness to Capitalization Ratio;
•Deterioration in our electric service territories couldfinancial metrics or the business environment that adversely affect financial results through lower natural gas volumes delivered, lower MWh soldimpacts our credit ratings;
•Delay in the permitting process of certain development projects, affecting the timing of final investment decisions and associated lower revenues.
start dates of construction;
We own and operate regulated and non-regulated fossil-fuel generating plants in Colorado, South Dakota and Wyoming. Developments under federal and state laws and regulations governing air emissions from fossil-fuel generating plants may result in more stringent emission limitations, which could have a material•Adverse impact on our costsliquidity position and cost of operations. Various pendingand ability to access funds from financial institutions and capital markets; and
•Delays in our ability to change rates through regulatory proceedings.
To date, we have experienced limited impacts to our results of operations, financial condition, cash flows or
final statebusiness plans. However, the situation remains fluid and
EPA regulations that willit is difficult to predict with certainty the potential impact
our facilities are also discussed in Item 1 of
this Annual Report on Form 10-K under the section “Environmental Matters”.
There is uncertainty surrounding current climate regulation due to legal challenges, new federal climate legislation anticipated in the future, or state climate legislation and regulation. We cannot definitively estimate the effect of GHG legislation or regulationCOVID-19 on our results of operations, financial position orcondition and cash flows.
New or more stringent regulations or other energy efficiency requirements could require us to incur significant additional costs relating to, among other things, the installation of additional emission control equipment, the acceleration of capital expenditures, the purchase of additional emissions allowances or offsets, the acquisition or development of additional energy supply from renewable resources, the closure or reduction of load of coal-fired power generation facilities and potential increased load of our combined cycle natural gas-fired generation units. To the extent our regulated fossil-fuel generating plants are included in rate base we will attempt to recover costs associated with complying with emission standards or other requirements. We will also attempt to recover the emission compliance costs of our non-regulated fossil-fuel generating plants from utility and other purchasers of the power generated by those non-regulated power plants. Any unrecovered costs could have a material impact on our results of operations and financial condition. In addition, future changes in environmental regulations governing air emissions could render some of our power generating units more expensive or uneconomical to operate and maintain; this could cause those generating units to be de-commissioned, potentially resulting in impairment costs. We will attempt to recover any remaining asset value; however, any unrecovered costs could have a material impact on our results of operations and financial condition.
The costs to achieve or maintain compliance with existing or future governmental laws, regulations or requirements, or failure to comply, could increase significantly.
Our business segments are subject to numerous environmental laws and regulations affecting many aspects of present and future operations, including air emissions, water quality, wastewater discharges, solid waste and hazardous waste. These laws and regulations may result in increased capital, operating and other costs. These laws and regulations generally require the business segments to obtain and comply with a wide variety of environmental licenses, permits, inspections and other approvals. Compliance with environmental laws and regulations may require significant expenditures, including expenditures for cleanup costs and damages arising from contaminated properties. Failure to comply with environmental regulations may result in the imposition of fines, penalties and injunctive measures affecting operating assets.
The business segments may not be successful in recovering capital and operating costs incurred to comply with new environmental regulations through existing regulatory rate structures and contracts with customers. More stringent environmental laws or regulations could result in additional costs of operation for existing facilities or impede the development of new facilities. Although it is not expected that the costs to comply with current environmental regulations will have a material adverse effect on the business segments’ financial position, results of operations or cash flows, future environmental compliance costs could have a significant negative impact.
The characteristics of coal may make it difficult for coal users to comply with various environmental standards related to coal combustion or utilization.
Future regulations may require further reductions in emissions of mercury, hazardous pollutants, SO2, NOx, volatile organic compounds, particulate matter and GHG, which are released into the air when coal is burned. These requirements could require the installation of costly emission control technology or the implementation of other measures.
Coal competes with other energy sources, such as natural gas, wind, solar and hydropower. The EPA was directed to repeal, revise and replace the CPP rule. At this time, it is not known what effect this will have on coal as a domestic energy source, and could have a significant impact on our mining operations.ITEM 1B.UNRESOLVED STAFF COMMENTS
Existing or proposed legislation focusing on emissions enacted by the United States or individual states could make coal a less attractive fuel alternative for our customers and could impose a tax or fee on the producer of the coal. If our customers decrease the volume of coal they purchase from us or switch to alternative fuels as a result of existing or future environmental regulations aimed at reducing emissions, our financial operating results including earnings, cash flow and liquidity could be adversely impacted.
| |
ITEM 1B. | UNRESOLVED STAFF COMMENTS |
None.
ITEM 3.LEGAL PROCEEDINGS
Information regarding our legal proceedings is incorporated herein by reference to the “Legal Proceedings” sub-caption within Item 8, Note 193, “Commitments“Commitments, Contingencies and Contingencies”Guarantees”, of our Notes to the Consolidated Financial Statements in this Annual Report on Form 10-K.
ITEM 4. MINE SAFETY DISCLOSURES
Information concerning mine safety violations or other regulatory matters required by Sections 1503(a) of the Dodd-Frank Wall Street Reform and Consumer Protection Act is included in Exhibit 95 of this Annual Report.
INFORMATION ABOUT OUR EXECUTIVE OFFICERS
David R. Emery, age 57, has been Executive Chairman since January 1, 2019, Chairman and Chief Executive Officer from 2016 through 2018, and Chairman, President and Chief Executive Officer from 2005 through 2015. Prior to that, he held various positions with the Company, including President and Chief Executive Officer and member of the Board of Directors from 2004 to 2005, President and Chief Operating Officer — Retail Business Segment from 2003 to 2004 and Vice President — Fuel Resources from 1997 to 2003. Mr. Emery has 30 years of experience with the Company.
Linden R. Evans, age 57,58, has been President and Chief Executive Officer since January 1, 2019, President and Chief Operating Officer from 2016 through 2018, and President and Chief Operating Officer — Utilities from 2004 through 2015. Mr. Evans served as the Vice President and General Manager of our former communication subsidiary in 2003 and 2004, and Associate Counsel from 2001 to 2003. Mr. Evans has 1819 years of experience with the Company.
Scott A. Buchholz, age 58,59, has been our Senior Vice President of Strategic Initiatives since July 2020. He served as Senior Vice President — Chief Information Officer sincefrom the closing of the Aquila Transaction in 2008.2008 to 2020. Prior to joining the Company, he was Aquila’s Vice President of Information Technology from 2005 until 2008, Six Sigma Deployment Leader/Black Belt from 2004 until 2005, and General Manager, Corporate Information Technology from 2002 until 2004. Mr. Buchholz has 3940 years of experience with the Company, including 28 years with Aquila. Mr. Buchholz plans to retire on March 8, 2021.
Brian G. Iverson, age 57,58, has been Senior Vice President, General Counsel and Chief Compliance Officer since August 26, 2019. He served as Senior Vice President, General Counsel, Chief Compliance Officer and Corporate Secretary from February 1, 2019 to August 26, 2019, Senior Vice President, General Counsel and Chief Compliance Officer from 2016 to February 2019, Senior Vice President - Regulatory and Governmental Affairs and Assistant General Counsel from 2014 to 2016, Vice President and Treasurer from 2011 to 2014, Vice President - Electric Regulatory Services from 2008 to 2011 and as Corporate Counsel from 2004 to 2008. Mr. Iverson has 1617 years of experience with the Company.
Richard W. Kinzley, age 54,55, has been Senior Vice President and Chief Financial Officer since 2015. He served as Vice President - Corporate Controller from 2013 to 2014, Vice President - Strategic Planning and Development from 2008 to 2013, and as Director of Corporate Development from 2000 to 2008. Mr. Kinzley has 2021 years of experience with the Company.
Jennifer C. Landis, age 45,46, has been Senior Vice President - Chief Human Resources Officer since February 1, 2017. She served as Vice President of Human Resources from April 2016 through January 2017, Director of Corporate Human Resources and Talent Management from 2013 to April 2016, and Director of Organization Development from 2008 to 2013. Ms. Landis has 1819 years of experience with the Company.
Karen Beachy, age 48, has been Senior Vice President - Growth and Strategy since August 26, 2019. She served as Vice President - Growth and Strategy from 2018 to August 2019, Vice President - Supply Chain from 2016 to 2018, and Director of Supply Chain from 2014 to 2016. Ms. Beachy has 5 years of experience with the Company.
Stuart Wevik, age 58,59, has been Senior Vice President - Utility Operations since August 26, 2019. He served as Group Vice President - Electric Utilities from 2016 to August 2019, Vice President - Utility Operations from 2008 to 2016, Vice President - Operations from 2004 to 2008 and Vice President and General Manager from 2003 to 2004. Mr. Wevik has 3435 years of experience with the Company.
Erik Keller, age 57, joined the Company as Senior Vice President and Chief Information Officer on July 27, 2020. Prior to joining the company, he was an Information Technology consultant to Ontic Inc., a global provider of parts and services for legacy aerospace platforms, from January 2020 to July 2020, and Chief Information Officer for BBA Aviation, a global aviation support and aftermarket services provider, from February 2012 to January 2020.
PART II
| |
ITEM 5. | MARKET FOR REGISTRANT’S COMMON EQUITY, RELATED STOCKHOLDER MATTERS AND ISSUER PURCHASES OF EQUITY SECURITIES |
ITEM 5.MARKET FOR REGISTRANT’S COMMON EQUITY, RELATED STOCKHOLDER MATTERS AND ISSUER PURCHASES OF EQUITY SECURITIES
Our common stock is traded on the New York Stock Exchange under the symbol BKH. As of DecemberJanuary 31, 2019,2021, we had 3,5863,537 common shareholders of record and 32,28546,737 beneficial owners, representing all 50 states, the District of Columbia and 6 foreign countries.
We have paid a regular quarterly cash dividend each year since the incorporation of our predecessor company in 1941 and expect to continue paying a regular quarterly dividend for the foreseeable future. At its January 29, 202027, 2021 meeting, our Board of Directors declared a quarterly dividend of $0.535$0.565 per share, equivalent to an annual dividend rate of $2.14$2.26 per share. This equivalent rate, if declared and paid in 2020,2021, will represent 5051 consecutive years of annual dividend increases.
For additional discussion of our dividend policy and factors that may limit our ability to pay dividends, see “Liquidity and Capital Resources” under Item 7, Management’s Discussion and Analysis of Financial Condition and Results of Operations in this Annual Report on Form 10-K.
UNREGISTERED SECURITIES ISSUED
There were no unregistered securities sold during 2019.2020.
ISSUER PURCHASES OF EQUITY SECURITIES
The following table contains monthly information about our acquisitions of equity securities for the three months ended December 31, 2020:
| | | | | | | | | | | | | | |
|
| Period | Total Number of Shares Purchased (a) | Average Price Paid per Share | Total Number of Shares Purchased as Part of Publicly Announced Plans or Programs | Maximum Number (or Approximate Dollar Value) of Shares That May Yet Be Purchased Under the Plans or Programs |
| | | | |
| | | | |
| | | | |
| | | | |
| | | | |
| | | | |
| | | | |
| | | | |
| | | | |
| October 1, 2020 - October 31, 2020 | 1 | $ | 53.95 | | — | | — | |
| November 1, 2020 - November 30, 2020 | 804 | 58.63 | | — | | — | |
| December 1, 2020 - December 31, 2020 | 7,569 | 59.66 | | — | | — | |
| Total | 8,374 | | $ | 59.56 | | — | | — | |
| | | | |
_____________
(a) Shares were acquired under the share withholding provisions of the Omnibus Incentive Plan for payment of taxes associated with the vesting of various equity compensation plans.
|
| | | | |
There were no equity securities acquired for the twelve months ended December 31, 2019. |
| |
ITEM 6. | SELECTED FINANCIAL DATA |
(Minor differences may result due to rounding)
|
| | | | | | | | | | | | | | | | | | | | |
| Years Ended December 31, | 2019 | | 2018 | | 2017 | | 2016 (a) | | 2015 | |
| (dollars in thousands, except per share amounts) | | | | | | | | | |
| | | | | | | | | | | |
Total Assets | $ | 7,558,457 |
| | $ | 6,963,327 |
| | $ | 6,658,902 |
| | $ | 6,541,773 |
| | $ | 4,626,643 |
| |
| | | | | | | | | | | |
Property, Plant and Equipment | | | | | | | | | | |
| Property, plant and equipment | $ | 6,784,679 |
| | $ | 6,000,015 |
| | $ | 5,567,518 |
| | $ | 5,315,296 |
| | $ | 3,849,309 |
| |
| Accumulated depreciation and depletion | (1,281,493 | ) | | (1,145,136 | ) | | (1,026,088 | ) | | (929,119 | ) | | (794,695 | ) | |
| Total property, plant and equipment, net | $ | 5,503,186 |
| | $ | 4,854,879 |
| | $ | 4,541,430 |
| | $ | 4,386,177 |
| | $ | 3,054,614 |
| |
| | | | | | | | | | | |
| Capital Expenditures | | | | | | | | | | |
| Continuing Operations | $ | 849,755 |
| | $ | 502,424 |
| | $ | 337,689 |
| | $ | 460,450 |
| | $ | 289,896 |
| |
Discontinued Operations (b) | — |
| | 2,402 |
| | 23,222 |
| | 6,669 |
| | 168,925 |
| |
| Total Capital Expenditures | $ | 849,755 |
| | $ | 504,826 |
| | $ | 360,911 |
| | $ | 467,119 |
| | $ | 458,821 |
| |
| | | | | | | | | | | |
Capitalization (excluding noncontrolling interests) | | | | | | | | | | |
| Current maturities of long-term debt | $ | 5,743 |
| | $ | 5,743 |
| | $ | 5,743 |
| | $ | 5,743 |
| | $ | — |
| |
| Notes payable | 349,500 |
| | 185,620 |
| | 211,300 |
| | 96,600 |
| | 76,800 |
| |
| Long-term debt, net of current maturities | 3,140,096 |
| | 2,950,835 |
| | 3,109,400 |
| | 3,211,189 |
| | 1,853,682 |
| |
| Total stockholders’ equity | 2,362,123 |
| | 2,181,588 |
| | 1,708,974 |
| | 1,614,639 |
| | 1,465,867 |
| |
| Total capitalization | $ | 5,857,462 |
| | $ | 5,323,786 |
| | $ | 5,035,417 |
| | $ | 4,928,171 |
| | $ | 3,396,349 |
| |
| | | | | | | | | | | |
| Total Operating Revenues | $ | 1,734,900 |
| | $ | 1,754,268 |
| | $ | 1,680,266 |
| | $ | 1,538,916 |
| | $ | 1,261,322 |
| |
| | | | | | | | | | | |
| Net Income Available for Common Stock | | | | | | | | | |
| Income from continuing operations available for common stock | 199,310 |
| (c) (g) | 265,329 |
| (c)(f) | 194,133 |
| (c) (d) | 137,132 |
| (c) (d) | 141,548 |
| (d) |
Income (loss) from discontinued operations, net of tax (b) | — |
| | (6,887 | ) | | (17,099 | ) | | (64,162 | ) | | (173,659 | ) | |
| Net income (loss) available for common stock | $ | 199,310 |
| | $ | 258,442 |
| | $ | 177,034 |
| | $ | 72,970 |
| | $ | (32,111 | ) | |
| | | | | | | | | | | |
Common Stock Data(e) (in thousands) | | | | | | | | | | |
| Shares outstanding, average basic | 60,662 |
| | 54,420 |
| | 53,221 |
| | 51,922 |
| | 45,288 |
| |
| Shares outstanding, average diluted | 60,798 |
| | 55,486 |
| | 55,120 |
| | 53,271 |
| | 45,288 |
| |
| Shares outstanding, end of year | 61,477 |
| | 60,004 |
| | 53,541 |
| | 53,382 |
| | 51,192 |
| |
ITEM 6.SELECTED FINANCIAL DATA continued
We have early adopted the new SEC amendments to modernize, simplify, and enhance certain financial disclosure requirements in Regulation S-K which, among other things, eliminates the requirement to present Selected Financial Data.
|
| | | | | | | | | | | | | | | | | | | | |
| Years Ended December 31, | 2019 | | 2018 | | 2017 | | 2016 | | 2015 | |
| (dollars in thousands, except per share amounts) | | | | | | | | | |
| | | | | | | | | | | |
Earnings (Loss) Per Share of Common Stock (in dollars) | | | | | | | | |
| Basic earnings (loss) per average share - | | | | | | | | | | |
| Continuing operations | $ | 3.52 |
| | $ | 5.14 |
| | $ | 3.92 |
| | $ | 2.83 |
| | $ | 3.12 |
| |
Discontinued operations (b) | — |
| | (0.13 | ) | | (0.32 | ) | | (1.23 | ) | | (3.83 | ) | |
Non-controlling interest (c) | (0.23 | ) | | (0.26 | ) | | (0.27 | ) | | (0.19 | ) | | — |
| |
| Total | $ | 3.29 |
| | $ | 4.75 |
| | $ | 3.33 |
| | $ | 1.41 |
| | $ | (0.71 | ) | |
| Diluted earnings (loss) per average share - | | | | | | | | | |
| Continuing operations | $ | 3.51 |
| | $ | 5.04 |
| | $ | 3.78 |
| | $ | 2.75 |
| | $ | 3.12 |
| |
Discontinued operations (b) | — |
| | (0.12 | ) | | (0.31 | ) | | (1.20 | ) | | (3.83 | ) | |
Non-controlling interest (c) | (0.23 | ) | | (0.26 | ) | | (0.26 | ) | | (0.18 | ) | | — |
| |
| Total | $ | 3.28 |
| | $ | 4.66 |
| | $ | 3.21 |
| | $ | 1.37 |
| | $ | (0.71 | ) | |
| | | | | | | | | | | |
| Cash Dividends Paid on Common Stock | $ | 124,647 |
| | $ | 106,591 |
| | $ | 96,744 |
| | $ | 87,570 |
| | $ | 72,604 |
| |
| | | | | | | | | | | |
| Dividends Declared per Share | $ | 2.05 |
| | $ | 1.93 |
| | $ | 1.81 |
| | $ | 1.68 |
| | $ | 1.62 |
| |
| | | | | | | | | | | |
| Book Value Per Share, End of Year | $ | 38.42 |
| | $ | 36.36 |
| | $ | 31.92 |
| | $ | 30.25 |
| | $ | 28.63 |
| |
| |
(a) | Effective February 12, 2016, we completed the SourceGas Transaction. Total cash consideration paid, net of debt assumed and working capital adjustment received, was $1.124 billion, funded with a combination of the issuance of 6.3 million shares of our common stock on November 23, 2015, 5.98 million equity units issued on November 23, 2015, $546 million of net proceeds from the issuance of senior unsecured notes on January 13, 2016, cash on hand and draws under our revolving credit facility. |
| |
(b) | On November 1, 2017, we made the decision to divest our Oil and Gas assets which was completed in 2018. Oil and Gas results are shown in discontinued operations. 2017 includes a non-cash after-tax fair value impairment on held-for-sale assets of $13 million. 2016 includes non-cash after-tax impairment charges to crude oil and natural gas properties of $67 million. 2015 includes non-cash after-tax impairment charges to crude oil and natural gas properties of $158 million. |
| |
(c) | On April 14, 2016, Black Hills Electric Generation sold a 49.9% interest in Black Hills Colorado IPP. Net income available for common stock for 2019, 2018, 2017 and 2016 was reduced by $14 million, $14 million, $14 million and $9.6 million, respectively, attributable to this noncontrolling interest. |
| |
(d) | 2017, 2016 and 2015 include incremental SourceGas Transaction costs, after-tax of $2.8 million, $30 million and $6.7 million, respectively. |
| |
(e) | In 2019, we issued 1.33 million shares at an average share price of $75.28 under our ATM equity offering program. On November 1, 2018, we issued 6.3 million shares of common stock upon conversion of our Equity Units. In 2016, we issued 1.97 million shares at an average share price of $60.95 under our ATM equity offering program. |
| |
(f) | The increase in 2018 included a $73 million tax benefit resulting from legal entity restructuring. See Note 15 of the Notes to the Consolidated Financial Statements in this Annual Report on Form 10-K for more information. |
| |
(g) | 2019 includes a non-cash after-tax impairment of $15 million in our investment in equity securities of a privately held oil and gas company. See Note 1 of the Notes to the Consolidated Financial Statements in this Annual Report on Form 10-K for more information. |
For additional information on our business segments see Item 7. Management’s Discussion and Analysis of Financial Condition and Results of Operations, Item 7A, Quantitative and Qualitative Disclosures about Market Risk and Note 5 of the Notes to the Consolidated Financial Statements in this Annual Report on Form 10-K.
ITEMS 7 & and 7A.ITEM 7. MANAGEMENT’S DISCUSSION AND ANALYSIS OF FINANCIAL CONDITION AND RESULTS OF OPERATIONS AND QUANTITATIVE AND QUALITATIVE DISCLOSURES ABOUT MARKET RISK
Executive Summary
We are a customer-focused, growth-oriented electric and natural gas utility company with a mission of improving lifeImproving Life with energyEnergy and a vision to be the energy partnerEnergy Partner of choice.Choice. The Company provides electricityelectric and natural gas through its Electric and Gas Utilitiesutility service to 1.3 million customers in 824over 800 communities in eight states, including Arkansas, Colorado, Iowa, Kansas, Montana, Nebraska, South Dakota and Wyoming. We conduct our business operations through four reportable segments: Electric Utilities, Gas Utilities, Power Generation and Mining. Certain unallocated corporate expenses that support our operating segments are presented as Corporate and Other. The Company conducts its utility operations under the name Black Hills Energy predominantly in rural areas of the Rocky Mountains and Midwestern states. The Company’s Electric Utilities are supported by our Power Generation and Mining segments.segments, which are mostly contracted to company affiliates and subject to utility-like regulation and oversight. The Power Generation segment produces electric power from its five generating facilities and sells most of the electric capacity and energy to our Electric Utilities under mid- and long-term contracts. OurThe Mining segment, producesconsisting of a single coal at our only locationmine near Gillette, Wyoming, and sells nearly all production to fuel the five on-site, mine-mouth power generation facilities. With more than 90% of the Company’s assets directly invested in its regulated utility businesses and the Power Generation and Mining segments supporting its electric utilities mainly through long-term contracts, the Company considers itself a domestic, pure-play electric and natural gas utility company.
The Company has provided energy and served customers for 136137 years, since the 1883 gold rush days in Deadwood, South Dakota. Throughout our history, the common thread that unites the past to the present is our commitment to serve our customers and communities. Our strategic focus has not changed in over a century - serving customers with affordable, reliable and safe energy.energy and being strong environmental stewards. Our strategy today continues that emphasis on serving customers but with a renewed focus on better engaging withand being responsive to the people and communities we serve. Customer expectations are rapidly changing with the advancement of technology and customers are demanding simpler, faster and more convenient solutions to their energy needs. WeCustomers and other stakeholders are demanding cleaner energy solutions to address concerns around carbon emissions. In this rapidly changing energy environment, we are Ready to serve as we have done for the past 136 years.serve.
Our strategy consists of five primary areas that focusfocuses on improving the way we serve customers with safe, reliable, affordable and affordablecleaner energy while improving the lives of the customers and communities we serve. The strategyOur emphasis is to 1) become the safest energy companyon consistently outperforming utility industry averages in the utility industry; 2) transformkey safety metrics; transforming the customer experience; 3) growgrowing our electric and natural gas customer load; 4) pursuepursuing operating efficiencies; and 5) modernizemodernizing utility infrastructure. This strategicThese areas of focus will present the company with significant investment needs as we modernize our infrastructure systems, and meet customer growth.growth and fulfill customer expectations for cleaner energy services. It will also allow us to better understand our customer and community needs while providing more intuitive and cost-effective interactions.
Key Elements of our Business Strategy
Modernize, replace and operate utility infrastructure to meet our customers’ energy needs while providing safe, reliable, affordable and affordablecleaner energy. Our utilities own and operate large electric and natural gas infrastructure systems with a geographic footprint that spanspans nearly 1,600 miles.miles of the United States. Our Electric Utilities own and operate 939992 MW of generation capacity and 8,900 miles of transmission and distribution lines and our Gas Utilities own and operate 46,00047,000 miles of natural gas transmission and distribution pipelines. A key strategic focus is to modernize this utility infrastructure to meet customers’ and communities’ varied energy needs, and to ensure the continued delivery of safe, reliable and affordable energy.energy and reduce GHG emission intensity. In addition, we need to invest in the accessibility, capacity and integrity of our systems to meet customer growth.
We rigorously comply with all applicable federal, state and local regulations and strive to consistently meet industry best practice standards. A key component of our modernization effort is the development of programs by our Electric and Gas utilitiesUtilities to systematically and proactively replace aging infrastructure on a system-wide basis. To meet our electric customers’ continued expectations of high levels of reliability, our Electric Utilities utilize a distribution integrity program to ensure the timely repair and replacement of aging infrastructure. Our Gas Utilities utilize a programmatic approach to system-wide pipeline system replacement, particularly in high consequence areas. Under the programmatic approach, obsolete, at-risk and vintage materials are replaced in a proactive and systematic time frame. We have removed all cast- and wrought-iron from our natural gas transmission and distribution systems and continue to replace aging infrastructure through programs that prioritize safety and reliability for our customers. ManyAll but one of our Gas Utilities are authorized to use system safety, integrity and replacement cost recovery mechanisms that provide for customer rate adjustments which reflect the cost incurred in repairing and replacing the gas delivery systems.
As of December 31, 2020, we estimate our five-year capital investment to be approximately $2.7 billion, with most of that investment targeted toward upgrading existing utility infrastructure and to support customer and community growth needs. Our actual
20192020 and forecasted capital expenditures and depreciation for
the next five years from
20202021 through
20242025 are as follows (in millions):
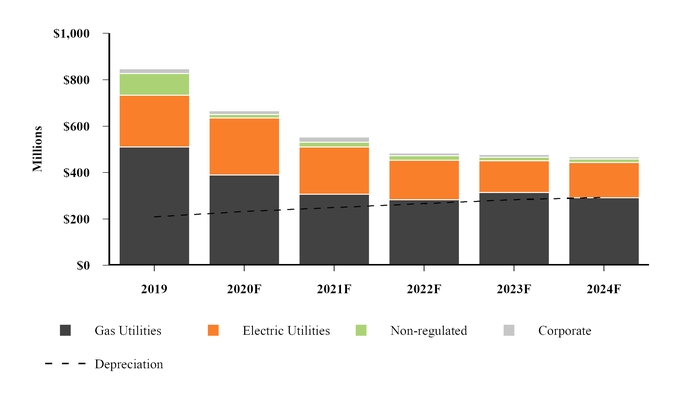
| | | | | | | | | | | | | | | | | | | | | | | |
| Actual | | Forecasted |
Capital Expenditures By Segment (a) : | 2020 | | 2021 | 2022 | 2023 | 2024 | 2025 |
| (in millions) | | | | | | | |
| Electric Utilities | $ | 271 | | | $ | 240 | | $ | 180 | | $ | 143 | | $ | 156 | | $ | 154 | |
| Gas Utilities | 449 | | | 377 | | 347 | | 339 | | 330 | | 326 | |
| Power Generation | 9 | | | 10 | | 9 | | 6 | | 4 | | 5 | |
| Mining | 8 | | | 9 | | 9 | | 9 | | 9 | | 10 | |
| Corporate and Other | 18 | | | 11 | | 5 | | 13 | | 13 | | 13 | |
| Total | $ | 755 | | | $ | 647 | | $ | 550 | | $ | 510 | | $ | 512 | | $ | 508 | |
|
| | | | | | | | | | | | | | | | | | |
| | Actual | Planned | Planned | Planned | Planned | Planned |
| Capital Expenditures By Segment | 2019 | 2020 | 2021 | 2022 | 2023 | 2024 |
| (in millions) | | | | | | |
| Electric Utilities | $ | 223 |
| $ | 246 |
| $ | 203 |
| $ | 170 |
| $ | 137 |
| $ | 152 |
|
| Gas Utilities | 512 |
| 391 |
| 309 |
| 285 |
| 316 |
| 293 |
|
| Power Generation | 85 |
| 7 |
| 9 |
| 11 |
| 6 |
| 6 |
|
| Mining | 9 |
| 8 |
| 12 |
| 9 |
| 9 |
| 9 |
|
| Corporate and Other | 21 |
| 17 |
| 22 |
| 11 |
| 12 |
| 10 |
|
| Total | $ | 850 |
| $ | 669 |
| $ | 555 |
| $ | 486 |
| $ | 480 |
| $ | 470 |
|
Efficiently plan, construct and operate rate base power generation facilities to serve our Electric Utilities. We believe that we best serve customers and communities with a vertically integrated business model for our Electric Utilities. This business model remains a core strength and strategy today as we invest in and operate efficient power generation resources to cost-effectively supply electricity to our customers. We strive to provide power at reasonable rates to our customers and earn competitive returns for our investors.
Our power production strategy focuses on low-cost construction and efficient operation of our generating facilities. Our low power production costs result from a variety of factors including low fuel costs, efficiency in converting fuel into energy, low per unit operating and maintenance costs and high levels of power plant availability. For our coal-fired power plants, we leverage our mine-mouth location advantage to eliminate coal transportation costs that often represent the largest component of the delivered cost of coal for many other utilities. Additionally, we operate our plants with high levels of availability as compared to industry benchmarks.
We continue to believe that ownership of power generation facilities by our Electric Utilities best serves customers. Rate-based generation assets offer several advantages for customers and shareholders, including:
•When generating assets are included in the utility rate base and reviewed and approved by government authorities, customer rates are more stable and predictable, and typically less expensive in the long run; especially when compared to power otherwise purchased from the open market through wholesale contracts that are periodically re-priced to reflect current and varying market conditions;
•Regulators participate in a planning process where long-term investments are designed to match long-term energy demand;
•The lower-risk profile of rate-based generation assets contributes to stronger credit ratings which, in turn, can benefit both customers and investors by lowering the cost of capital; and
•Investors are provided a long-term reasonable,and stable return on their investment.
Proactively integrate alternative and renewable energy into our utility energy supply while mitigating customer rate impacts. SomeIn November 2020, we announced clean energy goals to reduce GHG emissions intensity for our Electric Utilities of 40% by 2030 and 70% by 2040 and achieve GHG reductions of 50% by 2035 for our Gas Utilities. Our goals are based on existing technology and computed from 2005 baseline levels of GHG emissions intensity for our electric operations and natural gas distribution system. Since 2005, we have reduced GHG emissions intensity from our Gas Utilities by more than 33% and achieved a 25% reduction from our Electric Utilities. Colorado Electric has achieved an approximate 50% reduction in GHG emissions since 2005 and is on track to reach Colorado’s 80% carbon reduction goal by 2030. Our goals are based on prudent and proven solutions to reduce our emissions while minimizing cost impacts to our customers. This keeps our customers at the forefront of our decision-making, which is central to our values.
More of our customers, particularly our larger customers, are demanding more renewable and cleaner sources of energy to meet their sustainability goals. In addition, there is more interest from voters,consumers, regulators and legislators to increase the use of renewable and other alternative energy sources. To support this interest, we havecreated the Renewable Ready program for South Dakota and Wyoming customers. In support of this program, we created and received approvals for new, voluntary renewable energy tariffs to serve certain commercial, industrial and governmental agency customer requests for renewable energy resources in South Dakota and Wyoming.resources. To meet the renewable energy commitments under the new tariffs, on November 30, 2020, we also received approval from the Wyoming Public Service Commission to buildcompleted construction and placed into service the Corriedale wind project, a 52.5 MW wind farm to be constructedenergy project near Cheyenne, Wyoming. The $79 million project is expected to be in service by year-end 2020. Supporting our renewable energy efforts in Colorado, in November 2019, we successfully commissioned Busch Ranch II, a 60September 2020, Colorado Electric received approval from the CPUC for its request for approval of its preferred solar bid in support of its Renewable Advantage program, which plans to add up to 200 MW wind farm near Pueblo, Colorado, to provideof renewable energy to our Colorado Electric utility.by the end of 2023.
To date, many states have enacted, and others are considering, mandatory renewable energy standards, requiring utilities to meet certain thresholds of renewable energy generation. In addition, some states have either enacted or are considering legislation setting GHG emissionsemission reduction targets. Federal legislation for both renewable energy standards and GHG emission reductions has been considered and may be implemented in the future. Mandates for the use of renewable energy or the reduction of GHG emissions will likely drive the need for significant investment in our Electric Utilities and Gas Utilities segments. These mandates will also likely increase prices for electricity and/or natural gas for our utility customers. As a regulated utility we are responsible for providing safe, reliable and affordable sources of energy to our customers. Accordingly, we employ a customer-focused strategy for complying with standards and regulations that balances our customers’ rate concerns with environmental considerations and administrative and legislative mandates. We attempt to strike this balance by prudently and proactively incorporating renewable energy into our resource supply, while seeking to minimize the magnitude and frequency of rate increases for our utility customers.
Build and maintain strong relationships with wholesale power customers of our utilities and our power generation business. We strive to build strong relationships with other utilities, municipalities and wholesale customers. We believe we will continue to be an important provider of electricity to wholesale utility customers, who will continue to need products such as capacity and energy to reliably serve their customers. By providing these products under long-term contracts, we help our customers meet their energy needs. We also earn more stable revenues and greater returns for shareholders over the long-term than we would by selling energy into more volatile energy spot markets. In addition, relationships that we have established with wholesale power customers have developed into other opportunities. MEAN, MDU and the City of Gillette, Wyoming were wholesale power customers that are now joint minority owners in two of our power plants, Wygen I and Wygen III, reducing risk and providing steady revenues.
Vertically integrate businesses that are supportive of our Electric and Gas utilityUtility businesses. While our primary focus is onserving customers and growing our core utilities, we selectively invest in vertically integrated businesses that provide cost effective and efficient fuel and energy to our utilities. We currently own and operate power generation and mining assets that are vertically integrated into and supportive ofsupport our Electric Utilities. These operations are located at our utility-generating complexes and are physically integrated into our Electric UtilityUtilities’ operations.
The Power Generation segment currently owns five power facilities, four of which are contracted with our affiliate Electric Utilities under mid- to long-term power purchase agreements. Our Power Generation segment has an experienced staff with significant expertise in planning, building and operating power plants. The power generation team has constructed 20 coal-fired, gas-fired and renewable22 generation projects since 1995 with an aggregate project costsinvestment in excess of $2.1$2.5 billion. This team also provides shared services to our Electric Utilities’ generation facilities, resulting in efficient management of all of the company’s generation assets. In certain states, our Electric Utilities are required to competitively bid for generation resources needed to serve customers. Generally, our Power Generation segment submits bids in response to those competitive solicitations. Our Power Generation segment can often realize competitive advantages provided by prior construction expertise, fuel supply advantages and by co-locating new plants at existing sites, reducing infrastructure and operating costs.
Our small surface coal mine is located immediately adjacent to our Gillette energy complex in northeastern Wyoming, where all five of our remaining coal-fired power plants are located. We operate and own majority interests in four of ourthe five power plants. We own 20% of the fifth power plant which is operated by a majority owner. The mine provides low-sulfur coal directly to these power plants via a conveyor belt system, minimizing transportation costs. On average, the fuel can be delivered to the adjacent power plants at less than $1.00 per MMBtu, providing very cost competitive fuel to our power plants when compared to other coal-fired and natural gas-fired power plants.generating facilities. Nearly all of the mine’s production is sold to the five on-site, mine-mouth generation facilities under long-term supply contracts. Approximately one-half of our production is sold under cost-plus contracts with affiliates. A small portion of the mine’s production is sold to off-site industrial customers and delivered by truck.
Expand utility operations through selective acquisitions of electric and gas utilities. The electric and natural gas utility industries have consolidated significantly over the past two decades and continue to consolidate. We have successfully acquired and integrated numerous utility systems since 2005, including two large, transformational acquisitions - the Aquila Transaction in 2008 and SourceGas Transaction in 2016. Through these acquisitions, we developed a scalable platform that simplifies the rapid integration of acquired utilities, providing significant benefits to both customers and shareholders. The company targets small to large utilities, including municipal and private utility systems, located primarily in geographies that are near to or contiguous with our existing utility service territories and can provide long-term value for both customers and shareholders. In the near-term, we do not expect to pursue large utility acquisitions, particularly given the high valuation multiples realized in recent utility transactions. As pipeline regulations continue to increase, we believe there will be more opportunities to purchase these smaller and more rural utility systems.
Grow our dividend. We are extremely proud of our track record of annual dividend increases for shareholders. 2020 represented our 50th consecutive year of increasing dividends. In January 2020,2021, our Board of Directors declared a quarterly dividend of $0.535$0.565 per share, equivalent to an annual dividend of $2.14$2.26 per share. This current annual equivalent rate of $2.14 per share, if declared and paid in 2020, will represent 50 consecutive years of annual dividend increases. We intend to continue our record of annual dividend increases with a targeted dividend payout ratio of 50% to 60%.
Maintain an investment grade credit rating and ready access to debt and equity capital markets. We require access to the capital markets to fund our planned capital investments or acquire strategic assets that support prudent and earnings accretiveearnings-accretive business growth. We have demonstrated our ability to cost-effectively access the debt and equity markets, while maintaining our investment-grade issuer credit rating.
Prospective InformationPower Generation
Our Power Generation segment, which operates through Black Hills Electric Generation and its subsidiaries, acquires, develops, constructs and operates our non-regulated power plants. As of December 31, 2020, we held varying interests in independent power plants with a total net ownership of 423 MW.
We expectproduce electric power from our generating facilities and sell the electric capacity and energy, primarily to generateaffiliates under a combination of mid- to long-term growthcontracts, which mitigates the impacts of volatility in future power prices and fluctuations in demand.
As of December 31, 2020, the power plant ownership interests held by our Power Generation segment include:
| | | | | | | | | | | | | | | | | |
| Power Plants | Fuel Type | Location | Ownership Interest % (d) | Owned Capacity (MW) | In Service Date |
| Wygen I | Coal | Gillette, Wyoming | 76.5% | 68.9 | | 2003 |
Pueblo Airport Generation (a) | Gas | Pueblo, Colorado | 50.1% | 200.0 | | 2012 |
Busch Ranch I (b) | Wind | Pueblo, Colorado | 50.0% | 14.5 | | 2012 |
Busch Ranch II (c) | Wind | Pueblo, Colorado | 100.0% | 60.0 | | 2019 |
Top of Iowa (c) | Wind | Joice, Iowa | 100.0% | 80.0 | | 2019 |
| | | | 423.4 | | |
_________________________
(a) In 2016, Black Hills Electric Generation sold a 49.9% noncontrolling interest in Black Hills Colorado IPP to a third party. See Note 14 of the Notes to Consolidated Financial Statements in this Annual Report on Form 10-K for additional information. (b) In 2013, Busch Ranch I was awarded a one-time cash grant in lieu of ITCs under the Section 1603 program created under the American Recovery and Reinvestment Act.
(c) The Busch Ranch II and Top of Iowa facilities qualify for PTCs at $25/MWh under IRC 45 during the 10-year period beginning on the date each facility was originally placed in service.
(d) Jointly owned facilities are discussed in Note 6 of the Notes to Consolidated Financial Statements in this Annual Report on Form 10-K.
Power Sales Agreements and Operating Agreements. Our Power Generation facilities have various mid- to long-term power sales agreements and operating agreements. Key contracts are disclosed in Note 3 of the Notes to Consolidated Financial Statements in this Annual Report on Form 10-K.
Competition. The independent power industry consists of many strong and capable competitors, some of which may have more extensive operations or greater financial resources than we possess.
With respect to the merchant power sector, FERC has taken steps to increase access to the national transmission grid by utility and non-utility purchasers and sellers of electricity and foster competition within the wholesale electricity markets. Our Power Generation business could face greater competition if utilities are permitted to robustly invest in power generation assets. Conversely, state regulatory rules requiring utilities to competitively bid generation resources may provide opportunity for IPPs in some regions. To date, these initiatives have not had a material impact on our Power Generation segment.
The Energy Policy Act of 1992 and Public Utility Holding Company Act of 2005 (PUHCA 2005). PUHCA 2005 reiterated the definition and benefits of Exempt Wholesale Generator (EWG) status. Under PUHCA 2005, an EWG is an entity or generator engaged, directly or indirectly through the expansion of integrated utilities and supporting operations. Sustained growth requires continued capital deployment. Our integrated energy portfolio, focused predominately on regulated utilities, provides growth opportunities, yet avoids concentrating business risk. We expect much of our growthone or more affiliates, exclusively in the next few years will comebusiness of owning, operating or both owning and operating all or part of one or more eligible facilities and selling electric energy at wholesale. Though EWGs are public utilities within the definition set forth in the Federal Power Act and are subject to FERC regulation of rates and charges, they are exempt from other FERC requirements. Through its subsidiaries, Black Hills Corporation is affiliated with three EWGs, Wygen I, Pueblo Airport Generating and Top of Iowa. Each of these three EWG’s have been granted market-based rate authority.
Operating statistics. See a summary of key operating statistics in the need for capital deployment at our utilities and continued focus on improving efficiencies and controlling costs. Although dependent on market conditions, we are confident in our ability to obtain additional financing, as necessary, to continue our growth plans. We remain focused on prudently managing our operations and maintaining our overall liquidity to meet ourPower Generation segment operating capital and financing needs, as well as executing our long-term strategic plan. Prospective information for our operating segments should be read in conjunction with our business strategy discussed above, and our 2019 company highlights discussed below.
Our discussion and analysis for the year ended December 31, 2019 compared to 2018, as well as discussion and analysis of the results
of operations for the year ended December 31, 2018 compared to 2017 given segment reporting changes adopted by the Company in 2019, is included herein. For further discussion and analysis that remains unchanged for the year ended December 31, 2018 compared to 2017, please refer to Item 7 of Part II, “Management’swithin Management’s Discussion and Analysis of Financial Condition and Results of
Operations”Operations in
Item 7 of this Annual Report on Form 10-K.
Mining
Our Mining segment operates a single coal mine through our WRDC subsidiary. We surface mine, process and sell low-sulfur sub-bituminous coal at our mine near Gillette, Wyoming. The WRDC mine, which we acquired in 1956 from Homestake Mining Company, is located in the Powder River Basin. We produced approximately 3.7 million tons of coal in 2020.
During our surface mining operations, we strip and store the topsoil. We then remove the overburden (earth and rock covering the coal) with heavy equipment. Removal of the overburden typically requires drilling and blasting. Once the coal is exposed, we drill, fracture and systematically remove it, using front-end loaders and conveyors to transport the coal to the mine-mouth generating facilities. We reclaim disturbed areas as part of our normal mining activities by back-filling the pit with overburden removed during the mining process. Once we have replaced the overburden and topsoil, we reestablish vegetation and plant life in accordance with our approved post-mining topography plan.
In a basin characterized by thick coal seams, our overburden ratio, a comparison of the cubic yards of dirt removed to a ton of coal uncovered, has trended upwards over the last fifteen years. However, the overburden ratio at December 31, 2020 was 2.17 which decreased from 2.30 in the prior year as we mined in areas with lower overburden. We expect our stripping ratio to increase to approximately 2.27 by the end of 2021 as we mine in areas with higher overburden.
Mining rights to the reserves are based on three federal leases and one state lease. The federal leases expire between March 31, 2021 and September 30, 2025 and the state lease expires on August 1, 2023. The duration of the leases varies; however, the lease terms generally are extended to the exhaustion of economically recoverable reserves, as long as active mining continues. The federal lease expiring March 31, 2021 relates to an area we are no longer mining and will not be renewed. The Biden Administration recently issued an executive order that suspends new oil and gas leases on federal lands and eliminates fossil fuel subsidies. However, this moratorium does not apply to federal mining leases and we have not received federal subsidies.
We pay federal and state royalties of 12.5% of the selling price of all coal. As of December 31, 2020, we estimated our recoverable reserves to be approximately 182 million tons, based on a life-of-mine engineering study utilizing currently available drilling data and geological information prepared by internal engineering studies. The recoverable reserve life is equal to approximately 49 years at the current production levels. Our recoverable reserve estimates are periodically updated to reflect past production and other geological and mining data. Changes in mining methods or the utilization of new technologies may increase or decrease the recovery basis for a coal seam. Our recoverable reserves include reserves that can be economically and legally extracted at the time of their determination.
Substantially all of the mine’s production is currently sold under contracts to:
•South Dakota Electric for use at the 90 MW Neil Simpson II plant to which we sell approximately 500,000 tons each year. This contract is for the life of the plant;
•Wyoming Electric for use at the 95 MW Wygen II plant to which we sell approximately 550,000 tons each year. This contract is for the life of the plant;
•The 362 MW Wyodak Plant owned 80% by PacifiCorp and 20% by South Dakota Electric. PacifiCorp is obligated to purchase a minimum of 1.5 million tons each year, subject to adjustments for planned outages and other contract terms. This contract expires December 31, 2022 and negotiations to extend the contract are ongoing. South Dakota Electric is also obligated to purchase a minimum of 375,000 tons per year for its 20% share of the power plant, subject to adjustments for planned outages and other contract terms;
•The 110 MW Wygen III power plant jointly owned 52% by South Dakota Electric, 25% by MDU and 23% by the City of Gillette to which we sell approximately 600,000 tons each year;
•The 90 MW Wygen I power plant jointly owned 76.5% by Black Hills Wyoming and 23.5% by MEAN to which we sell approximately 500,000 tons each year; and
•Certain regional industrial customers served by truck to which we sell a total of approximately 300,000 tons each year. These contracts have terms of one to five years.
Our Mining segment sells coal to South Dakota Electric and Wyoming Electric for all of their requirements under cost-based agreements that regulate earnings from these affiliate sales to a specified return on our mine’s cost-depreciated investment base. The return calculated annually is 400 basis points above Moody’s A-Rated Utility Bond Index applied to our Mining investment base.
The price of unprocessed coal sold to PacifiCorp for the Wyodak Plant is determined by the supply agreement described above. The agreement included a price adjustment in 2019. The price adjustment essentially allowed us to retain the full economic advantage of the mine’s location adjacent to the plant. The price adjustment was based on market price plus considerations for the avoided costs of rail transportation and an unloading facility, which PacifiCorp would have to incur if it purchased from another mine. In addition, the agreement also provided for the monthly escalation of price based on an escalation factor.
In October 2019, negotiations were completed for the price re-opener in the contract with the Wyodak Plant. The new price was
reset at $17.94 per ton effective July 1, 2019, compared to the prior contract price of $18.25 per ton. The current contract price is comprised of three components: 1) avoided transportation costs (approximately 20% of current price); 2) avoided costs of an unloading facility (approximately 30% of current price); and 3) a rolling 12-month average of the Coal Daily spot market price of 8,400 Btu Powder River Basin coal (approximately 50% of current price).
WRDC supplies coal to Black Hills Wyoming for the Wygen I generating facility for requirements under an agreement through June 30, 2038. Currently, this agreement uses a base price that includes price escalators and quality adjustments and includes actual cost per ton plus a margin equal to the yield for Moody’s A-Rated Utility Bond Index plus 400 basis points with the base price being adjusted on a 5-year interval. Effective January 1, 2022, in conjunction with the new Wygen I 60 MW PPA, WRDC’s current coal supply agreement will be revised using pricing that will be cost-based to regulate earnings to a specified return on the cost-depreciated investment base. For additional information regarding the new Wygen I 60 MW PPA, see Note 3 of the Notes to Consolidated Financial Statements in this Annual Report on Form 10-K.
Competition. Our strategy is to sell the majority of our production to on-site, mine-mouth generation facilities under long-term supply contracts. Historically, any off-site sales have been to consumers within close proximity to the WRDC mine. Rail transport market opportunities for WRDC are limited due to the lower heating value (Btu) of the coal, combined with the fact that the WRDC mine is served by only one railroad, resulting in less competitive transportation rates.
Additionally, coal competes with other energy sources, such as natural gas, wind, solar and hydropower. Costs and other factors relating to these alternative fuels, such as safety, environmental and availability considerations affect the overall demand for coal as a fuel.
Environmental Matters. We are subject to federal, state and local laws and regulations providing for air, water and solid waste pollution control; state facility-siting regulations; zoning and planning regulations of certain state and local authorities; federal health and safety regulations; and state hazard communication standards. See Environmental Matters section for further information.
Mine Reclamation. Reclamation is completed during production and after mining has finished. Under applicable law, we must submit applications to, and receive approval from, the Wyoming Department of Environmental Quality for any mining and reclamation plans that provide for orderly mining, reclamation and restoration of the WRDC mine. We have approved mining permits and are in compliance with other permitting programs administered by various regulatory agencies. The WRDC mine is permitted to operate under a five-year mining permit issued by the State of Wyoming. In 2016, that five-year permit was re-issued and we are currently in the process of renewing this permit. Based on extensive reclamation studies, we have accrued approximately $13 million for reclamation costs as of December 31, 2020. See additional information in Note 7 of the Notes to Consolidated Financial Statements in this Annual Report on Form 10-K.
Operating statistics. See a summary of key operating statistics in the Mining segment operating results within Management’s Discussion and Analysis of Financial Condition and Results of Operations in Item 7 of this Annual Report on Form 10-K.
Environmental Matters
In November 2020, we announced clean energy goals to reduce GHG emissions that are based on prudent and proven solutions to reduce our emissions while minimizing cost impacts to our customers. See more information in Key Elements of our Business Strategy within Management’s Discussion and Analysis of Financial Condition and Results of Operations in Item 7 of this Annual Report on Form 10-K.
Environmental Management System (EMS). We operate an EMS that is composed of environmental policies and procedures, voluntary initiatives, objectives and annual targets, operational controls, training, a sophisticated task scheduling/tracking and document control system, and a continuous improvement process. The program attained Colorado’s highest level in their Environmental Leadership Program (Gold Level status in 2014) and has continued this status through 2020.
Methane Rules (Greenhouse Gas Emissions). The EPA and the State of Colorado have implemented strict regulatory requirements on hydrocarbon and methane emissions associated with natural gas gathering and transmission systems. Presently, we have facilities in our natural gas transmission operations affected by the methane reduction rules.
Our operations are in compliance with both EPA and State of Colorado rules. Future modifications to our gathering and transmissions systems are anticipated to trigger EPA methane rules that we will adhere to. We developed a corporate-wide methane control strategy to address GHG emissions. As a proactive measure in reducing methane emissions beyond current regulatory requirements, we have entered into the EPA’s Methane Challenge Program. This is a voluntary program founded by the EPA in collaboration with oil and natural gas companies that recognizes companies that make specific and transparent commitments to reduce methane emissions.
Short-term Emission Limits. The EPA and State Air Quality Programs implemented short-term emission limits for coal and natural gas-fired generating units during normal and start-up operating scenarios for SO2, NOx and opacity. The limits pertain to emissions during start-up periods and upset conditions such as mechanical malfunctions. State and federal regulatory agencies typically excuse short-term emissions exceedances if they are reported and corrected immediately or if it occurs during start-up.
We proactively manage this requirement through maintenance efforts and installing additional pollution control systems to control SO2 emission short-term excursions during start-up. These actions have nearly eliminated our short-term emission limit compliance risk while plant availability remained above 90% for all four of our coal-fired plants. To eliminate the remaining potential for exceedances, an innovative trip logic mechanism was implemented to shut down the power plant if we anticipate the emission limit will be exceeded. There have been limited instances of the trip logic mechanism being used and we experienced zero exceedances during 2020.
Regional Haze (Impacts to the Wyodak Plant). The EPA Regional Haze rule was promulgated to improve visibility in our National Parks and Wilderness Areas.The State of Wyoming proposed controls in its Regional Haze State Implementation Plan (SIP) which allowed PacifiCorp to install low-NOx burners in the Wyodak Plant, of which South Dakota Electric owns 20%. The EPA did not agree with the State of Wyoming’s determination, overruled it in a Federal Implementation Plan (FIP) and proposed a Selective Catalytic Reactor to be installed to control NOx emissions. This would cost South Dakota Electric approximately $27 million due to its 20% ownership of the Wyodak Plant. PacifiCorp and the State of Wyoming challenged the EPA’s determination. Prior to proceeding to court, PacifiCorp and the EPA reached a verbal agreement on December 16, 2020, to limit operating hours and determined that low-NOx burners would be considered appropriate to control NOx emissions. This proposed agreement was published in the Federal Register, but remains in the public comment period until March 1, 2021. The final agreement must be published in the Federal Register and approved in Wyoming’s State Implementation Plan through the rule making process.
Mining. Operations at the WRDC mine must regularly address issues related to the proximity of the mine disturbance boundary to the City of Gillette and to residential properties. Homeowner complaints and challenges to the permits may occur as mining operations move closer to residential areas. Specific concerns could include damage to wells, fugitive dust emissions, vibration and an emissions cloud from blasting. The mine makes every effort to reduce these impacts by monitoring blasts, modifying blast techniques to reduce blast vibration, applying dust suppression controls on roads and reclaiming lands to reduce windblown dust.
Former Manufactured Gas Plants (FMGP). Federal and state laws authorize the EPA and other agencies to issue orders compelling potentially responsible parties to clean up sites that are determined to present an actual or potential threat to human health or the environment. As of December 31, 2020, our Gas Utilities have two active FMGP sites, which are located in Council Bluffs, Iowa, and McCook, Nebraska. At the Council Bluffs site, the EPA issued an order for the responsible parties to proceed with an Engineering Evaluation and Cost Analysis (EECA) to clean up the site. Three viable Potential Responsible Parties (PRP) continue to deny their legal attachment to the site. The Company will continue conducting the EECA and anticipates pursuing the PRP’s through legal action. There is currently no action being taken at the McCook, Nebraska site. A third-party initially indicated they intend to manage and pay for the clean-up at this site. However, after further investigation, the third-party assessed they owned the property after the gas plant ceased operations. We expect to conduct an assessment to determine viable PRPs.
For additional information, see Note 3 of the Notes to Consolidated Financial Statements in this Annual Report on Form 10-K.
Affordable Clean Energy Rule. The EPA was directed to repeal, revise and replace the Clean Power Plan rule. On August 31, 2018, the EPA published the proposed Affordable Clean Energy (ACE) rule. This rule focused on heat-rate improvements on coal-fired boiler units and applied only to our coal-fired plants. The Company’s coal-fired plants subject to the rule had implemented or planned to implement a majority of the efficiency requirements listed in the rule. On January 19, 2021, a three-judge panel of the U.S. Court of Appeals for the District of Columbia Circuit vacated the ACE rule. The court remanded the regulation regarding carbon dioxide emissions from existing power plants back to the EPA for reconsideration. Currently, there is no rule governing power plant GHG emissions and it is uncertain when a new rule will be promulgated.
OSM Coal Combustion Residual Rule (CCR). The EPA issued the CCR which is currently effective and establishes requirements to protect surface and groundwater from impacts of coal ash impoundments. WRDC is exempt from the EPA CCR because ash is used for backfill reclamation in areas previously mined. The Office of Surface Mining (OSM) was considering CCR rules that would apply to the mine, but these rules were not proposed during the Trump administration. We will continue to monitor to see if the Biden administration pursues these rules.
Environmental risk changes constantly with the implementation of new or modified regulations, changing stakeholder interests and needs, and through the introduction of innovative work practices and technologies. We assess risk annually and develop mitigation strategies to successfully and responsibly manage and ensure compliance across the enterprise. For additional information on environmental matters, see Item 1A and Note 3 of the Notes to Consolidated Financial Statements in this Annual Report on Form 10-K.
Other Properties
In addition to the properties previously disclosed in the sections above, we own or lease several facilities throughout our service territories including a corporate headquarters building and various office, service center, storage, shop and warehouse space. Substantially all of the tangible utility properties of South Dakota Electric and Wyoming Electric are subject to liens securing first mortgage bonds issued by South Dakota Electric and Wyoming Electric, respectively.
Human Capital Resources
Overview
Black Hills Corporation is committed to supporting operational excellence by attracting, motivating, retaining and encouraging the development of highly qualified employees. Our employees’ drive and dedication to their work, and their commitment to the safety of our customers and their fellow employees, allows Black Hills Corporation to successfully grow and manage our business year over year. The impacts of COVID-19 to our businesses and employees are discussed in the Company Highlights within Management’s Discussion and Analysis of Financial Condition and Results of Operations in Item 7 of this Annual Report on Form 10-K.
| | | | | |
| Our Team | As of December 31, 2020 |
| Total employees | 3,011 |
| Gender diversity (women as a % of total employees) | 26% |
Women in executive leadership positions (a) | 31% |
| Ethnic diversity (non-white employees as a % of total) | 11% |
| Military veterans | 16% |
| Represented by a union | 25% |
| |
| For the year ended December 31, 2020 |
| Number of external hires | 299 |
| External hires gender diversity (as a % of total external hires) | 29% |
| External hires ethnic diversity (as a % of total external hires) | 16% |
Turnover rate (b) | 8% |
| Retirement rate | 3% |
__________
(a) Executive leadership positions are defined as positions with Vice President, Senior Vice President or Chief in their title.
(b) Includes voluntary and involuntary separations, but excludes internships.
Total Employees
| | | | | |
| Number of Employees |
| At December 31, 2020 |
| Electric Utilities | 379 | |
| Gas Utilities | 1,237 | |
| |
| Power Generation and Mining | 60 | |
| Corporate and Other | 1,335 | |
| Total | 3,011 | |
At December 31, 2020, approximately 21% of our total employees and 23% of our Electric and Gas Utilities employees were eligible for regular (age 65 with at least 5 years of service) or early (ages 55 to 64 with at least 5 years of service) retirement.
Collective Bargaining Agreements
At December 31, 2020, certain employees of our Electric Utilities and Gas Utilities were covered by the collective bargaining agreements as shown in the table below. We have not experienced any labor stoppages in decades.
| | | | | | | | | | | |
| Utility | Number of Employees | Union Affiliation | Expiration Date of Collective Bargaining Agreement |
| Colorado Electric | 95 | | IBEW Local 667 | April 15, 2023 |
| South Dakota Electric | 137 | | IBEW Local 1250 | March 31, 2022 |
| Wyoming Electric | 26 | | IBEW Local 111 | June 30, 2024 |
| Total Electric Utilities | 258 | | | |
| | | |
| Iowa Gas | 121 | | IBEW Local 204 | January 31, 2026 |
| Kansas Gas | 17 | | Communications Workers of America, AFL-CIO Local 6407 | December 31, 2024 |
| Nebraska Gas | 100 | | IBEW Local 244 | March 13, 2022 |
| Nebraska Gas | 147 | | CWA Local 7476 | October 30, 2023 |
| Wyoming Gas | 15 | | IBEW Local 111 | June 30, 2024 |
| Wyoming Gas | 84 | | CWA Local 7476 | October 30, 2023 |
| Total Gas Utilities | 484 | | | |
| | | |
| Total | 742 | | | |
Attraction
Continuous attraction of qualified team members is critical to our ability to serve our 1.3 million customers safely and efficiently. We actively recruit diverse candidates and continuously evaluate our interviewing and hiring practices to ensure equitable pay and processes. Our attraction efforts include the use of multiple nation-wide job boards, local college and high school outreach programs, a strong college internship program and participation in national and local job fairs. Another key area of attraction is our commitment to our military personnel and veterans. We have targeted attraction efforts specific to military personnel transitioning into civilian life and for veterans of all types.
Diversity & Inclusion
At Black Hills Corporation, we believe in the benefits of diversity, equity and inclusion. We believe that a diverse workforce will assist us in achieving our goals of becoming the safest utility in the nation, providing exceptional customer service and achieving new levels of growth in a rapidly evolving industry. Workforce diversity trends, including diverse new hires, promotions and turnover, are monitored at regular intervals.
Development and Retention
Retaining and developing team members is critical to our continued success. Our retention efforts include competitive compensation programs, career development resources for all employees and internal training programs. Our compensation programs are designed to be strategically aligned, externally competitive, internally equitable, personally motivating, cost effective and legally compliant. Our career development resources include management onboarding, leadership development programs, mentoring programs, individual development assessments and more. Internal training opportunities include corporate-wide trainings such as our code of conduct and specialized training opportunities for different job functions. Our Field Career Path Program (FCPP) promotes career growth through established standards of knowledge, skills, abilities and performance.
ITEM 1A.RISK FACTORS
The nature of our business subjects us to a number of uncertainties and risks. Risks that may adversely affect the business operations, financial condition, results of operations or cash flows are described below. These risk factors, along with other risk factors that we discuss in our periodic reports filed with the SEC should be considered for a better understanding of our Company.
STRATEGIC RISKS
Our continued success is dependent on execution of our strategic business plans including our growth strategy.
Our success depends, in significant part, on our ability to execute our strategic business plans, including our growth strategy. Our plans and strategy include reducing GHG emissions for our Electric Utilities and Gas Utilities, transforming the customer experience, growing our electric and natural gas customer load, pursuing operating efficiencies and modernizing our utility infrastructure. Our current plans and strategy may be negatively impacted by disruptive forces and innovations in the marketplace, changing political, business or regulatory conditions, and technology advancements.
In addition, we have significant capital investment programs planned for the next five years that are key to our strategic business plans. The successful execution of our capital investment program depends on, or could be affected by, a variety of factors that include, but are not limited to: weather conditions, effective management of projects, availability of qualified construction personnel including contractors, changes in commodity and other prices, availability of materials, governmental approvals and permitting, regulatory cost recovery and return on investment.
An inability to successfully and timely adapt to changing conditions and execute our strategic plans, including our growth strategy could materially affect our financial operating results including earnings, cash flow and liquidity.
Customer growth and usage in our service territories may fluctuate with economic conditions, emerging technologies or responses to price increases.
Our financial operating results are impacted by energy demand in our service territories. Customer growth and usage may be impacted by a number of factors, including the voluntary reduction in consumption of electricity and natural gas by our customers in response to increases in prices and energy efficiency programs, electrification initiatives that could negatively impact the demand for natural gas, economic conditions impacting customers’ disposable income and the use of distributed generation resources or other emerging technologies. Continued technological improvements may make customer and third-party distributed generation and energy storage systems, including fuel cells, micro-turbines, wind turbines, solar cells and batteries, more cost effective and feasible for our customers. If more customers utilize their own generation, demand for energy from us would decline. Such developments could affect the price of energy and delivery of energy, require further improvements to our distribution systems to address changing load demands and could make portions of our electric system power supply and transmission and/or distribution facilities obsolete prior to the end of their useful lives. Each of these factors could materially affect our financial operating results including earnings, cash flow and liquidity.
REGULATORY, LEGISLATIVE AND LEGAL RISKS
We may be subject to future laws, regulations, or actions associated with climate change, including those relating to fossil-fuel generation and GHG emissions, which could increase our operating costs or restrict our market opportunities.
We own and operate regulated and unregulated electric power plants that burn fossil fuels (natural gas and coal) and a surface mine that extracts and sells coal. We also purchase, store and deliver natural gas to our customers. These business activities are subject to evolving public concern regarding fossil fuels, GHG emissions (such as carbon dioxide and methane) and their impact on the climate.
There is uncertainty surrounding climate regulation due to legal challenges to some current regulations and anticipated new federal and/or state climate legislation and regulation. The Biden administration has issued executive orders aimed at reducing GHG emissions and declared climate change a national security policy for the first time. New or more stringent regulations or other energy efficiency requirements could require us to incur significant additional costs relating to, among other things, the installation of additional emission control equipment, the acceleration of capital expenditures, the purchase of additional emissions allowances or offsets, the acquisition or development of additional energy supply from renewable resources, the closure or capacity reductions of coal-fired power generation facilities and potential increased production from our combined cycle natural gas-fired generating units. Increased rules and regulations associated with fossil fuels and GHG emissions could result in the impairment or retirement of some of our existing or future transmission, distribution, generation and natural gas storage facilities or our coal mine. Further, these rules could create the need to purchase or build clean-energy fuel sources to fulfill obligations to our customers. These actions could also result in increased operating costs which could adversely impact customers and our financial operating results including earnings, cash flow and liquidity. We cannot definitively estimate the effect of GHG legislation or regulation on our results of operations, financial condition or cash flows.
Future GHG constraints designed to minimize emissions from natural gas could likewise result in increased costs and affect the demand for natural gas as well as the prices charged to customers and the competitive position of natural gas. Certain cities in our operational footprint are focused on electrification and have adopted initiatives to prohibit the construction of new natural gas distribution facilities. Any such initiatives and legislation could have a material impact on our results of operations, financial condition and cash flows.
We may be subject to unfavorable or untimely federal and state regulatory outcomes.
Our regulated Electric and Gas Utilities are subject to cost-of-service/rate-of-return regulation and earnings oversight from federal and eight state utility commissions. This regulatory treatment does not provide any assurance as to achievement of desired earnings levels. Our customer rates are regulated by either the FERC or the respective state utility regulatory authority based on an analysis of our costs and investments, as reviewed and approved in a regulatory proceeding. While rate regulation is premised on the full recovery of prudently incurred costs and a reasonable rate of return on invested capital, there can be no assurance that our various regulatory authorities will judge all of our costs to have been prudently incurred or that the regulatory process in which rates are determined will result in full or timely recovery of our costs and the allowed return on invested capital. In addition, adverse rate decisions, including rate moratoriums, rate refunds, limits on rate increases, lower allowed returns on investments or rate reductions, could be influenced by competitive, economic, political, legislative, public perception and regulatory pressures and adversely impact results of operations, financial condition and cash flows.
Each of our Electric and Gas Utilities are permitted to recover certain costs (such as increased fuel and purchased power costs or integrity capital investments) outside of a base rate review in order to stabilize customer rates and reduce regulatory lag. If regulators decide to discontinue these tariff-based recovery mechanisms, it could negatively impact results of operations, financial condition and cash flows.
Costs could significantly increase to achieve or maintain compliance with existing or future environmental laws, regulations or requirements.
Our business segments are subject to numerous environmental laws and regulations affecting many aspects of present and future operations, including air emissions (i.e. SO2, NOx, volatile organic compounds, particulate matter and GHG), water quality, wastewater discharges, solid waste and hazardous waste. These laws and regulations may result in increased capital, operating and other costs. These laws and regulations generally require the business segments to obtain and comply with a wide variety of environmental licenses, permits, inspections and other approvals. Compliance with environmental laws and regulations may require significant expenditures, including expenditures for cleanup costs and damages arising from contaminated properties. Failure or inability to comply with evolving environmental regulations may result in the imposition of fines, penalties and injunctive measures affecting operating assets.
Our business segments may not be successful in recovering increased capital and operating costs incurred to comply with new environmental regulations through existing regulatory rate structures and contracts with customers. More stringent environmental laws or regulations could result in additional costs of operation for existing facilities or impede the development of new facilities. Although it is not expected that the costs to comply with current environmental regulations will have a material adverse effect on our business segments’ financial position, results of operations or cash flows, future environmental compliance costs could have a significant negative impact.
Legislative and regulatory requirements may lead to increased costs and result in compliance penalties.
Business activities in the energy sector are heavily regulated, primarily by agencies of the federal government. Many agencies employ mandatory civil penalty structures for regulatory violations. The FERC, NERC, CFTC, EPA, OSHA, SEC and MSHA may impose significant civil and criminal penalties to enforce compliance requirements relative to our business, which could have a material adverse effect on our financial operating results including earnings, cash flow and liquidity.
Municipal governments may seek to limit or deny our franchise privileges.
Municipal governments within our utility service territories possess the power of condemnation and could establish a municipal utility within a portion of our current service territories by limiting or denying franchise privileges for our operations and exercising powers of condemnation over all or part of our utility assets within municipal boundaries. We regularly engage in negotiations on renewals of franchise agreements with our municipal governments. We have from time to time faced challenges or ballot initiatives on franchise renewals. To date, we have been successful in resolving or defending each of these challenges. Although condemnation is a process that is subject to constitutional protections requiring just and fair compensation, as with any judicial procedure, the outcome is uncertain. If a municipality sought to pursue this course of action, we cannot assure that we would secure adequate recovery of our investment in assets subject to condemnation. We also cannot quantify the impact that such action would have on the remainder of our business operations.
Changes in Federal tax law may significantly impact our business.
We are subject to taxation by the various taxing authorities at the federal, state and local levels where we do business. Similar to the TCJA, sweeping legislation or regulation could be enacted by any of these governmental authorities which may affect our tax burden. Changes may include numerous provisions that affect businesses, including changes to U.S. corporate tax rates, business-related exclusions, and deductions and credits. The outcome of regulatory proceedings regarding the extent to which the effect of a change in corporate tax rate will impact our utility customers and the time period over which the impact will occur could significantly impact future earnings and cash flows. Separately, a challenge by a taxing authority, changes in taxing authorities’ administrative interpretations, decisions, policies and positions, our ability to utilize tax benefits such as carryforwards or tax credits, or a deviation from other tax-related assumptions may cause actual financial results to deviate from previous estimates.
OPERATING RISKS
Our financial performance depends on the successful operation of electric generating facilities, electric and natural gas transmission and distribution systems, natural gas storage facilities, and a coal mine.
The risks associated with management of these operations include:
•Inherent dangers. Electricity and natural gas can be dangerous to employees and the general public. Failures of or contact with power lines, natural gas pipelines or service facilities and equipment may result in fires, explosions, property damage and personal injuries, including death. While we maintain liability and property insurance coverage, such policies are subject to certain limits and deductibles. The occurrence of any of these events may not be fully covered by our insurance;
•Weather, natural conditions and disasters. Severe weather events, such as snow and ice storms, fires, tornadoes, strong winds, significant thunderstorms, flooding and drought, could negatively impact operations, including our ability to provide energy safely, reliably and profitably and our ability to complete construction, expansion or refurbishment of facilities as planned;
•Acts of sabotage, terrorism or other malicious attacks. Damage to our facilities due to deliberate acts could lead to outages or other adverse effects;
•Operating hazards. Operating hazards such as leaks, mechanical problems and accidents, including fires or explosions could impact employee and public safety, reliability and customer confidence;
•Equipment and processes. Breakdown or failure of equipment or processes, unavailability or increased cost of equipment, and performance below expected levels of output or efficiency could negatively impact our results of operations;
•Disrupted transmission and distribution. We depend on transmission and distribution facilities, including those operated by unaffiliated parties, to deliver the electricity and gas that we sell to our retail and wholesale customers. If transmission is interrupted physically, mechanically, or with cyber means, our ability to sell or deliver utility services and satisfy our contractual obligations may be hindered;
•Natural gas supply for generation and distribution. Our regulated utilities and non-regulated entities purchase natural gas from a number of suppliers for our generating facilities and for distribution to our customers. Our results of operations could be negatively impacted by the lack of availability and cost of natural gas, and disruptions in the delivery of natural gas due to various factors, including but not limited to, transportation delays, labor relations, weather and environmental regulations;
•Replacement power. The cost of supplying or securing replacement power during scheduled and unscheduled outages of generation facilities could negatively impact our results of operations;
•Governmental permits. The inability to obtain required governmental permits and approvals along with the cost of complying with or satisfying conditions imposed upon such approvals could negatively impact our ability to operate
and our results of operations;
•Operational limitations. Operational limitations imposed by environmental and other regulatory requirements and contractual agreements, including those that restrict the timing of generation plant scheduled outages, could negatively impact our results of operations;
•Increased costs. Increased capital and operating costs to comply with increasingly stringent laws and regulations; unexpected engineering, environmental and geological problems; and unanticipated cost overruns could negatively impact our results of operations;
•Labor and labor relations. The cost of recruiting and retaining skilled technical labor or the unavailability of such resources could have a negative impact on our operations. Our ability to transition and replace our retirement-eligible utility employees is a risk; at December 31, 2020, approximately 23% of our Electric Utilities and Gas Utilities employees were eligible for regular or early retirement. Our ability to avoid or minimize supply interruptions, work stoppages and labor disputes is also a risk; approximately 25% of our employees are represented by unions;
•Public opposition. Opposition by members of public or special-interest groups could negatively impact our ability to operate our businesses; and
The ongoing operation of our business involves the risks described above, in addition to risks associated with threats to our overall business model, such as electrification initiatives. Any of these risks could cause us to experience negative financial results and damage to our reputation and public confidence. These risks could cause us to incur significant costs or be unable to deliver energy and/or operate below expected capacity levels, which in turn could reduce revenues or cause us to incur higher operating and maintenance costs and penalties. While we maintain insurance and obtain warranties from vendors and obligate contractors to meet certain performance levels, the proceeds of such insurance and our rights under contracts, warranties or performance guarantees may not be timely or adequate to cover lost revenues, increased expenses, liability or liquidated damage payments.
Cyberattacks, terrorism, or other malicious acts targeting our key technology systems could disrupt our operations, or lead to a loss or misuse of confidential and proprietary information.
To effectively operate our business, we rely upon a sophisticated electronic control system, information and operation technology systems and network infrastructure to generate, distribute and deliver energy, and collect and retain sensitive information including personal information about our customers and employees. Cyberattacks, terrorism or other malicious acts targeting electronic control systems could result in a full or partial disruption of our electric and/or gas operations. Attacks targeting other key technology systems, including our third-party vendors’ information systems, could further add to a full or partial disruption of our operations. Any disruption of these operations could result in a loss of service to customers and associated revenues, as well as significant expense to repair damages and remedy security breaches. In addition, any theft, loss and/or fraudulent use of customer, shareowner, employee or proprietary data could subject us to significant litigation, liability and costs, as well as adversely impact our reputation with customers and regulators, among others.
We have instituted security measures and safeguards to protect our operational systems and information technology assets, including certain safeguards required by FERC. Despite our implementation of security measures and safeguards, all of our technology systems may still be vulnerable to disability, failures or unauthorized access.
Weather conditions, including the impacts of climate change, may cause fluctuation in customer usage.
Our utility businesses are seasonal businesses and weather conditions and patterns can have a material impact on our operating performance. To the extent weather conditions are affected by climate change, customers’ energy use could increase or decrease. Demand for electricity is typically greater in the summer and winter months associated with cooling and heating, respectively. Demand for natural gas depends heavily upon winter-weather patterns throughout our service territory and a significant amount of natural gas revenues are recognized in the first and fourth quarters related to the heating season. Accordingly, our utility operations have historically generated lower revenues and income when weather conditions are cooler than normal in the summer and warmer than normal in the winter. Demand for natural gas is also impacted by summer weather patterns that are cooler than normal and provide higher than normal precipitation; both of which can reduce natural gas demand for irrigation. Unusually mild summers and winters, therefore, could have an adverse effect on our financial operating results, including earnings, cash flow and liquidity.
FINANCIAL RISKS
A sub-investment grade credit rating could impact our ability to access capital markets.
Our issuer credit rating is Baa2 (Stable outlook) by Moody’s; BBB+ (Stable outlook) by S&P; and BBB+ (Stable outlook) by Fitch. Reduction of our investment grade credit ratings could impair our ability to refinance or repay our existing debt and complete new financings on reasonable terms, if at all. A credit rating downgrade, particularly to sub-investment grade, could also result in counterparties requiring us to post additional collateral under existing or new contracts. In addition, a ratings downgrade would increase our interest expense under some of our existing debt obligations, including borrowings under our credit facilities, potentially significantly increasing our cost of capital and other associated operating costs which may not be recoverable through existing regulatory rate structures and contracts with customers.
Our use of derivative financial instruments as hedges against commodity prices and financial market risks could result in material financial losses.
We use various financial and physical derivatives, including futures, forwards, options and swaps to manage commodity price and interest rate risks. The timing of the recognition of gains or losses on these economic hedges in accordance with GAAP does not always match up with the gains or losses on the commodities being hedged. For Black Hills Energy Services under the Choice Gas Program, and in certain instances within our regulated Utilities where unrealized and realized gains and losses from derivative instruments are not approved for regulatory accounting treatment, fluctuating commodity prices may cause fluctuations in reported financial results due to mark-to-market accounting treatment.
To the extent that we hedge our commodity price and interest rate exposures, we forgo the benefits we would otherwise experience if commodity prices or interest rates were to change in our favor. In addition, even though they are closely monitored by management, our hedging activities can result in losses. Such losses could occur under various circumstances, including if a counterparty does not perform its obligations under the hedge arrangement, the hedge is economically imperfect, commodity prices or interest rates move unfavorably related to our physical or financial positions, or hedging policies and procedures are not followed.
Additionally, our exchange-traded futures contracts are subject to futures margin posting requirements. To the extent we are unable to meet these requirements, this could have a significant impact on our business by reducing our ability to execute derivative transactions to reduce commodity price uncertainty and to protect cash flows. Requirements to post collateral may cause significant liquidity issues by reducing our ability to use cash for investment or other corporate purposes, or may require us to increase our level of debt. Further, a requirement for our counterparties to post collateral could result in additional costs being passed on to us, thereby decreasing our profitability.
We have a holding company corporate structure with multiple subsidiaries. Corporate dividends and debt payments are dependent upon cash distributions to the holding company from the subsidiaries.
As a holding company, our investments in our subsidiaries are our primary assets. Our operating cash flow and ability to service our indebtedness depend on the operating cash flow of our subsidiaries and the payment of funds by them to us in the form of dividends or advances. Our subsidiaries are separate legal entities that have no obligation to make any funds available for that purpose, whether by dividends or otherwise. In addition, each subsidiary’s ability to pay dividends to us depends on any applicable contractual or regulatory restrictions that may include requirements to maintain minimum levels of cash, working capital, equity or debt service funds.
There is no assurance as to the amount, if any, of future dividends to the holding company because these subsidiaries depend on our future earnings, capital requirements and financial condition and are subject to declaration by the Board of Directors. See “Liquidity and Capital Resources” within Management’s Discussion and Analysis of Financial Condition and Results of Operations in Item 7 and Note 9 of our Notes to Consolidated Financial Statements of this Annual Report on Form 10-K for further information regarding these restrictions and their impact on our liquidity.
We may be unable to obtain financing on reasonable terms needed to refinance debt, fund planned capital expenditures or otherwise execute our operating strategy.
Our ability to execute our operating strategy is highly dependent upon our access to capital. Historically, we have addressed our liquidity needs (including funds required to make scheduled principal and interest payments, refinance debt, pay dividends and fund working capital and planned capital expenditures) with operating cash flow, borrowings under credit facilities, proceeds of debt and equity offerings and proceeds from asset sales. Our ability to access the capital markets and the costs and terms of available financing depend on many factors, including changes in our credit ratings, changes in the federal or state regulatory environment affecting energy companies, volatility in commodity or electricity prices and general economic and market conditions.
In addition, because we are a holding company and our utility assets are owned by our subsidiaries, if we are unable to adequately access the credit markets, we could be required to take additional measures designed to ensure that our utility subsidiaries are adequately capitalized to provide safe and reliable service. Possible additional measures would be evaluated in the context of then-prevailing market conditions, prudent financial management and any applicable regulatory requirements.
National and regional economic conditions may cause increased counterparty credit risk, late payments and uncollectible accounts.
A future recession or pandemic, if one occurs, may lead to an increase in late payments or non-payment from retail residential, commercial and industrial utility customers, as well as from our non-utility customers. If late payments and uncollectible accounts increase, earnings and cash flows from our continuing operations may be reduced.
We may be unable to obtain insurance coverage, and the coverage we currently have may not apply or may be insufficient to cover a significant loss.
Our ability to obtain insurance, as well as the cost of such insurance, could be impacted by developments affecting the insurance industry and the financial condition of insurers. Additionally insurance providers could deny coverage or decline to extend coverage under the same or similar terms that are presently available to us. A loss for which we are not adequately insured could materially affect our financial results. The coverage we currently have in place may not apply to a particular loss, or it may not be sufficient to cover all liabilities to which the Company may be subject, including liability and losses associated with wildfire, natural gas and gas storage field explosions, cyber-security breaches, environmental hazards and natural disasters.
Market performance or changes in key valuation assumptions could require us to make significant unplanned contributions to our pension plan and other postretirement benefit plans.
Assumptions related to interest rates, expected return on investments, mortality and other key actuarial assumptions have a significant impact on our funding requirements and the expense recognized related to these plans. An adverse change to key assumptions associated with our defined benefit retirement plans may require significant unplanned contributions to the plans which could adversely affect our financial operating results including earnings, cash flow and liquidity.
Costs associated with our healthcare plans and other benefits could increase significantly.
The costs of providing healthcare benefits to our employees and retirees have increased substantially in recent years. We believe that our employee benefit costs, including costs related to healthcare plans for our employees and former employees, will continue to rise. Significant regulatory developments have required, and likely will continue to require, changes to our current employee benefit plans and supporting administrative processes. Our electric and gas utility rates are regulated on a state-by-state basis by the relevant state regulatory authorities based on an analysis of our costs, as reviewed and approved in a regulatory proceeding. Within our utility rates we have generally recovered the cost of providing employee benefits. As benefit costs continue to rise, there is no assurance that the state utility commissions will allow recovery of these increased costs. The rising employee benefit costs, or inadequate recovery of such costs, may adversely affect our financial operating results including earnings, cash flow, or liquidity.
PANDEMIC RISK
Our business operations, results of operations, financial condition and cash flows could be adversely affected by the coronavirus (COVID-19) pandemic.
We have responded to the global pandemic of COVID-19 by taking steps to mitigate the potential risks to us posed by its spread.
For the year ended December 31, 2018, which was filed with2020, the SECCOVID-19 pandemic had a limited net financial impact on February 19, 2019.our business operations, financial condition and cash flows. In particular, we experienced:
Segment information does not include intercompany eliminations•Increased allowance for credit losses and all amounts are presented on a pre-tax basis unless otherwise indicated. Per share information references diluted shares unless otherwise noted.
Results of Operations
Consolidated Summary and Overview
|
| | | | | | | | | | | | | | | | | | | | |
| | For the Years Ended December 31, |
| | 2019 | | 2018 | | 2017 |
| (in millions, except per diluted share amounts) | Income | EPS | | Income | EPS | | Income | EPS |
| | | | | | | | | |
| Net income from continuing operations available for common stock | $ | 199.3 |
| $ | 3.28 |
| | $ | 265.3 |
| $ | 4.78 |
| | $ | 194.1 |
| $ | 3.52 |
|
| Net (loss) from discontinued operations | — |
| — |
| | (6.9 | ) | (0.12 | ) | | (17.1 | ) | (0.31 | ) |
| Net income available for common stock | $ | 199.3 |
| $ | 3.28 |
| | $ | 258.4 |
| $ | 4.66 |
| | $ | 177.0 |
| $ | 3.21 |
|
| | | | | | | | | |
2019 Compared to 2018
The variance to the prior year included the following:
Electric Utilities’ adjusted operating income increased $4.4 millionbad debt expense due to reduced purchased power capacityanticipated customer non-payment as a result of suspended disconnections;
•Increased costs increased rider revenuesdue to sequestration of mission-critical and the prior year Wyoming Electric PCA settlementessential employees;
•Lower commercial and certain transport volumes partially offset by higher operating expenses driven byelectric and natural gas residential usage;
•Waived customer late payment fees;
•Reduced availability of our employees;
•Increased costs for personal protection equipment and cleaning supplies;
•Minimal disruptions receiving the materials and supplies necessary to maintain operations and continue executing our capital investment plan;
•Minimal impacts to the availability of our contractors;
•Minimal decline in the funded status of our pension plan;
•Minimal interest expense increase due to disruptions in the Commercial Paper markets; and
•Reduced training, travel, and outside services related expenses.
Should the COVID-19 pandemic continue for a prolonged period or impact the areas we serve more significantly than it has to date, our business operations, financial condition and employee costs;cash flows could be impacted in more significant ways. In addition to exacerbating the impacts described above, we could experience:
Gas Utilities’ adjusted operating income increased $4.7 million primarily due
•Adverse impacts on our strategic business plans, growth strategy and capital investments;
•Increased adverse impacts to new customer rateselectricity and rider revenues, customer growthnatural gas demand from our customers, particularly from commercial and increased transport and transmission driven by increased volumes from new and existing customers partially offset by higher operating expenses driven by outside services and employee costs;industrial customers;
Power Generation’s adjusted operating income increased $2.2 million primarily due to higher revenue from increased wind MWh sold and higher PPA pricing partially offset by higher depreciation and property taxes from new wind assets;
Mining’s adjusted operating income decreased $3.7 million primarily due to lower tons sold driven by planned and unplanned generating facility outages partially offset by lower operating expenses;
Corporate and Other expenses decreased $1.4 million primarily due to prior year expenses related to the oil and gas segment that were not reclassified to discontinued operations;
A $20 million pre-tax non-cash impairment in 2019 of our investment in equity securities of a privately held oil and gas company;
We expensed $5.4 million of development costs related to projects we no longer intend to construct; and
Increased tax expense of $53 million primarily due to a prior year $73 million tax benefit resulting from legal entity restructuring partially offset by a prior year $4.0 million income tax expense associated with changes in the previously estimated impact of tax reform on deferred income taxes and current year $5.9 million federal PTCs and related state ITCs associated with new wind assets.
2018 Compared to 2017
The variance when comparing 2018 to 2017 included the following:
Electric Utilities’ adjusted operating income decreased $21.9 million due to TCJA benefits delivered to customers, the Wyoming Electric PCA settlement and higher operating expenses partially offset by increased rider revenues and favorable weather;
Gas Utilities’ adjusted operating income increased $0.1 million primarily due to colder winter weather, new customer rates, customer growth and increased transport and transmission offset by TCJA benefits delivered to customers and higher operating expenses;
Power Generation’s adjusted operating income decreased $4.1 million primarily due to a decrease in MWh sold and higher operating expenses;
Mining’s adjusted operating income increased $2.8 million primarily due to increase in price per ton sold and lower operating expenses;
Corporate and Other expenses decreased $3.3 million primarily due to prior year acquisition costs; and
Increased tax benefit of $97 million primarily due to a $73 million tax benefit resulting from legal entity restructuring and a•Further reduction in the federal corporate incomeavailability of our employees and contractors;
•Increased costs as a result of our preventative measures, such as sequestration of essential employees and facility cleaning services;
•Increased allowance for credit losses and bad debt expense as a result of delayed or non-payment from our customers, both of which could be magnified by Federal or state government legislation that requires us to extend suspensions of disconnections for non-payment;
•Delays and disruptions in the availability, timely delivery and cost of materials and components used in our operations;
•Disruptions in the commercial operation dates of certain projects impacting qualification criteria for certain tax ratecredits and triggering potential damages under our power purchase agreements;
•Deterioration of the credit quality of our counterparties, including gas commodity contract counterparties, power purchase agreement counterparties, contractors or retail customers, that could result in credit losses;
•Impairment of goodwill or long-lived assets;
•Adverse impacts on our ability to construct and operate facilities;
•Inability to meet the requirements of the covenants in our existing credit facilities, including covenants regarding Consolidated Indebtedness to Capitalization Ratio;
•Deterioration in our financial metrics or the business environment that adversely impacts our credit ratings;
•Delay in the permitting process of certain development projects, affecting the timing of final investment decisions and start dates of construction;
•Adverse impact on our liquidity position and cost of and ability to access funds from 35%financial institutions and capital markets; and
•Delays in our ability to 21%change rates through regulatory proceedings.
To date, we have experienced limited impacts to our results of operations, financial condition, cash flows or business plans. However, the situation remains fluid and it is difficult to predict with certainty the potential impact of COVID-19 on our results of operations, financial condition and cash flows.
ITEM 1B.UNRESOLVED STAFF COMMENTS
None.
ITEM 3.LEGAL PROCEEDINGS
Information regarding our legal proceedings is incorporated herein by reference to the “Legal Proceedings” sub-caption within Item 8, Note 3, “Commitments, Contingencies and Guarantees”, of our Notes to Consolidated Financial Statements in this Annual Report on Form 10-K.
ITEM 4. MINE SAFETY DISCLOSURES
Information concerning mine safety violations or other regulatory matters required by Sections 1503(a) of the Dodd-Frank Wall Street Reform and Consumer Protection Act is included in Exhibit 95 of this Annual Report.
INFORMATION ABOUT OUR EXECUTIVE OFFICERS
Linden R. Evans, age 58, has been President and Chief Executive Officer since January 1, 2019, President and Chief Operating Officer from 2016 through 2018, and President and Chief Operating Officer — Utilities from 2004 through 2015. Mr. Evans served as the Vice President and General Manager of our former communication subsidiary in 2003 and 2004, and Associate Counsel from 2001 to 2003. Mr. Evans has 19 years of experience with the Company.
Scott A. Buchholz, age 59, has been our Senior Vice President of Strategic Initiatives since July 2020. He served as Senior Vice President — Chief Information Officer from the TCJA, effectiveclosing of the Aquila Transaction in 2008 to 2020. Prior to joining the Company, he was Aquila’s Vice President of Information Technology from 2005 until 2008, Six Sigma Deployment Leader/Black Belt from 2004 until 2005, and General Manager, Corporate Information Technology from 2002 until 2004. Mr. Buchholz has 40 years of experience with the Company, including 28 years with Aquila. Mr. Buchholz plans to retire on March 8, 2021.
Brian G. Iverson, age 58, has been Senior Vice President, General Counsel and Chief Compliance Officer since August 26, 2019. He served as Senior Vice President, General Counsel, Chief Compliance Officer and Corporate Secretary from February 1, 2019 to August 26, 2019, Senior Vice President, General Counsel and Chief Compliance Officer from 2016 to February 2019, Senior Vice President - Regulatory and Governmental Affairs and Assistant General Counsel from 2014 to 2016, Vice President and Treasurer from 2011 to 2014, Vice President - Electric Regulatory Services from 2008 to 2011 and as Corporate Counsel from 2004 to 2008. Mr. Iverson has 17 years of experience with the Company.
Richard W. Kinzley, age 55, has been Senior Vice President and Chief Financial Officer since 2015. He served as Vice President - Corporate Controller from 2013 to 2014, Vice President - Strategic Planning and Development from 2008 to 2013, and as Director of Corporate Development from 2000 to 2008. Mr. Kinzley has 21 years of experience with the Company.
Jennifer C. Landis, age 46, has been Senior Vice President - Chief Human Resources Officer since February 1, 2017. She served as Vice President of Human Resources from April 2016 through January 1, 2018.2017, Director of Corporate Human Resources and Talent Management from 2013 to April 2016, and Director of Organization Development from 2008 to 2013. Ms. Landis has 19 years of experience with the Company.
Stuart Wevik, age 59, has been Senior Vice President - Utility Operations since August 26, 2019. He served as Group Vice President - Electric Utilities from 2016 to August 2019, Vice President - Utility Operations from 2008 to 2016, Vice President - Operations from 2004 to 2008 and Vice President and General Manager from 2003 to 2004. Mr. Wevik has 35 years of experience with the Company.
Erik Keller, age 57, joined the Company as Senior Vice President and Chief Information Officer on July 27, 2020. Prior to joining the company, he was an Information Technology consultant to Ontic Inc., a global provider of parts and services for legacy aerospace platforms, from January 2020 to July 2020, and Chief Information Officer for BBA Aviation, a global aviation support and aftermarket services provider, from February 2012 to January 2020.
PART II
ITEM 5.MARKET FOR REGISTRANT’S COMMON EQUITY, RELATED STOCKHOLDER MATTERS AND ISSUER PURCHASES OF EQUITY SECURITIES
Our common stock is traded on the New York Stock Exchange under the symbol BKH. As of January 31, 2021, we had 3,537 common shareholders of record and 46,737 beneficial owners, representing all 50 states, the District of Columbia and 6 foreign countries.
We have paid a regular quarterly cash dividend each year since the incorporation of our predecessor company in 1941 and expect to continue paying a regular quarterly dividend for the foreseeable future. At its January 27, 2021 meeting, our Board of Directors declared a quarterly dividend of $0.565 per share, equivalent to an annual dividend rate of $2.26 per share. This equivalent rate, if declared and paid in 2021, will represent 51 consecutive years of annual dividend increases.
For additional discussion of our dividend policy and factors that may limit our ability to pay dividends, see “Liquidity and Capital Resources” under Item 7, Management’s Discussion and Analysis of Financial Condition and Results of Operations in this Annual Report on Form 10-K.
UNREGISTERED SECURITIES ISSUED
There were no unregistered securities sold during 2020.
ISSUER PURCHASES OF EQUITY SECURITIES
The following table summarizes select financial results by operating segment and details significant items (in thousands):contains monthly information about our acquisitions of equity securities for the three months ended December 31, 2020:
|
| | | | | | | | | | | | | | | |
| | For the Years Ended December 31, |
| | 2019 | Variance | 2018 | Variance | 2017 |
| | (in thousands) |
| Revenue | | | | | |
| Revenue | $ | 1,885,669 |
| $ | (11,573 | ) | $ | 1,897,242 |
| $ | 83,721 |
| $ | 1,813,521 |
|
| Intercompany eliminations | (150,769 | ) | (7,795 | ) | (142,974 | ) | (9,719 | ) | (133,255 | ) |
| | $ | 1,734,900 |
| $ | (19,368 | ) | $ | 1,754,268 |
| $ | 74,002 |
| $ | 1,680,266 |
|
| | | | | | |
Adjusted operating income (a) | | | | | |
| Electric Utilities | $ | 160,297 |
| $ | 4,428 |
| $ | 155,869 |
| $ | (21,868 | ) | $ | 177,737 |
|
| Gas Utilities | 189,971 |
| 4,732 |
| 185,239 |
| 134 |
| 185,105 |
|
| Power Generation | 44,779 |
| 2,165 |
| 42,614 |
| (4,076 | ) | 46,690 |
|
| Mining | 12,627 |
| (3,713 | ) | 16,340 |
| 2,840 |
| 13,500 |
|
| Corporate and Other | (1,632 | ) | 1,393 |
| (3,025 | ) | 3,271 |
| (6,296 | ) |
| | 406,042 |
| 9,005 |
| 397,037 |
| (19,699 | ) | 416,736 |
|
| | | | | | |
| Interest expense, net | (137,659 | ) | 2,316 |
| (139,975 | ) | (2,873 | ) | (137,102 | ) |
| Impairment of investment | (19,741 | ) | (19,741 | ) | — |
| — |
| — |
|
| Other income (expense), net | (5,740 | ) | (4,560 | ) | (1,180 | ) | (3,288 | ) | 2,108 |
|
| Income tax benefit (expense) | (29,580 | ) | (53,247 | ) | 23,667 |
| 97,034 |
| (73,367 | ) |
| Income from continuing operations | 213,322 |
| (66,227 | ) | 279,549 |
| 71,174 |
| 208,375 |
|
| (Loss) from discontinued operations, net of tax | — |
| 6,887 |
| (6,887 | ) | 10,212 |
| (17,099 | ) |
| Net income | 213,322 |
| (59,340 | ) | 272,662 |
| 81,386 |
| 191,276 |
|
| Net income attributable to noncontrolling interest | (14,012 | ) | 208 |
| (14,220 | ) | 22 |
| (14,242 | ) |
| Net income available for common stock | $ | 199,310 |
| $ | (59,132 | ) | $ | 258,442 |
| $ | 81,408 |
| $ | 177,034 |
|
| | | | | | |
| | | | | | | | | | | | | | |
|
| Period | Total Number of Shares Purchased (a) | Average Price Paid per Share | Total Number of Shares Purchased as Part of Publicly Announced Plans or Programs | Maximum Number (or Approximate Dollar Value) of Shares That May Yet Be Purchased Under the Plans or Programs |
| | | | |
| | | | |
| | | | |
| | | | |
| | | | |
| | | | |
| | | | |
| | | | |
| | | | |
| October 1, 2020 - October 31, 2020 | 1 | $ | 53.95 | | — | | — | |
| November 1, 2020 - November 30, 2020 | 804 | 58.63 | | — | | — | |
| December 1, 2020 - December 31, 2020 | 7,569 | 59.66 | | — | | — | |
| Total | 8,374 | | $ | 59.56 | | — | | — | |
| | | | |
_____________
| |
(a) | In 2019, we changed our measure of segment performance to adjusted operating income, which impacted our segment disclosures for all periods presented. See Note 5 of the Notes to the Consolidated Financial Statements in this Annual Report on Form 10-K for more information. |
2019 Overview
ITEM 6.SELECTED FINANCIAL DATA
We have early adopted the new SEC amendments to modernize, simplify, and enhance certain financial disclosure requirements in Regulation S-K which, among other things, eliminates the requirement to present Selected Financial Data.
ITEM 7. MANAGEMENT’S DISCUSSION AND ANALYSIS OF FINANCIAL CONDITION AND RESULTS OF OPERATIONS
Executive Summary
We are a customer-focused, growth-oriented electric and natural gas utility company with a mission of Business SegmentsImproving Life with Energy and Corporate Activity
a vision to be the Energy Partner of Choice. The Company provides electric and natural gas utility service to 1.3 million customers over 800 communities in eight states, including Arkansas, Colorado, Iowa, Kansas, Montana, Nebraska, South Dakota and Wyoming. We conduct our business operations through four reportable segments: Electric Utilities, Gas Utilities, Power Generation and Mining. Certain unallocated corporate expenses that support our operating segments are presented as Corporate and Other. The Company conducts its utility operations under the name Black Hills Energy predominantly in rural areas of the Rocky Mountains and Midwestern states. The Company’s Electric Utilities are supported by our Power Generation and Mining segments, which are mostly contracted to company affiliates and subject to utility-like regulation and oversight. The Power Generation segment produces electric power from its five generating facilities and sells most of the electric capacity and energy to our Electric Utilities under mid- and long-term contracts. The Mining segment, consisting of a single coal mine near Gillette, Wyoming, sells nearly all production to fuel the five on-site, mine-mouth power generation facilities. With more than 90% of the Company’s assets directly invested in its regulated utility businesses and the Power Generation and Mining segments supporting its electric utilities mainly through long-term contracts, the Company considers itself a domestic, pure-play electric and natural gas utility company.
OnThe Company has provided energy and served customers for 137 years, since the 1883 gold rush days in Deadwood, South Dakota. Throughout our history, the common thread that unites the past to the present is our commitment to serve our customers and communities. Our strategic focus has not changed in over a century - serving customers with affordable, reliable and safe energy and being strong environmental stewards. Our strategy today continues that emphasis on serving customers and being responsive to the people and communities we serve. Customer expectations are rapidly changing with the advancement of technology and customers are demanding simpler, faster and more convenient solutions to their energy needs. Customers and other stakeholders are demanding cleaner energy solutions to address concerns around carbon emissions. In this rapidly changing energy environment, we are Ready to serve.
Our strategy focuses on improving the way we serve customers with safe, reliable, affordable and cleaner energy while improving the lives of the customers and communities we serve. Our emphasis is on consistently outperforming utility industry averages in key safety metrics; transforming the customer experience; growing our electric and natural gas customer load; pursuing operating efficiencies; and modernizing utility infrastructure. These areas of focus will present the company with significant investment needs as we modernize our infrastructure systems, meet customer growth and fulfill customer expectations for cleaner energy services. It will also allow us to better understand our customer and community needs while providing more intuitive and cost-effective interactions.
Key Elements of our Business Strategy
Modernize, replace and operate utility infrastructure to meet our customers’ energy needs while providing safe, reliable, affordable and cleaner energy. Our utilities own and operate large electric and natural gas infrastructure systems with a geographic footprint that spans nearly 1,600 miles of the United States. Our Electric Utilities own and operate 992 MW of generation capacity and 8,900 miles of transmission and distribution lines and our Gas Utilities own and operate 47,000 miles of natural gas transmission and distribution pipelines. A key strategic focus is to modernize this utility infrastructure to meet customers’ and communities’ varied energy needs, ensure the continued delivery of safe, reliable and affordable energy and reduce GHG emission intensity. In addition, we invest in the accessibility, capacity and integrity of our systems to meet customer growth.
We rigorously comply with all applicable federal, state and local regulations and strive to consistently meet industry best practice standards. A key component of our modernization effort is the development of programs by our Electric and Gas Utilities to systematically and proactively replace aging infrastructure on a system-wide basis. To meet our electric customers’ continued expectations of high levels of reliability, our Electric Utilities utilize a distribution integrity program to ensure the timely repair and replacement of aging infrastructure. Our Gas Utilities utilize a programmatic approach to system-wide pipeline replacement, particularly in high consequence areas. Under the programmatic approach, obsolete, at-risk and vintage materials are replaced in a proactive and systematic time frame. We have removed all cast- and wrought-iron from our natural gas transmission and distribution systems and continue to replace aging infrastructure through programs that prioritize safety and reliability for our customers. All but one of our Gas Utilities are authorized to use system safety, integrity and replacement cost recovery mechanisms that provide for customer rate adjustments which reflect the cost incurred in repairing and replacing the gas delivery systems.
As of December 13, 2019,31, 2020, we estimate our five-year capital investment to be approximately $2.7 billion, with most of that investment targeted toward upgrading existing utility infrastructure and to support customer and community growth needs. Our actual 2020 and forecasted capital expenditures and depreciation for the next five years from 2021 through 2025 are as follows (in millions):
| | | | | | | | | | | | | | | | | | | | | | | |
| Actual | | Forecasted |
Capital Expenditures By Segment (a) : | 2020 | | 2021 | 2022 | 2023 | 2024 | 2025 |
| (in millions) | | | | | | | |
| Electric Utilities | $ | 271 | | | $ | 240 | | $ | 180 | | $ | 143 | | $ | 156 | | $ | 154 | |
| Gas Utilities | 449 | | | 377 | | 347 | | 339 | | 330 | | 326 | |
| Power Generation | 9 | | | 10 | | 9 | | 6 | | 4 | | 5 | |
| Mining | 8 | | | 9 | | 9 | | 9 | | 9 | | 10 | |
| Corporate and Other | 18 | | | 11 | | 5 | | 13 | | 13 | | 13 | |
| Total | $ | 755 | | | $ | 647 | | $ | 550 | | $ | 510 | | $ | 512 | | $ | 508 | |
____________________________
(a) Includes accruals for property, plant and equipment as disclosed as supplemental cash flow information in the Consolidated Statements of Cash Flows in the Consolidated Financial Statements in this Annual Report on Form 10-K.
Efficiently plan, construct and operate rate base power generation facilities to serve our Electric Utilities. We believe that we best serve customers and communities with a vertically integrated business model for our Electric Utilities. This business model remains a core strength and strategy today as we invest in and operate efficient power generation resources to cost-effectively supply electricity to our customers. We strive to provide power at reasonable rates to our customers and earn competitive returns for our investors.
Our power production strategy focuses on low-cost construction and efficient operation of our generating facilities. Our low power production costs result from a variety of factors including low fuel costs, efficiency in converting fuel into energy, low per unit operating and maintenance costs and high levels of power plant availability. For our coal-fired power plants, we leverage our mine-mouth location advantage to eliminate coal transportation costs that often represent the largest component of the delivered cost of coal for many other utilities. Additionally, we operate our plants with high levels of availability as compared to industry benchmarks.
We continue to believe that ownership of power generation facilities by our Electric Utilities best serves customers. Rate-based generation assets offer several advantages for customers and shareholders, including:
•When generating assets are included in the utility rate base and reviewed and approved by government authorities, customer rates are more stable and predictable, and typically less expensive in the long run; especially when compared to power otherwise purchased from the open market through wholesale contracts that are periodically re-priced to reflect current and varying market conditions;
•Regulators participate in a planning process where long-term investments are designed to match long-term energy demand;
•The lower-risk profile of rate-based generation assets contributes to stronger credit ratings which, in turn, can benefit both customers and investors by lowering the cost of capital; and
•Investors are provided a long-term and stable return on their investment.
Proactively integrate alternative and renewable energy into our utility energy supply while mitigating customer rate impacts. In November 2020, we announced clean energy goals to reduce GHG emissions intensity for our Electric Utilities of 40% by 2030 and 70% by 2040 and achieve GHG reductions of 50% by 2035 for our Gas Utilities. Our goals are based on existing technology and computed from 2005 baseline levels of GHG emissions intensity for our electric operations and natural gas distribution system. Since 2005, we have reduced GHG emissions intensity from our Gas Utilities by more than 33% and achieved a 25% reduction from our Electric Utilities. Colorado Electric issuedhas achieved an approximate 50% reduction in GHG emissions since 2005 and is on track to reach Colorado’s 80% carbon reduction goal by 2030. Our goals are based on prudent and proven solutions to reduce our emissions while minimizing cost impacts to our customers. This keeps our customers at the forefront of our decision-making, which is central to our values.
More of our customers, particularly our larger customers, are demanding cleaner sources of energy to meet their sustainability goals. In addition, there is more interest from consumers, regulators and legislators to increase the use of renewable and other alternative energy sources. To support this interest, we created the Renewable Ready program for South Dakota and Wyoming customers. In support of this program, we created and received approvals for new, voluntary renewable energy tariffs to serve certain commercial, industrial and governmental agency customer requests for renewable energy resources. To meet the renewable energy commitments under the new tariffs, on November 30, 2020, we completed construction and placed into service the Corriedale wind project, a 52.5 MW wind energy project near Cheyenne, Wyoming. Supporting our renewable energy efforts in Colorado, in September 2020, Colorado Electric received approval from the CPUC for its request for proposals forapproval of its preferred solar bid in support of its Renewable Advantage program, which plans to potentially add up to 200 MW of renewable energy by the end of 2023.
To date, many states have enacted, and others are considering, mandatory renewable energy standards, requiring utilities to its southern Colorado system. A competitive solicitation processmeet certain thresholds of renewable energy generation. In addition, some states have either enacted or are considering legislation setting GHG emission reduction targets. Federal legislation for renewable energy standards and GHG emission reductions has been considered and may be implemented in the future. Mandates for the additionuse of cost-effective, utility-scale renewable energy projects includes wind, solaror the reduction of GHG emissions will likely drive the need for significant investment in our Electric Utilities and battery storage to supplement existingGas Utilities segments. These mandates will also likely increase prices for electricity and/or natural gas for our utility customers. As a regulated utility we are responsible for providing safe, reliable and windaffordable sources of energy to our customers. Accordingly, we employ a customer-focused strategy for complying with standards and regulations that balances our customers’ rate concerns with environmental considerations and administrative and legislative mandates. We attempt to strike this balance by prudently and proactively incorporating renewable energy into our resource supply, while seeking to minimize the magnitude and frequency of rate increases for our utility customers.
Build and maintain strong relationships with wholesale power customers of our utilities and our power generation business. We strive to build strong relationships with other utilities, municipalities and wholesale customers. We believe we will continue to be an important provider of electricity to wholesale utility customers, who will continue to need products such as capacity and energy to reliably serve their customers. By providing these products under long-term contracts, we help our customers meet their energy needs. We also earn more stable revenues and greater returns for shareholders over the long-term than we would by selling energy into more volatile energy spot markets. In addition, relationships that we have established with wholesale power supplies Bidderscustomers have until February 15, 2020,developed into other opportunities. MEAN, MDU and the City of Gillette, Wyoming were wholesale power customers that are now joint minority owners in two of our power plants, Wygen I and Wygen III, reducing risk and providing steady revenues.
Vertically integrate businesses that are supportive of our Electric and Gas Utility businesses. While our primary focus is serving customers and growing our core utilities, we selectively invest in vertically integrated businesses that provide cost effective and efficient fuel and energy to submit proposals,our utilities. We currently own and operate power generation and mining assets that are vertically integrated into and support our Electric Utilities. These operations are located at our utility-generating complexes and are physically integrated into our Electric Utilities’ operations.
The Power Generation segment currently owns five power facilities, four of which will be reviewed byare contracted with our affiliate Electric Utilities under mid- to long-term power purchase agreements. Our Power Generation segment has an independent evaluator overseen by the CPUC. Based on the outcomeexperienced staff with significant expertise in planning, building and operating power plants. The power generation team has constructed 22 generation projects since 1995 with an aggregate investment in excess of $2.5 billion. This team also provides shared services to our Electric Utilities’ generation facilities, resulting in efficient management of all of the bidding process, projects wouldcompany’s generation assets. In certain states, our Electric Utilities are required to competitively bid for generation resources needed to serve customers. Generally, our Power Generation segment submits bids in response to those competitive solicitations. Our Power Generation segment can often realize competitive advantages provided by prior construction expertise, fuel supply advantages and by co-locating new plants at existing sites, reducing infrastructure and operating costs.
Our small surface coal mine is located immediately adjacent to our Gillette energy complex in northeastern Wyoming, where all five of our remaining coal-fired power plants are located. We operate and own majority interests in four of the five power plants. We own 20% of the fifth power plant which is operated by a majority owner. The mine provides low-sulfur coal directly to these power plants via a conveyor belt system, minimizing transportation costs. On average, the fuel can be placed in service no laterdelivered to the adjacent power plants at less than 2023.
In July 2019, South Dakota Electric and Wyoming Electric received approvals for the Renewable Ready program and related jointly-filed CPCN$1.00 per MMBtu, providing very cost competitive fuel to construct Corriedale. The wind project will be jointly owned by the two electric utilities to deliver renewable energy for large commercial, industrial and governmental agency customers. In November 2019, South Dakota Electric received approval from the SDPUC to increase the offering under the program by 12.5 MW. The two electric utilities also received a determination from the WPSC to increase the project to 52.5 MW. The $79 million project is expected to be in service by year-end 2020.
On September 17, 2019, South Dakota Electric completed construction on the final 94-mile segment of a 175-mile electric transmission line from Rapid City, South Dakota, to Stegall, Nebraska. The first 48-mile segment was placed in service on July 25, 2018, and the second 33-mile segment was placed in service on November 20, 2018.
Colorado Electric set a new all-time and summer peak load:
On July 19, 2019, Colorado Electric set a new all-time and summer peak load of 422 MW, exceeding the previous peak of 413 MW set in June 2018.
Wyoming Electric set a new all-time and summer peak load, and also set a new winter peak load:
On July 19, 2019, Wyoming Electric set a new all-time and summer peak load of 265 MW, exceeding the previous peak of 254 MW set in July 2018.
On December 16, 2019, Wyoming Electric set a new winter peak load of 247 MW, exceeding the previous peak of 238 MW set in December 2018.
Cooling degree days for the year ended December 31, 2019 were 14% higher than the normalour power plants when compared to 29% higher than normal in 2018.other coal-fired and natural gas-fired generating facilities. Nearly all of the mine’s production is sold to the five on-site, mine-mouth generation facilities under long-term supply contracts. Approximately one-half of our production is sold under cost-plus contracts with affiliates. A small portion of the mine’s production is sold to off-site industrial customers and delivered by truck.
Heating degree daysGrow our dividend. We are extremely proud of our track record of annual dividend increases for shareholders. 2020 represented our 50th consecutive year of increasing dividends. In January 2021, our Board of Directors declared a quarterly dividend of $0.565 per share, equivalent to an annual dividend of $2.26 per share. We intend to continue our record of annual dividend increases with a targeted dividend payout ratio of 50% to 60%.
Maintain an investment grade credit rating and ready access to debt and equity capital markets. We require access to the year ended December 31, 2019 were 5% higher than normal comparedcapital markets to 3% higher than normal in 2018.fund our planned capital investments or acquire strategic assets that support prudent and earnings-accretive business growth. We have demonstrated our ability to cost-effectively access the debt and equity markets, while maintaining our investment-grade issuer credit rating.
Gas Utilities
Gas Utilities continued to consolidate utility jurisdictions within the States of Colorado, Nebraska, and Wyoming:
| |
◦ | On December 11, 2019, Wyoming Gas received approval from the WPSC to consolidate the rates, tariffs and services of its four existing gas distribution territories. A new, single statewide rate structure will be effective March 1, 2020. New rates are expected to generate $13 million in new revenue based on a return on equity of 9.40% and a capital structure of 50.23% equity and 49.77% debt. The approval also allows for a rider to recover integrity investments for system safety and reliability. |
| |
◦ | On February 1, 2019, Colorado Gas submitted a rate review with the CPUC to consolidate rates, tariffs and services of its two existing gas distribution territories. The rate review requested $2.5 million in new revenue to recover investments in safety, reliability and system integrity. Colorado Gas also requested a new rider mechanism to recover future safety and integrity investments in its system. On December 27, 2019, the ALJ issued a recommended decision denying the company’s plan to consolidate rate territories and recommending a rate decrease. Colorado Gas has filed exceptions to the ALJ’s recommended decision. A decision by the CPUC is expected by the end of March 2020. Legal consolidation was previously approved by the CPUC in late 2018 and completed in early 2019. |
| |
◦ | On October 29, 2019, Nebraska Gas received approval from the NPSC to merge its two natural gas distribution companies. Legal consolidation was effective January 1, 2020, and a rate review is expected to be filed by mid-year 2020 to consolidate the rates, tariffs and services. |
On December 1, 2019, Wyoming Gas placed in service the $54 million, 35-mile Natural Bridge pipeline project to enhance supply reliability and delivery capacity for customers in central Wyoming. The new 12-inch steel pipeline interconnects from a supply point near Douglas, Wyoming, to facilities near Casper, Wyoming. The associated investment was included in the Wyoming Gas rate review completed in December 2019.
Heating degree days at the Gas Utilities for the year ended December 31, 2019 were 5% higher than normal compared to 2% higher than normal in 2018.
Power Generation
On November 26, 2019,Our Power Generation segment, which operates through Black Hills Electric Generation placedand its subsidiaries, acquires, develops, constructs and operates our non-regulated power plants. As of December 31, 2020, we held varying interests in service Busch Ranch II. Throughindependent power plants with a competitive bidding process,total net ownership of 423 MW.
We produce electric power from our generating facilities and sell the electric capacity and energy, primarily to affiliates under a combination of mid- to long-term contracts, which mitigates the impacts of volatility in future power prices and fluctuations in demand.
As of December 31, 2020, the power plant ownership interests held by our Power Generation segment include:
| | | | | | | | | | | | | | | | | |
| Power Plants | Fuel Type | Location | Ownership Interest % (d) | Owned Capacity (MW) | In Service Date |
| Wygen I | Coal | Gillette, Wyoming | 76.5% | 68.9 | | 2003 |
Pueblo Airport Generation (a) | Gas | Pueblo, Colorado | 50.1% | 200.0 | | 2012 |
Busch Ranch I (b) | Wind | Pueblo, Colorado | 50.0% | 14.5 | | 2012 |
Busch Ranch II (c) | Wind | Pueblo, Colorado | 100.0% | 60.0 | | 2019 |
Top of Iowa (c) | Wind | Joice, Iowa | 100.0% | 80.0 | | 2019 |
| | | | 423.4 | | |
_________________________
(a) In 2016, Black Hills Electric Generation sold a 49.9% noncontrolling interest in Black Hills Colorado IPP to a third party. See Note 14 of the Notes to Consolidated Financial Statements in this Annual Report on Form 10-K for additional information. (b) In 2013, Busch Ranch I was selectedawarded a one-time cash grant in lieu of ITCs under the Section 1603 program created under the American Recovery and Reinvestment Act.
(c) The Busch Ranch II and Top of Iowa facilities qualify for PTCs at $25/MWh under IRC 45 during the 10-year period beginning on the date each facility was originally placed in service.
(d) Jointly owned facilities are discussed in Note 6 of the Notes to deliver renewableConsolidated Financial Statements in this Annual Report on Form 10-K.
Power Sales Agreements and Operating Agreements. Our Power Generation facilities have various mid- to long-term power sales agreements and operating agreements. Key contracts are disclosed in Note 3 of the Notes to Consolidated Financial Statements in this Annual Report on Form 10-K.
Competition. The independent power industry consists of many strong and capable competitors, some of which may have more extensive operations or greater financial resources than we possess.
With respect to the merchant power sector, FERC has taken steps to increase access to the national transmission grid by utility and non-utility purchasers and sellers of electricity and foster competition within the wholesale electricity markets. Our Power Generation business could face greater competition if utilities are permitted to robustly invest in power generation assets. Conversely, state regulatory rules requiring utilities to competitively bid generation resources may provide opportunity for IPPs in some regions. To date, these initiatives have not had a material impact on our Power Generation segment.
The Energy Policy Act of 1992 and Public Utility Holding Company Act of 2005 (PUHCA 2005). PUHCA 2005 reiterated the definition and benefits of Exempt Wholesale Generator (EWG) status. Under PUHCA 2005, an EWG is an entity or generator engaged, directly or indirectly through one or more affiliates, exclusively in the business of owning, operating or both owning and operating all or part of one or more eligible facilities and selling electric energy at wholesale. Though EWGs are public utilities within the definition set forth in the Federal Power Act and are subject to FERC regulation of rates and charges, they are exempt from other FERC requirements. Through its subsidiaries, Black Hills Corporation is affiliated with three EWGs, Wygen I, Pueblo Airport Generating and Top of Iowa. Each of these three EWG’s have been granted market-based rate authority.
Operating statistics. See a summary of key operating statistics in the Power Generation segment operating results within Management’s Discussion and Analysis of Financial Condition and Results of Operations in Item 7 of this Annual Report on Form 10-K.
Mining
Our Mining segment operates a single coal mine through our WRDC subsidiary. We surface mine, process and sell low-sulfur sub-bituminous coal at our mine near Gillette, Wyoming. The WRDC mine, which we acquired in 1956 from Homestake Mining Company, is located in the Powder River Basin. We produced approximately 3.7 million tons of coal in 2020.
During our surface mining operations, we strip and store the topsoil. We then remove the overburden (earth and rock covering the coal) with heavy equipment. Removal of the overburden typically requires drilling and blasting. Once the coal is exposed, we drill, fracture and systematically remove it, using front-end loaders and conveyors to transport the coal to the mine-mouth generating facilities. We reclaim disturbed areas as part of our normal mining activities by back-filling the pit with overburden removed during the mining process. Once we have replaced the overburden and topsoil, we reestablish vegetation and plant life in accordance with our approved post-mining topography plan.
In a basin characterized by thick coal seams, our overburden ratio, a comparison of the cubic yards of dirt removed to a ton of coal uncovered, has trended upwards over the last fifteen years. However, the overburden ratio at December 31, 2020 was 2.17 which decreased from 2.30 in the prior year as we mined in areas with lower overburden. We expect our stripping ratio to increase to approximately 2.27 by the end of 2021 as we mine in areas with higher overburden.
Mining rights to the reserves are based on three federal leases and one state lease. The federal leases expire between March 31, 2021 and September 30, 2025 and the state lease expires on August 1, 2023. The duration of the leases varies; however, the lease terms generally are extended to the exhaustion of economically recoverable reserves, as long as active mining continues. The federal lease expiring March 31, 2021 relates to an area we are no longer mining and will not be renewed. The Biden Administration recently issued an executive order that suspends new oil and gas leases on federal lands and eliminates fossil fuel subsidies. However, this moratorium does not apply to federal mining leases and we have not received federal subsidies.
We pay federal and state royalties of 12.5% of the selling price of all coal. As of December 31, 2020, we estimated our recoverable reserves to be approximately 182 million tons, based on a life-of-mine engineering study utilizing currently available drilling data and geological information prepared by internal engineering studies. The recoverable reserve life is equal to approximately 49 years at the current production levels. Our recoverable reserve estimates are periodically updated to reflect past production and other geological and mining data. Changes in mining methods or the utilization of new technologies may increase or decrease the recovery basis for a coal seam. Our recoverable reserves include reserves that can be economically and legally extracted at the time of their determination.
Substantially all of the mine’s production is currently sold under contracts to:
•South Dakota Electric for use at the 90 MW Neil Simpson II plant to which we sell approximately 500,000 tons each year. This contract is for the life of the plant;
•Wyoming Electric for use at the 95 MW Wygen II plant to which we sell approximately 550,000 tons each year. This contract is for the life of the plant;
•The 362 MW Wyodak Plant owned 80% by PacifiCorp and 20% by South Dakota Electric. PacifiCorp is obligated to purchase a 25-year PPAminimum of 1.5 million tons each year, subject to Colorado Electric.adjustments for planned outages and other contract terms. This contract expires December 31, 2022 and negotiations to extend the contract are ongoing. South Dakota Electric is also obligated to purchase a minimum of 375,000 tons per year for its 20% share of the power plant, subject to adjustments for planned outages and other contract terms;
On August 2, 2019,•The 110 MW Wygen III power plant jointly owned 52% by South Dakota Electric, 25% by MDU and 23% by the City of Gillette to which we sell approximately 600,000 tons each year;
•The 90 MW Wygen I power plant jointly owned 76.5% by Black Hills Wyoming and 23.5% by MEAN to which we sell approximately 500,000 tons each year; and
•Certain regional industrial customers served by truck to which we sell a total of approximately 300,000 tons each year. These contracts have terms of one to five years.
Our Mining segment sells coal to South Dakota Electric and Wyoming Electric jointly filedfor all of their requirements under cost-based agreements that regulate earnings from these affiliate sales to a request with FERCspecified return on our mine’s cost-depreciated investment base. The return calculated annually is 400 basis points above Moody’s A-Rated Utility Bond Index applied to our Mining investment base.
The price of unprocessed coal sold to PacifiCorp for approval of a new 60 MW PPA.the Wyodak Plant is determined by the supply agreement described above. The agreement would fulfillincluded a price adjustment in 2019. The price adjustment essentially allowed us to retain the capacity need for Wyoming Electric at the expirationfull economic advantage of the currentmine’s location adjacent to the plant. The price adjustment was based on market price plus considerations for the avoided costs of rail transportation and an unloading facility, which PacifiCorp would have to incur if it purchased from another mine. In addition, the agreement also provided for the monthly escalation of price based on December 31, 2022. If approved, Black Hills Wyoming will continue to deliver 60 MW of energy to Wyoming Electric from its Wygen I power plant starting January 1, 2023, and for 20 additional years. On December 23, 2019, the Company filed a response to questions from the FERC and awaits a decision from FERC.an escalation factor.
Mining
In October 2019, negotiations were completed for the price reopenerre-opener in the contract with the Wyodak power plant. Effective July 1, 2019, thePlant. The new price was
reset at $17.94 per ton with customary escalators,effective July 1, 2019, compared to the prior contract price of $18.25 per ton. The current contract expiresprice is comprised of three components: 1) avoided transportation costs (approximately 20% of current price); 2) avoided costs of an unloading facility (approximately 30% of current price); and 3) a rolling 12-month average of the Coal Daily spot market price of 8,400 Btu Powder River Basin coal (approximately 50% of current price).
WRDC supplies coal to Black Hills Wyoming for the Wygen I generating facility for requirements under an agreement through June 30, 2038. Currently, this agreement uses a base price that includes price escalators and quality adjustments and includes actual cost per ton plus a margin equal to the yield for Moody’s A-Rated Utility Bond Index plus 400 basis points with the base price being adjusted on a 5-year interval. Effective January 1, 2022, in conjunction with the new Wygen I 60 MW PPA, WRDC’s current coal supply agreement will be revised using pricing that will be cost-based to regulate earnings to a specified return on the cost-depreciated investment base. For additional information regarding the new Wygen I 60 MW PPA, see Note 3 of the Notes to Consolidated Financial Statements in this Annual Report on Form 10-K.
Competition. Our strategy is to sell the majority of our production to on-site, mine-mouth generation facilities under long-term supply contracts. Historically, any off-site sales have been to consumers within close proximity to the WRDC mine. Rail transport market opportunities for WRDC are limited due to the lower heating value (Btu) of the coal, combined with the fact that the WRDC mine is served by only one railroad, resulting in less competitive transportation rates.
Additionally, coal competes with other energy sources, such as natural gas, wind, solar and hydropower. Costs and other factors relating to these alternative fuels, such as safety, environmental and availability considerations affect the overall demand for coal as a fuel.
Environmental Matters. We are subject to federal, state and local laws and regulations providing for air, water and solid waste pollution control; state facility-siting regulations; zoning and planning regulations of certain state and local authorities; federal health and safety regulations; and state hazard communication standards. See Environmental Matters section for further information.
Mine Reclamation. Reclamation is completed during production and after mining has finished. Under applicable law, we must submit applications to, and receive approval from, the Wyoming Department of Environmental Quality for any mining and reclamation plans that provide for orderly mining, reclamation and restoration of the WRDC mine. We have approved mining permits and are in compliance with other permitting programs administered by various regulatory agencies. The WRDC mine is permitted to operate under a five-year mining permit issued by the State of Wyoming. In 2016, that five-year permit was re-issued and we are currently in the process of renewing this permit. Based on extensive reclamation studies, we have accrued approximately $13 million for reclamation costs as of December 31, 2020. See additional information in Note 7 of the Notes to Consolidated Financial Statements in this Annual Report on Form 10-K.
Operating statistics. See a summary of key operating statistics in the Mining segment operating results within Management’s Discussion and Analysis of Financial Condition and Results of Operations in Item 7 of this Annual Report on Form 10-K.
Environmental Matters
In November 2020, we announced clean energy goals to reduce GHG emissions that are based on prudent and proven solutions to reduce our emissions while minimizing cost impacts to our customers. See more information in Key Elements of our Business Strategy within Management’s Discussion and Analysis of Financial Condition and Results of Operations in Item 7 of this Annual Report on Form 10-K.
Environmental Management System (EMS). We operate an EMS that is composed of environmental policies and procedures, voluntary initiatives, objectives and annual targets, operational controls, training, a sophisticated task scheduling/tracking and document control system, and a continuous improvement process. The program attained Colorado’s highest level in their Environmental Leadership Program (Gold Level status in 2014) and has continued this status through 2020.
Methane Rules (Greenhouse Gas Emissions). The EPA and the State of Colorado have implemented strict regulatory requirements on hydrocarbon and methane emissions associated with natural gas gathering and transmission systems. Presently, we have facilities in our natural gas transmission operations affected by the methane reduction rules.
Our operations are in compliance with both EPA and State of Colorado rules. Future modifications to our gathering and transmissions systems are anticipated to trigger EPA methane rules that we will adhere to. We developed a corporate-wide methane control strategy to address GHG emissions. As a proactive measure in reducing methane emissions beyond current regulatory requirements, we have entered into the EPA’s Methane Challenge Program. This is a voluntary program founded by the EPA in collaboration with oil and natural gas companies that recognizes companies that make specific and transparent commitments to reduce methane emissions.
Short-term Emission Limits. The EPA and State Air Quality Programs implemented short-term emission limits for coal and natural gas-fired generating units during normal and start-up operating scenarios for SO2, NOx and opacity. The limits pertain to emissions during start-up periods and upset conditions such as mechanical malfunctions. State and federal regulatory agencies typically excuse short-term emissions exceedances if they are reported and corrected immediately or if it occurs during start-up.
We proactively manage this requirement through maintenance efforts and installing additional pollution control systems to control SO2 emission short-term excursions during start-up. These actions have nearly eliminated our short-term emission limit compliance risk while plant availability remained above 90% for all four of our coal-fired plants. To eliminate the remaining potential for exceedances, an innovative trip logic mechanism was implemented to shut down the power plant if we anticipate the emission limit will be exceeded. There have been limited instances of the trip logic mechanism being used and we experienced zero exceedances during 2020.
Regional Haze (Impacts to the Wyodak Plant). The EPA Regional Haze rule was promulgated to improve visibility in our National Parks and Wilderness Areas.The State of Wyoming proposed controls in its Regional Haze State Implementation Plan (SIP) which allowed PacifiCorp to install low-NOx burners in the Wyodak Plant, of which South Dakota Electric owns 20%. The EPA did not agree with the State of Wyoming’s determination, overruled it in a Federal Implementation Plan (FIP) and proposed a Selective Catalytic Reactor to be installed to control NOx emissions. This would cost South Dakota Electric approximately $27 million due to its 20% ownership of the Wyodak Plant. PacifiCorp and the State of Wyoming challenged the EPA’s determination. Prior to proceeding to court, PacifiCorp and the EPA reached a verbal agreement on December 16, 2020, to limit operating hours and determined that low-NOx burners would be considered appropriate to control NOx emissions. This proposed agreement was published in the Federal Register, but remains in the public comment period until March 1, 2021. The final agreement must be published in the Federal Register and approved in Wyoming’s State Implementation Plan through the rule making process.
Mining. Operations at the WRDC mine must regularly address issues related to the proximity of the mine disturbance boundary to the City of Gillette and to residential properties. Homeowner complaints and challenges to the permits may occur as mining operations move closer to residential areas. Specific concerns could include damage to wells, fugitive dust emissions, vibration and an emissions cloud from blasting. The mine makes every effort to reduce these impacts by monitoring blasts, modifying blast techniques to reduce blast vibration, applying dust suppression controls on roads and reclaiming lands to reduce windblown dust.
Former Manufactured Gas Plants (FMGP). Federal and state laws authorize the EPA and other agencies to issue orders compelling potentially responsible parties to clean up sites that are determined to present an actual or potential threat to human health or the environment. As of December 31, 20222020, our Gas Utilities have two active FMGP sites, which are located in Council Bluffs, Iowa, and negotiationsMcCook, Nebraska. At the Council Bluffs site, the EPA issued an order for the responsible parties to proceed with an Engineering Evaluation and Cost Analysis (EECA) to clean up the site. Three viable Potential Responsible Parties (PRP) continue to deny their legal attachment to the site. The Company will continue conducting the EECA and anticipates pursuing the PRP’s through legal action. There is currently no action being taken at the McCook, Nebraska site. A third-party initially indicated they intend to manage and pay for the clean-up at this site. However, after further investigation, the third-party assessed they owned the property after the gas plant ceased operations. We expect to conduct an assessment to determine viable PRPs.
For additional information, see Note 3 of the Notes to Consolidated Financial Statements in this Annual Report on Form 10-K.
Affordable Clean Energy Rule. The EPA was directed to repeal, revise and replace the Clean Power Plan rule. On August 31, 2018, the EPA published the proposed Affordable Clean Energy (ACE) rule. This rule focused on heat-rate improvements on coal-fired boiler units and applied only to our coal-fired plants. The Company’s coal-fired plants subject to the rule had implemented or planned to implement a majority of the efficiency requirements listed in the rule. On January 19, 2021, a three-judge panel of the U.S. Court of Appeals for the District of Columbia Circuit vacated the ACE rule. The court remanded the regulation regarding carbon dioxide emissions from existing power plants back to the EPA for reconsideration. Currently, there is no rule governing power plant GHG emissions and it is uncertain when a new rule will be promulgated.
OSM Coal Combustion Residual Rule (CCR). The EPA issued the CCR which is currently effective and establishes requirements to protect surface and groundwater from impacts of coal ash impoundments. WRDC is exempt from the EPA CCR because ash is used for backfill reclamation in areas previously mined. The Office of Surface Mining (OSM) was considering CCR rules that would apply to the mine, but these rules were not proposed during the Trump administration. We will continue to monitor to see if the Biden administration pursues these rules.
Environmental risk changes constantly with the implementation of new or modified regulations, changing stakeholder interests and needs, and through the introduction of innovative work practices and technologies. We assess risk annually and develop mitigation strategies to successfully and responsibly manage and ensure compliance across the enterprise. For additional information on environmental matters, see Item 1A and Note 3 of the Notes to Consolidated Financial Statements in this Annual Report on Form 10-K.
Other Properties
In addition to the properties previously disclosed in the sections above, we own or lease several facilities throughout our service territories including a corporate headquarters building and various office, service center, storage, shop and warehouse space. Substantially all of the tangible utility properties of South Dakota Electric and Wyoming Electric are underwaysubject to extendliens securing first mortgage bonds issued by South Dakota Electric and Wyoming Electric, respectively.
Human Capital Resources
Overview
Black Hills Corporation is committed to supporting operational excellence by attracting, motivating, retaining and encouraging the contract.development of highly qualified employees. Our employees’ drive and dedication to their work, and their commitment to the safety of our customers and their fellow employees, allows Black Hills Corporation to successfully grow and manage our business year over year. The impacts of COVID-19 to our businesses and employees are discussed in the Company Highlights within Management’s Discussion and Analysis of Financial Condition and Results of Operations in Item 7 of this Annual Report on Form 10-K.
| | | | | |
| Our Team | As of December 31, 2020 |
| Total employees | 3,011 |
| Gender diversity (women as a % of total employees) | 26% |
Women in executive leadership positions (a) | 31% |
| Ethnic diversity (non-white employees as a % of total) | 11% |
| Military veterans | 16% |
| Represented by a union | 25% |
| |
| For the year ended December 31, 2020 |
| Number of external hires | 299 |
| External hires gender diversity (as a % of total external hires) | 29% |
| External hires ethnic diversity (as a % of total external hires) | 16% |
Turnover rate (b) | 8% |
| Retirement rate | 3% |
__________
(a) Executive leadership positions are defined as positions with Vice President, Senior Vice President or Chief in their title.
(b) Includes voluntary and Otherinvoluntary separations, but excludes internships.
On October 3, 2019,Total Employees
| | | | | |
| Number of Employees |
| At December 31, 2020 |
| Electric Utilities | 379 | |
| Gas Utilities | 1,237 | |
| |
| Power Generation and Mining | 60 | |
| Corporate and Other | 1,335 | |
| Total | 3,011 | |
At December 31, 2020, approximately 21% of our total employees and 23% of our Electric and Gas Utilities employees were eligible for regular (age 65 with at least 5 years of service) or early (ages 55 to 64 with at least 5 years of service) retirement.
Collective Bargaining Agreements
At December 31, 2020, certain employees of our Electric Utilities and Gas Utilities were covered by the collective bargaining agreements as shown in the table below. We have not experienced any labor stoppages in decades.
| | | | | | | | | | | |
| Utility | Number of Employees | Union Affiliation | Expiration Date of Collective Bargaining Agreement |
| Colorado Electric | 95 | | IBEW Local 667 | April 15, 2023 |
| South Dakota Electric | 137 | | IBEW Local 1250 | March 31, 2022 |
| Wyoming Electric | 26 | | IBEW Local 111 | June 30, 2024 |
| Total Electric Utilities | 258 | | | |
| | | |
| Iowa Gas | 121 | | IBEW Local 204 | January 31, 2026 |
| Kansas Gas | 17 | | Communications Workers of America, AFL-CIO Local 6407 | December 31, 2024 |
| Nebraska Gas | 100 | | IBEW Local 244 | March 13, 2022 |
| Nebraska Gas | 147 | | CWA Local 7476 | October 30, 2023 |
| Wyoming Gas | 15 | | IBEW Local 111 | June 30, 2024 |
| Wyoming Gas | 84 | | CWA Local 7476 | October 30, 2023 |
| Total Gas Utilities | 484 | | | |
| | | |
| Total | 742 | | | |
Attraction
Continuous attraction of qualified team members is critical to our ability to serve our 1.3 million customers safely and efficiently. We actively recruit diverse candidates and continuously evaluate our interviewing and hiring practices to ensure equitable pay and processes. Our attraction efforts include the use of multiple nation-wide job boards, local college and high school outreach programs, a strong college internship program and participation in national and local job fairs. Another key area of attraction is our commitment to our military personnel and veterans. We have targeted attraction efforts specific to military personnel transitioning into civilian life and for veterans of all types.
Diversity & Inclusion
At Black Hills Corporation, we completedbelieve in the benefits of diversity, equity and inclusion. We believe that a diverse workforce will assist us in achieving our goals of becoming the safest utility in the nation, providing exceptional customer service and achieving new levels of growth in a rapidly evolving industry. Workforce diversity trends, including diverse new hires, promotions and turnover, are monitored at regular intervals.
Development and Retention
Retaining and developing team members is critical to our continued success. Our retention efforts include competitive compensation programs, career development resources for all employees and internal training programs. Our compensation programs are designed to be strategically aligned, externally competitive, internally equitable, personally motivating, cost effective and legally compliant. Our career development resources include management onboarding, leadership development programs, mentoring programs, individual development assessments and more. Internal training opportunities include corporate-wide trainings such as our code of conduct and specialized training opportunities for different job functions. Our Field Career Path Program (FCPP) promotes career growth through established standards of knowledge, skills, abilities and performance.
ITEM 1A.RISK FACTORS
The nature of our business subjects us to a number of uncertainties and risks. Risks that may adversely affect the business operations, financial condition, results of operations or cash flows are described below. These risk factors, along with other risk factors that we discuss in our periodic reports filed with the SEC should be considered for a better understanding of our Company.
STRATEGIC RISKS
Our continued success is dependent on execution of our strategic business plans including our growth strategy.
Our success depends, in significant part, on our ability to execute our strategic business plans, including our growth strategy. Our plans and strategy include reducing GHG emissions for our Electric Utilities and Gas Utilities, transforming the customer experience, growing our electric and natural gas customer load, pursuing operating efficiencies and modernizing our utility infrastructure. Our current plans and strategy may be negatively impacted by disruptive forces and innovations in the marketplace, changing political, business or regulatory conditions, and technology advancements.
In addition, we have significant capital investment programs planned for the next five years that are key to our strategic business plans. The successful execution of our capital investment program depends on, or could be affected by, a variety of factors that include, but are not limited to: weather conditions, effective management of projects, availability of qualified construction personnel including contractors, changes in commodity and other prices, availability of materials, governmental approvals and permitting, regulatory cost recovery and return on investment.
An inability to successfully and timely adapt to changing conditions and execute our strategic plans, including our growth strategy could materially affect our financial operating results including earnings, cash flow and liquidity.
Customer growth and usage in our service territories may fluctuate with economic conditions, emerging technologies or responses to price increases.
Our financial operating results are impacted by energy demand in our service territories. Customer growth and usage may be impacted by a number of factors, including the voluntary reduction in consumption of electricity and natural gas by our customers in response to increases in prices and energy efficiency programs, electrification initiatives that could negatively impact the demand for natural gas, economic conditions impacting customers’ disposable income and the use of distributed generation resources or other emerging technologies. Continued technological improvements may make customer and third-party distributed generation and energy storage systems, including fuel cells, micro-turbines, wind turbines, solar cells and batteries, more cost effective and feasible for our customers. If more customers utilize their own generation, demand for energy from us would decline. Such developments could affect the price of energy and delivery of energy, require further improvements to our distribution systems to address changing load demands and could make portions of our electric system power supply and transmission and/or distribution facilities obsolete prior to the end of their useful lives. Each of these factors could materially affect our financial operating results including earnings, cash flow and liquidity.
REGULATORY, LEGISLATIVE AND LEGAL RISKS
We may be subject to future laws, regulations, or actions associated with climate change, including those relating to fossil-fuel generation and GHG emissions, which could increase our operating costs or restrict our market opportunities.
We own and operate regulated and unregulated electric power plants that burn fossil fuels (natural gas and coal) and a surface mine that extracts and sells coal. We also purchase, store and deliver natural gas to our customers. These business activities are subject to evolving public debt offeringconcern regarding fossil fuels, GHG emissions (such as carbon dioxide and methane) and their impact on the climate.
There is uncertainty surrounding climate regulation due to legal challenges to some current regulations and anticipated new federal and/or state climate legislation and regulation. The Biden administration has issued executive orders aimed at reducing GHG emissions and declared climate change a national security policy for the first time. New or more stringent regulations or other energy efficiency requirements could require us to incur significant additional costs relating to, among other things, the installation of $700 millionadditional emission control equipment, the acceleration of capital expenditures, the purchase of additional emissions allowances or offsets, the acquisition or development of additional energy supply from renewable resources, the closure or capacity reductions of coal-fired power generation facilities and potential increased production from our combined cycle natural gas-fired generating units. Increased rules and regulations associated with fossil fuels and GHG emissions could result in senior unsecured notes. Proceeds were usedthe impairment or retirement of some of our existing or future transmission, distribution, generation and natural gas storage facilities or our coal mine. Further, these rules could create the need to repaypurchase or build clean-energy fuel sources to fulfill obligations to our customers. These actions could also result in increased operating costs which could adversely impact customers and our financial operating results including earnings, cash flow and liquidity. We cannot definitively estimate the $400 million Corporate term loan due June 17, 2021, retireeffect of GHG legislation or regulation on our results of operations, financial condition or cash flows.
Future GHG constraints designed to minimize emissions from natural gas could likewise result in increased costs and affect the $200 million 5.875% senior notes due July 15, 2020demand for natural gas as well as the prices charged to customers and repaythe competitive position of natural gas. Certain cities in our operational footprint are focused on electrification and have adopted initiatives to prohibit the construction of new natural gas distribution facilities. Any such initiatives and legislation could have a material impact on our results of operations, financial condition and cash flows.
We may be subject to unfavorable or untimely federal and state regulatory outcomes.
Our regulated Electric and Gas Utilities are subject to cost-of-service/rate-of-return regulation and earnings oversight from federal and eight state utility commissions. This regulatory treatment does not provide any assurance as to achievement of desired earnings levels. Our customer rates are regulated by either the FERC or the respective state utility regulatory authority based on an analysis of our costs and investments, as reviewed and approved in a regulatory proceeding. While rate regulation is premised on the full recovery of prudently incurred costs and a reasonable rate of return on invested capital, there can be no assurance that our various regulatory authorities will judge all of our costs to have been prudently incurred or that the regulatory process in which rates are determined will result in full or timely recovery of our costs and the allowed return on invested capital. In addition, adverse rate decisions, including rate moratoriums, rate refunds, limits on rate increases, lower allowed returns on investments or rate reductions, could be influenced by competitive, economic, political, legislative, public perception and regulatory pressures and adversely impact results of operations, financial condition and cash flows.
Each of our Electric and Gas Utilities are permitted to recover certain costs (such as increased fuel and purchased power costs or integrity capital investments) outside of a base rate review in order to stabilize customer rates and reduce regulatory lag. If regulators decide to discontinue these tariff-based recovery mechanisms, it could negatively impact results of operations, financial condition and cash flows.
Costs could significantly increase to achieve or maintain compliance with existing or future environmental laws, regulations or requirements.
Our business segments are subject to numerous environmental laws and regulations affecting many aspects of present and future operations, including air emissions (i.e. SO2, NOx, volatile organic compounds, particulate matter and GHG), water quality, wastewater discharges, solid waste and hazardous waste. These laws and regulations may result in increased capital, operating and other costs. These laws and regulations generally require the business segments to obtain and comply with a wide variety of environmental licenses, permits, inspections and other approvals. Compliance with environmental laws and regulations may require significant expenditures, including expenditures for cleanup costs and damages arising from contaminated properties. Failure or inability to comply with evolving environmental regulations may result in the imposition of fines, penalties and injunctive measures affecting operating assets.
Our business segments may not be successful in recovering increased capital and operating costs incurred to comply with new environmental regulations through existing regulatory rate structures and contracts with customers. More stringent environmental laws or regulations could result in additional costs of operation for existing facilities or impede the development of new facilities. Although it is not expected that the costs to comply with current environmental regulations will have a material adverse effect on our business segments’ financial position, results of operations or cash flows, future environmental compliance costs could have a significant negative impact.
Legislative and regulatory requirements may lead to increased costs and result in compliance penalties.
Business activities in the energy sector are heavily regulated, primarily by agencies of the federal government. Many agencies employ mandatory civil penalty structures for regulatory violations. The FERC, NERC, CFTC, EPA, OSHA, SEC and MSHA may impose significant civil and criminal penalties to enforce compliance requirements relative to our business, which could have a material adverse effect on our financial operating results including earnings, cash flow and liquidity.
Municipal governments may seek to limit or deny our franchise privileges.
Municipal governments within our utility service territories possess the power of condemnation and could establish a municipal utility within a portion of short-termour current service territories by limiting or denying franchise privileges for our operations and exercising powers of condemnation over all or part of our utility assets within municipal boundaries. We regularly engage in negotiations on renewals of franchise agreements with our municipal governments. We have from time to time faced challenges or ballot initiatives on franchise renewals. To date, we have been successful in resolving or defending each of these challenges. Although condemnation is a process that is subject to constitutional protections requiring just and fair compensation, as with any judicial procedure, the outcome is uncertain. If a municipality sought to pursue this course of action, we cannot assure that we would secure adequate recovery of our investment in assets subject to condemnation. We also cannot quantify the impact that such action would have on the remainder of our business operations.
Changes in Federal tax law may significantly impact our business.
We are subject to taxation by the various taxing authorities at the federal, state and local levels where we do business. Similar to the TCJA, sweeping legislation or regulation could be enacted by any of these governmental authorities which may affect our tax burden. Changes may include numerous provisions that affect businesses, including changes to U.S. corporate tax rates, business-related exclusions, and deductions and credits. The outcome of regulatory proceedings regarding the extent to which the effect of a change in corporate tax rate will impact our utility customers and the time period over which the impact will occur could significantly impact future earnings and cash flows. Separately, a challenge by a taxing authority, changes in taxing authorities’ administrative interpretations, decisions, policies and positions, our ability to utilize tax benefits such as carryforwards or tax credits, or a deviation from other tax-related assumptions may cause actual financial results to deviate from previous estimates.
OPERATING RISKS
Our financial performance depends on the successful operation of electric generating facilities, electric and natural gas transmission and distribution systems, natural gas storage facilities, and a coal mine.
The risks associated with management of these operations include:
•Inherent dangers. Electricity and natural gas can be dangerous to employees and the general public. Failures of or contact with power lines, natural gas pipelines or service facilities and equipment may result in fires, explosions, property damage and personal injuries, including death. While we maintain liability and property insurance coverage, such policies are subject to certain limits and deductibles. The occurrence of any of these events may not be fully covered by our insurance;
•Weather, natural conditions and disasters. Severe weather events, such as snow and ice storms, fires, tornadoes, strong winds, significant thunderstorms, flooding and drought, could negatively impact operations, including our ability to provide energy safely, reliably and profitably and our ability to complete construction, expansion or refurbishment of facilities as planned;
•Acts of sabotage, terrorism or other malicious attacks. Damage to our facilities due to deliberate acts could lead to outages or other adverse effects;
•Operating hazards. Operating hazards such as leaks, mechanical problems and accidents, including fires or explosions could impact employee and public safety, reliability and customer confidence;
•Equipment and processes. Breakdown or failure of equipment or processes, unavailability or increased cost of equipment, and performance below expected levels of output or efficiency could negatively impact our results of operations;
•Disrupted transmission and distribution. We depend on transmission and distribution facilities, including those operated by unaffiliated parties, to deliver the electricity and gas that we sell to our retail and wholesale customers. If transmission is interrupted physically, mechanically, or with cyber means, our ability to sell or deliver utility services and satisfy our contractual obligations may be hindered;
•Natural gas supply for generation and distribution. Our regulated utilities and non-regulated entities purchase natural gas from a number of suppliers for our generating facilities and for distribution to our customers. Our results of operations could be negatively impacted by the lack of availability and cost of natural gas, and disruptions in the delivery of natural gas due to various factors, including but not limited to, transportation delays, labor relations, weather and environmental regulations;
•Replacement power. The cost of supplying or securing replacement power during scheduled and unscheduled outages of generation facilities could negatively impact our results of operations;
•Governmental permits. The inability to obtain required governmental permits and approvals along with the cost of complying with or satisfying conditions imposed upon such approvals could negatively impact our ability to operate
and our results of operations;
•Operational limitations. Operational limitations imposed by environmental and other regulatory requirements and contractual agreements, including those that restrict the timing of generation plant scheduled outages, could negatively impact our results of operations;
•Increased costs. Increased capital and operating costs to comply with increasingly stringent laws and regulations; unexpected engineering, environmental and geological problems; and unanticipated cost overruns could negatively impact our results of operations;
•Labor and labor relations. The cost of recruiting and retaining skilled technical labor or the unavailability of such resources could have a negative impact on our operations. Our ability to transition and replace our retirement-eligible utility employees is a risk; at December 31, 2020, approximately 23% of our Electric Utilities and Gas Utilities employees were eligible for regular or early retirement. Our ability to avoid or minimize supply interruptions, work stoppages and labor disputes is also a risk; approximately 25% of our employees are represented by unions;
•Public opposition. Opposition by members of public or special-interest groups could negatively impact our ability to operate our businesses; and
The ongoing operation of our business involves the risks described above, in addition to risks associated with threats to our overall business model, such as electrification initiatives. Any of these risks could cause us to experience negative financial results and damage to our reputation and public confidence. These risks could cause us to incur significant costs or be unable to deliver energy and/or operate below expected capacity levels, which in turn could reduce revenues or cause us to incur higher operating and maintenance costs and penalties. While we maintain insurance and obtain warranties from vendors and obligate contractors to meet certain performance levels, the proceeds of such insurance and our rights under contracts, warranties or performance guarantees may not be timely or adequate to cover lost revenues, increased expenses, liability or liquidated damage payments.
Cyberattacks, terrorism, or other malicious acts targeting our key technology systems could disrupt our operations, or lead to a loss or misuse of confidential and proprietary information.
To effectively operate our business, we rely upon a sophisticated electronic control system, information and operation technology systems and network infrastructure to generate, distribute and deliver energy, and collect and retain sensitive information including personal information about our customers and employees. Cyberattacks, terrorism or other malicious acts targeting electronic control systems could result in a full or partial disruption of our electric and/or gas operations. Attacks targeting other key technology systems, including our third-party vendors’ information systems, could further add to a full or partial disruption of our operations. Any disruption of these operations could result in a loss of service to customers and associated revenues, as well as significant expense to repair damages and remedy security breaches. In addition, any theft, loss and/or fraudulent use of customer, shareowner, employee or proprietary data could subject us to significant litigation, liability and costs, as well as adversely impact our reputation with customers and regulators, among others.
We have instituted security measures and safeguards to protect our operational systems and information technology assets, including certain safeguards required by FERC. Despite our implementation of security measures and safeguards, all of our technology systems may still be vulnerable to disability, failures or unauthorized access.
Weather conditions, including the impacts of climate change, may cause fluctuation in customer usage.
Our utility businesses are seasonal businesses and weather conditions and patterns can have a material impact on our operating performance. To the extent weather conditions are affected by climate change, customers’ energy use could increase or decrease. Demand for electricity is typically greater in the summer and winter months associated with cooling and heating, respectively. Demand for natural gas depends heavily upon winter-weather patterns throughout our service territory and a significant amount of natural gas revenues are recognized in the first and fourth quarters related to the heating season. Accordingly, our utility operations have historically generated lower revenues and income when weather conditions are cooler than normal in the summer and warmer than normal in the winter. Demand for natural gas is also impacted by summer weather patterns that are cooler than normal and provide higher than normal precipitation; both of which can reduce natural gas demand for irrigation. Unusually mild summers and winters, therefore, could have an adverse effect on our financial operating results, including earnings, cash flow and liquidity.
FINANCIAL RISKS
A sub-investment grade credit rating could impact our ability to access capital markets.
Our issuer credit rating is Baa2 (Stable outlook) by Moody’s; BBB+ (Stable outlook) by S&P; and BBB+ (Stable outlook) by Fitch. Reduction of our investment grade credit ratings could impair our ability to refinance or repay our existing debt and complete new financings on reasonable terms, if at all. A credit rating downgrade, particularly to sub-investment grade, could also result in counterparties requiring us to post additional collateral under existing or new contracts. In addition, a ratings downgrade would increase our interest expense under some of our existing debt obligations, including borrowings under our credit facilities, potentially significantly increasing our cost of capital and other associated operating costs which may not be recoverable through existing regulatory rate structures and contracts with customers.
Our use of derivative financial instruments as hedges against commodity prices and financial market risks could result in material financial losses.
We use various financial and physical derivatives, including futures, forwards, options and swaps to manage commodity price and interest rate risks. The timing of the recognition of gains or losses on these economic hedges in accordance with GAAP does not always match up with the gains or losses on the commodities being hedged. For Black Hills Energy Services under the Choice Gas Program, and in certain instances within our regulated Utilities where unrealized and realized gains and losses from derivative instruments are not approved for regulatory accounting treatment, fluctuating commodity prices may cause fluctuations in reported financial results due to mark-to-market accounting treatment.
To the extent that we hedge our commodity price and interest rate exposures, we forgo the benefits we would otherwise experience if commodity prices or interest rates were to change in our favor. In addition, even though they are closely monitored by management, our hedging activities can result in losses. Such losses could occur under various circumstances, including if a counterparty does not perform its obligations under the hedge arrangement, the hedge is economically imperfect, commodity prices or interest rates move unfavorably related to our physical or financial positions, or hedging policies and procedures are not followed.
Additionally, our exchange-traded futures contracts are subject to futures margin posting requirements. To the extent we are unable to meet these requirements, this could have a significant impact on our business by reducing our ability to execute derivative transactions to reduce commodity price uncertainty and to protect cash flows. Requirements to post collateral may cause significant liquidity issues by reducing our ability to use cash for investment or other corporate purposes, or may require us to increase our level of debt. Further, a requirement for our counterparties to post collateral could result in additional costs being passed on to us, thereby decreasing our profitability.
We have a holding company corporate structure with multiple subsidiaries. Corporate dividends and debt payments are dependent upon cash distributions to the holding company from the subsidiaries.
As a holding company, our investments in our subsidiaries are our primary assets. Our operating cash flow and ability to service our indebtedness depend on the operating cash flow of our subsidiaries and the payment of funds by them to us in the form of dividends or advances. Our subsidiaries are separate legal entities that have no obligation to make any funds available for that purpose, whether by dividends or otherwise. In addition, each subsidiary’s ability to pay dividends to us depends on any applicable contractual or regulatory restrictions that may include requirements to maintain minimum levels of cash, working capital, equity or debt service funds.
There is no assurance as to the amount, if any, of future dividends to the holding company because these subsidiaries depend on our future earnings, capital requirements and financial condition and are subject to declaration by the Board of Directors. See “Liquidity and Capital Resources” within Management’s Discussion and Analysis of Financial Condition and Results of Operations in Item 7 and Note 9 of our Notes to Consolidated Financial Statements of this Annual Report on Form 10-K for further information regarding these restrictions and their impact on our liquidity.
We may be unable to obtain financing on reasonable terms needed to refinance debt, fund planned capital expenditures or otherwise execute our operating strategy.
Our ability to execute our operating strategy is highly dependent upon our access to capital. Historically, we have addressed our liquidity needs (including funds required to make scheduled principal and interest payments, refinance debt, pay dividends and fund working capital and planned capital expenditures) with operating cash flow, borrowings under credit facilities, proceeds of debt and equity offerings and proceeds from asset sales. Our ability to access the capital markets and the costs and terms of available financing depend on many factors, including changes in our credit ratings, changes in the federal or state regulatory environment affecting energy companies, volatility in commodity or electricity prices and general economic and market conditions.
In addition, because we are a holding company and our utility assets are owned by our subsidiaries, if we are unable to adequately access the credit markets, we could be required to take additional measures designed to ensure that our utility subsidiaries are adequately capitalized to provide safe and reliable service. Possible additional measures would be evaluated in the context of then-prevailing market conditions, prudent financial management and any applicable regulatory requirements.
National and regional economic conditions may cause increased counterparty credit risk, late payments and uncollectible accounts.
A future recession or pandemic, if one occurs, may lead to an increase in late payments or non-payment from retail residential, commercial and industrial utility customers, as well as from our non-utility customers. If late payments and uncollectible accounts increase, earnings and cash flows from our continuing operations may be reduced.
We may be unable to obtain insurance coverage, and the coverage we currently have may not apply or may be insufficient to cover a significant loss.
Our ability to obtain insurance, as well as the cost of such insurance, could be impacted by developments affecting the insurance industry and the financial condition of insurers. Additionally insurance providers could deny coverage or decline to extend coverage under the same or similar terms that are presently available to us. A loss for which we are not adequately insured could materially affect our financial results. The coverage we currently have in place may not apply to a particular loss, or it may not be sufficient to cover all liabilities to which the Company may be subject, including liability and losses associated with wildfire, natural gas and gas storage field explosions, cyber-security breaches, environmental hazards and natural disasters.
Market performance or changes in key valuation assumptions could require us to make significant unplanned contributions to our pension plan and other postretirement benefit plans.
Assumptions related to interest rates, expected return on investments, mortality and other key actuarial assumptions have a significant impact on our funding requirements and the expense recognized related to these plans. An adverse change to key assumptions associated with our defined benefit retirement plans may require significant unplanned contributions to the plans which could adversely affect our financial operating results including earnings, cash flow and liquidity.
Costs associated with our healthcare plans and other benefits could increase significantly.
The costs of providing healthcare benefits to our employees and retirees have increased substantially in recent years. We believe that our employee benefit costs, including costs related to healthcare plans for our employees and former employees, will continue to rise. Significant regulatory developments have required, and likely will continue to require, changes to our current employee benefit plans and supporting administrative processes. Our electric and gas utility rates are regulated on a state-by-state basis by the relevant state regulatory authorities based on an analysis of our costs, as reviewed and approved in a regulatory proceeding. Within our utility rates we have generally recovered the cost of providing employee benefits. As benefit costs continue to rise, there is no assurance that the state utility commissions will allow recovery of these increased costs. The rising employee benefit costs, or inadequate recovery of such costs, may adversely affect our financial operating results including earnings, cash flow, or liquidity.
PANDEMIC RISK
Our business operations, results of operations, financial condition and cash flows could be adversely affected by the coronavirus (COVID-19) pandemic.
We have responded to the global pandemic of COVID-19 by taking steps to mitigate the potential risks to us posed by its spread.
For the year ended December 31, 2020, the COVID-19 pandemic had a limited net financial impact on our business operations, financial condition and cash flows. In particular, we experienced:
•Increased allowance for credit losses and bad debt expense due to anticipated customer non-payment as a result of suspended disconnections;
•Increased costs due to sequestration of mission-critical and essential employees;
•Lower commercial and certain transport volumes partially offset by higher electric and natural gas residential usage;
•Waived customer late payment fees;
•Reduced availability of our employees;
•Increased costs for personal protection equipment and cleaning supplies;
•Minimal disruptions receiving the materials and supplies necessary to maintain operations and continue executing our capital investment plan;
•Minimal impacts to the availability of our contractors;
•Minimal decline in the funded status of our pension plan;
•Minimal interest expense increase due to disruptions in the Commercial Paper markets; and
•Reduced training, travel, and outside services related expenses.
Should the COVID-19 pandemic continue for a prolonged period or impact the areas we serve more significantly than it has to date, our business operations, financial condition and cash flows could be impacted in more significant ways. In addition to exacerbating the impacts described above, we could experience:
•Adverse impacts on our strategic business plans, growth strategy and capital investments;
•Increased adverse impacts to electricity and natural gas demand from our customers, particularly from commercial and industrial customers;
•Further reduction in the availability of our employees and contractors;
•Increased costs as a result of our preventative measures, such as sequestration of essential employees and facility cleaning services;
•Increased allowance for credit losses and bad debt expense as a result of delayed or non-payment from our customers, both of which could be magnified by Federal or state government legislation that requires us to extend suspensions of disconnections for non-payment;
•Delays and disruptions in the availability, timely delivery and cost of materials and components used in our operations;
•Disruptions in the commercial operation dates of certain projects impacting qualification criteria for certain tax credits and triggering potential damages under our power purchase agreements;
•Deterioration of the credit quality of our counterparties, including gas commodity contract counterparties, power purchase agreement counterparties, contractors or retail customers, that could result in credit losses;
•Impairment of goodwill or long-lived assets;
•Adverse impacts on our ability to construct and operate facilities;
•Inability to meet the requirements of the covenants in our existing credit facilities, including covenants regarding Consolidated Indebtedness to Capitalization Ratio;
•Deterioration in our financial metrics or the business environment that adversely impacts our credit ratings;
•Delay in the permitting process of certain development projects, affecting the timing of final investment decisions and start dates of construction;
•Adverse impact on our liquidity position and cost of and ability to access funds from financial institutions and capital markets; and
•Delays in our ability to change rates through regulatory proceedings.
To date, we have experienced limited impacts to our results of operations, financial condition, cash flows or business plans. However, the situation remains fluid and it is difficult to predict with certainty the potential impact of COVID-19 on our results of operations, financial condition and cash flows.
ITEM 1B.UNRESOLVED STAFF COMMENTS
None.
ITEM 3.LEGAL PROCEEDINGS
Information regarding our legal proceedings is incorporated herein by reference to the “Legal Proceedings” sub-caption within Item 8, Note 3, “Commitments, Contingencies and Guarantees”, of our Notes to Consolidated Financial Statements in this Annual Report on Form 10-K.
ITEM 4. MINE SAFETY DISCLOSURES
Information concerning mine safety violations or other regulatory matters required by Sections 1503(a) of the Dodd-Frank Wall Street Reform and Consumer Protection Act is included in Exhibit 95 of this Annual Report.
INFORMATION ABOUT OUR EXECUTIVE OFFICERS
Linden R. Evans, age 58, has been President and Chief Executive Officer since January 1, 2019, we issuedPresident and Chief Operating Officer from 2016 through 2018, and President and Chief Operating Officer — Utilities from 2004 through 2015. Mr. Evans served as the Vice President and General Manager of our former communication subsidiary in 2003 and 2004, and Associate Counsel from 2001 to 2003. Mr. Evans has 19 years of experience with the Company.
Scott A. Buchholz, age 59, has been our Senior Vice President of Strategic Initiatives since July 2020. He served as Senior Vice President — Chief Information Officer from the closing of the Aquila Transaction in 2008 to 2020. Prior to joining the Company, he was Aquila’s Vice President of Information Technology from 2005 until 2008, Six Sigma Deployment Leader/Black Belt from 2004 until 2005, and General Manager, Corporate Information Technology from 2002 until 2004. Mr. Buchholz has 40 years of experience with the Company, including 28 years with Aquila. Mr. Buchholz plans to retire on March 8, 2021.
Brian G. Iverson, age 58, has been Senior Vice President, General Counsel and Chief Compliance Officer since August 26, 2019. He served as Senior Vice President, General Counsel, Chief Compliance Officer and Corporate Secretary from February 1, 2019 to August 26, 2019, Senior Vice President, General Counsel and Chief Compliance Officer from 2016 to February 2019, Senior Vice President - Regulatory and Governmental Affairs and Assistant General Counsel from 2014 to 2016, Vice President and Treasurer from 2011 to 2014, Vice President - Electric Regulatory Services from 2008 to 2011 and as Corporate Counsel from 2004 to 2008. Mr. Iverson has 17 years of experience with the Company.
Richard W. Kinzley, age 55, has been Senior Vice President and Chief Financial Officer since 2015. He served as Vice President - Corporate Controller from 2013 to 2014, Vice President - Strategic Planning and Development from 2008 to 2013, and as Director of Corporate Development from 2000 to 2008. Mr. Kinzley has 21 years of experience with the Company.
Jennifer C. Landis, age 46, has been Senior Vice President - Chief Human Resources Officer since February 1, 2017. She served as Vice President of Human Resources from April 2016 through January 2017, Director of Corporate Human Resources and Talent Management from 2013 to April 2016, and Director of Organization Development from 2008 to 2013. Ms. Landis has 19 years of experience with the Company.
Stuart Wevik, age 59, has been Senior Vice President - Utility Operations since August 26, 2019. He served as Group Vice President - Electric Utilities from 2016 to August 2019, Vice President - Utility Operations from 2008 to 2016, Vice President - Operations from 2004 to 2008 and Vice President and General Manager from 2003 to 2004. Mr. Wevik has 35 years of experience with the Company.
Erik Keller, age 57, joined the Company as Senior Vice President and Chief Information Officer on July 27, 2020. Prior to joining the company, he was an Information Technology consultant to Ontic Inc., a totalglobal provider of 1.3 million shares ofparts and services for legacy aerospace platforms, from January 2020 to July 2020, and Chief Information Officer for BBA Aviation, a global aviation support and aftermarket services provider, from February 2012 to January 2020.
PART II
ITEM 5.MARKET FOR REGISTRANT’S COMMON EQUITY, RELATED STOCKHOLDER MATTERS AND ISSUER PURCHASES OF EQUITY SECURITIES
Our common stock is traded on the New York Stock Exchange under the symbol BKH. As of January 31, 2021, we had 3,537 common shareholders of record and 46,737 beneficial owners, representing all 50 states, the District of Columbia and 6 foreign countries.
We have paid a regular quarterly cash dividend each year since the incorporation of our predecessor company in 1941 and expect to continue paying a regular quarterly dividend for net proceedsthe foreseeable future. At its January 27, 2021 meeting, our Board of $99 million underDirectors declared a quarterly dividend of $0.565 per share, equivalent to an annual dividend rate of $2.26 per share. This equivalent rate, if declared and paid in 2021, will represent 51 consecutive years of annual dividend increases.
For additional discussion of our ATM equity offering program.
On June 17, 2019, we amendeddividend policy and factors that may limit our
Corporate term loan due July 30, 2020. This amendment increased total commitments to $400 million from $300 million and extended the term through June 17, 2021 on substantially similar terms and covenants. The net proceeds were usedability to pay
down short-term debt. Proceeds from the October 3, 2019 debt transactiondividends, see “Liquidity and Capital Resources” under Item 7, Management’s Discussion and Analysis of Financial Condition and Results of Operations in this Annual Report on Form 10-K.
UNREGISTERED SECURITIES ISSUED
There were used to repay this term loan.no unregistered securities sold during 2020.
Operating ResultsISSUER PURCHASES OF EQUITY SECURITIES
A discussion of operating results from our business segments follows.
Non-GAAP Financial Measure
The following discussion includestable contains monthly information about our acquisitions of equity securities for the three months ended December 31, 2020:
| | | | | | | | | | | | | | |
|
| Period | Total Number of Shares Purchased (a) | Average Price Paid per Share | Total Number of Shares Purchased as Part of Publicly Announced Plans or Programs | Maximum Number (or Approximate Dollar Value) of Shares That May Yet Be Purchased Under the Plans or Programs |
| | | | |
| | | | |
| | | | |
| | | | |
| | | | |
| | | | |
| | | | |
| | | | |
| | | | |
| October 1, 2020 - October 31, 2020 | 1 | $ | 53.95 | | — | | — | |
| November 1, 2020 - November 30, 2020 | 804 | 58.63 | | — | | — | |
| December 1, 2020 - December 31, 2020 | 7,569 | 59.66 | | — | | — | |
| Total | 8,374 | | $ | 59.56 | | — | | — | |
| | | | |
_____________
(a) Shares were acquired under the share withholding provisions of the Omnibus Incentive Plan for payment of taxes associated with the vesting of various equity compensation plans.
ITEM 6.SELECTED FINANCIAL DATA
We have early adopted the new SEC amendments to modernize, simplify, and enhance certain financial information prepareddisclosure requirements in accordanceRegulation S-K which, among other things, eliminates the requirement to present Selected Financial Data.
ITEM 7. MANAGEMENT’S DISCUSSION AND ANALYSIS OF FINANCIAL CONDITION AND RESULTS OF OPERATIONS
Executive Summary
We are a customer-focused, growth-oriented electric and natural gas utility company with GAAP,a mission of Improving Life with Energy and a vision to be the Energy Partner of Choice. The Company provides electric and natural gas utility service to 1.3 million customers over 800 communities in eight states, including Arkansas, Colorado, Iowa, Kansas, Montana, Nebraska, South Dakota and Wyoming. We conduct our business operations through four reportable segments: Electric Utilities, Gas Utilities, Power Generation and Mining. Certain unallocated corporate expenses that support our operating segments are presented as well as another financial measure, gross margin, that is considered a “non-GAAP financial measure.” Generally, a non-GAAP financial measure is a numerical measureCorporate and Other. The Company conducts its utility operations under the name Black Hills Energy predominantly in rural areas of the Rocky Mountains and Midwestern states. The Company’s Electric Utilities are supported by our Power Generation and Mining segments, which are mostly contracted to company affiliates and subject to utility-like regulation and oversight. The Power Generation segment produces electric power from its five generating facilities and sells most of the electric capacity and energy to our Electric Utilities under mid- and long-term contracts. The Mining segment, consisting of a company’s financial performance, financial position orsingle coal mine near Gillette, Wyoming, sells nearly all production to fuel the five on-site, mine-mouth power generation facilities. With more than 90% of the Company’s assets directly invested in its regulated utility businesses and the Power Generation and Mining segments supporting its electric utilities mainly through long-term contracts, the Company considers itself a domestic, pure-play electric and natural gas utility company.
The Company has provided energy and served customers for 137 years, since the 1883 gold rush days in Deadwood, South Dakota. Throughout our history, the common thread that unites the past to the present is our commitment to serve our customers and communities. Our strategic focus has not changed in over a century - serving customers with affordable, reliable and safe energy and being strong environmental stewards. Our strategy today continues that emphasis on serving customers and being responsive to the people and communities we serve. Customer expectations are rapidly changing with the advancement of technology and customers are demanding simpler, faster and more convenient solutions to their energy needs. Customers and other stakeholders are demanding cleaner energy solutions to address concerns around carbon emissions. In this rapidly changing energy environment, we are Ready to serve.
Our strategy focuses on improving the way we serve customers with safe, reliable, affordable and cleaner energy while improving the lives of the customers and communities we serve. Our emphasis is on consistently outperforming utility industry averages in key safety metrics; transforming the customer experience; growing our electric and natural gas customer load; pursuing operating efficiencies; and modernizing utility infrastructure. These areas of focus will present the company with significant investment needs as we modernize our infrastructure systems, meet customer growth and fulfill customer expectations for cleaner energy services. It will also allow us to better understand our customer and community needs while providing more intuitive and cost-effective interactions.
Key Elements of our Business Strategy
Modernize, replace and operate utility infrastructure to meet our customers’ energy needs while providing safe, reliable, affordable and cleaner energy. Our utilities own and operate large electric and natural gas infrastructure systems with a geographic footprint that spans nearly 1,600 miles of the United States. Our Electric Utilities own and operate 992 MW of generation capacity and 8,900 miles of transmission and distribution lines and our Gas Utilities own and operate 47,000 miles of natural gas transmission and distribution pipelines. A key strategic focus is to modernize this utility infrastructure to meet customers’ and communities’ varied energy needs, ensure the continued delivery of safe, reliable and affordable energy and reduce GHG emission intensity. In addition, we invest in the accessibility, capacity and integrity of our systems to meet customer growth.
We rigorously comply with all applicable federal, state and local regulations and strive to consistently meet industry best practice standards. A key component of our modernization effort is the development of programs by our Electric and Gas Utilities to systematically and proactively replace aging infrastructure on a system-wide basis. To meet our electric customers’ continued expectations of high levels of reliability, our Electric Utilities utilize a distribution integrity program to ensure the timely repair and replacement of aging infrastructure. Our Gas Utilities utilize a programmatic approach to system-wide pipeline replacement, particularly in high consequence areas. Under the programmatic approach, obsolete, at-risk and vintage materials are replaced in a proactive and systematic time frame. We have removed all cast- and wrought-iron from our natural gas transmission and distribution systems and continue to replace aging infrastructure through programs that prioritize safety and reliability for our customers. All but one of our Gas Utilities are authorized to use system safety, integrity and replacement cost recovery mechanisms that provide for customer rate adjustments which reflect the cost incurred in repairing and replacing the gas delivery systems.
As of December 31, 2020, we estimate our five-year capital investment to be approximately $2.7 billion, with most of that investment targeted toward upgrading existing utility infrastructure and to support customer and community growth needs. Our actual 2020 and forecasted capital expenditures and depreciation for the next five years from 2021 through 2025 are as follows (in millions):
| | | | | | | | | | | | | | | | | | | | | | | |
| Actual | | Forecasted |
Capital Expenditures By Segment (a) : | 2020 | | 2021 | 2022 | 2023 | 2024 | 2025 |
| (in millions) | | | | | | | |
| Electric Utilities | $ | 271 | | | $ | 240 | | $ | 180 | | $ | 143 | | $ | 156 | | $ | 154 | |
| Gas Utilities | 449 | | | 377 | | 347 | | 339 | | 330 | | 326 | |
| Power Generation | 9 | | | 10 | | 9 | | 6 | | 4 | | 5 | |
| Mining | 8 | | | 9 | | 9 | | 9 | | 9 | | 10 | |
| Corporate and Other | 18 | | | 11 | | 5 | | 13 | | 13 | | 13 | |
| Total | $ | 755 | | | $ | 647 | | $ | 550 | | $ | 510 | | $ | 512 | | $ | 508 | |
____________________________
(a) Includes accruals for property, plant and equipment as disclosed as supplemental cash flowsflow information in the Consolidated Statements of Cash Flows in the Consolidated Financial Statements in this Annual Report on Form 10-K.
Efficiently plan, construct and operate rate base power generation facilities to serve our Electric Utilities. We believe that excludes (or includes) amountswe best serve customers and communities with a vertically integrated business model for our Electric Utilities. This business model remains a core strength and strategy today as we invest in and operate efficient power generation resources to cost-effectively supply electricity to our customers. We strive to provide power at reasonable rates to our customers and earn competitive returns for our investors.
Our power production strategy focuses on low-cost construction and efficient operation of our generating facilities. Our low power production costs result from a variety of factors including low fuel costs, efficiency in converting fuel into energy, low per unit operating and maintenance costs and high levels of power plant availability. For our coal-fired power plants, we leverage our mine-mouth location advantage to eliminate coal transportation costs that often represent the largest component of the delivered cost of coal for many other utilities. Additionally, we operate our plants with high levels of availability as compared to industry benchmarks.
We continue to believe that ownership of power generation facilities by our Electric Utilities best serves customers. Rate-based generation assets offer several advantages for customers and shareholders, including:
•When generating assets are included in (or excluded from) the most directly comparable measure calculatedutility rate base and presentedreviewed and approved by government authorities, customer rates are more stable and predictable, and typically less expensive in accordance with GAAP. Gross margin (revenue lessthe long run; especially when compared to power otherwise purchased from the open market through wholesale contracts that are periodically re-priced to reflect current and varying market conditions;
•Regulators participate in a planning process where long-term investments are designed to match long-term energy demand;
•The lower-risk profile of rate-based generation assets contributes to stronger credit ratings which, in turn, can benefit both customers and investors by lowering the cost of sales) iscapital; and
•Investors are provided a non-GAAP financial measure duelong-term and stable return on their investment.
Proactively integrate alternative and renewable energy into our utility energy supply while mitigating customer rate impacts. In November 2020, we announced clean energy goals to the exclusion of depreciation and amortization from the measure. The presentation of gross margin is intended to supplement investors’ understanding of our operating performance.
Gross marginreduce GHG emissions intensity for our Electric Utilities is calculated as operating revenue less cost of fuel40% by 2030 and purchased power. Gross margin70% by 2040 and achieve GHG reductions of 50% by 2035 for our Gas Utilities. Our goals are based on existing technology and computed from 2005 baseline levels of GHG emissions intensity for our electric operations and natural gas distribution system. Since 2005, we have reduced GHG emissions intensity from our Gas Utilities by more than 33% and achieved a 25% reduction from our Electric Utilities. Colorado Electric has achieved an approximate 50% reduction in GHG emissions since 2005 and is calculated as operating revenues lesson track to reach Colorado’s 80% carbon reduction goal by 2030. Our goals are based on prudent and proven solutions to reduce our emissions while minimizing cost impacts to our customers. This keeps our customers at the forefront of gas sold. Our gross marginour decision-making, which is impactedcentral to our values.
More of our customers, particularly our larger customers, are demanding cleaner sources of energy to meet their sustainability goals. In addition, there is more interest from consumers, regulators and legislators to increase the use of renewable and other alternative energy sources. To support this interest, we created the Renewable Ready program for South Dakota and Wyoming customers. In support of this program, we created and received approvals for new, voluntary renewable energy tariffs to serve certain commercial, industrial and governmental agency customer requests for renewable energy resources. To meet the renewable energy commitments under the new tariffs, on November 30, 2020, we completed construction and placed into service the Corriedale wind project, a 52.5 MW wind energy project near Cheyenne, Wyoming. Supporting our renewable energy efforts in Colorado, in September 2020, Colorado Electric received approval from the CPUC for its request for approval of its preferred solar bid in support of its Renewable Advantage program, which plans to add up to 200 MW of renewable energy by the fluctuationsend of 2023.
To date, many states have enacted, and others are considering, mandatory renewable energy standards, requiring utilities to meet certain thresholds of renewable energy generation. In addition, some states have either enacted or are considering legislation setting GHG emission reduction targets. Federal legislation for renewable energy standards and GHG emission reductions has been considered and may be implemented in the future. Mandates for the use of renewable energy or the reduction of GHG emissions will likely drive the need for significant investment in our Electric Utilities and Gas Utilities segments. These mandates will also likely increase prices for electricity and/or natural gas for our utility customers. As a regulated utility we are responsible for providing safe, reliable and affordable sources of energy to our customers. Accordingly, we employ a customer-focused strategy for complying with standards and regulations that balances our customers’ rate concerns with environmental considerations and administrative and legislative mandates. We attempt to strike this balance by prudently and proactively incorporating renewable energy into our resource supply, while seeking to minimize the magnitude and frequency of rate increases for our utility customers.
Build and maintain strong relationships with wholesale power customers of our utilities and our power generation business. We strive to build strong relationships with other utilities, municipalities and wholesale customers. We believe we will continue to be an important provider of electricity to wholesale utility customers, who will continue to need products such as capacity and energy to reliably serve their customers. By providing these products under long-term contracts, we help our customers meet their energy needs. We also earn more stable revenues and greater returns for shareholders over the long-term than we would by selling energy into more volatile energy spot markets. In addition, relationships that we have established with wholesale power customers have developed into other opportunities. MEAN, MDU and the City of Gillette, Wyoming were wholesale power customers that are now joint minority owners in two of our power plants, Wygen I and Wygen III, reducing risk and providing steady revenues.
Vertically integrate businesses that are supportive of our Electric and Gas Utility businesses. While our primary focus is serving customers and growing our core utilities, we selectively invest in vertically integrated businesses that provide cost effective and efficient fuel and energy to our utilities. We currently own and operate power generation and mining assets that are vertically integrated into and support our Electric Utilities. These operations are located at our utility-generating complexes and are physically integrated into our Electric Utilities’ operations.
The Power Generation segment currently owns five power facilities, four of which are contracted with our affiliate Electric Utilities under mid- to long-term power purchase agreements. Our Power Generation segment has an experienced staff with significant expertise in planning, building and operating power plants. The power generation team has constructed 22 generation projects since 1995 with an aggregate investment in excess of $2.5 billion. This team also provides shared services to our Electric Utilities’ generation facilities, resulting in efficient management of all of the company’s generation assets. In certain states, our Electric Utilities are required to competitively bid for generation resources needed to serve customers. Generally, our Power Generation segment submits bids in response to those competitive solicitations. Our Power Generation segment can often realize competitive advantages provided by prior construction expertise, fuel supply advantages and by co-locating new plants at existing sites, reducing infrastructure and operating costs.
Our small surface coal mine is located immediately adjacent to our Gillette energy complex in northeastern Wyoming, where all five of our remaining coal-fired power plants are located. We operate and own majority interests in four of the five power plants. We own 20% of the fifth power plant which is operated by a majority owner. The mine provides low-sulfur coal directly to these power plants via a conveyor belt system, minimizing transportation costs. On average, the fuel can be delivered to the adjacent power plants at less than $1.00 per MMBtu, providing very cost competitive fuel to our power plants when compared to other coal-fired and natural gas-fired generating facilities. Nearly all of the mine’s production is sold to the five on-site, mine-mouth generation facilities under long-term supply contracts. Approximately one-half of our production is sold under cost-plus contracts with affiliates. A small portion of the mine’s production is sold to off-site industrial customers and delivered by truck.
Grow our dividend. We are extremely proud of our track record of annual dividend increases for shareholders. 2020 represented our 50th consecutive year of increasing dividends. In January 2021, our Board of Directors declared a quarterly dividend of $0.565 per share, equivalent to an annual dividend of $2.26 per share. We intend to continue our record of annual dividend increases with a targeted dividend payout ratio of 50% to 60%.
Maintain an investment grade credit rating and ready access to debt and equity capital markets. We require access to the capital markets to fund our planned capital investments or acquire strategic assets that support prudent and earnings-accretive business growth. We have demonstrated our ability to cost-effectively access the debt and equity markets, while maintaining our investment-grade issuer credit rating.
Prospective Information
We expect to generate long-term growth through the expansion of integrated utilities and supporting operations. Sustained growth requires continued capital deployment. Our integrated energy portfolio, focused predominately on regulated utilities, provides growth opportunities, yet avoids concentrating business risk. We expect much of our earnings growth in the next few years will come from the need for capital deployment at our utilities and continued focus on improving efficiencies and controlling costs. Although dependent on market conditions, we are confident in our ability to obtain additional financing, as necessary, to continue our growth plans. We remain focused on prudently managing our operations and maintaining our overall liquidity to meet our operating, capital and financing needs, as well as executing our long-term strategic plan. Prospective information for our operating segments should be read in conjunction with our business strategy discussed above, and our company highlights discussed below.
Company Highlights
February 2021 Weather Event
In February 2021, a prolonged period of historic cold temperatures across the central United States, which covered all of our Utilities’ service territories, caused a significant increase in heating and energy demand and contributed to unforeseeable and unprecedented market prices for natural gas and electricity. Although this historic weather and energy demand event strained energy resources across the United States, our natural gas and electric systems performed as expected and demonstrated our Ready to Serve commitment to our customers. Our ongoing system investments in safety and reliability and our strong operational performance were essential in our ability to maintain service for our customers during this extraordinary event.
We responded to this event with requests for certain natural gas customer usage curtailments that began on February 12, 2021, and extended through February 19, 2021, to ensure the reliability of our system. We also communicated to all customers on how to conserve energy and stay safe during this event. Our customer service representatives worked extended hours to provide guidance and support to our customers.
Our Utilities have regulatory mechanisms to recover the increased energy costs from this record-breaking cold weather event. However, given the extraordinary impact of these higher costs to our customers, we expect our regulators to undertake a heightened review. We are engaged with our regulators to identify appropriate recovery periods over which to recover costs associated with this event as we continue to address the impacts to our customers’ bills.
As a result of this historic event, our natural gas purchases increased by approximately $600 million compared to forecasted base load for the month of February. This amount is a preliminary estimate through February 24, 2021, and does not include certain pipeline transportation charges that remain subject to settlement and are payable in late March 2021. To fund February natural gas purchases and other fuel supply costs. However, while these fluctuating costs impact gross marginpipeline transportation charges and provide additional liquidity, we entered into an $800 million term loan maturing on November 23, 2021. The nine-month term loan has no prepayment penalty and is subject to the same covenants as our Revolving Credit Facility. We expect to repay a percentageportion of revenue, they only impact total gross margin ifthis term loan prior to maturity and refinance the costs cannot be passed throughremaining portion in longer-term debt.
As of February 24, 2021, the Company had $1.3 billion of liquidity consisting of approximately $800 million of cash and $500 million of available capacity on its Revolving Credit Facility.
COVID-19 Pandemic
One of the Company’s core values is safety. The COVID-19 pandemic has given us an opportunity to demonstrate our commitment to the health and safety of our customers, employees, business partners and the communities we serve. We have executed our business continuity plans across all of our jurisdictions with the goal of continuing to provide safe and reliable service during the COVID-19 pandemic.
For the year ended December 31, 2020, we have experienced limited impacts to our customers.financial results and operational activities due to COVID-19. Negative impacts to gross margins were driven primarily by lower volumes in certain commercial and industrial customers and waived customer late payment fees which were partially offset by higher residential usage. Increased operations and maintenance expenses due to sequestration costs of mission critical and essential employees and increased bad debt expense were partially offset by decreased training, travel, and outside services related expenses.
We continue to closely monitor customer loads in our states as updated executive orders and recommendations associated with COVID-19 are provided. We have continued to proactively communicate with various commercial and industrial customers in our service territories to understand their needs and forecast the potential financial implications. We have increased our allowance for credit losses and bad debt expense by $3.3 million for the year ended December 31, 2020, after considering the potential economic impact of the COVID-19 pandemic in forward looking projections related to write-off and recovery rates. All of our jurisdictions temporarily suspended disconnections for a period of time. State orders lifting those restrictions have been issued in nearly all of our jurisdictions; however, we expect the status of restrictions will continue to fluctuate for the next several months. We continue to monitor customer loads, accounts receivable arrears balances, disconnects, cash flows and bad debt expense. We are proactively working with customers to establish payment plans and find available payment assistance resources.
Throughout 2020, we maintained adequate liquidity to operate our businesses and fund our capital investment program. In February 2020, the Company issued $100 million in equity to support its 2020 capital investment program. In June 2020, the Company issued $400 million of long-term debt which was used to repay short-term debt and for working capital and general corporate purposes. For the year ended December 31, 2020, the Company also utilized a combination of its $750 million Revolving Credit Facility and CP Program to meet its funding requirements. As of December 31, 2020, the Company had $498 million of liquidity which included $6.4 million of cash and $491 million of available capacity on its Revolving Credit Facility. We continue to meet our debt covenant requirements. We also continue to monitor the funding status of our employee benefit plan obligations, which did not materially change during the year ended December 31, 2020.
We are monitoring supply chains, including lead times for key materials and supplies, availability of resources, and status of large capital projects. To date, there have been limited impacts from COVID-19 on supply chains including the availability of supplies, materials and lead times. Capital projects are ongoing without material disruption to schedules due to COVID-19. Our gross margin measurethird party resources continue to support our business plans without disruption. Contingency plans are ready to be executed if significant disruption to supply chain occurs; however, we currently do not anticipate a significant impact from COVID-19 on our capital investment plan for 2021.
We continue to work closely with local health, public safety and government officials to minimize the spread of COVID-19 and its impact to our employees and the services we provide to our customers. Actions the Company took earlier in the year included implementing protocols for our field operations personnel to safely and effectively interact with our customers, asking certain employees to work from home, requiring employees to complete daily health assessments, covering 100% of COVID-19 testing costs for our active employee medical plans, limiting travel to only mission-critical purposes and temporarily sequestering essential employees.
During the third quarter of 2020, we suspended sequestration of essential employees but continued to monitor the impacts of COVID-19 in our service territories to ensure we provide reliable service to our customers. Additionally, we implemented our Ready2Return program, which includes a phased return of our employees to our work facilities while keeping our workforce healthy, safe and informed. Our Ready2Return program also focuses on enhancing our facility readiness to improve ventilation, ensure social distancing and establish cleaning services to reduce the spread of infection.
On January 13, 2021, the FERC sent a letter to the Centers for Disease Control and Prevention’s (CDC) Advisory Committee on Immunization Practices urging that essential employees of the energy workforce receive vaccines earlier than currently recommended. We continue to monitor guidance from the CDC to ensure our essential employees may notreceive the vaccine within a prioritized phase.
We provide periodic status updates and maintain ongoing dialogue with the regulatory commissions in our jurisdictions. We have worked with regulators in our service territories to preserve our right for deferred regulatory treatment for certain COVID-19 related costs and to seek recovery of these costs at a later date.
During these uncertain times, we remain highly focused on the safety and health of our customers, employees, business partners and communities. We continue to monitor load, customers’ ability to pay, the potential for supply chain disruption that may impact our capital and maintenance project plans, the availability of resources to execute our plans and the capital markets to ensure we have the liquidity necessary to support our financial needs.
As we look forward to 2021 and beyond, our operating results could be comparablefurther affected by COVID-19, as discussed in detail in our Risk Factors.
Business Segment Highlights and Corporate Activity
Electric Utilities
•On November 30, 2020, South Dakota Electric and Wyoming Electric completed and placed in service the Corriedale project. The 52.5 MW wind project is jointly owned by the two electric utilities to other companies’ gross margin measure. Furthermore,deliver renewable energy for large commercial, industrial and governmental agency customers under the Renewable Ready program.
•On October 15, 2020, the FERC approved a settlement agreement in the joint application filed by Wyoming Electric and Black Hills Wyoming on August 2, 2019 for approval of a new 60 MW PPA. Under terms of the settlement, Wyoming Electric will continue to receive 60 MW of capacity and energy from the Wygen I power plant. The new agreement will commence on January 1, 2022, replace the existing PPA and continue for 11 years.
•On September 23, 2020, Colorado Electric received approval from the CPUC for its request for approval of its preferred solar bid in support of its Renewable Advantage program. The program plans to add up to 200 MW of renewable energy in Colorado by the end of 2023.
•On July 10, 2020, Wyoming Electric set a new all-time peak load of 271 MW, surpassing the previous peak of 265 MW set in July 2019.
•On May 5, 2020, citizens in Pueblo, Colorado voted overwhelmingly to retain Colorado Electric as its electric utility provider by 75.6% of votes cast. The current franchise agreement continues through 2030.
Gas Utilities
•On January 26, 2021, Nebraska Gas received approval from the NPSC to consolidate rate schedules into a new, single statewide structure and recover significant infrastructure investments in its 13,000-mile natural gas pipeline system. Final rates will be enacted on March 1, 2021 and is expected to generate $6.5 million in new annual revenue with a capital structure of 50% equity and 50% debt and a return on equity of 9.5%. The approval also includes an extension of the SSIR for five years and an expansion of this measure is not intendedmechanism for consolidated utility alignment.
•On September 11, 2020, Colorado Gas filed a rate review with the CPUC seeking recovery on significant infrastructure investments in its 7,000-mile natural gas pipeline system. The rate review requests $13.5 million in new annual revenue with a capital structure of 50% equity and 50% debt and a return on equity of 9.95%. The request seeks to replace operating income as determinedimplement new rates in the second quarter of 2021. On January 6, 2021 the CPUC issued an order dismissing the rate review. On January 26, 2021, Colorado Gas filed an application for rehearing, reargument or reconsideration in response to the Commission’s January 6 order.
On September 11, 2020, in accordance with GAAPthe final order from the earlier rate review discussed below, Colorado Gas also filed a new SSIR proposal that would recover safety and integrity focused investments in its system over five years. A decision from the CPUC is expected by mid-2021.
•On December 27, 2020, gas service to approximately 3,500 Colorado Gas customers in Aspen, Colorado was disrupted due to vandalism. Gas services were restored to nearly all customers by December 30, 2020 with the remaining few restored by January 1, 2021. Colorado Gas employees were joined by Black Hills Energy technicians from other states, as well as contractors and other utilities, to successfully restore service despite challenging weather, temperatures, additional precautions due to COVID-19 and significant travel by many to reach Aspen.
•On February 1, 2019, Colorado Gas filed a rate review with the CPUC requesting $2.5 million in new revenue to recover investments in safety, reliability and system integrity and approval to consolidate rates, tariffs, and services of its two existing gas distribution territories. Colorado Gas also requested a new rider mechanism to recover future safety and integrity investments in its system. On May 19, 2020, the CPUC issued a final order which denied the new system integrity recovery mechanism and consolidation of rate territories. In addition, the order resulted in an indicatorannual revenue decrease of operating performance.$0.6 million and a return on equity of 9.2%. New rates were effective July 3, 2020.
•On March 1, 2020, Wyoming Gas enacted new rates and implemented a new rider to recover integrity investments. The new, single statewide rate structure successfully completed the consolidation process of four natural gas utilities in the state and is expected to generate $13 million in new annual revenues. Going forward, the new rate structure and consolidated tariffs will contribute to improvements in customer service and reduce the complexity and number of rate reviews and other regulatory filings.
Power Generation
•On October 15, 2020, the FERC approved a settlement agreement in the joint application filed by Black Hills Wyoming and Wyoming Electric Utilities
Operating resultson August 2, 2019 for the years ended December 31 forapproval of a new 60 MW PPA. See additional information in the Electric Utilities were as follows (in thousands):
|
| | | | | | | | | | | | | | | |
| | 2019 | Variance | 2018 | Variance | 2017 |
| | | | | | |
| Revenue | $ | 712,752 |
| $ | 1,301 |
| $ | 711,451 |
| $ | 6,801 |
| $ | 704,650 |
|
| | | | | | |
| Total fuel and purchased power | 268,297 |
| (15,543 | ) | 283,840 |
| 9,477 |
| 274,363 |
|
| | | | | | |
| Gross margin (non-GAAP) | 444,455 |
| 16,844 |
| 427,611 |
| (2,676 | ) | 430,287 |
|
| | | | | | |
| Operations and maintenance | 195,581 |
| 9,406 |
| 186,175 |
| 13,868 |
| 172,307 |
|
| Depreciation and amortization | 88,577 |
| 3,010 |
| 85,567 |
| 5,324 |
| 80,243 |
|
| Total operating expenses | 284,158 |
| 12,416 |
| 271,742 |
| 19,192 |
| 252,550 |
|
| | | | | | |
Adjusted operating income (a) | $ | 160,297 |
| $ | 4,428 |
| $ | 155,869 |
| $ | (21,868 | ) | $ | 177,737 |
|
____________________
| |
(a) | Due to the changes in our segment disclosures discussed in Segment highlights above.Note 5 of the Notes to the Consolidated Financial Statements in this Annual Report on Form 10-K, Electric Utilities Adjusted operating income was revised for the years ended December 31, 2018 and December 31, 2017 which resulted in an increase of $6.4 million and $7.1 million, respectively. |
2019 Compared to 2018
Gross margin increased over the prior year as a result of:
|
| | | |
| | (in millions) |
| Reduction in purchased power capacity costs | $ | 6.5 |
|
| Prior year Wyoming Electric PCA Stipulation settlement | 3.7 |
|
| Rider recovery | 3.1 |
|
| Increased commercial and industrial demand | 1.9 |
|
| Weather | 0.2 |
|
| Other | 1.4 |
|
| Total increase in Gross margin (non-GAAP) | $ | 16.8 |
|
Operations and maintenance expense increased primarily due to $4.7 million of higher employee costs and $2.9 million of higher outside services expenses. Various other expenses comprise the remainder of the increase compared to the prior year.
Depreciation and amortization increased primarily due to higher asset base driven by prior and current year capital expenditures.
2018 Compared to 2017
Gross margin decreased over the prior year as a result of:
|
| | | |
| | (in millions) |
| TCJA revenue reserve | $ | (22.3 | ) |
| Wyoming Electric PCA Stipulation settlement | (2.6 | ) |
| Other | (1.4 | ) |
Horizon Point shared facility revenue (a) | 9.8 |
|
| Rider recovery | 5.1 |
|
| Weather | 3.6 |
|
| Power Marketing, transmission and Tech Services | 3.5 |
|
| Residential customer growth | 1.6 |
|
| Total increase (decrease) in Gross margin (non-GAAP) | $ | (2.7 | ) |
____________________
| |
(a) | Horizon Point shared facility revenue was offset by facility expenses at our operating segments and had no impact on consolidated results. |
Operations and maintenance expense increased primarily due to $4.5 million of higher facility costs, $4.1 million of higher outside services expenses, $3.6 million of higher employee costs, and $1.0 million of higher property taxes due to a higher asset base.
Depreciation and amortization increased primarily due to higher asset base driven by current and prior year capital expenditures.
|
| | | |
| | For the year ended December 31, |
Contracted power plant fleet availability (a) | 2019 | 2018 | 2017 |
| | | | |
Coal-fired plants (b) | 92.1% | 93.9% | 88.9% |
Natural gas fired plants and Other plants (c) | 87.9% | 96.4% | 96.1% |
| Wind | 95.6% | 96.9% | 93.3% |
| Total availability | 89.9% | 95.6% | 93.6% |
| | | | |
| Wind capacity factor | 38.7% | 39.2% | 36.7% |
____________________
| |
(a) | Availability and wind capacity factor are calculated using a weighted average based on capacity of our generating fleet. |
| |
(b) | 2019 included planned outages at Neil Simpson II and Wygen III and unplanned outages at Wyodak Plant and Wygen III. |
| |
(c) | 2019 included planned outages at Neil Simpson CT and Lange CT. |
Gas Utilities
Operating results for the years ended December 31 for the Gas Utilities were as follows (in thousands):
|
| | | | | | | | | | | | | | | |
| | 2019 | Variance | 2018 | Variance | 2017 |
| Revenue: | | | | | |
| Natural gas - regulated | $ | 932,111 |
| $ | (10,813 | ) | $ | 942,924 |
| $ | 77,093 |
| $ | 865,831 |
|
| Other - non-regulated services | 77,919 |
| (4,464 | ) | 82,383 |
| 584 |
| 81,799 |
|
| Total revenue | 1,010,030 |
| (15,277 | ) | 1,025,307 |
| 77,677 |
| 947,630 |
|
| | | | | | |
| Cost of natural gas sold: | | | | | |
| Natural gas - regulated | 406,643 |
| (35,887 | ) | 442,530 |
| 61,271 |
| 381,259 |
|
| Other - non-regulated services | 19,255 |
| (368 | ) | 19,623 |
| (8,721 | ) | 28,344 |
|
| Total cost of sales | 425,898 |
| (36,255 | ) | 462,153 |
| 52,550 |
| 409,603 |
|
| | | | | | |
| Gross margin (non-GAAP) | 584,132 |
| 20,978 |
| 563,154 |
| 25,127 |
| 538,027 |
|
| | | | | | |
| Operations and maintenance | 301,844 |
| 10,363 |
| 291,481 |
| 22,291 |
| 269,190 |
|
| Depreciation and amortization | 92,317 |
| 5,883 |
| 86,434 |
| 2,702 |
| 83,732 |
|
| Total operating expenses | 394,161 |
| 16,246 |
| 377,915 |
| 24,993 |
| 352,922 |
|
| | | | | | |
| Adjusted operating income | $ | 189,971 |
| $ | 4,732 |
| $ | 185,239 |
| $ | 134 |
| $ | 185,105 |
|
2019 Compared to 2018
Gross margin increased over the prior year as a result of:
|
| | | |
| | (in millions) |
| New rates | $ | 16.2 |
|
| Customer growth - distribution | 5.2 |
|
| Increased transport and transmission | 2.6 |
|
| Weather | (2.2 | ) |
| Decreased mark-to-market on non-utility natural gas commodity contracts | (3.3 | ) |
| Other | 2.5 |
|
| Total increase in Gross margin (non-GAAP) | $ | 21.0 |
|
Operations and maintenance expense increased primarily due to $5.5 million of higher outside services expenses, $1.2 million higher employee costs and $2.0 million of higher property taxes due to a higher asset base driven by prior and current year capital expenditures. Various other expenses comprise the remainder of the increase compared to the prior year.
Depreciation and amortization increased primarily due to a higher asset base driven by prior and current year capital expenditures.
2018 Compared to 2017
Gross margin increased over the prior year as a result of:
|
| | | |
| | (in millions) |
Weather (a) | $ | 13.8 |
|
| New rates | 10.7 |
|
| Customer growth - distribution | 5.2 |
|
| Increased mark-to-market on non-utility natural gas commodity contracts | 4.0 |
|
| Increased transport and transmission | 3.6 |
|
| Natural gas volumes sold | 3.2 |
|
| Non-utility - Choice Gas, Tech Services and appliance repair | 2.7 |
|
| Other | 2.4 |
|
| TCJA revenue reserve | (20.5 | ) |
| Total increase (decrease) in Gross margin (non-GAAP) | $ | 25.1 |
|
___________________ | |
(a) | Heating degree days at the Gas Utilities for the year ended December 31, 2018 were 2% higher than normal compared to 10% lower than normal in 2017. |
Operations and maintenance expense increased primarily due to $11.8 million of higher employee costs, $4.7 million of higher facility costs, $4.0 million of higher outside services expenses and $2.1 million of higher bad debt expense driven by an increase in revenues.
Depreciation and amortization increased primarily due to higher asset base driven by prior and current year capital expenditures.
Power Generation
Our Power Generation segment operating results for the years ended December 31 were as follows (in thousands):
|
| | | | | | | | | | | | | | | |
| | 2019 | Variance | 2018 | Variance | 2017 |
| | | | | | |
| Revenue | $ | 101,258 |
| $ | 8,807 |
| $ | 92,451 |
| $ | (2,169 | ) | $ | 94,620 |
|
| | | | | | |
| Total fuel | 9,059 |
| 467 |
| 8,592 |
| (748 | ) | 9,340 |
|
| Operations and maintenance | 28,429 |
| 3,294 |
| 25,135 |
| 2,093 |
| 23,042 |
|
| Depreciation and amortization | 18,991 |
| 2,881 |
| 16,110 |
| 562 |
| 15,548 |
|
| Total operating expenses | 56,479 |
| 6,642 |
| 49,837 |
| 1,907 |
| 47,930 |
|
| | | | | | |
Adjusted operating income (a) | $ | 44,779 |
| $ | 2,165 |
| $ | 42,614 |
| $ | (4,076 | ) | $ | 46,690 |
|
____________________
| |
(a) | Due to the changes in our segment disclosures discussed in Note 5 of the Notes to the Consolidated Financial Statements in this Annual Report on Form 10-K, Power Generation Adjusted operating income was revised for the years ended December 31, 2018 and December 31, 2017 which resulted in a decrease of $(5.7) million and $(6.5) million, respectively. |
2019 Compared to 2018
Revenue increased in the current year due to increased wind MWh sold and higher PPA prices. Operating expenses increased in the current year primarily due to higher depreciation and property taxes from new wind assets.
2018 Compared to 2017
Revenue decreased in 2018 due to a decrease in MWh sold, primarily from a planned outage at Wygen I. Operating expenses increased due to higher maintenance expenses primarily related to outage costs at Wygen I and higher depreciation.
|
| | | |
| | For the year ended December 31, |
Contracted power plant fleet availability (a) | 2019 | 2018 | 2017 |
| | | | |
Coal-fired plant (b) | 94.5% | 85.8% | 96.9% |
| Natural gas-fired plants | 98.6% | 99.4% | 99.2% |
Wind (c) | 90.6% | N/A | N/A |
| Total availability | 95.0% | 95.9% | 98.6% |
| | | | |
Wind capacity factor (c) | 23.5% | N/A | N/A |
___________
| |
(a) | Availability and wind capacity factor are calculated using a weighted average based on capacity of our generating fleet. |
| |
(b) | Wygen I experienced a planned outage in 2018 |
| |
(c) | Change from 2018 to 2019 is driven by Black Hills Electric Generation’s acquisition of new wind assets. |
Mining
Mining operating results for the years ended December 31 were as follows (in thousands):
|
| | | | | | | | | | | | | | | |
| | 2019 | Variance | 2018 | Variance | 2017 |
| | | | | | |
| Revenue | $ | 61,629 |
| $ | (6,404 | ) | $ | 68,033 |
| $ | 1,412 |
| $ | 66,621 |
|
| | | | | | |
| Operations and maintenance | 40,032 |
| (3,696 | ) | 43,728 |
| (1,154 | ) | 44,882 |
|
| Depreciation, depletion and amortization | 8,970 |
| 1,005 |
| 7,965 |
| (274 | ) | 8,239 |
|
| Total operating expenses | 49,002 |
| (2,691 | ) | 51,693 |
| (1,428 | ) | 53,121 |
|
| | | | | | |
| Adjusted operating income | $ | 12,627 |
| $ | (3,713 | ) | $ | 16,340 |
| $ | 2,840 |
| $ | 13,500 |
|
The following table provides certain operating statistics for the Mining segment (in thousands):
|
| | | | | | | | | |
| | 2019 | 2018 | 2017 |
| Tons of coal sold | 3,716 |
| 4,085 |
| 4,183 |
|
| Cubic yards of overburden moved | 8,534 |
| 8,970 |
| 9,018 |
|
| Coal reserves at year-end (in tons) | 185,448 |
| 189,164 |
| 194,909 |
|
| | | | |
| Revenue per ton | $ | 15.94 |
| $ | 16.11 |
| $ | 15.93 |
|
2019 Compared to 2018
Current year revenue decreased primarily due to 9% fewer tons sold driven primarily by planned and unplanned generation facility outages at the Wyodak Plant. Operating expenses decreased primarily due to lower royalties and production taxes on decreased revenues and lower fuel, labor, and major maintenance expenses.
2018 Compared to 2017
Revenue increased primarily due to a 1% increase in price per ton sold. Current year revenue is also reflective of lease and rental revenue, previously reported in Other income, net. Operating expenses decreased primarily due to lower major maintenance expenses.
Corporate and Other
•On August 3, 2020, we filed a shelf registration and DRSPP with the SEC. In conjunction with these shelf filings, we renewed the ATM. The renewed ATM program, which allows us to sell shares of our common stock, is the same as the prior program other than the aggregate value increased from $300 million to $400 million and a forward sales option was incorporated. This forward sales option allows us to sell our shares through the ATM program at the current trading price without actually issuing any shares to satisfy the sale until a future date.
•On June 17, 2020, we completed a public debt offering of $400 million principal amount in senior unsecured notes. The debt offering consisted of $400 million of 2.50%, 10-year senior notes due June 15, 2030. The proceeds were used to repay short-term debt, as well as for working capital and general corporate purposes.
•On February 27, 2020, we issued 1.2 million shares of common stock at a price of $81.77 per share for net proceeds of $99 million.
Results of Operations
Our discussion and analysis for the year ended December 31, 2020 compared to 2019 is included herein. For discussion and analysis for the year ended December 31, 2019 compared to 2018, please refer to Item 7 of Part II, “Management’s Discussion and Analysis of Financial Condition and Results of Operations” in our Annual Report on Form 10-K for the year ended December 31, 2019, which was filed with the SEC on February 14, 2020.
Segment information does not include intercompany eliminations and all amounts are presented on a pre-tax basis unless otherwise indicated. Per share information references diluted shares unless otherwise noted.
Consolidated Summary and Overview
| | | | | | | | | | | | | |
| For the Years Ended December 31, |
| 2020 | | 2019 | | 2018 |
| (in thousands) |
| | | | | |
| | | | | |
| | | | | |
| | | | | |
| | | | | |
Adjusted operating income (a) : | | | | | |
| Electric Utilities | $ | 156,055 | | | $ | 160,297 | | | $ | 155,869 | |
| Gas Utilities | 215,889 | | | 189,971 | | | 185,239 | |
| Power Generation | 42,112 | | | 44,779 | | | 42,614 | |
| Mining | 12,807 | | | 12,627 | | | 16,340 | |
| Corporate and Other | 1,440 | | | (1,632) | | | (3,025) | |
| Operating Income | 428,303 | | | 406,042 | | | 397,037 | |
| | | | | |
| Interest expense, net | (143,470) | | | (137,659) | | | (139,975) | |
| Impairment of investment | (6,859) | | | (19,741) | | | — | |
| Other income (expense), net | (2,293) | | | (5,740) | | | (1,180) | |
| Income tax benefit (expense) | (32,918) | | | (29,580) | | | 23,667 | |
| Income from continuing operations | 242,763 | | | 213,322 | | | 279,549 | |
| (Loss) from discontinued operations, net of tax | — | | | — | | | (6,887) | |
| Net income | 242,763 | | | 213,322 | | | 272,662 | |
| Net income attributable to noncontrolling interest | (15,155) | | | (14,012) | | | (14,220) | |
| Net income available for common stock | $ | 227,608 | | | $ | 199,310 | | | $ | 258,442 | |
| | | | | |
| Earnings per share from continuing operations, Diluted | $ | 3.65 | | | $ | 3.28 | | | $ | 4.78 | |
| (Loss) per share from discontinued operations, Diluted | — | | | — | | | (0.12) | |
| Total earnings per share of common stock, Diluted | $ | 3.65 | | | $ | 3.28 | | | $ | 4.66 | |
_____________
(a) Adjusted operating income recognizes intersegment revenues and costs for Colorado Electric’s PPA with Black Hills Colorado IPP on an accrual basis rather than as a finance lease. This presentation of segment information does not impact consolidated financial results.
2020 Compared to 2019
The variance to the prior year included the following:
•COVID-19 related impacts to consolidated results included $3.6 million of lower gross margin driven primarily by lower volumes and waived customer late payment fees, $2.6 million of costs due to sequestration of essential employees and $3.3 million of additional bad debt expense which were partially offset by $3.8 million of lower travel, training, and outside services related expenses;
•Electric Utilities’ adjusted operating income decreased $4.2 million due to higher depreciation and amortization expense as a result of additional plant placed in service, lower commercial and industrial demand and COVID-19 impacts partially offset by benefits from the release of TCJA revenue reserves and increased rider revenues;
•Gas Utilities’ adjusted operating income increased $26 million primarily due to new customer rates in Wyoming and Nebraska and increased rider revenues, customer growth, mark-to-market gains on non-utility natural gas commodity contracts and prior year amortization of excess deferred income taxes partially offset by higher depreciation and amortization expense as a result of additional plant placed in service, COVID-19 impacts and unfavorable weather;
•Power Generation’s adjusted operating income decreased $2.7 million primarily due to higher depreciation and maintenance expense from new wind assets and expense related to the early retirement of certain assets;
•Corporate and Other expenses decreased $3.1 million primarily due to lower unallocated employee costs;
•A $6.9 million pre-tax non-cash impairment in 2020 of our investment in equity securities of a privately held oil and gas company compared to a similar $20 million impairment in 2019;
•Interest expense increased $5.8 million primarily due to higher debt balances partially offset by lower rates;
•Other expense decreased $3.4 million due to the prior year expensing of $5.4 million of development costs related to projects we no longer intend to construct partially offset by increased current year pension non-service costs; and
•Increased tax expense of $3.3 million primarily due to higher pre-tax income partially offset by a lower effective tax rate.
Segment Operating Results
A discussion of operating results from our business segments follows.
Non-GAAP Financial Measure
The following discussion includes financial information prepared in accordance with GAAP, as well as another financial measure, gross margin, that is considered a “non-GAAP financial measure.” Generally, a non-GAAP financial measure is a numerical measure of a company’s financial performance, financial position or cash flows that excludes (or includes) amounts that are included in (or excluded from) the most directly comparable measure calculated and presented in accordance with GAAP. Gross margin (revenue less cost of sales) is a non-GAAP financial measure due to the exclusion of depreciation and amortization from the measure. The presentation of gross margin is intended to supplement investors’ understanding of our operating performance.
Gross margin for our Electric Utilities is calculated as operating revenue less cost of fuel and purchased power. Gross margin for our Gas Utilities is calculated as operating revenue less cost of natural gas sold. Our gross margin is impacted by the fluctuations in power and natural gas purchases and other fuel supply costs. However, while these fluctuating costs impact gross margin as a percentage of revenue, they only impact total gross margin if the costs cannot be passed through to our customers.
Our gross margin measure may not be comparable to other companies’ gross margin measures. Furthermore, this measure is not intended to replace operating income as determined in accordance with GAAP as an indicator of operating performance.
Electric Utilities
Operating results for the years ended December 31 for the Electric Utilities were as follows (in thousands):
| | | | | | | | | | | | | | | | | |
| 2020 | Variance | 2019 | Variance | 2018 |
| | | | | |
| Revenue | $ | 714,044 | | $ | 1,292 | | $ | 712,752 | | $ | 1,301 | | $ | 711,451 | |
| | | | | |
| Total fuel and purchased power | 267,045 | | (1,252) | | 268,297 | | (15,543) | | 283,840 | |
| | | | | |
| Gross margin (non-GAAP) | 446,999 | | 2,544 | | 444,455 | | 16,844 | | 427,611 | |
| | | | | |
| Operations and maintenance | 196,794 | | 1,213 | | 195,581 | | 9,406 | | 186,175 | |
| Depreciation and amortization | 94,150 | | 5,573 | | 88,577 | | 3,010 | | 85,567 | |
| Total operating expenses | 290,944 | | 6,786 | | 284,158 | | 12,416 | | 271,742 | |
| | | | | |
| Adjusted operating income | $ | 156,055 | | $ | (4,242) | | $ | 160,297 | | $ | 4,428 | | $ | 155,869 | |
| | | | | |
| | | | | |
| | | | | |
| | | | | |
| | | | | |
| | | | | |
| | | | | |
| | | | | |
| | | | | |
| | | | | |
2020 Compared to 2019
Gross margin increased over the prior year as a result of:
| | | | | |
| (in millions) |
Release of TCJA revenue reserves (a) | $ | 2.7 | |
Rider recovery and true-up (b) | 2.3 | |
| Transmission services | 1.4 | |
| Residential customer growth | 0.9 | |
| Lower commercial and industrial demand | (2.7) | |
COVID-19 impacts (c) | (1.8) | |
| Weather | (0.3) | |
| |
| Total increase in Gross margin (non-GAAP) | $ | 2.5 | |
____________________
(a) In July 2020, regulatory proceedings resolved the last of the Company's open dockets seeking approval of its TCJA plans. As a result, the Company reversed certain TCJA-related liabilities, which resulted in an increase to Gross margin of $2.7 million. See Note 2 of the Notes to Consolidated Financial Statements in this Annual Report on Form 10-K for additional details. (b) Gross margin increased due to $3.5 million of rider revenues, which was partially offset by a $1.2 million rider true-up.
(c) The impacts to Electric Utilities’ gross margin from COVID-19 were primarily driven by reduced commercial volumes and waived customer late payment fees partially offset by higher residential usage.
Operations and maintenance expense increased primarily due to COVID-19 impacts which included $2.2 million of expenses related to the sequestration of essential employees and $0.8 million of additional bad debt expense which were partially offset by $1.2 million of lower travel, training and outside services related expenses. Additionally, lower employee costs of $1.9 million were partially offset by $1.0 million of higher property taxes due to a higher asset base driven by prior and current year capital expenditures.
Depreciation and amortization increased primarily due to higher asset base driven by prior and current year capital expenditures.
Operating Statistics
| | | | | | | | | | | | | | | | | | | | | | | | | | |
| | Electric Revenue (in thousands) | | Quantities Sold (MWh) |
| For the year ended December 31, | | 2020 | 2019 | 2018 | | 2020 | 2019 | 2018 |
| | | | | | | | |
| Residential | | $ | 221,530 | | $ | 216,108 | | $ | 218,558 | | | 1,477,514 | | 1,440,551 | | 1,450,585 | |
| Commercial | | 239,166 | | 246,704 | | 250,894 | | | 1,974,043 | | 2,055,253 | | 2,034,917 | |
| Industrial | | 131,154 | | 131,831 | | 124,668 | | | 1,794,795 | | 1,787,412 | | 1,682,074 | |
| Municipal | | 16,860 | | 17,206 | | 17,871 | | | 158,222 | | 157,298 | | 160,913 | |
| Subtotal Retail Revenue - Electric | | 608,710 | | 611,849 | | 611,991 | | | 5,404,574 | | 5,440,514 | | 5,328,489 | |
Contract Wholesale (a) | | 17,847 | | 19,078 | | 33,688 | | | 492,637 | | 368,360 | | 900,854 | |
| Off-system/Power Marketing Wholesale | | 24,308 | | 25,622 | | 24,800 | | | 648,928 | | 701,633 | | 673,994 | |
| Other | | 63,179 | | 56,203 | | 40,972 | | | — | | — | | — | |
| Total Revenue and Energy Sold | | 714,044 | | 712,752 | | 711,451 | | | 6,546,139 | | 6,510,507 | | 6,903,337 | |
Other Uses, Losses or Generation, net (b) | | — | | — | | — | | | 400,826 | | 393,573 | | 470,250 | |
| Total Revenue and Energy | | 714,044 | | 712,752 | | 711,451 | | | 6,946,965 | | 6,904,080 | | 7,373,587 | |
| Less cost of fuel and purchased power | | 267,045 | | 268,297 | | 283,840 | | | | | |
| Gross Margin (non-GAAP) | | $ | 446,999 | | $ | 444,455 | | $ | 427,611 | | | | | |
| | | | | | | | | | | | | | | | | | | | | | | | | | | | | | | | | | | | | | |
| | Electric Revenue (in thousands) | | Gross Margin (non-GAAP) (in thousands) | | Quantities Sold (MWh) (b) |
For the year ended
December 31, | | 2020 | 2019 | 2018 | | 2020 | 2019 | 2018 | | 2020 | 2019 | 2018 |
| Colorado Electric | | $ | 253,229 | | $ | 247,332 | | $ | 251,218 | | | $ | 139,731 | | $ | 137,323 | | $ | 138,901 | | | 2,379,866 | | 2,180,985 | | 2,151,918 | |
South Dakota Electric (a) | | 283,153 | | 291,219 | | 298,080 | | | 220,456 | | 218,104 | | 205,194 | | | 2,563,387 | | 2,798,887 | | 3,360,396 | |
| Wyoming Electric | | 177,662 | | 174,201 | | 162,153 | | | 86,812 | | 89,028 | | 83,516 | | | 2,003,712 | | 1,924,208 | | 1,861,273 | |
| Total Revenue, Gross Margin (non-GAAP), and Quantities Sold | | $ | 714,044 | | $ | 712,752 | | $ | 711,451 | | | $ | 446,999 | | $ | 444,455 | | $ | 427,611 | | | 6,946,965 | | 6,904,080 | | 7,373,587 | |
________________
(a) 2020 and 2019 revenue and purchased power, as well as associated quantities, for certain wholesale contracts have been presented on a net basis. 2018 amounts were presented on a gross basis and, due to their immaterial nature, were not revised. This presentation change has no impact on Gross margin.
(b) Includes company uses, line losses, and excess exchange production.
| | | | | | | | | | | |
| For the year ended December 31, |
| Quantities Generated and Purchased by Fuel Type (MWh) | 2020 | 2019 | 2018 |
| Generated: | | | |
| Coal | 2,273,635 | | 2,226,028 | | 2,368,506 | |
| Natural Gas and Oil | 581,554 | | 600,002 | | 446,373 | |
| Wind | 261,400 | | 238,999 | | 253,180 | |
| Total Generated | 3,116,589 | | 3,065,029 | | 3,068,059 | |
| Purchased: | | | |
Coal, Natural Gas, Oil and Other Market Purchases (a) | 3,235,086 | | 3,576,394 | | 4,134,145 | |
| Wind | 595,290 | | 262,657 | | 171,383 | |
| Total Purchased | 3,830,376 | | 3,839,051 | | 4,305,528 | |
| Total Generated and Purchased | 6,946,965 | | 6,904,080 | | 7,373,587 | |
| | | | | | | | | | | |
| For the year ended December 31, |
| Quantities Generated and Purchased (MWh) | 2020 | 2019 | 2018 |
| Generated: | | | |
| Colorado Electric | 364,058 | | 443,770 | | 481,446 | |
| South Dakota Electric | 1,901,009 | | 1,768,456 | | 1,734,222 | |
| Wyoming Electric | 851,522 | | 852,803 | | 852,391 | |
| Total Generated | 3,116,589 | | 3,065,029 | | 3,068,059 | |
| | | |
| Purchased: | | | |
| Colorado Electric | 2,015,808 | | 1,737,215 | | 1,670,472 | |
South Dakota Electric (a) | 662,378 | | 1,030,431 | | 1,626,174 | |
| Wyoming Electric | 1,152,190 | | 1,071,405 | | 1,008,882 | |
| Total Purchased | 3,830,376 | | 3,839,051 | | 4,305,528 | |
| | | |
| Total Generated and Purchased | 6,946,965 | | 6,904,080 | | 7,373,587 | |
____________________
(a) 2020 and 2019 purchased power quantities for a wholesale contract have been presented on a net basis. 2018 amounts were presented on a gross basis and, due to their immaterial nature, were not revised. This presentation change has no impact on Gross margin.
| | | | | | | | | | | | | | | | | | | | | | |
| For the year ended December 31, |
| Degree Days | 2020 | 2019 | 2018 |
| Actual | | Variance from Normal | Actual | | Variance from Normal | Actual | Variance from Normal |
| Heating Degree Days: | | | | | | | | |
| Colorado Electric | 5,103 | | | (9)% | 5,453 | | | (3)% | 5,119 | | 4% |
| South Dakota Electric | 6,910 | | | (3)% | 8,284 | | | 16% | 7,749 | | 8% |
| Wyoming Electric | 6,771 | | | (5)% | 7,406 | | | 1% | 7,036 | | (7)% |
Combined (a) | 6,056 | | | (6)% | 6,813 | | | 5% | 6,405 | | 3% |
| | | | | | | | |
| Cooling Degree Days: | | | | | | | | |
| Colorado Electric | 1,384 | | | 54% | 1,226 | | | 37% | 1,420 | | 58% |
| South Dakota Electric | 682 | | | 7% | 404 | | | (36)% | 488 | | (23)% |
| Wyoming Electric | 594 | | | 71% | 462 | | | 33% | 430 | | 24% |
Combined (a) | 985 | | | 41% | 791 | | | 14% | 902 | | 29% |
________________
(a) The combined degree days are calculated based on a weighted average of total customers by state.
| | | | | | | | | | | |
| For the year ended December 31, |
Contracted generating facilities availability by fuel type(a) | 2020 | 2019 | 2018 |
| Coal | 94.1% | 92.1% | 93.9% |
Natural gas and diesel oil (b) | 80.6% | 87.9% | 96.4% |
| Wind | 98.1% | 95.6% | 96.9% |
| Total availability | 87.0% | 89.9% | 95.6% |
| | | |
| Wind capacity factor | 38.9% | 38.7% | 39.2% |
____________________
(a) Availability and wind capacity factor are calculated using a weighted average based on capacity of our generating fleet.
(b) 2020 included a planned outage at Cheyenne Prairie and unplanned outages at Pueblo Airport Generation and Lange CT. 2019 included planned outages at Neil Simpson CT and Lange CT.
Gas Utilities
Operating results for the years ended December 31 for the Gas Utilities were as follows (in thousands):
| | | | | | | | | | | | | | | | | |
| 2020 | Variance | 2019 | Variance | 2018 |
| Revenue: | | | | | |
| Natural gas - regulated | $ | 900,637 | | $ | (31,474) | | $ | 932,111 | | $ | (10,813) | | $ | 942,924 | |
| Other - non-regulated services | 74,033 | | (3,886) | | 77,919 | | (4,464) | | 82,383 | |
| Total revenue | 974,670 | | (35,360) | | 1,010,030 | | (15,277) | | 1,025,307 | |
| | | | | |
| Cost of natural gas sold: | | | | | |
| Natural gas - regulated | 347,611 | | (59,032) | | 406,643 | | (35,887) | | 442,530 | |
| Other - non-regulated services | 7,034 | | (12,221) | | 19,255 | | (368) | | 19,623 | |
| Total cost of sales | 354,645 | | (71,253) | | 425,898 | | (36,255) | | 462,153 | |
| | | | | |
| | | | | |
| | | | | |
| | | | | |
| Gross margin (non-GAAP) | 620,025 | | 35,893 | | 584,132 | | 20,978 | | 563,154 | |
| | | | | |
| Operations and maintenance | 303,577 | | 1,733 | | 301,844 | | 10,363 | | 291,481 | |
| | | | | |
| Depreciation and amortization | 100,559 | | 8,242 | | 92,317 | | 5,883 | | 86,434 | |
| Total operating expenses | 404,136 | | 9,975 | | 394,161 | | 16,246 | | 377,915 | |
| | | | | |
| Adjusted operating income | $ | 215,889 | | $ | 25,918 | | $ | 189,971 | | $ | 4,732 | | $ | 185,239 | |
| | | | | |
| | | | | |
| | | | | |
| | | | | |
| | | | | |
| | | | | |
| | | | | |
| | | | | |
| | | | | |
| | | | | |
2020 Compared to 2019
Gross margin increased over the prior year as a result of:
| | | | | |
| (in millions) |
| New rates | $ | 25.4 | |
| Customer growth - distribution | 5.6 | |
| Mark-to-market on non-utility natural gas commodity contracts | 3.3 | |
| Prior year amortization of excess deferred income taxes | 2.6 | |
| Weather | (1.8) | |
COVID-19 impacts (a) | (1.8) | |
| Other | 2.6 | |
| Total increase in Gross margin (non-GAAP) | $ | 35.9 | |
____________________
(a) The impacts to Gas Utilities’ gross margin from COVID-19 were primarily driven by reduced volumes from certain transport customers and waived customer late payment fees.
Operations and maintenance expense increased primarily due to higher property taxes due to a higher asset base driven by prior and current year capital expenditures. Lower employee costs were mostly offset by various other current year expenses. COVID-19 impacts to operations and maintenance expense included $2.5 million of additional bad debt expense which was partially offset by $2.4 million of lower travel, training, and outside services related expenses.
Depreciation and amortization increased primarily due to a higher asset base driven by prior and current year capital expenditures.
Operating Statistics
| | | | | | | | | | | | | | | | | | | | | | | | | | | | | | | | | | | | | | |
| | Revenue (in thousands) | | Gross Margin (non-GAAP) (in thousands) | | Quantities Sold and Transported (Dth) |
| | For the year ended December 31, | | For the year ended December 31, | | For the year ended December 31, |
| | 2020 | 2019 | 2018 | | 2020 | 2019 | 2018 | | 2020 | 2019 | 2018 |
| | | | | | | | | | | | |
| Residential | | $ | 527,518 | | $ | 551,701 | | $ | 567,785 | | | $ | 298,707 | | $ | 285,802 | | $ | 276,858 | | | 61,962,171 | | 66,956,080 | | 65,352,164 | |
| Commercial | | 193,017 | | 212,229 | | 214,718 | | | 89,590 | | 88,264 | | 82,529 | | | 28,784,319 | | 32,241,441 | | 30,753,361 | |
| Industrial | | 24,014 | | 24,832 | | 26,466 | | | 8,670 | | 8,053 | | 7,056 | | | 6,881,354 | | 6,548,023 | | 6,309,211 | |
| Other | | 582 | | (1,361) | | (7,899) | | | 582 | | (1,361) | | (7,899) | | | — | | — | | — | |
| Total Distribution | | 745,131 | | 787,401 | | 801,070 | | | 397,549 | | 380,758 | | 358,544 | | | 97,627,844 | | 105,745,544 | | 102,414,736 | |
| | | | | | | | | | | | |
| Transportation and Transmission | | 155,506 | | 144,710 | | 141,854 | | | 155,477 | | 144,710 | | 141,850 | | | 149,062,476 | | 153,101,264 | | 148,299,003 | |
| | | | | | | | | | | | |
| Total Regulated | | 900,637 | | 932,111 | | 942,924 | | | 553,026 | | 525,468 | | 500,394 | | | 246,690,320 | | 258,846,808 | | 250,713,739 | |
| | | | | | | | | | | | |
| Non-regulated Services | | 74,033 | | 77,919 | | 82,383 | | | 66,999 | | 58,664 | | 62,760 | | | — | | — | | — | |
| | | | | | | | | | | | |
| Total Revenue, Gross Margin (non-GAAP) and Quantities Sold | | $ | 974,670 | | $ | 1,010,030 | | $ | 1,025,307 | | | $ | 620,025 | | $ | 584,132 | | $ | 563,154 | | | 246,690,320 | | 258,846,808 | | 250,713,739 | |
| | | | | | | | | | | | | | | | | | | | | | | | | | | | | | | | | | | | | | |
| | Revenue (in thousands) | | Gross Margin (non-GAAP) (in thousands) | | Quantities Sold and Transported (Dth) |
| | For the year ended December 31, | | For the year ended December 31, | | For the year ended December 31, |
| | 2020 | 2019 | 2018 | | 2020 | 2019 | 2018 | | 2020 | 2019 | 2018 |
| | | | | | | | | | | | |
| Arkansas | | $ | 184,849 | | $ | 185,201 | | $ | 176,660 | | | $ | 127,720 | | $ | 115,899 | | $ | 100,917 | | | 28,572,621 | | 30,496,243 | | 30,931,390 | |
| Colorado | | 186,085 | | 199,369 | | 188,002 | | | 106,749 | | 106,776 | | 99,851 | | | 32,077,083 | | 33,908,529 | | 29,857,063 | |
| Iowa | | 137,982 | | 151,619 | | 161,843 | | | 69,528 | | 70,290 | | 68,384 | | | 36,824,548 | | 41,795,729 | | 40,668,682 | |
| Kansas | | 101,118 | | 105,906 | | 112,306 | | | 60,586 | | 58,020 | | 55,226 | | | 33,732,897 | | 32,650,854 | | 31,387,672 | |
| Nebraska | | 246,381 | | 255,622 | | 278,969 | | | 169,311 | | 155,901 | | 164,513 | | | 80,202,783 | | 81,481,192 | | 81,658,938 | |
| Wyoming | | 118,255 | | 112,313 | | 107,527 | | | 86,131 | | 77,246 | | 74,263 | | | 35,280,388 | | 38,514,261 | | 36,209,994 | |
| Total Revenue, Gross Margin (non-GAAP) and Quantities Sold | | $ | 974,670 | | $ | 1,010,030 | | $ | 1,025,307 | | | $ | 620,025 | | $ | 584,132 | | $ | 563,154 | | | 246,690,320 | | 258,846,808 | | 250,713,739 | |
| | | | | | | | | | | | | | | | | | | | | | | | | | | | |
| For the year ended December 31, |
| 2020 | | 2019 | | 2018 |
| Heating Degree Days: | Actual | | Variance From
Normal | | Actual | | Variance From Normal | | Actual | Variance From Normal |
Arkansas (a) | 3,442 | | | (15)% | | 3,897 | | | (4)% | | 4,169 | | 3% |
| Colorado | 6,068 | | | (8)% | | 6,672 | | | 1% | | 6,136 | | (7)% |
| Iowa | 6,504 | | | (4)% | | 7,200 | | | 6% | | 7,192 | | 6% |
Kansas (a) | 4,648 | | | (5)% | | 5,190 | | | 6% | | 5,242 | | 7% |
| Nebraska | 5,853 | | | (5)% | | 6,578 | | | 7% | | 6,563 | | 6% |
| Wyoming | 7,289 | | | (4)% | | 8,010 | | | 7% | | 7,425 | | (1)% |
Combined (b) | 6,038 | | | (6)% | | 6,840 | | | 5% | | 6,628 | | 2% |
________________
(a) Arkansas and Kansas have weather normalization mechanisms that mitigate the weather impact on gross margins.
(b) The combined heating degree days are calculated based on a weighted average of total customers by state excluding Kansas due to its weather normalization mechanism. Arkansas Gas is partially excluded based on the weather normalization mechanism in effect from November through April.
Power Generation
Our Power Generation segment operating results for the years ended December 31 were as follows (in thousands):
| | | | | | | | | | | | | | | | | |
| 2020 | Variance | 2019 | Variance | 2018 |
| | | | | |
| Revenue | $ | 105,047 | | $ | 3,789 | | $ | 101,258 | | $ | 8,807 | | $ | 92,451 | |
| | | | | |
| Total fuel | 8,993 | | (66) | | 9,059 | | 467 | | 8,592 | |
| Operations and maintenance | 33,695 | | 5,266 | | 28,429 | | 3,294 | | 25,135 | |
| Depreciation and amortization | 20,247 | | 1,256 | | 18,991 | | 2,881 | | 16,110 | |
| Total operating expenses | 62,935 | | 6,456 | | 56,479 | | 6,642 | | 49,837 | |
| | | | | |
| Adjusted operating income | $ | 42,112 | | $ | (2,667) | | $ | 44,779 | | $ | 2,165 | | $ | 42,614 | |
| | | | | |
| | | | | |
| | | | | |
| | | | | |
| | | | | |
| | | | | |
| | | | | |
| | | | | |
2020 Compared to 2019
Revenue increased in the current year due to increased wind megawatt hours sold primarily driven by Busch Ranch II, additional Black Hills Colorado IPP fired-engine hours and higher power sales agreement prices and volumes. Operating expenses increased in the current year primarily due to a $3.1 million expense related to the early retirement of certain assets and higher depreciation and maintenance expense from new wind assets. COVID-19 impacts included $0.4 million of expenses related to the sequestration of essential employees which were mostly offset by lower travel and training expenses.
Operating Statistics
| | | | | | | | | | | | | | | | | | | | | | | |
| | | | | | | |
| Revenue (in thousands) | | Quantities Sold (MWh) (a) |
| For the year ended December 31, | 2020 | 2019 | 2018 | | 2020 | 2019 | 2018 |
| Black Hills Colorado IPP | $ | 57,057 | | $ | 55,191 | | $ | 55,331 | | | 1,076,819 | | 935,997 | | 1,000,577 | |
| Black Hills Wyoming | 42,464 | | 41,822 | | 36,978 | | | 633,389 | | 629,788 | | 582,938 | |
| Black Hills Electric Generation | 5,526 | | 4,245 | | 142 | | | 353,559 | | 167,296 | | 5,873 | |
| Total Revenue and Quantities Sold | $ | 105,047 | | $ | 101,258 | | $ | 92,451 | | | 2,063,767 | | 1,733,081 | | 1,589,388 | |
____________________
(a) Company use and losses are not included in the quantities sold.
| | | | | | | | | | | | | | |
| | | | |
| | For the year ended December 31, |
Quantities Generated and Purchased (MWh) (a) | Fuel Type | 2020 | 2019 | 2018 |
| Generated: | | | | |
| Black Hills Colorado IPP | Natural Gas | 1,076,819 | | 935,997 | | 1,000,577 | |
| Black Hills Wyoming | Coal | 551,136 | | 557,119 | | 501,945 | |
| Black Hills Electric Generation | Wind | 353,559 | | 167,296 | | 5,873 | |
| Total Generated | | 1,981,514 | | 1,660,412 | | 1,508,395 | |
| Purchased: | | | | |
Black Hills Wyoming (b) | Various | 82,525 | | 74,199 | | 83,213 | |
| Total Generated and Purchased | | 82,525 | | 74,199 | | 83,213 | |
____________________
(a) Company use and losses are not included in the quantities generated and purchased.
(b) Under the 20-year economy energy PSA (discussed in Note 3 of the Notes to Consolidated Financial Statements in this Annual Report on Form 10-K) with the City of Gillette, Black Hills Wyoming purchases energy on behalf of the City of Gillette and sells that energy to the City of Gillette. MWh sold may not equal MWh generated and purchased due to a dispatch agreement Black Hills Wyoming has with South Dakota Electric to cover energy imbalances.
| | | | | | | | | | | |
| For the year ended December 31, |
Contracted generating facilities availability by fuel type (a) | 2020 | 2019 | 2018 |
| Coal | 95.4% | 94.5% | 85.8% |
| Natural gas | 99.5% | 98.6% | 99.4% |
| Wind | 92.8% | 90.6% | N/A |
| Total availability | 96.4% | 95.0% | 95.9% |
| | | |
| Wind capacity factor | 26.6% | 23.5% | N/A |
___________
(a) Availability and wind capacity factor are calculated using a weighted average based on capacity of our generating fleet.
Mining
Mining operating results for the years ended December 31 were as follows (in thousands):
| | | | | | | | | | | | | | | | | |
| 2020 | Variance | 2019 | Variance | 2018 |
| | | | | |
| Revenue | $ | 61,075 | | $ | (554) | | $ | 61,629 | | $ | (6,404) | | $ | 68,033 | |
| | | | | |
| Operations and maintenance | 39,033 | | (999) | | 40,032 | | (3,696) | | 43,728 | |
| Depreciation, depletion and amortization | 9,235 | | 265 | | 8,970 | | 1,005 | | 7,965 | |
| Total operating expenses | 48,268 | | (734) | | 49,002 | | (2,691) | | 51,693 | |
| | | | | |
| Adjusted operating income | $ | 12,807 | | $ | 180 | | $ | 12,627 | | $ | (3,713) | | $ | 16,340 | |
| | | | | |
| | | | | |
| | | | | |
| | | | | |
| | | | | |
| | | | | |
2020 Compared to 2019
Adjusted operating income was comparable to the prior year.
Operating Statistics
| | | | | | | | | | | |
| For the year ended December 31, | 2020 | 2019 | 2018 |
| Tons of coal sold | 3,737 | | 3,716 | | 4,085 | |
| | | |
| Cubic yards of overburden moved | 8,120 | | 8,534 | | 8,970 | |
| | | |
| Coal reserves at year-end (in tons) | 181,711 | | 185,448 | | 189,164 | |
| | | |
| Revenue per ton | $ | 15.67 | | $ | 15.94 | | $ | 16.11 | |
Corporate and Other
Corporate and Other operating results for the years ended December 31 were as follows (in thousands):
| | | | | | | | | | | | | | | | | |
| (in thousands) | 2020 | Variance | 2019 | Variance | 2018 |
| | | | | |
| Adjusted operating income (loss) | $ | 1,440 | | $ | 3,072 | | $ | (1,632) | | $ | 1,393 | | $ | (3,025) | |
| | | | | |
| | | | | |
| | | | | |
| | | | | |
| | | | | |
| | | | | |
|
| | | | | | | | | | | | | | | |
| (in thousands) | 2019 | Variance | 2018 | Variance | 2017 |
| | | | | | |
Adjusted operating (loss) (a) | $ | (1,632 | ) | $ | 1,393 |
| $ | (3,025 | ) | $ | 3,271 |
| $ | (6,296 | ) |
____________
| |
(a) | Due to the changes in our segment disclosures discussed in Note 5 of the Notes to the Consolidated Financial Statements in this Annual Report on Form 10-K, Corporate and Other Adjusted operating (loss) was revised for the years ended December 31, 2018 and December 31, 2017 which resulted in a decrease of $(0.7) million and $(0.6) million, respectively. |
20192020 Compared to 20182019
The variance in Adjusted operating income (loss) was primarily due to prior year expenses related to the oil and gas segment that were not reclassified to discontinued operations.
2018 Compared to 2017
The variance in Adjusted operating (loss) was primarily due to prior year acquisitionlower unallocated employee costs.
Consolidated Interest Expense, Impairment of Investment, Other Income (Expense) and Income Tax Benefit (Expense)
| | | | | | | | | | | | | | | | | |
| (in thousands) | 2020 | Variance | 2019 | Variance | 2018 |
| | | | | |
| Interest expense, net | $ | (143,470) | | $ | (5,811) | | $ | (137,659) | | $ | 2,316 | | $ | (139,975) | |
| Impairment of investment | (6,859) | | 12,882 | | (19,741) | | (19,741) | | — | |
| Other income (expense), net | (2,293) | | 3,447 | | (5,740) | | (4,560) | | (1,180) | |
| Income tax benefit (expense) | (32,918) | | (3,338) | | (29,580) | | (53,247) | | 23,667 | |
| | | | | |
| | | | | |
| | | | | |
| | | | | |
| | | | | |
| | | | | |
|
| | | | | | | | | | | | | | | |
| (in thousands) | 2019 | Variance | 2018 | Variance | 2017 |
| | | | | | |
| Interest expense, net | $ | (137,659 | ) | $ | 2,316 |
| $ | (139,975 | ) | $ | (2,873 | ) | $ | (137,102 | ) |
| Impairment of investment | (19,741 | ) | (19,741 | ) | — |
| — |
| — |
|
| Other income (expense), net | (5,740 | ) | (4,560 | ) | (1,180 | ) | (3,288 | ) | 2,108 |
|
| Income tax benefit (expense) | (29,580 | ) | (53,247 | ) | 23,667 |
| 97,034 |
| (73,367 | ) |
20192020 Compared to 20182019
Interest Expense
The increase in Interest expense, net was driven by higher debt balances partially offset by lower interest rates.
Impairment of Investment
ForIn the current year, ended December 31, 2019, we recorded a pre-tax non-cash write-down of $20$6.9 million in our investment in equity
securities of a privately held oil and gas company.company, compared to a $20 million write-down in the prior year. The impairment wasimpairments in both years were triggered by a deterioration in earnings performance of
continued adverse natural gas prices and liquidity concerns at the privately held oil and gas companycompany. The remaining book value of our investment is $1.5 million, and an adverse changethis is our only remaining investment in future naturaloil and gas prices.exploration and production activities. See Note 1 of the Notes to Consolidated Financial Statements in this Annual Report on Form 10-K for additional details.
Other Income (Expense)
ForThe variance in Other income (expense), net was due to the prior year ended December 31, 2019, we expensedexpensing of $5.4 million of development costs related to projects we no longer intend to construct.construct which was partially offset by higher current year non-service defined benefit plan costs primarily driven by lower discount rates.
Income Tax Benefit (Expense)
For the year ended December 31, 2020, the effective tax rate was 11.9% compared to 12.2% in 2019. The increase inlower effective tax expense wasrate is primarily due to a prior year $73 millionincreased tax benefit resultingbenefits from legal entity restructuring partially offset by:
A prior year $(4.0) million incomefederal production tax expense associated with changes in the previously estimated impact of tax reform on deferred income taxes;
Current year $3.8 million of federal PTCs and $2.1 million of related state ITCscredits associated with new wind assets;
A currentassets and one-time research and development tax credits partially offset by a prior year $1.9 million tax benefit from increased repair activity in flow-through regulatory jurisdictions;
A current year $1.4 million tax benefit for incremental excess deferred tax amortization related to tax reform; and
A current year $3.4 million tax benefit from a federal tax loss carry-back claim including interest.
We identified certain qualified expenses that extend beyondSee Note 17 of the typical two-year carry-back period.Notes to Consolidated Financial Statements in this Annual Report on Form 10-K for additional details.
2018 Compared to 2017
Other Income (Expense)
The variance in Other income (expense), net was primarily due to the presentation change of non-service pension costs to Other income (expense) in 2018, previously reported in Operations and maintenance.
Income Tax Benefit (Expense)
The variance in Income tax benefit (expense) was primarily due to a $73 million tax benefit in 2018 resulting from legal entity restructuring and the reduction in the federal corporate income tax rate from 35% to 21% from the TCJA, effective January 1, 2018, partially offset by a $(4.0) million income tax expense associated with changes in the previously estimated impact of tax reform on deferred income taxes.
Liquidity and Capital Resources
OVERVIEW
Our company requires significant cash to support and grow our businesses. Our predominant sourceprimary sources of cash isare generated from our operationsoperating activities, five-year Revolving Credit Facility, CP Program, ATM and supplemented with corporate financings.ability to access the public and private capital markets through debt and equity securities offerings when necessary. This cash is used for, among other things, working capital, capital expenditures, dividends, pension funding, investments in or acquisitions of assets and businesses, payment of debt obligations and redemption of outstanding debt and equity securities when required or financially appropriate.
We experience significant cash requirements during peak months of the winter heating season due to higher natural gas consumption and during periods of high natural gas prices, as well as during the construction season.season which typically peaks in spring and summer.
We believe that our cash on hand, operating cash flows, existing borrowing capacity and ability to complete new debt and equity financings, taken in their entirety, provide sufficient capital resources to fund our ongoing operating requirements, regulatory liabilities, debt maturities, anticipated dividends, and anticipated capital expenditures discussed in this section.
In response to the February 2021 weather event and the COVID-19 pandemic, we took steps to maintain adequate liquidity to operate our businesses and fund our capital investment program as discussed in the Company Highlights above.
The following table provides an informational summary of our financial position as of December 31 (dollars in thousands):
| | | Financial Position Summary | 2019 | 2018 | Financial Position Summary | 2020 | 2019 |
| Cash and cash equivalents | $ | 9,777 |
| $ | 20,776 |
| Cash and cash equivalents | $ | 6,356 | $ | 9,777 |
| Restricted cash and equivalents | $ | 3,881 |
| $ | 3,369 |
| Restricted cash and equivalents | $ | 4,383 | $ | 3,881 |
| Notes payable | $ | 349,500 |
| $ | 185,620 |
| Notes payable | $ | 234,040 | $ | 349,500 |
| Short-term debt, including current maturities of long-term debt | $ | 5,743 |
| $ | 5,743 |
| |
| Current maturities of long-term debt | | Current maturities of long-term debt | $ | 8,436 | $ | 5,743 |
Long-term debt (a) | $ | 3,140,096 |
| $ | 2,950,835 |
| Long-term debt (a) | $ | 3,528,100 | $ | 3,140,096 |
| Stockholders’ equity | $ | 2,362,123 |
| $ | 2,181,588 |
| Stockholders’ equity | $ | 2,561,385 | $ | 2,362,123 |
| | | |
| Ratios | | Ratios | |
| Long-term debt ratio | 57 | % | 57 | % | Long-term debt ratio | 58 | % | 57 | % |
| Total debt ratio | 60 | % | 59 | % | Total debt ratio | 60 | % | 60 | % |
______________
| |
(a) | (a) Carrying amount of long-term debt is net of deferred financing costs. |
Significant Factors Affecting Liquidity
Although we believe we have sufficient resources to fund
CASH FLOW ACTIVITIES
The following table summarizes our cash requirements, there are many factors with the potential to influence our cash flow position, including weather seasonality, commodity prices, significant capital projects and acquisitions, requirements imposed by state and federal agencies and economic market conditions. We have implemented risk mitigation programs, where possible, to stabilize cash flow. However, the potential for unforeseen events affecting cash needs will continue to exist.
Our Utilities maintain wholesale commodity contractsflows for the purchases and sales of electricity and natural gas which have performance assurance provisions that allowyears ended December 31 (in thousands):
| | | | | | | | | | | |
| 2020 | 2019 | 2018 |
| Cash provided by (used in) | | | |
| Operating activities | $ | 541,863 | | $ | 505,513 | | $ | 488,811 | |
| Investing activities | $ | (761,664) | | $ | (816,210) | | $ | (465,849) | |
| Financing activities | $ | 216,882 | | $ | 300,210 | | $ | (17,057) | |
2020 Compared to 2019
Operating Activities:
Net cash provided by operating activities was $36 million higher than in 2019. The variance to the counterparty to require collateral postings under certain conditions, including when requested on a reasonable basis due to a deterioration inprior year was primarily attributable to:
•Cash earnings (income from continuing operations plus non-cash adjustments) were $20 million higher than prior year driven primarily by higher operating income at our financial condition or nonperformance. A significant downgrade in our credit ratings, such as a downgrade to a level below investment grade, could result in counterparties requiring collateral postings under such adequate assurance provisions. The amount of credit support that we may be required to provide at any point in the future is dependent on the amount of the initial transaction,Gas Utilities;
•Net inflows from changes in the market price, open positionscertain operating assets and the amounts owedliabilities were $18 million higher than prior year, primarily attributable to:
•Cash inflows decreased by or to the counterparty. At December 31, 2019, we had sufficient liquidity to cover collateral that could be required to be posted under these contracts.
Weather Seasonality, Commodity Pricing and Associated Hedging Strategies
We manage liquidity needs through hedging activities,approximately $18 million primarily in connection with seasonal needs of our utility operations (including seasonal peaks in fuel requirements), interest rate movements and commodity price movements.
Utility Factors
Our cash flows, and in turn liquidity needs in many of our regulated jurisdictions, can be subject to fluctuations in weather and commodity prices. Since weather conditions are uncontrollable, we have implemented commission-approved natural gas hedging and storage programs in many of our regulated jurisdictions to mitigate significant changes in natural gas commodity pricing. We target hedging a percentage of our forecasted natural gas supply consumption using options, futures, basis swaps and physical fixed price purchases.
Interest Rates
Some of our debt instruments have a variable interest rate component which can change significantly depending on the economic climate. We do not have any interest rate swap agreements at December 31, 2019; 90% of our interest rate exposure has been mitigated through fixed interest rates.
Federal and State Regulations
We are structured as a utility holding company which owns several regulated utilities. Within this structure, we are subject to various regulations by our commissions that can influence our liquidity. As an example, the issuance of debt by our regulated subsidiaries and the use of our utility assets as collateral generally require prior approval of the state regulators in the state in which the utility assets are located. Furthermore, as a result of our holding company structure, our rightchanges in accounts receivable and other current assets driven by warmer weather, lower commodity prices and COVID-19 related impacts;
•Cash outflows decreased by approximately $60 million as a common shareholderresult of changes in accounts payable and other current liabilities driven by the impact of lower commodity prices, deferral of payroll taxes under the CARES Act and other working capital requirements; and
•Cash outflows increased by approximately $24 million primarily as a result of changes in our regulatory assets and liabilities driven by timing of recovery and returns for fuel costs adjustments partially offset by the TCJA tax rate change that was returned to receive assetscustomers in the prior year.
•Cash inflows decreased $1.3 million for other operating activities.
Investing Activities:
Net cash used in investing activities was $55 million lower than in 2019. This variance to the claims againstprior year was primarily attributable to:
•Capital expenditures of approximately $767 million in 2020 compared to $818 million in 2019. Higher prior year expenditures were driven by large projects such as the assets of such subsidiaries by their creditors. Therefore, our holding company debt obligations are effectively subordinated to all existingNatural Bridge pipeline project, the Busch Ranch II wind project and future claimsconstruction of the creditorsfinal segment of our subsidiaries, including trade creditors,the 175-mile transmission line from Rapid City, South Dakota to Stegall, Nebraska. The current year capital expenditures included the Corriedale wind project.
•Cash inflows increased $3.6 million for other investing activities.
Financing Activities:
Net cash provided by financing activities was $83 million lower than in 2019. This variance to the prior year was primarily attributable to:
•Cash inflows decreased $82 million due to maturities and repayments of long and short-term debt holders, secured creditors, taxing authoritiesin excess of issuances;
•Cash outflows increased $11 million due to increased dividends paid on common stock; and guarantee holders.
CASH GENERATION AND CASH REQUIREMENTS•Cash outflows decreased by $9.7 million for other financing activities primarily driven by lower current year financing costs incurred in the June 17, 2020 debt transaction compared to prior year financing costs incurred in the June 17, 2019 and October 3, 2019 debt transactions.
Cash Generation
Our primary sources of cash are generated from operating activities, our five-year Revolving Credit Facility expiring in 2023, our CP Program, our ATM equity offering program and our ability to access the public and private capital markets through debt and equity securities offerings when necessary.CAPITAL SOURCES
Cash Collateral
Under contractual agreements and exchange requirements, BHC or its subsidiaries have collateral requirements, which if triggered, require us to post cash collateral with the counterparty to meet these obligations. The cash collateral we were required to post at December 31, 2019 was not material.
DEBT, EQUITY AND LIQUIDITY
Debt
Revolving Credit Facility and CP Program
On July 30, 2018, we amended and restated our corporateWe have a $750 million Revolving Credit Facility maintaining total commitments of $750 million and extending the term throughthat matures on July 30, 2023 with two one-year extension options (subject to consent from lenders). This facility is similar to the former revolving credit facility, which includes an accordion feature that allows us, with the consent of the administrative agent, the issuing agents and each bank increasing or providing a new commitment, to increase total commitments up to $1.0 billion. Borrowings continue to be available under a base rate or various Eurodollar rate options. See Note 7 of our Notes to the Consolidated Financial Statements in this Annual Report on Form 10-K for more information.
We also have a $750 million, unsecured CP Program that is backstopped by the Revolving Credit Facility. Amounts outstanding under the Revolving Credit Facility and the CP Program, either individually or in the aggregate, cannot exceed $750 million. See Note 7 of our Notes to the Consolidated Financial Statements in this Annual Report on Form 10-K for more information.
Our Revolving Credit Facility and CP Program had the following borrowings, outstanding letters of credit, and available capacity (in millions):
|
| | | | | | | | | | | | | |
| | | Current | Short-term borrowings at | Letters of Credit at | Available Capacity at |
| Credit Facility | Expiration | Capacity | December 31, 2019 | December 31, 2019 | December 31, 2019 |
| Revolving Credit Facility and CP Program | July 30, 2023 | $ | 750 |
| $ | 350 |
| $ | 30 |
| $ | 370 |
|
The weighted average interest rate on short-term borrowings at December 31, 2019 was 2.03%. Short-term borrowing activity for the twelve months ended December 31, 2019 was:
|
| | | |
| | (dollars in millions) |
| Maximum amount outstanding - short-term borrowing (based on daily outstanding balances) | $ | 357 |
|
| Average amount outstanding - short-term borrowing (based on daily outstanding balances) | $ | 187 |
|
| Weighted average interest rates - short-term borrowing | 2.47 | % |
The Revolving Credit Facility contains customary affirmative and negative covenants, such as limitations on certain liens, restrictions on certain transactions, and maintenance of a certain Consolidated Indebtedness to Capitalization Ratio. We were in compliance with these covenants as of December 31, 2019. See
Note 7 of our Notes to the Consolidated Financial Statements in this Annual Report on Form 10-K for more information.
The Revolving Credit Facility prohibits us from paying cash dividends if a default or an event of default exists prior to, or would result after, paying a dividend. Although these contractual restrictions exist, we do not anticipate triggering any default measures or restrictions.
Cross-Default Provisions
Our $7 million Corporate term loanThe Revolving Credit Facility contains cross-default provisions that could result in a default under such agreements if BHC or its material subsidiaries failed to 1) make timely payments of debt obligationsobligations; or 2) triggered other default provisions under any debt agreement totaling, in the aggregate principal amount of $50 million or more that permitspermit the acceleration of debt maturities or mandatory debt prepayment.
Our Revolving Credit Facility containsand CP Program had the same provisionsfollowing borrowings, outstanding letters of credit, and available capacity (in millions):
| | | | | | | | | | | | | | | | | |
| | Current | Short-term borrowings at | Letters of Credit (a) at | Available Capacity at |
| Credit Facility | Expiration | Capacity | December 31, 2020 | December 31, 2020 | December 31, 2020 |
| Revolving Credit Facility and CP Program | July 30, 2023 | $ | 750 | | $ | 234 | | $ | 25 | | $ | 491 | |
__________
(a) Letters of credit are off-balance sheet commitments that reduce the threshold principal amount is $50 million.borrowing capacity available on our corporate Revolving Credit. For more information on these letters of credit, see Note 9 of the Notes to Consolidated Financial Statements in this Annual Report on Form 10-K.
The weighted average interest rate on short-term borrowings at December 31, 2020 was 0.27%. Short-term borrowing activity for the year ended December 31, 2020 was:
| | | | | |
| (dollars in millions) |
| Maximum amount outstanding (based on daily outstanding balances) | $ | 366 | |
| |
| Average amount outstanding (based on daily outstanding balances) | $ | 193 | |
| |
| Weighted average interest rate | 0.90 | % |
| |
See Note 9 of our Notes to Consolidated Financial Statements in this Annual Report on Form 10-K for more information on our Revolving Credit Facility prohibits us from paying cash dividends if we are in default or if paying dividends would cause us to be in default.and CP Program.
Utility Money Pool
As a utility holding company, we are required to establish a cash management program to address lending and borrowing activities between our utilities and the Company. We have established utility money pool agreements which address these requirements. These agreements are on file with the FERC and appropriate state regulators. Under the utility money pool agreements, our utilities may, at their option, borrow and extend short-term loans to our other utilities via a utility money pool at market-based rates (2.210% at December 31, 2019).rates. While the utility money pool may borrow funds from the Company (as ultimate parent company), the money pool arrangement does not allow loans from our utility subsidiaries to the Company (as ultimate parent company) or to non-regulated affiliates.
At
Our Long-term debt and associated interest payments due by year are shown below (in thousands). For more information on our long-term debt, see Note 9 of our Notes to Consolidated Financial Statements in this Annual Report on Form 10-K.
| | | | | | | | | | | | | | | | | | | | | | | |
| Payments Due by Period |
| 2021 | 2022 | 2023 | 2024 | 2025 | Thereafter | Total |
Principal payments on Long-term debt including current maturities (a) | $ | 8,436 | | $ | — | | $ | 525,000 | | $ | — | | $ | — | | $ | 3,035,000 | | $ | 3,568,436 | |
Interest payments on Long-term debt (a) | 141,561 | | 141,547 | | 141,547 | | 119,235 | | 119,235 | | 1,209,188 | | 1,872,313 | |
__________
(a)Long-term debt amounts do not include deferred financing costs or discounts or premiums on debt. Estimated interest payments on variable rate debt are calculated by utilizing the applicable rates as of December 31, 2019, money pool balances included (in thousands):2020.
|
| | | |
| Subsidiary | Borrowings From Money Pool Outstanding |
| BHSC | $ | 148,041 |
|
| South Dakota Electric | 57,585 |
|
| Wyoming Electric | 37,993 |
|
| Total Money Pool borrowings from Parent | $ | 243,619 |
|
The Revolving Credit Facility and Wyoming Electric’s financing agreements contain covenant requirements. We were in compliance with these covenants as of December 31, 2020. See additional information in Note 9 of our Notes to Consolidated Financial Statements in this Annual Report on Form 10-K
Equity
Shelf Registration
We have an effective automatica shelf registration statement on file with the SEC under which we may issue, from time to time, senior debt securities, subordinated debt securities, common stock, preferred stock, warrants and other securities. Although the shelf registration statement does not limit our issuance capacity, our ability to issue securities is limited to the authority granted by our Board of Directors, certain covenants in our financing arrangements and restrictions imposed by federal and state regulatory authorities. The shelf registration expires in August 2020.2023. Our articles of incorporation authorize the issuance of 100 million shares of common stock and 25 million shares of preferred stock. As of December 31, 2019,2020, we had approximately 6163 million shares of common stock outstanding and no shares of preferred stock outstanding.
ATM
Our ATM allows us to sell shares of our common stock with an aggregate value of up to $400 million. The shares may be offered from time to time pursuant to a sales agreement dated August 4, 2020. Shares of common stock are offered pursuant to our shelf registration statement filed with the SEC. In 2019,2020, we issued a total of 1,328,332did not issue any shares of common stock under the ATM for proceeds of $99 million, net of $1.2 million in issuance costs. As of December 31, 2019, all shares were settled.
Common Stock Dividends
Future cash dividends, if any, will be dependent on our results of operations, financial position, cash flows, reinvestment opportunities and other factors, and will be evaluated and approved by our Board of Directors.
On January 29, 2020, our Board of Directors declared a quarterly dividend of $0.535 per share, equivalent to an annual dividend rate of $2.14 per share. The table below provides our historical three-year dividend payout ratio and dividends paid per share:
|
| | | |
| | 2019 | 2018 | 2017 |
| Dividend Payout Ratio | 63% | 40% | 50% |
| Dividends Per Share | $2.05 | $1.93 | $1.81 |
Our three-year compound annualized dividend growth rate was 6.9% and all dividends were paid out of available operating cash flows.
Dividend Restrictions
As a utility holding company which owns several regulated utilities, we are subject to various regulations that could influence our liquidity. Our utilities in Arkansas, Colorado, Iowa, Kansas and Nebraska have regulatory agreements in which they cannot pay dividends if they have issued debt to third parties and the payment of a dividend would reduce their equity ratio to below 40% of their total capitalization; and neither BHSC nor its utility subsidiaries can extend credit to the Company except in the ordinary course of business and upon reasonable terms consistent with market terms. The use of our utility assets as collateral generally requires the prior approval of the state regulators in the state in which the utility assets are located. Additionally, our utility subsidiaries may generally be limited to the amount of dividends allowed by state regulatory authorities to be paid to us as a utility holding company and also may have further restrictions under the Federal Power Act.
As a result of our holding company structure, our right as a common shareholder to receive assets from any of our direct or indirect subsidiaries upon a subsidiary’s liquidation or reorganization is junior to the claims against the assets of such subsidiaries by their creditors. Therefore, our holding company debt obligations are effectively subordinated to all existing and future claims of the creditors of our subsidiaries, including trade creditors, debt holders, secured creditors, taxing authorities and guarantee holders. See
For additional information inregarding equity, see Note 610 of our Notes to the Consolidated Financial Statements in this Annual Report on Form 10-K.
Our credit facilities and other debt obligations contain restrictions on the payment of cash dividends upon a default or event of default. An event of default would be deemed to have occurred if we did not comply with certain financial or other covenants. See additional information in Note 7 of our Notes to the Consolidated Financial Statements in this Annual Report on Form 10-K.
Covenants within Wyoming Electric's financing agreements require Wyoming Electric to maintain a debt to capitalization ratioTable of no more than 0.60 to 1.00. As of December 31, 2019, we were in compliance with these covenants.Contents
Financing Activities
Financing activities in 2019 consisted of the following:
We issued a total of 1.3 million shares of common stock under the ATM equity offering program for proceeds of $99 million, net of $1.2 million in issuance costs.
On October 3, 2019, we completed a public debt offering of $700 million principal amount in senior unsecured notes. The debt offering consisted of $400 million of 3.05% 10-year senior notes due October 15, 2029, and $300 million of 3.875% 30-year senior notes due October 15, 2049. Proceeds were used to repay the $400 million Corporate term loan due June 17, 2021, retire the $200 million 5.875% senior notes due July 15, 2020, and repay a portion of short-term debt.
On June 17, 2019, we amended our Corporate term loan due July 30, 2020. This amendment increased total commitments to $400 million from $300 million, extended the term through June 17, 2021 and continued to have substantially similar terms and covenants as the amended and restated Revolving Credit Facility. The net proceeds were used to pay down short-term debt. Proceeds from the October 3, 2019 debt transaction were used to repay this term loan.
Short-term borrowings from our Revolving Credit Facility and CP Program.
Future Financing Plans
We anticipate the following financing activities in 2020:
Renew our shelf registration and ATM;
Continued equity issuance under the ATM or assess other equity issuance options;
Refinance a portion of short-term borrowings held through the Revolving Credit Facility and CP Program to long-term debt; and
Continuewill continue to assess debt and equity needs to support our capital expenditure plan.
CASH FLOW ACTIVITIES
The following table summarizes our cash flows (in thousands):
|
| | | | | | | | | |
| | 2019 | 2018 | 2017 |
| Cash provided by (used in) | | | |
| Operating activities | $ | 505,513 |
| $ | 488,811 |
| $ | 428,261 |
|
| Investing activities | $ | (816,210 | ) | $ | (465,849 | ) | $ | (317,118 | ) |
| Financing activities | $ | 300,210 |
| $ | (17,057 | ) | $ | (108,695 | ) |
2019 Compared to 2018
Operating Activities:
Net cash provided by operating activities was $17 million higher than in 2018. The variance to the prior year was primarily attributable to:
Cash earnings (income from continuing operations plus non-cash adjustments) were $37 million higher than prior year driven primarily by higher margins at our Electric and Gas Utilities;
Net outflows from operating assets and liabilities were $25 million higher than prior year, primarily attributable to:
Cash outflows increased by approximately $40 million as a result of changes in accounts payable and accrued liabilities, driven by the impact of higher outside services, employee costsinvestment plans and other working capital requirements;
Cash inflows increased by approximately $59 million compared to the prior year primarily as a result of lower accounts receivable driven by lower pass-through revenues reflecting lower commodity prices; and
Cash inflows decreased by approximately $44 million primarily as a result of changes in our current regulatory liabilities due to the TCJA tax rate change that has subsequently been returned to customers and from changes in our current regulatory assets driven by lower fuel cost adjustments and the impact of lower commodity prices; and
Cash outflows decreased approximately $5.5 million due to the absence of operating activities of discontinued operations in 2019.
Investing Activities:
Net cash used in investing activities was $816 million in 2019, compared to net cash used in investing activities of $466 million in 2018 for a variance of $350 million. This variance was primarily due to:
Capital expenditures of approximately $818 million in 2019 compared to $458 million in 2018. The $361 million increase from the prior year was due to higher capital expenditures driven by higher programmatic safety, reliability and integrity spending at our Electric and Gas Utilities segments, the Corriedale Wind Energy Project at our Electric Utilities segment, construction of the final segment of the 175-mile transmission line from Rapid City, South Dakota, to Stegall, Nebraska, at our Electric Utilities segment, the 35-mile Natural Bridge pipeline project at our Gas Utilities segment, and construction of Busch Ranch II at our Power Generation segment; and
Net cash used in investing activities decreased $4.0 million due to prior year activities associated with divesting of our oil and gas segment.
Financing Activities:
Net cash provided by financing activities was $300 million in 2019 as compared to net cash used by financing activities of $17 million in 2018, an increase of $317 million due to the following:
Increase of $539 million due to issuances of long and short-term debt in excess of required maturities that were usedkey strategic objectives. In 2021, we expect to fund our capital program
Decreaseplan and strategic objectives by using cash generated from operating activities, our Revolving Credit Facility and CP Program, and issuing $100 million to $120 million of $199 million in common stock issued primarily due to prior year gross proceeds of approximately $299 million fromunder the Equity Unit conversion partially offset by current year net proceeds of $99 million through our ATM equity offering program;
Cash dividends on common stock of $125 million were paid in 2019 compared to $107 million paid in 2018; and
Cash outflows for other financing activities increased by approximately $5.5 million driven primarily by current year financing costs incurredATM. As discussed in the October 3, 2019 debt transaction.
CAPITAL EXPENDITURES
Capital expenditures areCompany Highlights above, on February 24, 2021, we entered into an $800 million term loan maturing on November 23, 2021. We expect to repay a substantial portion of our cash requirements each yearthis term loan prior to maturity and we continue to forecast a robust capital expenditure program duringrefinance the next five years. See Key Elements of our Business Strategy aboveremaining portion in Item 7 - Executive Summary and Business Strategy for forecasted capital expenditure requirements.longer-term debt.
A significant portion of our capital expenditures relates to safety, reliability and integrity assets benefiting customers that may be included in utility rate base and can be recovered from our utility customers following regulatory approval. Those capital expenditures also earn a rate of return authorized by the commissions in the jurisdictions in which we operate.
Historical Capital Requirements
Our primary capital requirements for the three years ended December 31 were as follows (in thousands):
|
| | | | | | | | | | | |
| | 2019 | | 2018 | | 2017 |
Property additions: (a) | | | | | |
Electric Utilities (b) | $ | 222,911 |
| | $ | 152,524 |
| | $ | 138,060 |
|
Gas Utilities (c) | 512,366 |
| | 288,438 |
| | 184,389 |
|
Power Generation (d) | 85,346 |
| | 30,945 |
| | 1,864 |
|
| Mining | 8,430 |
| | 18,794 |
| | 6,708 |
|
| Corporate and Other | 20,702 |
| | 11,723 |
| | 6,668 |
|
| Capital expenditures before discontinued operations | 849,755 |
| | 502,424 |
| | 337,689 |
|
| Discontinued operations | — |
| | 2,402 |
| | 23,222 |
|
| Total capital expenditures | 849,755 |
| | 504,826 |
| | 360,911 |
|
| Common stock dividends | 124,647 |
| | 106,591 |
| | 96,744 |
|
| Maturities/redemptions of long-term debt | 905,743 |
| | 854,743 |
| | 105,743 |
|
| Total capital requirements | $ | 1,880,145 |
| | $ | 1,466,160 |
| | $ | 563,398 |
|
____________________________
| |
(a) | Includes accruals for property, plant and equipment as disclosed in Note 17 of the Notes to the Consolidated Financial Statements in this Annual Report on Form 10-K. |
| |
(b) | Current year capital expenditures at our Electric Utilities segment increased due to higher programmatic safety, reliability and integrity spending, the Corriedale wind project and construction of the final segment of the 175-mile transmission line from Rapid City, South Dakota, to Stegall, Nebraska. |
| |
(c) | Current year capital expenditures at our Gas Utilities segment increased due to higher programmatic safety, reliability and integrity spending and the 35-mile Natural Bridge pipeline project. |
| |
(d) | Current year capital expenditures at our Power Generation segment increased due to construction of Busch Ranch II. |
CREDIT RATINGS AND COUNTERPARTIES
Financing for operational needs and capital expenditure requirements, not satisfied by operating cash flows, depends upon the cost and availability of external funds through both short and long-term financing. In order to operate and grow our business, we need to consistently maintain the ability to raise capital on favorable terms. Access to funds is dependent upon factors such as general economic and capital market conditions, regulatory authorizations and policies, the Company’s credit ratings, cash flows from routine operations and the credit ratings of counterparties. After assessing the current operating performance, liquidity and credit ratings of the Company, management believes that the Company will have access to the capital markets at prevailing market rates for companies with comparable credit ratings. BHC notesWe note that credit ratings are not recommendations to buy, sell, or hold securities and may be subject to revision or withdrawal at any time by the assigning rating agency. Each rating should be evaluated independently of any other rating.
The following table represents the credit ratings, outlook and risk profile of BHC at December 31, 2019:
|
| | | | | | | |
| Rating Agency | Senior Unsecured Rating | Outlook |
S&P (a) | BBB+ | Stable |
Moody’s (b) | Baa2 | Stable |
Fitch (c) | BBB+ | Stable |
__________
| |
(a) | On February 28, 2019, S&P affirmed our BBB+ rating and maintained a Stable outlook. |
| |
(b) | On December 20, 2019, Moody’s affirmed our Baa2 rating and maintained a Stable outlook. |
| |
(c) | On August 29, 2019, Fitch affirmed our BBB+ rating and maintained a Stable outlook. |
(a) On April 10, 2020, S&P reported BBB+ rating and maintained a Stable outlook.
(b) On December 21, 2020, Moody’s reported Baa2 rating and maintained a Stable outlook.
(c) On August 20, 2020, Fitch reported BBB+ rating and maintained a Stable outlook.
Certain of our fees and our interest rates under various bank credit agreementsour Revolving Credit Facility are based on our credit ratings at all three rating agencies. If all of our ratings are at the same level, or if two of our ratings are the same level and one differs, these fees and interest rates will be based on the ratings that are at the same level. If all of our ratings are at different levels, these fees and interest rates will be based on the middle level. Currently, our Fitch and S&P ratings are at the same level, and our Moody’s rating is one level below. Therefore, if Fitch or S&P downgradeddowngrades our senior unsecured debt, we will be required to pay higher fees and interest rates under these bank credit agreements.
The following table represents the credit ratings of South Dakota Electric at December 31, 2019:
|
| | | | |
| Rating Agency | Senior Secured Rating |
S&P (a) | A |
Moody’s (b) | A1 |
Fitch (c) | A |
__________
| |
(a) | On April 30, 2019, S&P affirmed A rating. |
| |
(b) | On December 20, 2019, Moody’s affirmed A1 rating. |
| |
(c) | On August 29, 2019, Fitch affirmed A rating. |
(a) On April 16, 2020, S&P reported A rating.
(b) On December 21, 2020, Moody’s reported A1 rating.
(c) On August 20, 2020, Fitch reported A rating.
We do not have any trigger events (i.e., an acceleration of repayment of outstanding indebtedness, an increase in interest costs, or the posting of additional cash collateral) tied to our stock price and have not executed any transactions that require us to issue equity based on our credit ratings.
CONTRACTUAL OBLIGATIONS AND OTHER COMMITMENTS
ContractualCAPITAL REQUIREMENTS
Capital Expenditures
Capital expenditures are a substantial portion of our cash requirements each year and we continue to forecast a robust capital expenditure program during the next five years. See above in Key Elements of our Business Strategy for forecasted capital expenditure requirements. A significant portion of our capital expenditures are for safety, reliability and integrity benefiting customers that may be included in utility rate base and eligible to be recovered from our utility customers with regulatory approval. Those capital expenditures also earn a rate of return authorized by the commissions in the jurisdictions in which we operate.
As discussed in the Company Highlights above, there have been limited impacts from COVID-19 on our capital investment plan and we do not anticipate a significant impact in 2021.
Our capital expenditures for the three years ended December 31 were as follows (in thousands):
| | | | | | | | | | | | | | | | | |
| 2020 | | 2019 | | 2018 |
Capital Expenditures By Segment (a) : | | | | | |
| Electric Utilities | $ | 271,104 | | | $ | 222,911 | | | $ | 152,524 | |
| Gas Utilities | 449,209 | | | 512,366 | | | 288,438 | |
| Power Generation | 9,329 | | | 85,346 | | | 30,945 | |
| Mining | 8,250 | | | 8,430 | | | 18,794 | |
| Corporate and Other | 17,500 | | | 20,702 | | | 11,723 | |
| Capital expenditures before discontinued operations | 755,392 | | | 849,755 | | | 502,424 | |
| Discontinued operations | — | | | — | | | 2,402 | |
| Total capital expenditures | $ | 755,392 | | | $ | 849,755 | | | $ | 504,826 | |
| | | | | |
| | | | | |
| | | | | |
____________________________
(a) Includes accruals for property, plant and equipment as disclosed as supplemental cash flow information in the Consolidated Statements of Cash Flows in the Consolidated Financial Statements in this Annual Report on Form 10-K.
Unconditional Purchase Obligations
In addition toWe have unconditional purchase obligations which include the energy and capacity costs associated with our capital expenditure programs, we have contractual obligationsPPAs, transmission services agreements, and other commitments that will need to be funded in the future. The following information summarizesnatural gas capacity, transportation and storage agreements. Additionally, our cash obligations and commercial commitments at December 31, 2019. Actual future obligations may differ materially from these estimated amounts (in thousands):
|
| | | | | | | | | | | | | | | | | | | | | |
| | Payments Due by Period |
| Contractual Obligations | 2020 | 2021 | 2022 | 2023 | 2024 | Thereafter | Total |
Long-term debt(a) | $ | 5,743 |
| $ | 8,435 |
| $ | — |
| $ | 525,000 |
| $ | 2,855 |
| $ | 2,635,000 |
| $ | 3,177,033 |
|
Interest payments (a) | 131,859 |
| 131,842 |
| 131,756 |
| 131,756 |
| 109,390 |
| 1,273,648 |
| 1,910,251 |
|
Unconditional purchase obligations(b) | 181,773 |
| 159,827 |
| 134,018 |
| 105,583 |
| 54,098 |
| 126,147 |
| 761,446 |
|
Lease obligations(c) | 1,144 |
| 991 |
| 869 |
| 844 |
| 724 |
| 2,009 |
| 6,581 |
|
AROs (d) | 330 |
| 231 |
| 144 |
| 33 |
| 9,362 |
| 54,105 |
| 64,205 |
|
Employee benefit plans(e) | 18,921 |
| 19,678 |
| 19,736 |
| 19,944 |
| 19,896 |
| 35,580 |
| 133,755 |
|
| CP Program | 349,500 |
| — |
| — |
| — |
| — |
| — |
| 349,500 |
|
Total contractual cash obligations(f) | $ | 689,270 |
| $ | 321,004 |
| $ | 286,523 |
| $ | 783,160 |
| $ | 196,325 |
| $ | 4,126,489 |
| $ | 6,402,771 |
|
__________
| |
(a) | Long-term debt amounts do not include deferred financing costs or discounts or premiums on debt. Estimated interest payments on variable rate debt are calculated by utilizing the applicable rates as of December 31, 2019.
|
| |
(b) | Unconditional purchase obligations include the energy and capacity costs associated with our PPAs, capacity and certain transmission, gas transportation and storage agreements. The energy charges under the PPAs are variable costs, which for purposes of estimating our future obligations, were based on costs incurred during 2019 and price assumptions using existing prices at December 31, 2019. Our transmission obligations are based on filed tariffs as of December 31, 2019.
|
| |
(c) | Includes leases associated with several office and operating facilities, communication tower sites, equipment and materials storage. |
| |
(d) | Represents estimated payments for AROs associated with long-lived assets primarily related to retirement and reclamation of natural gas pipelines, mining sites, wind farms and an evaporation pond. See Notes 1 and 8 of the Notes to the Consolidated Financial Statements in this Annual Report on Form 10-K for additional information. |
| |
(e) | Represents estimated employer contributions to the Defined Benefit Pension Plan, the Non-Pension Defined Benefit Postretirement Healthcare Plan and the Supplemental Non-Qualified Defined Benefit Plans through the year 2029 as discussed in Note 18 of the Notes to the Consolidated Financial Statements in this Annual Report on Form 10-K. |
| |
(f) | Amounts in the table exclude: (1) any obligation that may arise from our derivatives, including commodity related contracts that have a negative fair value at December 31, 2019. These amounts have been excluded as it is impractical to reasonably estimate the final amount and/or timing of any associated payments; (2) a portion of our gas purchases are hedged. These hedges are in place to reduce our customers' underlying exposure to commodity price fluctuations. The impact of these hedges is not included in the above table; (3) our $4.2 million liability for unrecognized tax benefits in accordance with accounting guidance for uncertain tax positions as discussed in Note 15 of the Notes to the Consolidated Financial Statements in this Annual Report on Form 10-K. |
Our Gas Utilities have commitments to purchase physical quantities of natural gas under contracts indexed to various forward natural gas price curves.
In addition, a portionFor additional information. see Note 3 of our gas purchases are purchased under evergreen contracts and therefore, for purposesNotes to Consolidated Financial Statements in this Annual Report on Form 10-K.
Defined Benefit Pension Plan
We have one defined benefit pension plan, the Black Hills Retirement Plan (Pension Plan). The unfunded status of this disclosure, are carried out for 60 days. Asthe Pension Plan is defined as the amount the projected benefit obligation exceeds the plan assets. The unfunded status of the plan is $40 million as of December 31, 2019,2020 compared to $51 million as of December 31, 2019. We do not have required 2021 contributions and currently do not expect to contribute to our Pension Plan. See further information in Note 15 of our Notes to Consolidated Financial Statements in this Annual Report on Form 10-Ks.
Common Stock Dividends
Future cash dividends, if any, will be dependent on our results of operations, financial position, cash flows, reinvestment opportunities and other factors, and will be evaluated and approved by our Board of Directors.
Additionally, there are certain statutory limitations that could affect future cash dividends paid. Federal law places limits on the ability of public utilities within a holding company structure to declare dividends. Specifically, under the Federal Power Act, a public utility may not pay dividends from any funds properly included in a capital account. The utility subsidiaries’ dividends may be limited directly or indirectly by state regulatory commissions or bond indenture covenants. See additional information in Note 9 of our Notes to Consolidated Financial Statements in this Annual Report on Form 10-K.
On January 27, 2021, our Board of Directors declared a quarterly dividend of $0.565 per share, equivalent to an annual dividend rate of $2.26 per share. The table below provides our dividends paid (in thousands), dividend payout ratio and dividends paid per share for the three years ended December 31:
| | | | | | | | | | | |
| 2020 | 2019 | 2018 |
| Common Stock Dividends Paid | $ | 135,439 | | $ | 124,647 | | $ | 106,591 | |
| Dividend Payout Ratio | 60 | % | 63% | 40% |
| Dividends Per Share | $ | 2.17 | | $ | 2.05 | | $ | 1.93 | |
Our three-year compound annualized dividend growth rate was 6.2% and all dividends were paid out of available operating cash flows.
Collateral Requirements
Our Utilities maintain wholesale commodity contracts for the purchases and sales of electricity and natural gas which have performance assurance provisions that allow the counterparty to require collateral postings under certain conditions, including when requested on a reasonable basis due to a deterioration in our financial condition or nonperformance. A significant downgrade in our credit ratings, such as a downgrade to a level below investment grade, could result in counterparties requiring collateral postings under such adequate assurance provisions. The amount of credit support that we are committedmay be required to purchase 3.7 million MMBtu, 3.7 million MMBtu, and 1.8 million MMBtuprovide at any point in eachthe future is dependent on the amount of the years from 2020 to 2022, respectively.
Off-Balance Sheet Commitments
We have entered into various off-balance sheet commitmentsinitial transaction, changes in the formmarket price, open positions and the amounts owed by or to the counterparty. At December 31, 2020, we had sufficient liquidity to cover collateral that could be required to be posted under these contracts. The cash collateral we were required to post at December 31, 2020 was not material. For the year ended December 31, 2020, we did not experience any requests to post additional collateral, including for concerns over a potential deterioration of guarantees and letters of credit.our financial condition due to COVID-19.
Guarantees
We provide various guarantees, which represent off-balance sheet commitments, supporting certain of our subsidiaries under specified agreements or transactions. For more information on these guarantees, see Note 203 of the Notes to the Consolidated Financial Statements in this Annual Report on Form 10-K.
Letters of Credit
Letters of credit reduce the borrowing capacity available on our corporate Revolving Credit Facility. For more information on these letters of credit, see Note 7 of the Notes to the Consolidated Financial Statements in this Annual Report on Form 10-K.
Critical Accounting Policies Involving Significant Accounting Estimates
We prepare our consolidated financial statements in conformity with GAAP. In many cases, the accounting treatment of a particular transaction is specifically dictated by GAAP and does not require management’s judgment in application. There are also areas which require management’s judgment in selecting among available GAAP alternatives. We are required to make certain estimates, judgments and assumptions that we believe are reasonable based upon the information available. We continue to closely monitor the rapidly evolving and uncertain impact of COVID-19 on our critical accounting estimates including, but not limited to, collectibility of customer receivables, recoverability of regulatory assets, impairment risk of goodwill and long-lived assets, valuation of pension assets and liabilities and contingent liabilities. These estimates and assumptions affect the reported amounts of assets and liabilities at the date of the financial statements and the reported amounts of revenues and expenses during the periods presented. Actual results may differ from our estimates and to the extent there are material differences between these estimates, judgments or assumptions and actual results, our financial statements will be affected. We believe the following accounting estimates are the most critical in understanding and evaluating our reported financial results. We have reviewed these critical accounting estimates and related disclosures with our Audit Committee.
The following discussion of our critical accounting estimates should be read in conjunction with Note 1, “Business“Business Description and Significant Accounting Policies”Policies” of our Notes to the Consolidated Financial Statements in this Annual Report on Form 10-K.
Regulation
Our regulated Electric and Gas Utilities are subject to cost-of-service regulation and earnings oversight from federal and state utility commissions. This regulatory treatment does not provide any assurance as to achievement of desired earnings levels. Our retail electric and gas utility rates are regulated on a state-by-state basis by the relevant state regulatory commissions based on an analysis of our costs, as reviewed and approved in a regulatory proceeding. The rates that we are allowed to charge may or may not match our related costs and allowed return on invested capital at any given time.
Management continually assesses the probability of future recoveries associated with regulatory assets and future obligations associated with regulatory liabilities. Factors such as the current regulatory environment, recently issued rate orders and historical precedents are considered. As a result, we believe that the accounting prescribed under rate-based regulation remains appropriate and our regulatory assets are probable of recovery in current rates or in future rate proceedings.
To some degree, each of our Electric and Gas Utilities are permitted to recover certain costs (such as increased fuel and purchased power costs) outside of a base rate review. To the extent we are able to pass through such costs to our customers, and a state public utilityregulatory commission subsequently determines that such costs should not have been paid by the customers, we may be required to refund such costs. Any such costs not recovered through rates, or any such refund, could adversely affect our results of operations, financial position or cash flows.
As of December 31, 20192020 and 2018,2019, we had total regulatory assets of $271$278 million and $284$271 million, respectively, and total regulatory liabilities of $537$533 million and $541$537 million, respectively. See Note 132 of the Notes to the Consolidated Financial Statements for further information.
Goodwill
We perform a goodwill impairment test on an annual basis or upon the occurrence of events or changes in circumstances that indicate that the asset might be impaired. Our annual goodwill impairment testing date is as of October 1, which aligns our testing date with our financial planning process.
Accounting standards for testing goodwill for impairment require the application of either a two-step process be performedqualitative or quantitative assessment to analyze whether or not goodwill has been impaired. Goodwill is tested for impairment at the reporting unit level. The first step of this test, used to identify potential impairment, comparesUnder either the qualitative or quantitative assessment, the estimated fair value of a reporting unit is compared with its carrying amount, including goodwill. If the carrying amount exceeds fair value, under the first step, then the second step of thean impairment test is performedloss would be recognized in an amount equal to measurethat excess, limited to the amount of any impairment loss.goodwill allocated to that reporting unit.
Application of the goodwill impairment test requires judgment, including the identification of reporting units and determining the fair value of the reporting unit. We have determined that the reporting units for goodwill impairment testing are our operating segments, or components of an operating segment, that constitute a business for which discrete financial information is available and for which segment managementthe Chief Operating Decision Maker (CODM) regularly reviews the operating results. We estimate the fair value of our reporting units using a combination of an income approach, which estimates fair value based on discounted future cash flows, and a market approach, which estimates fair value based on market comparables within the utility and energy industries. These valuations require significant judgments, including, but not limited to: 1) estimates of future cash flows, based on our internal five-year business plans and adjusted as appropriate for our view of market participant assumptions, with long range cash flows estimated using a terminal value calculation; 2) estimates of long-term growth rates for our businesses; 3) the determination of an appropriate weighted-average cost of capital or discount rate; and 4) the utilization of market information such as recent sales transactions for comparable assets within the utility and energy industries. Varying by reporting unit, weighted average cost of capital in the range of 5% to 6% and long-term growth rate projections in the 1% to 2% range were utilized in the goodwill impairment test performed in the fourth quarteras of 2019.October 1, 2020. Although 1% to 2% was used for a long-term growth rate projection, the short-term projected growth rate is higher with planned recovery of capital investments through rider mechanisms and rate reviews, as well as other improved efficiency and cost reduction initiatives.reviews. Under the market approach, we estimate fair value using multiples derived from comparable sales transactions and enterprise value to EBITDA for comparative peer companies for each respective reporting unit. These multiples are applied to operating data for each reporting unit to arrive at an indication of fair value. In addition, we add a reasonable control premium when calculating fair value utilizing the peer multiples, which is estimated as the premium that would be received in a sale in an orderly transaction between market participants.
The estimates and assumptions used in the impairment assessments are based on available market information and we believe they are reasonable. However, variations in any of the assumptions could result in materially different calculations of fair value and determinations of whether or not an impairment is indicated. For the years ended December 31, 2020, 2019, 2018, and 2017,2018, there were no impairment losses recorded. At December 31, 2019,2020, the fair value substantially exceeded the carrying value at all reporting units.
As described in Note 1 of the Notes to the Consolidated Financial Statements in this Annual Report on Form 10-K, we have prospectively adopted ASU 2017-04, Simplifying the Test for Goodwill Impairment, prospectively on January 1, 2020.
Pension and Other Postretirement Benefits
As described in Note 1815 of the Notes to the Consolidated Financial Statements in this Annual Report on Form 10-K, we have one defined benefit pension plan, one defined post-retirement healthcare plan and several non-qualified retirement plans. A Master Trust holds the assets for the pension plan. A VEBA trust for the funded portion of the post-retirement healthcare plan has also been established.
Accounting for pension and other postretirement benefit obligations involves numerous assumptions, the most significant of which relate to the discount rates, healthcare cost trend rates, expected return on plan assets, compensation increases, retirement rates and mortality rates. The determination of our obligation and expenses for pension and other postretirement benefits is dependent on the assumptions determined by management and used by actuaries in calculating the amounts. Although we believe our assumptions are appropriate, significant differences in our actual experience or significant changes in our assumptions may materially affect our pension and other postretirement obligations and our future expense.
Effective January 1, 2020, the Company changed its method of accounting for net periodic benefit cost. Prior to the change, the Company used a calculated value for determining market-related value of plan assets which amortized the effects of gains and losses over a five-year period. Effective with the accounting change, the Company uses a calculated value for the return-seeking assets (equities) in the portfolio and fair value for the liability-hedging assets (fixed income). The Company considers the fair value method for determining market-related value of liability-hedging assets to be a preferable method of accounting because asset-related gains and losses are subject to amortization into pension cost immediately. Additionally, the fair value for liability-hedging assets allows for the impact of gains and losses on this portion of the asset portfolio to be reflected in tandem with changes in the liability which is linked to changes in the discount rate assumption for re-measurement.
The 20202021 pension benefit cost for our non-contributory funded pension plan is expected to be $10.2$0.5 million compared to $2.1$4 million in 2019.2020. The increasedecrease in the expected 2021 pension benefit cost is driven primarily by favorable asset returns partially offset by a decrease in the discount rate and lower expected return on assets.rate.
The effect of hypothetical changes to selected assumptions on the pension and other postretirement benefit plans would be as follows in thousands of dollars:
| | | | | | | | | | | | | | |
| | December 31, |
| Assumptions | Percentage Change | 2020 Increase/(Decrease) PBO/APBO (a) | | 2021
Increase/(Decrease) Expense - Pretax |
| | | | |
| Pension | | December 31, |
Assumptions | Percentage Change | 2019
Increase/(Decrease)
PBO/APBO (a)
| | 2020
Increase/(Decrease) Expense - Pretax
|
| | | | |
Pension | | | | |
Discount rate (b) | +/- 0.5 | (28,998)(30,334)/31,91233,326 | | (3,965)(3,162)/4,3113,743 |
| Expected return on assets | +/- 0.5 | N/A | | (2,036)(2,367)/2,0362,372 |
| | | | |
| OPEB | | | | |
Discount rate (b) | +/- 0.5 | (2,836)(3,139)/3,0953,425 | | 90/116(100)/108 |
| Expected return on assets | +/- 0.5 | N/A | | (39)(38)/3938 |
__________________________
| |
(a) | Projected benefit obligation (PBO) for the pension plan and accumulated postretirement benefit obligation (APBO) for OPEB plans. |
| |
(b) | Impact on service cost, interest cost and amortization of gains or losses. |
(a) Projected benefit obligation (PBO) for the pension plan and accumulated postretirement benefit obligation (APBO) for OPEB plans.
(b) Impact on service cost, interest cost and amortization of gains or losses.
Income Taxes
The Company and its subsidiaries file consolidated federal income tax returns. Each entity records income taxes as if it were a separate taxpayer for both federal and state income tax purposes and consolidating adjustments are allocated to the subsidiaries based on separate company computations of taxable income or loss.
The Company uses the asset and liability method in accounting for income taxes. Under the asset and liability method, deferred income taxes are recognized at currently enacted income tax rates, to reflect the tax effect of temporary differences between the financial and tax basis of assets and liabilities as well as operating loss and tax credit carryforwards. Such temporary differences are the result of provisions in the income tax law that either require or permit certain items to be reported on the income tax return in a different period than they are reported in the financial statements.
As of December 31, 2019,2020, we have a regulatory liability associated with TCJA related items of $285 million, completing our accounting for the revaluation of deferred taxes pursuant to the TCJA. A significant portion of the excess deferred taxes are subject to the average rate assumption method, as prescribed by the IRS, and will generally be amortized as a reduction of customer rates over the remaining lives of the related assets.
As of December 31, 2019,2020, the Company has amortized $6.5$13.3 million of regulatory liability associated with TCJA related items. The portion that was eligible for amortization under the average rate assumption method in 2019,2020, but is awaiting resolution of the treatment of these amounts in future regulatory proceedings, has not been recognized and may be refunded in customer rates at any time in accordance with the resolution of pending or future regulatory proceedings.
In assessing the realization of deferred tax assets, management considers whether it is more likely than not that some portion or all of the deferred tax assets will not be realized and provides any necessary valuation allowances as required. If we determine that we will be unable to realize all or part of our deferred tax assets in the future, an adjustment to the deferred tax asset would be charged to income in the period such determination was made. Although we believe our assumptions, judgments and estimates are reasonable, changes in tax laws or our interpretations of tax laws and the resolution of current and any future tax audits could significantly impact the amounts provided for income taxes in our consolidated financial statements.
See Note 1517 of the Notes to the Consolidated Financial Statements in this Annual Report on Form 10-K for additional information.
Market Risk Disclosures
Our market risk disclosures are detailed in
New Accounting Pronouncements
See Note 91 of the Notes to the Consolidated Financial Statements in this Annual Report on Form 10-K with additionalfor information providedon new accounting standards adopted in 2020 or pending adoption.
ITEM 7A. QUANTITATIVE AND QUALITATIVE DISCLOSURES ABOUT MARKET RISK
Our activities in the following paragraphs.regulated and non-regulated energy sectors expose us to a number of risks in the normal operations of our businesses. Depending on the activity, we are exposed to varying degrees of market risk and credit risk.
Our exposureMarket risk is the potential loss that may occur as a result of an adverse change in market price, rate or supply. We are exposed, but not limited to, the following market risks detailed in risks:
Note 9•Commodity price risk associated with our retail natural gas services, wholesale electric power marketing activities and fuel procurement for several of our gas-fired generation assets. Market fluctuations may occur due to unpredictable factors such as the Notes to the Consolidated Financial Statements in this Annual Report on Form 10-K is also affected byCOVID-19 pandemic, weather, market speculation, pipeline constraints, and other factors that may impact natural gas and electric supply and demand; and
•Interest rate risk associated with future debt, including reduced access to liquidity during periods of extreme capital markets volatility, such as the size, duration and composition of our energy portfolio, the absolute and relative levels of interest rates and commodity prices, the volatility of these prices and rates2008 financial crisis and the liquidityCOVID-19 pandemic.
Credit risk is associated with financial loss resulting from non-performance of the related interest rate and commodity markets.contractual obligations by a counterparty.
To manage and mitigate these identified risks, we have adopted the Black Hills Corporation Risk Policies and Procedures. The Black Hills Corporation Risk Policies and Procedures have been approved by our Executive Risk Committee. These policies relate to numerous matters including governance, control infrastructure, authorized commodities and trading instruments, prohibited activities and employee conduct. We report any issues or concerns pertaining to the Risk Policies and Procedures to the Audit Committee of our Board of Directors. The Executive Risk Committee, which includes senior level executives, meets at least quarterly and as necessary, appropriate or desirable, to review our business and credit activities and to ensure that these activities are conducted within the authorized policies.
Commodity Price Risk
Electric and Gas Utilities
We produce, purchase and distribute power in four states, and purchase and distribute natural gas in six states. Our utilities have various provisions that allow them to pass the prudently-incurred cost of energy through to the customer. To the extent energy prices are higher or lower than amounts in our current billing rates, adjustments are made on a periodic basis to “true-up”reflect billed amounts to match the actual energy cost we incurred. In Colorado, South Dakota and Wyoming, we have ECA or PCA provisions that adjust electric rates when energy costs are higher or lower than the costs included in our tariffs. In Arkansas, Colorado, Iowa, Kansas, Nebraska and Wyoming, we have GCA provisions that adjust natural gas rates when our natural gas costs are higher or lower than the energy cost included in our tariffs. These adjustments are subject to periodic prudence reviews by the state regulatory commissions.
The operations of our utilities, including natural gas sold by our Gas Utilities and natural gas used by our Electric Utilities’ generation plants or those plants under PPAs where our Electric Utilities must provide the generation fuel (tolling agreements), expose our utility commissions.customers to natural gas price volatility. Therefore, as allowed or required by state regulatory commissions, we have entered into commission-approved hedging programs utilizing natural gas futures, options, over-the-counter swaps and basis swaps to reduce our customers’ underlying exposure to these fluctuations.
For our regulated Utilities’ hedging plans, unrealized and realized gains and losses, as well as option premiums and commissions on these transactions are recorded as Regulatory assets or Regulatory liabilities in the accompanying Consolidated Balance Sheets in accordance with the state utility commission guidelines. When the related costs are recovered through our rates, the hedging activity is recognized in the Consolidated Statements of Income. See additional information in Note 911 of the Notes to the Consolidated Financial Statements in this Annual Report on Form 10-K.
Wholesale Power
We periodically have wholesale power purchase and sale contracts used to manage purchased power costs and load requirements associated with serving our electric customers that are considered derivative instruments and do not qualifying for the normal purchase and normal sales exception for derivative accounting. Changes in the fair value of these commodity derivatives are recognized in the Consolidated Statements of Income.
A potential risk related to wholesale power sales is the price risk arising from the sale of wholesale power that exceeds our generating capacity. These potential short positions can arise from unplanned plant outages or from unanticipated load demands. To manage such risk, we restrict wholesale off-system sales to amounts by which our anticipated generating capabilities and purchased power resources exceed our anticipated load requirements plus a required reserve margin.
Black Hills Energy Services
We buy and sell natural gas at competitive prices by managing commodity price risk. As a result of these activities, this area of our business is exposed to risks associated with changes in the market price of natural gas. We manage our exposure to such risks using over-the-counter and exchange traded options and swaps with counterparties in anticipation of forecasted purchases and sales. A portion of our over-the-counter swaps have been designated as cash flow hedges to mitigate the commodity price risk associated with fixed price forward contracts to supply gas to our Choice Gas Program customers. The gain or loss on these designated derivatives is reported in AOCI in the accompanying Consolidated Balance Sheets and reclassified into earnings in the same period that the underlying hedged item is recognized in earnings.
See additional commodity risk and derivative information in Note 11 of the Notes to Consolidated Financial Statements in this Annual Report on Form 10-K.
Interest Rate Risk
Periodically, we have engaged in activities to manage risks associated with changes in interest rates. We have utilized pay-fixed interest rate swap agreements to reduce exposure to interest rate fluctuations associated with floating rate debt obligations and anticipated debt refinancings. At December 31, 2019,2020, we had no interest rate swaps in place. As discussed in Item 7 - Liquidity and Capital Resources, 90% of our variable interest rate exposure has been mitigated through issuing fixed rate debt.
Further details of past swap agreements are set forth in Note 911 of the Notes to the Consolidated Financial Statements in this Annual Report on Form 10-K.
Credit Risk
Our creditAt December 31, 2020, 93% of our debt is fixed rate debt, which limits our exposure to variable interest rate fluctuations. A hypothetical 100 basis point increase in the benchmark rate on our variable rate debt would have increased annual pretax interest expense by approximately $2.1 million and $4.6 million for the years ended December 31, 2020 and 2019, respectively. See Note 9 for further information on cash amounts outstanding under short- and long-term variable rate borrowings.
We are subject to interest rate risk disclosures are detailedassociated with our pension and post-retirement benefit obligations. Changes in interest rates impact the liabilities associated with these benefit plans as well as the amount of income or expense recognized for these plans. Declines in the value of the plan assets could diminish the funded status of the pension plans and potentially increase the requirements to make cash contributions to these plans. See additional information in Critical Accounting Estimates in Item 7 and Note 915 of the Notes to the Consolidated Financial Statements in this Annual Report on Form 10-K, with additional information provided below.10-K.
Credit Risk
We have adopted the Black Hills Corporation Credit Policy that establishes guidelines, controls and limits to manage and mitigate credit risk within risk tolerances established by the Board of Directors. In addition, our Executive Risk Committee, which includes senior executives, meets on a regular basisWe attempt to reviewmitigate our credit activitiesexposure by conducting business primarily with high credit quality entities, setting tenor and to monitor compliancecredit limits commensurate with counterparty financial strength, obtaining master netting agreements and mitigating credit exposure with less creditworthy counterparties through parental guarantees, cash collateral requirements, letters of credit and other security agreements.
We perform ongoing credit evaluations of our customers and adjust credit limits based upon payment history and the adopted policies.customer’s current creditworthiness, as determined by review of their current credit information. We maintain a provision for estimated credit losses based upon historical experience, changes in current market conditions, expected losses and any specific customer collection issue that is identified. Our credit exposure at December 31, 2020 was concentrated primarily among retail utility customers, investment grade companies, cooperative utilities and federal agencies.
New Accounting Pronouncements
See more information in Notes 1Note 1 and 11 of the Notes to the Consolidated Financial Statements in this Annual Report on Form 10-K for information on new accounting standards adopted in 2019 or pending adoption.10-K.
| |
ITEM 8. | FINANCIAL STATEMENTS AND SUPPLEMENTARY DATA |
INDEX TO CONSOLIDATED ITEM 8.FINANCIAL STATEMENTS AND SUPPLEMENTARY DATA
Management’s Report on Internal Control over Financial Reporting
We are responsible for establishing and maintaining adequate internal control over financial reporting as defined in Rules 13a-15(f) and 15d-15(f) under the Securities Exchange Act of 1934, as amended.Our internal control over financial reporting is a process designed to provide reasonable assurance regarding the reliability of financial reporting and the preparation of financial statements for external purposes in accordance with generally accepted accounting principles.
All internal control systems, no matter how well designed, have inherent limitations. Therefore, even those systems determined to be effective can provide only reasonable assurance with respect to financial statement preparation and presentation. Because of its inherent limitations, internal control over financial reporting may not prevent or detect misstatements. Also, projections of any evaluation of effectiveness to future periods are subject to the risk that controls may become inadequate because of changes in conditions, or that the degree of compliance with the policies or procedures may deteriorate.
Under the supervision and with the participation of management, including our Chief Executive Officer and Chief Financial Officer, we conducted an evaluation of the effectiveness of our internal control over financial reporting as of December 31, 2019,2020, based on the criteria set forth in Internal Control - Integrated Framework (2013) issued by the Committee of Sponsoring Organizations of the Treadway Commission “COSO”. This evaluation included review of the documentation of controls, evaluation of the design effectiveness of controls, testing of the operating effectiveness of controls and a conclusion on this evaluation. Based on our evaluation, we have concluded that our internal control over financial reporting was effective as of December 31, 2019.2020.
Deloitte & Touche LLP, an independent registered public accounting firm, as auditors of Black Hills Corporation’s financial statements, has issued an attestation report on the effectiveness of Black Hills Corporation's internal control over financial reporting as of December 31, 2019.2020. Deloitte & Touche LLP's report on Black Hills Corporation's internal control over financial reporting is included herein.
Black Hills Corporation
REPORT OF INDEPENDENT REGISTERED PUBLIC ACCOUNTING FIRM
To the shareholders and the Board of Directors of Black Hills Corporation
Opinion on the Financial Statements
We have audited the accompanying consolidated balance sheets of Black Hills Corporation and subsidiaries (the “Company”"Company") as of December 31, 20192020 and 2018,2019, the related consolidated statements of income, comprehensive income, shareholders' equity, and cash flows, and equity, for each of the three years in the period ended December 31, 2019,2020, and the related notes and the schedule listed in the Index at Item 15 (collectively referred to as the “financial statements”"financial statements"). In our opinion, the financial statements present fairly, in all material respects, the financial position of the Company as of December 31, 20192020 and 2018,2019, and the results of its operations and its cash flows for each of the three years in the period ended December 31, 2019,2020, in conformity with accounting principles generally accepted in the United States of America.
We have also audited, in accordance with the standards of the Public Company Accounting Oversight Board (United States) (PCAOB), the Company’s internal control over financial reporting as of December 31, 2019, based on criteria established in Internal Control--Integrated Framework (2013) issued by the Committee of Sponsoring Organizations of the Treadway Commission and our report dated February 14, 2020, expressed an unqualified opinion on the Company’s internal control over financial reporting.
Basis for Opinion
These financial statements are the responsibility of the Company’s management. Our responsibility is to express an opinion on the Company’s financial statements based on our audits. We are a public accounting firm registered with the PCAOB and are required to be independent with respect to the Company in accordance with the U.S. federal securities laws and the applicable rules and regulations of the Securities and Exchange Commission and the PCAOB.
We conducted our audits in accordance with the standards of the PCAOB. Those standards require that we plan and perform the audit to obtain reasonable assurance about whether the financial statements are free of material misstatement, whether due to error or fraud. Our audits included performing procedures to assess the risks of material misstatement of the financial statements, whether due to error or fraud, and performing procedures that respond to those risks. Such procedures included examining, on a test basis, evidence regarding the amounts and disclosures in the financial statements. Our audits also included evaluating the accounting principles used and significant estimates made by management, as well as evaluating the overall presentation of the financial statements. We believe that our audits provide a reasonable basis for our opinion.
Critical Audit Matter
The critical audit matter communicated below is a matter arising from the current-period audit of the financial statements that was communicated or required to be communicated to the audit committee and that (1) relates to accounts or disclosures that are material to the financial statements and (2) involved our especially challenging, subjective, or complex judgments. The communication of critical audit matters does not alter in any way our opinion on the financial statements, taken as a whole, and we are not, by communicating the critical audit matter below, providing a separate opinion on the critical audit matter or on the accounts or disclosures to which it relates.
Regulatory Accounting--Impact of Rate Regulation on the Financial Statements--Refer to Note 1 and Note 13 to the financial statements
Critical Audit Matter Description
The Company is subject to cost-of-service regulation and earnings oversight by federal and state utility commissions (collectively, the “Commissions”), which have jurisdiction over the Company’s electric rates in Colorado, Montana, South Dakota and Wyoming and natural gas rates in Arkansas, Colorado, Iowa, Kansas, Nebraska and Wyoming. Management has determined it meets the requirements under accounting principles generally accepted in the United States of America to prepare its financial statements applying the specialized rules to account for the effects of cost-based rate regulation. Accounting for the economics of rate regulation impacts multiple financial statement line items and disclosures, such as property, plant, and equipment; regulatory assets and liabilities; revenue; operating expenses; and income tax benefit (expense).
Rates are regulated on a state-by-state basis by the relevant state regulatory commissions based on an analysis of the costs, as reviewed and approved in a regulatory proceeding. Rate regulation is premised on the full recovery of prudently incurred costs and a reasonable rate of return on invested capital. Decisions to be made by the Commissions in the future will impact the accounting for regulated operations, including decisions about the amount of allowable costs and return on invested capital included in rates and any refunds that may be required. While the Company has indicated its regulatory assets are probable of recovery in current rates or in future proceedings, there is a risk that the Commissions will not judge all costs to have been prudently incurred or that the rate regulation process in which rates are determined will always result in rates that produce a full recovery of costs and the return on invested capital.
We identified the impact of rate regulation as a critical audit matter due to the significant judgments made by management to support its assertions about impacted account balances and disclosures and the high degree of subjectivity involved in assessing the impact of future regulatory orders on the financial statements. Management judgments include assessing the likelihood of (1) recovery in future rates of incurred costs, and (2) a refund or future rate reduction to be provided to customers. Given the uncertainty of future decisions by the Commissions, auditing these judgments required specialized knowledge of accounting for rate regulation and the rate setting process due to its inherent complexities.
How the Critical Audit Matter Was Addressed in the Audit
Our audit procedures related to the uncertainty of future decisions by the Commissions included the following, among others:
We tested the effectiveness of management’s controls over the evaluation of the likelihood of (1) the recovery in future rates of costs incurred as property, plant, and equipment and deferred as regulatory assets, and (2) a refund or a future reduction in rates that should be reported as regulatory liabilities. We tested the effectiveness of management’s controls over the initial recognition of amounts as property, plant, and equipment; regulatory assets or liabilities; and the monitoring and evaluation of regulatory developments that may affect the likelihood of recovering costs in future rates or of a future reduction in rates.
We evaluated the Company’s disclosures related to the impacts of rate regulation, including the balances recorded and regulatory developments.
We read relevant regulatory orders issued by the Commissions, procedural memorandums, filings made by the Company, and other publicly available information, as appropriate, to assess the likelihood of recovery in future rates or of a future reduction in rates based on precedence of the Commissions’ treatment of similar costs under similar circumstances. We evaluated the external information and compared to the Company’s recorded regulatory asset and liability balances for completeness and for any evidence that might contradict management’s assertions.
We obtained an analysis from management regarding probability of recovery for regulatory assets or refund or future reduction in rates for regulatory liabilities not yet addressed in a regulatory order to assess management’s assertion that amounts are probable of recovery or a future reduction in rates.
/s/ DELOITTE & TOUCHE LLP
Minneapolis, Minnesota
February 14, 2020
We have served as the Company’s auditor since 2002.
REPORT OF INDEPENDENT REGISTERED PUBLIC ACCOUNTING FIRM
To the shareholders and the Board of Directors of Black Hills Corporation
Opinion on Internal Control over Financial Reporting
We have audited the internal control over financial reporting of Black Hills Corporation and subsidiaries (the "Company") as of December 31, 2019, based on criteria established in Internal Control - Integrated Framework (2013) issued by the Committee of Sponsoring Organizations of the Treadway Commission (COSO). In our opinion, the Company maintained, in all material respects, effective internal control over financial reporting as of December 31, 2019, based on criteria established in Internal Control - Integrated Framework (2013) issued by COSO.
We have also audited, in accordance with the standards of the Public Company Accounting Oversight Board (United States) (PCAOB), the consolidatedCompany's internal control over financial statementsreporting as of December 31, 2020, based on criteria established in Internal Control — Integrated Framework (2013) and financial statement scheduleissued by the Committee of Sponsoring Organizations of the Company as of and for the year ended December 31, 2019,Treadway Commission and our report dated February 14, 202026, 2021, expressed an unqualified opinion on those consolidatedthe Company's internal control over financial statements and financial statement schedule.reporting.
Basis for Opinion
These financial statements are the responsibility of the Company's management. Our responsibility is to express an opinion on the Company's financial statements based on our audits. We are a public accounting firm registered with the PCAOB and are required to be independent with respect to the Company in accordance with the U.S. federal securities laws and the applicable rules and regulations of the Securities and Exchange Commission and the PCAOB.
We conducted our audits in accordance with the standards of the PCAOB. Those standards require that we plan and perform the audit to obtain reasonable assurance about whether the financial statements are free of material misstatement, whether due to error or fraud. Our audits included performing procedures to assess the risks of material misstatement of the financial statements, whether due to error or fraud, and performing procedures that respond to those risks. Such procedures included examining, on a test basis, evidence regarding the amounts and disclosures in the financial statements. Our audits also included evaluating the accounting principles used and significant estimates made by management, as well as evaluating the overall presentation of the financial statements. We believe that our audits provide a reasonable basis for our opinion.
Critical Audit Matter
The critical audit matter communicated below is a matter arising from the current-period audit of the financial statements that was communicated or required to be communicated to the audit committee and that (1) relates to accounts or disclosures that are material to the financial statements and (2) involved our especially challenging, subjective, or complex judgments. The communication of critical audit matters does not alter in any way our opinion on the financial statements, taken as a whole, and we are not, by communicating the critical audit matter below, providing a separate opinion on the critical audit matter or on the accounts or disclosures to which it relates.
Regulatory Accounting - Impact of Rate Regulation on the Financial Statements — Refer to Notes 1 and 2 to the Financial Statements.
Critical Audit Matter Description
The Company is subject to cost-of-service regulation and earnings oversight by state and federal utility commissions (collectively, the “Commissions”), which have jurisdiction over the Company’s electric rates in Colorado, Montana, South Dakota and Wyoming and natural gas rates in Arkansas, Colorado, Iowa, Kansas, Nebraska and Wyoming. Management has determined it meets the requirements under accounting principles generally accepted in the United States of America to prepare its financial statements applying the specialized rules to account for the effects of cost-based rate regulation. Accounting for the economics of rate regulation impacts multiple financial statement line items and disclosures, such as property, plant, and equipment; regulatory assets and liabilities; revenue; operating expenses; and income tax benefit (expense).
Rates are regulated on a state-by-state basis by the relevant state regulatory commissions based on an analysis of the costs, as reviewed and approved in a regulatory proceeding. Rate regulation is premised on the full recovery of prudently incurred costs and a reasonable rate of return on invested capital. Decisions to be made by the Commissions in the future will impact the accounting for regulated operations, including decisions about the amount of allowable costs and return on invested capital included in rates and any refunds that may be required. While the Company has indicated its regulatory assets are probable of recovery in current rates or in future proceedings, there is a risk that the Commissions will not judge all costs to have been prudently incurred or that the rate regulation process in which rates are determined will not always result in rates that produce a full recovery of costs and the return on invested capital.
We identified the impact of rate regulation as a critical audit matter due to the significant judgments made by management to support its assertions about impacted account balances and disclosures and the high degree of subjectivity involved in assessing the impact of future regulatory orders on the financial statements. Management judgments include assessing the likelihood of (1) recovery in future rates of incurred costs, and (2) a refund or future rate reduction to be provided to customers. Given the uncertainty of future decisions by the Commissions, auditing these judgments required specialized knowledge of accounting for rate regulation and the rate setting process due to its inherent complexities.
How the Critical Audit Matter Was Addressed in the Audit
Our audit procedures related to the uncertainty of future decisions by the Commissions included the following, among others:
•We tested the effectiveness of management’s controls over the evaluation of the likelihood of (1) the recovery in future rates of costs incurred as property, plant, and equipment and deferred as regulatory assets, and (2) refunds or future reductions in rates that should be reported as regulatory liabilities. We tested the effectiveness of management’s controls over the initial recognition of amounts as property, plant, and equipment; regulatory assets or liabilities; and the monitoring and evaluation of regulatory developments that may affect the likelihood of recovering costs in future rates or of a future reduction in rates.
•We read relevant regulatory orders issued by the Commissions, procedural memorandums, filings made by the Company, and other publicly available information, as appropriate, to assess the likelihood of recovery in future rates or of a future reduction in rates based on precedents of the Commissions’ treatment of similar costs under similar circumstances. We evaluated the external information and compared it to the Company’s recorded regulatory asset and liability balances for completeness and for any evidence that might contradict management’s assertions.
•We obtained and evaluated an analysis from management regarding probability of recovery for regulatory assets or refund or future reduction in rates for regulatory liabilities not yet addressed in a regulatory order to assess management’s assertion that amounts are probable of recovery or of a future reduction in rates.
•We inspected minutes of the board of directors to identify any evidence that may contradict management’s assertions regarding probability of recovery or refunds. We also inquired of management regarding current year rate filings and new regulatory assets or liabilities.
•We evaluated the Company’s disclosures related to the impacts of rate regulation, including the balances recorded and regulatory developments.
/s/ DELOITTE & TOUCHE LLP
Minneapolis, Minnesota
February 26, 2021
We have served as the Company's auditor since 2002.
REPORT OF INDEPENDENT REGISTERED PUBLIC ACCOUNTING FIRM
To the shareholders and the Board of Directors of Black Hills Corporation
Opinion on Internal Control over Financial Reporting
We have audited the internal control over financial reporting of Black Hills Corporation and subsidiaries (the “Company”) as of December 31, 2020, based on criteria established in Internal Control — Integrated Framework (2013) issued by the Committee of Sponsoring Organizations of the Treadway Commission (COSO). In our opinion, the Company maintained, in all material respects, effective internal control over financial reporting as of December 31, 2020, based on criteria established in Internal Control — Integrated Framework (2013) issued by COSO.
We have also audited, in accordance with the standards of the Public Company Accounting Oversight Board (United States) (PCAOB), the consolidated financial statements as of and for the year ended December 31, 2020, of the Company and our report dated February 26, 2021, expressed an unqualified opinion on those financial statements.
Basis for Opinion
The Company’s management is responsible for maintaining effective internal control over financial reporting and for its assessment of the effectiveness of internal control over financial reporting, included in the accompanying Management’sManagement's Report on Internal Control over Financial Reporting. Our responsibility is to express an opinion on the Company'sCompany’s internal control over financial reporting based on our audit. We are a public accounting firm registered with the PCAOB and are required to be independent with respect to the Company in accordance with the U.S. federal securities laws and the applicable rules and regulations of the Securities and Exchange Commission and the PCAOB.
We conducted our audit in accordance with the standards of the PCAOB. Those standards require that we plan and perform the audit to obtain reasonable assurance about whether effective internal control over financial reporting was maintained in all material respects. Our audit included obtaining an understanding of internal control over financial reporting, assessing the risk that a material weakness exists, testing and evaluating the design and operating effectiveness of internal control based on the assessed risk, and performing such other procedures as we considered necessary in the circumstances. We believe that our audit provides a reasonable basis for our opinion.
Definition and Limitations of Internal Control over Financial Reporting
A company’s internal control over financial reporting is a process designed to provide reasonable assurance regarding the reliability of financial reporting and the preparation of financial statements for external purposes in accordance with generally accepted accounting principles. A company’s internal control over financial reporting includes those policies and procedures that (1) pertain to the maintenance of records that, in reasonable detail, accurately and fairly reflect the transactions and dispositions of the assets of the company; (2) provide reasonable assurance that transactions are recorded as necessary to permit preparation of financial statements in accordance with generally accepted accounting principles, and that receipts and expenditures of the company are being made only in accordance with authorizations of management and directors of the company; and (3) provide reasonable assurance regarding prevention or timely detection of unauthorized acquisition, use, or disposition of the company’s assets that could have a material effect on the financial statements.
Because of its inherent limitations, internal control over financial reporting may not prevent or detect misstatements. Also, projections of any evaluation of effectiveness to future periods are subject to the risk that controls may become inadequate because of changes in conditions, or that the degree of compliance with the policies or procedures may deteriorate.
/s/ DELOITTE & TOUCHE LLP
Minneapolis, Minnesota
February 14, 202026, 2021
BLACK HILLS CORPORATION
CONSOLIDATED STATEMENTS OF INCOME
| | | | | | | | | | | |
| Year ended | December 31, 2020 | December 31, 2019 | December 31, 2018 |
| (in thousands, except per share amounts) |
| | | |
| Revenue | $ | 1,696,941 | | $ | 1,734,900 | | $ | 1,754,268 | |
| | | |
| Operating expenses: | | | |
| Fuel, purchased power and cost of natural gas sold | 492,404 | | 570,829 | | 625,610 | |
| Operations and maintenance | 495,404 | | 495,994 | | 481,706 | |
| Depreciation, depletion and amortization | 224,457 | | 209,120 | | 196,328 | |
| Taxes - property and production | 56,373 | | 52,915 | | 51,746 | |
| Other operating expenses | 0 | | 0 | | 1,841 | |
| Total operating expenses | 1,268,638 | | 1,328,858 | | 1,357,231 | |
| | | |
| Operating income | 428,303 | | 406,042 | | 397,037 | |
| | | |
| Other income (expense): | | | |
| Interest expense incurred net of amounts capitalized (including amortization of debt issuance costs, premiums and discounts) | (144,931) | | (139,291) | | (141,616) | |
| Interest income | 1,461 | | 1,632 | | 1,641 | |
| Impairment of investment | (6,859) | | (19,741) | | 0 | |
| Other income (expense), net | (2,293) | | (5,740) | | (1,180) | |
| Total other income (expense) | (152,622) | | (163,140) | | (141,155) | |
| Income before income taxes | 275,681 | | 242,902 | | 255,882 | |
| Income tax benefit (expense) | (32,918) | | (29,580) | | 23,667 | |
| Income from continuing operations | 242,763 | | 213,322 | | 279,549 | |
| Net (loss) from discontinued operations | 0 | | 0 | | (6,887) | |
| Net income | 242,763 | | 213,322 | | 272,662 | |
| Net income attributable to noncontrolling interest | (15,155) | | (14,012) | | (14,220) | |
| Net income available for common stock | $ | 227,608 | | $ | 199,310 | | $ | 258,442 | |
| | | |
| Amounts attributable to common shareholders: | | | |
| Net income from continuing operations | $ | 227,608 | | $ | 199,310 | | $ | 265,329 | |
| Net (loss) from discontinued operations | 0 | | 0 | | (6,887) | |
| Net income available for common stock | $ | 227,608 | | $ | 199,310 | | $ | 258,442 | |
| | | |
| Earnings (loss) per share of common stock, Basic - | | | |
| Earnings from continuing operations | $ | 3.65 | | $ | 3.29 | | $ | 4.88 | |
| (Loss) from discontinued operations | 0 | | 0 | | (0.13) | |
| Total earnings per share of common stock, Basic | $ | 3.65 | | $ | 3.29 | | $ | 4.75 | |
| | | |
| Earnings (loss) per share of common stock, Diluted - | | | |
| Earnings from continuing operations | $ | 3.65 | | $ | 3.28 | | $ | 4.78 | |
| (Loss) from discontinued operations | 0 | | 0 | | (0.12) | |
| Total earnings per share of common stock, Diluted | $ | 3.65 | | $ | 3.28 | | $ | 4.66 | |
| | | |
| Weighted average common shares outstanding: | | | |
| Basic | 62,378 | | 60,662 | | 54,420 | |
| Diluted | 62,439 | | 60,798 | | 55,486 | |
|
| | | | | | | | | |
| Year ended | December 31, 2019 | December 31, 2018 | December 31, 2017 |
| | (in thousands, except per share amounts) |
| | | | |
| Revenue | $ | 1,734,900 |
| $ | 1,754,268 |
| $ | 1,680,266 |
|
| | | | |
| Operating expenses: | | | |
| Fuel, purchased power and cost of natural gas sold | 570,829 |
| 625,610 |
| 563,288 |
|
| Operations and maintenance | 495,994 |
| 481,706 |
| 454,605 |
|
| Depreciation, depletion and amortization | 209,120 |
| 196,328 |
| 188,246 |
|
| Taxes - property and production | 52,915 |
| 51,746 |
| 51,578 |
|
| Other operating expenses | — |
| 1,841 |
| 5,813 |
|
| Total operating expenses | 1,328,858 |
| 1,357,231 |
| 1,263,530 |
|
| | | | |
| Operating income | 406,042 |
| 397,037 |
| 416,736 |
|
| | | | |
| Other income (expense): | | | |
| Interest charges - | | | |
| Interest expense incurred net of amounts capitalized (including amortization of debt issuance costs, premiums and discounts) | (145,847 | ) | (143,720 | ) | (140,533 | ) |
| Allowance for funds used during construction - borrowed | 6,556 |
| 2,104 |
| 2,415 |
|
| Interest income | 1,632 |
| 1,641 |
| 1,016 |
|
| Allowance for funds used during construction - equity | 472 |
| 619 |
| 2,321 |
|
| Impairment of investment | (19,741 | ) | — |
| — |
|
| Other income (expense), net | (6,212 | ) | (1,799 | ) | (213 | ) |
| Total other income (expense) | (163,140 | ) | (141,155 | ) | (134,994 | ) |
| Income before income taxes | 242,902 |
| 255,882 |
| 281,742 |
|
| Income tax benefit (expense) | (29,580 | ) | 23,667 |
| (73,367 | ) |
| Income from continuing operations | 213,322 |
| 279,549 |
| 208,375 |
|
| Net (loss) from discontinued operations | — |
| (6,887 | ) | (17,099 | ) |
| Net income | 213,322 |
| 272,662 |
| 191,276 |
|
| Net income attributable to noncontrolling interest | (14,012 | ) | (14,220 | ) | (14,242 | ) |
| Net income available for common stock | $ | 199,310 |
| $ | 258,442 |
| $ | 177,034 |
|
| | | | |
| Amounts attributable to common shareholders: | | | |
| Net income from continuing operations | $ | 199,310 |
| $ | 265,329 |
| $ | 194,133 |
|
| Net (loss) from discontinued operations | — |
| (6,887 | ) | (17,099 | ) |
| Net income available for common stock | $ | 199,310 |
| $ | 258,442 |
| $ | 177,034 |
|
| | | | |
| Earnings (loss) per share of common stock, Basic - | | | |
| Earnings from continuing operations | $ | 3.29 |
| $ | 4.88 |
| $ | 3.65 |
|
| (Loss) from discontinued operations | — |
| (0.13 | ) | (0.32 | ) |
| Total earnings per share of common stock, Basic | $ | 3.29 |
| $ | 4.75 |
| $ | 3.33 |
|
| | | | |
| Earnings (loss) per share of common stock, Diluted - | | | |
| Earnings from continuing operations | $ | 3.28 |
| $ | 4.78 |
| $ | 3.52 |
|
| (Loss) from discontinued operations | — |
| (0.12 | ) | (0.31 | ) |
| Total earnings per share of common stock, Diluted | $ | 3.28 |
| $ | 4.66 |
| $ | 3.21 |
|
| | | | |
| Weighted average common shares outstanding: | | | |
| Basic | 60,662 |
| 54,420 |
| 53,221 |
|
| Diluted | 60,798 |
| 55,486 |
| 55,120 |
|
BLACK HILLS CORPORATION
CONSOLIDATED STATEMENTS OF COMPREHENSIVE INCOME
| | | | | | | | | | | |
| Year ended | December 31, 2020 | December 31, 2019 | December 31, 2018 |
| (in thousands) |
| Net income | $ | 242,763 | | $ | 213,322 | | $ | 272,662 | |
| | | |
| Other comprehensive income (loss), net of tax: | | | |
| Benefit plan liability adjustments - net gain (loss) (net of tax of $191, $1,886 and $(660), respectively) | (1,062) | | (6,253) | | 2,155 | |
| Benefit plan liability adjustments - prior service costs (net of tax of $0, $2 and $0 respectively) | 0 | | (8) | | 0 | |
| Reclassification adjustment of benefit plan liability - net loss (net of tax of $(958), $434 and $(586), respectively) | 1,429 | | 1,179 | | 1,901 | |
| Reclassification adjustment of benefit plan liability - prior service cost (net of tax of $23, $19 and $43, respectively) | (80) | | (58) | | (135) | |
| Derivative instruments designated as cash flow hedges: | | | |
| Reclassification of net realized (gains) losses on settled/amortized interest rate swaps (net of tax of $(287), $(666) and $(599), respectively) | 2,564 | | 2,185 | | 2,252 | |
| Net unrealized gains (losses) on commodity derivatives (net of tax of $14, $126 and $(228), respectively) | (47) | | (422) | | 755 | |
| Reclassification of net realized (gains) losses on settled commodity derivatives (net of tax of $(96), $55 and $(31), respectively) | 505 | | (362) | | 99 | |
| Other comprehensive income (loss), net of tax | 3,309 | | (3,739) | | 7,027 | |
| | | |
| Comprehensive income | 246,072 | | 209,583 | | 279,689 | |
| Less: comprehensive income attributable to non-controlling interest | (15,155) | | (14,012) | | (14,220) | |
| Comprehensive income available for common stock | $ | 230,917 | | $ | 195,571 | | $ | 265,469 | |
|
| | | | | | | | | |
| Year ended | December 31, 2019 | December 31, 2018 | December 31, 2017 |
| | (in thousands) |
| Net income | $ | 213,322 |
| $ | 272,662 |
| $ | 191,276 |
|
| | | | |
| Other comprehensive income (loss), net of tax: | | | |
| Benefit plan liability adjustments - net gain (loss) (net of tax of $1,886, $(660) and $1,030, respectively) | (6,253 | ) | 2,155 |
| (1,890 | ) |
| Benefit plan liability adjustments - prior service costs (net of tax of $2, $0 and $0, respectively) | (8 | ) | — |
| — |
|
| Reclassification adjustment of benefit plan liability - net loss (net of tax of $434, $(586) and $(585), respectively) | 1,179 |
| 1,901 |
| 1,072 |
|
| Reclassification adjustment of benefit plan liability - prior service cost (net of tax of $19, $43 and $69, respectively) | (58 | ) | (135 | ) | (128 | ) |
| Derivative instruments designated as cash flow hedges: | | | |
| Reclassification of net realized (gains) losses on settled/amortized interest rate swaps (net of tax of $(666), $(599) and$(1,029) , respectively) | 2,185 |
| 2,252 |
| 1,912 |
|
| Net unrealized gains (losses) on commodity derivatives (net of tax of $126, $(228) and $(135), respectively) | (422 | ) | 755 |
| 231 |
|
| Reclassification of net realized (gains) losses on settled commodity derivatives (net of tax of $55, $(31) and $154, respectively) | (362 | ) | 99 |
| (516 | ) |
| Other comprehensive income (loss), net of tax | (3,739 | ) | 7,027 |
| 681 |
|
| | | | |
| Comprehensive income | 209,583 |
| 279,689 |
| 191,957 |
|
| Less: comprehensive income attributable to non-controlling interest | (14,012 | ) | (14,220 | ) | (14,242 | ) |
| Comprehensive income available for common stock | $ | 195,571 |
| $ | 265,469 |
| $ | 177,715 |
|
See Note 16 13for additional disclosures related to Comprehensive Income.
BLACK HILLS CORPORATION
CONSOLIDATED BALANCE SHEETS
| | | | | | | | |
| As of |
| December 31, 2020 | December 31, 2019 |
| (in thousands) |
| ASSETS | | |
| Current assets: | | |
| Cash and cash equivalents | $ | 6,356 | | $ | 9,777 | |
| Restricted cash and equivalents | 4,383 | | 3,881 | |
| Accounts receivable, net | 265,961 | | 255,805 | |
| Materials, supplies and fuel | 117,400 | | 117,172 | |
| Derivative assets, current | 1,848 | | 342 | |
| Income tax receivable, net | 19,446 | | 16,446 | |
| | |
| Regulatory assets, current | 51,676 | | 43,282 | |
| Other current assets | 26,221 | | 26,479 | |
| Total current assets | 493,291 | | 473,184 | |
| | |
| | |
| | |
| Property, plant and equipment | 7,305,530 | | 6,784,679 | |
| Less accumulated depreciation and depletion | (1,285,816) | | (1,281,493) | |
| Total property, plant and equipment, net | 6,019,714 | | 5,503,186 | |
| | |
| Other assets: | | |
| Goodwill | 1,299,454 | | 1,299,454 | |
| Intangible assets, net | 11,944 | | 13,266 | |
| | |
| Regulatory assets, non-current | 226,582 | | 228,062 | |
| Other assets, non-current | 37,801 | | 41,305 | |
| Total other assets, non-current | 1,575,781 | | 1,582,087 | |
| TOTAL ASSETS | $ | 8,088,786 | | $ | 7,558,457 | |
|
| | | | | | |
| | As of |
| | December 31, 2019 | December 31, 2018 |
| | (in thousands) |
| ASSETS | | |
| Current assets: | | |
| Cash and cash equivalents | $ | 9,777 |
| $ | 20,776 |
|
| Restricted cash and equivalents | 3,881 |
| 3,369 |
|
| Accounts receivable, net | 255,805 |
| 269,153 |
|
| Materials, supplies and fuel | 117,172 |
| 117,299 |
|
| Derivative assets, current | 342 |
| 1,500 |
|
| Income tax receivable, net | 16,446 |
| 12,978 |
|
| Regulatory assets, current | 43,282 |
| 48,776 |
|
| Other current assets | 26,479 |
| 29,982 |
|
| Total current assets | 473,184 |
| 503,833 |
|
| | | |
| Investments | 21,929 |
| 41,013 |
|
| | | |
| Property, plant and equipment | 6,784,679 |
| 6,000,015 |
|
| Less accumulated depreciation and depletion | (1,281,493 | ) | (1,145,136 | ) |
| Total property, plant and equipment, net | 5,503,186 |
| 4,854,879 |
|
| | | |
| Other assets: | | |
| Goodwill | 1,299,454 |
| 1,299,454 |
|
| Intangible assets, net | 13,266 |
| 14,337 |
|
| Regulatory assets, non-current | 228,062 |
| 235,459 |
|
| Other assets, non-current | 19,376 |
| 14,352 |
|
| Total other assets, non-current | 1,560,158 |
| 1,563,602 |
|
| TOTAL ASSETS | $ | 7,558,457 |
| $ | 6,963,327 |
|
BLACK HILLS CORPORATION
CONSOLIDATED BALANCE SHEETS
(Continued)
| | | | | | | | |
| As of |
| December 31, 2020 | December 31, 2019 |
| (in thousands, except share amounts) |
| LIABILITIES AND EQUITY | | |
| Current liabilities: | | |
| Accounts payable | $ | 183,340 | | $ | 193,523 | |
| Accrued liabilities | 243,612 | | 226,767 | |
| Derivative liabilities, current | 2,044 | | 2,254 | |
| | |
| Regulatory liabilities, current | 25,061 | | 33,507 | |
| Notes payable | 234,040 | | 349,500 | |
| Current maturities of long-term debt | 8,436 | | 5,743 | |
| Total current liabilities | 696,533 | | 811,294 | |
| | |
| Long-term debt, net of current maturities | 3,528,100 | | 3,140,096 | |
| | |
| Deferred credits and other liabilities: | | |
| Deferred income tax liabilities, net | 408,624 | | 360,719 | |
| | |
| Regulatory liabilities, non-current | 507,659 | | 503,145 | |
| Benefit plan liabilities | 150,556 | | 154,472 | |
| Other deferred credits and other liabilities | 134,667 | | 124,662 | |
| | |
| Total deferred credits and other liabilities | 1,201,506 | | 1,142,998 | |
| | |
Commitments, contingencies and guarantees (Note 3) | 0 | 0 |
| | |
| Equity: | | |
| Stockholders’ equity - | | |
| Common stock $1.00 par value; 100,000,000 shares authorized; issued: 62,827,179 and 61,480,658, respectively | 62,827 | | 61,481 | |
| Additional paid-in capital | 1,657,285 | | 1,552,788 | |
| Retained earnings | 870,738 | | 778,776 | |
| Treasury stock at cost - 32,492 and 3,956, respectively | (2,119) | | (267) | |
| Accumulated other comprehensive income (loss) | (27,346) | | (30,655) | |
| Total stockholders’ equity | 2,561,385 | | 2,362,123 | |
| Noncontrolling interest | 101,262 | | 101,946 | |
| Total equity | 2,662,647 | | 2,464,069 | |
| | |
| TOTAL LIABILITIES AND TOTAL EQUITY | $ | 8,088,786 | | $ | 7,558,457 | |
|
| | | | | | |
| | As of |
| | December 31, 2019 | December 31, 2018 |
| | (in thousands, except share amounts) |
| LIABILITIES AND EQUITY | | |
| Current liabilities: | | |
| Accounts payable | $ | 193,523 |
| $ | 210,609 |
|
| Accrued liabilities | 226,767 |
| 215,501 |
|
| Derivative liabilities, current | 2,254 |
| 947 |
|
| Regulatory liabilities, current | 33,507 |
| 29,810 |
|
| Notes payable | 349,500 |
| 185,620 |
|
| Current maturities of long-term debt | 5,743 |
| 5,743 |
|
| Total current liabilities | 811,294 |
| 648,230 |
|
| | | |
| Long-term debt, net of current maturities | 3,140,096 |
| 2,950,835 |
|
| | | |
| Deferred credits and other liabilities: | | |
| Deferred income tax liabilities, net | 360,719 |
| 311,331 |
|
| Regulatory liabilities, non-current | 503,145 |
| 510,984 |
|
| Benefit plan liabilities | 154,472 |
| 145,147 |
|
| Other deferred credits and other liabilities | 124,662 |
| 109,377 |
|
| Total deferred credits and other liabilities | 1,142,998 |
| 1,076,839 |
|
| | | |
| Commitments and contingencies (See Notes 6, 7, 8, 9, 14, 18, 19, and 20) |
|
|
| | | |
| Equity: | | |
| Stockholders’ equity - | | |
| Common stock $1 par value; 100,000,000 shares authorized; issued: 61,480,658 and 60,048,567, respectively | 61,481 |
| 60,049 |
|
| Additional paid-in capital | 1,552,788 |
| 1,450,569 |
|
| Retained earnings | 778,776 |
| 700,396 |
|
| Treasury stock at cost - 3,956 and 44,253, respectively | (267 | ) | (2,510 | ) |
| Accumulated other comprehensive income (loss) | (30,655 | ) | (26,916 | ) |
| Total stockholders’ equity | 2,362,123 |
| 2,181,588 |
|
| Noncontrolling interest | 101,946 |
| 105,835 |
|
| Total equity | 2,464,069 |
| 2,287,423 |
|
| | | |
| TOTAL LIABILITIES AND TOTAL EQUITY | $ | 7,558,457 |
| $ | 6,963,327 |
|
BLACK HILLS CORPORATION
CONSOLIDATED STATEMENTS OF CASH FLOWS
| | | | | | | | | | | |
| Year ended | December 31, 2020 | December 31, 2019 | December 31, 2018 |
| (in thousands) |
| Operating activities: | | | |
| Net income | $ | 242,763 | | $ | 213,322 | | $ | 272,662 | |
| Loss from discontinued operations, net of tax | 0 | | 0 | | 6,887 | |
| Income from continuing operations | 242,763 | | 213,322 | | 279,549 | |
| Adjustments to reconcile net income to net cash provided by operating activities: | | | |
| Depreciation, depletion and amortization | 224,457 | | 209,120 | | 196,328 | |
| Deferred financing cost amortization | 7,883 | | 7,838 | | 7,845 | |
| Impairment of investment | 6,859 | | 19,741 | | 0 | |
| Stock compensation | 5,373 | | 12,095 | | 12,390 | |
| Deferred income taxes | 38,091 | | 38,020 | | (24,239) | |
| Employee benefit plans | 11,997 | | 12,406 | | 14,068 | |
| Other adjustments, net | 11,669 | | 16,485 | | 5,836 | |
| Change in certain operating assets and liabilities: | | | |
| Materials, supplies and fuel | 2,755 | | 2,052 | | (2,919) | |
| Accounts receivable and other current assets | (10,843) | | 7,578 | | (45,966) | |
| Accounts payable and other current liabilities | 24,659 | | (34,906) | | 5,305 | |
| Regulatory assets - current | (5,047) | | 23,619 | | 33,608 | |
| Regulatory liabilities - current | (10,706) | | (15,158) | | 18,533 | |
| Contributions to defined benefit pension plans | (12,700) | | (12,700) | | (12,700) | |
| Other operating activities, net | 4,653 | | 6,001 | | 6,689 | |
| Net cash provided by operating activities of continuing operations | 541,863 | | 505,513 | | 494,327 | |
| Net cash provided by (used in) operating activities of discontinued operations | 0 | | 0 | | (5,516) | |
| Net cash provided by operating activities | 541,863 | | 505,513 | | 488,811 | |
| | | |
| Investing activities: | | | |
| Property, plant and equipment additions | (767,404) | | (818,376) | | (457,524) | |
| Purchase of investment | 0 | | 0 | | (24,429) | |
| Other investing activities | 5,740 | | 2,166 | | (4,281) | |
| Net cash (used in) investing activities of continuing operations | (761,664) | | (816,210) | | (486,234) | |
| Net cash provided by investing activities of discontinued operations | 0 | | 0 | | 20,385 | |
| Net cash (used in) investing activities | (761,664) | | (816,210) | | (465,849) | |
| | | |
| Financing activities: | | | |
| Dividends paid on common stock | (135,439) | | (124,647) | | (106,591) | |
| Common stock issued | 99,278 | | 101,358 | | 300,834 | |
| Net (payments) borrowings of short-term debt | (115,460) | | 163,880 | | (25,680) | |
| Long-term debt - issuance | 400,000 | | 1,100,000 | | 700,000 | |
| Long-term debt - repayments | (8,597) | | (905,743) | | (854,743) | |
| Distributions to noncontrolling interests | (15,839) | | (17,901) | | (19,617) | |
| Other financing activities | (7,061) | | (16,737) | | (11,260) | |
| Net cash provided by (used in) financing activities | 216,882 | | 300,210 | | (17,057) | |
| | | |
| Net change in cash, restricted cash and cash equivalents | (2,919) | | (10,487) | | 5,905 | |
| | | |
| Cash, restricted cash and cash equivalents beginning of year | 13,658 | | 24,145 | | 18,240 | |
| Cash, restricted cash and cash equivalents end of year | $ | 10,739 | | $ | 13,658 | | $ | 24,145 | |
| | | |
| Supplemental cash flow information: | | | |
| Cash (paid) refunded during the period for continuing operations: | | | |
| Interest (net of amounts capitalized) | $ | (136,549) | | $ | (131,774) | | $ | (137,965) | |
| Income taxes | $ | 2,172 | | $ | 4,682 | | $ | (14,730) | |
| | | |
| Non-cash investing and financing activities from continuing operations: | | | |
| Accrued property, plant and equipment purchases at December 31 | $ | 72,215 | | $ | 91,491 | | $ | 69,017 | |
| Increase in capitalized assets associated with asset retirement obligations | $ | 4,774 | | $ | 5,044 | | $ | 2,625 | |
|
| | | | | | | | | |
| Year ended | December 31, 2019 | December 31, 2018 | December 31, 2017 |
| | (in thousands) |
| Operating activities: | | | |
| Net income | $ | 213,322 |
| $ | 272,662 |
| $ | 191,276 |
|
| Loss from discontinued operations, net of tax | — |
| 6,887 |
| 17,099 |
|
| Income from continuing operations | 213,322 |
| 279,549 |
| 208,375 |
|
| Adjustments to reconcile net income to net cash provided by operating activities: | | | |
| Depreciation, depletion and amortization | 209,120 |
| 196,328 |
| 188,246 |
|
| Deferred financing cost amortization | 7,838 |
| 7,845 |
| 8,261 |
|
| Impairment of investment | 19,741 |
| — |
| — |
|
| Stock compensation | 12,095 |
| 12,390 |
| 7,626 |
|
| Deferred income taxes | 38,020 |
| (24,239 | ) | 80,992 |
|
| Employee benefit plans | 12,406 |
| 14,068 |
| 10,141 |
|
| Other adjustments, net | 16,485 |
| 5,836 |
| (4,773 | ) |
| Change in certain operating assets and liabilities: | | | |
| Materials, supplies and fuel | 2,052 |
| (2,919 | ) | (10,089 | ) |
| Accounts receivable and other current assets | 7,578 |
| (45,966 | ) | 4,534 |
|
| Accounts payable and other current liabilities | (34,906 | ) | 5,305 |
| (28,222 | ) |
| Regulatory assets - current | 23,619 |
| 33,608 |
| (15,407 | ) |
| Regulatory liabilities - current | (15,158 | ) | 18,533 |
| (4,536 | ) |
| Contributions to defined benefit pension plans | (12,700 | ) | (12,700 | ) | (27,700 | ) |
| Other operating activities, net | 6,001 |
| 6,689 |
| (8,418 | ) |
| Net cash provided by operating activities of continuing operations | 505,513 |
| 494,327 |
| 409,030 |
|
| Net cash provided by (used in) operating activities of discontinued operations | — |
| (5,516 | ) | 19,231 |
|
| Net cash provided by operating activities | 505,513 |
| 488,811 |
| 428,261 |
|
| | | | |
| Investing activities: | | | |
| Property, plant and equipment additions | (818,376 | ) | (457,524 | ) | (326,010 | ) |
| Purchase of investment | — |
| (24,429 | ) | — |
|
| Other investing activities | 2,166 |
| (4,281 | ) | 1,011 |
|
| Net cash (used in) investing activities of continuing operations | (816,210 | ) | (486,234 | ) | (324,999 | ) |
| Net cash provided by investing activities of discontinued operations | — |
| 20,385 |
| 7,881 |
|
| Net cash (used in) investing activities | (816,210 | ) | (465,849 | ) | (317,118 | ) |
| | | | |
| Financing activities: | | | |
| Dividends paid on common stock | (124,647 | ) | (106,591 | ) | (96,744 | ) |
| Common stock issued | 101,358 |
| 300,834 |
| 4,408 |
|
| Net (payments) borrowings of short-term debt | 163,880 |
| (25,680 | ) | 114,700 |
|
| Long-term debt - issuance | 1,100,000 |
| 700,000 |
| — |
|
| Long-term debt - repayments | (905,743 | ) | (854,743 | ) | (105,743 | ) |
| Distributions to noncontrolling interests | (17,901 | ) | (19,617 | ) | (18,397 | ) |
| Other financing activities | (16,737 | ) | (11,260 | ) | (6,919 | ) |
| Net cash provided by (used in) financing activities | 300,210 |
| (17,057 | ) | (108,695 | ) |
| | | | |
| Net change in cash, restricted cash and cash equivalents | (10,487 | ) | 5,905 |
| 2,448 |
|
| | | | |
| Cash, restricted cash and cash equivalents beginning of year | 24,145 |
| 18,240 |
| 15,792 |
|
| Cash, restricted cash and cash equivalents end of year | $ | 13,658 |
| $ | 24,145 |
| $ | 18,240 |
|
See Note 17 for supplemental disclosure of cash flow information.
BLACK HILLS CORPORATION
CONSOLIDATED STATEMENTS OF EQUITY
|
| | | | | | | | | | | | | | | | | | | | | | | | | |
| | Common Stock | Treasury Stock | | | | | |
| (in thousands except share amounts) | Shares | Value | Shares | Value | Additional Paid in Capital | Retained Earnings | AOCI | Non controlling Interest | Total |
| Balance at December 31, 2016 | 53,397,467 |
| $ | 53,397 |
| 15,258 |
| $ | (791 | ) | $ | 1,138,982 |
| $ | 457,934 |
| $ | (34,883 | ) | $ | 115,495 |
| $ | 1,730,134 |
|
| Net income (loss) available for common stock | — |
| — |
| — |
| — |
| — |
| 177,034 |
| — |
| 14,242 |
| 191,276 |
|
| Other comprehensive income (loss), net of tax | — |
| — |
| — |
| — |
| — |
| — |
| 681 |
| — |
| 681 |
|
| Reclassification of certain tax effects from AOCI | — |
| — |
| — |
| — |
| — |
| 7,000 |
| (7,000 | ) | — |
| — |
|
| Dividends on common stock | — |
| — |
| — |
| — |
| — |
| (96,744 | ) | — |
| — |
| (96,744 | ) |
| Share-based compensation | 134,266 |
| 134 |
| 23,806 |
| (1,515 | ) | 8,948 |
| — |
| — |
| — |
| 7,567 |
|
| Tax effect of share-based compensation | — |
| — |
| — |
| — |
| 533 |
| 3,184 |
| — |
| — |
| 3,717 |
|
| Issuance costs | — |
| — |
| — |
| — |
| (189 | ) | — |
| — |
| — |
| (189 | ) |
| Dividend reinvestment and stock purchase plan | 48,253 |
| 49 |
| — |
| — |
| 3,107 |
| — |
| — |
| — |
| 3,156 |
|
| Distributions to noncontrolling interest | — |
| — |
| — |
| — |
| (1,096 | ) | 209 |
| — |
| (18,505 | ) | (19,392 | ) |
| Balance at December 31, 2017 | 53,579,986 |
| $ | 53,580 |
| 39,064 |
| $ | (2,306 | ) | $ | 1,150,285 |
| $ | 548,617 |
| $ | (41,202 | ) | $ | 111,232 |
| $ | 1,820,206 |
|
| Net income (loss) available for common stock | — |
| — |
| — |
| — |
| — |
| 258,442 |
| — |
| 14,220 |
| 272,662 |
|
| Other comprehensive income (loss), net of tax | — |
| — |
| — |
| — |
| — |
| — |
| 7,027 |
| — |
| 7,027 |
|
| Reclassification of certain tax effects from AOCI | — |
| — |
| — |
| — |
| — |
| — |
| 740 |
| — |
| 740 |
|
| Reclassification to regulatory asset | — |
| — |
| — |
| — |
| — |
| — |
| 6,519 |
| — |
| 6,519 |
|
| Dividends on common stock | — |
| — |
| — |
| — |
| — |
| (106,591 | ) | — |
| — |
| (106,591 | ) |
| Share-based compensation | 92,830 |
| 93 |
| 5,189 |
| (204 | ) | 7,301 |
| — |
| — |
| — |
| 7,190 |
|
| Issuance of common stock | 6,371,690 |
| 6,372 |
| — |
| — |
| 292,628 |
| — |
| — |
| — |
| 299,000 |
|
| Issuance costs | — |
| — |
| — |
| — |
| (15 | ) | — |
| — |
| — |
| (15 | ) |
| Dividend reinvestment and stock purchase plan | 4,061 |
| 4 |
| — |
| — |
| 216 |
| — |
| — |
| — |
| 220 |
|
| Other stock transactions | — |
| — |
| — |
| — |
| 154 |
| (72 | ) | — |
| — |
| 82 |
|
| Redemption of and distributions to noncontrolling interest | — |
| — |
| — |
| — |
| — |
| — |
| — |
| (19,617 | ) | (19,617 | ) |
| Balance at December 31, 2018 | 60,048,567 |
| $ | 60,049 |
| 44,253 |
| $ | (2,510 | ) | $ | 1,450,569 |
| $ | 700,396 |
| $ | (26,916 | ) | $ | 105,835 |
| $ | 2,287,423 |
|
| Net income (loss) available for common stock | — |
| — |
| — |
| — |
| — |
| 199,310 |
| — |
| 14,012 |
| 213,322 |
|
| Other comprehensive income (loss), net of tax | — |
| — |
| — |
| — |
| — |
| — |
| (3,739 | ) | — |
| (3,739 | ) |
| Dividends on common stock | — |
| — |
| — |
| — |
| — |
| (124,647 | ) | — |
| — |
| (124,647 | ) |
| Share-based compensation | 103,759 |
| 104 |
| (40,297 | ) | 2,243 |
| 4,729 |
| — |
| — |
| — |
| 7,076 |
|
| Issuance of common stock | 1,328,332 |
| 1,328 |
| — |
| — |
| 98,672 |
| — |
| — |
| — |
| 100,000 |
|
| Issuance costs | — |
| — |
| — |
| — |
| (1,182 | ) | — |
| — |
| — |
| (1,182 | ) |
| Other | — |
| — |
| — |
| — |
| — |
| 327 |
| — |
| — |
| 327 |
|
| Implementation of ASU 2016-02 Leases | — |
| — |
| — |
| — |
| — |
| 3,390 |
| — |
| — |
| 3,390 |
|
| Distributions to noncontrolling interest | — |
| — |
| — |
| — |
| — |
| — |
| — |
| (17,901 | ) | (17,901 | ) |
| Balance at December 31, 2019 | 61,480,658 |
| $ | 61,481 |
| 3,956 |
| $ | (267 | ) | $ | 1,552,788 |
| $ | 778,776 |
| $ | (30,655 | ) | $ | 101,946 |
| $ | 2,464,069 |
|
__________________ | | | | | | | | | | | | | | | | | | | | | | | | | | | | | |
| Common Stock | Treasury Stock | | | | | |
| (in thousands except share amounts) | Shares | Value | Shares | Value | Additional Paid in Capital | Retained Earnings | AOCI | Non controlling Interest | Total |
| Balance at December 31, 2017 | 53,579,986 | | $ | 53,580 | | 39,064 | | $ | (2,306) | | $ | 1,150,285 | | $ | 548,617 | | $ | (41,202) | | $ | 111,232 | | $ | 1,820,206 | |
| Net income available for common stock | — | | — | | — | | — | | — | | 258,442 | | — | | 14,220 | | 272,662 | |
| Other comprehensive income (loss), net of tax | — | | — | | — | | — | | — | | — | | 7,027 | | — | | 7,027 | |
| Reclassification of certain tax effects from AOCI | — | | — | | — | | — | | — | | — | | 740 | | — | | 740 | |
| Reclassification to regulatory asset | — | | — | | — | | — | | — | | — | | 6,519 | | — | | 6,519 | |
| Dividends on common stock ($1.93 per share) | — | | — | | — | | — | | — | | (106,591) | | — | | — | | (106,591) | |
| Share-based compensation | 92,830 | | 93 | | 5,189 | | (204) | | 7,301 | | — | | — | | — | | 7,190 | |
| | | | | | | | | |
| Issuance of common stock | 6,371,690 | | 6,372 | | — | | — | | 292,628 | | — | | — | | — | | 299,000 | |
| Issuance costs | — | | — | | — | | — | | (15) | | — | | — | | — | | (15) | |
| Dividend reinvestment and stock purchase plan | 4,061 | | 4 | | — | | — | | 216 | | — | | — | | — | | 220 | |
| Other stock transactions | — | | — | | — | | — | | 154 | | (72) | | — | | — | | 82 | |
| Distributions to noncontrolling interest | — | | — | | — | | — | | — | | — | | — | | (19,617) | | (19,617) | |
| Balance at December 31, 2018 | 60,048,567 | | $ | 60,049 | | 44,253 | | $ | (2,510) | | $ | 1,450,569 | | $ | 700,396 | | $ | (26,916) | | $ | 105,835 | | $ | 2,287,423 | |
| Net income available for common stock | — | | — | | — | | — | | — | | 199,310 | | — | | 14,012 | | 213,322 | |
| Other comprehensive income (loss), net of tax | — | | — | | — | | — | | — | | — | | (3,739) | | — | | (3,739) | |
| Dividends on common stock ($2.05 per share) | — | | — | | — | | — | | — | | (124,647) | | — | | — | | (124,647) | |
| Share-based compensation | 103,759 | | 104 | | (40,297) | | 2,243 | | 4,729 | | — | | — | | — | | 7,076 | |
| | | | | | | | | |
| Issuance of common stock | 1,328,332 | | 1,328 | | — | | — | | 98,672 | | — | | — | | — | | 100,000 | |
| Issuance costs | — | | — | | — | | — | | (1,182) | | — | | — | | — | | (1,182) | |
| | | | | | | | | |
| Other | — | | — | | — | | — | | — | | 327 | | — | | — | | 327 | |
| Implementation of ASU 2016-02 Leases | — | | — | | — | | — | | — | | 3,390 | | — | | — | | 3,390 | |
| Distributions to noncontrolling interest | — | | — | | — | | — | | — | | — | | — | | (17,901) | | (17,901) | |
| Balance at December 31, 2019 | 61,480,658 | | $ | 61,481 | | 3,956 | | $ | (267) | | $ | 1,552,788 | | $ | 778,776 | | $ | (30,655) | | $ | 101,946 | | $ | 2,464,069 | |
| Net income available for common stock | — | | — | | — | | — | | — | | 227,608 | | — | | 15,155 | | 242,763 | |
| Other comprehensive income (loss), net of tax | — | | — | | — | | — | | — | | — | | 3,309 | | — | | 3,309 | |
| Dividends on common stock ($2.17 per share) | — | | — | | — | | — | | — | | (135,439) | | — | | — | | (135,439) | |
| Share-based compensation | 123,578 | | 123 | | 28,536 | | (1,852) | | 6,923 | | — | | — | | — | | 5,194 | |
| | | | | | | | | |
| Issuance of common stock | 1,222,943 | | 1,223 | | — | | — | | 98,777 | | — | | — | | — | | 100,000 | |
| Issuance costs | — | | — | | — | | — | | (1,203) | | — | | — | | — | | (1,203) | |
| | | | | | | | | |
| Implementation of ASU 2016-13 Financial Instruments - - Credit Losses | — | | — | | — | | — | | — | | (207) | | — | | — | | (207) | |
| | | | | | | | | |
| Distributions to noncontrolling interest | — | | — | | — | | — | | — | | — | | — | | (15,839) | | (15,839) | |
| Balance at December 31, 2020 | 62,827,179 | | $ | 62,827 | | 32,492 | | $ | (2,119) | | $ | 1,657,285 | | $ | 870,738 | | $ | (27,346) | | $ | 101,262 | | $ | 2,662,647 | |
Dividends per share paid were $2.05, $1.93 and $1.81 for the years ended December 31, 2019, 2018 and 2017, respectively.
BLACK HILLS CORPORATION
NOTES TO THE CONSOLIDATED FINANCIAL STATEMENTSNotes to Consolidated Financial Statements
December 31, 2020, 2019, 2018 and 2018
2017
(1) BUSINESS DESCRIPTION AND SIGNIFICANT ACCOUNTING POLICIES | |
| BUSINESS DESCRIPTION AND SIGNIFICANT ACCOUNTING POLICIES |
Business Description
Black Hills Corporation is a customer-focused, growth-oriented utility company headquartered in Rapid City, South Dakota. We are a holding company that, through our subsidiaries, conducts our operations through the following reportable segments: Electric Utilities, Gas Utilities, Power Generation and Mining. Certain unallocated corporate expenses that support our operating segments are presented as Corporate and Other.
Segment Reporting
Our reportable segments are based on our method of internal reporting, which is generally segregated by differences in products, services and regulation. All of our operations and assets are located within the United States.
Our Electric Utilities segment includes the operating results of the regulated electric utility operations of Colorado Electric, South Dakota Electric, and Wyoming Electric, which supply regulated electric utility services to areas in Colorado, Montana, South Dakota and Wyoming. Our Gas Utilities segment consists of the operating results of our regulated natural gas utility subsidiaries in Arkansas, Colorado, Iowa, Kansas, Nebraska and Wyoming.
MostBoth of our non-utility business segments support our Electric Utilities. Our Power Generation segment, which is conducted through Black Hills Electric Generation and its subsidiaries, engages in independent power generation activities in Colorado, Iowa and Wyoming. Our Mining segment, which is conducted through WRDC, engages in coal mining activities located near Gillette, Wyoming. For further descriptions of our reportable business segments, see Note 518.
On November 1, 2017, our Board of Directors approved a complete divestiture of our Oil and Gas segment. We completed the divestiture of our Oil and Gas segment in 2018. The Oil and Gas segment assets and liabilities were classified as held for sale and the results of operations were shown in income (loss) from discontinued operations, other than certain general and administrative costs and interest expense which did not meet the criteria for income (loss) from discontinued operations in 2018 or 2017. At the time the assets were classified as held for sale, depreciation, depletion and amortization expenses were no longer recorded.operations. Unless otherwise noted, the amounts presented in the accompanying notesNotes to the consolidated financial statementsConsolidated Financial Statements relate to the Company’s continuing operations. For more information on discontinued operations, see Note 21.
Use of Estimates and Basis of Presentation
The preparation of financial statements in conformity with GAAP requires management to make estimates and assumptions that affect the reported amounts of certain assets and liabilities and disclosure of contingent assets and liabilities at the date of the financial statements and the reported amounts of revenues and expenses during the reporting period. Changes in facts and circumstances or additional information may result in revised estimates and actual results could differ materially from those estimates.
COVID-19 Pandemic
In March 2020, the World Health Organization categorized COVID-19 as a pandemic and the President of the United States declared the outbreak a national emergency. The U.S. government has deemed electric and natural gas utilities to be critical infrastructure sectors that provide essential services during this emergency. As a provider of essential services, the Company has an obligation to provide services to our customers. The Company remains focused on protecting the health of our customers, employees and the communities in which we operate while assuring the continuity of our business operations.
The Company’s Consolidated Financial Statements reflect estimates and assumptions made by management that affect the reported amounts of assets and liabilities and disclosure of contingent assets and liabilities at the date of the Consolidated Financial Statements and reported amounts of revenue and expenses during the reporting periods presented. The Company considered the impacts of COVID-19 on the assumptions and estimates used and determined that, for the year ended December 31, 2020, there were no material adverse impacts on the Company’s results of operations.
Principles of Consolidation
The consolidated financial statements include the accounts of Black Hills Corporation and its wholly-owned and majority-owned and controlled subsidiaries. All intercompany balances and transactions have been eliminated in consolidation. For additional information on intercompany revenues, see Note 518.
Our Consolidated Statements of Income include operating activity of acquired companies beginning with their acquisition date. We use the proportionate consolidation method to account for our ownership interest in any jointly-owned electric utility generatinggeneration facility, wind projectfarm or transmission tie. See Note 46 for additional information.
Variable Interest Entities
We evaluate arrangements and contracts with other entities to determine if they are VIEs and if we are the primary beneficiary. GAAP provides a framework for identifying VIEs and determining when a company should include the assets, liabilities, noncontrolling interest and results of activities of a VIE in its consolidated financial statements.
A VIE should be consolidated if a party with an ownership, contractual or other financial interest in the VIE (a variable interest holder) has the power to direct the VIE’s most significant activities and the obligation to absorb losses or right to receive benefits of the VIE that could be significant to the VIE. A variable interest holder that consolidates the VIE is called the primary beneficiary. Upon consolidation, the primary beneficiary generally must initially record all of the VIE’s assets, liabilities and noncontrolling interests at fair value and subsequently account for the VIE as if it were consolidated.
Our evaluation of whether our interest qualifies as the primary beneficiary of a VIE involves significant judgments, estimates and assumptions and includes a qualitative analysis of the activities that most significantly impact the VIE’s economic performance and whether the Company has the power to direct those activities, the design of the entity, the rights of the parties and the purpose of the arrangement. Black Hills Colorado IPP is a VIE. See additional information in Note 1214.
Cash and Cash Equivalents and Restricted Cash
We consider all highly liquid investments with an original maturity of three months or less to be cash and cash equivalents. We maintain cash accounts for various specified purposes, which are classified as restricted cash.
Accounts Receivable and Allowance for Doubtful AccountsCredit Losses
Accounts receivable for our Electric and Gas Utilities business segments primarily consists of sales to residential, commercial, industrial, municipaltransportation and other customers, all of which do not bear interest. These accounts receivable are stated at billed and estimated unbilled amounts, net of write-offs and allowance for doubtful accounts.credit losses. Accounts receivable for our Power Generation and Mining business segments consists of amounts due from sales of electric energy and capacity and coal.coal primarily to affiliates or regional utilities.
We maintain an allowance for doubtful accountscredit losses which reflects our estimate of uncollectible trade receivables. We regularly review our trade receivable allowance by considering such factors as historical experience, credit worthiness, the age of the receivable balances and current economic conditions that may affect collectibility.
In specific cases where we are aware of a customer’s inability or reluctance to pay, we record an allowance for doubtful accountscredit losses to reduce the net receivable balance to the amount we reasonably expect to collect. However, if circumstances change, our estimate of the recoverability of accounts receivable could be affected. Circumstances which could affect our estimates include, but are not limited to, customer credit issues, expected losses, the level of commodity prices, customer deposits and general economic conditions. Accounts are written off once they are deemed to be uncollectible or the time allowed for dispute under the contract has expired.
We utilize master netting agreements which consist of an agreement between two parties who have multiple contracts with each other that provide for the net settlement of all contracts in the event of default on or termination of any one contract. When the right of offset exists, accounting standards permit the netting of receivables and payables under a legally enforceable master netting agreement between counterparties. Accounting standards also permit offsetting of fair value amounts recognized for the right to reclaim, or the obligation to return, cash collateral against fair value amounts recognized for derivative instruments executed with the same counterparty.
Following is a summary of accounts receivable as of December 31 (in thousands):
| | | | | | | | | | | | | | |
| 2020 | Billed Accounts Receivable | Unbilled Revenue | Less Allowance for Credit Losses | Accounts Receivable, net |
| Electric Utilities | $ | 45,841 | | $ | 32,915 | | $ | (1,269) | | $ | 77,487 | |
| Gas Utilities | 95,592 | | 93,150 | | (5,734) | | 183,008 | |
| Power Generation | 1,837 | | 0 | | 0 | | 1,837 | |
| Mining | 2,511 | | 0 | | 0 | | 2,511 | |
| Corporate | 1,118 | | 0 | | 0 | | 1,118 | |
| Total | $ | 146,899 | | $ | 126,065 | | $ | (7,003) | | $ | 265,961 | |
| | | 2019 | Accounts Receivable, Trade | Unbilled Revenue | Less Allowance for Doubtful Accounts | Accounts Receivable, net | 2019 | Billed Accounts Receivable | Unbilled Revenue | Less Allowance for Credit Losses | Accounts Receivable, net |
| Electric Utilities | $ | 41,428 |
| $ | 33,886 |
| $ | (592 | ) | $ | 74,722 |
| Electric Utilities | $ | 41,428 | | $ | 33,886 | | $ | (592) | | $ | 74,722 | |
| Gas Utilities | 97,607 |
| 79,616 |
| (1,683 | ) | 175,540 |
| Gas Utilities | 97,607 | | 79,616 | | (1,683) | | 175,540 | |
| Power Generation | 2,164 |
| — |
| — |
| 2,164 |
| Power Generation | 2,164 | | 0 | | 0 | | 2,164 | |
| Mining | 2,277 |
| — |
| — |
| 2,277 |
| Mining | 2,277 | | 0 | | 0 | | 2,277 | |
| Corporate | 1,271 |
| — |
| (169 | ) | 1,102 |
| Corporate | 1,271 | | 0 | | (169) | | 1,102 | |
| Total | $ | 144,747 |
| $ | 113,502 |
| $ | (2,444 | ) | $ | 255,805 |
| Total | $ | 144,747 | | $ | 113,502 | | $ | (2,444) | | $ | 255,805 | |
|
| | | | | | | | | | | | |
| 2018 | Accounts Receivable, Trade | Unbilled Revenue | Less Allowance for Doubtful Accounts | Accounts Receivable, net |
| Electric Utilities | $ | 39,721 |
| $ | 35,125 |
| $ | (448 | ) | $ | 74,398 |
|
| Gas Utilities | 96,123 |
| 90,521 |
| (2,592 | ) | 184,052 |
|
| Power Generation | 1,876 |
| — |
| — |
| 1,876 |
|
| Mining | 3,988 |
| — |
| — |
| 3,988 |
|
| Corporate | 5,008 |
| — |
| (169 | ) | 4,839 |
|
| Total | $ | 146,716 |
| $ | 125,646 |
| $ | (3,209 | ) | $ | 269,153 |
|
Changes to allowance for doubtful accountscredit losses for the years ended December 31, were as follows (in thousands):
| | | | | | | | | | | | | | | | | | | | | | | | | | | | | | | | | | |
| | Balance at Beginning of Year | | | | Additions Charged to Costs and Expenses | | Recoveries and Other Additions | | Write-offs and Other Deductions | | Balance at End of Year |
| 2020 | | $ | 2,444 | | | | | $ | 8,927 | | (a) | $ | 4,728 | | | $ | (9,096) | | | $ | 7,003 | |
| 2019 | | $ | 3,209 | | | | | $ | 5,795 | | | $ | 3,942 | | | $ | (10,502) | | | $ | 2,444 | |
| 2018 | | $ | 3,081 | | | | | $ | 6,859 | | | $ | 4,092 | | | $ | (10,823) | | | $ | 3,209 | |
|
| | | | | | | | | | | | | | | | | | | | |
| | | Balance at Beginning of Year | | Additions Charged to Costs and Expenses | | Recoveries and Other Additions | | Write-offs and Other Deductions | | Balance at End of Year |
| 2019 | | $ | 3,209 |
| | $ | 5,795 |
| | $ | 3,942 |
| | $ | (10,502 | ) | | $ | 2,444 |
|
| 2018 | | $ | 3,081 |
| | $ | 6,859 |
| | $ | 4,092 |
| | $ | (10,823 | ) | | $ | 3,209 |
|
| 2017 | | $ | 2,392 |
| | $ | 4,926 |
| | $ | 8,262 |
| | $ | (12,499 | ) | | $ | 3,081 |
|
(a) Due to the COVID-19 pandemic, all of our jurisdictions temporarily suspended disconnections due to non-payment for a period of time, which increased our accounts receivable arrears balances. As a result, we increased our allowance for credit losses and bad debt expense for the year ended December 31, 2020 by an incremental $3.3 million. The ongoing credit evaluation of our customers during the COVID-19 pandemic is further discussed in the Credit Risk section of Note 11.
Materials, Supplies and Fuel
The following amounts by major classification are included in Materials, supplies and fuel on the accompanying Consolidated Balance Sheets as of December 31 (in thousands):
| | | | | | | | |
| 2020 | 2019 |
| Materials and supplies | $ | 85,250 | | $ | 82,809 | |
| Fuel | 1,531 | | 2,425 | |
| Natural gas in storage | 30,619 | | 31,938 | |
| Total materials, supplies and fuel | $ | 117,400 | | $ | 117,172 | |
|
| | | | | | |
| | 2019 | 2018 |
| Materials and supplies | $ | 82,809 |
| $ | 75,081 |
|
| Fuel - Electric Utilities | 2,425 |
| 2,850 |
|
| Natural gas in storage | 31,938 |
| 39,368 |
|
| Total materials, supplies and fuel | $ | 117,172 |
| $ | 117,299 |
|
Materials and supplies represent parts and supplies for all of our business segments. Fuel -represents diesel oil and gas used by our Electric Utilities represents oil, gas and coal on hand used to produce power. Natural gas in storage primarily represents gas purchased for use by our gas customers. All of our Materials, supplies and fuel are recorded using the weighted-average cost method and are valued at the lower-of-cost or net realizable value. The value of our Naturalnatural gas in storage fluctuates with seasonal volume requirements of our business and the commodity price of natural gas.
Investments
In February 2018, we made a contribution of $28 million of assets in exchange for equity securities in a privately held oil and gas company as we divested of our Oil and Gas segment. The carrying value of our investment in the equity securities was recorded at cost. We review this investment on a periodic basis to determine whether a significant event or change in circumstances has occurred that may have an adverse effect on the value of the investment.
During the third quarter of 2019, we assessed our investment for impairment as a result of a deterioration in earnings performance of the privately held oil and gas company and an adverse change in future natural gas prices. We engaged a third-party valuation consultant to estimate the fair value of our investment. The valuation was primarily based on an income approach but also considered a market valuation approach. The significant inputs used to estimate the fair value were the oil and gas reserve quantities and values utilizing forward market price curves, industry standard reserve adjustment factors and a discount rate of 10%. Based on the results of the valuation, we concluded that the carrying value of the investment exceeded fair value. As a result, we recorded a pre-tax impairment loss of $20 million for the three months ended September 30, 2019, which was the difference between the carrying amount and the fair value of the investment.investment at that time.
During the first quarter of 2020, we assessed our investment for impairment as a result of continued adverse changes in future natural gas prices and liquidity concerns at the privately held oil and gas company. We performed an internal analysis to compute the fair value of our investment, utilizing a consistent methodology as applied during the third quarter of 2019. Based on the results of the valuation, we concluded that the carrying value of the investment exceeded fair value. As a result, we recorded a pre-tax impairment loss of $6.9 million for the three months ended March 31, 2020, which was the difference between the carrying value and the fair value of the investment at that time.
The following table presents the carrying value of our investments (in thousands), which are included in Other assets, non-current on the Consolidated Balance Sheets, as of December 31:
| | | | | | | | |
| 2020 | 2019 |
| Investment in privately held oil and gas company | $ | 1,500 | | $ | 8,359 | |
| Cash surrender value of life insurance contracts | 13,628 | | 13,056 | |
| Other investments | 682 | | 514 | |
| Total investments | $ | 15,810 | | $ | 21,929 | |
|
| | | | | | |
| | 2019 | 2018 |
| Investment in privately held oil and gas company | $ | 8,359 |
| $ | 28,100 |
|
| Cash surrender value of life insurance contracts | 13,056 |
| 12,812 |
|
| Other investments | 514 |
| 101 |
|
| Total investments | $ | 21,929 |
| $ | 41,013 |
|
Property, Plant and Equipment
Additions to property, plant and equipment are recorded at cost. Included in the cost of regulated construction projects is AFUDC, when applicable, which represents the approximate composite cost of borrowed funds and a return on equity used to finance a regulated utility project. We also capitalize interest, when applicable, on undeveloped leasehold costs and certain non-regulated construction projects. In addition, asset retirement costs associated with tangible long-lived regulated utility assets are recognized as liabilities with an increase to the carrying amounts of the related long-lived regulated utility assets in the period incurred. The amounts capitalized are included in Property, plant and equipment on the accompanying Consolidated Balance Sheets. We also classify our stored natural gas base or “Cushion gas”Cushion Gas as property, plant and equipment.
The cost of regulated utility property, plant and equipment retired, or otherwise disposed of in the ordinary course of business, less salvage plus retirement costs, is charged to accumulated depreciation. Estimated removal costs associated with non-legal retirement obligations related to our regulated properties that do not have legal retirement obligations are reclassified from accumulated depreciation and reflected as regulatory liabilities. Retirement or disposal of all other assets result in gains or losses recognized as a component of operating income. Ordinary repairs and maintenance of property, except as allowed under rate regulations, are charged to operations as incurred.
Depreciation provisions for property, plant and equipment are generally computed on a straight-line basis based on the applicable estimated service life of the various classes of property. The composite depreciation method is applied to regulated utility property. Capitalized mining costs and coal leases are amortized on a unit-of-production method based on volumes produced and estimated reserves. For certain non-utility power plant components, depreciation is computed on a unit-of-production methodology based on plant hours run.
See Note 5 for additional information.
Asset Retirement Obligations
Accounting standards for AROs associated with long-lived assets require that the present value of retirement costs for which we have a legal obligation be recorded as liabilities with an equivalent amount added to the asset cost and depreciated over an appropriate period. The associated ARO accretion expense for our non-regulated operations is included within Depreciation, depletion and amortization on the accompanying Consolidated Statements of Income. The accounting for the obligation for regulated operations has no income statement impact due to the deferral of the adjustments through the establishment of a regulatory asset or a regulatory liability.
We initially record liabilities for the present value of retirement costs for which we have a legal obligation, with an equivalent amount added to the asset cost. The asset is then depreciated or depleted over the appropriate useful life and the liability is accreted over time by applying an interest method of allocation. Any difference in the actual cost of the settlement of the liability and the recorded amount is recognized as a gain or loss in the results of operations at the time of settlement for our non-regulated operations. Additional information is included in Note 7.
Goodwill and Intangible Assets
Goodwill and intangible assets with indefinite lives are not amortized, but the carrying values are reviewed upon an indicator of impairment or at least annually. Intangible assets with a finite life continue to beare amortized over their estimated useful lives.
We perform a goodwill impairment test on an annual basis or upon the occurrence of events or changes in circumstances that indicate that the asset might be impaired. Our annual goodwill impairment testing date is as of October 1, which aligns our testing date with our financial planning process.
The Company has determined that the reporting units for its goodwill impairment test are its operating segments, or components of an operating segment, that constitute a business for which discrete financial information is available and for which segment management regularly reviews the operating results. See Note 5 for additional business segment information.are also its reportable segments.
Our goodwill impairment analysis includes an income approach and a market approach to estimate the fair value of our reporting units. This analysis requiredrequires the input of several critical assumptions, including future growth rates, cash flow projections, operating cost escalation rates, rates of return, a risk-adjusted discount rate, timing and level of success in regulatory rate proceedings, the cost of debt and equity capital, long-term earnings and merger multiples for comparable companies.
We believe that the goodwill reflects the inherent value of the relatively stable, long-lived cash flows of the regulated electric and gas utility businesses, considering the regulatory environment, and the long-lived cash flow and rate base growth opportunities at our utilities. Goodwill amounts have not changed since 2016. As of December 31, 2019, 20182020 and 2017,2019, Goodwill balances were as follows (in thousands):
| | | | | | | | | | | | | | |
| Electric Utilities | Gas Utilities | Power Generation | Total |
| | | | |
| | | | |
| | | | |
| | | | |
| Goodwill | $ | 248,479 | | $ | 1,042,210 | | $ | 8,765 | | $ | 1,299,454 | |
Our intangible assets represent contract intangibles, easements, rights-of-way, customer listings and trademarks. The finite-lived intangible assets are amortized using a straight-line method based on estimated useful lives; these assets are currently being amortized from 2 years to 40 years. Changes to intangible assets for the years ended December 31, were as follows (in thousands):
| | | | 2019 | 2018 | 2017 | | 2020 | 2019 | 2018 |
| Intangible assets, net, beginning balance | $ | 14,337 |
| $ | 7,559 |
| $ | 8,392 |
| Intangible assets, net, beginning balance | $ | 13,266 | | $ | 14,337 | | $ | 7,559 | |
Additions (a) | — |
| 7,602 |
| — |
| |
Amortization expense (b) | (1,071 | ) | (824 | ) | (833 | ) | |
| Additions | | Additions | 0 | | 0 | | 7,602 | |
Amortization expense (a) | | Amortization expense (a) | (1,322) | | (1,071) | | (824) | |
| Intangible assets, net, ending balance | $ | 13,266 |
| $ | 14,337 |
| $ | 7,559 |
| Intangible assets, net, ending balance | $ | 11,944 | | $ | 13,266 | | $ | 14,337 | |
_________________
| |
(a) | The 2018 addition is related to the Busch Ranch 1 contract intangible asset. See (a) Amortization expense for existing intangible assets is expected to be $1.3 million for each year of the next five years.
Note 4 for further information. |
| |
(b) | Amortization expense for existing intangible assets is expected to be $1.1 million for each year of the next five years. |
Accrued Liabilities
The following amounts by major classification are included in Accrued liabilities on the accompanying Consolidated Balance Sheets as of December 31 (in thousands):
| | | | | | | | |
| 2020 | 2019 |
| Accrued employee compensation, benefits and withholdings | $ | 77,806 | | $ | 62,837 | |
| Accrued property taxes | 47,105 | | 44,547 | |
| | |
| Customer deposits and prepayments | 52,185 | | 54,728 | |
| Accrued interest | 31,520 | | 31,868 | |
| | |
| Other (none of which is individually significant) | 34,996 | | 32,787 | |
| Total accrued liabilities | $ | 243,612 | | $ | 226,767 | |
| | |
|
| | | | | | |
| | 2019 | 2018 |
| Accrued employee compensation, benefits and withholdings | $ | 62,837 |
| $ | 63,742 |
|
| Accrued property taxes | 44,547 |
| 42,510 |
|
| Customer deposits and prepayments | 54,728 |
| 43,574 |
|
| Accrued interest | 31,868 |
| 31,759 |
|
| CIAC current portion | 1,952 |
| 1,485 |
|
| Other (none of which is individually significant) | 30,835 |
| 32,431 |
|
| Total accrued liabilities | $ | 226,767 |
| $ | 215,501 |
|
Asset Retirement Obligations
Accounting standards for AROs associated with long-lived assets require that the present value of retirement costs for which we have a legal obligation be recorded as liabilities with an equivalent amount added to the asset cost and depreciated over an appropriate period. The associated ARO accretion expense for our non-regulated operations is included within Depreciation, depletion and amortization on the accompanying Consolidated Statements of Income. The accounting for the obligation for regulated operations has no income statement impact due to the deferral of the adjustments through the establishment of a regulatory asset or a regulatory liability.
We initially record liabilities for the present value of retirement costs for which we have a legal obligation, with an equivalent amount added to the asset cost. The asset is then depreciated or depleted over the appropriate useful life and the liability is accreted over time by applying an interest method of allocation. Any difference in the actual cost of the settlement of the liability and the recorded amount is recognized as a gain or loss in the results of operations at the time of settlement for our non-regulated operations. Additional information is included in Note 8.
Fair Value Measurements
Financial Instruments
We use the following fair value hierarchy for determining inputs for our financial instruments. Our financial instruments’ assets and liabilities for financial instruments are classified and disclosed in one of the following fair value categories:
Level 1 — Unadjusted quoted prices available in active markets that are accessible at the measurement date for identical unrestricted assets or liabilities. Level 1 instruments primarily consist of highly liquid and actively traded financial instruments with quoted pricing information on an ongoing basis.
Level 2 — Pricing inputs include quoted prices for identical or similar assets and liabilities in active markets other than quoted prices in Level 1, quoted prices for identical or similar assets or liabilities in markets that are not active, inputs other than quoted prices that are observable for the asset or liability and inputs that are derived principally from or corroborated by observable market data by correlation or other means.
Level 3 — Pricing inputs are generally less observable from objective sources. These inputs reflect management’s best estimate of fair value using its own assumptions about the assumptions a market participant would use in pricing the asset or liability.
Assets and liabilities are classified in their entirety based on the lowest level of input that is significant to the fair value measurement. Our assessment of the significance of a particular input to the fair value measurement requires judgment and may affect the placement within the fair value hierarchy levels. We record transfers, if necessary, between levels at the end of the reporting period for all of our financial instruments.
Transfers into Level 3, if any, occur when significant inputs used to value the derivative instruments become less observable, such as a significant decrease in the frequency and volume in which the instrument is traded, negatively impacting the availability of observable pricing inputs. Transfers out of Level 3, if any, occur when the significant inputs become more observable, such as when the time between the valuation date and the delivery date of a transaction becomes shorter, positively impacting the availability of observable pricing inputs.
Valuation Methodologies for Derivatives
The wholesale electric energy and natural gas commodity contracts for our Electric and Gas Utilities segments are valued using the market approach and include Level 2forward strip pricing at liquid delivery points, exchange-traded futures, options, basis swaps and over-the-counter swaps for natural gas contracts.and options (Level 2). For exchange-traded futures, options and basis swap assets and liabilities, fair value was derived using broker quotes validated by the exchange settlement pricing for the applicable instrument.contract. For over-the-counter instruments, the fair value wasis obtained by utilizing a nationally recognized service that obtains observable inputs to compute the fair value, which we validate by comparing our valuation with the counterparty. The fair value of these swaps includes a CVA based on the credit spreads of the counterparties when we are in an unrealized gain position or on our own credit spread when we are in an unrealized loss position.
Additional information on fair value measurements is included in Notes 1012, 11 and 1815.
Derivatives and Hedging Activities
All our derivatives are measured at fair value and recognized as either assets or liabilities on the Consolidated Balance Sheets, except for derivative contracts that qualify for and are elected under the normal purchase and normal sales exception. Normal purchases and normal sales are contracts where physical delivery is probable, quantities are expected to be used or sold in the normal course of business over a reasonable amount of time and price is not tied to an unrelated underlying derivative. Normal purchase and sales contracts are recognized when the underlying physical transaction is completed under the accrual basis of accounting. As part of our Electric and Gas Utilities’ operations, we enter into contracts to buy and sell energy to meet the requirements of our customers.
In addition, certain derivativesderivative contracts approved by regulatory authorities are either recovered or refunded through customer rates. Any changes in the fair value of these approved derivative contracts are deferred as a regulatory asset or regulatory liability pursuant to ASC 980.980, Regulated Operations.
We also have some derivatives that qualify for hedge accounting and are designated as cash flow hedges. The effective portion of the derivative gain or loss on these designated derivatives is deferred in AOCI and reclassified into earnings when the corresponding hedged transaction is recognized in earnings. Changes in the fair value of all other derivativesderivative contracts are recognized in earnings.
We utilize master netting agreements which consist of an agreement between two parties who have multiple contracts with each other that provide for the net settlement of all contracts in the event of default on or termination of any one contract. When the right of offset exists, accounting standards permit the netting of receivables and payables under a legally enforceable master netting agreement between counterparties. Accounting standards also permit offsetting of fair value amounts recognized for the right to reclaim, or the obligation to return, cash collateral against fair value amounts recognized for derivative instruments executed with the same counterparty. We reflect the offsetting of net derivative positions with fair value amounts for cash collateral with the same counterpartcounterparty when a legal right of offset exists. Therefore, the gross amounts are not indicative of either our actual credit or net economic exposures.
Deferred Financing Costs
Deferred financing costs include loan origination fees, underwriter fees, legal fees and other costs directly attributable to the issuance of debt. Deferred financing costs are amortized over the estimated useful life of the related debt. These costs are presented on the balance sheet as an adjustment to the related debt liabilities. See additional information in Note 9.
Regulatory Accounting
Our regulated Electric Utilities and Gas Utilities are subject to cost-of-service regulation and earnings oversight from federal and state utilityregulatory commissions. Our Electric and Gas Utilities account for income and expense items in accordance with accounting standards for regulated operations. These accounting policies differ in some respects from those used by our non-regulated businesses. Under these regulated operations accounting standards:
•Certain costs, which would otherwise be charged to expense or OCI, are deferred as regulatory assets based on the expected ability to recover the costs in future rates.
•Certain credits, which would otherwise be reflected as income or OCI, are deferred as regulatory liabilities based on the expectation the amounts will be returned to customers in future rates, or because the amounts were collected in rates prior to the costs being incurredincurred.
Management continually assesses the probability of future recoveries and obligations associated with regulatory assets and liabilities. Factors such as the current regulatory environment, recently issued rate orders, and historical precedents are considered. As a result, we believe that the accounting prescribed under rate-based regulation remains appropriate and our regulatory assets are probable of recovery in current rates or in future rate proceedings.
If changes in the regulatory environment occur, we may no longer be eligible to apply this accounting treatment, and may be required to eliminate regulatory assets and liabilities from our balance sheet. Such changes could adversely affect our results of operations, financial position or cash flows.
As of December 31, 20192020 and 2018,2019, we had total regulatory assets of $271$278 million and $284$271 million respectively, and total regulatory liabilities of $537$533 million and $541$537 million respectively. See Note 132 for further information.
Income Taxes
The Company and its subsidiaries file consolidated federal income tax returns. Each entity records both federal and state income taxes as if it were a separate taxpayer and consolidating expense adjustments are allocated to the subsidiaries based on separate company computations of taxable income or loss.
We use the asset and liability method in accounting for income taxes. Under the asset and liability method, deferred income taxes are recognized at currently enacted income tax rates, to reflect the tax effect of temporary differences between the financial and tax basis of assets and liabilities as well as operating loss and tax credit carryforwards. Such temporary differences are the result of provisions in the income tax law that either require or permit certain items to be reported on the income tax return in a different period than they are reported in the financial statements.
It is our policy to apply the flow-through method of accounting for ITCs. Under the flow-through method, ITCs are reflected in net income as a reduction to income tax expense in the year they qualify. An exception to this general policy is the deferral method, which applies to our regulated businesses. Such a method results in the ITC being amortized as a reduction to income tax expense over the estimated useful lives of the underlying property that gave rise to the credit.
We recognize interest income or interest expense and penalties related to income tax matters in Income tax benefit (expense) benefit on the Consolidated Statements of Income.
We account for uncertainty in income taxes recognized in the financial statements in accordance with the accounting standards for income taxes. The unrecognized tax benefit is classified in Other deferred credits and other liabilities or in Deferred income tax liabilities, net on the accompanying Consolidated Balance Sheets. See Note 1517 for additional information.
Earnings per Share of Common Stock
Basic earnings per share from continuing and discontinued operations is computed by dividing Net income (loss) from continuing and discontinued operations by the weighted average number of common shares outstanding during each year. Diluted earnings per share is computed by including all dilutive common shares outstanding during each year. Diluted common shares are primarily due to equity units, outstanding stock options, restricted stock and performance shares under our equity compensation plans.
A reconciliation of share amounts used to compute earnings per share is as follows for the years ended December 31 (in thousands):
| | | | | | | | | | | |
| 2020 | 2019 | 2018 |
| | | |
| Net income available for common stock | $ | 227,608 | | $ | 199,310 | | $ | 258,442 | |
| | | |
| Weighted average shares - basic | 62,378 | | 60,662 | | 54,420 | |
| Dilutive effect of: | | | |
| Equity Units | 0 | | 0 | | 898 | |
| Equity compensation | 61 | | 136 | | 168 | |
| Weighted average shares - diluted | 62,439 | | 60,798 | | 55,486 | |
| | | |
| Net income available for common stock, per share - Diluted | $ | 3.65 | | $ | 3.28 | | $ | 4.66 | |
|
| | | | | | | | | |
| | 2019 | 2018 | 2017 |
| | | | |
| Net income available for common stock | $ | 199,310 |
| $ | 258,442 |
| $ | 177,034 |
|
| | | | |
| Weighted average shares - basic | 60,662 |
| 54,420 |
| 53,221 |
|
| Dilutive effect of: | | | |
| Equity Units | — |
| 898 |
| 1,783 |
|
| Equity compensation | 136 |
| 168 |
| 116 |
|
| Weighted average shares - diluted | 60,798 |
| 55,486 |
| 55,120 |
|
| | | | |
| Net income available for common stock, per share - Diluted | $ | 3.28 |
| $ | 4.66 |
| $ | 3.21 |
|
The following securities were excluded from the diluted earnings per share computation for the years ended December 31 because of their anti-dilutive nature (in thousands):
| | | | | | | | | | | |
| 2020 | 2019 | 2018 |
| | | |
| Equity compensation | 60 | | 1 | | 16 | |
| | | |
| | | |
| Anti-dilutive shares excluded from computation of earnings per share | 60 | | 1 | | 16 | |
|
| | | | | | |
| | 2019 | 2018 | 2017 |
| | | | |
| Equity compensation | 1 |
| 16 |
| 11 |
|
| Anti-dilutive shares excluded from computation of earnings per share | 1 |
| 16 |
| 11 |
|
Noncontrolling Interests
We account for changes in our controlling interests of subsidiaries according to ASC 810, Consolidations.Consolidation. ASC 810 requires that the Company record such changes as equity transactions, recording no gain or loss on such a sale. GAAP requires that noncontrolling interests in subsidiaries and affiliates be reported in the equity section of a company’s balance sheet. In addition, the amounts attributable to the noncontrolling interest net income (loss) of those subsidiaries are reported separately in the consolidated statements of income and comprehensive income. See Note 1214 for additional detail on Noncontrolling Interests.noncontrolling interests.
Share-Based Compensation
We account for our share-based compensation arrangements in accordance with ASC 718, Compensation-Stock Compensation, by recognizing compensation costs for all share-based awards over the respective service period for employee services received in exchange for an award of equity or equity-based compensation. Awards that will be settled in stock are accounted for as equity and the compensation expense is based on the grant date fair value. Awards that are settled in cash are accounted for as liabilities and the compensation expense is re-measured each period based on the current market price and performance achievement measures. See additional information in Note 16.
Change in Accounting Principle - Pension Accounting Asset Method
Effective January 1, 2020, we changed our method of accounting for net periodic benefit cost. Prior to the change, the Company used a calculated value for determining market-related value of plan assets which amortized the effects of gains and losses over a five-year period. Effective with the accounting change, the Company will continue to use a calculated value for the return-seeking assets (equities) in the portfolio but was changed to fair value for the liability-hedging assets (fixed income). See Note 15 for additional information.
Recently Issued Accounting Standards
Facilitation of the Effects of Reference Rate Reform on Financial Reporting, ASU 2020-04
In March 2020, the FASB issued ASU 2020-04, Reference Rate Reform (Topic 848): Facilitation of the Effects of Reference Rate Reform on Financial Reporting, which was subsequently amended by ASU 2021-01. The standard provides relief for companies preparing for discontinuation of interest rates, such as LIBOR, and allows optional expedients and exceptions for applying GAAP to contracts, hedging relationships and other transactions affected by reference rate reform if certain criteria are met. The amendments in this update are elective and are effective upon the ASU issuance through December 31, 2022. We are currently evaluating if we will apply the optional guidance as we assess the impact of the discontinuance of LIBOR on our current arrangements and the potential impact on our financial position, results of operations and cash flows.
Simplifying the Accounting for Income Taxes, ASU 2019-12
In December 2019, the FASB issued ASU 2019-12, Simplifying the Accounting for Income Taxes as part of its overall simplification initiative to reduce costs and complexity in applying accounting standards while maintaining or improving the usefulness of the information provided to users of the financial statements. Amendments include removal of certain exceptions to the general principles of ASC 740, Income Taxes, and simplification in several other areas such as accounting for a franchise tax (or similar tax) that is partially based on income. The new guidance is effective for interim and annual periods beginning after December 15, 2020 with early adoption permitted. We are currently reviewingAdoption of this standard is not anticipated to assess thehave a material impact on our financial position, results of operations and cash flows.
Internal-Use Software: Customer’s Accounting for Implementation Costs Incurred in a Cloud Computing Arrangement That Is a Service Contract, ASU 2018-15
In August 2018, the FASB issued ASU 2018-15, Customer's Accounting for Implementation Costs Incurred in a Cloud Computing Arrangement That Is a Service Contract, which aligns the requirements for recording implementation costs incurred in a hosting arrangement that is a service contract with the requirements for capitalizing implementation costs incurred to develop or obtain internal-use software. As a result, certain categories of implementation costs that previously would have been charged to expense as incurred are now capitalized as prepayments and amortized over the term of the arrangement. The new guidance is effective for annual periods beginning after December 15, 2019, and interim periods within those fiscal years. The new guidance can be applied either retrospectively or prospectively to all implementation costs incurred after the date of adoption. Early adoption is permitted. We adopted this standard prospectively on January 1, 2020. Adoption of this guidance did not have a material impact on our financial position, results of operations or cash flows.
Simplifying the Test for Goodwill Impairment, ASU 2017-04
In January 2017, the FASB issued ASU 2017-04, Simplifying the Test for Goodwill Impairment by eliminating step 2 from the goodwill impairment test. Under the new guidance, if the carrying amount of a reporting unit exceeds its fair value, an impairment loss will be recognized in an amount equal to that excess, limited to the amount of goodwill allocated to that reporting unit. The new standard is effective for interim and annual reporting periods beginning after December 15, 2019, applied on a prospective basis with early adoption permitted. We adopted this standard prospectively on January 1, 2020. Adoption of this guidance is not expected to have any impact on our financial position, results of operations or cash flows.
Financial Instruments -- Credit Losses: Measurement of Credit Losses on Financial Instruments, ASU 2018-19
In June 2016, the FASB issued ASU 2016-13, Financial Instruments -- Credit Losses: Measurement of Credit Losses on Financial Instruments, which was subsequently amended by ASU 2018-19, ASU 2019-04, 2019-05, 2019-10, and 2019-11. The standard introduces new accounting guidance for credit losses on financial instruments within its scope, including trade receivables. This new guidance adds an impairment model that is based on expected losses rather than incurred losses. It is effective for interim and annual reporting periods beginning after December 15, 2019, with early adoption permitted.
We adopted this standard on January 1, 2020 with prior year comparative financial information remaining as previously reported when transitioning to the new standard. On January 1, 2020, we recorded an increase to our allowance for doubtful accounts, primarily associated with the inclusion of expected losses on unbilled revenue. Adoption of this standard did not have a material impact on our financial position, results of operations or cash flows.
Recently Adopted Accounting Standards
Leases,Financial Instruments -- Credit Losses: Measurement of Credit Losses on Financial Instruments, ASU 2016-022016-13
In FebruaryJune 2016, the FASB issued ASU 2016-02,2016-13, Leases (Topic 842)Financial Instruments -- Credit Losses: Measurement of Credit Losses on Financial Instruments, to increase transparencywhich was subsequently amended by ASU 2018-19, ASU 2019-04, 2019-05, 2019-10, and comparability among organizations by requiring the recognition of right-of-use assets and lease liabilities2019-11. The standard introduces new accounting guidance for credit losses on the balance sheet for most leases, whereas previously only financing-type lease liabilities (capital leases) were recognizedfinancial instruments within its scope, including trade receivables. This new guidance adds an impairment model that is based on the balance sheet. Under the new standard, disclosures are required to meet the objective of enabling users of financial statements to assess the amount, timing and uncertainty of cash flows arising from leases.expected losses rather than incurred losses.
We adopted thethis standard effectiveon January 1, 2019. We elected not2020 with prior year comparative financial information remaining as previously reported when transitioning to recast comparative periods coincidingthe new standard. On January 1, 2020, we recorded an increase to our allowance for credit losses, primarily associated with the new lease standard transition and will report these comparative periods as presented under previous lease guidance. In addition, we elected the packageinclusion of practical expedients permitted under the transition guidance with the new standard, which among other things, allowed us to carry forward the historical lease classification. We also elected the practical expedient related to land easements, allowing us to carry forward our accounting treatment for existing land easement agreements.
Adoption of the new standard resulted in the recording of an operating lease right-of-use asset of $3.1 million, an operating lease obligation liability of $3.2 million, and an accrued receivable of $4.5 million, as of January 1, 2019.expected losses on unbilled revenue. The cumulative effect of the adoption, net of tax impact, was $3.4$0.2 million, which was recorded as an adjustment to retained earnings at January 1, 2019.
See
Simplifying the Test for additional details on leases.Goodwill Impairment, ASU 2017-04
Derivatives and Hedging: Targeted Improvements to Accounting for Hedging Activities, ASU 2017-12
In AugustJanuary 2017, the FASB issued ASU 2017-12,2017-04, Derivatives and Hedging (Topic 815): Targeted ImprovementSimplifying the Test for Goodwill Impairment by eliminating step 2 from the goodwill impairment test. Under the new guidance, if the carrying amount of a reporting unit exceeds its fair value, an impairment loss will be recognized in an amount equal to Accounting for Hedging Activities. This standard better aligns risk management activities and financialthat excess, limited to the amount of goodwill allocated to that reporting for hedging
relationships, simplifies hedge accounting requirements and improves disclosures of hedging arrangements.unit. We have adopted this standard prospectively on January 1, 2019.2020. Adoption of this guidance did not have any impact on our financial position, results of operations or cash flows.
Internal-Use Software: Customer’s Accounting for Implementation Costs Incurred in a Cloud Computing Arrangement That Is a Service Contract, ASU 2018-15
In August 2018, the FASB issued ASU 2018-15, Customer's Accounting for Implementation Costs Incurred in a Cloud Computing Arrangement That Is a Service Contract, which aligns the requirements for recording implementation costs incurred in a hosting arrangement that is a service contract with the requirements for capitalizing implementation costs incurred to develop or obtain internal-use software. As a result, certain categories of implementation costs that previously would have been charged to expense as incurred are now capitalized as prepayments and amortized over the term of the arrangement. We adopted this standard prospectively on January 1, 2020. Adoption of this guidance did not have a material impact on our financial position, results of operations or cash flows.
(2) REGULATORY MATTERS
We had the following regulatory assets and liabilities as of December 31 (in thousands):
| | | | | | | | | |
| | | |
| | | |
| | 2020 | 2019 |
| Regulatory assets | | | |
Deferred energy and fuel cost adjustments (a) | | $ | 39,035 | | $ | 34,088 | |
Deferred gas cost adjustments (a) | | 3,200 | | 1,540 | |
Gas price derivatives (a) | | 2,226 | | 3,328 | |
Deferred taxes on AFUDC (b) | | 7,491 | | 7,790 | |
Employee benefit plans and related deferred taxes (c) | | 116,598 | | 115,900 | |
Environmental (a) | | 1,413 | | 1,454 | |
| | | |
Loss on reacquired debt (a) | | 22,864 | | 24,777 | |
Renewable energy standard adjustment (a) | | 0 | | 1,622 | |
Deferred taxes on flow-through accounting (c) | | 47,515 | | 41,220 | |
Decommissioning costs (a) | | 8,988 | | 10,670 | |
Gas supply contract termination (a) | | 2,524 | | 8,485 | |
Other regulatory assets (a) | | 26,404 | | 20,470 | |
| Total regulatory assets | | 278,258 | | 271,344 | |
| Less current regulatory assets | | (51,676) | | (43,282) | |
| Regulatory assets, non-current | | $ | 226,582 | | $ | 228,062 | |
| | | |
| Regulatory liabilities | | | |
Deferred energy and gas costs (a) | | $ | 13,253 | | $ | 17,278 | |
Employee benefit plan costs and related deferred taxes (c) | | 40,256 | | 43,349 | |
Cost of removal (a) | | 172,902 | | 166,727 | |
Excess deferred income taxes (c) | | 285,259 | | 285,438 | |
Other regulatory liabilities (c) | | 21,050 | | 23,860 | |
| Total regulatory liabilities | | 532,720 | | 536,652 | |
| Less current regulatory liabilities | | (25,061) | | (33,507) | |
| Regulatory liabilities, non-current | | $ | 507,659 | | $ | 503,145 | |
__________
(a) Recovery of costs, but we are not allowed a rate of return.
(b) In addition to recovery of costs, we are allowed a rate of return.
(c) In addition to recovery or repayment of costs, we are allowed a return on a portion of this amount or a reduction in rate base.
Regulatory assets represent items we expect to recover from customers through probable future rates.
Deferred Energy and Fuel Cost Adjustments - Deferred energy and fuel cost adjustments represent the cost of electricity delivered to our Electric Utilities’ customers that is either higher or lower than the current rates and will be recovered or refunded in future rates. Deferred energy and fuel cost adjustments are recorded and recovered or amortized as approved by the appropriate state regulatory commission. Our Electric Utilities file periodic quarterly, semi-annual and/or annual filings to recover these costs based on the respective cost mechanisms approved by their applicable state regulatory commissions. The recovery period for these costs is less than a year.
Deferred Gas Cost Adjustments - Our regulated Gas Utilities have GCA provisions that allow them to pass the cost of gas on to their customers. The GCA is based on forecasts of the upcoming gas costs and recovery or refund of prior under-recovered or over-recovered costs. To the extent that gas costs are under-recovered or over-recovered, they are recorded as a regulatory asset or liability, respectively. Our Gas Utilities file periodic estimates of future gas costs based on market forecasts with state regulatory commissions. The recovery period for these costs is less than a year.
Gas Price Derivatives - Our regulated Gas Utilities, as allowed or required by state regulatory commissions, have entered into certain exchange-traded natural gas futures and options to reduce our customers’ underlying exposure to fluctuations in gas prices. Gas price derivatives represent our unrealized positions on our commodity contracts supporting our utilities. Gas price derivatives at December 31, 2020 are hedged over a maximum forward term of two years.
Deferred Taxes on AFUDC - The equity component of AFUDC is considered a permanent difference for tax purposes with the tax benefit being flowed through to customers as prescribed or allowed by regulators. If, based on a regulator’s action, it is probable the utility will recover the future increase in taxes payable represented by this flow-through treatment through a rate revenue increase, a regulatory asset is recognized. This regulatory asset is a temporary difference for which a deferred tax liability must be recognized. Accounting standards for income taxes specifically address AFUDC-equity and require a gross-up of such amounts to reflect the revenue requirement associated with a rate-regulated environment.
Employee Benefit Plans and Related Deferred Taxes - Employee benefit plans include the unrecognized prior service costs and net actuarial loss associated with our defined benefit pension plan and post-retirement benefit plans in regulatory assets rather than in AOCI. In addition, this regulatory asset includes the income tax effect of the adjustment required under accounting for compensation - defined benefit plans, to record the full pension and post-retirement benefit obligations. Such income tax effect has been grossed-up to account for the revenue requirement associated with a rate regulated environment.
Environmental - Environmental costs associated with certain former manufactured gas plant sites. These costs are first offset by recognition of insurance proceeds and settlements with other third parties. Any remaining cost will be requested for recovery in future rate filings. Recovery for these specific environmental costs has not yet been approved by the applicable state regulatory commission and therefore, the recovery period is unknown at this time.
Loss on Reacquired Debt - Loss on reacquired debt is recovered over the remaining life of the original issue or, if refinanced, over the life of the new issue.
Renewable Energy Standard Adjustment - The renewable energy standard adjustment provides funding for various renewable energy projects and programs to comply with Colorado’s Renewable Energy Standard. These programs include incentives for our Colorado Electric customers to install renewable energy equipment at their location. These project costs and program incentives are recovered over time through the Renewable Energy Standard Adjustment charged on customers’ bills.
Deferred Taxes on Flow-Through Accounting - Under flow-through accounting, the income tax effects of certain tax items are reflected in our cost of service for the customer and result in lower utility rates in the year in which the tax benefits are realized. A regulatory asset was established to reflect that future increases in income taxes payable will be recovered from customers as the temporary differences reverse. As a result of this regulatory treatment, we continue to record a tax benefit for costs considered currently deductible for tax purposes, but are capitalized for book purposes.
Decommissioning Costs - South Dakota Electric and Colorado Electric received approval in 2014 for recovery of the remaining net book values and decommissioning costs of their decommissioned coal plants. In 2018, Arkansas Gas received approval to record Liquefied Natural Gas Plant decommissioning costs as a regulatory asset and received approval in 2020 to begin recovering those costs over three years.
Gas Supply Contract Termination - As part of our acquisition of SourceGas in 2016, we acquired agreements that required the Company to purchase all of the natural gas produced over the productive life of specific leaseholds in the Bowdoin Field in Montana. The majority of these purchases were committed to certain customers in Colorado, Nebraska, and Wyoming, which are subject to cost recovery mechanisms. The prices to be paid under these agreements varied, ranging from $6 to $8 per MMBtu at the time of acquisition, which exceeded market prices. We recorded a liability for this contract in our SourceGas Transaction purchase price allocation. We were granted approval to terminate these agreements from the CPUC, NPSC and WPSC on the basis that these agreements were not beneficial to customers over the long term. We received written orders allowing us to create a regulatory asset for the net buyout costs associated with the contract termination, and recover the majority of costs from customers over a period of five years. We terminated the contract and settled the liability on April 29, 2016.
Regulatory liabilities represent items we expect to refund to customers through probable future decreases in rates.
Deferred Energy and Gas Costs - Deferred energy and gas costs that have been over-recovered through customer rates and will be returned to customers in future periods.
Employee Benefit Plan Costs and Related Deferred Taxes - Employee benefit plans represent the cumulative excess of pension and retiree healthcare costs recovered in rates over pension expense recorded in accordance with accounting standards for compensation - retirement benefits. In addition, this regulatory liability includes the income tax effect of the adjustment required under accounting for compensation - defined benefit plans, to record the full pension and post-retirement benefit obligations. Such income tax effect has been grossed-up to account for the revenue requirement associated with a rate regulated environment.
Cost of Removal - Cost of removal represents the estimated cumulative net provisions for future removal costs for which there is no legal obligation for removal included in depreciation expense.
Excess Deferred Income Taxes - The revaluation of the regulated utilities' deferred tax assets and liabilities due to the passage of the TCJA was recorded as an excess deferred income tax to be refunded to customers primarily using the normalization principles as prescribed in the TCJA. See Note 17 for additional information.
Regulatory Activity
TCJA
On December 22, 2017, the U.S. government enacted comprehensive tax legislation commonly referred to as the TCJA. The TCJA reduced the U.S. federal corporate tax rate from 35% to 21%. As such, the Company remeasured our deferred income taxes at the 21% federal tax rate as of December 31, 2017. In 2018 and 2019, the Company successfully delivered several of these tax benefits from the TCJA to its utility customers.
In 2020, regulatory proceedings resolved the last of the Company’s open dockets seeking approval of its TCJA plans. As a result, the Company relieved certain TCJA-related liabilities, which resulted in an increase to net income for the year ended December 31, 2020 of $4.0 million.
On December 30, 2020, an administrative law judge approved a settlement of Colorado Electric’s plan to provide $9.3 million of TCJA-related customer billing credits to its customers. The billing credits, which represent a disposition of excess deferred income tax benefits resulting from the TCJA, will be delivered to customers in February 2021. These billing credits will be offset by a reduction in income tax expense and will result in a minimal impact to Net income.
On Janaury 26, 2021, NPSC approved Nebraska Gas’s plan to provide $2.9 million of TCJA-related customer billing credits to its customers. The billing credits, which represent a disposition of excess deferred income tax benefits resulting from the TCJA, is expected to be delivered to customers in the second quarter of 2021. These billing credits will be offset by a reduction in income tax and and will result in a minimal impact to Net income.
Electric Utilities Regulatory Activity
South Dakota Electric
Settlement
On January 7, 2020, South Dakota Electric received approval from the SDPUC on a settlement agreement to extend the 6-year moratorium period by an additional 3 years to June 30, 2026. Also, as part of the settlement, we withdrew our application for deferred accounting treatment and expensed $5.4 million of development costs in 2019 related to projects we no longer intend to construct. This settlement amends a previous agreement approved by the SDPUC on June 16, 2017, whereby South Dakota Electric would not increase base rates, absent an extraordinary event, for a 6 year moratorium period effective July 1, 2017. The moratorium period also includes suspension of both the TFA and EIA.
FERC Formula Rate
The annual rate determination process is governed by the FERC formula rate protocols established in the filed FERC joint-access transmission tariff. Effective January 1, 2020 the annual revenue requirement was $27 million and included estimated weighted average capital additions of $33 million for 2019 and 2020 combined. The annual transmission revenue requirement has a true-up mechanism that is recorded in June of each year.
Black Hills Wyoming and Wyoming Electric
Wygen 1 FERC Filing
On October 15, 2020, the FERC approved a settlement agreement that represents a resolution of all issues in the joint application filed by Wyoming Electric and Black Hills Wyoming on August 2, 2019 for approval of a new 60 MW PPA. Under the terms of the settlement, Wyoming Electric will continue to receive 60 MW of capacity and energy from the Wygen I power plant. The new agreement will commence on January 1, 2022, replace the existing PPA and continue for 11 years.
Gas Utilities Regulatory Activity
Colorado Gas
Jurisdictional Consolidation and Rate Reviews
On September 11, 2020, Colorado Gas filed a rate review with the CPUC seeking recovery on significant infrastructure investments in its 7,000-mile natural gas pipeline system. The rate review requests $13.5 million in new annual revenue with a capital structure of 50% equity and 50% debt and a return on equity of 9.95%. The request seeks to implement new rates in the second quarter of 2021. On January 6, 2021 the CPUC issued an order dismissing the rate review. On January 26, 2021, Colorado Gas filed an application for rehearing, reargument or reconsideration in response to the Commission’s January 6 order.
On September 11, 2020, in accordance with the final order from the earlier rate review discussed below, Colorado Gas also filed a new SSIR proposal that would recover safety and integrity focused investments in its system over five years. A decision from the CPUC is expected by mid-2021.
On February 1, 2019, Colorado Gas filed a rate review with the CPUC requesting $2.5 million in new revenue to recover investments in safety, reliability and system integrity and approval to consolidate rates, tariffs, and services of its 2 existing gas distribution territories. Colorado Gas also requested a new rider mechanism to recover future safety and integrity investments in its system. On May 19, 2020, the CPUC issued a final order which denied the system integrity recovery mechanism and consolidation of rate territories. In addition, the order resulted in an annual revenue decrease of $0.6 million and a return on equity of 9.2%. New rates were effective July 3, 2020.
RMNG SSIR
On October 30, 2020, RMNG filed the tariff adjusting rates to include 2021 projects with an expected capital investment of $33 million under the current SSIR. The new tariff rates went into effect January 1, 2021 and the current approved SSIR expires December 31, 2021.
Nebraska Gas
Jurisdictional Consolidation and Rate Review
On January 26, 2021, Nebraska Gas received approval from the NPSC to consolidate rate schedules into a new, single statewide structure and recover significant infrastructure investments in its 13,000-mile natural gas pipeline system. Final rates will be enacted on March 1, 2021, to replace interim rates enacted September 1, 2020. The approval will shift $4.6 million of SSIR revenue to base rates and is expected to generate $6.5 million in new annual revenue with a capital structure of 50% equity and 50% debt and a return on equity of 9.5%. The approval also includes an extension of the SSIR for five years and an expansion of this mechanism for consolidated utility alignment.
Wyoming Gas
Jurisdictional Consolidation and Rate Review
Wyoming Gas’s new single statewide rate structure became effective March 1, 2020. Wyoming Gas received approval from the WPSC on December 11, 2019, to consolidate the rates, tariffs and services of its 4 existing gas distribution territories. New rates are expected to generate $13 million in new annual revenue based on a return on equity of 9.40% and a capital structure of 50.23% equity and 49.77% debt. The approval also allows for a rider to recover integrity investments for system safety and reliability.
(3) COMMITMENTS, CONTINGENCIES AND GUARANTEES
Power Purchase and Transmission Services Agreements
Through our subsidiaries, we have the following significant long-term power purchase contracts and transmission services agreement (TSA) with non-affiliated third-parties:
| | | | | | | | | | | | | | | | | |
| Subsidiary | Contract Type | Counterparty | Fuel Type | Quantity (MW) | Expiration Date |
Colorado Electric (a) | PPA | PRPA | Wind | 60 | May 31, 2030 |
| Colorado Electric | PPA | PRPA | Coal | 25 | June 30, 2024 |
| South Dakota Electric | PPA | PacifiCorp | Coal | 50 | December 31, 2023 |
South Dakota Electric (b) | TSA | PacifiCorp | N/A | 50 | December 31, 2023 |
| South Dakota Electric | PPA | PRPA | Wind | 12 | September 30, 2029 |
| South Dakota Electric | PPA | Fall River Solar, LLC | Solar | 80 | Pending Completion (c) |
Wyoming Electric (d) | PPA | Happy Jack | Wind | 30 | September 3, 2028 |
Wyoming Electric (e) | PPA | Silver Sage | Wind | 30 | September 30, 2029 |
_____________
(a) Colorado Electric sells the wind energy purchased under this PPA to City of Colorado Springs as discussed below.
(b) This is a firm point-to-point transmission service agreement that provides 50 MW of capacity and energy to be transmitted annually.
(c) This agreement relates to a new solar facility currently being constructed and will expire 20 years after construction completion, which is expected by the end of 2022.
(d) Under a separate intercompany PSA, Wyoming Electric sells 50% of the facility output to South Dakota Electric.
(e) Under a separate intercompany PSA, Wyoming Electric sells 67% of the facility output to South Dakota Electric.
Costs under these agreements for the years ended December 31 were as follows (in thousands):
| | | | | | | | | | | | | | | | | | | | | | | |
| Subsidiary | Contract Type | Counterparty | Fuel Type | | 2020 | 2019 | 2018 |
| Colorado Electric | PPA | PRPA | Wind | | $ | 2,791 | | $ | 0 | | $ | 0 | |
| Colorado Electric | PPA | PRPA | Coal | | $ | 4,524 | | $ | 1,802 | | $ | 0 | |
| South Dakota Electric | PPA | PacifiCorp | Coal | | $ | 5,897 | | $ | 7,477 | | $ | 13,681 | |
| South Dakota Electric | TSA | PacifiCorp | N/A | | $ | 1,776 | | $ | 1,741 | | $ | 1,742 | |
| South Dakota Electric | PPA | PRPA | Wind | | $ | 715 | | $ | 688 | | $ | 223 | |
| Wyoming Electric | PPA | Happy Jack | Wind | | $ | 4,531 | | $ | 3,936 | | $ | 3,884 | |
| Wyoming Electric | PPA | Silver Sage | Wind | | $ | 6,203 | | $ | 5,366 | | $ | 5,376 | |
Power Purchase Agreements - Related Parties
Wyoming Electric currently has a PPA with Black Hills Wyoming expiring on December 31, 2022, which provides 60 MW of unit-contingent capacity and energy from Black Hills Wyoming’s Wygen I facility. On October 15, 2020, the FERC approved a settlement agreement in the joint application filed by Wyoming Electric and Black Hills Wyoming on August 2, 2019 for approval of a new 60 MW PPA. Under the terms of the settlement, Wyoming Electric will continue to receive 60 MW of capacity and energy from the Wygen I facility. The new agreement will commence on January 1, 2022, replace the existing PPA and continue for 11 years.
Black Hills Electric Generation provides the wind energy generated from Busch Ranch II to Colorado Electric through a PPA, which expires in November 2044.
Black Hills Electric Generation provides its 14.5 MW share of energy generated from Busch Ranch I to Colorado Electric through a PPA, which expires in October 2037.
Colorado Electric’s PPA with Black Hills Colorado IPP expiring on December 31, 2031, provides 200 MW of power to Colorado Electric from Black Hills Colorado IPP’s combined-cycle turbines. At the segment level, we recognize the associated revenues, costs and assets on an accrual basis, rather than as a finance lease. See Note 18 for additional information.
Purchase Commitments
We maintain natural gas supply contracts with several vendors that generally cover a period of up to one year. Commitments for estimated baseload gas volumes are established prior to the beginning of the month under these contracts on a monthly basis at contractually negotiated prices. Commitments for incremental daily purchases are made as necessary during the month based on requirements in accordance with the terms of the individual contract.
Our Gas Utilities segment has commitments to purchase physical quantities of natural gas under contracts indexed to various forward natural gas price curves. A portion of our gas purchases are purchased under evergreen contracts and are therefore, for purposes of this disclosure, carried out for 60 days. At December 31, 2020, the long-term commitments to purchase quantities of natural gas under contracts indexed to the following forward indices were as follows (in MMBtus):
| | | | | | | | | | | | | | | | | | | |
| | Northern Natural Gas - Ventura | Northwest Pipeline - Wyoming | ONEOK - Oklahoma | | Southern Star Central Gas Pipeline | Panhandle Eastern Pipe Line |
| 2021 | | 3,650,000 | 1,510,000 | 5,475,000 | | 113,130 | 4,680 |
| 2022 | | 1,810,000 | 1,510,000 | 5,475,000 | | 0 | 0 |
| 2023 | | 1,840,000 | 1,510,000 | 5,475,000 | | 0 | 0 |
| 2024 | | 1,820,000 | 910,000 | 5,490,000 | | 0 | 0 |
| 2025 | | 0 | 0 | 4,560,000 | | 0 | 0 |
| Thereafter | | 0 | 0 | 0 | | 0 | 0 |
Purchases under these contracts totaled $25 million, $6.7 million and $27 million for 2020, 2019 and 2018, respectively.
Other Gas Supply Agreements
Our Utilities also purchase natural gas, including transportation and storage capacity to meet customers’ needs, under short-term and long-term purchase contracts. These contracts extend to 2044.
The following is a schedule of unconditional purchase obligations required under the power purchase, transmission services and natural gas transportation and storage agreements (in thousands):
| | | | | | | | |
| Power purchase and transmission services agreements (a) | Natural gas transportation and storage agreements |
| 2021 | $ | 24,452 | | $ | 116,563 | |
| 2022 | $ | 11,678 | | $ | 121,819 | |
| 2023 | $ | 11,678 | | $ | 100,282 | |
| 2024 | $ | 2,738 | | $ | 67,089 | |
| 2025 | $ | 0 | | $ | 50,709 | |
| Thereafter | $ | 0 | | $ | 167,100 | |
_____________
(a) This schedule does not reflect renewable energy PPA obligations since these agreements vary based on weather conditions.
Power Sales Agreements
Through our subsidiaries, we have the following significant long-term power sales contracts with non-affiliated third-parties:
•On July 1, 2020, Colorado Electric entered into a PSA with the City of Colorado Springs to sell up to 60 MW of wind energy purchased from PRPA under a separate 60 MW PPA discussed above. This PSA with the City of Colorado Springs expires June 30, 2025.
•During periods of reduced production at Wygen III in which MDU owns a portion of the capacity, or during periods when Wygen III is off-line, South Dakota Electric will provide MDU with 25 MW from our other generation facilities or from system purchases with reimbursement of costs by MDU. This agreement expires January 31, 2023.
•South Dakota Electric has an agreement to provide MDU capacity and energy up to a maximum of 50 MW in excess of Wygen III ownership. This agreement expires December 31, 2023.
•During periods of reduced production at Wygen III in which the City of Gillette owns a portion of the capacity, or during periods when Wygen III is off-line, South Dakota Electric will provide the City of Gillette with its first 23 MW from its other generating facilities or from system purchases with reimbursement of costs by the City of Gillette. Under this agreement, which has an initial term through September 3, 2034 and would be renewed annually on September 3 thereafter, South Dakota Electric will also provide the City of Gillette their operating component of spinning reserves.
•South Dakota Electric has an amended agreement, effective January 1, 2019, to supply up to 20 MW of energy and capacity to MEAN under a contract that expires May 31, 2028. The contract terms are from June 1 through May 31 for each interval listed below. This contract is unit-contingent based on the availability of our Neil Simpson II and Wygen III plants, with decreasing capacity purchased over the term of the agreement. The unit-contingent capacity amounts from Wygen III and Neil Simpson II are as follows:
| | | | | | | | | | | | | | | | | | | | | | | | | | |
| Contract Years | Total Contract Capacity | | Contingent Capacity Amounts on Wygen III | | Contingent Capacity Amounts on Neil Simpson II |
| | | | | | | | |
| 2020-2022 | 15 | | MW | | 7 | | MW | | 8 | | MW |
| 2022-2023 | 15 | | MW | | 8 | | MW | | 7 | | MW |
| 2023-2028 | 10 | | MW | | 5 | | MW | | 5 | | MW |
•South Dakota Electric has an agreement that expires December 31, 2021 to provide 50 MW of energy to Macquarie Energy, LLC during heavy and light load timing intervals.
•Black Hills Wyoming sold its CTII 40 MW natural gas-fired generating unit to the City of Gillette, Wyoming on September 3, 2014. Under the terms of the sale, Black Hills Wyoming entered into ancillary agreements to operate CTII, provide use of shared facilities including a ground lease and dispatch generation services. In addition, the agreement includes a 20-year economy energy PSA that contains a sharing arrangement in which the parties share the savings of wholesale power purchases made when market power prices are less than the cost of operating the generating unit.
Environmental Matters
We are subject to costs resulting from a number of federal, state and local laws and regulations which affect future planning and existing operations. Laws and regulations can result in increased capital expenditures, operating and other costs as a result of compliance, remediation and monitoring obligations. Due to the environmental issues discussed below, we may be required to modify, curtail, replace or cease operating certain facilities or operations to comply with statutes, regulations and other requirements of regulatory bodies.
Reclamation Liability
For our Pueblo Airport Generation site, we posted a bond of $4.1 million with the State of Colorado to cover the costs of remediation for a waste water containment pond permitted to provide wastewater storage and processing for this zero discharge facility. The reclamation liability is recorded at the present value of the estimated future cost to reclaim the land.
Under our land leases for our wind generation facilities, we are required to reclaim land where we have placed wind turbines. The reclamation liabilities are recorded at the present value of the estimated future cost to reclaim the land.
Under its mining permit, WRDC is required to reclaim all land where it has mined reserves. The reclamation liability is recorded at the present value of the estimated future cost to reclaim the land.
See Note 7 for additional information.
Manufactured Gas Processing
In 2008, we acquired whole and partial liabilities for former manufactured gas processing sites in Nebraska and Iowa which were previously used to convert coal to natural gas. The acquisition provided for an insurance recovery, now valued at $1.2 million recorded in Other assets, non-current on our Consolidated Balance Sheets, which will be used to help offset remediation costs. We also have a $1.4 million regulatory asset for manufactured gas processing sites; see Note 2 for additional information.
As of December 31, 2020, we had $2.6 million accrued for remediation of Iowa’s manufactured gas processing site as the landowner. As of December 31, 2020, we had $0.6 million accrued for remediation of Nebraska’s manufactured gas processing site as the land owner. These liabilities are included in Other deferred credits and other liabilities on our Consolidated Balance Sheets. The remediation cost estimate could change materially due to results of further investigations, actions of environmental agencies or the financial viability of other responsible parties.
Legal Proceedings
In the normal course of business, we are subject to various lawsuits, actions, proceedings, claims and other matters asserted under laws and regulations. We believe the amounts provided in the consolidated financial statements to satisfy alleged liabilities are adequate in light of the probable and estimable contingencies. However, there can be no assurance that the actual amounts required to satisfy alleged liabilities from various legal proceedings, claims and other matters discussed, and to comply with applicable laws and regulations will not exceed the amounts reflected in the consolidated financial statements.
In the normal course of business, we enter into agreements that include indemnification in favor of third parties, such as information technology agreements, purchase and sale agreements and lease contracts. We have also agreed to indemnify our directors, officers and employees in accordance with our articles of incorporation, as amended. Certain agreements do not contain any limits on our liability and therefore, it is not possible to estimate our potential liability under these indemnifications. In certain cases, we have recourse against third parties with respect to these indemnities. Further, we maintain insurance policies that may provide coverage against certain claims under these indemnities.
Guarantees
We have entered into various agreements providing financial or performance assurance to third parties on behalf of certain of our subsidiaries. The agreements, which are off-balance sheet commitments, include indemnification for reclamation and surety bonds. The guarantees were entered into in the normal course of business. To the extent liabilities are incurred as a result of activities covered by the surety bonds, such liabilities are included in our Consolidated Balance Sheets.
We had the following guarantees in place as of (in thousands):
| | | | | | | | |
| Maximum Exposure at | |
| Nature of Guarantee | December 31, 2020 | Expiration |
| Indemnification for subsidiary reclamation/surety bonds | $ | 53,769 | | Ongoing |
| | |
(4) REVENUE
Our revenue contracts generally provide for performance obligations that are fulfilled and transfer control to customers over time, represent a series of distinct services that are substantially the same, involve the same pattern of transfer to the customer and provide a right to consideration from our customers in an amount that corresponds directly with the value to the customer for the performance completed to date. Therefore, we recognize revenue in the amount to which we have a right to invoice. Our primary types of revenue contracts are:
| |
• | Regulated natural gas and electric utility services tariffs - Our utilities have regulated operations, as defined by ASC 980, that provide services to regulated customers under tariff rates, charges, terms and conditions of service, and prices determined by the jurisdictional regulators designated for our service territories. Our regulated services primarily encompass single performance obligations for delivery of either commodity natural gas, commodity electricity, natural gas transportation or electric transmission services. These service revenues are variable based on quantities delivered, influenced by seasonal business and weather patterns. Tariffs are only permitted to be changed through a rate-setting process involving the state or federal regulatory commissions to establish contractual rates between the utility and its customers. All of our utilities’ regulated sales are subject to regulatory-approved tariffs.
|
| |
• | Power sales agreements - Our Electric Utilities and Power Generation segments have long-term wholesale power sales agreements with other load-serving entities, including affiliates, for the sale of excess power from owned generating units. These agreements include a combination of “take or pay” arrangements, where the customer is obligated to pay for the energy regardless of whether it actually takes delivery, as well as “requirements only” arrangements, where the customer is only obligated to pay for the energy the customer needs. In addition to these long-term contracts, we also sell excess energy to other load-serving entities on a short-term basis. The pricing for all of these arrangements is included in the executed contracts or confirmations, reflecting the standalone selling price and is variable based on energy delivered.
|
•Regulated natural gas and electric utility services tariffs - Our utilities have regulated operations, as defined by ASC 980, Regulated Operations, that provide services to regulated customers under tariff rates, charges, terms and conditions of service and prices determined by the jurisdictional regulators designated for our service territories. Our regulated services primarily encompass single performance obligations for delivery of either commodity natural gas, commodity electricity, natural gas transportation or electric transmission services. These service revenues are variable based on quantities delivered, influenced by seasonal business and weather patterns. Tariffs are only permitted to be changed through a rate-setting process involving the state or federal regulatory commissions to establish contractual rates between the utility and its customers. All of our Utilities’ regulated sales are subject to regulatory-approved tariffs.
| |
• |
•Power sales agreements - Our Electric Utilities and Power Generation segments have long-term wholesale power sales agreements with other load-serving entities, including affiliates, for the sale of excess power from owned generating units. These agreements include a combination of “take or pay” arrangements, where the customer is obligated to pay for the energy regardless of whether it actually takes delivery, as well as “requirements only” arrangements, where the customer is only obligated to pay for the energy the customer needs. In addition to these long-term contracts, we also sell excess energy to other load-serving entities on a short-term basis. The pricing for all of these arrangements is included in the executed contracts or confirmations, reflecting the standalone selling price and is variable based on energy delivered. Certain energy sale and purchase transactions with the same counterparty and at the same delivery point are netted to reflect the economic substance of the arrangement.
•Coal supply agreements - Our Mining segment sells coal primarily under long-term contracts to utilities for use at their power generating plants, including affiliate Electric Utilities, and an affiliate non-regulated Power Generation entity. The contracts include a single promise to supply coal necessary to fuel the customers’ facilities during the contract term. The transaction price is established in the supply agreements, including cost-based agreements with the affiliated regulated utilities, and is variable based on tons delivered.
•Other non-regulated services - Our Electric and Gas Utilities segments also provide non-regulated services primarily comprised of appliance repair service and protection plans, electric and natural gas technical infrastructure construction and maintenance services, and in Nebraska and Wyoming, an unbundled natural gas commodity offering under the regulatory-approved Choice Gas Program. Revenue contracts for these services generally represent a single performance obligation with the price reflecting the standalone selling price stated in the agreement, and the revenue is variable based on the units delivered or services provided.
- Our Mining segment sells coal primarily under long-term contracts to utilities for use at their power generating plants, including affiliate electric utilities, and an affiliate non-regulated power generation entity. The contracts include a single promise to supply coal necessary to fuel the customers’ facilities during the contract term. The transaction price is established in the supply agreements, including cost-based agreements with the affiliated regulated utilities, and is variable based on tons delivered.
|
| |
• | Other non-regulated services - Our Electric and Gas Utilities segments also provide non-regulated services primarily comprised of appliance repair service and protection plans, electric and natural gas technical infrastructure construction and maintenance services, and in Nebraska and Wyoming, an unbundled natural gas commodity offering under the regulatory-approved Choice Gas Program. Revenue contracts for these services generally represent a single performance obligation with the price reflecting the standalone selling price stated in the agreement, and the revenue is variable based on the units delivered or services provided.
|
The following tables depict the disaggregation of revenue, including intercompany revenue, from contracts with customers by customer type and timing of revenue recognition for each of the reportingreportable segments, for the years ended December 31, 2020, 2019 and 2018. Sales tax and other similar taxes are excluded from revenues.
| | | Year ended December 31, 2019 | Electric Utilities | Gas Utilities | Power Generation | Mining | Inter-company Revenues | Total | |
| Year ended December 31, 2020 | | Year ended December 31, 2020 | Electric Utilities | Gas Utilities | Power Generation | Mining | Inter-company Revenues | Total |
| Customer types: | (in thousands) | Customer types: | (in thousands) |
| Retail | $ | 605,756 |
| $ | 817,840 |
| $ | — |
| $ | 59,233 |
| $ | (32,053 | ) | $ | 1,450,776 |
| Retail | $ | 610,721 | | $ | 765,922 | | $ | 0 | | $ | 58,567 | | $ | (31,478) | | $ | 1,403,732 | |
| Transportation | — |
| 143,390 |
| — |
| — |
| (1,042 | ) | 142,348 |
| Transportation | 0 | | 154,581 | | 0 | | 0 | | (526) | | 154,055 | |
| Wholesale | 20,884 |
| — |
| 99,157 |
| — |
| (91,577 | ) | 28,464 |
| Wholesale | 17,848 | | 0 | | 103,258 | | 0 | | (97,169) | | 23,937 | |
| Market - off-system sales | 23,817 |
| 691 |
| — |
| — |
| (7,736 | ) | 16,772 |
| Market - off-system sales | 24,309 | | 260 | | 0 | | 0 | | (8,797) | | 15,772 | |
| Transmission/Other | 57,104 |
| 47,725 |
| — |
| — |
| (16,797 | ) | 88,032 |
| Transmission/Other | 58,965 | | 43,658 | | 0 | | 0 | | (19,315) | | 83,308 | |
| Revenue from contracts with customers | 707,561 |
| 1,009,646 |
| 99,157 |
| 59,233 |
| (149,205 | ) | 1,726,392 |
| Revenue from contracts with customers | 711,843 | | 964,421 | | 103,258 | | 58,567 | | (157,285) | | 1,680,804 | |
| Other revenues | 5,191 |
| 384 |
| 2,101 |
| 2,396 |
| (1,564 | ) | 8,508 |
| Other revenues | 2,201 | | 10,249 | | 1,789 | | 2,508 | | (610) | | 16,137 | |
| Total revenues | $ | 712,752 |
| $ | 1,010,030 |
| $ | 101,258 |
| $ | 61,629 |
| $ | (150,769 | ) | $ | 1,734,900 |
| Total revenues | $ | 714,044 | | $ | 974,670 | | $ | 105,047 | | $ | 61,075 | | $ | (157,895) | | $ | 1,696,941 | |
|
| | |
| Timing of revenue recognition: |
| Timing of revenue recognition: | |
| Services transferred at a point in time | $ | — |
| $ | — |
| $ | — |
| $ | 59,233 |
| $ | (32,053 | ) | $ | 27,180 |
| Services transferred at a point in time | $ | 0 | | $ | 0 | | $ | 0 | | $ | 58,567 | | $ | (31,478) | | $ | 27,089 | |
| Services transferred over time | 707,561 |
| 1,009,646 |
| 99,157 |
| — |
| (117,152 | ) | 1,699,212 |
| Services transferred over time | 711,843 | | 964,421 | | 103,258 | | 0 | | (125,807) | | 1,653,715 | |
| Revenue from contracts with customers | $ | 707,561 |
| $ | 1,009,646 |
| $ | 99,157 |
| $ | 59,233 |
| $ | (149,205 | ) | $ | 1,726,392 |
| Revenue from contracts with customers | $ | 711,843 | | $ | 964,421 | | $ | 103,258 | | $ | 58,567 | | $ | (157,285) | | $ | 1,680,804 | |
| | | | | | | | | | | | | | | | | | | | |
| Year ended December 31, 2019 | Electric Utilities | Gas Utilities | Power Generation | Mining | Inter-company Revenues | Total |
| Customer types: | (in thousands) |
| Retail | $ | 605,756 | | $ | 817,840 | | $ | 0 | | $ | 59,233 | | $ | (32,053) | | $ | 1,450,776 | |
| Transportation | 0 | | 143,390 | | 0 | | 0 | | (1,042) | | 142,348 | |
| Wholesale | 20,884 | | 0 | | 99,157 | | 0 | | (91,577) | | 28,464 | |
| Market - off-system sales | 23,817 | | 691 | | 0 | | 0 | | (7,736) | | 16,772 | |
| Transmission/Other | 57,104 | | 47,725 | | 0 | | 0 | | (16,797) | | 88,032 | |
| Revenue from contracts with customers | 707,561 | | 1,009,646 | | 99,157 | | 59,233 | | (149,205) | | 1,726,392 | |
| Other revenues | 5,191 | | 384 | | 2,101 | | 2,396 | | (1,564) | | 8,508 | |
| Total revenues | $ | 712,752 | | $ | 1,010,030 | | $ | 101,258 | | $ | 61,629 | | $ | (150,769) | | $ | 1,734,900 | |
| | | | | | |
| Timing of revenue recognition: | | | | | | |
| Services transferred at a point in time | $ | 0 | | $ | 0 | | $ | 0 | | $ | 59,233 | | $ | (32,053) | | $ | 27,180 | |
| Services transferred over time | 707,561 | | 1,009,646 | | 99,157 | | 0 | | (117,152) | | 1,699,212 | |
| Revenue from contracts with customers | $ | 707,561 | | $ | 1,009,646 | | $ | 99,157 | | $ | 59,233 | | $ | (149,205) | | $ | 1,726,392 | |
| | | Year ended December 31, 2018 | Electric Utilities | Gas Utilities | Power Generation (a) | Mining | Inter-company Revenues (a) | Total | Year ended December 31, 2018 | Electric Utilities | Gas Utilities | Power Generation | Mining | Inter-company Revenues | Total |
| Customer types: | (in thousands) | Customer types: | (in thousands) |
| Retail | $ | 594,329 |
| $ | 833,379 |
| $ | — |
| $ | 65,803 |
| $ | (32,194 | ) | $ | 1,461,317 |
| Retail | $ | 594,329 | | $ | 833,379 | | $ | 0 | | $ | 65,803 | | $ | (32,194) | | $ | 1,461,317 | |
| Transportation | — |
| 140,705 |
| — |
| — |
| (1,348 | ) | 139,357 |
| Transportation | 0 | | 140,705 | | 0 | | 0 | | (1,348) | | 139,357 | |
| Wholesale | 33,687 |
| — |
| 90,791 |
| — |
| (84,957 | ) | 39,521 |
| Wholesale | 33,687 | | 0 | | 90,791 | | 0 | | (84,957) | | 39,521 | |
| Market - off-system sales | 24,799 |
| 866 |
| — |
| — |
| (8,102 | ) | 17,563 |
| Market - off-system sales | 24,799 | | 866 | | 0 | | 0 | | (8,102) | | 17,563 | |
| Transmission/Other | 56,209 |
| 49,402 |
| — |
| — |
| (14,827 | ) | 90,784 |
| Transmission/Other | 56,209 | | 49,402 | | 0 | | 0 | | (14,827) | | 90,784 | |
| Revenue from contracts with customers | 709,024 |
| 1,024,352 |
| 90,791 |
| 65,803 |
| (141,428 | ) | 1,748,542 |
| Revenue from contracts with customers | 709,024 | | 1,024,352 | | 90,791 | | 65,803 | | (141,428) | | 1,748,542 | |
| Other revenues | 2,427 |
| 955 |
| 1,660 |
| 2,230 |
| (1,546 | ) | 5,726 |
| Other revenues | 2,427 | | 955 | | 1,660 | | 2,230 | | (1,546) | | 5,726 | |
| Total revenues | $ | 711,451 |
| $ | 1,025,307 |
| $ | 92,451 |
| $ | 68,033 |
| $ | (142,974 | ) | $ | 1,754,268 |
| Total revenues | $ | 711,451 | | $ | 1,025,307 | | $ | 92,451 | | $ | 68,033 | | $ | (142,974) | | $ | 1,754,268 | |
| | | | |
| Timing of revenue recognition: | | Timing of revenue recognition: | |
| Services transferred at a point in time | $ | — |
| $ | — |
| $ | — |
| $ | 65,803 |
| $ | (32,194 | ) | $ | 33,609 |
| Services transferred at a point in time | $ | 0 | | $ | 0 | | $ | 0 | | $ | 65,803 | | $ | (32,194) | | $ | 33,609 | |
| Services transferred over time | 709,024 |
| 1,024,352 |
| 90,791 |
| — |
| (109,234 | ) | 1,714,933 |
| Services transferred over time | 709,024 | | 1,024,352 | | 90,791 | | 0 | | (109,234) | | 1,714,933 | |
| Revenue from contracts with customers | $ | 709,024 |
| $ | 1,024,352 |
| $ | 90,791 |
| $ | 65,803 |
| $ | (141,428 | ) | $ | 1,748,542 |
| Revenue from contracts with customers | $ | 709,024 | | $ | 1,024,352 | | $ | 90,791 | | $ | 65,803 | | $ | (141,428) | | $ | 1,748,542 | |
| |
(a) | Due to the changes in our segment disclosures discussed in Note 5, Power Generation Wholesale revenue was revised for the year ended December 31, 2018, which resulted in an increase of $38 million. The changes to Power Generation Wholesale revenue were offset by a decrease to Power Generation Other revenues of $35 million and a decrease to eliminations in Inter-company Revenues of $3.5 million. There was no impact to our consolidated Total Revenues. |
The majority of our revenue contracts are based on variable quantities delivered; anydelivered. Any fixed consideration contracts with an expected duration of one year or more are immaterial to our consolidated revenues. Variable consideration constraints in the form of discounts, rebates, credits, price concessions, incentives, performance bonuses, penalties or other similar items are not material for our revenue contracts. We are the principal in our revenue contracts, as we have control over the services prior to those services being transferred to the customer.
Revenue Not in Scope of ASC 606
Other revenues included in the table above include our revenue accounted for under separate accounting guidance, including lease revenue under ASC 842, Leases, derivative revenue under ASC 815,Derivatives and Hedging, and alternative revenue programs revenue under ASC 980. Effective January 1, 2019, we changed how we account for the PPA between Black Hills Colorado IPP and Colorado Electric at the segment level and now recognize on an accrual basis, rather than a finance lease. See980, Note 5Regulated Operations for additional information..
Significant Judgments and Estimates
Unbilled Revenue
To the extent that deliveries have occurred but a bill has not been issued, our utilities accrue an estimate of the revenue since the latest billing. This estimate is calculated based upon several factors including billings through the last billing cycle in a month and prices in effect in our jurisdictions. Each month, the estimated unbilled revenue amounts are trued-up and recorded in Accounts receivable, net on the accompanying Consolidated Balance Sheets.
Contract Balances
The nature of our primary revenue contracts provides an unconditional right to consideration upon service delivery; therefore, no customer contract assets or liabilities exist. The unconditional right to consideration is represented by the balance in our Accounts Receivable further discussed in Note 1. We do not typically incur costs that would be capitalized to obtain or fulfill a contract.
(
(5) PROPERTY, PLANT AND EQUIPMENT
Property, plant and equipment at December 31 consisted of the following (dollars in thousands):
| | | | 2019 | 2018 | Lives (in years) | | 2020 | 2019 | Lives (in years) |
| Electric Utilities | Property, Plant and Equipment | Weighted Average Useful Life (in years) | Property, Plant and Equipment (b) | Weighted Average Useful Life (in years) | Minimum | Maximum | Electric Utilities | Property, Plant and Equipment | Weighted Average Useful Life (in years) | Property, Plant and Equipment | Weighted Average Useful Life (in years) | Minimum | Maximum |
| | | | | | |
| Electric plant: | | | | | Electric plant: | |
| Production | $ | 1,348,049 |
| 41 | $ | 1,318,643 |
| 41 | 32 | 46 | Production | $ | 1,417,951 | | 40 | $ | 1,348,049 | | 41 | 32 | 46 |
| Electric transmission | 483,640 |
| 51 | 437,082 |
| 51 | 43 | 54 | Electric transmission | 517,794 | | 49 | 483,640 | | 51 | 44 | 51 |
| Electric distribution | 861,042 |
| 47 | 793,725 |
| 48 | 46 | 50 | Electric distribution | 959,453 | | 46 | 861,042 | | 47 | 46 | 48 |
Plant acquisition adjustment (a) | 4,870 |
| 32 | 4,870 |
| 32 | Plant acquisition adjustment (a) | 4,870 | | 32 | 4,870 | | 32 |
| General | 259,266 |
| 28 | 233,531 |
| 28 | 26 | 33 | General | 259,010 | | 28 | 259,266 | | 28 | 26 | 29 |
| Total electric plant in service | 2,956,867 |
| | 2,787,851 |
| | Total electric plant in service | 3,159,078 | | | 2,956,867 | | |
| Construction work in progress | 102,268 |
| | 60,480 |
| | Construction work in progress | 89,402 | | | 102,268 | | |
| Total electric plant | 3,059,135 |
| | 2,848,331 |
| | Total electric plant | 3,248,480 | | | 3,059,135 | | |
| Less accumulated depreciation and amortization | (670,861 | ) | | (615,365 | ) | | |
| Electric plant net of accumulated depreciation and amortization | $ | 2,388,274 |
| | $ | 2,232,966 |
| | |
| Less accumulated depreciation | | Less accumulated depreciation | (666,669) | | | (670,861) | | |
| Electric plant net of accumulated depreciation | | Electric plant net of accumulated depreciation | $ | 2,581,811 | | | $ | 2,388,274 | | |
_____________
| |
(a) | The plant acquisition adjustment is included in rate base and is being recovered with 11(a) The plant acquisition adjustment is included in rate base and is being recovered with 10 years remaining. |
| |
(b) | Due to the changes in our segment disclosures discussed in Note 5, Total electric plant in service, Accumulated depreciation and amortization, and Electric plant net of accumulated depreciation and amortization were revised as of December 31, 2018 which resulted in an increase (decrease) of ($261) million, $91 million and ($170) million, respectively. There was no impact on our consolidated Plant, property and equipment. |
|
| | | | | | | | | | |
| | 2019 | 2018 | Lives (in years) |
| Gas Utilities | Property, Plant and Equipment | Weighted Average Useful Life (in years) | Property, Plant and Equipment | Weighted Average Useful Life (in years) | Minimum | Maximum |
| | | | | | | |
| Gas plant: | | | | | | |
| Production | $ | 13,000 |
| 35 | $ | 13,580 |
| 35 | 24 | 71 |
| Gas transmission | 516,172 |
| 50 | 423,873 |
| 48 | 22 | 67 |
| Gas distribution | 1,857,233 |
| 43 | 1,595,644 |
| 42 | 30 | 56 |
Cushion gas - depreciable (a) | 3,539 |
| 28 | 3,539 |
| 28 | 28 | 28 |
Cushion gas - not depreciable (a) | 44,443 |
| N/A | 46,369 |
| N/A | N/A | N/A |
| Storage | 46,977 |
| 31 | 29,335 |
| 30 | 27 | 49 |
| General | 437,054 |
| 20 | 355,920 |
| 19 | 10 | 24 |
| Total gas plant in service | 2,918,418 |
| | 2,468,260 |
| | | |
| Construction work in progress | 63,080 |
| | 38,271 |
| | | |
| Total gas plant | 2,981,498 |
| | 2,506,531 |
| | | |
| Less accumulated depreciation and amortization | (336,721 | ) | | (279,580 | ) | | | |
| Gas plant net of accumulated depreciation and amortization | $ | 2,644,777 |
| | $ | 2,226,951 |
| | | |
_____________
| |
(a) | Depreciation of Cushion gas is determined by the respective regulatory jurisdiction in which the Cushion gas resides. |
|
| | | | | | | | | | | | | | | | | | |
| 2019 | Lives (in years) |
| | Property, Plant and Equipment | Construction Work in Progress | Total Property Plant and Equipment | Less Accumulated Depreciation, Depletion and Amortization | Net Property, Plant and Equipment | Weighted Average Useful Life | Minimum | Maximum |
| | | | | | | | | |
| Power Generation | $ | 532,397 |
| $ | 2,121 |
| $ | 534,518 |
| $ | (154,362 | ) | $ | 380,156 |
| 31 | 2 | 40 |
| Mining | $ | 179,198 |
| $ | 1,275 |
| $ | 180,473 |
| $ | (118,585 | ) | $ | 61,888 |
| 13 | 2 | 59 |
|
| | | | | | | | | | | | | | | | | | |
| 2018 | Lives (in years) |
| | Property, Plant and Equipment | Construction Work in Progress | Total Property Plant and Equipment | Less Accumulated Depreciation, Depletion and Amortization | Net Property, Plant and Equipment | Weighted Average Useful Life | Minimum | Maximum |
| | | | | | | | | |
Power Generation (a) | $ | 435,438 |
| $ | 11,796 |
| $ | 447,234 |
| $ | (137,832 | ) | $ | 309,402 |
| 31 | 2 | 40 |
| Mining | $ | 175,650 |
| $ | — |
| $ | 175,650 |
| $ | (111,689 | ) | $ | 63,961 |
| 13 | 2 | 59 |
| | | | | | | | | | | | | | | | | | | | |
| 2020 | 2019 | Lives (in years) |
| Gas Utilities | Property, Plant and Equipment | Weighted Average Useful Life (in years) | Property, Plant and Equipment | Weighted Average Useful Life (in years) | Minimum | Maximum |
| | | | | | |
| Gas plant: | | | | | | |
| Production | $ | 15,603 | | 40 | $ | 13,000 | | 35 | 24 | 46 |
| Gas transmission | 578,278 | | 54 | 516,172 | | 50 | 22 | 71 |
| Gas distribution | 2,115,082 | | 53 | 1,857,233 | | 43 | 45 | 59 |
Cushion gas - depreciable (a) | 3,539 | | 28 | 3,539 | | 28 | 28 | 28 |
Cushion gas - not depreciable (a) | 39,184 | | N/A | 44,443 | | N/A | N/A | N/A |
| Storage | 55,481 | | 38 | 46,977 | | 31 | 24 | 52 |
| General | 438,217 | | 19 | 437,054 | | 20 | 12 | 23 |
| Total gas plant in service | 3,245,384 | | | 2,918,418 | | | | |
| Construction work in progress | 67,229 | | | 63,080 | | | | |
| Total gas plant | 3,312,613 | | | 2,981,498 | | | | |
| Less accumulated depreciation | (323,679) | | | (336,721) | | | | |
| Gas plant net of accumulated depreciation | $ | 2,988,934 | | | $ | 2,644,777 | | | | |
_____________
| |
(a) | Due to the changes in our segment disclosures discussed in Note 5, Property, plant and equipment, Accumulated depreciation and amortization, and Net property, plant and equipment were revised as of December 31, 2018 which resulted in an increase (decrease) of $261 million, ($73) million and $188 million, respectively. There was no impact on our consolidated Plant, property and equipment. |
(a) Depreciation of Cushion Gas is determined by the respective regulatory jurisdiction in which the Cushion Gas resides.
|
| | | | | | | | | | | | | | | | | | |
| 2019 | Lives (in years) |
| | Property, Plant and Equipment | Construction Work in Progress | Total Property Plant and Equipment | Less Accumulated Depreciation, Depletion and Amortization | Net Property, Plant and Equipment | Weighted Average Useful Life | Minimum | Maximum |
| Corporate | $ | 5,721 |
| $ | 23,334 |
| $ | 29,055 |
| $ | (964 | ) | $ | 28,091 |
| 10 | 3 | 30 |
92
|
| | | | | | | | | | | | | | | | | | |
| 2018 | Lives (in years) |
| | Property, Plant and Equipment | Construction Work in Progress | Total Property Plant and Equipment | Less Accumulated Depreciation and Amortization | Net Property, Plant and Equipment | Weighted Average Useful Life | Minimum | Maximum |
Corporate (a) | $ | 5,721 |
| $ | 16,548 |
| $ | 22,269 |
| $ | (670 | ) | $ | 21,599 |
| 8 | 3 | 30 |
___________
| |
(a) | Due to the changes in our segment disclosures discussed in Note 5, Corporate Accumulated depreciation and amortization and Net property, plant and equipment were revised as of December 31, 2018 which resulted in an increase (decrease) of ($18) million and ($18) million respectively. There was no impact on our consolidated Plant, property and equipment. |
| | | | | | | | | | | | | | | | | | | | | | | | | | |
| 2020 | Lives (in years) |
| Property, Plant and Equipment | Construction Work in Progress | Total Property Plant and Equipment | Less Accumulated Depreciation and Depletion | Net Property, Plant and Equipment | Weighted Average Useful Life | Minimum | Maximum |
| | | | | | | | |
| Power Generation | $ | 529,927 | | $ | 4,876 | | $ | 534,803 | | $ | (167,787) | | $ | 367,016 | | 31 | 2 | 40 |
| Mining | $ | 186,552 | | $ | 988 | | $ | 187,540 | | $ | (126,537) | | $ | 61,003 | | 14 | 2 | 59 |
| | | | | | | | |
(
| | | | | | | | | | | | | | | | | | | | | | | | | | |
| 2019 | Lives (in years) |
| Property, Plant and Equipment | Construction Work in Progress | Total Property Plant and Equipment | Less Accumulated Depreciation and Depletion | Net Property, Plant and Equipment | Weighted Average Useful Life | Minimum | Maximum |
| | | | | | | | |
| Power Generation | $ | 532,397 | | $ | 2,121 | | $ | 534,518 | | $ | (154,362) | | $ | 380,156 | | 31 | 2 | 40 |
| Mining | $ | 179,198 | | $ | 1,275 | | $ | 180,473 | | $ | (118,585) | | $ | 61,888 | | 13 | 2 | 59 |
| | | | | | | | |
| | | | | | | | | | | | | | | | | | | | | | | | | | |
| 2020 | Lives (in years) |
| Property, Plant and Equipment | Construction Work in Progress | Total Property Plant and Equipment | Less Accumulated Depreciation | Net Property, Plant and Equipment | Weighted Average Useful Life | Minimum | Maximum |
| Corporate | $ | 5,692 | | $ | 16,402 | | $ | 22,094 | | $ | (1,144) | | $ | 20,950 | | 10 | 10 | 22 |
4
| | | | | | | | | | | | | | | | | | | | | | | | | | |
| 2019 | Lives (in years) |
| Property, Plant and Equipment | Construction Work in Progress | Total Property Plant and Equipment | Less Accumulated Depreciation | Net Property, Plant and Equipment | Weighted Average Useful Life | Minimum | Maximum |
| Corporate | $ | 5,721 | | $ | 23,334 | | $ | 29,055 | | $ | (964) | | $ | 28,091 | | 10 | 3 | 30 |
)
(6) JOINTLY OWNED FACILITIES
Our consolidated financial statements include our share of several jointly-owned utility and non-regulated facilities as described below. Our share of the facilities’ expenses are reflected in the appropriate categories of operating expenses in the Consolidated Statements of Income. Each owner of the facility is responsible for financing its investment in the jointly-owned facilities.
Wyodak Plant
South Dakota Electric owns a 20% interest in the Wyodak Plant, a coal-fired electric generating station located in Campbell County, Wyoming. PacifiCorp owns the remaining ownership percentage and operates the Wyodak Plant. South Dakota Electric receives its proportionate share of the Wyodak Plant’s capacity and is committed to pay its proportionate share of its additions, replacements and operating and maintenance expenses. In addition to supplying South Dakota Electric with coal for its share of the Wyodak Plant, our Mining subsidiary, WRDC, supplies PacifiCorp’s share of the coal to the Wyodak Plant under a separate long-term agreement. This coal supply agreement is collateralized by a mortgage on and a security interest in some of WRDC’s coal reserves.
Transmission Tie
South Dakota Electric also owns a 35% interest in, and is the operator of, the Converter Station Site and South Rapid City Interconnection (the transmission tie)Transmission Tie), an AC-DC-AC transmission tie. Basin Electric Power Cooperative owns the remaining ownership percentage. The transmission tie provides an interconnection between the Western and Eastern transmission grids, which provides us with access to both the WECC and SPP regions. The total transfer capacity of the tie is 400 MW, including 200 MW from West to East and 200 MW from East to West. South Dakota Electric is committed to pay its proportionate share of the additions and replacements and operating and maintenance expenses of the transmission tie.
Wygen III
South Dakota Electric owns 52% of the Wygen III generation facility. MDU and the City of Gillette each owns an undivided ownership interest in Wygen III and are obligated to make payments for costs associated with administrative services and their proportionate share of the costs of operating the plant for the life of the facility. South Dakota Electric retains responsibility for plant operations. Our Mining subsidiary supplies fuel to Wygen III for the life of the plant.
| |
• | Black Hills Wyoming owns 76.5% of the Wygen I plant while MEAN owns the remaining ownership percentage. MEAN is obligated to make payments for its share of the costs associated with administrative services, plant operations and coal supply provided by our Mining subsidiary during the life of the facility. Black Hills Wyoming retains responsibility for plant operations.
|
Black Hills Wyoming owns 76.5% of the Wygen I plant while MEAN owns the remaining ownership percentage. MEAN is obligated to make payments for its share of the costs associated with administrative services, plant operations and coal supply provided by our Mining subsidiary during the life of the facility. Black Hills Wyoming retains responsibility for plant operations.
At December 31, 2019,2020, our interests in jointly-owned generating facilities and transmission systems were (in thousands):
| | | | | | | | | | | | | | |
| Plant in Service | Construction Work in Progress | Less Accumulated Depreciation | Plant Net of Accumulated Depreciation |
| Wyodak Plant | $ | 116,074 | | $ | 2,249 | | $ | (67,762) | | $ | 50,561 | |
| Transmission Tie | $ | 26,176 | | $ | 509 | | $ | (7,103) | | $ | 19,582 | |
| Wygen III | $ | 142,739 | | $ | 582 | | $ | (24,783) | | $ | 118,538 | |
| Wygen I | $ | 114,975 | | $ | 318 | | $ | (49,459) | | $ | 65,834 | |
|
| | | | | | | | | | | | |
| | Plant in Service | Construction Work in Progress | Less Accumulated Depreciation | Plant Net of Accumulated Depreciation |
| Wyodak Plant | $ | 116,074 |
| $ | 729 |
| $ | (64,413 | ) | $ | 52,390 |
|
| Transmission Tie | $ | 19,862 |
| $ | 4,161 |
| $ | (6,612 | ) | $ | 17,411 |
|
| Wygen I | $ | 120,824 |
| $ | 289 |
| $ | (48,703 | ) | $ | 72,410 |
|
| Wygen III | $ | 146,161 |
| $ | 400 |
| $ | (25,518 | ) | $ | 121,043 |
|
Jointly Owned FacilityFacilities - Related Party
Busch Ranch I
Colorado Electric owns 50% of Busch Ranch I while Black Hills Electric Generation owns the remaining 50% ownership interest. Each company is obligated to make payments for costs associated with their proportionate share of the costs of operating the wind farm over the life of the facility. On December 11, 2018, Black Hills Electric Generation purchased its 50% ownership interest in Busch Ranch I for $16 million. Colorado Electric retains responsibility for operations of the wind farm. We recorded this purchase as an asset acquisition at fair value with $8.7 million of the purchase price recorded as wind generation assets, and $7.6 million recorded as an intangible asset, reflective of the fair value of the PPA. Black Hills Electric Generation provides its share of energy from the wind farm to Colorado Electric through a PPA, which expires in October 2037.
(5) BUSINESS SEGMENT INFORMATION
Our reportable segments are based on our method of internal reporting, which
Corriedale
Corriedale serves as the dedicated wind energy supply for Renewable Ready customers in South Dakota and Wyoming. The 52.5 MW wind farm is generally segregatedjointly-owned by differences in products, servicesSouth Dakota Electric (32.5 MW) and regulation. All of ourWyoming Electric (20 MW). BHSC is responsible for operations and assets are located within the United States.
Accounting standards for presentation of segments require an approach based on the way we organize the segments for making operating decisions and how the chief operating decision maker (CODM) assesses performance. Effective January 1, 2019, we concluded that adjusted operating income, instead of net income available for common stock which was used previously, is the most relevant metric for measuring segment performance. The change to our segment performance measure resulted in a revision of the Company’swind farm.
(7) ASSET RETIREMENT OBLIGATIONS
We have identified legal retirement obligations related to reclamation of mining sites in the Mining segment, disclosures for all periods to report adjusted operating income as the measureremoval of segment performance.
Prior to January 1, 2019, operating income for thefuel tanks, transformers containing polychlorinated biphenyls, and an evaporation pond at our Electric Utilities, wind turbines at our Electric Utilities and Power Generation segments, and Corporate and Other included the impactsretirement of finance lease accounting relating to Colorado Electric’s PPA with Black Hills Colorado IPP. This PPA provides 200 MW of energy and capacity to Colorado Electric from Black Hills Colorado IPP’s combined-cycle turbines and expires on December 31, 2031. Finance lease accounting required us to de-recognize the asset from Black Hills Colorado IPP (Power Generation segment), which legally owns the asset, and recognize itgas pipelines at Colorado Electric (Electric Utilities segment).
The CODM assesses the performance of our segments using adjusted operating income, which recognizes intersegment revenues, costs, and assets for Colorado Electric’s PPA with Black Hills Colorado IPP on an accrual basis rather than as a finance lease. Effective January 1, 2019, we changed how we account for this PPA at the segment level, which impacts disclosures for all periods for revenues, fuel and purchased power cost, operating income and total assets for the Electric Utilities and Power Generation segments as well as Corporate and Other. There were no revisions to Gas Utilities and removal of asbestos at our Electric and Gas Utilities. We periodically review and update estimated costs related to these AROs. The actual cost may vary from estimates because of regulatory requirements, changes in technology and increased costs of labor, materials and equipment.
The following tables present the details of AROs which are included on the accompanying Consolidated Balance Sheets in Other deferred credits and other liabilities (in thousands):
| | | | | | | | | | | | | | | | | | | | | |
| December 31, 2019 | Liabilities Incurred | Liabilities Settled | Accretion | | Revisions to Prior Estimates | December 31, 2020 |
Electric Utilities (a) | $ | 9,329 | | $ | 1,217 | | $ | 0 | | $ | 407 | | | $ | 0 | | $ | 10,953 | |
Gas Utilities (b) | 36,085 | | 4,782 | | (132) | | 1,539 | | | 0 | | 42,274 | |
| Power Generation | 4,739 | | 0 | | 0 | | 206 | | | 0 | | 4,945 | |
Mining (c) | 14,052 | | 0 | | (185) | | 617 | | | (1,225) | | 13,259 | |
| Total | 64,205 | | $ | 5,999 | | $ | (317) | | $ | 2,769 | | | $ | (1,225) | | $ | 71,431 | |
| | | | | | | | | | | | | | | | | | | | | |
| December 31, 2018 | Liabilities Incurred | Liabilities Settled | Accretion | | Revisions to Prior Estimates | December 31, 2019 |
Electric Utilities (d) | $ | 6,258 | | $ | 0 | | $ | 0 | | $ | 385 | | | $ | 2,686 | | $ | 9,329 | |
| Gas Utilities | 34,627 | | 0 | | 0 | | 1,458 | | | 0 | | 36,085 | |
Power Generation (a) | 300 | | 3,445 | | 0 | | 158 | | | 836 | | 4,739 | |
Mining (c) | 15,615 | | 0 | | (380) | | 740 | | | (1,923) | | 14,052 | |
| Total | $ | 56,800 | | $ | 3,445 | | $ | (380) | | $ | 2,741 | | | $ | 1,599 | | $ | 64,205 | |
| | | | | | | |
| | | | | | | |
_____________________
(a) Liabilities incurred were related to new wind assets.
(b) Liabilities incurred were driven by an increase in gas pipeline miles; which increases our legal liability for retirement of gas pipelines, specifically to purge and cap these lines in accordance with Federal regulations.
(c) The Mining segments and this change had no effect on our consolidated revenues, fuel and purchased powerRevisions to Prior Estimates were primarily driven by changes in estimated costs associated with back-filling the pit with overburden removed during the mining process.
(d) The Electric Utilities Revisions to Prior Estimates was primarily driven by an increase in the estimated cost operating income or totalto decommission certain regulated wind farm assets.
We also have legally required AROs related to certain assets within our electric transmission and distribution systems. These retirement obligations are pursuant to an easement or franchise agreement and are only required if we discontinue our utility service under such easement or franchise agreement. Accordingly, it is not possible to estimate a time period when these obligations could be settled and therefore, a liability for the cost of these obligations cannot be measured at this time.
Segment
(8) LEASES
Lessee
We lease from third parties certain office and operation center facilities, communication tower sites, equipment, and materials storage. Our leases have remaining terms ranging from less than 1 year to 35 years, including options to extend that are reasonably certain to be exercised. We have 1 immaterial finance lease for communication equipment at the WRDC mine.
Most of our leases do not contain a readily determinable discount rate. Therefore, the present value of future lease payments is generally calculated using our applicable subsidiaries’ incremental borrowing rate (weighted-average of 4.24% as of December 31, 2020).
Leases with an initial term of 12 months or less are classified as short-term leases and are not recognized on the accompanying Consolidated Balance Sheets.
Lease expense for the year ended December 31 were as follows (in thousands):
| | | | | | | | | | | |
| Income Statement Location | 2020 | 2019 |
| Operating lease cost | Operations and maintenance | $ | 978 | | $ | 1,456 | |
| | | |
| | | |
| | | |
| | | |
Supplemental balance sheet information
related to leases as of December 31 was as follows (in thousands):
|
| | | | | | |
| Total Assets (net of intercompany eliminations) as of December 31, | 2019 | 2018 |
Electric Utilities (a) | $ | 2,900,983 |
| $ | 2,707,695 |
|
| Gas Utilities | 4,032,339 |
| 3,623,475 |
|
Power Generation (a) | 417,715 |
| 342,085 |
|
| Mining | 77,175 |
| 80,594 |
|
| Corporate and Other | 130,245 |
| 209,478 |
|
| Total assets | $ | 7,558,457 |
| $ | 6,963,327 |
|
| | | | | | | | | | | |
| Balance Sheet Location | 2020 | 2019 |
| Assets: | | | |
| Operating lease assets | Other assets, non-current | $ | 4,188 | | $ | 4,629 | |
| | | |
| Total lease assets | | $ | 4,188 | | $ | 4,629 | |
| | | |
| Liabilities: | | | |
| Current: | | | |
| Operating leases | Accrued liabilities | $ | 736 | | $ | 1,179 | |
| | | |
| | | |
| Noncurrent: | | | |
| Operating leases | Other deferred credits and other liabilities | 3,807 | | 3,821 | |
| | | |
| Total lease liabilities | | $ | 4,543 | | $ | 5,000 | |
__________________
| |
(a) | Due to the changes in our segment disclosures, Electric Utilities and Power Generation Total assets were revised as of December 31, 2018 which resulted in an increase (decrease) of ($188) million and $188 million, respectively. There was no impact on our consolidated Total assets. |
|
| | | | | | |
Capital Expenditures (a) for the years ended December 31, | 2019 | 2018 |
| Capital expenditures | | |
| Electric Utilities | $ | 222,911 |
| $ | 152,524 |
|
| Gas Utilities | 512,366 |
| 288,438 |
|
| Power Generation | 85,346 |
| 30,945 |
|
| Mining | 8,430 |
| 18,794 |
|
| Corporate and Other | 20,702 |
| 11,723 |
|
| Total capital expenditures of continuing operations | 849,755 |
| 502,424 |
|
| Total capital expenditures of discontinued operations | — |
| 2,402 |
|
| Total capital expenditures | $ | 849,755 |
| $ | 504,826 |
|
_________________
| |
(a) | Includes accruals for property, plant and equipment as disclosed in Note 17. |
|
| | | | | | |
| Property, Plant and Equipment as of December 31, | 2019 | 2018 |
Electric Utilities (a) | $ | 3,059,135 |
| $ | 2,848,331 |
|
| Gas Utilities | 2,981,498 |
| 2,506,531 |
|
Power Generation (a) | 534,518 |
| 447,234 |
|
| Mining | 180,473 |
| 175,650 |
|
| Corporate and Other | 29,055 |
| 22,269 |
|
| Total property, plant and equipment | $ | 6,784,679 |
| $ | 6,000,015 |
|
_______________
| |
(a) | Due to the changes in our segment disclosures, Electric Utilities and Power Generation Property, Plant and Equipment were revised as of December 31, 2018 which resulted in an increase (decrease) of ($261) million and $261 million, respectively. There was no impact on our consolidated Property, Plant and Equipment. |
|
| | | | | | | | | | | | | | | | | | | | | |
| | Consolidating Income Statement |
| Year ended December 31, 2019 | Electric Utilities | Gas Utilities | Power Generation | Mining | Corporate | Inter-Company Eliminations | Total |
| |
|
| Revenue - |
|
|
|
|
|
|
|
| Contracts with customers | $ | 684,445 |
| $ | 1,007,187 |
| $ | 7,580 |
| $ | 27,180 |
| $ | — |
| $ | — |
| $ | 1,726,392 |
|
| Other revenues | 5,191 |
| 384 |
| 1,859 |
| 1,074 |
| — |
| — |
| 8,508 |
|
| | 689,636 |
| 1,007,571 |
| 9,439 |
| 28,254 |
| — |
| — |
| 1,734,900 |
|
| Inter-company operating revenue - |
|
|
|
|
|
|
|
| Contracts with customers | 23,116 |
| 2,459 |
| 91,577 |
| 32,053 |
| 230 |
| (149,435 | ) | — |
|
| Other revenues | — |
| — |
| 242 |
| 1,322 |
| 343,975 |
| (345,539 | ) | — |
|
| | 23,116 |
| 2,459 |
| 91,819 |
| 33,375 |
| 344,205 |
| (494,974 | ) | — |
|
| Total revenue | 712,752 |
| 1,010,030 |
| 101,258 |
| 61,629 |
| 344,205 |
| (494,974 | ) | 1,734,900 |
|
| | | | | | | | |
| Fuel, purchased power and cost of natural gas sold | 268,297 |
| 425,898 |
| 9,059 |
| — |
| 268 |
| (132,693 | ) | 570,829 |
|
| Operations and maintenance | 195,581 |
| 301,844 |
| 28,429 |
| 40,032 |
| 286,799 |
| (303,776 | ) | 548,909 |
|
| Depreciation, depletion and amortization | 88,577 |
| 92,317 |
| 18,991 |
| 8,970 |
| 22,065 |
| (21,800 | ) | 209,120 |
|
| Adjusted operating income (loss) | $ | 160,297 |
| $ | 189,971 |
| $ | 44,779 |
| $ | 12,627 |
| $ | 35,073 |
| $ | (36,705 | ) | $ | 406,042 |
|
| | | | | | | | |
| Interest expense, net | | | | | | | (137,659 | ) |
Impairment of investment (a) | | | | | | | (19,741 | ) |
| Other income (expense), net | | | | | | | (5,740 | ) |
| Income tax benefit (expense) | | | | | | | (29,580 | ) |
| Income from continuing operations | | | | | | | 213,322 |
|
| (Loss) from discontinued operations, net of tax | | | | | | | — |
|
| Net income | | | | | | | 213,322 |
|
| Net income attributable to noncontrolling interest | | | | | | | (14,012 | ) |
| Net income available for common stock | | | | | | | $ | 199,310 |
|
________________
| |
(a) | In 2019 we recorded an impairment of our investment in equity securities of a privately held oil and gas company. See Note 1 for additional information. |
| | | | | | | | |
| 2020 | 2019 |
| Cash paid included in the measurement of lease liabilities: | | |
| Operating cash flows from operating leases | $ | 1,023 | | $ | 1,263 | |
| | |
| | |
| Right-of-use assets obtained in exchange for lease obligations: | | |
| Operating leases | $ | 161 | | $ | 2,801 | |
| | |
|
| | | | | | | | | | | | | | | | | | | | | |
| | Consolidating Income Statement |
| Year ended December 31, 2018 | Electric Utilities (b) | Gas Utilities | Power Generation (b) | Mining | Corporate | Inter-Company Eliminations (b) | Total |
| | |
| Revenue - | | | | | | | |
| Contracts with customers | $ | 686,272 |
| $ | 1,022,828 |
| $ | 5,833 |
| $ | 33,609 |
| $ | — |
| $ | — |
| $ | 1,748,542 |
|
| Other revenues | 2,427 |
| 955 |
| 1,413 |
| 931 |
| — |
| $ | — |
| 5,726 |
|
| | 688,699 |
| 1,023,783 |
| 7,246 |
| 34,540 |
| — |
| — |
| 1,754,268 |
|
| Inter-company operating revenue - | | | | | | |
|
| Contracts with customers | 22,752 |
| 1,524 |
| 84,959 |
| 32,194 |
| 148 |
| (141,577 | ) | — |
|
| Other revenues | — |
| — |
| 246 |
| 1,299 |
| 379,775 |
| (381,320 | ) | — |
|
| | 22,752 |
| 1,524 |
| 85,205 |
| 33,493 |
| 379,923 |
| (522,897 | ) | — |
|
| Total revenue | 711,451 |
| 1,025,307 |
| 92,451 |
| 68,033 |
| 379,923 |
| (522,897 | ) | 1,754,268 |
|
| | | | | | | | |
| Fuel, purchased power and cost of natural gas sold | 283,840 |
| 462,153 |
| 8,592 |
| — |
| 44 |
| (129,019 | ) | 625,610 |
|
| Operations and maintenance | 186,175 |
| 291,481 |
| 25,135 |
| 43,728 |
| 324,916 |
| (336,142 | ) | 535,293 |
|
| Depreciation, depletion and amortization | 85,567 |
| 86,434 |
| 16,110 |
| 7,965 |
| 21,161 |
| (20,909 | ) | 196,328 |
|
| Adjusted operating income (loss) | 155,869 |
| 185,239 |
| 42,614 |
| 16,340 |
| 33,802 |
| (36,827 | ) | 397,037 |
|
| |
|
|
|
|
|
|
|
| Interest expense, net | | | | | | | (139,975 | ) |
| Other income (expense), net | | | | | | | (1,180 | ) |
Income tax benefit (expense) (a) | | | | | | | 23,667 |
|
| Income from continuing operations | | | | | | | 279,549 |
|
| (Loss) from discontinued operations, net of tax | | | | | | | (6,887 | ) |
| Net income | | | | | | | 272,662 |
|
| Net income attributable to noncontrolling interest | | | | | | | (14,220 | ) |
| Net income available for common stock | | | | | | | $ | 258,442 |
|
| | | | | | | | |
________________
| |
(a) | Income tax benefit (expense) includes a tax benefit of $73 million resulting from legal entity restructuring. See Note 15. |
| |
(b) | Due to changes in our segment disclosures, Adjusted operating income and related income statement accounts were revised for the year ended December 31, 2018, which resulted in an increase (decrease) as follows (in millions): |
Weighted average remaining terms and discount rates related to leases as of December 31 were as follows: |
| | | | | | | | | | | | |
| Year ended December 31, 2018 | Electric Utilities | Power Generation | Inter-Company Eliminations | Total |
| Inter-company operating revenue - Contracts with customers | $ | — |
| $ | 3.5 |
| $ | (3.5 | ) | $ | — |
|
| Fuel, purchased power and cost of natural gas sold | 6.7 |
| — |
| (6.7 | ) | — |
|
| Depreciation, depletion and amortization | (13.1 | ) | 9.2 |
| 3.9 |
| — |
|
| Adjusted operating income (loss) | $ | 6.4 |
| $ | (5.7 | ) | $ | (0.7 | ) | $ | — |
|
| | | | | | | | |
| 2020 | 2019 |
| Weighted average remaining lease term: | | |
| Operating leases | 8 years | 8 years |
| | |
| | |
| Weighted average discount rate: | | |
| Operating leases | 4.24 | % | 4.27 | % |
| | |
|
| | | | | | | | | | | | | | | | | | | | | |
| | Consolidating Income Statement |
| Year ended December 31, 2017 | Electric Utilities (b) | Gas Utilities | Power Generation (b) | Mining | Corporate | Inter-Company Eliminations (b) | Total |
| | |
| Revenue | $ | 689,945 |
| $ | 947,595 |
| $ | 7,263 |
| $ | 35,463 |
| $ | — |
| $ | — |
| $ | 1,680,266 |
|
| Inter-company revenue | 14,705 |
| 35 |
| 87,357 |
| 31,158 |
| 344,685 |
| (477,940 | ) | — |
|
| Total revenue | 704,650 |
| 947,630 |
| 94,620 |
| 66,621 |
| 344,685 |
| (477,940 | ) | 1,680,266 |
|
| | | | | | | | |
| Fuel, purchased power and cost of natural gas sold | 274,363 |
| 409,603 |
| 9,340 |
| — |
| 151 |
| (130,169 | ) | 563,288 |
|
| Operations and maintenance | 172,307 |
| 269,190 |
| 23,042 |
| 44,882 |
| 296,067 |
| (293,492 | ) | 511,996 |
|
| Depreciation, depletion and amortization | 80,243 |
| 83,732 |
| 15,548 |
| 8,239 |
| 21,031 |
| (20,547 | ) | 188,246 |
|
| Adjusted operating income (loss) | 177,737 |
| 185,105 |
| 46,690 |
| 13,500 |
| 27,436 |
| (33,732 | ) | 416,736 |
|
| |
|
|
|
|
|
|
|
| Interest expense, net | | | | | | | (137,102 | ) |
| Other income (expense), net | | | | | | | 2,108 |
|
| Income tax benefit (expense) | | | | | | | (73,367 | ) |
| Income from continuing operations | | | | | | | 208,375 |
|
(Loss) from discontinued operations, net of tax(a) | | | | | | | (17,099 | ) |
| Net income | | | | | | | 191,276 |
|
| Net income attributable to noncontrolling interest | | | | | | | (14,242 | ) |
| Net income available for common stock | | | | | | | $ | 177,034 |
|
________________As of December 31, 2020, scheduled maturities of lease liabilities for future years were as follows (in thousands):
| |
(a) | | | | | | | | | | Operating Leases | | | | 2021 | $ | 907 | | | | | 2022 | 804 | | | | | 2023 | 779 | | | | | 2024 | 776 | | | | | 2025 | 529 | | | | | Thereafter | 1,643 | | | | | Total lease payments | $ | 5,438 | | | | | Less imputed interest | 895 | | | | | Present value of lease liabilities | $ | 4,543 | | | |
Discontinued operations includes oil and gas property impairments. See Note 21. |
| |
(b) | Due to changes in our segment disclosures, Adjusted operating income and related income statement accounts were revised for the year ended December 31, 2017, which resulted in an increase (decrease) as follows (in millions): |
|
| | | | | | | | | | | | |
| Year ended December 31, 2017 | Electric Utilities | Power Generation | Inter-Company Eliminations | Total |
| Inter-company revenue | $ | — |
| $ | 3.1 |
| $ | (3.1 | ) | $ | — |
|
| Fuel, purchased power and cost of natural gas sold | 6.0 |
| — |
| (6.0 | ) | — |
|
| Depreciation, depletion and amortization | (13.1 | ) | 9.6 |
| 3.5 |
| — |
|
| Adjusted operating income (loss) | $ | 7.1 |
| $ | (6.5 | ) | $ | (0.6 | ) | $ | — |
|
Lessor
(6) LONG-TERM DEBT
We lease to third parties certain generating station ground leases, communication tower sites, and a natural gas pipeline. These leases have remaining terms ranging from less than one year to 34 years.
Lease revenue for the year ended December 31 were as follows (in thousands):
| | | | | | | | | | | |
| Income Statement Location | 2020 | 2019 |
| Operating lease income | Revenue | $ | 2,534 | | $ | 2,306 | |
As of December 31, 2020, scheduled maturities of operating lease payments to be received in future years were as follows (in thousands):
| | | | | | | |
| Operating Leases | | |
| 2021 | $ | 2,383 | | | |
| 2022 | 2,122 | | | |
| 2023 | 2,130 | | | |
| 2024 | 2,074 | | | |
| 2025 | 2,090 | | | |
| Thereafter | 58,829 | | | |
| Total lease receivables | $ | 69,628 | | | |
(9) DEBT AND CREDIT FACILITIES
Short-term debt
We had the following Notes payable outstanding at the Consolidated Balance Sheets date (in thousands):
| | | | | | | | | | | | | | |
| December 31, 2020 | December 31, 2019 |
| Balance Outstanding | Letters of Credit (a) | Balance Outstanding | Letters of Credit (a) |
| Revolving Credit Facility | $ | 0 | | $ | 24,730 | | $ | 0 | | $ | 30,274 | |
| CP Program | 234,040 | | 0 | | 349,500 | | 0 | |
| Total | $ | 234,040 | | $ | 24,730 | | $ | 349,500 | | $ | 30,274 | |
_______________
(a) Letters of credit are off-balance sheet commitments that reduce the borrowing capacity available on our corporate Revolving Credit Facility.
Revolving Credit Facility and CP Program
On July 30, 2018, we amended and restated our corporate Revolving Credit Facility, maintaining total commitments of $750 million and extending the term through July 30, 2023 with 2 one year extension options (subject to consent from lenders). This facility includes an accordion feature that allows us, with the consent of the administrative agent, the issuing agents and each bank increasing or providing a new commitment, to increase total commitments up to $1.0 billion. Borrowings continue to be available under a base rate or various Eurodollar rate options. The interest costs associated with the letters of credit or borrowings and the commitment fee under the Revolving Credit Facility are determined based upon our Corporate credit rating from S&P, Fitch and Moody's for our senior unsecured long-term debt. Based on our credit ratings, the margins for base rate borrowings, Eurodollar borrowings and letters of credit were 0.125%, 1.125% and 1.125%, respectively, at December 31, 2020. Based on our credit ratings, a 0.175% commitment fee was charged on the unused amount at December 31, 2020.
We have a $750 million, unsecured CP Program that is backstopped by the Revolving Credit Facility. Amounts outstanding under the Revolving Credit Facility and the CP Program, either individually or in the aggregate, cannot exceed $750 million. The notes issued under the CP Program may have maturities not to exceed 397 days from the date of issuance and bear interest (or are sold at par less a discount representing an interest factor) based on, among other things, the size and maturity date of the note, the frequency of the issuance and our credit ratings. Under the CP Program, any borrowings rank equally with our unsecured debt. Notes under the CP Program are not registered and are offered and issued pursuant to a registration exemption.
Our net short-term borrowings (payments) during 2020 were $(115) million. As of December 31, 2020, the weighted average interest rate on short-term borrowings was 0.27%.
Total accumulated deferred financing costs on the Revolving Credit Facility of $6.7 million are being amortized over its estimated useful life and were included in Interest expense on the accompanying Consolidated Statements of Income. See below for additional details.
Long-term debt
Long-term debt outstanding was as follows (dollars in thousands):
| |
|
| Interest Rate at | Balance Outstanding | | Interest Rate at | Balance Outstanding |
| | Due Date | December 31, 2019 | December 31, 2019 | December 31, 2018 | | Due Date | December 31, 2020 | December 31, 2019 |
| Corporate | | | Corporate | |
| Senior unsecured notes due 2023 | November 30, 2023 | 4.25% | $ | 525,000 |
| $ | 525,000 |
| Senior unsecured notes due 2023 | November 30, 2023 | 4.25% | $ | 525,000 | | $ | 525,000 | |
| Senior unsecured notes due 2020 | July 15, 2020 | N/A | — |
| 200,000 |
| |
| Senior unsecured notes due 2026 | January 15, 2026 | 3.95% | 300,000 |
| 300,000 |
| Senior unsecured notes due 2026 | January 15, 2026 | 3.95% | 300,000 | | 300,000 | |
| Senior unsecured notes due 2027 | January 15, 2027 | 3.15% | 400,000 |
| 400,000 |
| Senior unsecured notes due 2027 | January 15, 2027 | 3.15% | 400,000 | | 400,000 | |
| Senior unsecured notes, due 2029 | | Senior unsecured notes, due 2029 | October 15, 2029 | 3.05% | 400,000 | | 400,000 | |
| Senior unsecured notes, due 2030 | | Senior unsecured notes, due 2030 | June 15, 2030 | 2.50% | 400,000 | | 0 | |
| Senior unsecured notes due 2033 | May 1, 2033 | 4.35% | 400,000 |
| 400,000 |
| Senior unsecured notes due 2033 | May 1, 2033 | 4.35% | 400,000 | | 400,000 | |
| Senior unsecured notes, due 2046 | September 15, 2046 | 4.20% | 300,000 |
| 300,000 |
| Senior unsecured notes, due 2046 | September 15, 2046 | 4.20% | 300,000 | | 300,000 | |
| Senior unsecured notes, due 2029 | October 15, 2029 | 3.05% | 400,000 |
| — |
| |
| Senior unsecured notes, due 2049 | October 15, 2049 | 3.88% | 300,000 |
| — |
| Senior unsecured notes, due 2049 | October 15, 2049 | 3.88% | 300,000 | | 300,000 | |
Corporate term loan due 2021 (a) | June 17, 2021 | N/A | — |
| 300,000 |
| |
| Corporate term loan due 2021 | June 7, 2021 | 2.32% | 7,178 |
| 12,921 |
| Corporate term loan due 2021 | June 7, 2021 | 2.32% | 1,436 | | 7,178 | |
| Total Corporate debt | | 2,632,178 |
| 2,437,921 |
| Total Corporate debt | | 3,026,436 | | 2,632,178 | |
| Less unamortized debt discount | | (6,462 | ) | (5,122 | ) | Less unamortized debt discount | | (7,013) | | (6,462) | |
| Total Corporate debt, net | | 2,625,716 |
| 2,432,799 |
| Total Corporate debt, net | | 3,019,423 | | 2,625,716 | |
| | | | | |
| South Dakota Electric | | | South Dakota Electric | |
Series 94A Debt, variable rate (b) | June 1, 2024 | 1.84% | 2,855 |
| 2,855 |
| |
Series 94A Debt, variable rate (a) | | Series 94A Debt, variable rate (a) | June 1, 2024 | N/A | 0 | | 2,855 | |
| First Mortgage Bonds due 2032 | August 15, 2032 | 7.23% | 75,000 |
| 75,000 |
| First Mortgage Bonds due 2032 | August 15, 2032 | 7.23% | 75,000 | | 75,000 | |
| First Mortgage Bonds due 2039 | November 1, 2039 | 6.13% | 180,000 |
| 180,000 |
| First Mortgage Bonds due 2039 | November 1, 2039 | 6.13% | 180,000 | | 180,000 | |
| First Mortgage Bonds due 2044 | October 20, 2044 | 4.43% | 85,000 |
| 85,000 |
| First Mortgage Bonds due 2044 | October 20, 2044 | 4.43% | 85,000 | | 85,000 | |
| Total South Dakota Electric debt | | 342,855 |
| 342,855 |
| Total South Dakota Electric debt | | 340,000 | | 342,855 | |
| Less unamortized debt discount | | (82 | ) | (86 | ) | Less unamortized debt discount | | (78) | | (82) | |
| Total South Dakota Electric debt, net | | 342,773 |
| 342,769 |
| Total South Dakota Electric debt, net | | 339,922 | | 342,773 | |
| | | | | |
| Wyoming Electric | | | Wyoming Electric | |
Industrial development revenue bonds due 2021(a) | September 1, 2021 | 1.68% | 7,000 |
| 7,000 |
| |
Industrial development revenue bonds due 2027(a) | March 1, 2027 | 1.68% | 10,000 |
| 10,000 |
| |
Industrial development revenue bonds due 2021(a) (b) | | Industrial development revenue bonds due 2021(a) (b) | September 1, 2021 | 0.12% | 7,000 | | 7,000 | |
Industrial development revenue bonds due 2027(a) (b) | | Industrial development revenue bonds due 2027(a) (b) | March 1, 2027 | 0.12% | 10,000 | | 10,000 | |
| First Mortgage Bonds due 2037 | November 20, 2037 | 6.67% | 110,000 |
| 110,000 |
| First Mortgage Bonds due 2037 | November 20, 2037 | 6.67% | 110,000 | | 110,000 | |
| First Mortgage Bonds due 2044 | October 20, 2044 | 4.53% | 75,000 |
| 75,000 |
| First Mortgage Bonds due 2044 | October 20, 2044 | 4.53% | 75,000 | | 75,000 | |
| Total Wyoming Electric debt | | 202,000 |
| 202,000 |
| Total Wyoming Electric debt | | 202,000 | | 202,000 | |
| Less unamortized debt discount | | — |
| — |
| Less unamortized debt discount | | 0 | | 0 | |
| Total Wyoming Electric debt, net | | 202,000 |
| 202,000 |
| Total Wyoming Electric debt, net | | 202,000 | | 202,000 | |
| | | | | |
| Total long-term debt | | 3,170,489 |
| 2,977,568 |
| Total long-term debt | | 3,561,345 | | 3,170,489 | |
| Less current maturities | | 5,743 |
| 5,743 |
| Less current maturities | | 8,436 | | 5,743 | |
Less unamortized deferred financing costs (b) | | 24,650 |
| 20,990 |
| |
Less unamortized deferred financing costs (c) | | Less unamortized deferred financing costs (c) | | 24,809 | | 24,650 | |
| Long-term debt, net of current maturities and deferred financing costs | | $ | 3,140,096 |
| $ | 2,950,835 |
| Long-term debt, net of current maturities and deferred financing costs | | $ | 3,528,100 | | $ | 3,140,096 | |
_______________
| |
(a) | Variable interest rate. |
| |
(b) | Includes deferred financing costs associated with our Revolving Credit Facility of $1.7 million and $2.3 million as of December 31, 2019 and December 31, 2018, respectively. |
(a) Variable interest rate.
(b) A reimbursement agreement is in place with Wells Fargo on behalf of Wyoming Electric for the 2009A bonds of $10 million due March 1, 2027 and the 2009B bonds of $7.0 million due September 1, 2021. In the case of default, we hold the assumption of liability for drawings on Wyoming Electric’s Letter of Credit attached to these bonds.
(c) Includes deferred financing costs associated with our Revolving Credit Facility of $1.0 million and $1.7 million as of December 31, 2020 and December 31, 2019, respectively.
Scheduled maturities of long-term debt, excluding amortization of premiums or discounts, for future years are (in thousands):
| | | | | |
| 2021 | $ | 8,436 | |
| 2022 | $ | 0 | |
| 2023 | $ | 525,000 | |
| 2024 | $ | 0 | |
| 2025 | $ | 0 | |
| Thereafter | $ | 3,035,000 | |
|
| | | |
| 2020 | $ | 5,743 |
|
| 2021 | $ | 8,435 |
|
| 2022 | $ | — |
|
| 2023 | $ | 525,000 |
|
| 2024 | $ | 2,855 |
|
| Thereafter | $ | 2,635,000 |
|
Our debt securities contain certain restrictive financial covenants, all of which the Company and its subsidiaries were in compliance with at December 31, 2019.2020. See below for additional information.
Substantially all of the tangible utility property of South Dakota Electric and Wyoming Electric is subject to the lien of indentures securing their first mortgage bonds. First mortgage bonds of South Dakota Electric and Wyoming Electric may be issued in amounts limited by property, earnings and other provisions of the mortgage indentures.
Amortization of Deferred Financing Costs
Our deferred financing costs and associated amortization expense included in Interest expense on the accompanying Consolidated Statements of Income were as follows (in thousands):
| | | | | | | | | | | | | | |
| Deferred Financing Costs Remaining at | | Amortization Expense for the years ended December 31, |
| December 31, 2020 | | 2020 | 2019 | 2018 |
| $ | 24,809 | | | $ | 3,272 | | $ | 3,242 | | $ | 2,829 | |
Debt Transactions
On June 17, 2020, we completed a public debt offering which consisted of $400 million of 2.50% 10-year senior unsecured notes due June 15, 2030. The proceeds were used to repay short-term debt and for working capital and general corporate purposes.
On March 24, 2020, South Dakota Electric paid off its $2.9 million, Series 94A variable rate notes due June 1, 2024. These notes were tendered by the sole investor on March 17, 2020.
On October 3, 2019, we completed a public debt offering of $700 million principal amount in senior unsecured noted.notes. The debt offering consisted of $400 million of 3.05% 10-year senior notes due October 15, 2029 and $300 million of 3.875% 30-year senior notes due October 15, 2049 (together the “Notes”). The proceeds of the Notes were used for the following:
• Repay the $400 million Corporate term loan under the Amended and Restated Credit Agreement due June 17, 2021;
• Retire the $200 million 5.875% senior notes due July 15, 2020; and
• Repay a portion of short-term debt.
On June 17, 2019, we amended our Corporate term loan due July 30, 2020. This amendment increased total commitments to $400 million from $300 million, extended the term through June 17, 2021, and had substantially similar terms and covenants as the amended and restated Revolving Credit Facility. The net proceeds from the increase in total commitments were used to pay down short-term debt. Proceeds from the October 3, 2019 public debt offering were used to repay this term loan.
On December 12, 2018, we paid off the $250 million, 2.5% senior unsecured notes due January 11, 2019. Proceeds from the November 1, 2018 Equity Unit conversion were used to pay off this debt.
On August 17, 2018, we issued $400 million principal amount, 4.350% senior unsecured notes due May 1, 2033. A portion of these notes were issued in a private exchange that resulted in the retirement of all $299 million principal amount of our RSNs due 2028. The remainder of the notes were sold for cash in a public offering, with the net proceeds being used to pay down short-term debt.
The issuance of the $400 million senior notes was the culmination of a series of transactions that also included the contractually required remarketing of such RSNs on behalf of the holders of our Equity Units, with the proceeds being deposited as collateral to secure the obligations of those holders under the purchase contracts included in the Equity Units (see Note 12). As a result of the remarketing, the annual interest rate on such RSNs was automatically reset to 4.579% (however, because the RSNs were then immediately retired, no interest accrued at this reset rate).
On July 30, 2018, we amended and restated our unsecured term loan due August 2019. This amended and restated term loan, with $300 million outstanding at December 31, 2018, had a maturity date of July 30, 2020 and had substantially similar terms and covenants as the amended and restated Revolving Credit Facility. This term loan was later amended on June 17, 2019 and then repaid using proceeds from the October 3, 2019 public debt offering.
Amortization Expense
Our deferred financing costs and associated amortization expense included in Interest expense on the accompanying Consolidated Statements of Income were as follows (in thousands):
|
| | | | | | | | | | | | |
| Deferred Financing Costs Remaining at | | Amortization Expense for the years ended December 31, |
| December 31, 2019 | | 2019 | 2018 | 2017 |
| $ | 24,650 |
| | $ | 3,242 |
| $ | 2,829 |
| $ | 3,349 |
|
Dividend Restrictions
Our credit facility and other debt obligations contain restrictions on the payment of cash dividends when a default or event of default occurs. As of December 31, 2019, we were in compliance with these covenants.
Due to our holding company structure, substantially all of our operating cash flows are provided by dividends paid or distributions made by our subsidiaries. The cash to pay dividends to our shareholders is derived from these cash flows. As a result, certain statutory limitations or regulatory or financing agreements could affect the levels of distributions allowed to be made by our subsidiaries. The following restrictions on distributions from our subsidiaries existed at December 31, 2019:
Our utilities are generally limited to the amount of dividends allowed to be paid to our utility holding company under the Federal Power Act and settlement agreements with state regulatory jurisdictions. As of December 31, 2019, the restricted net assets at our Electric and Gas Utilities were approximately $156 million.
Wyoming Electric and South Dakota Electric are generally limited to the amount of dividends allowed to be paid to our utility holding company under certain financing agreements.
(7) NOTES PAYABLE
We had the following short-term debt outstanding at the Consolidated Balance Sheets date (in thousands):
|
| | | | | | | | | | | | |
| | December 31, 2019 | December 31, 2018 |
| | Balance Outstanding | Letters of Credit (a) | Balance Outstanding | Letters of Credit (a) |
| Revolving Credit Facility | $ | — |
| $ | 30,274 |
| $ | — |
| $ | 22,311 |
|
| CP Program | 349,500 |
| — |
| 185,620 |
| — |
|
| Total | $ | 349,500 |
| $ | 30,274 |
| $ | 185,620 |
| $ | 22,311 |
|
_______________
| |
(a) | Letters of credit are off-balance sheet commitments that reduce the borrowing capacity available on our corporate Revolving Credit Facility. |
Revolving Credit Facility and CP Program
On July 30, 2018, we amended and restated our corporate Revolving Credit Facility, maintaining total commitments of $750 million and extending the term through July 30, 2023 with 2 one year extension options (subject to consent from lenders). This facility is similar to the former revolving credit facility, which includes an accordion feature that allows us, with the consent of the administrative agent, the issuing agents and each bank increasing or providing a new commitment, to increase total commitments up to $1.0 billion. Borrowings continue to be available under a base rate or various Eurodollar rate options. The interest costs associated with the letters of credit or borrowings and the commitment fee under the Revolving Credit Facility are determined based upon our Corporate credit rating from S&P, Fitch, and Moody's for our senior unsecured long-term debt. Based on our credit ratings, the margins for base rate borrowings, Eurodollar borrowings, and letters of credit were 0.125%, 1.125%, and 1.125%, respectively, at December 31, 2019. Based on our credit ratings, a 0.175% commitment fee was charged on the unused amount at December 31, 2019.
We have a $750 million, unsecured CP Program that is backstopped by the Revolving Credit Facility. Amounts outstanding under the Revolving Credit Facility and the CP Program, either individually or in the aggregate, cannot exceed $750 million. The notes issued under the CP Program may have maturities not to exceed 397 days from the date of issuance and bear interest (or are sold at par less a discount representing an interest factor) based on, among other things, the size and maturity date of the note, the frequency of the issuance and our credit ratings. Under the CP Program, any borrowings rank equally with our unsecured debt. Notes under the CP Program are not registered and are offered and issued pursuant to a registration exemption.
Our net short-term borrowings (payments) during 2019 were $164 million. As of December 31, 2019, the weighted average interest rate on short-term borrowings was 2.03%.
Total accumulated deferred financing costs on the Revolving Credit Facility of $6.7 million are being amortized over its estimated useful life and were included in Interest expense on the accompanying Consolidated Statements of Income. See Note 6 above for additional details.
Debt Covenants
Revolving Credit Facility
Under our Revolving Credit Facility and term loan agreements we are required to maintain a Consolidated Indebtedness to Capitalization Ratio not to exceed 0.65 to 1.00. Our Consolidated Indebtedness to Capitalization Ratio is calculated by dividing (i) Consolidated Indebtedness, which includes letters of credit and certain guarantees issued by (ii) Capital, which includes Consolidated Indebtedness plus Net Worth, which excludes noncontrolling interest in subsidiaries. Subject to applicable cure periods, a violation of any of these covenants would constitute an event of default that entitles the lenders to terminate their remaining commitments and accelerate all principal and interest outstanding.
We were in compliance with our covenants at December 31, 2020 as shown below:
| | | | | | | | | | | | | | |
| As of December 31, 2020 | | Covenant Requirement |
| Consolidated Indebtedness to Capitalization Ratio | 59.9% | | Less than | 65% |
Wyoming Electric
Covenants within Wyoming Electric's financing agreements require Wyoming Electric to maintain a debt to capitalization ratio of no more than 0.60 to 1.00. As of December 31, 2019,2020, we were in compliance with these covenants.
(8) ASSET RETIREMENT OBLIGATIONS
We have identified legal retirement obligations related
Due to reclamationour holding company structure, substantially all of mining sites inour operating cash flows are provided by dividends paid or distributions made by our subsidiaries. The cash to pay dividends to our shareholders is derived from these cash flows. As a result, certain statutory limitations or regulatory or financing agreements could affect the Mining segmentlevels of distributions allowed to be made by our subsidiaries. The following restrictions on distributions from our subsidiaries existed at December 31, 2020:
•Our utilities are generally limited to the amount of dividends allowed to be paid to our utility holding company under the Federal Power Act and removalsettlement agreements with state regulatory jurisdictions. As of fuel tanks, transformers containing polychlorinated biphenyls, and an evaporation pond at our Electric Utilities, wind turbines at our Electric Utilities and Power Generation segments, retirement of gas pipelines at our Gas Utilities and removal of asbestosDecember 31, 2020, the restricted net assets at our Electric and Gas Utilities. Utilities were approximately $155 million.
•South Dakota Electric and Wyoming Electric are generally limited to the amount of dividends allowed to be paid to our utility holding company under certain financing agreements.
(10) STOCKHOLDERS' EQUITY
February 2020 Equity Issuance
On February 27, 2020, we issued 1.2 million shares of common stock to a single investor through an underwritten registered transaction at a price of $81.77 per share for proceeds of $99 million, net of $1.0 million of issuance costs. The shares of common stock were offered pursuant to our shelf registration statement filed with the SEC.
At-the-Market Equity Offering Program
On August 3, 2020, we filed a shelf registration and DRSPP with the SEC. In conjunction with these shelf filings, we renewed the ATM. The renewed ATM program, which allows us to sell shares of our common stock, is the same as the prior program other than the aggregate value increased from $300 million to $400 million and a forward sales option was incorporated. This forward sales option allows us to sell our shares through the ATM program at the current trading price without actually issuing any shares to satisfy the sale until a future date. Under the ATM, shares may be offered from time to time pursuant to a sales agreement dated August 3, 2020. Shares of common stock are offered pursuant to our shelf registration statement filed with the SEC.
We periodically reviewdid not issue any common shares under the ATM during the twelve months ended December 31, 2020. During the twelve months ended December 31, 2019, we issued a total of 1,328,332 shares of common stock under the ATM for $99 million, net of $1.2 million in issuance costs. We did not issue any common shares under the ATM during the twelve months ended December 31, 2018.
Shareholder Dividend Reinvestment and update estimated costs related to these AROs. The actual costStock Purchase Plan
We have a DRSPP under which shareholders may vary from estimates becausepurchase additional shares of regulatory requirements, changes in technology and increased costscommon stock through dividend reinvestment and/or optional cash payments at 100% of labor, materials and equipment.
The following tables present the detailsrecent average market price. We have the option of AROs which are includedissuing new shares or purchasing the shares on the accompanying Consolidated Balance Sheets in Other deferred credits and other liabilities (in thousands):open market. We issued new shares until March 1, 2018, after which we began purchasing shares on the open market. At December 31, 2020, there were 163,962 shares of unissued stock available for future offering under the DRSPP.
Preferred Stock
Our articles of incorporation authorize the issuance of 25 million shares of preferred stock of which we had 0 shares of preferred stock outstanding.
|
| | | | | | | | | | | | | | | | | | |
| | December 31, 2018 | Liabilities Incurred | Liabilities Settled | Accretion | Revisions to Prior Estimates (a) (b) | December 31, 2019 |
Electric Utilities (c) | $ | 6,258 |
| $ | — |
| $ | — |
| $ | 385 |
| $ | 2,686 |
| $ | 9,329 |
|
| Gas Utilities | 34,627 |
| — |
| — |
| 1,458 |
| — |
| 36,085 |
|
Power Generation (c) | 300 |
| 3,445 |
| — |
| 158 |
| 836 |
| 4,739 |
|
| Mining | 15,615 |
| — |
| (380 | ) | 740 |
| (1,923 | ) | 14,052 |
|
| Total | $ | 56,800 |
| $ | 3,445 |
| $ | (380 | ) | $ | 2,741 |
| $ | 1,599 |
| $ | 64,205 |
|
|
| | | | | | | | | | | | | | | | | | |
| | December 31, 2017 | Liabilities Incurred | Liabilities Settled | Accretion | Revisions to Prior Estimates (b) | December 31, 2018 |
| Electric Utilities | $ | 6,287 |
| $ | — |
| $ | — |
| $ | 269 |
| $ | 2 |
| $ | 6,558 |
|
| Gas Utilities | 33,238 |
| 152 |
| — |
| 1,237 |
| — |
| 34,627 |
|
| Mining | 12,499 |
| — |
| (4 | ) | 649 |
| 2,471 |
| 15,615 |
|
| Total | $ | 52,024 |
| $ | 152 |
| $ | (4 | ) | $ | 2,155 |
| $ | 2,473 |
| $ | 56,800 |
|
_____________________
| |
(a) | The increase in Electric Utilities Revisions to Prior Estimates was primarily driven by an increase to the estimated cost to decommission certain regulated wind farm assets. |
| |
(b) | The changes in the Mining Revision to Prior Estimates were primarily driven by changes in estimated costs associated with back-filling the pit with overburden removed during the mining process. |
| |
(c) | We reclassified $0.3 million of ARO as of December 31, 2018 related to Busch Ranch I from Electric Utilities to the Power Generation segment as a result of Black Hills Electric Generation’s purchase of its 50% ownership interest in Busch Ranch I. Additional liabilities were incurred in 2019 from new wind assets. |
We also have legally required AROs related to certain assets within our electric transmission and distribution systems. These retirement obligations are pursuant to an easement or franchise agreement and are only required if we discontinue our utility service under such easement or franchise agreement. Accordingly, it is not possible to estimate a time period when these obligations could be settled and therefore, a liability for the cost of these obligations cannot be measured at this time.
(9) (11) RISK MANAGEMENT ACTIVITIESAND DERIVATIVES
Market and Credit Risk Disclosures
Our activities in the regulated and non-regulated energy sectors expose us to a number of risks in the normal operations of our businesses. Depending on the activity, we are exposed to varying degrees of market risk and credit risk. To manage and mitigate these identified risks, we have adopted the Black Hills Corporation Risk Policies and Procedures. Valuation methodologies for our derivatives are detailed within Note 1.
Market Risk
Market risk is the potential loss that may occur as a result of an adverse change in market price, rate or supply. We are exposed, but not limited to, the following market risks, including, but not limited to:risks:
•Commodity price risk associated with our retail natural gas and wholesale electric power marketing activities and our fuel procurement for several of our gas-fired generation assets, which include market fluctuations due to unpredictable factors such as the COVID-19 pandemic, weather, market speculation, pipeline constraints, and other factors that may impact natural gas and electric supply and demand; and
| |
• | Interest rate risk associated with our variable debt as described in •Interest rate risk associated with future debt, including reduced access to liquidity during periods of extreme capital markets volatility, such as the 2008 financial crisis and the COVID-19 pandemic. |
Credit Risk
Credit risk is the risk of financial loss resulting from non-performance of contractual obligations by a counterparty.
For production and generation activities, weWe attempt to mitigate our credit exposure by conducting business primarily with high credit quality entities, setting tenor and credit limits commensurate with counterparty financial strength, obtaining master netting agreements and mitigating credit exposure with less creditworthy counterparties through parental guarantees, prepayments,cash collateral requirements, letters of credit and other security agreements.
We perform ongoing credit evaluations of our customers and adjust credit limits based upon payment history and the customer’s current creditworthiness, as determined by review of their current credit information. We maintain a provision for estimated credit losses based upon historical experience, changes in current market conditions, expected losses and any specific customer collection issue that is identified.
Our credit exposure at December 31, 20192020 was concentrated primarily among retail utility customers, investment grade companies, cooperative utilities and federal agencies.
We continue to monitor COVID-19 impacts and changes to customer load, consistency in customer payments, requests for deferred or discounted payments, and requests for changes to credit limits to quantify estimated future financial impacts to the allowance for credit losses. During the year ended December 31, 2020, the potential economic impact of the COVID-19 pandemic was considered in forward looking projections related to write-off and recovery rates, and resulted in increases to the allowance for credit losses and bad debt expense of $3.3 million. See Note 1 for further information.
Derivatives and Hedging Activity
Our derivative and hedging activities included in the accompanying Consolidated Balance Sheets, Consolidated Statements of Income and Consolidated Statements of Comprehensive Income (Loss) are detailed below and within Note 1012.
Utilities
The operations of our utilities,Utilities, including natural gas sold by our Gas Utilities and natural gas used by our Electric Utilities’ generation plants or those plants under PPAs where our Electric Utilities must provide the generation fuel (tolling agreements), expose our utility customers to volatility in natural gas prices.price volatility. Therefore, as allowed or required by state utility commissions, we have entered into commission-approvedcommission approved hedging programs utilizing natural gas futures, options, over-the-counter swaps and basis swaps to reduce our customers’ underlying exposure to these fluctuations. These transactions are considered derivatives, and in accordance with accounting standards for derivatives and hedging, mark-to-market adjustments are recorded as Derivative assets or Derivative liabilities on the accompanying Consolidated Balance Sheets, net of balance sheet offsetting as permitted by GAAP.
For our regulated Utilities’ hedging plans, unrealized and realized gains and losses, as well as option premiums and commissions on these transactions are recorded as Regulatory assets or Regulatory liabilities in the accompanying Consolidated Balance Sheets in accordance with the state utilityregulatory commission guidelines. When the related costs are recovered through our rates, the hedging activity is recognized in the Consolidated Statements of Income.
We periodically have wholesale power purchase and sale contracts used to manage purchased power costs and load requirements associated with serving our electric customers that are considered derivative instruments due to not qualifying for the normal purchase and normal sales exception to derivative accounting. Changes in the fair value of these commodity derivatives are recognized in the Consolidated Statements of Income.
We buy, sell and deliver natural gas at competitive prices by managing commodity price risk. As a result of these activities, this area of our business is exposed to risks associated with changes in the market price of natural gas. We manage our exposure to such risks using over-the-counter and exchange traded options and swaps with counterparties in anticipation of forecasted purchases and/orand sales during time frames ranging from January 20202021 through December 2021.May 2022. A portion of our over-the-counter swaps have been designated as cash flow hedges to mitigate the commodity price risk associated with deliveries under fixed price forward contracts to deliver gas to our Choice Gas Program customers. The effective portion of the gain or loss on these designated derivatives is reported in AOCI in the accompanying Consolidated Balance Sheets and reclassified into earnings in the ineffective portion, if any,same period that the underlying hedged item is reportedrecognized in Fuel, purchased power and cost of natural gas sold.earnings. Effectiveness of our hedging position is evaluated at least quarterly.
The contract or notional amounts and terms of the natural gas derivative commodity instruments held by our Utilitiesutilities are comprised of both short and long positions. We had the following net long positions as of:
| | | | | | | | | | | | | | |
| December 31, 2020 | December 31, 2019 |
| Notional (MMBtus) | Maximum Term (months) (a) | Notional (MMBtus) | Maximum Term (months) (a) |
| Natural gas futures purchased | 620,000 | | 3 | 1,450,000 | | 12 |
| Natural gas options purchased, net | 3,160,000 | | 3 | 3,240,000 | | 3 |
| Natural gas basis swaps purchased | 900,000 | | 3 | 1,290,000 | | 12 |
Natural gas over-the-counter swaps, net (b) | 3,850,000 | | 17 | 4,600,000 | | 24 |
Natural gas physical commitments, net (c) | 17,513,061 | | 22 | 13,548,235 | | 12 |
Electric wholesale contracts (c) | 219,000 | | 12 | 0 | | 0 |
|
| | | | | | |
| | December 31, 2019 | December 31, 2018 |
| | Notional (MMBtus) | Maximum Term (months) (a) | Notional (MMBtus) | Maximum Term (months) (a) |
| Natural gas futures purchased | 1,450,000 |
| 12 | 4,000,000 |
| 24 |
| Natural gas options purchased, net | 3,240,000 |
| 3 | 4,320,000 |
| 13 |
| Natural gas basis swaps purchased | 1,290,000 |
| 12 | 3,960,000 |
| 24 |
Natural gas over-the-counter swaps, net (b) | 4,600,000 |
| 24 | 3,660,000 |
| 24 |
Natural gas physical commitments, net (c) | 13,548,235 |
| 12 | 18,325,852 |
| 30 |
(a) Term reflects the maximum forward period hedged.
(b) As of December 31, 2020, 914,600 of natural gas over-the-counter swaps purchased were designated as cash flow hedges.
(c) Volumes exclude derivative contracts that qualify for the normal purchase, normal sales exception permitted by GAAP.
__________
| |
(a) | Term reflects the maximum forward period hedged. |
| |
(b) | As of December 31, 2019, 1,415,000 MMBtus of natural gas over-the-counter swaps purchased were designated as cash flow hedges. |
| |
(c) | Volumes exclude contracts that qualify for normal purchase, normal sales exception. |
Based onWe have certain derivative contracts which contain credit provisions. These credit provisions may require the Company to post collateral when credit exposure to the Company is in excess of a negotiated line of unsecured credit. At December 31, 2019 prices,2020, the Company posted $1.5 million related to such provisions, which is included in Other current assets on the Consolidated Balance Sheets.
Derivatives by Balance Sheet Classification
As required by accounting standards for derivatives and hedges, fair values within the following tables are presented on a $0.5 million gain would be realized, reportedgross basis aside from the netting of asset and liability positions. Netting of positions is permitted in pre-tax earningsaccordance with accounting standards for offsetting and reclassified from AOCI duringunder terms of our master netting agreements that allow us to settle positive and negative positions.
The following tables present the next 12 months. As market prices fluctuate, estimatedfair value and actual realized gains or losses will change during future periods.balance sheet classification of our derivative instruments as of December 31, (in thousands):
| | | | | | | | | | | |
| Balance Sheet Location | 2020 | 2019 |
| Derivatives designated as hedges: | | | |
| Asset derivative instruments: | | | |
| Current commodity derivatives | Derivative assets - current | $ | 181 | | $ | 1 | |
| Noncurrent commodity derivatives | Other assets, non-current | 43 | | 3 | |
| Liability derivative instruments: | | | |
| Current commodity derivatives | Derivative liabilities - current | (108) | | (490) | |
| Noncurrent commodity derivatives | Other deferred credits and other liabilities | 0 | | (29) | |
| Total derivatives designated as hedges | $ | 116 | | $ | (515) | |
| | | |
| Derivatives not designated as hedges: | | | |
| Asset derivative instruments: | | | |
| Current commodity derivatives | Derivative assets - current | $ | 1,667 | | $ | 341 | |
| Noncurrent commodity derivatives | Other assets, non-current | 151 | | 2 | |
| Liability derivative instruments: | | | |
| Current commodity derivatives | Derivative liabilities - current | (1,936) | | (1,764) | |
| Noncurrent commodity derivatives | Other deferred credits and other liabilities | 0 | | (63) | |
| Total derivatives not designated as hedges | $ | (118) | | $ | (1,484) | |
Cash Flow HedgesDerivatives Designated as Hedge Instruments
The impact of cash flow hedges on our Consolidated Statements of Income is presented below for the years ended December 31, 2020, 2019 2018 and 2017 (in thousands).2018. Note that this presentation does not reflect the gains or losses arising from the underlying physical transactions; therefore, it is not indicative of the economic profit or loss we realized when the underlying physical and financial transactions were settled.
| | | | | | | | | | | | | | | | | | | | | | | |
| 2020 | 2019 | 2018 | | 2020 | 2019 | 2018 |
| Derivatives in Cash Flow Hedging Relationships | Amount of Gain/(Loss) Recognized in OCI | Income Statement Location | Amount of Gain/(Loss) Reclassified from AOCI into Income |
| (in thousands) | | (in thousands) |
| Interest rate swaps | $ | 2,851 | | $ | 2,851 | | $ | 2,851 | | Interest expense | $ | (2,851) | | $ | (2,851) | | $ | (2,851) | |
| Commodity derivatives | 540 | | (965) | | 1,113 | | Fuel, purchased power and cost of natural gas sold | (601) | | 417 | | (130) | |
| Total | $ | 3,391 | | $ | 1,886 | | $ | 3,964 | | | $ | (3,452) | | $ | (2,434) | | $ | (2,981) | |
As of December 31, 2020, $2.8 million of net losses related to our interest rate swaps and commodity derivatives are expected to be reclassified from AOCI into earnings within the next 12 months. As market prices fluctuate, estimated and actual realized gains or losses will change during future periods.
Derivatives Not Designated as Hedge Instruments
The following table summarizes the impacts of derivative instruments not designated as hedge instruments on our Consolidated Statements of Income for the years ended December 31, 2020, 2019 and 2018. Note that this presentation does not reflect the expected gains or losses arising from the underlying physical transactions; therefore, it is not indicative of the economic gross profit we realized when the underlying physical and financial transactions were settled.
| | | | | | | | | | | | | | |
| | 2020 | 2019 | 2018 |
| Derivatives Not Designated as Hedging Instruments | Income Statement Location | Amount of Gain/(Loss) on Derivatives Recognized in Income |
| | (in thousands) |
| Commodity derivatives - Electric | Fuel, purchased power and cost of natural gas sold | $ | 144 | | $ | 0 | | $ | 0 | |
| Commodity derivatives - Natural Gas | Fuel, purchased power and cost of natural gas sold | 1,640 | | (1,100) | | 1,101 | |
| | $ | 1,784 | | $ | (1,100) | | $ | 1,101 | |
|
| | | | |
| | December 31, 2019 |
| Derivatives in Cash Flow Hedging Relationships | Location of Reclassifications from AOCI into Income | Amount of Gain/(Loss) Reclassified from AOCI into Income |
| | | |
| Interest rate swaps | Interest expense | $ | (2,851 | ) |
| Commodity derivatives | Fuel, purchased power and cost of natural gas sold | 417 |
|
| Total impact from cash flow hedges | | $ | (2,434 | ) |
|
| | | | |
| | December 31, 2018 |
| Derivatives in Cash Flow Hedging Relationships | Location of Reclassifications from AOCI into Income | Amount of Gain/(Loss) Reclassified from AOCI into Income |
| | | |
| Interest rate swaps | Interest expense | $ | (2,851 | ) |
| Commodity derivatives | Fuel, purchased power and cost of natural gas sold | (130 | ) |
| Total impact from cash flow hedges | | $ | (2,981 | ) |
|
| | | | |
| | December 31, 2017 |
| Derivatives in Cash Flow Hedging Relationships | Location of Reclassifications from AOCI into Income | Amount of Gain/(Loss) Reclassified from AOCI into Income |
| | | |
| Interest rate swaps | Interest expense | $ | (2,941 | ) |
| Commodity derivatives | Net (loss) from discontinued operations | 913 |
|
| Commodity derivatives | Fuel, purchased power and cost of natural gas sold | (243 | ) |
| Total impact from cash flow hedges | | $ | (2,271 | ) |
The following table summarizes the gains and losses arising from hedging transactions that were recognized as a component of other comprehensive income (loss) for the years ended December 31, 2019, 2018 and 2017 (in thousands).
|
| | | | | | | | | |
| | December 31, 2019 | December 31, 2018 | December 31, 2017 |
| | |
| Increase (decrease) in fair value: | | | |
| Forward commodity contracts | $ | (548 | ) | $ | 983 |
| $ | 366 |
|
| Recognition of (gains) losses in earnings due to settlements: | | | |
| Interest rate swaps | 2,851 |
| 2,851 |
| 2,941 |
|
| Forward commodity contracts | (417 | ) | 130 |
| (670 | ) |
| Total other comprehensive income (loss) from hedging | $ | 1,886 |
| $ | 3,964 |
| $ | 2,637 |
|
Derivatives Not Designated as Hedge Instruments
The following table summarizes the impacts of derivative instruments not designated as hedge instruments on our Consolidated Statements of Income for the years ended December 31, 2019, 2018 and 2017 (in thousands). Note that this presentation does not reflect the expected gains or losses arising from the underlying physical transactions; therefore, it is not indicative of the economic gross profit we realized when the underlying physical and financial transactions were settled.
|
| | | | | | | | | | |
| | | December 31, 2019 | December 31, 2018 | December 31, 2017 |
| Derivatives Not Designated as Hedging Instruments | Location of Gain/(Loss) on Derivatives Recognized in Income | Amount of Gain/(Loss) on Derivatives Recognized in Income | Amount of Gain/(Loss) on Derivatives Recognized in Income | Amount of Gain/(Loss) on Derivatives Recognized in Income |
| | | | | |
| Commodity derivatives | Fuel, purchased power and cost of natural gas sold | $ | (1,100 | ) | $ | 1,101 |
| $ | (2,207 | ) |
| | | $ | (1,100 | ) | $ | 1,101 |
| $ | (2,207 | ) |
As discussed above, financial instruments used in our regulated utilitiesGas Utilities are not designated as cash flow hedges. However, there is no earnings impact because the unrealized gains and losses arising from the use of these financial instruments are recorded as Regulatory assets or Regulatory liabilities. The net unrealized losses included in our Regulatory assets or Regulatory liability accounts related to the hedgesthese financial instruments in our Gas Utilities were $3.3$2.2 million and $6.2$3.3 million at December 31, 2020 and 2019, respectively. For our Electric Utilities, the unrealized gains and 2018, respectively.
(
10
)
(12) FAIR VALUE MEASUREMENTS
Recurring Fair Value Measurements
Derivatives
The following tables set forth, by level within the fair value hierarchy, our gross assets and gross liabilities and related offsetting as permitted by GAAP that were accounted for at fair value on a recurring basis for derivative instruments.
| | | | | | | | | | | | | | | | | | | | |
| As of December 31, 2020 |
| Level 1 | Level 2 | Level 3 | | Cash Collateral and Counterparty Netting (a) | Total |
| (in thousands) |
| Assets: | | | | | | |
| Commodity derivatives - Gas Utilities | $ | 0 | | $ | 2,504 | | $ | 0 | | | $ | (1,527) | | $ | 977 | |
| Commodity derivatives - Electric Utilities | 0 | | 1,065 | | 0 | | | 0 | | 1,065 | |
| Total | $ | 0 | | $ | 3,569 | | $ | 0 | | | $ | (1,527) | | $ | 2,042 | |
| | | | | | |
| Liabilities: | | | | | | |
| Commodity derivatives - Gas Utilities | $ | 0 | | $ | 2,675 | | $ | 0 | | | $ | (1,552) | | $ | 1,123 | |
| Commodity derivatives - Electric Utilities | 0 | $ | 921 | | 0 | | $ | 0 | | $ | 921 | |
| Total | $ | 0 | | $ | 3,596 | | $ | 0 | | | $ | (1,552) | | $ | 2,044 | |
_______________
(a) As of December 31, 2020, $1.5 million of our commodity derivative gross assets and $1.6 million of our commodity derivative gross liabilities, as well as related gross collateral amounts, were subject to master netting agreements.
| | | | | | | | | | | | | | | | | | | | |
| As of December 31, 2019 |
| Level 1 | Level 2 | Level 3 | | Cash Collateral and Counterparty Netting (a) | Total |
| Assets: | | | | | | |
| Commodity derivatives - Gas Utilities | $ | 0 | | 1,433 | | $ | 0 | | | $ | (1,085) | | $ | 348 | |
| Total | $ | 0 | | $ | 1,433 | | $ | 0 | | | $ | (1,085) | | $ | 348 | |
| | | | | | |
| Liabilities: | | | | | | |
| Commodity derivatives - Gas Utilities | $ | 0 | | $ | 5,254 | | $ | 0 | | | $ | (2,909) | | $ | 2,345 | |
| Total | $ | 0 | | $ | 5,254 | | $ | 0 | | | $ | (2,909) | | $ | 2,345 | |
_______________
(a) As of December 31, 2019, $1.1 million of our commodity derivative assets and $2.9 million of our commodity derivative liabilities, as well as related gross collateral amounts, were subject to master netting agreements.
Pension and Postretirement Plan Assets
A discussion of the fair value of our Pension and Postretirement Plan assets is included in Note 15.
Nonrecurring Fair Value Measurement
A discussion
On August 3, 2020, we filed a shelf registration and DRSPP with the SEC. In conjunction with these shelf filings, we renewed the ATM. The renewed ATM program, which allows us to sell shares of our common stock, is the same as the prior program other than the aggregate value increased from $300 million to $400 million and a forward sales option was incorporated. This forward sales option allows us to sell our shares through the ATM program at the current trading price without actually issuing any shares to satisfy the sale until a future date. Under the ATM, shares may be offered from time to time pursuant to a sales agreement dated August 3, 2020. Shares of common stock are offered pursuant to our shelf registration statement filed with the SEC.
We did not issue any common shares under the ATM during the twelve months ended December 31, 2020. During the twelve months ended December 31, 2019, we issued a total of 1,328,332 shares of common stock under the ATM for $99 million, net of $1.2 million in issuance costs. We did not issue any common shares under the ATM during the twelve months ended December 31, 2018.
Shareholder Dividend Reinvestment and Stock Purchase Plan
We have a DRSPP under which shareholders may purchase additional shares of common stock through dividend reinvestment and/or optional cash payments at 100% of the recent average market price. We have the option of issuing new shares or purchasing the shares on the open market. We issued new shares until March 1, 2018, after which we began purchasing shares on the open market. At December 31, 2020, there were 163,962 shares of unissued stock available for future offering under the DRSPP.
Preferred Stock
Our articles of incorporation authorize the issuance of 25 million shares of preferred stock of which we had 0 shares of preferred stock outstanding.
(11) RISK MANAGEMENT AND DERIVATIVES
Market and Credit Risk Disclosures
Our activities in the regulated and non-regulated energy sectors expose us to a number of risks in the normal operations of our businesses. Depending on the activity, we are exposed to varying degrees of market risk and credit risk. To manage and mitigate these identified risks, we have adopted the Black Hills Corporation Risk Policies and Procedures. Valuation methodologies for our derivatives are detailed within Note 1.
Market Risk
Market risk is the potential loss that may occur as a result of an adverse change in market price, rate or supply. We are exposed, but not limited to, the following market risks:
•Commodity price risk associated with our retail natural gas and wholesale electric power marketing activities and our fuel procurement for several of our gas-fired generation assets, which include market fluctuations due to unpredictable factors such as the COVID-19 pandemic, weather, market speculation, pipeline constraints, and other factors that may impact natural gas and electric supply and demand; and
•Interest rate risk associated with future debt, including reduced access to liquidity during periods of extreme capital markets volatility, such as the 2008 financial crisis and the COVID-19 pandemic.
Credit Risk
Credit risk is the risk of financial loss resulting from non-performance of contractual obligations by a counterparty.
We attempt to mitigate our credit exposure by conducting business primarily with high credit quality entities, setting tenor and credit limits commensurate with counterparty financial strength, obtaining master netting agreements and mitigating credit exposure with less creditworthy counterparties through parental guarantees, cash collateral requirements, letters of credit and other security agreements.
We perform ongoing credit evaluations of our customers and adjust credit limits based upon payment history and the customer’s current creditworthiness, as determined by review of their current credit information. We maintain a provision for estimated credit losses based upon historical experience, changes in current market conditions, expected losses and any specific customer collection issue that is identified. Our credit exposure at December 31, 2020 was concentrated primarily among retail utility customers, investment grade companies, cooperative utilities and federal agencies.
We continue to monitor COVID-19 impacts and changes to customer load, consistency in customer payments, requests for deferred or discounted payments, and requests for changes to credit limits to quantify estimated future financial impacts to the allowance for credit losses. During the year ended December 31, 2020, the potential economic impact of the COVID-19 pandemic was considered in forward looking projections related to write-off and recovery rates, and resulted in increases to the allowance for credit losses and bad debt expense of $3.3 million. See Note 1 for further information.
Derivatives and Hedging Activity
Our derivative and hedging activities included in the accompanying Consolidated Balance Sheets, Consolidated Statements of Income and Consolidated Statements of Comprehensive Income (Loss) are detailed below and within Note 12.
The operations of our Utilities, including natural gas sold by our Gas Utilities and natural gas used by our Electric Utilities’ generation plants or those plants under PPAs where our Electric Utilities must provide the generation fuel (tolling agreements), expose our utility customers to natural gas price volatility. Therefore, as allowed or required by state utility commissions, we have entered into commission approved hedging programs utilizing natural gas futures, options, over-the-counter swaps and basis swaps to reduce our customers’ underlying exposure to these fluctuations. These transactions are considered derivatives, and in accordance with accounting standards for derivatives and hedging, mark-to-market adjustments are recorded as Derivative assets or Derivative liabilities on the accompanying Consolidated Balance Sheets, net of balance sheet offsetting as permitted by GAAP.
For our regulated Utilities’ hedging plans, unrealized and realized gains and losses, as well as option premiums and commissions on these transactions are recorded as Regulatory assets or Regulatory liabilities in the accompanying Consolidated Balance Sheets in accordance with state regulatory commission guidelines. When the related costs are recovered through our rates, the hedging activity is recognized in the Consolidated Statements of Income.
We periodically have wholesale power purchase and sale contracts used to manage purchased power costs and load requirements associated with serving our electric customers that are considered derivative instruments due to not qualifying for the normal purchase and normal sales exception to derivative accounting. Changes in the fair value of these commodity derivatives are recognized in the Consolidated Statements of Income.
We buy, sell and deliver natural gas at competitive prices by managing commodity price risk. As a result of these activities, this area of our investmentbusiness is exposed to risks associated with changes in equity securitiesthe market price of natural gas. We manage our exposure to such risks using over-the-counter and exchange traded options and swaps with counterparties in anticipation of forecasted purchases and sales during time frames ranging from January 2021 through May 2022. A portion of our over-the-counter swaps have been designated as cash flow hedges to mitigate the commodity price risk associated with deliveries under fixed price forward contracts to deliver gas to our Choice Gas Program customers. The gain or loss on these designated derivatives is reported in AOCI in the accompanying Consolidated Balance Sheets and reclassified into earnings in the same period that the underlying hedged item is recognized in earnings. Effectiveness of our hedging position is evaluated at least quarterly.
The contract or notional amounts and terms of the natural gas derivative commodity instruments held by our utilities are comprised of both short and long positions. We had the following net long positions as of:
| | | | | | | | | | | | | | |
| December 31, 2020 | December 31, 2019 |
| Notional (MMBtus) | Maximum Term (months) (a) | Notional (MMBtus) | Maximum Term (months) (a) |
| Natural gas futures purchased | 620,000 | | 3 | 1,450,000 | | 12 |
| Natural gas options purchased, net | 3,160,000 | | 3 | 3,240,000 | | 3 |
| Natural gas basis swaps purchased | 900,000 | | 3 | 1,290,000 | | 12 |
Natural gas over-the-counter swaps, net (b) | 3,850,000 | | 17 | 4,600,000 | | 24 |
Natural gas physical commitments, net (c) | 17,513,061 | | 22 | 13,548,235 | | 12 |
Electric wholesale contracts (c) | 219,000 | | 12 | 0 | | 0 |
__________
(a) Term reflects the maximum forward period hedged.
(b) As of December 31, 2020, 914,600 of natural gas over-the-counter swaps purchased were designated as cash flow hedges.
(c) Volumes exclude derivative contracts that qualify for the normal purchase, normal sales exception permitted by GAAP.
We have certain derivative contracts which contain credit provisions. These credit provisions may require the Company to post collateral when credit exposure to the Company is in excess of a
privately held oil and gas company, a Level 3 asset,negotiated line of unsecured credit. At December 31, 2020, the Company posted $1.5 million related to such provisions, which is included in
Other current assets on the Consolidated Balance Sheets. Note 1.
Recurring Fair Value MeasurementsDerivatives by Balance Sheet Classification
Amounts included in cash collateralAs required by accounting standards for derivatives and counterparty netting inhedges, fair values within the following tables representare presented on a gross basis aside from the impactnetting of legally enforceableasset and liability positions. Netting of positions is permitted in accordance with accounting standards for offsetting and under terms of our master netting agreements that allow us to settle positive and negative positions, nettingpositions.
The following tables present the fair value and balance sheet classification of assetour derivative instruments as of December 31, (in thousands):
| | | | | | | | | | | |
| Balance Sheet Location | 2020 | 2019 |
| Derivatives designated as hedges: | | | |
| Asset derivative instruments: | | | |
| Current commodity derivatives | Derivative assets - current | $ | 181 | | $ | 1 | |
| Noncurrent commodity derivatives | Other assets, non-current | 43 | | 3 | |
| Liability derivative instruments: | | | |
| Current commodity derivatives | Derivative liabilities - current | (108) | | (490) | |
| Noncurrent commodity derivatives | Other deferred credits and other liabilities | 0 | | (29) | |
| Total derivatives designated as hedges | $ | 116 | | $ | (515) | |
| | | |
| Derivatives not designated as hedges: | | | |
| Asset derivative instruments: | | | |
| Current commodity derivatives | Derivative assets - current | $ | 1,667 | | $ | 341 | |
| Noncurrent commodity derivatives | Other assets, non-current | 151 | | 2 | |
| Liability derivative instruments: | | | |
| Current commodity derivatives | Derivative liabilities - current | (1,936) | | (1,764) | |
| Noncurrent commodity derivatives | Other deferred credits and other liabilities | 0 | | (63) | |
| Total derivatives not designated as hedges | $ | (118) | | $ | (1,484) | |
Derivatives Designated as Hedge Instruments
The impact of cash flow hedges on our Consolidated Statements of Income is presented below for the years ended December 31, 2020, 2019 and liability positions permitted2018. Note that this presentation does not reflect the gains or losses arising from the underlying physical transactions; therefore, it is not indicative of the economic profit or loss we realized when the underlying physical and financial transactions were settled.
| | | | | | | | | | | | | | | | | | | | | | | |
| 2020 | 2019 | 2018 | | 2020 | 2019 | 2018 |
| Derivatives in Cash Flow Hedging Relationships | Amount of Gain/(Loss) Recognized in OCI | Income Statement Location | Amount of Gain/(Loss) Reclassified from AOCI into Income |
| (in thousands) | | (in thousands) |
| Interest rate swaps | $ | 2,851 | | $ | 2,851 | | $ | 2,851 | | Interest expense | $ | (2,851) | | $ | (2,851) | | $ | (2,851) | |
| Commodity derivatives | 540 | | (965) | | 1,113 | | Fuel, purchased power and cost of natural gas sold | (601) | | 417 | | (130) | |
| Total | $ | 3,391 | | $ | 1,886 | | $ | 3,964 | | | $ | (3,452) | | $ | (2,434) | | $ | (2,981) | |
As of December 31, 2020, $2.8 million of net losses related to our interest rate swaps and commodity derivatives are expected to be reclassified from AOCI into earnings within the next 12 months. As market prices fluctuate, estimated and actual realized gains or losses will change during future periods.
Derivatives Not Designated as Hedge Instruments
The following table summarizes the impacts of derivative instruments not designated as hedge instruments on our Consolidated Statements of Income for the years ended December 31, 2020, 2019 and 2018. Note that this presentation does not reflect the expected gains or losses arising from the underlying physical transactions; therefore, it is not indicative of the economic gross profit we realized when the underlying physical and financial transactions were settled.
| | | | | | | | | | | | | | |
| | 2020 | 2019 | 2018 |
| Derivatives Not Designated as Hedging Instruments | Income Statement Location | Amount of Gain/(Loss) on Derivatives Recognized in Income |
| | (in thousands) |
| Commodity derivatives - Electric | Fuel, purchased power and cost of natural gas sold | $ | 144 | | $ | 0 | | $ | 0 | |
| Commodity derivatives - Natural Gas | Fuel, purchased power and cost of natural gas sold | 1,640 | | (1,100) | | 1,101 | |
| | $ | 1,784 | | $ | (1,100) | | $ | 1,101 | |
As discussed above, financial instruments used in accordance with accounting standards for offsetting as wellour regulated Gas Utilities are not designated as cash collateral posted withflow hedges. However, there is no earnings impact because the same counterparties.
A discussionunrealized gains and losses arising from the use of fair value ofthese financial instruments isare recorded as Regulatory assets or Regulatory liabilities. The net unrealized losses included in our Regulatory assets or Regulatory liability accounts related to these financial instruments in our Gas Utilities were $2.2 million and $3.3 million at December 31, 2020 and 2019, respectively. For our Electric Utilities, the unrealized gains and losses arising from these derivatives are recognized in the Consolidated Statements of Income.
Note 11
(12) FAIR VALUE MEASUREMENTS
.
Recurring Fair Value Measurements
Derivatives
The following tables set forth, by level within the fair value hierarchy, our gross assets and gross liabilities and related offsetting as permitted by GAAP that were accounted for at fair value on a recurring basis for derivative instruments (in thousands):instruments.
| | | | | | | | | | | | | | | | | | | | |
| As of December 31, 2020 |
| Level 1 | Level 2 | Level 3 | | Cash Collateral and Counterparty Netting (a) | Total |
| (in thousands) |
| Assets: | | | | | | |
| Commodity derivatives - Gas Utilities | $ | 0 | | $ | 2,504 | | $ | 0 | | | $ | (1,527) | | $ | 977 | |
| Commodity derivatives - Electric Utilities | 0 | | 1,065 | | 0 | | | 0 | | 1,065 | |
| Total | $ | 0 | | $ | 3,569 | | $ | 0 | | | $ | (1,527) | | $ | 2,042 | |
| | | | | | |
| Liabilities: | | | | | | |
| Commodity derivatives - Gas Utilities | $ | 0 | | $ | 2,675 | | $ | 0 | | | $ | (1,552) | | $ | 1,123 | |
| Commodity derivatives - Electric Utilities | 0 | $ | 921 | | 0 | | $ | 0 | | $ | 921 | |
| Total | $ | 0 | | $ | 3,596 | | $ | 0 | | | $ | (1,552) | | $ | 2,044 | |
_______________
(a) As of December 31, 2020, $1.5 million of our commodity derivative gross assets and $1.6 million of our commodity derivative gross liabilities, as well as related gross collateral amounts, were subject to master netting agreements.
|
| | | | | | | | | | | | | | | | |
| | As of December 31, 2019 |
| | Level 1 | Level 2 | Level 3 | | Cash Collateral and Counterparty Netting | Total |
| Assets: | | | | | | |
| Commodity derivatives - Utilities | $ | — |
| $ | 1,433 |
| $ | — |
| | $ | (1,085 | ) | $ | 348 |
|
| Total | $ | — |
| $ | 1,433 |
| $ | — |
| | $ | (1,085 | ) | $ | 348 |
|
| | | | | | | |
| Liabilities: | | | | | | |
| Commodity derivatives - Utilities | $ | — |
| $ | 5,254 |
| $ | — |
| | $ | (2,909 | ) | $ | 2,345 |
|
| Total | $ | — |
| $ | 5,254 |
| $ | — |
| | $ | (2,909 | ) | $ | 2,345 |
|
104
| | | | | | | | | | | | | | | | | | | | |
| As of December 31, 2019 |
| Level 1 | Level 2 | Level 3 | | Cash Collateral and Counterparty Netting (a) | Total |
| Assets: | | | | | | |
| Commodity derivatives - Gas Utilities | $ | 0 | | 1,433 | | $ | 0 | | | $ | (1,085) | | $ | 348 | |
| Total | $ | 0 | | $ | 1,433 | | $ | 0 | | | $ | (1,085) | | $ | 348 | |
| | | | | | |
| Liabilities: | | | | | | |
| Commodity derivatives - Gas Utilities | $ | 0 | | $ | 5,254 | | $ | 0 | | | $ | (2,909) | | $ | 2,345 | |
| Total | $ | 0 | | $ | 5,254 | | $ | 0 | | | $ | (2,909) | | $ | 2,345 | |
_______________
(a) As of December 31, 2019, $1.1 million of our commodity derivative assets and $2.9 million of our commodity derivative liabilities, as well as related gross collateral amounts, were subject to master netting agreements.
|
| | | | | | | | | | | | | | | | |
| | As of December 31, 2018 |
| | Level 1 | Level 2 | Level 3 | | Cash Collateral and Counterparty Netting | Total |
| Assets: | | | | | | |
| Commodity derivatives - Utilities | $ | — |
| 2,927 |
| $ | — |
| | $ | (1,408 | ) | $ | 1,519 |
|
| Total | $ | — |
| $ | 2,927 |
| $ | — |
| | $ | (1,408 | ) | $ | 1,519 |
|
| | | | | | | |
| Liabilities: | | | | | | |
| Commodity derivatives - Utilities | $ | — |
| $ | 6,801 |
| $ | — |
| | $ | (5,794 | ) | $ | 1,007 |
|
| Total | $ | — |
| $ | 6,801 |
| $ | — |
| | $ | (5,794 | ) | $ | 1,007 |
|
Fair Value Measures by Balance Sheet Classification
As required by accounting standards for derivatives and hedges, fair values within the following tables are presented on a gross basis, aside from the nettingA discussion of asset and liability positions permitted in accordance with accounting standards for offsetting and under terms of our master netting agreements and the impact of legally enforceable master netting agreements that allow us to settle positive and negative positions.
The following tables present the fair value and balance sheet classification of our derivative instruments as of December 31, (in thousands):
|
| | | | | | | |
| | | December 31, |
| | Balance Sheet Location | 2019 | 2018 |
| Derivatives designated as hedges: | | | |
| Asset derivative instruments: | | | |
| Current commodity derivatives | Derivative assets - current | $ | 1 |
| $ | 415 |
|
| Noncurrent commodity derivatives | Other assets, non-current | 3 |
| 18 |
|
| Liability derivative instruments: | | | |
| Current commodity derivatives | Derivative liabilities - current | (490 | ) | (114 | ) |
| Noncurrent commodity derivatives | Other deferred credits and other liabilities | (29 | ) | (4 | ) |
| Total derivatives designated as hedges | $ | (515 | ) | $ | 315 |
|
| | | | |
| Not designated as hedges: | | | |
| Asset derivative instruments: | | | |
| Current commodity derivatives | Derivative assets - current | $ | 341 |
| $ | 1,085 |
|
| Noncurrent commodity derivatives | Other assets, non-current | 2 |
| 1 |
|
| Liability derivative instruments: | | | |
| Current commodity derivatives | Derivative liabilities - current | (1,764 | ) | (833 | ) |
| Noncurrent commodity derivatives | Other deferred credits and other liabilities | (63 | ) | (56 | ) |
| Total derivatives not designated as hedges | $ | (1,484 | ) | $ | 197 |
|
Derivatives Offsetting
ItPension and Postretirement Plan assets is our policy to offset, in our Consolidated Balance Sheets, contracts which provide for legally enforceable netting of our accounts receivable and payable and derivative activities.
As required by accounting standards for derivatives and hedges, fair values within the following tables reconcile the gross amounts to the net amounts. Amounts included in Gross Amounts Offset on Consolidated Balance Sheets in the following tables include the netting of asset and liability positions permitted in accordance with accounting standards for offsetting as well as the impact of legally enforceable master netting agreements that allow us to settle positive and negative positions as well as cash collateral posted with the same counterparties. Additionally, the amounts reflect cash collateral on deposit in margin accounts at December 31, 2019 and 2018, to collateralize certain financial instruments, which are included in Derivative assets and/or Derivative liabilities. Therefore, the gross amounts are not indicative of either our actual credit exposure or net economic exposure.
Offsetting of derivative assets and derivative liabilities on our Consolidated Balance Sheets at December 31, 2019 was as follows (in thousands):
|
| | | | | | | | | |
| Derivative Assets | Gross Amounts of Derivative Assets | Gross Amounts Offset on Consolidated Balance Sheets | Net Amount of Total Derivative Assets on Consolidated Balance Sheets |
| Commodity derivative assets subject to a master netting agreement or similar arrangement | $ | 1,085 |
| $ | (1,085 | ) | $ | — |
|
| Commodity derivative assets not subject to a master netting agreement or similar arrangement | 348 |
| — |
| 348 |
|
| Total derivative assets | $ | 1,433 |
| $ | (1,085 | ) | $ | 348 |
|
|
| | | | | | | | | |
| Derivative Liabilities | Gross Amounts of Derivative Liabilities | Gross Amounts Offset on Consolidated Balance Sheets | Net Amount of Total Derivative Liabilities on Consolidated Balance Sheets |
| Commodity derivative liabilities subject to a master netting agreement or similar arrangement | $ | 2,908 |
| $ | (2,908 | ) | $ | — |
|
| Commodity derivative liabilities not subject to a master netting agreement or similar arrangement | 2,345 |
| — |
| 2,345 |
|
| Total derivative liabilities | $ | 5,253 |
| $ | (2,908 | ) | $ | 2,345 |
|
Offsetting of derivative assets and derivative liabilities on our Consolidated Balance Sheets as of December 31, 2018 were as follows (in thousands):
|
| | | | | | | | | |
| Derivative Assets | Gross Amounts of Derivative Assets | Gross Amounts Offset on Consolidated Balance Sheets | Net Amount of Total Derivative Assets on Consolidated Balance Sheets |
| Commodity derivative assets subject to a master netting agreement or similar arrangement | $ | 1,408 |
| $ | (1,408 | ) | $ | — |
|
| Commodity derivative assets not subject to a master netting agreement or similar arrangement | 1,519 |
| — |
| 1,519 |
|
| Total derivative assets | $ | 2,927 |
| $ | (1,408 | ) | $ | 1,519 |
|
|
| | | | | | | | | |
| Derivative Liabilities | Gross Amounts of Derivative Liabilities | Gross Amounts Offset on Consolidated Balance Sheets | Net Amount of Total Derivative Liabilities on Consolidated Balance Sheets |
| Commodity derivative liabilities subject to a master netting agreement or similar arrangement | $ | 5,794 |
| $ | (5,794 | ) | $ | — |
|
| Commodity derivative liabilities not subject to a master netting agreement or similar arrangement | 1,007 |
| — |
| 1,007 |
|
| Total derivative liabilities | $ | 6,801 |
| $ | (5,794 | ) | $ | 1,007 |
|
(11) FAIR VALUE OF FINANCIAL INSTRUMENTS
The estimated fair values of our financial instruments, excluding derivatives which are presented in Note 1015, were as follows at December 31 (in thousands): |
| | | | | | | | | | | | |
| | 2019 | 2018 |
| | Carrying Amount | Fair Value | Carrying Amount | Fair Value |
Cash and cash equivalents (a) | $ | 9,777 |
| $ | 9,777 |
| $ | 20,776 |
| $ | 20,776 |
|
Restricted cash and equivalents (a) | $ | 3,881 |
| $ | 3,881 |
| $ | 3,369 |
| $ | 3,369 |
|
Notes payable (b) | $ | 349,500 |
| $ | 349,500 |
| $ | 185,620 |
| $ | 185,620 |
|
Long-term debt, including current maturities (c) | $ | 3,145,839 |
| $ | 3,479,367 |
| $ | 2,956,578 |
| $ | 3,039,108 |
|
_______________
| |
(a) | Carrying value approximates fair value. Cash, cash equivalents, and restricted cash are classified in Level 1 in the fair value hierarchy. |
| |
(b) | Notes payable consist of commercial paper borrowings. Carrying value approximates fair value due to the short-term length of maturity; since these borrowings are not traded on an exchange, they are classified in Level 2 in the fair value hierarchy. |
| |
(c) | Long-term debt is valued based on observable inputs available either directly or indirectly for similar liabilities in active markets and therefore is classified in Level 2 in the fair value hierarchy. Carrying amount of long-term debt is net of deferred financing costs. |
Cash and Cash Equivalents
Included in cash and cash equivalents is cash, money market mutual funds, and term deposits. As part of our cash management process, excess operating cash is invested in money market mutual funds with our bank. Money market mutual funds are not deposits and are not insured by the U.S. Government, the FDIC, or any other government agency and involve investment risk including possible loss of principal. We believe, however, that the market risk arising from holding these financial instruments is minimal.
Restricted Cash and Equivalents
Restricted cash and cash equivalents represent restricted cash and uninsured term deposits.
Notes Payable and Long-Term Debt
For additional information on our notes payable and long-term debt, see Note 6 and Note 7.
(12) EQUITY
At-the-Market Equity Offering Program
OurOn August 3, 2020, we filed a shelf registration and DRSPP with the SEC. In conjunction with these shelf filings, we renewed the ATM. The renewed ATM equity offering program, which allows us to sell shares of our common stock, with anis the same as the prior program other than the aggregate value of upincreased from $300 million to $300 million.
The$400 million and a forward sales option was incorporated. This forward sales option allows us to sell our shares through the ATM program at the current trading price without actually issuing any shares to satisfy the sale until a future date. Under the ATM, shares may be offered from time to time pursuant to a sales agreement dated August 4, 2017.3, 2020. Shares of common stock are
offered pursuant to our shelf registration statement filed with the SEC.
We did not issue any common shares under the ATM during the twelve months ended December 31, 2020. During the twelve months ended December 31, 2019, we issued a total of 1,328,332 shares of common stock under the ATM equity offering program for $99 million, net of $1.2 million in issuance costs. As of December 31, 2019, all shares were settled. We did not issue any common shares under the ATM equity offering program during the twelve months ended December 31, 2018 and 2017.
Equity Units
On November 23, 2015, we issued 5.98 million Equity Units for total gross proceeds of $299 million. Each Equity Unit had a stated amount of $50.00 and consisted of (i) a forward purchase contract to purchase the Company’s common stock and (ii) a 1/20, or 5%, undivided beneficial ownership interest in $1,000 principal amount of RSNs due 2028.
2018.
On October 29, 2018, we announced the settlement rate for the stock purchase contracts that are components of the Equity Units issued on November 23, 2015. The settlement rate was based upon the minimum settlement rate, as adjusted to account for past dividends, because the average of the closing price per share of BHC common stock on the New York Stock Exchange for the 20 consecutive trading days ending on October 29, 2018 exceeded the threshold appreciation price. Each holder of the Equity Units on that date, following payment of $50.00 for each unit which it holds, received 1.0655 shares of BHC common stock for each such unit. The holders' obligations to make such payments were satisfied with proceeds generated by the successful remarketing on August 17, 2018, of the RSNs that formerly constituted a component of the Equity Units. See Note 6 for additional information.
Upon settlement of all outstanding stock purchase obligations, the Company received gross proceeds of approximately $299 million in exchange for approximately 6.372 million shares of common stock. Proceeds were used to pay down the $250 million senior unsecured notes due January 11, 2019, with the balance used to pay down short-term debt.
Equity Compensation Plans`
Our 2015 Omnibus Incentive Plan allows for the granting of stock, restricted stock, restricted stock units, stock options and performance shares. We had 672,049 shares available to grant at December 31, 2019.
Compensation expense is determined using the grant date fair value estimated in accordance with the provisions of accounting standards for stock compensation and is recognized over the vesting periods of the individual awards. As of December 31, 2019, total unrecognized compensation expense related to non-vested stock awards was approximately $12 million and is expected to be recognized over a weighted-average period of 2 years. Stock-based compensation expense included in Operations and maintenance on the accompanying Consolidated Statements of Income was as follows for the years ended December 31 (in thousands):
|
| | | | | | | | | |
| | 2019 | 2018 | 2017 |
| Stock-based compensation expense | $ | 12,095 |
| $ | 12,390 |
| $ | 7,626 |
|
Stock Options
The Company has not issued any stock options since 2014 and has 14,000 stock options outstanding at December 31, 2019. The amount of stock options granted during the last three years, and related exercise activity are not material to the Company’s consolidated financial statements.
Restricted Stock
The fair value of restricted stock and restricted stock unit awards equals the market price of our stock on the date of grant.
The shares carry a restriction on the ability to sell the shares until the shares vest. The shares substantially vest over 3 years, contingent on continued employment. Compensation expense related to the awards is recognized over the vesting period.
A summary of the status of the restricted stock and restricted stock units at December 31, 2019, was as follows:
|
| | | | | |
| | Restricted Stock | Weighted-Average Grant Date Fair Value |
| | (in thousands) | |
| Balance at beginning of period | 236 |
| $ | 57.50 |
|
| Granted | 92 |
| 73.66 |
|
| Vested | (120 | ) | 56.33 |
|
| Forfeited | (16 | ) | 62.02 |
|
| Balance at end of period | 192 |
| $ | 65.66 |
|
The weighted-average grant-date fair value of restricted stock granted and the total fair value of shares vested during the years ended December 31, were as follows:
|
| | | | | | |
| | Weighted-Average Grant Date Fair Value | Total Fair Value of Shares Vested |
| | | (in thousands) |
| 2019 | $ | 73.66 |
| $ | 8,438 |
|
| 2018 | $ | 57.31 |
| $ | 6,776 |
|
| 2017 | $ | 60.63 |
| $ | 7,909 |
|
As of December 31, 2019, there was $9.0 million of unrecognized compensation expense related to non-vested restricted stock that is expected to be recognized over a weighted-average period of 2.1 years.
Performance Share Plan
Certain officers of the Company and its subsidiaries are participants in a performance share award plan, a market-based plan. Performance shares are awarded based on our total shareholder return over designated performance periods as measured against a selected peer group. In addition, certain stock price performance must be achieved for a payout to occur. The final value of the performance shares will vary according to the number of shares of common stock that are ultimately granted based upon the actual level of attainment of the performance criteria.
The performance awards are paid 50% in cash and 50% in common stock. The cash portion accrued is classified as a liability and the stock portion is classified as equity. In the event of a change-in-control, performance awards are paid 100% in cash. If it is determined that a change-in-control is probable, the equity portion of $2.9 million at December 31, 2019 would be reclassified as a liability.
Outstanding performance periods at December 31 were as follows (shares in thousands):
|
| | | | |
| | | | Possible Payout Range of Target |
| Grant Date | Performance Period | Target Grant of Shares | Minimum | Maximum |
| January 1, 2017 | January 1, 2017 - December 31, 2019 | 46 | 0% | 200% |
| January 1, 2018 | January 1, 2018 - December 31, 2020 | 50 | 0% | 200% |
| January 1, 2019 | January 1, 2019 - December 31, 2021 | 37 | 0% | 200% |
A summary of the status of the Performance Share Plan at December 31 was as follows:
|
| | | | | | | | | | |
| | Equity Portion | Liability Portion |
| | | Weighted-Average Grant Date Fair Value (a) | | Weighted-Average Fair Value at |
| | Shares | Shares | December 31, 2019 |
| | (in thousands) | | (in thousands) | |
| Performance Shares balance at beginning of period | 77 |
| $ | 57.66 |
| 77 |
| |
| Granted | 20 |
| 68.72 |
| 20 |
| |
| Forfeited | (4 | ) | 64.60 |
| (4 | ) | |
| Vested | (26 | ) | 47.76 |
| (26 | ) | |
| Performance Shares balance at end of period | 67 |
| $ | 64.32 |
| 67 |
| $ | 89.63 |
|
_____________________
| |
(a) | The grant date fair values for the performance shares granted in 2019, 2018 and 2017 were determined by Monte Carlo simulation using a blended volatility of 21%, 21% and 23%, respectively, comprised of 50% historical volatility and 50% implied volatility and the average risk-free interest rate of the three-year United States Treasury security rate in effect as of the grant date. |
The weighted-average grant-date fair value of performance share awards granted was as follows in the years ended:
|
| | | |
| | Weighted Average Grant Date Fair Value |
| December 31, 2019 | $ | 68.72 |
|
| December 31, 2018 | $ | 61.82 |
|
| December 31, 2017 | $ | 63.52 |
|
Performance plan payouts have been as follows (in thousands):
|
| | | | | | | | | |
| Performance Period | Year Paid | Stock Issued | Cash Paid | Total Intrinsic Value |
| January 1, 2016 to December 31, 2018 | 2019 | 44 |
| $ | 2,860 |
| $ | 5,720 |
|
| January 1, 2015 to December 31, 2017 | | — |
| — |
| — |
|
| January 1, 2014 to December 31, 2016 | | — |
| — |
| — |
|
On January 28, 2020, the Compensation Committee of our Board of Directors determined that the Company’s total shareholder return for the January 1, 2017 through December 31, 2019 performance period was at the 36.3 percentile of its peer group and confirmed a payout equal to 58.86% of target shares, valued at $2.2 million. The payout was fully accrued at December 31, 2019.
As of December 31, 2019, there was $3.4 million of unrecognized compensation expense related to outstanding performance share plans that is expected to be recognized over a weighted-average period of 1.6 years.
Shareholder Dividend Reinvestment and Stock Purchase Plan
We have a DRSPP under which shareholders may purchase additional shares of common stock through dividend reinvestment and/or optional cash payments at 100% of the recent average market price. We have the option of issuing new shares or purchasing the shares on the open market. We issued new shares until March 1, 2018, after which we began purchasing shares on the open market. At December 31, 2019,2020, there were 214,967163,962 shares of unissued stock available for future offering under the plan.DRSPP.
Preferred StockElectric Utilities Regulatory Activity
Our articlesSouth Dakota Electric
Settlement
On January 7, 2020, South Dakota Electric received approval from the SDPUC on a settlement agreement to extend the 6-year moratorium period by an additional 3 years to June 30, 2026. Also, as part of incorporation authorize the issuancesettlement, we withdrew our application for deferred accounting treatment and expensed $5.4 million of 25development costs in 2019 related to projects we no longer intend to construct. This settlement amends a previous agreement approved by the SDPUC on June 16, 2017, whereby South Dakota Electric would not increase base rates, absent an extraordinary event, for a 6 year moratorium period effective July 1, 2017. The moratorium period also includes suspension of both the TFA and EIA.
FERC Formula Rate
The annual rate determination process is governed by the FERC formula rate protocols established in the filed FERC joint-access transmission tariff. Effective January 1, 2020 the annual revenue requirement was $27 million sharesand included estimated weighted average capital additions of preferred stock$33 million for 2019 and 2020 combined. The annual transmission revenue requirement has a true-up mechanism that is recorded in June of which we had 0 shares of preferred stock outstanding.each year.
Noncontrolling Interest in Subsidiary
Black Hills Wyoming and Wyoming Electric
Wygen 1 FERC Filing
On October 15, 2020, the FERC approved a settlement agreement that represents a resolution of all issues in the joint application filed by Wyoming Electric and Black Hills Wyoming on August 2, 2019 for approval of a new 60 MW PPA. Under the terms of the settlement, Wyoming Electric will continue to receive 60 MW of capacity and energy from the Wygen I power plant. The new agreement will commence on January 1, 2022, replace the existing PPA and continue for 11 years.
Gas Utilities Regulatory Activity
Colorado IPP ownsGas
Jurisdictional Consolidation and operatesRate Reviews
On September 11, 2020, Colorado Gas filed a 200 MW, combined-cyclerate review with the CPUC seeking recovery on significant infrastructure investments in its 7,000-mile natural gas generating facility locatedpipeline system. The rate review requests $13.5 million in Pueblo, Colorado.new annual revenue with a capital structure of 50% equity and 50% debt and a return on equity of 9.95%. The request seeks to implement new rates in the second quarter of 2021. On January 6, 2021 the CPUC issued an order dismissing the rate review. On January 26, 2021, Colorado Gas filed an application for rehearing, reargument or reconsideration in response to the Commission’s January 6 order.
On September 11, 2020, in accordance with the final order from the earlier rate review discussed below, Colorado Gas also filed a new SSIR proposal that would recover safety and integrity focused investments in its system over five years. A decision from the CPUC is expected by mid-2021.
On February 1, 2019, Colorado Gas filed a rate review with the CPUC requesting $2.5 million in new revenue to recover investments in safety, reliability and system integrity and approval to consolidate rates, tariffs, and services of its 2 existing gas distribution territories. Colorado Gas also requested a new rider mechanism to recover future safety and integrity investments in its system. On May 19, 2020, the CPUC issued a final order which denied the system integrity recovery mechanism and consolidation of rate territories. In April 2016, Black Hillsaddition, the order resulted in an annual revenue decrease of $0.6 million and a return on equity of 9.2%. New rates were effective July 3, 2020.
RMNG SSIR
On October 30, 2020, RMNG filed the tariff adjusting rates to include 2021 projects with an expected capital investment of $33 million under the current SSIR. The new tariff rates went into effect January 1, 2021 and the current approved SSIR expires December 31, 2021.
Nebraska Gas
Jurisdictional Consolidation and Rate Review
On January 26, 2021, Nebraska Gas received approval from the NPSC to consolidate rate schedules into a new, single statewide structure and recover significant infrastructure investments in its 13,000-mile natural gas pipeline system. Final rates will be enacted on March 1, 2021, to replace interim rates enacted September 1, 2020. The approval will shift $4.6 million of SSIR revenue to base rates and is expected to generate $6.5 million in new annual revenue with a capital structure of 50% equity and 50% debt and a return on equity of 9.5%. The approval also includes an extension of the SSIR for five years and an expansion of this mechanism for consolidated utility alignment.
Wyoming Gas
Jurisdictional Consolidation and Rate Review
Wyoming Gas’s new single statewide rate structure became effective March 1, 2020. Wyoming Gas received approval from the WPSC on December 11, 2019, to consolidate the rates, tariffs and services of its 4 existing gas distribution territories. New rates are expected to generate $13 million in new annual revenue based on a return on equity of 9.40% and a capital structure of 50.23% equity and 49.77% debt. The approval also allows for a rider to recover integrity investments for system safety and reliability.
(3) COMMITMENTS, CONTINGENCIES AND GUARANTEES
Power Purchase and Transmission Services Agreements
Through our subsidiaries, we have the following significant long-term power purchase contracts and transmission services agreement (TSA) with non-affiliated third-parties:
| | | | | | | | | | | | | | | | | |
| Subsidiary | Contract Type | Counterparty | Fuel Type | Quantity (MW) | Expiration Date |
Colorado Electric (a) | PPA | PRPA | Wind | 60 | May 31, 2030 |
| Colorado Electric | PPA | PRPA | Coal | 25 | June 30, 2024 |
| South Dakota Electric | PPA | PacifiCorp | Coal | 50 | December 31, 2023 |
South Dakota Electric (b) | TSA | PacifiCorp | N/A | 50 | December 31, 2023 |
| South Dakota Electric | PPA | PRPA | Wind | 12 | September 30, 2029 |
| South Dakota Electric | PPA | Fall River Solar, LLC | Solar | 80 | Pending Completion (c) |
Wyoming Electric (d) | PPA | Happy Jack | Wind | 30 | September 3, 2028 |
Wyoming Electric (e) | PPA | Silver Sage | Wind | 30 | September 30, 2029 |
_____________
(a) Colorado Electric Generation soldsells the wind energy purchased under this PPA to City of Colorado Springs as discussed below.
(b) This is a 49.9%, noncontrolling interest in Black Hills Colorado IPP for $216 millionfirm point-to-point transmission service agreement that provides 50 MW of capacity and energy to be transmitted annually.
(c) This agreement relates to a third-party buyer. Black Hillsnew solar facility currently being constructed and will expire 20 years after construction completion, which is expected by the end of 2022.
(d) Under a separate intercompany PSA, Wyoming Electric Generation is the operatorsells 50% of the facility which is contractedoutput to provide capacity and energy through 2031South Dakota Electric.
(e) Under a separate intercompany PSA, Wyoming Electric sells 67% of the facility output to ColoradoSouth Dakota Electric.
The accounting for a partial sale of a subsidiary in which control is maintained and the subsidiary continues to be consolidated, is specifiedCosts under ASC 810. The partial sale is required to be recorded as an equity transaction with no resulting gain or loss on the sale. GAAP requires that noncontrolling interests in subsidiaries and affiliates be reported in the equity section of a company’s balance sheet. Distributions of net income attributable to noncontrolling interests are due within 30 days following the end of a quarter, but may be withheld as necessary by Black Hills Electric Generation.
Net income available for common stockthese agreements for the years ended December 31 were as follows (in thousands):
| | | | | | | | | | | | | | | | | | | | | | | |
| Subsidiary | Contract Type | Counterparty | Fuel Type | | 2020 | 2019 | 2018 |
| Colorado Electric | PPA | PRPA | Wind | | $ | 2,791 | | $ | 0 | | $ | 0 | |
| Colorado Electric | PPA | PRPA | Coal | | $ | 4,524 | | $ | 1,802 | | $ | 0 | |
| South Dakota Electric | PPA | PacifiCorp | Coal | | $ | 5,897 | | $ | 7,477 | | $ | 13,681 | |
| South Dakota Electric | TSA | PacifiCorp | N/A | | $ | 1,776 | | $ | 1,741 | | $ | 1,742 | |
| South Dakota Electric | PPA | PRPA | Wind | | $ | 715 | | $ | 688 | | $ | 223 | |
| Wyoming Electric | PPA | Happy Jack | Wind | | $ | 4,531 | | $ | 3,936 | | $ | 3,884 | |
| Wyoming Electric | PPA | Silver Sage | Wind | | $ | 6,203 | | $ | 5,366 | | $ | 5,376 | |
Power Purchase Agreements - Related Parties
Wyoming Electric currently has a PPA with Black Hills Wyoming expiring on December 31, 2022, which provides 60 MW of unit-contingent capacity and energy from Black Hills Wyoming’s Wygen I facility. On October 15, 2020, the FERC approved a settlement agreement in the joint application filed by Wyoming Electric and Black Hills Wyoming on August 2, 2019 2018for approval of a new 60 MW PPA. Under the terms of the settlement, Wyoming Electric will continue to receive 60 MW of capacity and 2017 was reduced by $14 million, $14 million,energy from the Wygen I facility. The new agreement will commence on January 1, 2022, replace the existing PPA and $14 million, respectively, attributablecontinue for 11 years.
Black Hills Electric Generation provides the wind energy generated from Busch Ranch II to this noncontrolling interest. The net income allocableColorado Electric through a PPA, which expires in November 2044.
Black Hills Electric Generation provides its 14.5 MW share of energy generated from Busch Ranch I to the noncontrolling interest holders is based on ownership interestsColorado Electric through a PPA, which expires in October 2037.
Colorado Electric’s PPA with the exception of certain agreed upon adjustments.
Black Hills Colorado IPP
has been determined to be a VIE in which the Company has a variable interest. Black Hills Electric Generation has been determined to be the primary beneficiaryexpiring on December 31, 2031, provides 200 MW of
the VIE as Black Hills Electric Generation is the operator and manager of the generation facility and, as such, has the power to
direct the activities that most significantly impactColorado Electric from Black Hills Colorado IPP’s
economic performance. combined-cycle turbines. At the segment level, we recognize the associated revenues, costs and assets on an accrual basis, rather than as a finance lease. See Note 18 for additional information.
Purchase Commitments
We maintain natural gas supply contracts with several vendors that generally cover a period of up to one year. Commitments for estimated baseload gas volumes are established prior to the beginning of the month under these contracts on a monthly basis at contractually negotiated prices. Commitments for incremental daily purchases are made as necessary during the month based on requirements in accordance with the terms of the individual contract.
Our Gas Utilities segment has commitments to purchase physical quantities of natural gas under contracts indexed to various forward natural gas price curves. A portion of our gas purchases are purchased under evergreen contracts and are therefore, for purposes of this disclosure, carried out for 60 days. At December 31, 2020, the long-term commitments to purchase quantities of natural gas under contracts indexed to the following forward indices were as follows (in MMBtus):
| | | | | | | | | | | | | | | | | | | |
| | Northern Natural Gas - Ventura | Northwest Pipeline - Wyoming | ONEOK - Oklahoma | | Southern Star Central Gas Pipeline | Panhandle Eastern Pipe Line |
| 2021 | | 3,650,000 | 1,510,000 | 5,475,000 | | 113,130 | 4,680 |
| 2022 | | 1,810,000 | 1,510,000 | 5,475,000 | | 0 | 0 |
| 2023 | | 1,840,000 | 1,510,000 | 5,475,000 | | 0 | 0 |
| 2024 | | 1,820,000 | 910,000 | 5,490,000 | | 0 | 0 |
| 2025 | | 0 | 0 | 4,560,000 | | 0 | 0 |
| Thereafter | | 0 | 0 | 0 | | 0 | 0 |
Purchases under these contracts totaled $25 million, $6.7 million and $27 million for 2020, 2019 and 2018, respectively.
Other Gas Supply Agreements
Our Utilities also purchase natural gas, including transportation and storage capacity to meet customers’ needs, under short-term and long-term purchase contracts. These contracts extend to 2044.
The following is a schedule of unconditional purchase obligations required under the power purchase, transmission services and natural gas transportation and storage agreements (in thousands):
| | | | | | | | |
| Power purchase and transmission services agreements (a) | Natural gas transportation and storage agreements |
| 2021 | $ | 24,452 | | $ | 116,563 | |
| 2022 | $ | 11,678 | | $ | 121,819 | |
| 2023 | $ | 11,678 | | $ | 100,282 | |
| 2024 | $ | 2,738 | | $ | 67,089 | |
| 2025 | $ | 0 | | $ | 50,709 | |
| Thereafter | $ | 0 | | $ | 167,100 | |
_____________
(a) This schedule does not reflect renewable energy PPA obligations since these agreements vary based on weather conditions.
Power Sales Agreements
Through our subsidiaries, we have the following significant long-term power sales contracts with non-affiliated third-parties:
•On July 1, 2020, Colorado Electric entered into a PSA with the City of Colorado Springs to sell up to 60 MW of wind energy purchased from PRPA under a separate 60 MW PPA discussed above. This PSA with the City of Colorado Springs expires June 30, 2025.
•During periods of reduced production at Wygen III in which MDU owns a portion of the capacity, or during periods when Wygen III is off-line, South Dakota Electric will provide MDU with 25 MW from our other generation facilities or from system purchases with reimbursement of costs by MDU. This agreement expires January 31, 2023.
•South Dakota Electric has an agreement to provide MDU capacity and energy up to a maximum of 50 MW in excess of Wygen III ownership. This agreement expires December 31, 2023.
•During periods of reduced production at Wygen III in which the City of Gillette owns a portion of the capacity, or during periods when Wygen III is off-line, South Dakota Electric will provide the City of Gillette with its first 23 MW from its other generating facilities or from system purchases with reimbursement of costs by the City of Gillette. Under this agreement, which has an initial term through September 3, 2034 and would be renewed annually on September 3 thereafter, South Dakota Electric will also provide the City of Gillette their operating component of spinning reserves.
•South Dakota Electric has an amended agreement, effective January 1, 2019, to supply up to 20 MW of energy and capacity to MEAN under a contract that expires May 31, 2028. The contract terms are from June 1 through May 31 for each interval listed below. This contract is unit-contingent based on the availability of our Neil Simpson II and Wygen III plants, with decreasing capacity purchased over the term of the agreement. The unit-contingent capacity amounts from Wygen III and Neil Simpson II are as follows:
| | | | | | | | | | | | | | | | | | | | | | | | | | |
| Contract Years | Total Contract Capacity | | Contingent Capacity Amounts on Wygen III | | Contingent Capacity Amounts on Neil Simpson II |
| | | | | | | | |
| 2020-2022 | 15 | | MW | | 7 | | MW | | 8 | | MW |
| 2022-2023 | 15 | | MW | | 8 | | MW | | 7 | | MW |
| 2023-2028 | 10 | | MW | | 5 | | MW | | 5 | | MW |
•South Dakota Electric has an agreement that expires December 31, 2021 to provide 50 MW of energy to Macquarie Energy, LLC during heavy and light load timing intervals.
•Black Hills ElectricWyoming sold its CTII 40 MW natural gas-fired generating unit to the City of Gillette, Wyoming on September 3, 2014. Under the terms of the sale, Black Hills Wyoming entered into ancillary agreements to operate CTII, provide use of shared facilities including a ground lease and dispatch generation services. In addition, the agreement includes a 20-year economy energy PSA that contains a sharing arrangement in which the parties share the savings of wholesale power purchases made when market power prices are less than the cost of operating the generating unit.
Environmental Matters
We are subject to costs resulting from a number of federal, state and local laws and regulations which affect future planning and existing operations. Laws and regulations can result in increased capital expenditures, operating and other costs as a result of compliance, remediation and monitoring obligations. Due to the environmental issues discussed below, we may be required to modify, curtail, replace or cease operating certain facilities or operations to comply with statutes, regulations and other requirements of regulatory bodies.
Reclamation Liability
For our Pueblo Airport Generation site, we posted a bond of $4.1 million with the State of Colorado to cover the costs of remediation for a waste water containment pond permitted to provide wastewater storage and processing for this zero discharge facility. The reclamation liability is recorded at the present value of the estimated future cost to reclaim the land.
Under our land leases for our wind generation facilities, we are required to reclaim land where we have placed wind turbines. The reclamation liabilities are recorded at the present value of the estimated future cost to reclaim the land.
Under its mining permit, WRDC is required to reclaim all land where it has mined reserves. The reclamation liability is recorded at the present value of the estimated future cost to reclaim the land.
See Note 7 for additional information.
Manufactured Gas Processing
In 2008, we acquired whole and partial liabilities for former manufactured gas processing sites in Nebraska and Iowa which were previously used to convert coal to natural gas. The acquisition provided for an insurance recovery, now valued at $1.2 million recorded in Other assets, non-current on our Consolidated Balance Sheets, which will be used to help offset remediation costs. We also have a $1.4 million regulatory asset for manufactured gas processing sites; see Note 2 for additional information.
As of December 31, 2020, we had $2.6 million accrued for remediation of Iowa’s manufactured gas processing site as the primary beneficiary, continueslandowner. As of December 31, 2020, we had $0.6 million accrued for remediation of Nebraska’s manufactured gas processing site as the land owner. These liabilities are included in Other deferred credits and other liabilities on our Consolidated Balance Sheets. The remediation cost estimate could change materially due to consolidate Black Hills Colorado IPP. Black Hills Colorado IPP hasresults of further investigations, actions of environmental agencies or the financial viability of other responsible parties.
Legal Proceedings
In the normal course of business, we are subject to various lawsuits, actions, proceedings, claims and other matters asserted under laws and regulations. We believe the amounts provided in the consolidated financial statements to satisfy alleged liabilities are adequate in light of the probable and estimable contingencies. However, there can be no assurance that the actual amounts required to satisfy alleged liabilities from various legal proceedings, claims and other matters discussed, and to comply with applicable laws and regulations will not receivedexceed the amounts reflected in the consolidated financial or other support fromstatements.
In the Company outsidenormal course of pre-existing contractual arrangements during the reporting period. Black Hills Colorado IPP doesbusiness, we enter into agreements that include indemnification in favor of third parties, such as information technology agreements, purchase and sale agreements and lease contracts. We have also agreed to indemnify our directors, officers and employees in accordance with our articles of incorporation, as amended. Certain agreements do not contain any limits on our liability and therefore, it is not possible to estimate our potential liability under these indemnifications. In certain cases, we have any debt and its cash flows from operations are sufficientrecourse against third parties with respect to support its ongoing operations.these indemnities. Further, we maintain insurance policies that may provide coverage against certain claims under these indemnities.
Guarantees
We have recordedentered into various agreements providing financial or performance assurance to third parties on behalf of certain of our subsidiaries. The agreements, which are off-balance sheet commitments, include indemnification for reclamation and surety bonds. The guarantees were entered into in the following assets andnormal course of business. To the extent liabilities onare incurred as a result of activities covered by the surety bonds, such liabilities are included in our consolidated balance sheets related to the VIE described above as of December 31 (in thousands):Consolidated Balance Sheets.
|
| | | | | | | |
| | 2019 | | 2018 |
| Assets | | | |
| Current assets | $ | 13,350 |
| | $ | 13,620 |
|
| Property, plant and equipment of variable interest entities, net | $ | 193,046 |
| | $ | 199,839 |
|
| | | | |
| Liabilities | | | |
| Current liabilities | $ | 6,013 |
| | $ | 5,174 |
|
(13) REGULATORY MATTERS
We had the following regulatory assets and liabilitiesguarantees in place as of December 31 (in thousands):
|
| | | | | | |
| | 2019 | 2018 |
| Regulatory assets | | |
Deferred energy and fuel cost adjustments (a) | $ | 34,088 |
| $ | 29,661 |
|
Deferred gas cost adjustments (a) | 1,540 |
| 3,362 |
|
Gas price derivatives (a) | 3,328 |
| 6,201 |
|
Deferred taxes on AFUDC (b) | 7,790 |
| 7,841 |
|
Employee benefit plans (c) | 115,900 |
| 110,524 |
|
Environmental (a) | 1,454 |
| 959 |
|
Loss on reacquired debt (a) | 24,777 |
| 21,001 |
|
Renewable energy standard adjustment (a) | 1,622 |
| 1,722 |
|
Deferred taxes on flow through accounting (c) | 41,220 |
| 31,044 |
|
Decommissioning costs (a) | 10,670 |
| 11,700 |
|
Gas supply contract termination (a) | 8,485 |
| 14,310 |
|
Other regulatory assets (a) | 20,470 |
| 45,910 |
|
| Total regulatory assets | 271,344 |
| 284,235 |
|
| Less current regulatory assets | (43,282 | ) | (48,776 | ) |
| Regulatory assets, non-current | $ | 228,062 |
| $ | 235,459 |
|
| | | |
| Regulatory liabilities | | |
Deferred energy and gas costs (a) | $ | 17,278 |
| $ | 6,991 |
|
Employee benefit plan costs and related deferred taxes (c) | 43,349 |
| 42,533 |
|
Cost of removal (a) | 166,727 |
| 150,123 |
|
Excess deferred income taxes (c) | 285,438 |
| 310,562 |
|
| TCJA revenue reserve | 3,418 |
| 18,032 |
|
Other regulatory liabilities (c) | 20,442 |
| 12,553 |
|
| Total regulatory liabilities | 536,652 |
| 540,794 |
|
| Less current regulatory liabilities | (33,507 | ) | (29,810 | ) |
| Regulatory liabilities, non-current | $ | 503,145 |
| $ | 510,984 |
|
__________
| | | | | | | | |
(a) | Recovery of costs, but we are not allowed a rate of return. |
| Maximum Exposure at | |
(b)Nature of Guarantee | In addition to recovery of costs, we are allowed a rate of return.December 31, 2020 | Expiration |
| Indemnification for subsidiary reclamation/surety bonds | $ | 53,769 | | Ongoing |
| |
(c) | In addition to recovery or repayment of costs, we are allowed a return on a portion of this amount or a reduction in rate base. |
Regulatory assets represent items we expect to recover from customers through probable future rates.
Deferred Energy
(4)REVENUE
Our revenue contracts generally provide for performance obligations that are fulfilled and Fuel Cost Adjustments - Deferred energytransfer control to customers over time, represent a series of distinct services that are substantially the same, involve the same pattern of transfer to the customer and fuel cost adjustments representprovide a right to consideration from our customers in an amount that corresponds directly with the costvalue to the customer for the performance completed to date. Therefore, we recognize revenue in the amount to which we have a right to invoice. Our primary types of electricity delivered to our Electric Utility customers that is either higher or lower than the current rates and will be recovered or refunded in future rates. Deferred energy and fuel cost adjustments are recorded and recovered or amortized as approved by the appropriate state commission. Our Electric Utilities file periodic quarterly, semi-annual and/or annual filings to recover these costs based on the respective cost mechanisms approved by their applicable state utility commissions. The recovery period for these costs is less than a year.revenue contracts are:
Deferred Gas Cost Adjustment•Regulated natural gas and electric utility services tariffs - Our regulated gas utilities have GCA provisions regulated operations, as defined by ASC 980, Regulated Operations, that allow themprovide services to passregulated customers under tariff rates, charges, terms and conditions of service and prices determined by the costjurisdictional regulators designated for our service territories. Our regulated services primarily encompass single performance obligations for delivery of either commodity natural gas, on to their customers. The GCA iscommodity electricity, natural gas transportation or electric transmission services. These service revenues are variable based on forecastsquantities delivered, influenced by seasonal business and weather patterns. Tariffs are only permitted to be changed through a rate-setting process involving the state or federal regulatory commissions to establish contractual rates between the utility and its customers. All of our Utilities’ regulated sales are subject to regulatory-approved tariffs.
•Power sales agreements - Our Electric Utilities and Power Generation segments have long-term wholesale power sales agreements with other load-serving entities, including affiliates, for the sale of excess power from owned generating units. These agreements include a combination of “take or pay” arrangements, where the customer is obligated to pay for the energy regardless of whether it actually takes delivery, as well as “requirements only” arrangements, where the customer is only obligated to pay for the energy the customer needs. In addition to these long-term contracts, we also sell excess energy to other load-serving entities on a short-term basis. The pricing for all of these arrangements is included in the executed contracts or confirmations, reflecting the standalone selling price and is variable based on energy delivered. Certain energy sale and purchase transactions with the same counterparty and at the same delivery point are netted to reflect the economic substance of the upcomingarrangement.
•Coal supply agreements - Our Mining segment sells coal primarily under long-term contracts to utilities for use at their power generating plants, including affiliate Electric Utilities, and an affiliate non-regulated Power Generation entity. The contracts include a single promise to supply coal necessary to fuel the customers’ facilities during the contract term. The transaction price is established in the supply agreements, including cost-based agreements with the affiliated regulated utilities, and is variable based on tons delivered.
•Other non-regulated services - Our Electric and Gas Utilities segments also provide non-regulated services primarily comprised of appliance repair service and protection plans, electric and natural gas coststechnical infrastructure construction and recoverymaintenance services, and in Nebraska and Wyoming, an unbundled natural gas commodity offering under the regulatory-approved Choice Gas Program. Revenue contracts for these services generally represent a single performance obligation with the price reflecting the standalone selling price stated in the agreement, and the revenue is variable based on the units delivered or refundservices provided.
The following tables depict the disaggregation of revenue, including intercompany revenue, from contracts with customers by customer type and timing of revenue recognition for each of the reportable segments, for the years ended December 31, 2020, 2019 and 2018. Sales tax and other similar taxes are excluded from revenues.
| | | | | | | | | | | | | | | | | | | | |
| Year ended December 31, 2020 | Electric Utilities | Gas Utilities | Power Generation | Mining | Inter-company Revenues | Total |
| Customer types: | (in thousands) |
| Retail | $ | 610,721 | | $ | 765,922 | | $ | 0 | | $ | 58,567 | | $ | (31,478) | | $ | 1,403,732 | |
| Transportation | 0 | | 154,581 | | 0 | | 0 | | (526) | | 154,055 | |
| Wholesale | 17,848 | | 0 | | 103,258 | | 0 | | (97,169) | | 23,937 | |
| Market - off-system sales | 24,309 | | 260 | | 0 | | 0 | | (8,797) | | 15,772 | |
| Transmission/Other | 58,965 | | 43,658 | | 0 | | 0 | | (19,315) | | 83,308 | |
| Revenue from contracts with customers | 711,843 | | 964,421 | | 103,258 | | 58,567 | | (157,285) | | 1,680,804 | |
| Other revenues | 2,201 | | 10,249 | | 1,789 | | 2,508 | | (610) | | 16,137 | |
| Total revenues | $ | 714,044 | | $ | 974,670 | | $ | 105,047 | | $ | 61,075 | | $ | (157,895) | | $ | 1,696,941 | |
| | | | | | |
| Timing of revenue recognition: | | | | | | |
| Services transferred at a point in time | $ | 0 | | $ | 0 | | $ | 0 | | $ | 58,567 | | $ | (31,478) | | $ | 27,089 | |
| Services transferred over time | 711,843 | | 964,421 | | 103,258 | | 0 | | (125,807) | | 1,653,715 | |
| Revenue from contracts with customers | $ | 711,843 | | $ | 964,421 | | $ | 103,258 | | $ | 58,567 | | $ | (157,285) | | $ | 1,680,804 | |
| | | | | | | | | | | | | | | | | | | | |
| Year ended December 31, 2019 | Electric Utilities | Gas Utilities | Power Generation | Mining | Inter-company Revenues | Total |
| Customer types: | (in thousands) |
| Retail | $ | 605,756 | | $ | 817,840 | | $ | 0 | | $ | 59,233 | | $ | (32,053) | | $ | 1,450,776 | |
| Transportation | 0 | | 143,390 | | 0 | | 0 | | (1,042) | | 142,348 | |
| Wholesale | 20,884 | | 0 | | 99,157 | | 0 | | (91,577) | | 28,464 | |
| Market - off-system sales | 23,817 | | 691 | | 0 | | 0 | | (7,736) | | 16,772 | |
| Transmission/Other | 57,104 | | 47,725 | | 0 | | 0 | | (16,797) | | 88,032 | |
| Revenue from contracts with customers | 707,561 | | 1,009,646 | | 99,157 | | 59,233 | | (149,205) | | 1,726,392 | |
| Other revenues | 5,191 | | 384 | | 2,101 | | 2,396 | | (1,564) | | 8,508 | |
| Total revenues | $ | 712,752 | | $ | 1,010,030 | | $ | 101,258 | | $ | 61,629 | | $ | (150,769) | | $ | 1,734,900 | |
| | | | | | |
| Timing of revenue recognition: | | | | | | |
| Services transferred at a point in time | $ | 0 | | $ | 0 | | $ | 0 | | $ | 59,233 | | $ | (32,053) | | $ | 27,180 | |
| Services transferred over time | 707,561 | | 1,009,646 | | 99,157 | | 0 | | (117,152) | | 1,699,212 | |
| Revenue from contracts with customers | $ | 707,561 | | $ | 1,009,646 | | $ | 99,157 | | $ | 59,233 | | $ | (149,205) | | $ | 1,726,392 | |
| | | | | | | | | | | | | | | | | | | | |
| Year ended December 31, 2018 | Electric Utilities | Gas Utilities | Power Generation | Mining | Inter-company Revenues | Total |
| Customer types: | (in thousands) |
| Retail | $ | 594,329 | | $ | 833,379 | | $ | 0 | | $ | 65,803 | | $ | (32,194) | | $ | 1,461,317 | |
| Transportation | 0 | | 140,705 | | 0 | | 0 | | (1,348) | | 139,357 | |
| Wholesale | 33,687 | | 0 | | 90,791 | | 0 | | (84,957) | | 39,521 | |
| Market - off-system sales | 24,799 | | 866 | | 0 | | 0 | | (8,102) | | 17,563 | |
| Transmission/Other | 56,209 | | 49,402 | | 0 | | 0 | | (14,827) | | 90,784 | |
| Revenue from contracts with customers | 709,024 | | 1,024,352 | | 90,791 | | 65,803 | | (141,428) | | 1,748,542 | |
| Other revenues | 2,427 | | 955 | | 1,660 | | 2,230 | | (1,546) | | 5,726 | |
| Total revenues | $ | 711,451 | | $ | 1,025,307 | | $ | 92,451 | | $ | 68,033 | | $ | (142,974) | | $ | 1,754,268 | |
| | | | | | |
| Timing of revenue recognition: | | | | | | |
| Services transferred at a point in time | $ | 0 | | $ | 0 | | $ | 0 | | $ | 65,803 | | $ | (32,194) | | $ | 33,609 | |
| Services transferred over time | 709,024 | | 1,024,352 | | 90,791 | | 0 | | (109,234) | | 1,714,933 | |
| Revenue from contracts with customers | $ | 709,024 | | $ | 1,024,352 | | $ | 90,791 | | $ | 65,803 | | $ | (141,428) | | $ | 1,748,542 | |
The majority of our revenue contracts are based on variable quantities delivered. Any fixed consideration contracts with an expected duration of one year or more are immaterial to our consolidated revenues. Variable consideration constraints in the form of discounts, rebates, credits, price concessions, incentives, performance bonuses, penalties or other similar items are not material for our revenue contracts. We are the principal in our revenue contracts, as we have control over the services prior under-recovered or over-recovered costs. to those services being transferred to the customer.
Revenue Not in Scope of ASC 606
Other revenues included in the table above include our revenue accounted for under separate accounting guidance, including lease revenue under ASC 842, Leases, derivative revenue under ASC 815, Derivatives and Hedging, and alternative revenue programs revenue under ASC 980, Regulated Operations.
Significant Judgments and Estimates
Unbilled Revenue
To the extent that gas costsdeliveries have occurred but a bill has not been issued, our utilities accrue an estimate of the revenue since the latest billing. This estimate is calculated based upon several factors including billings through the last billing cycle in a month and prices in effect in our jurisdictions. Each month, the estimated unbilled revenue amounts are under-recoveredtrued-up and recorded in Accounts receivable, net on the accompanying Consolidated Balance Sheets.
Contract Balances
The nature of our primary revenue contracts provides an unconditional right to consideration upon service delivery; therefore, no customer contract assets or over-recovered, they are recorded as a regulatory asset or liability, respectively. Our Gas Utilities file periodic estimatesliabilities exist. The unconditional right to consideration is represented by the balance in our Accounts Receivable further discussed in Note 1.
(5) PROPERTY, PLANT AND EQUIPMENT
Gas Price Derivatives - Our regulated utilities, as allowed or required by state utility commissions, have entered into certain exchange-traded natural gas futuresProperty, plant and options to reduce our customers’ underlying exposure to fluctuations in gas prices. Gas price derivatives represent our unrealized positions on our commodity contracts supporting our utilities. Gas price derivativesequipment at December 31 2019consisted of the following (dollars in thousands):
| | | | | | | | | | | | | | | | | | | | |
| 2020 | 2019 | Lives (in years) |
| Electric Utilities | Property, Plant and Equipment | Weighted Average Useful Life (in years) | Property, Plant and Equipment | Weighted Average Useful Life (in years) | Minimum | Maximum |
| | | | | | |
| Electric plant: | | | | | | |
| Production | $ | 1,417,951 | | 40 | $ | 1,348,049 | | 41 | 32 | 46 |
| Electric transmission | 517,794 | | 49 | 483,640 | | 51 | 44 | 51 |
| Electric distribution | 959,453 | | 46 | 861,042 | | 47 | 46 | 48 |
Plant acquisition adjustment (a) | 4,870 | | 32 | 4,870 | | 32 | 32 | 32 |
| General | 259,010 | | 28 | 259,266 | | 28 | 26 | 29 |
| Total electric plant in service | 3,159,078 | | | 2,956,867 | | | | |
| Construction work in progress | 89,402 | | | 102,268 | | | | |
| Total electric plant | 3,248,480 | | | 3,059,135 | | | | |
| Less accumulated depreciation | (666,669) | | | (670,861) | | | | |
| Electric plant net of accumulated depreciation | $ | 2,581,811 | | | $ | 2,388,274 | | | | |
_____________
(a) The plant acquisition adjustment is included in rate base and is being recovered with 10 years remaining.
| | | | | | | | | | | | | | | | | | | | |
| 2020 | 2019 | Lives (in years) |
| Gas Utilities | Property, Plant and Equipment | Weighted Average Useful Life (in years) | Property, Plant and Equipment | Weighted Average Useful Life (in years) | Minimum | Maximum |
| | | | | | |
| Gas plant: | | | | | | |
| Production | $ | 15,603 | | 40 | $ | 13,000 | | 35 | 24 | 46 |
| Gas transmission | 578,278 | | 54 | 516,172 | | 50 | 22 | 71 |
| Gas distribution | 2,115,082 | | 53 | 1,857,233 | | 43 | 45 | 59 |
Cushion gas - depreciable (a) | 3,539 | | 28 | 3,539 | | 28 | 28 | 28 |
Cushion gas - not depreciable (a) | 39,184 | | N/A | 44,443 | | N/A | N/A | N/A |
| Storage | 55,481 | | 38 | 46,977 | | 31 | 24 | 52 |
| General | 438,217 | | 19 | 437,054 | | 20 | 12 | 23 |
| Total gas plant in service | 3,245,384 | | | 2,918,418 | | | | |
| Construction work in progress | 67,229 | | | 63,080 | | | | |
| Total gas plant | 3,312,613 | | | 2,981,498 | | | | |
| Less accumulated depreciation | (323,679) | | | (336,721) | | | | |
| Gas plant net of accumulated depreciation | $ | 2,988,934 | | | $ | 2,644,777 | | | | |
_____________
(a) Depreciation of Cushion Gas is determined by the respective regulatory jurisdiction in which the Cushion Gas resides.
| | | | | | | | | | | | | | | | | | | | | | | | | | |
| 2020 | Lives (in years) |
| Property, Plant and Equipment | Construction Work in Progress | Total Property Plant and Equipment | Less Accumulated Depreciation and Depletion | Net Property, Plant and Equipment | Weighted Average Useful Life | Minimum | Maximum |
| | | | | | | | |
| Power Generation | $ | 529,927 | | $ | 4,876 | | $ | 534,803 | | $ | (167,787) | | $ | 367,016 | | 31 | 2 | 40 |
| Mining | $ | 186,552 | | $ | 988 | | $ | 187,540 | | $ | (126,537) | | $ | 61,003 | | 14 | 2 | 59 |
| | | | | | | | |
| | | | | | | | | | | | | | | | | | | | | | | | | | |
| 2019 | Lives (in years) |
| Property, Plant and Equipment | Construction Work in Progress | Total Property Plant and Equipment | Less Accumulated Depreciation and Depletion | Net Property, Plant and Equipment | Weighted Average Useful Life | Minimum | Maximum |
| | | | | | | | |
| Power Generation | $ | 532,397 | | $ | 2,121 | | $ | 534,518 | | $ | (154,362) | | $ | 380,156 | | 31 | 2 | 40 |
| Mining | $ | 179,198 | | $ | 1,275 | | $ | 180,473 | | $ | (118,585) | | $ | 61,888 | | 13 | 2 | 59 |
| | | | | | | | |
| | | | | | | | | | | | | | | | | | | | | | | | | | |
| 2020 | Lives (in years) |
| Property, Plant and Equipment | Construction Work in Progress | Total Property Plant and Equipment | Less Accumulated Depreciation | Net Property, Plant and Equipment | Weighted Average Useful Life | Minimum | Maximum |
| Corporate | $ | 5,692 | | $ | 16,402 | | $ | 22,094 | | $ | (1,144) | | $ | 20,950 | | 10 | 10 | 22 |
| | | | | | | | | | | | | | | | | | | | | | | | | | |
| 2019 | Lives (in years) |
| Property, Plant and Equipment | Construction Work in Progress | Total Property Plant and Equipment | Less Accumulated Depreciation | Net Property, Plant and Equipment | Weighted Average Useful Life | Minimum | Maximum |
| Corporate | $ | 5,721 | | $ | 23,334 | | $ | 29,055 | | $ | (964) | | $ | 28,091 | | 10 | 3 | 30 |
(6) JOINTLY OWNED FACILITIES
Our consolidated financial statements include our share of several jointly-owned utility and non-regulated facilities as described below. Our share of the facilities’ expenses are hedged overreflected in the appropriate categories of operating expenses in the Consolidated Statements of Income. Each owner of the facility is responsible for financing its investment in the jointly-owned facilities.
Wyodak Plant
South Dakota Electric owns a maximum forward term20% interest in the Wyodak Plant, a coal-fired electric generating station located in Campbell County, Wyoming. PacifiCorp owns the remaining ownership percentage and operates the Wyodak Plant. South Dakota Electric receives its proportionate share of two years.the Wyodak Plant’s capacity and is committed to pay its proportionate share of its additions, replacements and operating and maintenance expenses. In addition to supplying South Dakota Electric with coal for its share of the Wyodak Plant, our Mining subsidiary, WRDC, supplies PacifiCorp’s share of the coal to the Wyodak Plant under a separate long-term agreement. This coal supply agreement is collateralized by a mortgage on and a security interest in some of WRDC’s coal reserves.
Deferred Taxes on AFUDC
- The equity component
South Dakota Electric also owns a 35% interest in, and is the operator of, AFUDCthe Converter Station Site and South Rapid City Interconnection (the Transmission Tie), an AC-DC-AC transmission tie. Basin Electric Power Cooperative owns the remaining ownership percentage. South Dakota Electric is considered a permanent difference for tax purposes withcommitted to pay its proportionate share of the tax benefit being flowed through to customers as prescribed or allowed by regulators. If, based on a regulator’s action, it is probableadditions and replacements and operating and maintenance expenses of the utility will recover the future increase in taxes payable represented by this flow-through treatment through a rate revenue increase, a regulatory asset is recognized. This regulatory asset is a temporary difference for which a deferred tax liability must be recognized. Accounting standards for income taxes specifically address AFUDC-equity and require a gross-up of such amounts to reflect the revenue requirement associated with a rate-regulated environment.transmission tie.
Wygen III
Employee Benefit Plans
- Employee benefit plans include
South Dakota Electric owns 52% of the unrecognized prior service costsWygen III generation facility. MDU and net actuarial loss associated with our defined benefit pension planthe City of Gillette each owns an undivided ownership interest in Wygen III and post-retirement benefit plans in regulatory assets rather than in AOCI.
Environmental - Environmental expenditures are obligated to make payments for costs associated with manufactured gasadministrative services and their proportionate share of the costs of operating the plant sites. The amortization of this asset is first offset by recognition of insurance proceeds and settlements with other third parties. Any remaining recovery will be requested in future rate filings. Recovery has not yet been approved byfor the applicable commission or board and therefore, the recovery period is unknown.
Loss on Reacquired Debt - Loss on reacquired debt is recovered over the remaining life of the original issue or, if refinanced,facility. South Dakota Electric retains responsibility for plant operations. Our Mining subsidiary supplies fuel to Wygen III for the life of the plant.
Wygen I
Black Hills Wyoming owns 76.5% of the Wygen I plant while MEAN owns the remaining ownership percentage. MEAN is obligated to make payments for its share of the costs associated with administrative services, plant operations and coal supply provided by our Mining subsidiary during the life of the facility. Black Hills Wyoming retains responsibility for plant operations.
At December 31, 2020, our interests in jointly-owned generating facilities and transmission systems were (in thousands):
| | | | | | | | | | | | | | |
| Plant in Service | Construction Work in Progress | Less Accumulated Depreciation | Plant Net of Accumulated Depreciation |
| Wyodak Plant | $ | 116,074 | | $ | 2,249 | | $ | (67,762) | | $ | 50,561 | |
| Transmission Tie | $ | 26,176 | | $ | 509 | | $ | (7,103) | | $ | 19,582 | |
| Wygen III | $ | 142,739 | | $ | 582 | | $ | (24,783) | | $ | 118,538 | |
| Wygen I | $ | 114,975 | | $ | 318 | | $ | (49,459) | | $ | 65,834 | |
Jointly Owned Facilities - Related Party
Busch Ranch I
Colorado Electric owns 50% of Busch Ranch I while Black Hills Electric Generation owns the remaining 50% ownership interest. Each company is obligated to make payments for costs associated with their proportionate share of the costs of operating the wind farm over the life of the new issue.
Renewable Energy Standard Adjustment - The renewable energy standard adjustment is associated with incentives for ourfacility. Colorado Electric customersretains responsibility for operations of the wind farm. Black Hills Electric Generation provides its share of energy from the wind farm to install renewable energy equipment at their location. These incentives are recovered over time with an additional rider charged on customers’ bills.Colorado Electric through a PPA, which expires in October 2037.
Deferred Taxes on Flow-Through Accounting
- Under flow-through accounting,
Cheyenne Prairie serves the income tax effectsutility customers of certain tax items are reflected in our cost of service for the customer in the year in which the tax benefits are realized and result in lower utility rates. A regulatory asset was established to reflect that future increases in income taxes payable will be recovered from customers as the temporary differences reverse. As a result of this regulatory treatment, we continue to record a tax benefit for costs considered currently deductible for tax purposes, but are capitalized for book purposes.
Decommissioning Costs - South Dakota Electric and ColoradoWyoming Electric. The facility includes one simple-cycle, 37 MW combustion turbine that is wholly-owned by Wyoming Electric received approvaland one combined-cycle, 100.4 MW unit that is jointly-owned by South Dakota Electric (58 MW) and Wyoming Electric (42.4 MW). BHSC is responsible for plant operations.
Corriedale
Corriedale serves as the dedicated wind energy supply for Renewable Ready customers in 2014South Dakota and Wyoming. The 52.5 MW wind farm is jointly-owned by South Dakota Electric (32.5 MW) and Wyoming Electric (20 MW). BHSC is responsible for recoveryoperations of the remaining net book valueswind farm.
(7) ASSET RETIREMENT OBLIGATIONS
We have identified legal retirement obligations related to reclamation of mining sites in the Mining segment, removal of fuel tanks, transformers containing polychlorinated biphenyls, and decommissioningan evaporation pond at our Electric Utilities, wind turbines at our Electric Utilities and Power Generation segments, retirement of gas pipelines at our Gas Utilities and removal of asbestos at our Electric and Gas Utilities. We periodically review and update estimated costs related to these AROs. The actual cost may vary from estimates because of regulatory requirements, changes in technology and increased costs of their decommissioned coal plants. In 2018, Arkansas Gas received approvallabor, materials and equipment.
The following tables present the details of AROs which are included on the accompanying Consolidated Balance Sheets in Other deferred credits and other liabilities (in thousands):
| | | | | | | | | | | | | | | | | | | | | |
| December 31, 2019 | Liabilities Incurred | Liabilities Settled | Accretion | | Revisions to Prior Estimates | December 31, 2020 |
Electric Utilities (a) | $ | 9,329 | | $ | 1,217 | | $ | 0 | | $ | 407 | | | $ | 0 | | $ | 10,953 | |
Gas Utilities (b) | 36,085 | | 4,782 | | (132) | | 1,539 | | | 0 | | 42,274 | |
| Power Generation | 4,739 | | 0 | | 0 | | 206 | | | 0 | | 4,945 | |
Mining (c) | 14,052 | | 0 | | (185) | | 617 | | | (1,225) | | 13,259 | |
| Total | 64,205 | | $ | 5,999 | | $ | (317) | | $ | 2,769 | | | $ | (1,225) | | $ | 71,431 | |
| | | | | | | | | | | | | | | | | | | | | |
| December 31, 2018 | Liabilities Incurred | Liabilities Settled | Accretion | | Revisions to Prior Estimates | December 31, 2019 |
Electric Utilities (d) | $ | 6,258 | | $ | 0 | | $ | 0 | | $ | 385 | | | $ | 2,686 | | $ | 9,329 | |
| Gas Utilities | 34,627 | | 0 | | 0 | | 1,458 | | | 0 | | 36,085 | |
Power Generation (a) | 300 | | 3,445 | | 0 | | 158 | | | 836 | | 4,739 | |
Mining (c) | 15,615 | | 0 | | (380) | | 740 | | | (1,923) | | 14,052 | |
| Total | $ | 56,800 | | $ | 3,445 | | $ | (380) | | $ | 2,741 | | | $ | 1,599 | | $ | 64,205 | |
| | | | | | | |
| | | | | | | |
_____________________
(a) Liabilities incurred were related to record Liquefied Natural Gas Plant decommissioningnew wind assets.
(b) Liabilities incurred were driven by an increase in gas pipeline miles; which increases our legal liability for retirement of gas pipelines, specifically to purge and cap these lines in accordance with Federal regulations.
(c) The Mining Revisions to Prior Estimates were primarily driven by changes in estimated costs in a regulatory asset,associated with recoveryback-filling the pit with overburden removed during the mining process.
(d) The Electric Utilities Revisions to be determined in a future regulatory filing.
Gas Supply Contract Termination - Agreements under the previous ownership required the Company to purchase all of the natural gas produced over the productive life of specific leaseholdsPrior Estimates was primarily driven by an increase in the Bowdoin Field in Montana. The majority ofestimated cost to decommission certain regulated wind farm assets.
We also have legally required AROs related to certain assets within our electric transmission and distribution systems. These retirement obligations are pursuant to an easement or franchise agreement and are only required if we discontinue our utility service under such easement or franchise agreement. Accordingly, it is not possible to estimate a time period when these purchases were committed to distribution customers in Colorado, Nebraska,obligations could be settled and Wyoming, which are subject to cost recovery mechanisms. The prices to be paid under these agreements varied, ranging from $6 to $8 per MMBtu at the time of acquisition, which exceeded market prices. We recordedtherefore, a liability for the cost of these obligations cannot be measured at this contract intime.
(8) LEASES
Lessee
We lease from third parties certain office and operation center facilities, communication tower sites, equipment, and materials storage. Our leases have remaining terms ranging from less than 1 year to 35 years, including options to extend that are reasonably certain to be exercised. We have 1 immaterial finance lease for communication equipment at the WRDC mine.
Most of our purchase price allocation. We were granted approval to terminate these agreements fromleases do not contain a readily determinable discount rate. Therefore, the CPUC, NPSCpresent value of future lease payments is generally calculated using our applicable subsidiaries’ incremental borrowing rate (weighted-average of 4.24% as of December 31, 2020).
Leases with an initial term of 12 months or less are classified as short-term leases and WPSCare not recognized on the basis that these agreements were not beneficial to customers over the long term. We received written orders allowing us to create a regulatory assetaccompanying Consolidated Balance Sheets.
Lease expense for the net buyoutyear ended December 31 were as follows (in thousands):
| | | | | | | | | | | |
| Income Statement Location | 2020 | 2019 |
| Operating lease cost | Operations and maintenance | $ | 978 | | $ | 1,456 | |
| | | |
| | | |
| | | |
| | | |
Supplemental balance sheet information related to leases as of December 31 was as follows (in thousands):
| | | | | | | | | | | |
| Balance Sheet Location | 2020 | 2019 |
| Assets: | | | |
| Operating lease assets | Other assets, non-current | $ | 4,188 | | $ | 4,629 | |
| | | |
| Total lease assets | | $ | 4,188 | | $ | 4,629 | |
| | | |
| Liabilities: | | | |
| Current: | | | |
| Operating leases | Accrued liabilities | $ | 736 | | $ | 1,179 | |
| | | |
| | | |
| Noncurrent: | | | |
| Operating leases | Other deferred credits and other liabilities | 3,807 | | 3,821 | |
| | | |
| Total lease liabilities | | $ | 4,543 | | $ | 5,000 | |
Supplemental cash flow information related to leases for the year ended December 31 was as follows (in thousands):
| | | | | | | | |
| 2020 | 2019 |
| Cash paid included in the measurement of lease liabilities: | | |
| Operating cash flows from operating leases | $ | 1,023 | | $ | 1,263 | |
| | |
| | |
| Right-of-use assets obtained in exchange for lease obligations: | | |
| Operating leases | $ | 161 | | $ | 2,801 | |
| | |
Weighted average remaining terms and discount rates related to leases as of December 31 were as follows:
| | | | | | | | |
| 2020 | 2019 |
| Weighted average remaining lease term: | | |
| Operating leases | 8 years | 8 years |
| | |
| | |
| Weighted average discount rate: | | |
| Operating leases | 4.24 | % | 4.27 | % |
| | |
As of December 31, 2020, scheduled maturities of lease liabilities for future years were as follows (in thousands):
| | | | | | | |
| Operating Leases | | |
| 2021 | $ | 907 | | | |
| 2022 | 804 | | | |
| 2023 | 779 | | | |
| 2024 | 776 | | | |
| 2025 | 529 | | | |
| Thereafter | 1,643 | | | |
| Total lease payments | $ | 5,438 | | | |
| Less imputed interest | 895 | | | |
| Present value of lease liabilities | $ | 4,543 | | | |
Lessor
We lease to third parties certain generating station ground leases, communication tower sites, and a natural gas pipeline. These leases have remaining terms ranging from less than one year to 34 years.
Lease revenue for the year ended December 31 were as follows (in thousands):
| | | | | | | | | | | |
| Income Statement Location | 2020 | 2019 |
| Operating lease income | Revenue | $ | 2,534 | | $ | 2,306 | |
As of December 31, 2020, scheduled maturities of operating lease payments to be received in future years were as follows (in thousands):
| | | | | | | |
| Operating Leases | | |
| 2021 | $ | 2,383 | | | |
| 2022 | 2,122 | | | |
| 2023 | 2,130 | | | |
| 2024 | 2,074 | | | |
| 2025 | 2,090 | | | |
| Thereafter | 58,829 | | | |
| Total lease receivables | $ | 69,628 | | | |
(9) DEBT AND CREDIT FACILITIES
Short-term debt
We had the following Notes payable outstanding at the Consolidated Balance Sheets date (in thousands):
| | | | | | | | | | | | | | |
| December 31, 2020 | December 31, 2019 |
| Balance Outstanding | Letters of Credit (a) | Balance Outstanding | Letters of Credit (a) |
| Revolving Credit Facility | $ | 0 | | $ | 24,730 | | $ | 0 | | $ | 30,274 | |
| CP Program | 234,040 | | 0 | | 349,500 | | 0 | |
| Total | $ | 234,040 | | $ | 24,730 | | $ | 349,500 | | $ | 30,274 | |
_______________
(a) Letters of credit are off-balance sheet commitments that reduce the borrowing capacity available on our corporate Revolving Credit Facility.
Revolving Credit Facility and CP Program
On July 30, 2018, we amended and restated our corporate Revolving Credit Facility, maintaining total commitments of $750 million and extending the term through July 30, 2023 with 2 one year extension options (subject to consent from lenders). This facility includes an accordion feature that allows us, with the consent of the administrative agent, the issuing agents and each bank increasing or providing a new commitment, to increase total commitments up to $1.0 billion. Borrowings continue to be available under a base rate or various Eurodollar rate options. The interest costs associated with the contract termination,letters of credit or borrowings and recover the majoritycommitment fee under the Revolving Credit Facility are determined based upon our Corporate credit rating from S&P, Fitch and Moody's for our senior unsecured long-term debt. Based on our credit ratings, the margins for base rate borrowings, Eurodollar borrowings and letters of costs from customers overcredit were 0.125%, 1.125% and 1.125%, respectively, at December 31, 2020. Based on our credit ratings, a period of five years. We terminated0.175% commitment fee was charged on the contract and settled the liability on April 29, 2016.unused amount at December 31, 2020.
Regulatory liabilities represent items we expectWe have a $750 million, unsecured CP Program that is backstopped by the Revolving Credit Facility. Amounts outstanding under the Revolving Credit Facility and the CP Program, either individually or in the aggregate, cannot exceed $750 million. The notes issued under the CP Program may have maturities not to refundexceed 397 days from the date of issuance and bear interest (or are sold at par less a discount representing an interest factor) based on, among other things, the size and maturity date of the note, the frequency of the issuance and our credit ratings. Under the CP Program, any borrowings rank equally with our unsecured debt. Notes under the CP Program are not registered and are offered and issued pursuant to customers through probable future decreases in rates.
Our net short-term borrowings (payments) during 2020 were $(115) million. As of December 31, 2020, the weighted average interest rate on short-term borrowings was 0.27%.
Total accumulated deferred financing costs on the Revolving Credit Facility of $6.7 million are being amortized over its estimated useful life and were included in Interest expense on the accompanying Consolidated Statements of Income. See below for additional details.
Long-term debt
Long-term debt outstanding was as follows (dollars in thousands):
| | | | | | | | | | | | | | |
| | Interest Rate at | Balance Outstanding |
| Due Date | December 31, 2020 | December 31, 2020 | December 31, 2019 |
| Corporate | | | | |
| Senior unsecured notes due 2023 | November 30, 2023 | 4.25% | $ | 525,000 | | $ | 525,000 | |
| Senior unsecured notes due 2026 | January 15, 2026 | 3.95% | 300,000 | | 300,000 | |
| Senior unsecured notes due 2027 | January 15, 2027 | 3.15% | 400,000 | | 400,000 | |
| Senior unsecured notes, due 2029 | October 15, 2029 | 3.05% | 400,000 | | 400,000 | |
| Senior unsecured notes, due 2030 | June 15, 2030 | 2.50% | 400,000 | | 0 | |
| Senior unsecured notes due 2033 | May 1, 2033 | 4.35% | 400,000 | | 400,000 | |
| Senior unsecured notes, due 2046 | September 15, 2046 | 4.20% | 300,000 | | 300,000 | |
| Senior unsecured notes, due 2049 | October 15, 2049 | 3.88% | 300,000 | | 300,000 | |
| Corporate term loan due 2021 | June 7, 2021 | 2.32% | 1,436 | | 7,178 | |
| Total Corporate debt | | | 3,026,436 | | 2,632,178 | |
| Less unamortized debt discount | | | (7,013) | | (6,462) | |
| Total Corporate debt, net | | | 3,019,423 | | 2,625,716 | |
| | | | |
| South Dakota Electric | | | | |
Series 94A Debt, variable rate (a) | June 1, 2024 | N/A | 0 | | 2,855 | |
| First Mortgage Bonds due 2032 | August 15, 2032 | 7.23% | 75,000 | | 75,000 | |
| First Mortgage Bonds due 2039 | November 1, 2039 | 6.13% | 180,000 | | 180,000 | |
| First Mortgage Bonds due 2044 | October 20, 2044 | 4.43% | 85,000 | | 85,000 | |
| Total South Dakota Electric debt | | | 340,000 | | 342,855 | |
| Less unamortized debt discount | | | (78) | | (82) | |
| Total South Dakota Electric debt, net | | | 339,922 | | 342,773 | |
| | | | |
| Wyoming Electric | | | | |
Industrial development revenue bonds due 2021(a) (b) | September 1, 2021 | 0.12% | 7,000 | | 7,000 | |
Industrial development revenue bonds due 2027(a) (b) | March 1, 2027 | 0.12% | 10,000 | | 10,000 | |
| First Mortgage Bonds due 2037 | November 20, 2037 | 6.67% | 110,000 | | 110,000 | |
| First Mortgage Bonds due 2044 | October 20, 2044 | 4.53% | 75,000 | | 75,000 | |
| Total Wyoming Electric debt | | | 202,000 | | 202,000 | |
| Less unamortized debt discount | | | 0 | | 0 | |
| Total Wyoming Electric debt, net | | | 202,000 | | 202,000 | |
| | | | |
| Total long-term debt | | | 3,561,345 | | 3,170,489 | |
| Less current maturities | | | 8,436 | | 5,743 | |
Less unamortized deferred financing costs (c) | | | 24,809 | | 24,650 | |
| Long-term debt, net of current maturities and deferred financing costs | | | $ | 3,528,100 | | $ | 3,140,096 | |
_______________
(a) Variable interest rate.
(b) A reimbursement agreement is in place with Wells Fargo on behalf of Wyoming Electric for the 2009A bonds of $10 million due March 1, 2027 and the 2009B bonds of $7.0 million due September 1, 2021. In the case of default, we hold the assumption of liability for drawings on Wyoming Electric’s Letter of Credit attached to these bonds.
(c) Includes deferred financing costs associated with our Revolving Credit Facility of $1.0 million and $1.7 million as of December 31, 2020 and December 31, 2019, respectively.
Scheduled maturities of long-term debt, excluding amortization of premiums or discounts, for future years are (in thousands):
| | | | | |
| 2021 | $ | 8,436 | |
| 2022 | $ | 0 | |
| 2023 | $ | 525,000 | |
| 2024 | $ | 0 | |
| 2025 | $ | 0 | |
| Thereafter | $ | 3,035,000 | |
Our debt securities contain certain restrictive financial covenants, all of which the Company and its subsidiaries were in compliance with at December 31, 2020. See below for additional information.
Substantially all of the tangible utility property of South Dakota Electric and Wyoming Electric is subject to the lien of indentures securing their first mortgage bonds. First mortgage bonds of South Dakota Electric and Wyoming Electric may be issued in amounts limited by property, earnings and other provisions of the mortgage indentures.
Amortization of Deferred EnergyFinancing Costs
Our deferred financing costs and associated amortization expense included in Interest expense on the accompanying Consolidated Statements of Income were as follows (in thousands):
| | | | | | | | | | | | | | |
| Deferred Financing Costs Remaining at | | Amortization Expense for the years ended December 31, |
| December 31, 2020 | | 2020 | 2019 | 2018 |
| $ | 24,809 | | | $ | 3,272 | | $ | 3,242 | | $ | 2,829 | |
Debt Transactions
On June 17, 2020, we completed a public debt offering which consisted of $400 million of 2.50% 10-year senior unsecured notes due June 15, 2030. The proceeds were used to repay short-term debt and for working capital and general corporate purposes.
On March 24, 2020, South Dakota Electric paid off its $2.9 million, Series 94A variable rate notes due June 1, 2024. These notes were tendered by the sole investor on March 17, 2020.
On October 3, 2019, we completed a public debt offering of $700 million principal amount in senior unsecured notes. The debt offering consisted of $400 million of 3.05% 10-year senior notes due October 15, 2029 and $300 million of 3.875% 30-year senior notes due October 15, 2049 (together the “Notes”). The proceeds of the Notes were used for the following:
• Repay the $400 million Corporate term loan under the Amended and Restated Credit Agreement due June 17, 2021;
• Retire the $200 million 5.875% senior notes due July 15, 2020; and
• Repay a portion of short-term debt.
On June 17, 2019, we amended our Corporate term loan due July 30, 2020. This amendment increased total commitments to $400 million from $300 million, extended the term through June 17, 2021, and had substantially similar terms and covenants as the amended and restated Revolving Credit Facility. The net proceeds from the increase in total commitments were used to pay down short-term debt. Proceeds from the October 3, 2019 public debt offering were used to repay this term loan.
Debt Covenants
Revolving Credit Facility
Under our Revolving Credit Facility and term loan agreements we are required to maintain a Consolidated Indebtedness to Capitalization Ratio not to exceed 0.65 to 1.00. Our Consolidated Indebtedness to Capitalization Ratio is calculated by dividing (i) Consolidated Indebtedness, which includes letters of credit and certain guarantees issued by (ii) Capital, which includes Consolidated Indebtedness plus Net Worth, which excludes noncontrolling interest in subsidiaries. Subject to applicable cure periods, a violation of any of these covenants would constitute an event of default that entitles the lenders to terminate their remaining commitments and accelerate all principal and interest outstanding.
We were in compliance with our covenants at December 31, 2020 as shown below:
| | | | | | | | | | | | | | |
| As of December 31, 2020 | | Covenant Requirement |
| Consolidated Indebtedness to Capitalization Ratio | 59.9% | | Less than | 65% |
Wyoming Electric
Covenants within Wyoming Electric's financing agreements require Wyoming Electric to maintain a debt to capitalization ratio of no more than 0.60 to 1.00. As of December 31, 2020, we were in compliance with these covenants.
Dividend Restrictions
Our credit facility and other debt obligations contain restrictions on the payment of cash dividends when a default or event of default occurs.
Due to our holding company structure, substantially all of our operating cash flows are provided by dividends paid or distributions made by our subsidiaries. The cash to pay dividends to our shareholders is derived from these cash flows. As a result, certain statutory limitations or regulatory or financing agreements could affect the levels of distributions allowed to be made by our subsidiaries. The following restrictions on distributions from our subsidiaries existed at December 31, 2020:
•Our utilities are generally limited to the amount of dividends allowed to be paid to our utility holding company under the Federal Power Act and settlement agreements with state regulatory jurisdictions. As of December 31, 2020, the restricted net assets at our Electric and Gas Costs - Deferred energy costs and gas costs related to over-recovery of purchased power, transmission and natural gas costs.Utilities were approximately $155 million.
Employee Benefit•South Dakota Electric and Wyoming Electric are generally limited to the amount of dividends allowed to be paid to our utility holding company under certain financing agreements.
(10) STOCKHOLDERS' EQUITY
February 2020 Equity Issuance
On February 27, 2020, we issued 1.2 million shares of common stock to a single investor through an underwritten registered transaction at a price of $81.77 per share for proceeds of $99 million, net of $1.0 million of issuance costs. The shares of common stock were offered pursuant to our shelf registration statement filed with the SEC.
At-the-Market Equity Offering Program
On August 3, 2020, we filed a shelf registration and DRSPP with the SEC. In conjunction with these shelf filings, we renewed the ATM. The renewed ATM program, which allows us to sell shares of our common stock, is the same as the prior program other than the aggregate value increased from $300 million to $400 million and a forward sales option was incorporated. This forward sales option allows us to sell our shares through the ATM program at the current trading price without actually issuing any shares to satisfy the sale until a future date. Under the ATM, shares may be offered from time to time pursuant to a sales agreement dated August 3, 2020. Shares of common stock are offered pursuant to our shelf registration statement filed with the SEC.
We did not issue any common shares under the ATM during the twelve months ended December 31, 2020. During the twelve months ended December 31, 2019, we issued a total of 1,328,332 shares of common stock under the ATM for $99 million, net of $1.2 million in issuance costs. We did not issue any common shares under the ATM during the twelve months ended December 31, 2018.
Shareholder Dividend Reinvestment and Stock Purchase Plan Costs and Related Deferred Taxes
- Employee benefit plans represent the cumulative excess
We have a DRSPP under which shareholders may purchase additional shares of pension and retiree healthcare costs recovered in rates over pension expense recorded in accordance with accounting standards for compensation - retirement benefits. In addition, this regulatory liability includes the income tax effectcommon stock through dividend reinvestment and/or optional cash payments at 100% of the adjustment required under accounting for compensation - defined benefit plans, to recordrecent average market price. We have the full pension and post-retirement benefit obligations. Such income tax effect has been grossed-up to account foroption of issuing new shares or purchasing the revenue requirement associated with a rate regulated environment.
Costshares on the open market. We issued new shares until March 1, 2018, after which we began purchasing shares on the open market. At December 31, 2020, there were 163,962 shares of Removal - Cost of removal represents the estimated cumulative net provisionsunissued stock available for future removal costs for which there is no legal obligation for removal included in depreciation expense.
Excess Deferred Income Taxes - The revaluation of the regulated utilities' deferred tax assets and liabilities due to the passage of the TCJA was recorded as an excess deferred income tax to be refunded to customers primarily using the normalization principles as prescribed in the TCJA.
TCJA Revenue Reserve - Revenue to be returned to customers as a result of the TCJA. See Note 15 for additional information.
Regulatory Matters
Electric Utilities Regulatory Activity
South Dakota Electric
Settlement
On January 7, 2020, South Dakota Electric received approval from the SDPUC on a settlement agreement to extend the 6-year moratorium period by an additional 3 years to June 30, 2026. Also, as part of the settlement, we withdrew our application for deferred accounting treatment and expensed $5.4 million of development costs in 2019 related to projects we no longer intend to construct. This settlement amends a previous agreement approved by the SDPUC on June 16, 2017, whereby South Dakota Electric would not increase base rates, absent an extraordinary event, for a 6 year moratorium period effective July 1, 2017. The moratorium period also includes suspension of both the TFA and EIA.
FERC Formula Rate
The annual rate determination process is governed by the FERC formula rate protocols established in the filed FERC joint-access transmission tariff. Effective January 1, 20192020 the annual revenue requirement increased by $1.9was $27 million and included estimated weighted average capital additions of $31$33 million for 20182019 and 20192020 combined. The annual transmission revenue requirement has a true uptrue-up mechanism that is postedrecorded in June of each year.
South Dakota Electric and Wyoming Electric
Renewable Ready
In July 2019, South Dakota Electric and Wyoming Electric received approvals for the Renewable Ready program and related jointly-filed CPCN to construct Corriedale. The wind project will be jointly owned by the two electric utilities to deliver renewable energy for large commercial, industrial and governmental agency customers. In November 2019, South Dakota Electric received approval from the SDPUC to increase the offering under the program by 12.5 MW. The 2 electric utilities also received a determination from the WPSC to increase the project to 52.5 MW. The $79 million project is expected to be in service by year-end 2020.
Black Hills Wyoming and Wyoming Electric
Wygen 1 FERC Filing
On October 15, 2020, the FERC approved a settlement agreement that represents a resolution of all issues in the joint application filed by Wyoming Electric and Black Hills Wyoming on August 2, 2019 Black Hills Wyoming and Wyoming Electric jointly filed a request with FERC for approval of a new 60 MW PPA. The agreement would fulfillUnder the capacity need for Wyoming Electric at the expirationterms of the current agreement on December 31, 2022. If approved, Black Hillssettlement, Wyoming Electric will continue to deliverreceive 60 MW of energy to Wyoming Electric from its Wygen I power plant starting January 1, 2023,capacity and continuing for an additional 20 years to December 31, 2042. On December 23, 2019, the Company filed a response to questions from the FERC and awaits a decision from FERC.
Wyoming Electric
Blockchain Tariff
On April 30, 2019, the WPSC approved Wyoming Electric’s application for a new Blockchain Interruptible Service Tariff. The utility has partnered with the economic development organization for City of Cheyenne and Laramie County to actively recruit blockchain customers to the state. This tariff is complementary to recently enacted Wyoming legislation supporting the development of blockchain within the state.
PCA Settlement
On October 31, 2018, Wyoming Electric received approval from the WPSC for a comprehensive, multi-year settlement regarding its PCA Application filed earlier in 2018. Wyoming Electric’s PCA permits the recovery of costs associated with fuel, purchased electricity and other specified costs, including the portion of the company’s energy that is delivered from the Wygen I power plant. The new agreement will commence on January 1, 2022, replace the existing PPA with Black Hills Wyoming. Wyoming Electric was to provide a total of $7.0 million in customer credits through the PCA mechanism in 2018, 2019 and 2020 to resolve all outstanding issues relating to its current and prior PCA filings. The settlement also stipulated the adjustmentcontinue for the variable cost segment of the Wygen I PPA with Wyoming Electric will escalate by 3.0% annually through 2022, providing price certainty for Wyoming Electric and its customers.11 years.
Gas Utilities Regulatory Activity
ArkansasColorado Gas
Jurisdictional Consolidation and Rate ReviewReviews
On October 5, 2018, ArkansasSeptember 11, 2020, Colorado Gas received approval fromfiled a rate review with the APSC for a generalCPUC seeking recovery on significant infrastructure investments in its 7,000-mile natural gas pipeline system. The rate increase. The new rates were to generate approximately $12review requests $13.5 million ofin new annual revenue. The APSC’s approval also allowed Arkansas Gas to include $11 millionrevenue with a capital structure of revenue that was being collected through certain rider mechanisms in the new base rates. The new revenue increase was based on50% equity and 50% debt and a return on equity of 9.61% and a capital structure9.95%. The request seeks to implement new rates in the second quarter of 49.1% equity and 50.9% debt. New rates, inclusive of customer benefits related2021. On January 6, 2021 the CPUC issued an order dismissing the rate review. On January 26, 2021, Colorado Gas filed an application for rehearing, reargument or reconsideration in response to the TCJA, were effective October 15, 2018.Commission’s January 6 order.
On September 11, 2020, in accordance with the final order from the earlier rate review discussed below, Colorado Gas also filed a new SSIR proposal that would recover safety and integrity focused investments in its system over five years. A decision from the CPUC is expected by mid-2021.
Jurisdictional Consolidation and Rate Review
On February 1, 2019, Colorado Gas filed a rate review with the CPUC requesting $2.5 million in new revenue to recover investments in safety, reliability and system integrity and approval to consolidate rates, tariffs, and services of its 2 existing gas distribution territories. The rate review requested $2.5 million in new revenue to recover investments in safety, reliability and system integrity. Colorado Gas also requested a new rider mechanism to recover future safety and integrity investments in its system. On December 27, 2019,May 19, 2020, the ALJCPUC issued a recommended decision denyingfinal order which denied the company’s plansystem integrity recovery mechanism and consolidation of rate territories. In addition, the order resulted in an annual revenue decrease of $0.6 million and a return on equity of 9.2%. New rates were effective July 3, 2020.
RMNG SSIR
On October 30, 2020, RMNG filed the tariff adjusting rates to consolidate rate territoriesinclude 2021 projects with an expected capital investment of $33 million under the current SSIR. The new tariff rates went into effect January 1, 2021 and recommending a rate decrease. Colorado Gas has filed exceptions to the ALJ’s recommended decision. A decision by the CPUC is expected by the end of March 2020. Legal consolidation was previouslycurrent approved by the CPUC in late 2018 and completed in early 2019.SSIR expires December 31, 2021.
Nebraska Gas
Jurisdictional Consolidation and Rate Review
On October 29, 2019,January 26, 2021, Nebraska Gas received approval from the NPSC to mergeconsolidate rate schedules into a new, single statewide structure and recover significant infrastructure investments in its 213,000-mile natural gas distribution companies. Legal consolidation was effective Januarypipeline system. Final rates will be enacted on March 1, 2020,2021, to replace interim rates enacted September 1, 2020. The approval will shift $4.6 million of SSIR revenue to base rates and a rate review is expected to be filed by mid-year 2020 to consolidate the rates, tariffsgenerate $6.5 million in new annual revenue with a capital structure of 50% equity and services.
SSIR
On June 1, 2018, Nebraska Gas Distribution filed50% debt and a return on equity of 9.5%. The approval also includes an application with the NPSC requesting a continuationextension of the SSIR beyond the expiration datefor five years and an expansion of October 31, 2019. On September 5, 2018, the NPSC approved continuationthis mechanism for consolidated utility alignment.
On October 2, 2017, Nebraska Gas Distribution filed with the NPSC requesting recovery of $6.8 million, which includes $0.3 million of increased annual revenue related to system safety and integrity expenditures on projects for the period of 2012 through 2017. This SSIR tariff was approved by the NPSC in January 2018, and went into effect on February 1, 2018.
Wyoming Gas
Jurisdictional Consolidation and Rate Review
On December 11, 2019,Wyoming Gas’s new single statewide rate structure became effective March 1, 2020. Wyoming Gas received approval from the WPSC on December 11, 2019, to consolidate the rates, tariffs and services of its 4 existing gas distribution territories. A new, single statewide rate structure will be effective March 1, 2020. New rates are expected to generate $13 million in new annual revenue based on a return on equity of 9.40% and a capital structure of 50.23% equity and 49.77% debt. The approval also allows for a rider to recover integrity investments for system safety and reliability.
(14) LEASES
(3) COMMITMENTS, CONTINGENCIES AND GUARANTEES
Power Purchase and Transmission Services Agreements
Through our subsidiaries, we have the following significant long-term power purchase contracts and transmission services agreement (TSA) with non-affiliated third-parties:
| | | | | | | | | | | | | | | | | |
| Subsidiary | Contract Type | Counterparty | Fuel Type | Quantity (MW) | Expiration Date |
Colorado Electric (a) | PPA | PRPA | Wind | 60 | May 31, 2030 |
| Colorado Electric | PPA | PRPA | Coal | 25 | June 30, 2024 |
| South Dakota Electric | PPA | PacifiCorp | Coal | 50 | December 31, 2023 |
South Dakota Electric (b) | TSA | PacifiCorp | N/A | 50 | December 31, 2023 |
| South Dakota Electric | PPA | PRPA | Wind | 12 | September 30, 2029 |
| South Dakota Electric | PPA | Fall River Solar, LLC | Solar | 80 | Pending Completion (c) |
Wyoming Electric (d) | PPA | Happy Jack | Wind | 30 | September 3, 2028 |
Wyoming Electric (e) | PPA | Silver Sage | Wind | 30 | September 30, 2029 |
_____________
(a) Colorado Electric sells the wind energy purchased under this PPA to City of Colorado Springs as discussed below.
(b) This is a firm point-to-point transmission service agreement that provides 50 MW of capacity and energy to be transmitted annually.
(c) This agreement relates to a new solar facility currently being constructed and will expire 20 years after construction completion, which is expected by the end of 2022.
(d) Under a separate intercompany PSA, Wyoming Electric sells 50% of the facility output to South Dakota Electric.
(e) Under a separate intercompany PSA, Wyoming Electric sells 67% of the facility output to South Dakota Electric.
Costs under these agreements for the years ended December 31 were as follows (in thousands):
| | | | | | | | | | | | | | | | | | | | | | | |
| Subsidiary | Contract Type | Counterparty | Fuel Type | | 2020 | 2019 | 2018 |
| Colorado Electric | PPA | PRPA | Wind | | $ | 2,791 | | $ | 0 | | $ | 0 | |
| Colorado Electric | PPA | PRPA | Coal | | $ | 4,524 | | $ | 1,802 | | $ | 0 | |
| South Dakota Electric | PPA | PacifiCorp | Coal | | $ | 5,897 | | $ | 7,477 | | $ | 13,681 | |
| South Dakota Electric | TSA | PacifiCorp | N/A | | $ | 1,776 | | $ | 1,741 | | $ | 1,742 | |
| South Dakota Electric | PPA | PRPA | Wind | | $ | 715 | | $ | 688 | | $ | 223 | |
| Wyoming Electric | PPA | Happy Jack | Wind | | $ | 4,531 | | $ | 3,936 | | $ | 3,884 | |
| Wyoming Electric | PPA | Silver Sage | Wind | | $ | 6,203 | | $ | 5,366 | | $ | 5,376 | |
Power Purchase Agreements - Related Parties
Wyoming Electric currently has a PPA with Black Hills Wyoming expiring on December 31, 2022, which provides 60 MW of unit-contingent capacity and energy from Black Hills Wyoming’s Wygen I facility. On October 15, 2020, the FERC approved a settlement agreement in the joint application filed by Wyoming Electric and Black Hills Wyoming on August 2, 2019 for approval of a new 60 MW PPA. Under the terms of the settlement, Wyoming Electric will continue to receive 60 MW of capacity and energy from the Wygen I facility. The new agreement will commence on January 1, 2022, replace the existing PPA and continue for 11 years.
Black Hills Electric Generation provides the wind energy generated from Busch Ranch II to Colorado Electric through a PPA, which expires in November 2044.
Black Hills Electric Generation provides its 14.5 MW share of energy generated from Busch Ranch I to Colorado Electric through a PPA, which expires in October 2037.
Colorado Electric’s PPA with Black Hills Colorado IPP expiring on December 31, 2031, provides 200 MW of power to Colorado Electric from Black Hills Colorado IPP’s combined-cycle turbines. At the segment level, we recognize the associated revenues, costs and assets on an accrual basis, rather than as a finance lease. See Note 18 for additional information.
Purchase Commitments
We maintain natural gas supply contracts with several vendors that generally cover a period of up to one year. Commitments for estimated baseload gas volumes are established prior to the beginning of the month under these contracts on a monthly basis at contractually negotiated prices. Commitments for incremental daily purchases are made as necessary during the month based on requirements in accordance with the terms of the individual contract.
Our Gas Utilities segment has commitments to purchase physical quantities of natural gas under contracts indexed to various forward natural gas price curves. A portion of our gas purchases are purchased under evergreen contracts and are therefore, for purposes of this disclosure, carried out for 60 days. At December 31, 2020, the long-term commitments to purchase quantities of natural gas under contracts indexed to the following forward indices were as follows (in MMBtus):
| | | | | | | | | | | | | | | | | | | |
| | Northern Natural Gas - Ventura | Northwest Pipeline - Wyoming | ONEOK - Oklahoma | | Southern Star Central Gas Pipeline | Panhandle Eastern Pipe Line |
| 2021 | | 3,650,000 | 1,510,000 | 5,475,000 | | 113,130 | 4,680 |
| 2022 | | 1,810,000 | 1,510,000 | 5,475,000 | | 0 | 0 |
| 2023 | | 1,840,000 | 1,510,000 | 5,475,000 | | 0 | 0 |
| 2024 | | 1,820,000 | 910,000 | 5,490,000 | | 0 | 0 |
| 2025 | | 0 | 0 | 4,560,000 | | 0 | 0 |
| Thereafter | | 0 | 0 | 0 | | 0 | 0 |
Purchases under these contracts totaled $25 million, $6.7 million and $27 million for 2020, 2019 and 2018, respectively.
Other Gas Supply Agreements
Our Utilities also purchase natural gas, including transportation and storage capacity to meet customers’ needs, under short-term and long-term purchase contracts. These contracts extend to 2044.
The following is a schedule of unconditional purchase obligations required under the power purchase, transmission services and natural gas transportation and storage agreements (in thousands):
| | | | | | | | |
| Power purchase and transmission services agreements (a) | Natural gas transportation and storage agreements |
| 2021 | $ | 24,452 | | $ | 116,563 | |
| 2022 | $ | 11,678 | | $ | 121,819 | |
| 2023 | $ | 11,678 | | $ | 100,282 | |
| 2024 | $ | 2,738 | | $ | 67,089 | |
| 2025 | $ | 0 | | $ | 50,709 | |
| Thereafter | $ | 0 | | $ | 167,100 | |
_____________
(a) This schedule does not reflect renewable energy PPA obligations since these agreements vary based on weather conditions.
Power Sales Agreements
Through our subsidiaries, we have the following significant long-term power sales contracts with non-affiliated third-parties:
•On July 1, 2020, Colorado Electric entered into a PSA with the City of Colorado Springs to sell up to 60 MW of wind energy purchased from PRPA under a separate 60 MW PPA discussed above. This PSA with the City of Colorado Springs expires June 30, 2025.
•During periods of reduced production at Wygen III in which MDU owns a portion of the capacity, or during periods when Wygen III is off-line, South Dakota Electric will provide MDU with 25 MW from our other generation facilities or from system purchases with reimbursement of costs by MDU. This agreement expires January 31, 2023.
•South Dakota Electric has an agreement to provide MDU capacity and energy up to a maximum of 50 MW in excess of Wygen III ownership. This agreement expires December 31, 2023.
•During periods of reduced production at Wygen III in which the City of Gillette owns a portion of the capacity, or during periods when Wygen III is off-line, South Dakota Electric will provide the City of Gillette with its first 23 MW from its other generating facilities or from system purchases with reimbursement of costs by the City of Gillette. Under this agreement, which has an initial term through September 3, 2034 and would be renewed annually on September 3 thereafter, South Dakota Electric will also provide the City of Gillette their operating component of spinning reserves.
•South Dakota Electric has an amended agreement, effective January 1, 2019, to supply up to 20 MW of energy and capacity to MEAN under a contract that expires May 31, 2028. The contract terms are from June 1 through May 31 for each interval listed below. This contract is unit-contingent based on the availability of our Neil Simpson II and Wygen III plants, with decreasing capacity purchased over the term of the agreement. The unit-contingent capacity amounts from Wygen III and Neil Simpson II are as follows:
| | | | | | | | | | | | | | | | | | | | | | | | | | |
| Contract Years | Total Contract Capacity | | Contingent Capacity Amounts on Wygen III | | Contingent Capacity Amounts on Neil Simpson II |
| | | | | | | | |
| 2020-2022 | 15 | | MW | | 7 | | MW | | 8 | | MW |
| 2022-2023 | 15 | | MW | | 8 | | MW | | 7 | | MW |
| 2023-2028 | 10 | | MW | | 5 | | MW | | 5 | | MW |
•South Dakota Electric has an agreement that expires December 31, 2021 to provide 50 MW of energy to Macquarie Energy, LLC during heavy and light load timing intervals.
•Black Hills Wyoming sold its CTII 40 MW natural gas-fired generating unit to the City of Gillette, Wyoming on September 3, 2014. Under the terms of the sale, Black Hills Wyoming entered into ancillary agreements to operate CTII, provide use of shared facilities including a ground lease and dispatch generation services. In addition, the agreement includes a 20-year economy energy PSA that contains a sharing arrangement in which the parties share the savings of wholesale power purchases made when market power prices are less than the cost of operating the generating unit.
Environmental Matters
We are subject to costs resulting from a number of federal, state and local laws and regulations which affect future planning and existing operations. Laws and regulations can result in increased capital expenditures, operating and other costs as a result of compliance, remediation and monitoring obligations. Due to the environmental issues discussed below, we may be required to modify, curtail, replace or cease operating certain facilities or operations to comply with statutes, regulations and other requirements of regulatory bodies.
Reclamation Liability
For our Pueblo Airport Generation site, we posted a bond of $4.1 million with the State of Colorado to cover the costs of remediation for a waste water containment pond permitted to provide wastewater storage and processing for this zero discharge facility. The reclamation liability is recorded at the present value of the estimated future cost to reclaim the land.
Under our land leases for our wind generation facilities, we are required to reclaim land where we have placed wind turbines. The reclamation liabilities are recorded at the present value of the estimated future cost to reclaim the land.
Under its mining permit, WRDC is required to reclaim all land where it has mined reserves. The reclamation liability is recorded at the present value of the estimated future cost to reclaim the land.
See Note 7 for additional information.
Manufactured Gas Processing
In 2008, we acquired whole and partial liabilities for former manufactured gas processing sites in Nebraska and Iowa which were previously used to convert coal to natural gas. The acquisition provided for an insurance recovery, now valued at $1.2 million recorded in Other assets, non-current on our Consolidated Balance Sheets, which will be used to help offset remediation costs. We also have a $1.4 million regulatory asset for manufactured gas processing sites; see Note 2 for additional information.
As of December 31, 2020, we had $2.6 million accrued for remediation of Iowa’s manufactured gas processing site as the landowner. As of December 31, 2020, we had $0.6 million accrued for remediation of Nebraska’s manufactured gas processing site as the land owner. These liabilities are included in Other deferred credits and other liabilities on our Consolidated Balance Sheets. The remediation cost estimate could change materially due to results of further investigations, actions of environmental agencies or the financial viability of other responsible parties.
Legal Proceedings
In the normal course of business, we are subject to various lawsuits, actions, proceedings, claims and other matters asserted under laws and regulations. We believe the amounts provided in the consolidated financial statements to satisfy alleged liabilities are adequate in light of the probable and estimable contingencies. However, there can be no assurance that the actual amounts required to satisfy alleged liabilities from various legal proceedings, claims and other matters discussed, and to comply with applicable laws and regulations will not exceed the amounts reflected in the consolidated financial statements.
In the normal course of business, we enter into agreements that include indemnification in favor of third parties, such as information technology agreements, purchase and sale agreements and lease contracts. We have also agreed to indemnify our directors, officers and employees in accordance with our articles of incorporation, as amended. Certain agreements do not contain any limits on our liability and therefore, it is not possible to estimate our potential liability under these indemnifications. In certain cases, we have recourse against third parties with respect to these indemnities. Further, we maintain insurance policies that may provide coverage against certain claims under these indemnities.
Guarantees
We have entered into various agreements providing financial or performance assurance to third parties on behalf of certain of our subsidiaries. The agreements, which are off-balance sheet commitments, include indemnification for reclamation and surety bonds. The guarantees were entered into in the normal course of business. To the extent liabilities are incurred as a result of activities covered by the surety bonds, such liabilities are included in our Consolidated Balance Sheets.
We had the following guarantees in place as of (in thousands):
| | | | | | | | |
| Maximum Exposure at | |
| Nature of Guarantee | December 31, 2020 | Expiration |
| Indemnification for subsidiary reclamation/surety bonds | $ | 53,769 | | Ongoing |
| | |
(4)REVENUE
Our revenue contracts generally provide for performance obligations that are fulfilled and transfer control to customers over time, represent a series of distinct services that are substantially the same, involve the same pattern of transfer to the customer and provide a right to consideration from our customers in an amount that corresponds directly with the value to the customer for the performance completed to date. Therefore, we recognize revenue in the amount to which we have a right to invoice. Our primary types of revenue contracts are:
•Regulated natural gas and electric utility services tariffs - Our utilities have regulated operations, as defined by ASC 980, Regulated Operations, that provide services to regulated customers under tariff rates, charges, terms and conditions of service and prices determined by the jurisdictional regulators designated for our service territories. Our regulated services primarily encompass single performance obligations for delivery of either commodity natural gas, commodity electricity, natural gas transportation or electric transmission services. These service revenues are variable based on quantities delivered, influenced by seasonal business and weather patterns. Tariffs are only permitted to be changed through a rate-setting process involving the state or federal regulatory commissions to establish contractual rates between the utility and its customers. All of our Utilities’ regulated sales are subject to regulatory-approved tariffs.
•Power sales agreements - Our Electric Utilities and Power Generation segments have long-term wholesale power sales agreements with other load-serving entities, including affiliates, for the sale of excess power from owned generating units. These agreements include a combination of “take or pay” arrangements, where the customer is obligated to pay for the energy regardless of whether it actually takes delivery, as well as “requirements only” arrangements, where the customer is only obligated to pay for the energy the customer needs. In addition to these long-term contracts, we also sell excess energy to other load-serving entities on a short-term basis. The pricing for all of these arrangements is included in the executed contracts or confirmations, reflecting the standalone selling price and is variable based on energy delivered. Certain energy sale and purchase transactions with the same counterparty and at the same delivery point are netted to reflect the economic substance of the arrangement.
•Coal supply agreements - Our Mining segment sells coal primarily under long-term contracts to utilities for use at their power generating plants, including affiliate Electric Utilities, and an affiliate non-regulated Power Generation entity. The contracts include a single promise to supply coal necessary to fuel the customers’ facilities during the contract term. The transaction price is established in the supply agreements, including cost-based agreements with the affiliated regulated utilities, and is variable based on tons delivered.
•Other non-regulated services - Our Electric and Gas Utilities segments also provide non-regulated services primarily comprised of appliance repair service and protection plans, electric and natural gas technical infrastructure construction and maintenance services, and in Nebraska and Wyoming, an unbundled natural gas commodity offering under the regulatory-approved Choice Gas Program. Revenue contracts for these services generally represent a single performance obligation with the price reflecting the standalone selling price stated in the agreement, and the revenue is variable based on the units delivered or services provided.
The following tables depict the disaggregation of revenue, including intercompany revenue, from contracts with customers by customer type and timing of revenue recognition for each of the reportable segments, for the years ended December 31, 2020, 2019 and 2018. Sales tax and other similar taxes are excluded from revenues.
| | | | | | | | | | | | | | | | | | | | |
| Year ended December 31, 2020 | Electric Utilities | Gas Utilities | Power Generation | Mining | Inter-company Revenues | Total |
| Customer types: | (in thousands) |
| Retail | $ | 610,721 | | $ | 765,922 | | $ | 0 | | $ | 58,567 | | $ | (31,478) | | $ | 1,403,732 | |
| Transportation | 0 | | 154,581 | | 0 | | 0 | | (526) | | 154,055 | |
| Wholesale | 17,848 | | 0 | | 103,258 | | 0 | | (97,169) | | 23,937 | |
| Market - off-system sales | 24,309 | | 260 | | 0 | | 0 | | (8,797) | | 15,772 | |
| Transmission/Other | 58,965 | | 43,658 | | 0 | | 0 | | (19,315) | | 83,308 | |
| Revenue from contracts with customers | 711,843 | | 964,421 | | 103,258 | | 58,567 | | (157,285) | | 1,680,804 | |
| Other revenues | 2,201 | | 10,249 | | 1,789 | | 2,508 | | (610) | | 16,137 | |
| Total revenues | $ | 714,044 | | $ | 974,670 | | $ | 105,047 | | $ | 61,075 | | $ | (157,895) | | $ | 1,696,941 | |
| | | | | | |
| Timing of revenue recognition: | | | | | | |
| Services transferred at a point in time | $ | 0 | | $ | 0 | | $ | 0 | | $ | 58,567 | | $ | (31,478) | | $ | 27,089 | |
| Services transferred over time | 711,843 | | 964,421 | | 103,258 | | 0 | | (125,807) | | 1,653,715 | |
| Revenue from contracts with customers | $ | 711,843 | | $ | 964,421 | | $ | 103,258 | | $ | 58,567 | | $ | (157,285) | | $ | 1,680,804 | |
| | | | | | | | | | | | | | | | | | | | |
| Year ended December 31, 2019 | Electric Utilities | Gas Utilities | Power Generation | Mining | Inter-company Revenues | Total |
| Customer types: | (in thousands) |
| Retail | $ | 605,756 | | $ | 817,840 | | $ | 0 | | $ | 59,233 | | $ | (32,053) | | $ | 1,450,776 | |
| Transportation | 0 | | 143,390 | | 0 | | 0 | | (1,042) | | 142,348 | |
| Wholesale | 20,884 | | 0 | | 99,157 | | 0 | | (91,577) | | 28,464 | |
| Market - off-system sales | 23,817 | | 691 | | 0 | | 0 | | (7,736) | | 16,772 | |
| Transmission/Other | 57,104 | | 47,725 | | 0 | | 0 | | (16,797) | | 88,032 | |
| Revenue from contracts with customers | 707,561 | | 1,009,646 | | 99,157 | | 59,233 | | (149,205) | | 1,726,392 | |
| Other revenues | 5,191 | | 384 | | 2,101 | | 2,396 | | (1,564) | | 8,508 | |
| Total revenues | $ | 712,752 | | $ | 1,010,030 | | $ | 101,258 | | $ | 61,629 | | $ | (150,769) | | $ | 1,734,900 | |
| | | | | | |
| Timing of revenue recognition: | | | | | | |
| Services transferred at a point in time | $ | 0 | | $ | 0 | | $ | 0 | | $ | 59,233 | | $ | (32,053) | | $ | 27,180 | |
| Services transferred over time | 707,561 | | 1,009,646 | | 99,157 | | 0 | | (117,152) | | 1,699,212 | |
| Revenue from contracts with customers | $ | 707,561 | | $ | 1,009,646 | | $ | 99,157 | | $ | 59,233 | | $ | (149,205) | | $ | 1,726,392 | |
| | | | | | | | | | | | | | | | | | | | |
| Year ended December 31, 2018 | Electric Utilities | Gas Utilities | Power Generation | Mining | Inter-company Revenues | Total |
| Customer types: | (in thousands) |
| Retail | $ | 594,329 | | $ | 833,379 | | $ | 0 | | $ | 65,803 | | $ | (32,194) | | $ | 1,461,317 | |
| Transportation | 0 | | 140,705 | | 0 | | 0 | | (1,348) | | 139,357 | |
| Wholesale | 33,687 | | 0 | | 90,791 | | 0 | | (84,957) | | 39,521 | |
| Market - off-system sales | 24,799 | | 866 | | 0 | | 0 | | (8,102) | | 17,563 | |
| Transmission/Other | 56,209 | | 49,402 | | 0 | | 0 | | (14,827) | | 90,784 | |
| Revenue from contracts with customers | 709,024 | | 1,024,352 | | 90,791 | | 65,803 | | (141,428) | | 1,748,542 | |
| Other revenues | 2,427 | | 955 | | 1,660 | | 2,230 | | (1,546) | | 5,726 | |
| Total revenues | $ | 711,451 | | $ | 1,025,307 | | $ | 92,451 | | $ | 68,033 | | $ | (142,974) | | $ | 1,754,268 | |
| | | | | | |
| Timing of revenue recognition: | | | | | | |
| Services transferred at a point in time | $ | 0 | | $ | 0 | | $ | 0 | | $ | 65,803 | | $ | (32,194) | | $ | 33,609 | |
| Services transferred over time | 709,024 | | 1,024,352 | | 90,791 | | 0 | | (109,234) | | 1,714,933 | |
| Revenue from contracts with customers | $ | 709,024 | | $ | 1,024,352 | | $ | 90,791 | | $ | 65,803 | | $ | (141,428) | | $ | 1,748,542 | |
The majority of our revenue contracts are based on variable quantities delivered. Any fixed consideration contracts with an expected duration of one year or more are immaterial to our consolidated revenues. Variable consideration constraints in the form of discounts, rebates, credits, price concessions, incentives, performance bonuses, penalties or other similar items are not material for our revenue contracts. We are the principal in our revenue contracts, as we have control over the services prior to those services being transferred to the customer.
Revenue Not in Scope of ASC 606
Other revenues included in the table above include our revenue accounted for under separate accounting guidance, including lease revenue under ASC 842, Leases, derivative revenue under ASC 815, Derivatives and Hedging, and alternative revenue programs revenue under ASC 980, Regulated Operations.
Significant Judgments and Estimates
Unbilled Revenue
To the extent that deliveries have occurred but a bill has not been issued, our utilities accrue an estimate of the revenue since the latest billing. This estimate is calculated based upon several factors including billings through the last billing cycle in a month and prices in effect in our jurisdictions. Each month, the estimated unbilled revenue amounts are trued-up and recorded in Accounts receivable, net on the accompanying Consolidated Balance Sheets.
Contract Balances
The nature of our primary revenue contracts provides an unconditional right to consideration upon service delivery; therefore, no customer contract assets or liabilities exist. The unconditional right to consideration is represented by the balance in our Accounts Receivable further discussed in Note 1.
(5) PROPERTY, PLANT AND EQUIPMENT
Property, plant and equipment at December 31 consisted of the following (dollars in thousands):
| | | | | | | | | | | | | | | | | | | | |
| 2020 | 2019 | Lives (in years) |
| Electric Utilities | Property, Plant and Equipment | Weighted Average Useful Life (in years) | Property, Plant and Equipment | Weighted Average Useful Life (in years) | Minimum | Maximum |
| | | | | | |
| Electric plant: | | | | | | |
| Production | $ | 1,417,951 | | 40 | $ | 1,348,049 | | 41 | 32 | 46 |
| Electric transmission | 517,794 | | 49 | 483,640 | | 51 | 44 | 51 |
| Electric distribution | 959,453 | | 46 | 861,042 | | 47 | 46 | 48 |
Plant acquisition adjustment (a) | 4,870 | | 32 | 4,870 | | 32 | 32 | 32 |
| General | 259,010 | | 28 | 259,266 | | 28 | 26 | 29 |
| Total electric plant in service | 3,159,078 | | | 2,956,867 | | | | |
| Construction work in progress | 89,402 | | | 102,268 | | | | |
| Total electric plant | 3,248,480 | | | 3,059,135 | | | | |
| Less accumulated depreciation | (666,669) | | | (670,861) | | | | |
| Electric plant net of accumulated depreciation | $ | 2,581,811 | | | $ | 2,388,274 | | | | |
_____________
(a) The plant acquisition adjustment is included in rate base and is being recovered with 10 years remaining.
| | | | | | | | | | | | | | | | | | | | |
| 2020 | 2019 | Lives (in years) |
| Gas Utilities | Property, Plant and Equipment | Weighted Average Useful Life (in years) | Property, Plant and Equipment | Weighted Average Useful Life (in years) | Minimum | Maximum |
| | | | | | |
| Gas plant: | | | | | | |
| Production | $ | 15,603 | | 40 | $ | 13,000 | | 35 | 24 | 46 |
| Gas transmission | 578,278 | | 54 | 516,172 | | 50 | 22 | 71 |
| Gas distribution | 2,115,082 | | 53 | 1,857,233 | | 43 | 45 | 59 |
Cushion gas - depreciable (a) | 3,539 | | 28 | 3,539 | | 28 | 28 | 28 |
Cushion gas - not depreciable (a) | 39,184 | | N/A | 44,443 | | N/A | N/A | N/A |
| Storage | 55,481 | | 38 | 46,977 | | 31 | 24 | 52 |
| General | 438,217 | | 19 | 437,054 | | 20 | 12 | 23 |
| Total gas plant in service | 3,245,384 | | | 2,918,418 | | | | |
| Construction work in progress | 67,229 | | | 63,080 | | | | |
| Total gas plant | 3,312,613 | | | 2,981,498 | | | | |
| Less accumulated depreciation | (323,679) | | | (336,721) | | | | |
| Gas plant net of accumulated depreciation | $ | 2,988,934 | | | $ | 2,644,777 | | | | |
_____________
(a) Depreciation of Cushion Gas is determined by the respective regulatory jurisdiction in which the Cushion Gas resides.
| | | | | | | | | | | | | | | | | | | | | | | | | | |
| 2020 | Lives (in years) |
| Property, Plant and Equipment | Construction Work in Progress | Total Property Plant and Equipment | Less Accumulated Depreciation and Depletion | Net Property, Plant and Equipment | Weighted Average Useful Life | Minimum | Maximum |
| | | | | | | | |
| Power Generation | $ | 529,927 | | $ | 4,876 | | $ | 534,803 | | $ | (167,787) | | $ | 367,016 | | 31 | 2 | 40 |
| Mining | $ | 186,552 | | $ | 988 | | $ | 187,540 | | $ | (126,537) | | $ | 61,003 | | 14 | 2 | 59 |
| | | | | | | | |
| | | | | | | | | | | | | | | | | | | | | | | | | | |
| 2019 | Lives (in years) |
| Property, Plant and Equipment | Construction Work in Progress | Total Property Plant and Equipment | Less Accumulated Depreciation and Depletion | Net Property, Plant and Equipment | Weighted Average Useful Life | Minimum | Maximum |
| | | | | | | | |
| Power Generation | $ | 532,397 | | $ | 2,121 | | $ | 534,518 | | $ | (154,362) | | $ | 380,156 | | 31 | 2 | 40 |
| Mining | $ | 179,198 | | $ | 1,275 | | $ | 180,473 | | $ | (118,585) | | $ | 61,888 | | 13 | 2 | 59 |
| | | | | | | | |
| | | | | | | | | | | | | | | | | | | | | | | | | | |
| 2020 | Lives (in years) |
| Property, Plant and Equipment | Construction Work in Progress | Total Property Plant and Equipment | Less Accumulated Depreciation | Net Property, Plant and Equipment | Weighted Average Useful Life | Minimum | Maximum |
| Corporate | $ | 5,692 | | $ | 16,402 | | $ | 22,094 | | $ | (1,144) | | $ | 20,950 | | 10 | 10 | 22 |
| | | | | | | | | | | | | | | | | | | | | | | | | | |
| 2019 | Lives (in years) |
| Property, Plant and Equipment | Construction Work in Progress | Total Property Plant and Equipment | Less Accumulated Depreciation | Net Property, Plant and Equipment | Weighted Average Useful Life | Minimum | Maximum |
| Corporate | $ | 5,721 | | $ | 23,334 | | $ | 29,055 | | $ | (964) | | $ | 28,091 | | 10 | 3 | 30 |
(6) JOINTLY OWNED FACILITIES
Our consolidated financial statements include our share of several jointly-owned utility and non-regulated facilities as described below. Our share of the facilities’ expenses are reflected in the appropriate categories of operating expenses in the Consolidated Statements of Income. Each owner of the facility is responsible for financing its investment in the jointly-owned facilities.
Wyodak Plant
South Dakota Electric owns a 20% interest in the Wyodak Plant, a coal-fired electric generating station located in Campbell County, Wyoming. PacifiCorp owns the remaining ownership percentage and operates the Wyodak Plant. South Dakota Electric receives its proportionate share of the Wyodak Plant’s capacity and is committed to pay its proportionate share of its additions, replacements and operating and maintenance expenses. In addition to supplying South Dakota Electric with coal for its share of the Wyodak Plant, our Mining subsidiary, WRDC, supplies PacifiCorp’s share of the coal to the Wyodak Plant under a separate long-term agreement. This coal supply agreement is collateralized by a mortgage on and a security interest in some of WRDC’s coal reserves.
Transmission Tie
South Dakota Electric also owns a 35% interest in, and is the operator of, the Converter Station Site and South Rapid City Interconnection (the Transmission Tie), an AC-DC-AC transmission tie. Basin Electric Power Cooperative owns the remaining ownership percentage. South Dakota Electric is committed to pay its proportionate share of the additions and replacements and operating and maintenance expenses of the transmission tie.
Wygen III
South Dakota Electric owns 52% of the Wygen III generation facility. MDU and the City of Gillette each owns an undivided ownership interest in Wygen III and are obligated to make payments for costs associated with administrative services and their proportionate share of the costs of operating the plant for the life of the facility. South Dakota Electric retains responsibility for plant operations. Our Mining subsidiary supplies fuel to Wygen III for the life of the plant.
Wygen I
Black Hills Wyoming owns 76.5% of the Wygen I plant while MEAN owns the remaining ownership percentage. MEAN is obligated to make payments for its share of the costs associated with administrative services, plant operations and coal supply provided by our Mining subsidiary during the life of the facility. Black Hills Wyoming retains responsibility for plant operations.
At December 31, 2020, our interests in jointly-owned generating facilities and transmission systems were (in thousands):
| | | | | | | | | | | | | | |
| Plant in Service | Construction Work in Progress | Less Accumulated Depreciation | Plant Net of Accumulated Depreciation |
| Wyodak Plant | $ | 116,074 | | $ | 2,249 | | $ | (67,762) | | $ | 50,561 | |
| Transmission Tie | $ | 26,176 | | $ | 509 | | $ | (7,103) | | $ | 19,582 | |
| Wygen III | $ | 142,739 | | $ | 582 | | $ | (24,783) | | $ | 118,538 | |
| Wygen I | $ | 114,975 | | $ | 318 | | $ | (49,459) | | $ | 65,834 | |
Jointly Owned Facilities - Related Party
Busch Ranch I
Colorado Electric owns 50% of Busch Ranch I while Black Hills Electric Generation owns the remaining 50% ownership interest. Each company is obligated to make payments for costs associated with their proportionate share of the costs of operating the wind farm over the life of the facility. Colorado Electric retains responsibility for operations of the wind farm. Black Hills Electric Generation provides its share of energy from the wind farm to Colorado Electric through a PPA, which expires in October 2037.
Cheyenne Prairie
Cheyenne Prairie serves the utility customers of South Dakota Electric and Wyoming Electric. The facility includes one simple-cycle, 37 MW combustion turbine that is wholly-owned by Wyoming Electric and one combined-cycle, 100.4 MW unit that is jointly-owned by South Dakota Electric (58 MW) and Wyoming Electric (42.4 MW). BHSC is responsible for plant operations.
Corriedale
Corriedale serves as the dedicated wind energy supply for Renewable Ready customers in South Dakota and Wyoming. The 52.5 MW wind farm is jointly-owned by South Dakota Electric (32.5 MW) and Wyoming Electric (20 MW). BHSC is responsible for operations of the wind farm.
(7) ASSET RETIREMENT OBLIGATIONS
We have identified legal retirement obligations related to reclamation of mining sites in the Mining segment, removal of fuel tanks, transformers containing polychlorinated biphenyls, and an evaporation pond at our Electric Utilities, wind turbines at our Electric Utilities and Power Generation segments, retirement of gas pipelines at our Gas Utilities and removal of asbestos at our Electric and Gas Utilities. We periodically review and update estimated costs related to these AROs. The actual cost may vary from estimates because of regulatory requirements, changes in technology and increased costs of labor, materials and equipment.
The following tables present the details of AROs which are included on the accompanying Consolidated Balance Sheets in Other deferred credits and other liabilities (in thousands):
| | | | | | | | | | | | | | | | | | | | | |
| December 31, 2019 | Liabilities Incurred | Liabilities Settled | Accretion | | Revisions to Prior Estimates | December 31, 2020 |
Electric Utilities (a) | $ | 9,329 | | $ | 1,217 | | $ | 0 | | $ | 407 | | | $ | 0 | | $ | 10,953 | |
Gas Utilities (b) | 36,085 | | 4,782 | | (132) | | 1,539 | | | 0 | | 42,274 | |
| Power Generation | 4,739 | | 0 | | 0 | | 206 | | | 0 | | 4,945 | |
Mining (c) | 14,052 | | 0 | | (185) | | 617 | | | (1,225) | | 13,259 | |
| Total | 64,205 | | $ | 5,999 | | $ | (317) | | $ | 2,769 | | | $ | (1,225) | | $ | 71,431 | |
| | | | | | | | | | | | | | | | | | | | | |
| December 31, 2018 | Liabilities Incurred | Liabilities Settled | Accretion | | Revisions to Prior Estimates | December 31, 2019 |
Electric Utilities (d) | $ | 6,258 | | $ | 0 | | $ | 0 | | $ | 385 | | | $ | 2,686 | | $ | 9,329 | |
| Gas Utilities | 34,627 | | 0 | | 0 | | 1,458 | | | 0 | | 36,085 | |
Power Generation (a) | 300 | | 3,445 | | 0 | | 158 | | | 836 | | 4,739 | |
Mining (c) | 15,615 | | 0 | | (380) | | 740 | | | (1,923) | | 14,052 | |
| Total | $ | 56,800 | | $ | 3,445 | | $ | (380) | | $ | 2,741 | | | $ | 1,599 | | $ | 64,205 | |
| | | | | | | |
| | | | | | | |
_____________________
(a) Liabilities incurred were related to new wind assets.
(b) Liabilities incurred were driven by an increase in gas pipeline miles; which increases our legal liability for retirement of gas pipelines, specifically to purge and cap these lines in accordance with Federal regulations.
(c) The Mining Revisions to Prior Estimates were primarily driven by changes in estimated costs associated with back-filling the pit with overburden removed during the mining process.
(d) The Electric Utilities Revisions to Prior Estimates was primarily driven by an increase in the estimated cost to decommission certain regulated wind farm assets.
We also have legally required AROs related to certain assets within our electric transmission and distribution systems. These retirement obligations are pursuant to an easement or franchise agreement and are only required if we discontinue our utility service under such easement or franchise agreement. Accordingly, it is not possible to estimate a time period when these obligations could be settled and therefore, a liability for the cost of these obligations cannot be measured at this time.
(8) LEASES
Lessee
We lease from third parties certain office and operation center facilities, communication tower sites, equipment, and materials storage. Our leases have remaining terms ranging from less than 1 year to 3635 years, including options to extend that are reasonably certain to be exercised. We have 1 immaterial finance lease for communication equipment at the WRDC mine.
Most of our leases do not contain a readily determinable discount rate. Therefore, the present value of future lease payments is generally calculated using our applicable subsidiaries’ incremental borrowing rate (weighted-average of 4.24% as of December 31, 2020).
The componentsLeases with an initial term of lease12 months or less are classified as short-term leases and are not recognized on the accompanying Consolidated Balance Sheets.
Lease expense for the year ended December 31 were as follows (in thousands):
| | | | | | | | | | | |
| Income Statement Location | 2020 | 2019 |
| Operating lease cost | Operations and maintenance | $ | 978 | | $ | 1,456 | |
| | | |
| | | |
| | | |
| | | |
|
| | | | |
| | Income Statement Location | 2019 |
| Operating lease cost | Operations and maintenance | $ | 1,456 |
|
| Finance lease cost: | | |
| Amortization of right-of-use asset | Depreciation, depletion and amortization | 100 |
|
| Interest on lease liabilities | Interest expense incurred net of amounts capitalized (including amortization of debt issuance costs, premiums and discounts) | 19 |
|
| Total lease cost | | $ | 1,575 |
|
Supplemental balance sheet information related to leases as of December 31 was as follows (in thousands):
| | | | | | | | | | | |
| Balance Sheet Location | 2020 | 2019 |
| Assets: | | | |
| Operating lease assets | Other assets, non-current | $ | 4,188 | | $ | 4,629 | |
| | | |
| Total lease assets | | $ | 4,188 | | $ | 4,629 | |
| | | |
| Liabilities: | | | |
| Current: | | | |
| Operating leases | Accrued liabilities | $ | 736 | | $ | 1,179 | |
| | | |
| | | |
| Noncurrent: | | | |
| Operating leases | Other deferred credits and other liabilities | 3,807 | | 3,821 | |
| | | |
| Total lease liabilities | | $ | 4,543 | | $ | 5,000 | |
|
| | | | |
| | Balance Sheet Location | 2019 |
| Assets: | | |
| Operating lease assets | Other assets, non-current | $ | 4,629 |
|
| Finance lease assets | Other assets, non-current | 465 |
|
| Total lease assets | | $ | 5,094 |
|
| | | |
| Liabilities: | | |
| Current: | | |
| Operating leases | Accrued liabilities | $ | 1,179 |
|
| Finance lease | Accrued liabilities | 109 |
|
| | | |
| Noncurrent: | | |
| Operating leases | Other deferred credits and other liabilities | 3,821 |
|
| Finance lease | Other deferred credits and other liabilities | 364 |
|
| Total lease liabilities | | $ | 5,473 |
|
Supplemental cash flow information related to leases for the year ended December 31 was as follows (in thousands):
| | | | | | | | |
| 2020 | 2019 |
| Cash paid included in the measurement of lease liabilities: | | |
| Operating cash flows from operating leases | $ | 1,023 | | $ | 1,263 | |
| | |
| | |
| Right-of-use assets obtained in exchange for lease obligations: | | |
| Operating leases | $ | 161 | | $ | 2,801 | |
| | |
|
| | | |
| | 2019 |
| Cash paid included in the measurement of lease liabilities: | |
| Operating cash flows from operating leases | $ | 1,263 |
|
| Operating cash flows from finance lease | $ | 19 |
|
| Financing cash flows from finance lease | $ | 93 |
|
| Right-of-use assets obtained in exchange for lease obligations: | |
| Operating leases | $ | 2,801 |
|
| Finance lease | $ | 67 |
|
Weighted average remaining terms and discount rates related to leases as of December 31 were as follows:
| | | | | | | | |
| 2020 | 2019 |
| Weighted average remaining lease term: | | |
| Operating leases | 8 years | 8 years |
| | |
| | |
| Weighted average discount rate: | | |
| Operating leases | 4.24 | % | 4.27 | % |
| | |
|
| | |
| 2019 |
Weighted average remaining lease term (years): | |
Operating leases | 8 years |
|
Finance lease | 4 years |
|
| |
Weighted average discount rate: | |
Operating leases | 4.27 | % |
Finance lease | 4.19 | % |
As of December 31, 2019,2020, scheduled maturities of lease liabilities for future years were as follows (in thousands):
| | | | | | | |
| Operating Leases | | |
| 2021 | $ | 907 | | | |
| 2022 | 804 | | | |
| 2023 | 779 | | | |
| 2024 | 776 | | | |
| 2025 | 529 | | | |
| Thereafter | 1,643 | | | |
| Total lease payments | $ | 5,438 | | | |
| Less imputed interest | 895 | | | |
| Present value of lease liabilities | $ | 4,543 | | | |
|
| | | | | | | | | |
| | Operating Leases | Finance Lease | Total |
| 2020 | 1,018 |
| 126 |
| 1,144 |
|
| 2021 | 865 |
| 126 |
| 991 |
|
| 2022 | 743 |
| 126 |
| 869 |
|
| 2023 | 718 |
| 126 |
| 844 |
|
| 2024 | 714 |
| 10 |
| 724 |
|
| Thereafter | 2,009 |
| — |
| 2,009 |
|
Total lease payments (a) | $ | 6,067 |
| $ | 514 |
| $ | 6,581 |
|
| Less imputed interest | 1,067 |
| 41 |
| 1,108 |
|
| Present value of lease liabilities | $ | 5,000 |
| $ | 473 |
| $ | 5,473 |
|
_______________
| |
(a) | Lease payments exclude payments to landlords for common area maintenance, real estate taxes, and insurance. |
As previously disclosed in Note 14 of the Notes to the Consolidated Financial Statements in our 2018 Annual Report on Form 10-K, prior to the adoption of ASU 2016-02, Leases (Topic 842), the future minimum payments required under operating lease agreements as of December 31, 2018 were as follows (in thousands):
|
| | | |
| | Operating Leases |
| 2019 | $ | 1,052 |
|
| 2020 | 464 |
|
| 2021 | 344 |
|
| 2022 | 224 |
|
| 2023 | 216 |
|
| Thereafter | 1,776 |
|
Total lease payments | $ | 4,076 |
|
Lessor
We lease to third parties certain generating station ground leases, communication tower sites, and a natural gas pipeline. These leases have remaining terms ranging from less than one year to 3534 years.
The components of leaseLease revenue for the year ended December 31 were as follows (in thousands):
| | | | | | | | | | | |
| Income Statement Location | 2020 | 2019 |
| Operating lease income | Revenue | $ | 2,534 | | $ | 2,306 | |
|
| | | | |
| | Income Statement Location | 2019 |
| Operating lease income | Revenue | $ | 2,306 |
|
As of December 31, 2019,2020, scheduled maturities of operating lease payments to be received in future years were as follows (in thousands):
| | | | | | | |
| Operating Leases | | |
| 2021 | $ | 2,383 | | | |
| 2022 | 2,122 | | | |
| 2023 | 2,130 | | | |
| 2024 | 2,074 | | | |
| 2025 | 2,090 | | | |
| Thereafter | 58,829 | | | |
| Total lease receivables | $ | 69,628 | | | |
|
| | | |
| | Operating Leases |
| 2020 | 2,227 |
|
| 2021 | 1,857 |
|
| 2022 | 1,793 |
|
| 2023 | 1,799 |
|
| 2024 | 1,743 |
|
| Thereafter | 53,739 |
|
| Total lease receivables | $ | 63,158 |
|
(9) DEBT AND CREDIT FACILITIES (15) INCOME TAXES
TCJA
We had the following Notes payable outstanding at the Consolidated Balance Sheets date (in thousands):
| | | | | | | | | | | | | | |
| December 31, 2020 | December 31, 2019 |
| Balance Outstanding | Letters of Credit (a) | Balance Outstanding | Letters of Credit (a) |
| Revolving Credit Facility | $ | 0 | | $ | 24,730 | | $ | 0 | | $ | 30,274 | |
| CP Program | 234,040 | | 0 | | 349,500 | | 0 | |
| Total | $ | 234,040 | | $ | 24,730 | | $ | 349,500 | | $ | 30,274 | |
_______________
(a) Letters of credit are off-balance sheet commitments that reduce the borrowing capacity available on our corporate Revolving Credit Facility.
Revolving Credit Facility and CP Program
On July 30, 2018, we amended and restated our corporate Revolving Credit Facility, maintaining total commitments of $750 million and extending the term through July 30, 2023 with 2 one year extension options (subject to consent from lenders). This facility includes an accordion feature that allows us, with the consent of the administrative agent, the issuing agents and each bank increasing or providing a new commitment, to increase total commitments up to $1.0 billion. Borrowings continue to be available under a base rate or various Eurodollar rate options. The interest costs associated with the letters of credit or borrowings and the commitment fee under the Revolving Credit Facility are determined based upon our Corporate credit rating from S&P, Fitch and Moody's for our senior unsecured long-term debt. Based on our credit ratings, the margins for base rate borrowings, Eurodollar borrowings and letters of credit were 0.125%, 1.125% and 1.125%, respectively, at December 22, 2017,31, 2020. Based on our credit ratings, a 0.175% commitment fee was charged on the U.S. government enacted comprehensive tax legislation commonly referredunused amount at December 31, 2020.
We have a $750 million, unsecured CP Program that is backstopped by the Revolving Credit Facility. Amounts outstanding under the Revolving Credit Facility and the CP Program, either individually or in the aggregate, cannot exceed $750 million. The notes issued under the CP Program may have maturities not to exceed 397 days from the date of issuance and bear interest (or are sold at par less a discount representing an interest factor) based on, among other things, the size and maturity date of the note, the frequency of the issuance and our credit ratings. Under the CP Program, any borrowings rank equally with our unsecured debt. Notes under the CP Program are not registered and are offered and issued pursuant to a registration exemption.
Our net short-term borrowings (payments) during 2020 were $(115) million. As of December 31, 2020, the weighted average interest rate on short-term borrowings was 0.27%.
Total accumulated deferred financing costs on the Revolving Credit Facility of $6.7 million are being amortized over its estimated useful life and were included in Interest expense on the accompanying Consolidated Statements of Income. See below for additional details.
Long-term debt
Long-term debt outstanding was as follows (dollars in thousands):
| | | | | | | | | | | | | | |
| | Interest Rate at | Balance Outstanding |
| Due Date | December 31, 2020 | December 31, 2020 | December 31, 2019 |
| Corporate | | | | |
| Senior unsecured notes due 2023 | November 30, 2023 | 4.25% | $ | 525,000 | | $ | 525,000 | |
| Senior unsecured notes due 2026 | January 15, 2026 | 3.95% | 300,000 | | 300,000 | |
| Senior unsecured notes due 2027 | January 15, 2027 | 3.15% | 400,000 | | 400,000 | |
| Senior unsecured notes, due 2029 | October 15, 2029 | 3.05% | 400,000 | | 400,000 | |
| Senior unsecured notes, due 2030 | June 15, 2030 | 2.50% | 400,000 | | 0 | |
| Senior unsecured notes due 2033 | May 1, 2033 | 4.35% | 400,000 | | 400,000 | |
| Senior unsecured notes, due 2046 | September 15, 2046 | 4.20% | 300,000 | | 300,000 | |
| Senior unsecured notes, due 2049 | October 15, 2049 | 3.88% | 300,000 | | 300,000 | |
| Corporate term loan due 2021 | June 7, 2021 | 2.32% | 1,436 | | 7,178 | |
| Total Corporate debt | | | 3,026,436 | | 2,632,178 | |
| Less unamortized debt discount | | | (7,013) | | (6,462) | |
| Total Corporate debt, net | | | 3,019,423 | | 2,625,716 | |
| | | | |
| South Dakota Electric | | | | |
Series 94A Debt, variable rate (a) | June 1, 2024 | N/A | 0 | | 2,855 | |
| First Mortgage Bonds due 2032 | August 15, 2032 | 7.23% | 75,000 | | 75,000 | |
| First Mortgage Bonds due 2039 | November 1, 2039 | 6.13% | 180,000 | | 180,000 | |
| First Mortgage Bonds due 2044 | October 20, 2044 | 4.43% | 85,000 | | 85,000 | |
| Total South Dakota Electric debt | | | 340,000 | | 342,855 | |
| Less unamortized debt discount | | | (78) | | (82) | |
| Total South Dakota Electric debt, net | | | 339,922 | | 342,773 | |
| | | | |
| Wyoming Electric | | | | |
Industrial development revenue bonds due 2021(a) (b) | September 1, 2021 | 0.12% | 7,000 | | 7,000 | |
Industrial development revenue bonds due 2027(a) (b) | March 1, 2027 | 0.12% | 10,000 | | 10,000 | |
| First Mortgage Bonds due 2037 | November 20, 2037 | 6.67% | 110,000 | | 110,000 | |
| First Mortgage Bonds due 2044 | October 20, 2044 | 4.53% | 75,000 | | 75,000 | |
| Total Wyoming Electric debt | | | 202,000 | | 202,000 | |
| Less unamortized debt discount | | | 0 | | 0 | |
| Total Wyoming Electric debt, net | | | 202,000 | | 202,000 | |
| | | | |
| Total long-term debt | | | 3,561,345 | | 3,170,489 | |
| Less current maturities | | | 8,436 | | 5,743 | |
Less unamortized deferred financing costs (c) | | | 24,809 | | 24,650 | |
| Long-term debt, net of current maturities and deferred financing costs | | | $ | 3,528,100 | | $ | 3,140,096 | |
_______________
(a) Variable interest rate.
(b) A reimbursement agreement is in place with Wells Fargo on behalf of Wyoming Electric for the TCJA. The TCJA reduced2009A bonds of $10 million due March 1, 2027 and the U.S. federal corporate tax rate from 35%2009B bonds of $7.0 million due September 1, 2021. In the case of default, we hold the assumption of liability for drawings on Wyoming Electric’s Letter of Credit attached to 21%. As such, the Company remeasured thethese bonds.
(c) Includes deferred income taxes at the 21% federal tax ratefinancing costs associated with our Revolving Credit Facility of $1.0 million and $1.7 million as of December 31, 2017. The entities2020 and December 31, 2019, respectively.
Scheduled maturities of long-term debt, excluding amortization of premiums or discounts, for future years are (in thousands):
| | | | | |
| 2021 | $ | 8,436 | |
| 2022 | $ | 0 | |
| 2023 | $ | 525,000 | |
| 2024 | $ | 0 | |
| 2025 | $ | 0 | |
| Thereafter | $ | 3,035,000 | |
Our debt securities contain certain restrictive financial covenants, all of which the Company and its subsidiaries were in compliance with at December 31, 2020. See below for additional information.
Substantially all of the tangible utility property of South Dakota Electric and Wyoming Electric is subject to regulatory construct have madethe lien of indentures securing their best estimate regarding the probabilityfirst mortgage bonds. First mortgage bonds of settlements of net regulatory liabilities established pursuant to the TCJA. The amountSouth Dakota Electric and Wyoming Electric may be issued in amounts limited by property, earnings and other provisions of the settlements may change basedmortgage indentures.
Amortization of Deferred Financing Costs
Our deferred financing costs and associated amortization expense included in Interest expense on decisionsthe accompanying Consolidated Statements of Income were as follows (in thousands):
| | | | | | | | | | | | | | |
| Deferred Financing Costs Remaining at | | Amortization Expense for the years ended December 31, |
| December 31, 2020 | | 2020 | 2019 | 2018 |
| $ | 24,809 | | | $ | 3,272 | | $ | 3,242 | | $ | 2,829 | |
Debt Transactions
On June 17, 2020, we completed a public debt offering which consisted of $400 million of 2.50% 10-year senior unsecured notes due June 15, 2030. The proceeds were used to repay short-term debt and actionsfor working capital and general corporate purposes.
On March 24, 2020, South Dakota Electric paid off its $2.9 million, Series 94A variable rate notes due June 1, 2024. These notes were tendered by the federalsole investor on March 17, 2020.
On October 3, 2019, we completed a public debt offering of $700 million principal amount in senior unsecured notes. The debt offering consisted of $400 million of 3.05% 10-year senior notes due October 15, 2029 and state utility commissions,$300 million of 3.875% 30-year senior notes due October 15, 2049 (together the “Notes”). The proceeds of the Notes were used for the following:
• Repay the $400 million Corporate term loan under the Amended and Restated Credit Agreement due June 17, 2021;
• Retire the $200 million 5.875% senior notes due July 15, 2020; and
• Repay a portion of short-term debt.
On June 17, 2019, we amended our Corporate term loan due July 30, 2020. This amendment increased total commitments to $400 million from $300 million, extended the term through June 17, 2021, and had substantially similar terms and covenants as the amended and restated Revolving Credit Facility. The net proceeds from the increase in total commitments were used to pay down short-term debt. Proceeds from the October 3, 2019 public debt offering were used to repay this term loan.
Debt Covenants
Revolving Credit Facility
Under our Revolving Credit Facility and term loan agreements we are required to maintain a Consolidated Indebtedness to Capitalization Ratio not to exceed 0.65 to 1.00. Our Consolidated Indebtedness to Capitalization Ratio is calculated by dividing (i) Consolidated Indebtedness, which could haveincludes letters of credit and certain guarantees issued by (ii) Capital, which includes Consolidated Indebtedness plus Net Worth, which excludes noncontrolling interest in subsidiaries. Subject to applicable cure periods, a material impactviolation of any of these covenants would constitute an event of default that entitles the lenders to terminate their remaining commitments and accelerate all principal and interest outstanding.
We were in compliance with our covenants at December 31, 2020 as shown below:
| | | | | | | | | | | | | | |
| As of December 31, 2020 | | Covenant Requirement |
| Consolidated Indebtedness to Capitalization Ratio | 59.9% | | Less than | 65% |
Wyoming Electric
Covenants within Wyoming Electric's financing agreements require Wyoming Electric to maintain a debt to capitalization ratio of no more than 0.60 to 1.00. As of December 31, 2020, we were in compliance with these covenants.
Dividend Restrictions
Our credit facility and other debt obligations contain restrictions on the Company’s future resultspayment of operations,cash dividends when a default or event of default occurs.
Due to our holding company structure, substantially all of our operating cash flows are provided by dividends paid or financial position.distributions made by our subsidiaries. The cash to pay dividends to our shareholders is derived from these cash flows. As a result, certain statutory limitations or regulatory or financing agreements could affect the levels of the revaluationdistributions allowed to be made by our subsidiaries. The following restrictions on distributions from our subsidiaries existed at December 31, 2017, deferred tax assets and liabilities were reduced by approximately $309 million. Of2020:
•Our utilities are generally limited to the $309 million, approximately $301 million is relatedamount of dividends allowed to be paid to our utility holding company under the Federal Power Act and settlement agreements with state regulatory jurisdictions. As of December 31, 2020, the restricted net assets at our Electric and Gas Utilities were approximately $155 million.
•South Dakota Electric and Wyoming Electric are generally limited to the amount of dividends allowed to be paid to our utility holding company under certain financing agreements.
(10) STOCKHOLDERS' EQUITY
February 2020 Equity Issuance
On February 27, 2020, we issued 1.2 million shares of common stock to a single investor through an underwritten registered transaction at a price of $81.77 per share for proceeds of $99 million, net of $1.0 million of issuance costs. The shares of common stock were offered pursuant to our shelf registration statement filed with the SEC.
At-the-Market Equity Offering Program
On August 3, 2020, we filed a shelf registration and DRSPP with the SEC. In conjunction with these shelf filings, we renewed the ATM. The renewed ATM program, which allows us to sell shares of our common stock, is the same as the prior program other than the aggregate value increased from $300 million to $400 million and a forward sales option was incorporated. This forward sales option allows us to sell our shares through the ATM program at the current trading price without actually issuing any shares to satisfy the sale until a future date. Under the ATM, shares may be offered from time to time pursuant to a sales agreement dated August 3, 2020. Shares of common stock are offered pursuant to our shelf registration statement filed with the SEC.
We did not issue any common shares under the ATM during the twelve months ended December 31, 2020. During the twelve months ended December 31, 2019, we issued a total of 1,328,332 shares of common stock under the ATM for $99 million, net of $1.2 million in issuance costs. We did not issue any common shares under the ATM during the twelve months ended December 31, 2018.
Shareholder Dividend Reinvestment and Stock Purchase Plan
We have a DRSPP under which shareholders may purchase additional shares of common stock through dividend reinvestment and/or optional cash payments at 100% of the recent average market price. We have the option of issuing new shares or purchasing the shares on the open market. We issued new shares until March 1, 2018, after which we began purchasing shares on the open market. At December 31, 2020, there were 163,962 shares of unissued stock available for future offering under the DRSPP.
Preferred Stock
Our articles of incorporation authorize the issuance of 25 million shares of preferred stock of which we had 0 shares of preferred stock outstanding.
(11) RISK MANAGEMENT AND DERIVATIVES
Market and Credit Risk Disclosures
Our activities in the regulated and non-regulated energy sectors expose us to a number of risks in the normal operations of our businesses. Depending on the activity, we are exposed to varying degrees of market risk and credit risk. To manage and mitigate these identified risks, we have adopted the Black Hills Corporation Risk Policies and Procedures. Valuation methodologies for our derivatives are detailed within Note 1.
Market Risk
Market risk is the potential loss that may occur as a result of an adverse change in market price, rate or supply. We are exposed, but not limited to, the following market risks:
•Commodity price risk associated with our retail natural gas and wholesale electric power marketing activities and our fuel procurement for several of our gas-fired generation assets, which include market fluctuations due to unpredictable factors such as the COVID-19 pandemic, weather, market speculation, pipeline constraints, and other factors that may impact natural gas and electric supply and demand; and
•Interest rate risk associated with future debt, including reduced access to liquidity during periods of extreme capital markets volatility, such as the 2008 financial crisis and the COVID-19 pandemic.
Credit Risk
Credit risk is the risk of financial loss resulting from non-performance of contractual obligations by a counterparty.
We attempt to mitigate our credit exposure by conducting business primarily with high credit quality entities, setting tenor and credit limits commensurate with counterparty financial strength, obtaining master netting agreements and mitigating credit exposure with less creditworthy counterparties through parental guarantees, cash collateral requirements, letters of credit and other security agreements.
We perform ongoing credit evaluations of our customers and adjust credit limits based upon payment history and the customer’s current creditworthiness, as determined by review of their current credit information. We maintain a provision for estimated credit losses based upon historical experience, changes in current market conditions, expected losses and any specific customer collection issue that is identified. Our credit exposure at December 31, 2020 was concentrated primarily among retail utility customers, investment grade companies, cooperative utilities and is reclassifiedfederal agencies.
We continue to a regulatory liability.monitor COVID-19 impacts and changes to customer load, consistency in customer payments, requests for deferred or discounted payments, and requests for changes to credit limits to quantify estimated future financial impacts to the allowance for credit losses. During the year ended December 31, 2018 we recorded approximately $11 million2020, the potential economic impact of additional regulatory liability associated with TCJA related items primarilythe COVID-19 pandemic was considered in forward looking projections related to property, completing the revaluation of deferred taxes pursuantwrite-off and recovery rates, and resulted in increases to the TCJA. A majorityallowance for credit losses and bad debt expense of $3.3 million. See Note 1 for further information.
Derivatives and Hedging Activity
Our derivative and hedging activities included in the excess deferred taxesaccompanying Consolidated Balance Sheets, Consolidated Statements of Income and Consolidated Statements of Comprehensive Income (Loss) are subjectdetailed below and within Note 12.
The operations of our Utilities, including natural gas sold by our Gas Utilities and natural gas used by our Electric Utilities’ generation plants or those plants under PPAs where our Electric Utilities must provide the generation fuel (tolling agreements), expose our utility customers to the average rate assumption method,natural gas price volatility. Therefore, as prescribedallowed or required by the IRS,state utility commissions, we have entered into commission approved hedging programs utilizing natural gas futures, options, over-the-counter swaps and will generally be amortized as a reduction of customer rates over the remaining lives of the related assets. As of December 31, 2019, the Company has amortized $6.5 million of the regulatory liability. The portion that was eligible for amortization under the average rate assumption method in 2019, but is awaiting resolution of the treatment ofbasis swaps to reduce our customers’ underlying exposure to these amounts in future regulatory proceedings, has not been recognizedfluctuations. These transactions are considered derivatives, and may be refunded in customer rates at any time in accordance with the resolution of pendingaccounting standards for derivatives and hedging, mark-to-market adjustments are recorded as Derivative assets or future regulatory proceedings.
Tax benefit related to legal entity restructuring
As part of the Company’s ongoing efforts to continue to integrate the legal entities that the Company has acquired in recent years, certain legal entity restructuring transactions occurred on March 31, 2018 and December 31, 2018. As a result of these transactions, additional deferred income tax assets of $73 million, related to goodwill that is amortizable for tax purposes, were recorded and deferred tax benefits of $73 million were recorded to income tax benefit (expense) on the Consolidated Statements of Income. Due to this being a common control transaction, it had no effect on the other assets and liabilities of these entities.
Income tax expense (benefit) from continuing operations for the years ended December 31 was (in thousands):
|
| | | | | | | | | |
| | 2019 | 2018 | 2017 |
| Current: | | | |
| Federal | $ | (8,578 | ) | $ | 325 |
| $ | (6,193 | ) |
| State | 138 |
| 247 |
| (1,432 | ) |
| | (8,440 | ) | 572 |
| (7,625 | ) |
| Deferred: | | | |
| Federal | 34,551 |
| (25,022 | ) | 76,522 |
|
| State | 3,469 |
| 783 |
| 4,470 |
|
| | 38,020 |
| (24,239 | ) | 80,992 |
|
| | | | |
| | $ | 29,580 |
| $ | (23,667 | ) | $ | 73,367 |
|
Included in discontinued operations is a tax benefit of $2.6 million and $8.4 million for 2018 and 2017, respectively.
The temporary differences, which gave rise to the net deferred tax liability, for the years ended December 31 were as follows (in thousands):
|
| | | | | | |
| | 2019 | 2018 |
| Deferred tax assets: | | |
| Regulatory liabilities | $ | 89,754 |
| $ | 92,966 |
|
| State tax credits | 23,261 |
| 20,466 |
|
| Federal net operating loss | 120,624 |
| 139,371 |
|
| State net operating loss | 13,537 |
| 16,647 |
|
| Partnership | 14,030 |
| 16,032 |
|
| Credit Carryovers | 27,139 |
| 23,124 |
|
Other deferred tax assets(a) | 33,395 |
| 39,349 |
|
| Less: Valuation allowance | (12,063 | ) | (11,809 | ) |
| Total deferred tax assets | 309,677 |
| 336,146 |
|
| | | |
| Deferred tax liabilities: | | |
| Accelerated depreciation, amortization and other property-related differences | (533,292 | ) | (529,338 | ) |
| Regulatory assets | (23,586 | ) | (32,324 | ) |
Goodwill (b) | (15,875 | ) | (602 | ) |
| State deferred tax liability | (72,911 | ) | (64,095 | ) |
| Other deferred tax liabilities | (24,732 | ) | (21,118 | ) |
| Total deferred tax liabilities | (670,396 | ) | (647,477 | ) |
| | | |
| Net deferred tax liability | $ | (360,719 | ) | $ | (311,331 | ) |
_______________
| |
(a) | Other deferred tax assets consist primarily of alternative minimum tax credit and federal research and development credits. No single item exceeds 5% of the total net deferred tax liability. |
| |
(b) | Legal entity restructuring - see above. |
The effective tax rate differs from the federal statutory rate for the years ended December 31, as follows:
|
| | | | | | |
| | 2019 | 2018 | 2017 |
| Federal statutory rate | 21.0 | % | 21.0 | % | 35.0 | % |
| State income tax (net of federal tax effect) | 1.5 |
| 2.3 |
| 0.9 |
|
Non-controlling interest (a) | (1.2 | ) | (1.3 | ) | (1.8 | ) |
| Tax credits | (3.9 | ) | (2.0 | ) | (1.7 | ) |
Flow-through adjustments (b) | (2.4 | ) | (1.6 | ) | (1.1 | ) |
Jurisdictional consolidation project (d) | — |
| (28.5 | ) | — |
|
| Other tax differences | (1.6 | ) | (0.1 | ) | (2.6 | ) |
TCJA corporate rate reduction (c) | — |
| 1.6 |
| (2.7 | ) |
Amortization of excess deferred income tax expense (e) | (1.2 | ) | (0.7 | ) | — |
|
| | 12.2 | % | (9.3 | )% | 26.0 | % |
_________________________
| |
(a) | The effective tax rate reflects the income attributable to the noncontrolling interest in Black Hills Colorado IPP for which a tax provision was not recorded. |
| |
(b) | Flow-through adjustments related primarily to accounting method changes for tax purposes that allow us to take a current tax deduction for repair costs and certain indirect costs. We recorded a deferred income tax liability in recognition of the temporary difference created between book and tax treatment and flowed the tax benefit through to tax expense. A regulatory asset was established to reflect the recovery of future increases in taxes payable from customers as the temporary differences reverse. As a result of this regulatory treatment, we continue to record tax benefits consistent with the flow-through method. |
| |
(c) | On December 22, 2017, the TCJA was signed into law reducing the federal corporate rate from 35% to 21% effective January 1, 2018. The 2017 effective tax rate reduction reflects the revaluation of deferred income taxes associated with non-regulated operations required by the change. During the year ended December 31, 2018, we recorded $4.0 million of additional tax expense associated with changes in the prior estimated impacts of TCJA related items. During the year ended December 31, 2017, we recorded $7.6 million of tax benefit resulting from revaluation of net deferred tax liabilities in accordance with ASC 740 and the enactment of the TCJA on December 22, 2017. |
| |
(d) | Legal entity restructuring - see above. |
| |
(e) | Primarily TCJA - see above. |
At December 31, 2019, we have federal and state NOL carryforwards that will expire at various dates as follows (in thousands):
|
| | | | | | | | |
| | | Amounts | | Expiration Dates |
| Federal Net Operating Loss Carryforward | | $ | 575,457 |
| | 2022 | to | 2037 |
| | | | | | | |
State Net Operating Loss Carryforward (a) | | $ | 224,716 |
| | 2020 | to | 2040 |
_________________________
| |
(a) | The carryforward balance is reflected on the basis of apportioned tax losses to jurisdictions imposing state income taxes. |
As of December 31, 2019, we had a $0.5 million valuation allowance against the state NOL carryforwards. Our 2019 analysis of the ability to utilize such NOLs resulted in no increase in the valuation allowance. If the valuation allowance is adjusted due to higher or lower than anticipated utilization of the NOLs, the offsetting amount will affect tax expense.
The following table reconciles the total amounts of unrecognized tax benefits, without interest, at the beginning and end of the period included in Other deferred credits and otherDerivative liabilities on the accompanying Consolidated Balance Sheets, net of balance sheet offsetting as permitted by GAAP.
For our regulated Utilities’ hedging plans, unrealized and realized gains and losses, as well as option premiums and commissions on these transactions are recorded as Regulatory assets or Regulatory liabilities in the accompanying Consolidated Balance Sheets in accordance with state regulatory commission guidelines. When the related costs are recovered through our rates, the hedging activity is recognized in the Consolidated Statements of Income.
We periodically have wholesale power purchase and sale contracts used to manage purchased power costs and load requirements associated with serving our electric customers that are considered derivative instruments due to not qualifying for the normal purchase and normal sales exception to derivative accounting. Changes in the fair value of these commodity derivatives are recognized in the Consolidated Statements of Income.
We buy, sell and deliver natural gas at competitive prices by managing commodity price risk. As a result of these activities, this area of our business is exposed to risks associated with changes in the market price of natural gas. We manage our exposure to such risks using over-the-counter and exchange traded options and swaps with counterparties in anticipation of forecasted purchases and sales during time frames ranging from January 2021 through May 2022. A portion of our over-the-counter swaps have been designated as cash flow hedges to mitigate the commodity price risk associated with deliveries under fixed price forward contracts to deliver gas to our Choice Gas Program customers. The gain or loss on these designated derivatives is reported in AOCI in the accompanying Consolidated Balance Sheets and reclassified into earnings in the same period that the underlying hedged item is recognized in earnings. Effectiveness of our hedging position is evaluated at least quarterly.
The contract or notional amounts and terms of the natural gas derivative commodity instruments held by our utilities are comprised of both short and long positions. We had the following net long positions as of:
| | | | | | | | | | | | | | |
| December 31, 2020 | December 31, 2019 |
| Notional (MMBtus) | Maximum Term (months) (a) | Notional (MMBtus) | Maximum Term (months) (a) |
| Natural gas futures purchased | 620,000 | | 3 | 1,450,000 | | 12 |
| Natural gas options purchased, net | 3,160,000 | | 3 | 3,240,000 | | 3 |
| Natural gas basis swaps purchased | 900,000 | | 3 | 1,290,000 | | 12 |
Natural gas over-the-counter swaps, net (b) | 3,850,000 | | 17 | 4,600,000 | | 24 |
Natural gas physical commitments, net (c) | 17,513,061 | | 22 | 13,548,235 | | 12 |
Electric wholesale contracts (c) | 219,000 | | 12 | 0 | | 0 |
__________
(a) Term reflects the maximum forward period hedged.
(b) As of December 31, 2020, 914,600 of natural gas over-the-counter swaps purchased were designated as cash flow hedges.
(c) Volumes exclude derivative contracts that qualify for the normal purchase, normal sales exception permitted by GAAP.
We have certain derivative contracts which contain credit provisions. These credit provisions may require the Company to post collateral when credit exposure to the Company is in excess of a negotiated line of unsecured credit. At December 31, 2020, the Company posted $1.5 million related to such provisions, which is included in Other current assets on the Consolidated Balance Sheets.
Derivatives by Balance Sheet Classification
As required by accounting standards for derivatives and hedges, fair values within the following tables are presented on a gross basis aside from the netting of asset and liability positions. Netting of positions is permitted in accordance with accounting standards for offsetting and under terms of our master netting agreements that allow us to settle positive and negative positions.
The following tables present the fair value and balance sheet classification of our derivative instruments as of December 31, (in thousands):
| | | | | | | | | | | |
| Balance Sheet Location | 2020 | 2019 |
| Derivatives designated as hedges: | | | |
| Asset derivative instruments: | | | |
| Current commodity derivatives | Derivative assets - current | $ | 181 | | $ | 1 | |
| Noncurrent commodity derivatives | Other assets, non-current | 43 | | 3 | |
| Liability derivative instruments: | | | |
| Current commodity derivatives | Derivative liabilities - current | (108) | | (490) | |
| Noncurrent commodity derivatives | Other deferred credits and other liabilities | 0 | | (29) | |
| Total derivatives designated as hedges | $ | 116 | | $ | (515) | |
| | | |
| Derivatives not designated as hedges: | | | |
| Asset derivative instruments: | | | |
| Current commodity derivatives | Derivative assets - current | $ | 1,667 | | $ | 341 | |
| Noncurrent commodity derivatives | Other assets, non-current | 151 | | 2 | |
| Liability derivative instruments: | | | |
| Current commodity derivatives | Derivative liabilities - current | (1,936) | | (1,764) | |
| Noncurrent commodity derivatives | Other deferred credits and other liabilities | 0 | | (63) | |
| Total derivatives not designated as hedges | $ | (118) | | $ | (1,484) | |
|
| | | |
| | Changes in Uncertain Tax Positions |
| Beginning balance at January 1, 2017 | $ | 3,592 |
|
| Additions for prior year tax positions | 358 |
|
| Reductions for prior year tax positions | (5,713 | ) |
| Additions for current year tax positions | 5,026 |
|
| Settlements | — |
|
| Ending balance at December 31, 2017 | 3,263 |
|
| Additions for prior year tax positions | 251 |
|
| Reductions for prior year tax positions | (417 | ) |
| Additions for current year tax positions | 486 |
|
| Settlements | — |
|
| Ending balance at December 31, 2018 | 3,583 |
|
| Additions for prior year tax positions | 446 |
|
| Reductions for prior year tax positions | (862 | ) |
| Additions for current year tax positions | 998 |
|
| Settlements | — |
|
| Ending balance at December 31, 2019 | $ | 4,165 |
|
Derivatives Designated as Hedge Instruments
The total amountimpact of unrecognized tax benefits that, if recognized, would impact the effective tax ratecash flow hedges on our Consolidated Statements of Income is approximately $0.3 million.
We recognized 0 interest expense associated with income taxespresented below for the years ended December 31, 2019, December 31, 2018 and December 31, 2017. We had 0 accrued interest (before tax effect) associated with income taxes at December 31,2020, 2019 and December 31, 2018. Note that this presentation does not reflect the gains or losses arising from the underlying physical transactions; therefore, it is not indicative of the economic profit or loss we realized when the underlying physical and financial transactions were settled.
| | | | | | | | | | | | | | | | | | | | | | | |
| 2020 | 2019 | 2018 | | 2020 | 2019 | 2018 |
| Derivatives in Cash Flow Hedging Relationships | Amount of Gain/(Loss) Recognized in OCI | Income Statement Location | Amount of Gain/(Loss) Reclassified from AOCI into Income |
| (in thousands) | | (in thousands) |
| Interest rate swaps | $ | 2,851 | | $ | 2,851 | | $ | 2,851 | | Interest expense | $ | (2,851) | | $ | (2,851) | | $ | (2,851) | |
| Commodity derivatives | 540 | | (965) | | 1,113 | | Fuel, purchased power and cost of natural gas sold | (601) | | 417 | | (130) | |
| Total | $ | 3,391 | | $ | 1,886 | | $ | 3,964 | | | $ | (3,452) | | $ | (2,434) | | $ | (2,981) | |
The Company is subject to federal income tax as well as income tax in various state and local jurisdictions. Black Hills Gas, Inc. and subsidiaries, which filed a separate consolidated tax return from BHC and subsidiaries through March 31, 2018, is under examination by the IRS for 2014. BHC is no longer subject to examination for tax years prior to 2016.
As of December 31, 2020, $2.8 million of net losses related to our interest rate swaps and commodity derivatives are expected to be reclassified from AOCI into earnings within the next 12 months. As market prices fluctuate, estimated and actual realized gains or losses will change during future periods.
Derivatives Not Designated as Hedge Instruments
The following table summarizes the impacts of derivative instruments not designated as hedge instruments on our Consolidated Statements of Income for the years ended December 31, 2020, 2019 we doand 2018. Note that this presentation does not have any tax positions for whichreflect the expected gains or losses arising from the underlying physical transactions; therefore, it is reasonably possible thatnot indicative of the total amounteconomic gross profit we realized when the underlying physical and financial transactions were settled.
| | | | | | | | | | | | | | |
| | 2020 | 2019 | 2018 |
| Derivatives Not Designated as Hedging Instruments | Income Statement Location | Amount of Gain/(Loss) on Derivatives Recognized in Income |
| | (in thousands) |
| Commodity derivatives - Electric | Fuel, purchased power and cost of natural gas sold | $ | 144 | | $ | 0 | | $ | 0 | |
| Commodity derivatives - Natural Gas | Fuel, purchased power and cost of natural gas sold | 1,640 | | (1,100) | | 1,101 | |
| | $ | 1,784 | | $ | (1,100) | | $ | 1,101 | |
As discussed above, financial instruments used in our regulated Gas Utilities are not designated as cash flow hedges. However, there is no earnings impact because the unrealized gains and losses arising from the use of unrecognized tax benefits will significantly increasethese financial instruments are recorded as Regulatory assets or decrease onRegulatory liabilities. The net unrealized losses included in our Regulatory assets or beforeRegulatory liability accounts related to these financial instruments in our Gas Utilities were $2.2 million and $3.3 million at December 31, 2020.2020 and 2019, respectively. For our Electric Utilities, the unrealized gains and losses arising from these derivatives are recognized in the Consolidated Statements of Income.
State tax credits have been generated and are available to offset future state income taxes. At December 31, 2019, we had the following state tax credit carryforwards (in thousands):
|
| | | | | | |
| State Tax Credit Carryforwards | Expiration Year |
| ITC | $ | 23,060 |
| 2023 | to | 2041 |
| Research and development | $ | 201 |
| No expiration |
(12) FAIR VALUE MEASUREMENTS
Recurring Fair Value Measurements
Derivatives
The following tables set forth, by level within the fair value hierarchy, our gross assets and gross liabilities and related offsetting as permitted by GAAP that were accounted for at fair value on a recurring basis for derivative instruments.
| | | | | | | | | | | | | | | | | | | | |
| As of December 31, 2020 |
| Level 1 | Level 2 | Level 3 | | Cash Collateral and Counterparty Netting (a) | Total |
| (in thousands) |
| Assets: | | | | | | |
| Commodity derivatives - Gas Utilities | $ | 0 | | $ | 2,504 | | $ | 0 | | | $ | (1,527) | | $ | 977 | |
| Commodity derivatives - Electric Utilities | 0 | | 1,065 | | 0 | | | 0 | | 1,065 | |
| Total | $ | 0 | | $ | 3,569 | | $ | 0 | | | $ | (1,527) | | $ | 2,042 | |
| | | | | | |
| Liabilities: | | | | | | |
| Commodity derivatives - Gas Utilities | $ | 0 | | $ | 2,675 | | $ | 0 | | | $ | (1,552) | | $ | 1,123 | |
| Commodity derivatives - Electric Utilities | 0 | $ | 921 | | 0 | | $ | 0 | | $ | 921 | |
| Total | $ | 0 | | $ | 3,596 | | $ | 0 | | | $ | (1,552) | | $ | 2,044 | |
_______________
(a) As of December 31, 2020, $1.5 million of our commodity derivative gross assets and $1.6 million of our commodity derivative gross liabilities, as well as related gross collateral amounts, were subject to master netting agreements.
| | | | | | | | | | | | | | | | | | | | |
| As of December 31, 2019 |
| Level 1 | Level 2 | Level 3 | | Cash Collateral and Counterparty Netting (a) | Total |
| Assets: | | | | | | |
| Commodity derivatives - Gas Utilities | $ | 0 | | 1,433 | | $ | 0 | | | $ | (1,085) | | $ | 348 | |
| Total | $ | 0 | | $ | 1,433 | | $ | 0 | | | $ | (1,085) | | $ | 348 | |
| | | | | | |
| Liabilities: | | | | | | |
| Commodity derivatives - Gas Utilities | $ | 0 | | $ | 5,254 | | $ | 0 | | | $ | (2,909) | | $ | 2,345 | |
| Total | $ | 0 | | $ | 5,254 | | $ | 0 | | | $ | (2,909) | | $ | 2,345 | |
_______________
(a) As of December 31, 2019, we had$1.1 million of our commodity derivative assets and $2.9 million of our commodity derivative liabilities, as well as related gross collateral amounts, were subject to master netting agreements.
Pension and Postretirement Plan Assets
A discussion of the fair value of our Pension and Postretirement Plan assets is included in Note 15.
Nonrecurring Fair Value Measurement
A discussion of the fair value of our investment in equity securities of a $9 million valuation allowance against the state tax credit carryforwards. Ultimate usageprivately held oil and gas company, a Level 3 asset, is included in Note 1.
Other Fair Value Measurements
The carrying amount of these credits depends upon our future tax filings. If the valuation allowance is adjustedcash and cash equivalents, restricted cash and equivalents, and short-term borrowings approximates fair value due to highertheir liquid or lower than anticipated utilizationshort-term nature. Cash, cash equivalents, and restricted cash are classified in Level 1 in the fair value hierarchy. Notes payable consist of commercial paper borrowings and since these borrowings are not traded on an exchange, they are classified in Level 2 in the state tax credit carryforwards, the offsetting amount will affect tax expense.
(
The following table presents the carrying amounts and fair values of financial instruments not recorded at fair value on the Consolidated Balance Sheets at December 31 (in thousands):
16
| | | | | | | | | | | | | | |
| 2020 | 2019 |
| Carrying Amount | Fair Value | Carrying Amount | Fair Value |
| | | | |
| | | | |
| | | | |
Long-term debt, including current maturities (a) | $ | 3,536,536 | | $ | 4,208,167 | | $ | 3,145,839 | | $ | 3,479,367 | |
_______________
(a) Long-term debt is valued based on observable inputs available either directly or indirectly for similar liabilities in active markets and therefore is classified in Level 2 in the fair value hierarchy. Carrying amount of long-term debt is net of deferred financing costs.
)
(13) OTHER COMPREHENSIVE INCOME
We record deferred gains (losses) in AOCI related to interest rate swaps designated as cash flow hedges, commodity contracts designated as cash flow hedges and the amortization of components of our defined benefit plans. Deferred gains (losses) for our commodity contracts designated as cash flow hedges are recognized in earnings upon settlement, while deferred gains (losses) related to our interest rate swaps are recognized in earnings as they are amortized.
The following table details reclassifications out of AOCI and into net income. The amounts in parentheses below indicate decreases to net income in the Consolidated Statements of Income for the period, net of tax (in thousands):
| | | | Location on the Consolidated Statements of Income | Amount Reclassified from AOCI | | Location on the Consolidated Statements of Income | Amount Reclassified from AOCI |
| December 31, 2019 | December 31, 2018 | December 31, 2020 | December 31, 2019 |
| Gains and (losses) on cash flow hedges: | | | Gains and (losses) on cash flow hedges: | |
| Interest rate swaps | Interest expense | $ | (2,851 | ) | $ | (2,851 | ) | Interest rate swaps | Interest expense | $ | (2,851) | | $ | (2,851) | |
| Commodity contracts | Fuel, purchased power and cost of natural gas sold | 417 |
| (130 | ) | Commodity contracts | Fuel, purchased power and cost of natural gas sold | (601) | | 417 | |
| | | (2,434 | ) | (2,981 | ) | | (3,452) | | (2,434) | |
| Income tax | Income tax benefit (expense) | 611 |
| 630 |
| Income tax | Income tax benefit (expense) | 383 | | 611 | |
| Total reclassification adjustments related to cash flow hedges, net of tax | | $ | (1,823 | ) | $ | (2,351 | ) | Total reclassification adjustments related to cash flow hedges, net of tax | | $ | (3,069) | | $ | (1,823) | |
| | | | | |
| Amortization of components of defined benefit plans: | | | Amortization of components of defined benefit plans: | |
| Prior service cost | Operations and maintenance | $ | 77 |
| $ | 178 |
| Prior service cost | Operations and maintenance | $ | 103 | | $ | 77 | |
| | | | |
| Actuarial gain (loss) | Operations and maintenance | (745 | ) | (2,487 | ) | Actuarial gain (loss) | Operations and maintenance | (2,387) | | (745) | |
| | | (668 | ) | (2,309 | ) | | (2,284) | | (668) | |
| Income tax | Income tax benefit (expense) | (453 | ) | 543 |
| Income tax | Income tax benefit (expense) | 935 | | (453) | |
| Total reclassification adjustments related to defined benefit plans, net of tax | | $ | (1,121 | ) | $ | (1,766 | ) | Total reclassification adjustments related to defined benefit plans, net of tax | | $ | (1,349) | | $ | (1,121) | |
| | | | | |
| Total reclassifications | | $ | (2,944 | ) | $ | (4,117 | ) | Total reclassifications | | $ | (4,418) | | $ | (2,944) | |
Balances by classification included within AOCI, net of tax on the accompanying Consolidated Balance Sheets were as follows (in thousands):
| | | | | | | | | | | | | | |
| Derivatives Designated as Cash Flow Hedges | | |
| Interest Rate Swaps | Commodity Derivatives | Employee Benefit Plans | Total |
| As of December 31, 2019 | $ | (15,122) | | $ | (456) | | $ | (15,077) | | $ | (30,655) | |
| Other comprehensive income (loss) | | | | |
| before reclassifications | 0 | | (47) | | (1,062) | | (1,109) | |
| Amounts reclassified from AOCI | 2,564 | | 505 | | 1,349 | | 4,418 | |
| | | | |
| As of December 31, 2020 | $ | (12,558) | | $ | 2 | | $ | (14,790) | | $ | (27,346) | |
| | | | |
| Derivatives Designated as Cash Flow Hedges | | |
| Interest Rate Swaps | Commodity Derivatives | Employee Benefit Plans | Total |
| As of December 31, 2018 | $ | (17,307) | | $ | 328 | | $ | (9,937) | | $ | (26,916) | |
| Other comprehensive income (loss) | | | | |
| before reclassifications | 0 | | (422) | | (6,261) | | (6,683) | |
| Amounts reclassified from AOCI | 2,185 | | (362) | | 1,121 | | 2,944 | |
| | | | |
| | | | |
| As of December 31, 2019 | $ | (15,122) | | $ | (456) | | $ | (15,077) | | $ | (30,655) | |
|
| | | | | | | | | | | | |
| | Derivatives Designated as Cash Flow Hedges | | |
| | Interest Rate Swaps | Commodity Derivatives | Employee Benefit Plans | Total |
| As of December 31, 2018 | $ | (17,307 | ) | $ | 328 |
| $ | (9,937 | ) | $ | (26,916 | ) |
| Other comprehensive income (loss) | | | | |
| before reclassifications | — |
| (422 | ) | (6,261 | ) | (6,683 | ) |
| Amounts reclassified from AOCI | 2,185 |
| (362 | ) | 1,121 |
| 2,944 |
|
| As of December 31, 2019 | $ | (15,122 | ) | $ | (456 | ) | $ | (15,077 | ) | $ | (30,655 | ) |
| | | | | |
| | Derivatives Designated as Cash Flow Hedges | | |
| | Interest Rate Swaps | Commodity Derivatives | Employee Benefit Plans | Total |
| As of December 31, 2017 | $ | (19,581 | ) | $ | (518 | ) | $ | (21,103 | ) | $ | (41,202 | ) |
| Other comprehensive income (loss) | | | | |
| before reclassifications | — |
| 755 |
| 2,155 |
| 2,910 |
|
| Amounts reclassified from AOCI | 2,252 |
| 99 |
| 1,766 |
| 4,117 |
|
| Reclassification to regulatory asset | — |
| — |
| 6,519 |
| 6,519 |
|
| Reclassification of certain tax effects from AOCI | 22 |
| (8 | ) | 726 |
| 740 |
|
| As of December 31, 2018 | $ | (17,307 | ) | $ | 328 |
| $ | (9,937 | ) | $ | (26,916 | ) |
(17) SUPPLEMENTAL DISCLOSURE OF CASH FLOW INFORMATION
|
| | | | | | | | | | | |
| Years ended December 31, | 2019 | | 2018 | | 2017 |
| | (in thousands) |
| Non-cash investing activities and financing from continuing operations - | | | | | |
| Accrued property, plant and equipment purchases at December 31 | $ | 91,491 |
| | $ | 69,017 |
| | $ | 28,191 |
|
| Increase (decrease) in capitalized assets associated with asset retirement obligations | $ | 5,044 |
| | $ | 2,625 |
| | $ | 3,198 |
|
| | | | | | |
| Cash (paid) refunded during the period for continuing operations- | | | | | |
| Interest (net of amounts capitalized) | $ | (131,774 | ) | | $ | (137,965 | ) | | $ | (132,428 | ) |
| Income taxes (paid) refunded | $ | 4,682 |
| | $ | (14,730 | ) | | $ | 1,775 |
|
(14) VARIABLE INTEREST ENTITY (
Black Hills Colorado IPP owns and operates a 200 MW, combined-cycle natural gas generating facility located in Pueblo, Colorado. In 2016, Black Hills Electric Generation sold a 49.9%, noncontrolling interest in Black Hills Colorado IPP to a third-party buyer. Black Hills Electric Generation is the operator of the facility, which is contracted to provide capacity and energy through 2031 to Colorado Electric.
The accounting for a partial sale of a subsidiary in which control is maintained and the subsidiary continues to be consolidated, is specified under ASC 810, 18Consolidation) . The partial sale is required to be recorded as an equity transaction with no resulting gain or loss on the sale. GAAP requires that noncontrolling interests in subsidiaries and affiliates be reported in the equity section of a company’s balance sheet.
Net income available for common stock for the years ended December 31, 2020, 2019 and 2018 was reduced by $15 million, $14 million, and $14 million, respectively, attributable to this noncontrolling interest. The net income allocable to the noncontrolling interest holder is based on ownership interest with the exception of certain agreed upon adjustments. Distributions of net income attributable to this noncontrolling interest are due within 30 days following the end of a quarter, but may be withheld as necessary by Black Hills Electric Generation.
Black Hills Colorado IPP has been determined to be a VIE in which the Company has a variable interest. Black Hills Electric Generation has been determined to be the primary beneficiary of the VIE as Black Hills Electric Generation is the operator and manager of the generation facility and, as such, has the power to direct the activities that most significantly impact Black Hills Colorado IPP’s economic performance. Black Hills Electric Generation, as the primary beneficiary, continues to consolidate Black Hills Colorado IPP. Black Hills Colorado IPP has not received financial or other support from the Company outside of pre-existing contractual arrangements during the reporting period. Black Hills Colorado IPP does not have any debt and its cash flows from operations are sufficient to support its ongoing operations.
We have recorded the following assets and liabilities on our consolidated balance sheets related to the VIE described above as of December 31 (in thousands):
| | | | | | | | | | | |
| |
| 2020 | | 2019 |
| Assets: | | | |
| Current assets | $ | 13,604 | | | $ | 13,350 | |
| Property, plant and equipment of variable interest entities, net | $ | 190,637 | | | $ | 193,046 | |
| | | |
| Liabilities: | | | |
| Current liabilities | $ | 5,318 | | | $ | 6,013 | |
(15) EMPLOYEE BENEFIT PLANS
Defined Contribution Plans
We sponsor a 401(k) retirement savings plan (the 401(k) Plan). Participants in the 401(k) Plan may elect to invest a portion of their eligible compensation in the 401(k) Plan up to the maximum amounts established by the IRS. The 401(k) Plan provides employees the opportunity to invest up to 50% of their eligible compensation on a pre-tax or after-tax basis.
The 401(k) Plan provides a Company matching contribution for all eligible participants. Certain eligible participants who are not currently accruing a benefit in the Pension Plan also receive a Company retirement contribution based on the participant’s age and years of service. Vesting of all Company and matching contributions occurs at 20% per year with 100% vesting when the participant has 5 years of service with the Company.
Defined Benefit Pension Plan
We have one1 defined benefit pension plan, the Black Hills Retirement Plan (Pension Plan). The Pension Plan covers certain eligible employees of the Company. The benefits for the Pension Plan are based on years of service and calculations of average earnings during a specific time period prior to retirement. The Pension Plan is closed to new employees and frozen for certain employees who did not meet age and service based criteria.
The Pension Plan assets are held in a Master Trust. Our Board of Directors has approved the Pension Plan’s investment policy. The objective of the investment policy is to manage assets in such a way that will allow the eventual settlement of our obligations to the Pension Plan’s beneficiaries. To meet this objective, our pension assets are managed by an outside adviser using a portfolio strategy that will provide liquidity to meet the Pension Plan’s benefit payment obligations. The Pension Plan’s assets consist primarily of equity, fixed income and hedged investments.
The expected rate of return on the Pension Plan assets is determined by reviewing the historical and expected returns of both equity and fixed income markets, taking into account asset allocation, the correlation between asset class returns, and the mix of active and passive investments. The Pension Plan utilizes a dynamic asset allocation where the target range to return-seeking and liability-hedging assets is determined based on the funded status of the Plan. As of December 31, 2019,2020, the expected rate of return on pension plan assets was based on the targeted asset allocation range of 29%28% to 37%36% return-seeking assets and 63%64% to 71%72% liability-hedging assets.
Our Pension Plan is funded in compliance with the federal government’s funding requirements.
Plan Assets
The percentages of total plan asset by investment category for our Pension Plan at December 31 were as follows:
| | | | | | | | |
| 2020 | 2019 |
| Equity | 21% | 20% |
| Real estate | 3 | 3 |
| Fixed income | 69 | 71 |
| Cash | 3 | 1 |
| Hedge funds | 4 | 5 |
| Total | 100% | 100% |
|
| | |
| | 2019 | 2018 |
| Equity | 20% | 17% |
| Real estate | 3 | 4 |
| Fixed income | 71 | 71 |
| Cash | 1 | 3 |
| Hedge funds | 5 | 5 |
| Total | 100% | 100% |
Supplemental Non-qualified Defined Benefit Plans
We have various supplemental retirement plans for key executives of the Company. The plans are non-qualified defined benefit and defined contribution plans (Supplemental Plans). The Supplemental Plans are subject to various vesting schedules and are funded on a cash basis as benefits are paid.
Non-pension Defined Benefit Postretirement Healthcare Plan
BHC sponsors a retiree healthcare plan (Healthcare Plan) for employees who meet certain age and service requirements at retirement. Healthcare Plan benefits are subject to premiums, deductibles, co-payment provisions and other limitations. A portion of the Healthcare Plan for participating business units are pre-funded via VEBA trusts. Pre-65 retirees as well as a grandfathered group of post-65 retirees receive their retiree medical benefits through the Black Hills self-insured retiree medical plans. Healthcare coverage for post-65 Medicare-eligible retirees is provided through an individual market healthcare exchange.
Plan Assets
We fund the Healthcare Plan on a cash basis as benefits are paid. The Black Hills Corporation Retiree MedicalHealthcare Plan provides for partial pre-funding via VEBA trusts. Assets related to this pre-funding are held in trust and are for the benefit of the union and non-union employees located in the states of Arkansas, Iowa and Kansas. We do not pre-fund the Healthcare Plan for those employees outside Arkansas, Iowa and Kansas.
Plan Contributions
Contributions to the Pension Plan are cash contributions made directly to the Master Trust. Healthcare and Supplemental Plan contributions are made in the form of benefit payments. Healthcare benefits include company and participant paid premiums. Contributions for the years ended December 31 were as follows (in thousands):
| | | | | | | | |
| 2020 | 2019 |
| Defined Contribution Plan | | |
| Company retirement contributions | $ | 10,455 | | $ | 9,714 | |
| Company matching contributions | $ | 15,240 | | $ | 14,558 | |
|
| | | | | | |
| | 2019 | 2018 |
| Defined Contribution Plan | | |
| Company retirement contributions | $ | 9,714 |
| $ | 8,766 |
|
| Company matching contributions | $ | 14,558 |
| $ | 13,559 |
|
| | | | | | | | |
| 2020 | 2019 |
| Defined Benefit Plans | | |
| Defined Benefit Pension Plan | $ | 12,700 | | $ | 12,700 | |
| Non-Pension Defined Benefit Postretirement Healthcare Plan | $ | 6,058 | | $ | 7,033 | |
| Supplemental Non-Qualified Defined Benefit Plans | $ | 2,674 | | $ | 2,344 | |
|
| | | | | | |
| | 2019 | 2018 |
| Defined Benefit Plans | | |
| Defined Benefit Pension Plan | $ | 12,700 |
| $ | 12,700 |
|
| Non-Pension Defined Benefit Postretirement Healthcare Plan | $ | 7,033 |
| $ | 5,298 |
|
| Supplemental Non-Qualified Defined Benefit Plans | $ | 2,344 |
| $ | 2,073 |
|
While weWe do not have required 2021 contributions weand currently do not expect to make approximately $13 million in contributionscontribute to our Pension Plan in 2020.Plan.
Fair Value Measurements
Assets and liabilities are classified in their entirety based on the lowest level of input that is significant to the fair value measurement. The Company’s assessment of the significance of a particular input to the fair value measurement requires judgment and may affect their placement within the fair value hierarchy levels.
The following tables set forth, by level within the fair value hierarchy, the assets that were accounted for at fair value on a recurring basis (in thousands):
| | | | | | | | | | | | | | | | | | | | | | | | | | | | | | | | | | | |
| Pension Plan | December 31, 2020 |
| Level 1 | | Level 2 | | Level 3 | | Total Investments Measured at Fair Value | | NAV (a) | | Total Investments |
| | | | | | | | | | | |
| Common Collective Trust - Cash and Cash Equivalents | $ | 0 | | | $ | 16,810 | | | $ | 0 | | | $ | 16,810 | | | $ | 0 | | | $ | 16,810 | |
| Common Collective Trust - Equity | 0 | | | 100,311 | | | 0 | | | 100,311 | | | 0 | | | 100,311 | |
| Common Collective Trust - Fixed Income | 0 | | | 324,845 | | | 0 | | | 324,845 | | | 0 | | | 324,845 | |
| Common Collective Trust - Real Estate | 0 | | | 0 | | | 0 | | | 0 | | | 14,301 | | | 14,301 | |
| Hedge Funds | 0 | | | 0 | | | 0 | | | 0 | | | 17,454 | | | 17,454 | |
| Total investments measured at fair value | $ | 0 | | | $ | 441,966 | | | $ | 0 | | | $ | 441,966 | | | $ | 31,755 | | | $ | 473,721 | |
|
| | | | | | | | | | | | | | | | | | | | | | | |
| Pension Plan | December 31, 2019 |
| | Level 1 | | Level 2 | | Level 3 | | Total Investments Measured at Fair Value | | NAV (a) | | Total Investments |
| AXA Equitable General Fixed Income | $ | — |
| | $ | 60 |
| | $ | — |
| | $ | 60 |
| | $ | — |
| | $ | 60 |
|
| Common Collective Trust - Cash and Cash Equivalents | — |
| | 7,054 |
| | — |
| | 7,054 |
| | — |
| | 7,054 |
|
| Common Collective Trust - Equity | — |
| | 87,106 |
| | — |
| | 87,106 |
| | — |
| | 87,106 |
|
| Common Collective Trust - Fixed Income | — |
| | 306,275 |
| | — |
| | 306,275 |
| | — |
| | 306,275 |
|
| Common Collective Trust - Real Estate | — |
| | — |
| | — |
| | — |
| | 14,239 |
| | 14,239 |
|
| Hedge Funds | — |
| | — |
| | — |
| | — |
| | 19,550 |
| | 19,550 |
|
| Total investments measured at fair value | $ | — |
| | $ | 400,495 |
| | $ | — |
| | $ | 400,495 |
| | $ | 33,789 |
| | $ | 434,284 |
|
|
| | | | | | | | | | | | | | | | | | | | | | | |
| Pension Plan | December 31, 2018 |
| | Level 1 | | Level 2 | | Level 3 | | Total Investments Measured at Fair Value | | NAV (a) | | Total Investments |
| AXA Equitable General Fixed Income | $ | — |
| | $ | 1,867 |
| | $ | — |
| | $ | 1,867 |
| | $ | — |
| | $ | 1,867 |
|
| Common Collective Trust - Cash and Cash Equivalents | — |
| | 9,923 |
| | — |
| | 9,923 |
| | — |
| | 9,923 |
|
| Common Collective Trust - Equity | — |
| | 67,457 |
| | — |
| | 67,457 |
| | — |
| | 67,457 |
|
| Common Collective Trust - Fixed Income | — |
| | 279,148 |
| | — |
| | 279,148 |
| | — |
| | 279,148 |
|
| Common Collective Trust - Real Estate | — |
| | 67 |
| | — |
| | 67 |
| | 13,551 |
| | 13,618 |
|
| Hedge Funds | — |
| | — |
| | — |
| | — |
| | 18,783 |
| | 18,783 |
|
| Total investments measured at fair value | $ | — |
| | $ | 358,462 |
| | $ | — |
| | $ | 358,462 |
| | $ | 32,334 |
| | $ | 390,796 |
|
_____________
| |
(a) | Certain investments that are measured at fair value using NAV per share (or its equivalent) for practical expedient have not been classified in the fair value hierarchy. The fair value amounts presented in these tables for these investments are intended to permit reconciliation of the fair value hierarchy to the amounts presented in the reconciliation of changes in the plan’s benefit obligations and fair value of plan assets above. |
|
| | | | | | | | | | | | | | | | | | | |
| Non-pension Defined Benefit Postretirement Healthcare Plan | December 31, 2019 |
| | Level 1 | | Level 2 | | Level 3 | | Total Investments Measured at Fair Value | | Total Investments |
| Cash and Cash Equivalents | $ | 8,305 |
| | $ | — |
| | $ | — |
| | $ | 8,305 |
| | $ | 8,305 |
|
| Total investments measured at fair value | $ | 8,305 |
| | $ | — |
| | $ | — |
| | $ | 8,305 |
| | $ | 8,305 |
|
| | | | | | | | | | | | | | | | | | | | | | | | | | | | | | | | | | | |
| Pension Plan | December 31, 2019 |
| Level 1 | | Level 2 | | Level 3 | | Total Investments Measured at Fair Value | | NAV (a) | | Total Investments |
| AXA Equitable General Fixed Income | $ | 0 | | | $ | 60 | | | $ | 0 | | | $ | 60 | | | $ | 0 | | | $ | 60 | |
| Common Collective Trust - Cash and Cash Equivalents | 0 | | | 7,054 | | | 0 | | | 7,054 | | | 0 | | | 7,054 | |
| Common Collective Trust - Equity | 0 | | | 87,106 | | | 0 | | | 87,106 | | | 0 | | | 87,106 | |
| Common Collective Trust - Fixed Income | 0 | | | 306,275 | | | 0 | | | 306,275 | | | 0 | | | 306,275 | |
| Common Collective Trust - Real Estate | 0 | | | 0 | | | 0 | | | 0 | | | 14,239 | | | 14,239 | |
| Hedge Funds | 0 | | | 0 | | | 0 | | | 0 | | | 19,550 | | | 19,550 | |
| Total investments measured at fair value | $ | 0 | | | $ | 400,495 | | | $ | 0 | | | $ | 400,495 | | | $ | 33,789 | | | $ | 434,284 | |
(a) Certain investments that are measured at fair value using NAV per share (or its equivalent) for practical expedient have not been classified in the fair value hierarchy. The fair value amounts presented in these tables for these investments are intended to permit reconciliation of the fair value hierarchy to the amounts presented in the reconciliation of changes in the plan’s benefit obligations and fair value of plan assets above.
|
| | | | | | | | | | | | | | | | | | | |
| Non-pension Defined Benefit Postretirement Healthcare Plan | December 31, 2018 |
| | Level 1 | | Level 2 | | Level 3 | | Total Investments Measured at Fair Value | | Total Investments |
| Cash and Cash Equivalents | $ | 4,873 |
| | $ | — |
| | $ | — |
| | $ | 4,873 |
| | $ | 4,873 |
|
| Equity Securities | 1,005 |
| | — |
| | — |
| | 1,005 |
| | 1,005 |
|
| Intermediate-term Bond | — |
| | 2,284 |
| | — |
| | 2,284 |
| | 2,284 |
|
| Total investments measured at fair value | $ | 5,878 |
| | $ | 2,284 |
| | $ | — |
| | $ | 8,162 |
| | $ | 8,162 |
|
| | | | | | | | | | | | | | | | | | | | | | | | | | | | | | | |
| Non-pension Defined Benefit Postretirement Healthcare Plan | December 31, 2020 |
| Level 1 | | Level 2 | | Level 3 | | Total Investments Measured at Fair Value | | | | Total Investments |
| Cash and Cash Equivalents | $ | 8,165 | | | $ | 0 | | | $ | 0 | | | $ | 8,165 | | | | | $ | 8,165 | |
| | | | | | | | | | | |
| | | | | | | | | | | |
| | | | | | | | | | | |
| | | | | | | | | | | |
| Total investments measured at fair value | $ | 8,165 | | | $ | 0 | | | $ | 0 | | | $ | 8,165 | | | | | $ | 8,165 | |
| | | | | | | | | | | | | | | | | | | | | | | | | | | | | | | |
| Non-pension Defined Benefit Postretirement Healthcare Plan | December 31, 2019 |
| Level 1 | | Level 2 | | Level 3 | | Total Investments Measured at Fair Value | | | | Total Investments |
| Cash and Cash Equivalents | $ | 8,305 | | | $ | 0 | | | $ | 0 | | | $ | 8,305 | | | | | $ | 8,305 | |
| | | | | | | | | | | |
| | | | | | | | | | | |
| | | | | | | | | | | |
| | | | | | | | | | | |
| Total investments measured at fair value | $ | 8,305 | | | $ | 0 | | | $ | 0 | | | $ | 8,305 | | | | | $ | 8,305 | |
Additional information about assets of the benefit plans, including methods and assumptions used to estimate the fair value of these assets, is as follows:
Pension Plan
AXA Equitable General Fixed Income Fund
: This fund is a diversified portfolio, primarily composed of fixed income instruments. Assets are invested in long-term holdings, such as commercial, agricultural and residential mortgages, publicly traded and privately placed bonds and real estate as well as short-term bonds. Fair values of mortgage loans are measured by discounting future contractual cash flows to be received on the mortgage loans using interest rates of loans with similar characteristics. The discount rate is derived from taking the appropriate U.S. Treasury rate with a like term. The fair value of public fixed maturity securities are generally based on prices obtained from independent valuation service providers with reasonableness prices compared with directly observable market trades. The fair value of privately placed securities are determined using a discounted cash flow model. These models use observable inputs with a discount rate based upon the average of spread surveys collected from private market intermediaries and industry sector of the issuer. The Plan’s investments in the AXA Equitable General Fixed Income Fund are categorized as Level 2.
Common Collective Trust Funds: These funds are valued based upon the redemption price of units held by the Plan, which is based on the current fair value of the common collective trust funds’ underlying assets. Unit values are determined by the financial institution sponsoring such funds by dividing the fund’s net assets at fair value by its units outstanding at the valuation dates. The Plan’s investments in common collective trust funds, with the exception of shares of the common collective trust-real estate are categorized as Level 2.
Common Collective Trust-Real Estate FundFunds: This fund isThese funds are valued based on various factors of the underlying real estate properties, including market rent, market rent growth, occupancy levels, etc. As part of the trustee’s valuation process, properties are externally appraised generally on an annual basis. The appraisals are conducted by reputable independent appraisal firms and signed by appraisers that are members of the Appraisal Institute, with professional designation of Member, Appraisal Institute. All external appraisals are performed in accordance with the Uniform Standards of Professional Appraisal Practices. We receive monthly statements from the trustee, along with the annual schedule of investments and rely on these reports for pricing the units of the fund. Some of the funds without participant withdrawal limitations are categorized as Level 2.
The following investments are measured at NAV and are not classified in the fair value hierarchy, in accordance with accounting guidance:
Common Collective Trust-Real Estate Fund: This is the same fund as above except that certain of the funds’ assets contain participant withdrawal policies with restrictions on redemption and are therefore not included in the fair value hierarchy.
Hedge Funds: These funds represent investments in other investment funds that seek a return utilizing a number of diverse investment strategies. The strategies, when combined, aim to reduce volatility and risk while attempting to deliver positive returns under all market conditions. Amounts are reported on a one-month lag. The fair value of hedge funds is determined using net asset value per share based on the fair value of the hedge fund’s underlying investments. 20%10% of the shares may be redeemed at the end of each month with a 10-day15-day notice and full redemptions are available at the end of each quarter with 30-day60-day notice and is limited to a percentage of the total net assets value of the fund. The net asset values are based on the fair value of each fund’s underlying investments. There are no unfunded commitments related to these hedge funds.
Non-pension Defined Benefit Postretirement Healthcare Plan
Cash and Cash Equivalents: This represents an investment in Invesco Treasury Portfolio, which is a short-term investment trust, as well as an investment in Northern Institutional Government Assets Portfolio, which is a government money market fund. As shares held reflect quoted prices in an active market, they are categorized as Level 1.
Equity Securities: These represent investments in a combination of equity positions for mainly large cap core allocation and Exchange Trade Funds (ETFs) for diversification into the other sectors of the economy. ETFs are a basket of securities traded like individual stocks on the exchange. Value of equity securities held at year end are based on published market quotations of active markets. The ETF funds can be redeemed on a daily basis at their market price and have no redemption restrictions. As shares held reflect quoted prices in an active market, they are categorized as Level 1.
Intermediate-term Bond: This is comprised of a diversified pool of high quality, individual municipal bonds. Pricing is evaluated using multi-dimensional relational models, as well as a series of matrices using Standard Inputs, including Municipal Securities Rule Making Board (MSRB) reported trades and material event notices, plus Municipal Market Data (MMD) benchmark yields and new issue data. As the models use observable inputs and standard data, the investments are categorized as Level 2.
Other Plan Information
The following tables provide a reconciliation of the employee benefit plan obligations and fair value of employee benefit plan assets, and amounts recognized in the Consolidated Balance Sheets, accumulated benefit obligation, and reconciliation of components of the net periodic expense and elements of AOCI:AOCI (in thousands):
Benefit Obligations
|
| | | | | | | | | | | | | | | | | | | | |
| | Defined Benefit Pension Plan | | Supplemental Non-qualified Defined Benefit Plans | | Non-pension Defined Benefit Postretirement Healthcare Plan |
| As of December 31 (in thousands), | 2019 | 2018 | | 2019 | 2018 | | 2019 | 2018 |
| Change in benefit obligation: | | | | | | | | |
| Projected benefit obligation at beginning of year | $ | 445,381 |
| $ | 474,725 |
| | $ | 43,010 |
| $ | 45,112 |
| | $ | 60,817 |
| $ | 69,339 |
|
| Service cost | 5,383 |
| 6,834 |
| | 4,995 |
| 1,764 |
| | 1,815 |
| 2,291 |
|
| Interest cost | 17,374 |
| 15,470 |
| | 1,295 |
| 1,170 |
| | 2,247 |
| 2,085 |
|
| Actuarial (gain) loss | 56,384 |
| (31,340 | ) | | 7,132 |
| (2,963 | ) | | 5,976 |
| (9,045 | ) |
| Benefits paid | (39,146 | ) | (20,308 | ) | | (2,344 | ) | (2,073 | ) | | (7,033 | ) | (5,298 | ) |
| Plan participants’ contributions | — |
| — |
| | — |
| — |
| | 1,455 |
| 1,445 |
|
| Projected benefit obligation at end of year | $ | 485,376 |
| $ | 445,381 |
| | $ | 54,088 |
| $ | 43,010 |
| | $ | 65,277 |
| $ | 60,817 |
|
| | | | | | | | | | | | | | | | | | | | | | | | | | |
| Defined Benefit Pension Plan | | Supplemental Non-qualified Defined
Benefit Plans | | Non-pension Defined Benefit Postretirement Healthcare Plan |
| As of December 31, | 2020 | 2019 | | 2020 | 2019 | | 2020 | 2019 |
| Change in benefit obligation: | | | | | | | | |
| Projected benefit obligation at beginning of year | $ | 485,376 | | $ | 445,381 | | | $ | 54,088 | | $ | 43,010 | | | $ | 65,277 | | $ | 60,817 | |
| | | | | | | | |
Service cost (a) | 5,411 | | 5,383 | | | 1,579 | | 4,995 | | | 2,056 | | 1,815 | |
| Interest cost | 13,426 | | 17,374 | | | 1,099 | | 1,295 | | | 1,649 | | 2,247 | |
| Actuarial (gain) loss | 47,064 | | 56,384 | | | 962 | | 7,132 | | | 5,804 | | 5,976 | |
| | | | | | | | |
| Benefits paid | (37,269) | | (39,146) | | | (2,674) | | (2,344) | | | (6,058) | | (7,033) | |
| | | | | | | | |
| Plan participants’ contributions | 0 | | 0 | | | 0 | | 0 | | | 1,510 | | 1,455 | |
| Projected benefit obligation at end of year | $ | 514,008 | | $ | 485,376 | | | $ | 55,054 | | $ | 54,088 | | | $ | 70,238 | | $ | 65,277 | |
____________________
(a) For the year ended December 31, 2020, Service Cost for the Supplemental Non-qualified Defined Benefit Plans includes a $1.4 million correction of a prior year overstatement of Projected benefit obligation. Due to the immaterial nature of this correction, the prior year information was not revised.
Fair Value Employee Benefit Plan Assets
| | | | | | | | | | | | | | | | Defined Benefit
Pension Plan | | Supplemental Non-qualified Defined
Benefit Plans | | Non-pension Defined Benefit Postretirement Healthcare Plan (a) |
| | Defined Benefit Pension Plan | | Supplemental Non-qualified Defined Benefit Plans | | Non-pension Defined Benefit Postretirement Healthcare Plan (a) | |
| As of December 31 (in thousands), | 2019 | 2018 | | 2019 | 2018 | | 2019 | 2018 | |
| As of December 31, | | As of December 31, | 2020 | 2019 | | 2020 | 2019 | | 2020 | 2019 |
| Change in fair value of plan assets: | | | | | | Change in fair value of plan assets: | |
| Beginning fair value of plan assets | $ | 390,796 |
| $ | 416,343 |
| | $ | — |
| $ | — |
| | $ | 8,162 |
| $ | 8,621 |
| Beginning fair value of plan assets | $ | 434,284 | | $ | 390,796 | | | $ | 0 | | $ | 0 | | | $ | 8,305 | | $ | 8,162 | |
| | Investment income (loss) | 69,934 |
| (17,939 | ) | | — |
| — |
| | 260 |
| (149 | ) | Investment income (loss) | 64,006 | | 69,934 | | | 0 | | 0 | | | 33 | | 260 | |
| Employer contributions | 12,700 |
| 12,700 |
| | 2,344 |
| 2,073 |
| | 5,461 |
| 3,543 |
| Employer contributions | 12,700 | | 12,700 | | | 2,674 | | 2,344 | | | 4,374 | | 5,461 | |
| Retiree contributions | — |
| — |
| | — |
| — |
| | 1,455 |
| 1,445 |
| Retiree contributions | 0 | | 0 | | | 0 | | 0 | | | 1,511 | | 1,455 | |
| Benefits paid | (39,146 | ) | (20,308 | ) | | (2,344 | ) | (2,073 | ) | | (7,033 | ) | (5,298 | ) | Benefits paid | (37,269) | | (39,146) | | | (2,674) | | (2,344) | | | (6,058) | | (7,033) | |
| | Ending fair value of plan assets | $ | 434,284 |
| $ | 390,796 |
| | $ | — |
| $ | — |
| | $ | 8,305 |
| $ | 8,162 |
| Ending fair value of plan assets | $ | 473,721 | | $ | 434,284 | | | $ | 0 | | $ | 0 | | | $ | 8,165 | | $ | 8,305 | |
____________________
| |
(a) | (a) Assets of VEBA trusts. |
In 2012, we froze our Pension Plan and closed it to new participants. Since then, we have implemented various de-risking strategies including lump sum buyouts, the planspurchase of annuities and the amounts recognizedreduction of return-seeking assets over time to a more liability-hedged portfolio. As a result, recent capital markets volatility driven by the COVID-19 pandemic did not materially affect our unfunded status.
Amounts Recognized in the Consolidated Balance Sheets at December 31 consist of (in thousands):
| | | | | | | | | | | | | | | | | | | | | | | | | | |
| Defined Benefit
Pension Plan | | Supplemental
Non-qualified Defined Benefit Plans | Non-pension Defined Benefit Postretirement Healthcare Plan |
| As of December 31, | 2020 | 2019 | | 2020 | 2019 | | 2020 | 2019 |
| Regulatory assets | $ | 86,677 | | $ | 88,471 | | | $ | 0 | | $ | 0 | | | $ | 16,102 | | $ | 11,670 | |
| Current liabilities | $ | 0 | | $ | 0 | | | $ | 1,927 | | $ | 1,420 | | | $ | 4,931 | | $ | 4,802 | |
| Non-current liabilities | $ | 40,287 | | $ | 51,093 | | | $ | 53,127 | | $ | 51,243 | | | $ | 57,142 | | $ | 52,136 | |
| Regulatory liabilities | $ | 3,607 | | $ | 3,524 | | | $ | 0 | | $ | 0 | | | $ | 2,140 | | $ | 4,088 | |
|
| | | | | | | | | | | | | | | | | | | | |
| | Defined Benefit Pension Plan | | Supplemental Non-qualified Defined Benefit Plans | Non-pension Defined Benefit Postretirement Healthcare Plan |
| | 2019 | 2018 | | 2019 | 2018 | | 2019 | 2018 |
| Regulatory assets | $ | 88,471 |
| $ | 82,919 |
| | $ | — |
| $ | — |
| | $ | 11,670 |
| $ | 6,655 |
|
| Current liabilities | $ | — |
| $ | — |
| | $ | 1,420 |
| $ | 1,463 |
| | $ | 4,802 |
| $ | 3,885 |
|
| Non-current assets | $ | — |
| $ | — |
| | $ | — |
| $ | — |
| | $ | — |
| $ | 249 |
|
| Non-current liabilities | $ | 51,093 |
| $ | 54,585 |
| | $ | 51,243 |
| $ | 41,547 |
| | $ | 52,136 |
| $ | 49,015 |
|
| Regulatory liabilities | $ | 3,524 |
| $ | 4,620 |
| | $ | — |
| $ | — |
| | $ | 4,088 |
| $ | 5,207 |
|
Accumulated Benefit Obligation
| | | | | | | | | | | | | | | | | | | | | | | | | | |
| Defined Benefit
Pension Plan | | Supplemental
Non-qualified Defined Benefit Plans | Non-pension Defined Benefit Postretirement Healthcare Plan |
| As of December 31, | 2020 | 2019 | | 2020 | 2019 | | 2020 | 2019 |
| Accumulated Benefit Obligation | $ | 498,815 | | $ | 470,615 | | | $ | 54,779 | | $ | 49,241 | | | $ | 70,238 | | $ | 65,277 | |
|
| | | | | | | | | | | | | | | | | | | | |
| | Defined Benefit Pension Plan | | Supplemental Non-qualified Defined Benefit Plans | Non-pension Defined Benefit Postretirement Healthcare Plan |
| As of December 31 (in thousands) | 2019 | 2018 | | 2019 | 2018 | | 2019 | 2018 |
| Accumulated Benefit Obligation | $ | 470,615 |
| $ | 428,851 |
| | $ | 49,241 |
| $ | 40,530 |
| | $ | 65,277 |
| $ | 60,817 |
|
Components of Net Periodic Expense
| | | | | | | | | | | | | | | | | | | | | | | | | | | | | | | | | | | |
| Defined Benefit
Pension Plan | | Supplemental
Non-qualified Defined Benefit Plans | | Non-pension Defined Benefit Postretirement Healthcare Plan |
| For the years ended December 31, | 2020 | 2019 | 2018 | | 2020 | 2019 | 2018 | | 2020 | 2019 | 2018 |
Service cost (a) | $ | 5,411 | | $ | 5,383 | | $ | 6,834 | | | $ | 1,579 | | $ | 4,995 | | $ | 1,764 | | | $ | 2,056 | | $ | 1,815 | | $ | 2,291 | |
| Interest cost | 13,426 | | 17,374 | | 15,470 | | | 1,099 | | 1,295 | | 1,170 | | | 1,649 | | 2,247 | | 2,085 | |
| Expected return on assets | (22,591) | | (24,401) | | (24,741) | | | 0 | | 0 | | 0 | | | (182) | | (230) | | (315) | |
| Net amortization of prior service cost | 0 | | 26 | | 58 | | | 2 | | 2 | | 2 | | | (546) | | (398) | | (398) | |
| Recognized net actuarial loss (gain) | 8,372 | | 3,763 | | 8,632 | | | 1,702 | | 535 | | 1,000 | | | 20 | | 0 | | 216 | |
| | | | | | | | | | | |
| Net periodic expense | $ | 4,618 | | $ | 2,145 | | $ | 6,253 | | | $ | 4,382 | | $ | 6,827 | | $ | 3,936 | | | $ | 2,997 | | $ | 3,434 | | $ | 3,879 | |
Net periodic expense consisted of the following for____________________
(a) For the year ended December 31, (in thousands):2020, Service Cost for the Supplemental Non-qualified Defined Benefit Plans includes a $1.4 million correction of a prior year overstatement of Projected benefit obligation. Due to the immaterial nature of this correction, the prior year information was not revised.
|
| | | | | | | | | | | | | | | | | | | | | | | | | | | | | |
| | Defined Benefit Pension Plan | | Supplemental Non-qualified Defined Benefit Plans | | Non-pension Defined Benefit Postretirement Healthcare Plan |
| | 2019 | 2018 | 2017 | | 2019 | 2018 | 2017 | | 2019 | 2018 | 2017 |
| Service cost | $ | 5,383 |
| $ | 6,834 |
| $ | 7,034 |
| | $ | 4,995 |
| $ | 1,764 |
| $ | 1,546 |
| | $ | 1,815 |
| $ | 2,291 |
| $ | 2,300 |
|
| Interest cost | 17,374 |
| 15,470 |
| 15,520 |
| | 1,295 |
| 1,170 |
| 1,276 |
| | 2,247 |
| 2,085 |
| 2,141 |
|
| Expected return on assets | (24,401 | ) | (24,741 | ) | (24,517 | ) | | — |
| — |
| — |
| | (230 | ) | (315 | ) | (315 | ) |
| Net amortization of prior service cost | 26 |
| 58 |
| 58 |
| | 2 |
| 2 |
| 2 |
| | (398 | ) | (398 | ) | (411 | ) |
| Recognized net actuarial loss (gain) | 3,763 |
| 8,632 |
| 4,007 |
| | 535 |
| 1,000 |
| 1,001 |
| | — |
| 216 |
| 499 |
|
| Net periodic expense | $ | 2,145 |
| $ | 6,253 |
| $ | 2,102 |
| | $ | 6,827 |
| $ | 3,936 |
| $ | 3,825 |
| | $ | 3,434 |
| $ | 3,879 |
| $ | 4,214 |
|
For the years ended December 31, 2020, 2019 and 2018, serviceService costs were recorded in Operations and maintenance expense while non-servicenon service costs were recorded in Other expense on the Consolidated Statements of Income. For
Change in Accounting Principle - Pension Accounting Asset Method
Effective January 1, 2020, the year ended December 31, 2017,Company changed its method of accounting for net periodic benefit cost. Prior to the change, the Company used a calculated value for determining market-related value of plan assets which amortized the effects of gains and losses over a five-year period. Effective with the accounting change, the Company used a calculated value for the return-seeking assets (equities) in the portfolio and fair value for the liability-hedging assets (fixed income). The Company considers the fair value method for determining market-related value of liability-hedging assets to be a preferable method of accounting because asset-related gains and losses are subject to amortization into pension cost immediately. Additionally, the fair value for liability-hedging assets allows for the impact of gains and losses on this portion of the asset portfolio to be reflected in tandem with changes in the liability which is linked to changes in the discount rate assumption for re-measurement.
We evaluated the effect of this change in accounting method and deemed it immaterial to the historical and current financial statements and therefore did not account for the change retrospectively. Accordingly, the Company calculated the cumulative difference using a calculated value versus fair value to determine market-related value for liability-hedging assets of the portfolio. The cumulative effect of this change, as of January 1, 2020, resulted in a decrease to prior service costs, and non-service costs wereas recorded in OperationsOther income (expense), net, of $0.6 million, an increase in Income tax expense of $0.2 million and maintenance expense. Because non-service costs were not considered materialan increase to Net income of $0.4 million within the accompanying Consolidated Statements of Income for the year ended December 31, 2017, they were not reclassified on2020.
AOCI Amounts (After-Tax)
| | | | | | | | | | | | | | | | | | | | | | | | | | |
| Defined Benefit
Pension Plan | | Supplemental
Non-qualified Defined Benefit Plans | Non-pension Defined Benefit Postretirement Healthcare Plan |
| As of December 31, | 2020 | 2019 | | 2020 | 2019 | | 2020 | 2019 |
| Net (gain) loss | $ | 5,511 | | $ | 5,322 | | | $ | 9,323 | | $ | 9,893 | | | $ | 100 | | $ | 90 | |
| Prior service cost (gain) | 0 | | 0 | | | 0 | | 2 | | | (144) | | (230) | |
| Total amounts included in AOCI, after-tax not yet recognized as components of net periodic expense | $ | 5,511 | | $ | 5,322 | | | $ | 9,323 | | $ | 9,895 | | | $ | (44) | | $ | (140) | |
Assumptions
| | | | | | | | | | | | | | | | | | | | | | | | | | | | | | | | | | | |
| Defined Benefit
Pension Plan | | Supplemental
Non-qualified Defined Benefit Plans | | Non-pension Defined Benefit Postretirement Healthcare Plan |
| Weighted-average assumptions used to determine benefit obligations: | 2020 | 2019 | 2018 | | 2020 | 2019 | 2018 | | 2020 | 2019 | 2018 |
| Discount rate | 2.56 | % | 3.27 | % | 4.40 | % | | 2.41 | % | 3.14 | % | 4.34 | % | | 2.41 | % | 3.15 | % | 4.28 | % |
| Rate of increase in compensation levels | 3.34 | % | 3.49 | % | 3.52 | % | | 5.00 | % | 5.00 | % | 5.00 | % | | N/A | N/A | N/A |
| | | | | | | | | | | | | | | | | | | | | | | | | | | | | | | | | | | |
| Defined Benefit
Pension Plan | | Supplemental
Non-qualified Defined Benefit Plans | | Non-pension Defined Benefit Postretirement Healthcare Plan |
| Weighted-average assumptions used to determine net periodic benefit cost for plan year: | 2020 | 2019 | 2018 | | 2020 | 2019 | 2018 | | 2020 | 2019 | 2018 |
Discount rate (a) | 3.27 | % | 4.40 | % | 3.71 | % | | 3.14 | % | 4.34 | % | 3.67 | % | | 3.15 | % | 4.28 | % | 3.60 | % |
| | | | | | | | | | | |
Expected long-term rate of return on assets (b) | 5.25 | % | 6.00 | % | 6.25 | % | | N/A | N/A | N/A | | 2.35 | % | 3.00 | % | 3.93 | % |
| Rate of increase in compensation levels | 3.49 | % | 3.52 | % | 3.43 | % | | 5.00 | % | 5.00 | % | 5.00 | % | | N/A | N/A | N/A |
_____________________________
(a) The estimated discount rate for the Consolidated StatementsDefined Benefit Pension Plan is 2.56% for the calculation of Income.
AOCI
For defined benefit plans, amounts included in AOCI, after-tax, that have not yet been recognized as components ofthe 2021 net periodic benefit cost at December 31 were as follows (in thousands):pension costs.
(b) The expected rate of return on plan assets is 4.50% for the calculation of the 2021 net periodic pension cost.
|
| | | | | | | | | | | | | | | | | | | | |
| | Defined Benefit Pension Plan | | Supplemental Non-qualified Defined Benefit Plans | Non-pension Defined Benefit Postretirement Healthcare Plan |
| | 2019 | 2018 | | 2019 | 2018 | | 2019 | 2018 |
| Net (gain) loss | $ | 5,322 |
| $ | 11,967 |
| | $ | 9,893 |
| $ | 4,668 |
| | $ | 90 |
| $ | 860 |
|
| Prior service cost (gain) | — |
| 1 |
| | 2 |
| 3 |
| | (230 | ) | (317 | ) |
| Reclassification of certain tax effects from AOCI | — |
| (594 | ) | | — |
| (87 | ) | | — |
| (45 | ) |
| Reclassification to regulatory asset | — |
| (5,600 | ) | | — |
| — |
| | — |
| (919 | ) |
| Total AOCI | $ | 5,322 |
| $ | 5,774 |
| | $ | 9,895 |
| $ | 4,584 |
| | $ | (140 | ) | $ | (421 | ) |
Assumptions
|
| | | | | | | | | | | | | | | | | | | | |
| | Defined Benefit Pension Plan | | Supplemental Non-qualified Defined Benefit Plans | | Non-pension Defined Benefit Postretirement Healthcare Plan |
| Weighted-average assumptions used to determine benefit obligations: | 2019 | 2018 | 2017 | | 2019 | 2018 | 2017 | | 2019 | 2018 | 2017 |
| | | | | | | | | | | | |
| Discount rate | 3.27 | % | 4.40 | % | 3.71 | % | | 3.14 | % | 4.34 | % | 3.56 | % | | 3.15 | % | 4.28 | % | 3.60 | % |
| Rate of increase in compensation levels | 3.49 | % | 3.52 | % | 3.43 | % | | 5.00 | % | 5.00 | % | 5.00 | % | | N/A |
| N/A |
| N/A |
|
|
| | | | | | | | | | | | | | | | | | | | |
| | Defined Benefit Pension Plan | | Supplemental Non-qualified Defined Benefit Plans | | Non-pension Defined Benefit Postretirement Healthcare Plan |
| Weighted-average assumptions used to determine net periodic benefit cost for plan year: | 2019 | 2018 | 2017 | | 2019 | 2018 | 2017 | | 2019 | 2018 | 2017 |
| | | | | | | | | | | | |
Discount rate (a) | 4.40 | % | 3.71 | % | 4.27 | % | | 4.34 | % | 3.67 | % | 4.02 | % | | 4.28 | % | 3.60 | % | 4.05 | % |
Expected long-term rate of return on assets (b) | 6.00 | % | 6.25 | % | 6.75 | % | | N/A |
| N/A |
| N/A |
| | 3.00 | % | 3.93 | % | 3.88 | % |
| Rate of increase in compensation levels | 3.52 | % | 3.43 | % | 3.47 | % | | 5.00 | % | 5.00 | % | 5.00 | % | | N/A |
| N/A |
| N/A |
|
_____________________________
| |
(a) | The estimated discount rate for the Defined Benefit Pension Plan is 3.27% for the calculation of the 2020 net periodic pension costs. |
| |
(b) | The expected rate of return on plan assets is 5.25% for the calculation of the 2020 net periodic pension cost.
|
The healthcare benefit obligation was determined at December 31 was determined as follows:
| | | | | | | | |
| 2020 | 2019 |
| Trend Rate - Medical | | |
| Pre-65 for next year - All Plans | 6.10% | 6.40% |
| Pre-65 Ultimate trend rate - Black Hills Corp | 4.50% | 4.50% |
| Trend Year | 2027 | 2027 |
| | |
| Post-65 for next year - All Plans | 4.92% | 4.92% |
| Post-65 Ultimate trend rate - Black Hills Corp | 4.50% | 4.50% |
| Trend Year | 2029 | 2028 |
|
| | |
| | 2019 | 2018 |
| Trend Rate - Medical | | |
| Pre-65 for next year - All Plans | 6.40% | 6.70% |
| Pre-65 Ultimate trend rate - Black Hills Corp | 4.50% | 4.50% |
| Trend Year | 2027 | 2027 |
| | | |
| Post-65 for next year - All Plans | 4.92% | 4.94% |
| Post-65 Ultimate trend rate - Black Hills Corp | 4.50% | 4.50% |
| Trend Year | 2028 | 2026 |
The following benefit payments to employees, which reflect future service, are expected to be paid (in thousands):
| | | | | | | | | | | | | | | | | |
| Defined Benefit Pension Plan | | Supplemental Non-qualified Defined Benefit Plans | | Non-pension Defined Benefit Postretirement Healthcare Plan |
| 2021 | $ | 25,842 | | | $ | 1,927 | | | $ | 6,108 | |
| 2022 | $ | 26,658 | | | $ | 1,968 | | | $ | 5,965 | |
| 2023 | $ | 27,581 | | | $ | 2,033 | | | $ | 5,725 | |
| 2024 | $ | 28,284 | | | $ | 2,231 | | | $ | 5,532 | |
| 2025 | $ | 29,062 | | | $ | 2,690 | | | $ | 5,244 | |
| 2026-2030 | $ | 144,273 | | | $ | 13,117 | | | $ | 22,872 | |
|
| | | | | | | | | | | |
| | Defined Benefit Pension Plan | | Supplemental Non-qualified Defined Benefit Plans | | Non-pension Defined Benefit Postretirement Healthcare Plan |
| 2020 | $ | 24,586 |
| | $ | 1,420 |
| | $ | 5,919 |
|
| 2021 | $ | 25,774 |
| | $ | 1,786 |
| | $ | 5,974 |
|
| 2022 | $ | 26,728 |
| | $ | 2,167 |
| | $ | 5,790 |
|
| 2023 | $ | 27,795 |
| | $ | 2,223 |
| | $ | 5,521 |
|
| 2024 | $ | 28,547 |
| | $ | 2,412 |
| | $ | 5,329 |
|
| 2025-2029 | $ | 145,426 |
| | $ | 14,689 |
| | $ | 23,030 |
|
(16) SHARE-BASED COMPENSATION PLANS (19) COMMITMENTS AND CONTINGENCIES
Power Purchase
Compensation expense is determined using the grant date fair value estimated in accordance with the provisions of accounting standards for stock compensation and Transmission Services Agreementsis recognized over the vesting periods of the individual awards. As of December 31, 2020, total unrecognized compensation expense related to non-vested stock awards was approximately $12 million and is expected to be recognized over a weighted-average period of 2 years. Stock-based compensation expense, which is included in Operations and maintenance on the accompanying Consolidated Statements of Income, was as follows for the years ended December 31 (in thousands):
| | | | | | | | | | | |
| 2020 | 2019 | 2018 |
| Stock-based compensation expense | $ | 5,373 | | $ | 12,095 | | $ | 12,390 | |
Through
Stock Options
The Company has not issued any stock options since 2014 and has 5,000 stock options outstanding at December 31, 2020. The amount of stock options granted and related exercise activity are not material to the Company’s consolidated financial statements.
Restricted Stock
The fair value of restricted stock and restricted stock unit awards equals the market price of our stock on the date of grant.
The shares carry a restriction on the ability to sell the shares until the shares vest. The shares substantially vest over three years, contingent on continued employment. Compensation expense related to the awards is recognized over the vesting period.
A summary of the status of the restricted stock and restricted stock units at December 31, 2020, was as follows:
| | | | | | | | |
| Restricted Stock | Weighted-Average Grant Date Fair Value |
| (in thousands) | |
| Balance at January 1, 2020 | 192 | | $ | 65.66 | |
| Granted | 116 | | 69.49 | |
| Vested | (90) | | 63.30 | |
| Forfeited | (22) | | 65.30 | |
| Balance at December 31, 2020 | 196 | | $ | 69.05 | |
The weighted-average grant-date fair value of restricted stock granted and the total fair value of shares vested during the years ended December 31, were as follows:
| | | | | | | | |
| Weighted-Average Grant Date Fair Value | Total Fair Value of Shares Vested |
| | (in thousands) |
| 2020 | $ | 69.49 | | $ | 6,722 | |
| 2019 | $ | 73.66 | | $ | 8,438 | |
| 2018 | $ | 57.31 | | $ | 6,776 | |
As of December 31, 2020, there was $10.3 million of unrecognized compensation expense related to non-vested restricted stock that is expected to be recognized over a weighted-average period of 2.2 years.
Performance Share Plan
Certain officers of the Company and its subsidiaries we haveare participants in a performance share award plan, a market-based plan. Performance shares are awarded based on our total shareholder return over designated performance periods as measured against a selected peer group. In addition, certain stock price performance must be achieved for a payout to occur. The final value of the following significant long-term power purchase contracts with non-affiliated third-parties:performance shares will vary according to the number of shares of common stock that are ultimately granted based upon the actual level of attainment of the performance criteria.
The performance awards are paid 50% in cash and 50% in common stock. The cash portion accrued is classified as a liability and the stock portion is classified as equity. In the event of a change-in-control, performance awards are paid 100% in cash. If it is determined that a change-in-control is probable, the equity portion of $2.7 million at December 31, 2020 would be reclassified as a liability.
Outstanding performance periods at December 31, 2020 were as follows (shares in thousands):
| | | | | | | | | | | | | | |
| | | Possible Payout Range of Target |
| Grant Date | Performance Period | Target Grant of Shares | Minimum | Maximum |
| January 1, 2020 | January 1, 2020 - December 31, 2022 | 36 | 0% | 200% |
| January 1, 2019 | January 1, 2019 - December 31, 2021 | 36 | 0% | 200% |
| January 1, 2018 | January 1, 2018 - December 31, 2020 | 49 | 0% | 200% |
A summary of the status of the Performance Share Plan at December 31, 2020 was as follows:
| | | | | | | | | | | | | | |
| Equity Portion | Liability Portion |
| | Weighted-Average Grant Date Fair Value (a) | | Weighted-Average Fair Value at |
| Shares | Shares | December 31, 2020 |
| (in thousands) | | (in thousands) | |
| Performance Shares balance at beginning of period | 67 | | $ | 64.32 | | 67 | | |
| Granted | 19 | | 81.42 | | 19 | | |
| Forfeited | (2) | | 73.89 | | (2) | | |
| Vested | (23) | | 63.52 | | (23) | | |
| Performance Shares balance at end of period | 61 | | $ | 69.71 | | 61 | | $ | 52.42 | |
_____________________
(a) The grant date fair values for the performance shares granted in 2020, 2019 and 2018 were determined by Monte Carlo simulation using a blended volatility of 18%, 21% and 21%, respectively, comprised of 50% historical volatility and 50% implied volatility and the average risk-free interest rate of the three-year United States Treasury security rate in effect as of the grant date.
The weighted-average grant-date fair value of performance share awards granted was as follows in the years ended:
| | | | | |
• | Colorado Electric’s PPA with PRPA to purchase up to 60 MW of wind energy upon construction of a new wind project, which is expected in mid-2020. This agreement will expire Weighted Average Grant Date Fair Value
|
MayDecember 31, 20302020 | .$ | 81.42 | |
| December 31, 2019 | $ | 68.72 | |
| December 31, 2018 | $ | 61.82 | |
Colorado Electric’s PPA with PRPA to purchase 25 MW
Performance plan payouts have been as follows (in thousands):
| | | | | | | | | | | | | | |
| Performance Period | Year Paid | Stock Issued | Cash Paid | Total Intrinsic Value |
| January 1, 2017 to December 31, 2019 | 2020 | 14 | | $ | 1,100 | | $ | 2,199 | |
| January 1, 2016 to December 31, 2018 | 2019 | 44 | | $ | 2,860 | | $ | 5,720 | |
| January 1, 2015 to December 31, 2017 | 2018 | 0 | | 0 | | 0 | |
On January 27, 2021, the Compensation Committee of unit contingent energy. This agreement will expire June 30, 2024.
South Dakota Electric’s PPA with PacifiCorp, expiringour Board of Directors determined that the Company’s total shareholder return for the January 1, 2018 through December 31, 2023,2020 performance period was at the 55th percentile of its peer group and confirmed a payout equal to 112.35% of target shares, valued at $3.3 million. The payout was fully accrued at December 31, 2020.
As of December 31, 2020, there was $2.0 million of unrecognized compensation expense related to outstanding performance share plans that is expected to be recognized over a weighted-average period of 1.7 years.
(17) INCOME TAXES
CARES Act
On March 27, 2020, President Trump signed the CARES Act, which contained, in part, an allowance for deferral of the purchaseemployer portion of 50 MWSocial Security employment tax liabilities until 2021 and 2022, as well as a COVID-19 employee retention tax credit of electric capacityup to $5,000 per eligible employee.
Eligible employers are taxpayers experiencing either: (1) a full or partial suspension of business operations stemming from a government COVID-19 related order or (2) a more than 50% drop in gross receipts compared to the corresponding calendar quarter in 2019. This 50% employee retention tax credit applies up to $10,000 in qualified wages paid between March 13, 2020 through December 31, 2020, and energy from PacifiCorp’s system. The priceis refundable to the extent it exceeds the employer portion of payroll tax liability.
Eligible wages or employer-paid health benefits must be paid for the capacityperiod of time during which an employee did not provide services. However, employees do not need to stop providing all services to the employer for the credit to potentially apply.
Additionally, the CARES Act accelerates the amount of alternative minimum tax (“AMT”) credits that can be refunded for the 2018 and energy is2019 annual tax returns. In 2020, we filed for, and received, a refund of approximately $2.4 million of AMT credit carryforwards under this provision.
During the year ended December 31, 2020, we utilized the payroll tax deferral provision which allowed us to defer payment of approximately $10 million of Social Security employment tax liabilities. We are currently reviewing the potential future benefits of the CARES Act related to employee retention tax credits to assess the impact on our financial position, results of operations and cash flows.
TCJA
On December 22, 2017, the U.S. government enacted comprehensive tax legislation commonly referred to as the TCJA. The TCJA reduced the U.S. federal corporate tax rate from 35% to 21%. As such, the Company remeasured the deferred income taxes at the 21% federal tax rate as of December 31, 2017. The entities subject to regulatory construct have made their best estimate regarding the probability of settlements of net regulatory liabilities established pursuant to the TCJA. The amount of the settlements may change based on decisions and actions by the operating costsfederal and state utility commissions, which could have a material impact on the Company’s future results of oneoperations, cash flows or financial position. As a result of PacifiCorp’s coal-fired electric generating plants.
South Dakota Electric’s firm point-to-point transmission service agreement with PacifiCorp expiringthe revaluation at December 31, 2023. The agreement provides 50 MW2017, deferred tax assets and liabilities were reduced by approximately $309 million. Of the $309 million, approximately $301 million is related to our regulated utilities and is reclassified to a regulatory liability. During the year ended December 31, 2018, we recorded approximately $11 million of capacity and energyadditional regulatory liability associated with TCJA related items primarily related to be transmitted annually by PacifiCorp.
South Dakota Electric’s PPA with PRPAproperty, completing the revaluation of deferred taxes pursuant to purchase up to 12 MW of wind energy through PRPA’s agreement with Silver Sage. This agreement will expire September 30, 2029.
Wyoming Electric’s PPA with Happy Jack, expiring September 3, 2028, provides up to 30 MW of wind energy. Under a separate intercompany agreement, Wyoming Electric sells 50%the TCJA. A majority of the facility outputexcess deferred taxes are subject to South Dakota Electric.the average rate assumption method, as prescribed by the IRS, and will generally be amortized as a reduction of customer rates over the remaining lives of the related assets. As of December 31, 2020, the Company has amortized $13.3 million of the regulatory liability. The portion that was eligible for amortization under the average rate assumption method in 2020, but is awaiting resolution of the treatment of these amounts in future regulatory proceedings, has not been recognized and may be refunded in customer rates at any time in accordance with the resolution of pending or future regulatory proceedings.
Wyoming Electric’s PPA with Silver Sage, expiring September 30, 2029, provides up
Income Tax Expense (Benefit)
Income tax expense (benefit) from continuing operations for the years ended December 31 was (in thousands):
| | | | | | | | | | | |
| 2020 | 2019 | 2018 |
| Current: | | | |
| Federal | $ | (6,020) | | $ | (8,578) | | $ | 325 | |
| State | 847 | | 138 | | 247 | |
| Current income tax expense (benefit) | (5,173) | | (8,440) | | 572 | |
| Deferred: | | | |
| Federal | 35,672 | | 34,551 | | (25,022) | |
| State | 2,419 | | 3,469 | | 783 | |
| Deferred income tax expense (benefit) | 38,091 | | 38,020 | | (24,239) | |
| | | |
| Income tax expense (benefit) | $ | 32,918 | | $ | 29,580 | | $ | (23,667) | |
Effective Tax Rates
The effective tax rate differs from the federal statutory rate for the years ended December 31, as follows:
| | | | | | | | | | | |
| 2020 | 2019 | 2018 |
| Federal statutory rate | 21.0 | % | 21.0 | % | 21.0 | % |
| State income tax (net of federal tax effect) | 2.4 | | 1.5 | | 2.3 | |
| | | |
| | | |
Non-controlling interest (a) | (1.2) | | (1.2) | | (1.3) | |
Tax credits(b) (c) | (9.2) | | (3.9) | | (2.0) | |
| | | |
Flow-through adjustments (d) | (1.6) | | (2.4) | | (1.6) | |
Jurisdictional consolidation project (e) | 0 | | 0 | | (28.5) | |
| Uncertain Tax Benefits | 1.5 | | 0 | | 0 | |
| Valuation Allowance | 0.7 | | 0 | | 0 | |
| Other tax differences | 0.6 | | (1.6) | | (0.1) | |
TCJA corporate rate reduction (f) | 0 | | 0 | | 1.6 | |
Amortization of excess deferred income tax expense (g) | (2.3) | | (1.2) | | (0.7) | |
| Effective Tax Rate | 11.9 | % | 12.2 | % | (9.3) | % |
_________________________
(a) The effective tax rate reflects the income attributable to 30 MW of wind energy. Under a separate intercompany agreement, Wyoming Electric sells 20 MW of energy from Silver Sage to South Dakota Electric.
the noncontrolling interest in Black Hills Wyoming sold its CTII 40 MW natural gas-fired generating unitColorado IPP for which a tax provision was not recorded.
(b) The current year increase of PTCs reflect full year production of two wind facilities that were acquired/ placed into service during 2019; Top of Iowa purchased February 2019 and Busch Ranch II with an in-service date of November 2019. Additionally, in November 2020, the Corriedale qualifying wind facility was placed in service.
(c) In 2020, the Company completed a research and development study which encompassed tax years from 2013 to 2019.
(d) Flow-through adjustments related primarily to accounting method changes for tax purposes that allow us to take a current tax deduction for repair costs and certain indirect costs. We recorded a deferred income tax liability in recognition of the temporary difference created between book and tax treatment and flowed the tax benefit through to tax expense. A regulatory asset was established to reflect the recovery of future increases in taxes payable from customers as the temporary differences reverse. As a result of this regulatory treatment, we continue to record tax benefits consistent with the flow-through method.
(e) In 2018, the Company restructured certain legal entities from earlier acquisitions, which resulted in additional deferred income tax assets of $73 million, related to goodwill that is amortizable for tax purposes, and deferred tax benefits of $73 million.
(f) On December 22, 2017, the TCJA was signed into law reducing the federal corporate rate from 35% to 21% effective January 1, 2018. During the year ended December 31, 2018, we recorded $4.0 million of additional tax expense associated with changes in the prior estimated impacts of TCJA related items.
(g) Primarily TCJA - see above.
Deferred Tax Assets and Liabilities
The temporary differences, which gave rise to the City of Gillette, Wyoming on September 3, 2014. Under the terms of the sale, Black Hills Wyoming entered into ancillary agreements to operate CTII, provide use of shared facilities including a ground lease and dispatch generation services. In addition, the agreement includes a 20-year economy energy PPA that contains a sharing arrangement in which the parties share the savings of wholesale power purchases made when market power prices are less than the cost of operating the generating unit.
Costs under these power purchase contractsnet deferred tax liability, for the years ended December 31 were as follows (in thousands):
| | | | | | | | |
| 2020 | 2019 |
| Deferred tax assets: | | |
| Regulatory liabilities | $ | 90,535 | | $ | 89,754 | |
| | |
| State tax credits | 23,339 | | 23,261 | |
| Federal NOL | 96,155 | | 120,624 | |
| State NOL | 9,914 | | 13,537 | |
| Partnership | 15,601 | | 14,030 | |
| Credit Carryovers | 51,445 | | 27,139 | |
| Other deferred tax assets | 40,143 | | 33,395 | |
| Less: Valuation allowance | (13,943) | | (12,063) | |
| Total deferred tax assets | 313,189 | | 309,677 | |
| | |
| Deferred tax liabilities: | | |
| Accelerated depreciation, amortization and other property-related differences | (551,137) | | (533,292) | |
| Regulatory assets | (28,007) | | (23,586) | |
| Goodwill | (30,590) | | (15,875) | |
| | |
| State deferred tax liability | (73,910) | | (72,911) | |
| | |
| Other deferred tax liabilities | (38,169) | | (24,732) | |
| Total deferred tax liabilities | (721,813) | | (670,396) | |
| | |
| Net deferred tax liability | $ | (408,624) | | $ | (360,719) | |
|
| | | | | | | | | |
| | 2019 | 2018 | 2017 |
| Colorado Electric PPA with PRPA - Unit Contingent Energy | $ | 1,802 |
| $ | — |
| $ | — |
|
Colorado Electric PPA Busch Ranch I (a) | $ | — |
| $ | — |
| $ | 1,966 |
|
| South Dakota Electric PPA with PacifiCorp | $ | 7,477 |
| $ | 13,681 |
| $ | 13,218 |
|
| South Dakota Electric Transmission services agreement with PacifiCorp | $ | 1,741 |
| $ | 1,742 |
| $ | 1,671 |
|
| South Dakota Electric PPA with PRPA | $ | 688 |
| $ | 223 |
| $ | — |
|
| Wyoming Electric PPA with Happy Jack | $ | 3,936 |
| $ | 3,884 |
| $ | 3,846 |
|
| Wyoming Electric PPA with Silver Sage | $ | 5,366 |
| $ | 5,376 |
| $ | 4,934 |
|
________________
| |
(a) | On December 11, 2018, Black Hills Electric Generation purchased a 50% ownership interest of the Busch Ranch I. Black Hills Electric Generation and Colorado Electric now collectively own 100% of the wind farm. |
Power Purchase Agreements - Related Party
On November 26, 2019, Black Hills Electric Generation completed and placed in service Busch Ranch II. Black Hills Electric Generation provides the wind energy generated from Busch Ranch II to Colorado Electric under a new PPA, which expires in November 2044.
On December 11, 2018, Black Hills Electric Generation purchased a 50% ownership interest in Busch Ranch I. Black Hills Electric Generation provides its 14.5 MW share of energy from the wind farm to Colorado Electric through a PPA, which expires in October 2037.
Colorado Electric’s PPA with Black Hills Colorado IPP expiring on December 31, 2031, provides 200 MW of power to Colorado Electric from Black Hills Colorado IPP’s combined-cycle turbines. Effective January 1, 2019, we changed how we account for this PPA at the segment level and now recognize on an accrual basis, rather than a finance lease. See Note 5 for additional information.
Other Gas Supply Agreements
Our Utilities also purchase natural gas, including transportation and storage capacity to meet customers’ needs, under short-term and long-term purchase contracts. These contracts extend to 2044.
Purchase Commitments
We maintain natural gas supply contracts with several vendors that generally cover a period of up to one year. Commitments for estimated baseload gas volumes are established prior to the beginning of the month under these contracts on a monthly basis at contractually negotiated prices. Commitments for incremental daily purchases are made as necessary during the month based on requirements in accordance with the terms of the individual contract.
Our Gas Utilities segment has commitments to purchase physical quantities of natural gas under contracts indexed to various forward natural gas price curves. A portion of our gas purchases are purchased under evergreen contracts and are therefore, for purposes of this disclosure, carried out for 60 days. At December 31, 2019, the long-term commitments to purchase quantities of natural gas under contracts indexed to the following forward indices were2020, we have federal and state NOL carryforwards that will expire at various dates as follows (in MMBtus):
|
| | |
| | NNG-Ventura | NWPL-Wyoming |
| 2020 | 3,660,000 | 1,520,000 |
| 2021 | 3,650,000 | 1,510,000 |
| 2022 | 1,810,000 | 1,510,000 |
| 2023 | 0 | 1,510,000 |
| 2024 | 0 | 910,000 |
| Thereafter | 0 | 0 |
Purchases under these contracts totaled $6.7 million, $27 million and $65 million for 2019, 2018 and 2017, respectively.
The following is a schedule of unconditional purchase obligations required under the power purchase, transmission services and natural gas transportation and storage agreements (in thousands):
|
| | | | | | |
| | Power purchase and transmission services agreements | Natural gas transportation and storage agreements |
| 2020 | $ | 25,476 |
| $ | 156,297 |
|
| 2021 | $ | 11,678 |
| $ | 148,149 |
|
| 2022 | $ | 11,678 |
| $ | 122,340 |
|
| 2023 | $ | 11,678 |
| $ | 93,905 |
|
| 2024 | $ | 2,738 |
| $ | 51,360 |
|
| Thereafter | $ | — |
| $ | 126,147 |
|
| | | | | | | | | | | | | | | | | | | | |
| | Amounts | | Expiration Dates |
| Federal NOL Carryforward | | $ | 378,236 | | | 2022 | to | 2037 |
| Federal NOL Carryforward | | $ | 79,644 | | | No expiration |
| | | | | | |
State NOL Carryforward (a) | | $ | 173,867 | | | 2021 | to | 2040 |
Future Purchase Agreement - Related Party
Wyoming Electric has a PPA with Black Hills Wyoming expiring on December 31, 2022, which provides 60 MW of unit-contingent capacity and energy from Black Hills Wyoming’s Wygen I facility. On August 2, 2019, Black Hills Wyoming and Wyoming Electric jointly filed a request with FERC for approval of a new 60 MW PPA.(a) The agreement would fulfill the capacity need for Wyoming Electric at the expiration of the current agreement on December 31, 2022. If approved, Black Hills Wyoming will continue to deliver 60 MW of energy to Wyoming Electric from its Wygen I power plant starting January 1, 2023, and continuing for an additional 20 years to December 31, 2042. On December 23, 2019, the Company filed a response to questions from the FERC and awaits a decision from FERC.
Power Sales Agreements
Through our subsidiaries, we have the following significant long-term power sales contracts with non-affiliated third-parties:
| |
• | During periods of reduced production at Wygen III in which MDU owns a portion of the capacity, or during periods when Wygen III is off-line, South Dakota Electric will provide MDU with 25 MW from our other generation facilities or from system purchases with reimbursement of costs by MDU. This agreement expires January 31, 2023.
|
South Dakota Electric has an agreement to provide MDU capacity and energy up to a maximum of 50 MW in excess of Wygen III ownership. This agreement expires December 31, 2023.
During periods of reduced production at Wygen III in which the City of Gillette owns a portion of the capacity, or during periods when Wygen IIIcarryforward balance is off-line, South Dakota Electric will provide the City of Gillette with its first 23 MW from our other generating facilities or from system purchases with reimbursement of costs by the City of Gillette. Under this agreement which is renewed annually on September 3, South Dakota Electric will also provide the City of Gillette their operating component of spinning reserves.
South Dakota Electric has an amended agreement, effective January 1, 2019, to supply up to 20 MW of energy and capacity to MEAN under a contract that expires May 31, 2028. The contract terms are from June 1 through May 31 for each interval listed below. This contract is unit-contingent basedreflected on the availabilitybasis of our Neil Simpson II and Wygen III plants, with decreasing capacity purchased over the term of the agreement. The unit-contingent capacity amounts from Wygen III and Neil Simpson II are as follows:apportioned tax losses to jurisdictions imposing state income taxes.
|
| | | | | | | | | | | |
| Contract Years | Total Contract Capacity | | Contingent Capacity Amounts on Wygen III | | Contingent Capacity Amounts on Neil Simpson II |
| 2019-2020 | 15 |
| MW | | 10 |
| MW | | 5 |
| MW |
| 2020-2022 | 15 |
| MW | | 7 |
| MW | | 8 |
| MW |
| 2022-2023 | 15 |
| MW | | 8 |
| MW | | 7 |
| MW |
| 2023-2028 | 10 |
| MW | | 5 |
| MW | | 5 |
| MW |
South Dakota Electric has an agreement that expires December 31, 2021 to provide 50 MW of energy to Macquarie Energy, LLC during heavy and light load timing intervals.
Reimbursement Agreement
We have a reimbursement agreement in place with Wells Fargo on behalf of Wyoming Electric for the 2009A bonds of $10 million due in 2027 and the 2009B bonds of $7.0 million due in 2021. In the case of default, we hold the assumption of liability for drawings on Wyoming Electric’s Letter of Credit attached to these bonds.
Environmental Matters
We are subject to costs resulting from a number of federal, state and local laws and regulations which affect future planning and existing operations. Laws and regulations can result in increased capital expenditures, operating and other costs as a result of compliance, remediation and monitoring obligations. Due to the environmental issues discussed below, we may be required to modify, curtail, replace or cease operating certain facilities or operations to comply with statutes, regulations and other requirements of regulatory bodies.
Reclamation Liability
For our Pueblo Airport Generation site, we posted a bond of $4.1 million with the State of Colorado to cover the costs of remediation for a waste water containment pond permitted to provide wastewater storage and processing for this zero discharge facility. The reclamation liability is recorded at the present value of the estimated future cost to reclaim the land.
Under our land leases for our wind generation facilities, we are required to reclaim all land where we have placed wind turbines. The reclamation liabilities are recorded at the present value of the estimated future cost to reclaim the land.
Under its mining permit, WRDC is required to reclaim all land where it has mined reserves. The reclamation liability is recorded at the present value of the estimated future cost to reclaim the land.
See Note 8 for additional information.
Manufactured Gas Processing
In 2008, we acquired whole and partial liabilities for former manufactured gas processing sites in Nebraska and Iowa which were previously used to convert coal to natural gas. The acquisition provided for an insurance recovery, now valued at $1.1 million recorded in Other assets, non-current on our Consolidated Balance Sheets, which will be used to help offset remediation costs. We also have a $1.5 million regulatory asset for manufactured gas processing sites; see Note 13 for additional information.
As of December 31, 2019, our estimated liabilities for Iowa’s manufactured gas processing site currently range from approximately $2.6 million to $10 million for which2020, we had $2.6a $1.1 million accrued for remediationvaluation allowance against the state NOL carryforwards. Our 2020 analysis of the site asability to utilize such NOLs resulted in a $0.8 million increase in the valuation allowance reduced by previously reserved expiring NOL of December 31, 2019$0.2 million, which results in an increase to tax expense of $0.8 million net of federal income tax and a decrease to the state NOL deferred tax asset of $0.2 million. The valuation allowance adjustment was primarily attributable to statutory rate reduction for years beyond 2020.
Unrecognized Tax Benefits
The following table reconciles the total amounts of unrecognized tax benefits, without interest, at the beginning and end of the period included in Other deferred credits and other liabilities on ourthe accompanying Consolidated Balance Sheets. The remediation cost estimate could change materially due to results of further investigations, actions of environmental agencies or the financial viability of other responsible parties.Sheets (in thousands):
| | | | | |
| Changes in Uncertain Tax Positions |
| Beginning balance at January 1, 2018 | $ | 3,263 | |
| Additions for prior year tax positions | 251 | |
| Reductions for prior year tax positions | (417) | |
| Additions for current year tax positions | 486 | |
| Settlements | 0 | |
| Ending balance at December 31, 2018 | 3,583 | |
| Additions for prior year tax positions | 446 | |
| Reductions for prior year tax positions | (862) | |
| Additions for current year tax positions | 998 | |
| Settlements | 0 | |
| Ending balance at December 31, 2019 | 4,165 | |
| Additions for prior year tax positions | 3,788 | |
| Reductions for prior year tax positions | (1,313) | |
| Additions for current year tax positions | 1,743 | |
| Settlements | 0 | |
| Ending balance at December 31, 2020 | $ | 8,383 | |
For additional
The total amount of unrecognized tax benefits that, if recognized, would impact the effective tax rate is approximately $4.3 million.
We recognized 0 interest expense associated with income taxes for the years ended December 31, 2020, December 31, 2019 and December 31, 2018. We had 0 accrued interest (before tax effect) associated with income taxes at December 31, 2020 and December 31, 2019.
The Company is subject to federal income tax as well as income tax in various state and local jurisdictions. Black Hills Gas, Inc. and subsidiaries, which filed a separate consolidated tax return from BHC and subsidiaries through March 31, 2018, is under examination by the IRS for 2014. BHC is no longer subject to examination for tax years prior to 2017.
As of December 31, 2020, we do not have any tax positions for which it is reasonably possible that the total amount of unrecognized tax benefits will significantly increase or decrease on or before December 31, 2021.
State tax credits have been generated and are available to offset future state income taxes. At December 31, 2020, we had the following state tax credit carryforwards (in thousands):
| | | | | | | | | | | | | | |
| State Tax Credit Carryforwards | Expiration Year |
| ITC | $ | 23,060 | | 2023 | to | 2041 |
| Research and development | $ | 278 | | No expiration |
As of December 31, 2020, we had a $12.8 million valuation allowance against the state ITC carryforwards. Our 2020 analysis of the ability to utilize such ITC resulted in a $1.3 million increase in the valuation allowance, which resulted in an increase to tax expense of $1.3 million. The valuation allowance adjustment was primarily attributable to changes in forecasted future state taxable income.
(18) BUSINESS SEGMENT INFORMATION
Our reportable segments are based on our method of internal reporting, which is generally segregated by differences in products, services and regulation. All of our operations and assets are located within the United States.
Accounting standards for presentation of segments require an approach based on the way we organize the segments for making operating decisions and how the Chief Operating Decision Maker (CODM) assesses performance. The CODM assesses the performance of our segments using adjusted operating income, which recognizes intersegment revenues, costs, and assets for Colorado Electric’s PPA with Black Hills Colorado IPP on an accrual basis rather than as a finance lease. This presentation of segment information see does not impact consolidated financial results.
Segment information was as follows (in thousands):
| | | | | | | | |
| Total Assets (net of intercompany eliminations) as of December 31, | 2020 | 2019 |
| Electric Utilities | $ | 3,120,928 | | $ | 2,900,983 | |
| Gas Utilities | 4,376,204 | | 4,032,339 | |
| Power Generation | 404,220 | | 417,715 | |
| Mining | 77,085 | | 77,175 | |
| Corporate and Other | 110,349 | | 130,245 | |
| Total assets | $ | 8,088,786 | | $ | 7,558,457 | |
Environmental Matters
| | | | | | | | |
Capital Expenditures (a) for the years ended December 31, | 2020 | 2019 |
| Electric Utilities | $ | 271,104 | | $ | 222,911 | |
| Gas Utilities | 449,209 | | 512,366 | |
| Power Generation | 9,329 | | 85,346 | |
| Mining | 8,250 | | 8,430 | |
| Corporate and Other | 17,500 | | 20,702 | |
| Total capital expenditures | $ | 755,392 | | $ | 849,755 | |
_________________
| | | | | | | | |
| Property, Plant and Equipment as of December 31, | 2020 | 2019 |
| | |
| Electric Utilities | $ | 3,248,480 | | $ | 3,059,135 | |
| Gas Utilities | 3,312,613 | | 2,981,498 | |
| | |
| Power Generation | 534,803 | | 534,518 | |
| Mining | 187,540 | | 180,473 | |
| Corporate and Other | 22,094 | | 29,055 | |
| Total property, plant and equipment | $ | 7,305,530 | | $ | 6,784,679 | |
| | | | | | | | | | | | | | | | | | | | | | | |
| Consolidating Income Statement |
| Year ended December 31, 2020 | Electric Utilities | Gas Utilities | Power Generation | Mining | Corporate | Inter-Company Eliminations | Total |
| |
| Revenue - | | | | | | | |
| Contracts with customers | $ | 687,929 | | $ | 959,696 | | $ | 6,090 | | $ | 27,089 | | $ | — | | $ | — | | $ | 1,680,804 | |
| Other revenues | 2,201 | | 9,962 | | 1,566 | | 2,408 | | — | | — | | 16,137 | |
| 690,130 | | 969,658 | | 7,656 | | 29,497 | | — | | — | | 1,696,941 | |
| Inter-company operating revenue - | | | | | | | |
| Contracts with customers | 23,914 | | 4,724 | | 97,169 | | 31,478 | | 167 | | (157,452) | | 0 | |
| Other revenues | 0 | | 288 | | 222 | | 100 | | 352,976 | | (353,586) | | 0 | |
| 23,914 | | 5,012 | | 97,391 | | 31,578 | | 353,143 | | (511,038) | | 0 | |
| Total revenue | 714,044 | | 974,670 | | 105,047 | | 61,075 | | 353,143 | | (511,038) | | 1,696,941 | |
| | | | | | | |
| Fuel, purchased power and cost of natural gas sold | 267,045 | | 354,645 | | 8,993 | | 0 | | 83 | | (138,362) | | 492,404 | |
| Operations and maintenance, including taxes | 196,794 | | 303,577 | | 33,695 | | 39,033 | | 284,501 | | (305,823) | | 551,777 | |
| Depreciation, depletion and amortization | 94,150 | | 100,559 | | 20,247 | | 9,235 | | 25,150 | | (24,884) | | 224,457 | |
| Adjusted operating income (loss) | $ | 156,055 | | $ | 215,889 | | $ | 42,112 | | $ | 12,807 | | $ | 43,409 | | $ | (41,969) | | $ | 428,303 | |
| | | | | | | |
| Interest expense, net | | | | | | | (143,470) | |
| Impairment of investment | | | | | | | (6,859) | |
| Other income (expense), net | | | | | | | (2,293) | |
| Income tax benefit (expense) | | | | | | | (32,918) | |
| Income from continuing operations | | | | | | | 242,763 | |
| (Loss) from discontinued operations, net of tax | | | | | | | 0 | |
| Net income | | | | | | | 242,763 | |
| Net income attributable to noncontrolling interest | | | | | | | (15,155) | |
| Net income available for common stock | | | | | | | $ | 227,608 | |
| | | | | | | | | | | | | | | | | | | | | | | |
| Consolidating Income Statement |
| Year ended December 31, 2019 | Electric Utilities | Gas Utilities | Power Generation | Mining | Corporate | Inter-Company Eliminations | Total |
| |
| Revenue - | | | | | | | |
| Contracts with customers | $ | 684,445 | | $ | 1,007,187 | | $ | 7,580 | | $ | 27,180 | | $ | — | | $ | — | | $ | 1,726,392 | |
| Other revenues | 5,191 | | 384 | | 1,859 | | 1,074 | | — | | $ | — | | 8,508 | |
| 689,636 | | 1,007,571 | | 9,439 | | 28,254 | | — | | — | | 1,734,900 | |
| Inter-company operating revenue - | | | | | | | |
| Contracts with customers | 23,116 | | 2,459 | | 91,577 | | 32,053 | | 230 | | (149,435) | | 0 | |
| Other revenues | 0 | | 0 | | 242 | | 1,322 | | 343,975 | | (345,539) | | 0 | |
| 23,116 | | 2,459 | | 91,819 | | 33,375 | | 344,205 | | (494,974) | | 0 | |
| Total revenue | 712,752 | | 1,010,030 | | 101,258 | | 61,629 | | 344,205 | | (494,974) | | 1,734,900 | |
| | | | | | | |
| Fuel, purchased power and cost of natural gas sold | 268,297 | | 425,898 | | 9,059 | | 0 | | 268 | | (132,693) | | 570,829 | |
| Operations and maintenance, including taxes | 195,581 | | 301,844 | | 28,429 | | 40,032 | | 286,799 | | (303,776) | | 548,909 | |
| Depreciation, depletion and amortization | 88,577 | | 92,317 | | 18,991 | | 8,970 | | 22,065 | | (21,800) | | 209,120 | |
| Adjusted operating income (loss) | 160,297 | | 189,971 | | 44,779 | | 12,627 | | 35,073 | | (36,705) | | 406,042 | |
| | | | | | | |
| Interest expense, net | | | | | | | (137,659) | |
| Impairment of investment | | | | | | | (19,741) | |
| Other income (expense), net | | | | | | | (5,740) | |
| Income tax benefit (expense) | | | | | | | (29,580) | |
| Income from continuing operations | | | | | | | 213,322 | |
| (Loss) from discontinued operations, net of tax | | | | | | | 0 | |
| Net income | | | | | | | 213,322 | |
| Net income attributable to noncontrolling interest | | | | | | | (14,012) | |
| Net income available for common stock | | | | | | | $ | 199,310 | |
| | | | | | | | | | | | | | | | | | | | | | | |
| Consolidating Income Statement |
| Year ended December 31, 2018 | Electric Utilities | Gas Utilities | Power Generation | Mining | Corporate | Inter-Company Eliminations | Total |
| |
| Revenue - | | | | | | | |
| Contracts with customers | $ | 686,272 | | $ | 1,022,828 | | $ | 5,833 | | $ | 33,609 | | $ | — | | $ | — | | $ | 1,748,542 | |
| Other revenues | 2,427 | | 955 | | 1,413 | | 931 | | — | | — | | 5,726 | |
| 688,699 | | 1,023,783 | | 7,246 | | 34,540 | | — | | — | | 1,754,268 | |
| Inter-company operating revenue - | | | | | | | |
| Contracts with customers | 22,752 | | 1,524 | | 84,959 | | 32,194 | | 148 | | (141,577) | | 0 | |
| Other revenues | 0 | | 0 | | 246 | | 1,299 | | 379,775 | | (381,320) | | 0 | |
| 22,752 | | 1,524 | | 85,205 | | 33,493 | | 379,923 | | (522,897) | | 0 | |
| Total revenue | 711,451 | | 1,025,307 | | 92,451 | | 68,033 | | 379,923 | | (522,897) | | 1,754,268 | |
| | | | | | | |
| Fuel, purchased power and cost of natural gas sold | 283,840 | | 462,153 | | 8,592 | | 0 | | 44 | | (129,019) | | 625,610 | |
| Operations and maintenance, including taxes | 186,175 | | 291,481 | | 25,135 | | 43,728 | | 324,916 | | (336,142) | | 535,293 | |
| Depreciation, depletion and amortization | 85,567 | | 86,434 | | 16,110 | | 7,965 | | 21,161 | | (20,909) | | 196,328 | |
| Adjusted operating income (loss) | 155,869 | | 185,239 | | 42,614 | | 16,340 | | 33,802 | | (36,827) | | 397,037 | |
| | | | | | | |
| Interest expense, net | | | | | | | (139,975) | |
| Other income (expense), net | | | | | | | (1,180) | |
| Income tax benefit (expense) | | | | | | | 23,667 | |
| Income from continuing operations | | | | | | | 279,549 | |
| (Loss) from discontinued operations, net of tax | | | | | | | (6,887) | |
| Net income | | | | | | | 272,662 | |
| Net income attributable to noncontrolling interest | | | | | | | (14,220) | |
| Net income available for common stock | | | | | | | $ | 258,442 | |
(19) SUBSEQUENT EVENT
In February 2021, a prolonged period of historic cold temperatures across the central United States, which covered all of our Utilities’ service territories, caused a significant increase in heating and energy demand and contributed to unforeseeable and unprecedented market prices for natural gas and electricity.
Our Utilities have regulatory mechanisms to recover the increased energy costs from this record-breaking cold weather event. However, given the extraordinary impact of these higher costs to our customers, we expect our regulators to undertake a heightened review. We are engaged with our regulators to identify appropriate recovery periods over which to recover costs associated with this event as we continue to address the impacts to our customers’ bills.
As a result of this Annual Reporthistoric event, our natural gas purchases increased by approximately $600 million compared to forecasted base load for the month of February. This amount is a preliminary estimate through February 24, 2021, and does not include certain pipeline transportation charges that remain subject to settlement and payable in late March 2021. To fund February natural gas purchases and pipeline transportation charges and provide additional liquidity, we entered into a nine-month Credit Agreement on Form 10-K.
Legal Proceedings
February 24, 2021, that provides for an $800 million unsecured term loan facility. The term loan, which matures on November 23, 2021, has an interest rate based on LIBOR plus 75 basis points, carries 0 prepayment penalty and is subject to the same covenant requirements as our Revolving Credit Facility. We expect to repay a portion of this term loan prior to maturity and refinance the remaining portion in longer-term debt. In the normal course of business,event we are subjectunable to various lawsuits, actions, proceedings, claimsrefinance the remaining obligation under the $800 million term loan, we believe it is probable that our current plans to manage liquidity would be sufficient to meet our obligations.
Except as described above and other matters asserted under lawsthe Note 2 disclosures surrounding Colorado Gas’ and regulations. We believe the amounts providedNebraska Gas’ jurisdictional consolidation and rate reviews, there have been no events subsequent to December 31, 2020 which would require recognition in the consolidated financial statements to satisfy alleged liabilities are adequate in light of the probable and estimable contingencies. However, there can be no assurance that the actual amounts required to satisfy alleged liabilities from various legal proceedings, claims and other matters discussed, and to comply with applicable laws and regulations will not exceed the amounts reflected in the consolidated financial statements.
In the normal course of business, we enter into agreements that include indemnification in favor of third parties, such as information technology agreements, purchase and sale agreements and lease contracts. We have also agreed to indemnify our directors, officers and employees in accordance with our articles of incorporation, as amended. Certain agreements do not contain any limits on our liability and therefore, it is not possible to estimate our potential liability under these indemnifications. In certain cases, we have recourse against third parties with respect to these indemnities. Further, we maintain insurance policies that may provide coverage against certain claims under these indemnities.
(20) GUARANTEESor disclosures.
We have entered into various agreements providing financial or performance assurance to third parties on behalf of certain of our subsidiaries. The agreements include indemnification for reclamation and surety bonds and a contract performance guarantee.
We had the following guarantees in place as of (in thousands):
|
| | | | |
| | Maximum Exposure at | |
| Nature of Guarantee | December 31, 2019 | Expiration |
Indemnification for subsidiary reclamation/surety bonds (a) | $ | 55,527 |
| Ongoing |
Contract performance guarantee (b) | 46,831 |
| May 2020 |
| | $ | 102,358 |
| |
_______________________
| |
(a) | We have guarantees in place for reclamation and surety bonds for our subsidiaries. The guarantees were entered into in the normal course of business. To the extent liabilities are incurred as a result of activities covered by the surety bonds, such liabilities are included in our Consolidated Balance Sheets. |
| |
(b) | BHC has guaranteed the full and complete payment and performance on behalf of Black Hills Electric Generation for construction of Busch Ranch II. The guarantee terminates when BHC or Black Hills Electric Generation has paid for and performed all guaranteed obligations. |
(21) DISCONTINUED OPERATIONS
Results of operations for discontinued operations were classified as Net (loss) from discontinued operations in the accompanying Consolidated Statements of Income. Prior periods relating to our discontinued operations were reclassified to reflect consistency within our consolidated financial statements.
Oil and Gas Segment
On November 1, 2017, the BHC Board of Directors approved a complete divestiture of our Oil and Gas segment. We completed the divestiture in 2018.
In 2017, we performed a fair value assessment of the assets and liabilities classified as held for sale. We evaluated our disposal groups classified as held for sale based on the lower of carrying value or fair value less cost to sell. The market approach was based on our fourth quarter 2017 sale of our Powder River Basin assets and pending sale transactions of our other properties. We believe that the estimates used in calculating the fair value of our assets and liabilities held for sale were reasonable based on the information that was known when the estimates were made. At December 31, 2017, the fair value of our held for sale assets was less than our carrying value, which required a pre-tax write down of $20 million. There were no adjustments made to the fair value of our held for sale liabilities.
For the year ended December 31, 2018, we recorded $3.3 million of expenses comprised of royalty payments and reclamation costs related to final closing on the sale of oil and gas assets.
Operating results of the Oil and Gas segment included in Discontinued operations on the accompanying Consolidated Statements of Income were as follows (in thousands): |
| | | | | | |
| | For the Years Ended |
| | December 31, 2018 | December 31, 2017 |
| | | |
| Revenue | $ | 5,897 |
| $ | 25,382 |
|
| | | |
| Operations and maintenance | 11,014 |
| 22,872 |
|
| Loss on sale of assets | 3,259 |
| — |
|
| Depreciation, depletion and amortization | 1,300 |
| 7,521 |
|
| Impairment of long-lived assets | — |
| 20,385 |
|
| Total operating expenses | 15,573 |
| 50,778 |
|
| | | |
| Operating (loss) | (9,676 | ) | (25,396 | ) |
| | | |
| Interest income (expense), net | (19 | ) | 181 |
|
| Other income (expense), net | 190 |
| (297 | ) |
| Income tax benefit | 2,618 |
| 8,413 |
|
| | | |
| Net (loss) from discontinued operations | $ | (6,887 | ) | $ | (17,099 | ) |
(ITEM 9.22) QUARTERLY HISTORICAL DATA(Unaudited)CHANGES IN AND DISAGREEMENTS WITH ACCOUNTANTS ON ACCOUNTING AND FINANCIAL DISCLOSURE
The Company operates on a calendar year basis. The following tables set forth select unaudited historical operating results and market data for each quarter of 2019 and 2018.
|
| | | | | | | | | | | | |
| | First Quarter | Second Quarter | Third Quarter | Fourth Quarter |
| | (in thousands, except per share amounts, dividends and common stock prices) |
| 2019 | | | | |
| Revenue | $ | 597,810 |
| $ | 333,888 |
| $ | 325,548 |
| $ | 477,654 |
|
| Operating income | $ | 160,131 |
| $ | 54,001 |
| $ | 70,551 |
| $ | 121,359 |
|
| Income from continuing operations | $ | 107,362 |
| $ | 17,693 |
| $ | 15,395 |
| $ | 72,872 |
|
| (Loss) from discontinued operations | $ | — |
| $ | — |
| $ | — |
| $ | — |
|
| Net income attributable to noncontrolling interest | $ | (3,554 | ) | $ | (3,110 | ) | $ | (3,655 | ) | $ | (3,693 | ) |
| Net income available for common stock | $ | 103,808 |
| $ | 14,583 |
| $ | 11,740 |
| $ | 69,179 |
|
| | | | | |
| Amounts attributable to common shareholders: | | | | |
| Net income from continuing operations | $ | 103,808 |
| $ | 14,583 |
| $ | 11,740 |
| $ | 69,179 |
|
| Net (loss) from discontinued operations | — |
| — |
| — |
| — |
|
| Net income available for common stock | $ | 103,808 |
| $ | 14,583 |
| $ | 11,740 |
| $ | 69,179 |
|
| | | | | |
| Income per share for continuing operations - Basic | $ | 1.73 |
| $ | 0.24 |
| $ | 0.19 |
| $ | 1.13 |
|
| (Loss) per share for discontinued operations - Basic | — |
| — |
| — |
| — |
|
| Earnings per share - Basic | $ | 1.73 |
| $ | 0.24 |
| $ | 0.19 |
| $ | 1.13 |
|
| | | | | |
| Income per share for continuing operations - Diluted | $ | 1.73 |
| $ | 0.24 |
| $ | 0.19 |
| $ | 1.13 |
|
| (Loss) per share for discontinued operations - Diluted | — |
| — |
| — |
| — |
|
| Earnings per share - Diluted | $ | 1.73 |
| $ | 0.24 |
| $ | 0.19 |
| $ | 1.13 |
|
Included within the Income (loss) from continuing operations in the third quarter of 2019 is $15 million non-cash after-tax impairment of our investment in equity securities of a privately held oil and gas company.
|
| | | | | | | | | | | | |
| | First Quarter | Second Quarter | Third Quarter | Fourth Quarter |
| | (in thousands, except per share amounts, dividends and common stock prices) |
| 2018 | | | | |
| Revenue | $ | 575,389 |
| $ | 355,704 |
| $ | 321,979 |
| $ | 501,196 |
|
| Operating income | $ | 148,274 |
| $ | 69,551 |
| $ | 65,085 |
| $ | 114,127 |
|
| Income from continuing operations | $ | 138,977 |
| $ | 27,167 |
| $ | 21,801 |
| $ | 91,604 |
|
| (Loss) from discontinued operations | $ | (2,343 | ) | $ | (2,427 | ) | $ | (857 | ) | $ | (1,260 | ) |
| Net income attributable to noncontrolling interest | $ | (3,630 | ) | $ | (2,823 | ) | $ | (3,994 | ) | $ | (3,773 | ) |
| Net income available for common stock | $ | 133,004 |
| $ | 21,917 |
| $ | 16,950 |
| $ | 86,571 |
|
| | | | | |
| Amounts attributable to common shareholders: | | | | |
| Net income from continuing operations | $ | 135,347 |
| $ | 24,344 |
| $ | 17,807 |
| $ | 87,831 |
|
| Net (loss) from discontinued operations | (2,343 | ) | (2,427 | ) | (857 | ) | (1,260 | ) |
| Net income available for common stock | $ | 133,004 |
| $ | 21,917 |
| $ | 16,950 |
| $ | 86,571 |
|
| | | | | |
| Income per share for continuing operations - Basic | $ | 2.54 |
| $ | 0.46 |
| $ | 0.33 |
| $ | 1.52 |
|
| (Loss) per share for discontinued operations - Basic | (0.05 | ) | (0.05 | ) | (0.02 | ) | (0.02 | ) |
| Earnings per share - Basic | $ | 2.49 |
| $ | 0.41 |
| $ | 0.32 |
| $ | 1.50 |
|
| | | | | |
| Income per share for continuing operations - Diluted | $ | 2.50 |
| $ | 0.45 |
| $ | 0.32 |
| $ | 1.51 |
|
| (Loss) per share for discontinued operations - Diluted | (0.04 | ) | (0.05 | ) | (0.02 | ) | (0.02 | ) |
| Earnings per share - Diluted | $ | 2.46 |
| $ | 0.40 |
| $ | 0.31 |
| $ | 1.49 |
|
Included within the Income (loss) from continuing operations in the first and fourth quarters of 2018 are tax benefits of $49 million and $23 million, respectively, related to goodwill that is amortizable for tax purposes which resulted from legal entity restructuring.
| |
ITEM 9. | CHANGES IN AND DISAGREEMENTS WITH ACCOUNTANTS ON ACCOUNTING AND FINANCIAL DISCLOSURE |
None.
| |
ITEM 9A. | CONTROLS AND PROCEDURES |
ITEM 9A.CONTROLS AND PROCEDURES
Disclosure Controls and Procedures
Our Chief Executive Officer and Chief Financial Officer evaluated the effectiveness of our disclosure controls and procedures (as defined in Rules 13a-15(e) and 15d-15(e) of the Securities Exchange Act of 1934 (Exchange Act)) as of December 31, 2019.2020. Based on their evaluation, they have concluded that our disclosure controls and procedures are effective.
Our disclosure controls and procedures are designed to ensure that information required to be disclosed by us in the reports that we file or submit under the Security Exchange Act, of 1934, as amended, is recorded, processed, summarized and reported, within the time periods specified in the Commission’sSEC’s rules and forms, and that such information is accumulated and communicated to our management, including our Chief Executive Officer and Chief Financial Officer, as appropriate to allow timely decisions regarding required disclosure.
Changes in Internal Control over Financial Reporting
During the quarter ended December 31, 2019,2020, there were no changes in the Company’s internal control over financial reporting (as defined in Rule 13a-15(f) under the Securities Exchange Act of 1934)Act) that have materially affected, or are reasonably likely to materially affect, the Company’s internal control over financial reporting.
Management’s Report on Internal Control over Financial Reporting is presented on Page 62 of this Annual Report on Form 10-K.
ITEM 9B.OTHER INFORMATION
|
|
Management’s Report on Internal Control over Financial Reporting is presented on Page
73 of this Annual Report on Form 10-K. |
| |
ITEM 9B. | OTHER INFORMATION |
None.
PART III
| |
ITEM 10. | DIRECTORS, EXECUTIVE OFFICERS AND CORPORATE GOVERNANCE |
ITEM 10.DIRECTORS, EXECUTIVE OFFICERS AND CORPORATE GOVERNANCE
Information required under this item with respect to directors and information required by Items 401, 405, 406, 407(c)(3), 407(d)(4) and 407(d)(5) of Regulation S-K, is set forth in the Proxy Statement for our 20202021 Annual Meeting of Shareholders, which is incorporated herein by reference. Information about our Executive Officers is reported in Part 1 of this Annual Report on Form 10-K.
| |
ITEM 11. | EXECUTIVE COMPENSATION |
ITEM 11.EXECUTIVE COMPENSATION
Information required under this item is set forth in the Proxy Statement for our 20202021 Annual Meeting of Shareholders, which is incorporated herein by reference.
| |
ITEM 12. | SECURITY OWNERSHIP OF CERTAIN BENEFICIAL OWNERS AND MANAGEMENT AND RELATED STOCKHOLDER MATTERS |
ITEM 12.SECURITY OWNERSHIP OF CERTAIN BENEFICIAL OWNERS AND MANAGEMENT AND RELATED STOCKHOLDER MATTERS
Information regarding the security ownership of certain beneficial owners and management is set forth in the Proxy Statement for our 20202021 Annual Meeting of Shareholders, which is incorporated herein by reference.
EQUITY COMPENSATION PLAN INFORMATION
The following table includes information as of December 31, 20192020 with respect to our equity compensation plans. These plans include the 2005 Omnibus Incentive Plan and 2015 Omnibus Incentive Plan.
| | | Equity Compensation Plan Information | Equity Compensation Plan Information | Equity Compensation Plan Information |
| Plan category | Number of securities to be issued upon exercise of outstanding options, warrants and rights | Weighted-average exercise price of outstanding options, warrants and rights | Number of securities remaining available for future issuance under equity compensation plans (excluding securities reflected in column (a)) | Plan category | Number of securities to be issued upon exercise of outstanding options, warrants and rights | Weighted-average exercise price of outstanding options, warrants and rights | Number of securities remaining available for future issuance under equity compensation plans (excluding securities reflected in column (a)) |
| | (a) | (b) | (c) | | (a) | (b) | (c) |
| Equity compensation plans approved by security holders | 160,179 |
| (1) | | $ | 39.99 |
| (1) | 672,049 |
| (2) | Equity compensation plans approved by security holders | 154,354 | | (1) | | $ | 54.29 | | (1) | 561,073 | | (2) |
| Equity compensation plans not approved by security holders | — |
| | $ | — |
| | — |
| | Equity compensation plans not approved by security holders | — | | | $ | — | | | — | | |
| Total | 160,179 |
| | $ | 39.99 |
| | 672,049 |
| | Total | 154,354 | | | $ | 54.29 | | | 561,073 | | |
_________________________
| |
(1) | Includes 146,179 full value awards outstanding as of December 31, 2019, comprised of restricted stock units, performance shares, short-term incentive plan (STIP) units and Director common stock units. The weighted average exercise price does not include the restricted stock units, performance shares, STIP or common stock units. In addition, 192,120 shares of unvested restricted stock were outstanding as of December 31, 2019,(1) Includes 149,354 full value awards outstanding as of December 31, 2020, comprised of restricted stock units, performance shares, short-term incentive plan (STIP) units and Director common stock units. The weighted average exercise price does not include the restricted stock units, performance shares, STIP or common stock units. In addition, 195,875 shares of unvested restricted stock were outstanding as of December 31, 2020, which are not included in the above table because they have already been issued. |
| |
(2) | Shares available for issuance are from the 2015 Omnibus Incentive Plan. The 2015 Omnibus Incentive Plan permits the grant of stock options, stock appreciation rights, restricted stock, restricted stock units, performance shares, performance units, cash-based awards and other stock based awards. |
(2)Shares available for issuance are from the 2015 Omnibus Incentive Plan. The 2015 Omnibus Incentive Plan permits the grant of stock options, stock appreciation rights, restricted stock, restricted stock units, performance shares, performance units, cash-based awards and other stock based awards. | |
ITEM 13. | CERTAIN RELATIONSHIPS AND RELATED TRANSACTIONS AND DIRECTOR INDEPENDENCE |
ITEM 13.CERTAIN RELATIONSHIPS AND RELATED TRANSACTIONS AND DIRECTOR INDEPENDENCE
Information regarding certain relationships and related transactions and director independence is set forth in the Proxy Statement for our 20202021 Annual Meeting of Shareholders, which is incorporated herein by reference.
| |
ITEM 14. | PRINCIPAL ACCOUNTING FEES AND SERVICES |
ITEM 14.PRINCIPAL ACCOUNTING FEES AND SERVICES
Information regarding principal accounting fees and services is set forth in the Proxy Statement for our 20202021 Annual Meeting to Shareholders, which is incorporated herein by reference.
PART IV
| |
ITEM 15. | EXHIBITS, FINANCIAL STATEMENT SCHEDULES |
|
| | |
(a) | 1. | Consolidated Financial Statements |
| | |
| | Financial statements required under this item are included in Item 8 of Part II |
| | |
| 2. | Schedules |
| | |
| | Schedule II — Consolidated Valuation and Qualifying Accounts for the years ended December 31, 2019, 2018 and 2017 |
| | |
| 3. | Exhibits |
| | |
| | All other schedules have been omitted because of the absence of the conditions under which they are required or because the required information is included in our consolidated financial statements and notes thereto. |
SCHEDULE II
ITEM 15.EXHIBITS, FINANCIAL STATEMENT SCHEDULES
(a) Documents filed as part of this report
1. Consolidated Financial Statements
Financial statements required under this item are included in Item 8 of Part II
2. Schedules
All other schedules have been omitted because of the absence of the conditions under which they are required or because the required information is included in our consolidated financial statements and notes thereto. Consolidated valuation and qualifying accounts are detailed within Note 1 of the Notes to the Consolidated Financial Statements in this Annual Report on Form 10-K.
3.Exhibits
Exhibits filed herewithin are designated by an asterisk (*). All exhibits not so designated are incorporated by reference to a prior filing, as indicated. Items constituting a board of director or management compensatory plan are designated by a cross (†).
| Description |
| |
Exhibit Number | Description |
| |
2.1*2.1 | |
| |
2.2*2.2 | |
| |
2.3*2.3 | |
| |
3.1*3.1 | |
| |
3.2*3.2 | |
| |
4.1*4.1 | |
| 4.1.1 | |
| 4.1.2 | |
| 4.1.3 | |
|
| |
| 4.1.4 | |
| 4.1.5 | |
| 4.1.6 | |
| 4.1.7 | |
| 4.1.8 | |
| | | | | |
| 4.1.9 | |
| |
4.2*4.2 | |
| 4.2.1 | |
| 4.2.2 | |
| 4.2.3 | |
| |
4.3*4.3 | |
| 4.3.1 | |
| 4.3.2 | |
| |
4.4*4.4 | |
| |
| 4.5 | |
| |
10.1*†10.1† | |
| 10.1.1† | |
| 10.1.2† | |
| |
10.2*†10.2† | |
| |
10.3*†10.3† | |
| 10.3.1† | |
| |
10.4*†10.4† | |
| |
10.5*†10.4.1† | |
| |
10.6*†10.5† | |
| |
|
| |
10.7*†10.6† | |
| 10.6.1† | |
| 10.6.2† | |
| |
10.8*10.7*† | |
| |
10.9*†10.8† | |
| 10.9† | |
| |
10.10*†10.10† | |
| | | | | |
| 10.11*† | |
| |
10.11*†10.12† | |
| |
10.12†10.13† | |
| 10.14† | |
| |
10.13*†10.15† | |
| 10.16*† | |
10.14*10.17*† | |
| 10.18† | |
| |
10.15†10.19† | |
| |
10.16†10.20† | |
| |
10.17*†10.21† | |
| 10.21.1† | |
| 10.21.2† | |
| 10.21.3† | |
| 10.21.4† | |
| 10.21.5† | |
| |
10.18*†10.21.6† | |
| |
10.19*†10.22† | |
| |
10.2010.23 | |
| 10.24 | |
| |
10.21* | |
|
| |
| |
10.22*10.25 | Amended and Restated Credit Agreement dated as of July 30, 2018 (relating to $300 million, two-year term loan), among Black Hills Corporation, as Borrower, the financial institutions party thereto, as Banks, and JPMorgan Chase Bank, N.A., as Administrative Agent (filed as Exhibit 10.2 to the Registrant’s Form 8-K filed on July 31, 2018). |
| 10.25.1 | First Amendment dated as of June 17, 2019 to Amended and Restated Credit Agreement dated as of July 30, 2018, among Black Hills Corporation, as Borrower, the financial institutions party thereto, as Banks, and JPMorgan Chase Bank, N.A., as Administrative Agent (filed as Exhibit 10.1 to the Registrant’s Form 8–K filed on June 17, 2019). |
| | | | | |
| 10.26 | |
10.23* | Coal Leases between WRDC and the Federal Government
-Dated May 1, 1959 (filed as Exhibit 5(i) to the Registrant’s Form S‑7, File No. 2‑60755)
-Modified January 22, 1990 (filed as Exhibit 10(h) to the Registrant’s Form 10‑K for 1989)
-Dated April 1, 1961 (filed as Exhibit 5(j) to the Registrant’s Form S‑7, File No. 2‑60755)
-Modified January 22, 1990 (filed as Exhibit 10(i) to Registrant’s Form 10‑K for 1989)
-Dated October 1, 1965 (filed as Exhibit 5(k) to the Registrant’s Form S‑7, File No. 2‑60755)
-Modified January 22, 1990 (filed as Exhibit 10(j) to the Registrant’s Form 10‑K for 1989).
|
| 10.27 | |
10.24* | Assignment of Mining Leases and Related Agreement effective May 27, 1997, between WRDC and Kerr-McGee Coal Corporation (filed as Exhibit 10(u) to the Registrant’s Form 10-K for 1997). |
| |
2121* | |
| |
23.123.1* | |
| |
31.131.1* | |
| |
31.231.2* | |
| |
32.132.1* | |
| |
32.232.2* | |
| |
9595* | |
| 101.INS* | |
101.INS | XBRL Instance Document - the instance document does not appear in the Interactive Data File because its XBRL tags are embedded within the Inline XBRL document |
101.SCH101.SCH* | XBRL Taxonomy Extension Schema Document |
101.CAL101.CAL* | XBRL Taxonomy Extension Calculation Linkbase Document |
101.DEF101.DEF* | XBRL Taxonomy Extension Definition Linkbase Document |
101.LAB101.LAB* | XBRL Taxonomy Extension Label Linkbase Document |
101.PRE101.PRE* | XBRL Taxonomy Extension Presentation Linkbase Document |
| 104* | |
104 | Cover Page Interactive Data File (formatted as inline XBRL and contained in Exhibit 101) |
________________________
| |
* | Previously filed as part of the filing indicated and incorporated by reference herein. |
| |
† | Indicates a board of director or management compensatory plan. |
| |
ITEM 16. | FORM 10-K SUMMARY |
ITEM 16.FORM 10-K SUMMARY
None.
SIGNATURES
Pursuant to the requirements of Section 13 or 15(d) of the Securities Exchange Act of 1934, the Registrant has duly caused this report to be signed on its behalf by the undersigned, thereunto duly authorized.
|
| | | | | | | | | | |
| | BLACK HILLS CORPORATION |
| | |
| | By: | /S/ LINDEN R. EVANS |
| | Linden R. Evans, President and Chief Executive Officer |
| Dated: | February 14, 202026, 2021 | |
Pursuant to the requirements of the Securities Exchange Act of 1934, this report has been signed below by the following persons on behalf of the Registrant and in the capacities and on the dates indicated.
| | | | | | | | |
| /S/ STEVEN R. MILLS | Director and | February 26, 2021 |
| Steven R. Mills | Chairman | |
| | |
| /S/ LINDEN R. EVANS | Director and | February 14, 202026, 2021 |
| Linden R. Evans, President | Principal Executive Officer | |
| and Chief Executive Officer | | |
| | |
| /S/ RICHARD W. KINZLEY | Principal Financial and | February 14, 202026, 2021 |
| Richard W. Kinzley, Senior Vice President | Accounting Officer | |
| and Chief Financial Officer | | |
| | |
/S/ DAVID R. EMERYBARRY M. GRANGER | Director and | February 14, 202026, 2021 |
David R. Emery, Executive ChairmanBarry M. Granger | Executive Chairman | |
| | |
| /S/ TONY A. JENSEN | Director | February 14, 202026, 2021 |
| Tony A. Jensen | | |
| | |
| /S/ MICHAEL H. MADISON | Director | February 14, 202026, 2021 |
| Michael H. Madison | | |
| | |
| /S/ KATHLEEN S. MCALLISTER | Director | February 14, 202026, 2021 |
| Kathleen S. McAllister | | |
| | |
/S/ STEVEN R. MILLS | Director | February 14, 2020 |
Steven R. Mills | | |
| | |
| /S/ ROBERT P. OTTO | Director | February 14, 202026, 2021 |
| Robert P. Otto | | |
| | |
| /S/ SCOTT M. PROCHAZKA | Director | February 26, 2021 |
| Scott M. Prochazka | | |
| | |
| /S/ REBECCA B. ROBERTS | Director | February 14, 202026, 2021 |
| Rebecca B. Roberts | | |
| | |
| /S/ MARK A. SCHOBER | Director | February 14, 202026, 2021 |
| Mark A. Schober | | |
| | |
| /S/ TERESA A. TAYLOR | Director | February 14, 202026, 2021 |
| Teresa A. Taylor | | |
| | |
| /S/ JOHN B. VERING | Director | February 14, 202026, 2021 |
| John B. Vering | | |
| | |
/S/ THOMAS J. ZELLER | Director | February 14, 2020 |
Thomas J. Zeller | | |