UNITED STATES | |
SECURITIES AND EXCHANGE COMMISSION | |
WASHINGTON, D.C. 20549 | |
FORM 10-K | |
FOR ANNUAL AND TRANSACTION REPORTS PURSUANT TO SECTIONS 13 OR 15(d) OF THE | |
SECURITIES EXCHANGE ACT OF 1934 | |
x | ANNUAL REPORT PURSUANT TO SECTION 13 OR 15(d) OF THE SECURITIES EXCHANGE ACT OF 1934 |
For the fiscal year ended December 31, 2007 | |
OR | |
o | TRANSITION REPORT PURSUANT TO SECTION 13 OR 15(d) OF THE SECURITIES EXCHANGE ACT OF 1934 |
For the transition period from _________ to __________ | |
Commission File Number 1-10258 | |
TREDEGAR CORPORATION |
(Exact name of registrant as specified in its charter) |
Virginia | 54-1497771 |
(State or other jurisdiction | (I.R.S. Employer |
1100 Boulders Parkway, Richmond, Virginia | 23225 |
(Address of principal executive offices) | (Zip Code) |
Registrant’s telephone number, including area code: 804-330-1000 | |
Securities registered pursuant to Section 12(b) of the Act: | |
Title of Each Class | Name of Each Exchange on Which Registered | |
Common Stock | New York Stock Exchange | |
Preferred Stock Purchase Rights | New York Stock Exchange |
Securities registered pursuant to Section 12(g) of the Act: None
Indicate by check mark if the registrant is a well-known seasoned issuer, as defined in Rule 405 of the Securities Act.
Indicate by check mark if the registrant is not required to file reports pursuant to Section 13 or Section 15(d) of the Act.
Indicate by check mark whether the registrant (1) has filed all reports required to be filed by Section 13 or 15(d) of the Securities Exchange Act of 1934 during the preceding 12 months (or for such shorter period that the registrant was required to file such reports), and (2) has been subject to such filing requirements for at least the past 90 days.Yes x No o
Indicate by check mark if disclosure of delinquent filers pursuant to Item 405 of Regulation S-K (§ 229.405 of this chapter) is not contained herein, and will not be contained, to the best of registrant'sregistrant’s knowledge, in definitive proxy or information statements incorporated by reference in Part III of this Form 10-K or any amendment to this Form 10-K x
Indicate by check mark whether the registrant is a large accelerated filer, an accelerated filer, a non-accelerated filer, or a non-accelerated filer.smaller reporting company. See definitionthe definitions of “large accelerated filer,” “accelerated filerfiler” and large accelerated filer”“smaller reporting company” in Rule 12b-2 of the Exchange Act. (Check one):
Large accelerated filer | o | Accelerated filer x | ||
Non-accelerated filer | o | (Do not check if a smaller reporting company) | Smaller reporting company o |
Indicate by check mark whether the registrant is a shell company (as defined in Rule 12b-2 of the Act).
Aggregate market value of voting and non-voting common equity held by non-affiliates of the registrant as of June 30, 20062007 (the last business day of the registrant’s most recently completed second quarter): $479,651,105*
Number of shares of Common Stock outstanding as of January 31, 2007: 39,382,964 (38,790,2972008: 34,698,950 (39,595,524 as of June 30, 2006)
* In determining this figure, an aggregate of 8,471,0118,269,963 shares of Common Stock beneficially owned by Floyd D. Gottwald, Jr., John D. Gottwald, William M. Gottwald and the members of their immediate families has been excluded because the shares are held by affiliates. The aggregate market value has been computed based on the closing price in the New York Stock Exchange Composite Transactions on June 30, 2006,29, 2007, as reported by The Wall Street Journal.
Documents Incorporated By Reference |
Portions of the Tredegar Corporation Proxy Statement for the 2008 Annual Meeting of Shareholders (the “Proxy Statement”) are incorporated by reference into Part III of this Form 10-K. We expect to file our Proxy Statement with the Securities and Exchange Commission (the “SEC”) and mail it to shareholders on or about April 4, 2008. |
Documents Incorporated By Reference
Page | ||||
1-3 | ||||
4-6 | ||||
None | ||||
6 | ||||
None | ||||
None | ||||
7-10 | ||||
10-16 | ||||
17-34 | ||||
35 | ||||
39-73 | ||||
None | ||||
35-36 | ||||
None | ||||
36-37 | ||||
* | ||||
38 | ||||
38 | ||||
* | ||||
39 | ||||
*
Items 11 and 14 and portions of Items 10, 12 and 13 are incorporated by reference from the Proxy Statement.The Securities and Exchange Commission (the “SEC”)SEC has not approved or disapproved of this report or passed upon its accuracy or adequacy.
Item 1. | BUSINESS |
Description of Business
Tredegar Corporation (“Tredegar”), a Virginia corporation incorporated in 1988, is engaged, through its subsidiaries, in the manufacture of plastic films and aluminum extrusions. FinancialThe financial information related to Tredegar’s films and continuing aluminum segments included in Note 3 to the notes to financial statements is incorporated herein by reference.
Film Products
Tredegar Film Products Corporation and its subsidiaries (together, “Film Products”) manufacture plastic films, elastics and laminate materials primarily for personal and household care products and packaging and surface protection applications. These products are produced at locations in the United States and at plants in The Netherlands, Hungary, Italy, China and Brazil. Film Products competes in all of its markets on the basis of product innovation, quality, price and service.
Personal and Household Care Materials. Film Products is one of the largest global suppliers of apertured, breathable, elastic and embossed films, and laminate materials for personal care markets, including:
• | Apertured film and nonwoven materials for use as topsheet in feminine hygiene products, baby diapers and adult incontinent products (including materials sold under the ComfortQuilt®and ComfortAireTMbrand names); |
• | Breathable, embossed and elastic materials for use as components for baby diapers, adult incontinent products and feminine hygiene products (including elastic components sold under the FabriflexTM, StretchTabTMand FlexAireTMbrand names); and |
• | Absorbent transfer layers for baby diapers and adult incontinent products sold under the AquiDryTM and AquiSoftTM brand names. |
In each of the last three years, personal care products accounted for more than 30%approximately 40% of Tredegar’s consolidated net sales.
Film Products also makes apertured films, breathable barrier films and laminates that regulate vaporfluid or fluidvapor transmission. These products are typically used in industrial, medical, agricultural and household markets, including disposable mops, facial wipes, filter layers for personal protective suits, facial masks and landscaping fabric. Film Products supplies a family of laminates for use in protective apparel under the GuardDog Laminates
TM brand name.
Film Products also produces films that are disposable, protective coversheets for photopolymers used in the manufacture of circuit boards. Othersingle and multi-layer surface protection films sold under the UltraMask® and ForceFieldTM brand namesnames. These films are used as protective films to protectin high technology applications, including protecting components of flat panel display componentsdisplays and LCD televisions during fabrication, shipping and handling.the manufacturing process.
Raw Materials. The primary raw materials used by Film Products are low density, linear low density and high density polyethylene and polypropylene resins, which are obtained from domestic and foreign suppliers at competitive prices. We believe there will be an adequate supply of polyethylene and polypropylene resins in the immediate future. Film Products also buys polypropylene-based nonwoven fabrics based on these same resins, and we believe there will be an adequate supply of these materials in the immediate future.
P&G and Tredegar have had a successful long-term relationship based on cooperation, product innovation and continuous process improvement. The loss or significant reduction in sales associated with P&G would have a material adverse effect on our business.
Research and Development and Intellectual Property. Film Products has technical centers in Richmond, Virginia; Terre Haute, Indiana; Chieti, Italy; and Shanghai, China; and holds 189200 issued patents (73(76 of which are issued in the U.S.) and 110116 trademarks (10(15 of which are issued in the U.S.). Expenditures for research and development (“R&D”) have averaged $7.4$7.7 million annually over the past three years.
Aluminum Extrusions
The William L. Bonnell Company, Inc. and its subsidiaries (together, "Aluminum Extrusions"“Aluminum Extrusions”) produce soft-alloy aluminum extrusions primarily for building and construction, distribution, transportation, machinery and equipment, electrical and consumer durables markets.
Aluminum Extrusions manufactures mill (unfinished), anodized (coated) and painted aluminum extrusions for sale directly to fabricators and distributors that use our extrusions to produce window components, curtain walls and storefronts, tub and shower doors, industrial and agricultural machinery and equipment, ladders, bus bars, automotive parts, snowmobiles and tractor-trailer shapes, among other products. Sales are made primarily in the United States, and Canada, principally east of the Rocky Mountains. Aluminum Extrusions competes primarily on the basis of product quality, service and price.
Aluminum Extrusions sales volume from continuing operations by market segment over the last three years is shown below:
| by Market Segment | ||||||||||
2006 | 2005 | 2004 | ||||||||
| Building and construction: | ||||||||||
| Commercial | 48 | 44 | 41 | |||||||
| Residential | 14 | 18 | 21 | |||||||
| Distribution | 19 | 16 | 13 | |||||||
| Transportation | 9 | 9 | 10 | |||||||
| Machinery and equipment | 5 | 6 | 7 | |||||||
| Electrical | 3 | 4 | 5 | |||||||
| Consumer durables | 2 | 3 | 3 | |||||||
| Total | 100 | 100 | 100 | |||||||
|
|
|
|
|
|
|
|
|
|
|
| ||||||||||
% of Aluminum Extrusions Sales Volume |
| |||||||||
| ||||||||||
|
| 2007 |
| 2006 |
| 2005 |
| |||
|
|
|
|
| ||||||
Building and construction: |
|
|
|
|
|
|
|
|
|
|
Commercial |
|
| 65 |
|
| 55 |
|
| 51 |
|
Residential |
|
| 17 |
|
| 19 |
|
| 25 |
|
Distribution |
|
| 9 |
|
| 18 |
|
| 16 |
|
Transportation |
|
| 4 |
|
| 3 |
|
| 4 |
|
Machinery and equipment |
|
| 2 |
|
| 2 |
|
| 2 |
|
Electrical |
|
| 2 |
|
| 2 |
|
| 1 |
|
Consumer durables |
|
| 1 |
|
| 1 |
|
| 1 |
|
Total |
|
| 100 |
|
| 100 |
|
| 100 |
|
Raw Materials. The primary raw materials used by Aluminum Extrusions consist of aluminum ingot, aluminum scrap and various alloys, which are purchased from domestic and foreign producers in open-market purchases and under short-term contracts. We believe there will be an adequate supply of aluminum and other required raw materials and supplies in the immediate future.
Intellectual Property. Aluminum Extrusions holds twoone U.S. patentspatent and two U.S. trademarks.
Patents, Licenses and Trademarks. Tredegar considers patents, licenses and trademarks to be of significance for Film Products. We routinely apply for patents on significant developments in this business. Our patents have remaining terms ranging from 1 to 19 years. We also have licenses under patents owned by third parties.
Research and Development. Tredegar’s spending for R&D activities in 2007, 2006 2005 and 20042005 was related to Film Products and AFBS, Inc. (formerly known as Therics, Inc.). R&D spending at Film Products was approximately $8.4 million in 2007, $8.1 million in 2006 and $6.6 million in 2005 and $7.5 million in 2004.2005.
On June 30, 2005, substantially all of the assets of AFBS, a wholly-owned subsidiary of Tredegar, were sold or assigned to a newly-created limited liability company, Therics, LLC, controlled and managed by an individual not affiliated with Tredegar. AFBS received a 17.5% equity interest in Therics, LLC, then valued at $170,000 and a 3.5% interest in Theken Spine, LLC, then valued at $800,000, along with potential future payments based on the sale of certain products by Therics, LLC. AFBS had operating losses of $3.5 million during the first six months of 2005 and $9.8 million in 2004.2005. There was no R&D spending at AFBS in 2007 and 2006. R&D spending at AFBS was approximately $2.4 million in 2005 and $7.8 million in 2004.
Backlog. Backlogs are not material to our operations.operations in Film Products. Overall backlog for continuing operations in Aluminum Extrusions at December 31, 2007 was down by approximately 7% compared with December 31, 2006. The demand for extruded aluminum shapes is down significantly in most market segments, which we believe is cyclical in nature. Aluminum extrusion volume from continuing operations decreased to 155.8 million pounds in 2007, down 15.9% from 185.2 million pounds in 2006. Shipments declined in most markets, especially extrusions used in hurricane protection products and residential construction. In addition, we began experiencing a softening of markets for extrusions used in non-residential construction in the fourth quarter of 2007.
Government Regulation. Laws concerning the environment that affect or could affect our domestic operations include, among others, the Clean Water Act, the Clean Air Act, the Resource Conservation Recovery Act, the Occupational Safety and Health Act, the National Environmental Policy Act, the Toxic Substances Control Act, the Comprehensive Environmental Response, Compensation and Liability Act ("CERCLA"(“CERCLA”), as amended, regulations promulgated under these acts, and any other federal, state or local laws or regulations governing environmental matters. WeAt December 31, 2007, we believe that we arewere in substantial compliance with all applicable laws, regulations and permits. In order to maintain substantial compliance with such standards, we may be required to incur expenditures, the amounts and timing of which are not presently determinable but which could be significant, in constructing new facilities or in modifying existing facilities.
Employees. Tredegar employed approximately 3,0002,600 people in continuing operations at December 31, 2006.2007.
Available Information and Corporate Governance Documents.Our Internet address is www.tredegar.com. We make available, free of charge through our website, our annual report on Form 10-K, quarterly reports on Form 10-Q, current reports on Form 8-K and amendments to those reports filed or furnished pursuant to Section 13(a) or 15(d) of the Securities Exchange Act of 1934, as amended, as soon as reasonably practicable after such documents are electronically filed with, or furnished to, the SEC. Information filed electronically with the SEC can be accessed on its website at www.sec.gov. In addition, our Corporate Governance Guidelines, Code of Conduct and the charters of our Audit, Executive Compensation and Nominating and Governance Committees are available on our website and are available in print, without charge, to any shareholder upon request by contacting Tredegar’s Corporate Secretary at 1100 Boulders Parkway, Richmond, Virginia 23225. The information on or that can be accessed through our website is not, and shall not be deemed to be, a part of this report or incorporated into other filings we make with the SEC.
RISK FACTORS |
There are a number of risks and uncertainties that can have a material effect on the operating results of our businesses and our financial condition. These risk factors include, but are not limited to, the following:
General
• | Our future performance is influenced by costs incurred by our operating companies including, for example, the cost of energy and raw materials.These costs include, without limitation, the cost of resin (the raw material on which Film Products primarily depends), aluminum (the raw material on which Aluminum Extrusions primarily depends), natural gas (the principal fuel necessary for Aluminum Extrusions’ plants to operate), electricity and diesel fuel. Resin, aluminum and natural gas prices are volatile, and the prices for resin and aluminum have |
• | Our substantial international operations subject us to risks of doing business in foreign countries, which could adversely affect our business, financial condition and results of operations. Risks inherent in international operations include the following, by way of example: changes in general economic conditions, potential difficulty enforcing agreements and intellectual property rights, staffing and managing widespread operations, restrictions on foreign trade or investment, restrictions on the repatriation of income, fluctuations in exchange rates, imposition of additional taxes on our foreign income, nationalization of private enterprises and unexpected adverse changes in foreign laws and regulatory requirements. |
• | Non-compliance with any of the covenants in our $300 million credit facility could result in all outstanding debt under the agreement becoming due, which could have an adverse effect on our financial condition |
• | Our investments (primarily $10 million investment in Harbinger and $6.5 million investment in a drug delivery company) have high risk. Harbinger Capital Partners Special Situations Fund, L.P. (“Harbinger”) is a fund that seeks to achieve superior absolute returns by participating primarily in medium to long-term investments involving distressed/high yield debt securities, special situation equities and private loans and notes. The fund is a highly speculative investment subject to a two-year lock-up and additional limitations on withdrawal. The drug delivery company may need several more rounds of financing to have the opportunity to complete product development and bring its technology to market, which may never occur. There is no secondary market for selling our interests in Harbinger or the drug delivery company. |
Film Products | |
• | Film Products is highly dependent on sales associated with one customer, P |
• | Growth of Film Products depends on our ability to develop and deliver new products at competitive prices, especially in the personal care |
• | Continued growth in Film |
• | Our inability to protect our intellectual property rights or our infringement of the intellectual property rights of others could have a significant adverse impact on Film Products. Film Products operates in a field where our significant customers and competitors have substantial intellectual property portfolios. The continued success of this business depends on our ability not only to protect our own technologies and trade secrets, but also to develop and sell new products that do not infringe upon existing patents or threaten existing customer relationships. An unfavorable outcome in any intellectual property litigation or similar proceeding could have a |
• | As Film Products expands its personal care business, we have greater credit risk that is inherent in broadening our customer base. |
Aluminum Extrusions | |
• | Sales volume and profitability of Aluminum Extrusions is cyclical and highly dependent on economic conditions of end-use markets in the United States, |
• | The markets for our products are highly competitive with product quality, service, delivery performance and price being the principal competitive factors. Aluminum Extrusions has |
During improving economic conditions, excess industry capacity is absorbed and pricing pressure becomes less of a factor in many of our end-use markets. Conversely, during an economic slowdown, excess industry capacity often drives increased pricing pressure in many end-use markets as competitors protect their position with key customers. Because the business is susceptible to these changing economic conditions, Aluminum Extrusions targets complex, customized, service-intensive business with more challenging requirements which is competitively more defensible compared to higher volume, standard extrusion applications. |
Foreign imports, primarily from China, represent a |
There can be no assurance that we will be able to maintain current margins and profitability. Our continued success and prospects depend on our ability to retain existing customers and participate in overall industry cross-cycle growth. |
UNRESOLVED STAFF COMMENTS | |
None. | |
PROPERTIES | |
General |
Most of the improved real property and the other assets used in our operations are owned, and none of the owned property is subject to an encumbrance that is material to our consolidated operations. We consider the plants, warehouses and other properties and assets owned or leased by us to be in generally good condition.
We believe that the capacity of our plants is adequate to meet our immediate needs. Our plants generally have operated at 50-95% of capacity. Our corporate headquarters, which is leased, is located at 1100 Boulders Parkway, Richmond, Virginia 23225.
Our principal plants and facilities are listed below:
Film Products
Locations in the United States | Locations in Foreign Countries | Principal Operations | ||
Lake Zurich, Illinois | Chieti, Italy (technical center) | Production of plastic films and | ||
Pottsville, Pennsylvania | Guangzhou, China | laminate materials | ||
Red Springs, North Carolina | Kerkrade, The Netherlands | |||
(leased) | Rétság, Hungary | |||
Richmond, Virginia (technical | Roccamontepiano, Italy | |||
center) (leased) | São Paulo, Brazil | |||
Terre Haute, Indiana | Shanghai, China | |||
(technical center and | ||||
production facility) |
Aluminum Extrusions
Locations in the United States | Locations in Canada | Principal Operations | ||
Carthage, Tennessee | All locations in Canada were part | Production of aluminum extrusions, | ||
Kentland, Indiana | of the sale on February 12, 2008, | fabrication and finishing | ||
Newnan, Georgia | of the aluminum extrusions | |||
business in Canada (see Note 17 to | ||||
the notes to financial statements | ||||
for more information) |
LEGAL PROCEEDINGS | |
None. |
SUBMISSION OF MATTERS TO A VOTE OF SECURITY HOLDERS | |
None. |
MARKET FOR TREDEGAR’S COMMON EQUITY, RELATED STOCKHOLDER MATTERS AND ISSUER PURCHASES OF EQUITY SECURITIES |
Market Prices of Common Stock and Shareholder Data
Our common stock is traded on the New York Stock Exchange (“NYSE”) under the ticker symbol TG. We have no preferred stock outstanding. There were 39,286,07934,765,450 shares of common stock held by 3,4823,486 shareholders of record on December 31, 2006.
The following table shows the reported high and low closing prices of our common stock by quarter for the past two years.
2006 | 2005 | ||||||||||||
High | Low | High | Low | ||||||||||
| First quarter | $ | 16.65 | $ | 13.06 | $ | 20.19 | $ | 16.08 | |||||
| Second quarter | 16.89 | 13.84 | 17.56 | 14.52 | |||||||||
| Third quarter | 16.94 | 14.39 | 16.67 | 12.09 | |||||||||
| Fourth quarter | 23.32 | 16.31 | 13.16 | 11.76 | |||||||||
|
|
|
|
|
|
|
|
|
|
|
|
|
|
|
| 2007 |
| 2006 |
| ||||||||
|
|
|
| ||||||||||
|
| High |
| Low |
| High |
| Low |
| ||||
|
|
|
|
|
| ||||||||
First quarter |
| $ | 24.44 |
| $ | 21.18 |
| $ | 16.65 |
| $ | 13.06 |
|
Second quarter |
|
| 24.45 |
|
| 20.57 |
|
| 16.89 |
|
| 13.84 |
|
Third quarter |
|
| 22.43 |
|
| 16.25 |
|
| 16.94 |
|
| 14.39 |
|
Fourth quarter |
|
| 18.27 |
|
| 13.33 |
|
| 23.32 |
|
| 16.31 |
|
The closing price of our common stock on February 20, 200726, 2008 was $23.86.
Dividend Information
We have paid a dividend every quarter since becoming a public company in July 1989. During 2007, 2006 2005 and 2004,2005, our quarterly dividend was 4 cents per share.
All decisions with respect to the declaration and payment of dividends will be made by the Board of Directors in its sole discretion based upon earnings, financial condition, anticipated cash needs, restrictions in our credit agreement and such other considerations as the Board deems relevant. See Note 8 beginning on page 5958 for the restrictions contained in our credit agreement related to minimum shareholders’ equity required and aggregate dividends permitted.
Issuer Purchases of Equity Securities
During 2006 2005 and 2004,2005, we did not purchase any shares of our common stock in the open market. UnderDuring 2007, under a standing authorization from our board of directors announced on August 8, 2006, we may purchase up to 5purchased approximately 4.8 million shares of our stock at an average price of $16.00 per share. The table below summarizes share repurchase activity by month during 2007:
|
|
|
|
|
|
|
|
|
|
|
|
|
|
|
|
|
| ||||||||||||||||
| Period |
| Total |
| Average |
| Total |
| Maximum |
| ||||||
| ||||||||||||||||
| January - July 2007 |
| — |
|
|
| $ | — |
|
| — |
|
| — |
|
|
| August 2007 |
| 687,100 |
|
|
|
| 17.25 |
|
| 687,100 |
|
| 4,312,900 |
|
|
| September 2007 |
| 1,005,600 |
|
|
|
| 17.03 |
|
| 1,692,700 |
|
| 3,307,300 |
|
|
| October 2007 |
| 518,800 |
|
|
|
| 17.32 |
|
| 2,211,500 |
|
| 2,788,500 |
|
|
| November 2007 |
| 1,236,900 |
|
|
|
| 14.13 |
|
| 3,448,400 |
|
| 1,551,600 |
|
|
| December 2007 |
| 1,385,100 |
|
|
|
| 15.73 |
|
| 4,833,500 |
|
| 166,500 |
|
|
| ||||||||||||||||
* On August 8, 2006, our board of directors approved a share repurchase program authorizing management at its discretion to purchase, in the open market or in privately negotiated transactions, up to 5 million shares of our outstanding common stock.
On January 7, 2008, we announced that our board of directors approved a new share repurchase program whereby management is authorized at prices management deems appropriate.
Annual Meeting
Our annual meeting of shareholders will be held on May 17, 2007,8, 2008, beginning at 9:00 a.m. EDT at Lewis Ginter Botanical Garden, 1800 Lakeside Avenue, Richmond, Virginia, 23229.23228. We expect to mail formal notice of the annual meeting, proxies and proxy statements to shareholders on or about March 28, 2007.
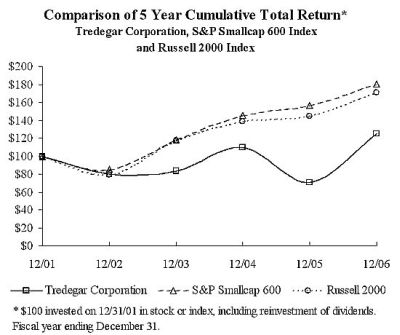
The following graph compares cumulative total shareholder returns for Tredegar, the S&P 600 Stock Index (an index comprised of companies with market capitalizations similar to Tredegar) and the Russell 2000 Index for the five years ended December 31, 2006.2007. Tredegar is part of both the S&P SmallCap 600 Index and Russell 2000 Index.
COMPARISON OF 5 YEAR CUMULATIVE TOTAL RETURN*
Tredegar Corporation, S&P Smallcap 600 Index
and Russell 2000 Index

* $100 invested on 12/31/02 in stock or index-including reinvestment of dividends. |
Fiscal year ending December 31. |
Inquiries
Inquiries concerning stock transfers, dividends, dividend reinvestment, consolidating accounts, changes of address, or lost or stolen stock certificates should be directed to:
National City Bank
All other inquiries should be directed to:
Tredegar Corporation
We do not generate or distribute quarterly reports to shareholders. Information on quarterly results can be obtained from our website. In addition, we file quarterly, annual and other information electronically with the SEC, which can be accessed on its website at
Legal Counsel | Independent Registered Public Accounting Firm | |
Hunton & Williams LLP | PricewaterhouseCoopers LLP | |
Richmond, Virginia | Richmond, Virginia | |
SELECTED FINANCIAL DATA |
The tables that follow on pages 10-1611-16 present certain selected financial and segment information for the eightfive years ended December 31, 2006.
EIGHT-YEAR SUMMARY | |||||||||||||||||||||||||
| Tredegar Corporation and Subsidiaries | |||||||||||||||||||||||||
| Years Ended December 31 | 2006 | 2005 | 2004 | 2003 | 2002 | 2001 | 2000 | 1999 | |||||||||||||||||
| (In Thousands, Except Per-Share Data) | |||||||||||||||||||||||||
Results of Operations (a): | |||||||||||||||||||||||||
| Sales | $ | 1,116,525 | $ | 956,969 | $ | 861,165 | $ | 738,651 | $ | 753,724 | $ | 779,157 | $ | 879,475 | $ | 828,015 | |||||||||
| Other income (expense), net | 1,444 | (b) | (544 | ) (c) | 15,604 | (d) | 7,853 | 546 | 1,255 | 1,914 | 972 | ||||||||||||||
1,117,969 | 956,425 | 876,769 | 746,504 | 754,270 | 780,412 | 881,389 | 828,987 | ||||||||||||||||||
| Cost of goods sold | 944,839 | (b) | 810,621 | (c) | 717,120 | (d) | 606,242 | 582,658 | 618,323 | 706,817 | 648,254 | ||||||||||||||
| Freight | 28,096 | 24,691 | 22,398 | 18,557 | 16,319 | 15,580 | 17,125 | 15,221 | |||||||||||||||||
| Selling, general & administrative expenses | 68,360 | (b) | 64,723 | (c) | 60,030 | (d) | 53,341 | 52,252 | 47,954 | 47,321 | 44,675 | ||||||||||||||
| Research and development expenses | 8,088 | 8,982 | 15,265 | 18,774 | 20,346 | 20,305 | 15,305 | 11,500 | |||||||||||||||||
| Amortization of intangibles | 149 | 299 | 330 | 268 | 100 | 4,914 | 5,025 | 3,430 | |||||||||||||||||
| Interest expense | 5,520 | 4,573 | 3,171 | 6,785 | 9,352 | 12,671 | 17,319 | 9,088 | |||||||||||||||||
| Asset impairments and costs associated with exit and disposal activities | 4,080 | (b) | 16,334 | (c) | 22,973 | (d) | 11,426 | (e) | 3,884 | (f) | 16,935 | (g) | 23,791 | (h) | 4,628 | (i) | |||||||||
| Unusual items | - | - | - | 1,067 | (e) | (6,147 | ) (f) | (971 | ) (g) | (762 | ) (h) | - | |||||||||||||
1,059,132 | 930,223 | 841,287 | 716,460 | 678,764 | 735,711 | 831,941 | 736,796 | ||||||||||||||||||
| Income from continuing operations before income taxes | 58,837 | 26,202 | 35,482 | 30,044 | 75,506 | 44,701 | 49,448 | 92,191 | |||||||||||||||||
| Income taxes | 20,636 | (b) | 9,973 | 9,222 | (d) | 10,717 | 26,881 | 13,950 | (g) | 18,135 | 32,728 | ||||||||||||||
| Income from continuing operations (a) | 38,201 | 16,229 | 26,260 | 19,327 | 48,625 | 30,751 | 31,313 | 59,463 | |||||||||||||||||
| Discontinued operations (a): | |||||||||||||||||||||||||
| Income (loss) from venture capital investment activities | - | - | 2,921 | (46,569 | ) | (42,428 | ) | (16,627 | ) | 83,640 | (4,626 | ) | |||||||||||||
| Income (loss) from operations of Molecumetics | - | - | - | 891 | (8,728 | ) | (5,768 | ) | (3,577 | ) | (2,189 | ) | |||||||||||||
| Income from discontinued energy segment | - | - | - | - | - | 1,396 | - | - | |||||||||||||||||
| Income (loss) from discontinued operations (a) | - | - | 2,921 | (45,678 | ) | (51,156 | ) | (20,999 | ) | 80,063 | (6,815 | ) | |||||||||||||
| Net income (loss) | $ | 38,201 | $ | 16,229 | $ | 29,181 | $ | (26,351 | ) | $ | (2,531 | ) | $ | 9,752 | $ | 111,376 | $ | 52,648 | |||||||
| Diluted earnings (loss) per share: | |||||||||||||||||||||||||
| Continuing operations (a) | $ | .98 | $ | .42 | $ | .68 | $ | .50 | $ | 1.25 | $ | .79 | $ | .80 | $ | 1.54 | |||||||||
| Discontinued operations (a) | - | - | .08 | (1.19 | ) | (1.32 | ) | (.54 | ) | 2.06 | (.18 | ) | |||||||||||||
| Net income (loss) | $ | .98 | $ | .42 | $ | .76 | $ | (.69 | ) | $ | (.07 | ) | $ | .25 | $ | 2.86 | $ | 1.36 | |||||||
Refer to notes to financial tables on page 16. | |||||||||||||||||||||||||
EIGHT-YEAR SUMMARY | |||||||||||||||||||||||||
| Tredegar Corporation and Subsidiaries | |||||||||||||||||||||||||
| Years Ended December 31 | 2006 | 2005 | 2004 | 2003 | 2002 | 2001 | 2000 | 1999 | |||||||||||||||||
| (In Thousands, Except Per-Share Data) | |||||||||||||||||||||||||
Share Data: | |||||||||||||||||||||||||
| Equity per share | $ | 13.15 | $ | 12.53 | $ | 12.45 | $ | 11.72 | $ | 12.08 | $ | 12.53 | $ | 13.07 | $ | 9.88 | |||||||||
| Cash dividends declared per share | .16 | .16 | .16 | .16 | .16 | .16 | .16 | .16 | |||||||||||||||||
| Weighted average common shares outstanding during the period | 38,671 | 38,471 | 38,295 | 38,096 | 38,268 | 38,061 | 37,885 | 36,992 | |||||||||||||||||
| Shares used to compute diluted earnings per share during the period | 38,931 | 38,597 | 38,507 | 38,441 | 38,869 | 38,824 | 38,908 | 38,739 | |||||||||||||||||
| Shares outstanding at end of period | 39,286 | 38,737 | 38,598 | 38,177 | 38,323 | 38,142 | 38,084 | 37,661 | |||||||||||||||||
| Closing market price per share: | |||||||||||||||||||||||||
| High | 23.32 | 20.19 | 20.25 | 16.76 | 24.72 | 21.70 | 32.00 | 32.94 | |||||||||||||||||
| Low | 13.06 | 11.76 | 13.00 | 10.60 | 12.25 | 15.30 | 15.00 | 16.06 | |||||||||||||||||
| End of year | 22.61 | 12.89 | 20.21 | 15.53 | 15.00 | 19.00 | 17.44 | 20.69 | |||||||||||||||||
| Total return to shareholders (j) | 76.6 | % | (35.4 | )% | 31.2 | % | 4.6 | % | (20.2 | )% | 9.9 | % | (14.9 | )% | (7.3 | )% | |||||||||
Financial Position: | |||||||||||||||||||||||||
| Total assets | 781,787 | 781,758 | 769,474 | 753,025 | 837,962 | 865,031 | 903,768 | 792,487 | |||||||||||||||||
| Cash and cash equivalents | 40,898 | 23,434 | 22,994 | 19,943 | 109,928 | 96,810 | 44,530 | 25,752 | |||||||||||||||||
| Income taxes recoverable from sale of venture capital portfolio | - | - | - | 55,000 | - | - | - | - | |||||||||||||||||
| Debt | 62,520 | 113,050 | 103,452 | 139,629 | 259,280 | 264,498 | 268,102 | 270,000 | |||||||||||||||||
| Shareholders' equity (net book value) | 516,595 | 485,362 | 480,442 | 447,399 | 462,932 | 477,899 | 497,728 | 372,228 | |||||||||||||||||
| Equity market capitalization (k) | 888,256 | 499,320 | 780,066 | 592,889 | 574,845 | 724,706 | 664,090 | 779,112 | |||||||||||||||||
Refer to notes to financial tables on page 16. | |||||||||||||||||||||||||
| Net Sales (1) | |||||||||||||||||||||||||
| Segment | 2006 | 2005 | 2004 | 2003 | 2002 | 2001 | 2000 | 1999 | |||||||||||||||||
| (In Thousands) | |||||||||||||||||||||||||
| Film Products | $ | 511,169 | $ | 460,277 | $ | 413,257 | $ | 365,501 | $ | 376,904 | $ | 382,740 | $ | 380,202 | $ | 342,300 | |||||||||
| Aluminum Extrusions | 577,260 | 471,749 | 425,130 | 354,593 | 360,293 | 380,387 | 479,889 | 461,241 | |||||||||||||||||
| AFBS (formerly Therics) | - | 252 | 380 | - | 208 | 450 | 403 | 161 | |||||||||||||||||
| Total ongoing operations (m) | 1,088,429 | 932,278 | 838,767 | 720,094 | 737,405 | 763,577 | 860,494 | 803,702 | |||||||||||||||||
| Divested operations (a): | |||||||||||||||||||||||||
| Fiberlux | - | - | - | - | - | - | 1,856 | 9,092 | |||||||||||||||||
| Total net sales | 1,088,429 | 932,278 | 838,767 | 720,094 | 737,405 | 763,577 | 862,350 | 812,794 | |||||||||||||||||
| Add back freight | 28,096 | 24,691 | 22,398 | 18,557 | 16,319 | 15,580 | 17,125 | 15,221 | |||||||||||||||||
| Sales as shown in Consolidated Statements of Income | $ | 1,116,525 | $ | 956,969 | $ | 861,165 | $ | 738,651 | $ | 753,724 | $ | 779,157 | $ | 879,475 | $ | 828,015 | |||||||||
Refer to notes to financial tables on page 16. | |||||||||||||||||||||||||
Operating Profit | |||||||||||||||||||||||||
| Segment | 2006 | 2005 | 2004 | 2003 | 2002 | 2001 | 2000 | 1999 | |||||||||||||||||
| (In Thousands) | |||||||||||||||||||||||||
| Film Products: | |||||||||||||||||||||||||
| Ongoing operations | $ | 57,645 | $ | 44,946 | $ | 43,259 | $ | 45,676 | $ | 72,307 | $ | 61,787 | $ | 47,112 | $ | 59,554 | |||||||||
| Plant shutdowns, asset impairments and restructurings, net of gains on sale of assets and related income from LIFO inventory liquidations | 221 | (b) | (3,955 | ) (c) | (10,438 | ) (d) | (5,746 | ) (e) | (3,397 | ) (f) | (9,136 | ) (g) | (22,163 | ) (h) | (1,170 | ) (i) | |||||||||
| Unusual items | - | - | - | - | 6,147 | (f) | - | - | - | ||||||||||||||||
| Aluminum Extrusions: | |||||||||||||||||||||||||
| Ongoing operations | 22,031 | 19,302 | 22,637 | 15,117 | 27,304 | 25,407 | 52,953 | 56,501 | |||||||||||||||||
| Plant shutdowns, asset impairments and restructurings, net of gains on sale of assets | (1,434 | ) (b) | 122 | (c) | (10,553 | ) (d) | (644 | ) (e) | (487 | ) (f) | (7,799 | ) (g) | (1,628 | ) (h) | - | ||||||||||
| Gain on sale of land | - | 1,385 | - | - | - | - | |||||||||||||||||||
| Other | - | - | 7,316 | (d) | - | - | - | - | - | ||||||||||||||||
| AFBS (formerly Therics): | |||||||||||||||||||||||||
| Ongoing operations | - | (3,467 | ) | (9,763 | ) | (11,651 | ) | (13,116 | ) | (12,861 | ) | (8,024 | ) | (5,235 | ) | ||||||||||
| Loss on investment in Therics, LLC | (25 | ) | (145 | ) | - | - | - | - | - | - | |||||||||||||||
| Plant shutdowns, asset impairments and restructurings | (637 | ) (b) | (10,318 | ) (c) | (2,041 | ) (d) | (3,855 | ) (e) | - | - | - | (3,458 | ) (i) | ||||||||||||
| Unusual items | - | - | - | (1,067 | ) (e) | - | - | - | - | ||||||||||||||||
| Divested operations (a): | |||||||||||||||||||||||||
| Fiberlux | - | - | - | - | - | - | (264 | ) | 57 | ||||||||||||||||
| Unusual items | - | - | - | - | - | - | 762 | (h) | - | ||||||||||||||||
| Total | 77,801 | 46,485 | 40,417 | 39,215 | 88,758 | 57,398 | 68,748 | 106,249 | |||||||||||||||||
| Interest income | 1,240 | 586 | 350 | 1,183 | 1,934 | 2,720 | 2,578 | 1,419 | |||||||||||||||||
| Interest expense | 5,520 | 4,573 | 3,171 | 6,785 | 9,352 | 12,671 | 17,319 | 9,088 | |||||||||||||||||
| Gain on sale of corporate assets | 56 | 61 | 7,560 | 5,155 | - | - | - | 712 | |||||||||||||||||
| Loss from write-down of investment in Novalux | - | (b) | 5,000 | (c) | - | - | - | - | - | - | |||||||||||||||
| Stock option-based compensation costs | 970 | - | - | - | - | - | - | - | |||||||||||||||||
| Corporate expenses, net | 13,770 | 11,357 | 9,674 | 8,724 | (e) | 5,834 | 2,746 | (g) | 4,559 | 7,101 | |||||||||||||||
| Income from continuing operations before income taxes | 58,837 | 26,202 | 35,482 | 30,044 | 75,506 | 44,701 | 49,448 | 92,191 | |||||||||||||||||
| Income taxes | 20,636 | (b) | 9,973 | 9,222 | 10,717 | 26,881 | 13,950 | (g) | 18,135 | 32,728 | |||||||||||||||
| Income from continuing operations | 38,201 | 16,229 | 26,260 | 19,327 | 48,625 | 30,751 | 31,313 | 59,463 | |||||||||||||||||
| Income (loss) from discontinued operations (a) | - | - | 2,921 | (45,678 | ) | (51,156 | ) | (20,999 | ) | 80,063 | (6,815 | ) | |||||||||||||
| Net income (loss) | $ | 38,201 | $ | 16,229 | $ | 29,181 | $ | (26,351 | ) | $ | (2,531 | ) | $ | 9,752 | $ | 111,376 | $ | 52,648 | |||||||
Refer to notes to financial tables on page 16. | |||||||||||||||||||||||||
| Identifiable Assets | |||||||||||||||||||||||||
| Segment | 2006 | 2005 | 2004 | 2003 | 2002 | 2001 | 2000 | 1999 | |||||||||||||||||
| (In Thousands) | |||||||||||||||||||||||||
| Film Products | $ | 498,961 | $ | 479,286 | $ | 472,810 | $ | 422,321 | $ | 379,635 | $ | 367,291 | $ | 367,526 | $ | 360,517 | |||||||||
| Aluminum Extrusions | 209,395 | 214,374 | 210,894 | 185,336 | 176,631 | 185,927 | 210,434 | 216,258 | |||||||||||||||||
| AFBS (formerly Therics) | 2,420 | 2,759 | 8,613 | 8,917 | 10,643 | 9,931 | 9,609 | 9,905 | |||||||||||||||||
| Subtotal | 710,776 | 696,419 | 692,317 | 616,574 | 566,909 | 563,149 | 587,569 | 586,680 | |||||||||||||||||
| General corporate | 30,113 | 61,905 | 54,163 | 61,508 | 52,412 | 40,577 | 30,214 | 22,419 | |||||||||||||||||
| Income taxes recoverable from sale of venture capital investment portfolio | - | - | - | 55,000 | - | - | - | - | |||||||||||||||||
| Cash and cash equivalents | 40,898 | 23,434 | 22,994 | 19,943 | 109,928 | 96,810 | 44,530 | 25,752 | |||||||||||||||||
| Identifiable assets from ongoing operations | 781,787 | 781,758 | 769,474 | 753,025 | 729,249 | 700,536 | 662,313 | 634,851 | |||||||||||||||||
| Divested operations (a): | |||||||||||||||||||||||||
| Fiberlux | - | - | - | - | - | - | - | 7,859 | |||||||||||||||||
| Discontinued operations (a): | |||||||||||||||||||||||||
| Venture capital | - | - | - | - | 108,713 | 158,887 | 236,698 | 145,028 | |||||||||||||||||
| Molecumetics | - | - | - | - | - | 5,608 | 4,757 | 4,749 | |||||||||||||||||
| Total | $ | 781,787 | $ | 781,758 | $ | 769,474 | $ | 753,025 | $ | 837,962 | $ | 865,031 | $ | 903,768 | $ | 792,487 | |||||||||
Refer to notes to financial tables on page 16. | |||||||||||||||||||||||||
| Depreciation and Amortization | |||||||||||||||||||||||||
| Segment | 2006 | 2005 | 2004 | 2003 | 2002 | 2001 | 2000 | 1999 | |||||||||||||||||
| (In Thousands) | |||||||||||||||||||||||||
| Film Products | $ | 31,847 | $ | 26,673 | $ | 21,967 | $ | 19,828 | $ | 20,085 | $ | 22,047 | $ | 23,122 | $ | 18,751 | |||||||||
| Aluminum Extrusions | 12,323 | 11,484 | 10,914 | 10,883 | 10,506 | 11,216 | 9,862 | 9,484 | |||||||||||||||||
| AFBS (formerly Therics) | - | 437 | 1,300 | 1,641 | 463 | 2,262 | 1,782 | 1,195 | |||||||||||||||||
| Subtotal | 44,170 | 38,594 | 34,181 | 32,352 | 31,054 | 35,525 | 34,766 | 29,430 | |||||||||||||||||
| General corporate | 111 | 195 | 241 | 270 | 353 | 329 | 315 | 253 | |||||||||||||||||
| Total ongoing operations | 44,281 | 38,789 | 34,422 | 32,622 | 31,407 | 35,854 | 35,081 | 29,683 | |||||||||||||||||
| Divested operations (a): | |||||||||||||||||||||||||
| Fiberlux | - | - | - | - | - | - | 151 | 498 | |||||||||||||||||
| Discontinued operations (a): | |||||||||||||||||||||||||
| Venture capital | - | - | - | - | - | - | 18 | 22 | |||||||||||||||||
| Molecumetics | - | - | - | - | 527 | 2,055 | 1,734 | 1,490 | |||||||||||||||||
| Total | $ | 44,281 | $ | 38,789 | $ | 34,422 | $ | 32,622 | $ | 31,934 | $ | 37,909 | $ | 36,984 | $ | 31,693 | |||||||||
Capital Expenditures, Acquisitions and Investments | |||||||||||||||||||||||||
| Segment | 2006 | 2005 | 2004 | 2003 | 2002 | 2001 | 2000 | 1999 | |||||||||||||||||
| (In Thousands) | |||||||||||||||||||||||||
| Film Products | $ | 33,168 | $ | 50,466 | $ | 44,797 | $ | 57,203 | $ | 24,063 | $ | 24,775 | $ | 53,161 | $ | 25,296 | |||||||||
| Aluminum Extrusions | 7,381 | 11,968 | 10,007 | 8,293 | 4,799 | 8,506 | 21,911 | 16,388 | |||||||||||||||||
| AFBS (formerly Therics) | - | 36 | 275 | 219 | 1,621 | 2,340 | 1,730 | 757 | |||||||||||||||||
| Subtotal | 40,549 | 62,470 | 55,079 | 65,715 | 30,483 | 35,621 | 76,802 | 42,441 | |||||||||||||||||
| General corporate | 24 | 73 | 572 | 93 | 60 | 519 | 384 | 606 | |||||||||||||||||
| Capital expenditures for ongoing operations | 40,573 | 62,543 | 55,651 | 65,808 | 30,543 | 36,140 | 77,186 | 43,047 | |||||||||||||||||
| Divested operations (a): | |||||||||||||||||||||||||
| Fiberlux | - | - | - | - | - | - | 425 | 812 | |||||||||||||||||
| Discontinued operations (a): | |||||||||||||||||||||||||
| Venture capital | - | - | - | - | - | - | 86 | - | |||||||||||||||||
| Molecumetics | - | - | - | - | 793 | 2,850 | 2,133 | 1,362 | |||||||||||||||||
| Total capital expenditures | 40,573 | 62,543 | 55,651 | 65,808 | 31,336 | 38,990 | 79,830 | 45,221 | |||||||||||||||||
| Acquisitions and other | - | - | 1,420 | 1,579 | - | 1,918 | 6,316 | 215,227 | |||||||||||||||||
| Novalux investment | 542 | 1,095 | 5,000 | - | - | - | - | - | |||||||||||||||||
| Venture capital investments | - | - | - | 2,807 | 20,373 | 24,504 | 93,058 | 81,747 | |||||||||||||||||
| Total | $ | 41,115 | $ | 63,638 | $ | 62,071 | $ | 70,194 | $ | 51,709 | $ | 65,412 | $ | 179,204 | $ | 342,195 | |||||||||
Refer to notes to financial tables on page 16. | |||||||||||||||||||||||||
FIVE-YEAR SUMMARY |
Tredegar Corporation and Subsidiaries |
|
|
|
|
|
|
|
|
|
|
|
|
|
|
|
|
|
Years Ended December 31 |
| 2007 |
| 2006 |
| 2005 |
| 2004 |
| 2003 |
| |||||
(In Thousands, Except |
|
|
|
|
|
|
|
|
|
|
|
|
| |||
|
|
|
|
|
|
|
|
|
|
|
|
|
|
|
|
|
Results of Operations (a): |
|
|
|
|
|
|
|
|
|
|
|
|
|
|
|
|
Sales |
| $ | 922,583 |
| $ | 937,561 |
| $ | 808,464 |
| $ | 709,649 |
| $ | 609,077 |
|
Other income (expense), net |
|
| 1,782 | (b) |
| 1,444 | (c) |
| (2,211 | ) (d) |
| 15,604 | (e) |
| 6,468 |
|
|
|
| 924,365 |
|
| 939,005 |
|
| 806,253 |
|
| 725,253 |
|
| 615,545 |
|
Cost of goods sold |
|
| 761,509 | (b) |
| 779,376 | (c) |
| 672,465 | (d) |
| 580,893 | (e) |
| 486,065 |
|
Freight |
|
| 19,808 |
|
| 22,602 |
|
| 20,276 |
|
| 18,027 |
|
| 14,330 |
|
Selling, general & administrative expenses |
|
| 68,501 |
|
| 64,082 |
|
| 61,007 | (d) |
| 57,221 | (e) |
| 50,793 |
|
Research and development expenses |
|
| 8,354 |
|
| 8,088 |
|
| 8,982 |
|
| 15,265 |
|
| 18,774 |
|
Amortization of intangibles |
|
| 149 |
|
| 149 |
|
| 299 |
|
| 330 |
|
| 268 |
|
Interest expense |
|
| 2,721 |
|
| 5,520 |
|
| 4,573 |
|
| 3,171 |
|
| 6,785 |
|
Asset impairments and costs associated with exit and disposal activities |
|
| 4,027 | (b) |
| 4,080 | (c) |
| 15,782 | (d) |
| 12,566 | (e) |
| 11,426 | (f) |
Unusual items |
|
| — |
|
| — |
|
| — |
|
| — |
|
| 1,067 | (f) |
|
|
| 865,069 |
|
| 883,897 |
|
| 783,384 |
|
| 687,473 |
|
| 589,508 |
|
Income from continuing operations before income taxes |
|
| 59,296 |
|
| 55,108 |
|
| 22,869 |
|
| 37,780 |
|
| 26,037 |
|
Income taxes |
|
| 24,366 |
|
| 19,791 | (c) |
| 9,497 |
|
| 10,201 | (e) |
| 9,837 |
|
Income from continuing operations (a) |
|
| 34,930 |
|
| 35,317 |
|
| 13,372 |
|
| 27,579 |
|
| 16,200 |
|
Discontinued operations (a): |
|
|
|
|
|
|
|
|
|
|
|
|
|
|
|
|
Income (loss) from aluminum extrusions business in Canada |
|
| (19,681 | ) |
| 2,884 |
|
| 2,857 |
|
| (1,319 | ) |
| 3,127 |
|
Income (loss) from venture capital investment activities |
|
| — |
|
| — |
|
| — |
|
| 2,921 |
|
| (46,569 | ) |
Income from operations of Molecumetics |
|
| — |
|
| — |
|
| — |
|
| — |
|
| 891 |
|
Income (loss) from discontinued operations (a) |
|
| (19,681 | ) |
| 2,884 |
|
| 2,857 |
|
| 1,602 |
|
| (42,551 | ) |
Net income (loss) |
| $ | 15,249 |
| $ | 38,201 |
| $ | 16,229 |
| $ | 29,181 |
| $ | (26,351 | ) |
|
|
|
|
|
|
|
|
|
|
|
|
|
|
|
|
|
Diluted earnings (loss) per share: |
|
|
|
|
|
|
|
|
|
|
|
|
|
|
|
|
Continuing operations (a) |
| $ | .90 |
| $ | .91 |
| $ | .35 |
| $ | .72 |
| $ | .42 |
|
Discontinued operations (a) |
|
| (.51 | ) |
| .07 |
|
| .07 |
|
| .04 |
|
| (1.11 | ) |
Net income (loss) |
| $ | .39 |
| $ | .98 |
| $ | .42 |
| $ | .76 |
| $ | (.69 | ) |
Refer to notes to financial tables on page 16.
FIVE-YEAR SUMMARY |
Tredegar Corporation and Subsidiaries |
|
|
|
|
|
|
|
|
|
|
|
|
|
|
|
|
|
Years Ended December 31 |
| 2007 |
| 2006 |
| 2005 |
| 2004 |
| 2003 |
| |||||
(In Thousands, Except Per-Share Data) |
|
|
|
|
|
|
|
|
|
|
|
|
|
|
|
|
|
|
|
|
|
|
|
|
|
|
|
|
|
|
|
|
|
Share Data: |
|
|
|
|
|
|
|
|
|
|
|
|
|
|
|
|
Equity per share |
| $ | 14.13 |
| $ | 13.15 |
| $ | 12.53 |
| $ | 12.45 |
| $ | 11.72 |
|
Cash dividends declared per share |
|
| .16 |
|
| .16 |
|
| .16 |
|
| .16 |
|
| .16 |
|
Weighted average common shares outstanding during the period |
|
| 38,532 |
|
| 38,671 |
|
| 38,471 |
|
| 38,295 |
|
| 38,096 |
|
Shares used to compute diluted earnings per share during the period |
|
| 38,688 |
|
| 38,931 |
|
| 38,597 |
|
| 38,507 |
|
| 38,441 |
|
Shares outstanding at end of period |
|
| 34,765 |
|
| 39,286 |
|
| 38,737 |
|
| 38,598 |
|
| 38,177 |
|
Closing market price per share: |
|
|
|
|
|
|
|
|
|
|
|
|
|
|
|
|
High |
|
| 24.45 |
|
| 23.32 |
|
| 20.19 |
|
| 20.25 |
|
| 16.76 |
|
Low |
|
| 13.33 |
|
| 13.06 |
|
| 11.76 |
|
| 13.00 |
|
| 10.60 |
|
End of year |
|
| 16.08 |
|
| 22.61 |
|
| 12.89 |
|
| 20.21 |
|
| 15.53 |
|
Total return to shareholders (g) |
|
| (28.2 | ) % |
| 76.6 | % |
| (35.4 | ) % |
| 31.2 | % |
| 4.6 | % |
|
|
|
|
|
|
|
|
|
|
|
|
|
|
|
|
|
Financial Position: |
|
|
|
|
|
|
|
|
|
|
|
|
|
|
|
|
Total assets |
|
| 784,478 |
|
| 781,787 |
|
| 781,758 |
|
| 769,474 |
|
| 753,025 |
|
Cash and cash equivalents |
|
| 48,217 |
|
| 40,898 |
|
| 23,434 |
|
| 22,994 |
|
| 19,943 |
|
Income taxes recoverable from sale of venture capital portfolio |
|
| — |
|
| — |
|
| — |
|
| — |
|
| 55,000 |
|
Debt |
|
| 82,056 |
|
| 62,520 |
|
| 113,050 |
|
| 103,452 |
|
| 139,629 |
|
Shareholders’ equity (net book value) |
|
| 491,328 |
|
| 516,595 |
|
| 485,362 |
|
| 480,442 |
|
| 447,399 |
|
Equity market capitalization (h) |
|
| 559,021 |
|
| 888,256 |
|
| 499,320 |
|
| 780,066 |
|
| 592,889 |
|
Refer to notes to financial tables on page 16.
|
|
|
|
|
|
|
|
|
|
|
|
|
|
|
|
|
SEGMENT TABLES |
|
|
|
|
|
|
|
|
|
|
|
|
|
|
|
|
Tredegar Corporation and Subsidiaries |
|
|
|
|
|
|
|
|
|
|
|
|
|
|
|
|
|
|
|
|
|
|
|
|
|
|
|
|
|
|
|
|
|
Net Sales (i) |
|
|
|
|
|
|
|
|
|
|
|
|
|
|
|
|
|
|
|
|
|
|
|
|
|
|
|
|
|
|
|
|
|
Segment |
| 2007 |
| 2006 |
| 2005 |
| 2004 |
| 2003 |
| |||||
(In Thousands) |
|
|
|
|
|
|
|
|
|
|
|
|
|
|
|
|
|
|
|
|
|
|
|
|
|
|
|
|
|
|
|
|
|
Film Products |
| $ | 530,972 |
| $ | 511,169 |
| $ | 460,277 |
| $ | 413,257 |
| $ | 365,501 |
|
Aluminum Extrusions |
|
| 371,803 |
|
| 403,790 |
|
| 327,659 |
|
| 277,985 |
|
| 229,246 |
|
AFBS (formerly Therics) |
|
| — |
|
| — |
|
| 252 |
|
| 380 |
|
| — |
|
Total net sales (j) |
|
| 902,775 |
|
| 914,959 |
|
| 788,188 |
|
| 691,622 |
|
| 594,747 |
|
Add back freight |
|
| 19,808 |
|
| 22,602 |
|
| 20,276 |
|
| 18,027 |
|
| 14,330 |
|
Sales as shown in Consolidated Statements of Income |
| $ | 922,583 |
| $ | 937,561 |
| $ | 808,464 |
| $ | 709,649 |
| $ | 609,077 |
|
|
|
|
|
|
|
|
|
|
|
|
|
|
|
|
|
|
Identifiable Assets |
|
|
|
|
|
|
|
|
|
|
|
|
|
|
|
|
|
|
|
|
|
|
|
|
|
|
|
|
|
|
|
|
|
Segment |
|
| 2007 |
|
| 2006 |
|
| 2005 |
|
| 2004 |
|
| 2003 |
|
(In Thousands) |
|
|
|
|
|
|
|
|
|
|
|
|
|
|
|
|
|
|
|
|
|
|
|
|
|
|
|
|
|
|
|
|
|
Film Products |
| $ | 488,035 |
| $ | 498,961 |
| $ | 479,286 |
| $ | 472,810 |
| $ | 422,321 |
|
Aluminum Extrusions |
|
| 115,223 |
|
| 128,967 |
|
| 130,448 |
|
| 126,425 |
|
| 105,753 |
|
AFBS (formerly Therics) |
|
| 2,866 |
|
| 2,420 |
|
| 2,759 |
|
| 8,613 |
|
| 8,917 |
|
Subtotal |
|
| 606,124 |
|
| 630,348 |
|
| 612,493 |
|
| 607,848 |
|
| 536,991 |
|
General corporate |
|
| 74,927 |
|
| 30,113 |
|
| 61,905 |
|
| 54,163 |
|
| 61,508 |
|
Income taxes recoverable from sale of venture capital investment portfolio |
|
| — |
|
| — |
|
| — |
|
| — |
|
| 55,000 |
|
Cash and cash equivalents |
|
| 48,217 |
|
| 40,898 |
|
| 23,434 |
|
| 22,994 |
|
| 19,943 |
|
Identifiable assets from continuing operations |
|
| 729,268 |
|
| 701,359 |
|
| 697,832 |
|
| 685,005 |
|
| 673,442 |
|
Discontinued operations (a): |
|
|
|
|
|
|
|
|
|
|
|
|
|
|
|
|
Aluminum extrusions business in Canada |
|
| 55,210 |
|
| 80,428 |
|
| 83,926 |
|
| 84,469 |
|
| 79,583 |
|
Total |
| $ | 784,478 |
| $ | 781,787 |
| $ | 781,758 |
| $ | 769,474 |
| $ | 753,025 |
|
| ||||||||||||||||
Refer to notes to financial tables on page 16. |
| |||||||||||||||
|
|
|
|
|
|
|
|
|
|
|
|
|
|
|
|
|
SEGMENT TABLES |
|
|
|
|
|
|
|
|
|
|
|
|
|
|
|
|
Tredegar Corporation and Subsidiaries |
|
|
|
|
|
|
|
|
|
|
|
| ||||
|
|
|
|
|
|
|
|
|
|
|
|
|
|
|
|
|
Operating Profit |
|
|
|
|
|
|
|
|
|
|
|
|
|
|
|
|
| ||||||||||||||||
Segment |
| 2007 |
| 2006 |
| 2005 |
| 2004 |
| 2003 |
| |||||
(In Thousands) |
|
|
|
|
|
|
|
|
|
|
|
|
|
|
|
|
|
|
|
|
|
|
|
|
|
|
|
|
|
|
|
|
|
Film Products: |
|
|
|
|
|
|
|
|
|
|
|
|
|
|
|
|
Ongoing operations |
| $ | 59,423 |
| $ | 57,645 |
| $ | 44,946 |
| $ | 43,259 |
| $ | 45,676 |
|
Plant shutdowns, asset impairments and restructurings, net of gains on sale of assets and related income from LIFO inventory liquidations |
|
| (649 | ) (b) |
| 221 | (c) |
| (3,955 | ) (d) |
| (10,438 | ) (e) |
| (5,746 | ) (f) |
Aluminum Extrusions: |
|
|
|
|
|
|
|
|
|
|
|
|
|
|
|
|
Ongoing operations |
|
| 16,516 |
|
| 18,302 |
|
| 17,084 |
|
| 14,526 |
|
| 12,495 |
|
Plant shutdowns, asset impairments and restructurings, net of gains on sale of assets |
|
| (634 | ) (b) |
| (1,434 | ) (c) |
| (993 | ) (d) |
| (146 | ) (e) |
| (644 | ) (f) |
Other |
|
| — |
|
| — |
|
| — |
|
| 7,316 | (e) |
| — |
|
AFBS (formerly Therics): |
|
|
|
|
|
|
|
|
|
|
|
|
|
|
|
|
Ongoing operations |
|
| — |
|
| — |
|
| (3,467 | ) |
| (9,763 | ) |
| (11,651 | ) |
Loss on investment in Therics, LLC |
|
| — |
|
| (25 | ) |
| (145 | ) |
| — |
|
| — |
|
Plant shutdowns, asset impairments and restructurings |
|
| (2,786 | ) (b) |
| (637 | ) (c) |
| (10,318 | ) (d) |
| (2,041 | ) (e) |
| (3,855 | ) (f) |
Unusual items |
|
| — |
|
| — |
|
| — |
|
| — |
|
| (1,067 | ) (f) |
Total |
|
| 71,870 |
|
| 74,072 |
|
| 43,152 |
|
| 42,713 |
|
| 35,208 |
|
Interest income |
|
| 1,212 |
|
| 1,240 |
|
| 586 |
|
| 350 |
|
| 1,183 |
|
Interest expense |
|
| 2,721 |
|
| 5,520 |
|
| 4,573 |
|
| 3,171 |
|
| 6,785 |
|
Gain on sale of corporate assets |
|
| 2,699 |
|
| 56 |
|
| 61 |
|
| 7,560 |
|
| 5,155 |
|
Loss from write-down of investment |
|
| 2,095 | (b) |
| — | (c) |
| 5,000 | (d) |
| — |
|
| — |
|
Stock option-based compensation costs |
|
| 978 |
|
| 970 |
|
| — |
|
| — |
|
| — |
|
Corporate expenses, net |
|
| 10,691 |
|
| 13,770 |
|
| 11,357 | (d) |
| 9,674 |
|
| 8,724 | (f) |
Income from continuing operations before income taxes |
|
| 59,296 |
|
| 55,108 |
|
| 22,869 |
|
| 37,778 |
|
| 26,037 |
|
Income taxes |
|
| 24,366 | (b) |
| 19,791 | (c) |
| 9,497 |
|
| 10,200 |
|
| 9,837 |
|
Income from continuing operations |
|
| 34,930 |
|
| 35,317 |
|
| 13,372 |
|
| 27,578 |
|
| 16,200 |
|
Income (loss) from discontinued operations (a) |
|
| (19,681 | ) |
| 2,884 |
|
| 2,857 |
|
| 1,603 |
|
| (42,551 | ) |
|
|
|
|
|
|
|
|
|
|
|
|
|
|
|
|
|
Net income (loss) |
| $ | 15,249 |
| $ | 38,201 |
| $ | 16,229 |
| $ | 29,181 |
| $ | (26,351 | ) |
| ||||||||||||||||
Refer to notes to financial tables on page 16. |
|
| ||||||||||||||
|
|
|
|
|
|
|
|
|
|
|
|
|
|
|
|
|
SEGMENT TABLES |
|
|
|
|
|
|
|
|
|
|
|
|
|
|
|
|
Tredegar Corporation and Subsidiaries |
|
|
|
|
|
|
|
|
|
|
|
| ||||
|
|
|
|
|
|
|
|
|
|
|
|
|
|
|
|
|
Depreciation and Amortization |
|
|
|
|
|
|
|
|
|
|
|
|
|
|
|
|
| ||||||||||||||||
Segment |
|
| 2007 |
|
| 2006 |
|
| 2005 |
|
| 2004 |
|
| 2003 |
|
(In Thousands) |
|
|
|
|
|
|
|
|
|
|
|
|
|
|
|
|
|
|
|
|
|
|
|
|
|
|
|
|
|
|
|
|
|
Film Products |
| $ | 34,092 |
| $ | 31,847 |
| $ | 26,673 |
| $ | 21,967 |
| $ | 19,828 |
|
Aluminum Extrusions |
|
| 8,472 |
|
| 8,378 |
|
| 7,996 |
|
| 7,474 |
|
| 7,502 |
|
AFBS (formerly Therics) |
|
| — |
|
| — |
|
| 437 |
|
| 1,300 |
|
| 1,641 |
|
Subtotal |
|
| 42,564 |
|
| 40,225 |
|
| 35,106 |
|
| 30,741 |
|
| 28,971 |
|
General corporate |
|
| 91 |
|
| 111 |
|
| 195 |
|
| 241 |
|
| 270 |
|
Total continuing operations |
|
| 42,655 |
|
| 40,336 |
|
| 35,301 |
|
| 30,982 |
|
| 29,241 |
|
Discontinued operations (a): |
|
|
|
|
|
|
|
|
|
|
|
|
|
|
|
|
Aluminum extrusions business in Canada |
|
| 3,386 |
|
| 3,945 |
|
| 3,488 |
|
| 3,440 |
|
| 3,381 |
|
Total |
| $ | 46,041 |
| $ | 44,281 |
| $ | 38,789 |
| $ | 34,422 |
| $ | 32,622 |
|
|
|
|
|
|
|
|
|
|
|
|
|
|
|
|
|
|
Capital Expenditures, Acquisitions and Investments |
|
|
|
|
|
|
|
|
|
|
|
| ||||
| ||||||||||||||||
Segment |
|
| 2007 |
|
| 2006 |
|
| 2005 |
|
| 2004 |
|
| 2003 |
|
(In Thousands) |
|
|
|
|
|
|
|
|
|
|
|
|
|
|
|
|
|
|
|
|
|
|
|
|
|
|
|
|
|
|
|
|
|
Film Products |
| $ | 15,304 |
| $ | 33,168 |
| $ | 50,466 |
| $ | 44,797 |
| $ | 57,203 |
|
Aluminum Extrusions |
|
| 4,391 |
|
| 6,609 |
|
| 5,750 |
|
| 7,263 |
|
| 7,656 |
|
AFBS (formerly Therics) |
|
| — |
|
| — |
|
| 36 |
|
| 275 |
|
| 219 |
|
Subtotal |
|
| 19,695 |
|
| 39,777 |
|
| 56,252 |
|
| 52,335 |
|
| 65,078 |
|
General corporate |
|
| 6 |
|
| 24 |
|
| 73 |
|
| 572 |
|
| 93 |
|
Capital expenditures for continuing operations |
|
| 19,701 |
|
| 39,801 |
|
| 56,325 |
|
| 52,907 |
|
| 65,171 |
|
Discontinued operations (a): |
|
|
|
|
|
|
|
|
|
|
|
|
|
|
|
|
Aluminum extrusions business in Canada |
|
| 942 |
|
| 772 |
|
| 6,218 |
|
| 2,744 |
|
| 637 |
|
Total capital expenditures |
|
| 20,643 |
|
| 40,573 |
|
| 62,543 |
|
| 55,651 |
|
| 65,808 |
|
Acquisitions and other |
|
| — |
|
| — |
|
| — |
|
| 1,420 |
|
| 1,579 |
|
Investments |
|
| 23,513 |
|
| 542 |
|
| 1,095 |
|
| 5,000 |
|
| — |
|
Venture capital investments |
|
| — |
|
| — |
|
| — |
|
| — |
|
| 2,807 |
|
Total |
| $ | 44,156 |
| $ | 41,115 |
| $ | 63,638 |
| $ | 62,071 |
| $ | 70,194 |
|
| ||||||||||||||||
Refer to notes to financial tables on page 16. |
|
|
|
|
|
|
|
|
|
|
|
|
|
|
|
|
NOTES TO FINANCIAL TABLES |
(In Thousands, Except Per-Share Data) |
(a) | On February 12, 2008, we sold our aluminum extrusions business in Canada. All historical results for this business have been reflected as discontinued operations. In 2007, discontinued operations also includes $11,428 in cash income tax benefits from the sale that we expect to realize in 2008. In 2004, discontinued operations include a gain of $2,921 after-taxes primarily related to the reversal of a business and occupancy tax contingency accrual upon favorable resolution. The accrual was originally recorded in connection with our venture capital investment operation. In 2003, we sold substantially all of our venture capital investment portfolio. |
(b) | Plant shutdowns, asset impairments and restructurings for 2007 include a charge of $2,786 related to the estimated loss on the |
(c) | Plant shutdowns, asset impairments and restructurings for 2006 include a net gain of $1,454 associated with the shutdown of the films manufacturing facility in LaGrange, Georgia, including a gain of $2,889 for related LIFO inventory liquidations (included in |
(d) | Plant shutdowns, asset impairments and restructurings for 2005 include charges of $10,318 related to the sale or assignment of substantially all of |
(e) | Plant shutdowns, asset impairments and restructurings for 2004 include |
(f) | Plant shutdowns, asset impairments and restructurings for 2003 include charges of $4,514 for severance costs in connection with restructurings in Film Products ($1,922), Aluminum Extrusions ($256), AFBS ($1,155) and corporate headquarters ($1,181, included in |
(g) |
Total return to shareholders is defined as the change in stock price during the year plus dividends per share, divided by the stock price at the beginning of the year. |
(h) | Equity market capitalization is the closing market price per share for the period multiplied by the shares outstanding at the end of the period. |
(i) | Net sales represent gross sales less freight. Net sales is the measure used by the chief operating decision maker of each segment for purposes of assessing performance. |
(j) | Net sales include sales to P&G totaling $258,602 in 2007, $255,414 in 2006 and $236,554 in |
MANAGEMENT’S DISCUSSION AND ANALYSIS OF FINANCIAL CONDITION AND RESULTS OF OPERATIONS |
Forward-looking and Cautionary Statements
From time to time, we may make statements that may constitute “forward-looking statements” within the meaning of the “safe-harbor” provisions of the Private Securities Litigation Reform Act of 1995. These statements are based on our then current expectations and are subject to a number of risks and uncertainties that could cause actual results to differ materially from those addressed in the forward-looking statements. Some of the risk factors that may cause such a difference are summarized on pages 3-54-6 and are incorporated herein.
Executive Summary
General
Tredegar is a manufacturer of plastic films and aluminum extrusions. Descriptions of our businesses are provided on pages 1-5.
Income from continuing operations was $38.2$34.9 million (98(90 cents per diluted share) in 20062007 compared with $16.2$35.3 million (42(91 cents per diluted share) in 2005.2006. Gains on the sale of assets, investment write-downs and other items and losses related to plant shutdowns, assets impairments and restructurings are described in results of operations beginning on page 20.21. The business segment review begins on page 33.
Film Products
In Film Products, net sales were $531.0 million in 2007, up 3.9% versus $511.2 million in 2006, up 11.1% versus $460.3 million in 2005.2006. Operating profit from ongoing operations was $59.4 million in 2007, up 3.1% compared with $57.6 million in 2006, up 28.3% compared to $44.9 million in 2005. Operating profit from ongoing operations excluding the estimated effects of resin pass-through lag and year-end LIFO adjustments was $53.1 million in 2006, up 8.6% versus $48.9 million in 2005.2006. Volume decreased to 244.3 million pounds in 2007 from 253.5 million pounds in 2006. Volume was down in 2007 compared with 2006 from 261.1 million poundsprimarily due to a decrease in 2005.sales of commodity barrier films and packaging films, partially offset by an increase in sales of elastic materials used in baby diapers and adult incontinence products and apertured materials used as topsheet in feminine hygiene products. Certain commodity barrier films were discontinued in conjunction with the shutdown in the second quarter of 2006 of the plant in LaGrange, Georgia. Net sales increased primarily due to appreciation of the U.S. dollar value of currencies for operations outside of the U.S., higher volume of elastic and apertured materials and improved product mix of surface protection films, partially offset by a decline in volume of commodity barrier films and a decline in volume and prices of certain packaging films. We estimate that the growth in net sales excluding the effects of the pass-through of resin price changes and foreign exchange rate changes was approximately 6%3.5% in 2006. Sales2007.
Operating profit from ongoing operations in Film Products increased in 2007 versus 2006 primarily due to the net changes in sales noted above and appreciation of the U.S. dollar value of currencies for operations outside of the U.S. (the benefit from currency rate changes was approximately $3.0 million), partially offset by an estimated negative impact in 2007 of $2.5 million from the lag in the pass-through of changes in average resin costs and year-end adjustments for LIFO. In 2006, we estimated a favorable impact of $4.5 million from the lag in the pass-through of changes in average resin costs and year-end adjustments for LIFO.
Future operating profit levels in films will depend on our ability to deliver product innovations and cost reductions to support growth in 2006 were driven primarily by increasedthe sales of high-valuehigher value surface protection films elasticand to address competitive pressures facing our personal care and packaging materials and new apertured topsheets, partially offset by lower sales of certain commodity barrier films thatbusinesses.
Capital expenditures in Film Products were dropped in conjunction with the shutdown of the plant in LaGrange, Georgia. The plant was shut down in the first half of 2006 and had sales of commodity barrier films of approximately $20$15.3 million in 2005.
Aluminum Extrusions
On February 12, 2008, we sold our aluminum extrusions business in Canada for an estimated purchase price of $25.5 million to an affiliate of H.I.G. Capital. The final purchase price is subject to increase or decrease to the extent that actual working capital, cash and indebtedness (as defined) as of February 12, 2008 are above or below the estimated amounts used to determine the estimated purchase price. We expect to realize cash income tax benefits in 2008 from the sale of approximately $11.4 million, which we recognized as a deferred income tax asset in our consolidated balance sheet at December 31, 2007. All historical results for the Canadian business have been reflected as discontinued operations; however, cash flows for discontinued operations have not been separately disclosed in the consolidated statements of cash flows (see Note 17 to the notes to financial statements for more information).
The sale of our aluminum extrusions business in Canada, which was suffering from operating losses driven by lower volume and higher conversion costs from appreciation of the Canadian dollar, allows us to focus on our U.S. aluminum extrusions operations where we have more control over costs and profitability.
Net sales from continuing operations in Aluminum Extrusions net sales were $577.3$371.8 million in 2006, up 22.4% versus $471.72007, down 7.9% from $403.8 million in 2005.2006. Operating profit from ongoing U.S. operations was $22.0decreased to $16.5 million in 2006, up 14.0% compared to $19.32007, down 9.8% from $18.3 million in 2005.2006. Volume increasedfrom continuing operations decreased to 259.9155.8 million pounds in 2006, up 5.5% compared to 246.42007, down 15.9% from 185.2 million pounds in 2005. Growth2006.
The decreases in shipmentsnet sales and ongoing operating profit from continuing operations were mainly due to lower volume, partially offset by higher selling prices. Shipments declined in 2006 was driven by demandmost markets, especially extrusions used in hurricane protection products and residential construction. In addition, we began experiencing a softening of markets for extrusions used in commercialnon-residential construction and hurricane protection products, partially offsetin the fourth quarter of 2007. Overall backlog for continuing operations in Aluminum Extrusions at December 31, 2007 was down by a decline in extrusions used in residential construction. The increase in operating profit during 2006 was primarily due to higher volume and selling prices and lower energy costs (energy costs were down $1.1 million), partially offset by appreciation of the Canadian Dollar ($2.8 million) and higher charges for possible uncollectible accounts ($1.4 million).
Capital expenditures for continuing operations in Aluminum Extrusions were $4.4 million in 2007, down from $6.6 million in 2006, were $7.4 million versus $12 million in 2005 and are expectedprojected to be approximately $14$21 million in 2007.2008. In January, we announced plans to spend approximately $24 million over the next 18 months to expand the capacity at our plant in Carthage, Tennessee. Approximately 65% of our sales of aluminum extrusions from our U.S. operations are related to non-residential construction, and this additional capacity will increase our capabilities in this sector. Depreciation expense for continuing operations was $12.3$8.5 million in 2006 compared with $11.52007, up slightly from $8.4 million in 2005,2006, and is projected to be $12.8$8.5 million in 2007.
Other Developments
Net pension expenseincome from continuing operations was $2.6$2.8 million in 2006, an increase2007, a favorable change of $5.3$4.5 million (9(8 cents per share after taxes) from the net pension income of $2.7 millionamounts recognized in 2005 (see Note 11 beginning on page 61 for more information).2006. Most of this unfavorable change relatesthe favorable changes relate to a pension plan that is reflected in “Corporate expenses, net” in the segment operating profit by segment table presented on page 13.14. Net pension income from continuing operations is expected to be $5.5 million in 2008. We contributed $1.1 millionapproximately $167,000 to our pension plans for continuing operations in 20062007 and expect required contributions of $1.1 millionto contribute a similar amount in 2007.
Interest expense by approximately $600,000, $600,000 and $1.5 million, respectively, and the savings plan changes are expected to increase charges for company matching contributions by approximately $700,000. Based on these changes and other factors, we expect pension income of $2.0was $2.7 million in 2007, a favorable change of $4.6decline $2.8 million or 7(5 cents per share after taxes) versus 2006 due to lower average debt outstanding.
The effective tax rate used to compute income taxes from continuing operations was 41.1% in 2007 compared with 35.9% in 2006.
During the first quarter of 2006,2007, we adopted Statementnew accounting standards for maintenance costs and uncertain income tax positions, neither of Financial Accounting Standards No. 123(R),
In addition, we adopted new accounting standards on fair value measurements and the fair value option for financial assets and liabilities, neither of which had an impact on historical results at the date of adoption.
On April 2, 2007, we invested $10 million in Harbinger Capital Partners Special Situations Fund, L.P. (“SFAS 123(R)”Harbinger”), a fund that seeks to achieve superior absolute returns by participating primarily in medium to long-term investments involving distressed/high yield debt securities, special situation equities and private loans and notes. The fund is a highly speculative investment subject to a two-year lock-up and additional limitations on withdrawal. There is no secondary market for interests in the fund. Our investment in Harbinger, which requires all stock-based compensation to be expensed andrepresents less than 2% of Harbinger’s total partnership capital, is accounted for using a fair value-basedunder the cost method. The adoptionAt December 31, 2007, Harbinger reported our capital account value at $23.0 million reflecting $13.0 million of SFAS 123(R) and the granting of stock options in 2006 resulted in pretax charges for stock option-based compensation of $970,000 (2unrealized appreciation ($8.3 million or 22 cents per share after taxes) versus the carrying value in 2006.
On August 31, 2007, we invested $6.5 million in a privately held drug delivery company representing ownership on a fully diluted basis of approximately $5823%. This company is developing and commercializing state of the art drug delivery systems designed to improve patient compliance and outcomes. During 2007, we invested $6.2 million in real estate. At December 31, 2007, the carrying value in Tredegar’s balance sheet of its investments in this real estate and proceedsthe drug delivery company equaled the respective amounts invested.
During 2007 we used a portion of a standing authorization from our board of directors to repurchase approximately 4.8 million shares of our stock at an average price of $16.00 per share. Despite the exercise of stock options of approximately $10 million resulted in a decline insignificant funds used for this program, our net debt (total debt less cash and cash equivalents) at December 31, 2007 increased by only $12.2 million to $33.8 million due to strong cash flow from operations and lower capital expenditures (net debt is not intended to represent debt as defined by generally accepted accounting principles, but is utilized by management in evaluating financial leverage and equity valuation and we believe that investors also may find net debt helpful for the same purposes). On January 7, 2008, we announced that our board of cash)directors approved a share repurchase program whereby we are authorized at our discretion to purchase, in the open market or in privately negotiated transactions, up to 5 million shares of approximately $68 million in 2006.our outstanding common stock. This share repurchase program replaces our previous share repurchase authorization. The authorization has no time limit. Consolidated net capitalization and other credit measures are provided in the financial condition section beginning on page 24.
Critical Accounting Policies
In the ordinary course of business, we make a number of estimates and assumptions relating to the reporting of results of operations and financial position in the preparation of financial statements in conformity with generally accepted accounting principles. Actual results could differ significantly from those estimates under different assumptions and conditions. We believe the following discussion addresses our critical accounting policies. These policies require management to exercise judgments that are often difficult, subjective and complex due to the necessity of estimating the effect of matters that are inherently uncertain.
We regularly assess our long-lived identifiable assets for impairment when events or circumstances indicate that their carrying value may not be recoverable from future cash flows. Any necessary impairment charges are recorded when we do not believe the carrying value of the long-lived asset will be recoverable. We also reassess the useful lives of our long-lived assets based on changes in our business and technologies.
We assess goodwill for impairment when events or circumstances indicate that the carrying value may not be recoverable, or, at a minimum, on an annual basis (December 1 of each year). We have made determinations as to what our reporting units are and what amounts of goodwill and intangible assets should be allocated to those reporting units.
In assessing the recoverability of long-lived identifiable assets and goodwill, we must make assumptions regarding estimated future cash flows, discount rates and other factors to determine if impairment tests are met or the fair value of the respective assets. If these estimates or their related assumptions change in the future, we may be required to record additional impairment charges. Based upon assessments performed, we recorded asset impairment losses for
continuing operations related to long-lived identifiable assets of $594,000 in 2007, $1.2 million in 2006 $8.6and $8.4 million in 2005 and $14.12005. For asset impairments relating to discontinued operations, see Note 17 to the notes to financial statements.
Investment Accounted for Under the Fair Value Method
On August 31, 2007, we invested $6.5 million in 2004.a privately held drug delivery company representing ownership on a fully diluted basis of approximately 23%. This investment is accounted for under the fair value method. We elected the fair value option over the equity method of accounting since our investment objectives are similar to those of venture capitalists, which typically do not have controlling financial interests (venture capital funds use the fair value method to account for their investment portfolios). At December 31, 2007, the fair value of our investment (included in “Other assets and deferred charges” in our consolidated balance sheet) equaled the amount invested.
Statement of Financial Accounting Standards (“SFAS”) No. 157, Fair Value Measurements, requires disclosure of the level within the fair value hierarchy in which fair value measurements in their entirety fall, segregating fair value measurements using quoted prices in active markets for identical assets or liabilities (Level 1), significant other observable inputs (Level 2), and significant unobservable inputs (Level 3). On the date of our investment (August 31, 2007), we believe that the amount we paid for our ownership interest and liquidation preferences was based on Level 2 inputs, including investments by other investors. Subsequent to August 31, 2007, and until the next round of financing, we believe fair value estimates drop to Level 3 inputs since there is no secondary market for our ownership interest. In addition, the company currently has no product sales. Accordingly, after the latest financing and until the next round of financing or other significant financial transaction, value estimates will primarily be based on assumptions relating to meeting product development and commercialization milestones, cash flow projections (projections of sales, costs, expenses, capital expenditures and working capital investment) and discounting of these factors for the high degree of risk. As a result, an increase in our estimate of the fair value of our ownership interest is unlikely unless a significant new round of financing, merger or initial public offering indicates a higher value. However, if the company does not meet its development and commercialization milestones and there are indications that the amount or timing of its projected cash flows or related risks are unfavorable versus plans as of August 31, 2007, or a new round of financing or other significant financial transaction indicates a lower value, then our estimate of the fair value of our ownership interest in the company is likely to decline.
Pension Benefits
We have noncontributory and contributory defined benefit (pension) plans in our continuing operations that have significant net pension income developed from actuarial valuations. Inherent in these valuations are key assumptions including discount rates, expected return on plan assets and rate of future compensation increases. We are required to consider current market conditions, including changes in interest rates and plan asset investment returns, in determining these assumptions. Actuarial assumptions may differ materially from actual results due to changing market and economic conditions, higher or lower withdrawal rates or longer or shorter life spans of participants. These differences may result in a significant impact to the amount of net pension income recorded in future periods.
The discount rate is used to determine the present value of future payments. The discount rate is the single rate that, when applied to expected benefit payments, provides a present value equal to the present value of expected benefit payments determined by using the AA-rated bond yield curve. In general, our liability increases as the discount rate decreases and vice versa. Our weighted average discount rate for continuing operations was 5.70%6.25% at the end of 2007, 5.75% at the end of 2006 5.70%and 5.75% at the end of 2005, and 6.00% at the end of 2004, with changes between periods due to changes in market interest rates. The compensation increase assumption affects the estimate of future payments, and was 4% at the end of 2007, 2006 2005 and 2004.2005. A lower expected return on plan assets increases the amount of expense and vice versa. Decreases in the level of actual plan assets will also serve to increase the amount of pension expense. During 2006, 2005, 2004 andSince 2003, the value of our plan assets relating to continuing operations has increased due to improved general market conditions after declining in 2002, 2001 and 2000.from 2000 to 2002. Our expected long-term return on plan assets relating to continuing operations has been 8.4%8.5% since 2004 based on market and economic conditions and asset mix (our expected return was 8.6%8.75% in 2003 and 9% in 2002 and prior years). See page 6564 for more information on expected long-term return on plan assets and asset mix.
See the executive summary beginning on page 17 for further discussion regarding the financial impact of our pension plans.
Income Taxes
On a quarterly basis, we review our judgments regarding incomeuncertain tax contingency accrualspositions and the likelihood that the benefits of a deferred tax asset will be realized. During the periodic reviews, we must consider a variety of factors, including the nature and amount of the tax income and expense items, the current tax statutes, the current status of audits performed by tax authorities and the projected future earnings. We believe the realization of our net deferred tax assets is reasonably assured and that our income tax contingency accruals are adequate as measured under existing accounting standards. As circumstances change, ourwe reflect in earnings any adjustments to unrecognized benefits for uncertain tax positions and valuation allowances for deferred tax assets,assets.
For financial reporting purposes, we had unrecognized tax benefits on uncertain tax positions of $3.3 million as of December 31, 2007. Included in this amount were $2.3 million for tax positions for which ultimate deductibility is highly certain but for which the timing of deductibility is uncertain. Because of the impact of deferred income tax contingency accrualsaccounting, other than interest, penalties and deductions not related to timing, a longer deductibility period would not affect the total income tax expense or the annual effective tax rate shown for financial reporting purposes, but would accelerate payments to the taxing authority. Tax payments resulting from the successful challenge by the taxing authority for accelerated deductions taken by us would possibly result in the payment of interest and penalties. Accordingly, we also accrue for possible interest and penalties on uncertain tax positions. The balance of accrued interest and penalties on deductions taken relating to uncertain tax positions was approximately $1.2 million at December 31, 2007 ($759,000 net earningsof corresponding federal and state income tax benefits). Accruals for possible interest and penalties on uncertain tax positions are adjusted accordinglyreflected in income tax expense for financial reporting purposes.
We anticipate that period.
Tredegar and its subsidiaries file income tax returns in U.S., state and foreign jurisdictions. Tredegar is no longer subject to U.S. federal income tax examinations by tax authorities for years before 2001. With few exceptions, Tredegar and its subsidiaries are no longer subject to state or non-U.S. income tax examinations by tax authorities for years before 2004.
As of December 31, 2007, we had valuation allowances relating to deferred tax assets of $4.0 million. For more information on deferred income tax assets and liabilities, see Note 14 of the notes to financial statements.
In September 2006,December 2007, the Financial Accounting Standards Board (“FASB”) issued FASB Staff Position ("FSP")SFAS No. AUG AIR-1, Accounting141(R), Business Combinations, and SFAS No. 160, Noncontrolling Interests in Consolidated Financial Statements. SFAS No. 141 is applied prospectively to business combinations for Planned Major Maintenance Activities. The FSPwhich the acquisition date is effective foron or after the beginning of the first fiscal yearannual reporting period beginning on or after December 15, 2006.2008. The FSP eliminates the accrual method ofnew accounting standard for major maintenance activities, but continuesnoncontrolling interests (sometimes referred to permit the use of the direct expensing, built-in overhaulas minority interests) applies to all fiscal years and deferral methods. The FSP also continues to require accruals or deferrals for interim periods of annual costs that clearly benefit twobeginning on or more interim periods. We are evaluating the FSP and have not determined whether or not it will have a material effect on our financial position or results of operations.
Results of Continuing Operations
2007 versus 2006
Revenues. Overall, sales in 2007 decreased by 1.6% compared with 2006, primarily due to a decline in sales in Aluminum Extrusions. For more information on net sales and volume, see the executive summary beginning on page 17.
Operating Costs and Expenses. Consolidated gross profit (sales minus cost of goods sold and freight) as a percentage of sales was 15.3% in 2007 and 14.5% in 2006. The gross profit margin increased in Film Products but decreased in
Aluminum Extrusions primarily because of the changes in sales and volume. In addition, gross profit improvement in Film Products was partially offset by an estimated negative impact in 2007 of $2.5 million from the lag in the pass-through of changes in average resin costs and year-end adjustments for LIFO. In 2006, we estimated a favorable impact of $4.5 million from the lag in the pass-through of changes in average resin costs and year-end adjustments for LIFO.
As a percentage of sales, selling, general and administrative and R&D expenses were 8.3% in 2007, up from 7.7% in 2006. The increase is primarily due to higher costs in Film Products, including costs associated with a new information system and a reorganization that resulted in the hiring of additional personnel.
Losses associated with plant shutdowns, asset impairments and restructurings in 2007 totaled $4.1 million ($2.8 million after taxes) and included:
• | A fourth quarter charge of $1.2 million ($780,000 after taxes), a third quarter charge of $1.2 million ($793,000 after taxes) and a first quarter charge of $366,000 ($238,000 after taxes) related to the estimated loss on the sublease of a portion of the AFBS (formerly Therics) facility in Princeton, New Jersey; |
• | A fourth quarter charge of $256,000 ($256,000 after taxes) and a first quarter charge of $338,000 ($284,000 after taxes) for asset impairments in Film Products; |
• | A third quarter charge of $493,000 ($309,000 after taxes) and a second quarter charge of $99,000 ($62,000 after taxes) for severance and other employee-related costs in Aluminum Extrusions; |
• | A second quarter charge of $26,000 ($16,000 after taxes) and a first quarter charge of $29,000 ($17,000 after taxes) for costs related to the shutdown of the films manufacturing facility in LaGrange, Georgia; and |
• | A third quarter charge of $42,000 ($26,000 after taxes) related to expected future environmental costs at the aluminum extrusions facility in Newnan, Georgia (included in “Cost of goods sold” in the consolidated statements of income). |
Results in 2007 include a fourth-quarter gain of $2.7 million ($1.7 million after taxes) on the sale of corporate real estate (proceeds of $3.8 million) and a third-quarter loss from the write-down of an investment of $2.1 million ($1.3 million after taxes). The pretax amounts for both of these items are included in “Other income (expense), net” in the consolidated statements of income and separately shown in the segment operating profit table on page 14. Income taxes in 2007 include the recognition of a valuation allowance against deferred tax assets of $1.1 million in the third quarter for expected limitations on the utilization of certain assumed capital losses.
For more information on costs and expenses, see the executive summary beginning on page 17.
Interest Income and Expense. Interest income, which is included in “Other income (expense), net” in the consolidated statements of income, was $1.2 million in 2007 and $1.2 million in 2006. Our policy permits investment of excess cash in marketable securities that have the highest credit ratings and maturities of less than one year with the primary objectives being safety of principal and liquidity.
Interest expense decreased to $2.7 million in 2007, a decline of $2.8 million versus 2006 due to lower average debt outstanding. Average debt outstanding and interest rates were as follows:
|
|
|
|
|
|
|
|
(In Millions) |
| 2007 |
| 2006 |
| ||
Floating-rate debt with interest charged on a rollover |
|
|
|
|
|
|
|
Average outstanding debt balance |
| $ | 41.5 |
| $ | 91.0 |
|
Average interest rate |
|
| 6.0 | % |
| 5.9 | % |
Fixed-rate and other debt: |
|
|
|
|
|
|
|
Average outstanding debt balance |
| $ | 2.2 |
| $ | 4.4 |
|
Average interest rate |
|
| 3.8 | % |
| 6.5 | % |
Total debt: |
|
|
|
|
|
|
|
Average outstanding debt balance |
| $ | 43.7 |
| $ | 95.4 |
|
Average interest rate |
|
| 5.9 | % |
| 5.9 | % |
Income Taxes. The effective tax rate increased to 41.1% in 2007 compared with 35.9% in 2006 mainly due to a valuation allowance for possible deferred tax benefits on capital loss carry-forwards and lower income tax benefits expected for the Extraterritorial Income Exclusion and Domestic Production Activities Deduction and the research and development (“R&D”) tax credit. For more information on the variances in our effective tax rate between years, see Note 14 of the notes to financial statements.
2006 versus 2005
Revenues.Sales in 2006 increased by 16.7%16.0% compared with 2005. Net sales (sales less freight) increased 11.1% in Film Products primarily due to growth in higher value-added products, including surface protection, elastic and apertured materials, and higher selling prices, which were driven by higher raw material costs. Net sales increased 22.4%23.2% in Aluminum Extrusions due to higher volume (up 5.5%4.6%) and selling prices. For more information on net sales and volume, see the executive summarybusiness segment review beginning on page 17.33.
Operating Costs and Expenses. Gross profit (sales minus cost of goods sold and freight) as a percentage of sales increased to 12.9%14.5% in 2006 from 12.7%14.3% in 2005. At Film Products, a higher gross profit margin was driven primarily by growth in higher value-added products, including surface protection, elastic and apertured materials, partially offset by the effects of higher average selling prices to cover higher average resin costs. Margins in Film Products also improved in 2006 versus 2005 from a favorable lag in the pass-through to customers of changes in resin costs and income from LIFO inventory liquidations of approximately $7.4 million in 2006 (including $2.9 million of income shown in “Cost of goods sold” in the consolidated statements of income from LIFO liquidations related to the shutdown of the facility in LaGrange, Georgia) compared with an unfavorable net lag and LIFO adjustment in 2005 of approximately $4.0 million. At Aluminum Extrusions, a lower gross profit margin was primarily due to the effects of higher selling prices to cover higher aluminum costs, and appreciation of the Canadian Dollar, partially offset by higher volume and selling prices and lower energy costs.
As a percentage of sales, selling, general and administrative (“SG&A”)and R&D expenses decreased to 6.1%7.7% in 2006 compared with 6.8%8.7% in 2005 due primarily to higher sales and the divestiture of substantially all of our interest in AFBS, Inc. (formerly known as Therics, Inc.) at the end of the second quarter of 2005. For more information on this divestiture, see the business segment review beginning on page 33.
Losses associated with plant shutdowns, asset impairments and restructurings, net of gains on sale of related assets and related income from LIFO inventory liquidations, in 2006 totaled $1.9 million ($1.4 million after taxes) and included:
• | A fourth quarter net gain of $14,000 ($8,000 after taxes), a third-quarter net gain of $1 million ($615,000 after taxes), a second-quarter net gain of $822,000 ($494,000 after taxes) and a first-quarter pretax charge of $404,000 ($243,000 after taxes) associated with the shutdown of the films manufacturing facility in LaGrange, Georgia, including a pretax gain of $2.9 million for related LIFO inventory liquidations (included in |
• | A third-quarter charge of $920,000 ($566,000 after taxes) related to expected future environmental costs at the aluminum extrusions facility in Newnan, Georgia (included in |
• | A fourth quarter charge of $143,000 ($93,000 after taxes) and a third quarter charge of $494,000 ($321,000 after taxes) related to the estimated loss on the sub-lease of a portion of the AFBS facility in Princeton, New Jersey; |
• | Second-quarter charges of $459,000 ($289,000 after taxes) and first-quarter charges of $268,000 ($170,000 after taxes) for severance and other employee-related costs in connection with restructurings in Aluminum Extrusions ($514,000) and Film Products ($213,000); and |
• | First-quarter charges of $1 million ($876,000 after taxes) for asset impairments relating to machinery & equipment in Film Products. |
In 2006, a pretax gain on the sale of public equity securities of $56,000 (proceeds also of $56,000) is
included in “Other income (expense), net” in the consolidated statements of income and “Gain on the sale of corporate assets” in the segment operating profit table on page 13.14. Income taxes in 2006 include a reversal of a valuation allowance of $577,000 for deferred tax assets associated with capital loss carry-forwards recorded with the write-down of the investment in Novalux. Outside appraisal of the value of corporate assets, primarily real estate, performed in December 2006, indicates that realization of related deferred tax assets is more likely than not.
For more information on costs and expenses, see the executive summary beginning on page 17.
Interest Income and Expense.Interest income, which is included in “Other income (expense), net” in the consolidated statements of income, was $1.2 million in 2006 and $586,000 in 2005. Interest income was up primarily due to a higher average yield earned on cash equivalents. Our policy permits investment of excess cash in marketable securities that have the highest credit ratings and maturities of less than one year with the primary objectives being safety of principal and liquidity.
Interest expense increased to $5.5 million in 2006 compared with $4.6 million in 2005. Average debt outstanding and interest rates were as follows:
|
|
|
|
|
|
|
|
(In Millions) |
| 2006 |
| 2005 |
| ||
Floating-rate debt with interest charged on a rollover basis at one-month LIBOR plus a credit spread: |
|
|
|
|
|
|
|
Average outstanding debt balance |
| $ | 91.0 |
| $ | 110.0 |
|
Average interest rate |
|
| 5.9 | % |
| 4.5 | % |
Fixed-rate and other debt: |
|
|
|
|
|
|
|
Average outstanding debt balance |
| $ | 4.4 |
| $ | 5.9 |
|
Average interest rate |
|
| 6.5 | % |
| 5.5 | % |
Total debt: |
|
|
|
|
|
|
|
Average outstanding debt balance |
| $ | 95.4 |
| $ | 115.9 |
|
Average interest rate |
|
| 5.9 | % |
| 4.6 | % |
Income Taxes.The effective tax rate declined to 35.1%35.9% in 2006 compared with 38.1%41.5% in 2005 due to the numerous variances between years that are shown in the effective tax rate reconciliation provided in Note 14 of the notes to financial statements.
| (In Millions) | 2005 | 2004 | |||||
| Floating-rate debt with interest charged on a rollover basis at one-month LIBOR plus a credit spread: | |||||||
| Average outstanding debt balance | $ | 110.0 | $ | 105.2 | |||
| Average interest rate | 4.5 | % | 2.7 | % | |||
| Fixed-rate and other debt: | |||||||
| Average outstanding debt balance | $ | 5.9 | $ | 5.6 | |||
| Average interest rate | 5.5 | % | 6.0 | % | |||
| Total debt: | |||||||
| Average outstanding debt balance | $ | 115.9 | $ | 110.8 | |||
| Average interest rate | 4.6 | % | 2.8 | % | |||
Assets and Liabilities
Changes in operating assets and liabilities from continuing operations from December 31, 20052006 to December 31, 20062007 are summarized below:
• | Accounts receivable | |
– | Accounts receivable in Film Products increased by | |
– | Accounts receivable for continuing operations in Aluminum Extrusions decreased by |
• | Inventories | |
��� | Inventories in Film Products | |
– | Inventories for continuing operations of | |
• | Net property, plant and equipment was | |
• | Accounts payable increased by | |
– | Accounts payable in Film Products increased by $2.9 million due mainly to higher sales. Accounts payable days were 30 at December 31, 2007 compared with 29 at December 31, 2006. | |
– | Accounts payable for continuing operations in | |
– | Accounts payable |
• | Accrued expenses | |
Net capitalization and indebtedness as defined under our revolving credit agreement as of December 31, 2006 are2007 were as follows:
| Net Capitalization and Indebtedness as of Dec. 31, 2006 | ||||
| (In Thousands) | ||||
| Net capitalization: | ||||
| Cash and cash equivalents | $ | 40,898 | ||
| Debt: | ||||
$300 million revolving credit agreement maturing December 15, 2010 | 60,000 | |||
| Other debt | 2,520 | |||
| Total debt | 62,520 | |||
| Debt net of cash and cash equivalents | 21,622 | |||
| Shareholders' equity | 516,595 | |||
| Net capitalization | $ | 538,217 | ||
| Indebtedness as defined in revolving credit agreement: | ||||
| Total debt | $ | 62,520 | ||
| Face value of letters of credit | 5,907 | |||
| Liabilities relating to derivative financial instruments | 116 | |||
| Indebtedness | $ | 68,543 | ||
|
|
|
|
|
Net Capitalization and Indebtedness as of Dec. 31, 2007 |
| |||
(In Thousands) |
| |||
Net capitalization: |
|
|
|
|
Cash and cash equivalents |
| $ | 48,217 |
|
Debt: |
|
|
|
|
$300 million revolving credit agreement maturing |
|
| 80,000 |
|
Other debt |
|
| 2,056 |
|
|
|
| ||
Total debt |
|
| 82,056 |
|
|
|
| ||
Debt net of cash and cash equivalents |
|
| 33,839 |
|
Shareholders’ equity |
|
| 491,328 |
|
|
|
| ||
Net capitalization |
| $ | 525,167 |
|
|
|
| ||
Indebtedness as defined in revolving credit agreement: |
|
|
|
|
Total debt |
| $ | 82,056 |
|
Face value of letters of credit |
|
| 5,957 |
|
Liabilities relating to derivative financial instruments |
|
| 1,815 |
|
|
|
| ||
Indebtedness |
| $ | 89,828 |
|
Under the revolving credit agreement, borrowings are permitted up to $300 million, and $239$219 million was available to borrow at December 31, 2006.2007. The credit spread and commitment fees charged on the unused amount under the revolving credit agreement at various indebtedness-to-adjusted EBITDA levels are as follows:
|
|
|
|
|
|
|
|
Pricing Under Revolving Credit Agreement (Basis Points) |
| ||||||
Indebtedness-to-Adjusted |
| Credit Spread |
| Commitment |
| ||
> 2.50x but <= 3x |
|
| 125 |
|
| 25 |
|
> 1.75x but <= 2.50x |
|
| 100 |
|
| 20 |
|
> 1x but <=1.75x |
|
| 87.5 |
|
| 17.5 |
|
<= 1x |
|
| 75 |
|
| 15 |
|
At December 31, 2006,2007, the interest rate on debt under the revolving credit agreement was priced at one-month LIBOR plus the applicable credit spread of 75 basis points.
The computations of adjusted EBITDA, adjusted EBIT, the leverage ratio and interest coverage ratio as defined in the credit agreement are presented below along with the related most restrictive covenants. Adjusted EBITDA and adjusted EBIT as defined in the credit agreement are not intended to represent cash flow from operations as defined by GAAP and should not be considered as either an alternative to net income or to cash flow.
| Computations of Adjusted EBITDA, Adjusted EBIT, Leverage Ratio and | ||||
| Interest Coverage Ratio as Defined in Credit Agreement Along with Related Most | ||||
| Restrictive Covenants | ||||
| For the Year Ended December 31, 2006 (In Thousands) | ||||
| Computations of adjusted EBITDA and adjusted EBIT as defined in | ||||
| Credit Agreement: | ||||
| Net income | $ | 38,201 | ||
| Plus: | ||||
| After-tax losses related to discontinued operations | - | |||
| Total income tax expense for continuing operations | 20,636 | |||
| Interest expense | 5,520 | |||
| Charges related to stock option grants and awards accounted for under the fair value-based method | 970 | |||
| Losses related to the application of the equity method of accounting | 25 | |||
| Depreciation and amortization expense for continuing operations | 44,281 | |||
| All non-cash losses and expenses, plus cash losses and expenses not to exceed $10,000, for continuing operations that are classified as unusual, extraordinary or which are related to plant shutdowns, asset impairments and/or restructurings (cash-related of $3,850) | 5,000 | |||
| Minus: | ||||
| After-tax income related to discontinued operations | - | |||
| Total income tax benefits for continuing operations | - | |||
| Interest income | (1,240 | ) | ||
| All non-cash gains and income, plus cash gains and income not to exceed $10,000, for continuing operations that are classified as unusual, extraordinary or which are related to plant shutdowns, asset impairments and/or restructurings (cash-related of $317) | (3,206 | ) | ||
| Plus or minus, as applicable, pro forma EBITDA adjustments associated with acquisitions and asset dispositions | - | |||
| Adjusted EBITDA as defined in Credit Agreement | 110,187 | |||
| Less: Depreciation and amortization expense for continuing operations (including pro forma for acquisitions and asset dispositions) | (44,281 | ) | ||
| Adjusted EBIT as defined in Credit Agreement | $ | 65,906 | ||
| Indebtedness: | ||||
| Total debt | $ | 62,520 | ||
| Face value of letters of credit | 5,907 | |||
| Indebtedness | $ | 68,427 | ||
| Shareholders' equity at December 31, 2006 | $ | 516,595 | ||
| Computations of leverage and interest coverage ratios as defined in | ||||
| Credit Agreement: | ||||
| Leverage ratio (indebtedness-to-adjusted EBITDA) | .62x | |||
| Interest coverage ratio (adjusted EBIT-to-interest expense) | 11.94x | |||
| Most restrictive covenants as defined in Credit Agreement: | ||||
| Maximum permitted aggregate amount of dividends that can be paid by Tredegar during the term of the Credit Agreement ($100,000 plus 50% of net income generated after October 1, 2005) | $ | 119,546 | ||
| Minimum adjusted shareholders' equity permitted ($351,918 plus 50% of net income generated after October 1, 2005) | $ | 371,464 | ||
| Maximum leverage ratio permitted: | ||||
| Ongoing | 3.00x | |||
| Pro forma for acquisitions | 2.50x | |||
| Minimum interest coverage ratio permitted | 2.50x | |||
|
|
|
|
|
Computations of Adjusted EBITDA, Adjusted EBIT, Leverage Ratio and |
| |||
Interest Coverage Ratio as Defined in Revolving Credit Agreement Along with Related Most |
| |||
Restrictive Covenants |
| |||
As of and For the Year Ended December 31, 2007 (In Thousands) |
| |||
Computations of adjusted EBITDA and adjusted EBIT as defined in revolving credit agreement for the twelve months ended December 31, 2007: |
|
|
|
|
Net income |
| $ | 15,249 |
|
Plus: |
|
|
|
|
After-tax losses related to discontinued operations |
|
| 19,681 |
|
Total income tax expense for continuing operations |
|
| 24,366 |
|
Interest expense |
|
| 2,721 |
|
Charges related to stock option grants and awards accounted for under the fair value-based method |
|
| 978 |
|
Losses related to the application of the equity method of accounting |
|
| — |
|
Depreciation and amortization expense for continuing operations |
|
| 42,655 |
|
All non-cash losses and expenses, plus cash losses and expenses not to exceed $10,000, for continuing operations that are classified as unusual, extraordinary or which are related to plant shutdowns, asset impairments and/or restructurings (cash-related of $3,475) |
|
| 6,164 |
|
Minus: |
|
|
|
|
After-tax income related to discontinued operations |
|
| — |
|
Total income tax benefits for continuing operations |
|
| — |
|
Interest income |
|
| (1,212 | ) |
All non-cash gains and income, plus cash gains and income not to exceed $10,000, for continuing operations that are classified as unusual, extraordinary or which are related to plant shutdowns, asset impairments and/or restructurings (all cash-related) |
|
| (2,699 | ) |
Plus or minus, as applicable, pro forma EBITDA adjustments associated with acquisitions and asset dispositions |
|
| — |
|
|
|
| ||
Adjusted EBITDA as defined in revolving credit agreement |
|
| 107,903 |
|
Less: Depreciation and amortization expense for continuing operations (including pro forma for acquisitions and asset dispositions) |
|
| (42,655 | ) |
|
|
| ||
Adjusted EBIT as defined in revolving credit agreement |
| $ | 65,248 |
|
|
|
| ||
Shareholders’ equity at December 31, 2007 |
| $ | 491,328 |
|
Computations of leverage and interest coverage ratios as defined in revolving credit agreement: |
|
|
|
|
Leverage ratio (indebtedness-to-adjusted EBITDA) |
|
| .83 | x |
Interest coverage ratio (adjusted EBIT-to-interest expense) |
|
| 23.98 | x |
Most restrictive covenants as defined in revolving credit agreement: |
|
|
|
|
Maximum permitted aggregate amount of dividends that can be paid by Tredegar during the term of the revolving credit agreement ($100,000 plus 50% of net income generated after October 1, 2005) |
| $ | 127,170 |
|
Minimum adjusted shareholders’ equity permitted ($351,918 plus 50% of net income generated after October 1, 2005) |
| $ | 388,276 |
|
Maximum leverage ratio permitted: |
|
|
|
|
Ongoing |
|
| 3.00 | x |
Pro forma for acquisitions |
|
| 2.50 | x |
Minimum interest coverage ratio permitted |
|
| 2.50 | x |
Noncompliance with any one or more of the debt covenants may have a material adverse effect on financial condition or liquidity in the event such noncompliance cannot be cured or should we be unable to obtain a waiver from the lenders. Renegotiation of the covenant(s) through an amendment to the credit agreement may effectively cure the noncompliance, but may have an effect on financial condition or liquidity depending upon how the covenant is renegotiated.
We are obligated to make future payments under various contracts as set forth below:
| Payments Due by Period | ||||||||||||||||||||||
| (In Millions) | 2007 | 2008 | 2009 | 2010 | 2011 | Remainder | Total | |||||||||||||||
| Debt | $ | .7 | $ | .5 | $ | .5 | $ | 60.4 | $ | .2 | $ | .2 | $ | 62.5 | ||||||||
| Operating leases: | ||||||||||||||||||||||
| AFBS (formerly Therics) | 1.6 | 1.6 | 1.6 | 1.6 | .4 | - | 6.8 | |||||||||||||||
| Other | 2.1 | 1.6 | .5 | .5 | .3 | .8 | 5.8 | |||||||||||||||
| Capital expenditure commitments * | 6.0 | - | - | - | - | - | 6.0 | |||||||||||||||
| Total | $ | 10.4 | $ | 3.7 | $ | 2.6 | $ | 62.5 | $ | .9 | $ | 1.0 | $ | 81.1 | ||||||||
| *Represents contractual obligations for plant construction and purchases of real property and equipment. See Note 13 on page 66. | ||||||||||||||||||||||
|
|
|
|
|
|
|
|
|
|
|
|
|
|
|
|
|
|
|
|
|
|
|
|
|
| ||||||||||||||||||||||||
|
| Payments Due by Period |
| |||||||||||||||||||||
| ||||||||||||||||||||||||
(In Millions) |
| 2008 |
| 2009 |
| 2010 |
| 2011 |
| 2012 |
| Remainder |
| Total |
| |||||||||
| ||||||||||||||||||||||||
Debt |
| $ | .5 |
| $ | .6 |
| $ | 80.5 |
| $ | .3 |
| $ | .1 |
|
| $ | .1 |
|
| $ | 82.1 |
|
Operating leases: |
|
|
|
|
|
|
|
|
|
|
|
|
|
|
|
|
|
|
|
|
|
|
|
|
AFBS (formerly Therics) |
|
| 1.6 |
|
| 1.6 |
|
| 1.6 |
|
| .4 |
|
| — |
|
|
| — |
|
|
| 5.2 |
|
Other |
|
| .9 |
|
| 1.3 |
|
| 1.4 |
|
| 1.3 |
|
| 1.3 |
|
|
| .6 |
|
|
| 6.8 |
|
Capital expenditure commitments (1) |
|
| 3.0 |
|
| — |
|
| — |
|
| — |
|
| — |
|
|
| — |
|
|
| 3.0 |
|
Estimated obligations relating to uncertain tax positions (2) |
|
| 2.2 |
|
| — |
|
| — |
|
| — |
|
| — |
|
|
| 2.3 |
|
|
| 4.5 |
|
| ||||||||||||||||||||||||
Total |
| $ | 8.2 |
| $ | 3.5 |
| $ | 83.5 |
| $ | 2.0 |
| $ | 1.4 |
|
| $ | 3.0 |
|
| $ | 101.6 |
|
| ||||||||||||||||||||||||
(1) | Represents contractual obligations for plant construction and purchases of real property and equipment. See Note 13 on page 65. |
(2) | Amounts for which reasonable estimates about the timing of payments cannot be made are included in the remainder column. |
We believe that existing borrowing availability, our current cash balances and our cash flow from operations will be sufficient to satisfy our working capital, capital expenditure and dividend requirements for the foreseeable future.
From time to time, we enter into transactions with third parties in connection with the sale of assets or businesses in which we agree to indemnify the buyers or third parties involved in the sale for certain liabilities or risks related to the assets or business. Also, in the ordinary course of our business, we may enter into agreements with third parties for the sale of goods or services that may contain indemnification provisions. In the event that an indemnification claim is asserted, liability for indemnification would be subject to an assessment of the underlying facts and circumstances under the terms of the applicable agreement. Further, any indemnification payments may be limited or barred by a monetary cap, a time limitation, or a deductible or basket. For these reasons, we are unable to estimate the maximum potential amount of the potential future liability under the indemnity provisions of these agreements. We do, however, accrue for losses for any known contingent liability, including those that may arise from indemnification provisions, when future payment is probable. We disclose contingent liabilities if the probability of loss is reasonably possible and significant.
Shareholders’ Equity
At December 31, 2006,2007, we had 34,765,450 shares of common stock outstanding and a total market capitalization of $559.0 million, compared with 39,286,079 shares of common stock outstanding and a total market capitalization of $888.3 million compared with 38,737,016 shares of common stock outstanding and a total market capitalization of $499.3 million at December 31, 2005.
During 2006 2005 and 2004,2005 we did not purchase any shares of our common stock in the open market. Under aSee the issuer purchases of equity securities section of Item 5 on page 8 regarding purchases of our common stock in 2007 and our standing authorization from our board of directors, we may purchase up to 5 million shares in the open market or in privately negotiated transactions at prices management deems appropriate.
Cash Flows
The discussion in this section supplements the information presented in the consolidated statements of cash flows on page 44.
Cash provided by operating activities was $95.6 million in 2007 compared with $104.6 million in 2006. The decrease is due primarily to higher income tax payments (income tax payments were approximately $17.0 million
in 2007 compared with $7.8 million in 2006) and a decline in operating results in Aluminum Extrusions (mainly operations in Canada divested on February 12, 2008), partially offset by lower incremental working capital investment (see assets and liabilities section on page 25 for discussion of working capital trends and Note 17 to the notes to financial statements for discussion of discontinued aluminum extrusion operations in Canada).
Cash used in investing activities declined to $36.3 million in 2007 compared with $40.6 million in 2006 due to lower capital expenditures and proceeds from property disposals and reimbursements from a customer for purchases of equipment, partially offset by higher investments. Capital expenditures in 2007 primarily included the normal replacement of machinery and equipment and continued expansion of capacity for surface protection films and elastic materials. See the executive summary beginning on page 17 and the business segment review beginning on page 33 for more information on capital expenditures.
Net cash flow used in financing activities was $54.1 million in 2007 and included the use of cash generated from operating activities in excess of investing activities, additional borrowings under our revolving credit facility and proceeds from the exercise of stock options to pay dividends and purchase Tredegar common stock.
Cash provided by operating activities was $104.6 million in 2006 compared with $53.7 million in 2005. The increase is due primarily to improved operating results, higher deferred income taxes and lower incremental working capital investment (see assets and liabilities section on page 24 for discussion of working capital trends).
Cash used in investing activities was $40.6 million in 2006 compared with $55.0 million in 2005 due primarily to lower capital expenditures. Capital expenditures in 2006 in Film Products of $33.2 million (down from $50.5 million in 2005 and $1.5 million in excess of 2006 depreciation) primarily included the continued expansion of capacity for surface protection films and elastic materials, a new information system and normal replacement of machinery and equipment. Capital expenditures in Aluminum Extrusions were $7.4 million in 2006 compared to $12 million in 2005 and depreciation in 2006 of $12.3 million. See the executive summary beginning on page 17 and the business segment review beginning on page 33 for more information on capital expenditures.
Net cash flow used in financing activities was $47.0 million in 2006 and included the use of cash generated from operating activities in excess of investing activities to pay dividends and repay amounts outstanding under our revolving credit facility. In addition, financing activities in 2006 included proceeds from the exercise of stock options of $9.7 million, including $8.5 million in the fourth quarter of 2006 due to an increase in the company’sour stock price and certain stock option expiration dates in early 2007.
Cash provided by operating activities was $53.7 million in 2005 compared with $93.8 million in 2004. The decrease is due primarily to the income tax refund received in 2004 related to the sale in 2003 of our venture capital portfolio, partially offset by lower working capital investment in 2005 compared with 2004.
Cash used in investing activities was $55.0 million in 2005 compared with $52.2 million in 2004. The change is primarily attributable to higher capital expenditures (up $6.9 million) and lower proceeds from the sale of assets and property disposals (down $2.2 million), partially offset by a small acquisition in Film Products in 2004 ($1.4 million) and higher investment in Novalux, Inc. in 2004 ($5.0 million invested in 2004 compared with $1.1 million invested in 2005).
Net cash provided by financing activities was $3.6 million in 2005 and included the refinancing of our debt in December 2005 (see the assets and liabilities section beginning on page 24 for more information).
In 2004, cash provided by operating activities was $93.8 million compared with $76.4 million in 2003. The increase is due primarily to the income tax refund related to the sale of the venture capital portfolio (see the business segment review beginning on page 33) partially offset by higher primary working capital (accounts receivable, inventories and accounts payable) needed to support higher sales.
Tredegar has exposure to the volatility of interest rates, polyethylene and polypropylene resin prices, aluminum ingot and scrap prices, energy prices, foreign currencies and emerging markets. See the assets and liabilities section beginning on page 2425 regarding credit agreements and interest rate exposures.
Changes in resin prices, and the timing of those changes, could have a significant impact on profit margins in Film Products. Profit margins in Aluminum Extrusions are sensitive to fluctuations in aluminum ingot and scrap prices as well as natural gas prices (natural gas is the principal energy source used to operate our casting furnaces). There is no assurance of our ability to pass through higher raw material and energy costs to our customers.
See the executive summary beginning on page 17 and the business segment review beginning on page 33 for discussion regarding the impact of the lag in the pass-through of resin price changes. The volatility of average quarterly prices of low density polyethylene resin in the U.S. (a primary raw material for Film Products) areis shown in the chart below.

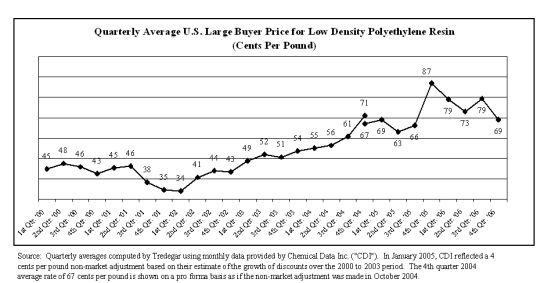
Source: Quarterly averages computed by Tredegar using monthly data provided by Chemical Data Inc. (“CDI”). In January 2005, CDI reflected a 4 cents per pound non-market adjustment based on their estimate of the growth of discounts over the 2000 to 2003 period. The 4th quarter 2004 average rate of 67 cents per pound is shown on a pro forma basis as if the non-market adjustment was made in October 2004.
Resin prices in Europe, Asia and South America have exhibited similar trends. The price of resin is driven by several factors including supply and demand and the price of oil, ethylene and natural gas. To address fluctuating resin prices, Film Products has index-based pass-through raw material cost agreements for the majority of its business. However, under certain agreements, changes in resin prices are not passed through for an average period of 90 days.
In the normal course of business, we enter into fixed-price forward sales contracts with certain customers for the sale of fixed quantities of aluminum extrusions at scheduled intervals. In order to hedge our exposure to aluminum price volatility (see the chart below) under these fixed-price arrangements, which generally have a duration of not more than 12 months, we enter into a combination of forward purchase commitments and futures contracts to acquire or hedge aluminum, based on the scheduled deliveries. See Note 6 on page 55 for more information.
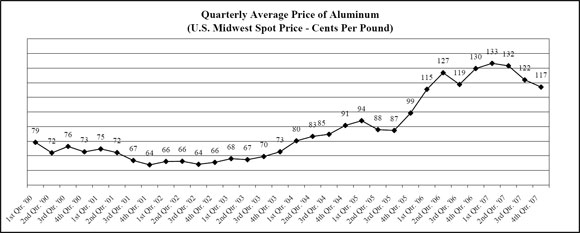
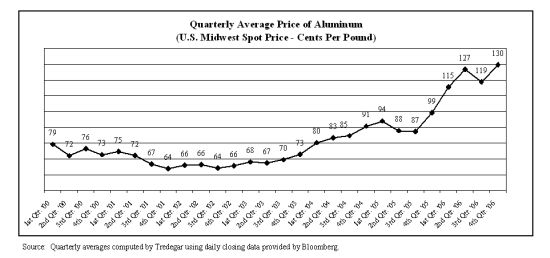
Source: Quarterly averages computed by Tredegar using daily closing data provided by Bloomberg.
In Aluminum Extrusions, we hedge from time-to-time a portion of our exposure to natural gas price volatility by entering into fixed-price forward purchase contracts with our natural gas suppliers. We estimate that, in an unhedged situation, every $1 per mmBtu per month change in the market price of natural gas has a $150,000$95,000 impact on the continuing monthly operating profit for our U.S. operations in Aluminum Extrusions. Substantially higher energy costs (primarily natural gas) in 2005 resulted in a reduction in operating profit in Aluminum Extrusions of approximately $7 million in 2005 compared with 2004. In September 2005, we announced an energy surcharge for our aluminum extrusions business in the U.S. to be applied when the previous quarter’s NYMEX natural gas average settlement price is in excess of $8.85 per mmBtu.

Source: Quarterly averages computed by Tredegar using monthly NYMEX settlement prices.
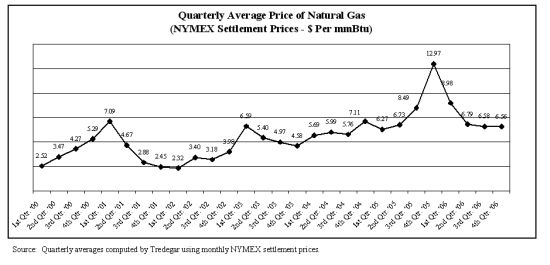
We sell to customers in foreign markets through our foreign operations and through exports from U.S. plants. The percentage of sales and total assets for continuing manufacturing operations related to foreign markets for 20062007 and 20052006 are as follows:
Tredegar Corporation - Manufacturing Operations | |||||||||||||||||||
Percentage of Net Sales and Total Assets Related to Foreign Markets | |||||||||||||||||||
| 2006 | 2005 | ||||||||||||||||||
| % of Total | % Total | % of Total | % Total | ||||||||||||||||
| Net Sales * | Assets - | Net Sales * | Assets - | ||||||||||||||||
| Exports | Foreign | Foreign | Exports | Foreign | Foreign | ||||||||||||||
| From | Oper- | Oper- | From | Oper- | Oper- | ||||||||||||||
| U.S. | ations | ations * | U.S. | ations | ations * | ||||||||||||||
| Canada | 4 | 16 | 11 | 5 | 16 | 12 | |||||||||||||
| Europe | 1 | 12 | 14 | 1 | 14 | 14 | |||||||||||||
| Latin America | - | 2 | 2 | 1 | 2 | 2 | |||||||||||||
| Asia | 5 | 4 | 7 | 4 | 4 | 5 | |||||||||||||
| Total % exposure to foreign markets | 10 | 34 | 34 | 11 | 36 | 33 | |||||||||||||
| *The percentages for foreign markets are relative to Tredegar's total net sales and total assets from manufacturing operations (consolidated net sales and total assets from continuing operations excluding cash and cash equivalents and AFBS (formerly Therics)). | |||||||||||||||||||
|
|
|
|
|
|
|
|
|
|
|
|
|
|
|
|
|
|
|
|
Tredegar Corporation - Continuing Manufacturing Operations |
| ||||||||||||||||||
|
| 2007 |
| 2006 |
| ||||||||||||||
|
|
|
| ||||||||||||||||
|
| % of Total |
| % Total |
| % of Total |
| % Total |
| ||||||||||
|
|
|
|
|
| ||||||||||||||
|
|
|
|
|
| ||||||||||||||
|
| Exports |
| Foreign |
|
| Exports |
| Foreign |
|
| ||||||||
|
|
|
|
|
|
|
| ||||||||||||
|
|
|
|
|
|
|
| ||||||||||||
|
|
|
|
|
| ||||||||||||||
Canada |
|
| 5 |
|
| — |
|
| — |
|
| 5 |
|
| — |
|
| — |
|
Europe |
|
| 1 |
|
| 17 |
|
| 16 |
|
| 1 |
|
| 15 |
|
| 16 |
|
Latin America |
|
| — |
|
| 3 |
|
| 2 |
|
| — |
|
| 3 |
|
| 2 |
|
Asia |
|
| 3 |
|
| 6 |
|
| 7 |
|
| 5 |
|
| 5 |
|
| 8 |
|
| |||||||||||||||||||
Total % exposure to foreign markets |
|
| 9 |
|
| 26 |
|
| 25 |
|
| 11 |
|
| 23 |
|
| 26 |
|
| |||||||||||||||||||
* | The percentages for foreign markets are relative to Tredegar’s total net sales and total assets from manufacturing operations (consolidated net sales and total assets from continuing operations excluding cash and cash equivalents and AFBS (formerly Therics)). |
We attempt to match the pricing and cost of our products in the same currency (except in Canada where about 80% of our sales of aluminum extrusions are U.S. Dollar-based) and generally view the volatility of foreign currencies (see trends for the Euro Canadian Dollar and Chinese Yuan in the chart below) and emerging markets, and the corresponding impact on earnings and cash flow, as part of the overall risk of operating in a global environment. Exports from the U.S. are generally denominated in U.S. Dollars. Our foreign currency exposure on income from continuing foreign operations relates to the Canadian Dollar, the Euro, the Chinese Yuan, the Hungarian Forint and the Brazilian Real.
In Film Products, where we have beenare typically able to better match the currency of our sales and costs, we estimate that the change in value of foreign currencies (primarily the Euro and Hungarian Forint and to a lesser extent the Chinese Yuan and Brazilian Real) relative to the U.S. Dollar had a positive impact on operating profit of aboutapproximately $3 million in 2007 compared with 2006, $500,000 in 2006 compared with 2005, and $600,000 in 2005 compared with 2004.
In 2007, we used currency options to review the loadinghedge a portion of our aluminum extrusions plantsexposure to changes in North Americaexchange rates. Results for continuing operations include realized losses of $239,000 on currency hedges of royalties relating to optimize production mixour operations in Europe and minimize cost in lightresults from discontinued operations include realized gains of the increase in the U.S. Dollar equivalent cost structure$1.3 million on currency hedges of our plants in Canada. In addition, we have partially hedged our exposure to the Canadian Dollar and Euro as shown in the following tables (accounted for as cash flow hedges):
| (In Thousands Except Exchange Rates) | |||||||||||||||||||||||||||||||
Notional Amount as a % of Forecasted USD-Equiv. | USD-Equivalent Strike Prices of Options Bought & | Pretax Unrealized Gain (Loss) on Options at | USD- Equiv. Average | Cash (Paid to) Received from | Gain (Loss) on Options Recognized in Income for Period | ||||||||||||||||||||||||||
| Notional | CAD- | Net Option | Sold on CAD/USD | 12/31/06 | Reference | Counter- | Portion | Portion | |||||||||||||||||||||||
| Description of Currency | Amount | Related | Premium | Call | Put | Included in | Price of | party at | Deemed | Deemed | |||||||||||||||||||||
| Exposure, Options Hedging Strategy | of Option | Costs for | (Paid) | Options | Options | Shareholders' | CAD for | Expiration | Effective | Ineffective | |||||||||||||||||||||
| Used & Periods Covered | Contracts | Period | Received | Bought | Sold | Equity | Period | of Options | as Hedge | as Hedge | |||||||||||||||||||||
Exposure: About 80% of sales of extrusions manufactured in facilities in Canada are denominated or economically priced in U.S. Dollars ("USD") while conversion costs are denominated or economically priced in Canadian Dollars ("CAD"). | |||||||||||||||||||||||||||||||
Hedge Strategy: Bought average rate call options & sold average rate put options on CAD/USD. | |||||||||||||||||||||||||||||||
Periods Covered by Option Contracts: | |||||||||||||||||||||||||||||||
| 5/11/06 to end of second quarter 2006 | $ | 2,500 | 38 | % | $ | - | $ | 0.9500 | $ | 0.8850 | n/a | $ | 0.8995 | $ | - | $ | - | $ | - | ||||||||||||
| Third quarter 2006 | 5,000 | 40 | % | - | 0.9500 | 0.8749 | n/a | 0.8919 | - | - | - | ||||||||||||||||||||
| Fourth quarter 2006 | 6,500 | 53 | % | - | 0.9324 | 0.8650 | n/a | 0.8793 | - | - | - | ||||||||||||||||||||
| First quarter 2007 | 3,500 | 28 | % | - | 0.9100 | 0.8380 | $ | (3 | ) | n/a | n/a | n/a | - | ||||||||||||||||||
| First quarter 2007 | 3,500 | 28 | % | - | 0.9000 | 0.8345 | (2 | ) | n/a | n/a | n/a | - | |||||||||||||||||||
| Second quarter 2007 | 3,500 | 28 | % | - | 0.9100 | 0.8430 | (18 | ) | n/a | n/a | n/a | - | |||||||||||||||||||
| Second quarter 2007 | 3,500 | 28 | % | - | 0.9000 | 0.8364 | (8 | ) | n/a | n/a | n/a | - | |||||||||||||||||||
| Third quarter 2007 | 3,500 | 28 | % | - | 0.9100 | 0.8473 | (27 | ) | n/a | n/a | n/a | - | |||||||||||||||||||
| Third quarter 2007 | 3,500 | 28 | % | - | 0.9000 | 0.8403 | (11 | ) | n/a | n/a | n/a | - | |||||||||||||||||||
| Fourth quarter 2007 | 3,500 | 28 | % | - | 0.9100 | 0.8516 | (33 | ) | n/a | n/a | n/a | - | |||||||||||||||||||
| Fourth quarter 2007 | 3,500 | 28 | % | - | 0.9000 | 0.8446 | (14 | ) | n/a | n/a | n/a | - | |||||||||||||||||||
| $ | (116 | ) | |||||||||||||||||||||||||||||
| (In Thousands Except Exchange Rates) | |||||||||||||||||||
| Sensitivity Analysis of Amount Tredegar (Pays to) Receives | |||||||||||||||||||
| Average | Average | from Counterparty in 2007 for Settlement of CAD/USD Options | |||||||||||||||||
| CAD Per | USD Equiv. | First | Second | Third | Fourth | ||||||||||||||
| USD | of CAD | Quarter | Quarter | Quarter | Quarter | Total | |||||||||||||
| 1.21951 | $ | 0.8200 | $ | (136 | ) | $ | (164 | ) | $ | (197 | ) | $ | (232 | ) | $ | (729 | ) | ||
| 1.20482 | 0.8300 | (52 | ) | (81 | ) | (115 | ) | (149 | ) | (397 | ) | ||||||||
| 1.19048 | 0.8400 | - | (12 | ) | (32 | ) | (67 | ) | (111 | ) | |||||||||
| 1.17647 | 0.8500 | - | - | - | (7 | ) | (7 | ) | |||||||||||
| 1.16279 | 0.8600 | - | - | - | - | - | |||||||||||||
| 1.14943 | 0.8700 | - | - | - | - | - | |||||||||||||
| 1.13636 | 0.8800 | - | - | - | - | - | |||||||||||||
| 1.12360 | 0.8900 | - | - | - | - | - | |||||||||||||
| 1.11111 | 0.9000 | - | - | - | - | - | |||||||||||||
| 1.09890 | 0.9100 | 39 | 39 | 39 | 39 | 155 | |||||||||||||
| 1.08696 | 0.9200 | 116 | 116 | 116 | 116 | 465 | |||||||||||||
| 1.07527 | 0.9300 | 194 | 194 | 194 | 194 | 774 | |||||||||||||
| 1.06383 | 0.9400 | 271 | 271 | 271 | 271 | 1,084 | |||||||||||||
| (In Thousands Except Exchange Rates) | |||||||||||||||||||
| Notional | |||||||||||||||||||
| Amount as | Pretax | ||||||||||||||||||
| a % of | USD-Equivalent | Unrealized | |||||||||||||||||
| Forecasted | Strike Prices of | Gain (Loss) | |||||||||||||||||
| USD-Equiv. | Options Bought & | on Options at | |||||||||||||||||
| Notional | Royalty | Net Option | Sold on EUR/USD | 12/31/06 | |||||||||||||||
| Description of Currency | Amount | from | Premium | Call | Put | Included in | |||||||||||||
| Exposure, Options Hedging Strategy | of Option | Nether- | (Paid) | Options | Options | Shareholders' | |||||||||||||
| Used & Periods Covered | Contracts | lands Sub | Received | Sold | Bought | Equity* | |||||||||||||
Exposure: Significant royalty on sales from film technology licensed to subsidiary in the Netherlands is earned in Euros ("EUR"). | |||||||||||||||||||
Hedge Strategy: Sold average rate call options & bought average rate put options on EUR/USD. | |||||||||||||||||||
Periods Covered by Option Contracts: | |||||||||||||||||||
| First quarter 2007 | $ | 3,200 | 74 | % | $ | - | $ | 1.3350 | $ | 1.2800 | n/a | ||||||||
| Second quarter 2007 | 3,200 | 82 | % | - | 1.3480 | 1.2800 | n/a | ||||||||||||
| Third quarter 2007 | 3,200 | 75 | % | - | 1.3575 | 1.2800 | n/a | ||||||||||||
| Fourth quarter 2007 | 3,200 | 76 | % | - | 1.3640 | 1.2800 | n/a | ||||||||||||
| * Hedge transactions occurred on 1/4/07 and therefore there was no unrealized gain or loss at 12/31/06. | |||||||||||||||||||
| (In Thousands Except Exchange Rates) | |||||||||||||||||||
| Sensitivity Analysis of Amount Tredegar (Pays to) Receives | |||||||||||||||||||
| Average | Average | from Counterparty in 2007 for Settlement of EUR/USD Options | |||||||||||||||||
| EUR Per | USD Equiv. | First | Second | Third | Fourth | ||||||||||||||
| USD | of EUR | Quarter | Quarter | Quarter | Quarter | Total | |||||||||||||
| 0.84034 | $ | 1.1900 | $ | 225 | $ | 225 | $ | 225 | $ | 225 | $ | 900 | |||||||
| 0.82645 | 1.2100 | 175 | 175 | 175 | 175 | 700 | |||||||||||||
| 0.81301 | 1.2300 | 125 | 125 | 125 | 125 | 500 | |||||||||||||
| 0.80000 | 1.2500 | 75 | 75 | 75 | 75 | 300 | |||||||||||||
| 0.78740 | 1.2700 | 25 | 25 | 25 | 25 | 100 | |||||||||||||
| 0.77519 | 1.2900 | - | - | - | - | - | |||||||||||||
| 0.76336 | 1.3100 | - | - | - | - | - | |||||||||||||
| 0.75188 | 1.3300 | - | - | - | - | - | |||||||||||||
| 0.74074 | 1.3500 | (36 | ) | (5 | ) | - | - | (41 | ) | ||||||||||
| 0.72993 | 1.3700 | (84 | ) | (52 | ) | (29 | ) | (14 | ) | (180 | ) | ||||||||
| 0.71942 | 1.3900 | (132 | ) | (100 | ) | (77 | ) | (61 | ) | (369 | ) | ||||||||
| 0.70922 | 1.4100 | (180 | ) | (147 | ) | (124 | ) | (108 | ) | (559 | ) | ||||||||
| 0.69930 | 1.4300 | (228 | ) | (195 | ) | (171 | ) | (155 | ) | (748 | ) | ||||||||

Source: Quarterly averages computed by Tredegar using daily closing data provided by Bloomberg.
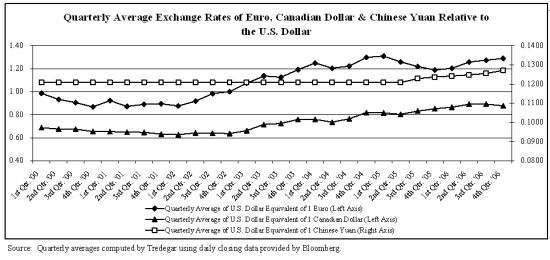
Net sales (sales less freight) and operating profit from ongoing operations are the measures of sales and operating profit used by the chief operating decision maker for purposes of assessing performance.
Film Products
Net Sales. See the executive summary beginning on page 17 for the discussion of net sales (sales less freight) in Film Products in 2007 compared with 2006.
Net sales in Film Products were $511.2 million in 2006 and $460.3 million in 2005 and $413.3 million in 2004.2005. The increasesincrease in net sales (sales less freight) in Film Products in the last two years2006 is primarily due to growth in higher value-added products, including surface protection films, elastic materials and new apertured materials. Selling price and net sales are also affected by the pass-through of changes in raw material costs and changes in currency exchange rates (see the qualitative and quantitative disclosures about market risks section beginning on page 28)30). Total volume was 253.5 million pounds in 2006 and 261.1 million pounds in 2005 and 278.7 million pounds in 2004. Total volume related to the business in Argentina sold in the third quarter of 2004 was 9.4 million pounds in 2004.2005. We estimate that the growth in net sales excluding the effects of the pass-through of resin price changes foreignand currency exchange rate changes and the business in Argentina sold was about 6% in 2006 and 7% in 2005 and 9% in 2004.2005. Volume declines in 2006 compared with 2005 were mainly due to lower sales of certain commodity barrier films that were dropped in conjunction with the shutdown of the plant in LaGrange, Georgia. The plant was shut down in the first half of 2006 and had sales of commodity barrier films of approximately $20 million in 2005.
Operating Profit. See the executive summary beginning on page 17 for the discussion of operating profit in Film Products in 2007 compared with 2006.
Operating profit from ongoing operations in Film Products was $57.6 million in 2006 and $44.9 million in 2005 and $43.3 million in 2004.2005. Operating profit from ongoing operations excluding the estimated effects of resin pass-through lag and year-end LIFO adjustments was $53.1 million in 2006 and $48.9 million in 2005 and $45.8 million in 2004.2005. The increase in operating profit in since 20042006 excluding the impact of resin pass-through lag and LIFO adjustments has beenwas driven by growth in the sale of higher value surface protection films, elastic materials and new apertured topsheets.
Identifiable Assets. Identifiable assets in Film Products decreased to $488.0 million at December 31, 2007, from $499.0 million at December 31, 2006, due primarily to depreciation of $33.9 million compared with capital expenditures of $15.3 million and asset impairments during the year totaling $594,000, partially offset by the effects of currency rate changes on property, plant and equipment and goodwill of approximately $11.3 million. See page 25 for further discussion on changes in assets and liabilities.
Identifiable assets in Film Products increased to $499.0 million at December 31, 2006, from $479.3 million at December 31, 2005, due primarily to the effects of foreign exchangecurrency rate changes of $9.0 million, higher accounts receivable (up $6.5 million) due to higher sales and higher inventories (up $3.4 million) and asset impairments during the year2006 totaling $1.2 million. See page 24 for further discussion on changes in assets and liabilities.
Identifiable assets in Film Products increased to $479.3 million at December 31, 2005, from $472.8 million at December 31, 2004, due primarily to capital expenditures in excess of depreciation of $24.0 million (see the depreciation, amortization and capital expenditures section below for more information) partially offset by lower accounts receivable (down $4.9 million) due to lower days sales outstanding (down about 5 days since the end of 2004), the effects of foreign exchange rate changes of $9.8 million and asset impairments and disposals during 2005 totaling $4.3 million.
Capital expenditures declined to $15.3 million in 2007 compared with $33.2 million in 2006. Capital expenditures in 2008 are expected to be approximately $33 million. Capital expenditures in 2007 primarily included the normal replacement of machinery and equipment and continued expansion of capacity for surface protection films and elastic materials.
Capital expenditures declined to $33.2 million in 2006 compared with $50.5 million in 2005. Capital expenditures in 2007 are expected to be approximately $35 million. Approximately half of the capital expenditures in 2006 related to expanding the production capacity for surface protection films. These films are primarily used to protect flat panel display components during fabrication, shipping and handling. Sales of surface protection films used primarily in this application totaled approximately $56 million in 2006, $30 million in 2005 and $16 million in 2004. Other capital expenditures in 2006 included capacity additions for elastic materials and continued costs associated with a new information system, which was rolled out in U.S. locations.
Net Sales and Operating Profit. See the executive summary beginning on page 17 for the discussion of net sales (sales less freight) and operating profit for the continuing operations of Aluminum Extrusions in 2007 compared with 2006.
Net sales were $577.3$403.8 million in 2006, up 22.4%23.2% versus $471.7$327.7 million in 2005. Operating profit from continuing ongoing operations was $22.0$18.3 million in 2006, up 14.0%7.1% compared to $19.3$17.1 million in 2005. Volume increased to 259.9185.2 million pounds in 2006, up 5.5%4.6% compared to 246.4177.0 million pounds in 2005. Growth in shipments in 2006 was driven by demand for extrusions used in commercial construction and hurricane protection products, partially offset by a decline in extrusions used in residential construction. The increase in operating profit during 2006 was primarily due to higher volume and selling prices and lower energy costs, (energy costs were down $1.1 million), partially offset by appreciation of the Canadian Dollar ($2.8 million) and higher charges for possible uncollectible accounts ($1.4 million).
Net sales in Aluminum Extrusions were $471.7 million in 2005, up 11% from $425.1 million in 2004 primarily due to higher selling prices driven by higher raw material and energy costs. Annual volume increased to 246.4 million pounds in 2005 from 243.4 million pounds in 2004, as stronger shipments in commercial construction and hurricane protection products were offset by lower shipments in other end markets. Operating profit from ongoing operations declined 15% to $19.3 million in 2005 from $22.6 million in 2004 due mainly to higher energy costs (approximately $7 million) and strength of the Canadian Dollar (about $3.5 million), partially offset by price increases, higher volume and an energy surcharge.
Depreciation, Amortization and Capital Expenditures. Depreciation and amortization for Aluminum Extrusions was $12.3$8.5 million in 2007, $8.4 million in 2006 $11.5and $8 million in 2005 and $10.9 million in 2004. The increases in 2006 and 2005 are primarily due to the start of depreciation in 2005 of capital expenditures associated with moving and upgrading the largest extrusions press at the facility shut down in Aurora, Ontario to the plant in Pickering, Ontario, and enlargement of the Pickering facility.2005. We expect depreciation and amortization expense for Aluminum Extrusions to increase to about $12.8be $8.5 million in 2007.2008.
Capital expenditures totaled $7.4$4.4 million in 2007, $6.6 million in 2006 $12.0and $5.8 million in 2005, and $10.0 million in 2004, and reflect the normal replacement of machinery and equipment plus capital expenditures associated with the plant in Pickering, Ontario described above.equipment. Capital expenditures are expected to be approximately $14$21 million in 2007.
On June 30, 2005, substantially all of the assets of AFBS, Inc. (formerly known as Therics, Inc.), a wholly-owned subsidiary of Tredegar, were sold or assigned to a newly-created limited liability company, Therics, LLC, which is controlled and managed by an individual not affiliated with Tredegar. AFBS received a 17.5% equity interest in Therics, LLC, then valued at $170,000 and a 3.5% interest in Theken Spine, LLC, then valued at $800,000, along with potential future payments based on the sale of certain products by Therics, LLC. AFBS retained substantially all of its liabilities in the transaction, which included customary indemnification provisions for pre-transaction liabilities. Tredegar has no obligation or intent to fund any future losses that may occur at Therics, LLC or Theken Spine, LLC. The ownership interest in Therics, LLC is accounted for under the equity method of accounting with losses limited to its initial carrying value of $170,000. The ownership interest in Theken Spine, LLC is accounted for under the cost method, with an impairment loss recognized and a new cost basis established for any write-down to estimated fair value, if necessary. The payments due from Therics, LLC that are based on the sale of certain products are recognized as income when earned. AFBS had operating losses of $3.5 million during the first six months of 2005 and $9.8 million in 2004. Results of operations for AFBS since June 30, 2005 are immaterial.
Item 7A. |
See discussion of quantitative and qualitative disclosures about market risk beginning on page 2830 in Management’s Discussion and Analysis.
Item 8. |
See the index on page 4039 for references to the report of the independent registered public accounting firm, the consolidated financial statements and selected quarterly financial data.
None.
Item |
Evaluation of Disclosure Controls and Procedures
Pursuant to Rule 13a-15(b) under the Securities Exchange Act of 1934, as amended (the “Exchange Act”), we carried out an evaluation, with the participation of our management, including our
principal executive officer and principal financial officer, of the effectiveness of our disclosure controls and procedures (as defined under Rule 13a-15(e) under theManagement’s Report on Internal Control Over Financial Reporting
Our management is responsible for establishing and maintaining adequate internal control over financial reporting, as such term is defined in Exchange Act Rule 13a-15(f) under the Securities Exchange Act of 1934, as amended.Act. The Company’s internal control over financial reporting is designed to provide reasonable assurance to the Company’s management and board of directors regarding the reliability of financial reporting and the preparation and fair presentation of published financial statements in accordance with generally accepted accounting principles in the United States of America and includes policies and procedures that:
• | Pertain to the maintenance of records that, in reasonable detail, accurately and fairly reflect the transactions and dispositions of our assets; |
• | Provide reasonable assurance that transactions are recorded as necessary to permit preparation of financial statements in accordance with generally accepted accounting principles in the United States of America, and that our receipts and expenditures are being made only in accordance with authorization of our management and directors; and |
• | Provide reasonable assurance regarding prevention or timely detection of unauthorized acquisition, use or disposition of our assets that could have a material effect on the consolidated financial statements. |
Internal control over financial reporting includes the controls themselves, monitoring (including internal auditing practices) and actions taken to correct deficiencies as identified.
Because of its inherent limitations, internal control over financial reporting may not prevent or detect misstatements. Also, projections of any evaluation of effectiveness to future periods are subject to the risk that controls may become inadequate because of changes in conditions, or that the degree of compliance with the policies
or procedures may deteriorate.
The effectiveness of our internal control over financial reporting as of December 31, 2006,2007 has been audited by PricewaterhouseCoopers LLP, an independent registered public accounting firm, as stated in their report which is included on pages 40-41.
Changes in Internal Control Over Financial Reporting
There has been no change in our internal control over financial reporting during the quarter ended December 31, 2006,2007, that has materially affected, or is reasonably likely to materially affect, our internal control over financial reporting.
Item |
Item | DIRECTORS, EXECUTIVE OFFICERS AND CORPORATE GOVERNANCE |
The information concerning directors and persons nominated to become directors of Tredegar included in the Proxy Statement under the headings "Election“Election of Directors"Directors” and “Tredegar’s Board of Directors” is incorporated herein by reference.
The information concerning corporate governance included in the Proxy Statement under the heading “Board Meetings, Meetings of Non-Management Directors and the Board Committees - Audit Committee Matters”Committees” is incorporated herein by reference.
The information included in the Proxy Statement under the heading “Section 16(a) Beneficial Ownership Reporting Requirements” is incorporated herein by reference.
Set forth below are the names, ages and titles of our executive officers:
Name | Age | Title | |||||
John D. Gottwald | 53 | President and Chief Executive | |||||
Nancy M. Taylor | 48 | President, Tredegar Film Products and Corporate Senior Vice President | |||||
D. Andrew Edwards | 49 | Vice President, Chief Financial Officer and Treasurer | |||||
McAlister C. Marshall, II | 38 | Vice President, General Counsel and Corporate Secretary | |||||
Larry J. Scott | 57 | Vice President, Audit | |||||
John D. Gottwald. On January 16, 2006, Mr. Gottwald was elected President and Chief Executive Officer effective March 1, 2006. Mr. Gottwald had served as Chairman of the Board of Directors since September 10, 2001. Mr. Gottwald served as President and Chief Executive Officer from July 10, 1989 until September 10, 2001.
Nancy M. Taylor. Ms. Taylor was elected President of Tredegar Film Products effective April 5, 2005. She was elected Senior Vice President effective November 1, 2004. Ms. Taylor served as Senior Vice President, Strategy and Special Projects from November 1, 2004 until April 5, 2005. Ms. Taylor served as Managing Director, European Operations, of Tredegar Film Products from January 1, 2003 until November 1, 2004. Ms. Taylor served as Vice President, Administration and Corporate Development from September 10, 2001 until February 12, 2003. Ms. Taylor served as Secretary from February 24, 1994 until February 12, 2003. She served as Vice President, Law, from November 18, 1998 until September 10, 2001, and served as General Counsel from May 22, 1997 until July 25, 2000.
D. Andrew Edwards. Mr. Edwards was elected Vice President, Chief Financial Officer and Treasurer on August 28, 2003. Mr. Edwards has served as Vice President, Finance since November 18, 1998. Mr. Edwards has served as Treasurer since May 22, 1997. From October 19, 1992 until July 10, 2000, Mr. Edwards served as Controller.
McAlister C. Marshall, II.Mr. Marshall was elected Vice President, General Counsel and Corporate Secretary on October 1, 2006, the date that he joined Tredegar. From July 2000 until September 2006, he served as Assistant General Counsel at The Brink’s Company. He was an Associate at the law firm of Hunton & Williams LLP from 1996 until 2000.
Larry J. Scott. Mr. Scott was elected Vice President, Audit, on May 24, 2000. Mr. Scott served as Director of Internal Audit from February 24, 1994 until May 24, 2000.
We have adopted a Code of Conduct that applies to all of our directors, officers and employees (including our Chief Executive Officer, Chief Financial Officer and principal accounting officer) and have posted the Code of Conduct on our web site. We intend to satisfy the disclosure requirement under Item 10 of Form 8-K relating to amendments to or waivers from any provision of our Code of Conduct applicable to Chief Executive Officer, Chief Financial Officer and principal accounting officer by posting this information on our website. Our Internet address is
Because our common stock is listed on the NYSE, our chief executive officer is required to make, and he has made, an annual certification to the NYSE stating that he was not aware of any violation by us of the corporate governance listing standards of the NYSE. Our chief executive officer made his annual certification to that effect to the NYSE as of May 26, 2006.25, 2007. In addition, we have filed, as exhibits to this Annual Report on Form 10-K, the certifications of our principal executive officer and principal financial officer required under Section 302 of the Sarbanes Oxley Act of 2002 to be filed with the SEC regarding the quality of our public disclosure.
EXECUTIVE COMPENSATION |
The information included in the Proxy Statement under the headings "Compensation“Compensation of Directors”, “Board Meetings of Non-Management Directors and Board Committees - Executive Compensation Committee Interlocks and Insider Participation”, “Compensation Discussion and Analysis”, “Executive Compensation Committee Report” and “Compensation of Executive Officers"Officers” is incorporated herein by reference.
SECURITY OWNERSHIP OF CERTAIN BENEFICIAL OWNERS AND MANAGEMENT AND RELATED STOCKHOLDER MATTERS |
The information included in the Proxy Statement under the heading "Stock Ownership"“Stock Ownership” is incorporated herein by reference. The following table summarizes information with respect to equity compensation plans under which securities are authorized for issuance as of December 31, 2006.
| Column (a) | Column (b) | Column (c) | Column (d) | |||
| Plan Category | Number of Securities to be Issued Upon Exercise of Outstanding Options, Warrants and Rights | Weighted Average Exercise Price of Outstanding Options, Warrants and Rights | Number of Securities Remaining Available for Future Issuance Under Equity Compensation Plans, Excluding Securities Reflected in Column (b) | |||
| Equity compensation plans approved by security holders* | 1,247,173 | $18.16 | 1,601,700 | |||
| Equity compensation plans not approved by security holders | - | - | - | |||
| Total | 1,247,173 | $18.16 | 1,601,700 |
|
|
|
|
|
|
|
|
|
|
|
|
|
Column (a) |
| Column (b) |
| Column (c) |
| Column (d) |
| |||||
|
|
|
|
|
|
|
| |||||
Plan Category |
| Number of Securities |
| Weighted Average |
| Number of Securities |
| |||||
Equity compensation plans approved by security holders |
| 1,009,858 | * |
|
| $ | 17.90 |
|
| 1,412,232 |
|
|
Equity compensation plans not approved by security holders |
| — |
|
|
|
| — |
|
| — |
|
|
|
|
|
|
|
|
|
|
|
|
|
|
|
Total |
| 1,009,858 |
|
|
| $ | 17.90 |
|
| 1,412,232 |
|
|
* Includes performance stock units that give the holder the right to receive shares issuable pursuant to options issued under bothof Tredegar common stock upon the 2004 Equity Incentive Plan and the Directors Stock Plan.
CERTAIN RELATIONSHIPS AND RELATED TRANSACTIONS, AND DIRECTOR INDEPENDENCE |
The information included in the Proxy Statement under the headings "Certain“Certain Relationships and Related Transactions” and “Tredegar’s Board of Directors” is incorporated herein by reference.
PRINCIPAL ACCOUNTING FEES AND SERVICES |
The following is incorporated herein by reference:
• | Information on accounting fees and services included in the Proxy Statement under the heading |
• | Information on the Audit Committee’s procedures for pre-approving certain audit and non-audit services included in the Proxy Statement under the heading “Board Meetings, Meetings of Non-Management Directors and Board Committees - Audit Committee Matters”. |
EXHIBITS AND FINANCIAL STATEMENT SCHEDULES | |||
(a) | List of documents filed as a part of the report: | ||
(1) | Financial statements: | ||
Tredegar Corporation
Index to Financial Statements and Supplementary Data
Page | |||
39-40 | |||
Financial Statements: | |||
Consolidated Statements of Income for the Years Ended | 41 | ||
Consolidated Balance Sheets as of December 31, | 42 | ||
Consolidated Statements of Cash Flows for the Years Ended | 43 | ||
44 | |||
45-72 | |||
73 | |||
(2) | Financial statement schedules: | |
None. | ||
(3) | Exhibits: | |
See Exhibit Index on pages 80-81. |
To the Board of Directors and Shareholders of
Consolidated Financial Statements
assurance about whether the financial statements are free of material misstatement. An auditmisstatement and whether effective internal control over financial reporting was maintained in all material respects. Our audits of the financial statements includesincluded examining, on a test basis, evidence supporting the amounts and disclosures in the financial statements, assessing the accounting principles used and significant estimates made by management, and evaluating the overall financial statement presentation. Our audit of internal control over financial reporting included obtaining an understanding of internal control over financial reporting, assessing the risk that a material weakness exists, and testing and evaluating the design and operating effectiveness of internal control based on the assessed risk. Our audits also included performing such other procedures as we considered necessary in the circumstances. We believe that our audits provide a reasonable basis for our opinion.
A company’s internal control over financial reporting is a process designed to provide reasonable assurance regarding the reliability of financial reporting and the preparation of financial statements for external purposes in accordance with generally accepted accounting principles. A company’s internal control over financial reporting includes those policies and procedures that (i) pertain to the maintenance of records that, in reasonable detail, accurately and fairly reflect the transactions and dispositions of the assets of the company; (ii) provide reasonable assurance that transactions are recorded as necessary to permit preparation of financial statements in accordance with generally accepted accounting principles, and that receipts and expenditures of the company are being made only in accordance with authorizations of management and directors of the company; and (iii) provide reasonable assurance regarding prevention or timely detection of unauthorized acquisition, use, or disposition of the company’s assets that could have a material effect on the financial statements.
Because of its inherent limitations, internal control over financial reporting may not prevent or detect misstatements. Also, projections of any evaluation of effectiveness to future periods are subject to the risk that controls may become inadequate because of changes in conditions, or that the degree of compliance with the policies or procedures may deteriorate.
As discussed in Note 1 to the consolidated financial statements, the Company changed the way in which it accounts for uncertain tax positions effective January 1, 2007, share-based compensation effective January 1, 2006, and defined benefit pension and other postretirement plans effective December 31, 2006.
PricewaterhouseCoopers LLP
Richmond, Virginia
March 4, 2008
Tredegar Corporation and Subsidiaries |
|
|
|
|
|
|
|
|
|
|
|
Years Ended December 31 |
| 2007 |
| 2006 |
| 2005 |
| |||
(In Thousands, Except Per-Share Data) |
|
|
|
|
|
|
|
|
|
|
|
|
|
|
|
|
|
|
|
|
|
Revenues and other: |
|
|
|
|
|
|
|
|
|
|
Sales |
| $ | 922,583 |
| $ | 937,561 |
| $ | 808,464 |
|
Other income (expense), net |
|
| 1,782 |
|
| 1,444 |
|
| (2,211 | ) |
|
|
| 924,365 |
|
| 939,005 |
|
| 806,253 |
|
|
|
|
|
|
|
|
|
|
|
|
Costs and expenses: |
|
|
|
|
|
|
|
|
|
|
Cost of goods sold |
|
| 761,509 |
|
| 779,376 |
|
| 672,465 |
|
Freight |
|
| 19,808 |
|
| 22,602 |
|
| 20,276 |
|
Selling, general and administrative |
|
| 68,501 |
|
| 64,082 |
|
| 61,007 |
|
Research and development |
|
| 8,354 |
|
| 8,088 |
|
| 8,982 |
|
Amortization of intangibles |
|
| 149 |
|
| 149 |
|
| 299 |
|
Interest expense |
|
| 2,721 |
|
| 5,520 |
|
| 4,573 |
|
Asset impairments and costs associated with exit and disposal activities |
|
| 4,027 |
|
| 4,080 |
|
| 15,782 |
|
Total |
|
| 865,069 |
|
| 883,897 |
|
| 783,384 |
|
Income from continuing operations before income taxes |
|
| 59,296 |
|
| 55,108 |
|
| 22,869 |
|
Income taxes |
|
| 24,366 |
|
| 19,791 |
|
| 9,497 |
|
Income from continuing operations |
|
| 34,930 |
|
| 35,317 |
|
| 13,372 |
|
Income (loss) from discontinued operations |
|
| (19,681 | ) |
| 2,884 |
|
| 2,857 |
|
Net income |
| $ | 15,249 |
| $ | 38,201 |
| $ | 16,229 |
|
Earnings (loss) per share: |
|
|
|
|
|
|
|
|
|
|
Basic: |
|
|
|
|
|
|
|
|
|
|
Continuing operations |
| $ | .91 |
| $ | .92 |
| $ | .35 |
|
Discontinued operations |
|
| (.51 | ) |
| .07 |
|
| .07 |
|
Net income |
| $ | .40 |
| $ | .99 |
| $ | .42 |
|
Diluted: |
|
|
|
|
|
|
|
|
|
|
Continuing operations |
| $ | .90 |
| $ | .91 |
| $ | .35 |
|
Discontinued operations |
|
| (.51 | ) |
| .07 |
|
| .07 |
|
Net income |
| $ | .39 |
| $ | .98 |
| $ | .42 |
|
March 1, 2007See accompanying notes to financial statements.
Tredegar Corporation and Subsidiaries |
|
|
|
|
|
|
|
|
December 31 |
| 2007 |
| 2006 |
| ||
(In Thousands, Except Share Data) |
|
|
|
|
|
|
|
|
|
|
|
|
|
|
|
Assets |
|
|
|
|
|
|
|
Current assets: |
|
|
|
|
|
|
|
Cash and cash equivalents |
| $ | 48,217 |
| $ | 40,898 |
|
|
|
|
|
|
|
|
|
Accounts and notes receivable, net of allowance for doubtful accounts and sales returns of $5,198 in 2007 and $7,388 in 2006 |
|
| 97,064 |
|
| 106,955 |
|
Income taxes recoverable |
|
| 323 |
|
| 10,975 |
|
Inventories |
|
| 48,666 |
|
| 48,664 |
|
Deferred income taxes |
|
| 9,172 |
|
| 6,055 |
|
Prepaid expenses and other |
|
| 4,077 |
|
| 4,428 |
|
Current assets of discontinued operation |
|
| 37,750 |
|
| 35,275 |
|
Total current assets |
|
| 245,269 |
|
| 253,250 |
|
Property, plant and equipment, at cost: |
|
|
|
|
|
|
|
Land and land improvements |
|
| 7,278 |
|
| 8,497 |
|
Buildings |
|
| 81,449 |
|
| 77,804 |
|
Machinery and equipment |
|
| 548,961 |
|
| 521,650 |
|
Total property, plant and equipment |
|
| 637,688 |
|
| 607,951 |
|
Less accumulated depreciation |
|
| 368,605 |
|
| 320,516 |
|
Net property, plant and equipment |
|
| 269,083 |
|
| 287,435 |
|
Other assets and deferred charges |
|
| 116,759 |
|
| 63,712 |
|
Goodwill and other intangibles (other intangibles of $464 in 2007 and $581 in 2006) |
|
| 135,907 |
|
| 132,237 |
|
Noncurrent assets of discontinued operation |
|
| 17,460 |
|
| 45,153 |
|
Total assets |
| $ | 784,478 |
| $ | 781,787 |
|
| |||||||
Liabilities and Shareholders’ Equity |
|
|
|
|
|
|
|
Current liabilities: |
|
|
|
|
|
|
|
Accounts payable |
| $ | 67,161 |
| $ | 54,020 |
|
Accrued expenses |
|
| 33,676 |
|
| 38,790 |
|
Current portion of long-term debt |
|
| 540 |
|
| 678 |
|
Current liabilities of discontinued operation |
|
| 17,152 |
|
| 18,522 |
|
Total current liabilities |
|
| 118,529 |
|
| 112,010 |
|
Long-term debt |
|
| 81,516 |
|
| 61,842 |
|
Deferred income taxes |
|
| 68,625 |
|
| 65,732 |
|
Other noncurrent liabilities |
|
| 15,662 |
|
| 14,299 |
|
Noncurrent liabilities of discontinued operation |
|
| 8,818 |
|
| 11,309 |
|
Total liabilities |
|
| 293,150 |
|
| 265,192 |
|
Commitments and contingencies (Notes 13 and 16) |
|
|
|
|
|
|
|
Shareholders’ equity: |
|
|
|
|
|
|
|
Common stock (no par value): |
|
|
|
|
|
|
|
Authorized 150,000,000 shares; |
|
|
|
|
|
|
|
Issued and outstanding - 34,765,450 shares in 2007 and 39,286,079 in 2006 (including restricted stock) |
|
| 51,444 |
|
| 120,508 |
|
Common stock held in trust for savings restoration plan (59,222 shares in 2007 and 58,632 in 2006) |
|
| (1,303 | ) |
| (1,291 | ) |
Accumulated other comprehensive income (loss): |
|
|
|
|
|
|
|
Foreign currency translation adjustment |
|
| 40,610 |
|
| 21,522 |
|
Gain (loss) on derivative financial instruments |
|
| (1,204 | ) |
| 654 |
|
Pension and other postretirement benefit adjustments |
|
| (3,767 | ) |
| (21,211 | ) |
Retained earnings |
|
| 405,548 |
|
| 396,413 |
|
Total shareholders’ equity |
|
| 491,328 |
|
| 516,595 |
|
Total liabilities and shareholders’ equity |
| $ | 784,478 |
| $ | 781,787 |
|
IndexSee accompanying notes to financial statements.
| Years Ended December 31 | 2006 | 2005 | 2004 | |||||||
| (In Thousands, Except Per-Share Data) | ||||||||||
Revenues and other: | ||||||||||
| Sales | $ | 1,116,525 | $ | 956,969 | $ | 861,165 | ||||
| Other income (expense), net | 1,444 | (544 | ) | 15,604 | ||||||
1,117,969 | 956,425 | 876,769 | ||||||||
Costs and expenses: | ||||||||||
| Cost of goods sold | 944,839 | 810,621 | 717,120 | |||||||
| Freight | 28,096 | 24,691 | 22,398 | |||||||
| Selling, general and administrative | 68,360 | 64,723 | 60,030 | |||||||
| Research and development | 8,088 | 8,982 | 15,265 | |||||||
| Amortization of intangibles | 149 | 299 | 330 | |||||||
| Interest | 5,520 | 4,573 | 3,171 | |||||||
Asset impairments and costs associated with exit and disposal activities | 4,080 | 16,334 | 22,973 | |||||||
| Total | 1,059,132 | 930,223 | 841,287 | |||||||
| Income from continuing operations | ||||||||||
| before income taxes | 58,837 | 26,202 | 35,482 | |||||||
| Income taxes | 20,636 | 9,973 | 9,222 | |||||||
| Income from continuing operations | 38,201 | 16,229 | 26,260 | |||||||
| Discontinued operations: | ||||||||||
| Gain from venture capital investment activities (including an after-tax gain on a tax-related item of $2,275 in 2004) | - | - | 2,921 | |||||||
| Income from discontinued operations | - | - | 2,921 | |||||||
Net income | $ | 38,201 | $ | 16,229 | $ | 29,181 | ||||
Earnings per share: | ||||||||||
| Basic: | ||||||||||
| Continuing operations | $ | .99 | $ | .42 | $ | .69 | ||||
| Discontinued operations | - | - | .08 | |||||||
| Net income | $ | .99 | $ | .42 | $ | .77 | ||||
| Diluted: | ||||||||||
| Continuing operations | $ | .98 | $ | .42 | $ | .68 | ||||
| Discontinued operations | - | - | .08 | |||||||
| Net income | $ | .98 | $ | .42 | $ | .76 | ||||
See accompanying notes to financial statements. | ||||||||||
| December 31 | 2006 | 2005 | |||||
| (In Thousands, Except Share Data) | |||||||
Assets | |||||||
| Current assets: | |||||||
| Cash and cash equivalents | $ | 40,898 | $ | 23,434 | |||
| Accounts and notes receivable, net of allowance for doubtful accounts and sales returns of $8,559 in 2006 and $5,423 in 2005 | 121,834 | 119,330 | |||||
| Income taxes recoverable | 10,975 | 7,163 | |||||
| Inventories | 68,930 | 62,438 | |||||
| Deferred income taxes | 6,055 | 7,778 | |||||
| Prepaid expenses and other | 4,558 | 4,224 | |||||
| Total current assets | 253,250 | 224,367 | |||||
| Property, plant and equipment, at cost: | |||||||
| Land and land improvements | 12,540 | 12,496 | |||||
| Buildings | 95,877 | 91,400 | |||||
| Machinery and equipment | 567,989 | 528,821 | |||||
| Total property, plant and equipment | 676,406 | 632,717 | |||||
| Less accumulated depreciation | 350,643 | 309,841 | |||||
| Net property, plant and equipment | 325,763 | 322,876 | |||||
| Other assets and deferred charges | 64,078 | 96,527 | |||||
| Goodwill and other intangibles (other intangibles of $581 in 2006 and $712 in 2005) | 138,696 | 137,988 | |||||
| Total assets | $ | 781,787 | $ | 781,758 | |||
Liabilities and Shareholders' Equity | |||||||
| Current liabilities: | |||||||
| Accounts payable | $ | 69,426 | $ | 61,731 | |||
| Accrued expenses | 41,906 | 36,031 | |||||
| Current portion of long-term debt | 678 | - | |||||
| Total current liabilities | 112,010 | 97,762 | |||||
| Long-term debt | 61,842 | 113,050 | |||||
| Deferred income taxes | 75,772 | 74,287 | |||||
| Other noncurrent liabilities | 15,568 | 11,297 | |||||
| Total liabilities | 265,192 | 296,396 | |||||
| Commitments and contingencies (Notes 13 and 16) | |||||||
| Shareholders' equity: | |||||||
| Common stock (no par value): | |||||||
| Authorized 150,000,000 shares; | |||||||
| Issued and outstanding - 39,286,079 shares in 2006 and 38,737,016 in 2005 (including restricted stock) | 120,508 | 110,706 | |||||
| Common stock held in trust for savings restoration plan (58,632 shares in 2006 and 58,156 in 2005) | (1,291 | ) | (1,284 | ) | |||
| Unearned compensation on restricted stock (109,000 shares in 2005) | - | (966 | ) | ||||
| Accumulated other comprehensive income (loss): | |||||||
| Unrealized gain on available-for-sale securities | - | 23 | |||||
| Foreign currency translation adjustment | 21,522 | 14,114 | |||||
| Gain on derivative financial instruments | 654 | 776 | |||||
| Pension and other postretirement benefit adjustments | (21,211 | ) | (2,434 | ) | |||
| Retained earnings | 396,413 | 364,427 | |||||
| Total shareholders' equity | 516,595 | 485,362 | |||||
| Total liabilities and shareholders' equity | $ | 781,787 | $ | 781,758 | |||
| Years Ended December 31 | 2006 | 2005 | 2004 | |||||||
| (In Thousands) | ||||||||||
Cash flows from operating activities: | ||||||||||
| Net income | $ | 38,201 | $ | 16,229 | $ | 29,181 | ||||
| Adjustments for noncash items: | ||||||||||
| Depreciation | 44,132 | 38,490 | 34,092 | |||||||
| Amortization of intangibles | 149 | 299 | 330 | |||||||
| Deferred income taxes | 10,155 | 9,217 | 1,947 | |||||||
| Accrued pension income and postretirement benefits | 3,178 | (1,979 | ) | (3,999 | ) | |||||
| Stock option-based compensation expense | 970 | - | - | |||||||
| Loss from write-down of investment in Novalux | - | 5,000 | - | |||||||
| Gain on sale of assets | (317 | ) | (4,174 | ) | (7,560 | ) | ||||
| Loss on asset impairments and divestitures | 1,150 | 9,378 | 13,811 | |||||||
| Changes in assets and liabilities, net of effects from acquisitions and divestitures: | ||||||||||
| Accounts and notes receivable | 151 | (3,361 | ) | (31,711 | ) | |||||
| Inventories | (5,080 | ) | 2,803 | (13,962 | ) | |||||
| Income taxes recoverable | 1,991 | (12,966 | ) | 61,538 | ||||||
| Prepaid expenses and other | (275 | ) | 530 | (258 | ) | |||||
| Accounts payable and accrued expenses | 11,592 | (3,590 | ) | 12,269 | ||||||
| Other, net | (1,392 | ) | (2,173 | ) | (1,858 | ) | ||||
| Net cash provided by operating activities | 104,605 | 53,703 | 93,820 | |||||||
Cash flows from investing activities: | ||||||||||
| Capital expenditures | (40,573 | ) | (62,543 | ) | (55,651 | ) | ||||
| Acquisitions | - | - | (1,420 | ) | ||||||
| Novalux investment | (542 | ) | (1,095 | ) | (5,000 | ) | ||||
| Proceeds from the sale of assets and property disposals | 475 | 8,018 | 10,209 | |||||||
| Other, net | - | 636 | (310 | ) | ||||||
| Net cash used in investing activities | (40,640 | ) | (54,984 | ) | (52,172 | ) | ||||
Cash flows from financing activities: | ||||||||||
| Dividends paid | (6,221 | ) | (6,190 | ) | (6,154 | ) | ||||
| Debt principal payments and financing costs | (54,530 | ) | (147,846 | ) | (72,750 | ) | ||||
| Borrowings | 4,000 | 156,500 | 36,573 | |||||||
| Proceeds from exercise of stock options | 9,702 | 1,130 | 1,871 | |||||||
| Net cash (used in) provided by financing activities | (47,049 | ) | 3,594 | (40,460 | ) | |||||
Effect of exchange rate changes on cash | 548 | (1,873 | ) | 1,863 | ||||||
Increase in cash and cash equivalents | 17,464 | 440 | 3,051 | |||||||
Cash and cash equivalents at beginning of period | 23,434 | 22,994 | 19,943 | |||||||
Cash and cash equivalents at end of period | $ | 40,898 | $ | 23,434 | $ | 22,994 | ||||
| Supplemental cash flow information: | ||||||||||
| Interest payments (net of amount capitalized) | $ | 5,734 | $ | 4,388 | $ | 3,264 | ||||
| Income tax payments (refunds), net | $ | 7,828 | $ | 14,915 | $ | (50,006 | ) | |||
See accompanying notes to financial statements. | ||||||||||
| Accumulated Other | |||||||||||||||||||||||||||||||
| Comprehensive Income (Loss) | |||||||||||||||||||||||||||||||
| Unrealized | Gain | Pension & | |||||||||||||||||||||||||||||
| Trust for | Unearned | Gain on | Foreign | (Loss) on | Other Post- | Total | |||||||||||||||||||||||||
| Savings | Restricted | Available- | Currency | Derivative | retirement | Share- | |||||||||||||||||||||||||
| Common Stock | Retained | Restora- | Stock | for-Sale | Trans- | Financial | Benefit | holders' | |||||||||||||||||||||||
| Shares | Amount | Earnings | tion Plan | Compensation | Securities | lation | Instruments | Adjust. | Equity | ||||||||||||||||||||||
| (In Thousands, Except Share and Per-Share Data) | |||||||||||||||||||||||||||||||
| Balance December 31, 2003 | 38,176,821 | $ | 104,991 | $ | 331,289 | $ | (1,212 | ) | $ | - | $ | 2,770 | $ | 9,997 | $ | 444 | $ | (880 | ) | $ | 447,399 | ||||||||||
| Comprehensive income (loss): | |||||||||||||||||||||||||||||||
| Net income | - | - | 29,181 | - | - | - | - | - | - | 29,181 | |||||||||||||||||||||
| Other comprehensive income (loss): | |||||||||||||||||||||||||||||||
| Available-for-sale securities adjustment, net of reclassification adjustment (net of tax of $1,556) | - | - | - | - | - | (2,770 | ) | - | - | - | (2,770 | ) | |||||||||||||||||||
Foreign currency translation adjustment (net of tax of $4,500) | - | - | - | - | - | - | 8,404 | - | - | 8,404 | |||||||||||||||||||||
| Reclassification of foreign currency translation loss realized on the sale of the films business in Argentina (net of tax of $625) | - | - | - | - | - | - | 1,161 | - | - | 1,161 | |||||||||||||||||||||
Derivative financial instruments adjustment (net of tax of $247) | - | - | - | - | - | - | - | 440 | - | 440 | |||||||||||||||||||||
| Minimum pension liability adjustment (net of tax of $149) | - | - | - | - | - | - | - | - | (276 | ) | (276 | ) | |||||||||||||||||||
| Comprehensive income | 36,140 | ||||||||||||||||||||||||||||||
| Cash dividends declared ($.16 per share) | - | - | (6,154 | ) | - | - | - | - | - | - | (6,154 | ) | |||||||||||||||||||
| Restricted stock grant, net of forfeitures | 120,000 | 1,674 | - | - | (1,674 | ) | - | - | - | - | - | ||||||||||||||||||||
| Restricted stock amortization | - | - | - | - | 272 | - | - | - | - | 272 | |||||||||||||||||||||
Issued upon exercise of stock options (including related income tax benefits of $868) & other | 300,701 | 2,785 | - | - | - | - | - | - | - | 2,785 | |||||||||||||||||||||
Tredegar common stock purchased by trust for savings restoration plan | - | - | 62 | (62 | ) | - | - | - | - | - | - | ||||||||||||||||||||
| Balance December 31, 2004 | 38,597,522 | 109,450 | 354,378 | (1,274 | ) | (1,402 | ) | - | 19,562 | 884 | (1,156 | ) | 480,442 | ||||||||||||||||||
| Comprehensive income (loss): | |||||||||||||||||||||||||||||||
| Net income | - | - | 16,229 | - | - | - | - | - | - | 16,229 | |||||||||||||||||||||
| Other comprehensive income (loss): | |||||||||||||||||||||||||||||||
Available-for-sale securities adjustment, net of reclassification adjustment (net of tax of $13) | - | - | - | - | - | 23 | - | - | - | 23 | |||||||||||||||||||||
| Foreign currency translation adjustment (net of tax of $2,933) | - | - | - | - | - | - | (5,448 | ) | - | - | (5,448 | ) | |||||||||||||||||||
| Derivative financial instruments adjustment (net of tax of $60) | - | - | - | - | - | - | - | (108 | ) | - | (108 | ) | |||||||||||||||||||
Minimum pension liability adjustment (net of tax of $630) | - | - | - | - | - | - | - | - | (1,278 | ) | (1,278 | ) | |||||||||||||||||||
| Comprehensive income | 9,418 | ||||||||||||||||||||||||||||||
| Cash dividends declared ($.16 per share) | - | - | (6,190 | ) | - | - | - | - | - | - | (6,190 | ) | |||||||||||||||||||
| Restricted stock grant, net of forfeitures and vested shares | (11,000 | ) | (49 | ) | - | - | 49 | - | - | - | - | - | |||||||||||||||||||
| Restricted stock amortization | - | - | - | - | 387 | - | - | - | - | 387 | |||||||||||||||||||||
Issued upon exercise of stock options (including related income tax benefits of $175) & other | 150,494 | 1,305 | - | - | - | - | - | - | - | 1,305 | |||||||||||||||||||||
Tredegar common stock purchased by trust for savings restoration plan | - | - | 10 | (10 | ) | - | - | - | - | - | - | ||||||||||||||||||||
| Balance December 31, 2005 | 38,737,016 | 110,706 | 364,427 | (1,284 | ) | (966 | ) | 23 | 14,114 | 776 | (2,434 | ) | 485,362 | ||||||||||||||||||
| Comprehensive income (loss): | |||||||||||||||||||||||||||||||
| Net income | - | - | 38,201 | - | - | - | - | - | - | 38,201 | |||||||||||||||||||||
| Other comprehensive income (loss): | |||||||||||||||||||||||||||||||
| Available-for-sale securities adjustment, net of reclassification adjustment (net of tax of $13) | - | - | - | - | - | (23 | ) | - | - | - | (23 | ) | |||||||||||||||||||
Foreign currency translation adjustment (net of tax of $3,921) | - | - | - | - | - | - | 7,408 | - | - | 7,408 | |||||||||||||||||||||
| Derivative financial instruments adjustment (net of tax of $60) | - | - | - | - | - | - | - | (122 | ) | - | (122 | ) | |||||||||||||||||||
Minimum pension liability adjustment (net of tax of $422) | - | - | - | - | - | - | - | - | 821 | 821 | |||||||||||||||||||||
| Comprehensive income | 46,285 | ||||||||||||||||||||||||||||||
| Cumulative adjustment for the adoption of SFAS No. 158 relating to pension and other postretirement benefits (net of tax of $11,354) | - | - | - | - | - | - | - | - | (19,598 | ) | (19,598 | ) | |||||||||||||||||||
| Cash dividends declared ($.16 per share) | - | - | (6,221 | ) | - | - | - | - | - | - | (6,221 | ) | |||||||||||||||||||
| Stock-based Compensation expense | (25,500 | ) | 1,066 | - | - | - | - | - | - | - | 1,066 | ||||||||||||||||||||
| Restricted stock amortization | - | (966 | ) | - | - | 966 | - | - | - | - | - | ||||||||||||||||||||
| Issued upon exercise of stock options (including related income tax benefits of $678) & other | 574,563 | 9,702 | - | - | - | - | - | - | - | 9,702 | |||||||||||||||||||||
| Tredegar common stock purchased by trust for savings restoration plan | - | - | 6 | (7 | ) | - | - | - | - | - | (1 | ) | |||||||||||||||||||
| Balance December 31, 2006 | 39,286,079 | $ | 120,508 | $ | 396,413 | $ | (1,291 | ) | $ | - | $ | - | $ | 21,522 | $ | 654 | $ | (21,211 | ) | $ | 516,595 | ||||||||||
See accompanying notes to financial statements. | |||||||||||||||||||||||||||||||
Tredegar Corporation and Subsidiaries |
|
|
|
|
|
|
|
|
|
|
|
Years Ended December 31 |
| 2007 |
| 2006 |
| 2005 |
| |||
(In Thousands) |
|
|
|
|
|
|
|
|
|
|
|
|
|
|
|
|
|
|
|
|
|
Cash flows from operating activities: |
|
|
|
|
|
|
|
|
|
|
Net income |
| $ | 15,249 |
| $ | 38,201 |
| $ | 16,229 |
|
Adjustments for noncash items: |
|
|
|
|
|
|
|
|
|
|
Depreciation |
|
| 45,892 |
|
| 44,132 |
|
| 38,490 |
|
Amortization of intangibles |
|
| 149 |
|
| 149 |
|
| 299 |
|
Deferred income taxes |
|
| (24,241 | ) |
| 10,155 |
|
| 9,217 |
|
Accrued pension and postretirement benefits |
|
| (1,735 | ) |
| 3,178 |
|
| (1,979 | ) |
Stock option-based compensation expense |
|
| 978 |
|
| 970 |
|
| — |
|
Loss from write-down of investment |
|
| 2,095 |
|
| — |
|
| 5,000 |
|
Gain on sale of assets |
|
| (2,699 | ) |
| (317 | ) |
| (4,174 | ) |
Loss on asset impairments and divestitures |
|
| 32,287 |
|
| 1,150 |
|
| 9,378 |
|
Changes in assets and liabilities, net of effects of acquisitions and divestitures: |
|
|
|
|
|
|
|
|
|
|
Accounts and notes receivable |
|
| 15,786 |
|
| 151 |
|
| (3,361 | ) |
Inventories |
|
| 4,099 |
|
| (5,080 | ) |
| 2,803 |
|
Income taxes recoverable |
|
| 10,478 |
|
| 1,991 |
|
| (12,966 | ) |
Prepaid expenses and other |
|
| 764 |
|
| (275 | ) |
| 530 |
|
Accounts payable and accrued expenses |
|
| (2,932 | ) |
| 11,592 |
|
| (3,590 | ) |
Other, net |
|
| (616 | ) |
| (1,392 | ) |
| (2,173 | ) |
|
|
|
|
| ||||||
Net cash provided by operating activities |
|
| 95,554 |
|
| 104,605 |
|
| 53,703 |
|
|
|
|
|
| ||||||
Cash flows from investing activities: |
|
|
|
|
|
|
|
|
|
|
Capital expenditures |
|
| (20,643 | ) |
| (40,573 | ) |
| (62,543 | ) |
Investments, including Harbinger ($10 million), a drug delivery company ($6.5 million) and real estate ($6.2 million) in 2007 |
|
| (23,513 | ) |
| (542 | ) |
| (1,095 | ) |
Proceeds from the sale of assets and property disposals and reimbursements from customers for purchases of equipment |
|
| 7,871 |
|
| 475 |
|
| 8,018 |
|
Other, net |
|
| — |
|
| — |
|
| 636 |
|
|
|
|
| |||||||
Net cash used in investing activities |
|
| (36,285 | ) |
| (40,640 | ) |
| (54,984 | ) |
|
|
|
| |||||||
Cash flows from financing activities: |
|
|
|
|
|
|
|
|
|
|
Dividends paid |
|
| (6,126 | ) |
| (6,221 | ) |
| (6,190 | ) |
Debt principal payments |
|
| (39,964 | ) |
| (54,530 | ) |
| (147,846 | ) |
Borrowings |
|
| 59,500 |
|
| 4,000 |
|
| 156,500 |
|
Repurchases of Tredegar common stock, net of settlement payable of $3,368 |
|
| (73,959 | ) |
| — |
|
| — |
|
Proceeds from exercise of stock options |
|
| 6,471 |
|
| 9,702 |
|
| 1,130 |
|
|
|
|
| |||||||
Net cash used in financing activities |
|
| (54,078 | ) |
| (47,049 | ) |
| 3,594 |
|
|
|
|
| |||||||
Effect of exchange rate changes on cash |
|
| 2,128 |
|
| 548 |
|
| (1,873 | ) |
|
|
|
| |||||||
Increase in cash and cash equivalents |
|
| 7,319 |
|
| 17,464 |
|
| 440 |
|
Cash and cash equivalents at beginning of period |
|
| 40,898 |
|
| 23,434 |
|
| 22,994 |
|
|
|
|
| |||||||
Cash and cash equivalents at end of period |
| $ | 48,217 |
| $ | 40,898 |
| $ | 23,434 |
|
| ||||||||||
Supplemental cash flow information: |
|
|
|
|
|
|
|
|
|
|
Interest payments (net of amount capitalized) |
| $ | 2,712 |
| $ | 5,734 |
| $ | 4,388 |
|
Income tax payments (refunds), net |
|
| 16,989 |
|
| 7,828 |
|
| 14,915 |
|
IndexSee accompanying notes to financial statements.
Tredegar Corporation and Subsidiaries |
|
|
|
|
|
|
|
|
|
|
|
|
|
|
|
|
|
|
|
|
|
|
|
|
|
|
|
|
|
|
|
|
|
|
|
|
|
|
|
|
|
|
|
|
| Accumulated Other |
|
|
| |||||||||||||||||||||
|
|
|
|
|
|
|
|
|
|
|
|
| ||||||||||||||||||||||
|
|
|
|
|
|
|
|
|
|
|
|
| ||||||||||||||||||||||
|
|
|
|
|
|
|
|
|
| Unrealized |
|
|
| Gain |
| Pension & |
|
|
| |||||||||||||||
|
|
|
|
|
| Trust for |
| Unearned |
|
| Foreign |
|
|
| Total |
| ||||||||||||||||||
|
| Common Stock |
|
|
|
|
|
|
|
|
|
| ||||||||||||||||||||||
|
|
| Retained |
|
|
|
|
|
|
|
| |||||||||||||||||||||||
|
| Shares |
| Amount |
|
|
|
|
|
|
|
|
| |||||||||||||||||||||
(In Thousands, Except Share |
|
|
|
|
|
|
|
|
|
|
|
|
|
|
|
|
|
|
|
|
|
|
|
|
|
|
|
|
|
| ||||
| ||||||||||||||||||||||||||||||||||
Balance December 31, 2004 |
| 38,597,522 |
| $ | 109,450 |
| $ | 354,378 |
| $ | (1,274 | ) |
| $ | (1,402 | ) |
|
| $ | — |
|
| $ | 19,562 |
| $ | 884 |
| $ | (1,156 | ) | $ | 480,442 |
|
Comprehensive income (loss): |
|
|
|
|
|
|
|
|
|
|
|
|
|
|
|
|
|
|
|
|
|
|
|
|
|
|
|
|
|
|
|
|
|
|
Net income |
| — |
|
| — |
|
| 16,229 |
|
| — |
|
|
| — |
|
|
|
| — |
|
|
| — |
|
| — |
|
| — |
|
| 16,229 |
|
Other comprehensive income (loss): |
|
|
|
|
|
|
|
|
|
|
|
|
|
|
|
|
|
|
|
|
|
|
|
|
|
|
|
|
|
|
|
|
|
|
Available-for-sale securities adjustment, net of reclassification adjustment (net of tax of $13) |
| — |
|
| — |
|
| — |
|
| — |
|
|
| — |
|
|
|
| 23 |
|
|
| — |
|
| — |
|
| — |
|
| 23 |
|
Foreign currency translation adjustment (net of tax of $2,933) |
| — |
|
| — |
|
| — |
|
| — |
|
|
| — |
|
|
|
| — |
|
|
| (5,448 | ) |
| — |
|
| — |
|
| (5,448 | ) |
Derivative financial instruments adjustment (net of tax of $60) |
| — |
|
| — |
|
| — |
|
| — |
|
|
| — |
|
|
|
| — |
|
|
| — |
|
| (108 | ) |
| — |
|
| (108 | ) |
Minimum pension liability adjustment (net of tax of $630) |
| — |
|
| — |
|
| — |
|
| — |
|
|
| — |
|
|
|
| — |
|
|
| — |
|
| — |
|
| (1,278 | ) |
| (1,278 | ) |
|
|
|
|
|
|
|
|
|
|
|
|
|
|
|
|
|
|
|
|
|
|
|
|
|
|
|
|
|
|
|
| |||
Comprehensive income |
|
|
|
|
|
|
|
|
|
|
|
|
|
|
|
|
|
|
|
|
|
|
|
|
|
|
|
|
|
|
|
| 9,418 |
|
Cash dividends declared |
| — |
|
| — |
|
| (6,190 | ) |
| — |
|
|
| — |
|
|
|
| — |
|
|
| — |
|
| — |
|
| — |
|
| (6,190 | ) |
Restricted stock grant, net of forfeitures and vested shares |
| (11,000 | ) |
| (49 | ) |
| — |
|
| — |
|
|
| 49 |
|
|
|
| — |
|
|
| — |
|
| — |
|
| — |
|
| — |
|
Restricted stock amortization |
| — |
|
| — |
|
| — |
|
| — |
|
|
| 387 |
|
|
|
| — |
|
|
| — |
|
| — |
|
| — |
|
| 387 |
|
Issued upon exercise of stock options (including related income tax benefits of $175) & other |
| 150,494 |
|
| 1,305 |
|
| — |
|
| — |
|
|
| — |
|
|
|
| — |
|
|
| — |
|
| — |
|
| — |
|
| 1,305 |
|
Tredegar common stock purchased by trust for savings restoration plan |
| — |
|
| — |
|
| 10 |
|
| (10 | ) |
|
| — |
|
|
|
| — |
|
|
| — |
|
| — |
|
| — |
|
| — |
|
Balance December 31, 2005 |
| 38,737,016 |
|
| 110,706 |
|
| 364,427 |
|
| (1,284 | ) |
|
| (966 | ) |
|
|
| 23 |
|
|
| 14,114 |
|
| 776 |
|
| (2,434 | ) |
| 485,362 |
|
Comprehensive income (loss): |
|
|
|
|
|
|
|
|
|
|
|
|
|
|
|
|
|
|
|
|
|
|
|
|
|
|
|
|
|
|
|
|
|
|
Net income |
| — |
|
| — |
|
| 38,201 |
|
| — |
|
|
| — |
|
|
|
| — |
|
|
| — |
|
| — |
|
| — |
|
| 38,201 |
|
Other comprehensive income (loss): |
|
|
|
|
|
|
|
|
|
|
|
|
|
|
|
|
|
|
|
|
|
|
|
|
|
|
|
|
|
|
|
|
|
|
Available-for-sale securities adjustment, net of reclassification adjustment (net of tax of $13) |
| — |
|
| — |
|
| — |
|
| — |
|
|
| — |
|
|
|
| (23 | ) |
|
| — |
|
| — |
|
| — |
|
| (23 | ) |
Foreign currency translation adjustment (net of tax of $3,921) |
| — |
|
| — |
|
| — |
|
| — |
|
|
| — |
|
|
|
| — |
|
|
| 7,408 |
|
| — |
|
| — |
|
| 7,408 |
|
Derivative financial instruments adjustment (net of tax of $60) |
| — |
|
| — |
|
| — |
|
| — |
|
|
| — |
|
|
|
| — |
|
|
| — |
|
| (122 | ) |
| — |
|
| (122 | ) |
Minimum pension liability adjustment (net of tax of $422) |
| — |
|
| — |
|
| — |
|
| — |
|
|
| — |
|
|
|
| — |
|
|
| — |
|
| — |
|
| 821 |
|
| 821 |
|
|
|
|
|
|
|
|
|
|
|
|
|
|
|
|
|
|
|
|
|
|
|
|
|
|
|
|
|
|
|
|
| |||
Comprehensive income |
|
|
|
|
|
|
|
|
|
|
|
|
|
|
|
|
|
|
|
|
|
|
|
|
|
|
|
|
|
|
|
| 46,285 |
|
Cumulative adjustment for the adoption of SFAS No. 158 relating to pension and other postretirement benefits (net of tax of $11,354) |
| — |
|
| — |
|
| — |
|
| — |
|
|
| — |
|
|
|
| — |
|
|
| — |
|
| — |
|
| (19,598 | ) |
| (19,598 | ) |
Cash dividends declared |
| — |
|
| — |
|
| (6,221 | ) |
| — |
|
|
| — |
|
|
|
| — |
|
|
| — |
|
| — |
|
| — |
|
| (6,221 | ) |
Stock-based compensation expense |
| (25,500 | ) |
| 1,066 |
|
| — |
|
| — |
|
|
| — |
|
|
|
| — |
|
|
| — |
|
| — |
|
| — |
|
| 1,066 |
|
Restricted stock amortization |
| — |
|
| (966 | ) |
| — |
|
| — |
|
|
| 966 |
|
|
|
| — |
|
|
| — |
|
| — |
|
| — |
|
| — |
|
Issued upon exercise of stock options (including related income tax benefits of $678) & other |
| 574,563 |
|
| 9,702 |
|
| — |
|
| — |
|
|
| — |
|
|
|
| — |
|
|
| — |
|
| — |
|
| — |
|
| 9,702 |
|
Tredegar common stock purchased by trust for savings restoration plan |
| — |
|
| — |
|
| 6 |
|
| (7 | ) |
|
| — |
|
|
|
| — |
|
|
| — |
|
| — |
|
| — |
|
| (1 | ) |
Balance December 31, 2006 |
| 39,286,079 |
|
| 120,508 |
|
| 396,413 |
|
| (1,291 | ) |
|
| — |
|
|
|
| — |
|
|
| 21,522 |
|
| 654 |
|
| (21,211 | ) |
| 516,595 |
|
Comprehensive income (loss): |
|
|
|
|
|
|
|
|
|
|
|
|
|
|
|
|
|
|
|
|
|
|
|
|
|
|
|
|
|
|
|
|
|
|
Net income |
| — |
|
| — |
|
| 15,249 |
|
| — |
|
|
| — |
|
|
|
| — |
|
|
| — |
|
| — |
|
| — |
|
| 15,249 |
|
Other comprehensive income (loss): |
|
|
|
|
|
|
|
|
|
|
|
|
|
|
|
|
|
|
|
|
|
|
|
|
|
|
|
|
|
|
|
|
|
|
Foreign currency translation adjustment (net of tax of $10,428) |
| — |
|
| — |
|
| — |
|
| — |
|
|
| — |
|
|
|
| — |
|
|
| 19,088 |
|
| — |
|
| — |
|
| 19,088 |
|
Derivative financial instruments adjustment (net of tax of $1,166) |
| — |
|
| — |
|
| — |
|
| — |
|
|
| — |
|
|
|
| — |
|
|
| — |
|
| (1,858 | ) |
| — |
|
| (1,858 | ) |
Net actuarial gains or losses and prior service costs (net of tax of $10,209) |
| — |
|
| — |
|
| — |
|
| — |
|
|
| — |
|
|
|
| — |
|
|
| — |
|
| — |
|
| 16,218 |
|
| 16,218 |
|
Amortization of net actuarial gains or losses and prior service costs (net of tax of $702) |
| — |
|
| — |
|
| — |
|
| — |
|
|
| — |
|
|
|
| — |
|
|
| — |
|
| — |
|
| 1,226 |
|
| 1,226 |
|
|
|
|
|
|
|
|
|
|
|
|
|
|
|
|
|
|
|
|
|
|
|
|
|
|
|
|
|
|
|
|
| |||
Comprehensive income |
|
|
|
|
|
|
|
|
|
|
|
|
|
|
|
|
|
|
|
|
|
|
|
|
|
|
|
|
|
|
|
| 49,923 |
|
Cash dividends declared |
| — |
|
| — |
|
| (6,126 | ) |
| — |
|
|
| — |
|
|
|
| — |
|
|
| — |
|
| — |
|
| — |
|
| (6,126 | ) |
Stock-based compensation expense |
| (10,000 | ) |
| 1,654 |
|
| — |
|
| — |
|
|
| — |
|
|
|
| — |
|
|
| — |
|
| — |
|
| — |
|
| 1,654 |
|
Issued upon exercise of stock options (including related income tax benefits of $491) & other |
| 322,871 |
|
| 6,609 |
|
| — |
|
| — |
|
|
| — |
|
|
|
| — |
|
|
| — |
|
| — |
|
| — |
|
| 6,609 |
|
Repurchases of Tredegar common stock |
| (4,833,500 | ) |
| (77,327 | ) |
| — |
|
| — |
|
|
| — |
|
|
|
| — |
|
|
| — |
|
| — |
|
| — |
|
| (77,327 | ) |
Tredegar common stock purchased by trust for savings restoration plan |
| — |
|
| — |
|
| 12 |
|
| (12 | ) |
|
| — |
|
|
|
| — |
|
|
| — |
|
| — |
|
| — |
|
| — |
|
Balance December 31, 2007 |
| 34,765,450 |
| $ | 51,444 |
| $ | 405,548 |
| $ | (1,303 | ) |
| $ | — |
|
|
| $ | — |
|
| $ | 40,610 |
| $ | (1,204 | ) | $ | (3,767 | ) | $ | 491,328 |
|
NOTES TO FINANCIAL STATEMENTSSee accompanying notes to financial statements.
Tredegar Corporation and Subsidiaries |
1 | SUMMARY OF SIGNIFICANT ACCOUNTING POLICIES |
Organization and Nature of Operations.Tredegar Corporation and subsidiaries (“Tredegar”(collectively “Tredegar,” “we,” “us” or “our”) are engaged in the manufacture of plastic films and aluminum extrusions. See Note 15 regarding restructurings and Note 17 regarding discontinued operations.
Basis of Presentation.The consolidated financial statements include the accounts and operations of Tredegar and all of its majority-owned subsidiaries. Intercompany accounts and transactions have been eliminated. Prior periods have been reclassified to conform to the current period presentation of discontinued operations.
The preparation of financial statements in conformity with generally accepted accounting principles requires us to make estimates and assumptions that affect the reported amounts of revenues, expenses, assets and liabilities and disclosure of contingent assets and liabilities at the date of the financial statements. Actual results could differ from those estimates.
Foreign Currency Translation.The financial statements of foreign subsidiaries, where the local currency is the functional currency, are translated into U.S. Dollars using exchange rates in effect at the period end for assets and liabilities and average exchange rates during each reporting period for results of operations. Adjustments resulting from the translation of these financial statements are reflected as a separate component of shareholders’ equity. We have no foreign subsidiaries where the U.S. Dollar is the functional currency.
Transaction and remeasurement gains or losses included in income were not material in 2007, 2006 2005 and 2004.2005. These amounts do not include the effects between reporting periods that exchange rate changes have on income of our foreign locations that result from translation into U.S. Dollars.
Cash and Cash Equivalents.Cash and cash equivalents consist of cash on hand in excess of daily operating requirements and highly liquid investments with original maturities of three months or less. At December 31, 20062007 and 2005,2006, Tredegar had cash and cash equivalents of $40,898$48,217 and $23,434,$40,898, respectively, including funds held in foreign locations of $24,559 and $19,118, and $14,890, respectively.
Our policy permits investment of excess cash in marketable securities that have the highest credit ratings and maturities of less than one year. The primary objectives of the policy are safety of principal and liquidity.
Accounts and Notes Receivable. Accounts receivable are stated at the amount invoiced to customers less allowances for doubtful accounts and sales returns. Accounts receivable are non-interest bearing and arise from the sale of product to customers under typical industry trade terms. Notes receivable are not significant. Past due amounts are determined based on established terms and charged-off when deemed uncollectible. The allowance for doubtful accounts is determined based on our assessment of probable losses taking into account past due amounts, customer credit profile, historical experience and current economic conditions. Other receivables include insurance recoveries due within one year and value-added taxes related to certain foreign subsidiaries.
Inventories.Inventories are stated at the lower of cost or market, with cost determined on the last-in, first-out (“LIFO”) basis, the weighted average cost or the first-in, first-out basis. Cost elements included in work-in-process and finished goods inventories are raw materials, direct labor and manufacturing overhead.
Property, Plant and Equipment.Accounts include costs of assets constructed or purchased, related delivery and installation costs and interest incurred on significant capital projects during their construction periods. Expenditures for renewals and betterments also are capitalized, but expenditures for repairs and maintenance are expensed as incurred. The cost and accumulated depreciation applicable to assets retired or sold are removed from the respective accounts, and gains or losses thereon are included in income.
Index On January 1, 2007, we adopted Financial Accounting Standards Board (“FASB”) Staff Position (“FSP”) No. AUG AIR-1, Accounting for Planned Major Maintenance Activities, which had no impact on our results of operations or financial condition reported in prior periods. The FSP eliminates the accrual method of accounting for major maintenance activities, but continues to permit the use of the direct expensing, built-in overhaul and deferral methods.
Property, plant and equipment include capitalized interest of $577 in 2007, $885 in 2006 $1,387and $1,179 in 2005 and $762 in 2004.
Depreciation is computed primarily by the straight-line method based on the estimated useful lives of the assets, which range from 15 to 4025 years for buildings and land improvements and 3 to 2511 years for machinery and equipment. The average depreciation period for machinery and equipment is approximately 1310 years in Film Products and 15 yearsfor the continuing operations of Aluminum Extrusions.
Investments in Aluminum Extrusions.Private Entities with Less Than or Equal to 50% Voting Ownership Interest. We account for our investments in private entities where our voting ownership is less than or equal to 50% based on the facts and circumstances surrounding the investment at the time the investment is made. We are required to account for investments under the consolidation method in situations where we are the primary beneficiary of a variable interest entity (we have no investments that meet this condition). The primary beneficiary is the party in a variable interest entity that will absorb a majority of the entity’s expected losses, receive a majority of the entity’s expected residual returns, or both. If we are not deemed the primary beneficiary in an investment in a private entity then we select either: (i) the fair value method or (ii) either the (a) the cost method if we do not have significant influence over operating and financial policies of the company or (b) the equity method if we do have significant influence.
FASB Statement No. 157, Fair Value Measurements, requires disclosure of the level within the fair value hierarchy in which fair value measurements in their entirety fall, segregating fair value measurements using quoted prices in active markets for identical assets or liabilities (Level 1), significant other observable inputs (Level 2), and significant unobservable inputs (Level 3).
Goodwill and Other Intangibles.The excess of the purchase price over the fair value of identifiable net assets of acquired companies is allocated to goodwill. We assess goodwill for impairment when events or circumstances indicate the carrying value may not be recoverable, or, at a minimum, on an annual basis as of December 1 of each year. Impairment reviews may result in recognition of losses. We have made determinations as to what our reporting units are and what amounts of goodwill, intangible assets, other assets and liabilities should be allocated to those reporting units.
The components of goodwill and other intangibles at December 31, 20062007 and 2005,2006, and related amortization periods for continuing operations are as follows:
|
|
|
|
|
|
|
|
|
|
|
December 31 |
| 2007 |
| 2006 |
|
| Amortization Periods |
| ||
Carrying value of goodwill: |
|
|
|
|
|
|
|
|
|
|
Film Products |
| $ | 104,507 |
| $ | 103,562 |
|
| Not amortized |
|
Aluminum Extrusions |
|
| 30,935 |
|
| 28,094 |
|
| Not amortized |
|
Total carrying value of goodwill |
|
| 135,442 |
|
| 131,656 |
|
|
|
|
Carrying value of other intangibles: |
|
|
|
|
|
|
|
|
|
|
Film Products (cost basis of $1,172 in 2007 and 2006) |
|
| 465 |
|
| 581 |
|
| Not more than 17 yrs. |
|
Total carrying value of other intangibles |
|
| 465 |
|
| 581 |
|
|
|
|
Total carrying value of goodwill and other intangibles |
| $ | 135,907 |
| $ | 132,237 |
|
|
|
|
Excluded from the table above is goodwill for the Aluminum Extrusions reporting unit of $6,459 which was allocated to discontinued aluminum extrusions operations in Canada. This goodwill was allocated using the estimated fair value of the aluminum extrusions business in Canada (the after-tax cash flow expected from disposal of approximately $30,000 when it was classified as held for sale at the end of December 2007), and the estimated fair value of the aluminum extrusions business in the U.S. retained. The fair value of the aluminum extrusions business in the U.S. was estimated at approximately $145,000 using comparable enterprise value-to-EBITDA multiples as of December 31, 2007. See Note 17 for more information on discontinued operations.
| December 31 | 2006 | 2005 | Amortization Periods | |||||||
| Carrying value of goodwill: | ||||||||||
| Film Products | $ | 103,562 | $ | 102,732 | Not amortized | |||||
| Aluminum Extrusions | 34,553 | 34,544 | Not amortized | |||||||
| Total carrying value of goodwill | 138,115 | 137,276 | ||||||||
| Carrying value of other intangibles: | ||||||||||
| Film Products (cost basis of $1,172 in 2006 and 2005) | 581 | 712 | Not more than 17 yrs. | |||||||
| Total carrying value of other intangibles | 581 | 712 | ||||||||
| Total carrying value of goodwill and other intangibles | $ | 138,696 | $ | 137,988 | ||||||
A reconciliation of the beginning and ending balances of goodwill and other intangibles for each of the three years in the period ended December 31, 20062007 is as follows:
2006 | 2005 | 2004 | ||||||||
| Goodwill and other intangibles: | ||||||||||
| Net carrying value, beginning of year | $ | 137,988 | $ | 142,983 | $ | 140,548 | ||||
| Amortization | (149 | ) | (299 | ) | (330 | ) | ||||
| Decrease due to sale of AFBS (formerly Therics) assets | - | (4,329 | ) | - | ||||||
| Increase (decrease) due to foreign currency translation and other | 857 | (367 | ) | 2,765 | ||||||
| Total carrying value of goodwill and other intangibles | $ | 138,696 | $ | 137,988 | $ | 142,983 | ||||
|
|
|
|
|
|
|
|
|
|
|
|
| 2007 |
| 2006 |
| 2005 |
| |||
Goodwill and other intangibles: |
|
|
|
|
|
|
|
|
|
|
Net carrying value, beginning of year |
| $ | 132,237 |
| $ | 131,529 |
| $ | 136,524 |
|
Amortization |
|
| (149 | ) |
| (149 | ) |
| (299 | ) |
Decrease due to sale of AFBS (formerly Therics) assets |
|
| — |
|
| — |
|
| (4,329 | ) |
Increase (decrease) due to foreign currency translation and other |
|
| 3,819 |
|
| 857 |
|
| (367 | ) |
Total carrying value of goodwill and other intangibles |
| $ | 135,907 |
| $ | 132,237 |
| $ | 131,529 |
|
Impairment of Long-Lived Assets.We review long-lived assets for possible impairment when events indicate that impairment may exist. For assets to be held and used in operations, if events indicate that an asset may be impaired, we estimate the future unlevered pre-tax cash flows expected to result from the use of the asset and its eventual disposition. Assets are grouped for this purpose at the lowest level for which there are identifiable and independent cash flows. If the sum of these undiscounted pre-tax cash flows is less than the carrying amount of the asset, an impairment loss is recognized. Measurement of the impairment loss is based on the estimated fair value of the asset, generally determined on a discounted after-tax cash flow basis.
Assets to be disposed of are reported at the lower of their carrying amount or estimated fair value less cost to sell, with an impairment loss recognized for any writedown required.
Pension Costs and Postretirement Benefit Costs Other than Pensions.Pension costs and postretirement benefit costs other than pensions are accrued over the period employees provide service to the company. Our policy is to fund our pension plans at amounts not less than the minimum requirements of the Employee Retirement Income Security Act of 1974 and to fund postretirement benefits other than pensions when claims are incurred. In September 2006, the Financial Accounting Standards Board (“FASB”)FASB issued Statement of Financial Accounting Standards (“SFAS”) No. 158, Employers'Employers’ Accounting for Defined Benefit Pension and Other Postretirement Plans, an amendment of FASB Statements No 87, 88, 106 and 132(R),effective forpublic companies for fiscal years ending after December 15, 2006. Accordingly, we were required to recognize the funded status of our pension and other postretirement plans in our December 31, 2006 financial statements, which resulted in a reduction of prepaid pension cost of $27,651, (included in “Other assets and deferred charges” in the consolidated balance sheets), an increase in related liabilities of $3,301, (included in “Other noncurrent liabilities” in the consolidated balance sheets), a decrease in noncurrent deferred income liabilities of $11,354 and a decrease in shareholders’ equity of $19,598. See Note 11 for more information.
Revenue Recognition.Revenue from the sale of products, which is shown net of estimated sales returns and allowances, is recognized when title has passed to the customer, the price of the product is fixed and determinable, and collectibility is reasonably assured. Amounts billed to customers related to freight have been classified as sales in the accompanying consolidated statements of income. The cost of freight has been classified as a separate line in the accompanying consolidated statements of income. Taxes assessed by a governmental authority that are both imposed on and concurrent with a specific revenue-producing transaction between Tredegar and its customers (such as value-added taxes) are accounted for on a net basis and therefore excluded from revenues.
Research & Development (“R&D”) Costs. R&D costs are expensed as incurred and include primarily salaries, wages, employee benefits, equipment depreciation, facility costs and the cost of materials consumed relating to R&D efforts. R&D costs include a reasonable allocation of indirect costs.
Income Taxes.Income taxes are recognized during the period in which transactions enter into the determination of income for financial reporting purposes, with deferred income taxes being provided at enacted statutory tax rates on the differences between the financial reporting and tax bases of assets and liabilities (see Note 14). We accrue U.S. federal income taxes on unremitted earnings of our foreign subsidiaries.
On January 1, 2007, we adopted a new accounting standard for uncertain tax positions (FASB Interpretation No. 48, Accounting for Uncertainty in Income Taxes), which had no impact on our results of operations or financial condition reported in prior periods. Under the new standard, in order to report the benefit of a tax position in our financial statements, we must determine that it is more likely than not that the position will be sustained, based on the technical merits of the position, if the taxing authority examines the position and the dispute is litigated. The determination is made on the basis of all the facts, circumstances and information available as of the reporting date.
Earnings Per Share.Basic earnings per share is computed using the weighted average number of shares of common stock outstanding. Diluted earnings per share is computed using the weighted average common and potentially dilutive common equivalent shares outstanding, determined as follows:
2006 | 2005 | 2004 | ||||||||
| Weighted average shares outstanding used to compute basic earnings per share | 38,670,757 | 38,471,348 | 38,294,996 | |||||||
| Incremental shares attributable to stock options and restricted stock | 260,305 | 125,356 | 211,688 | |||||||
| Shares used to compute diluted earnings per share | 38,931,062 | 38,596,704 | 38,506,684 | |||||||
|
|
|
|
|
|
|
|
|
|
|
|
| 2007 |
| 2006 |
| 2005 |
| |||
Weighted average shares outstanding used to compute basic earnings per share |
|
| 38,532,036 |
|
| 38,670,757 |
|
| 38,471,348 |
|
Incremental shares attributable to stock options and restricted stock |
|
| 156,467 |
|
| 260,305 |
|
| 125,356 |
|
Shares used to compute diluted earnings per share |
|
| 38,688,503 |
|
| 38,931,062 |
|
| 38,596,704 |
|
Incremental shares attributable to stock options and restricted stock are computed using the average market price during the related period. During 2007, 2006 and 2005, 184,960, 1,128,393 and 2004, 1,128,393, 2,024,690 and 2,073,990 of average out-of-the-money options to purchase shares were excluded from the calculation of incremental shares attributable to stock options and restricted stock.
Stock-Based Employee Compensation Plans.Effective January 1, 2006, we adopted SFAS No. 123(R), Share-Based Payment (“SFAS 123(R)”). SFAS 123(R) requires us to record compensation expense for all share-based awards. Because we used the modified prospective method in adopting SFAS 123(R), prior periods have not been restated. In addition, the cumulative adjustment (estimated forfeitures) relating to the adoption of SFAS 123(R) in the first quarter of 2006 of $96,000 has not been separately shown in the income statement due to immateriality.
• | No compensation cost is recognized for fixed stock option or restricted stock grants unless the quoted market price of the stock at the measurement date (ordinarily the date of grant or award) is in excess of the amount the employee is required to pay; and |
• | Compensation cost for SARs is recognized and adjusted up through the date of exercise or forfeiture based on the estimated number of SARs expected to be exercised multiplied by the difference between the market price of our stock and the amount the employee is required to pay (there were no SARs outstanding at December 31, 2005). |
Had compensation cost for stock option grants been determined in 2005 and 2004 based on the fair value at the grant dates, our income and diluted earnings per share from continuing operations would have been reduced to the pro forma amounts indicated below:
| 2005 | 2004 | ||||||
| Income from continuing operations: | |||||||
| As reported | $ | 16,229 | $ | 26,260 | |||
| Pro forma for stock option-based employee compensation cost, net of tax, based on the fair value method | (1,073 | ) | (2,133 | ) | |||
| Pro forma income from continuing operations | $ | 15,156 | $ | 24,127 | |||
| Basic earnings per share from continuing operations: | |||||||
| As reported | $ | .42 | $ | .69 | |||
| Pro forma | .39 | .63 | |||||
| Diluted earnings per share from continuing operations: | |||||||
| As reported | $ | .42 | $ | .68 | |||
| Pro forma | .39 | .63 | |||||
|
|
|
|
|
|
| 2005 |
| |
Income from continuing operations: |
|
|
|
|
As reported |
| $ | 13,372 |
|
Pro forma for stock option-based employee compensation cost, net of tax, based on the fair value method |
|
| (1,073 | ) |
Pro forma income from continuing operations |
| $ | 12,299 |
|
Basic earnings per share from continuing operations: |
|
|
|
|
As reported |
| $ | .35 |
|
Pro forma |
|
| .32 |
|
Diluted earnings per share from continuing operations: |
|
|
|
|
As reported |
| $ | .35 |
|
Pro forma |
|
| .32 |
|
Stock option-based compensation expense included in determining net income in 2006 under SFAS 123(R) was $978 ($629 after taxes or 2 cents per share) in 2007 and $970 ($676 after taxes or 2 cents per share). in 2006. Compensation cost related to restricted and phantom stockother stock-based awards included in determining net income from continuing operations was $713 in 2007, $188 in 2006 and $386 in 2005 and $272 in 2004.
The fair value of each option was estimated as of the grant date using the Black-Scholes options-pricing model. The assumptions used in this model for valuing Tredegar stock options granted in 20062007 and 20042006 are as follows (there were no Tredegar stock options granted in 2005):
2006 | 2004 | ||||||
| Dividend yield | 1.1 | % | 1.2 | % | |||
| Weighted average volatility percentage | 38.3 | % | 45.0 | % | |||
| Weighted average risk-free interest rate | 4.7 | % | 3.1 | % | |||
| Holding period (years): | |||||||
| Officers | 6.0 | n/a | |||||
| Management | 5.0 | 5.0 | |||||
| Other employees | n/a | 3.0 | |||||
| Weighted average excercise price at date of grant (also weighted average market price at date of grant): | |||||||
| Officers | $ | 15.22 | n/a | ||||
| Management | 15.32 | $ | 13.97 | ||||
| Other employees | n/a | 13.95 | |||||
|
|
|
|
|
|
|
|
|
| 2007 |
| 2006 |
| ||
Dividend yield |
|
| 1.1 | % |
| 1.1 | % |
Weighted average volatility percentage |
|
| 33.1 | % |
| 38.3 | % |
Weighted average risk-free interest rate |
|
| 3.3 | % |
| 4.7 | % |
Holding period (years): |
|
|
|
|
|
|
|
Officers |
|
| n/a |
|
| 6.0 |
|
Management |
|
| 5.0 |
|
| 5.0 |
|
Other employees |
|
| n/a |
|
| n/a |
|
Weighted average excercise price at date of grant (also weighted average market price at date of grant): |
|
|
|
|
|
|
|
Officers |
|
| n/a |
| $ | 15.22 |
|
Management |
| $ | 14.40 |
|
| 15.32 |
|
Other employees |
|
| n/a |
|
| n/a |
|
The dividend yield is the dividend yield on our common stock at the date of grant, which we believe is a reasonable estimate of the expected yield during the holding period. We calculate expected volatility based on the historical volatility of our common stock using a sequential period of historical data equal to the expected holding period of the option. We have no reason to believe that future volatility is likely to differ from the past. The assumed risk-free interest rate is based on observed interest rates (zero coupon U.S. Treasury debt securities) appropriate for the expected holding period. The expected holding period and forfeiture assumptions are based on historical experience. Estimated forfeiture assumptions are reviewed through the vesting period. Adjustments are made if actual forfeitures differ from previous estimates. The cumulative effect of a change in estimated forfeitures is recognized in the period of the change.
Tredegar stock options granted during 20062007 and 20042006 (there were no Tredegar stock options granted in 2005), and related estimated fair value at the date of grant, are as follows:
2006 | 2004 | ||||||
| Stock options granted (number of shares): | |||||||
| Officers | 107,500 | n/a | |||||
| Management | 342,300 | 176,950 | |||||
| Other employees | n/a | 161,675 | |||||
| Total | 449,800 | 338,625 | |||||
| Estimated weighted average fair value of options per share at date of grant: | |||||||
| Officers | $ | 6.26 | n/a | ||||
| Management | 5.69 | $ | 5.54 | ||||
| Other employees | n/a | 4.32 | |||||
Total estimated fair value of stock options granted (in thousands) | $ | 2,620 | $ | 1,679 | |||
|
|
|
|
|
|
|
| 2007 |
| 2006 |
|
Stock options granted (number of shares): |
|
|
|
|
|
Officers |
| n/a |
| 107,500 |
|
Management |
| 4,000 |
| 342,300 |
|
Other employees |
| n/a |
| n/a |
|
Total |
| 4,000 |
| 449,800 |
|
Estimated weighted average fair value of options per share at date of grant: |
|
|
|
|
|
Officers |
| n/a |
| $ 6.26 |
|
Management |
| $ 4.91 |
| 5.69 |
|
Other employees |
| n/a |
| n/a |
|
Total estimated fair value of stock options granted (in thousands) |
| $ 20 |
| $2,620 |
|
Additional disclosure of Tredegar stock options is included in Note 10.
AFBS, Inc. (formerly known as Therics, Inc. - see Note 15 for additional information regarding its restructuring in 2005) stock options granted in 2004 and assumptions used in determining related pro forma compensation expense are as follows (there were no significant grants of AFBS stock options after 2004):
| Assumptions Used in Determining Pro Forma Comp. Expense for AFBS Stock Options Granted in 2004 & Other Data | ||||
| Assumptions used in Black-Scholes | Other assumptions and items: | |||
| options-pricing model: | Vesting period (years) | 0.4 - 4 | ||
| Dividend yield | 0.0% | AFBS stock options granted: | ||
| Volatility percentage (a) | 95% | 3rd quarter 2004 | 7,906,149 | |
| Weighted average risk-free interest rate | 4.1% | 1st quarter 2004 | 30,809,000 | |
| Holding period (years) | 7.0 | Aggregate estimated fair value of options | ||
| Weighted average estimated fair value per share | at date of grant: | |||
| of underlying stock at date of grant (b) | $ .090 | 3rd quarter 2004 | $ 584 | |
| Weighted average estimated fair value of | 1st quarter 2004 | $ 2,271 | ||
| options per share at date of grant | $ .074 | |||
| (a) Volatility estimated for AFBS based on Orthovita, Inc. (NASDAQ: VITA), a comparable company. | ||||
| (b) Estimated fair value of underlying stock equaled the stock option exercise price at date of grant. | ||||
Our policy requires that we formally document all relationships between hedging instruments and hedged items, as well as our risk management objective and strategy for undertaking various hedge transactions. We also formally assess (both at the hedge’s inception and on an ongoing basis) whether the derivatives that are used in hedging transactions have been highly effective in offsetting changes in the fair value or cash flows of hedged items and whether those derivatives may be expected to remain highly effective in future periods. When it is determined that a derivative is not (or has ceased to be) highly effective as a hedge, we discontinue hedge accounting prospectively.
As a policy, we do not engage in speculative or leveraged transactions, nor do we hold or issue financial instruments for trading purposes.
The cash flows related to financial instruments are classified in the statements of cash flows in a manner consistent with those of the transactions being hedged.
Comprehensive Income.Comprehensive income, which is included in the consolidated statement of shareholders’ equity, is defined as net income and other comprehensive income. Other comprehensive income includes changes in unrealized gains and losses on available-for-sale securities, foreign currency translation adjustments, unrealized gains and losses on derivative financial instruments and minimum pension liability adjustments, all recorded net of deferred income taxes directly in shareholders’ equity.
The available-for-sale securities adjustment included in the consolidated statement of shareholders’ equity is comprised of the following components:
2006 | 2005 | 2004 | ||||||||
| Available-for-sale securities adjustment: | ||||||||||
| Unrealized net holding gains (losses) arising during the period | $ | 20 | $ | 36 | $ | 1,872 | ||||
| Income taxes | (7 | ) | (13 | ) | (655 | ) | ||||
| Reclassification adjustment for net losses (gains) realized in income | (56 | ) | - | (6,134 | ) | |||||
| Income taxes | 20 | - | 2,147 | |||||||
| Available-for-sale securities adjustment | $ | (23 | ) | $ | 23 | $ | (2,770 | ) | ||
|
|
|
|
|
|
|
|
|
|
| 2006 |
|
| 2005 |
|
Available-for-sale securities adjustment: |
|
|
|
|
|
|
|
Unrealized net holding gains (losses) |
| $ | 20 |
| $ | 36 |
|
Income taxes |
|
| (7 | ) |
| (13 | ) |
Reclassification adjustment for net |
|
| (56 | ) |
| — |
|
Income taxes |
|
| 20 |
|
| — |
|
Available-for-sale securities adjustment |
| $ | (23 | ) | $ | 23 |
|
Recently Issued Accounting Standards. In September 2006,December 2007, the FASB issued FASB Staff Position ("FSP")SFAS No. AUG AIR-1, Accounting141(R), Business Combinations, and SFAS No. 160, Noncontrolling Interests in Consolidated Financial Statements. SFAS No. 141 is applied prospectively to business combinations for Planned Major Maintenance Activities. The FSPwhich the acquisition date is effective foron or after the beginning of the first fiscal yearannual reporting period beginning on or after December 15, 2006.2008. The FSP eliminatesnew accounting standard for noncontrolling interests (sometimes referred to as minority interests) applies to all fiscal years and interim periods beginning on or after December 15, 2008. Early application is prohibited for both standards. We currently do not have noncontrolling or minority interests in our consolidated financial statements. We will apply the accrualnew standards when required and applicable.
2 | INVESTMENTS |
During the third quarter of 2007, we invested $6,500 in a privately held drug delivery company representing ownership on a fully diluted basis of approximately 23%. The company is developing and commercializing state of the art drug delivery systems designed to improve patient compliance and outcomes. The investment is accounted for under the fair value method. We elected the fair value option over the equity method of accounting since our investment objectives are similar to those of venture capitalists, which typically do not have controlling financial interests (venture capital funds use the fair value method to account for major maintenance activities, but continuestheir investment portfolios). At December 31, 2007, the fair value of our investment (also the carrying value included in “Other assets and deferred charges” in our balance sheet) equaled the amount invested.
On the date of our investment (August 31, 2007), we believe that the amount we paid for our ownership interest and liquidation preferences was based on Level 2 inputs, including investments by other investors. Subsequent to permitAugust 31, 2007, and until the usenext round of financing, we believe fair value estimates drop to Level 3 inputs since there is no secondary market for our ownership interest. In addition, the company currently has no product sales. Accordingly, after the latest financing and until the next round of financing or other significant financial transaction, value estimates will primarily be based on assumptions relating to meeting product development and commercialization milestones, cash flow projections (projections of sales, costs, expenses, capital expenditures and working capital investment) and discounting of these factors for the high degree of risk. As a result, an increase in our estimate of the direct expensing, built-in overhaulfair value of our ownership interest is unlikely unless a significant new round of financing, merger or initial public offering indicates a higher value. However, if the company does not meet its development and deferral methods. The FSP also continuescommercialization milestones and there are indications that the amount or timing of its projected cash flows or related risks are unfavorable versus plans as of August 31, 2007, or a new round of financing or other significant financial transaction indicates a lower value, then our estimate of the fair value of our ownership interest in the company is likely to require accruals or deferralsdecline.
Had we not elected to account for interim periodsour investment under the fair value method, we would have been required to use the equity method of annualaccounting.
Our valuation of intangibles indicates that there were no in-process research & development costs that clearly benefit twowould have been written off in applying the purchase accounting and the equity method at August 31, 2007. We would not have been allocated any profits or more interim periods. We are evaluating the FSP and have not determined whether or not it will have a material effect on our financial position or results of operations.
|
|
|
|
|
|
|
|
(Unaudited) |
| Pro Forma 8/31/07 |
| 12/31/07 |
| ||
Assets |
|
|
|
|
|
|
|
Cash & ownership subscriptions |
| $ | 8,557 |
| $ | 6,781 |
|
Other tangible assets |
|
| 278 |
|
| 1,253 |
|
Identifiable intangibles (15 year life) |
|
| 3,967 |
|
| 3,901 |
|
Goodwill |
|
| 10,194 |
|
| 10,194 |
|
Total assets |
| $ | 22,996 |
| $ | 22,129 |
|
|
|
|
|
|
|
|
|
|
| Pro Forma 8/31/07 |
| 12/31/07 |
| ||
Liabilities & Members’ Equity |
|
|
|
|
|
|
|
Liabilities |
| $ | 1,503 |
| $ | 1,494 |
|
Contributed capital |
|
| 12,233 |
|
| 12,354 |
|
Net equity appreciation implied from |
|
| 12,805 |
|
| 12,805 |
|
Accumulated losses |
|
| (3,545 | ) |
| (4,524 | ) |
Total liabilities & members’ equity |
| $ | 22,996 |
| $ | 22,129 |
|
|
|
|
|
|
|
|
|
|
|
| 2007 |
| Sept.-Dec. ‘07 |
| |
Revenues & Expenses |
|
|
|
|
|
|
|
Revenues |
| $ | — |
| $ | — |
|
Costs & expenses |
|
| 2,445 |
|
| 800 |
|
Net loss |
| $ | (2,445 | ) | $ | (800 | ) |
On April 2, 2007, we invested $10,000 in Harbinger Capital Partners Special Situations Fund, L.P. (“Harbinger”), a fund that seeks to achieve superior absolute returns by participating primarily in medium to long-term investments involving distressed/high yield debt securities, special situation equities and private loans and notes. The fund is a highly speculative investment subject to a two-year lock-up and additional limitations on withdrawal. There is no secondary market for interests in the fund. Our investment in Harbinger, which represents less than 2% of Harbinger’s total partnership capital, is accounted for under the cost method. At December 31, 2007, Harbinger reported our capital account value at $23,000 reflecting $13,000 of unrealized appreciation versus the carrying value in our balance sheet of $10,000 (included in “Other assets and deferred charges”).
During 2007, we invested approximately $6,200 in real estate. At December 31, 2007, the carrying value in our balance sheet of investments in this real estate (included in “Other assets and deferred charges”) equaled the amount invested.
In August of 2004, we invested $5,000 in Novalux, Inc., a developer of laser technology for potential use in a variety of applications. InWe made additional investments in Novalux based on its prospects at the time of $1,095 in October 2005, we invested an additional $1,095$400 in a new convertible secured bridge financing for Novalux bringingMay 2006, $142 in September 2006, $458 in July 2007 and $404 in November 2007. We wrote down our aggregate investment to $6,095 at December 31, 2005. As of December 31, 2005, the investment in Novalux was written down to estimated fair valueand recognized losses of $1,095. The reduction$5,000 in estimated fair value at the end ofDecember 2005 was due to longer thanand $2,095 in September 2007 based on anticipated delays both in bringing the company’s technology to market and in obtaining key development partnerships as well as liquidity issues. The loss from the write-down in 2005 is included in “Other income (expense), net” in the consolidated statements of income and separately shown in the operating profit by segment table in Note 3. Subsequent to the first quarter of 2006, Novalux prospects improved and we invested an aggregate of $542 in May and September of 2006. As of December 31, 2006, our investment in Novalux was $6,637. Our carrying value in Novalux of $1,637$404 and $1,095$1,637 at December 31, 20062007 and 2005,2006, respectively, is included in “Other assets and deferred charges” in the consolidated balance sheet. Our voting ownershipNovalux assets were sold in January 2008 in exchange for certain unrestricted and restricted common shares of a public company in Australia. We expect to recover our remaining carrying value of $404 upon the liquidation by Novalux as of December 31, 2006 is approximately 12% (11% on a fully diluted basis).
3 | BUSINESS SEGMENTS |
Information by business segment and geographic area for the last three years is provided below. There are no accounting transactions between segments and no allocations to segments. Net sales (sales less freight) and operating profit from ongoing operations are the measures of sales and operating profit used by the chief operating decision maker for purposes of assessing performance. Film Products’ net sales to The Procter & Gamble Company (“P&G”) totaled $258,602 in 2007, $255,414 in 2006 and $236,554 in 2005 and $226,122 in 2004.2005. These amounts include plastic film sold to others that convert the film into materials used with products manufactured by P&G.
Net Sales | ||||||||||
2006 | 2005 | 2004 | ||||||||
| Film Products | $ | 511,169 | $ | 460,277 | $ | 413,257 | ||||
| Aluminum Extrusions | 577,260 | 471,749 | 425,130 | |||||||
| AFBS (formerly Therics) | - | 252 | 380 | |||||||
| Total net sales | 1,088,429 | 932,278 | 838,767 | |||||||
| Add back freight | 28,096 | 24,691 | 22,398 | |||||||
| Sales as shown in consolidated statements of income | $ | 1,116,525 | $ | 956,969 | $ | 861,165 | ||||
Operating Profit | ||||||||||
2006 | 2005 | 2004 | ||||||||
| Film Products: | ||||||||||
| Ongoing operations | $ | 57,645 | $ | 44,946 | $ | 43,259 | ||||
| Plant shutdowns, asset impairments and restructurings, net of gains on the sale of assets (a) | 221 | (3,955 | ) | (10,438 | ) | |||||
| Aluminum Extrusions: | ||||||||||
| Ongoing operations | 22,031 | 19,302 | 22,637 | |||||||
| Plant shutdowns, asset impairments and restructurings, net of gains on the sale of assets (a) | (1,434 | ) | 122 | (10,553 | ) | |||||
| Other (a) | - | - | 7,316 | |||||||
| AFBS (formerly Therics): | ||||||||||
| Ongoing operations | - | (3,467 | ) | (9,763 | ) | |||||
| Loss on investment in Therics, LLC | (25 | ) | (145 | ) | - | |||||
| Restructurings (a) | (637 | ) | (10,318 | ) | (2,041 | ) | ||||
| Total | 77,801 | 46,485 | 40,417 | |||||||
| Interest income | 1,240 | 586 | 350 | |||||||
| Interest expense | 5,520 | 4,573 | 3,171 | |||||||
| Gain on sale of corporate assets (a) | 56 | 61 | 7,560 | |||||||
| Loss from write-down of investment in Novalux (a) | - | 5,000 | - | |||||||
| Stock option-based compensation expense | 970 | - | - | |||||||
| Corporate expenses, net (a) | 13,770 | 11,357 | 9,674 | |||||||
| Income from continuing operations before income taxes | 58,837 | 26,202 | 35,482 | |||||||
| Income taxes (a) | 20,636 | 9,973 | 9,222 | |||||||
| Income from continuing operations | 38,201 | 16,229 | 26,260 | |||||||
| Income from discontinued operations (a) | - | - | 2,921 | |||||||
| Net income | $ | 38,201 | $ | 16,229 | $ | 29,181 | ||||
|
|
|
|
|
|
|
|
|
|
|
|
| Net Sales |
| |||||||
|
|
| 2007 |
|
| 2006 |
|
| 2005 |
|
Film Products |
| $ | 530,972 |
| $ | 511,169 |
| $ | 460,277 |
|
Aluminum Extrusions |
|
| 371,803 |
|
| 403,790 |
|
| 327,659 |
|
AFBS (formerly Therics) |
|
| — |
|
| — |
|
| 252 |
|
Total net sales |
|
| 902,775 |
|
| 914,959 |
|
| 788,188 |
|
Add back freight |
|
| 19,808 |
|
| 22,602 |
|
| 20,276 |
|
Sales as shown in consolidated statements of income |
| $ | 922,583 |
| $ | 937,561 |
| $ | 808,464 |
|
|
|
|
|
|
|
|
|
|
|
|
|
| Operating Profit |
| |||||||
|
|
| 2007 |
|
| 2006 |
|
| 2005 |
|
Film Products: |
|
|
|
|
|
|
|
|
|
|
Ongoing operations |
| $ | 59,423 |
| $ | 57,645 |
| $ | 44,946 |
|
Plant shutdowns, asset impairments and restructurings, net of gains on the sale of assets (a) |
|
| (649 | ) |
| 221 |
|
| (3,955 | ) |
Aluminum Extrusions: |
|
|
|
|
|
|
|
|
|
|
Ongoing operations |
|
| 16,516 |
|
| 18,302 |
|
| 17,084 |
|
Plant shutdowns, asset impairments and restructurings, net of gains on the sale of assets (a) |
|
| (634 | ) |
| (1,434 | ) |
| (993 | ) |
AFBS (formerly Therics): |
|
|
|
|
|
|
|
|
|
|
Ongoing operations |
|
| — |
|
| — |
|
| (3,467 | ) |
Loss on investment in Therics, LLC |
|
| — |
|
| (25 | ) |
| (145 | ) |
Restructurings (a) |
|
| (2,786 | ) |
| (637 | ) |
| (10,318 | ) |
Total |
|
| 71,870 |
|
| 74,072 |
|
| 43,152 |
|
Interest income |
|
| 1,212 |
|
| 1,240 |
|
| 586 |
|
Interest expense |
|
| 2,721 |
|
| 5,520 |
|
| 4,573 |
|
Gain on sale of corporate assets (a) |
|
| 2,699 |
|
| 56 |
|
| 61 |
|
Loss from write-down of investment in Novalux (a) |
|
| 2,095 |
|
| — |
|
| 5,000 |
|
Stock option-based compensation expense |
|
| 978 |
|
| 970 |
|
| — |
|
Corporate expenses, net (a) |
|
| 10,691 |
|
| 13,770 |
|
| 11,357 |
|
Income from continuing operations before income taxes |
|
| 59,296 |
|
| 55,108 |
|
| 22,869 |
|
Income taxes (a) |
|
| 24,366 |
|
| 19,791 |
|
| 9,497 |
|
Income from continuing operations |
|
| 34,930 |
|
| 35,317 |
|
| 13,372 |
|
Income (loss) from discontinued operations (a) |
|
| (19,681 | ) |
| 2,884 |
|
| 2,857 |
|
Net income |
| $ | 15,249 |
| $ | 38,201 |
| $ | 16,229 |
|
(a) | See Notes 2 and 15 for more information on losses associated with plant shutdowns, asset impairments and restructurings, unusual items, gains from sale of assets, investment write-down and other items, and Note 17 for more information on discontinued operations. |
(b) | The difference between total consolidated sales as reported in the consolidated statements of income and segment and geographic net sales reported in this note is freight of |
(c) | Information on exports and foreign operations are provided on the next page. Cash and cash equivalents includes funds held in foreign locations of $24,559, $19,118 |
Identifiable Assets | ||||||||||
| December 31 | 2006 | 2005 | 2004 | |||||||
| Film Products | $ | 498,961 | $ | 479,286 | $ | 472,810 | ||||
| Aluminum Extrusions | 209,395 | 214,374 | 210,894 | |||||||
| AFBS (formerly Therics) | 2,420 | 2,759 | 8,613 | |||||||
| Subtotal | 710,776 | 696,419 | 692,317 | |||||||
| General corporate | 30,113 | 61,905 | 54,163 | |||||||
| Cash and cash equivalents (c) | 40,898 | 23,434 | 22,994 | |||||||
| Total | $ | 781,787 | $ | 781,758 | $ | 769,474 | ||||
|
|
|
|
|
|
|
|
|
|
|
|
|
|
|
|
|
|
| ||||||||||||||||||||
Depreciation and Amortization | Capital Expenditures |
| ||||||||||||||||||||||||||||||||||||
|
| Identifiable Assets |
| |||||||||||||||||||||||||||||||||||
December 31 |
| 2007 |
| 2006 |
| 2005 |
|
|
|
|
|
|
| |||||||||||||||||||||||||
2006 | 2005 | 2004 | 2006 | 2005 | 2004 |
|
|
|
|
|
|
| ||||||||||||||||||||||||||
| Film Products | $ | 31,847 | $ | 26,673 | $ | 21,967 | $ | 33,168 | $ | 50,466 | $ | 44,797 |
| $ | 488,035 |
| $ | 498,961 |
| $ | 479,286 |
|
|
|
|
|
|
|
| |||||||||
| Aluminum Extrusions | 12,323 | 11,484 | 10,914 | 7,381 | 11,968 | 10,007 |
| 115,223 |
| 128,967 |
| 130,448 |
|
|
|
|
|
|
| |||||||||||||||||||
| AFBS (formerly Therics) | - | 437 | 1,300 | - | 36 | 275 |
| 2,866 |
| 2,420 |
| 2,759 |
|
|
|
|
|
|
|
| ||||||||||||||||||
|
|
|
|
|
|
| ||||||||||||||||||||||||||||||||
| Subtotal | 44,170 | 38,594 | 34,181 | 40,549 | 62,470 | 55,079 |
| 606,124 |
| 630,348 |
| 612,493 |
|
|
|
|
|
|
| |||||||||||||||||||
| General corporate | 111 | 195 | 241 | 24 | 73 | 572 |
| 74,927 |
| 30,113 |
| 61,905 |
|
|
|
|
|
|
|
| ||||||||||||||||||
Cash and cash equivalents (c) |
| 48,217 |
| 40,898 |
| 23,434 |
|
|
|
|
|
|
| |||||||||||||||||||||||||
|
|
|
|
|
|
| ||||||||||||||||||||||||||||||||
Continuing operations |
| 729,268 |
| 701,359 |
| 697,832 |
|
|
|
|
|
|
|
| ||||||||||||||||||||||||
Discontinued aluminum extrusions business in Canada (a) |
| 55,210 |
| 80,428 |
| 83,926 |
|
|
|
|
|
|
| |||||||||||||||||||||||||
|
|
|
|
|
|
| ||||||||||||||||||||||||||||||||
| Total | $ | 44,281 | $ | 38,789 | $ | 34,422 | $ | 40,573 | $ | 62,543 | $ | 55,651 |
| $ | 784,478 |
| $ | 781,787 |
| $ | 781,758 |
|
|
|
|
|
|
|
| |||||||||
|
|
|
|
|
|
| ||||||||||||||||||||||||||||||||
|
|
|
|
|
|
|
|
|
|
|
|
|
|
|
|
|
|
|
|
| |||||||||||||||||||
|
| Depreciation and Amortization |
| Capital Expenditures |
| ||||||||||||||
|
| 2007 |
| 2006 |
| 2005 |
| 2007 |
| 2006 |
| 2005 |
| ||||||
| |||||||||||||||||||
Film Products |
| $ | 34,092 |
| $ | 31,847 |
| $ | 26,673 |
| $ | 15,304 |
| $ | 33,168 |
| $ | 50,466 |
|
Aluminum Extrusions |
|
| 8,472 |
|
| 8,378 |
|
| 7,996 |
|
| 4,391 |
|
| 6,609 |
|
| 5,750 |
|
AFBS (formerly Therics) |
|
| — |
|
| — |
|
| 437 |
|
| — |
|
| — |
|
| 36 |
|
| |||||||||||||||||||
Subtotal |
|
| 42,564 |
|
| 40,225 |
|
| 35,106 |
|
| 19,695 |
|
| 39,777 |
|
| 56,252 |
|
General corporate |
|
| 91 |
|
| 111 |
|
| 195 |
|
| 6 |
|
| 24 |
|
| 73 |
|
| |||||||||||||||||||
Continuing operations |
|
| 42,655 |
|
| 40,336 |
|
| 35,301 |
|
| 19,701 |
|
| 39,801 |
|
| 56,325 |
|
Discontinued aluminum extrusions business in Canada (a) |
|
| 3,386 |
|
| 3,945 |
|
| 3,488 |
|
| 942 |
|
| 772 |
|
| 6,218 |
|
| |||||||||||||||||||
Total |
| $ | 46,041 |
| $ | 44,281 |
| $ | 38,789 |
| $ | 20,643 |
| $ | 40,573 |
| $ | 62,543 |
|
| |||||||||||||||||||
|
|
|
|
|
|
|
|
|
|
|
|
|
|
|
|
|
|
|
|
|
|
|
|
|
|
|
|
|
|
|
| ||||||||||
|
| Net Sales by Geographic Area (c) |
|
|
|
|
|
|
|
|
|
|
| |||||||
|
| 2007 |
| 2006 |
| 2005 |
|
|
|
|
|
|
|
|
|
|
| |||
|
|
|
|
|
|
|
|
|
|
| ||||||||||
United States |
| $ | 577,824 |
| $ | 606,411 |
| $ | 495,900 |
|
|
|
|
|
|
|
|
|
|
|
Exports from the United States to: |
|
|
|
|
|
|
|
|
|
|
|
|
|
|
|
|
|
|
|
|
Canada |
|
| 46,243 |
|
| 42,669 |
|
| 44,870 |
|
|
|
|
|
|
|
|
|
|
|
Latin America |
|
| 1,188 |
|
| 4,364 |
|
| 9,428 |
|
|
|
|
|
|
|
|
|
|
|
Europe |
|
| 9,856 |
|
| 8,944 |
|
| 8,311 |
|
|
|
|
|
|
|
|
|
|
|
Asia |
|
| 31,432 |
|
| 50,096 |
|
| 40,476 |
|
|
|
|
|
|
|
|
|
|
|
Foreign operations: |
|
|
|
|
|
|
|
|
|
|
|
|
|
|
|
|
|
|
|
|
The Netherlands |
|
| 104,379 |
|
| 91,476 |
|
| 83,649 |
|
|
|
|
|
|
|
|
|
|
|
Hungary |
|
| 35,286 |
|
| 29,152 |
|
| 33,573 |
|
|
|
|
|
|
|
|
|
|
|
China |
|
| 57,252 |
|
| 42,460 |
|
| 36,823 |
|
|
|
|
|
|
|
|
|
|
|
Italy |
|
| 13,359 |
|
| 14,323 |
|
| 15,866 |
|
|
|
|
|
|
|
|
|
|
|
Brazil |
|
| 25,956 |
|
| 25,064 |
|
| 19,292 |
|
|
|
|
|
|
|
|
|
|
|
|
|
|
|
|
|
|
|
|
|
| ||||||||||
Total (b) |
| $ | 902,775 |
| $ | 914,959 |
| $ | 788,188 |
|
|
|
|
|
|
|
|
|
|
|
|
|
|
|
|
|
|
|
|
| |||||||||||
|
|
|
|
|
|
|
|
|
|
|
|
|
|
|
|
|
|
|
|
| |||||||||||||||||||
|
| Identifiable Assets |
| Property, Plant & Equipment, |
| ||||||||||||||
December 31 |
| 2007 |
| 2006 |
| 2005 |
| 2007 |
| 2006 |
| 2005 |
| ||||||
| |||||||||||||||||||
United States |
| $ | 429,376 |
| $ | 454,931 |
| $ | 452,546 |
| $ | 163,130 |
| $ | 175,983 |
| $ | 177,956 |
|
Foreign operations: |
|
|
|
|
|
|
|
|
|
|
|
|
|
|
|
|
|
|
|
The Netherlands |
|
| 73,658 |
|
| 70,609 |
|
| 67,683 |
|
| 52,383 |
|
| 53,905 |
|
| 54,331 |
|
Hungary |
|
| 20,178 |
|
| 20,039 |
|
| 18,505 |
|
| 10,952 |
|
| 12,475 |
|
| 12,787 |
|
China |
|
| 49,696 |
|
| 53,633 |
|
| 40,599 |
|
| 33,192 |
|
| 34,671 |
|
| 26,104 |
|
Italy |
|
| 17,378 |
|
| 16,734 |
|
| 17,997 |
|
| 3,580 |
|
| 3,565 |
|
| 3,093 |
|
Brazil |
|
| 15,838 |
|
| 14,402 |
|
| 15,163 |
|
| 5,055 |
|
| 4,892 |
|
| 5,205 |
|
General corporate |
|
| 74,927 |
|
| 30,113 |
|
| 61,905 |
|
| 791 |
|
| 1,944 |
|
| 1,994 |
|
Cash and cash equivalents (c) |
|
| 48,217 |
|
| 40,898 |
|
| 23,434 |
|
| n/a |
|
| n/a |
|
| n/a |
|
| |||||||||||||||||||
Continuing operations |
|
| 729,268 |
|
| 701,359 |
|
| 697,832 |
|
| 269,083 |
|
| 287,435 |
|
| 281,470 |
|
Discontinued aluminum extrusions business in Canada (a) |
|
| 55,210 |
|
| 80,428 |
|
| 83,926 |
|
| 11,001 |
|
| 38,328 |
|
| 41,406 |
|
| |||||||||||||||||||
Total |
| $ | 784,478 |
| $ | 781,787 |
| $ | 781,758 |
| $ | 280,084 |
| $ | 325,763 |
| $ | 322,876 |
|
| |||||||||||||||||||
See footnotes on prior page and a reconciliation of net sales to sales as shown in the consolidated statements of income.
Net Sales by Geographic Area (c) | ||||||||||
2006 | 2005 | 2004 | ||||||||
| United States | $ | 606,410 | $ | 495,900 | $ | 441,891 | ||||
| Exports from the United States to: | ||||||||||
| Canada | 42,669 | 44,870 | 27,663 | |||||||
| Latin America | 4,364 | 9,428 | 16,668 | |||||||
| Europe | 8,944 | 8,311 | 15,768 | |||||||
| Asia | 50,096 | 40,476 | 31,617 | |||||||
| Foreign operations: | ||||||||||
| Canada | 173,471 | 144,090 | 147,145 | |||||||
| The Netherlands | 91,476 | 83,649 | 66,856 | |||||||
| Hungary | 29,152 | 33,573 | 34,721 | |||||||
| China | 42,460 | 36,823 | 25,291 | |||||||
| Italy | 14,323 | 15,866 | 12,423 | |||||||
| Brazil and Argentina (2004) | 25,064 | 19,292 | 18,724 | |||||||
| Total (b) | $ | 1,088,429 | $ | 932,278 | $ | 838,767 | ||||
Identifiable Assetsby Geographic Area (c) | Property, Plant & Equipment,Net by Geographic Area (c) | ||||||||||||||||||
| December 31 | 2006 | 2005 | 2004 | 2006 | 2005 | 2004 | |||||||||||||
| United States | $ | 446,005 | $ | 444,144 | $ | 427,240 | $ | 176,160 | $ | 178,154 | $ | 163,383 | |||||||
| Foreign operations: | |||||||||||||||||||
| Canada | 89,354 | 92,328 | 92,290 | 38,151 | 41,208 | 38,610 | |||||||||||||
| The Netherlands | 70,609 | 67,683 | 75,449 | 53,905 | 54,331 | 58,370 | |||||||||||||
| Hungary | 20,039 | 18,505 | 27,308 | 12,475 | 12,787 | 19,371 | |||||||||||||
| China | 53,633 | 40,599 | 38,713 | 34,671 | 26,104 | 25,684 | |||||||||||||
| Italy | 16,734 | 17,997 | 20,785 | 3,565 | 3,093 | 3,991 | |||||||||||||
| Brazil | 14,402 | 15,163 | 10,532 | 4,892 | 5,205 | 5,037 | |||||||||||||
| General corporate | 30,113 | 61,905 | 54,163 | 1,944 | 1,994 | 2,246 | |||||||||||||
| Cash and cash equivalents (c) | 40,898 | 23,434 | 22,994 | n/a | n/a | n/a | |||||||||||||
| Total | $ | 781,787 | $ | 781,758 | $ | 769,474 | $ | 325,763 | $ | 322,876 | $ | 316,692 | |||||||
| See footnotes on prior page and a reconciliation of net sales to sales as shown in the consolidated statements of income. | |||||||||||||||||||
4 | ACCOUNTS AND NOTES RECEIVABLE |
Accounts and notes receivable consist of the following: |
2006 | 2005 | ||||||
| Trade, less allowance for doubtful accounts and sales returns of $8,559 in 2006 and $5,423 in 2005 | $ | 116,943 | $ | 112,968 | |||
| Other | 4,891 | 6,362 | |||||
| Total | $ | 121,834 | $ | 119,330 | |||
|
|
|
|
|
|
|
|
December 31 |
|
| 2007 |
|
| 2006 |
|
Trade, less allowance for doubtful |
| $ | 94,699 |
| $ | 102,062 |
|
Other |
|
| 2,365 |
|
| 4,893 |
|
Total |
| $ | 97,064 |
| $ | 106,955 |
|
The allowance for doubtful accounts and sales returns decreased by $2,190 in 2007 and increased by $3,136$2,515 in 2006 $110and $164 in 2005 and $865 in 2004.2005. The changes in 2007, 2006 2005 and 20042005 were comprised of increases to the allowance for charges to expense of $3,911, $612$3,001, $3,236 and $956,$366, respectively, decreases in the allowance for income from recoveries of $1,442, $57 $15 and $5,$15, respectively, decreases in the allowance for write-offs of $696, $403$3,780, $680 and $413,$62, respectively, and foreign exchange and other adjustments to the allowance of plus $31, plus $16 and minus $22, minus $84 and plus $327,$125, respectively.
5 | INVENTORIES |
Inventories consist of the following: |
2006 | 2005 | ||||||
| Finished goods | $ | 15,412 | $ | 12,838 | |||
| Work-in-process | 4,540 | 3,685 | |||||
| Raw materials | 34,185 | 33,043 | |||||
| Stores, supplies and other | 14,793 | 12,872 | |||||
| Total | $ | 68,930 | $ | 62,438 | |||
|
|
|
|
|
|
|
|
December 31 |
|
| 2007 |
|
| 2006 |
|
Finished goods |
| $ | 10,004 |
| $ | 9,182 |
|
Work-in-process |
|
| 3,624 |
|
| 3,495 |
|
Raw materials |
|
| 19,369 |
|
| 21,773 |
|
Stores, supplies and other |
|
| 15,669 |
|
| 14,214 |
|
Total |
| $ | 48,666 |
| $ | 48,664 |
|
Inventories stated on the LIFO basis amounted to $17,774 at December 31, 2007 and $17,230 at December 31, 2006, and $19,843 at December 31, 2005, which are below replacement costs by approximately $25,845 at December 31, 2007 and $26,139 at December 31, 2006 and $29,164 at December 31, 2005.2006. During 2006, inventories accounted for on a LIFO basis declined, which resulted in cost of goods sold being stated at below current replacement costs by approximately $5,400 ($5,300 in Film Products, including $2,900 associated with the shutdown of the films manufacturing facility in LaGrange, Georgia, and $100 in Aluminum Extrusions). During 2005, inventories accounted for on a LIFO basis declined, which resulted in cost of goods sold being stated at below current replacement costs by approximately $2,300 ($2,100 in Film Products and $200 in Aluminum Extrusions).
6 | FINANCIAL INSTRUMENTS |
In the normal course of business, we enter into fixed-price forward sales contracts with certain customers for the sale of fixed quantities of aluminum extrusions at scheduled intervals. In order to hedge our exposure to aluminum price volatility under these fixed-price arrangements, which generally have a duration of not more than 12 months, we enter into a combination of forward purchase commitments and futures contracts to acquire or hedge aluminum, based on the scheduled deliveries. The futures contracts are designated as and accounted for as cash flow hedges. These contracts involve elements of credit and market risk that are not reflected on our balance sheet, including the risk of dealing with counterparties and their ability to meet the terms of the contracts. The counterparties to our forward purchase commitments are major aluminum brokers and suppliers, and the counterparties to our futures contracts are major financial institutions. Fixed-price forward sales contracts are only made available to our best and most credit-worthy customers. The notional amount of aluminum futures contracts that hedged fixed-price forward sales contracts was $36,369 (32,762 pounds of aluminum) at December 31, 2007 and $15,865 (13,016 pounds of aluminum) at December 31, 2006 and $5,367 (6,393 pounds2006. Unrealized losses in excess of aluminum)gains on aluminum futures contracts that hedge fixed-price forward sales contracts of $1,815 ($1,204 after taxes) at December 31, 2005. Unrealized2007, and unrealized gains in excess of losses on
aluminum futures contracts that hedge fixed-price forward sales contracts of $1,184 ($728 after taxes) and $1,213 ($776 after taxes) at December 31, 2006, and 2005, respectively, are included as a separate component of shareholders’ equity.equity for the respective periods. The portion of aluminum futures contracts that was ineffective in hedging fixed-price forward sales contracts was immaterial in 2007, 2006 2005 and 2004.
In the past we have used interest rate swaps with large major financial institutions to manage interest rate exposure, but there have been no interest rate swaps outstanding since 2003.
In 2007, we used zero cost collar currency options to hedge a portion of our exposure to changes in exchange rates. Results for continuing operations include realized losses of $239,000 on currency hedges of royalties relating to our operations in Europe and results from discontinued operations include realized gains of $1,311 on currency hedges of our exposure to the Canadian Dollar (“CAD”) and Euro (“EUR”) as shown in the following tables (accounted(see Note 17 for as cash flow hedges):
| (In Thousands Except Exchange Rates) | |||||||||||||||||||||||||||||||
| Notional Amount as a % of Forecasted USD-Equiv. | Net | USD-Equivalent Strike Prices of Options Bought & | Pretax Unrealized Gain (Loss) on Options at | USD-Equiv. Average | Cash (Paid to) Recieved from | Gain (Loss) on Options Recognized in Income for Period | |||||||||||||||||||||||||
| Notional | CAD- | Option | Sold on CAD/USD | 12/31/06 | Reference | Counter- | Portion | Portion | |||||||||||||||||||||||
| Description of Currency | Amount | Related | Premium | Call | Put | Included in | Price of | party at | Deemed | Deemed | |||||||||||||||||||||
| Exposure, Options Hedging Strategy | of Option | Costs for | (Paid) | Options | Options | Shareholders' | CAD for | Expiration | Effective | Ineffective | |||||||||||||||||||||
| Used & Periods Covered | Contracts | Period | Received | Bought | Sold | Equity | Period | of Options | as Hedge | as Hedge | |||||||||||||||||||||
Exposure: About 80% of sales of extrusions manufactured in facilities in Canada are denominated or economically priced in U.S. Dollars ("USD") while conversion costs are denominated or economically priced in Canadian Dollars ("CAD"). | |||||||||||||||||||||||||||||||
Hedge Strategy: Bought average rate call options & sold average rate put options on CAD/USD. | |||||||||||||||||||||||||||||||
Periods Covered by Option Contracts: | |||||||||||||||||||||||||||||||
| 5/11/06 to end of second quarter 2006 | $ | 2,500 | 38 | % | $ | - | $ | 0.9500 | $ | 0.8850 | n/a | $ | 0.8995 | $ | - | $ | - | $ | - | ||||||||||||
| Third quarter 2006 | 5,000 | 40 | % | - | 0.9500 | 0.8749 | n/a | 0.8919 | - | - | - | ||||||||||||||||||||
| Fourth quarter 2006 | 6,500 | 53 | % | - | 0.9324 | 0.8650 | n/a | 0.8793 | - | - | - | ||||||||||||||||||||
| First quarter 2007 | 3,500 | 28 | % | - | 0.9100 | 0.8380 | $ | (3 | ) | n/a | n/a | n/a | - | ||||||||||||||||||
| First quarter 2007 | 3,500 | 28 | % | - | 0.9000 | 0.8345 | (2 | ) | n/a | n/a | n/a | - | |||||||||||||||||||
| Second quarter 2007 | 3,500 | 28 | % | - | 0.9100 | 0.8430 | (18 | ) | n/a | n/a | n/a | - | |||||||||||||||||||
| Second quarter 2007 | 3,500 | 28 | % | - | 0.9000 | 0.8364 | (8 | ) | n/a | n/a | n/a | - | |||||||||||||||||||
| Third quarter 2007 | 3,500 | 28 | % | - | 0.9100 | 0.8473 | (27 | ) | n/a | n/a | n/a | - | |||||||||||||||||||
| Third quarter 2007 | 3,500 | 28 | % | - | 0.9000 | 0.8403 | (11 | ) | n/a | n/a | n/a | - | |||||||||||||||||||
| Fourth quarter 2007 | 3,500 | 28 | % | - | 0.9100 | 0.8516 | (33 | ) | n/a | n/a | n/a | - | |||||||||||||||||||
| Fourth quarter 2007 | 3,500 | 28 | % | - | 0.9000 | 0.8446 | (14 | ) | n/a | n/a | n/a | - | |||||||||||||||||||
| $ | (116 | ) | |||||||||||||||||||||||||||||
| (In Thousands Except Exchange Rates) | |||||||||||||||||||
| Sensitivity Analysis of Amount Tredegar (Pays to) Receives | |||||||||||||||||||
| Average | Average | from Counterparty in 2007 for Settlement of CAD/USD Options | |||||||||||||||||
| CAD Per | USD Equiv. | First | Second | Third | Fourth | ||||||||||||||
| USD | of CAD | Quarter | Quarter | Quarter | Quarter | Total | |||||||||||||
| 1.21951 | $ | 0.8200 | $ | (136 | ) | $ | (164 | ) | $ | (197 | ) | $ | (232 | ) | $ | (729 | ) | ||
| 1.20482 | 0.8300 | (52 | ) | (81 | ) | (115 | ) | (149 | ) | (397 | ) | ||||||||
| 1.19048 | 0.8400 | - | (12 | ) | (32 | ) | (67 | ) | (111 | ) | |||||||||
| 1.17647 | 0.8500 | - | - | - | (7 | ) | (7 | ) | |||||||||||
| 1.16279 | 0.8600 | - | - | - | - | - | |||||||||||||
| 1.14943 | 0.8700 | - | - | - | - | - | |||||||||||||
| 1.13636 | 0.8800 | - | - | - | - | - | |||||||||||||
| 1.12360 | 0.8900 | - | - | - | - | - | |||||||||||||
| 1.11111 | 0.9000 | - | - | - | - | - | |||||||||||||
| 1.09890 | 0.9100 | 39 | 39 | 39 | 39 | 155 | |||||||||||||
| 1.08696 | 0.9200 | 116 | 116 | 116 | 116 | 465 | |||||||||||||
| 1.07527 | 0.9300 | 194 | 194 | 194 | 194 | 774 | |||||||||||||
| 1.06383 | 0.9400 | 271 | 271 | 271 | 271 | 1,084 | |||||||||||||
| (In Thousands Except Exchange Rates) | |||||||||||||||||||
| Notional | |||||||||||||||||||
| Amount as | Pretax | ||||||||||||||||||
| a % of | USD-Equivalent | Unrealized | |||||||||||||||||
| Forecasted | Strike Prices of | Gain (Loss) | |||||||||||||||||
| USD-Equiv. | Options Bought & | on Options at | |||||||||||||||||
| Notional | Royalty | Net Option | Sold on EUR/USD | 12/31/06 | |||||||||||||||
| Description of Currency | Amount | from | Premium | Call | Put | Included in | |||||||||||||
| Exposure, Options Hedging Strategy | of Option | Nether- | (Paid) | Options | Options | Shareholders' | |||||||||||||
| Used & Periods Covered | Contracts | lands Sub | Received | Sold | Bought | Equity* | |||||||||||||
Exposure: Significant royalty on sales from film technology licensed to subsidiary in the Netherlands is earned in Euros ("EUR"). | |||||||||||||||||||
Hedge Strategy: Sold average rate call options & bought average rate put options on EUR/USD. | |||||||||||||||||||
Periods Covered by Option Contracts: | |||||||||||||||||||
| First quarter 2007 | $ | 3,200 | 74 | % | $ | - | $ | 1.3350 | $ | 1.2800 | n/a | ||||||||
| Second quarter 2007 | 3,200 | 82 | % | - | 1.3480 | 1.2800 | n/a | ||||||||||||
| Third quarter 2007 | 3,200 | 75 | % | - | 1.3575 | 1.2800 | n/a | ||||||||||||
| Fourth quarter 2007 | 3,200 | 76 | % | - | 1.3640 | 1.2800 | n/a | ||||||||||||
| * Hedge transactions occurred on 1/4/07 and therefore there was no unrealized gain or loss at 12/31/06. | |||||||||||||||||||
| (In Thousands Except Exchange Rates) | |||||||||||||||||||
| Sensitivity Analysis of Amount Tredegar (Pays to) Receives | |||||||||||||||||||
| Average | Average | from Counterparty in 2007 for Settlement of EUR/USD Options | |||||||||||||||||
| EUR Per | USD Equiv. | First | Second | Third | Fourth | ||||||||||||||
| USD | of EUR | Quarter | Quarter | Quarter | Quarter | Total | |||||||||||||
| 0.84034 | $ | 1.1900 | $ | 225 | $ | 225 | $ | 225 | $ | 225 | $ | 900 | |||||||
| 0.82645 | 1.2100 | 175 | 175 | 175 | 175 | 700 | |||||||||||||
| 0.81301 | 1.2300 | 125 | 125 | 125 | 125 | 500 | |||||||||||||
| 0.80000 | 1.2500 | 75 | 75 | 75 | 75 | 300 | |||||||||||||
| 0.78740 | 1.2700 | 25 | 25 | 25 | 25 | 100 | |||||||||||||
| 0.77519 | 1.2900 | - | - | - | - | - | |||||||||||||
| 0.76336 | 1.3100 | - | - | - | - | - | |||||||||||||
| 0.75188 | 1.3300 | - | - | - | - | - | |||||||||||||
| 0.74074 | 1.3500 | (36 | ) | (5 | ) | - | - | (41 | ) | ||||||||||
| 0.72993 | 1.3700 | (84 | ) | (52 | ) | (29 | ) | (14 | ) | (180 | ) | ||||||||
| 0.71942 | 1.3900 | (132 | ) | (100 | ) | (77 | ) | (61 | ) | (369 | ) | ||||||||
| 0.70922 | 1.4100 | (180 | ) | (147 | ) | (124 | ) | (108 | ) | (559 | ) | ||||||||
| 0.69930 | 1.4300 | (228 | ) | (195 | ) | (171 | ) | (155 | ) | (748 | ) | ||||||||
After-tax gains of $731 in 2007, $1,104 in 2006 and $939 in 2005 and $1,230 in 2004 were reclassified from other comprehensive income to earnings and were offset by losses, respectively, from transactions relating to the underlying hedged item. As of December 31, 2006,2007, we expect $654$1,204 of unrealized after-tax gainslosses on derivative instruments reported in accumulated other comprehensive income to be reclassified to earnings within the next twelve months. We also expect that these gainslosses will be offset by lossesgains from transactions relating to the underlying hedged item.
7 | ACCRUED EXPENSES |
Accrued expenses consist of the following: | |
|
|
|
|
|
|
|
|
December 31 |
|
| 2007 |
|
| 2006 |
|
Payrolls, related taxes and medical and |
| $ | 7,921 |
| $ | 8,209 |
|
Workmen’s compensation and disabilities |
|
| 4,159 |
|
| 4,334 |
|
Vacation |
|
| 3,636 |
|
| 3,592 |
|
Plant shutdowns and divestitures |
|
| 6,201 |
|
| 5,058 |
|
Incentive compensation |
|
| 1,880 |
|
| 4,075 |
|
Other |
|
| 9,879 |
|
| 13,522 |
|
Total |
| $ | 33,676 |
| $ | 38,790 |
|
2006 | 2005 | ||||||
| Payrolls, related taxes and medical and other benefits | $ | 8,620 | $ | 6,687 | |||
| Workmen's compensation and disabilities | 4,335 | 4,226 | |||||
| Vacation | 4,875 | 4,488 | |||||
| Plant shutdowns and divestitures | 5,058 | 6,972 | |||||
| Incentive compensation | 4,075 | 383 | |||||
| Other | 14,943 | 13,275 | |||||
| Total | $ | 41,906 | $ | 36,031 | |||
A reconciliation of the beginning and ending balances of accrued expenses associated with plant shutdowns and divestitures for each of the three years in the period ended December 31, 20062007 is as follows:
| Severance | Asset Impairments | Accelerated Depreciation (a) | Other (b) | Total | ||||||||||||
| Balance at December 31, 2003 | $ | 2,106 | $ | - | $ | - | $ | 3,086 | $ | 5,192 | ||||||
| 2004: | ||||||||||||||||
| Charges | 6,456 | 11,554 | 2,572 | 2,450 | 23,032 | |||||||||||
| Cash spent | (3,732 | ) | - | - | (2,112 | ) | (5,844 | ) | ||||||||
| Charged against assets | - | (11,554 | ) | (2,572 | ) | - | (14,126 | ) | ||||||||
| Foreign currency translation | 261 | - | - | - | 261 | |||||||||||
| Reversed to income | - | - | - | (30 | ) | (30 | ) | |||||||||
| Balance at December 31, 2004 | 5,091 | - | - | 3,394 | 8,485 | |||||||||||
| 2005: | ||||||||||||||||
| Charges | 3,620 | 8,198 | 353 | 6,553 | 18,724 | |||||||||||
| Cash spent | (6,182 | ) | - | - | (4,290 | ) | (10,472 | ) | ||||||||
| Charged against assets | - | (8,198 | ) | (353 | ) | - | (8,551 | ) | ||||||||
| Foreign currency translation | (8 | ) | - | - | - | (8 | ) | |||||||||
| Reversed to income | (1,036 | ) | - | - | (170 | ) | (1,206 | ) | ||||||||
| Balance at December 31, 2005 | 1,485 | - | - | 5,487 | 6,972 | |||||||||||
| 2006: | ||||||||||||||||
| Charges | 1,371 | 1,150 | - | 1,607 | 4,128 | |||||||||||
| Cash spent | (2,420 | ) | - | - | (2,472 | ) | (4,892 | ) | ||||||||
| Charged against assets | - | (1,150 | ) | - | - | (1,150 | ) | |||||||||
| Foreign currency translation | - | - | - | - | - | |||||||||||
| Reversed to income | - | - | - | - | - | |||||||||||
| Balance at December 31, 2006 | $ | 436 | $ | - | $ | - | $ | 4,622 | $ | 5,058 | ||||||
| (a) Represents depreciation accelerated due to plant shutdowns based on a remaining useful life of less than one year. | ||||||||||||||||
| (b) Other includes primarily accrued losses on a sub-lease at a facility in Princeton New, Jersey. | ||||||||||||||||
|
|
|
|
|
|
|
|
|
|
|
|
|
|
|
|
|
|
| Severance |
| Asset | Accelerated | Other (b) |
| Total |
| |||||||
Balance at December 31, 2004 |
| $ | 2,457 |
| $ | — |
| $ | — |
| $ | 3,394 |
| $ | 5,851 |
|
2005: |
|
|
|
|
|
|
|
|
|
|
|
|
|
|
|
|
Charges |
|
| 3,470 |
|
| 8,433 |
|
| 353 |
|
| 5,442 |
|
| 17,698 |
|
Cash spent |
|
| (3,887 | ) |
| — |
|
| — |
|
| (3,179 | ) |
| (7,066 | ) |
Charged against assets |
|
| — |
|
| (8,433 | ) |
| (353 | ) |
| — |
|
| (8,786 | ) |
Foreign currency translation |
|
| (8 | ) |
| — |
|
| — |
|
| — |
|
| (8 | ) |
Reversed to income |
|
| (562 | ) |
| — |
|
| — |
|
| (170 | ) |
| (732 | ) |
Balance at December 31, 2005 |
|
| 1,470 |
|
| — |
|
| — |
|
| 5,487 |
|
| 6,957 |
|
2006: |
|
|
|
|
|
|
|
|
|
|
|
|
|
|
|
|
Charges |
|
| 1,371 |
|
| 1,150 |
|
| — |
|
| 1,607 |
|
| 4,128 |
|
Cash spent |
|
| (2,405 | ) |
| — |
|
| — |
|
| (2,472 | ) |
| (4,877 | ) |
Charged against assets |
|
| — |
|
| (1,150 | ) |
| — |
|
| — |
|
| (1,150 | ) |
Foreign currency translation |
|
| — |
|
| — |
|
| — |
|
| — |
|
| — |
|
Reversed to income |
|
| — |
|
| — |
|
| — |
|
| — |
|
| — |
|
Balance at December 31, 2006 |
|
| 436 |
|
| — |
|
| — |
|
| 4,622 |
|
| 5,058 |
|
2007: |
|
|
|
|
|
|
|
|
|
|
|
|
|
|
|
|
Charges |
|
| 592 |
|
| 594 |
|
| — |
|
| 2,841 |
|
| 4,027 |
|
Cash spent |
|
| (665 | ) |
| — |
|
| — |
|
| (1,625 | ) |
| (2,290 | ) |
Charged against assets |
|
| — |
|
| (594 | ) |
| — |
|
| — |
|
| (594 | ) |
Foreign currency translation |
|
| — |
|
| — |
|
| — |
|
| — |
|
| — |
|
Reversed to income |
|
| — |
|
| — |
|
| — |
|
| — |
|
| — |
|
Balance at December 31, 2007 |
| $ | 363 |
| $ | — |
| $ | — |
| $ | 5,838 |
| $ | 6,201 |
|
(a) | Represents depreciation accelerated due to plant shutdowns based on a remaining useful life of less than one year. |
(b) | Other includes primarily accrued losses on a sub-lease at a facility in Princeton New, Jersey. |
See Note 15 for more information on plant shutdowns, asset impairments and restructurings.
8 | DEBT AND CREDIT AGREEMENTS |
On December 15, 2005, we refinanced our debt with a new $300,000, five-year unsecured revolving credit agreement (the “Credit Agreement”). At December 31, 2006,2007, available credit under the Credit Agreement was approximately $239,000.$219,000. Total debt due and outstanding at December 31, 20062007 is summarized below:
| Debt Due and Outstanding at December 31, 2006 | ||||||||||
Year Due | Credit Agreement | Other | Total Debt Due | |||||||
| 2007 | $ | - | $ | 678 | $ | 678 | ||||
| 2008 | - | 484 | 484 | |||||||
| 2009 | - | 495 | 495 | |||||||
| 2010 | 60,000 | 415 | 60,415 | |||||||
| 2011 | - | 221 | 221 | |||||||
| Remainder | - | 227 | 227 | |||||||
| Total | $ | 60,000 | $ | 2,520 | $ | 62,520 | ||||
|
|
|
|
|
|
|
|
|
|
|
Debt Due and Outstanding at December 31, 2007 | ||||||||||
Year |
| Credit |
| Other |
| Total Debt |
| |||
2008 |
| $ | — |
| $ | 540 |
| $ | 540 |
|
2009 |
|
| — |
|
| 552 |
|
| 552 |
|
2010 |
|
| 80,000 |
|
| 463 |
|
| 80,463 |
|
2011 |
|
| — |
|
| 247 |
|
| 247 |
|
2012 |
|
| — |
|
| 126 |
|
| 126 |
|
Remainder |
|
| — |
|
| 128 |
|
| 128 |
|
Total |
| $ | 80,000 |
| $ | 2,056 |
| $ | 82,056 |
|
The credit spread over LIBOR and commitment fees charged on the unused amount under the Credit Agreement at various indebtedness-to-adjusted EBITDA levels are as follows:
| Pricing Under Credit Agreement (Basis Points) | |||||||
Credit Spread Over LIBOR | |||||||
Indebtedness-to- Adjusted EBITDA Ratio | ($60 Million Outstanding at 12/31/06) | Commitment Fee | |||||
| > 2.50x but <= 3x | 125 | 25 | |||||
| > 1.75x but <= 2.50x | 100 | 20 | |||||
| > 1x but <= 1.75x | 87.5 | 17.5 | |||||
| <= 1x | 75 | 15 | |||||
|
|
|
|
|
|
|
|
Pricing Under Credit Agreement (Basis Points) | |||||||
|
| Credit Spread |
|
|
|
| |
|
|
|
|
|
| ||
Indebtedness-to- |
| ($80 Million |
| Commitment |
| ||
> 2.50x but <= 3x |
| 125 |
|
| 25 |
|
|
> 1.75x but <= 2.50x |
| 100 |
|
| 20 |
|
|
> 1x but <= 1.75x |
| 87.5 |
|
| 17.5 |
|
|
<= 1x |
| 75 |
|
| 15 |
|
|
At December 31, 2006,2007, the interest cost on debt was priced at one-month LIBOR plus the applicable credit spread of 75 basis points.
The most restrictive covenants in the Credit Agreement include:
• | Maximum aggregate dividends over the term of the Credit Agreement of $100,000 plus, beginning October 1, 2005, 50% of net income ($ |
• | Minimum shareholders’ equity ($ |
• | Maximum indebtedness-to-adjusted EBITDA through December 31, 2008 of 3x and 2.75x thereafter (2.5x on a pro forma basis for acquisitions); and |
• | Minimum adjusted EBIT-to-interest expense of 2.5x. |
We believe we were in compliance with all of our debt covenants as of December 31, 2006.2007. Noncompliance with any one or more of the debt covenants may have a material adverse effect on financial condition or liquidity in the event such noncompliance cannot be cured or should we be unable to obtain a waiver from the lenders. Renegotiation of the covenant through an amendment to the Credit Agreement may effectively cure the noncompliance, but may have an effect on financial condition or liquidity depending upon how the covenant is renegotiated.
In the past we have used interest rate swaps with large major financial institutions to manage interest rate exposure, but there have been no interest rate swaps outstanding since 2003.
9 | SHAREHOLDER RIGHTS AGREEMENT |
Pursuant to a Rights Agreement dated as of June 30, 1999 (as amended), between Tredegar and National City Bank as Rights Agent, one Rightright is attendant to each share of our common stock.stock (“Right”). Each Right entitles the registered holder to purchase from Tredegar one one-hundredth of a share of Participating Cumulative Preferred Stock, Series A (the “Preferred Stock”), at an exercise price of $150 (the “Purchase Price”). The Rights will become exercisable, if not earlier redeemed, only if a person or group acquires 10% or more of the outstanding shares of our common stock or announces a tender offer which would result in ownership by a person or group of 10% or more of our common stock. Any action by a person or group whose beneficial ownership iswas reported on Amendment No. 4 to the Schedule 13D filed with respect to Tredegar on March 20, 1997, cannot cause the Rights to become exercisable.
Each holder of a Right, upon the occurrence of certain events, will become entitled to receive, upon exercise and payment of the Purchase Price, Preferred Stock (or in certain circumstances, cash, property or other securities of Tredegar or a potential acquirer) having a value equal to twice the amount of the Purchase Price.
The Rights will expire on June 30, 2009.
10 | STOCK OPTION AND STOCK AWARD PLANS |
We have two stock option plans under which stock options may be granted to purchase a specified number of shares of common stock at a price no lower than the fair market value on the date of grant and for a term not to exceed 10 years. One of those option plans is a directors’ stock plan. In addition, we have three other stock option plans under which there are options that remain outstanding, but no future grants can be made. Employee options ordinarily vest one to two years from the date of grant. The outstanding options granted to directors vest over three years. The option plans also permit the grant of stock appreciation rights (“SARs”), stock, restricted stock, stock unit awards and incentive awards. No SARs have been granted since 1992. All SARs outstanding at December 31, 2001, were exercised during 2002.
A summary of our stock options outstanding at December 31, 2007, 2006 2005 and 2004,2005, and changes during those years, is presented below:
| Option Exercise Price/Share | ||||||||||||||||
Number of Options | Range | Wgted. Ave. | ||||||||||||||
| Outstanding at 12/31/03 | 2,722,610 | $ | 3.37 | to | 46.63 | $ | 21.39 | |||||||||
| Granted | 348,425 | 13.95 | to | 14.50 | 13.97 | |||||||||||
| Forfeited and Expired | (102,175 | ) | 7.38 | to | 46.63 | 23.28 | ||||||||||
| Exercised | (306,870 | ) | 3.37 | to | 19.75 | 6.99 | ||||||||||
| Outstanding at 12/31/04 | 2,661,990 | 4.17 | to | 46.63 | 22.01 | |||||||||||
| Granted | - | n/a | to | n/a | n/a | |||||||||||
| Forfeited and Expired | (274,575 | ) | 13.95 | to | 46.63 | 21.90 | ||||||||||
| Exercised | (137,075 | ) | 4.17 | to | 16.55 | 7.51 | ||||||||||
| Outstanding at 12/31/05 | 2,250,340 | 7.38 | to | 46.63 | 22.90 | |||||||||||
| Granted | 449,800 | 15.11 | to | 19.52 | 15.30 | |||||||||||
| Forfeited and Expired | (874,525 | ) | 7.38 | to | 46.63 | 29.73 | ||||||||||
| Exercised | (578,442 | ) | 7.38 | to | 19.75 | 16.47 | ||||||||||
| Outstanding at 12/31/06 | 1,247,173 | $ | 13.95 | to | $ | 29.94 | $ | 18.16 | ||||||||
|
|
|
|
|
|
|
|
|
|
|
|
|
|
|
|
|
|
|
|
|
| Option Exercise Price/Share |
| ||||||||||
|
|
|
|
|
| |||||||||||
|
| Number of |
|
|
|
| Range |
|
|
|
| Wgted. |
| |||
Outstanding at 12/31/04 |
|
| 2,661,990 |
| $ | 4.17 |
|
| to |
| $ | 46.63 |
| $ | 22.01 |
|
Granted |
|
| — |
|
| n/a |
|
| to |
|
| n/a |
|
| n/a |
|
Forfeited and Expired |
|
| (274,575 | ) |
| 13.95 |
|
| to |
|
| 46.63 |
|
| 21.90 |
|
Exercised |
|
| (137,075 | ) |
| 4.17 |
|
| to |
|
| 16.55 |
|
| 7.51 |
|
Outstanding at 12/31/05 |
|
| 2,250,340 |
|
| 7.38 |
|
| to |
|
| 46.63 |
|
| 22.90 |
|
Granted |
|
| 449,800 |
|
| 15.11 |
|
| to |
|
| 19.52 |
|
| 15.30 |
|
Forfeited and Expired |
|
| (874,525 | ) |
| 7.38 |
|
| to |
|
| 46.63 |
|
| 29.73 |
|
Exercised |
|
| (578,442 | ) |
| 7.38 |
|
| to |
|
| 19.75 |
|
| 16.47 |
|
Outstanding at 12/31/06 |
|
| 1,247,173 |
|
| 13.95 |
|
| to |
|
| 29.94 |
|
| 18.16 |
|
Granted |
|
| 4,000 |
|
| 14.40 |
|
| to |
|
| 14.40 |
|
| 14.40 |
|
Forfeited and Expired |
|
| (184,065 | ) |
| 13.95 |
|
| to |
|
| 29.94 |
|
| 20.68 |
|
Exercised |
|
| (364,125 | ) |
| 13.95 |
|
| to |
|
| 22.72 |
|
| 18.58 |
|
Outstanding at 12/31/07 |
|
| 702,983 |
| $ | 13.95 |
|
| to |
| $ | 29.94 |
| $ | 17.25 |
|
| ||||||||||||||||
The following table summarizes additional information about stock options outstanding and exercisable and non-vested restricted stock outstanding at December 31, 2006:
|
|
|
|
|
|
|
|
|
|
|
|
|
|
|
|
|
|
|
|
|
|
|
|
|
|
|
|
|
|
|
|
|
|
|
|
|
| Options Outstanding at |
| Options Exercisable at |
| ||||||||||||||||||
|
|
|
|
|
|
|
| ||||||||||||||||||||||
|
|
|
|
|
|
|
|
|
| Weighted Average |
|
|
|
|
|
|
|
|
|
|
|
|
|
| |||||
|
|
|
|
|
|
|
|
|
|
|
|
|
|
|
|
|
|
|
|
|
|
|
| ||||||
Range of |
|
| Shares |
| Remaining |
| Exercise |
| Aggregate |
| Shares |
| Weighted |
| Aggregate |
|
| ||||||||||||
$ 13.95 |
|
| to |
| $ | 17.88 |
|
| 420,943 |
|
| 4.8 |
| $ | 14.95 |
| $ | 781 |
|
| 86,643 |
| $ | 13.95 |
| $ | 247 |
|
|
17.89 |
|
| to |
|
| 19.75 |
|
| 235,750 |
|
| 1.2 |
|
| 18.91 |
|
| — |
|
| 224,250 |
|
| 18.88 |
|
| — |
|
|
19.76 |
|
| and over |
|
|
|
|
| 46,290 |
|
| .5 |
|
| 29.78 |
|
| — |
|
| 46,290 |
|
| 29.78 |
|
| — |
|
|
Total |
|
|
|
|
|
|
|
| 702,983 |
|
| 3.3 |
| $ | 17.25 |
| $ | 781 |
|
| 357,183 |
| $ | 19.09 |
| $ | 247 |
|
|
|
|
|
|
|
|
|
|
|
|
|
|
|
|
|
|
|
|
|
|
|
|
|
|
|
|
|
|
|
|
| Options Outstanding at | Options Exercisable at | |||||||||||||||||||||||||||
| December 31, 2006 | December 31, 2006 | |||||||||||||||||||||||||||
| Weighted Average | Aggregate | Aggregate | ||||||||||||||||||||||||||
| Remaining | Intrinsic | Weighted | Intrinsic | |||||||||||||||||||||||||
| Contract- | Value | Average | Value | |||||||||||||||||||||||||
| Range of | ual Life | Exercise | (In | Exercise | (In | |||||||||||||||||||||||
| Exercise Prices | Shares | (Years) | Price | Thousands) | Shares | Price | Thousands) | |||||||||||||||||||||
| $ | 13.95 | to | $ | 17.88 | 627,068 | 4.6 | $ | 15.18 | $ | 4,660 | 243,268 | $ | 15.14 | $ | 1,816 | |||||||||||||
| 17.89 | to | 19.75 | 361,650 | 1.7 | 19.06 | 1,282 | 350,150 | 19.05 | 1,247 | |||||||||||||||||||
| 19.76 | to | 25.65 | 188,300 | .2 | 21.98 | 131 | 188,300 | 21.98 | 131 | |||||||||||||||||||
| 25.66 | to | 29.94 | 70,155 | 1.4 | 29.84 | - | 70,155 | 29.84 | - | |||||||||||||||||||
| $ | 13.95 | to | $ | 29.94 | 1,247,173 | 2.9 | $ | 18.16 | $ | 6,073 | 851,873 | $ | 19.47 | $ | 3,194 | |||||||||||||
| Non-vested Restricted Stock | Number of Shares | Wgtd. Ave. Grant Date Fair Value/Sh. | Grant Date Fair Value (In Thousands) | |||||||
| Outstanding at 12/31/03 | - | $ | - | $ | - | |||||
| Granted | 125,000 | 13.95 | 1,744 | |||||||
| Vested | - | - | - | |||||||
| Forfeited | (5,000 | ) | 13.95 | (70 | ) | |||||
| Outstanding at 12/30/04 | 120,000 | 13.95 | 1,674 | |||||||
| Granted | 7,000 | 12.92 | 90 | |||||||
| Vested | (8,000 | ) | 13.95 | (111 | ) | |||||
| Forfeited | (10,000 | ) | 13.95 | (140 | ) | |||||
| Outstanding at 12/31/05 | 109,000 | 13.88 | 1,513 | |||||||
| Granted | 2,000 | 16.31 | 33 | |||||||
| Vested | (17,333 | ) | 13.95 | (242 | ) | |||||
| Forfeited | (24,167 | ) | 13.80 | (333 | ) | |||||
| Outstanding at 12/31/06 | 69,500 | $ | 13.97 | $ | 971 | |||||
|
|
|
|
|
|
|
|
|
|
|
|
|
|
|
|
|
|
|
|
|
|
|
| Non-vested Restricted Stock |
| Maximum Non-vested Restricted |
| ||||||||||||||||
|
| ||||||||||||||||||||
|
| Number |
| Wgtd. Ave. |
| Grant Date |
| Number |
| Wgtd. Ave. |
| Grant Date |
| ||||||||
Outstanding at 12/30/04 |
|
| 120,000 |
| $ | 13.95 |
|
| $ | 1,674 |
|
|
| — |
| $ | — |
| $ | — |
|
Granted |
|
| 7,000 |
|
| 12.92 |
|
| 90 |
|
| — |
|
| — |
|
| — |
| ||
Vested |
|
| (8,000 | ) |
| 13.95 |
|
|
| (111 | ) |
| — |
|
| — |
|
| — |
| |
Forfeited |
|
| (10,000 | ) |
| 13.95 |
|
| (140 | ) |
|
| — |
|
| — |
|
| — |
| |
Outstanding at 12/30/05 |
|
| 109,000 |
|
| 13.88 |
|
|
| 1,513 |
|
|
| — |
|
| — |
|
| — |
|
Granted |
|
| 2,000 |
|
| 16.31 |
|
| 33 |
|
| — |
|
| — |
|
| — |
| ||
Vested |
|
| (17,333 | ) |
| 13.95 |
|
|
| (242 | ) |
|
| — |
|
| — |
|
| — |
|
Forfeited |
|
| (24,167 | ) |
| 13.80 |
|
| (333 | ) |
|
| — |
|
| — |
|
| — |
| |
Outstanding at 12/31/06 |
|
| 69,500 |
|
| 13.97 |
|
|
| 971 |
|
|
| — |
|
| — |
|
| — |
|
Granted |
|
| — |
|
| — |
|
| — |
|
| 233,375 |
|
| 20.80 |
|
| 4,854 |
| ||
Vested |
|
| (6,000 | ) |
| 13.95 |
|
|
| (84 | ) |
|
| — |
|
| — |
|
| — |
|
Forfeited |
|
| (4,000 | ) |
| 13.95 |
|
| (56 | ) |
|
| (56,500 | ) |
| 23.00 |
|
| (1,300) |
| |
Outstanding at 12/31/07 |
|
| 59,500 |
| $ | 13.97 |
|
| $ | 831 |
|
|
| 176,875 |
| $ | 20.09 |
| $ | 3,554 |
|
The total intrinsic value of stock options exercised during 2006 was $2,174.$1,455 in 2007 and $2,174 in 2006. The grant-date fair value of stock option-based awards vested duringwas $1,323 in 2006 was $1,323.(none in 2007). As of December 31, 2006,2007, there was $1,300$260 and $380approximately $1,700 of unrecognized compensation cost related to stock option-based awards and non-vested restricted stock and other stock-based awards, respectively. This cost is expected to be recognized over the remaining weighted average period of 1.23.26 years for stock option-based awards and 2.31.4 years for non-vested restricted stock.stock and other stock-based awards. Compensation costs for non-vested restricted stock is subject to accelerated vesting based on meeting certain financial targets.
Stock options exercisable totaled 851,873 shares at December 31, 2006 and 1,983,440 shares at December 31, 2005 and 2,316,390 shares at December 31, 2004.2005. Stock options available for grant totaled 1,412,232 shares at December 31, 2007, 1,601,700 shares at December 31, 2006 and 1,998,300 shares at December 31, 2005 and 2,030,300 shares at December 31, 2004.
11 | RETIREMENT PLANS AND OTHER POSTRETIREMENT BENEFITS |
We have noncontributory and contributory defined benefit (pension) plans covering most employees. The plans for salaried and hourly employees currently in effect are based on a formula using the participant’s years of service and compensation or using the participant’s years of service and a dollar amount.
On October 26, 2006, we announced changes to our U.S. defined benefit (pension) and savings plans covering salaried and certain other employees. The changes had no impact on our net income or earnings per share in 2006. The changes relating to the pension plan reduced our projected benefit obligation by approximately $10,000 as of
December 31, 2006. In 2007, the changes to the pension plan are expected to reducereduced our service cost, interest cost and amortization of prior service cost components of pension expense by approximately $600, $600 and $1,500, respectively, and the savings plan changes (see Note 12) are expected to increaseincreased charges for company matching contributions by approximately $700.
In addition to providing pension benefits, we provide postretirement life insurance and health care benefits for certain groups of employees. Tredegar and retirees share in the cost of postretirement health care benefits, with employees hired on or before January 1, 1993, receiving a fixed subsidy to cover a portion of their health care premiums. On December 8, 2003, the Medicare Prescription Drug Improvement and Modernization Act of 2003 (the “Act”) was signed into law. We eliminated prescription drug coverage for Medicare-eligible retirees as of January 1, 2006. Consequently, we are not eligible for any federal subsidies.
Assumptions used for financial reporting purposes to compute net benefit income or cost and benefit obligations for continuing operations, and the components of net periodic benefit income or cost for continuing operations, are as follows:
| Pension Benefits | Other Post- Retirement Benefits | ||||||||||||||||||
2006 | 2005 | 2004 | 2006 | 2005 | 2004 | ||||||||||||||
| Weighted-average assumptions used to determine benefit obligations: | |||||||||||||||||||
| Discount rate | 5.70 | % | 5.70 | % | 6.00 | % | 5.70 | % | 5.70 | % | 6.00 | % | |||||||
| Rate of compensation increases | 4.00 | % | 4.00 | % | 4.00 | % | 4.00 | % | 4.00 | % | 4.00 | % | |||||||
| Weighted-average assumptions used to determine net periodic benefit cost: | |||||||||||||||||||
| Discount rate | 5.70 | % | 6.00 | % | 6.25 | % | 5.70 | % | 6.00 | % | 6.25 | % | |||||||
| Rate of compensation increases | 4.00 | % | 4.00 | % | 4.00 | % | 4.00 | % | 4.00 | % | 4.00 | % | |||||||
| Expected long-term return on plan assets, during the year | 8.40 | % | 8.40 | % | 8.40 | % | n/a | n/a | n/a | ||||||||||
| Rate of increase in per-capita cost of covered health care benefits: | |||||||||||||||||||
| Indemnity plans, end of year | n/a | n/a | n/a | 6.00 | % | 6.00 | % | 6.00 | % | ||||||||||
| Managed care plans, end of year | n/a | n/a | n/a | 6.00 | % | 6.00 | % | 6.00 | % | ||||||||||
| Components of net periodic benefit income (cost): | |||||||||||||||||||
| Service cost | $ | (6,327 | ) | $ | (6,469 | ) | $ | (5,519 | ) | $ | (70 | ) | $ | (109 | ) | $ | (115 | ) | |
| Interest cost | (13,497 | ) | (12,661 | ) | (12,283 | ) | (535 | ) | (576 | ) | (562 | ) | |||||||
| Employee contributions | 517 | 468 | 443 | - | - | - | |||||||||||||
| Other | (127 | ) | 12 | (212 | ) | - | - | - | |||||||||||
| Expected return on plan assets | 21,583 | 22,050 | 22,678 | - | - | - | |||||||||||||
| Amortization of: | |||||||||||||||||||
| Net transition asset | - | - | 7 | - | - | - | |||||||||||||
| Prior service costs and gains or losses | (4,746 | ) | (738 | ) | (491 | ) | 24 | 2 | 53 | ||||||||||
| Net periodic benefit income (cost) | $ | (2,597 | ) | $ | 2,662 | $ | 4,623 | $ | (581 | ) | $ | (683 | ) | $ | (624 | ) | |||
|
|
|
|
|
|
|
|
|
|
|
|
|
|
|
|
|
|
|
|
|
| Pension Benefits |
| Other Post- |
| ||||||||||||||
|
|
| |||||||||||||||||
|
| 2007 |
| 2006 |
| 2005 |
| 2007 |
| 2006 |
| 2005 |
| ||||||
Weighted-average assumptions used to determine benefit obligations: |
|
|
|
|
|
|
|
|
|
|
|
|
|
|
|
|
|
|
|
Discount rate |
|
| 6.25 | % |
| 5.75 | % |
| 5.75 | % |
| 6.25 | % |
| 5.75 | % |
| 5.75 | % |
Rate of compensation increases |
|
| 4.00 | % |
| 4.00 | % |
| 4.00 | % |
| 4.00 | % |
| 4.00 | % |
| 4.00 | % |
Weighted-average assumptions used to determine net periodic benefit cost: |
|
|
|
|
|
|
|
|
|
|
|
|
|
|
|
|
|
|
|
Discount rate |
|
| 5.75 | % |
| 5.75 | % |
| 6.00 | % |
| 5.75 | % |
| 5.75 | % |
| 6.00 | % |
Rate of compensation increases |
|
| 4.00 | % |
| 4.00 | % |
| 4.00 | % |
| 4.00 | % |
| 4.00 | % |
| 4.00 | % |
Expected long-term return on plan assets, during the year |
|
| 8.50 | % |
| 8.50 | % |
| 8.50 | % |
| n/a |
|
| n/a |
|
| n/a |
|
Rate of increase in per-capita cost of covered health care benefits: |
|
|
|
|
|
|
|
|
|
|
|
|
|
|
|
|
|
|
|
Indemnity plans, end of year |
|
| n/a |
|
| n/a |
|
| n/a |
|
| 6.00 | % |
| 6.00 | % |
| 6.00 | % |
Managed care plans, end of year |
|
| n/a |
|
| n/a |
|
| n/a |
|
| 6.00 | % |
| 6.00 | % |
| 6.00 | % |
Components of net periodic benefit income (cost): |
|
|
|
|
|
|
|
|
|
|
|
|
|
|
|
|
|
|
|
Service cost |
| $ | (4,232 | ) | $ | (4,933 | ) | $ | (5,334 | ) | $ | (106 | ) | $ | (70 | ) | $ | (90 | ) |
Interest cost |
|
| (11,447 | ) |
| (12,079 | ) |
| (11,377 | ) |
| (503 | ) |
| (513 | ) |
| (556 | ) |
Expected return on plan assets |
|
| 20,372 |
|
| 19,820 |
|
| 20,564 |
|
| — |
|
| — |
|
| — |
|
Amortization of prior service costs and gains or losses |
|
| (1,819 | ) |
| (4,476 | ) |
| (655 | ) |
| — |
|
| 14 |
|
| (7 | ) |
Net periodic benefit income (cost) |
| $ | 2,874 |
| $ | (1,668 | ) | $ | 3,198 |
| $ | (609 | ) | $ | (569 | ) | $ | (653 | ) |
The following tables reconcile the changes in benefit obligations and plan assets in 20062007 and 2005,2006, and reconcile the funded status to prepaid or accrued cost at December 31, 20062007 and 2005:
| Pension Benefits | Other Post- Retirement Benefits | ||||||||||||
2006 | 2005 | 2006 | 2005 | ||||||||||
| Change in benefit obligation: | |||||||||||||
| Benefit obligation, beginning of year | $ | 238,533 | $ | 214,037 | $ | 10,070 | $ | 9,994 | |||||
| Service cost | 6,327 | 6,469 | 70 | 109 | |||||||||
| Interest cost | 13,497 | 12,661 | 535 | 576 | |||||||||
| Plan amendments | (10,039 | ) | 1,372 | - | - | ||||||||
| Effect of discount rate change | (985 | ) | 10,424 | (4 | ) | 326 | |||||||
| Employee contributions | 517 | 468 | - | - | |||||||||
| Other | (3,615 | ) | 3,500 | (329 | ) | (290 | ) | ||||||
| Benefits paid | (10,841 | ) | (10,398 | ) | (920 | ) | (645 | ) | |||||
| Benefit obligation, end of year | $ | 233,394 | $ | 238,533 | $ | 9,422 | $ | 10,070 | |||||
| Change in plan assets: | |||||||||||||
| Plan assets at fair value, beginning of year | $ | 257,101 | $ | 247,505 | $ | - | $ | - | |||||
| Actual return on plan assets | 36,086 | 18,487 | - | - | |||||||||
| Employee contributions | 517 | 468 | - | - | |||||||||
| Employer contributions | 1,074 | 1,158 | 920 | 645 | |||||||||
| Other | (128 | ) | (119 | ) | - | - | |||||||
| Benefits paid | (10,841 | ) | (10,398 | ) | (920 | ) | (645 | ) | |||||
| Plan assets at fair value, end of year | $ | 283,809 | $ | 257,101 | $ | - | $ | - | |||||
| Reconciliation of prepaid (accrued) cost: | |||||||||||||
| Funded status of the plans | $ | 50,415 | $ | 18,568 | $ | (9,422 | ) | $ | (10,070 | ) | |||
| Unrecognized prior service cost | - | 4,303 | - | - | |||||||||
| Unrecognized net (gain) loss | - | 62,776 | - | (8 | ) | ||||||||
| Prepaid (accrued) cost, end of year | $ | 50,415 | $ | 85,647 | $ | (9,422 | ) | $ | (10,078 | ) | |||
| Amounts recognized in the consolidated balance sheets: | |||||||||||||
| Prepaid benefit cost | $ | 54,034 | $ | 85,647 | $ | - | $ | - | |||||
| Accrued benefit liability | (3,619 | ) | (4,832 | ) | (9,422 | ) | (10,078 | ) | |||||
| Intangible asset | - | 1,145 | - | - | |||||||||
| Decrease in deferred income tax liabilities relating to accumulated other comprehensive loss | - | 1,253 | - | - | |||||||||
| Accumulated other comprehensive loss | - | 2,434 | - | - | |||||||||
| Net amount recognized | $ | 50,415 | $ | 85,647 | $ | (9,422 | ) | $ | (10,078 | ) | |||
|
|
|
|
|
|
|
|
|
|
|
|
|
|
|
| Pension Benefits |
| Other Post- |
| ||||||||
|
|
| |||||||||||
|
| 2007 |
| 2006 |
| 2007 |
| 2006 |
| ||||
Change in benefit obligation: |
|
|
|
|
|
|
|
|
|
|
|
|
|
Benefit obligation, beginning of year |
| $ | 205,588 |
| $ | 211,701 |
| $ | 9,366 |
| $ | 9,623 |
|
Service cost |
|
| 4,232 |
|
| 4,933 |
|
| 106 |
|
| 70 |
|
Interest cost |
|
| 11,447 |
|
| 12,079 |
|
| 503 |
|
| 513 |
|
Plan amendments |
|
| 23 |
|
| (10,039 | ) |
| — |
|
| — |
|
Effect of discount rate change |
|
| (12,318 | ) |
| — |
|
| (467 | ) |
| — |
|
Other |
|
| 775 |
|
| (3,426 | ) |
| (377 | ) |
| 80 |
|
Benefits paid |
|
| (9,618 | ) |
| (9,660 | ) |
| (441 | ) |
| (920 | ) |
Benefit obligation, end of year |
| $ | 200,129 |
| $ | 205,588 |
| $ | 8,690 |
| $ | 9,366 |
|
Change in plan assets: |
|
|
|
|
|
|
|
|
|
|
|
|
|
Plan assets at fair value, |
|
|
|
|
|
|
|
|
|
|
|
|
|
beginning of year |
| $ | 256,669 |
| $ | 232,624 |
| $ | — |
| $ | — |
|
Actual return on plan assets |
|
| 36,883 |
|
| 33,538 |
|
| — |
|
| — |
|
Employer contributions |
|
| 167 |
|
| 167 |
|
| 441 |
|
| 920 |
|
Benefits paid |
|
| (9,619 | ) |
| (9,660 | ) |
| (441 | ) |
| (920 | ) |
Plan assets at fair value, end of year |
| $ | 284,100 |
| $ | 256,669 |
| $ | — |
| $ | — |
|
Funded status of the plans |
| $ | 83,971 |
| $ | 51,081 |
| $ | (8,690 | ) | $ | (9,366 | ) |
Amounts recognized in the consolidated |
|
|
|
|
|
|
|
|
|
|
|
|
|
balance sheets: |
|
|
|
|
|
|
|
|
|
|
|
|
|
Prepaid benefit cost |
| $ | 86,295 |
| $ | 53,619 |
| $ | — |
| $ | — |
|
Accrued benefit liability |
|
| (2,324 | ) |
| (2,538 | ) |
| (8,690 | ) |
| (9,366 | ) |
Net amount recognized |
| $ | 83,971 |
| $ | 51,081 |
| $ | (8,690 | ) | $ | (9,366 | ) |
Net benefit income or cost is determined using assumptions at the beginning of each year. Funded status is determined using assumptions at the end of each year.
At December 31, 2006,2007, the effect of a 1% change in the health care cost trend rate assumptions would be immaterial.
Expected benefit payments for continuing operations over the next five years and in the aggregate for 2012-20162013-2017 are as follows:
| Years | Pension Benefits | Other Post- Retirement Benefits | |||||
| 2007 | 11,027 | 496 | |||||
| 2008 | 11,885 | 534 | |||||
| 2009 | 12,418 | 572 | |||||
| 2010 | 12,781 | 615 | |||||
| 2011 | 13,363 | 642 | |||||
| 2012 - 2016 | 76,660 | 3,546 | |||||
|
|
|
|
|
|
|
|
|
|
Years |
| Pension |
| Other |
| ||||
2008 |
| $ | 10,621 |
|
| $ | 492 |
|
|
2009 |
|
| 11,104 |
|
|
| 537 |
|
|
2010 |
|
| 11,564 |
|
|
| 579 |
|
|
2011 |
|
| 12,074 |
|
|
| 609 |
|
|
2012 |
|
| 12,766 |
|
|
| 641 |
|
|
2013 - 2017 |
|
| 72,202 |
|
|
| 3,556 |
|
|
| |||||||||
The incremental impact for continuing and discontinued operations of adopting SFAS No. 158 as of December 31, 2006 (see the pension costs and postretirement benefit costs other than pensions section of Note 1 for further information on this new standard) and recognizing an additional minimum liability (the “AML”) is shown in the table below:
| As of December 31, 2006 | Prior to AML & SFAS No. 158 Adjustments | AML Adjustment | SFAS No. 158 Adjustment | Post AML & SFAS No. 158 Adjustments | |||||||||
| Prepaid pension costs | $ | 80,442 | $ | 1,243 | $ | (27,651 | ) | $ | 54,034 | ||||
| Pension liabilities | - | - | 3,619 | 3,619 | |||||||||
| Postretirement liabilities | 9,740 | - | (318 | ) | 9,422 | ||||||||
| Decrease (increase) in deferred income tax liabilities relating to accumulated other comprehensive loss | 1,252 | (422 | ) | 11,354 | 12,184 | ||||||||
| Accumulated other comprehensive loss | 2,434 | (821 | ) | 19,598 | 21,211 | ||||||||
|
|
|
|
|
|
|
|
|
|
|
|
|
|
|
|
|
|
|
|
|
|
As of December 31, 2006 |
| Prior to AML & |
| AML |
| SFAS No. 158 |
| Post AML |
| ||||||||||||
Prepaid pension costs |
|
| $ | 80,442 |
|
|
| $ | 1,243 |
|
|
| $ | (27,651 | ) |
|
| $ | 54,034 |
|
|
Pension liabilities |
|
|
| — |
|
|
|
| — |
|
|
|
| 3,619 |
|
|
|
| 3,619 |
|
|
Postretirement liabilities |
|
|
| 9,740 |
|
|
|
| — |
|
|
|
| (318 | ) |
|
|
| 9,422 |
|
|
Decrease (increase) in deferred income tax liabilities relating to accumulated other comprehensive loss |
|
|
| 1,252 |
|
|
|
| (422 | ) |
|
|
| 11,354 |
|
|
|
| 12,184 |
|
|
Accumulated other comprehensive loss |
|
|
| 2,434 |
|
|
|
| (821 | ) |
|
|
| 19,598 |
|
|
|
| 21,211 |
|
|
| |||||||||||||||||||||
Amounts recognized in the table above are included2007 and 2006 before related deferred income taxes in “Other assets and deferred charges” in the consolidated balance sheet at December 31, 2006. Pension and postretirement liabilities in the table above are included in “Other noncurrent liabilities” in the consolidated balance sheet at December 31, 2006.
|
|
|
|
|
|
|
|
|
|
|
|
|
|
|
| Pension |
| Other Post - |
| ||||||||
|
|
| |||||||||||
|
| 2007 |
| 2006 |
| 2007 |
| 2006 |
| ||||
Continuing operations: |
|
|
|
|
|
|
|
|
|
|
|
|
|
Prior service cost (benefit) |
| $ | (6,140 | ) | $ | (7,200 | ) | $ | — |
| $ | — |
|
Net actuarial (gain) loss |
|
| 5,194 |
|
| 36,103 |
|
| (682 | ) |
| 161 |
|
Discontinued operations: |
|
|
|
|
|
|
|
|
|
|
|
|
|
Prior service cost (benefit) |
|
| 1,108 |
|
| 1,002 |
|
| — |
|
| — |
|
Net actuarial (gain) loss |
|
| 6,008 |
|
| 3,807 |
|
| (445 | ) |
| (478 | ) |
Total: |
|
|
|
|
|
|
|
|
|
|
|
|
|
Prior service cost (benefit) |
|
| (5,032 | ) |
| (6,198 | ) |
| — |
|
| — |
|
Net actuarial (gain) loss |
|
| 11,202 |
|
| 39,910 |
|
| (1,127 | ) |
| (317 | ) |
The amounts before related deferred income taxes in accumulated other comprehensive income that are expected to be recognized as components of net periodic benefit or cost during 20072008 are as follows:
| Pension | Other Post- Retirement | Total | ||||||||
| Prior service cost | $ | (967 | ) | $ | - | $ | (967 | ) | ||
| Net (gain) loss | 2,855 | (47 | ) | 2,808 | ||||||
| Pension | Other Post- Retirement | ||||||
| Prior service cost | $ | (6,198 | ) | $ | - | ||
| Net (gain) loss | 39,910 | (317 | ) | ||||
|
|
|
|
|
|
|
|
|
|
|
|
|
| Pension |
| Other Post |
| ||||||
Continuing operations: |
|
|
|
|
|
|
| ||||
Prior service cost (benefit) |
|
| $ | (1,049 | ) |
|
| $ | — |
|
|
Net actuarial (gain) loss |
|
|
| 344 |
|
|
|
| (1 | ) |
|
Discontinued operations: |
|
|
|
|
|
|
|
|
|
|
|
Prior service cost (benefit) |
|
|
| 83 |
|
|
|
| — |
|
|
Net actuarial (gain) loss |
|
|
| 187 |
|
|
|
| (43 | ) |
|
Total: |
|
|
|
|
|
|
|
|
|
|
|
Prior service cost (benefit) |
|
|
| (966 | ) |
|
|
| — |
|
|
Net actuarial (gain) loss |
|
|
| 531 |
|
|
|
| (44 | ) |
|
The percentage composition of assets held by pension plans for continuing operations at December 31, 2007, 2006 and 2005, and the current expected long-term return on assets are as follows:
% Composition of Plan Assets | Expected Long-term | |||||||||
| December 31 | 2006 | 2005 | Return % | |||||||
| Pension plans related to operations in the U.S.: | ||||||||||
| Low-risk fixed income securities | 10.3 | % | 14.1 | % | 5.0 | % | ||||
| Large capitalization equity securities | 20.2 | 19.1 | 9.2 | |||||||
| Mid-capitalization equity securities | 8.0 | 7.3 | 9.8 | |||||||
| Small-capitalization equity securities | 4.6 | 4.3 | 10.4 | |||||||
| International equity securities | 24.8 | 22.4 | 10.4 | |||||||
| Total equity securities | 57.6 | 53.1 | 9.9 | |||||||
| Hedge and private equity funds | 20.3 | 21.0 | 7.0 | |||||||
| Other assets | 2.2 | 2.3 | 3.0 | |||||||
| Total for pension plans related to operations in the U.S. | 90.4 | 90.5 | 8.5 | |||||||
| Pension plans related to operations in Canada | 9.6 | 9.5 | 7.0 | |||||||
| Total | 100.0 | % | 100.0 | % | 8.4 | % | ||||
|
|
|
|
|
|
|
|
|
|
|
|
|
|
|
| % Composition |
| Expected |
| ||||||||
|
| of Plan Assets |
|
| |||||||||
|
|
|
| ||||||||||
December 31 |
| 2007 |
| 2006 |
| 2005 |
| Return % |
| ||||
Pension plans related to continuing operations: |
|
|
|
|
|
|
|
|
|
|
|
|
|
Low-risk fixed income securities |
| 8.5 | % |
| 11.4 | % |
| 15.6 | % |
| 4.3 | % |
|
Large capitalization equity securities |
| 20.7 |
|
| 22.4 |
|
| 21.1 |
|
| 8.1 |
|
|
Mid-capitalization equity securities |
| 7.4 |
|
| 8.8 |
|
| 8.0 |
|
| 9.1 |
|
|
Small-capitalization equity securities |
| 4.7 |
|
| 5.1 |
|
| 4.7 |
|
| 9.5 |
|
|
International equity securities |
| 22.6 |
|
| 27.4 |
|
| 24.8 |
|
| 10.4 |
|
|
Total equity securities |
| 55.4 |
|
| 63.7 |
|
| 58.6 |
|
| 9.4 |
|
|
Hedge and private equity funds |
| 33.9 |
|
| 22.5 |
|
| 23.3 |
|
| 8.8 |
|
|
Other assets |
| 2.2 |
|
| 2.4 |
|
| 2.5 |
|
| 3.6 |
|
|
Total for continuing operations |
| 100.0 | % |
| 100.0 | % |
| 100.0 | % |
| 8.5 | % |
|
Our targeted allocation percentage for pension plan assets is in the range of the percentage composition that existed at December 31, 2006.2007. Expected long-term returns are estimated by asset class and generally are based on inflation-adjusted historical returns, volatilities, risk premiums and managed asset premiums. For pension plans related to operations in the U.S., theThe portfolio of fixed income securities is structured with maturities that generally match estimated benefit payments over the next 2-31-2 years. We believe that over the long term a diversified portfolio of equity securities, hedge funds and private equity funds have a better risk-return profile than fixed income securities. The average remaining duration of benefit payments for our pension plans is about 12 years. We expect our required contributions to approximate $1,100$167 in 2007.
The accumulated benefit obligation was $230,025 at December 31, 2006 and $223,821 at December 31, 2005. The projected benefit obligation, accumulated benefit obligation andestimate of the fair value of plan assets held by our pension plans is provided by third parties not affiliated with Tredegar. The fair value of low-risk fixed income securities and equity securities are typically based on Level 1 inputs. The fair value of the ownership interests held by our pension plans in hedge and private equity funds is reported by the funds. While the fair value of the underlying assets in these funds may be substantially based on Level 1 and Level 2 inputs, we believe that the ownership interests held by our pension plans in these funds are based on Level 3 inputs since there is no secondary market for plans with accumulated benefit obligations in excessthe ownership interests and there are restrictions on withdrawals. Other assets are primarily comprised of plan assets were $13,740, $13,740cash and $12,658, respectively, at December 31, 2006, and $13,200, $13,200 and $10,607, respectively, at December 31, 2005.
We also have a non-qualified supplemental pension plan covering certain employees. Effective December 31, 2005, further participation in this plan was terminated and benefit accruals for existing participants were frozen. The plan was designed to restore all or a part of the pension benefits that would have been payable to designated participants from our principal pension plans if it were not for limitations imposed by income tax regulations. The
projected benefit obligation relating to this unfunded plan was $2,324 at December 31, 2007 and $2,537 at December 31, 2006 and $2,655 at December 31, 2005.2006. Pension expense recognized was $161 in 2007, $355 in 2006 and $256 in 2005 and $275 in 2004.2005. This information has been included in the preceding pension benefit tables.
Approximately 136135 employees at our films manufacturing facility in Kerkrade, The Netherlands are covered by a collective bargaining agreement that includes participation in a multi-employer pension plan. Pension expense recognized for participation in this plan, which is equal to required contributions, was $868 in 2007, $807 in 2006 and $364 in 2005 and $281 in 2004.2005. This information has been excluded from the preceding pension benefit tables.
12 | SAVINGS PLAN |
We have a savings plan that allows eligible employees to voluntarily contribute a percentage (generallyof their compensation up to 15%Internal Revenue Service (“IRS”) of their compensation.limitations. Under the provisions of the plan on or before December 31, 2006, we matched a portion (generally 50 cents for every $1 of employee contribution, up to a maximum of 10% of base pay) of the employee’s contribution to the plan with shares of our common stock. Effective January 1, 2007, and in conjunction with certain pension plan changes (see Note 11), the following changes were made to the savings plan for salaried and certain hourly employees:
• | The company |
• | The savings plan |
We also have a non-qualified plan that restores matching benefits for employees suspended from the savings plan due to certain limitations imposed by income tax regulations. Charges recognized for these plans were $2,828 in 2007, $2,770 in 2006 and $1,889 in 2005 and $2,716 in 2004.2005. The savings plan changes effective January 1, 2007 are expected to increaseincreased charges for company matching contributions by approximately $700. Our liability under the restoration plan was $1,027 at December 31, 2007 (consisting of 63,852 phantom shares of common stock) and $1,332 at December 31, 2006 (consisting of 58,931 phantom shares of common stock) and $782 at December 31, 2005 (consisting of 60,674 phantom shares of common stock) valued at the closing market price on those dates.
The Tredegar Corporation Benefits Plan Trust (the “Trust”) purchased 7,200 shares of our common stock in 1998 for $192 and 46,671 shares of our common stock in 1997 for $1,020, as a partial hedge against the phantom shares held in the restoration plan. There have been no shares purchased since 1997 except for
re-invested dividends. The cost of the shares held by the Trust is shown as a reduction to shareholders’ equity in the consolidated balance sheets.
13 | RENTAL EXPENSE AND CONTRACTUAL COMMITMENTS |
Rental expense for continuing operations was $4,302$3,873 in 2007, $3,859 in 2006 $4,316and $3,811 in 2005 and $4,549 in 2004.2005. Rental commitments under all non-cancelable operating leases for continuing operations as of December 31, 2006,2007, are as follows:
| Amount | ||||
| 2007 | $ | 3,652 | ||
| 2008 | 3,165 | |||
| 2009 | 2,123 | |||
| 2010 | 2,120 | |||
| 2011 | 701 | |||
| Remainder | 818 | |||
| Total | $ | 12,579 | ||
|
|
|
|
|
Year |
| Amount |
| |
2008 |
| $ | 2,461 |
|
2009 |
|
| 2,929 |
|
2010 |
|
| 2,959 |
|
2011 |
|
| 1,757 |
|
2012 |
|
| 1,322 |
|
Remainder |
|
| 595 |
|
Total |
| $ | 12,023 |
|
AFBS, Inc. (formerly known as Therics, Inc. - see Note 15 for additional information regarding its restructuring in 2005), a wholly-owned subsidiary of Tredegar, has future rental commitments under noncancelable
operating leases through 2011 (most of which contain sublease options) totaling $6,800.approximately $5,200. These future rental commitments are included in the above table. Sublease rental commitments relating to excess space at AFBS total about $900$632 (excluded from the above table).
Contractual obligations for plant construction and purchases of real property and equipment amounted to $6,025$2,965 at December 31, 20062007 and $14,628$5,992 at December 31, 2005.
14 | INCOME TAXES |
Income from continuing operations before income taxes and income taxes are as follows:
2006 | 2005 | 2004 | ||||||||
| Income from continuing operations before income taxes: | ||||||||||
| Domestic | $ | 52,408 | $ | 19,709 | $ | 27,875 | ||||
| Foreign | 6,429 | 6,493 | 7,607 | |||||||
| Total | $ | 58,837 | $ | 26,202 | $ | 35,482 | ||||
| Current income taxes: | ||||||||||
| Federal | $ | 5,584 | $ | 1,853 | $ | (2 | ) | |||
| State | 840 | 811 | 1,105 | |||||||
| Foreign | 4,057 | (1,908 | ) | 6,996 | ||||||
| Total | 10,481 | 756 | 8,099 | |||||||
| Deferred income taxes: | ||||||||||
| Federal | 9,807 | 7,900 | 3,385 | |||||||
| State | 687 | 600 | 1,198 | |||||||
| Foreign | (339 | ) | 717 | (3,460 | ) | |||||
| Total | 10,155 | 9,217 | 1,123 | |||||||
| Total income taxes | $ | 20,636 | $ | 9,973 | $ | 9,222 | ||||
|
|
|
|
|
|
|
|
|
|
|
| ||||||||||
| ||||||||||
|
| 2007 |
| 2006 |
| 2005 |
| |||
Income from continuing operations |
|
|
|
|
|
|
|
|
|
|
before income taxes: |
|
|
|
|
|
|
|
|
|
|
Domestic |
| $ | 50,942 |
| $ | 48,850 |
| $ | 16,031 |
|
Foreign |
|
| 8,354 |
|
| 6,258 |
|
| 6,838 |
|
Total |
| $ | 59,296 |
| $ | 55,108 |
| $ | 22,869 |
|
Current income taxes: |
|
|
|
|
|
|
|
|
|
|
Federal |
| $ | 24,698 |
| $ | 5,165 |
| $ | 1,592 |
|
State |
|
| 856 |
|
| 840 |
|
| 811 |
|
Foreign |
|
| 4,351 |
|
| 4,223 |
|
| (422 | ) |
Total |
|
| 29,905 |
|
| 10,228 |
|
| 1,981 |
|
Deferred income taxes: |
|
|
|
|
|
|
|
|
|
|
Federal |
|
| (4,009 | ) |
| 9,030 |
|
| 6,928 |
|
State |
|
| 316 |
|
| 687 |
|
| 600 |
|
Foreign |
|
| (1,846 | ) |
| (154 | ) |
| (12 | ) |
Total |
|
| (5,539 | ) |
| 9,563 |
|
| 7,516 |
|
Total income taxes |
| $ | 24,366 |
| $ | 19,791 |
| $ | 9,497 |
|
The significant differences between the U.S. federal statutory rate and the effective income tax rate for continuing operations are as follows:
Percent of Income Before Income Taxes for Continuing Operations | ||||||||||
2006 | 2005 | 2004 | ||||||||
| Income tax expense at federal statutory rate | 35.0 | 35.0 | 35.0 | |||||||
| State taxes, net of federal income tax benefit | 1.7 | 3.5 | 4.2 | |||||||
| Valuation allowance for foreign operating loss carry-forwards | 1.3 | 1.6 | 1.7 | |||||||
| Unremitted earnings from foreign operations | 1.2 | 2.3 | (.1 | ) | ||||||
| Non-deductible expenses | .7 | .6 | .8 | |||||||
| Foreign rate differences | - | - | 1.0 | |||||||
| Tax-exempt income | - | (1.6 | ) | - | ||||||
| Reversal of income tax contingency accruals | - | - | (11.3 | ) | ||||||
| Research and development tax credit | (.9 | ) | (1.6 | ) | (1.9 | ) | ||||
Valuation allowance for capital loss carry-forwards | (1.0 | ) | 2.2 | - | ||||||
| Extraterritorial Income Exclusion and | ||||||||||
| Domestic Production Activities Deduction | (1.7 | ) | (2.4 | ) | (2.3 | ) | ||||
| Other | (1.2 | ) | (1.5 | ) | (1.1 | ) | ||||
| Effective income tax rate | 35.1 | 38.1 | 26.0 | |||||||
|
|
|
|
|
|
|
|
|
|
| ||||
|
| Percent of Income Before Income |
| |||||||||||
|
| |||||||||||||
|
| 2007 |
| 2006 |
| 2005 |
| |||||||
Income tax expense at federal statutory rate |
|
|
| 35.0 |
|
|
|
| 35.0 |
|
|
| 35.0 |
|
State taxes, net of federal income tax benefit |
|
|
| 1.3 |
|
|
|
| 1.8 |
|
|
| 4.0 |
|
Unremitted earnings from foreign operations |
|
|
| 2.2 |
|
|
|
| 1.2 |
|
|
| 2.7 |
|
Valuation allowance for capital loss |
|
|
| 1.8 |
|
|
|
| (1.1 | ) |
|
| 2.5 |
|
Valuation allowance for foreign operating |
|
|
| 1.4 |
|
|
|
| 1.9 |
|
|
| 1.8 |
|
Non-deductible expenses |
|
|
| .2 |
|
|
|
| .3 |
|
|
| .6 |
|
Research and development tax credit |
|
|
| (.1 | ) |
|
|
| (.9 | ) |
|
| (1.8 | ) |
Extraterritorial Income Exclusion and |
|
|
| (.5 | ) |
|
|
| (1.8 | ) |
|
| (2.8 | ) |
Foreign rate differences |
|
|
| (1.1 | ) |
|
|
| (.3 | ) |
|
| (.9 | ) |
Other |
|
|
| .9 |
|
|
|
| (.2 | ) |
|
| .4 |
|
Effective income tax rate |
|
|
| 41.1 |
|
|
|
| 35.9 |
|
|
| 41.5 |
|
Deferred tax liabilities and deferred tax assets at December 31, 20062007 and 2005,2006, are as follows:
2006 | 2005 | ||||||
| Deferred tax liabilities: | |||||||
| Depreciation | $ | 37,188 | $ | 37,438 | |||
| Pensions | 19,384 | 30,595 | |||||
| Amortization of goodwill | 14,314 | 11,627 | |||||
| Foreign currency translation gain adjustment | 11,607 | 7,686 | |||||
| Unrealized gain on available-for-sale securities | - | 12 | |||||
| Derivative financial instruments | 497 | 437 | |||||
| Other | 1,315 | 351 | |||||
| Total deferred tax liabilities | 84,305 | 88,146 | |||||
| Deferred tax assets: | |||||||
| Employee benefits | 5,987 | 5,244 | |||||
Tax in excess of book basis for venture capital and other investments (net of valuation allowance of $577 in 2005) | 2,372 | 1,863 | |||||
Asset write-offs, divestitures and environmental accruals | 1,251 | 2,602 | |||||
| Allowance for doubtful accounts and sales returns | 1,209 | 1,086 | |||||
| Tax benefit on U.S. foreign and R&D tax credits and | |||||||
| NOL carryforwards | 731 | 7,895 | |||||
| Inventory | 640 | 329 | |||||
Other (net of valuation allowance of $2,120 in 2006 and $1,020 in 2005) | 2,398 | 2,618 | |||||
| Total deferred tax assets | 14,588 | 21,637 | |||||
| Net deferred tax liability | $ | 69,717 | $ | 66,509 | |||
| Included in the balance sheet: | |||||||
| Noncurrent deferred tax liabilities in excess of assets | $ | 75,772 | $ | 74,287 | |||
| Current deferred tax assets in excess of liabilities | 6,055 | 7,778 | |||||
| Net deferred tax liability | $ | 69,717 | $ | 66,509 | |||
|
|
|
|
|
|
|
|
December 31 |
| 2007 |
| 2006 |
| ||
Deferred tax liabilities: |
|
|
|
|
|
|
|
Depreciation |
| $ | 29,105 |
| $ | 30,077 |
|
Pensions |
|
| 31,693 |
|
| 19,584 |
|
Amortization of goodwill |
|
| 18,059 |
|
| 15,318 |
|
Foreign currency translation gain adjustment |
|
| 13,497 |
|
| 7,402 |
|
Derivative financial instruments |
|
| — |
|
| 480 |
|
Other |
|
| 1,152 |
|
| 1,490 |
|
Total deferred tax liabilities |
|
| 93,506 |
|
| 74,351 |
|
Deferred tax assets: |
|
|
|
|
|
|
|
Excess of tax basis over financial reporting basis for the aluminum extrusions business in Canada |
|
| 11,428 |
|
| — |
|
Employee benefits |
|
| 6,543 |
|
| 5,945 |
|
Tax in excess of book basis for venture capital and other investments |
|
| 5,805 |
|
| 2,547 |
|
Asset write-offs, divestitures and environmental accruals |
|
| 3,274 |
|
| 2,851 |
|
Timing adjustment for unrecognized tax benefits on uncertain tax positions, including portion relating to interest and penalties |
|
| 2,761 |
|
| — |
|
Allowance for doubtful accounts and sales returns |
|
| 1,237 |
|
| 1,209 |
|
Tax benefit on state credits and foreign NOL carryforwards |
|
| 954 |
|
| 731 |
|
Derivative financial instruments |
|
| 464 |
|
| — |
|
Inventory |
|
| 70 |
|
| 640 |
|
Other (net of valuation allowance of $2,947 in 2007and $2,120 in 2006) |
|
| 1,517 |
|
| 750 |
|
Total deferred tax assets |
|
| 34,053 |
|
| 14,673 |
|
Net deferred tax liability |
| $ | 59,453 |
| $ | 59,678 |
|
Included in the balance sheet: |
|
|
|
|
|
|
|
Noncurrent deferred tax liabilities in excess of assets |
| $ | 68,625 |
| $ | 65,732 |
|
Current deferred tax assets in excess of liabilities |
|
| 9,172 |
|
| 6,055 |
|
Net deferred tax liability |
| $ | 59,453 |
| $ | 59,677 |
|
Except as noted below, we realized substantially allbelieve that it is more likely than not that future taxable income will exceed future tax deductible amounts thereby resulting in the realization of thedeferred tax benefits from tax credit and other carry-forwards existingassets. A valuation allowance of $2,947 at December 31, 2005. The remaining deferred tax asset associated with tax credit and other carry-forwards of $731 at December 31, 2006, relates to state income taxes and a net operating loss carry-forward for a foreign subsidiary that has no expiration. A valuation allowance at December 31, 2006 of approximately $2,1202007 is included in other deferred tax assets that offsets an amount included in that line item relating to possible future tax benefits on operating losses generated by anothercertain foreign subsidiarysubsidiaries that may not be recoverable in itsthe carry-forward period. In addition, a valuation allowance of $577$1,066 at December 31, 2007 was established in 2005 in conjunction with the write-downthird quarter of our investment in Novalux (see Note 2) for2007 due to expected limitations on the utilization of assumed capital losses. In
A reconciliation of our unrecognized uncertain tax positions since January 1, 2007, is shown below:
|
|
|
|
|
|
|
|
|
|
|
|
|
|
|
|
|
|
|
|
|
|
|
|
|
|
|
|
|
|
|
|
|
|
|
|
|
|
|
|
|
|
| Increase |
|
|
|
|
|
|
| |||||||||||||
|
|
|
|
| Increase (Decrease) |
|
|
|
|
|
|
|
| ||||||||||||||||||
|
|
|
|
|
|
| Reductions |
|
|
|
| ||||||||||||||||||||
|
|
|
|
|
|
|
|
|
|
| |||||||||||||||||||||
|
| Balance at |
|
|
|
| Balance at |
| |||||||||||||||||||||||
|
|
| Current |
| Prior |
|
|
|
| ||||||||||||||||||||||
|
|
|
|
|
|
|
| ||||||||||||||||||||||||
Gross unrecognized tax benefits on uncertain tax positions (reflected in current income tax and other noncurrent liability accounts in the balance sheet) |
|
| $ | 3,393 |
|
|
| $ | 566 |
|
|
| $ | (506 | ) |
|
| $ | — |
|
|
| $ | (185 | ) |
|
| $ | 3,268 |
|
|
Deferred income tax assets related to unrecognized tax benefits on uncertain tax positions for which ultimate deductibility is highly certain but for which the timing of the deduction is uncertain (reflected in deferred income tax accounts in the balance sheet) |
|
|
| (2,733 | ) |
|
|
|
|
|
|
|
|
|
|
|
|
|
|
|
|
|
|
|
|
|
|
| (2,325 | ) |
|
Net unrecognized tax benefits on uncertain tax positions, which would impact the effective tax rate if recognized |
|
|
| 660 |
|
|
|
|
|
|
|
|
|
|
|
|
|
|
|
|
|
|
|
|
|
|
|
| 943 |
|
|
Interest and penalties accrued on deductions taken relating to uncertain tax positions (approximately $300, $300 and $100 reflected in income tax expense in the income statement in 2007, 2006 and 2005, respectively, with the balance shown in current income tax and other noncurrent liability accounts in the balance sheet) |
|
|
| 891 |
|
|
|
|
|
|
|
|
|
|
|
|
|
|
|
|
|
|
|
|
|
|
|
| 1,195 |
|
|
Related deferred income tax assets recognized on interest and penalties |
|
|
| (327 | ) |
|
|
|
|
|
|
|
|
|
|
|
|
|
|
|
|
|
|
|
|
|
|
| (436 | ) |
|
Interest and penalties accrued on uncertain tax positions net of related deferred income tax benefits, which would impact the effective tax rate if recognized |
|
|
| 564 |
|
|
|
|
|
|
|
|
|
|
|
|
|
|
|
|
|
|
|
|
|
|
|
| 759 |
|
|
Total net unrecognized tax benefits on uncertain tax positions reflected in the balance sheet, which would impact the effective tax rate if recognized |
|
| $ | 1,224 |
|
|
|
|
|
|
|
|
|
|
|
|
|
|
|
|
|
|
|
|
|
|
| $ | 1,702 |
|
|
We anticipate that by December 31, 2008, we will settle several disputed issues raised by the fourth quarterIRS during its examination of 2006, we reversed this valuation allowance and reduced our U.S. income tax provisionreturns for 2001-2003, the most significant of which regards the recognition of our captive insurance subsidiary as an insurance company for U.S. income tax purposes. It is reasonably possible that a settlement with the IRS for the disputed issues would cost us $1,400, which would be applied against the balance of unrecognized tax benefits and accrued interest and penalties.
Tredegar and its subsidiaries file income tax returns in U.S., state and foreign jurisdictions. Tredegar is no longer subject to U.S. federal income tax examinations by $577. Outside appraisal of the value of corporate assets, primarily real estate, performed in December 2006, indicates that realization of this deferred tax assets is more likely than not. We had currentauthorities for years before 2001. With few exceptions, Tredegar and non-currentits subsidiaries are no longer subject to state or non-U.S. income taxes recoverable of $10,975 and zero, respectively, at December 31, 2006, and $7,163 and $5,803, respectively, at December 31, 2005.
15 | LOSSES ASSOCIATED WITH PLANT SHUTDOWNS, ASSET IMPAIRMENTS AND RESTRUCTURINGS, UNUSUAL ITEMS, GAINS FROM SALE OF ASSETS AND OTHER ITEMS |
Losses associated with plant shutdowns, asset impairments and restructurings net of gains on sale of related assets,for continuing operations in 20062007 totaled $1,850$4,069 ($1,4412,781 after taxes) and include:
• | A fourth quarter charge of $1,200 ($780 after taxes), a third quarter charge of $1,220 ($793 after taxes) and a first quarter charge of $366 ($238 after taxes) related to the estimated loss on the sub-lease of a portion of the AFBS (formerly Therics) facility in Princeton, New Jersey; |
• | A fourth quarter charge of $256 ($256 after taxes) and a first quarter charge of $338 ($284 after taxes) for asset impairments in Film Products; |
• | A third quarter charge of $493 ($309 after taxes) and a second quarter charge of $99 ($62 after taxes) for severance and other employee-related costs in Aluminum Extrusions; |
• | A second quarter charge of $26 ($16 after taxes) and a first quarter charge of $29 ($17 after taxes) for costs related to the shutdown of the films manufacturing facility in LaGrange, Georgia; and |
• | A third quarter charge of $42 ($26 after taxes) related to expected future environmental costs at the aluminum extrusions facility in Newnan, Georgia (included in “Cost of goods sold” in the consolidated statements of income). |
Results in 2007 also include a fourth-quarter gain of $2,699 ($1,737 after taxes) on the sale of corporate real estate (proceeds of approximately $3,800) and a third-quarter loss from the write-down of Novalux of $2,095 ($1,341 after taxes). See Note 2 for more information on Novalux. The pretax amounts for both of these items are included in “Other income (expense), net” in the consolidated statements of income and separately shown in the segment operating profit table in Note 3. Income taxes in 2007 include the recognition of a valuation allowance against deferred tax assets of $1,066 in the third quarter for expected limitations on the utilization of assumed capital losses (see Note 14). | |
Losses associated with plant shutdowns, asset impairments and restructurings for continuing operations, net of gains on sale of related assets, in 2006 totaled $1,850 ($1,441 after taxes) and include: | |
• | A fourth quarter net gain of $14 ($8 after taxes), a third-quarter net gain of $1,022 ($615 after taxes), a second-quarter net gain of $822 ($494 after taxes) and a first-quarter pretax charge of $404 ($243 after taxes) associated with the shutdown of the films manufacturing facility in LaGrange, Georgia, including a pretax gain of $2,889 for related LIFO inventory liquidations (included in |
• | A third-quarter charge of $920 ($566 after taxes) related to expected future environmental costs at the aluminum extrusions facility in Newnan, Georgia (included in |
• | A fourth quarter charge of $143 ($93 after taxes) and a third quarter charge of $494 ($321 after taxes) related to the estimated loss on the |
• | Second-quarter charges of $459 ($289 after taxes) and first-quarter charges of $268 ($170 after taxes) for severance and other employee-related costs in connection with restructurings in Aluminum Extrusions ($514) and Film Products ($213); and |
• | First-quarter charges of $1,020 ($876 after taxes) for asset impairments relating to machinery & equipment in Film Products. |
In 2006, a pretax gain on the sale of public equity securities of $56 (proceeds also of $56) is included in “Other income (expense), net” in the consolidated statements of income and “Gain on the sale of corporate assets” in the segment operating profit table in Note 3. Income taxes in 2006 include a reversal of a valuation allowance of $577 for deferred tax assets associated with capital loss carry-forwards recorded with the write-down of the investment in Novalux (see Notes 2 and 14). | |
Losses associated with plant shutdowns, asset impairments and restructurings for continuing operations, net of gains on sale of related assets, in 2005 totaled $15,721 ($10,087 after taxes) and include: | |
• | A fourth-quarter charge of $269 ($174 after taxes) and a second-quarter charge of $10,049 ($6,532 after taxes) related to the sale or assignment of substantially all of the assets of AFBS, Inc. (formerly known as Therics, Inc. - see below for additional information regarding its restructuring in 2005), including asset impairment charges of $5,638, lease-related losses of $3,326 and severance (31 people) and other transaction-related costs of $1,354 (see below for additional information on the transaction); |
• | Fourth-quarter charges of $397 ($256 after taxes), third-quarter charges of |
• | A fourth-quarter charge of $2,101 ($1,263 after taxes) related to the shutdown of the films manufacturing facility in LaGrange, Georgia, including asset impairment charges of $1,615 and severance (15 people) and other costs of $486; |
• | A second-quarter charge of $27 ($16 after taxes) and a first-quarter gain of $1,618 ($973 after taxes) related to the shutdown of the films manufacturing facility in New Bern, North Carolina, including a $1,816 gain on the sale of the facility (included in |
• | A first-quarter charge of $1,019 ($653 after taxes) for process reengineering costs associated with the implementation of an information system in Film Products (included in |
• | Fourth-quarter charges of $118 ($72 after taxes), third-quarter charges of $595 ($359 after taxes), second-quarter charges of $250 ($150 after taxes) partially offset by a net first-quarter gain of $120 ($72 after taxes) related to severance and other employee-related accruals associated with the restructuring of the research and development operations in Film Products (of this amount, $1,366 in pretax charges for employee relocation and recruitment is included in SG&A expenses in the consolidated statements of income); |
• | A second-quarter gain of $653 ($392 after taxes) related to the shutdown of the films manufacturing facility in Carbondale, Pennsylvania, including a $630 gain on the sale of the facility (included in “Other income (expense), net” in the consolidated statements |
• | Fourth-quarter charges of $583 ($351 after taxes) for asset impairments in Film Products; |
• | A net fourth-quarter charge of $495 ($310 after taxes) in Aluminum Extrusions, including an asset impairment of $597, partially offset by the reversal to income of certain shutdown-related accruals of $102; |
• | Fourth-quarter charges of $31 ($19 after taxes), third-quarter charges of $117 ($70 after taxes), second-quarter charges of $105 ($63 after taxes) and first-quarter charges of $100 ($60 after taxes) for accelerated depreciation related to restructurings in Film Products; and |
• | A fourth-quarter charge of $182 ($119 after taxes) in Film Products related to the write-off of an investment. |
On June 30, 2005, substantially all of the assets of AFBS, Inc. (formerly known as Therics, Inc.), a wholly-owned subsidiary of Tredegar, were sold or assigned to a newly-created limited liability company, Therics, LLC, which is controlled and managed by an individual not affiliated with Tredegar. AFBS received a 17.5% equity interest in Therics, LLC, then valued at $170 and a 3.5% interest in Theken Spine, LLC, then valued at $800, along with potential future payments based on the sale of certain products by Therics, LLC. AFBS retained substantially all of its liabilities in the transaction, which included customary indemnification provisions for pre-transaction liabilities. Tredegar has no obligation or intent to fund any future losses that may occur at Therics, LLC or Theken Spine, LLC. The ownership interest in Therics, LLC is accounted for under the equity method of accounting with losses limited to its initial carrying value of $170. The ownership interest in Theken Spine, LLC is accounted for under the cost method, with an impairment loss recognized and a new cost basis established for any write-down to estimated fair value, if necessary. The payments due from Therics, LLC that are based on the sale of certain products are recognized as income when earned. AFBS had operating losses of $3,467 during the first six months of 2005 and $9,763 in 2004. Results of operations for AFBS since June 30, 2005 are immaterial.
See Note 2 for information regarding the write-down in 2005 of our investment in Novalux, Inc.
Gain on sale of corporate assets in 2005 includes a pretax gain of $61 related to the sale of corporate real estate. This gain is included in “Other income (expense), net” in the consolidated statements of income and separately shown in the operating profit by segment table in Note 3.
During the first quarter of 2005, we recognized a pretax gain for interest receivable on tax refund claims of $508 ($327 after taxes) (included in "Other income (expense), net" in the consolidated statements of income and "Corporate expenses, net" in the segment operating profit table in Note 3).
16 | CONTINGENCIES |
We are involved in various stages of investigation and remediation relating to environmental matters at certain
current and former plant locations. Where we have determined the nature and scope of any required environmental remediation activity, estimates of cleanup costs have been obtained and accrued. As we continue efforts to maintain compliance with applicable environmental laws and regulations, additional contingencies may be identified. If additional contingencies are identified, our practice is to determine the nature and scope of those contingencies, obtain and accrue estimates of the cost of remediation, and perform remediation. We do not believe that additional costs that could arise from those activities will have a material adverse effect on our financial position. However, those costs could have a material adverse effect on quarterly or annual operating results at that time.
We are involved in various other legal actions arising in the normal course of business. After taking into consideration legal counsels’ evaluation of these actions,information we deemed relevant, we believe that we have sufficiently accrued for probable losses and that the actions will not have a material adverse effect on our financial position. However, the resolution of the actions in a future period could have a material adverse effect on quarterly or annual operating results at that time.
From time to time, we enter into transactions with third parties in connection with the sale of assets or businesses in which we agree to indemnify the buyers or third parties involved in the sale for certain liabilities or risks related to the assets or business. Also, in the ordinary course of our business, we may enter into agreements with third parties for the sale of goods or services that may contain indemnification provisions. In the event that an indemnification claim is asserted, liability for indemnification would be subject to an assessment of the underlying facts and circumstances under the terms of the applicable agreement. Further, any indemnification payments may be limited or barred by a monetary cap, a time limitation, or a deductible or basket. For these reasons, we are unable to estimate the maximum potential amount of the potential future liability under the indemnity provisions of these agreements. We do, however, accrue for losses for any known contingent liability, including those that may arise from indemnification provisions, when future payment is probable. We disclose contingent liabilities if the probability of loss is reasonably possible and significant.
17 | DISCONTINUED OPERATIONS |
On March 7, 2003, Tredegar Investments, Inc. (“Tredegar Investments”) reached definitive agreementsFebruary 12, 2008, and pursuant to sell substantially allthe terms and conditions of its portfolioa purchase agreement dated January 6, 2008, we sold our aluminum extrusions business in Canada for an estimated purchase price of private equity partnership interestsapproximately $25,500 to GS Vintage Funds II, whichan affiliate of H.I.G. Capital. The final purchase price is subject to increase or decrease to the extent that actual working capital, cash and indebtedness (as defined) as of February 12, 2008 are investment partnerships managed by Goldman Sachs Asset Management’s Private Equity Group. Onabove or below the same date and in a separate transaction, Tredegar Investments also agreedestimated amounts used to sell to W Capital Partners, an independent private equity manager,determine the subsidiary funds that hold substantially all of Tredegar Investments’ direct venture capital investments.estimated purchase price.
The sale of these fund interests included the assumptionour aluminum extrusions business in Canada, which was suffering from operating losses driven by the buyer of Tredegar Investments’ obligations to make additional capital contributions to those funds in the future.
During September 2007, we recognized a charge of $27,550 ($22,744 after taxes) for impairment of property, plant and equipment (“PP&E”) related to the aluminum extrusions operations in Canada. The impairment of PP&E was due to deteriorating business conditions and financial results. The combination of lower volume and appreciation of the Canadian dollar, which impacted our costs, caused a shift from overall profitability in 2006 to losses in 2007. In addition, our projections of the future unlevered pretax cash flows for this business indicated that the carrying value of its net assets at September 30, 2007 of approximately $71,700 (tangible assets in excess of liabilities excluding deferred income taxes) before the impairment would not be recovered. As a result, in accordance with SFAS No. 144, Accounting for the Impairment or Disposal of Long-Lived Assets, we recognized the impairment charge to write down the individual components of long-lived assets (PP&E) to the lower of their carrying value or estimated fair value. Our estimates of real property values were based on a commonly used valuation methodology in real estate whereby projected net operating income for the property (projected earnings before interest, taxes, depreciation and amortization that could be earned from rent) is divided by a related risk-adjusted expected rate of return (referred to as the capitalization rate). The estimated fair value of machinery and equipment was based on our estimates of the proceeds that we would receive if they were sold. Our estimates of the value of real estate and machinery and equipment were based on Level 2 inputs as defined by SFAS No. 157, Fair Value Measurements.
During December 2007, we recognized an additional impairment charge of $4,143 ($4,143 after taxes) to write down the remaining carrying value of the aluminum extrusions operations in Canada to estimated fair value less cost to sell in accordance with SFAS No. 144. In addition, in December 2007 we recognized income tax benefits of $11,428 relating to a worthless stock deduction for the business that will be recognized in Tredegar’s 2008 consolidated income tax return (included in discontinued operations in the consolidated statement of income in 2007 but reflected as a deferred income tax asset for continuing operations in our consolidated balance sheet at December 31, 2007). This tax benefit is expected to be realized by a reduction of Tredegar’s quarterly estimated income tax payments by the end of the third quarter of 2008.
Goodwill for the Aluminum Extrusions reporting unit of $6,459 has been allocated to the discontinued aluminum extrusions operations in Canada using the estimated fair value of the business sold (the after-tax cash flows.flow expected from disposal of approximately $30,000 when it was classified as held for sale at the end of December 2007), and the estimated fair value of the aluminum extrusions business in the U.S. retained. The fair value of the aluminum extrusions business in the U.S. was estimated at approximately $145,000 using comparable enterprise value-to-EBITDA multiples as of December 31, 2007.
The statements of income for 2007, 2006 and 2005 and balance sheets as of December 31, 2007 and 2006 for the aluminum extrusions business in Canada are shown below:
Aluminum Extrusions Business in Canada |
Statements of Income |
|
|
|
|
|
|
|
|
|
|
|
|
|
| 2007 |
| 2006 |
| 2005 |
|
| |||
Revenues and other items: |
|
|
|
|
|
|
|
|
|
|
|
Sales |
| $ | 157,691 |
| $ | 178,965 |
| $ | 148,505 |
|
|
Other income (expense), net |
|
| — |
|
| — |
|
| 1,667 |
|
|
|
|
| 157,691 |
|
| 178,965 |
|
| 150,172 |
|
|
Costs and expenses: |
|
|
|
|
|
|
|
|
|
|
|
Cost of goods sold |
|
| 156,700 |
|
| 165,465 |
|
| 138,156 |
|
|
Freight |
|
| 4,969 |
|
| 5,494 |
|
| 4,415 |
|
|
Selling, general and administrative |
|
| 2,389 |
|
| 4,277 |
|
| 3,716 |
|
|
Asset impairments and costs associated with exit and disposal activities |
|
| 31,754 |
|
| — |
|
| 552 |
|
|
Total |
|
| 195,812 |
|
| 175,236 |
|
| 146,839 |
|
|
Income (loss) before income taxes |
|
| (38,121 | ) |
| 3,729 |
|
| 3,333 |
|
|
Income taxes |
|
| (18,440 | ) |
| 845 |
|
| 476 |
|
|
Net income (loss) |
| $ | (19,681 | ) | $ | 2,884 |
| $ | 2,857 |
|
|
Aluminum Extrusions Business in Canada
Balance Sheets
|
|
|
|
|
|
|
|
December 31 |
| 2007 |
| 2006 |
| ||
| |||||||
Assets |
|
|
|
|
|
|
|
Current assets: |
|
|
|
|
|
|
|
Accounts and notes receivable, net |
| $ | 15,470 |
| $ | 14,879 |
|
Inventories |
|
| 22,089 |
|
| 20,266 |
|
Prepaid expenses and other |
|
| 191 |
|
| 130 |
|
Total current assets |
|
| 37,750 |
|
| 35,275 |
|
Noncurrent assets: |
|
|
|
|
|
|
|
Net property, plant and equipment |
|
| 11,001 |
|
| 38,328 |
|
Other assets and deferred charges |
|
| — |
|
| 366 |
|
Goodwill and other intangibles |
|
| 6,459 |
|
| 6,459 |
|
Total noncurrent assets |
|
| 17,460 |
|
| 45,153 |
|
|
|
|
|
|
|
|
|
| |||||||
Total assets |
| $ | 55,210 |
| $ | 80,428 |
|
|
|
|
|
|
|
|
|
December 31 |
| 2007 |
| 2006 |
| ||
Liabilities and Carrying Value of |
|
|
|
|
|
|
|
Tredegar’s Net Advances & Investment |
|
|
|
|
|
|
|
Current liabilities: |
|
|
|
|
|
|
|
Accounts payable |
| $ | 13,528 |
| $ | 15,406 |
|
Accrued expenses |
|
| 3,624 |
|
| 3,116 |
|
Total current liabilities |
|
| 17,152 |
|
| 18,522 |
|
Noncurrent liabilities: |
|
|
|
|
|
|
|
Deferred income taxes |
|
| 6,048 |
|
| 10,040 |
|
Other noncurrent liabilities |
|
| 2,770 |
|
| 1,269 |
|
Total noncurrent liabilities |
|
| 8,818 |
|
| 11,309 |
|
Accumul. other comprehensive income (loss): |
|
|
|
|
|
|
|
Foreign currency translation adjust. |
|
| 15,700 |
|
| 7,821 |
|
Gain (loss) on derivatives |
|
| (465 | ) |
| 47 |
|
Pension and other postret. benefit adjust. |
|
| (4,871 | ) |
| (2,877 | ) |
Carrying value of Tredegar’s net advances & investment |
|
| 18,876 |
|
| 45,606 |
|
Liabilities and carrying value of Tredegar’s net advances & investment |
| $ | 55,210 |
| $ | 80,428 |
|
Tredegar Corporation and Subsidiaries | |
(In thousands, except per-share amounts) | |
(Unaudited) | |
|
|
|
|
|
|
|
|
|
|
|
|
|
|
|
|
|
|
|
|
|
|
|
|
|
|
|
|
|
|
|
|
|
|
|
| First |
| Second |
| Third |
| Fourth |
| Year |
| |||||
2007 |
|
|
|
|
|
|
|
|
|
|
|
|
|
|
|
|
Sales |
| $ | 244,887 |
| $ | 234,882 |
| $ | 234,352 |
| $ | 208,462 |
| $ | 922,583 |
|
Gross profit |
|
| 37,180 |
|
| 35,075 |
|
| 36,297 |
|
| 32,714 |
|
| 141,266 |
|
Income from continuing operations |
|
| 11,135 |
|
| 10,564 |
|
| 6,195 |
|
| 7,036 |
|
| 34,930 |
|
Income (loss) from discontinued operations |
|
| (802 | ) |
| (629 | ) |
| (24,571 | ) |
| 6,321 |
|
| (19,681 | ) |
Net income (loss) |
|
| 10,333 |
|
| 9,935 |
|
| (18,376 | ) |
| 13,357 |
|
| 15,249 |
|
Earnings (loss) per share: |
|
|
|
|
|
|
|
|
|
|
|
|
|
|
|
|
Basic |
|
|
|
|
|
|
|
|
|
|
|
|
|
|
|
|
Continuing operations |
|
| .28 |
|
| .27 |
|
| .16 |
|
| .19 |
|
| .91 |
|
Discontinued operations |
|
| (.02 | ) |
| (.02 | ) |
| (.63 | ) |
| .17 |
|
| (.51 | ) |
Net income (loss) |
|
| .26 |
|
| .25 |
|
| (.47 | ) |
| .36 |
|
| .40 |
|
Diluted |
|
|
|
|
|
|
|
|
|
|
|
|
|
|
|
|
Continuing operations |
|
| .28 |
|
| .27 |
|
| .16 |
|
| .19 |
|
| .90 |
|
Discontinued operations |
|
| (.02 | ) |
| (.02 | ) |
| (.63 | ) |
| .17 |
|
| (.51 | ) |
Net income (loss) |
|
| .26 |
|
| .25 |
|
| (.47 | ) |
| .36 |
|
| .39 |
|
Shares used to compute earnings per share: |
|
|
|
|
|
|
|
|
|
|
|
|
|
|
|
|
Basic |
|
| 39,272 |
|
| 39,402 |
|
| 38,985 |
|
| 36,494 |
|
| 38,532 |
|
Diluted |
|
| 39,487 |
|
| 39,584 |
|
| 39,119 |
|
| 36,587 |
|
| 38,688 |
|
2006 |
|
|
|
|
|
|
|
|
|
|
|
|
|
|
|
|
Sales |
| $ | 228,518 |
| $ | 234,491 |
| $ | 247,557 |
| $ | 226,995 |
| $ | 937,561 |
|
Gross profit |
|
| 32,404 |
|
| 33,303 |
|
| 35,800 |
|
| 34,076 |
|
| 135,583 |
|
Income from continuing operations |
|
| 7,104 |
|
| 8,494 |
|
| 9,883 |
|
| 9,836 |
|
| 35,317 |
|
Income (loss) from discontinued operations |
|
| 1,111 |
|
| 756 |
|
| (193 | ) |
| 1,210 |
|
| 2,884 |
|
Net income (loss) |
|
| 8,215 |
|
| 9,250 |
|
| 9,690 |
|
| 11,046 |
|
| 38,201 |
|
Earnings (loss) per share: |
|
|
|
|
|
|
|
|
|
|
|
|
|
|
|
|
Basic |
|
|
|
|
|
|
|
|
|
|
|
|
|
|
|
|
Continuing operations |
|
| .18 |
|
| .22 |
|
| .25 |
|
| .25 |
|
| .92 |
|
Discontinued operations |
|
| .03 |
|
| .02 |
|
| — |
|
| .03 |
|
| .07 |
|
Net income (loss) |
|
| .21 |
|
| .24 |
|
| .25 |
|
| .28 |
|
| .99 |
|
Diluted |
|
|
|
|
|
|
|
|
|
|
|
|
|
|
|
|
Continuing operations |
|
| .18 |
|
| .22 |
|
| .25 |
|
| .25 |
|
| .91 |
|
Discontinued operations |
|
| .03 |
|
| .02 |
|
| — |
|
| .03 |
|
| .07 |
|
Net income (loss) |
|
| .21 |
|
| .24 |
|
| .25 |
|
| .28 |
|
| .98 |
|
Shares used to compute earnings per share: |
|
|
|
|
|
|
|
|
|
|
|
|
|
|
|
|
Basic |
|
| 38,602 |
|
| 38,632 |
|
| 38,654 |
|
| 38,793 |
|
| 38,671 |
|
Diluted |
|
| 38,664 |
|
| 38,837 |
|
| 39,123 |
|
| 39,092 |
|
| 38,931 |
|
SELECTED QUARTERLY FINANCIAL DATASIGNATURES
First Quarter | Second Quarter | Third Quarter | Fourth Quarter | Year | ||||||||||||
| 2006 | ||||||||||||||||
| Sales | $ | 267,964 | $ | 282,491 | $ | 296,256 | $ | 269,814 | $ | 1,116,525 | ||||||
| Gross profit | 34,852 | 35,550 | 36,143 | 37,045 | 143,590 | |||||||||||
| Net income | 8,215 | 9,250 | 9,690 | 11,046 | 38,201 | |||||||||||
| Earnings per share: | ||||||||||||||||
| Basic | .21 | .24 | .25 | .28 | .99 | |||||||||||
| Diluted | .21 | .24 | .25 | .28 | .98 | |||||||||||
| Shares used to compute earnings per share: | ||||||||||||||||
| Basic | 38,602 | 38,632 | 38,654 | 38,793 | 38,671 | |||||||||||
| Diluted | 38,664 | 38,837 | 39,123 | 39,092 | 38,931 | |||||||||||
| 2005 | ||||||||||||||||
| Sales | $ | 232,757 | $ | 243,724 | $ | 240,716 | $ | 239,772 | $ | 956,969 | ||||||
| Gross profit | 28,462 | 33,245 | 32,518 | 27,432 | 121,657 | |||||||||||
| Net income | 5,550 | 2,132 | 7,657 | 890 | 16,229 | |||||||||||
| Earnings per share: | ||||||||||||||||
| Basic | .14 | .05 | .20 | .02 | .42 | |||||||||||
| Diluted | .14 | .05 | .20 | .02 | .42 | |||||||||||
| Shares used to compute earnings per share: | ||||||||||||||||
| Basic | 38,440 | 38,453 | 38,465 | 38,527 | 38,471 | |||||||||||
| Diluted | 38,636 | 38,592 | 38,565 | 38,594 | 38,597 | |||||||||||
Pursuant to the requirements of Section 13 or 15(d) of the Securities Exchange Act of 1934, the registrant has duly caused this report to be signed on its behalf by the undersigned, thereunto duly authorized.
TREDEGAR CORPORATION | |||
Dated: March | By | /s/ John D. Gottwald | |
John D. Gottwald | |||
President and Chief Executive | |||
Officer | |||
Pursuant to the requirements of the Securities Exchange Act of 1934, this report has been signed below by the following persons on behalf of the registrant and in the capacities indicated on March 2, 2007.
Signature | Title | ||
/s/ | John D. Gottwald | President, Chief Executive Officer and Director | |
(Principal Executive Officer) | |||
(John D. Gottwald) | |||
/s/ | D. Andrew Edwards | Vice President, Chief Financial Officer and Treasurer | |
(Principal Financial and Accounting Officer) | |||
(D. Andrew Edwards) | |||
/s/ | Richard L. Morrill | Chairman of the Board of Directors | |
(Richard L. Morrill) | |||
/s/ | William M. Gottwald | Vice Chairman of the Board of Directors | |
(William M. Gottwald) | |||
/s/ | N. A. Scher | Vice Chairman of the Board of Directors | |
(Norman A. Scher) | |||
/s/ | Horst R. Adam | Director | |
(Horst R. Adam) | |||
/s/ | Austin Brockenbrough, III | Director | |
(Austin Brockenbrough, III) | |||
/s/ | Donald T. Cowles | Director | |
(Donald T. Cowles) |
/s/ | Thomas G. Slater, Jr. | Director | |
(Thomas G. Slater, Jr.) | |||
/s/ | R. Gregory Williams | Director | |
(R. Gregory Williams) | |||
3.1 | Amended and Restated Articles of Incorporation of Tredegar (filed as Exhibit 3.1 to |
3.2 | Amended and Restated By-laws of Tredegar (filed as Exhibit |
3.3 | Articles of Amendment (filed as Exhibit 3.3 to |
4.1 | Form of Common Stock Certificate (filed as Exhibit 4.1 to |
4.2 | Rights Agreement, dated as of June 30, 1999, by and between Tredegar and American Stock Transfer & Trust Company, as Rights Agent (filed as Exhibit 4.2 to |
4.2.1 | Amendment and Substitution Agreement (Rights Agreement) dated as of December 11, 2002, by and among Tredegar, American Stock Transfer and Trust Company and National City Bank (filed as Exhibit 4.2.1 to Tredegar’s Annual Report on Form 10-K (File No. 1-10258) for the year ended December 31, 2002, and incorporated herein by reference) |
4.3 | Credit Agreement among Tredegar Corporation, as borrower, the domestic subsidiaries of Tredegar that from time to time become parties thereto, as guarantors, the several banks and other financial institutions as may from time to time become parties thereto, Wachovia Bank, National Association, as administrative agent, SunTrust Bank, as syndication agent, and Bank of America, N.A., KeyBank National Association, and JPMorgan Chase Bank, N.A., as documentation agents, dated as of December 15, 2005 (filed as Exhibit 10.16 to |
10.1 | Reorganization and Distribution Agreement dated as of June 1, 1989, between Tredegar and Ethyl (filed as Exhibit 10.1 to |
*10.2 | Employee Benefits Agreement dated as of June 1, 1989, between Tredegar and Ethyl (filed as Exhibit 10.2 to |
10.3 | Tax Sharing Agreement dated as of June 1, 1989, between Tredegar and Ethyl (filed as Exhibit 10.3 to |
10.4 | Indemnification Agreement dated as of June 1, 1989, between Tredegar and Ethyl (filed as Exhibit 10.4 to |
*10.5 | Tredegar |
*10.5.1 |
Amendment to the Tredegar Retirement Benefit Restoration Plan (filed as Exhibit 10.7.1 to |
*10.6 | Tredegar Industries, Inc. Savings Plan Benefit Restoration Plan (filed as Exhibit 10.8 to |
*10.6.1 | Resolutions of the Executive Committee of the Board of Directors of Tredegar Corporation adopted on December 28, 2004 (effective as of December 31, 2004) amending the Tredegar Corporation Retirement Savings Plan Benefit Restoration Plan (filed as Exhibit 10.9.1 to Tredegar’s Current Report on Form 8-K (File No. 1-10258), filed on December 30, 2004, and incorporated herein by reference) |
*10.7 | Tredegar Industries, Inc. Amended and Restated Incentive Plan (filed as Exhibit 10.9 to Tredegar’s Annual Report on Form 10-K (File No. 1-10258) for the year ended December 31, 2005, and incorporated herein by reference) |
*10.8 | Tredegar Industries, Inc. Directors’ Stock Plan (filed as Exhibit 10.11 to |
*10.9 | Tredegar Corporation’s 2004 Equity Incentive Plan (filed as Exhibit 10.13 to the Form S-8 Registration Statement No. 333-115423, filed on May 12, 2004 (incorporating from the Annex to Tredegar Corporation’s Definitive Proxy Statement on Schedule 14A filed on March 4, 2004 |
*10.10 | Transfer Agreement, by and between Old Therics and New Therics, dated as of June 30, 2005 (filed as Exhibit 10.17 to |
10.11 | Intellectual Property Transfer Agreement, by and between Old Therics and New Therics, dated as of June 30, 2005 (filed as Exhibit 10.18 to |
10.12 | Unit Purchase Agreement, by and between Old Therics, New Therics and Randall R. Theken, dated as of June 30, 2005 (filed as Exhibit 10.19 to |
10.13 | Payment Agreement, by and between Old Therics and New Therics, dated as of June 30, 2005 (filed as Exhibit 10.20 to |
* |
Form of Notice of Nonstatutory Stock Option Grant and Nonstatutory Stock Option Terms and Conditions (filed as Item 1.01 to Tredegar’s Current Report on Form 8-K (File No. 1-10258), filed on March 10, 2006, and incorporated herein by reference) |
*10.15 | Form of Notice of Stock Unit Award and Stock Unit Award Terms and Conditions (filed as Exhibit |
*10.16 | Form of Notice of Stock Unit Award and Stock Unit Award Terms and Conditions (2007 EPA) (filed as |
*10.17 | Form of Notice of Stock Unit Award and Stock Unit Award Terms and Conditions (2008 EPA) (filed as Exhibit 10.23 to Tredegar’s Current Report on Form 8-K (File No. 1-10258), filed on June 26, 2007, and incorporated herein by reference) |
* Denotes compensatory plans or arrangements or management contracts.
+ Filed herewith
77