UNITED STATES
SECURITIES AND EXCHANGE COMMISSION
Washington D.C. 20549, D.C.20549
FORM 10-K
x ANNUAL REPORT PURSUANT TO SECTION 13 or 15(d)
OF THE SECURITIES EXCHANGE ACT OF 1934
For the fiscal year ended December 31, 20112012
OR o TRANSITION REPORT PURSUANT TO SECTION 13 OR 15(d)
OF THE SECURITIES EXCHANGE ACT OF 1934
For the transition period from __________ to __________
Commission File Number 0-53965
GRAHAM ALTERNATIVE INVESTMENT
FUND I LLC
(Exact name of registrant as specified in its charter)
| DELAWARE | | 20-4897069 |
| (State or other jurisdiction of incorporation or organization) | | (I.R.S. Employer Identification No.) |
c/o GRAHAM CAPITAL MANAGEMENT, L.P.
40 Highland Avenue
Rowayton, CT 06853
(Address of principal executive offices) (zip code)
Paul Sedlack
Graham Capital Management, L.P.
40 Highland Avenue
Rowayton, CT 06853
(203) 899-3400
(Name, address, including zip code, and telephone number, including area code,
of agent for service)
__________________________
Copies to:
Christopher Wells
Proskauer Rose LLP
11 Times Square
New York, NY 10036NY10036
Securities to be registered pursuant to Section 12(b) of the Act: | | None |
| | | |
Securities to be registered pursuant to Section 12(g) of the Act: | | Blended Strategies Portfolio: Units of Interests |
| | | Systematic Strategies Portfolio: Units of Interests |
| | | (Title of Class) |
Indicate by check mark if the registrant is a well-known seasoned issuer, as defined in Rule 405 of the Securities Act.
Yes o No þ
Indicate by check mark if the registrant is not required to file reports pursuant to section 13 or section 15(d) of the Act.
Yes o No þ
Indicate by check mark whether the registrant (1) has filed all reports required to be filed by Section 13 or 15(d) of the Securities Exchange Act of 1934 during the preceding 12 months (or for such shorter period that the registrant was required to file such reports), and (2) has been subject to such filing requirements for the past 90 days.
Yes þ No o
Indicate by check mark whether the registrant has submitted electronically and posted on its corporate Web site, if any, every Interactive Data File required to be submitted and posted pursuant to Rule 405 of Regulation S-T during the preceding 12 months (or for such shorter period that the registrant was required to submit and post such files).
Yes o No o
Indicate by check mark if disclosure of delinquent filers pursuant to Item 405 of Regulation S-K is not contained herein, and will not be contained, to the best of registrant’s knowledge, in definitive proxy or information statements incorporated by reference in Part III of this Form 10-K or any amendment to this form 10-K þ.
Indicate by check mark whether the registrant is a large accelerated filer, an accelerated filer, a non-accelerated file or a smaller reporting company. See the definitions of “large accelerated filer,” “accelerated filer” and “smaller reporting company” in Rule 12b-2 of the Exchange Act. (Check one):
Large accelerated filer o | | Accelerated filer o | | Non-accelerated filer o (Do (Do not check if a smaller
reporting company) | | Smaller reporting company þ |
Indicate by check mark whether the registrant is a shell company (as defined in Rule 12b-2 of the Exchange Act)
Yes o No þ
Units of the Systematic Strategies Portfolio and the Blended Strategies Portfolio with an aggregate value of $58,563,212$39,052,950 and $327,226,545,$225,385,271, respectively, were outstanding and held by non-affiliates as of June 30, 2011.2012.
As of February 29, 2012, 555,475.99728, 2013, 236,498.777 Units of the Systematic Strategies Portfolio were outstanding.
As of February 29, 2012, 2,148,119.94528, 2013, 1,356,308.504 Units of the Blended Strategies Portfolio were outstanding.
DOCUMENTS INCORPORATED BY REFERENCE
None
GRAHAM ALTERNATIVE INVESTMENT FUND I LLC
General Development of Business
Graham Alternative Investment Fund I LLC (“GAIF I”), a Delaware limited liability company, was formed on May 16, 2006. GAIF I was formed to enable U.S. taxable investors to achieve long-term capital appreciation through professionally managed trading in both U.S. and foreign markets, primarily in futures contracts, forward currency and metals contracts, spot currency contracts and associated derivative instruments such as options and swaps. GAIF I commenced operations on August 1, 2006.
Investors in GAIF I may invest in either or both of two different portfolios, the Blended Strategies Portfolio or the Systematic Strategies Portfolio. The Blended Strategies Portfolio uses a systematic trading program and a discretionary trading program. The Systematic Strategies Portfolio uses solely a systematic program.
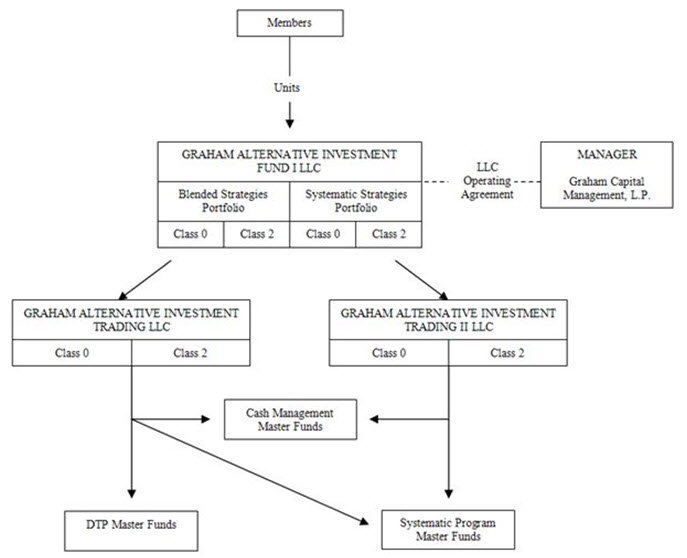
GAIF I invests substantially all of its assets into two feeder funds each of which in turn invests substantially all of its assets in one or more master funds. Assets invested in the Blended Strategies Portfolio will be invested by GAIF I in Graham Alternative Investment Trading LLC (“GAIT”) and assets invested in the Systematic Strategies Portfolio will be invested by GAIF I in Graham Alternative Investment Trading II LLC (“GAIT II”), each of which is a Delaware limited liability company (the “Feeder Funds”). For the purposes of this registration statement,report, the term “Fund” shall include each of GAIF I, the Feeder Funds and the master funds in which they invest, unless the context implies otherwise. Graham Capital Management, L.P. (the “Manager”) is the Fund’s manager and the investment advisor to the Fund.
The investment objective of each portfolio of the Fund is to achieve long-term capital appreciation through professionally managed trading in both U.S. and foreign markets, primarily in futures contracts, forwards contracts, spot currency contracts and associated derivative instruments such as options and swaps. The Fund seeks profit opportunities in the global financial markets, including interest rates, foreign exchange, global stock indices and energy, metals and agricultural futures, as a professionally managed multi-strategy investment vehicle.
Each portfolio of the Fund consists of multiple trading strategies of the Manager, which the Manager has combined in an effort to diversify the investment exposure of each portfolio and to make the performance returns of each portfolio less volatile and more consistently profitable. The Manager seeks to combine in each portfolio investment strategies that trade in different markets and display relatively low correlation to each other. Through such composition, the Manager aims to provide each portfolio with the potential to make profits and have strong risk-adjusted returns in both rising and falling markets and during both expanding and recessionary economic cycles. In discretionary programs, a trader determines trades subjectively based on personal assessment of trading data and trading experience, while in systematic programs, trades are based almost entirely on computerized mathematical models. The Fund, at all times, will look primarily to commodity interests as its principal intended source of gains and anticipates that at all times commodity interests will present the Fund’s primary risk of loss, and the Fund will not acquire any financial instrument or enter into any financial transaction if to do so would cause the Fund to look to securities as its principal intended source of gains or anticipate that securities will present the Fund’s primary risk of loss. Examples of the types of instruments that the Fund may trade by market include, but are not limited to:
Global fixed income: U.S. Treasury futures, Eurodollar futures and Japanese government bond futures
Global stock indices: futures contracts on the Russell 2000, S&P 500 and TOPIX
Foreign exchange: forward contracts on the British pound, euro,Euro, Japanese yen and Swiss franc
Energy: futures contracts on heating oil, natural gas and crude oil
Agriculture and Softs: futures contracts on cotton, feeder cattle, lean hogs and soybeans
Metals: futures or forward contracts on aluminum, copper and gold
The Manager believes strongly in the importance of its ongoing research activities, particularly in the development of new trading programs, and expects to develop additional trading systems for the Fund and to modify the systems currently in use for the Fund over time. The Manager also seeks to add new trading strategies to its discretionary programs and to modify such strategies over time. There is no maximum number of trading programs that the Manager may see fit to include in either the Blended Strategies Portfolio or the Systematic Strategies Portfolio, and the Manager may increase or decrease the number of programs included in each portfolio over time. The Manager continually updates and modifies its trading programs, and may make such additions or deletions of trading programs to either the Blended Strategies Portfolio or the Systematic Strategies Portfolio at any time– such as changes in the leverage of, or in the asset allocations to, any of the Fund’s trading programs – in its sole discretion. The Fund is not required to provide prior, or any, notice of any such changes to investors.
Under the Limited Liability Company Agreement of GAIF I (the “Company Agreement”), the Manager has complete and exclusive responsibility for management and administration of the affairs of GAIF I. The Manager is currently registered as a commodity pool operator (“CPO”) and commodity trading advisor (“CTA”) with the Commodity Futures Trading Commission (“CFTC”) and is a member of the National Futures Association (“NFA”). The Manager is also registered as a Registered Investment Advisor with the Securities and Exchange Commission (the “SEC”). GAIF I is not required to be, and is not, registered under the Investment Company Act of 1940, as amended. Investors purchasing units of interests (the “Units”) in GAIF I have no rights to participate in the management of the Fund. Units are sold through dealers that are not affiliated with the Fund or the Manager.
Pursuant to the Company Agreement, GAIF I’s term will end upon the first to occur of the following:
| | ·●
| the withdrawal (voluntary or involuntary), bankruptcy or an assignment for the benefit of creditors or dissolution of the Manager; or |
| | ·●
| any date prior to December 31, 2050 on which the Manager elects to dissolve GAIF I. |
GAIF I’s business constitutes only one segment for financial reporting purposes (i.e., a speculative commodity pool). GAIF I does not engage in sales of goods or services.
As of February 29, 2012,28, 2013, the aggregate Net Asset Value (as defined below under “Allocation of Profit and Loss”) of the Units in GAIF I was $307,902,747.$174,646,449. GAIF I operates on a calendar fiscal year.
Narrative Description of Business
GAIF I offers four classes (each a “Class”) of Units, being Class 0 Units and Class 2 Units of the Blended Strategies Portfolio and Class 0 Units and Class 2 Units of the Systematic Strategies Portfolio. As further described below under “Fees,” Class 0 and Class 2 Units of each portfolio differ only as to their applicable fees. Subscriptions for Units of any Class may be accepted by GAIF I as of the first business day of each month upon written notice of at least three business days prior to the last business day of the preceding month, and on such other notice and dates as the Manager may permit in its sole and absolute discretion.
Units of each Class of each portfolio are offered at their Net Asset Value per Unit as of the end of each month. The minimum initial investment for Class 0 Units is $50,000 (this Class is primarily for “wrap fee programs”) and the minimum additional investment is $5,000. Wrap fee programs bundle the various services provided to a client by a broker or financial advisor in a single fee arrangement rather than charging the client fees for specific transactions. The minimum initial investment for Class 2 Units is $50,000 and the minimum additional investment is $5,000. GAIF I will be continuously offered and has no limit on the maximum aggregate amount of subscriptions that may be contributed to it.
Capital contributions by a single subscriber for any Class of Units, upon acceptance of the subscriber as a member, represent a single interest in GAIF I for that subscriber’s respective Class of Units. A Unit of each Class reflects a member’s interest in GAIF I’s net assets with respect to the Class of Units owned by the member. Although separate Classes of Units in a portfolio are offered, all capital contributions to a particular portfolio are pooled by GAIF I and invested in GAIT or GAIT II, as applicable. Units may be purchased only by investors who qualify as accredited investors under Regulation D of the Securities Act of 1933, (“Securitiesas amended (the “Securities Act”). The principal differences among the separate Classes of Units within the same portfolio are their fees. Holders of Units, regardless of which Class of a portfolio they hold, participate pro rata in the profits and losses of that portfolio in proportion to the Net Asset Value of the Class and have identical rights, as members, under the Company Agreement.

The Manager was organized in May 1994 as a Delaware limited partnership. The general partner of the Manager is KGT, Inc., a Delaware corporation of which Kenneth G. Tropin is the sole director and sole shareholder. KGT, Inc. became a listed Principal of the Manager effective July 27, 1994. The Manager has been registered as a CPO and CTA under the Commodity Exchange Act (“CEA”) and has been a member of the NFA since July 27, 1994. As of March 1, 2012,2013, the Manager has approximately 226233 employees and manages assets of over $8 billion. The Manager’s principal office is located at 40 Highland Avenue, Rowayton, Connecticut 06853 and its telephone number is (203) 899-3400. An affiliate of the Manager, Graham Capital LLP, has an office in London, England.Englandlocated at 55 Baker Street, London W1U 8EW.
The Fund offers two separate portfolios, each representing a different investment program: the Blended Strategies Portfolio and the Systematic Strategies Portfolio. The Manager strives to combine various trading strategies within each portfolio in order to diversify the investment exposure of each portfolio and reduce its dependence on any single trading strategy. The Manager also seeks trading strategies that have low correlation to each other in an effort to make the performance returns of each portfolio, so far as is practicable, less volatile and more consistently profitable. The Manager’s Investment Committee, which is comprised of Kenneth G. Tropin, Pablo Calderini, Paul Sedlack, Robert E. Murray, Pablo Calderini, William Pertusi, Barry S. Fox, Jeff Baisley and Thomas P. Schneider, makes decisions with respect to the selection of strategies traded on behalf of the Fund.
Biographical information regarding the members of the Investment Committee is set forth below.
Kenneth G. Tropin, 5859, is the Chairman and the founder of the Manager. In May 1994, he founded the Manager and became an Associated Person and Principal effective July 27, 1994. Mr. Tropin is responsible for the overall management of the organization, including the investment of its proprietary trading capital.
Paul Sedlack, 51Pablo Calderini, 48, , is the Chief Executive OfficerPresident and the General Counsel of the Manager. He joined the Manager in June 1998 and became an Associated Person of the Manager effective November 20, 1998 and a Principal on August 21, 1998. He oversees the operation of the finance and administration departments and is also responsible for all legal and compliance matters. Mr. Sedlack received a J.D. from Cornell Law School in 1986 and an M.B.A. in Finance in 1983 and B.S. in Engineering in 1982 from State University of New York at Buffalo.
Robert E. Murray, 51, is the Chief Operating Officer of the Manager and is responsible for the management and oversight of client services, quantitative trading, and technology and risk management at the Manager. He joined the Manager in June 2003 and became an Associated Person and Principal of the Manager effective June 27, 2003. Mr. Murray received a Bachelor’s Degree in Finance from Geneseo State University in 1983.
Pablo Calderini, 47, is the Chief Investment Officer of the Manager and, among other things, is responsible for the management and oversight of the discretionary trading business and portfolio managers at the Manager. He joined the Manager in August 2010 and became an Associated Person and Principal of the Manager effective August 13, 2010. Prior to joining the Manager, Mr. Calderini worked at Deutsche Bank from June 1997 to July 2010 where he held positions of increasing responsibility, most recently the Global Head of Equity Proprietary Trading. Mr. Calderini commenced his career at Deutsche Bank as Global Head of Emerging Markets. During his tenure at Deutsche Bank, Mr. Calderini also helped manage several groups across the fixed income and equity platforms, including the Global Credit Derivatives Team. Mr. Calderini received a B.A. in Economics from Universidad Nacional de Rosario in 1987 and a Masters in Economics from Universidad del CemadelCema in 1988, each in Argentina.
Paul Sedlack, 52, is the Chief Executive Officer and the General Counsel of the Manager. He joined the Manager in June 1998 and became an Associated Person of the Manager effective November 20, 1998 and a Principal on August 21, 1998. He oversees the operation of the finance and administration departments and is also responsible for all legal and compliance matters. Mr. Sedlack received a J.D. from CornellLawSchool in 1986 and an M.B.A. in Finance in 1983 and B.S. in Engineering in 1982 from State University of New York at Buffalo.
Robert E. Murray, 52, is the Chief Operating Officer of the Manager and is responsible for the management and oversight of client services, quantitative trading, technology, and risk management at the Manager. He joined the Manager in June 2003 and became an Associated Person and Principal of the Manager effective June 27, 2003. Mr. Murray received a Bachelor’s Degree in Finance from GeneseoStateUniversity in 1983.
William Pertusi, 5152, is the Chief Risk Officer of the Manager, responsible for identifying, monitoring and acting upon financial risks relative to financial returns in the Manager’s diverse trading strategies. He became an Associated Person of the Manager effective July 24, 2006 and a Principal on November 28, 2006. Prior to joining the Manager in April 2006, Mr. Pertusi held the positions of Director and Risk Manager at SAC Capital Advisors LLC, an investment management firm, from July 2004 to April 2006. From July 2002 to July 2004, he was employed as a Portfolio Manager at SAC specializing in Mortgage Backed Securities. Mr. Pertusi was an associated person of SAC from June 2003 to June 2006 and a principal from June 2003 to May 2005. Mr. Pertusi received a B.S. in Electrical Engineering from Lehigh UniversityLehighUniversity in 1983, an M.B.A. from Harvard in 1987, and an M.S. in Mathematics from Fairfield UniversityFairfieldUniversity in 2006.
Barry S. Fox, 4849, is Director of Research of the Manager. He became an Associated Person of the Manager effective November 10, 2000 and a Principal on November 15, 2007. Mr. Fox joined the Manager in August 2000 as a portfolio manager and developed several quantitative trading programs. In May 2005, he joined the Manager’s Research Department, and in October 2005 was appointed Co-Associate Director of Research. Mr. Fox was appointed Director of Research in April 2007.2000. Mr. Fox received a B.S. in Business Administration from State University of New York at Buffalo in 1986.
Jeff Baisley, 4243, C.P.A., is the Chief Financial Officer of the Manager. In March 2004 he joined the Manager as Manager of Financial Reporting and became an Associated Person effective March 17, 2008 and a Principal on April 8, 2008. He received his B.S. in accounting from Fordham UniversityFordhamUniversity in 1991.
Thomas P. Schneider, 4950, is an Executive Vice President and the Chief Trader of the Manager. He joined the Manager in June 1994 and became an Associated Person of the Manager effective September 12, 1994 and a Principal on November 30, 1995. He is responsible for managing the Manager’s quantitative futures and foreign exchange trade execution, including all of its core and short term quantitative trading strategies, and developing and maintaining relationships with independent executing brokers and futures commission merchants (“FCMs”). Mr. Schneider graduated from the University of Notre Dame in 1983 with a B.B.A. in Finance and received his Executive M.B.A. from the University of Texas at Austin in 1997.
The discretionary traders for any discretionary investment strategy selected to trade on behalf of the Fund make the trading decisions for that discretionary strategy. The Manager has developed sophisticated proprietary software to study optimal portfolio weighting strategies and the effect of specific markets on the performance, risk, correlation and volatility characteristics of each of its trading strategies. As a result, the weighting or leverage that a trading strategy uses in each market may change to address changes in market conditions. With such software, the Manager devotes considerable attention to risk management at the portfolio level in an effort to ensure balance between markets and that the overall leverage used by each portfolio is consistent with the Manager’s overall views on risk. The Manager’s objective in forming the investment program of each portfolio is to provide the portfolio with significant potential for capital appreciation in both rising and falling markets and during expanding or recessionary economic cycles. Currently, the Blended Strategies Portfolio allocates 50% of its assets to the Manager’s Discretionary Trading Program (“DTP”) and 50% of its assets to the Manager’s Systematic Trading Program (“K4D”), but the Manager may alter these allocations to DTP and the K4D Program at any time within its sole discretion. The Systematic Strategies Portfolio allocates 100% of its assets to the Manager’s K4D Program, but the Manager may over time add other systematic trading programs to the Systematic Strategies Program.
The Fund will trade actively in both U.S. and foreign markets, primarily on major futures exchanges as well as the inter-bank cash currency and swaps markets. The Fund also engages in exchange for physical (EFP) transactions, which involve a privately negotiated and simultaneous exchange of a futures position for a corresponding position in the underlying physical commodity, and the Fund may use other derivatives in addition to swaps. The Manager may also trade other financial instruments as it endeavors to achieve superior results for investors and enhanced portfolio diversification. The Manager reserves the right in extraordinary market conditions to reduce leverage and portfolio risk if it feels in its sole discretion that it is in the potential best interest of the Fund. While such actions are anticipated to occur very infrequently, no assurance can be given that the Manager’s actions will enhance performance or that any efforts by the Manager to achieve portfolio diversification will be successful.
The Manager expects to add additional trading strategies and programs to each portfolio and to modify the strategies currently in use for each portfolio over time, and may in the future offer other portfolios. There is no maximum number of strategies and programs that the Manager may see fit to include in the Fund or each portfolio, and the Manager may increase or decrease the number of strategies and programs included in the Fund or each portfolio over time or increase the number of markets or contracts that are traded on behalf of the Fund or each portfolio. The Manager may make such additions or deletions of trading programs to the Fund or each portfolio at any time and may make such additions, deletions or any other changes, such as changes in the leverage of, or in the asset allocations to, any of the Fund’s trading strategies and programs, in its sole discretion and without prior notice to members.
In constructing a portfolio, the Manager employs various risk management protocols. The Manager conducts risk analysis and employs risk management controls at various levels of the Fund, including portfolio risk, strategy risk, market risk and execution risk. The objectives of its risk management approach are to measure a portfolio’s quantitative and qualitative exposures to the risks identified, formulate appropriate policies and procedures in an effort to prudently manage overall risk, monitor compliance with the Manager’s risk policies and procedures and report identified and measured risks to the Manager’s Risk Committee.
Effective testing, reporting and review are critical elements of the Manager’s risk management process. Daily stress testing is performed to evaluate a strategy’s risk exposure. Daily reporting of Value-at-Risk (VaR), plus intraday reporting of net gains or losses for each strategy, enables the risk management team and the Manager’s Investment Committee to observe the strategy’s adherence to its investment profile as well as market exposure. VaR is a probabilistic measure of the amount of loss, often referred to as the threshold, that a portfolio of investments will experience over a specified time period. For example, the Manager utilizes a one day 97.5% VaR, which means that in respect of the portfolio that it is analyzing it expects the portfolio to experience a loss in excess of VaR on approximately 1 out of every 40 days. Finally, each strategy is formally reviewed by the Investment Committee on a monthly basis.
As part of its efforts to manage risk, the Manager limits the size and structure of positions taken on behalf of each Portfolio so that they comply with various risk parameters, both those defined by the Manager and, with respect to the DTP, those defined by each of the individual discretionary traders for the Fund’s underlying trading strategies.
The Fund currently employs a master-feeder structure for its individual trading programs such that each portfolio’s trading program may, but will not necessarily in all cases, be conducted through one or more master funds. Each of the master funds is managed by one or more employees of the Manager. The master funds were organized by the Manager in order to facilitate the management of various funds and accounts managed by the Manager using in whole or in part the same trading program. The Fund, alternatively, may trade its individual trading programs through one or more managed accounts in the Fund’s name.
Discretionary Trading Program
The Manager has been trading discretionary programs since February 1998. Discretionary programs, unlike systematic programs which are based almost entirely on computerized mathematical models, determine trades subjectively on the basis of a trader’s personal assessment of trading data and trading experience. Although the Manager has had over a decade of experience trading various discretionary programs, DTP itself commenced trading as of August 2008. DTP seeks to invest in various global macro markets that are highly liquid. DTP consists of several of the Manager’s leading discretionary strategies traded by employees of the Manager that focus on the global fixed income, stock index, currency, energy, commodity and metals markets, but over time it may participate in any other liquid market that is available as the Manager deems appropriate.
The Manager’s discretionary programs have generally displayed a significant degree of non-correlation with traditional and other alternative investments, including with the Manager’s own quantitative investment programs. In its composition of DTP, the Manager will seek an investment portfolio that continues to offer such non-correlation and that provides diversification to other investments. DTP may take both long and short positions and thus may generate successful performance results in both rising and declining markets. The holding periods of its positions may range, depending on the individual trading strategies, from just a few hours to months, such that DTP may potentially profit in markets that exhibit either short-term moves or long-term trends. As with its systematic investment programs, the Manager may add or delete trading strategies or trading markets in DTP or alter their individual weightings or leverage as it deems appropriate, and no notice will be given to investors of such allocation changes; in addition, discretionary strategies that have previously traded on behalf of the Fund may be included in DTP. The Manager may make such allocation changes based on a proprietary allocation model, its assessment of market conditions or the availability of additional discretionary trading strategies, in its discretion.
Using a proprietary asset allocation model, the Manager’s Investment Committee determines the appropriate strategies for a portfolio and the weighting of each in the portfolio. At the individual strategy level, the Manager works closely with each discretionary trader to design an appropriate investment profile, including return objective and volatility level. Through continuous monitoring and an active dialogue with every discretionary trader, the Manager seeks to identify and minimize any deviations from the investment profile. In addition, the Manager has implemented a uniform set of risk guidelines for all discretionary traders designed to reduce a strategy’s downside risk potential. The Manager has developed a trade execution and reporting infrastructure designed to minimize the risk of errors. For example, where appropriate, trades are manually checked for accuracy by the Manager’s Middle Office staff and are subject to additional cross checking using computerized means. Each discretionary trader’s positions must adhere to established risk management guidelines and position limits, which are regularly monitored by the Manager’s Risk Management team.
The Manager subjects the trading of all its discretionary traders to a risk monitoring regime that includes a set of defined drawdown limits and a series of risk measurements. Draw down limits are used as a risk management tool to enforce risk reduction on a discretionary portfolio if the discretionary trader is experiencing losses and has not yet reduced overall risk levels. The Manager generally defines a draw down as losses experienced over a specified period of time, expressed as a percentage of net assets at the beginning of the period. The Manager imposes daily, monthly, and overall draw down limits for all discretionary portfolios. There is a daily move that requires a prompt report to the risk manager, a monthly peak to trough drawdown that likely leads to risk reduction, and a total peak to trough drawdown that likely leads to risk reduction. There is also a drawdown limit where the Manager’s Investment Committee would meet to consider closing a given program. Further, the Manager conducts a daily risk process measuring VaR and reviewing stress tests for all its portfolios, including the aggregate of those portfolios comprising the Fund. The Manager evaluates the validity of VaR as a risk management tool by comparing the number of instances that profit and loss exceeded expected parameters over various time frames. In addition, the Manager runs an extensive series of stress tests, including historical scenarios as well as specific foreign exchange, equity and interest rate shocks.
In addition to the risk monitoring procedures employed by the Manager, each discretionary trader trading on behalf of a discretionary strategy for the Fund has established his or her own proprietary risk measures and parameters. These generally include measures of first order sensitivities (i.e., the sensitivity of the portfolio to a change in a parameter of the underlying instruments) to the most relevant risk factors for a given book (for example, the dollar value of a basis point in the case of interest rate products), measurement of stress loss in extreme market events, or the use of explicit stop loss points. When individual limits on any of these are breached, the discretionary trader likely will reduce risk even if within the Manager’s guidelines.
The descriptions contained herein of DTP should not be understood as in any way limiting its investment activities. In addition, the Fund may engage in investment strategies and programs not described herein that the Manager considers appropriate.
Systematic Trading Program
The Manager’s systematic investment programs employ various quantitatively based systems that are designed to participate selectively in potential profit opportunities that can occur in a diverse number of U.S. and international markets. Such systems generally are based on computerized mathematical models and rely primarily on technical (i.e., historic price and volume data) rather than fundamental (i.e., general economic, interest rate and industrial production data) information as the basis for their trading decisions. The systems establish positions in markets where the price action of a particular market signals the computerized systems that a potential move in prices is occurring. The systems are designed to analyze mathematically the recent trading characteristics of each market and to statistically compare such characteristics to the historical trading patterns of the particular market. The systems also employ proprietary risk management and trade filter strategies that seek to benefit from price moves while reducing risk and volatility exposure.
Each systematic investment program of the Manager incorporates trading strategies developed by the Manager’s research department. While the Manager’s systematic investment programs have employed long-term systematic strategies from their inception, the programs may also include trend systems with varying time horizons as well as high frequency trading systems, counter-trend trading systems and trading systems that do not seek to identify or follow price trends at all. For example, high frequency trading systems, counter-trend systems, non-trend systems and other strategies may add value attributable to their low correlation to the Manager’s trend systems, reducing volatility and risk. Importantly, high frequency trading systems, counter-trend systems, non-trend systems and other strategies may generate successful performance results in trading range type markets where there are few long-term trends.
The Manager believes strongly in the importance of research and development of new trading strategies and expects to develop additional trading systems and strategies and to modify the systems currently in use in its systematic programs over time in its ongoing efforts to keep pace with changing market conditions. As an example of such efforts, the Manager has incorporated a proprietary risk model within its K4D program to systematically adjust the program’s exposure based on proprietary factors that assess prices, correlation and volatility in the near term. The decision to add or subtract systems or strategies from any investment program shall be at the Manager’s sole discretion. The Manager anticipates that the range of trading strategies comprising the K4D program will continue to grow and evolve over time.
In connection with the Fund’s systematic trading, the Manager may employ discretion in determining the leverage and timing of trades for new accounts and the market weighting and participation. In unusual or emergency market conditions, the Manager may also utilize discretion in establishing positions or liquidating positions or otherwise reducing portfolio risk where the Manager believes, in its sole discretion, that it is in the potential best interest of the Fund to do so. As an example of the Manager’s use of discretion, in response to the significant disruption in the general markets caused by the financial crisis, over the course of the fourth quarter of 2008 the Manager increasingly reduced, by up to approximately 50%, the portfolio risk of its trading systems. As a result of this use of discretion, the Fund’s trading activities generated less profit during that period than would have been the case if portfolio risk had not been reduced. While such actions are anticipated to occur very infrequently, no assurance can be given that the Manager’s discretionary actions in these programs will enhance performance, and in fact such actions may cause the Fund to experience losses that it otherwise might not have incurred if the Manager had not intervened.
The K4D Program includes the first system that the Manager developed, which began trading client accounts in 1995. It utilizes multiple computerized trading models and offers broad diversification in both financial and non-financial markets, trading in approximately 100 global markets. On a daily basis, the computer models analyze the recent price action, the relative strength and the risk characteristics of each market and compare statistically the quantitative results of this data to years of historical data on each market. The K4D Program’s original systematic strategy is primarily long-term in nature, but the program also includes short-term and intermediate-term trend-following as well as momentum and other non-trend following strategies.
The investment objectives and methods summarized above represent the Manager’s current intentions. Depending on conditions in the financial and securities markets and the economy in general, the Manager may pursue other objectives, employ other investment techniques or purchase any type of financial instrument that it considers appropriate and in the best interests of the Fund, whether or not described in this section.
JPMorgan Chase Bank N.A. serves as the Fund’s banker for purposes of receiving subscription funds, disbursing redemption payments and processing cash transactions not directly related to the Fund’s portfolio.
Bank of America, N.A. serves as the Fund’s banker for transactions on behalf of each portfolio. A significant portion of the Fund’s assets may be held by Bank of America, N.A. in addition to the futures clearing brokers utilized on behalf of the Fund as well as OTC counterparties. The Fund may also hold excess funds not required for trading in bank accounts at Bank of America, N.A. or elsewhere. The Manager, in its discretion, may change the brokerage and custodial arrangements described herein without notice to investors.
GAIF I currently has no direct arrangement with any futures commission broker; rather each master fund that trades on behalf of the Fund may have its separate clearing arrangements with a futures broker. At present, Credit Suisse Securities (USA) LLC, Merrill Lynch, Pierce Fenner& Smith Incorporated,Incorporated(the successor to Bank of America Securities LLC as futures broker after Bank of America’s merger with Merrill Lynch and Co.), and Barclay’s Capital Inc. are the primary futures clearing brokers for the master funds, but neither the Fund nor the master funds are required or under any contractual obligation to continue to employ them as futures clearing brokers (together with additional or replacement clearing brokers the Manager may select from time to time without notice to investors, the “Futures Brokers”). The Manager is authorized to determine the Futures Broker (or the counterparty, if concerning a foreign currency or swap transaction) to be used for each portfolio transaction for the Fund. The Manager is not affiliated with any futures commission merchant or broker-dealer.
Each Futures Broker will obtain, safe-keep and maintain custody of all of the Fund’s fully paid assets held by it in a customer account identified on the books of the Futures Broker as belonging to the Fund and segregated from the broker’s own proprietary positions. All of the Fund’s assets, funds, securities and other property held by each Futures Broker are held as security or collateral for the Fund’s obligations to the broker. The margin levels required to initiate or maintain open positions are established from time to time by each Futures Broker and applicable regulatory authorities. Each Futures Broker may close out positions, purchase securities, or cancel orders for the Fund’s account at any time it deems necessary for its protection, generally without the consent of or notice to the Fund.
Agreements with Futures Brokers in general provide that the broker will not be liable in connection with the execution, clearing, handling, purchasing, or selling of commodities, or other property, or other action, except for negligence or misconduct on the broker’s part. Such agreements also may provide that the Futures Broker will be indemnified and held harmless by the Fund from and against any loss, claim, or expense (including attorney’s fees) incurred by the broker in connection with it acting or declining to act for the Fund, and that the Fund will fully reimburse the broker for any legal or other expenses (including the cost of any investigation and preparation) which the broker may incur in connection with any claim, action, proceeding, or investigation arising out of or in connection with the agreement or the transactions contemplated thereunder.
In addition to trading in the Interbank market for foreign exchange, the Fund currently trades on all the major U.S. futures exchanges and may also trade on, but is not limited to, the following foreign exchanges:
Bolsa de Mercadorias and Futuros
Borsa ItalianaBorsaItaliana Idem
Eurex Exchange
Hong Kong Exchanges and Clearing Ltd.
Intercontinental Exchange
London Metal Exchange Ltd.
Mercado de Futuros FinancierosFuturosFinancieros
Montreal Exchange
NYSE Euronext
Osaka Securities Exchange
Singapore Exchange Ltd.
Stockholm Stock Exchange
South African Exchange
Sydney Futures Exchange Ltd.
Tokyo Commodity Exchange
Tokyo Financial Exchange
Tokyo Stock Exchange
Turkish Derivatives Exchange
In connection with such trading on foreign exchanges, the Fund’s assets may be deposited by the futures brokers with foreign brokers or banks. Although these foreign brokers or banks are subject to local regulation in their jurisdiction, the protections afforded by foreign regulatory bodies and rules may differ significantly from those afforded by United States regulators and rules.
The Fund expects to earn interest on cash not required to be posted as margin for its trading. Cash not required by the Fund’s investment programs for trading is currently invested by the Manager in a separate cash management master fund, Graham Cash Assets LLC (“Cash Assets”), managed by the Manager. The Fund pays the Manager no additional fees for managing the Fund’s assets in Cash Assets. It is currently anticipated that on average between 70% and 90% of the assets of each portfolio will be invested in Cash Assets. Various investment funds managed by the Manager and other entities affiliated with the Manager may invest in Cash Assets and each such entity bears its proportional share of the operating expenses of Cash Assets. Cash Assets may pay some third-party fees to unaffiliated custodians or managers in connection with the management of its portfolio, which fees will effectively be borne pro rata by all investment vehicles that invest in Cash Assets. Cash Assets may deposit a portion of its assets in an interest bearing bank account with Bank of America N.A. or other banks or in brokerage accounts, or it may purchase securities which are direct obligations of or obligations guaranteed as to principal or interest by the United States (e.g. U. S. Treasury Bills), or other securities issued or guaranteed by corporations in which the United States has a direct or indirect interest (e.g., U.S. government agency securities) which have been designated pursuant to section 3(a)(12) of the Securities Exchange Act of 1934, as amended (the “exchange Act”) as exempted securities. The Fund may invest in other cash management master funds managed by the Manager in the future or it may manage its cash directly either through deposit accounts at banks or by purchasing those types of securities described above that are currently purchased by Cash Assets.
The Fund trades spot and forward contracts on foreign currencies and, to a lesser degree, swap and derivatives contracts, currently the only non-CFTC regulated instruments the Fund anticipates trading. The Manager estimates that 20-60% of the Fund’s trades for each portfolio may be in forward contracts and 5-15% in swap contracts, but depending on market conditions, the percentage of each portfolio’s trades constituted by forward or swap contracts may fall substantially outside that range. Bank of America, N.A. currently serves as the Fund’s primary counterparty for foreign currency forward transactions. All of the Fund’s assets, funds, securities, and other property held by Bank of America, N.A. as a Fund counterparty, and any other bank or broker-dealer acting as a foreign currency forward counterparty or swap counterparty of the Fund are held as security or collateral for the Fund’s obligations to such entity. As the forward and swap markets currently areremain partially unregulated, the Fund bears additional risks to a certain extent (e.g., the credit risk of trading with counterparties) not present in futures trading. Under the Dodd–Frank Wall Street Reform and Consumer Protection Act, the CFTC, sometimes together with the Securities and Exchange Commission, (the “SEC”), must enacthas begun enacting regulations to govern these contracts and to require many of them to be cleared through an exchange or clearinghouse, but final regulations remain to be promulgated.clearinghouse.
The Manager determines, in its sole and absolute discretion, the amount of distributions, if any, to be made by the Fund. It is expected that dividends ordinarily will not be paid and that all portfolio earnings will be retained for reinvestment (subject to the redemption privilege).
Fees
Pursuant to the Company Agreement, each Class of the Fund pays the Manager an advisory fee (the “Advisory Fee”) at an aggregate annual rate equal to 2% of the Net Asset Value of such Class. For purposes of calculating the Advisory Fee, the Net Asset Value of each Class equals the total fair market value of the assets of the Fund attributable to that Class less the liabilities of the Fund attributable to that Class. Profits and losses are allocated among the Classes in proportion to their respective Net Asset Values (before accrual of the Brokerage and Sponsor Fees and the Incentive Allocation set forth below). The Advisory Fee is payable monthly in arrears calculated as of the last business day of each month (before giving effect to any redemptions as of the last business day of the month and subscriptions as of the beginning of the next business day, and before deduction or accrual of fees payable to the Manager and the Incentive Allocation). If the Company Agreement is terminated as of a date other than the last business day of a month, the Advisory Fee will be prorated through the termination date.
Class 0 of each portfolio of the Fund pays the Manager a brokerage and administrative fee (the “Brokerage Fee”) at an aggregate annual rate of 2% of its Net Asset Value and Class 2 of each portfolio of the Fund pays the Manager a Brokerage Fee at an aggregate annual rate of 4% of its Net Asset Value, in each case calculated and payable monthly in arrears in the same manner as the Advisory Fee. In consideration of the Brokerage Fee, the Manager bears all of the Fund’s trading commissions (including exchange and clearing and regulatory fees relating to its trades), routine legal expenses, internal and external accounting, audit and tax preparation expenses, fees and expenses of an external or internal administrator, and expenses and costs of printing and mailing reports and notices, together with the costs incurred in connection with the organization of the Fund (including government incorporation charges and professional fees and expenses in connection with the preparation of the Fund’s offering documents and the preparation of the basic corporate and contract documents of the Fund) and the Fund’s continuing offering of Units. The Brokerage Fee does not cover taxes, interest and other expenses related to borrowing, extraordinary expenses of the Fund, such as litigation expenses, or any other fees or expenses not described above, which will be separately borne by the Fund.
Each investor should understand that the Brokerage Fee will be determined solely based upon the Class and value of the investor’s Units, irrespective of the level of each portfolio’s trading or brokerage activity, which will fluctuate due to market conditions and the actual trading programs used on behalf of each portfolio. Consequently, members may pay higher trading fees than if they invested in an investment vehicle that paid separate transaction-based commissions for trades. The Manager shall bear the costs of the Fund’s brokerage and the administrative activities enumerated above to the extent they exceed any amount of Brokerage Fee received by the Manager. To the extent that the amount of Brokerage Fees received by the Manager exceeds the amount that it pays for the Fund’s brokerage and administrative costs, the Manager will retain and not rebate the excess and such amount may be construed as an additional advisory fee to the Manager.
Although the Manager will pay all brokerage commissions relating to the trading programs utilized on behalf of the Fund, the Manager is not responsible for (i) the difference between bid and asked prices in over-the-counter transactions by the Fund, such as forward contracts, swaps and most government securities, (ii) bid-ask spreads in futures contracts traded on certain non-U.S. exchanges where trades are executed on a “net basis” and (iii) differential spreads in connection with EFP transactions.
Each Class of the Fund pays the Manager a sponsor fee (the “Sponsor Fee”) at an annual rate of 1% of its Net Asset Value, payable monthly in arrears, determined in the same manner as the Advisory Fee.
Each Class of the Fund bears a quarterly Incentive Allocation, payable to the Manager as of the end of each calendar quarter, equal to 20% of the net profits of the Class for the quarter, subject to a “loss carryforward” provision. The loss carryforward provision generally provides that the Manager will not receive an Incentive Allocation in respect of the Class for a calendar quarter to the extent that the Class experiences net loss since the last calendar quarter for which an Incentive Allocation was earned and such loss has not been recouped through subsequent net profits. The Incentive Allocation is calculated and paid as follows: At the end of each calendar quarter, the Incentive Allocation is deducted from the Net Asset Value of each Class and credited to the Capital Account of the Manager in the Feeder Funds, in an amount equal to 20% of New High Net Trading Profits (as defined below) of such Class for such period. “New High Net Trading Profits” for any Class for any quarter shall mean the Net Capital Appreciation (which includes unrealized gains and losses and interest income and expense, less all accrued debts, liabilities and obligations of the Class (but before any accrual for the Incentive Allocation) for such period) for the quarter minus the Carryforward Loss (as defined below), if any, as of the beginning of the quarter, for such Class. The “Carryforward Loss” shall be increased as of the end of each calendar quarter by the amount of any Net Capital Depreciation with respect to such Class during the quarter then ended, and shall be decreased (but not below zero) as of the end of each calendar quarter by the amount of any Net Capital Appreciation with respect to such Class during the quarter then ended. In addition, the Carryforward Loss for a Class for any calendar quarter shall be proportionately reduced effective as of the date of redemption of any Units of such Class by multiplying (i) the Carryforward Loss for such Class immediately prior to such redemption by (ii) the ratio that the amount of assets redeemed from such Class bears to the Net Assets of such Class immediately prior to such redemption. The Carryforward Loss of a Class must be recouped before any subsequent Incentive Allocation can be made to the Manager. The Incentive Allocation is also accrued and allocable on the date of redemption with respect to any Units that are redeemed on any date not the end of a calendar quarter, as if the date of redemption were the end of a calendar quarter and the Incentive Allocation shall only be deducted with respect to such redeemed Units.
A portion of any of the above fees (including the Incentive Allocation) may be paid by the Manager to third parties as compensation for offering or selling activities in connection with the Fund.
All investments risk the loss of capital. No guarantee or representation is made that either portfolio of the Fund will achieve its investment objective. An investment in the Fund is speculative and involves certain considerations and risk factors that prospective investors should consider before subscribing. The practices of leverage and derivatives trading and other investment techniques, which the Fund expects to employ, can, in certain circumstances, result in significant losses. Under certain circumstances, an investment in the Fund involves the risk of a substantial loss of such investment. Investors should be able to bear the loss of their entire investment in the Fund, and their investment in the Fund should not be their sole significant investment.
Past performance is not necessarily indicative of future results.
Class 0 of the Fund has been operating since August 1, 2006, and Class 2 since November 1, 2007 with respect to its original portfolio, now the Blended Strategies Portfolio. Moreover, DTP became a part of the Blended Strategies Portfolio as of August 2008. The Systematic Strategies Portfolio commenced actual trading as of January 1, 2009. There can be no assurance that either portfolio of the Fund will achieve its investment objective.
Futures and Options Trading Is Speculative and Volatile. Futures and options prices are highly volatile. Such volatility may lead to substantial risks and returns, generally much larger than in the case of equity or fixed-income investments. Price movements for futures are influenced by, among other things: changing supply and demand relationships; weather; agricultural, trade, fiscal, monetary, and exchange control programs and policies of governments; macro political and economic events and policies; changes in national and international interest rates and rates of inflation; currency devaluations and revaluations; and emotions of other market participants. None of these factors can be controlled by the Fund and no assurance can be given that the Manager’s advice will result in profitable trades for a participating customer or that a customer will not incur substantial losses. With respect to the Blended Strategies Portfolio, the master funds included in DTP may purchase and write options. The purchaser of an option is subject to the risk of losing the entire purchase price of the option, while the writer of an option is subject to an unlimited risk of loss, namely the risk of loss resulting from the difference between the premium received for the option and the price of the futures contract or other asset underlying the option which the writer must purchase or deliver upon exercise of the option. Thus, an investment in the Fund is suitable only for those investors with speculative capital who understand the risks of futures and options markets.
The Fund’s Trading Is Highly Leveraged, Which May Result in Substantial Losses for the Fund. The Fund trades futures and options on a leveraged basis due to the low margin deposits normally required for trading. As a result, a relatively small price movement in a contract may result in immediate and substantial gains or losses for the Fund. For example, $3,000 in margin may be required to hold a U.S. Treasury futures contract with a face value of $100,000. If the value of the contract were to decline by 3%, the entire margin deposit would be lost.
Market Illiquidity May Cause Less Favorable Trade Prices. Futures trading at times may be illiquid. Most United States commodity exchanges limit price fluctuations in certain commodity interest prices during a single day by means of “daily price fluctuation limits” or “daily limits.” The daily limit, which is set by most exchanges for all but a portion of the expiration month, imposes a floor and a ceiling on the prices at which a trade may be executed, as measured from the last trading day’s close. While these limits were put in place to lessen margin exposure, they may have certain negative consequences for the Fund’s trading. For example, once the price of a particular contract has increased or decreased by an amount equal to the daily limit, thereby producing a “limit-up” or “limit-down” market, positions in the contract can neither be taken nor liquidated unless traders are willing to effect trades at or within the limit. Contract prices in various commodities have occasionally moved the daily limit for several consecutive days with little or no trading. Similar occurrences could prevent the Fund from promptly liquidating unfavorable positions, subjecting the Fund to substantial losses.
In Times of Market Stress, the Fund May Not Be Able to Diversify Its Portfolio. Where the markets are subject to exceptional stress, trading strategies and programs may become less diversified and more highly correlated as the stress may cause diverse and otherwise unrelated markets all to act in a similar manner. Efforts by the Manager to diversify the Fund’s trading strategies and investment exposure may not succeed in protecting the Fund from significant losses in the event of severe market disruptions.
The Fund Is Subject to Speculative Position Limits, Which May Limit the Fund’s Ability to Generate Profits or Result in Losses. The CFTC and various exchanges impose speculative position limits on the number of futures positions a person or group may hold or control in particular futures. Most physical delivery and many financial futures and option contracts are subject to speculative position limits. The CFTC has established position limits with respect to contracts for corn, oats, wheat, soybeans, soybean oil, soybean meal, and cotton. In other markets, the relevant exchanges are required to determine whether and to what extent limits should apply. For purposes of complying with speculative position limits, the Fund’s outright futures positions will be required to be aggregated with any futures positions owned or controlled by the Manager or any principal of the Manager. As a result, the Fund may be unable to take positions in particular futures or may be forced to liquidate positions in particular futures, which could limit the ability of the Fund to earn profits or cause it to experience losses.
Trading on Non-U.S. Exchanges Presents Greater Risks to the Fund than Trading on U.S. Exchanges. Unlike trading on U.S. commodity exchanges, trading on non-U.S. commodity exchanges is not regulated by the CFTC and may be subject to greater risks than trading on U.S. exchanges. For example, some non-U.S. exchanges are “principals’ markets” in which no common clearing facility exists and a trader may look only to the broker for performance of the contract. In addition, unless the Fund hedges against fluctuations in the exchange rate between the U.S. dollar (in which Units are denominated) and other currencies in which trading is done on non-U.S. exchanges, any profits that the Fund might realize in trading could be reduced or eliminated by adverse changes in the exchange rate, or the Fund could incur losses as a result of those changes.
The Unregulated Nature of the Over-The-Counter Markets Creates Counterparty Risks that Do Not Exist in Futures Trading on Exchanges. Forward markets, including foreign currency markets, offer less protection against defaults in trading than is available when trading occurs on an exchange. Forward contracts are not guaranteed by an exchange or clearing house, and, therefore, a non-settlement or default on the contract would deprive the Fund of unrealized profits or force the Fund to cover its commitment to purchase and resale, if any, at the current market price.
Additional risks of the forward markets include: (i) the forward markets are generally not regulated by any U.S. or foreign governmental authorities; (ii) there are generally no limitations on daily price moves in forward transactions; (iii) speculative position limits are not applicable to forward transactions although the counterparties with which the Fund may deal may limit the size or duration of positions available as a consequence of credit considerations; (iv) participants in the forward markets are not required to make continuous markets in forward contracts; and (v) the forward markets are “principals’ markets” in which performance with respect to a forward contract is the responsibility only of the counterparty with which the trader has entered into a contract (or its guarantor, if any), and not of any exchange or clearing house. As a result, the Fund will be subject to the risk of inability or refusal to perform with respect to such contracts on the part of the counterparties with which the Fund trades. Because the Fund trades foreign exchange contracts substantially with Bank of America, N.A., it is at risk with respect to the creditworthiness and trading practices of Bank of America, N.A. as the counterparty to its contracts.
The Fund Has Credit Risk with respect to its Futures Brokers. The CEA requires a U.S. broker to segregate all funds received from such broker’s customers in respect of regulated futures transactions from such broker’s proprietary funds. If the broker were not to do so to the full extent required by law, the assets of the Fund might not be fully protected in the event of the bankruptcy of the broker. In the event of the broker’s bankruptcy, the Fund would be limited to recovering only a pro rata share of all available funds segregated on behalf of the broker’s combined customer accounts, even though certain property specifically traceable to the Fund (for example, U.S. Treasury bills deposited by the Fund) was held by the broker. In addition, in the event of bankruptcy or insolvency of an exchange or an affiliated clearing house, the Fund might experience a loss of funds deposited through its broker as margin with an exchange or affiliated clearing house, the loss of unrealized profits on its open positions, and the loss of funds owed to it as realized profits on closed positions. If the Fund retains brokers that are not subject to U.S. regulation, its funds deposited with those brokers might not be segregated.
The Unregulated Nature of the Swaps and Derivatives Markets Creates Counterparty Risks that Do Not Exist in Futures Trading on Exchanges. The Fund may enter into swap contracts and related derivatives agreements with various counterparties. SwapsCertain swaps and other forms of derivatives instruments currently are not guaranteed by an exchange or its clearing house or regulated by any U.S. or foreign governmental authorities. Consequently, there are no requirements with respect to record keeping, financial responsibility or segregation of customer funds and positions. The default of a party with which the Fund has entered into aan uncleared swap or other derivative may result in the loss of unrealized profits and force the Fund to cover its resale commitments, if any, at the then current market price. It may not be possible to dispose of or close out a swap or other derivative position without the consent of the counterparty, and the Fund may not be able to enter into an offsetting contract in order to be able to cover its risk.
The Fund Has Credit and Market Risks With Respect to Its Cash Management. The Fund currently invests all assets not required for trading in Cash Assets, which in turn presently holds deposits in bank accounts or invests broadly in U.S. government or agency securities. With respect to its cash deposited in bank accounts, although the bank accounts themselves may be insured by the United States Federal Deposit Insurance Corporation, the balances in such accounts will be largely uninsured, as the maximum amount of insurance available to such accounts will not be material relative to the balances that are expected to be maintained in the accounts. With respect to its investment in U.S. government or agency securities, Cash Assets currently intends to hold them until they mature. Some of these securities may not mature for a year or longer. If Cash Assets were forced to sell some of its securities in the open market before they mature to meet unanticipated redemption requests (whether from the Fund or other entities affiliated with the Manager), the market value of the securities at such time may be below their principal face amount, causing a loss for Fund investors. In addition, if interest rates rise, the interest rate that Cash Assets pays its investors (including the Fund) will not fully reflect the new rates because its pre-existing investments are still yielding interest at lower rates.
The Fund May Also Borrow Money to Support its Trading, Which Could Increase the Level of Volatility in its Performance and Expose the Fund to Greater Losses. In addition to the leverage implicit in trading futures, the Fund may borrow money from brokers or their affiliates and other lenders. A significant portion of the funds borrowed by the Fund may be obtained from brokerage entities in the form of margin loans collateralized by assets held in the Fund’s brokerage account with such brokerage firms. The Fund does not have any limits on borrowing or leverage.
The Fund Relies on Key Individuals. The Fund relies exclusively on the Manager for the management of its investment portfolio, and the Manager relies significantly on the services of its founder, Kenneth G. Tropin. There could be adverse consequences to the Fund in the event that the Manager ceases to be available to devote its services to the Fund. There could be adverse consequences to the Fund if Mr. Tropin ceases to be available to devote his services to the Manager. In the event that the CFTC suspended the registration of the Manager, the Manager would be unable to manage the business of the Fund. Should the Manager’s registration be suspended, termination of GAIF I might result.
The Fund May Be Terminated at Any Time. Unforeseen circumstances, including substantial losses, the retirement or loss of key personnel of the Manager, the withdrawal of the Manager or the decision of the Manager not to continue to manage the Fund, could cause the Fund to terminate prior to its stated termination date of December 31, 2050. Early termination of the Fund could disrupt an investor’s overall investment portfolio plan resulting in the loss of some or all of its investment.
There is no Secondary Market for the Units, Therefore Investors Should Consider Their Investment in the Fund to be Illiquid. It is not anticipated that an active secondary market will develop in the Units. Units are not registered so as to permit a public offering under the securities laws of any jurisdiction. The Units will not be transferable without the consent of the Manager (which may be granted on such terms as it determines or withheld). Moreover, there are limitations on the ability of an investor to require the Fund to redeem Units. Consequently, the Units will be illiquid investments.
The Fund Does Not Anticipate Paying Dividends or Making Distributions, Therefore an Investment in the Fund is Not Appropriate for Investors Seeking Current Income. Since the Fund does not presently intend to pay dividends or other distributions, an investment in the Fund may not be suitable for investors seeking current returns for financial or tax planning purposes.
Taxes Will Be Imposed on You Regardless of Cash Distributions. U.S. taxable investors in the Fund must recognize for federal income tax purposes their pro rata share of the taxable net income of the Fund, regardless of whether such investors requested a partial redemption from the Fund to cover their tax liabilities. An investment in the Fund may generate taxable income for a member even though the value of the member’s interest in the Fund has declined. A member may have to use personal funds to pay the income tax owed on the income or gain allocated to the member. Sufficient information may not be available in time for the member to determine accurately an amount to redeem to pay taxes for a given fiscal year.
Investors Do Not Have the Protections Provided to a Regulated Mutual FundFund. . Although the Fund may be considered similar to an investment company, it is not required to, and does not intend to, register as such under the Investment Company Act of 1940, as amended (the “Investment Company Act”). Accordingly, certain provisions of the Investment Company Act (which, among other things, require investment companies to have a certain number of disinterested directors and regulate the relationship between the adviser and the investment company) will not be applicable.
Interests in the Fund have not been and will not be registered under the Securities Act, in reliance upon an exemption available under Regulation D under the Securities Act. Accordingly, interests in the Fund will be offered only to investors that, among other requirements, are accredited investors within the meaning of Regulation D.
Impact of Recent Financial Industry Regulation is Uncertain but May Impact the Fund’s Operations. The Dodd-Frank Wall Street Reform and Consumer Protection Act contains a number of new provisions intended to limit systemic risk in the financial services industry. The act’s provisions seek to increase regulatory oversight and supervision of both bank and nonbank entities in the financial services sector. Under the act, Federal regulators have been tasked to develop rules designed to effect the act’s purposes, and in many respects this rulemaking is expected to be extensive. TheWhile certain provisions of the act are in effect, the rulemaking process is not complete and as such the effect of such rulemaking on the financial services industry is as yet not fully capable of being known. In particular as it relates to the Fund’s operations, the act tasks the SEC and the CFTC to draft rules bearing on the over-the-counter derivatives market designed to address capital and margin requirements, mandatory clearing, the operation of execution facilities and data repositories, business conduct standards for swap dealers, and transparency for transactional information. It is not clear at this time howMandatory clearing of such instruments has only recently gone in to effect, and it remains to be seen what the long-term impact of these rules will alterbe on the operation of the markets in which the Fund operates or affecton the operations of the Fund.
The Trading Programs Used by Each Portfolio May Be Changed Without Notice to Investors. The Manager continuously updates and changes its trading programs as a result of its ongoing research efforts and in response to changing market conditions. The Manager also expects to develop and implement new trading programs from time to time. The Manager may make additions or deletions of trading programs used by either the Blended Strategies Portfolio or the Systematic Strategies Portfolio at any time, and may make additions, deletions or any other changes to its trading programs used by either portfolio – such as changes in the amount of leverage of, or in the allocations of assets to, any of the trading programs used by either portfolio – at any time as determined by the Manager in its sole discretion. The Manager is not required to provide prior, or any, notice to investors of any such changes. As a result, the descriptions of the trading programs of each portfolio in the Fund’s offering materials may not at any particular time fully or accurately describe the trading programs being used by each portfolio.
Conflicts of Interest
Performance Based and other Fund Compensation Could Expose the Fund to Greater Risks. The Manager could receive substantial compensation in the event it generates net profits for the Fund. Such compensation arrangements may provide an incentive for the Manager to effectuate larger and more risky transactions than would be the case in the absence of such arrangements. The Manager may receive compensation with respect to unrealized appreciation of Fund assets as well as with respect to realized gains from the trading of Fund assets. The fees and incentive allocation payable to the Manager were not the subject of arms’ length negotiation. In addition, investors that acquire Units of any Class with a Net Asset Value below a previous high water mark might benefit at the expense of pre-existing investors where those Units increase in value but are not yet subject to an Incentive Allocation because the Class as a whole still has aggregate carried forward losses.
The Manager Manages Other Accounts. The Manager acts as general partner or trading manager to investment funds and other managed accounts that have investment objectives and methodologies similar to those of the Fund. As of March 1, 2012,2013, the Manager acts as general partner or trading manager to 3424 investment funds or managed accounts to which outside investors contribute capital, including the Funds. Of these, 3424 investment funds or managed accounts, 2317 employ a systematic trading program identical to, or substantially similar to, that traded for the Systematic Strategies Portfolio and 117 employ a discretionary trading program similar to DTP, differing primarily in that they trade securities. The Manager may also receive higher fees for managing certain of these accounts. The Manager and its principals may trade for their own accounts in the same markets in which the Fund trades and such accounts may take positions that are opposite, or ahead of, positions taken for the Fund. Fund investors will not be permitted to inspect the records of such proprietary accounts or the written policies related to such trading. The Manager and its principals also may manage other accounts in the future. All of the above accounts may compete with the Fund for the same positions. All of the foregoing accounts may be aggregated for purposes of determining applicable position limits, and may take the same or different positions as the Fund.
With respect to the discretionary strategies traded for DTP, all of the Manager’s trading for each discretionary strategy is conducted through a single master fund for each such strategy or substrategy. This structure eliminates the need for trade allocation procedures, which would otherwise be the case if trading for each strategy was conducted for multiple accounts. The Manager closely reviews the capacity levels of each master fund traded for DTP to ensure that all funds that utilize DTP or a trading program similar to DTP can invest in the master funds at the levels designated by the Investment Committee. To date, the master funds have not experienced capacity limits that would impact the operations of the funds that invest in them; however, no assurance can be given that in the future one or more master funds will not experience capacity limits, which would require the Manager to limit the participation of one or more funds in the affected master funds.
With respect to the Manager’s systematic trading programs, the Manager may place block orders with brokers on behalf of multiple accounts, including the Fund. Accounts in which the Manager and its principals have an interest may be included with client accounts in block orders. One or more of the accounts may receive more favorable fills and some less favorable fills because a block order may be executed at different prices. Unless an average price of split fills is allocated to an order or unless fills are allocated according to a non-discretionary computer-based allocation methodology, split fills generally are allocated to accounts on a “high to low” basis. Accounts are ranked based on commencement of trading, and the highest split fill prices on both buy and sell transactions are allocated to the highest ranked accounts. Any advantage a high ranked account enjoys on the sell order generally is offset by a disadvantage on the buy order. Consistent application of this non-discretionary allocation methodology satisfies regulatory requirements of objectivity and fairness such that no account or group of accounts receives consistently favorable or unfavorable treatment. Allocations made according to this methodology will be deemed equitable even though under certain market conditions a trade may be more favorable to some accounts than others.
The Manager may enter into side agreements with specific investors in the Fund providing for different fees, redemption rights, access to information about the Fund’s investments or other matters relating to an investment in the Fund.
The Master–Feeder Structure Underlying the Fund’s Trading May Create Operating Inefficiencies for the Fund. All trading attributable to the Fund is currently conducted through the master funds organized and managed by the Manager, through a so-called “master-feeder” fund structure. A portionAll of the subscription proceeds received from investors ordinarily is invested by the Fund in the master funds including Cash Assets, in each case with limited liability to the Fund. A separate master fund then invests in global fixed income, foreign exchange and other markets pursuant to each of the investment programs managed by the ManagerManager.
Other investment funds and managed accounts structured to meet the needs of various U.S. and non-U.S. investors, including various proprietary accounts of the Manager, also may invest in each master fund, including Cash Assets. The units of such investors in any master fund may be in conflict in a number of respects, including, without limitation, as to the tax consequences and capital utilization with regard to any master fund’s transactions. For example, each master fund’s transactions may provide investors subject to U.S. income taxation with different after-tax returns than those of non-U.S. and tax-exempt investors. Also, each master fund may borrow to increase the efficiency of its capital utilization, but in so doing may incur borrowing charges at a rate that exceeds the rate at which the Fund earns interest income on its available cash. Such borrowing, with its attendant additional cost, serves to stabilize the master funds’ financing arrangements and offers various other advantages to their investors. At the same time, such borrowing may disproportionately benefit more leveraged investors in the master funds (including proprietary accounts of the Manager) over less leveraged investors (potentially including the Fund).
The foregoing list of risk factors and conflicts of interest does not purport to be a complete enumeration or explanation of the risks or conflicts involved in an investment in the Fund. Prospective investors should consult with their own advisors before deciding to subscribe for Units.
Allocation of Profit and Loss
A separate Capital Account is maintained for each member with respect to each Class of Units held by such member. The initial balance of each Capital Account of each member will equal the net initial contribution to the Fund by such member with respect to the Class to which such Capital Account relates. Each Capital Account of each member is increased by any additional capital contributions by such member with respect to the Class to which such Capital Account relates, and decreased by any redemptions of Units of such Class by such member. Net realized and unrealized appreciation or depreciation in the value of assets of each portfolio of the Fund, including investment income and expenses, is allocated at the end of each fiscal period among the Capital Accounts of the members in proportion to the relative values of such Capital Accounts as of the commencement of such fiscal period (in the case of any month end that is not also the end of a calendar quarter, before any accrual for the Incentive Allocation).
On the last day of each fiscal period, an allocation is made of the net profit or net loss attributable to the investments of each portfolio for such fiscal period. The net profit or net loss for a fiscal period is allocated among all the Classes of each portfolio pro rata in the proportion that the Net Asset Value of each Class as of the date of the commencement of such fiscal period bears to the Net Asset Value of the portfolio as of such date.
The Net Asset Value of each Class means the total value of the Fund’s assets, at fair value, attributable to that Class less the liabilities of the Fund attributable to that Class. The Net Asset Value per Unit of any Class is determined as of the close of business on the last business day of the month (a “Valuation Day”) by dividing the Net Asset Value of that Class by the number of outstanding Units of that Class. Such deductions will include an accrual for the Incentive Allocation and the fees to be paid to the Manager.
The net profit or net loss of each Class for a fiscal period in turn is allocated among all holders of Units of that Class pro rata in the proportion that the Net Asset Value of each member’s holding of Units of that Class as of the date of the commencement of such fiscal period (after adjustment for any contributions to the capital of the Fund which are effective on such date) bears to the aggregate Net Asset Value of that Class as of such date.
The Manager is responsible for determining the value of the Fund’s assets. The Fund has appointed SEI Global Services Inc. as the Fund’s independent administrator (“Administrator”), and in connection with that role SEI is responsible, subject to the ultimate supervision of the Manager, for calculating the Net Asset Value of the Fund and the Net Asset Value per Unit of each Class of Units. In determining the Net Asset Value of the Fund and the Net Asset Value per Unit of each Class of Units, the Administrator will follow the valuation policies and procedures adopted by the Fund as set out below. If the Manager is involved in the pricing of any of the Fund’s portfolio assets, the Administrator may accept, use and rely on such prices in determining the Net Asset Value of the Fund and shall not be liable to the Fund, any investor in the Fund, the Manager or any other person in so doing.
For all purposes, including subscriptions, redemptions and the calculation of the fees paid to the Manager, the Manager shall determine the fair market value of any investment made by the Fund. In general, the Master Funds’ investments will be valued as follows:
| | a. | The value of unrealized gain or loss on open futures contracts shall be recorded as the difference between the contract price on the trade date and the closing price reported as of the Valuation Day on the primary exchange on which such contracts are traded. |
| | b. | The value of any option listed or traded on any recognized foreign or U.S. exchange shall be the settlement price published by the principal exchange on which it is traded on the relevant Valuation Day. If the recognized foreign or U.S. exchange does not publish a settlement price, the value of any option shall be the last reported sale price on the relevant Valuation Day on the principal exchange on which such option is traded. If no such sale of such option was reported on that date, the market value shall be the average of the last reported bid and asked price. The market value of any over-the-counter option for which representative broker’s quotations are available shall be determined in like manner by reference to the last reported sale price, or, if none is available, to the average of the last reported bid and asked quotation. Premiums forPremiumsfor the sale of such options written by the Fund shall be included in the assets of the portfolio, and the market value of such options shall be included as a liability. |
| | c. | The value of any U.S. government security held by Cash Assets shall be the cost of such security plus accrued interest, discount and amortization of premium. The value of any other U.S. government security shall be determined as the average between the bid and ask quotations received from independent brokers. |
The fair value of any assets not referred to in clauses (a) through (c) above (or the valuation of any assets referred to therein in the event that the Manager shall determine that there is no active market or that another method of valuation is advisable in the circumstances) shall be determined by or pursuant to the direction of the Manager. The Manager, in its sole and absolute discretion, permit any other method of valuation to be used if it considers that such method of valuation better reflects fair value and is in accordance with generally accepted accounting policies. Prospective investors should be aware that situations involving uncertainties as to the valuation of portfolio positions could have an adverse effect on Net Asset Value if management’s judgments regarding appropriate valuations should prove incorrect. Absent bad faith or manifest error, the Fund’s Net Asset Value determinations are conclusive and binding on all investors. Net Asset Values are expressed in U.S. Dollars,dollars, and any items denominated in other currencies are translated at prevailing exchange rates as determined by the Administrator in consultation with the Manager.
The Manager may, in its sole and absolute discretion, permit any other method of valuation to be used if it considers that such method of valuation better reflects fair value and is in accordance with goodgenerally accepted accounting practice.policies.
Reporting
The Fund is required to furnish audited annual reports to its members containing financial statements examined by the Fund’s independent registered public accounting firm. The Fund is also required to provide members with monthly performance updates. The Fund is also required to file Form 10-Q each quarter and Form 10-K each year with the SEC.
Regulation
The Manager has been registered as a CPO and CTA under the CEA and has been a member of the NFA since July 27, 1994. The Manager has also been registered as a Registered Investment Advisor with the SEC since March 30, 2012. GAIF I is regulated as a commodity pool by the CFTC and NFA.
The CFTC may suspend a CPO’s or CTA’s registration if it finds that its trading practices tend to disrupt orderly market conditions or in certain other situations. In the event that the registration of the Manager were terminated or suspended, the Manager would be unable to continue to manage the business of the Fund. Should the Manager’s registration be suspended, termination of GAIF I might result. In addition to such registration requirements, the CFTC and certain commodity exchanges have established limits on the maximum net long or net short positions that any person may hold or control in particular commodities. Most exchanges also limit the changes in futures contract prices that may occur during a single trading day.
As of March 1, 2013, the Systematic Strategies Portfolio of GAIF I had fewer than 300 Unit holders. Pursuant to Section 12(g)(4) of the Exchange Act, GAIF I deregistered the Units of the Systematic Strategies Portfolio on March 28, 2013.
All persons who provide services directly to the Fund (as opposed to those persons who provide services through a third-party service provider) are employed by the Manager. The Fund has no employees of its own.
Item 1B: | Item 1B: | UNRESOLVED STAFF COMMENTS |
Not applicable.
The Fund does not own or use any physical properties in the conduct of its business. The Manager operates from its principal office in Rowayton, Connecticut.
There are no legal proceedings pending, on appeal or concluded to which the Fund is a party or to which any of its assets is subject. There have been no material legal proceedings pending, on appeal or concluded against the Manager or any of its principals, directors or executive officers within the past five years.
Item 4: [Removed and Reserved]
| Item 5: | MARKET FOR REGISTRANT’S COMMON EQUITY, RELATED STOCKHOLDER MATTERS AND ISSUER PURCHASES OF EQUITY SECURITIES |
There is no public market for the Units, and none is likely to develop. Units may be redeemed subject to the conditions of the Company Agreement. Units may not be assigned or otherwise transferred except as permitted under the Company Agreement and as such may not be sold by investors pursuant to Rule 144 of the Securities Act, as amended.
As of February 29, 2012,28, 2013, there were 543361 holders of Class 0 Units and 443306 holders of Class 2 Units of the Blended Strategies Portfolio and 16885 holders of Class 0 Units and 227147 holders of Class 2 Units of the Systematic Strategies Portfolio.
The Manager determines, in its sole and absolute discretion, the amount of distributions, if any, to be made by the Fund to its investors. To date no distributions have been paid on the Units and the Manager has no present intention to make any distributions in the future.
| (d) | Securities Authorized for Issuance under Equity Compensation Plans |
None.
(f) | Recent Sales of Unregistered Securities |
Not applicable.
| (f) | Recent Sales of Unregistered Securities |
For the three months ended December 31, 2011,2012, the Fund issued 50,302.62515,361.752 Units in exchange for $6,198,381$1,660,000 with respect to the Blended Strategies Portfolio and 15,327.6091,489.990 Units in exchange for $1,290,000$108,888 with respect to the Systematic Strategies Portfolio, in each case in a transaction that was not registered under the Securities Act. The Units were issued in reliance upon applicable exemptions from registration under Section 4(2) of the Securities Act and Section 506 of Regulation D promulgated thereunder.
The following chart sets forth the purchases of Units of the Fund.
| | Blended Strategies Portfolio Total Number of Units Purchased | | Systematic Strategies Portfolio Total Number of Units Purchased |
| Period (as of) | | | | | | |
| October 1, 2011 | 13,348.348 | | | | 7,406.204 | |
| November 1, 2011 | 28,726.900 | | | | 3,708.604 | |
| December 1, 2011 | 8,227.377 | | | | 4,212.801 | |
| | | Blended Strategies Portfolio Total Number of Units Purchased | | | Systematic Strategies Portfolio Total Number of Units Purchased | |
| Period (as of) | | | | | | |
| October 1, 2012 | | | 7,084.756 | | | | 342.539 | |
| November 1, 2012 | | | 5,588.290 | | | | 1,147.451 | |
| December 1, 2012 | | | 2,688.706 | | | | 0.000 | |
| Item 6: | SELECTED FINANCIAL DATA |
TheNo disclosure is required hereunder as the Fund is a smaller Reporting Company,“smaller reporting company”, as defined by Rule 229.10(f)in Item 10(f)(1) and therefore this item is not applicable.of Regulation S-K.
| Item 7: | MANAGEMENT’S DISCUSSION AND ANALYSIS OF FINANCIAL CONDITION AND RESULTS OF OPERATIONS |
| (a) | Management’s Discussion and Analysis of Financial Condition and Results of Operations |
Reference is made to “Item 8: Financial Statements”. The information contained therein is essential to, and should be read in conjunction with, the following analysis. The Fund does not engage in the sale of goods or services. The Fund’s capital consists of capital contributions of the members, as increased or decreased by gains and losses from its investments in the Master Funds, interest, expenses and redemptions. Its only assets are its investments in the Master Funds. The Master Funds do not engage in the sale of goods or services. Their assets are comprised of the equity in their accounts with clearing brokers and OTC counterparties, in each case consisting of cash, open trade equity on derivatives and the net option premium paid or received. In the case of Graham Cash Assets LLC, the assets consist of investments in debt obligations guaranteed by the U.S. federal government, as well as cash and cash equivalents.
For the year ended December 31, 2012 the Fund’s net asset value decreased by $123,524,427 or -39.9%. This decrease was attributable to a $96,057,124 or -31.0% net decrease in the Blended Strategies Portfolio and a $27,467,303 or -8.9% net decrease in the Systematic Strategies Portfolio. The net decrease in the Blended Strategies Portfolio was attributable to total subscriptions of $10,464,469 or 3.4% offset by redemptions totaling $90,162,741 or -29.1% and net a loss of $16,358,852 or -5.3%, for the year. The net decrease in the Systematic Strategies Portfolio was attributable to total subscriptions of $716,888 or 0.2% partially offset by redemptions totaling $24,549,641 or -7.9% and a net loss of $3,634,550 or -1.2%, for the year.
For the year ended December 31, 2011 the Fund’s net asset value decreased by $28,580,739 or -8.4%. This decrease was attributable to a $26,094,202 or -7.7% net decrease in the Blended Strategies Portfolio and a $2,486,537 or -0.7% net decrease in the Systematic Strategies Portfolio. The net decrease in the Blended Strategies Portfolio was attributable to total subscriptions of $87,250,848 or 25.8% offset by redemptions totaling $75,050,692 or -22.2% and net a loss of $38,294,358 or -11.3%, for the period. The net decrease in the Systematic Strategies Portfolio was attributable to total subscriptions of $24,170,918 or 7.1% partially offset by redemptions totaling $12,930,421 or -3.8% and a net loss of $13,727,034 or -4.0%, for the period.
For the year ended December 31, 2010, the Fund’s net asset value increased by $120,761,148 or 55.5%. This increase was attributable to a $102,272,726 or 47.0% net increase in the Blended Strategies Portfolio and a $18,488,422 or 8.5% net increase in the Systematic Strategies Portfolio. The net increase in the Blended Strategies Portfolio was attributable to total subscriptions of $115,273,013 or 53.0% and net income of $6,271,559 or 2.9% partially offset by redemptions totaling $19,271,846 or -8.9%, for the period. The net increase in the Systematic Strategies Portfolio was attributable to total subscriptions of $19,960,357 or 9.2% and net income of $1,455,958 or 0.7% partially offset by redemptions totaling $2,927,893 or -1.4%, for the period. | (i) | Results of Operations |
(i) Results of Operations
The Fund’s success depends primarily upon the Manager’s ability to recognize and capitalize on market trends in the different and varied sectors of the global financial markets in which it trades.
Blended Strategies Portfolio
2012 Summary
For the year ended December 31, 2012, the Blended Strategies Portfolio experienced net trading losses of $4,538,505 attributable to the following sectors:
| Agriculture / Softs | | $ | (3,498,820 | ) |
| Base Metals | | | (5,631,710 | ) |
| Energy | | | 283,552 | |
| Equities | | | 2,876,178 | |
| Foreign Exchange | | | (1,399,830 | ) |
| Long Term / Intermediate Rates | | | 3,404,037 | |
| Precious Metals | | | (2,125,882 | ) |
| Short Term Rates | | | 1,553,970 | |
| | | $ | (4,538,505 | ) |
The portfolio posted a net loss for 2012. The majority of the losses were recorded from trading in the commodity complex, particularly in metals and agricultural commodities. The portfolio recorded smaller losses in foreign exchange. The portfolio recorded profits from trading European, Asian and Australian bond futures with additional gains from trading European and U.S. stock index futures as prices rallied during the year. Smaller gains resulted from trading energy, which helped offset a small portion of the overall loss.
Brokerage, Advisory and Sponsor Fees are calculated as a percentage of the Fund’s net asset value as of the end of each month and are affected by trading performance, interest income, subscriptions into and redemptions out of the Fund. Accordingly, the fluctuations in these amounts are directly correlated to the changes in net asset value which are discussed in detail herein.
For the year ended December 31, 2012, Brokerage Fees decreased by $2,001,392 or -27.4%, Advisory Fees decreased by $1,744,050 or -27.4% and Sponsor Fees decreased by $872,027 or -27.4% in the Blended Strategies Portfolio over the corresponding period of the preceding year. These decreases are all attributable to lower net assets of the portfolio resulting from subscriptions offset by redemptions and a net loss for the period. During the same period, interest income decreased by $668,332 or -58.7%. Interest was earned on free cash at an average annualized yield of 0.26% for the year ended December 31, 2012 compared to 0.43% for the year ended December 31, 2011.
The Incentive Allocation is based on the New High Net Trading Profits of the portfolio. For the year ended December 31, 2012, the Incentive Allocation decreased by $31,172 or -100.0%, when compared to the corresponding period of 2011 due to the portfolio’s lack of profitability in 2012.
The following table illustrates the sector distribution of the Blended Strategies Portfolio’s investments in Master Funds as of December 31, 2012 based on the fair value of the underlying assets and liabilities in each master fund including both long and short positions. Positive percentages represent net assets whereas negative percentages represent a net liability.
| Agriculture / Softs | | | 1.9 | % |
| Base Metals | | | (15.8 | )% |
| Energy | | | (24.4 | )% |
| Equities | | | 47.6 | % |
| Foreign Exchange | | | 77.8 | % |
| Long Term / Intermediate Rates | | | 11.4 | % |
| Precious Metals | | | (1.5 | )% |
| Short Term Rates | | | 3.0 | % |
| | | 100.0 | % |
2011 Summary
For the year ended December 31, 2011, the Blended Strategies Portfolio experienced net trading losses of $22,435,127 attributable to the following sectors:
| | | | |
| Agriculture | | $ | (1,948,354 | ) |
| Energy | | | (6,409,509 | ) |
| Foreign exchange | | | (14,658,890 | ) |
| Interest rates | | | 10,774,483 | |
| Metals | | | 5,526,374 | |
| Softs | | | (14,221,003 | ) |
| Stock index | | | (1,498,228 | ) |
| | | $ | (22,435,127 | ) |
| Agriculture | | $ | (1,948,354 | ) |
| Energy | | | (6,409,509 | ) |
| Foreign exchange | | | (14,658,890 | ) |
| Interest rates | | | 10,774,483 | |
| Metals | | | 5,526,374 | |
| Softs | | | (14,221,003 | ) |
| Stock index | | | (1,498,228 | ) |
| | | $ | (22,435,127 | ) |
The portfolio posted a net loss for the year ended December 31, 2011 as profits recorded by discretionary portfolio managers were more than offset by losses in the systematic portion of the portfolio. The majority of the losses stemmed from foreign exchange as extreme daily volatility without lasting directional moves mired many of our systematic models. While the systematic portfolio held only moderate exposure to stock indices, the short-term volatility in the equity markets negatively impacted the portfolio and resulted in losses for the year. In foreign exchange, the largest losses resulted from trading the Australian dollar, New Zealand dollar, Japanese Yen and South African Rand as central bank interventions and Eurozone headlines generated tremendous volatility. Smaller losses resulted from trading in the energy and agricultural commodity markets. Both the systematic and discretionary portions of the portfolio recorded significant gains from trading interest rates, which offset a material portion of the Portfolio’s overall loss. The majority of the gains in interest rates resulted from discretionary trading in U.S., European and commodity driven markets. The portfolio recorded solid gains in metals as gold hit record highs during 2011, which also helped to offset some of the losses for the year.
Brokerage, Advisory and Sponsor Fees are calculated as a percentage of the Fund’s net asset value as of the end of each month and are affected by trading performance, interest income, subscriptions into and redemptions out of the Fund. Accordingly, the fluctuations in these amounts are directly correlated to the changes in net asset value which are discussed in detail herein.
For the year ended December 31, 2011, Brokerage Fees increased by $1,776,596 or 32.1%, Advisory Fees increased by $1,641,549 or 34.7% and Sponsor Fees increased by $820,776 or 34.7% in the Blended Strategies Portfolio over the corresponding period of the preceding year. These increases are all attributable to higher net assets of the portfolio early in the year resulting from subscriptions partially offset by redemptions later in the year and a net loss for the period. During the same period interest income decreased by $1,244,259 or -52.2%. Interest was earned on free cash at an average annualized yield of 0.43% for the year ended December 31, 2011 compared to 0.59% for the year ended December 31, 2010.
The Incentive Allocation is based on the New High Net Trading Profits of the portfolio. For the year ended December 31, 2011, the Incentive Allocation decreased by $1,564,231 or -98.0%, when compared to the corresponding period of 2010 due to the portfolio’s lack of profitability in 2011.
The following table illustrates the sector distribution of the Blended Strategies Portfolio’s investments in Master Funds as of December 31, 2011 based on the fair value of the underlying assets and liabilities in each master fund including both long and short positions. Positive percentages represent net assets whereas negative percentages represent a net liability.
| Agriculture | | | (17.9(17.9%) | %) |
| Energy | | | (19.6(19.6%) | %) |
| Foreign exchange | | | 47.947.9% | % |
| Interest rates | | | 49.149.1% | % |
| Metals | | | 12.012.0% | % |
| Softs | | | 23.623.6% | % |
| Stock index | | | 4.94.9% | % |
| | | | 100.0100.0% | % |
Systematic Strategies Portfolio 20102012 Summary
For 2010, the Blendedyear ended December 31, 2012, the Systematic Strategies Portfolio experienced net trading gainslosses of $18,158,796$1,429,257 attributable to the following sectors;sectors:
| Agriculture | | $ | 1,935,401 | |
| Energy | | | (3,469,667 | ) |
| Foreign exchange | | | 4,103,928 | |
| Interest rates | | | 12,312,474 | |
| Metals | | | 4,806,934 | |
| Softs | | | 966,816 | |
| Stock index | | | (2,497,090 | ) |
| | | $ | 18,158,796 | |
| Agriculture / Softs | | $ | (500,068 | ) |
| Base Metals | | | (1,533,146 | ) |
| Energy | | | (725,892 | ) |
| Equities | | | 1,415,516 | |
| Foreign Exchange | | | (1,516,962 | ) |
| Long Term / Intermediate Rates | | | 1,500,361 | |
| Precious Metals | | | (470,353 | ) |
| Short Term Rates | | | 401,287 | |
| | | $ | (1,429,257 | ) |
Through much of 2010 investors searched for greater clarity on the resilience of the economic recovery in the U.S. and Europe. While corporate balance sheets demonstrated remarkable strength, government balance sheets were cast into considerable doubt and unemployment remained high. Mid-term elections in the U.S., the expansion of the Federal Reserve’s balance sheet and cross-border tensions in the Eurozone regarding bailout packages for the European periphery, cast a spotlight on fiscal imbalances, while real solutions were deferred. In the end, 2010 closed much as it began – with high unemployment and looming debt burdens in the U.S. and Europe, and a range of economic data that seem to point toward a positive, but tepid recovery.
The macro cross-currents of 2010 presented periods of significant volatility that at times were challenging to both the systematic and discretionary programs. Thus, while trends emerged over the course of the year, such as higher commodity and equity prices and firm benchmark yields for much of the year, there were sharp reversals at points throughout the year particularly in January and May, and as bond yields bottomed in October. This environment made it difficult to run sustained, directional risk and as such the portfolio experienced volatility in the returns from each sector as the trends and reversals emerged throughout the year.
The interest rate sector was the most profitable for the Blended Strategies Portfolio as the European fiscal imbalances and central bank intervention dominated market moves globally. Performance in interest rates was slightly positive in the first quarter predominantly in the European markets offset by losses in the U.S. The second quarter realized consistent gains, led by the European fixed income sector, as investors sought safety and purchased global bonds leading yields to fall sharply throughout the quarter. The trend in positive performance continued into the third quarter with significant gains derived in August from the flight to quality capital movements which were offset by losses in September. The fourth quarter produced net losses as the portfolio was negatively impacted by trend reversals and subsequent short term volatility across the U.S. and European fixed income markets. Foreign exchange provided solid gains for the year primarily on the strength in the Euro and the Australian dollar and the significant sell off in the U.S. dollar versus most currencies leading up to the second round of quantitative easing. These gains were partially offset by losses on European cross currency positions. The first quarter produced modest gains generated most notably in European currencies as well as Australian and New Zealand dollars. The second quarter also resulted in modest gains driven by trading gains in the Euro when the portfolio took advantage of weakening in May. These gains were partially offset by losses in June as the portfolio recognized losses amid general U.S. dollar weakness. The positive performance continued into the third quarter as the portfolio was able to record notable gains on the strengthening Australian dollar as well as profits in trading the U.S. dollar as it weakened late in the quarter. The fourth quarter saw the portfolio post a loss marked by the U.S. dollar strengthening. Profits were recognized in commodities for the year most notably in the second half as commodity prices surged in general on the heels of the weakened U.S. dollar. Metals profits were led by the portfolio’s ability to capitalize as silver and gold reached historic highs. Long positions in agricultural markets including corn and the soy complex benefited the portfolio as well during the latter part of the year as these prices also surged. Modest gains were recorded in softs led by cotton which rallied on the heels of Chinese demand and in coffee, offset by losses recorded in sugar. Energy markets resulted in a loss for the year. Profits from falling natural gas prices and spread trading in energy products were overshadowed by negative performance from crude and heating oil for much of the year. The quarterly performance had mixed results, with a slightly positive performance in the first quarter amid the falling natural gas prices offset by larger losses in the second quarter as crude prices reversed during the quarter while trading in the third and fourth quarters generating smaller trading losses. Key reversals in January and May led toposted a net loss for the year in equities. Geographically positions in European equity markets contributed the largest losses.2012. The sharp reversal in global stock prices at the beginningmajority of the year led tolosses were recorded from trading in the commodity complex including metals, energy and agricultural commodities. The portfolio also recorded losses in foreign exchange, particularly from choppy trading conditions in the first quarter. The portfolio generated trading gains in March as equities rallied but these gains were not enough to offset theeuro with further losses from the beginningSwiss franc and Canadian dollar. The portfolio experienced profits in European and Asian fixed income futures as well as in European and U.S. stock index futures, which helped to offset a portion of the quarter. The second and third quarters also generated significantoverall losses as investors sold off equities and began purchasing global bonds, which resulted in declines in equity indices. The fourth quarter generated positive results as global equity indices rebounded through the end ofduring the year.
Brokerage, Advisory and Sponsor Fees are calculated as a percentage of the Fund’s Net Asset Valuenet asset value as of the end of each month and are affected by trading performance, interest income, subscriptions into and redemptions out of the Fund. Accordingly, the fluctuations in these amounts are directly correlated to the changes in net asset value, which are discussed in detail herein.
For the year ended December 31, 2010,2012, Brokerage Fees increaseddecreased by $1,532,492$485,018 or 38.4%-30.5%, Advisory Fees increaseddecreased by $1,287,390$362,394 or 37.4%-32.0% and Sponsor Fees increaseddecreased by $643,695$181,196 or 37.4%-32.0% in the BlendedSystematic Strategies Portfolio as compared toover the year ended December 31, 2009.corresponding period of the preceding year. These increasesdecreases are all attributable to higherlower net assets of the portfolio resulting from subscriptions offset by redemptions and a net gainloss for the period partially offset by redemptions.period. During the same period, interest income increaseddecreased by $1,011,683$130,653 or 73.8% predominantly due to the increase in net assets discussed above.-61.9%. Interest was earned on free cash at an average annualized yield of 0.59%0.26% for the year ended December 31, 20102012 compared to 0.60%0.43% for the year ended December 31, 2009.2011.
The Incentive Allocation is based on the New High Net Trading Profits of the portfolio. For the year ended December 31, 2010,2012, the Incentive Allocation increaseddecreased by $512,478,$11,821 or 47.3%-100.0%, when compared to the year ended December 31, 2009. This was the resultcorresponding period of a higher net gain before incentive allocation for the year ended December 31, 2010 compared2011 due to the year ended December 31, 2009.portfolio’s lack of profitability in 2012.
The following table illustrates the sector distribution of the BlendedSystematic Strategies Portfolio’s investments in Master Funds as of December 31, 20102012 based on the fair value of the underlying assets and liabilities in each master fund including both long and short positions. Positive percentages represent net assets whereas negative percentages represent a net liability.
| Agriculture / Softs | | | 20.76.6% | |
| Base Metals | | | (24.0)% | |
| Energy | | | 19.7(8.4% | % |
Foreign exchangeEquities | | | 4.481.0% | % |
Interest ratesForeign Exchange | | | 21.728.4% | % |
| Long Term / Intermediate Rates | | | 16.8% | |
| Precious Metals | | | 30.7(4.1)% | % |
SoftsShort Term Rates | | | 4.3 | % |
Stock index3.7% | | | (1.5 | %) |
| | | | 100.0100.0% | % |
Systematic Strategies Portfolio
2011 Summary
For the year ended December 31, 2011, the Systematic Strategies Portfolio experienced net trading losses of $10,609,014 attributable to the following sectors:
| Agriculture | | $ | (893,368 | ) |
| Energy | | | (1,865,737 | ) |
| Foreign exchange | | | (4,823,489 | ) |
| Interest rates | | | 1,655,476 | |
| Metals | | | 973,417 | |
| Softs | | | (438,612 | ) |
| Stock index | | | (5,216,701 | ) |
| | | $ | (10,609,014 | ) |
The largest losses stemmed from stock indices on the back of sharp reversals to the downside in March (following the Japanese Tsunami) and again in August (following the downgrade of the U.S. credit rating) as well as severe intra-month volatility throughout the year. Foreign exchange also produced losses as continuous sentiment shifts over Europe's debt crisis and U.S. growth forecasts as well as political squabbling led to oscillation between “risk on” and “risk off” market moves. Notable gains resulted from interest rate positions in the spring and summer as ongoing concerns in Europe and pledges from Fed Chairman Bernanke to keep rates low for an extended period led to a significant rally in bonds. Trading in metals also generated profits primarily on the back of all-time record prices of gold and silver. In energy markets, gains from natural gas positions late in the year were more than offset by crude and crude products, which were negatively affected by an abrupt sell-off in May and a reversal to the upside in October. Agricultural markets weighed on performance with December posting the largest loss amidst a weather related rally.
Brokerage, Advisory and Sponsor Fees are calculated as a percentage of the Fund’s net asset value as of the end of each month and are affected by trading performance, interest income, subscriptions into and redemptions out of the Fund. Accordingly, the fluctuations in these amounts are directly correlated to the changes in net asset value, which are discussed in detail herein.
For the year ended December 31, 2011, Brokerage Fees increased by $486,389 or 44.0%, Advisory Fees increased by $350,360 or 44.7% and Sponsor Fees increased by $175,178 or 44.7% in the Systematic Strategies Portfolio over the corresponding period of the preceding year. These increases are all attributable to higher net assets of the portfolio early in the year resulting from subscriptions, partially offset by redemptions later in the year and a net loss for the period. During the same period interest income decreased by $178,053 or -45.7%. Interest was earned on free cash at an average annualized yield of 0.43% for the year ended December 31, 2011 compared to 0.59% for the year ended December 31, 2010.
The Incentive Allocation is based on the New High Net Trading Profits of the portfolio. For the year ended December 31, 2011, the Incentive Allocation decreased by $360,559 or -96.8%, when compared to the corresponding period of 2010 due to the portfolio’s lack of profitability in 2011.
The following table illustrates the sector distribution of the Systematic Strategies Portfolio’s investments in Master Funds as of December 31, 2011 based on the fair value of the underlying assets and liabilities in each master fund including both long and short positions. Positive percentages represent net assets whereas negative percentages represent a net liability.
| Agriculture | | | (102.9(102.9%) | %) |
| Energy | | | 17.917.9% | % |
| Foreign exchange | | | 69.569.5% | % |
| Interest rates | | | 78.378.3% | % |
| Metals | | | 18.218.2% | % |
| Softs | | | 9.79.7% | % |
| Stock index | | | 9.39.3% | % |
| | | | 100.0 | % |
2010 Summary
For the year ended December 31, 2010, the Systematic Strategies Portfolio experienced net trading gains of $3,727,622 attributable to the following sectors;
| Agriculture | | $ | 303,818 | |
| Energy | | | (984,111 | ) |
| Foreign exchange | | | 1,315,447 | |
| Interest rates | | | 2,287,092 | |
| Metals | | | 1,252,602 | |
| Softs | | | 25,561 | |
| Stock index | | | (472,787 | ) |
| | | $ | 3,727,622 | |
The interest rate income sector was the most profitable as the European fiscal imbalances and accommodative monetary policy led to a rally in benchmark bonds during the second and third quarters. During the first quarter, the portfolio experienced gains from European fixed income positions partially offset by losses in U.S. and Asian fixed income. In the fourth quarter the portfolio posted losses amid volatile market conditions. Foreign exchange provided solid gains primarily in the second half of the year on strength in the Euro and Swiss franc and weakness in the U.S. dollar versus most currencies leading up to the second round of quantitative easing. During the first half of the year gains in commodity currencies, as they rallied versus the Euro, were overshadowed by losses late in the second quarter when the Euro strengthened versus the U.S. dollar and Swiss Franc resulting in a net loss to the portfolio. Trading in metals resulted in losses in the first half of the year led by steep declines in base metal prices. In the second half of the year, the portfolio posted significant gains in precious metals as economic growth concerns helped spur a rally in both silver and gold which reached historic highs. Profits were also recognized in the second half in base metals as prices rebounded driven by a more favorable outlook for industrial activity and increased demand from China. The portfolio posted gains in agriculture commodities as well as in soft commodities. The first half of the year generated losses in sugar, corn, wheat and soybeans but the portfolio was able to offset these losses with gains in the seconds half of the year as long positions in agricultural markets including corn, soybean oil, soybean meal, cotton and sugar benefited the portfolio. Energy markets netted a loss as profits from falling natural gas prices were overshadowed by negative performance in of crude and heating oil for much of the year. Key reversals in January and May led to a net loss for the year in equities. Geographically positions in European equity markets contributed the largest losses. The portfolio experienced early losses in the first quarter, predominantly in the European equity indices, partially offset with late first quarter gains in U.S. and Asian equity indices, but still resulted in a net loss for the quarter. The second quarter brought some volatile conditions in global equity indices and the portfolio posted a net loss for the quarter. The third quarter saw continued volatility with a late June equity market sell-off turning into a sharp rally in July only to see a sell off again in August as investors flocked to the safety of government securities which resulted in a loss to the portfolio for the quarter. Long positions in global stock indexes generated gains in the fourth quarter as U.S. markets rose amid positive third quarter corporate earnings reported in October. The portfolio was able to hold the gains despite volatile conditions with European and U.S. equity markets declining in November and then rebounding partially in December.
Brokerage, Advisory and Sponsor Fees are calculated as a percentage of the Fund’s Net Asset Value as of the end of each month and are affected by trading performance, interest income, subscriptions into and redemptions out of the Fund. Accordingly, the fluctuations in these amounts are directly correlated to the changes in net asset value which are discussed in detail herein.
For the year ended December 31, 2010, Brokerage Fees increased by $789,894 or 250.3%, Advisory Fees increased by $576,493 or 278.1% and Sponsor Fees increased by $288,247 or 278.1% in the Systematic Strategies Portfolio as compared to the year ended December 31, 2009. These increases are all attributable to higher net assets of the portfolio resulting from subscriptions and a net gain for the period partially offset by redemptions. During the same period interest income increased by $309,801 or 389.8% predominantly due to the increase in net assets discussed above. Interest was earned on free cash at an average annualized yield of 0.59% for the year ended December 31, 2010 compared to 0.60% for the year ended December 31, 2009.
The Incentive Allocation is based on the New High Net Trading Profits of the portfolio. For the year ended December 31, 2010, the Incentive Allocation increased by $217,951, or 141.1%, as compared to the year ended December 31, 2009. This was the result of a higher net gain before incentive allocation for the year ended December 31, 2010 as compared to the year ended December 31, 2009.
The following table illustrates the sector distribution of the Systematic Strategies Portfolio’s investments in Master Funds as of December 31, 2010 based on the fair value of the underlying assets and liabilities in each master fund including both long and short positions. Positive percentages represent net assets whereas negative percentages represent a net liability.
Agriculture100.0% | | | 21.3 | % |
Energy | | | 14.1 | % |
Foreign exchange | | | 19.3 | % |
Interest rates | | | (15.6 | %) |
Metals | | | 56.3 | % |
Softs | | | 7.6 | % |
Stock index | | | (3.0 | %) |
| | | 100.0 | % |
Variables Affecting Performance
The performance of each portfolio of the Fund is affected by net profitability resulting from the trading operations of the master funds, the fees charged by the Fund, and interest income earned on cash and cash equivalents. The master funds acquire and liquidate long and short positions in futures contracts, forward contracts, spot currency contracts and associated derivative instruments such as options and swaps. These instruments are carried at fair value, which is heavily influenced by a wide variety of factors including, but not limited to the level and volatility of exchange rates, interest rates, equity prices, and commodity prices as well as global macro political events. These factors generate market movements affecting the fair value of these instruments and in turn the net gains and losses allocated from the master funds.
Brokerage, advisory and sponsor fees are calculated based on percentage of the net asset value of each portfolio. Changes in the net assets of each portfolio resulting from subscriptions, redemptions, interest and trading profits allocated from the master funds can therefore have a material impact in the fee expense of each portfolio.
A portion of the assets of each portfolio is held in cash and cash equivalents. Changes in the net assets of each portfolio as well as changes in the interest rates earned on these investments can have a material impact on interest income earned.
A portion of the assets of each portfolio is generally held as cash or cash equivalents, which are used to margin the Fund’s investments. It is expected that the average margin the Fund will be required to post to support the Fund’s trading may range between 10% and 30% of the total assets of each portfolio, which will be segregated or secured by the futures brokers in accordance with the CEA and with CFTC regulations or be maintained on deposit with over-the-counter counterparties. In exceptional market conditions, this amount could increase. The master funds are subject to margin calls on a constant daily and intra-day basis, whether in connection with initiating new investment positions or as a result of changes in the value of current investment positions. These margin requirements are met through the posting of additional margin with the applicable futures broker or FX clearing broker, on an almost daily basis. The Manager generally expresses its margin requirements for the portfolios in terms of the aggregate of the margin requirements for the underlying strategies plus the net option premium costs for the underlying strategies. For the periodsyears ended December 31, 20112012 and December 31, 2010,2011, the margin requirements for the Blended Strategies Portfolio was 21.61%16.47% and 7.57%21.61%, respectively, and for the Systematic Strategies Portfolio was 18.83%17.00% and 7.73%18.83%, respectively.
Other than any potential market-imposed limitations on liquidity, the Fund’s assets are highly liquid and are expected to remain so. Market-imposed limitations, when they occur, can be due to limited open interest in certain futures markets or to daily price fluctuation limits, which are inherent in the Fund’s futures trading. Through December 31, 2011,2012, the Fund experienced no meaningful periods of illiquidity in any of the markets traded by the Manager on behalf of the Fund.
The Fund raises additional capital only through the sale of Units and capital is increased through trading profits (if any) and interest income. The Fund may borrow money from brokers or their affiliates and other lenders. Units may be offered for sale as of the beginning, and may be redeemed as of the end, of each month. The amount of capital raised for the Fund shouldis not expected to have a significant impact on its operations, as the Fund has no significant capital expenditure or working capital requirements other than for monies to pay trading losses, brokerage commissions, expenses, and expenses.to satisfy withdrawals.
The Fund participates in the speculative trading of commodity futures contracts, substantially all of which are subject to margin requirements. The minimum amount of margin required for each contract is set from time to time in response to various market factors by the respective exchanges. Further, the Fund’s brokers may require margin in excess of minimum exchange requirements. The Fund bears the risk of financial failure of the brokers through which it clears trades and maintains margin in respect of any such trades and of its counterparties for its foreign exchange and swap trades with whom it also maintains margin.
| | (iv) | Critical Accounting Policies |
Use of Estimates – The Fund’s financial statements have been prepared in conformity with U.S. generally accepted accounting principles (“U.S. GAAP”) and all amounts are stated in U.S. dollars. The preparation of the financial statements requires the Manager to make estimates and assumptions that affect the amounts reported in the financial statements and accompanying notes. Actual results could differ from those estimates. The Fund’s significant accounting policies are described in detail in Note 2 of the financial statements.
Fair Value Measurement - The Fund follows U.S. GAAP for fair value measurements, which defines fair value, establishes a framework for measuring fair value and requires certain disclosures about fair value measurements. U.S. GAAP uses a three-level hierarchy for fair value measurement based on the activeness of the market and the transparency and independence of inputs used in the valuation of an asset or liability as of the measurement date. The Fund reports the fair value of its investment-related assets and liabilities in accordance with the hierarchy established under U.S. GAAP.
The Fund records its investments in the Feeder Funds at fair value in accordance with U.S. GAAP. In determining its net asset value, each Feeder Fund records its investments in master funds at fair value in accordance with U.S. GAAP. The Fund records its proportionate share of the Feeder Funds’ investment income and loss, expenses, fees, and realized and unrealized gains and losses on a monthly basis. Purchases and sales of units in the Feeder Funds are recorded on a trade date basis.
The master funds record all their financial instruments at fair value, which is derived in accordance with U.S. GAAP. Unrealized gains and losses from these instruments are recorded based on changes in their fair value. Realized gains and losses are recorded when the positions are closed. All unrealized and realized gains and losses related to derivative financial instruments are included in net gain (loss) on investments in the master funds’ statements of operations.
Cash Assets - The Feeder Funds invest a portion of their excess liquidity in Cash Assets, an entity for which the Manager is also the sole investment advisor. The financial information of Cash Assets is included in the notes to the Financial Statements of the Feeder Funds within Item 8.
Income Taxes - No provision for income taxes has been made in the Fund’s financial statements, as each member is responsible for reporting income or loss based upon the member’s respective share of the Fund’s revenues and expenses for income tax purposes.
U.S. GAAP provides guidance for how uncertain tax positions should be recognized, measured, presented and disclosed in the financial statements. U.S. GAAP requires the evaluation of tax positions taken or expected to be taken in the course of preparing the Fund’s tax returns to determine whether the tax positions are “more-likely-than-not” of being sustained by the applicable tax authority. Tax positions not deemed to meet a more-likely-than-not threshold would be recorded as a tax expense in the current year. The Manager has evaluated the Fund’s tax positions and has concluded that there are no significant tax positions requiring recognition, measurement or disclosure in the financial statements. The Manager is not aware of any tax positions for which it is reasonably possible that the total amounts of unrecognized tax expense will change materially in the next twelve months.
| | (v) | Off-Balance Sheet Arrangements |
The Fund does not engage in off-balance sheet arrangements with other entities.
Item 7A: | Item 7A: | QUANTITATIVE AND QUALITATIVE DISCLOSURE ABOUT MARKET RISK |
TheNo disclosure is required hereunder as the Fund is a smaller Reporting Company,“smaller reporting company”, as defined by Rule 229.10(f)in Item 10(f)(1) and therefore this item is not applicable.of Regulation S-K.
Item 8: | Item 8: | FINANCIAL STATEMENTS AND SUPPLEMENTARY DATA |
| | Financial Statements |
| |
| | Graham Alternative Investment Fund I LLC |
| | Years Ended December 31, 20112012 and 20102011 |
| | with Report of Independent Registered Public Accounting Firm |
Report of Independent Registered Public Accounting Firm
To the AdvisorManager of
Graham Alternative Investment Fund I LLC
We have audited the accompanying statements of financial condition of Graham Alternative Investment Fund I LLC (the “Fund”), as of December 31, 20112012 and 2010,2011, and the related statements of operations, changes in members’ capital and cash flows for each of the two years in the period ended December 31, 2011.2012. These financial statements are the responsibility of the Fund’s management. Our responsibility is to express an opinion on these financial statements based on our audits.
We conducted our audits in accordance with the standards of the Public Company Accounting Oversight Board (United States). Those standards require that we plan and perform the audit to obtain reasonable assurance about whether the financial statements are free of material misstatement. We were not engaged to perform an audit of the Fund's internal control over financial reporting. Our audits included consideration of internal control over financial reporting as a basis for designing audit procedures that are appropriate in the circumstances, but not for the purpose of expressing an opinion on the effectiveness of the Fund's internal control over financial reporting. Accordingly, we express no such opinion. An audit also includes examining, on a test basis, evidence supporting the amounts and disclosures in the financial statements, assessing the accounting principles used and significant estimates made by management, and evaluating the overall financial statement presentation. We believe that our audits provide a reasonable basis for our opinion.
In our opinion, the financial statements referred to above present fairly, in all material respects, the financial position of Graham Alternative Investment Fund I LLC at December 31, 20112012 and 2010,2011, and the results of its operations, changes in its members’ capital and its cash flows for each of the two years in the period ended December 31, 2011,2012, in conformity with U.S. generally accepted accounting principles.
March 30, 2012
| /s/ Ernst & Young LLP |
| Stamford, CT |
|
| March 28, 2013 |
Graham Alternative Investment Fund I LLC
Statements of Financial Condition
| | | December 31, | |
| | | 2012 | | | 2011 | |
| | | | | | | |
| Assets | | | | | | |
| Investment in Graham Alternative Investment Trading LLC, at fair value | | $ | 167,871,994 | | | $ | 263,929,118 | |
| Investment in Graham Alternative Investment Trading II LLC, at fair value | | | 18,488,309 | | | | 45,955,612 | |
| Redemption receivable from Graham Alternative Investment Trading LLC | | | 14,897,527 | | | | 8,563,194 | |
| Redemption receivable from Graham Alternative Investment Trading II LLC | | | 6,924,115 | | | | 2,164,043 | |
| Total assets | | $ | 208,181,945 | | | $ | 320,611,967 | |
| | | | | | | | | |
| Liabilities and members’ capital | | | | | | | | |
| Liabilities: | | | | | | | | |
| Accrued redemptions | | $ | 21,821,642 | | | $ | 10,727,237 | |
| Total liabilities | | | 21,821,642 | | | | 10,727,237 | |
| | | | | | | | | |
| Members’ capital: | | | | | | | | |
| Blended Strategies Portfolio: | | | | | | | | |
| Class 0 Units (1,241,639.087 and 1,814,039.586 units issued and outstanding | | | | | | | | |
| at $114.88 and $123.17, respectively) | | | 142,637,622 | | | | 223,427,719 | |
| Class 2 Units (279,471.807 and 410,047.431 units issued and outstanding at | | | | | | | | |
| $90.29 and $98.77, respectively) | | | 25,234,372 | | | | 40,501,399 | |
| Total Blended Strategies Portfolio | | | 167,871,994 | | | | 263,929,118 | |
| | | | | | | | | |
| Systematic Strategies Portfolio: | | | | | | | | |
| Class 0 Units (101,445.837 and 322,756.427 units issued and outstanding at | | | | | | | | |
| $73.46 and $81.35, respectively) | | | 7,452,523 | | | | 26,254,798 | |
| Class 2 Units (161,427.944 and 255,073.907 units issued and outstanding at | | | | | | | | |
| $68.36 and $77.24, respectively) | | | 11,035,786 | | | | 19,700,814 | |
| Total Systematic Strategies Portfolio | | | 18,488,309 | | | | 45,955,612 | |
| Total members’ capital | | | 186,360,303 | | | | 309,884,730 | |
| Total liabilities and members’ capital | | $ | 208,181,945 | | | $ | 320,611,967 | |
See accompanying notes.
Graham Alternative Investment Fund I LLC
Statements of Financial Condition
| | | December 31, | |
| | | 2011 | | | 2010 | |
| | | | | | | |
| Assets | | | | | | |
| Investment in Graham Alternative Investment Trading LLC, at fair value | | $ | 263,929,118 | | | $ | 290,023,320 | |
| Investment in Graham Alternative Investment Trading II LLC, at fair value | | | 45,955,612 | | | | 48,442,149 | |
| Redemption receivable from Graham Alternative Investment Trading LLC | | | 8,563,194 | | | | 1,296,065 | |
| Redemption receivable from Graham Alternative Investment Trading II LLC | | | 2,164,043 | | | | 125,284 | |
| Total assets | | $ | 320,611,967 | | | $ | 339,886,818 | |
| | | | | | | | | |
| Liabilities and members’ capital | | | | | | | | |
| Liabilities: | | | | | | | | |
| Accrued redemptions | | $ | 10,727,237 | | | $ | 1,421,349 | |
| Total liabilities | | | 10,727,237 | | | | 1,421,349 | |
| | | | | | | | | |
| Members’ capital: | | | | | | | | |
| Blended Strategies Portfolio: | | | | | | | | |
| Class 0 Units (1,814,039.586 and 1,752,436.237 units issued and outstanding at $123.17 and $138.96, respectively) | | | 223,427,719 | | | | 243,511,752 | |
| Class 2 Units (410,047.431 and 409,129.824 units issued and outstanding at $98.77 and $113.68, respectively) | | | 40,501,399 | | | | 46,511,568 | |
| Total Blended Strategies Portfolio | | | 263,929,118 | | | | 290,023,320 | |
| | | | | | | | | |
| Systematic Strategies Portfolio: | | | | | | | | |
| Class 0 Units (322,756.427 and 274,960.438 units issued and outstanding at $81.35 and $102.92, respectively) | | | 26,254,798 | | | | 28,297,652 | |
| Class 2 Units (255,073.907 and 202,003.861 units issued and outstanding at $77.24 and $99.72, respectively) | | | 19,700,814 | | | | 20,144,497 | |
| Total Systematic Strategies Portfolio | | | 45,955,612 | | | | 48,442,149 | |
| Total members’ capital | | | 309,884,730 | | | | 338,465,469 | |
| Total liabilities and members’ capital | | $ | 320,611,967 | | | $ | 339,886,818 | |
See accompanying notes.
Graham Alternative Investment Fund I LLC
Statements of Operations
| | | Years ended December 31, | | | Years ended December 31, | |
| | | 2011 | | | 2010 | | | 2012 | | | 2011 | |
| Net (loss) gain allocated from investments in other funds: | | | | | | | |
| Net realized (loss) gain on investments | | $ | (23,558,747 | ) | | $ | 13,895,786 | | |
| Net (decrease) increase in unrealized appreciation on investments | | | (9,485,394 | ) | | | 7,990,632 | | |
| Net (loss) gain allocated from investments in other funds | | | (33,044,141 | ) | | | 21,886,418 | | |
| Net loss allocated from investments in other funds: | | | | | | | |
| Net realized loss on investments | | | $ | (7,785,811 | ) | | $ | (23,558,747 | ) |
| Net increase (decrease) in unrealized appreciation on investments | | | | 1,818,049 | | | | (9,485,394 | ) |
| Net loss allocated from investments in other funds | | | | (5,967,762 | ) | | | (33,044,141 | ) |
| | | | | | | | | | | | | | | | | |
| Net investment loss allocated from investment in other funds: | | | | | | | | | | | | | | | | |
| Investment income: | | | | | | | | | | | | | | | | |
| Interest income | | | 1,349,325 | | | | 2,771,637 | | | | 550,340 | | | | 1,349,325 | |
| | | | | | | | | | | | | | | | | |
| Expenses: | | | | | | | | | | | | | | | | |
| Brokerage fees | | | 8,895,975 | | | | 6,632,990 | | | | 6,409,565 | | | | 8,895,975 | |
| Advisory fees | | | 7,502,569 | | | | 5,510,660 | | | | 5,396,125 | | | | 7,502,569 | |
| Sponsor fees | | | 3,751,285 | | | | 2,755,331 | | | | 2,698,062 | | | | 3,751,285 | |
| Incentive allocation | | | 42,993 | | | | 1,967,783 | | | | – | | | | 42,993 | |
| Interest and other | | | 133,754 | | | | 63,774 | | | | 72,228 | | | | 133,754 | |
| Total expenses | | | 20,326,576 | | | | 16,930,538 | | | | 14,575,980 | | | | 20,326,576 | |
| Net investment loss allocated from investments in other funds | | | (18,977,251 | ) | | | (14,158,901 | ) | | | (14,025,640 | ) | | | (18,977,251 | ) |
| | | | | | | | | | | | | | | | | |
| Net (loss) income | | $ | (52,021,392 | ) | | $ | 7,727,517 | | |
| Net loss | | | $ | (19,993,402 | ) | | $ | (52,021,392 | ) |
See accompanying notes.
Graham Alternative Investment Fund I LLC
Statements of Changes in Members’ Capital
Years ended December 31, 20112012 and 20102011
| | | Blended Strategies Portfolio | | | Blended Strategies Portfolio | |
| | | Class 0 Units | | | Class 2 Units | | | Total | | | Class 0 Units | | | Class 2 Units | | | Total | |
| | | Units | | | Capital | | | Units | | | Capital | | | Blended Strategies Portfolio | | | Units | | | Capital | | | Units | | | Capital | | | Blended Strategies Portfolio | |
| | | | | | | | | | | | | | | | | | | | | | | | | | | | | | | |
| Members’ capital, December 31, 2009 | | | 1,134,943.426 | | | $ | 153,850,323 | | | | 300,723.739 | | | $ | 33,900,271 | | | $ | 187,750,594 | | |
| Subscriptions | | | 727,290.307 | | | | 98,736,853 | | | | 147,810.091 | | | | 16,536,160 | | | | 115,273,013 | | |
| Redemptions | | | (109,797.496 | ) | | | (14,886,199 | ) | | | (39,404.006 | ) | | | (4,385,647 | ) | | | (19,271,846 | ) | |
| Net income | | | – | | | | 5,810,775 | | | | – | | | | 460,784 | | | | 6,271,559 | | |
| Members’ capital, December 31, 2010 | | | 1,752,436.237 | | | $ | 243,511,752 | | | | 409,129.824 | | | $ | 46,511,568 | | | $ | 290,023,320 | | | | 1,752,436.237 | | | $ | 243,511,752 | | | | 409,129.824 | | | $ | 46,511,568 | | | $ | 290,023,320 | |
| Subscriptions | | | 565,032.245 | | | | 77,766,983 | | | | 85,293.740 | | | | 9,483,865 | | | | 87,250,848 | | | | 565,032.245 | | | | 77,766,983 | | | | 85,293.740 | | | | 9,483,865 | | | | 87,250,848 | |
| Redemptions | | | (503,428.896 | ) | | | (66,038,036 | ) | | | (84,376.133 | ) | | | (9,012,656 | ) | | | (75,050,692 | ) | | | (503,428.896 | ) | | | (66,038,036 | ) | | | (84,376.133 | ) | | | (9,012,656 | ) | | | (75,050,692 | ) |
| Net loss | | | – | | | | (31,812,980 | ) | | | – | | | | (6,481,378 | ) | | | (38,294,358 | ) | | | – | | | | (31,812,980 | ) | | | – | | | | (6,481,378 | ) | | | (38,294,358 | ) |
| Members’ capital, December 31, 2011 | | | 1,814,039.586 | | | $ | 223,427,719 | | | | 410,047.431 | | | $ | 40,501,399 | | | $ | 263,929,118 | | | | 1,814,039.586 | | | $ | 223,427,719 | | | | 410,047.431 | | | $ | 40,501,399 | | | $ | 263,929,118 | |
| Subscriptions | | | | 60,627.102 | | | | 7,385,929 | | | | 31,890.491 | | | | 3,078,540 | | | | 10,464,469 | |
| Redemptions | | | | (633,027.601 | ) | | | (74,771,511 | ) | | | (162,466.115 | ) | | | (15,391,230 | ) | | | (90,162,741 | ) |
| Net loss | | | | – | | | | (13,404,515 | ) | | | – | | | | (2,954,337 | ) | | | (16,358,852 | ) |
| Members’ capital, December 31, 2012 | | | | 1,241,639.087 | | | $ | 142,637,622 | | | | 279,471.807 | | | $ | 25,234,372 | | | $ | 167,871,994 | |
See accompanying notes.
Graham Alternative Investment Fund I LLC
Statements of Changes in Members’ Capital (continued)
Years ended December 31, 20112012 and 20102011
| | | | Systematic Strategies Portfolio | | | | | |
| | | | Class 0 Units | | | | Class 2 Units | | | | | | | | | |
| | | | | | | | | | | | | | | | | | | | Total Systematic | | | | | |
| | | | | | | | | | | | | | | | | | | | Strategies | | | | Total Members’ | |
| | | | Units | | | | Capital | | | | Units | | | | Capital | | | | Portfolio | | | | Capital | |
| | | | | | | | | | | | | | | | | | | | | | | | | |
| Members’ capital, December 31, 2009 | | | 180,564.957 | | | $ | 18,162,877 | | | | 119,035.753 | | | $ | 11,790,850 | | | $ | 29,953,727 | | | $ | 217,704,321 | |
| Subscriptions | | | 111,304.434 | | | | 10,807,501 | | | | 96,254.791 | | | | 9,152,856 | | | | 19,960,357 | | | | 135,233,370 | |
| Redemptions | | | (16,908.953 | ) | | | (1,672,062 | ) | | | (13,286.683 | ) | | | (1,255,831 | ) | | | (2,927,893 | ) | | | (22,199,739 | ) |
| Net income | | | – | | | | 999,336 | | | | – | | | | 456,622 | | | | 1,455,958 | | | | 7,727,517 | |
| Members’ capital, December 31, 2010 | | | 274,960.438 | | | $ | 28,297,652 | | | | 202,003.861 | | | $ | 20,144,497 | | | $ | 48,442,149 | | | $ | 338,465,469 | |
| Subscriptions | | | 149,857.518 | | | | 15,006,260 | | | | 95,481.068 | | | | 9,164,658 | | | | 24,170,918 | | | | 111,421,766 | |
| Redemptions | | | (102,061.529 | ) | | | (9,200,929 | ) | | | (42,411.022 | ) | | | (3,729,492 | ) | | | (12,930,421 | ) | | | (87,981,113 | ) |
| Net loss | | | – | | | | (7,848,185 | ) | | | – | | | | (5,878,849 | ) | | | (13,727,034 | ) | | | (52,021,392 | ) |
| Members’ capital, December 31, 2011 | | | 322,756.427 | | | $ | 26,254,798 | | | | 255,073.907 | | | $ | 19,700,814 | | | $ | 45,955,612 | | | $ | 309,884,730 | |
| | | Systematic Strategies Portfolio | | | | |
| | | Class 0 Units | | | Class 2 Units | | | Total | | | | |
| | | Units | | | Capital | | | Units | | | Capital | | | Systematic Strategies Portfolio | | | Total Members’ Capital | |
| | | | | | | | | | | | | | | | | | | |
| Members’ capital, December 31, 2010 | | | 274,960.438 | | | $ | 28,297,652 | | | | 202,003.861 | | | $ | 20,144,497 | | | $ | 48,442,149 | | | $ | 338,465,469 | |
| Subscriptions | | | 149,857.518 | | | | 15,006,260 | | | | 95,481.068 | | | | 9,164,658 | | | | 24,170,918 | | | | 111,421,766 | |
| Redemptions | | | (102,061.529 | ) | | | (9,200,929 | ) | | | (42,411.022 | ) | | | (3,729,492 | ) | | | (12,930,421 | ) | | | (87,981,113 | ) |
| Net loss | | | – | | | | (7,848,185 | ) | | | – | | | | (5,878,849 | ) | | | (13,727,034 | ) | | | (52,021,392 | ) |
| Members’ capital, December 31, 2011 | | | 322,756.427 | | | $ | 26,254,798 | | | | 255,073.907 | | | $ | 19,700,814 | | | $ | 45,955,612 | | | $ | 309,884,730 | |
| Subscriptions | | | 7,552.122 | | | | 611,888 | | | | 1,409.257 | | | | 105,000 | | | | 716,888 | | | | 11,181,357 | |
| Redemptions | | | (228,862.712 | ) | | | (17,661,117 | ) | | | (95,055.220 | ) | | | (6,888,524 | ) | | | (24,549,641 | ) | | | (114,712,382 | ) |
| Net loss | | | – | | | | (1,753,046 | ) | | | – | | | | (1,881,504 | ) | | | (3,634,550 | ) | | | (19,993,402 | ) |
| Members’ capital, December 31, 2012 | | | 101,445.837 | | | $ | 7,452,523 | | | | 161,427.944 | | | $ | 11,035,786 | | | $ | 18,488,309 | | | $ | 186,360,303 | |
See accompanying notes.
Graham Alternative Investment Fund I LLC
Statements of Cash Flows
| | | Years ended December 31, | | | Years Ended December 31, | |
| | | 2011 | | | 2010 | | | 2012 | | | 2011 | |
| Cash flows used in operating activities | | | | | | | |
| Net (loss) income | | $ | (52,021,392 | ) | | $ | 7,727,517 | | |
| Adjustments to reconcile net (loss) income to net cash used in operating activities: | | | | | | | | | |
| Net loss (income) allocated from investment in Graham Alternative Investment Trading LLC | | | 38,294,358 | | | | (6,271,559 | ) | |
| Net loss (income) allocated from investment in Graham Alternative Investment Trading II LLC | | | 13,727,034 | | | | (1,455,958 | ) | |
| Cash flows provided by (used in) operating activities | | | | | | | |
| Net loss | | | $ | (19,993,402 | ) | | $ | (52,021,392 | ) |
| Adjustments to reconcile net loss to net cash provided by (used in) operating activities: | | | | | | | | | |
| Net loss allocated from investment in Graham Alternative Investment Trading LLC | | | | 16,358,852 | | | | 38,294,358 | |
| Net loss allocated from investment in Graham Alternative Investment Trading II LLC | | | | 3,634,550 | | | | 13,727,034 | |
| Proceeds from sale of investments in Graham Alternative Investment Trading LLC | | | 67,783,563 | | | | 18,368,558 | | | | 83,828,408 | | | | 67,783,563 | |
| Proceeds from sale of investments in Graham Alternative Investment Trading II LLC | | | 10,891,662 | | | | 2,802,609 | | | | 19,789,569 | | | | 10,891,662 | |
| Investments in Graham Alternative Investment Trading LLC | | | (87,250,848 | ) | | | (115,273,013 | ) | | | (10,464,469 | ) | | | (87,250,848 | ) |
| Investments in Graham Alternative Investment Trading II LLC | | | (24,170,918 | ) | | | (19,960,357 | ) | | | (716,888 | ) | | | (24,170,918 | ) |
| Net cash used in operating activities | | | (32,746,541 | ) | | | (114,062,203 | ) | |
| Net cash provided by (used in) operating activities | | | | 92,436,620 | | | | (32,746,541 | ) |
| | | | | | | | | | | | | | | | | |
| Cash flows provided by financing activities | | | | | | | | | |
| Cash flows (used in) provided by financing activities | | | | | | | | | |
| Subscriptions | | | 111,421,766 | | | | 135,233,370 | | | | 11,181,357 | | | | 111,421,766 | |
| Redemptions | | | (78,675,225 | ) | | | (21,171,167 | ) | | | (103,617,977 | ) | | | (78,675,225 | ) |
| Net cash provided by financing activities | | | 32,746,541 | | | | 114,062,203 | | |
| Net cash (used in) provided by financing activities | | | | (92,436,620 | ) | | | 32,746,541 | |
| | | | | | | | | | | | | | | | | |
| Net change in cash and cash equivalents | | | – | | | | – | | | | – | | | | – | |
| | | | | | | | | | | | | | | | | |
| Cash and cash equivalents, beginning of year | | | – | | | | – | | | | – | | | | – | |
| Cash and cash equivalents, end of year | | $ | – | | | $ | – | | | $ | – | | | $ | – | |
See accompanying notes.
Graham Alternative Investment Fund I LLC
Notes to Financial Statements
December 31, 2011
1. | 1. | Organization and Business |
Graham Alternative Investment Fund I LLC (the “Fund”) was formed on May 16, 2006, commenced operations on August 1, 2006 and is organized as a Delaware Limited Liability Company (“LLC”). The Fund offers investors Class 0 and Class 2 shares of a Blended Strategies Portfolio, and Class 0 and Class 2 shares of a Systematic Strategies Portfolio. The Fund invests all of its Blended Strategies Portfolio assets dedicated to trading in Graham Alternative Investment Trading LLC (“GAIT”), a Delaware LLC which was formed on May 16, 2006 and commenced operations on August 1, 2006. The Fund invests all of its Systematic Strategies Portfolio assets dedicated to trading in Graham Alternative Investment Trading II LLC (“GAIT II”), a Delaware LLC which was formed on July 16, 2008 and commenced operations on January 4, 2009. GAIT and GAIT II (collectively “the GAIT Funds”) invest in various master trading vehicles (“Master Funds”), all of which are managed by Graham Capital Management, L.P. (the “Advisor” or “Manager”). The Manager is the manager and the sole investment advisor of the GAIT Funds and the Fund. The Manager is registered as a Commodity Pool Operator and Commodity Trading Advisor with the Commodity Futures Trading Commission and is a member of the National Futures Association. The Manager is also registered as a Registered Investment Advisor with the Securities and Exchange Commission. The Fund is registered as a smaller reporting company under the Securities Exchange Act of 1934.
The investment objective of the Fund is to achieve long-term capital appreciation through professionally managed trading in both U.S. and foreign markets primarily in futures contracts, forwards contracts, spot currency contracts, and associated derivative instruments, such as options and swaps, through its investments in the GAIT Funds, which in turn invest in various Master Funds. The Master Funds seek to profit from opportunities in the global financial markets, including interest rate futures, foreign exchange, global stock indices and energy, metals and agricultural futures, as professionally managed multi-strategy investment vehicles. Each of the investment programs consists of multiple trading strategies of the Manager, which the Manager has combined in an effort to diversify the Fund’s investment exposure and to make the Fund’s performance returns less volatile and more consistently profitable.
In addition to trading in the Interbank market for foreign exchange, the Manager currently executes orders on all the major U.S. futures exchanges and may also trade on, but is not limited to, the Bolsa de Mercadorias and Futuros (“BMF”), Borsa Italiana Idem (“IML”), the Eurex Exchange (“Eurex”), , the Hong Kong Exchanges and Clearing Ltd. (“HKEX”), the Intercontinental Exchange (“ICE”), the London Metal Exchange (“LME”), the Montreal Exchange (“ME”), the Mercado de Futuros Financieros (“MEFF”), the NYMEX Euronext (“Euronext”), the Osaka Securities Exchange (“OSE”), the Singapore Exchange (“SGX”), the South African Exchange (“SAFEX”), the Sydney Futures Exchange Ltd. (“SFE”), the Tokyo Commodity Exchange (“TOCOM”), the Tokyo Financial Exchange (“TFX”), and the Tokyo Stock Exchange (“TSE”).
SEI Global Services, Inc. (“SEI”) is the Fund’s independent administrator and transfer agent. SEI is responsible for certain matters pertaining to the administration of the Fund.
The Fund will terminate on December 31, 2050 or at an earlier date if certain conditions occur as outlined in the Limited Liability Company Agreement (“LLC Agreement”).
The performance of the Fund is directly affected by the performance of the GAIT Funds; therefore these financial statements should be read in conjunction with the attached financial statements of the GAIT Funds.
Graham Alternative Investment Fund I LLC
Notes to Financial Statements (continued)
1. Organization and Business (continued)
Duties of the Manager
Subject to the terms and conditions of the LLC Agreement, the Manager has complete and exclusive responsibility for managing and administering the affairs of the Fund and for directing the investment and reinvestment of the assets of the Fund and the GAIT Funds.
2. | 2. | Summary of Significant Accounting Policies |
These financial statements have been prepared in conformity with U.S. generally accepted accounting principles (“U.S. GAAP”) and all amounts are stated in U.S. dollars. The preparation of these financial statements requires the Manager to make estimates and assumptions that affect the amounts reported in the financial statements and accompanying notes. Actual results could differ from those estimates.
Graham Alternative Investment Fund I LLC
Notes to Financial Statements (continued)
| 2. | Summary of Significant Accounting Policies (continued) |
Investments in Graham Alternative Investment Trading LLC and Graham Alternative Investment Trading II LLC
The Fund records its investments in the GAIT Funds at fair value based upon the Fund’s proportionate share of the GAIT Funds’ reported net asset value in accordance with U.S. GAAP. In determining its net asset value, the GAIT Funds record their investments in Master Funds at fair value based upon the GAIT Funds’ proportionate share of the Master Funds’ reported net asset value. The Fund records its proportionate share of the GAIT Funds’ investment income and loss, expenses, fees, and realized and unrealized gains and losses on a monthly basis and includes them in the statements of operations. Purchases and sales of units in the GAIT Funds are recorded on a trade date basis. The accounting policies of the GAIT Funds are described in their attached respective financial statements.
Each of the GAIT Funds charges its investors, including the Fund, an advisory fee, brokerage fee, sponsor fee and incentive allocation, all of which are described in detail in Note 4. The Fund does not charge any additional fees; however each investor in the Fund indirectly bears their portion of the advisory fee, brokerage fee, sponsor fee and incentive allocation charged by the GAIT Funds.
At December 31, 20112012 and December 31, 2010,2011, the Fund owned 63.27% and 64.92%63.27%, respectively of GAIT, and 66.27%56.47% and 69.42%66.27%, respectively of GAIT II.
Fair Value
The fair value of the assets and liabilities of the Fund and the GAIT and GAIT II,Funds, which qualify as financial instruments under U.S. GAAP, approximates the carrying amounts presented in the statements of financial condition. Changes in these carrying amounts are included in the statements of operations.
The Fund follows U.S. GAAP for fair value measurements, which defines fair value, establishes a framework for measuring fair value, and requires certain disclosures about fair value measurements. The Fund reports the fair value of its investment related assets and liabilities in accordance with the hierarchy established under U.S. GAAP. U.S. GAAP uses a three-level hierarchy for fair value measurement based on the activeness of the market and the transparency and independence of inputs used in the valuation of an asset or liability as of the measurement date.
Graham Alternative Investment Fund I LLC
Notes to Financial Statements (continued)
2. Summary of Significant Accounting Policies (continued)
Fair Value (continued)
The fair value hierarchy categorizes asset and liability positions into one of three levels, as summarized below, based on the inputs and assumptions used in deriving fair value.
| | · | Level 1 inputs are unadjusted closing or settlement prices for such assets or liabilities as published by the primary exchange upon which they are traded. |
| | · | Level 2 inputs include quoted prices for similar assets and liabilities obtained from independent brokers and/or market makers in each security. With respect to the Fund’s investments in the GAIT Funds, Level 2 inputs include the net asset value of the underlying fund in which it holds an investment. |
| | · | Level 3 inputs are those which are considered unobservable and are significant in arriving at fair value. |
Graham Alternative Investment Fund reports the fair value of its investment related assets and liabilities in accordance with the hierarchy established under U.S. GAAP. I LLC
Notes to Financial Statements (continued)
| 2. | Summary of Significant Accounting Policies (continued) |
Fair Value (continued)
In accordance with this hierarchy, the Fund’s investments in the GAIT Funds have been classified as a Level 2 valuation. There were no Level 3 assets or liabilities held at any point during the years ended December 31, 2012 or 2011 and 2010 by the Fund, the GAIT Funds, or the Master Funds, and there were no transfers between levels during those years. Transfers between levels, if any, are recognized on the actual date of the event or change in circumstances that cause the transfer.
Recent Accounting Pronouncements
In May 2011, the Financial Accounting Standards Board (“FASB”) issued Accounting Standards Update No. 2011-04, Amendments to Achieve Common Fair Value Measurement and Disclosure Requirements in U.S. GAAP and International Financial Reporting Standards (“IFRS”) (“ASU No. 2011-04”). ASU No. 2011-04 includes common requirements for measurement of and disclosure about fair value between U.S. GAAP and IFRS. ASU No. 2011-04 will require reporting entities to disclose the following information for fair value measurements categorized within Level 3 of the fair value hierarchy: quantitative information about the unobservable inputs used in the fair value measurement, the valuation process used by the reporting entity and a narrative description of the sensitivity of the fair value measurement to changes in unobservable inputs and the interrelationships between those unobservable inputs. The disclosure is effective for annual reporting periods beginning on or after December 15, 2011 and is to be applied prospectively.
Indemnifications
In the normal course of business, the Master Funds, the GAIT Funds, GCA,Graham Cash Assets LLC (“Cash Assets”), and the Fund enter into contracts that contain a variety of indemnifications. Such contracts may include those by GCACash Assets and the Master Funds with their brokers and trading counterparties. The Fund’s maximum exposure under these arrangements is unknown; however, the Fund has not had prior claims or losses with respect to such indemnifications and considers the risk of loss to be remote.
Certain prior year amounts have been reclassified to conform with the current year presentation.
Graham Alternative Investment Fund I LLC
Notes to Financial Statements (continued)
3. Capital Accounts
The Fund offers Class 0 Units and Class 2 Units (collectively the “Units”) in both Blended and Systematic Strategies Portfolios. The Fund may issue additional Classes in the future subject to different fees, expenses or other terms, or to invest in other investment programs or combinations of investment programs managed by the Manager.
A separate Capital Account is maintained for each Member with respect to each member’s Class of Units. The initial balance of each Member’s Capital Account is equal to the initial contribution tocontributionto the Fund by such Member with respect to the Class to which such Capital Account relates. Each Member’s Capital Account is increased by any additional subscription, and decreased by any redemption by such Member of Units of such Class to which the Capital Account relates. All income and expenses of the Fund are allocated among the Members’ Capital Accounts in proportion to the balance that each Capital Account bears to the balance of all Capital Accounts as of the beginning of such fiscal period.
Subscriptions
Units may be purchased at a price equal to the Net Asset Value per Unit of the relevant Class as of the immediately preceding Valuation Day as defined in the LLC Agreement. The minimum initial subscription from each investor in each Class is $50,000. Members may subscribe for additional Units in a minimum amount of not less than $5,000.
Units are available for subscription as of the first business day of each month upon written notice of at least three business days prior to the last business day of the preceding month.
Graham Alternative Investment Fund I LLC
Notes to Financial Statements (continued)
| 3. | Capital Accounts (continued) |
Redemption of Units
Units are not subject to any minimum holding period. Members may redeem Units at the Net Asset Value thereof as of each Valuation Day, as defined in the LLC Agreement, upon not less than three business days’ prior written notice to the administrator. A partial redemption request for an amount less than $10,000 will not be accepted, nor will a redemption request be accepted to the extent that it would result in an investor owning less than $25,000. The redemption proceeds will normally be remitted within 15 days after the Valuation Day, without interest for the period from the Valuation Day to the payment date.
Redemption Fees
Class 2 Units are subject to a redemption fee equal to 2% of their Net Asset Value if redeemed within six months from their subscription date and a redemption fee equal to 1% of their Net Asset Value if redeemed more than six and less than twelve months from their subscription date. Class 0 Units are not subject to a redemption fee. Redemption fees are payable to the Manager upon redemption of Units from the proceeds of such redemption. Redemption fees of $13,325$9,024 and $17,309$13,325 were paid to the Manager for the years ended December 31, 20112012 and 2010,2011, respectively, and are included as redemptions in the statements of changes in members’ capital.
Graham Alternative Investment Fund I LLC
Notes to Financial Statements (continued)
4. | 4. | Fees and Related Party Transactions |
Advisory Fees
Each Class of the GAIT Funds other than Class M pays the Manager an advisory fee (the “Advisory Fee”) at an aggregate annual rate equal to 2% of the Net Asset Value of such Class. The Advisory Fee is payable monthly in arrears calculated as of the last business day of each month and any other date the Manager may permit, in its sole and absolute discretion, as of whichofwhich any subscription or redemption is effected with respect to Units of such Class during the month.
Sponsor Fees
Each Class of the GAIT Funds other than Class M pays the Manager a sponsor fee (the “Sponsor Fee”) at an annual rate of 1% of its Net Asset Value, payable monthly in arrears, determined in the same manner as the Advisory Fee.
Incentive Allocation
At the end of each calendar quarter, the Manager of the GAIT Funds will receive a special allocation of net profits (the “Incentive Allocation”) in an amount equal to 20% of the New High Net Trading Profits of each Class of the GAIT Funds, as defined in the LLC Agreement. The Incentive Allocation is also accrued and allocable on the date of redemption with respect to any Units that are redeemed prior to the end of a calendar quarter. Additionally, any loss carryforward attributable to any class of the GAIT Funds shall be proportionately reduced, effective as of the date of any redemption of any Units of such class, by multiplying the loss carryforward by the ratio that the amount of assets redeemed from such class bears to the net assets of such class immediately prior to such redemption. The loss carryforward of a class must be recouped before any subsequent Incentive Allocation can be made to the Manager.
Graham Alternative Investment Fund I LLC
Notes to Financial Statements (continued)
| 4. | Fees and Related Party Transactions (continued) |
Brokerage Fees
Each Class of the GAIT Funds other than Class M pays the Manager a brokerage fee (the “Brokerage Fee”) at the annual rate specified in the table below. This Brokerage Fee is payable monthly in arrears and calculated as of the last business day of each month in the same manner as the Advisory Fee.
| Class | Annual Rate |
| Class 0 | 2% |
| Class 2 | 4% |
In consideration of the Brokerage Fee, the Manager bears all of the GAIT Funds’ trading commissions (including exchange, clearing and regulatory fees relating to its trades), routine legal expenses, internal and external accounting, audit and tax preparation expenses, fees and expenses of an external or internal administrator, and expenses and costs of printing and mailing reports and notices, together with the costs incurred in connection with the organization of the GAIT Funds and the Fund and the continuous offering of Units. To the extent the GAIT Funds are allocated any of these expenses from the Master Funds in which they invest, the Manager will reimburse the GAIT Funds for those amounts. These reimbursements are included in commission reimbursements in the GAIT Funds’ statements of operations and managing member allocation. As a result, there is no impact to the Fund’s statement of operations.
Any portion of any of the above fees, including the Incentive Allocation, may be paid by the Manager to third parties as compensation for selling activities in connection with the Fund.
Graham Alternative Investment Fund I LLC
Notes to Financial Statements (continued)
No provision for income taxes has been made in the accompanying financial statements, as members are individually responsible for reporting income or loss based upon their respective share of the Fund’s revenues and expenses for income tax purposes.
U.S. GAAP provides guidance for how uncertain tax positions should be recognized, measured, presented and disclosed in the financial statements. U.S. GAAP requires the evaluation of tax positions taken or expected to be taken in the course of preparing the Fund’s tax returns to determine whether the tax positions are “more-likely-than-not” of being sustained by the applicable tax authority. Tax positions not deemed to meet a more-likely-than-not threshold would be recorded as a tax expense in the current year. The Manager has evaluated the Fund’s tax positions and has concluded that there are no significant tax positions requiring recognition, measurement or disclosure in the financial statements. The Manager is not aware of any tax positions for which it is reasonably possible that the total amounts of unrecognized tax expense will change materially in the next twelve months. Tax years which are considered open by the relevant jurisdiction are subject to potential examination.
Graham Alternative Investment Fund I LLC
6.Notes to Financial Statements (continued)
The following is the per Unit operating performance calculation for the years ended December 31, 20112012 and 2010:2011:
| | | Blended Strategies Portfolio | | | Systematic Strategies Portfolio | |
| | | Class 0 | | | Class 2 | | | Class 0 | | | Class 2 | |
| Per share operating performance | | | | | | | | | | | | |
| Net asset value per unit, December 31, 2009 | | $ | 135.56 | | | $ | 112.73 | | | $ | 100.59 | | | $ | 99.05 | |
| Net income: | | | | | | | | | | | | | | | | |
| Net investment loss | | | (6.92 | ) | | | (6.34 | ) | | | (2.62 | ) | | | (1.49 | ) |
| Net gain on investments | | | 10.32 | | | | 7.29 | | | | 4.95 | | | | 2.16 | |
| Net income | | | 3.40 | | | | 0.95 | | | | 2.33 | | | | 0.67 | |
| Net asset value per unit, December 31, 2010 | | $ | 138.96 | | | $ | 113.68 | | | $ | 102.92 | | | $ | 99.72 | |
| | | | | | | | | | | | | | | | | |
| | | | | | | | | | | | | | | | | |
| Net asset value per unit, December 31, 2010 | | $ | 138.96 | | | $ | 113.68 | | | $ | 102.92 | | | $ | 99.72 | |
| Net loss: | | | | | | | | | | | | | | | | |
| Net investment loss | | | (5.53 | ) | | | (6.66 | ) | | | (4.40 | ) | | | (6.03 | ) |
| Net loss on investments | | | (10.26 | ) | | | (8.25 | ) | | | (17.17 | ) | | | (16.45 | ) |
| Net loss | | | (15.79 | ) | | | (14.91 | ) | | | (21.57 | ) | | | (22.48 | ) |
| Net asset value per unit, December 31, 2011 | | $ | 123.17 | | | $ | 98.77 | | | $ | 81.35 | | | $ | 77.24 | |
Graham Alternative Investment Fund I LLC
Notes to Financial Statements (continued)
6. Financial Highlights (continued)| | | Blended Strategies Portfolio | | | Systematic Strategies Portfolio | |
| | | Class 0 | | | Class 2 | | | Class 0 | | | Class 2 | |
| Per unit operating performance | | | | | | | | | | | | |
| Net asset value per unit, December 31, 2010 | | $ | 138.96 | | | $ | 113.68 | | | $ | 102.92 | | | $ | 99.72 | |
| Net loss: | | | | | | | | | | | | | | | | |
| Net investment loss | | | (5.53 | ) | | | (6.66 | ) | | | (4.40 | ) | | | (6.03 | ) |
| Net loss on investments | | | (10.26 | ) | | | (8.25 | ) | | | (17.17 | ) | | | (16.45 | ) |
| Net loss | | | (15.79 | ) | | | (14.91 | ) | | | (21.57 | ) | | | (22.48 | ) |
| Net asset value per unit, December 31, 2011 | | $ | 123.17 | | | $ | 98.77 | | | $ | 81.35 | | | $ | 77.24 | |
| | | | | | | | | | | | | | | | | |
| | | | | | | | | | | | | | | | | |
| Net asset value per unit, December 31, 2011 | | $ | 123.17 | | | $ | 98.77 | | | $ | 81.35 | | | $ | 77.24 | |
| Net loss: | | | | | | | | | | | | | | | | |
| Net investment loss | | | (4.88 | ) | | | (5.84 | ) | | | (3.81 | ) | | | (5.03 | ) |
| Net loss on investments | | | (3.41 | ) | | | (2.64 | ) | | | (4.08 | ) | | | (3.85 | ) |
| Net loss | | | (8.29 | ) | | | (8.48 | ) | | | (7.89 | ) | | | (8.88 | ) |
| Net asset value per unit, December 31, 2012 | | $ | 114.88 | | | $ | 90.29 | | | $ | 73.46 | | | $ | 68.36 | |
The following represents ratios to average members’ capital and total return for the years ended December 31, 20112012 and 20102011 for the Blended Strategies Portfolio:
| | | Blended Strategies Portfolio | | | Blended Strategies Portfolio | |
| | | Class 0 | | | Class 2 | | | Class 0 | | | Class 2 | |
| | | 2011 | | | 2010 | | | 2011 | | | 2010 | | | 2012 | | | 2011 | | | 2012 | | | 2011 | |
| | | | | | | | | | | | | | | | | | | | | | | | | |
| Total return before Incentive Allocation | | | (11.35 | )% | | | 3.27 | % | | | (13.11 | )% | | | 1.17 | % | | | (6.73 | )% | | | (11.35 | )% | | | (8.59 | )% | | | (13.11 | )% |
| Incentive Allocation | | | (0.01 | ) | | | (0.76 | ) | | | (0.01 | ) | | | (0.32 | ) | | | 0.00 | | | | (0.01 | ) | | | 0.00 | | | | (0.01 | ) |
| Total return after Incentive Allocation | | | (11.36 | )% | | | 2.51 | % | | | (13.12 | )% | | | 0.85 | % | | | (6.73 | )% | | | (11.36 | )% | | | (8.59 | )% | | | (13.12 | )% |
| | | | | | | | | | | | | | | | | | | | | | | | | | | | | | | | | |
| Net investment loss before Incentive Allocation | | | (3.97 | )% | | | (4.45 | )% | | | (5.85 | )% | | | (6.50 | )% | | | (3.96 | )% | | | (3.97 | )% | | | (5.91 | )% | | | (5.85 | )% |
| Incentive Allocation | | | (0.01 | ) | | | (0.76 | ) | | | (0.01 | ) | | | (0.32 | ) | | | 0.00 | | | | (0.01 | ) | | | 0.00 | | | | (0.01 | ) |
| Net investment loss after Incentive Allocation | | | (3.98 | )% | | | (5.21 | )% | | | (5.86 | )% | | | (6.82 | )% | | | (3.96 | )% | | | (3.98 | )% | | | (5.91 | )% | | | (5.86 | )% |
| | | | | | | | | | | | | | | | | | | | | | | | | | | | | | | | | |
| Total expenses before Incentive Allocation | | | 5.15 | % | | | 5.14 | % | | | 7.16 | % | | | 7.19 | % | | | 5.13 | % | | | 5.15 | % | | | 7.18 | % | | | 7.16 | % |
| Incentive Allocation | | | 0.01 | | | | 0.76 | | | | 0.01 | | | | 0.32 | | | | 0.00 | | | | 0.01 | | | | 0.00 | | | | 0.01 | |
| Total expenses after Incentive Allocation | | | 5.16 | %* | | | 5.90 | %* | | | 7.17 | %* | | | 7.51 | %* | | | 5.13 | % | | | 5.16 | % | | | 7.18 | % | | | 7.17 | % |
Graham Alternative Investment Fund I LLC
Notes to Financial Statements (continued)
*6. | The percentages noted above represent total expenses before commission reimbursements, which represent 1.04% and 0.71% of average members's capital for the years then ended.Financial Highlights (continued) |
The following represents ratios to average members’ capital and total return for the years ended December 31, 20112012 and 20102011 for the Systematic Strategies Portfolio:
| | | Systematic Strategies Portfolio | |
| | | Class 0 | | | Class 2 | |
| | | 2011 | | | 2010 | | | 2011 | | | 2010 | |
| | | | | | | | | | | | | |
| Total return before Incentive Allocation | | | (20.95 | )% | | | 3.53 | % | | | (22.53 | )% | | | 1.43 | % |
| Incentive Allocation | | | (0.01 | ) | | | (1.21 | ) | | | (0.01 | ) | | | (0.75 | ) |
| Total return after Incentive Allocation | | | (20.96 | )% | | | 2.32 | % | | | (22.54 | )% | | | 0.68 | )% |
| | | | | | | | | | | | | | | | | |
| Net investment loss before Incentive Allocation | | | (4.27 | )% | | | (4.74 | )% | | | (6.03 | )% | | | (6.82 | )% |
| Incentive Allocation | | | (0.01 | ) | | | (1.21 | ) | | | (0.01 | ) | | | (0.75 | ) |
| Net investment loss after Incentive Allocation | | | (4.28 | )% | | | (5.95 | )% | | | (6.04 | )% | | | (7.57 | )% |
| | | | | | | | | | | | | | | | | |
| Total expenses before Incentive Allocation | | | 5.20 | % | | | 5.20 | % | | | 7.25 | % | | | 7.28 | % |
| Incentive Allocation | | | 0.01 | | | | 1.21 | | | | 0.01 | | | | 0.75 | |
| Total expenses after Incentive Allocation | | | 5.21 | %* | | | 6.41 | %* | | | 7.26 | %* | | | 8.03 | %* |
* | The percentages noted above represent total expenses before commission reimbursements, which represent 0.62% and 0.48% of average members' capital for the years then ended. |
| | | Systematic Strategies Portfolio | |
| | | Class 0 | | | Class 2 | |
| | | 2012 | | | 2011 | | | 2012 | | | 2011 | |
| | | | | | | | | | | | | |
| Total return before Incentive Allocation | | | (9.70 | )% | | | (20.95 | )% | | | (11.50 | )% | | | (22.53 | )% |
| Incentive Allocation | | | 0.00 | | | | (0.01 | ) | | | 0.00 | | | | (0.01 | ) |
| Total return after Incentive Allocation | | | (9.70 | )% | | | (20.96 | )% | | | (11.50 | )% | | | (22.54 | )% |
| | | | | | | | | | | | | | | | | |
| Net investment loss before Incentive Allocation | | | (4.68 | )% | | | (4.27 | )% | | | (6.52 | )% | | | (6.03 | )% |
| Incentive Allocation | | | 0.00 | | | | (0.01 | ) | | | 0.00 | | | | (0.01 | ) |
| Net investment loss after Incentive Allocation | | | (4.68 | )% | | | (4.28 | )% | | | (6.52 | )% | | | (6.04 | )% |
| | | | | | | | | | | | | | | | | |
| Total expenses before Incentive Allocation | | | 5.22 | % | | | 5.20 | % | | | 7.16 | % | | | 7.25 | % |
| Incentive Allocation | | | 0.00 | | | | 0.01 | | | | 0.00 | | | | 0.01 | |
| Total expenses after Incentive Allocation | | | 5.22 | % | | | 5.21 | % | | | 7.16 | % | | | 7.26 | % |
Total return is calculated for Class 0 and Class 2 Units taken as a whole. Total return is calculated as the change in total members’ capital adjusted for subscriptions or redemptions during the year. An individual member’s return may vary from these returns based on the timing of capital transactions and the applicability of Advisory Fees, Brokerage Fees, Sponsor Fees and the Incentive Allocation. The net investment loss and total expense ratios (including Incentive Allocation) are calculated for Class 0 and Class 2 Units taken as a whole and include net amounts allocated from the GAIT Funds. The computation of such ratios is based on the amount of net investment loss, expenses and Incentive Allocation. The netNet investment loss and total expense ratios are computed based upon the weighted average of members’ capital for Class 0 and Class 2 Units of the Fund for the years ended December 31, 20112012 and 2010.2011.
Graham Alternative Investment Fund I LLC
NotesAs of January 1, 2013 the GAIT Funds reduced the Brokerage Fee in Class 0 and Class 2 to Financial Statements (continued)
7. Subsequent EventsOn March 28, 2013 the Fund filed Form 15 with the Securities and Exchange Commission to deregister the units of the Systematic Strategies Portfolio.
The Fund had subscriptions of approximately $1.8$2.3 million and redemptions of approximately $11.6$22.3 million from January 1, 2013 through March 30, 2012,28, 2013, the date through which subsequent events were evaluated by management. These amounts have not been included in the financial statements.
On February 13, 2012 the Manager submitted the Uniform Application for Investment Advisor Registration (Form-ADV) with the Securities and Exchange Commission, seeking registration no earlier than March 30, 2012.
SEI Global Services Inc.
1 Freedom Valley Drive
Oaks, PA 19456
U.S.A
Graham Capital Management, L.P.
40 Highland Avenue
Rowayton, CT 06853
U.S.A.
Proskauer Rose LLP
11 Times Square
New York, NY 10036
U.S.A.
Corporation Service Company
2711 Centerville Road
Suite 400
Wilmington, DE 19808
U.S.A.
Independent Registered Public Accounting Firm
Ernst & Young LLP
300 First Stamford Place
Stamford, CT 06902
U.S.A.
| | Financial Statements |
| | |
| Graham Alternative Investment Trading LLC |
| Years Ended December 31, 20112012 and 20102011 |
| with Report of Independent Registered Public Accounting Firm |
Report of Independent Registered Public Accounting Firm
To the Managing MemberManager of
Graham Alternative Investment Trading LLC
We have audited the accompanying statements of financial condition of Graham Alternative Investment Trading LLC (the “Fund”), including the condensed schedule of investments, as of December 31, 20112012 and 2010,2011, and the related statements of operations and managing member allocation, changes in members’ capital and cash flows for each of the two years in the period ended December 31, 2011.2012. These financial statements are the responsibility of the Fund’s management. Our responsibility is to express an opinion on these financial statements based on our audits.
We conducted our audits in accordance with the standards of the Public Company Accounting Oversight Board (United States). Those standards require that we plan and perform the audit to obtain reasonable assurance about whether the financial statements are free of material misstatement. We were not engaged to perform an audit of the Fund's internal control over financial reporting. Our audits included consideration of internal control over financial reporting as a basis for designing audit procedures that are appropriate in the circumstances, but not for the purpose of expressing an opinion on the effectiveness of the Fund's internal control over financial reporting. Accordingly, we express no such opinion. An audit also includes examining, on a test basis, evidence supporting the amounts and disclosures in the financial statements, assessing the accounting principles used and significant estimates made by management, and evaluating the overall financial statement presentation. We believe that our audits provide a reasonable basis for our opinion.
In our opinion, the financial statements referred to above present fairly, in all material respects, the financial position of Graham Alternative Investment Trading LLC at December 31, 20112012 and 2010,2011, and the results of its operations, changes in its members’ capital and its cash flows for each of the two years in the period ended December 31, 2011,2012, in conformity with U.S. generally accepted accounting principles.
March 30, 2012
| /s/ Ernst & Young LLP |
| Stamford, CT |
|
| March 28, 2013 |
Graham Alternative Investment Trading LLC
Statements of Financial Condition
| | | December 31, | | | December 31, | |
| | | 2011 | | | 2010 | | | 2012 | | | 2011 | |
| Assets | | | | | | | | | | | | |
| Investments in Master Funds, at fair value | | $ | 87,903,988 | | | $ | 43,910,786 | | | $ | 47,870,899 | | | $ | 87,903,988 | |
| Investment in Graham Cash Assets LLC, at fair value | | | 344,807,748 | | | | 409,389,656 | | | | 241,839,538 | | | | 344,807,748 | |
| Accrued commission reimbursements | | | 331,720 | | | | 278,469 | | | | 165,510 | | | | 331,720 | |
| Receivable from Master Funds | | | 18,287 | | | | – | | | | 1,856 | | | | 18,287 | |
| Total assets | | $ | 433,061,743 | | | $ | 453,578,911 | | | $ | 289,877,803 | | | $ | 433,061,743 | |
| | | | | | | | | | | | | | | | | |
| Liabilities and members’ capital | | | | | | | | | | | | | | | | |
| Liabilities: | | | | | | | | | | | | | | | | |
| Accrued redemptions | | $ | 13,947,652 | | | $ | 4,817,403 | | | $ | 23,262,309 | | | $ | 13,947,652 | |
| Accrued brokerage fees | | | 852,551 | | | | 894,187 | | | | 568,525 | | | | 852,551 | |
| Accrued advisory fees | | | 734,211 | | | | 768,947 | | | | 489,673 | | | | 734,211 | |
| Accrued sponsor fees | | | 367,106 | | | | 384,474 | | | | 244,837 | | | | 367,106 | |
| Payable to Master Funds | | | 2,155 | | | | 61 | | | | 6,476 | | | | 2,155 | |
| Total liabilities | | | 15,903,675 | | | | 6,865,072 | | | | 24,571,820 | | | | 15,903,675 | |
| | | | | | | | | | | | | | | | | |
| Members’ capital: | | | | | | | | | | | | | | | | |
| Class 0 Units (2,827,795.124 and 2,685,172.128 units issued and outstanding at $123.17 and $138.96 per unit, respectively) | | | 348,287,779 | | | | 373,121,130 | | |
| Class 2 Units (688,937.679 and 639,582.657 units issued and outstanding at $98.77 and $113.68 per unit, respectively) | | | 68,048,075 | | | | 72,710,381 | | |
| Class M Units (4,671.470 and 4,671.470 units issued and outstanding at $176.01 and $188.88 per unit, respectively) | | | 822,214 | | | | 882,328 | | |
| Class 0 Units (1,922,696.211 and 2,827,795.124 units issued and outstanding | | | | | | | | | |
| at $114.88 and $123.17 per unit, respectively) | | | | 220,876,439 | | | | 348,287,779 | |
| Class 2 Units (483,129.319 and 688,937.679 units issued and outstanding | | | | | | | | | |
| at $90.29 and $98.77 per unit, respectively) | | | | 43,623,249 | | | | 68,048,075 | |
| Class M Units (4,671.470 and 4,671.470 units issued and outstanding | | | | | | | | | |
| at $172.60 and $176.01 per unit, respectively) | | | | 806,295 | | | | 822,214 | |
| Total members’ capital | | | 417,158,068 | | | | 446,713,839 | | | | 265,305,983 | | | | 417,158,068 | |
| Total liabilities and members’ capital | | $ | 433,061,743 | | | $ | 453,578,911 | | | $ | 289,877,803 | | | $ | 433,061,743 | |
See accompanying notes.
Graham Alternative Investment Trading LLC
Condensed Schedules of Investments
| | | December 31, 2011 | | | December 31, 2010 | | | December 31, 2012 | | | December 31, 2011 | |
| Description | | Fair Value | | | Percentage of Members’ Capital | | | Fair Value | | | Percentage of Members’ Capital | | | Fair Value | | | Percentage of Members’ Capital | | | Fair Value | | | Percentage of Members’ Capital | |
| | | | | | | | | | | | | | | | | | | | | | | | | |
| Investments in Master Funds, at fair value | | | | | | | | | | | | | | | | | | | | | | | | |
| Graham Commodity Strategies LLC | | $ | 19,823,897 | | | | 4.75% | | | $ | 7,603,525 | | | | 1.70% | | | $ | 16,324,504 | | | | 6.15 | % | | $ | 19,823,897 | | | | 4.75 | % |
| Graham Discretionary Energy Trading III LLC | | | - | | | | 0.00% | | | | 1,690,592 | | | | 0.38% | | |
| Graham Energy Focus LLC | | | 4,391,910 | | | | 1.05% | | | | - | | | | 0.00% | | | | - | | | | - | | | | 4,391,910 | | | | 1.05 | % |
| Graham Fed Policy Ltd. | | | 5,956,632 | | | | 1.43% | | | | 6,709,637 | | | | 1.50% | | | | - | | | | - | | | | 5,956,632 | | | | 1.43 | % |
| Graham Global Monetary Policy LLC | | | 10,693,175 | | | | 2.56% | | | | 3,566,013 | | | | 0.80% | | | | 7,258,710 | | | | 2.74 | % | | | 10,693,175 | | | | 2.56 | % |
| Graham K4D Trading Ltd. | | | 45,101,309 | | | | 10.82% | | | | 24,030,670 | | | | 5.38% | | | | 24,287,685 | | | | 9.15 | % | | | 45,101,309 | | | | 10.82 | % |
| Graham Macro Directional LLC | | | 1,937,065 | | | | 0.46% | | | | 268,357 | | | | 0.06% | | | | - | | | | - | | | | 1,937,065 | | | | 0.46 | % |
| Graham Short Term Global Macro LLC | | | - | | | | 0.00% | | | | 41,992 | | | | 0.01% | | |
| Total investments in Master Funds | | $ | 87,903,988 | | | | 21.07% | | | $ | 43,910,786 | | | | 9.83% | | | $ | 47,870,899 | | | | 18.04 | % | | $ | 87,903,988 | | | | 21.07 | % |
See accompanying notes.
Graham Alternative Investment Trading LLC
Statements of Operations and Managing Member Allocation
| | | Years Ended December 31, | |
| | | 2012 | | | 2011 | |
| Net loss allocated from investments in Master Funds: | | | | | | |
| Net realized loss on investments | | $ | (9,664,083 | ) | | $ | (21,085,183 | ) |
| Net increase (decrease) in unrealized appreciation on investments | | | 2,266,309 | | | | (14,661,083 | ) |
| Brokerage commissions and fees | | | (3,239,602 | ) | | | (5,006,506 | ) |
| Net loss allocated from investments in Master Funds | | | (10,637,376 | ) | | | (40,752,772 | ) |
| | | | | | | | | |
| Net investment loss allocated from investments in | | | | | | | | |
| Master Funds | | | (48,406 | ) | | | (174,879 | ) |
| | | | | | | | | |
| Investment income: | | | | | | | | |
| Interest income | | | 747,456 | | | | 1,782,810 | |
| | | | | | | | | |
| Expenses: | | | | | | | | |
| Brokerage fees | | | 8,496,466 | | | | 11,340,066 | |
| Advisory fees | | | 7,342,658 | | | | 9,812,103 | |
| Sponsor fees | | | 3,671,329 | | | | 4,906,051 | |
| Interest and other | | | 32,849 | | | | 31,615 | |
| Commission reimbursements | | | (3,239,602 | ) | | | (5,006,506 | ) |
| Total expenses | | | 16,303,700 | | | | 21,083,329 | |
| Net investment loss of the Fund | | | (15,556,244 | ) | | | (19,300,519 | ) |
| | | | | | | | | |
| Net loss | | | (26,242,026 | ) | | | (60,228,170 | ) |
| | | | | | | | | |
| Incentive allocation | | | – | | | | (51,877 | ) |
| | | | | | | | | |
| Net loss available for pro-rata allocation to all members | | $ | (26,242,026 | ) | | $ | (60,280,047 | ) |
See accompanying notes.
Graham Alternative Investment Trading LLC
Statements of Changes in Members’ Capital
For the years ended December 31, 2012 and 2011
| | | Class 0 | | | Class 2 | | | Class M | | | Total | |
| | | Units | | | Capital | | | Units | | | Capital | | | Units | | | Capital | | | Capital | |
| | | | | | | | | | | | | | | | | | | | | | |
| Members’ capital, December 31, 2010 | | | 2,685,172.128 | | | $ | 373,121,130 | | | | 639,582.657 | | | $ | 72,710,381 | | | | 4,671.470 | | | $ | 882,328 | | | $ | 446,713,839 | |
| Subscriptions | | | 830,914.077 | | | | 114,151,381 | | | | 170,351.428 | | | | 18,958,693 | | | | – | | | | – | | | | 133,110,074 | |
| Redemptions | | | (688,291.081 | ) | | | (89,468,532 | ) | | | (120,996.406 | ) | | | (12,917,266 | ) | | | – | | | | (51,877 | ) | | | (102,437,675 | ) |
| Incentive allocation | | | – | | | | (44,314 | ) | | | – | | | | (7,563 | ) | | | – | | | | 51,877 | | | | – | |
| Net loss | | | – | | | | (49,471,886 | ) | | | – | | | | (10,696,170 | ) | | | – | | | | (60,114 | ) | | | (60,228,170 | ) |
| Members’ capital, December 31, 2011 | | | 2,827,795.124 | | | $ | 348,287,779 | | | | 688,937.679 | | | $ | 68,048,075 | | | | 4,671.470 | | | $ | 822,214 | | | $ | 417,158,068 | |
| Subscriptions | | | 171,874.373 | | | | 20,965,683 | | | | 60,152.303 | | | | 5,776,644 | | | | – | | | | – | | | | 26,742,327 | |
| Redemptions | | | (1,076,973.286 | ) | | | (127,109,507 | ) | | | (265,960.663 | ) | | | (25,242,879 | ) | | | – | | | | – | | | | (152,352,386 | ) |
| Incentive allocation | | | – | | | | – | | | | – | | | | – | | | | – | | | | – | | | | – | |
| Net loss | | | – | | | | (21,267,516 | ) | | | – | | | | (4,958,591 | ) | | | – | | | | (15,919 | ) | | | (26,242,026 | ) |
| Members’ capital, December 31, 2012 | | | 1,922,696.211 | | | $ | 220,876,439 | | | | 483,129.319 | | | $ | 43,623,249 | | | | 4,671.470 | | | $ | 806,295 | | | $ | 265,305,983 | |
See accompanying notes.
Graham Alternative Investment Trading LLC
Statements of OperationsCash Flows
| | | Years Ended December 31, | |
| | | 2012 | | | 2011 | |
| Cash flows provided by (used in) operating activities | | | | | | |
| Net loss | | $ | (26,242,026 | ) | | $ | (60,228,170 | ) |
| Adjustments to reconcile net loss to net cash provided by (used in) | | | | | | | | |
| operating activities: | | | | | | | | |
| Net loss allocated from investments in Master Funds | | | 10,685,782 | | | | 40,927,651 | |
| Net income allocated from investment in Graham Cash Assets LLC | | | (747,456 | ) | | | (1,782,810 | ) |
| Proceeds from sale of investments in Master Funds | | | 577,349,465 | | | | 767,121,556 | |
| Proceeds from sale of investments in Graham Cash Assets LLC | | | 574,565,811 | | | | 671,571,056 | |
| Investments in Master Funds | | | (547,981,406 | ) | | | (852,058,602 | ) |
| Investments in Graham Cash Assets LLC | | | (470,850,145 | ) | | | (605,206,338 | ) |
| Changes in assets and liabilities: | | | | | | | | |
| Accrued commission reimbursements | | | 166,210 | | | | (53,251 | ) |
| Accrued brokerage fees | | | (284,026 | ) | | | (41,636 | ) |
| Accrued advisory fees | | | (244,538 | ) | | | (34,736 | ) |
| Accrued sponsor fees | | | (122,269 | ) | | | (17,368 | ) |
| Net cash provided by (used in) operating activities | | | 116,295,402 | | | | (39,802,648 | ) |
| | | | | | | | | |
| Cash flows (used in) provided by financing activities | | | | | | | | |
| Subscriptions | | | 26,742,327 | | | | 133,110,074 | |
| Redemptions | | | (143,037,729 | ) | | | (93,307,426 | ) |
| Net cash (used in) provided by financing activities | | | (116,295,402 | ) | | | 39,802,648 | |
| | | | | | | | | |
| Net change in cash and cash equivalents | | | - | | | | - | |
| | | | | | | | | |
| Cash and cash equivalents, beginning of year | | | - | | | | - | |
| Cash and cash equivalents, end of year | | $ | - | | | | - | |
Supplemental disclosure of non cash operating activities
Investments and Managing Member Allocationproceeds related to investments in liquidated Master Funds consolidated into Graham Commodity Strategies LLC not included above: $1,362,929 and $0 for the years ended December 31, 2012 and 2011, respectively (See Note 2).
| | | Years Ended December 31, | |
| | | 2011 | | | 2010 | |
| Net (loss) gain allocated from investments in Master Funds: | | | | | | |
| Net realized (loss) gain on investments | | $ | (21,085,183 | ) | | $ | 17,840,753 | |
| Net (decrease) increase in unrealized appreciation on investments | | | (14,661,083 | ) | | | 12,183,572 | |
| Brokerage commissions and fees | | | (5,006,506 | ) | | | (2,566,961 | ) |
| Net (loss) gain allocated from investments in Master Funds | | | (40,752,772 | ) | | | 27,457,364 | |
| | | | | | | | | |
| Net investment loss allocated from investments in Master Funds | | | (174,879 | ) | | | (77,203 | ) |
| | | | | | | | | |
| Investment income: | | | | | | | | |
| Interest income | | | 1,782,810 | | | | 1,901,499 | |
| | | | | | | | | |
| Expenses: | | | | | | | | |
| Brokerage fees | | | 11,340,066 | | | | 8,578,779 | |
| Advisory fees | | | 9,812,103 | | | | 7,370,466 | |
| Sponsor fees | | | 4,906,051 | | | | 3,685,233 | |
| Interest and other | | | 31,615 | | | | 50,259 | |
| Commission reimbursements | | | (5,006,506 | ) | | | (2,566,961 | ) |
| Total expenses | | | 21,083,329 | | | | 17,117,776 | |
| Net investment loss of the Fund | | | (19,300,519 | ) | | | (15,216,277 | ) |
| | | | | | | | | |
| Net (loss) income | | | (60,228,170 | ) | | | 12,163,884 | |
| | | | | | | | | |
| Incentive allocation | | | (51,877 | ) | | | (2,474,082 | ) |
| | | | | | | | | |
| Net (loss) income available for pro-rata allocation to all members | | $ | (60,280,047 | ) | | $ | 9,689,802 | |
See accompanying notes.
Graham Alternative Investment Trading LLC
Statements of Changes in Members’ Capital
Years ended December 31, 2011and 2010
| | | Class 0 | | | Class 2 | | | Class M | | | Total | |
| | | Units | | | Capital | | | Units | | | Capital | | | Units | | | Capital | | | Capital | |
| | | | | | | | | | | | | | | | | | | | | | |
| Members’ capital, December 31, 2009 | | | 1,851,259.271 | | | $ | 250,952,480 | | | | 462,314.824 | | | $ | 52,116,241 | | | | 4,671.470 | | | $ | 813,191 | | | $ | 303,881,912 | |
| Subscriptions | | | 1,020,127.356 | | | | 138,433,221 | | | | 234,253.744 | | | | 26,258,778 | | | | – | | | | – | | | | 164,691,999 | |
| Redemptions | | | (186,214.499 | ) | | | (25,203,919 | ) | | | (56,985.911 | ) | | | (6,345,955 | ) | | | – | | | | (2,474,082 | ) | | | (34,023,956 | ) |
| Incentive allocation | | | – | | | | (2,284,033 | ) | | | – | | | | (190,049 | ) | | | – | | | | 2,474,082 | | | | – | |
| Net income | | | – | | | | 11,223,381 | | | | – | | | | 871,366 | | | | – | | | | 69,137 | | | | 12,163,884 | |
| Members’ capital, December 31, 2010 | | | 2,685,172.128 | | | | 373,121,130 | | | | 639,582.657 | | | | 72,710,381 | | | | 4,671.470 | | | | 882,328 | | | | 446,713,839 | |
| Subscriptions | | | 830,914.077 | | | | 114,151,381 | | | | 170,351.428 | | | | 18,958,693 | | | | – | | | | – | | | | 133,110,074 | |
| Redemptions | | | (688,291.081 | ) | | | (89,468,532 | ) | | | (120,996.406 | ) | | | (12,917,266 | ) | | | – | | | | (51,877 | ) | | | (102,437,675 | ) |
| Incentive allocation | | | – | | | | (44,314 | ) | | | – | | | | (7,563 | ) | | | – | | | | 51,877 | | | | – | |
| Net loss | | | – | | | | (49,471,886 | ) | | | – | | | | (10,696,170 | ) | | | – | | | | (60,114 | ) | | | (60,228,170 | ) |
| Members’ capital, December 31, 2011 | | | 2,827,795.124 | | | $ | 348,287,779 | | | | 688,937.679 | | | $ | 68,048,075 | | | | 4,671.470 | | | $ | 822,214 | | | $ | 417,158,068 | |
See accompanying notes.
Graham Alternative Investment Trading LLC
Statements of Cash Flows
| | | Years Ended December 31, | |
| | | 2011 | | | 2010 | |
| Cash flows used in operating activities | | | | | | |
| Net (loss) income | | $ | (60,228,170 | ) | | $ | 12,163,884 | |
| Adjustments to reconcile net (loss) income to net cash used in operating activities: | | | | | | | | |
| Net loss (income) allocated from investment in Master Funds | | | 40,927,651 | | | | (27,380,161 | ) |
| Net income allocated from investment in Graham Cash Assets LLC | | | (1,782,810 | ) | | | (1,901,499 | ) |
| Proceeds from sale of investments in Master Funds | | | 767,121,556 | | | | 370,473,044 | |
| Proceeds from sale of investments in Graham Cash Assets LLC | | | 671,571,056 | | | | 266,204,819 | |
| Investments in Master Funds | | | (852,058,602 | ) | | | (370,789,920 | ) |
| Investments in Graham Cash Assets LLC | | | (605,206,338 | ) | | | (383,861,653 | ) |
| Changes in assets and liabilities: | | | | | | | | |
| Accrued commission reimbursements | | | (53,251 | ) | | | (141,390 | ) |
| Accrued brokerage fees | | | (41,636 | ) | | | 286,103 | |
| Accrued advisory fees | | | (34,736 | ) | | | 250,254 | |
| Accrued sponsor fees | | | (17,368 | ) | | | 125,128 | |
| Net cash used in operating activities | | | (39,802,648 | ) | | | (134,571,391 | ) |
| | | | | | | | | |
| Cash flows provided by financing activities | | | | | | | | |
| Subscriptions | | | 133,110,074 | | | | 164,691,999 | |
| Redemptions | | | (93,307,426 | ) | | | (30,120,657 | ) |
| Net cash provided by financing activities | | | 39,802,648 | | | | 134,571,342 | |
| | | | | | | | | |
| Net decrease in cash and cash equivalents | | | - | | | | (49 | ) |
| | | | | | | | | |
| Cash and cash equivalents, beginning of year | | | - | | | | 49 | |
| Cash and cash equivalents, end of year | | $ | - | | | $ | - | |
See accompanying notes.
Graham Alternative Investment Trading LLC
Notes to Financial Statements
December 31, 20112012
1. | 1. | Organization and Business |
Graham Alternative Investment Trading LLC (“GAIT”) was formed on May 18, 2006, commenced operations on August 1, 2006 and is organized as a Delaware Limited Liability Company. Graham Capital Management, L.P. (the “Managing Member” or “Manager”) is the Managing Member and the sole investment advisor. The Managing Member is registered as a Commodity Pool Operator and Commodity Trading Advisor with the Commodity Futures Trading Commission and is a member of the National Futures Association. The Managing Member is also registered as a Registered Investment Advisor with the Securities and Exchange Commission.
The investment objective of GAIT is to achieve long-term capital appreciation through professionally managed trading through its investment in various master trading vehicles (“Master Funds”). As more fully described in Notes 2 and 3, these Master Funds invest in a broad range of derivative instruments such as currency forward and futures contracts; bond, interest rate, and index futures contracts; commodity forward and futures contracts, and options and swaps thereon (collectively referred to as “Derivative Positions”) traded on U.S. and foreign exchanges.
In addition to trading in the Interbank market for foreign exchange, the Manager currently executes orders on all the major U.S. futures exchanges, and may also trade on, but is not limited to, the Bolsa de Mercadorias and Futuros (“BMF”), Borsa Italiana Idem (“IML”), the Eurex Exchange (“Eurex”), , the Hong Kong Exchanges and Clearing Ltd. (“HKEX”), the Intercontinental Exchange (“ICE”), the London Metal Exchange (“LME”), the Montreal Exchange (“ME”), the Mercado de Futuros Financieros (“MEFF”), the NYMEX Euronext (“Euronext”), the Osaka Securities Exchange (“OSE”), the Singapore Exchange (“SGX”), the South African Exchange (“SAFEX”), the Sydney Futures Exchange Ltd. (“SFE”), the Tokyo Commodity Exchange (“TOCOM”), the Tokyo Financial Exchange (“TFX”), and the Tokyo Stock Exchange (“TSE”).as well as over-the-counter.
Graham Alternative Investment Fund I LLC, Graham Alternative Investment Fund II LLC, and Graham Alternative Investment III Ltd. are the primary investors of GAIT.
SEI Global Services, Inc. (“SEI”) is GAIT’s independent administrator and transfer agent. SEI is responsible for certain matters pertaining to the administration of GAIT.
GAIT will terminate on December 31, 2050 or at an earlier date if certain conditions occur as outlined in the Limited Liability Company Agreement (“LLC Agreement”).
Duties of the Managing Member
Subject to the terms and conditions of the LLC Agreement, the Managing Member has complete and exclusive responsibility for managing and administering the affairs of GAIT and for directing the investment and reinvestment of the assets of GAIT.
2. | 2. | Summary of Significant Accounting Policies |
These financial statements have been prepared in conformity with U.S. generally accepted accounting principles (“U.S. GAAP”) and all amounts are stated in U.S. dollars. The preparation of these financial statements requires the Managing Member to make estimates and assumptions that affect the amounts reported in the financial statements and accompanying notes. Actual results could differ from those estimates.
Graham Alternative Investment Trading LLC
Notes to Financial Statements (continued)
2. Summary of Significant Accounting Policies (continued)
Investments in Master Funds
GAIT invests in various Master Funds which are managed by the Managing Member. These investments are valued in the accompanying statements of financial condition at fair value in accordance with U.S. GAAP based upon GAIT’s proportionate share of the Master Funds’ reported net asset value.values. Gains and losses are allocated monthly by each Master Fund to GAIT based upon GAIT’s proportionate share of the net asset value of each Master Fund and are included in the statements of operations and managing member allocation.
Graham Alternative Investment Trading LLC
Notes to Financial Statements (continued)
| 2. | Summary of Significant Accounting Policies (continued) |
Investments in Master Funds (continued)
During the year ended December 31, 2012 certain Master Funds in which GAIT invested consolidated their assets under Graham Commodity Strategies LLC, then ceased operations and were dissolved. The amount of assets that were transferred in-kind in connection with this consolidation totals $1,362,929. The dates of the consolidations and dissolutions were as follows:
| Master Fund | Consolidation Date | Dissolution Date |
| Graham Fed Policy Ltd. | May 29, 2012 | October 23, 2012 |
| Graham Energy Fundamental LLC | May 29, 2012 | October 1, 2012 |
| Graham Macro Directional LLC | May 30, 2012 | October 1, 2012 |
| Graham Macro Technical Ltd. | May 30, 2012 | October 23, 2012 |
Fair Value
The fair value of GAIT’s assets and liabilities, which qualify as financial instruments under U.S. GAAP, approximates the carrying amounts presented in the statements of financial condition. Changes in these carrying amounts are included in the statements of operations and managing member allocation.
GAIT follows U.S. GAAP for fair value measurements, which defines fair value, establishes a framework for measuring fair value, and requires certain disclosures about fair value measurements. GAIT reports the fair value of its investment related assets and liabilities in accordance with the hierarchy established under U.S. GAAP. U.S. GAAP uses a three-level hierarchy for fair value measurement based on the activeness of the market and the transparency and independence of inputs used in the valuation of an asset or liability as of the measurement date.
The fair value hierarchy categorizes asset and liability positions into one of three levels, as summarized below, based on the inputs and assumptions used in deriving fair value.
| | · | Level 1 inputs are unadjusted closing or settlement prices for such assets or liabilities as published by the primary exchange upon which they are traded. |
| | · | Level 2 inputs include quoted prices for similar assets and liabilities obtained from independent brokers and/or market makers in each security. With respect to GAIT’s investments in the other funds managed by the Manager, Level 2 inputs include the net asset value of the underlying fund in which it holds an investment. |
| | · | Level 3 inputs are those which are considered unobservable and are significant in arriving at fair value. |
GAIT reports the fair value of its investment related assets and liabilities in accordance with the hierarchy established under U.S. GAAP. In accordance with this hierarchy, GAIT’s investments in Master Funds and Graham Cash Assets LLC (“GCA”Cash Assets”) have been classified as Level 2. These investments are discussed in Notes 3 and 4. The Master Funds record all of their derivative financial instruments at fair value, which is derived in accordance with U.S. GAAP. There were no Level 3 assets or liabilities held at any point during the years ended December 31, 20112012 and 20102011 by GAIT, the Master Funds, or GCA,Cash Assets, and there were no transfers between levels during those periods.years. Transfers between levels, if any, are recognized on the actual date of the event or change in circumstances that cause the transfer.
Graham Alternative Investment Trading LLC
Notes to Financial Statements (continued)
2. | 2. | Summary of Significant Accounting Policies (continued) |
Derivative Instruments
In the normal course of business, the Master Funds utilize derivative financial instruments in connection with their trading activities. Derivative instruments derive their value from underlying assets, indices, reference rates or a combination of these factors. Investments in derivative financial instruments are subject to additional risks that can result in a loss of all or part of an investment. The Master Funds’ derivative financial instruments are classified by the following primary underlying risks: interest rate, foreign currency exchange rate, commodity price, and equity price risks. These risks can be in excess of the amounts recognized in the statements of financial condition. In addition, the Master Funds are also subject to additional counterparty risk should their counterparties fail to meet the terms of their contracts. Management of counterparty risk involves a number of considerations, such as the financial profile of the counterparty, specific terms and duration of the contractual agreement, and the value of collateral held, if any. The Master Funds have established initial credit approval, credit limits, and collateral requirements and may reduce their exposure to any counterparties they deem necessary. Trading in non-U.S. dollar denominated derivative instruments may subject the value of, and gains and losses associated with, such contracts to additional risks related to adverse changes in the applicable exchange rates.
Unrealized gains and losses from derivative financial instruments are recorded based on changes in their fair value. Realized gains and losses are recorded when the positions are closed. All unrealized and realized gains and losses related to derivative financial instruments are included in net gain (loss)loss on investments in the Master Funds’ statements of operations.
Futures Contracts
The Master Funds use futures contracts in an attempt to take advantage of changes in the value of equities, commodities, interest rates, bonds and foreign currencies. Futures contracts are valued based upon the closing price as of the valuation date established by the primary exchange upon which they are traded.
A futures contract represents a commitment for the future purchase or sale of an asset or cash settlement based on the value of an asset on a specified date. The purchase and sale of futures contracts are executed on an exchange which requires margin deposits with a Futures Commission Merchant (“FCM”). Subsequent payments are made or received by the Master Funds each day, depending on the daily fluctuations in the value of the contract. These changes in valuation are recorded for financial statement purposes as unrealized gains or losses by the Master Funds. Relative to over-the-counter derivative financial instruments, futures contracts provide reduced counterparty risk to the Master Funds since futures are exchange-traded and the exchange’s clearinghouseexchanges’ clearing house guarantees the futures against default. However some non-U.S. exchanges are “principals’ markets” in which no common clearing facility exists and the Master Funds may look only to the clearing broker for performance of the contract. The U.S. Commodity Exchange Act requires an FCM to segregate all funds received from such FCM’s customers in respect of regulated futures transactions. If the FCM were not to do so to the full extent required by law, the assets of the Master Funds might not be fully protected in the event of the bankruptcy or insolvency of the FCM. In that case, the Master Funds would be limited to recovering only a pro rata share of all available funds segregated on behalf of the FCM’s combined customer accounts, even though certain property specifically traceable to the Master Funds was held by the FCM. In addition, in the event of bankruptcy or insolvency of an exchange or an affiliated clearing house, the Master Funds might experience a loss of funds deposited through its FCM as margin with such exchange or affiliated clearing house, the loss of unrealized profits on its open positions, and the loss of funds owed to it as realized profits on closed positions.
Graham Alternative Investment Trading LLC
Notes to Financial Statements (continued)
2. | 2. | Summary of Significant Accounting Policies (continued) |
Derivative Instruments (continued)
Forward Contracts
The Master Funds enter into foreign currency forward contracts in an attempt to take advantage of changes in exchange rates. Forward currency transactions are contracts or agreements for delivery of specific currencies or the cash equivalent value at a specified future date and an agreed upon price. Forward contracts are not guaranteed by an exchange or clearing house and therefore the risks include the inability of counterparties to meet their obligations under the terms of the contracts as well as the risks associated with movements in fair value.
Exchange traded forward contracts are valued based upon the settlement prices as of the valuation date, established by the primary exchange upon which they are traded. All other forward contracts are valued based upon a forward curve constructed using independently quoted forward points. Changes in fair value of each forward contract are recognized as unrealized gains or losses.
Swap Contracts
The Master Funds may enter into various swap contracts in an attempt to take advantage of changes in interest rates and asset values. Swap contracts are not guaranteed by an exchange or an affiliated clearing house or regulated by any U.S. or foreign government authorities. Failure of a counterparty to meet its obligation under the terms of the swap contract could result in the loss of any unrealized gains on open positions. It may not be possible to dispose of or close out a swap position without the consent of the counterparty, and the Master Fund may not be able to enter into an offsetting contract in order to cover its risk. Swaps are subject to the International Swap and Derivative Association (“ISDA”) Master Agreements which generally require among other things, that a Master Fund maintain a predetermined level of net assets, and provide limits with respect to any decline in the Master Fund’s net asset value over 1-month, 3-month and 12-month periods. If a Master Fund were to violate such provisions, the counterparty to the swaps could demand liquidation of outstanding swap positions.
A total return swap contract is an agreement that obligates two parties to exchange cash flows calculated by reference to changes in specified prices or rates for a specified notional amount of the underlying assets. The payment flows are usually netted against each other, with the difference being paid by one party to another.
Exchange traded swaps are valued based upon the closing prices established by the primary exchange upon which they are traded. Total return swaps are valued based upon the exchange published settle price of the underlying reference instrument. Changes in fair value of each swap are recognized as unrealized gains or losses. The Master Funds record realized gains or losses when a swap contract is terminated. Interest is calculated and accrued throughout the life of each swap. Payments received at the end of each reset period are recorded against such accruals.
Options
The Master Funds may buy and sell covered and uncovered exchange traded and over-the-counter options on futures, foreign currencies, commodities, interest rates and equities to take advantage of the price movements of the financial instrument underlying the option or to hedge positions in the underlying assets. Option contracts give one party the right, but not the obligation, to buy or sell within a limited time or on a specified date, a financial instrument, commodity or currency at a contracted price. Options may also be settled in cash, based on differentials between specified indices or prices.
Graham Alternative Investment Trading LLC
Notes to Financial Statements (continued)
2. | 2. | Summary of Significant Accounting Policies (continued) |
Derivative Instruments (continued)
Options (continued)
The Master Funds are exposed to counterparty risk to the extent that a seller of an over-the-counter option does not meet its obligations under the terms of the option contract. The maximum risk of loss to the Master Funds is the unrealized gains of the contracts and the premiums paid to purchase its open option contracts. Relative to over-the-counter options, exchange traded options provide reduced counterparty risk to the Master Funds since the exchanges’ clearinghouse guarantees the option against default.
Exchange traded options are valued based upon the settlement prices published as of the valuation date by the principal exchange upon which they are traded. In the absence of an exchange published settlement price, the option will be valued using the last reported sales price reported on the exchange for the valuation date. Over-the-counter options and exchange traded options with no reported sales price on the valuation date will generally be valued at the average of last reported bid and offer quotes from independent brokers or from the exchange, respectively.
Recent Accounting Pronouncements
In May 2011, the Financial Accounting Standards Board (“FASB”) issued Accounting Standards Update No. 2011-04, Amendments to Achieve Common Fair Value Measurement and Disclosure Requirements in U.S. GAAP and International Financial Reporting Standards (“IFRS”) (“ASU No. 2011-04”). ASU No. 2011-04 includes common requirements for measurement of and disclosure about fair value between U.S. GAAP and IFRS. ASU No. 2011-04 will require reporting entities to disclose the following information for fair value measurements categorized within Level 3 of the fair value hierarchy: quantitative information about the unobservable inputs used in the fair value measurement, the valuation process used by the reporting entity and a narrative description of the sensitivity of the fair value measurement to changes in unobservable inputs and the interrelationships between those unobservable inputs. The disclosure is effective for annual reporting periods beginning on or after December 15, 2011 and is to be applied prospectively.
In December 2011, the FASB issued Accounting Standards Update No. 2011-11, Disclosures about Offsetting Assets and Liabilities (“ASU No. 2011-11”). The amendments in ASU No. 2011-11 affect all entities that have financial instruments that are either offset or are subject to an enforceable master netting arrangement or similar agreement in accordance with authoritative guidance under U.S. GAAP. Entities will be required to disclose both gross information and net information about instruments and transactions eligible for offset in the statement of financial positionoffsetting or subject to an agreement similar to a master netting arrangement in the statement of financial position, to enable users of its financial statements to understand the effect of those arrangements on its financial position. The disclosure is effective for annual reporting periods beginning on or after January 1, 2013, and interim periods within those annual periods. The Manager is assessing the impact these new pronouncements will have on these financial statements.
The Manager is assessing the impact thesethis new pronouncementspronouncement will have on these financial statements.
Indemnifications
In the normal course of business, the Master Funds, GCA,Cash Assets, and GAIT enter into contracts that contain a variety of indemnifications. Such contracts may include those by GCACash Assets and the Master Funds with their brokers and trading counterparties. GAIT’s maximum exposure under these arrangements is unknown; however, GAIT has not had prior claims or losses with respect to such indemnifications and considers the risk of loss to be remote.
Graham Alternative Investment Trading LLC
Notes to Financial Statements (continued)
2. Summary of Significant Accounting Policies (continued)
Reclassifications
Certain prior year amounts have been reclassified to conform with the current year presentation.
3. | 3. | Investments in Master Funds |
As of December 31, 20112012 and 2010,2011, GAIT invested in various Master Funds, all of which were managed by the Manager. GAIT’s investments in these Master Funds, as well as the investment objectives of each Master Fund, are summarized below. Master Funds in which GAIT invested 5% or more of its members’ capital are individually identified, while smaller investments are aggregated under the caption “Other MasterGlobal Macro Funds.” The number of Master Funds included for the year in each aggregated category is disclosed parenthetically next to each name. All of the Master Funds and GAIT are related parties. The Master Funds do not charge management or incentive fees and all offer monthly subscriptions and redemptions.
| December 31, 2011 |
| Investment – Objective | | Percent of Members’ Capital | | | Fair Value | | | Net Income (Loss) |
| | | | | | | | | |
| Graham K4D Trading Ltd. – (a) | | | 10.82 | % | | $ | 45,101,309 | | | $ | (55,856,964 | ) |
| Other Master Funds (8) – (b) (c) (d) (e) | | | 10.25 | % | | | 42,802,679 | | | | 14,929,313 | |
| | | | 21.07 | % | | $ | 87,903,988 | | | $ | (40,927,651 | ) |
| December 31, 2010 |
| Investment – Objective | | Percent of Members’ Capital | | | Fair Value | | | Net Income |
| | | | | | | | | |
| Graham K4D Trading Ltd. – (a) | | | 5.38 | % | | $ | 24,030,670 | | | $ | 17,360,793 | |
| Other Master Funds (7) – (b) (c) (d) (e) | | | 4.45 | % | | | 19,880,116 | | | | 10,019,368 | |
| | | | 9.83 | % | | $ | 43,910,786 | | | $ | 27,380,161 | |
| December 31, 2012 | |
| Investment – Objective | | Percent of Members’ Capital | | | Fair Value | | | Net Income (Loss) | |
| | | | | | | | | | |
| Systematic Macro Funds | | | | | | | | | |
| Graham K4D Trading Ltd. | | | 9.15 | % | | $ | 24,287,685 | | | $ | (10,096,654 | ) |
| | | | | | | | | | | | | |
| Global Macro Funds | | | | | | | | | | | | |
| Graham Commodity Strategies LLC | | | 6.15 | % | | | 16,324,504 | | | | (9,313,441 | ) |
| Other Global Macro Funds (6) | | | 2.74 | % | | | 7,258,710 | | | | 8,724,313 | |
| | | | 18.04 | % | | $ | 47,870,899 | | | $ | (10,685,782 | ) |
| December 31, 2011 | |
| Investment – Objective | | Percent of Members’ Capital | | | Fair Value | | | Net Income (Loss) | |
| | | | | | | | | | | | | |
| Systematic Macro Funds | | | | | | | | | | | | |
| Graham K4D Trading Ltd. | | | 10.82 | % | | $ | 45,101,309 | | | $ | (55,856,964 | ) |
| | | | | | | | | | | | | |
| Global Macro Funds | | | | | | | | | | | | |
| Other Global Macro Funds (7) | | | 10.25 | % | | | 42,802,679 | | | | 14,929,313 | |
| | | | 21.07 | % | | $ | 87,903,988 | | | $ | (40,927,651 | ) |
(a) – Systematic Macro (b) – Fixed Income (c) – Global Macro (d) – Energy Related (e) – Commodities
Graham Alternative Investment Trading LLC
Notes to Financial Statements (continued)
3. Investments in Master Funds (continued)
| 3. | Investments in Master Funds (continued) |
The following table summarizes the financial position of each Master Fund as of December 31, 2011:2012:
| | | Graham Commodity Strategies LLC (Delaware) | | | Graham Energy Focus LLC (Delaware) | | | Graham Fed Policy Ltd. (BVI) | | | Graham Global Monetary Policy LLC (Delaware) | | | Graham K4D Trading Ltd. (BVI) | | | Graham Macro Directional LLC (Delaware) | | | Graham Commodity Strategies LLC (Delaware) | | | Graham Global Monetary Policy LLC (Delaware) | | | Graham K4D Trading Ltd. (BVI) | |
| Assets: | | | | | | | | | | | | | | | | | | | | | | | | | | | |
| Due from brokers | | $ | 142,601,701 | | | $ | 29,432,093 | | | $ | 37,426,188 | | | $ | 73,168,865 | | | $ | 307,111,336 | | | $ | 12,363,794 | | | $ | 114,206,522 | | | $ | 76,261,597 | | | $ | 29,961,942 | |
| Options, at fair value | | | - | | | | 6,085,420 | | | | - | | | | - | | | | - | | | | - | | |
| Fixed income securities, at fair value | | | | 49,996,302 | | | | - | | | | 124,990,755 | |
| Derivative financial instruments, at fair value | | | - | | | | - | | | | 4,895,517 | | | | 2,556,238 | | | | 41,337,536 | | | | - | | | | 34,869,226 | | | | 13,475,515 | | | | 25,424,116 | |
| CME Membership, at fair value | | | 2,000 | | | | - | | | | - | | | | - | | | | 355,000 | | | | - | | |
| Subscriptions receivable | | | 5,925 | | | | 1,048 | | | | 882 | | | | 40,815 | | | | 34,651 | | | | 2,311 | | |
| CME membership, at fair value | | | | 2,000,300 | | | | - | | | | 793,453 | |
| Dividends receivable | | | | 52,500 | | | | - | | | | - | |
| Other assets | | | | - | | | | 107 | | | | - | |
| Total assets | | | 142,609,626 | | | | 35,518,561 | | | | 42,322,587 | | | | 75,765,918 | | | | 348,838,523 | | | | 12,366,105 | | | | 201,124,850 | | | | 89,737,219 | | | | 181,170,266 | |
| | | | | | | | | | | | | | | | | | | | | | | | | | | | | | | | | | | | | |
| Liabilities: | | | | | | | | | | | | | | | | | | | | | | | | | | | | | | | | | | | | |
| Options, at fair value | | | - | | | | - | | | | 3,048,431 | | | | 296,433 | | | | - | | | | - | | |
| Derivative financial instruments, at fair value | | | 10,834,559 | | | | 13,573,247 | | | | - | | | | - | | | | 15,255,976 | | | | 1,521,488 | | | | 17,032,718 | | | | 1,950,294 | | | | - | |
| Due to brokers | | | | - | | | | - | | | | 1,750,659 | |
| Redemptions payable | | | 5,925 | | | | 1,048 | | | | 1,024 | | | | 40,370 | | | | 34,651 | | | | 2,311 | | | | 5,369 | | | | - | | | | - | |
| Total liabilities | | | 10,840,484 | | | | 13,574,295 | | | | 3,049,455 | | | | 336,803 | | | | 15,290,627 | | | | 1,523,799 | | | | 17,038,087 | | | | 1,950,294 | | | | 1,750,659 | |
| Net assets | | $ | 131,769,142 | | | $ | 21,944,266 | | | $ | 39,273,132 | | | $ | 75,429,115 | | | $ | 333,547,896 | | | $ | 10,842,306 | | | $ | 184,086,763 | | | $ | 87,786,925 | | | $ | 179,419,607 | |
| | | | | | | | | | | | | | | | | | | | | | | | | | | | | | | | | | | | | |
| Percentage of Master Fund held by GAIT | | | 15.04 | % | | | 20.01 | % | | | 15.17 | % | | | 14.18 | % | | | 13.52 | % | | | 17.87 | % | | | 8.87 | % | | | 8.27 | % | | | 13.54 | % |
Graham Alternative Investment Trading LLC
Notes to Financial Statements (continued)
3. | 3. | Investments in Master Funds (continued) |
The following schedules display the condensed schedules of investments for the Master Funds as of December 31, 2011.2012.
| Description | | Number of Contracts | | | Fair Value | | | Percentage of Net Assets of Master Fund | |
| Graham Commodity Strategies LLC | | | | | | | | | |
| Long contracts | | | | | | | | | |
| Futures | | | | | | | | | |
| Brent Crude February 2012-May 2012 | | | 5,558 | | | $ | (1,566,650 | ) | | | (1.19 | )% |
| Coffee May 2012-July 2012 | | | 1,865 | | | | (7,800,506 | ) | | | (5.92 | )% |
| Corn July 2012 | | | 3,693 | | | | 6,097,513 | | | | 4.63 | % |
| Gasoline RBOB December 2012 | | | 750 | | | | (7,893,900 | ) | | | (5.99 | )% |
| Other Gasoline RBOB February 2012 | | | 1,638 | | | | (93,072 | ) | | | (0.07 | )% |
| Natural Gas February 2012-January 2013 | | | 6,254 | | | | (11,037,040 | ) | | | (8.38 | )% |
| Wheat July 2012 | | | 2,504 | | | | (7,274,588 | ) | | | (5.52 | )% |
| Wheat December 2012 | | | 888 | | | | (8,308,563 | ) | | | (6.31 | )% |
| Other Wheat March 2012 | | | 710 | | | | (2,154,100 | ) | | | (1.63 | )% |
| Other Wheat March 2012 - December 2012 | | | 1,674 | | | | 3,218,225 | | | | 2.44 | % |
| WTI Crude April 2012 | | | 8,991 | | | | 36,997,150 | | | | 28.08 | % |
| Other WTI Crude December 2012 - December 2013 | | | 3,523 | | | | 6,861,280 | | | | 5.21 | % |
| Other WTI Crude September 2013 | | | 1,000 | | | | (2,660,000 | ) | | | (2.02 | )% |
| Other commodity | | | | | | | 12,325,498 | | | | 9.35 | % |
| Foreign currency | | | | | | | (39,300 | ) | | | (0.03 | )% |
| U.S. index | | | | | | | (30,612 | ) | | | (0.02 | )% |
| Total futures | | | | | | | 16,641,335 | | | | 12.63 | % |
| | | | | | | | | | | | | |
| Swaps | | | | | | | | | | | | |
| Wheat future May 2012 | | | 269 | | | | 903,018 | | | | 0.69 | % |
| Other commodity futures | | | | | | | (2,762,970 | ) | | | (2.10 | )% |
| Total swaps | | | | | | | (1,859,952 | ) | | | (1.41 | )% |
| Description | | Principal Amount / Notional Amount / Number of Contracts | | | Fair Value | | | Percentage of Net Assets of Master Fund | |
| Graham Commodity Strategies LLC | | | | | | | | | |
| Fixed income securities | | | | | | | | | |
| Bonds (cost $49,989,111) | | | | | | | | | |
| United States | | | | | | | | | |
| U.S. Treasury bill 0.00% due 03/14/13 | | $ | 50,000,000 | | | $ | 49,996,302 | | | | 27.16 | % |
| Total United States | | | | | | | 49,996,302 | | | | 27.16 | % |
| Total bonds | | | | | | | 49,996,302 | | | | 27.16 | % |
| | | | | | | | | | | | | |
| Derivative financial instruments | | | | | | | | | | | | |
| Long contracts | | | | | | | | | | | | |
| Futures | | | | | | | | | | | | |
| Brent Crude March 2013 - September 2013 | | | 9,543 | | | | 14,516,600 | | | | 7.89 | % |
| Natural Gas May 2013 | | | 7,931 | | | | (14,959,620 | ) | | | (8.13 | )% |
| Natural Gas July 2013 | | | 6,351 | | | | (11,052,940 | ) | | | (6.00 | )% |
| Other Natural Gas February 2013 - January 2014 | | | 11,510 | | | | (4,945,000 | ) | | | (2.69 | )% |
| Wheat March 2013 - December 2013 | | | 8,992 | | | | (7,496,000 | ) | | | (4.07 | )% |
| WTI Crude April 2013 | | | 6,643 | | | | 10,201,020 | | | | 5.54 | % |
| WTI Crude November 2013 | | | 1,999 | | | | (12,183,290 | ) | | | (6.62 | )% |
| WTI Crude January 2014 | | | 1,999 | | | | (11,361,590 | ) | | | (6.17 | )% |
| Other WTI Crude February 2013 - June 2014 | | | 8,570 | | | | 13,477,380 | | | | 7.32 | % |
| Other commodity | | | | | | | (24,499,577 | ) | | | (13.31 | )% |
| Total futures | | | | | | | (48,303,017 | ) | | | (26.24 | )% |
| | | | | | | | | | | | | |
| Swaps | | | | | | | | | | | | |
| Commodity futures | | | | | | | (162,119 | ) | | | (0.09 | )% |
| Total swaps | | | | | | | (162,119 | ) | | | (0.09 | )% |
| | | | | | | | | | | | | |
| Forwards | | | | | | | | | | | | |
| Japanese Yen / U.S. dollar 01/04/13 | | JPY180,218,436,000 | | | | (15,289,285 | ) | | | (8.31 | )% |
| Japanese Yen / U.S. dollar 01/07/13 | | JPY 73,665,968,900 | | | | (5,778,001 | ) | | | (3.14 | )% |
| Other foreign currency | | | | | | | 1,376,864 | | | | 0.75 | % |
| Total forwards | | | | | | | (19,690,422 | ) | | | (10.70 | )% |
Graham Alternative Investment Trading LLC
Notes to Financial Statements (continued)
3. | 3. | Investments in Master Funds (continued) |
The following schedules display the condensed schedules of investments for the Master Funds as of December 31, 2011.2012.
| Description | | Number of Contracts | | | Fair Value | | | Percentage of Net Assets of Master Fund | |
| Graham Commodity Strategies LLC (continued) | | | | | | | | | |
| Short contracts | | | | | | | | | |
| Futures | | | | | | | | | |
| Brent Crude Penultimate Financial December 2012 | | | (1,097 | ) | | $ | (9,057,530 | ) | | | (6.87 | )% |
| Other Brent Crude April 2012 - December 2013 | | | (2,581 | ) | | | (4,752,620 | ) | | | (3.61 | )% |
| Coffee March 2012 | | | (1,799 | ) | | | (1,080,731 | ) | | | (0.82 | )% |
| Corn December 2012 | | | (1,074 | ) | | | 1,099,575 | | | | 0.83 | % |
| Gasoil June 2012 - December 2012 | | | (3,748 | ) | | | (10,964,450 | ) | | | (8.32 | )% |
| Natural Gas April 2012 | | | (7,358 | ) | | | 12,529,350 | | | | 9.51 | % |
| Other Natural Gas October 2012 | | | (275 | ) | | | 2,387,340 | | | | 1.81 | % |
| Wheat July 2012 | | | (2,919 | ) | | | 23,443,525 | | | | 17.79 | % |
| Other Wheat May 2012 | | | (765 | ) | | | (792,350 | ) | | | (0.60 | )% |
| WTI Crude October 2012 | | | (1,500 | ) | | | (18,800,000 | ) | | | (14.27 | )% |
| Other WTI Crude February 2012-December 2014 | | | (12,649 | ) | | | (2,116,630 | ) | | | (1.60 | )% |
| Other commodity | | | | | | | (9,868,200 | ) | | | (7.49 | )% |
| U.S. index | | | | | | | (11,021 | ) | | | (0.01 | )% |
| Total futures | | | | | | | (17,983,742 | ) | | | (13.65 | )% |
| | | | | | | | | | | | | |
| Swaps | | | | | | | | | | | | |
| Wheat future March 2012 | | | (1,539 | ) | | | (6,067,775 | ) | | | (4.60 | )% |
| Other Wheat future July 2012 | | | (427 | ) | | | (1,435,788 | ) | | | (1.09 | )% |
| Other commodity futures | | | | | | | (128,637 | ) | | | (0.10 | )% |
| Total swaps | | | | | | | (7,632,200 | ) | | | (5.79 | )% |
| | | | | | | | | | | | | |
| Total | | | | | | $ | (10,834,559 | ) | | | (8.22 | )% |
| Description | | Number of Contracts | | | Fair Value | | | Percentage of Net Assets of Master Fund | |
| Graham Commodity Strategies LLC (continued) | | | | | | | | | |
| Derivative financial instruments (continued) | | | | | | | | | |
| Long contracts (continued) | | | | | | | | | |
| Options | | | | | | | | | |
| Natural Gas Futures February 2013 - January 2015 Call $3.75 - $5.00 | | | 2,150 | | | $ | 1,591,150 | | | | 0.86 | % |
| Natural Gas Futures March 2013 - April 2013 Put $0.00 - $3.25 | | | 4,100 | | | | 1,971,000 | | | | 1.07 | % |
| Other commodity | | | | | | | 521,780 | | | | 0.28 | % |
| U.S. dollar / Japanese Yen February 2013 - May 2013 Call $85.00 - $88.00 | | | 4 | | | | 16,385,856 | | | | 8.90 | % |
| Other currency | | | | | | | 1,195,163 | | | | 0.66 | % |
| U.S. bond | | | | | | | 574,219 | | | | 0.31 | % |
| U.S. index | | | | | | | 1,856,250 | | | | 1.01 | % |
| Total options | | | | | | | 24,095,418 | | | | 13.09 | % |
Graham Alternative Investment Trading LLC
Notes to Financial Statements (continued)
3. | 3. | Investments in Master Funds (continued) |
The following schedules display the condensed schedules of investments for the Master Funds as of December 31, 2011.2012.
| Description | | Number of Contracts | | | Fair Value | | | Percentage of Net Assets of Master Fund | |
| Graham Energy Focus LLC | | | | | | | | | |
| Long contracts | | | | | | | | | |
| Futures | | | | | | | | | |
| Henry Hub Penultimate March 2012 | | | 4,031 | | | $ | (11,345,235 | ) | | | (51.70 | )% |
| Henry Hub Penultimate April 2013 | | | 2,550 | | | | (4,180,875 | ) | | | (19.05 | )% |
| Other Henry Hub Penultimate February 2012 - December 2012 | | | 5,156 | | | | (7,521,975 | ) | | | (34.28 | )% |
| Natural Gas December 2012 | | | 1,083 | | | | (1,437,960 | ) | | | (6.55 | )% |
| Natural Gas January 2013 | | | 2,083 | | | | (5,207,770 | ) | | | (23.73 | )% |
| Other Natural Gas March 2013 - October 2013 | | | 200 | | | | (1,204,420 | ) | | | (5.49 | )% |
| Other commodity | | | | | | | (25,000 | ) | | | (0.12 | )% |
| Total futures | | | | | | | (30,923,235 | ) | | | (140.92 | )% |
| | | | | | | | | | | | | |
| Options | | | | | | | | | | | | |
| Natural Gas EURO February 2012, $4.80 Put | | | 100 | | | | 1,810,600 | | | | 8.25 | % |
| Natural Gas EURO March 2012, $4.80 Put | | | 100 | | | | 1,784,000 | | | | 8.13 | % |
| Natural Gas EURO April 2012 - October 2012, $0.20 - $4.50 Put | | | 850 | | | | 5,012,500 | | | | 22.84 | % |
| Total options | | | | | | | 8,607,100 | | | | 39.22 | % |
| | | | | | | | | | | | | |
| Swaps | | | | | | | | | | | | |
| Natural Gas February 2012 | | | 3,915 | | | | (11,572,885 | ) | | | (52.74 | )% |
| Natural Gas March 2012 | | | 1,767 | | | | (6,214,880 | ) | | | (28.32 | )% |
| Natural Gas April 2012 | | | 1,250 | | | | (1,615,525 | ) | | | (7.36 | )% |
| Natural Gas May 2012 | | | 930 | | | | (1,610,140 | ) | | | (7.34 | )% |
| Natural Gas June 2012 | | | 900 | | | | (1,443,450 | ) | | | (6.58 | )% |
| Natural Gas July 2012 | | | 930 | | | | (1,349,740 | ) | | | (6.15 | )% |
| Natural Gas August 2012 | | | 930 | | | | (1,273,015 | ) | | | (5.80 | )% |
| Natural Gas September 2012 | | | 900 | | | | (1,216,200 | ) | | | (5.54 | )% |
| Natural Gas November 2012 | | | 1,630 | | | | (1,596,325 | ) | | | (7.27 | )% |
| Other Natural Gas January 2012 - November 2013 | | | 1,765 | | | | (916,000 | ) | | | (4.18 | )% |
| Total swaps | | | | | | | (28,808,160 | ) | | | (131.28 | )% |
| Description | | Number of Contracts / Notional Amount | | | Fair Value | | | Percentage of Net Assets of Master Fund | |
| Graham Commodity Strategies LLC (continued) | | | | | | | | | |
| Derivative financial instruments (continued) | | | | | | | | | |
| Short contracts | | | | | | | | | |
| Futures | | | | | | | | | |
| Brent Crude February 2013 - December 2014 | | | (8,330 | ) | | $ | (10,374,090 | ) | | | (5.64 | )% |
| Natural Gas March 2013 | | | (5,467 | ) | | | 16,116,840 | | | | 8.76 | % |
| Natural Gas April 2013 | | | (10,618 | ) | | | 27,581,820 | | | | 14.99 | % |
| Other Natural Gas February 2013 - April 2014 | | | (9,670 | ) | | | 5,062,300 | | | | 2.75 | % |
| Wheat March 2013 - July 2013 | | | (8,999 | ) | | | 8,924,988 | | | | 4.85 | % |
| WTI Crude March 2013 | | | (5,663 | ) | | | (9,638,060 | ) | | | (5.24 | )% |
| WTI Crude June 2013 | | | (3,787 | ) | | | (12,403,880 | ) | | | (6.74 | )% |
| Other WTI Crude February 2013 - December 2015 | | | (10,649 | ) | | | (15,529,960 | ) | | | (8.44 | )% |
| Other commodity | | | | | | | 22,886,444 | | | | 12.44 | % |
| U.S. bond | | | | | | | 45,313 | | | | 0.02 | % |
| U.S. index | | | | | | | 7,500 | | | | 0.00 | % |
| Total futures | | | | | | | 32,679,215 | | | | 17.75 | % |
| | | | | | | | | | | | | |
| Swaps | | | | | | | | | | | | |
| Commodity futures | | | | | | | 59,748 | | | | 0.03 | % |
| Total swaps | | | | | | | 59,748 | | | | 0.03 | % |
| | | | | | | | | | | | | |
| Forwards | | | | | | | | | | | | |
| U.S. dollar / Japanese Yen 01/04/13 | | JPY(179,649,983,200) | | | | 21,846,045 | | | | 11.87 | % |
| U.S. dollar / Japanese Yen 01/07/13 | | JPY(186,460,696,800) | | | | 14,713,710 | | | | 7.99 | % |
| U.S. dollar / Japanese Yen 01/07/13 | | JPY (2,602,098,000) | | | | (14,672 | ) | | | (0.01 | )% |
| Other foreign currency | | | | | | | (798,071 | ) | | | (0.43 | )% |
| Total forwards | | | | | | | 35,747,012 | | | | 19.42 | % |
| | | | | | | | | | | | | |
| Options | | | | | | | | | | | | |
| Natural Gas Futures April 2013 Put $3.00 | | | (250 | ) | | | (182,500 | ) | | | (0.10 | )% |
| Natural Gas Futures February 2013 - January 2015 Call $0.10 - $5.50 | | | (3,350 | ) | | | (979,700 | ) | | | (0.53 | )% |
| Other commodity | | | | | | | (21,000 | ) | | | (0.01 | )% |
| Currency | | | | | | | (5,242,064 | ) | | | (2.84 | )% |
| U.S. bond | | | | | | | (164,063 | ) | | | (0.09 | )% |
| Total options | | | | | | | (6,589,327 | ) | | | (3.57 | )% |
| Total | | | | | | $ | 67,832,810 | | | | 36.85 | % |
Graham Alternative Investment Trading LLC
Notes to Financial Statements (continued)
3. | 3. | Investments in Master Funds (continued) |
The following schedules display the condensed schedules of investments for the Master Funds as of December 31, 2011.2012.
| Description | | Number of Contracts | | | Fair Value | | | Percentage of Net Assets of Master Fund | |
| Graham Energy Focus LLC (continued) | | | | | | | | | |
| Short contracts | | | | | | | | | |
| Futures | | | | | | | | | |
| Henry Hub Penultimate February 2012 | | | (3,971 | ) | | $ | 11,724,378 | | | | 53.43 | % |
| Henry Hub Penultimate October 2012 | | | (2,124 | ) | | | 4,157,730 | | | | 18.95 | % |
| Henry Hub Penultimate April 2012 | | | (1,340 | ) | | | 1,845,850 | | | | 8.41 | % |
| Other Henry Hub Penultimate June 2012 - September 2012 | | | (612 | ) | | | 2,458,900 | | | | 11.21 | % |
| Natural Gas March 2012 | | | (1,709 | ) | | | 6,557,620 | | | | 29.88 | % |
| Natural Gas April 2012 | | | (1,318 | ) | | | 2,137,030 | | | | 9.74 | % |
| Natural Gas May 2012 | | | (197 | ) | | | 1,589,960 | | | | 7.25 | % |
| Natural Gas June 2012 | | | (188 | ) | | | 1,293,180 | | | | 5.89 | % |
| Natural Gas October 2012 | | | (1,011 | ) | | | 1,398,270 | | | | 6.37 | % |
| Natural Gas November 2012 | | | (1,355 | ) | | | 2,352,710 | | | | 10.72 | % |
| Natural Gas April 2013 | | | (696 | ) | | | 3,780,580 | | | | 17.23 | % |
| Other Natural Gas February 2012 - November 2013 | | | (703 | ) | | | 3,128,470 | | | | 14.26 | % |
| Other commodity | | | | | | | 95,180 | | | | 0.43 | % |
| Total futures | | | | | | | 42,519,858 | | | | 193.77 | % |
| | | | | | | | | | | | | |
| Options | | | | | | | | | | | | |
| Natural Gas EURO February 2012 - December 2012, $4.00 - $6.50 Call | | | (3,100 | ) | | | (769,600 | ) | | | (3.51 | )% |
| Natural Gas EURO February 2012 - March 2012, $3.00 - $3.25 Put | | | (800 | ) | | | (1,436,100 | ) | | | (6.54 | )% |
| Other commodity | | | | | | | (315,980 | ) | | | (1.44 | )% |
| Total options | | | | | | | (2,521,680 | ) | | | (11.49 | )% |
| | | | | | | | | | | | | |
| Swaps | | | | | | | | | | | | |
| Natural Gas January 2013 | | | (1,116 | ) | | | 1,752,508 | | | | 7.99 | % |
| Natural Gas May 2012 - September 2012 | | | (1,983 | ) | | | 1,910,892 | | | | 8.70 | % |
| Other Natural Gas December 2013 | | | (62 | ) | | | (25,110 | ) | | | (0.11 | )% |
| Total swaps | | | | | | | 3,638,290 | | | | 16.58 | % |
| | | | | | | | | | | | | |
| Total | | | | | | $ | (7,487,827 | ) | | | (34.12 | )% |
| Description | Notional Amount | | Fair Value | | | Percentage of Net Assets of Master Fund | |
| Graham Global Monetary Policy LLC | | | | | | | |
| Derivative financial instruments | | | | | | | |
| Long contracts | | | | | | | |
| Futures | | | | | | | |
| Foreign bond | | | $ | 145,741 | | | | 0.17 | % |
| Foreign index | | | | 2,401,384 | | | | 2.73 | % |
| Interest rate | | | | (1,575,000 | ) | | | (1.79 | )% |
| Total futures | | | | 972,125 | | | | 1.11 | % |
| | | | | | | | | | |
| Forwards | | | | | | | | | |
| Brazilian Real / U.S. dollar 01/03/13 | BRL 838,687,500 | | | 10,278,835 | | | | 11.71 | % |
| Chinese Yuan / U.S. dollar 01/03/13 - 06/27/13 | | | | 4,523,387 | | | | 5.15 | % |
| Mexican Peso / U.S. dollar 01/02/13 - 01/03/13 | | | | 7,159,228 | | | | 8.16 | % |
| Other foreign currency | | | | (963,799 | ) | | | (1.10 | )% |
| Total forwards | | | | 20,997,651 | | | | 23.92 | % |
| | | | | | | | | | |
| Options | | | | | | | | | |
| Interest rate | | | | 625,000 | | | | 0.71 | % |
| U.S. index | | | | 158,750 | | | | 0.18 | % |
| Foreign currency | | | | 529,605 | | | | 0.61 | % |
| Total options | | | | 1,313,355 | | | | 1.50 | % |
| | | | | | | | | | |
| Short contracts | | | | | | | | | |
| Futures | | | | | | | | | |
| Foreign index | | | | (328,287 | ) | | | (0.37 | )% |
| Foreign bond | | | | 492,734 | | | | 0.56 | % |
| Interest rate | | | | 2,371,123 | | | | 2.70 | % |
| U.S. bond | | | | 759,204 | | | | 0.86 | % |
| Total futures | | | | 3,294,774 | | | | 3.75 | % |
| | | | | | | | | | |
| Forwards | | | | | | | | | |
| U.S. dollar / Brazilian Dollar 01/03/13 | BRL (838,687,500) | | | (6,955,653 | ) | | | (7.92 | )% |
| Other foreign currency | | | | (4,833,382 | ) | | | (5.51 | )% |
| Total forwards | | | | (11,789,035 | ) | | | (13.43 | )% |
| | | | | | | | | | |
| Options | | | | | | | | | |
| Interest rate | | | | (468,750 | ) | | | (0.53 | )% |
| Foreign currency | | | | (2,794,899 | ) | | | (3.19 | )% |
| Total options | �� | | | (3,263,649 | ) | | | (3.72 | )% |
| | | | | | | | | | |
| Total | | | $ | 11,525,221 | | | | 13.13 | % |
Graham Alternative Investment Trading LLC
Notes to Financial Statements (continued)
3. | 3. | Investments in Master Funds (continued) |
The following schedules display the condensed schedules of investments for the Master Funds as of December 31, 2011.2012.
| Description | | Principal Amount / Notional Amount / Number of Contracts | | | Fair Value | | | Percentage of Net Assets of Master Fund | |
| Graham K4D Trading Ltd. | | | | | | | | | |
| Fixed income securities | | | | | | | | | |
| Bonds (cost $124,963,438) | | | | | | | | | |
| United States | | | | | | |
| U.S. Treasury bill 0.00% due 03/14/13 | | $ | 125,000,000 | | | $ | 124,990,755 | | | | 69.66 | % |
| Total United States | | | | | | | 124,990,755 | | | | 69.66 | % |
| Total bonds | | | | | | | 124,990,755 | | | | 69.66 | % |
| | | | | | | | | | | | | |
| Derivative financial instruments | | | | | | | | | | | | |
| Long contracts | | | | | | | | | | | | |
| Futures | | | | | | | | | | | | |
| Nikkei 225 Index March 2013 | | | 2,254 | | | | 11,197,084 | | | | 6.24 | % |
| Topix Index March 2013 | | | 1,383 | | | | 11,116,231 | | | | 6.20 | % |
| Other foreign index | | | | | | | (1,641,221 | ) | | | (0.92 | )% |
| Commodity | | | | | | | 40,893 | | | | 0.02 | % |
| Currency | | | | | | | 19,615 | | | | 0.01 | % |
| Interest rate | | | | | | | 989,629 | | | | 0.55 | % |
| Foreign bond | | | | | | | 3,888,306 | | | | 2.17 | % |
| U.S. bond | | | | | | | 372,289 | | | | 0.21 | % |
| U.S. index | | | | | | | 345,055 | | | | 0.19 | % |
| Total futures | | | | | | | 26,327,881 | | | | 14.67 | % |
| | | | | | | | | | | | | |
| Forwards | | | | | | | | | | | | |
| Foreign currency | | | | | | | (1,692,952 | ) | | | (0.94 | )% |
| Total forwards | | | | | | | (1,692,952 | ) | | | (0.94 | )% |
| Description | | Number of Contracts | | | Fair Value | | | Percentage of Net Assets of Master Fund | |
| Graham Fed Policy Ltd. | | | | | | | | | |
| Long contracts | | | | | | | | | |
| Futures | | | | | | | | | |
| 30 Day Fed Fund June 2012 | | | 8,547 | | | $ | 2,324,519 | | | | 5.92 | % |
| Other 30 Day Fed Fund January 2012 - December 2013 | | | 26,631 | | | | 2,594,437 | | | | 6.60 | % |
| Other 30 Day Fed Fund November 2012 - October 2013 | | | 1,598 | | | | (23,439 | ) | | | (0.06 | )% |
| Total futures | | | | | | | 4,895,517 | | | | 12.46 | % |
| | | | | | | | | | | | | |
| Options | | | | | | | | | | | | |
| Interest rate futures | | | | | | | 549,104 | | | | 1.40 | % |
| Total options | | | | | | | 549,104 | | | | 1.40 | % |
| | | | | | | | | | | | | |
| Short contracts | | | | | | | | | | | | |
| Options | | | | | | | | | | | | |
| Fed Fund futures February 2012 - June 2012, $99.88 Call | | | (12,650 | ) | | | (2,304,872 | ) | | | (5.87 | )% |
| Fed Fund futures January 2012 - June 2012, $99.75 - $99.88 Put | | | (25,162 | ) | | | (1,255,163 | ) | | | (3.19 | )% |
| Other interest rate futures | | | | | | | (37,500 | ) | | | (0.10 | )% |
| Total options | | | | | | | (3,597,535 | ) | | | (9.16 | )% |
| | | | | | | | | | | | | |
| Total | | | | | | $ | 1,847,086 | | | | 4.70 | % |
Graham Alternative Investment Trading LLC
Notes to Financial Statements (continued)
3. | 3. | Investments in Master Funds (continued) |
The following schedules display the condensed schedules of investments for the Master Funds as of December 31, 2011.2012.
| Description | Notional Amount | | Fair Value | | | Percentage of Net Assets of Master Fund | | Notional Amount | | Fair Value | | | Percentage of Net Assets of Master Fund | |
| Graham Global Monetary Policy LLC | | | | | | | | |
| Long contracts | | | | | | | | |
| Graham K4D Trading Ltd. (continued) | | | | | | | | |
| Derivative financial instruments (continued) | | | | | | | | |
| Short contracts | | | | | | | | |
| Futures | | | | | | | | | | | | | | |
| Foreign index | | | | $ | (73,012 | ) | | | (0.04 | )% |
| Commodity | | | | | (7,643,113 | ) | | | (4.27 | )% |
| Currency | | | | | 1,060,981 | | | | 0.59 | % |
| Interest rate | | | | | (39,202 | ) | | | (0.02 | )% |
| Foreign bond | | | $ | 298,460 | | | | 0.40 | % | | | | (241,205 | ) | | | (0.13 | )% |
| U.S. bond | | | | | 243,652 | | | | 0.14 | % |
| U.S. index | | | | | (353,828 | ) | | | (0.20 | )% |
| Total futures | | | | 298,460 | | | | 0.40 | % | | | | (7,045,727 | ) | | | (3.93 | )% |
| | | | | | | | | | | | | | | | | | | |
| Options | | | | | | | | | | |
| Foreign currency | | | | 339,824 | | | | 0.45 | % | |
| Total options | | | | 339,824 | | | | 0.45 | % | |
| | | | | | | | | | | |
| Forwards | | | | | | | | | | | | | | | | | | |
| Chinese Yuan / U.S. dollar January 2012 – December 2012 | CNY 3,296,537,500 | | | 4,745,926 | | | | 6.29 | % | |
| Other foreign currency | | | | 4,716,017 | | | | 6.25 | % | |
| Total forwards | | | | 9,461,943 | | | | 12.54 | % | |
| | | | | | | | | | | |
| Short contracts | | | | | | | | | | |
| Futures | | | | | | | | | | |
| Interest rate | | | | 94,330 | | | | 0.13 | % | |
| Total futures | | | | 94,330 | | | | 0.13 | % | |
| | | | | | | | | | | |
| Options | | | | | | | | | | |
| Foreign currency | | | | (636,257 | ) | | | (0.84 | )% | |
| Total options | | | | (636,257 | ) | | | (0.84 | )% | |
| | | | | | | | | | | |
| Forwards | | | | | | | | | | |
| Chinese Yuan / U.S. dollar January 2012 – December 2012 | CNY (3,619,150,000) | | | (3,949,883 | ) | | | (5.24 | )% | |
| U.S. Dollar / Japanese Yen 03/21/13 | | JPY(24,575,106,969) | | | 9,839,401 | | | | 5.48 | % |
| U.S. Dollar / Japanese Yen 01/04/13 - 01/07/13 | | JPY (2,181,627,007) | | | 105,135 | | | | 0.06 | % |
| Other foreign currency | | | | (3,348,612 | ) | | | (4.44 | )% | | | | (2,109,622 | ) | | | (1.17 | )% |
| Total forwards | | | | (7,298,495 | ) | | | (9.68 | )% | | | | 7,834,914 | | | | 4.37 | % |
| Total | | | $ | 2,259,805 | | | | 3.00 | % | | | $ | 150,414,871 | | | | 83.83 | % |
Graham Alternative Investment Trading LLC
Notes to Financial Statements (continued)
| 3. | Investments in Master Funds (continued) |
3. Investments in Master Funds (continued)
The following schedule displays the condensed schedule of investments for the Master Funds as of December 31, 2011.
| Description | | Fair Value | | | Percentage of Net Assets of Master Fund | |
| Graham K4D Trading Ltd. | | | | | | |
| Long contracts | | | | | | |
| Futures | | | | | | |
| U.S. bond | | $ | 5,555,669 | | | | 1.67 | % |
| Foreign bond | | | 15,262,571 | | | | 4.58 | % |
| U.S. index | | | 2,281,203 | | | | 0.68 | % |
| Foreign index | | | 1,698,637 | | | | 0.51 | % |
| Commodity | | | (255,745 | ) | | | (0.08 | )% |
| Interest rate | | | 903,752 | | | | 0.27 | % |
| Currency | | | 839,900 | | | | 0.25 | % |
| Total futures | | | 26,285,987 | | | | 7.88 | % |
| | | | | | | | | |
| Forwards | | | | | | | | |
| Foreign currency | | | 8,206,755 | | | | 2.46 | % |
| Total forwards | | | 8,206,755 | | | | 2.46 | % |
| | | | | | | | | |
| Short contracts | | | | | | | | |
| Futures | | | | | | | | |
| Foreign bond | | | (7,404 | ) | | | (0.00 | )% |
| U.S. index | | | 5,540 | | | | 0.00 | % |
| Foreign index | | | (1,563,165 | ) | | | (0.47 | )% |
| Commodity | | | 615,434 | | | | 0.18 | % |
| Interest rate | | | (1,288,252 | ) | | | (0.38 | )% |
| Currency | | | 337,837 | | | | 0.10 | % |
| Total futures | | | (1,900,010 | ) | | | (0.57 | )% |
| | | | | | | | | |
| Swaps | | | | | | | | |
| Commodity | | | (15,255,976 | ) | | | (4.57 | )% |
| Total swaps | | | (15,255,976 | ) | | | (4.57 | )% |
| | | | | | | | | |
| Forwards | | | | | | | | |
| Foreign currency | | | 8,744,804 | | | | 2.62 | % |
| Total forwards | | | 8,744,804 | | | | 2.62 | % |
| | | | | | | | | |
| Total | | $ | 26,081,560 | | | | 7.82 | % |
Graham Alternative Investment Trading LLC
Notes to Financial Statements (continued)
3. Investments in Master Funds (continued)
The following schedules display the condensed schedules of investments for the Master Funds as of December 31, 2011.
| Description | Notional Amount | | Fair Value | | | Percentage of Net Assets of Master Fund | |
| Graham Macro Directional LLC | | | | | | | |
| Long contracts | | | | | | | |
| Futures | | | | | | | |
| Foreign bond | | | $ | (21,390 | ) | | | (0.20 | )% |
| Total forwards | | | | (21,390 | ) | | | (0.20 | )% |
| | | | | | | | | | |
| Forwards | | | | | | | | | |
| Foreign currency | | | | 227,165 | | | | 2.10 | % |
| Total forwards | | | | 227,165 | | | | 2.10 | % |
| | | | | | | | | | |
| Short contracts | | | | | | | | | |
| Futures | | | | | | | | | |
| U.S. index | | | | (22,500 | ) | | | (0.21 | )% |
| Total futures | | | | (22,500 | ) | | | (0.21 | )% |
| | | | | | | | | | |
| Forwards | | | | | | | | | |
| Australian dollar / U.S. dollar 01/03/12 | AUD (40,000,000) | | | (555,000 | ) | | | (5.12 | )% |
| Other foreign currency | | | | (1,149,763 | ) | | | (10.60 | )% |
| Total forwards | | | | (1,704,763 | ) | | | (15.72 | )% |
| | | | | | | | | | |
| Total | | | $ | (1,521,488 | ) | | | (14.03 | )% |
Graham Alternative Investment Trading LLC
Notes to Financial Statements (continued)
3. Investments in Master Funds (continued)
The following table shows the fair value classification of each investment type by Master Fund as of December 31, 2011:2012:
| | | Graham Commodity Strategies LLC | | | Graham Energy Focus LLC | | | Graham Fed Policy Ltd. | | | Graham Global Monetary Policy LLC | | | Graham K4D Trading Ltd. | | | Graham Macro Directional LLC | |
| Assets | | | | | | | | | | | | | | | | | | |
| Level 1: | | | | | | | | | | | | | | | | | | |
| U.S. bond futures | | $ | - | | | $ | - | | | $ | - | | | $ | - | | | $ | 5,807,164 | | | $ | - | |
| Foreign bond futures | | | - | | | | - | | | | - | | | | 385,999 | | | | 15,262,571 | | | | - | |
| U.S. index futures | | | - | | | | - | | | | - | | | | - | | | | 3,038,693 | | | | - | |
| Foreign index futures | | | - | | | | - | | | | - | | | | - | | | | 1,954,287 | | | | - | |
| Commodity futures | | | 121,643,778 | | | | 42,519,858 | | | | - | | | | - | | | | 15,602,465 | | | | - | |
| Commodity futures options | | | - | | | | 8,607,100 | | | | - | | | | - | | | | - | | | | - | |
| Commodity futures swaps | | | 2,117,443 | | | | 3,663,400 | | | | - | | | | - | | | | - | | | | - | |
| Interest rate futures | | | - | | | | - | | | | 4,918,956 | | | | 94,330 | | | | 1,693,157 | | | | - | |
| Interest rate futures options | | | - | | | | - | | | | 549,104 | | | | - | | | | - | | | | - | |
| Currency futures | | | - | | | | - | | | | - | | | | - | | | | 1,406,611 | | | | - | |
| Total Level 1 | | | 123,761,221 | | | | 54,790,358 | | | | 5,468,060 | | | | 480,329 | | | | 44,764,948 | | | | - | |
| | | | | | | | | | | | | | | | | | | | | | | | | |
| Level 2: | | | | | | | | | | | | | | | | | | | | | | | | |
| Foreign currency forwards | | | - | | | | - | | | | - | | | | 8,341,253 | | | | 21,958,196 | | | | 37,206 | |
| Foreign currency options | | | - | | | | - | | | | - | | | | 339,824 | | | | - | | | | - | |
| Total Level 2 | | | - | | | | - | | | | - | | | | 8,681,077 | | | | 21,958,196 | | | | 37,206 | |
| Total assets | | $ | 123,761,221 | | | $ | 54,790,358 | | | $ | 5,468,060 | | | $ | 9,161,406 | | | $ | 66,723,144 | | | $ | 37,206 | |
| | | | | | | | | | | | | | | | | | | | | | | | | |
| Liabilities | | | | | | | | | | | | | | | | | | | | | | | | |
| Level 1: | | | | | | | | | | | | | | | | | | | | | | | | |
| U.S. bond futures | | $ | - | | | $ | - | | | $ | - | | | $ | - | | | $ | (251,495 | ) | | $ | - | |
| Foreign bond futures | | | - | | | | - | | | | - | | | | (87,539 | ) | | | (7,404 | ) | | | (21,390 | ) |
| Foreign index futures | | | - | | | | - | | | | - | | | | - | | | | (1,818,815 | ) | | | - | |
| U.S. index futures | | | (41,633 | ) | | | - | | | | - | | | | - | | | | (751,950 | ) | | | (22,500 | ) |
| Commodity futures | | | (122,905,252 | ) | | | (30,923,235 | ) | | | - | | | | - | | | | (15,242,776 | ) | | | - | |
| Commodity futures options | | | - | | | | (2,521,680 | ) | | | - | | | | - | | | | - | | | | - | |
| Commodity futures swaps | | | (11,609,595 | ) | | | (28,833,270 | ) | | | - | | | | - | | | | (15,255,976 | ) | | | - | |
| Interest rate futures | | | - | | | | - | | | | (23,439 | ) | | | - | | | | (2,077,657 | ) | | | - | |
| Interest rate futures options | | | - | | | | - | | | | (3,597,535 | ) | | | - | | | | - | | | | - | |
| Currency futures | | | (39,300 | ) | | | - | | | | - | | | | - | | | | (228,874 | ) | | | - | |
| Total Level 1 | | | (134,595,780 | ) | | | (62,278,185 | ) | | | (3,620,974 | ) | | | (87,539 | ) | | | (35,634,947 | ) | | | (43,890 | ) |
| | | | | | | | | | | | | | | | | | | | | | | | | |
| Level 2: | | | | | | | | | | | | | | | | | | | | | | | | |
| Foreign currency forwards | | | - | | | | - | | | | - | | | | (6,177,805 | ) | | | (5,006,637 | ) | | | (1,514,804 | ) |
| Foreign currency options | | | - | | | | - | | | | - | | | | (636,257 | ) | | | - | | | | - | |
| Total Level 2 | | | - | | | | - | | | | - | | | | (6,814,062 | ) | | | (5,006,637 | ) | | | (1,514,804 | ) |
| Total liabilities | | $ | (134,595,780 | ) | | $ | (62,278,185 | ) | | $ | (3,620,974 | ) | | $ | (6,901,601 | ) | | $ | (40,641,584 | ) | | $ | (1,558,694 | ) |
| | | Graham Commodity Strategies LLC | | | Graham Global Monetary Policy LLC | | | Graham K4D Trading Ltd. | |
| Assets | | | | | | | | | |
| Level 1: | | | | | | | | | |
| U.S. bond futures | | $ | 45,313 | | | $ | 921,438 | | | $ | 927,920 | |
| U.S. bond futures options | | | 574,219 | | | | - | | | | - | |
| Foreign bond futures | | | - | | | | 638,475 | | | | 7,253,098 | |
| Foreign index futures | | | - | | | | 2,401,384 | | | | 23,920,199 | |
| U.S. index futures | | | 7,500 | | | | - | | | | 1,461,395 | |
| U.S. index futures options | | | 1,856,250 | | | | 158,750 | | | | - | |
| Commodity futures | | | 136,583,500 | | | | - | | | | 10,650,606 | |
| Commodity futures options | | | 4,083,930 | | | | - | | | | - | |
| Commodity futures swaps | | | 59,748 | | | | - | | | | - | |
| Interest rate futures | | | - | | | | 2,202,373 | | | | 1,735,617 | |
| Interest rate futures options | | | - | | | | 625,000 | | | | - | |
| Currency futures | | | - | | | | - | | | | 1,104,266 | |
| Equity securities | | | 2,000,300 | | | | - | | | | 793,453 | |
| Total Level 1 | | | 145,210,760 | | | | 6,947,420 | | | | 47,846,554 | |
| | | | | | | | | | | | | |
| Level 2: | | | | | | | | | | | | |
| Foreign currency forwards | | | 38,314,684 | | | | 36,251,151 | | | | 19,238,245 | |
| Foreign currency options | | | 17,581,019 | | | | 529,605 | | | | - | |
| Fixed income securities | | | 49,996,302 | | | | - | | | | 124,990,755 | |
| Total Level 2 | | | 105,892,005 | | | | 36,780,756 | | | | 144,229,000 | |
| Total assets | | $ | 251,102,765 | | | $ | 43,728,176 | | | $ | 192,075,554 | |
| | | | | | | | | | | | | |
| Liabilities | | | | | | | | | | | | |
| Level 1: | | | | | | | | | | | | |
| U.S. bond futures | | $ | - | | | $ | (162,234 | ) | | $ | (311,979 | ) |
| U.S. bond futures options | | | (164,063 | ) | | | - | | | | - | |
| Foreign bond futures | | | - | | | | - | | | | (3,605,997 | ) |
| Foreign index futures | | | - | | | | (328,287 | ) | | | (3,321,117 | ) |
| U.S. index futures | | | - | | | | - | | | | (1,470,168 | ) |
| Commodity futures | | | (152,260,115 | ) | | | - | | | | (18,252,826 | ) |
| Commodity futures options | | | (1,183,200 | ) | | | - | | | | - | |
| Commodity futures swaps | | | (162,119 | ) | | | - | | | | - | |
| Interest rate futures | | | - | | | | (1,406,250 | ) | | | (785,190 | ) |
| Interest rate futures options | | | - | | | | (468,750 | ) | | | - | |
| Currency futures | | | - | | | | - | | | | (23,670 | ) |
| Total Level 1 | | | (153,769,497 | ) | | | (2,365,521 | ) | | | (27,770,947 | ) |
| | | | | | | | | | | | | |
| Level 2: | | | | | | | | | | | | |
| Foreign currency forwards | | | (22,258,094 | ) | | | (27,042,535 | ) | | | (13,096,283 | ) |
| Foreign currency options | | | (5,242,064 | ) | | | (2,794,899 | ) | | | - | |
| Total Level 2 | | | (27,500,158 | ) | | | (29,837,434 | ) | | | (13,096,283 | ) |
| Total liabilities | | $ | (181,269,655 | ) | | $ | (32,202,955 | ) | | $ | (40,867,230 | ) |
Graham Alternative Investment Trading LLC
Notes to Financial Statements (continued)
| 3. | Investments in Master Funds (continued) |
3. Investments in Master Funds (continued)
The following table displays the gross volume of derivative activities based on their notional amounts and number of contracts and fair value of derivative contracts held by the Master Funds at December 31, 20112012 categorized by primary underlying risk and areis representative of the derivative positions held by the Master Funds throughout the year. Derivatives denominated in foreign currencies have been converted to U.S. dollars. Derivative assetsasset and liability balances are presented on a gross basis, prior to the application of counterparty netting. The Master Funds trade futures and options on a leveraged basis. Due to the low margin deposits normally required for trading these derivative financial instruments, the gross notional exposure as displayed in the tables below may exceed the net asset value of the Master Funds by a significant amount. As a result, a relatively small price movement in an underlying derivative financial instrument may result in immediate and substantial effect on the net income and net asset value of the Master Funds and GAIT. Amounts presented below as collateral balances supporting all derivative positions are included in due from brokers and fixed income securities on the respective Master Fund’s statementFunds’ statements of financial condition.
| | | Graham Commodity Strategies LLC | | | Graham Global Monetary Policy LLC | |
| | | Long exposure | | | Short exposure | | | | | | | | | Long exposure | | | Short exposure | | | | | | | |
| | | Notional amounts | | | Number of contracts | | | Notional amounts | | | Number of contracts | | | Derivative Assets | | | Derivative Liabilities | | | Notional amounts | | | Number of contracts | | | Notional amounts | | | Number of contracts | | | Derivative Assets | | | Derivative Liabilities | |
| Commodity price | | | | | | | | | | | | | | | | | | | | | | | | | | | | | | | | | | | | |
| Futures | | $ | 6,957,172,641 | | | | 102,887 | | | $ | (6,812,506,601 | ) | | | (100,934 | ) | | $ | 136,583,500 | | | $ | (152,260,115 | ) | | $ | - | | | | - | | | $ | - | | | | - | | | $ | - | | | $ | - | |
| Options(a) | | | 35,431,382 | | | | 7,568 | | | | (17,122,694 | ) | | | (3,700 | ) | | | 4,083,930 | | | | (1,183,200 | ) | | | - | | | | - | | | | - | | | | - | | | | - | | | | - | |
| Swaps | | | 5,039,580 | | | | 142 | | | | (4,869,180 | ) | | | (142 | ) | | | 59,748 | | | | (162,119 | ) | | | - | | | | - | | | | - | | | | - | | | | - | | | | - | |
| | | | 6,997,643,603 | | | | 110,597 | | | | (6,834,498,475 | ) | | | (104,776 | ) | | | 140,727,178 | | | | (153,605,434 | ) | | | - | | | | - | | | | - | | | | - | | | | - | | | | - | |
| | | | | | | | | | | | | | | | | | | | | | | | | | | | | | | | | | | | | | | | | | | | | | | | | |
| Equity price | | | | | | | | | | | | | | | | | | | | | | | | | | | | | | | | | | | | | | | | | | | | | | | | |
| Futures | | | - | | | | - | | | | (10,650,000 | ) | | | (150 | ) | | | 7,500 | | | | - | | | | 41,877,970 | | | | 450 | | | | (9,872,405 | ) | | | (165 | ) | | | 2,401,384 | | | | (328,287 | ) |
| Options(a) | | | 61,067,207 | | | | 3,000 | | | | - | | | | - | | | | 1,856,250 | | | | - | | | | - | | | | - | | | | (6,152,186 | ) | | | (1,500 | ) | | | 158,750 | | | | - | |
| | | | 61,067,207 | | | | 3,000 | | | | (10,650,000 | ) | | | (150 | ) | | | 1,863,750 | | | | - | | | | 41,877,970 | | | | 450 | | | | (16,024,591 | ) | | | (1,665 | ) | | | 2,560,134 | | | | (328,287 | ) |
| | | | | | | | | | | | | | | | | | | | | | | | | | | | | | | | | | | | | | | | | | | | | | | | | |
| Foreign currency | | | | | | | | | | | | | | | | | | | | | | | | | | | | | | | | | | | | | | | | | | | | | | | | |
| exchange rate | | | | | | | | | | | | | | | | | | | | | | | | | | | | | | | | | | | | | | | | | | | | | | | | |
| Forwards | | | 1,898,423,498 | | | | N/A | | | | (1,882,366,909 | ) | | | N/A | | | | 38,314,684 | | | | (22,258,094 | ) | | | 3,622,783,412 | | | | N/A | | | | (3,613,574,796 | ) | | | N/A | | | | 36,251,151 | | | | (27,042,535 | ) |
| Options(a) | | | 475,390,150 | | | | 8 | | | | (245,955,750 | ) | | | (4 | ) | | | 17,581,019 | | | | (5,242,064 | ) | | | 197,455,675 | | | | 10 | | | | (259,686,600 | ) | | | (11 | ) | | | 529,605 | | | | (2,794,899 | ) |
| | | | 2,373,813,648 | | | | 8 | | | | (2,128,322,659 | ) | | | (4 | ) | | | 55,895,703 | | | | (27,500,158 | ) | | | 3,820,239,087 | | | | 10 | | | | (3,873,261,396 | ) | | | (11 | ) | | | 36,780,756 | | | | (29,837,434 | ) |
| | | | | | | | | | | | | | | | | | | | | | | | | | | | | | | | | | | | | | | | | | | | | | | | | |
| Interest rate | | | | | | | | | | | | | | | | | | | | | | | | | | | | | | | | | | | | | | | | | | | | | | | | |
| Futures | | | - | | | | - | | | | (33,195,313 | ) | | | (250 | ) | | | 45,313 | | | | - | | | | 2,689,682,667 | | | | 10,913 | | | | (4,622,750,125 | ) | | | (19,386 | ) | | | 3,762,286 | | | | (1,568,484 | ) |
| Options(a) | | | 84,078,349 | | | | 3,500 | | | | (32,955,244 | ) | | | (3,500 | ) | | | 574,219 | | | | (164,063 | ) | | | 289,162,168 | | | | 5,000 | | | | (370,156,922 | ) | | | (5,000 | ) | | | 625,000 | | | | (468,750 | ) |
| | | | 84,078,349 | | | | 3,500 | | | | (66,150,557 | ) | | | (3,750 | ) | | | 619,532 | | | | (164,063 | ) | | | 2,978,844,835 | | | | 15,913 | | | | (4,992,907,047 | ) | | | (24,386 | ) | | | 4,387,286 | | | | (2,037,234 | ) |
| Total | | $ | 9,516,602,807 | | | | 117,105 | | | $ | (9,039,621,691 | ) | | | (108,680 | ) | | $ | 199,106,163 | | | $ | (181,269,655 | ) | | $ | 6,840,961,892 | | | | 16,373 | | | $ | (8,882,193,034 | ) | | | (26,062 | ) | | $ | 43,728,176 | | | $ | (32,202,955 | ) |
| | | | | | | | | | | | | | | | | | | | | | | | | | | | | | | | | | | | | | | | | | | | | | | | | |
| Collateral balances supporting all derivative positions | | | | | | | | | | $ | 164,202,824 | | | | | | | | | | | | | | | | | | | | | | | $ | 76,261,597 | |
| | | Graham Commodity Strategies LLC | | | Graham Energy Focus LLC | |
| | | Long exposure | | | Short exposure | | | | | | | | | Long exposure | | | Short exposure | | | | | | | |
| | | Notional amounts | | | Number of contracts | | | Notional amounts | | | Number of contracts | | | Derivative Assets | | | Derivative Liabilities | | | Notional amounts | | | Number of contracts | | | Notional amounts | | | Number of contracts | | | Derivative Assets | | | Derivative Liabilities | |
| | | | | | | | | | | | | | | | | | | | | | | | | | | | | | | | | | | | | |
| Commodity price | | | | | | | | | | | | | | | | | | | | | | | | | | | | | | | | | | | | |
| Futures | | $ | 5,222,568,696 | | | | 73,089 | | | $ | (5,055,686,350 | ) | | | (73,848 | ) | | $ | 121,643,778 | | | $ | (122,905,252 | ) | | $ | 231,604,970 | | | | 15,138 | | | $ | (297,888,138 | ) | | | (15,304 | ) | | $ | 42,519,858 | | | $ | (30,923,235 | ) |
| Options | | | - | | | | - | | | | - | | | | - | | | | - | | | | - | | | | 26,350,000 | | | | 1,050 | | | | (112,935,000 | ) | | | (4,022 | ) | | | 8,607,100 | | | | (2,521,680 | ) |
| Swaps | | | 176,282,548 | | | | 5,469 | | | | (252,954,190 | ) | | | (7,895 | ) | | | 2,117,443 | | | | (11,609,595 | ) | | | 119,063,430 | | | | 14,917 | | | | (31,672,403 | ) | | | (3,161 | ) | | | 3,663,400 | | | | (28,833,270 | ) |
| | | | 5,398,851,244 | | | | 78,558 | | | | (5,308,640,540 | ) | | | (81,743 | ) | | | 123,761,221 | | | | (134,514,847 | ) | | | 377,018,400 | | | | 31,105 | | | | (442,495,541 | ) | | | (22,487 | ) | | | 54,790,358 | | | | (62,278,185 | ) |
| | | | | | | | | | | | | | | | | | | | | | | | | | | | | | | | | | | | | | | | | | | | | | | | | |
| Equity price | | | | | | | | | | | | | | | | | | | | | | | | | | | | | | | | | | | | | | | | | | | | | | | | |
| Futures | | | 42,835,500 | | | | 684 | | | | (24,380,400 | ) | | | (330 | ) | | | - | | | | (41,633 | ) | | | - | | | | - | | | | - | | | | - | | | | - | | | | - | |
| | | | 42,835,500 | | | | 684 | | | | (24,380,400 | ) | | | (330 | ) | | | - | | | | (41,633 | ) | | | - | | | | - | | | | - | | | | - | | | | - | | | | - | |
| | | | | | | | | | | | | | | | | | | | | | | | | | | | | | | | | | | | | | | | | | | | | | | | | |
| Foreign currency exchange rate+ | | | | | | | | | | | | | | | | | | | | | | | | | | | | | | | | | | | | | | | | | | | | | | | | |
| Futures | | | 12,233,700 | | | | 230 | | | | - | | | | - | | | | - | | | | (39,300 | ) | | | - | | | | - | | | | - | | | | - | | | | - | | | | - | |
| Forwards | | | - | | | | - | | | | - | | | | - | | | | - | | | | - | | | | - | | | | - | | | | - | | | | - | | | | - | | | | - | |
| | | | 12,233,700 | | | | 230 | | | | - | | | | - | | | | - | | | | (39,300 | ) | | | - | | | | - | | | | - | | | | - | | | | - | | | | - | |
| | | | | | | | | | | | | | | | | | | | | | | | | | | | | | | | | | | | | | | | | | | | | | | | | |
| Interest rate | | | | | | | | | | | | | | | | | | | | | | | | | | | | | | | | | | | | | | | | | | | | | | | | |
| Futures | | | - | | | | - | | | | - | | | | - | | | | - | | | | - | | | | - | | | | - | | | | - | | | | - | | | | - | | | | - | |
| | | | - | | | | - | | | | - | | | | - | | | | - | | | | - | | | | - | | | | - | | | | - | | | | - | | | | - | | | | - | |
| Total | | $ | 5,453,920,444 | | | | 79,472 | | | $ | (5,333,020,940 | ) | | | (82,073 | ) | | $ | 123,761,221 | | | $ | (134,595,780 | ) | | $ | 377,018,400 | | | | 31,105 | | | $ | (442,495,541 | ) | | | (22,487 | ) | | $ | 54,790,358 | | | $ | (62,278,185 | ) |
| | | | | | | | | | | | | | | | | | | | | | | | | | | | | | | | | | | | | | |
| Collateral balances supporting all derivative positions | | | | | | | $ | 142,601,701 | | | | | | | | | | | | | | | | | | | | | | | $ | 29,432,093 | |
Graham Alternative Investment Trading LLC
Notes to Financial Statements (continued)
3. Investments in Master Funds (continued)
| 3. | Investments in Master Funds (continued) |
The following table displays the gross volume of derivative activities based on their notional amounts and number of contracts and fair value of derivative contracts held by the Master Funds at December 31, 20112012 categorized by primary underlying risk and areis representative of the derivative positions held by the Master Funds throughout the year. Derivatives denominated in foreign currencies have been converted to U.S. dollars. Derivative assetsasset and liability balances are presented on a gross basis, prior to the application of counterparty netting. The Master Funds trade futures and options on a leveraged basis. Due to the low margin deposits normally required for trading these derivative financial instruments, the gross notional exposure as displayed in the tables below may exceed the net asset value of the Master Funds by a significant amount. As a result, a relatively small price movement in an underlying derivative financial instrument may result in immediate and substantial effect on the net income and net asset value of the Master Funds and GAIT. Amounts presented below as collateral balances supporting all derivative positions are included in due from brokers and fixed income securities on the respective Master Fund’s statementFunds’ statements of financial condition.
| | | Graham Fed Policy Ltd. | | | Graham Global Monetary Policy LLC | | |
| | | Long exposure | | | Short exposure | | | | | | | | | Long exposure | | | Short exposure | | | | | | | | | | | | Graham K4D Trading Ltd. | | | | |
| | | Notional amounts | | | Number of contracts | | | Notional amounts | | | Number of contracts | | | Derivative Assets | | | Derivative Liabilities | | | Notional amounts | | | Number of contracts | | | Notional amounts | | | Number of contracts | | | Derivative Assets | | | Derivative Liabilities | | | Long exposure | | | Short exposure | | | | | | | |
| | | | | | | | | | | | | | | | | | | | | | | | | | | | | | | | | | | | | | | Notional amounts | | | Number of contracts | | | Notional amounts | | | Number of contracts | | | Derivative Assets | | | Derivative Liabilities | |
| Commodity price | | | | | | | | | | | | | | | | | | | | | | | | | | | | | | | | | | | | | | | | | | | | | | | | | | | | | | |
| Futures | | $ | - | | | | - | | | $ | - | | | | - | | | $ | - | | | $ | - | | | $ | - | | | | - | | | $ | - | | | | - | | | $ | - | | | $ | - | | | $ | 364,319,244 | | | | 4,414 | | | $ | (883,588,505 | ) | | | (13,712 | ) | | $ | 10,650,606 | | | $ | (18,252,826 | ) |
| Swaps | | | - | | | | - | | | | - | | | | - | | | | - | | | | - | | | | - | | | | - | | | | - | | | | - | | | | - | | | | - | | |
| | | | - | | | | - | | | | - | | | | - | | | | - | | | | - | | | | - | | | | - | | | | - | | | | - | | | | - | | | | - | | | | 364,319,244 | | | | 4,414 | | | | (883,588,505 | ) | | | (13,712 | ) | | | 10,650,606 | | | | (18,252,826 | ) |
| | | | | | | | | | | | | | | | | | | | | | | | | | | | | | | | | | | | | | | | | | | | | | | | | | | | | | | | | | | | | | | | | | | | | | | | | |
| Equity price | | | | | | | | | | | | | | | | | | | | | | | | | | | | | | | | | | | | | | | | | | | | | | | | | | | | | | | | | | | | | | | | | | | | | | | | |
| Futures | | | - | | | | - | | | | - | | | | - | | | | - | | | | - | | | | - | | | | - | | | | - | | | | - | | | | - | | | | - | | | | 1,226,779,876 | | | | 13,036 | | | | (106,770,515 | ) | | | (1,893 | ) | | | 25,381,594 | | | | (4,791,285 | ) |
| | | | - | | | | - | | | | - | | | | - | | | | - | | | | - | | | | - | | | | - | | | | - | | | | - | | | | - | | | | - | | | | 1,226,779,876 | | | | 13,036 | | | | (106,770,515 | ) | | | (1,893 | ) | | | 25,381,594 | | | | (4,791,285 | ) |
| | | | | | | | | | | | | | | | | | | | | | | | | | | | | | | | | | | | | | | | | | | | | | | | | | | | | | | | | | | | | | | | | | | | | | | | | |
| Foreign currency exchange rate | | | | | | | | | | | | | | | | | | | | | | | | | | | | | | | | | | | | | | | | | | | | | | | | | |
| Foreign currency | | | | | | | | | | | | | | | | | | | | | | | | | |
| exchange rate | | | | | | | | | | | | | | | | | | | | | | | | | |
| Futures | | | - | | | | - | | | | - | | | | - | | | | - | | | | - | | | | - | | | | - | | | | - | | | | - | | | | - | | | | - | | | | 36,929,900 | | | | 352 | | | | (136,511,977 | ) | | | (1,624 | ) | | | 1,104,266 | | | | (23,670 | ) |
| Forwards | | | - | | | | - | | | | - | | | | - | | | | - | | | | - | | | | 2,504,581,338 | | | | N/A | | | | (2,502,417,890 | ) | | | N/A | | | | 8,341,253 | | | | (6,177,805 | ) | | | 1,526,791,218 | | | | N/A | | | | (1,520,649,257 | ) | | | N/A | | | | 19,238,245 | | | | (13,096,283 | ) |
| Options | | | - | | | | - | | | | - | | | | - | | | | - | | | | - | | | | 200,000,000 | | | | 1 | | | | (100,000,000 | ) | | | (1 | ) | | | 339,824 | | | | (636,257 | ) | |
| | | | - | | | | - | | | | - | | | | - | | | | - | | | | - | | | | 2,704,581,338 | | | | 1 | | | | (2,602,417,890 | ) | | | (1 | ) | | | 8,681,077 | | | | (6,814,062 | ) | | | 1,563,721,118 | | | | 352 | | | | (1,657,161,234 | ) | | | (1,624 | ) | | | 20,342,511 | | | | (13,119,953 | ) |
| | | | | | | | | | | | | | | | | | | | | | | | | | | | | | | | | | | | | | | | | | | | | | | | | | | | | | | | | | | | | | | | | | | | | | | | | |
| Interest rate | | | | | | | | | | | | | | | | | | | | | | | | | | | | | | | | | | | | | | | | | | | | | | | | | | | | | | | | | | | | | | | | | | | | | | | | |
| Futures | | | 14,640,919,492 | | | | 35,178 | | | | - | | | | - | | | | 4,918,956 | | | | (23,439 | ) | | | 216,273,337 | | | | 1,940 | | | | (514,021,011 | ) | | | (2,100 | ) | | | 480,329 | | | | (87,539 | ) | | | 9,571,876,106 | | | | 45,765 | | | | (16,351,154 | ) | | | (81 | ) | | | 9,916,635 | | | | (4,703,166 | ) |
| Options | | | 2,155,189,586 | | | | 5,981 | | | | (17,228,752,250 | ) | | | (43,812 | ) | | | 549,104 | | | | (3,597,535 | ) | | | - | | | | - | | | | - | | | | - | | | | - | | | | - | | |
| | | | 16,796,109,078 | | | | 41,159 | | | | (17,228,752,250 | ) | | | (43,812 | ) | | | 5,468,060 | | | | (3,620,974 | ) | | | 216,273,337 | | | | 1,940 | | | | (514,021,011 | ) | | | (2,100 | ) | | | 480,329 | | | | (87,539 | ) | | | 9,571,876,106 | | | | 45,765 | | | | (16,351,154 | ) | | | (81 | ) | | | 9,916,635 | | | | (4,703,166 | ) |
| Total | | $ | 16,796,109,078 | | | | 41,159 | | | $ | (17,228,752,250 | ) | | | (43,812 | ) | | $ | 5,468,060 | | | $ | (3,620,974 | ) | | $ | 2,920,854,675 | | | | 1,941 | | | $ | (3,116,438,901 | ) | | | (2,101 | ) | | $ | 9,161,406 | | | $ | (6,901,601 | ) | | $ | 12,726,696,344 | | | | 63,567 | | | $ | (2,663,871,408 | ) | | | (17,310 | ) | | $ | 66,291,346 | | | $ | (40,867,230 | ) |
| | | | | | | | | | | | | | | | | | | | | | | | | | | | | | | | | | | | | | | | | | | | | | | | | | | | | | | | | | | | | | | |
| Collateral balances supporting all derivative positions | Collateral balances supporting all derivative positions | | | | | | | | | | | $ | 37,426,188 | | | | | | | | | | | | | | | | | | | | | | | $ | 73,168,865 | | Collateral balances supporting all derivative positions | | | | | | | | | | | | | | | | $ | 153,202,038 | |
Graham Alternative Investment Trading LLC
Notes to Financial Statements (continued)
3. Investments in Master Funds (continued)
The following table displays the gross volume of derivative activities based on their notional amounts and number of contracts and fair value of derivative contracts held by the Master Funds at December 31, 2011 categorized by primary underlying risk and are representative of the derivative positions held by the Master Funds throughout the year. Derivatives denominated in foreign currencies have been converted to U.S. dollars. Derivative assets and liability balances are presented on a gross basis, prior to the application of counterparty netting. Amounts presented below as collateral balances supporting all derivative positions are included in due from brokers on the respective Master Fund’s statement of financial condition.
| | | Graham K4D Trading Ltd. | | | Graham Macro Directional LLC | |
| | | Long exposure | | | Short exposure | | | | | | | | | Long exposure | | | Short exposure | | | | | | | |
| | | Notional amounts | | | Number of contracts | | | Notional amounts | | | Number of contracts | | | Derivative Assets | | | Derivative Liabilities | | | Notional amounts | | | Number of contracts | | | Notional amounts | | | Number of contracts | | | Derivative Assets | | | Derivative Liabilities | |
| | | | | | | | | | | | | | | | | | | | | | | | | | | | | | | | | | | | | |
| Commodity price | | | | | | | | | | | | | | | | | | | | | | | | | | | | | | | | | | | | |
| Futures | | $ | 549,621,961 | | | | 6,056 | | | $ | (748,131,689 | ) | | | (17,936 | ) | | $ | 15,602,465 | | | $ | (15,242,776 | ) | | $ | - | | | | - | | | $ | - | | | | - | | | $ | - | | | $ | - | |
| Swaps | | | - | | | | - | | | | (232,232,146 | ) | | | (6,040 | ) | | | - | | | | (15,255,976 | ) | | | - | | | | - | | | | - | | | | - | | | | - | | | | - | |
| | | | 549,621,961 | | | | 6,056 | | | | (980,363,835 | ) | | | (23,976 | ) | | | 15,602,465 | | | | (30,498,752 | ) | | | - | | | | - | | | | - | | | | - | | | | - | | | | - | |
| | | | | | | | | | | | | | | | | | | | | | | | | | | | | | | | | | | | | | | | | | | | | | | | | |
| Equity price | | | | | | | | | | | | | | | | | | | | | | | | | | | | | | | | | | | | | | | | | | | | | | | | |
| Futures | | | 532,726,507 | | | | 8,449 | | | | (283,517,405 | ) | | | (4,519 | ) | | | 4,992,980 | | | | (2,570,765 | ) | | | - | | | | - | | | | (12,525,000 | ) | | | (200 | ) | | | - | | | | (22,500 | ) |
| | | | 532,726,507 | | | | 8,449 | | | | (283,517,405 | ) | | | (4,519 | ) | | | 4,992,980 | | | | (2,570,765 | ) | | | - | | | | - | | | | (12,525,000 | ) | | | (200 | ) | | | - | | | | (22,500 | ) |
| | | | | | | | | | | | | | | | | | | | | | | | | | | | | | | | | | | | | | | | | | | | | | | | | |
| Foreign currency exchange rate | | | | | | | | | | | | | | | | | | | | | | | | | | | | | | | | | | | | | | | | | | | | | | | | |
| Futures | | | 263,535,156 | | | | 2,886 | | | | (55,089,450 | ) | | | (348 | ) | | | 1,406,611 | | | | (228,874 | ) | | | | | | | | | | | | | | | | | | | | | | | | |
| Forwards | | | 1,473,161,901 | | | | N/A | | | | (1,456,210,342 | ) | | | N/A | | | | 21,958,196 | | | | (5,006,637 | ) | | | 378,520,504 | | | | N/A | | | | (379,998,102 | ) | | | N/A | | | | 37,206 | | | | (1,514,804 | ) |
| | | | 1,736,697,057 | | | | 2,886 | | | | (1,511,299,792 | ) | | | (348 | ) | | | 23,364,807 | | | | (5,235,511 | ) | | | 378,520,504 | | | | - | | | | (379,998,102 | ) | | | - | | | | 37,206 | | | | (1,514,804 | ) |
| | | | | | | | | | | | | | | | | | | | | | | | | | | | | | | | | | | | | | | | | | | | | | | | | |
| Interest rate | | | | | | | | | | | | | | | | | | | | | | | | | | | | | | | | | | | | | | | | | | | | | | | | |
| Futures | | | 11,861,168,194 | | | | 60,131 | | | | (3,335,791,712 | ) | | | (13,264 | ) | | | 22,762,892 | | | | (2,336,556 | ) | | | 22,151,552 | | | | 200 | | | | - | | | | - | | | | - | | | | (21,390 | ) |
| | | | 11,861,168,194 | | | | 60,131 | | | | (3,335,791,712 | ) | | | (13,264 | ) | | | 22,762,892 | | | | (2,336,556 | ) | | | 22,151,552 | | | | 200 | | | | - | | | | - | | | | - | | | | (21,390 | ) |
| Total | | $ | 14,680,213,719 | | | | 77,522 | | | $ | (6,110,972,744 | ) | | | (42,107 | ) | | $ | 66,723,144 | | | $ | (40,641,584 | ) | | $ | 400,672,056 | | | | 200 | | | $ | (392,523,102 | ) | | | (200 | ) | | $ | 37,206 | | | $ | (1,558,694 | ) |
| | | | | | | | | | | | | | | | | | | | | | | | | | | | | | | | | | | | | | |
| Collateral balances supporting all derivative positions | | | | | | | | | | | $ | 307,111,336 | | | | | | | | | | | | | | | | | | | | | | | $ | 12,363,794 | |
Graham Alternative Investment Trading LLC
Notes to Financial Statements (continued)
3. | 3. | Investments in Master Funds (continued) |
The following table summarizes the results of operations of each Master Fund for the year ended December 31, 2011:2012 except as disclosed below:
| | | Graham Commodity Strategies LLC (Delaware) | | | Graham Discretionary Energy Trading III LLC - * (Delaware) | | | Graham Energy Focus LLC (Delaware) | | | Graham Fed Policy Ltd. (BVI) | | | Graham Global Monetary Policy LLC (Delaware) | | | Graham K4D Trading Ltd. (BVI) | | | Graham Macro Directional LLC (Delaware) | | | Graham Short Term Global Macro LLC - ** (Delaware) | | | Graham Commodity Strategies LLC (Delaware) | | | Graham Energy Focus LLC (1) (Delaware) | | | Graham Energy Fundamental LLC (2) (Delaware) | | | Graham Fed Policy Ltd. (3) (BVI) | | | Graham Global Monetary Policy LLC (Delaware) | | | Graham K4D Trading Ltd. (BVI) | | | Graham Macro Directional LLC (4) (Delaware) | | | Graham Macro Technical Ltd. (5) (BVI) | |
| | | | | | | | | | | | | | | | | | | | | | | | | | | | |
| Net investment income (loss) | | $ | (19,290 | ) | | $ | (60,323 | ) | | $ | (19,555 | ) | | $ | (3,341 | ) | | $ | (440,668 | ) | | $ | (598,015 | ) | | $ | (33,854 | ) | | $ | 1,186 | | | $ | 345,951 | | | $ | 6,739 | | | $ | (155 | ) | | $ | (1,576 | ) | | $ | (286,790 | ) | | $ | (240,755 | ) | | $ | (1,941 | ) | | $ | 24 | |
| | | | | | | | | | | | | | | | | | | | | | | | | | | | | | | | | | | | | | | | | | | | | | | | | | | | | | | | | | | | | | |
| Net realized gain (loss) on investments | | | 101,152,045 | | | | (11,935,802 | ) | | | 13,912,634 | | | | 41,782,108 | | | | 11,480,259 | | | | (422,430,555 | ) | | | 45,060,590 | | | | 3,960,455 | | | | (61,053,061 | ) | | | (3,769,417 | ) | | | 312,340 | | | | 5,613,231 | | | | 28,094,665 | | | | (74,164,455 | ) | | | 38,728,553 | | | | 1,495,306 | |
| Net increase (decrease) in unrealized appreciation on investments | | | (47,806,437 | ) | | | (16,614,275 | ) | | | (6,771,856 | ) | | | (8,009,721 | ) | | | 3,752,016 | | | | (18,855,089 | ) | | | (1,555,122 | ) | | | (1,898,136 | ) | |
| Net increase (decrease) in unrealized | | | | | | | | | | | | | | | | | | | | | | | | | | | | | | | | | |
| appreciation on investments | | | | 14,903,217 | | | | 5,355,406 | | | | - | | | | (6,791,394 | ) | | | 11,896,822 | | | | (1,457,876 | ) | | | 1,432,230 | | | | 45,230 | |
| Brokerage commissions and fees | | | (8,898,603 | ) | | | (2,215,911 | ) | | | (1,327,724 | ) | | | (2,064,973 | ) | | | (3,894,968 | ) | | | (13,215,302 | ) | | | (1,446,409 | ) | | | (548,562 | ) | | | (18,289,597 | ) | | | (205,979 | ) | | | (413,249 | ) | | | (251,780 | ) | | | (2,901,200 | ) | | | (4,371,586 | ) | | | (411,391 | ) | | | (61,432 | ) |
| Net gain (loss) on investments | | | 44,447,005 | | | | (30,765,988 | ) | | | 5,813,054 | | | | 31,707,414 | | | | 11,337,307 | | | | (454,500,946 | ) | | | 42,059,059 | | | | 1,513,757 | | | | (64,439,441 | ) | | | 1,380,010 | | | | (100,909 | ) | | | (1,429,943 | ) | | | 37,090,287 | | | | (79,993,917 | ) | | | 39,749,392 | | | | 1,479,104 | |
| Net income (loss) | | $ | 44,427,715 | | | $ | (30,826,311 | ) | | $ | 5,793,499 | | | $ | 31,704,073 | | | $ | 10,896,639 | | | $ | (455,098,961 | ) | | $ | 42,025,205 | | | $ | 1,514,943 | | | $ | (64,093,490 | ) | | $ | 1,386,749 | | | $ | (101,064 | ) | | $ | (1,431,519 | ) | | $ | 36,803,497 | | | $ | (80,234,672 | ) | | $ | 39,747,451 | | | $ | 1,479,128 | |
| (1) | For the period from January 1, 2012 to May 22, 2012 (date of dissolution) |
*- For the period from January 1, 2011 to October 31, 2011| (2) | For the period from February 28, 2012 to October 1, 2012 (date of dissolution) |
**- For the period from January 1, 2011 to February 28, 2011| (3) | For the period from January 1, 2012 to October 23, 2012 (date of dissolution) |
| (4) | For the period from January 1, 2012 to October 1, 2012 (date of dissolution) |
| (5) | For the period from May 1, 2012 to October 23, 2012 (date of dissolution) |
Graham Alternative Investment Trading LLC
Notes to Financial Statements (continued)
3. | 3. | Investments in Master Funds (continued) |
The following table shows the gains and losses on all financial instruments held by the Master Funds reported in net realized gain (loss) and net increase (decrease) in unrealized appreciation on investments in their statements of operations segregated by primary underlying risk and contract type for the year ended December 31, 2011:2012 except as disclosed below:
| | | Graham Commodity Strategies LLC | | | Graham Energy Focus LLC (1) | | | Graham Energy Fundamental LLC (2) | | | Graham Fed Policy Ltd. (3) | | | Graham Global Monetary Policy LLC | | | Graham K4D Trading Ltd. | | | Graham Macro Directional LLC (4) | | | Graham Macro Technical Ltd. (5) | |
| Commodity price | | | | | | | | | | | | | | | | | | | | | | | | |
| Futures | | $ | (51,699,208 | ) | | $ | 12,682,853 | | | $ | 229,930 | | | $ | - | | | $ | (1,071,029 | ) | | $ | (153,351,496 | ) | | $ | (865,110 | ) | | $ | 116,550 | |
| Options | | | 968,630 | | | | 789,330 | | | | (84,980 | ) | | | - | | | | - | | | | - | | | | - | | | | 21,500 | |
| Swaps | | | 10,585,971 | | | | (11,744,944 | ) | | | 167,390 | | | | - | | | | - | | | | 8,862,476 | | | | - | | | | - | |
| | | | (40,144,607 | ) | | | 1,727,239 | | | $ | 312,340 | | | | - | | | | (1,071,029 | ) | | | (144,489,020 | ) | | | (865,110 | ) | | | 138,050 | |
| Equity price | | | | | | | | | | | | | | | | | | | | | | | | | | | | | | | | |
| Futures | | | (14,957,621 | ) | | | (141,250 | ) | | | - | | | | 17,313 | | | | 10,286,966 | | | | 59,969,550 | | | | 1,981,489 | | | | 451,569 | |
| Equities | | | (298,920 | ) | | | - | | | | - | | | | - | | | | - | | | | (250,647 | ) | | | - | | | | - | |
| Options | | | (2,025,040 | ) | | | - | | | | - | | | | - | | | | (1,670,328 | ) | | | - | | | | - | | | | (70,000 | ) |
| | | | (17,281,581 | ) | | | (141,250 | ) | | | - | | | | 17,313 | | | | 8,616,638 | | | | 59,718,903 | | | | 1,981,489 | | | | 381,569 | |
| Foreign currency | | | | | | | | | | | | | | | | | | | | | | | | | | | | | | | | |
| exchange rate | | | | | | | | | | | | | | | | | | | | | | | | | | | | | | | | |
| Futures | | | 2,877,440 | | | | - | | | | - | | | | - | | | | - | | | | (19,324,533 | ) | | | - | | | | - | |
| Forwards | | | 9,747,837 | | | | - | | | | - | | | | - | | | | 34,292,224 | | | | (44,179,110 | ) | | | 33,756,168 | | | | 897,553 | |
| Options | | | 3,479,277 | | | | - | | | | - | | | | - | | | | (10,200,938 | ) | | | - | | | | 1,335,000 | | | | 426,906 | |
| | | | 16,104,554 | | | | - | | | | - | | | | - | | | | 24,091,286 | | | | (63,503,643 | ) | | | 35,091,168 | | | | 1,324,459 | |
| Interest rate | | | | | | | | | | | | | | | | | | | | | | | | | | | | | | | | |
| Futures | | | (7,583,780 | ) | | | - | | | | - | | | | (4,431,350 | ) | | | 8,302,329 | | | | 72,515,966 | | | | 4,218,861 | | | | (210,273 | ) |
| Options | | | 2,704,934 | | | | - | | | | - | | | | 3,235,874 | | | | 52,263 | | | | - | | | | (265,625 | ) | | | (93,269 | ) |
| Fixed income securities | | | 50,636 | | | | - | | | | - | | | | - | | | | - | | | | 135,463 | | | | - | | | | - | |
| | | | (4,828,210 | ) | | | - | | | | - | | | | (1,195,476 | ) | | | 8,354,592 | | | | 72,651,429 | | | | 3,953,236 | | | | (303,542 | ) |
| Total | | $ | (46,149,844 | ) | | $ | 1,585,989 | | | $ | 312,340 | | | $ | (1,178,163 | ) | | $ | 39,991,487 | | | $ | (75,622,331 | ) | | $ | 40,160,783 | | | $ | 1,540,536 | |
| | | Graham Commodity Strategies LLC | | | Graham Discretionary Energy Trading III LLC | | | Graham Energy Focus LLC | | | Graham Fed Policy Ltd. | | | Graham Global Monetary Policy LLC | | | Graham K4D Trading Ltd. | | | Graham Macro Directional LLC | | | Graham Short Term Global Macro LLC | |
| Commodity price | | | | | | | | | | | | | | | | | | | | | | | | |
| Futures | | $ | 45,722,101 | | | $ | (9,820,087 | ) | | $ | 47,267,957 | | | $ | - | | | $ | 23,983,012 | | | $ | (85,253,000 | ) | | $ | 1,152,146 | | | $ | 3,852,769 | |
| Options | | | - | | | | (19,066,205 | ) | | | 14,532,585 | | | | - | | | | (87,120 | ) | | | - | | | | - | | | | (223,490 | ) |
| Swaps | | | 7,276,761 | | | | 336,215 | | | | (54,527,139 | ) | | | - | | | | - | | | | (15,123,659 | ) | | | - | | | | - | |
| | | | 52,998,862 | | | | (28,550,077 | ) | | | 7,273,403 | | | | - | | | | 23,895,892 | | | | (100,376,659 | ) | | | 1,152,146 | | | | 3,629,279 | |
| Equity price | | | | | | | | | | | | | | | | | | | | | | | | | | | | | | | | |
| Equities | | | - | | | | - | | | | - | | | | - | | | | - | | | | (7,000 | ) | | | - | | | | - | |
| Futures | | | (111,971 | ) | | | - | | | | (132,625 | ) | | | - | | | | 7,102,008 | | | | (232,290,243 | ) | | | 2,890,718 | | | | 1,134,945 | |
| Options | | | - | | | | - | | | | - | | | | - | | | | (4,083,863 | ) | | | - | | | | - | | | | (427,187 | ) |
| | | | (111,971 | ) | | | - | | | | (132,625 | ) | | | - | | | | 3,018,145 | | | | (232,297,243 | ) | | | 2,890,718 | | | | 707,758 | |
| Foreign currency exchange rate | | | | | | | | | | | | | | | | | | | | | | | | | | | | | | | | |
| Futures | | | 459,943 | | | | - | | | | - | | | | - | | | | - | | | | (20,151,534 | ) | | | - | | | | - | |
| Forwards | | | - | | | | - | | | | - | | | | - | | | | 21,980,582 | | | | (189,137,435 | ) | | | 3,796,665 | | | | 5,706,028 | |
| Options | | | - | | | | - | | | | - | | | | - | | | | (28,421,930 | ) | | | - | | | | - | | | | (7,400,670 | ) |
| | | | 459,943 | | | | - | | | | - | | | | - | | | | (6,441,348 | ) | | | (209,288,969 | ) | | | 3,796,665 | | | | (1,694,642 | ) |
| Interest rate | | | | | | | | | | | | | | | | | | | | | | | | | | | | | | | | |
| Futures | | | (1,226 | ) | | | - | | | | - | | | | 48,059,659 | | | | (4,532,601 | ) | | | 100,677,227 | | | | 34,798,013 | | | | (580,076 | ) |
| Options | | | - | | | | - | | | | - | | | | (14,287,272 | ) | | | (707,813 | ) | | | - | | | | 867,926 | | | | - | |
| | | | (1,226 | ) | | | - | | | | - | | | | 33,772,387 | | | | (5,240,414 | ) | | | 100,677,227 | | | | 35,665,939 | | | | (580,076 | ) |
| Total | | $ | 53,345,608 | | | $ | (28,550,077 | ) | | $ | 7,140,778 | | | $ | 33,772,387 | | | $ | 15,232,275 | | | $ | (441,285,644 | ) | | $ | 43,505,468 | | | $ | 2,062,319 | |
(1) For the period from January 1, 2012 to May 22, 2012 (date of dissolution)
(2) For the period from February 28, 2012 to October 1, 2012 (date of dissolution)
(3) For the period from January 1, 2012 to October 23, 2012 (date of dissolution)
(4) For the period from January 1, 2012 to October 1, 2012 (date of dissolution)
(5) For the period from May 1, 2012 to October 23, 2012 (date of dissolution)
Graham Alternative Investment Trading LLC
Notes to Financial Statements (continued)
3. Investments in Master Funds (continued)
| 3. | Investments in Master Funds (continued) |
The following table summarizes the financial position of each Master Fund as of December 31, 2010:
2011:
| | | Graham Commodity Strategies LLC (Delaware) | | | Graham Discretionary Energy Trading III LLC (Delaware) | | | Graham Fed Policy Ltd. (BVI) | | | Graham Global Monetary Policy LLC (Delaware) | | | Graham K4D Trading Ltd. (BVI) | | | Graham Macro Directional LLC (Delaware) | | | Graham Short Term Global Macro LLC (Delaware) | | | Graham Commodity Strategies LLC (Delaware) | | | Graham Energy Focus LLC (Delaware) | | | Graham Fed Policy Ltd. (BVI) | | | Graham Global Monetary Policy LLC (Delaware) | | | Graham K4D Trading Ltd. (BVI) | | | Graham Macro Directional LLC (Delaware) | |
| Assets: | | | | | | | | | | | | | | | | | | | | | | | | | | | | | | | | | | | | | | | |
| Due from brokers | | $ | 14,527,187 | | | $ | - | | | $ | 23,563,039 | | | $ | 42,869,239 | | | $ | 135,887,098 | | | $ | 1,286,040 | | | $ | 246,023 | | | $ | 142,601,701 | | | $ | 29,432,093 | | | $ | 37,426,188 | | | $ | 73,168,865 | | | $ | 307,111,336 | | | $ | 12,363,794 | |
| Options, at fair value | | | - | | | | 2,165,000 | | | | 15,955,481 | | | | 603,151 | | | | - | | | | - | | | | 47,256 | | | | - | | | | 6,085,420 | | | | - | | | | - | | | | - | | | | - | |
| Derivative financial instruments, at fair value | | | 36,971,878 | | | | 16,379,776 | | | | 11,613,647 | | | | - | | | | 45,743,328 | | | | 173,923 | | | | - | | | | - | | | | - | | | | 4,895,517 | | | | 2,556,238 | | | | 41,337,536 | | | | - | |
| CME Membership, at fair value | | | | 2,000 | | | | - | | | | - | | | | - | | | | 355,000 | | | | - | |
| Subscriptions receivable | | | - | | | | - | | | | 1,739 | | | | 340 | | | | - | | | | - | | | | - | | | | 5,925 | | | | 1,048 | | | | 882 | | | | 40,815 | | | | 34,651 | | | | 2,311 | |
| Interest receivable | | | - | | | | - | | | | - | | | | 3,056 | | | | 9,100 | | | | 113 | | | | - | | |
| Total assets | | | 51,499,065 | | | | 18,544,776 | | | | 51,133,906 | | | | 43,475,786 | | | | 181,639,526 | | | | 1,460,076 | | | | 293,279 | | | | 142,609,626 | | | | 35,518,561 | | | | 42,322,587 | | | | 75,765,918 | | | | 348,838,523 | | | | 12,366,105 | |
| | | | | | | | | | | | | | | | | | | | | | | | | | | | | | | | | | | | | | | | | | | | | | | | | | | | | |
| Liabilities: | | | | | | | | | | | | | | | | | | | | | | | | | | | | | | | | | | | | | | | | | | | | | | | | | | | | |
| Options, at fair value | | | - | | | | 182,500 | | | | 3,958,218 | | | | - | | | | - | | | | - | | | | - | | | | - | | | | - | | | | 3,048,431 | | | | 296,433 | | | | - | | | | - | |
| Derivative financial instruments, at fair value | | | - | | | | - | | | | - | | | | 3,185,389 | | | | - | | | | - | | | | 105,751 | | | | 10,834,559 | | | | 13,573,247 | | | | - | | | | - | | | | 15,255,976 | | | | 1,521,488 | |
| Due to brokers | | | - | | | | 6,241,250 | | | | - | | | | 530,100 | | | | - | | | | - | | | | 41,070 | | |
| Redemptions payable | | | - | | | | - | | | | - | | | | 220 | | | | - | | | | - | | | | - | | | | 5,925 | | | | 1,048 | | | | 1,024 | | | | 40,370 | | | | 34,651 | | | | 2,311 | |
| Total liabilities | | | - | | | | 6,423,750 | | | | 3,958,218 | | | | 3,715,709 | | | | - | | | | - | | | | 146,821 | | | | 10,840,484 | | | | 13,574,295 | | | | 3,049,455 | | | | 336,803 | | | | 15,290,627 | | | | 1,523,799 | |
| Net assets | | $ | 51,499,065 | | | $ | 12,121,026 | | | $ | 47,175,688 | | | $ | 39,760,077 | | | $ | 181,639,526 | | | $ | 1,460,076 | | | $ | 146,458 | | | $ | 131,769,142 | | | $ | 21,944,266 | | | $ | 39,273,132 | | | $ | 75,429,115 | | | $ | 333,547,896 | | | $ | 10,842,306 | |
| | | | | | | | | | | | | | | | | | | | | | | | | | | | | | | | | | | | | | | | | | | | | | | | | | | | | |
| Percentage of Master Fund held by the Fund | | | 14.76 | % | | | 13.95 | % | | | 14.22 | % | | | 8.97 | % | | | 13.23 | % | | | 18.38 | % | | | 28.67 | % | |
| Percentage of Master Fund held by GAIT | | | | 15.04 | % | | | 20.01 | % | | | 15.17 | % | | | 14.18 | % | | | 13.52 | % | | | 17.87 | % |
Graham Alternative Investment Trading LLC
Notes to Financial Statements (continued)
3. | 3. | Investments in Master Funds (continued) |
The following schedules display the condensed schedules of investments for the Master Funds as of December 31, 2010.2011.
| Description | | Number of Contracts | | | Fair Value | | | Percentage of Net Assets of Master Fund | |
| Graham Commodity Strategies LLC | | | | | | | | | |
| Long contracts | | | | | | | | | |
| Futures | | | | | | | | | |
| Brent Crude Penultimate Financial December 2011 | | | 1,095 | | | $ | 14,633,650 | | | | 28.42 | % |
| Brent Crude Penultimate Financial June 2012 | | | 200 | | | | 2,036,000 | | | | 3.95 | % |
| Other Brent Crude December 2011 - June 2011 | | | 1,277 | | | | 3,601,460 | | | | 6.99 | % |
| Coffee March 2011 | | | 396 | | | | 4,360,950 | | | | 8.47 | % |
| Corn July 2011 | | | 3,991 | | | | 18,055,400 | | | | 35.06 | % |
| Corn December 2011 | | | 48 | | | | 153,788 | | | | 0.30 | % |
| Heating Oil March 2011 | | | 527 | | | | 5,647,421 | | | | 10.97 | % |
| Other Heating Oil February 2011 - June 2011 | | | 397 | | | | 264,810 | | | | 0.51 | % |
| LME Aluminum March 2011 | | | 1,590 | | | | 2,988,131 | | | | 5.80 | % |
| LME Aluminum January 2011 | | | 723 | | | | 2,143,550 | | | | 4.16 | % |
| LME Copper January 2011 | | | 172 | | | | 2,952,825 | | | | 5.73 | % |
| LME Copper March 2011 | | | 359 | | | | 2,598,425 | | | | 5.05 | % |
| LME Lead January 2011 | | | 511 | | | | 3,757,844 | | | | 7.30 | % |
| LME Lead March 2011 | | | 315 | | | | 641,800 | | | | 1.25 | % |
| LME Zinc March 2011 | | | 1,566 | | | | 4,704,131 | | | | 9.13 | % |
| LME Zinc January 2011 | | | 633 | | | | 2,228,906 | | | | 4.33 | % |
| Soybean July 2011 | | | 613 | | | | 4,537,487 | | | | 8.81 | % |
| Soybean November 2011 | | | 102 | | | | 280,350 | | | | 0.54 | % |
| Wheat July 2011 | | | 1,414 | | | | 7,393,413 | | | | 14.36 | % |
| Wheat March 2011 | | | 1,044 | | | | 5,075,512 | | | | 9.86 | % |
| Other Wheat May 2011 - December 2011 | | | 1,676 | | | | 4,151,525 | | | | 8.06 | % |
| WTI Crude April 2011 | | | 2,180 | | | | 4,866,480 | | | | 9.45 | % |
| WTI Crude December 2012 | | | 2,529 | | | | 18,709,570 | | | | 36.33 | % |
| Other commodity | | | | | | | 10,047,962 | | | | 19.51 | % |
| Total futures | | | | | | | 125,831,390 | | | | 244.34 | % |
| Description | | Number of Contracts | | | Fair Value | | | Percentage of Net Assets of Master Fund | |
| Graham Commodity Strategies LLC | | | | | | | | | |
| Long contracts | | | | | | | | | |
| Futures | | | | | | | | | |
| Brent Crude February 2012 - May 2012 | | | 5,558 | | | $ | (1,566,650 | ) | | | (1.19 | )% |
| Coffee May 2012 - July 2012 | | | 1,865 | | | | (7,800,506 | ) | | | (5.92 | )% |
| Corn July 2012 | | | 3,693 | | | | 6,097,513 | | | | 4.63 | % |
| Gasoline RBOB December 2012 | | | 750 | | | | (7,893,900 | ) | | | (5.99 | )% |
| Other Gasoline RBOB February 2012 | | | 1,638 | | | | (93,072 | ) | | | (0.07 | )% |
| Natural Gas February 2012 - January 2013 | | | 6,254 | | | | (11,037,040 | ) | | | (8.38 | )% |
| Wheat July 2012 | | | 2,504 | | | | (7,274,588 | ) | | | (5.52 | )% |
| Wheat December 2012 | | | 888 | | | | (8,308,563 | ) | | | (6.31 | )% |
| Other Wheat March 2012 | | | 710 | | | | (2,154,100 | ) | | | (1.63 | )% |
| Other Wheat March 2012 - December 2012 | | | 1,674 | | | | 3,218,225 | | | | 2.44 | % |
| WTI Crude April 2012 | | | 8,991 | | | | 36,997,150 | | | | 28.08 | % |
| Other WTI Crude December 2012 - December 2013 | | | 3,523 | | | | 6,861,280 | | | | 5.21 | % |
| Other WTI Crude September 2013 | | | 1,000 | | | | (2,660,000 | ) | | | (2.02 | )% |
| Other commodity | | | | | | | 12,325,498 | | | | 9.35 | % |
| Foreign currency | | | | | | | (39,300 | ) | | | (0.03 | )% |
| U.S. index | | | | | | | (30,612 | ) | | | (0.02 | )% |
| Total futures | | | | | | | 16,641,335 | | | | 12.63 | % |
| | | | | | | | | | | | | |
| Swaps | | | | | | | | | | | | |
| Wheat future May 2012 | | | 269 | | | | 903,018 | | | | 0.69 | % |
| Other commodity futures | | | | | | | (2,762,970 | ) | | | (2.10 | )% |
| Total swaps | | | | | | | (1,859,952 | ) | | | (1.41 | )% |
Graham Alternative Investment Trading LLC
Notes to Financial Statements (continued)
3. | 3. | Investments in Master Funds (continued) |
The following schedules display the condensed schedules of investments for the Master Funds as of December 31, 2010.2011.
| Description | | Number of Contracts | | | Fair Value | | | Percentage of Net Assets of Master Fund | |
| Graham Commodity Strategies LLC (continued) | | | | | | | | | |
| Short contracts | | | | | | | | | |
| Futures | | | | | | | | | |
| Brent Crude Penultimate Financial December 2012 | | | (1,295 | ) | | $ | (13,292,950 | ) | | | (25.81 | )% |
| Brent Crude Penultimate Financial June 2011 | | | (3 | ) | | | (49,020 | ) | | | (0.10 | )% |
| Brent Crude December 2012 | | | (1,143 | ) | | | (5,592,330 | ) | | | (10.86 | )% |
| Coffee May 2011 | | | (338 | ) | | | (4,695,019 | ) | | | (9.12 | )% |
| Corn March 2011 | | | (3,625 | ) | | | (9,012,475 | ) | | | (17.50 | )% |
| Gas Oil March 2011 | | | (646 | ) | | | (3,626,950 | ) | | | (7.04 | )% |
| Gas Oil January 2011 - June 2012 | | | (53 | ) | | | (108,375 | ) | | | (0.22 | )% |
| LME Aluminum January 2011 - March 2011 | | | (2,207 | ) | | | (3,806,831 | ) | | | (7.39 | )% |
| LME Copper January 2011 | | | (173 | ) | | | (2,962,525 | ) | | | (5.75 | )% |
| LME Copper March 2011 | | | (327 | ) | | | (2,328,450 | ) | | | (4.52 | )% |
| LME Lead January 2011 - March 2011 | | | (826 | ) | | | (3,205,319 | ) | | | (6.22 | )% |
| LME Zinc January 2011 | | | (634 | ) | | | (4,078,794 | ) | | | (7.92 | )% |
| LME Zinc March 2011 | | | (1,494 | ) | | | (5,237,125 | ) | | | (10.17 | )% |
| Wheat July 2011 | | | (2,459 | ) | | | (5,308,537 | ) | | | (10.31 | )% |
| Wheat March 2011 | | | (688 | ) | | | (4,981,550 | ) | | | (9.67 | )% |
| Wheat May 2011 | | | (795 | ) | | | (849,025 | ) | | | (1.65 | )% |
| WTI Crude February 2011 | | | (2,758 | ) | | | (5,155,560 | ) | | | (10.01 | )% |
| WTI Crude December 2011 | | | (1,829 | ) | | | (7,981,680 | ) | | | (15.50 | )% |
| Other commodity | | | | | | | (6,586,997 | ) | | | (12.79 | )% |
| Total futures | | | | | | | (88,859,512 | ) | | | (172.55 | )% |
| | | | | | | | | | | | | |
| Total | | | | | | $ | 36,971,878 | | | | 71.79 | % |
| Description | | Number of Contracts | | | Fair Value | | | Percentage of Net Assets of Master Fund | |
| Graham Commodity Strategies LLC (continued) | | | | | | | | | |
| Short contracts | | | | | | | | | |
| Futures | | | | | | | | | |
| Brent Crude Penultimate Financial December 2012 | | | (1,097 | ) | | $ | (9,057,530 | ) | | | (6.87 | )% |
| Other Brent Crude April 2012 - December 2013 | | | (2,581 | ) | | | (4,752,620 | ) | | | (3.61 | )% |
| Coffee March 2012 | | | (1,799 | ) | | | (1,080,731 | ) | | | (0.82 | )% |
| Corn December 2012 | | | (1,074 | ) | | | 1,099,575 | | | | 0.83 | % |
| Gasoil June 2012 - December 2012 | | | (3,748 | ) | | | (10,964,450 | ) | | | (8.32 | )% |
| Natural Gas April 2012 | | | (7,358 | ) | | | 12,529,350 | | | | 9.51 | % |
| Other Natural Gas October 2012 | | | (275 | ) | | | 2,387,340 | | | | 1.81 | % |
| Wheat July 2012 | | | (2,919 | ) | | | 23,443,525 | | | | 17.79 | % |
| Other Wheat May 2012 | | | (765 | ) | | | (792,350 | ) | | | (0.60 | )% |
| WTI Crude October 2012 | | | (1,500 | ) | | | (18,800,000 | ) | | | (14.27 | )% |
| Other WTI Crude February 2012 - December 2014 | | | (12,649 | ) | | | (2,116,630 | ) | | | (1.60 | )% |
| Other commodity | | | | | | | (9,868,200 | ) | | | (7.49 | )% |
| U.S. index | | | | | | | (11,021 | ) | | | (0.01 | )% |
| Total futures | | | | | | | (17,983,742 | ) | | | (13.65 | )% |
| | | | | | | | | | | | | |
| Swaps | | | | | | | | | | | | |
| Wheat future March 2012 | | | (1,539 | ) | | | (6,067,775 | ) | | | (4.60 | )% |
| Other Wheat future July 2012 | | | (427 | ) | | | (1,435,788 | ) | | | (1.09 | )% |
| Other commodity futures | | | | | | | (128,637 | ) | | | (0.10 | )% |
| Total swaps | | | | | | | (7,632,200 | ) | | | (5.79 | )% |
| | | | | | | | | | | | | |
| Total | | | | | | $ | (10,834,559 | ) | | | (8.22 | )% |
Graham Alternative Investment Trading LLC
Notes to Financial Statements (continued)
3. | 3. | Investments in Master Funds (continued) |
The following schedules display the condensed schedules of investments for the Master Funds as of December 31, 2010.2011.
| Description | | Number of Contracts | | | Fair Value | | | Percentage of Net Assets of Master Fund | |
| Graham Energy Focus LLC | | | | | | | | | |
| Long contracts | | | | | | | | | |
| Futures | | | | | | | | | |
| Henry Hub Penultimate March 2012 | | | 4,031 | | | $ | (11,345,235 | ) | | | (51.70 | )% |
| Henry Hub Penultimate April 2013 | | | 2,550 | | | | (4,180,875 | ) | | | (19.05 | )% |
| Other Henry Hub Penultimate February 2012 - December 2012 | | | 5,156 | | | | (7,521,975 | ) | | | (34.28 | )% |
| Natural Gas December 2012 | | | 1,083 | | | | (1,437,960 | ) | | | (6.55 | )% |
| Natural Gas January 2013 | | | 2,083 | | | | (5,207,770 | ) | | | (23.73 | )% |
| Other Natural Gas March 2013 - October 2013 | | | 200 | | | | (1,204,420 | ) | | | (5.49 | )% |
| Other commodity | | | | | | | (25,000 | ) | | | (0.12 | )% |
| Total futures | | | | | | | (30,923,235 | ) | | | (140.92 | )% |
| | | | | | | | | | | | | |
| Options | | | | | | | | | | | | |
| Natural Gas EURO February 2012, $4.80 Put | | | 100 | | | | 1,810,600 | | | | 8.25 | % |
| Natural Gas EURO March 2012, $4.80 Put | | | 100 | | | | 1,784,000 | | | | 8.13 | % |
| Natural Gas EURO April 2012 - October 2012, $0.20 - $4.50 Put | | | 850 | | | | 5,012,500 | | | | 22.84 | % |
| Total options | | | | | | | 8,607,100 | | | | 39.22 | % |
| | | | | | | | | | | | | |
| Swaps | | | | | | | | | | | | |
| Natural Gas February 2012 | | | 3,915 | | | | (11,572,885 | ) | | | (52.74 | )% |
| Natural Gas March 2012 | | | 1,767 | | | | (6,214,880 | ) | | | (28.32 | )% |
| Natural Gas April 2012 | | | 1,250 | | | | (1,615,525 | ) | | | (7.36 | )% |
| Natural Gas May 2012 | | | 930 | | | | (1,610,140 | ) | | | (7.34 | )% |
| Natural Gas June 2012 | | | 900 | | | | (1,443,450 | ) | | | (6.58 | )% |
| Natural Gas July 2012 | | | 930 | | | | (1,349,740 | ) | | | (6.15 | )% |
| Natural Gas August 2012 | | | 930 | | | | (1,273,015 | ) | | | (5.80 | )% |
| Natural Gas September 2012 | | | 900 | | | | (1,216,200 | ) | | | (5.54 | )% |
| Natural Gas November 2012 | | | 1,630 | | | | (1,596,325 | ) | | | (7.27 | )% |
| Other Natural Gas January 2012 - November 2013 | | | 1,765 | | | | (916,000 | ) | | | (4.18 | )% |
| Total swaps | | | | | | | (28,808,160 | ) | | | (131.28 | )% |
| Description | | Number of Contracts | | | Fair Value | | | Percentage of Net Assets of Master Fund | |
| Graham Discretionary Energy Trading III LLC | | | | | | | | | |
| Long contracts | | | | | | | | | |
| Futures | | | | | | | | | |
| Brent Crude February 2011 | | | 330 | | | $ | 977,500 | | | | 8.07 | % |
| Brent Crude April 2011 | | | 330 | | | | 974,400 | | | | 8.04 | % |
| Gasoline RBOB February 2011 – June 2011 | | | 1,025 | | | | 7,896,193 | | | | 65.14 | % |
| Globex RBOB Gasoline June 2011 | | | 475 | | | | 2,643,060 | | | | 21.81 | % |
| Globex Crude Oil June 2011 | | | 75 | | | | 733,500 | | | | 6.05 | % |
| Globex Crude Oil December 2011 | | | 500 | | | | 4,600,000 | | | | 37.95 | % |
| Heating Oil December 2011 | | | 1,650 | | | | 14,407,478 | | | | 118.86 | % |
| Heating Oil August 2011 | | | 500 | | | | 412,012 | | | | 3.40 | % |
| Natural Gas October 2011 | | | 721 | | | | 1,138,980 | | | | 9.40 | % |
| Other commodity | | | | | | | 594,381 | | | | 4.90 | % |
| Total futures | | | | | | | 34,377,504 | | | | 283.62 | % |
| | | | | | | | | | | | | |
| Options | | | | | | | | | | | | |
| Crude Oil Future April 2011, $100.00 Call | | | 500 | | | | 1,010,000 | | | | 8.33 | % |
| Crude Oil Future, February 2011 - March 2011 $(0.50) - $85.00 Put | | | 3,450 | | | | 1,155,000 | | | | 9.53 | % |
| Total options | | | | | | | 2,165,000 | | | | 17.86 | % |
| | | | | | | | | | | | | |
| Swaps | | | | | | | | | | | | |
| Natural Gas Swap April 2011 | | | 4,540 | | | | 1,872,750 | | | | 15.45 | % |
| Natural Gas Swap October 2011 | | | 2,124 | | | | 933,360 | | | | 7.70 | % |
| Natural Gas Swap November 2011 | | | 2,000 | | | | 950,000 | | | | 7.84 | % |
| Total swaps | | | | | | | 3,756,110 | | | | 30.99 | % |
Graham Alternative Investment Trading LLC
Notes to Financial Statements (continued)
3. | 3. | Investments in Master Funds (continued) |
The following schedules display the condensed schedules of investments for the Master Funds as of December 31, 2010.2011.
| Description | | Number of Contracts | | | Fair Value | | | Percentage of Net Assets of Master Fund | |
| Graham Energy Focus LLC (continued) | | | | | | | | | |
| Short contracts | | | | | | | | | |
| Futures | | | | | | | | | |
| Henry Hub Penultimate February 2012 | | | (3,971 | ) | | $ | 11,724,378 | | | | 53.43 | % |
| Henry Hub Penultimate October 2012 | | | (2,124 | ) | | | 4,157,730 | | | | 18.95 | % |
| Henry Hub Penultimate April 2012 | | | (1,340 | ) | | | 1,845,850 | | | | 8.41 | % |
| Other Henry Hub Penultimate June 2012 - September 2012 | | | (612 | ) | | | 2,458,900 | | | | 11.21 | % |
| Natural Gas March 2012 | | | (1,709 | ) | | | 6,557,620 | | | | 29.88 | % |
| Natural Gas April 2012 | | | (1,318 | ) | | | 2,137,030 | | | | 9.74 | % |
| Natural Gas May 2012 | | | (197 | ) | | | 1,589,960 | | | | 7.25 | % |
| Natural Gas June 2012 | | | (188 | ) | | | 1,293,180 | | | | 5.89 | % |
| Natural Gas October 2012 | | | (1,011 | ) | | | 1,398,270 | | | | 6.37 | % |
| Natural Gas November 2012 | | | (1,355 | ) | | | 2,352,710 | | | | 10.72 | % |
| Natural Gas April 2013 | | | (696 | ) | | | 3,780,580 | | | | 17.23 | % |
| Other Natural Gas February 2012 - November 2013 | | | (703 | ) | | | 3,128,470 | | | | 14.26 | % |
| Other commodity | | | | | | | 95,180 | | | | 0.43 | % |
| Total futures | | | | | | | 42,519,858 | | | | 193.77 | % |
| | | | | | | | | | | | | |
| Options | | | | | | | | | | | | |
| Natural Gas EURO February 2012 - December 2012, $4.00 - $6.50 Call | | | (3,100 | ) | | | (769,600 | ) | | | (3.51 | )% |
| Natural Gas EURO February 2012 - March 2012, $3.00 - $3.25 Put | | | (800 | ) | | | (1,436,100 | ) | | | (6.54 | )% |
| Other commodity | | | | | | | (315,980 | ) | | | (1.44 | )% |
| Total options | | | | | | | (2,521,680 | ) | | | (11.49 | )% |
| | | | | | | | | | | | | |
| Swaps | | | | | | | | | | | | |
| Natural Gas January 2013 | | | (1,116 | ) | | | 1,752,508 | | | | 7.99 | % |
| Natural Gas May 2012 - September 2012 | | | (1,983 | ) | | | 1,910,892 | | | | 8.70 | % |
| Other Natural Gas December 2013 | | | (62 | ) | | | (25,110 | ) | | | (0.11 | )% |
| Total swaps | | | | | | | 3,638,290 | | | | 16.58 | % |
| | | | | | | | | | | | | |
| Total | | | | | | $ | (7,487,827 | ) | | | (34.12 | )% |
| Description | | Number of Contracts | | | Fair Value | | | Percentage of Net Assets of Master Fund | |
| Graham Discretionary Energy Trading III LLC (continued) | | | | | | | | | |
| Short contracts | | | | | | | | | |
| Futures | | | | | | | | | |
| Brent Crude March 2011 | | | (660 | ) | | $ | (1,900,100 | ) | | | (15.68 | )% |
| Globex Heat Oil June 2011 | | | (550 | ) | | | (2,936,850 | ) | | | (24.23 | )% |
| Heating Oil June 2011 | | | (1,325 | ) | | | (5,756,297 | ) | | | (47.49 | )% |
| Heating Oil July 2011 | | | (1,000 | ) | | | (836,611 | ) | | | (6.90 | )% |
| Heating Oil June 2012 | | | (75 | ) | | | (239,350 | ) | | | (1.97 | )% |
| Natural Gas April 2011 | | | (1,135 | ) | | | (1,872,750 | ) | | | (15.45 | )% |
| Natural Gas November 2011 | | | (500 | ) | | | (840,220 | ) | | | (6.93 | )% |
| Natural Gas January 2012 - April 2012 | | | (302 | ) | | | (314,660 | ) | | | (2.60 | )% |
| WTI Crude June 2011 | | | (775 | ) | | | (4,299,500 | ) | | | (35.47 | )% |
| WTI Crude December 2011 | | | (500 | ) | | | (976,750 | ) | | | (8.06 | )% |
| WTI Crude April 2011 | | | (125 | ) | | | (363,750 | ) | | | (3.00 | )% |
| Total futures | | | | | | | (20,336,838 | ) | | | (167.78 | )% |
| | | | | | | | | | | | | |
| Options | | | | | | | | | | | | |
| Commodity | | | | | | | (182,500 | ) | | | (1.51 | )% |
| Total options | | | | | | | (182,500 | ) | | | (1.51 | )% |
| | | | | | | | | | | | | |
| Swaps | | | | | | | | | | | | |
| Natural Gas Swap January 2012 | | | (1,800 | ) | | | (837,000 | ) | | | (6.91 | )% |
| Natural Gas Swap April 2012 | | | (2,000 | ) | | | (580,000 | ) | | | (4.78 | )% |
| Total swaps | | | | | | | (1,417,000 | ) | | | (11.69 | )% |
| | | | | | | | | | | | | |
| Total | | | | | | $ | 18,362,276 | | | | 151.49 | % |
Graham Alternative Investment Trading LLC
Notes to Financial Statements (continued)
3. | 3. | Investments in Master Funds (continued) |
The following schedules display the condensed schedules of investments for the Master Funds as of December 31, 2010.2011.
| Description | | Number of Contracts | | | Fair Value | | | Percentage of Net Assets of Master Fund | |
| Graham Fed Policy Ltd. | | | | | | | | | |
| Long contracts | | | | | | | | | |
| Futures | | | | | | | | | |
| 30 Day Fed Fund June 2012 | | | 8,547 | | | $ | 2,324,519 | | | | 5.92 | % |
| Other 30 Day Fed Fund January 2012 - December 2013 | | | 26,631 | | | | 2,594,437 | | | | 6.60 | % |
| Other 30 Day Fed Fund November 2012 - October 2013 | | | 1,598 | | | | (23,439 | ) | | | (0.06 | )% |
| Total futures | | | | | | | 4,895,517 | | | | 12.46 | % |
| | | | | | | | | | | | | |
| Options | | | | | | | | | | | | |
| Interest rate futures | | | | | | | 549,104 | | | | 1.40 | % |
| Total options | | | | | | | 549,104 | | | | 1.40 | % |
| | | | | | | | | | | | | |
| Short contracts | | | | | | | | | | | | |
| Options | | | | | | | | | | | | |
| Fed Fund futures February 2012 - June 2012, $99.88 Call | | | (12,650 | ) | | | (2,304,872 | ) | | | (5.87 | )% |
| Fed Fund futures January 2012 - June 2012, $99.75 - $99.88 Put | | | (25,162 | ) | | | (1,255,163 | ) | | | (3.19 | )% |
| Other interest rate futures | | | | | | | (37,500 | ) | | | (0.10 | )% |
| Total options | | | | | | | (3,597,535 | ) | | | (9.16 | )% |
| | | | | | | | | | | | | |
| Total | | | | | | $ | 1,847,086 | | | | 4.70 | % |
| Description | | Number of Contracts | | | Fair Value | | | Percentage of Net Assets of Master Fund | |
| Graham Fed Policy Ltd. | | | | | | | | | |
| Long contracts | | | | | | | | | |
| Futures | | | | | | | | | |
| 30 Day Fed Fund February 2011 | | | 4,831 | | | $ | 2,646,031 | | | | 5.61 | % |
| Other 30 Day Fed Fund January 2011 - June 2012 | | | 0,026 | | | | 8,927,649 | | | | 18.92 | % |
| Total futures | | | | | | | 11,573,680 | | | | 24.53 | % |
| | | | | | | | | | | | | |
| Options | | | | | | | | | | | | |
| 30 Day Fed Fund futures February 2011, $99.75 Call | | | 11,350 | | | | 3,310,682 | | | | 7.02 | % |
| Other 30 Day Fed Fund futures January 2011 - December 2011, $99.69 - $99.81 Call | | | 74,106 | | | | 11,797,652 | | | | 25.01 | % |
| 30 Day Fed Fund futures January 2011 - February 2011, $99.63 - $99.75 Put | | | 30,823 | | | | 409,647 | | | | 0.87 | % |
| Other interest rate futures | | | | | | | 437,500 | | | | 0.93 | % |
| Total options | | | | | | | 15,955,481 | | | | 33.83 | % |
| | | | | | | | | | | | | |
| Short contracts | | | | | | | | | | | | |
| Futures | | | | | | | | | | | | |
| 30 Day Fed Fund December 2010 - July 2012 | | | (2,849 | ) | | | 39,967 | | | | 0.08 | % |
| Total futures | | | | | | | 39,967 | | | | 0.08 | % |
| | | | | | | | | | | | | |
| Options | | | | | | | | | | | | |
| 30 Day Fed Fund futures January 2011 - December 2011, $99.81 - $99.94 Call | | | (178,751 | ) | | | (3,833,213 | ) | | | (8.13 | )% |
| 30 Day Fed Fund futures January 2011, $99.69 Put | | | (6,000 | ) | | | (62,505 | ) | | | (0.13 | )% |
| Other interest rate futures | | | | | | | (62,500 | ) | | | (0.13 | )% |
| Total options | | | | | | | (3,958,218 | ) | | | (8.39 | )% |
| | | | | | | | | | | | | |
| Total | | | | | | $ | 23,610,910 | | | | 50.05 | % |
Graham Alternative Investment Trading LLC
Notes to Financial Statements (continued)
3. | 3. | Investments in Master Funds (continued) |
The following schedules display the condensed schedules of investments for the Master Funds as of December 31, 2010.2011.
| Description | Notional Amount | | Fair Value | | | Percentage of Net Assets of Master Fund | |
| Graham Global Monetary Policy LLC | | | | | | | |
| Long contracts | | | | | | | |
| Futures | | | | | | | |
| Foreign bond | | | $ | 298,460 | | | | 0.40 | % |
| Total futures | | | | 298,460 | | | | 0.40 | % |
| | | | | | | | | | |
| Options | | | | | | | | | |
| Foreign currency | | | | 339,824 | | | | 0.45 | % |
| Total options | | | | 339,824 | | | | 0.45 | % |
| | | | | | | | | | |
| Forwards | | | | | | | | | |
| Chinese Yuan / U.S. dollar January 2012 – December 2012 | CNY 3,296,537,500 | | | 4,745,926 | | | | 6.29 | % |
| Other foreign currency | | | | 4,716,017 | | | | 6.25 | % |
| Total forwards | | | | 9,461,943 | | | | 12.54 | % |
| | | | | | | | | | |
| Short contracts | | | | | | | | | |
| Futures | | | | | | | | | |
| Interest rate | | | | 94,330 | | | | 0.13 | % |
| Total futures | | | | 94,330 | | | | 0.13 | % |
| | | | | | | | | | |
| Options | | | | | | | | | |
| Foreign currency | | | | (636,257 | ) | | | (0.84 | )% |
| Total options | | | | (636,257 | ) | | | (0.84 | )% |
| | | | | | | | | | |
| Forwards | | | | | | | | | |
| Chinese Yuan / U.S. dollar January 2012 – December 2012 | CNY (3,619,150,000) | | | (3,949,883 | ) | | | (5.24 | )% |
| Other foreign currency | | | | (3,348,612 | ) | | | (4.44 | )% |
| Total forwards | | | | (7,298,495 | ) | | | (9.68 | )% |
| Total | | | $ | 2,259,805 | | | | 3.00 | % |
| Description | | Number of Contracts / Principal Amount | | | Fair Value | | | Percentage of Net Assets of Master Fund | |
| Graham Global Monetary Policy LLC | | | | | | | | | |
| Long contracts | | | | | | | | | |
| Futures | | | | | | | | | |
| Commodity | | | | | $ | 833,980 | | | | 2.10 | % |
| Interest rate | | | | | | 1,570,955 | | | | 3.95 | % |
| Total futures | | | | | | 2,404,935 | | | | 6.05 | % |
| | | | | | | | | | | | |
| Options | | | | | | | | | | | |
| Foreign currency | | | | | | 603,151 | | | | 1.52 | % |
| Total options | | | | | | 603,151 | | | | 1.52 | % |
| | | | | | | | | | | | |
| Forwards | | | | | | | | | | | |
| Japanese Yen / U.S. dollar 01/04/11 | | JPY 35,703,594,900 | | | | 2,677,452 | | | | 6.73 | % |
| Japanese Yen / U.S. dollar 01/05/11 | | JPY 34,708,122,000 | | | | 2,429,135 | | | | 6.11 | % |
| Chinese Yuan / U.S. dollar 06/17/11 - 06/27/11 | | CNY 471,400,000 | | | | 2,318,175 | | | | 5.83 | % |
| Australian Dollar / U.S. dollar 01/04/11 - 01/05/11 | | AUD 550,000,000 | | | | 3,850,775 | | | | 9.68 | % |
| Other foreign currency | | | | | | (474,653 | ) | | | (1.19 | )% |
| Total forwards | | | | | | 10,800,884 | | | | 27.16 | % |
| | | | | | | | | | | | |
| Short contracts | | | | | | | | | | | |
| Futures | | | | | | | | | | | |
| Euroswiss March 2011 | | | (7,500 | ) | | | (2,070,419 | ) | | | (5.21 | )% |
| Other interest rate | | | | | | | (1,009,594 | ) | | | (2.53 | )% |
| U.S. bond | | | | | | | (37,016 | ) | | | (0.09 | )% |
| Foreign bond | | | | | | | 641,195 | | | | 1.61 | % |
| Commodity | | | | | | | (770,200 | ) | | | (1.94 | )% |
| Total futures | | | | | | | (3,246,034 | ) | | | (8.16 | )% |
| | | | | | | | | | | | | |
| Forwards | | | | | | | | | | | | |
| Australian dollar / U.S. dollar 01/04/11 | | AUD (450,000,000) | | | | (3,909,044 | ) | | | (9.83 | )% |
| Other Australian dollar / U.S. dollar 01/05/11 | | AUD (115,000,000) | | | | (192,228 | ) | | | (0.48 | )% |
| Japanese Yen / U.S. dollar 01/04/11 | | JPY (35,868,141,100) | | | | (4,709,285 | ) | | | (11.84 | )% |
| Other Japanese Yen / U.S. dollar 01/05/11 | | JPY (40,735,192,000) | | | | (1,652,261 | ) | | | (4.16 | )% |
| Other foreign currency | | | | | | | (2,682,356 | ) | | | (6.75 | )% |
| Total forwards | | | | | | | (13,145,174 | ) | | | (33.06 | )% |
| | | | | | | | | | | | | |
| Total | | | | | | $ | (2,582,238 | ) | | | (6.49 | )% |
Graham Alternative Investment Trading LLC
Notes to Financial Statements (continued)
3. | 3. | Investments in Master Funds (continued) |
The following schedules display the condensed schedules of investments for the Master Funds as of December 31, 2010.2011.
| Description | | Fair Value | | | Percentage of Net Assets of Master Fund | |
| Graham K4D Trading Ltd. | | | | | | |
| Long contracts | | | | | | |
| Futures | | | | | | |
| U.S. bond | | $ | 5,555,669 | | | | 1.67 | % |
| Foreign bond | | | 15,262,571 | | | | 4.58 | % |
| U.S. index | | | 2,281,203 | | | | 0.68 | % |
| Foreign index | | | 1,698,637 | | | | 0.51 | % |
| Commodity | | | (255,745 | ) | | | (0.08 | )% |
| Interest rate | | | 903,752 | | | | 0.27 | % |
| Currency | | | 839,900 | | | | 0.25 | % |
| Total futures | | | 26,285,987 | | | | 7.88 | % |
| | | | | | | | | |
| Forwards | | | | | | | | |
| Foreign currency | | | 8,206,755 | | | | 2.46 | % |
| Total forwards | | | 8,206,755 | | | | 2.46 | % |
| | | | | | | | | |
| Short contracts | | | | | | | | |
| Futures | | | | | | | | |
| Foreign bond | | | (7,404 | ) | | | (0.00 | )% |
| U.S. index | | | 5,540 | | | | 0.00 | % |
| Foreign index | | | (1,563,165 | ) | | | (0.47 | )% |
| Commodity | | | 615,434 | | | | 0.18 | % |
| Interest rate | | | (1,288,252 | ) | | | (0.38 | )% |
| Currency | | | 337,837 | | | | 0.10 | % |
| Total futures | | | (1,900,010 | ) | | | (0.57 | )% |
| | | | | | | | | |
| Swaps | | | | | | | | |
| Commodity | | | (15,255,976 | ) | | | (4.57 | )% |
| Total swaps | | | (15,255,976 | ) | | | (4.57 | )% |
| | | | | | | | | |
| Forwards | | | | | | | | |
| Foreign currency | | | 8,744,804 | | | | 2.62 | % |
| Total forwards | | | 8,744,804 | | | | 2.62 | % |
| | | | | | | | | |
| Total | | $ | 26,081,560 | | | | 7.82 | % |
| Description | Principal Amount | | Fair Value | | | Percentage of Net Assets of Master Fund | |
| Graham K4D Trading Ltd. | | | | | | | |
| Long contracts | | | | | | | |
| Futures | | | | | | | |
| U.S. bond | | | $ | 237,741 | | | | 0.13 | % |
| Foreign bond | | | | 1,053,653 | | | | 0.58 | % |
| U.S. index | | | | 3,010,100 | | | | 1.66 | % |
| Foreign index | | | | (3,683,508 | ) | | | (2.03 | )% |
| Commodity | | | | 31,911,445 | | | | 17.57 | % |
| Interest rate | | | | 325,182 | | | | 0.18 | % |
| Currency | | | | 4,536,916 | | | | 2.50 | % |
| Total futures | | | | 37,391,529 | | | | 20.59 | % |
| | | | | | | | | | |
| Forwards | | | | | | | | | |
| Japanese Yen / U.S. dollar 01/19/11 | JPY 43,988,617,100 | | | 11,186,032 | | | | 6.16 | % |
| Other Japanese Yen / U.S. dollar 1/04/11 - 1/05/11 | JPY 14,270,122,339 | | | 796,715 | | | | 0.44 | % |
| Swiss Franc / U.S. dollar 01/19/11 | CHF 491,922,158 | | | 17,376,713 | | | | 9.57 | % |
| Other foreign currency | | | | 28,092,524 | | | | 15.46 | % |
| Total forwards | | | | 57,451,984 | | | | 31.63 | % |
Graham Alternative Investment Trading LLC
Notes to Financial Statements (continued)
3. | 3. | Investments in Master Funds (continued) |
The following schedules display the condensed schedules of investments for the Master Funds as of December 31, 2010.2011.
| Description | Principal Amount | | Fair Value | | | Percentage of Net Assets of Master Fund | | Notional Amount | | Fair Value | | | Percentage of Net Assets of Master Fund | |
| Graham K4D Trading Ltd. (continued) | | | | | | | | |
| Graham Macro Directional LLC | | | | | | | | |
| Long contracts | | | | | | | | |
| Futures | | | | | | | | |
| Foreign bond | | | | $ | (21,390 | ) | | | (0.20 | )% |
| Total forwards | | | | | (21,390 | ) | | | (0.20 | )% |
| | | | | | | | | | | |
| Forwards | | | | | | | | | | |
| Foreign currency | | | | | 227,165 | | | | 2.10 | % |
| Total forwards | | | | | 227,165 | | | | 2.10 | % |
| | | | | | | | | | | |
| Short contracts | | | | | | | | | | | | | | | | |
| Futures | | | | | | | | | | | | | | | | |
| U.S. bond | | | $ | (1,546,794 | ) | | | (0.85 | )% | |
| Foreign bond | | | | (540,937 | ) | | | (0.30 | )% | |
| Foreign index | | | | (142,959 | ) | | | (0.08 | )% | |
| Commodity | | | | (4,754,965 | ) | | | (2.62 | )% | |
| Interest rate | | | | (3,790,967 | ) | | | (2.09 | )% | |
| Currency | | | | 739,824 | | | | 0.41 | % | |
| U.S. index | | | | | (22,500 | ) | | | (0.21 | )% |
| Total futures | | | | (10,036,798 | ) | | | (5.53 | )% | | | | (22,500 | ) | | | (0.21 | )% |
| | | | | | | | | | | | | | | | | | | |
| Forwards | | | | | | | | | | | | | | | | | | |
| Japanese Yen / U.S. dollar 01/19/11 | JPY (36,043,608,800) | | | (12,993,436 | ) | | | (7.15 | )% | |
| Other Japanese Yen / U.S. dollar 1/04/11 - 1/05/11 | JPY (14,111,800,669) | | | (834,965 | ) | | | (0.46 | )% | |
| Swiss Franc / U.S. dollar 01/19/11 | CHF (431,464,200) | | | (17,247,454 | ) | | | (9.50 | )% | |
| Australian dollar / U.S. dollar 01/03/12 | | AUD (40,000,000) | | | (555,000 | ) | | | (5.12 | )% |
| Other foreign currency | | | | (7,987,532 | ) | | | (4.40 | )% | | | | (1,149,763 | ) | | | (10.60 | )% |
| Total forwards | | | | (39,063,387 | ) | | | (21.51 | )% | | | | (1,704,763 | ) | | | (15.72 | )% |
| | | | | | | | | | | | | | | | | | | |
| Total | | | $ | 45,743,328 | | | | 25.18 | % | | | $ | (1,521,488 | ) | | | (14.03 | )% |
Graham Alternative Investment Trading LLC
Notes to Financial Statements (continued)
3. | 3. | Investments in Master Funds (continued) |
The following schedules displaytable shows the condensed schedulesfair value classification of investments for theeach investment type by Master FundsFund as of December 31, 2010.2011:
| Description | Principal Amount | | Fair Value | | | Percentage of Net Assets of Master Fund | |
| Graham Macro Directional LLC | | | | | | | |
| Long contracts | | | | | | | |
| Futures | | | | | | | |
| Commodity | | | $ | 66,430 | | | | 4.55 | % |
| Total futures | | | | 66,430 | | | | 4.55 | % |
| | | | | | | | | | |
| Forwards | | | | | | | | | |
| Canadian dollar / U.S. dollar 01/04/11 | CAD 20,003,980 | | | 87,433 | | | | 5.99 | % |
| Total forwards | | | | 87,433 | | | | 5.99 | % |
| | | | | | | | | | |
| Short Contracts | | | | | | | | | |
| Futures | | | | | | | | | |
| Foreign bond | | | | 20,060 | | | | 1.37 | % |
| Total futures | | | | 20,060 | | | | 1.37 | % |
| | | | | | | | | | |
| Total | | | $ | 173,923 | | | | 11.91 | % |
| | | Graham Commodity Strategies LLC | | | Graham Energy Focus LLC | | | Graham Fed Policy Ltd. | | | Graham Global Monetary Policy LLC | | | Graham K4D Trading Ltd. | | | Graham Macro Directional LLC | |
| Assets | | | | | | | | | | | | | | | | | | |
| Level 1: | | | | | | | | | | | | | | | | | | |
| U.S. bond futures | | $ | - | | | $ | - | | | $ | - | | | $ | - | | | $ | 5,807,164 | | | $ | - | |
| Foreign bond futures | | | - | | | | - | | | | - | | | | 385,999 | | | | 15,262,571 | | | | - | |
| U.S. index futures | | | - | | | | - | | | | - | | | | - | | | | 3,038,693 | | | | - | |
| Foreign index futures | | | - | | | | - | | | | - | | | | - | | | | 1,954,287 | | | | - | |
| Commodity futures | | | 121,643,778 | | | | 42,519,858 | | | | - | | | | - | | | | 15,602,465 | | | | - | |
| Commodity futures options | | | - | | | | 8,607,100 | | | | - | | | | - | | | | - | | | | - | |
| Commodity futures swaps | | | 2,117,443 | | | | 3,663,400 | | | | - | | | | - | | | | - | | | | - | |
| Interest rate futures | | | - | | | | - | | | | 4,918,956 | | | | 94,330 | | | | 1,693,157 | | | | - | |
| Interest rate futures options | | | - | | | | - | | | | 549,104 | | | | - | | | | - | | | | - | |
| Currency futures | | | - | | | | - | | | | - | | | | - | | | | 1,406,611 | | | | - | |
| Total Level 1 | | | 123,761,221 | | | | 54,790,358 | | | | 5,468,060 | | | | 480,329 | | | | 44,764,948 | | | | - | |
| | | | | | | | | | | | | | | | | | | | | | | | | |
| Level 2: | | | | | | | | | | | | | | | | | | | | | | | | |
| Foreign currency forwards | | | - | | | | - | | | | - | | | | 8,341,253 | | | | 21,958,196 | | | | 37,206 | |
| Foreign currency options | | | - | | | | - | | | | - | | | | 339,824 | | | | - | | | | - | |
| Total Level 2 | | | - | | | | - | | | | - | | | | 8,681,077 | | | | 21,958,196 | | | | 37,206 | |
| Total assets | | $ | 123,761,221 | | | $ | 54,790,358 | | | $ | 5,468,060 | | | $ | 9,161,406 | | | $ | 66,723,144 | | | $ | 37,206 | |
| | | | | | | | | | | | | | | | | | | | | | | | | |
| Liabilities | | | | | | | | | | | | | | | | | | | | | | | | |
| Level 1: | | | | | | | | | | | | | | | | | | | | | | | | |
| U.S. bond futures | | $ | - | | | $ | - | | | $ | - | | | $ | - | | | $ | (251,495 | ) | | $ | - | |
| Foreign bond futures | | | - | | | | - | | | | - | | | | (87,539 | ) | | | (7,404 | ) | | | (21,390 | ) |
| Foreign index futures | | | - | | | | - | | | | - | | | | - | | | | (1,818,815 | ) | | | - | |
| U.S. index futures | | | (41,633 | ) | | | - | | | | - | | | | - | | | | (751,950 | ) | | | (22,500 | ) |
| Commodity futures | | | (122,905,252 | ) | | | (30,923,235 | ) | | | - | | | | - | | | | (15,242,776 | ) | | | - | |
| Commodity futures options | | | - | | | | (2,521,680 | ) | | | - | | | | - | | | | - | | | | - | |
| Commodity futures swaps | | | (11,609,595 | ) | | | (28,833,270 | ) | | | - | | | | - | | | | (15,255,976 | ) | | | - | |
| Interest rate futures | | | - | | | | - | | | | (23,439 | ) | | | - | | | | (2,077,657 | ) | | | - | |
| Interest rate futures options | | | - | | | | - | | | | (3,597,535 | ) | | | - | | | | - | | | | - | |
| Currency futures | | | (39,300 | ) | | | - | | | | - | | | | - | | | | (228,874 | ) | | | - | |
| Total Level 1 | | | (134,595,780 | ) | | | (62,278,185 | ) | | | (3,620,974 | ) | | | (87,539 | ) | | | (35,634,947 | ) | | | (43,890 | ) |
| | | | | | | | | | | | | | | | | | | | | | | | | |
| Level 2: | | | | | | | | | | | | | | | | | | | | | | | | |
| Foreign currency forwards | | | - | | | | - | | | | - | | | | (6,177,805 | ) | | | (5,006,637 | ) | | | (1,514,804 | ) |
| Foreign currency options | | | - | | | | - | | | | - | | | | (636,257 | ) | | | - | | | | - | |
| Total Level 2 | | | - | | | | - | | | | - | | | | (6,814,062 | ) | | | (5,006,637 | ) | | | (1,514,804 | ) |
| Total liabilities | | $ | (134,595,780 | ) | | $ | (62,278,185 | ) | | $ | (3,620,974 | ) | | $ | (6,901,601 | ) | | $ | (40,641,584 | ) | | $ | (1,558,694 | ) |
Graham Alternative Investment Trading LLC
Notes to Financial Statements (continued)
3. Investments in Master Funds (continued)
| 3. | Investments in Master Funds (continued) |
The following schedules display the condensed schedules of investments for the Master Funds as of December 31, 2010.
| Description | | Principal Amount / Number of Contracts | | | Fair Value | | | Percentage of Net Assets of Master Fund | |
| Graham Short Term Global Macro LLC | | | | | | | | | |
| Long contracts | | | | | | | | | |
| Futures | | | | | | | | | |
| S&P 500 E-Mini March 2011 | | | 225 | | | $ | (16,875 | ) | | | (11.52 | )% |
| Total futures | | | | | | | (16,875 | ) | | | (11.52 | )% |
| | | | | | | | | | | | | |
| Options | | | | | | | | | | | | |
| British Pound Put / Swiss Franc Call, $1.47 | | CHF 10,000,000 | | | | 47,256 | | | | 32.27 | % |
| Total options | | | | | | | 47,256 | | | | 32.27 | % |
| | | | | | | | | | | | | |
| Forwards | | | | | | | | | | | | |
| Chinese Yuan / U.S. dollar 08/19/11 | | CNY 334,143,000 | | | | 1,385,221 | | | | 945.81 | % |
| Total forwards | | | | | | | 1,385,221 | | | | 945.81 | % |
| | | | | | | | | | | | | |
| Short Contracts | | | | | | | | | | | | |
| Forwards | | | | | | | | | | | | |
| Swiss Franc / British Pound 01/05/11 | | CHF (7,292,955) | | | | (15,162 | ) | | | (10.35 | )% |
| Chinese Yuan / U.S. dollar 08/19/11 | | CNY (334,143,000) | | | | (1,458,935 | ) | | | (996.15 | )% |
| Total forwards | | | | | | | (1,474,097 | ) | | | (1,006.50 | )% |
| | | | | | | | | | | | | |
| Total | | | | | | $ | (58,495 | ) | | | (39.94 | )% |
Graham Alternative Investment Trading LLC
Notes to Financial Statements (continued)
3. Investments in Master Funds (continued)
The following table shows the fair value classification of each investment type by Master Fund as of December 31, 2010:
| | | Graham Commodity Strategies LLC | | | Graham Discretionary Energy Trading III LLC | | | Graham Fed Policy Ltd. | | | Graham Global Monetary Policy LLC | | | Graham K4D Trading Ltd. | | | Graham Macro Directional LLC | | | Graham Short Term Global Macro LLC | |
| Long Contracts | | | | | | | | | | | | | | | | | | | | | |
| Level 1: | | | | | | | | | | | | | | | | | | | | | |
| U.S. bond futures | | $ | - | | | $ | - | | | $ | - | | | $ | - | | | $ | 237,741 | | | $ | - | | | $ | - | |
| Foreign bond futures | | | - | | | | - | | | | - | | | | - | | | | 1,053,653 | | | | - | | | | - | |
| U.S. index futures | | | - | | | | - | | | | - | | | | - | | | | 3,010,100 | | | | - | | | | (16,875 | ) |
| Foreign index futures | | | - | | | | - | | | | - | | | | - | | | | (3,683,508 | ) | | | - | | | | - | |
| Commodity futures | | | 125,831,390 | | | | 34,377,504 | | | | - | | | | 833,980 | | | | 31,911,445 | | | | 66,430 | | | | - | |
| Commodity futures options | | | - | | | | 2,165,000 | | | | - | | | | - | | | | - | | | | - | | | | - | |
| Commodity swaps | | | - | | | | 3,756,110 | | | | - | | | | - | | | | - | | | | - | | | | - | |
| Interest rate futures | | | - | | | | - | | | | 11,573,680 | | | | 1,570,955 | | | | 325,182 | | | | - | | | | - | |
| Interest rate futures options | | | - | | | | - | | | | 15,955,481 | | | | - | | | | - | | | | - | | | | - | |
| Currency futures | | | - | | | | - | | | | - | | | | - | | | | 4,536,916 | | | | - | | | | - | |
| Total Level 1 | | | 125,831,390 | | | | 40,298,614 | | | | 27,529,161 | | | | 2,404,935 | | | | 37,391,529 | | | | 66,430 | | | | (16,875 | ) |
| | | | | | | | | | | | | | | | | | | | | | | | | | | | | |
| Level 2: | | | | | | | | | | | | | | | | | | | | | | | | | | | | |
| Foreign currency forwards | | | - | | | | - | | | | - | | | | 10,800,884 | | | | 57,451,984 | | | | 87,433 | | | | 1,385,221 | |
| Foreign currency forwards options | | | - | | | | - | | | | - | | | | 603,151 | | | | - | | | | - | | | | 47,256 | |
| Total Level 2 | | | - | | | | - | | | | - | | | | 11,404,035 | | | | 57,451,984 | | | | 87,433 | | | | 1,432,477 | |
| Total long contracts | | $ | 125,831,390 | | | $ | 40,298,614 | | | $ | 27,529,161 | | | $ | 13,808,970 | | | $ | 94,843,513 | | | $ | 153,863 | | | $ | 1,415,602 | |
| | | | | | | | | | | | | | | | | | | | | | | | | | | | | |
| Short Contracts | | | | | | | | | | | | | | | | | | | | | | | | | | | | |
| Level 1: | | | | | | | | | | | | | | | | | | | | | | | | | | | | |
| U.S. bond futures | | | - | | | | - | | | | - | | | | (37,016 | ) | | | (1,546,794 | ) | | | - | | | | - | |
| Foreign bond futures | | | - | | | | - | | | | - | | | | 641,195 | | | | (540,937 | ) | | | 20,060 | | | | - | |
| Foreign index futures | | | - | | | | - | | | | - | | | | - | | | | (142,959 | ) | | | - | | | | - | |
| Commodity futures | | | (88,859,512 | ) | | | (20,336,838 | ) | | | - | | | | (770,200 | ) | | | (4,754,965 | ) | | | - | | | | - | |
| Commodity futures options | | | - | | | | (182,500 | ) | | | - | | | | - | | | | - | | | | - | | | | - | |
| Commodity swaps | | | - | | | | (1,417,000 | ) | | | - | | | | - | | | | - | | | | - | | | | - | |
| Interest rate futures | | | - | | | | - | | | | 39,967 | | | | (3,080,013 | ) | | | (3,790,967 | ) | | | - | | | | - | |
| Interest rate futures options | | | - | | | | - | | | | (3,958,218 | ) | | | - | | | | - | | | | - | | | | - | |
| Currency futures | | | - | | | | - | | | | - | | | | - | | | | 739,824 | | | | - | | | | - | |
| Total Level 1 | | | (88,859,512 | ) | | | (21,936,338 | ) | | | (3,918,251 | ) | | | (3,246,034 | ) | | | (10,036,798 | ) | | | 20,060 | | | | - | |
| | | | | | | | | | | | | | | | | | | | | | | | | | | | | |
| Level 2: | | | | | | | | | | | | | | | | | | | | | | | | | | | | |
| Foreign currency forwards | | | - | | | | - | | | | - | | | | (13,145,174 | ) | | | (39,063,387 | ) | | | - | | | | (1,474,097 | ) |
| Total Level 2 | | | - | | | | - | | | | - | | | | (13,145,174 | ) | | | (39,063,387 | ) | | | - | | | | (1,474,097 | ) |
| Total short contracts | | $ | (88,859,512 | ) | | $ | (21,936,338 | ) | | $ | (3,918,251 | ) | | $ | (16,391,208 | ) | | $ | (49,100,185 | ) | | $ | 20,060 | | | $ | (1,474,097 | ) |
Graham Alternative Investment Trading LLC
Notes to Financial Statements (continued)
3. Investments in Master Funds (continued)
The following table displays the gross volume of derivative activities based on their notional amounts and number of contracts and fair value of derivative contracts held by the Master Funds at December 31, 20102011 categorized by primary underlying risk and areis representative of the derivative positions held by the Master Funds throughout the year. Derivatives denominated in foreign currencies have been converted to U.S. dollars. Derivative assetsasset and liability balances are presented on a gross basis, prior to the application of counterparty netting. The Master Funds trade futures and options on a leveraged basis. Due to the low margin deposits normally required for trading these derivative financial instruments, the gross notional exposure as displayed in the tables below may exceed the net asset value of the Master Funds by a significant amount. As a result, a relatively small price movement in an underlying derivative financial instrument may result in immediate and substantial effect on the net income and net asset value of the Master Funds and GAIT. Amounts presented below as collateral balances supporting all derivative positions are included in due from brokers on the respective Master Fund’sFunds’ statement of financial condition.
| | | Graham Commodity Strategies LLC | | | Graham Discretionary Energy Trading III LLC | | | Graham Commodity Strategies LLC | | | Graham Energy Focus LLC | |
| | | Long exposure | | | Short exposure | | | | | | | | | Long exposure | | | Short exposure | | | | | | | | | Long exposure | | | Short exposure | | | | | | | | | Long exposure | | | Short exposure | | | | | | | |
| | | Notional amounts | | | Number of contracts | | | Notional amounts | | | Number of contracts | | | Derivative Assets | | | Derivative Liabilities | | | Notional amounts | | | Number of contracts | | | Notional amounts | | | Number of contracts | | | Derivative Assets | | | Derivative Liabilities | | | Notional amounts | | | Number of contracts | | | Notional amounts | | | Number of contracts | | | Derivative Assets | | | Derivative Liabilities | | | Notional amounts | | | Number of contracts | | | Notional amounts | | | Number of contracts | | | Derivative Assets | | | Derivative Liabilities | |
| | | | | | | | | | | | | | | | | | | | | | | | | | | | | | | | | | | | | | | | | | | | | | | | | | | | | | | | | | | | | | | | | | | | | | | | | |
| Commodity price | | | | | | | | | | | | | | | | | | | | | | | | | | | | | | | | | | | | | | | | | | | | | | | | | | | | | | | | | | | | | | | | | | | | | | | | |
| Futures | | $ | 2,051,527,235 | | | | 30,976 | | | $ | (1,894,621,560 | ) | | | (29,206 | ) | | $ | 126,128,889 | | | $ | (89,157,011 | ) | | $ | 670,612,370 | | | | 6,981 | | | $ | (598,798,245 | ) | | | (6,947 | ) | | $ | 34,377,504 | | | $ | (20,336,838 | ) | | $ | 5,222,568,696 | | | | 73,089 | | | $ | (5,055,686,350 | ) | | | (73,848 | ) | | $ | 121,643,778 | | | $ | (122,905,252 | ) | | $ | 231,604,970 | | | | 15,138 | | | $ | (297,888,138 | ) | | | (15,304 | ) | | $ | 42,519,858 | | | $ | (30,923,235 | ) |
| Options | | | | - | | | | - | | | | - | | | | - | | | | - | | | | - | | | | 26,350,000 | | | | 1,050 | | | | (112,935,000 | ) | | | (4,022 | ) | | | 8,607,100 | | | | (2,521,680 | ) |
| Swaps | | | - | | | | - | | | | - | | | | - | | | | - | | | | - | | | | 98,880,020 | | | | 8,664 | | | | (48,003,000 | ) | | | (3,800 | ) | | | 3,756,110 | | | | (1,417,000 | ) | | | 176,282,548 | | | | 5,469 | | | | (252,954,190 | ) | | | (7,895 | ) | | | 2,117,443 | | | | (11,609,595 | ) | | | 119,063,430 | | | | 14,917 | | | | (31,672,403 | ) | | | (3,161 | ) | | | 3,663,400 | | | | (28,833,270 | ) |
| | | | 2,051,527,235 | | | | 30,976 | | | | (1,894,621,560 | ) | | | (29,206 | ) | | | 126,128,889 | | | | (89,157,011 | ) | | | 769,492,390 | | | | 15,645 | | | | (646,801,245 | ) | | | (10,747 | ) | | | 38,133,614 | | | | (21,753,838 | ) | | | 5,398,851,244 | | | | 78,558 | | | | (5,308,640,540 | ) | | | (81,743 | ) | | | 123,761,221 | | | | (134,514,847 | ) | | | 377,018,400 | | | | 31,105 | | | | (442,495,541 | ) | | | (22,487 | ) | | | 54,790,358 | | | | (62,278,185 | ) |
| | | | | | | | | | | | | | | | | | | | | | | | | | | | | | | | | | | | | | | | | | | | | | | | | | | | | | | | | | | | | | | | | | | | | | | | | | | | | | | | | | | | | | | | | | | | | | | | | |
| Equity price | | | | | | | | | | | | | | | | | | | | | | | | | | | | | | | | | | | | | | | | | | | | | | | | | | | | | | | | | | | | | | | | | | | | | | | | | | | | | | | | | | | | | | | | | | | | | | | | |
| Futures | | | - | | | | - | | | | - | | | | - | | | | - | | | | - | | | | - | | | | - | | | | - | | | | - | | | | - | | | | - | | | | 42,835,500 | | | | 684 | | | | (24,380,400 | ) | | | (330 | ) | | | - | | | | (41,633 | ) | | | - | | | | - | | | | - | | | | - | | | | - | | | | - | |
| | | | - | | | | - | | | | - | | | | - | | | | - | | | | - | | | | - | | | | - | | | | - | | | | - | | | | - | | | | - | | | | 42,835,500 | | | | 684 | | | | (24,380,400 | ) | | | (330 | ) | | | - | | | | (41,633 | ) | | | - | | | | - | | | | - | | | | - | | | | - | | | | - | |
| | | | | | | | | | | | | | | | | | | | | | | | | | | | | | | | | | | | | | | | | | | | | | | | | | | | | | | | | | | | | | | | | | | | | | | | | | | | | | | | | | | | | | | | | | | | | | | | | |
| Foreign currency exchange rate | | | | | | | | | | | | | | | | | | | | | | | | | | | | | | | | | | | | | | | | | | | | | | | | | |
| Foreign currency | | | | | | | | | | | | | | | | | | | | | | | | | | | | | | | | | | | | | | | | | | | | | | | | | |
| exchange rate | | | | | | | | | | | | | | | | | | | | | | | | | | | | | | | | | | | | | | | | | | | | | | | | | |
| Futures | | | - | | | | - | | | | - | | | | - | | | | - | | | | - | | | | - | | | | - | | | | - | | | | - | | | | - | | | | - | | | | 12,233,700 | | | | 230 | | | | - | | | | - | | | | - | | | | (39,300 | ) | | | - | | | | - | | | | - | | | | - | | | | - | | | | - | |
| Forwards | | | - | | | | - | | | | - | | | | - | | | | - | | | | - | | | | - | | | | - | | | | - | | | | - | | | | - | | | | - | | | | - | | | | - | | | | - | | | | - | | | | - | | | | - | | | | - | | | | - | | | | - | | | | - | | | | - | | | | - | |
| | | | - | | | | - | | | | - | | | | - | | | | - | | | | - | | | | - | | | | - | | | | - | | | | - | | | | - | | | | - | | | | 12,233,700 | | | | 230 | | | | - | | | | - | | | | - | | | | (39,300 | ) | | | - | | | | - | | | | - | | | | - | | | | - | | | | - | |
| | | | | | | | | | | | | | | | | | | | | | | | | | | | | | | | | | | | | | | | | | | | | | | | | | | | | | | | | | | | | | | | | | | | | | | | | | | | | | | | | | | | | | | | | | | | | | | | | |
| Interest rate | | | | | | | | | | | | | | | | | | | | | | | | | | | | | | | | | | | | | | | | | | | | | | | | | | | | | | | | | | | | | | | | | | | | | | | | | | | | | | | | | | | | | | | | | | | | | | | | |
| Futures | | | - | | | | - | | | | - | | | | - | | | | - | | | | - | | | | - | | | | - | | | �� | - | | | | - | | | | - | | | | - | | | | - | | | | - | | | | - | | | | - | | | | - | | | | - | | | | - | | | | - | | | | - | | | | - | | | | - | | | | - | |
| | | | - | | | | - | | | | - | | | | - | | | | - | | | | - | | | | - | | | | - | | | | - | | | | - | | | | - | | | | - | | | | - | | | | - | | | | - | | | | - | | | | - | | | | - | | | | - | | | | - | | | | - | | | | - | | | | - | | | | - | |
| Total | | $ | 2,051,527,235 | | | | 30,976 | | | $ | (1,894,621,560 | ) | | | (29,206 | ) | | $ | 126,128,889 | | | $ | (89,157,011 | ) | | $ | 769,492,390 | | | | 15,645 | | | $ | (646,801,245 | ) | | | (10,747 | ) | | $ | 38,133,614 | | | $ | (21,753,838 | ) | | $ | 5,453,920,444 | | | | 79,472 | | | $ | (5,333,020,940 | ) | | | (82,073 | ) | | $ | 123,761,221 | | | $ | (134,595,780 | ) | | $ | 377,018,400 | | | | 31,105 | | | $ | (442,495,541 | ) | | | (22,487 | ) | | $ | 54,790,358 | | | $ | (62,278,185 | ) |
| | | | | | | | | | | | | | | | | | | | | | | | | | | | | | | | | | | | | | | | | | | | | | | | | | | | | | | | | | | | | | | | | | | | | | | | | | | | | | | | | | | | | | | |
| | | | | | | | | | | | | | | | | | | | | | | | | | | | | | | | | | | | | | | | |
| Collateral balances supporting all derivative positions | Collateral balances supporting all derivative positions | | | | | | | | | | | $ | 14,527,187 | | | | | | | | | | | | | | | | | | | | | | | $ | (6,241,250 | ) | Collateral balances supporting all derivative positions | | | | | | | | | | | $ | 142,601,701 | | | | | | | | | | | | | | | | | | | | | | | $ | 29,432,093 | |
Graham Alternative Investment Trading LLC
Notes to Financial Statements (continued)
3. Investments in Master Funds (continued)
| 3. | Investments in Master Funds (continued) |
The following table displays the gross volume of derivative activities based on their notional amounts and number of contracts and fair value of derivative contracts held by the Master Funds at December 31, 20102011 categorized by primary underlying risk and areis representative of the derivative positions held by the Master Funds throughout the year. Derivatives denominated in foreign currencies have been converted to U.S. dollars. Derivative assetsasset and liability balances are presented on a gross basis, prior to the application of counterparty netting. The Master Funds trade futures and options on a leveraged basis. Due to the low margin deposits normally required for trading these derivative financial instruments, the gross notional exposure as displayed in the tables below may exceed the net asset value of the Master Funds by a significant amount. As a result, a relatively small price movement in an underlying derivative financial instrument may result in immediate and substantial effect on the net income and net asset value of the Master Funds and GAIT. Amounts presented below as collateral balances supporting all derivative positions are included in due from brokers on the respective Master Fund’sFunds’ statement of financial condition.
| | | Graham Fed Policy Ltd. | | | Graham Global Monetary Policy LLC | | |
| | | Long exposure | | | Short exposure | | | | | | | | | Long exposure | | | Short exposure | | | | | | | | | Graham Fed Policy Ltd. | | | Graham Global Monetary Policy LLC | |
| | | Notional amounts | | | Number of contracts | | | Notional amounts | | | Number of contracts | | | Derivative Assets | | | Derivative Liabilities | | | Notional amounts | | | Number of contracts | | | Notional amounts | | | Number of contracts | | | Derivative Assets | | | Derivative Liabilities | | | Long exposure | | | Short exposure | | | | | | | | | Long exposure | | | Short exposure | | | | | | | |
| | | | | | | | | | | | | | | | | | | | | | | | | | | | | | | | | | | | | | | Notional amounts | | | Number of contracts | | | Notional amounts | | | Number of contracts | | | Derivative Assets | | | Derivative Liabilities | | | Notional amounts | | | Number of contracts | | | Notional amounts | | | Number of contracts | | | Derivative Assets | | | Derivative Liabilities | |
| Commodity price | | | | | | | | | | | | | | | | | | | | | | | | | | | | | | | | | | | | | | | | | | | | | | | | | | | | | | | | | | | | | | | | | | | | | | | | |
| Futures | | $ | - | | | | - | | | $ | - | | | | - | | | $ | - | | | $ | - | | | $ | 38,619,000 | | | | 600 | | | $ | (24,200,000 | ) | | | (500 | ) | | $ | 833,980 | | | $ | (770,200 | ) | | $ | - | | | | - | | | $ | - | | | | - | | | $ | - | | | $ | - | | | - | | | $ | - | | | - | | | $ | - | | | $ | - | | | $ | - | |
| Swaps | | | | - | | | | - | | | | - | | | | - | | | | - | | | | - | | | | - | | | | - | | | | - | | | | - | | | | - | | | | - | |
| | | | - | | | | - | | | | - | | | | - | | | | - | | | | - | | | | 38,619,000 | | | | 600 | | | | (24,200,000 | ) | | | (500 | ) | | | 833,980 | | | | (770,200 | ) | | | - | | | | - | | | | - | | | | - | | | | - | | | | - | | | | - | | | | - | | | | - | | | | | | | | - | | | | - | |
| | | | | | | | | | | | | | | | | | | | | | | | | | | | | | | | | | | | | | | | | | | | | | | | | | | | | | | | | | | | | | | | | | | | | | | | | | | | | | | | | | | | | | | | | | | | | | | | | |
| Equity price | | | | | | | | | | | | | | | | | | | | | | | | | | | | | | | | | | | | | | | | | | | | | | | | | | | | | | | | | | | | | | | | | | | | | | | | | | | | | | | | | | | | | | | | | | | | | | | | |
| Futures | | | - | | | | - | | | | - | | | | - | | | | - | | | | - | | | | - | | | | - | | | | - | | | | - | | | | - | | | | - | | | | - | | | | - | | | | - | | | | - | | | | - | | | | - | | | | - | | | | - | | | | - | | | | - | | | | - | | | | - | |
| | | | - | | | | - | | | | - | | | | - | | | | - | | | | - | | | | - | | | | - | | | | - | | | | - | | | | - | | | | - | | | | - | | | | - | | | | - | | | | - | | | | - | | | | - | | | | - | | | | - | | | | - | | | | - | | | | - | | | | - | |
| | | | | | | | | | | | | | | | | | | | | | | | | | | | | | | | | | | | | | | | | | | | | | | | | | | | | | | | | | | | | | | | | | | | | | | | | | | | | | | | | | | | | | | | | | | | | | | | | |
| Foreign currency exchange rate | | | | | | | | | | | | | | | | | | | | | | | | | | | | | | | | | | | | | | | | | | | | | | | | | |
| Foreign currency | | | | | | | | | | | | | | | | | | | | | | | | | | | | | | | | | | | | | | | | | | | | | | | | | |
| exchange rate | | | | | | | | | | | | | | | | | | | | | | | | | | | | | | | | | | | | | | | | | | | | | | | | | |
| Futures | | | - | | | | - | | | | - | | | | - | | | | - | | | | - | | | | - | | | | - | | | | - | | | | - | | | | - | | | | - | | | | - | | | | - | | | | - | | | | - | | | | - | | | | - | | | | - | | | | - | | | | - | | | | - | | | | - | | | | - | |
| Forwards | | | - | | | | - | | | | - | | | | - | | | | - | | | | - | | | | 56,025,637,522 | | | | - | | | | (46,698,002,524 | ) | | | - | | | | 15,230,468 | | | | (17,574,758 | ) | | | - | | | | - | | | | - | | | | - | | | | - | | | | - | | | | 2,504,581,338 | | | | N/A | | | | (2,502,417,890 | ) | | | N/A | | | | 8,341,253 | | | | (6,177,805 | ) |
| Options | | | | - | | | | - | | | | - | | | | - | | | | - | | | | - | | | | 200,000,000 | | | | 1 | | | | (100,000,000 | ) | | | (1 | ) | | | 339,824 | | | | (636,257 | ) |
| | | | - | | | | - | �� | | | - | | | | - | | | | - | | | | - | | | | 56,025,637,522 | | | | - | | | | (46,698,002,524 | ) | | | - | | | | 15,230,468 | | | | (17,574,758 | ) | | | - | | | | - | | | | - | | | | - | | | | - | | | | - | | | | 2,704,581,338 | | | | 1 | | | | (2,602,417,890 | ) | | | (1 | ) | | | 8,681,077 | | | | (6,814,062 | ) |
| | | | | | | | | | | | | | | | | | | | | | | | | | | | | | | | | | | | | | | | | | | | | | | | | | | | | | | | | | | | | | | | | | | | | | | | | | | | | | | | | | | | | | | | | | | | | | | | | |
| Interest rate | | | | | | | | | | | | | | | | | | | | | | | | | | | | | | | | | | | | | | | | | | | | | | | | | | | | | | | | | | | | | | | | | | | | | | | | | | | | | | | | | | | | | | | | | | | | | | | | |
| Futures | | | 22,811,918,666 | | | | 54,857 | | | | (1,184,445,024 | ) | | | (2,849 | ) | | | 12,217,514 | | | | (603,867 | ) | | | 1,740,487,175 | | | | 5,000 | | | | (2,788,603,000 | ) | | | (14,950 | ) | | | 2,212,150 | | | | (3,117,029 | ) | | | 14,640,919,492 | | | | 35,178 | | | | - | | | | - | | | | 4,918,956 | | | | (23,439 | ) | | | 216,273,337 | | | | 1,940 | | | | (514,021,011 | ) | | | (2,100 | ) | | | 480,329 | | | | (87,539 | ) |
| Options | | | | 2,155,189,586 | | | | 5,981 | | | | (17,228,752,250 | ) | | | (43,812 | ) | | | 549,104 | | | | (3,597,535 | ) | | | - | | | | - | | | | - | | | | - | | | | - | | | | - | |
| | | | 22,811,918,666 | | | | 54,857 | | | | (1,184,445,024 | ) | | | (2,849 | ) | | | 12,217,514 | | | | (603,867 | ) | | | 1,740,487,175 | | | | 5,000 | | | | (2,788,603,000 | ) | | | (14,950 | ) | | | 2,212,150 | | | | (3,117,029 | ) | | | 16,796,109,078 | | | | 41,159 | | | | (17,228,752,250 | ) | | | (43,812 | ) | | | 5,468,060 | | | | (3,620,974 | ) | | | 216,273,337 | | | | 1,940 | | | | (514,021,011 | ) | | | (2,100 | ) | | | 480,329 | | | | (87,539 | ) |
| Total | | $ | 22,811,918,666 | | | | 54,857 | | | $ | (1,184,445,024 | ) | | | (2,849 | ) | | $ | 12,217,514 | | | $ | (603,867 | ) | | $ | 57,804,743,697 | | | | 5,600 | | | $ | (49,510,805,524 | ) | | | (15,450 | ) | | $ | 18,276,598 | | | $ | (21,461,987 | ) | | $ | 16,796,109,078 | | | | 41,159 | | | $ | (17,228,752,250 | ) | | | (43,812 | ) | | $ | 5,468,060 | | | $ | (3,620,974 | ) | | $ | 2,920,854,675 | | | | 1,941 | | | $ | (3,116,438,901 | ) | | | (2,101 | ) | | $ | 9,161,406 | | | $ | (6,901,601 | ) |
| | | | | | | | | | | | | | | | | | | | | | | | | | | | | | | | | | | | | | | | | | | | | | | | | | | | | | | | | | | | | | | | | | | | | | | | | | | | | | | | | | | | | | | |
| | | | | | | | | | | | | | | | | | | | | | | | | | | | | | | | | | | | | | | | |
| Collateral balances supporting all derivative positions | Collateral balances supporting all derivative positions | | | | | | | | | | | $ | 23,563,039 | | | | | | | | | | | | | | | | | | | | | | | $ | 42,339,139 | | Collateral balances supporting all derivative positions | | | | | | | | | | | $ | 37,426,188 | | | | | | | | | | | | | | | | | | | | | | | $ | 73,168,865 | |
Graham Alternative Investment Trading LLC
Notes to Financial Statements (continued)
| 3. | Investments in Master Funds (continued) |
3. Investments in Master Funds (continued)
The following table displays the gross volume of derivative activities based on their notional amounts and number of contracts and fair value of derivative contracts held by the Master Funds at December 31, 20102011 categorized by primary underlying risk and areis representative of the derivative positions held by the Master Funds throughout the year. Derivatives denominated in foreign currencies have been converted to U.S. dollars. Derivative assetsasset and liability balances are presented on a gross basis, prior to the application of counterparty netting. The Master Funds trade futures and options on a leveraged basis. Due to the low margin deposits normally required for trading these derivative financial instruments, the gross notional exposure as displayed in the tables below may exceed the net asset value of the Master Funds by a significant amount. As a result, a relatively small price movement in an underlying derivative financial instrument may result in immediate and substantial effect on the net income and net asset value of the Master Funds and GAIT. Amounts presented below as collateral balances supporting all derivative positions are included in due from brokers on the respective Master Fund’sFunds’ statement of financial condition.
| | | Graham K4D Trading Ltd. | | | Graham Macro Directional LLC | | |
| | | Long exposure | | | Short exposure | | | | | | | | | Long exposure | | | Short exposure | | | | | | | | | Graham K4D Trading Ltd. | | | Graham Macro Directional LLC | |
| | | Notional amounts | | | Number of contracts | | | Notional amounts | | | Number of contracts | | | Derivative Assets | | | Derivative Liabilities | | | Notional amounts | | | Number of contracts | | | Notional amounts | | | Number of contracts | | | Derivative Assets | | | Derivative Liabilities | | | Long exposure | | | Short exposure | | | | | | | | | Long exposure | | | Short exposure | | | | | | | |
| | | | | | | | | | | | | | | | | | | | | | | | | | | | | | | | | | | | | | | Notional amounts | | | Number of contracts | | | Notional amounts | | | Number of contracts | | | Derivative Assets | | | Derivative Liabilities | | | Notional amounts | | | Number of contracts | | | Notional amounts | | | Number of contracts | | | Derivative Assets | | | Derivative Liabilities | |
| Commodity price | | | | | | | | | | | | | | | | | | | | | | | | | | | | | | | | | | | | | | | | | | | | | | | | | | | | | | | | | | | | | | | | | | | | | | | | |
| Futures | | $ | 810,106,878 | | | | 10,782 | | | $ | (53,034,444 | ) | | | (926 | ) | | $ | 32,742,543 | | | $ | (5,586,063 | ) | | $ | 10,660,500 | | | | 75 | | | $ | - | | | | - | | | $ | 66,430 | | | $ | - | | | $ | 549,621,961 | | | | 6,056 | | | $ | (748,131,689 | ) | | | (17,936 | ) | | $ | 15,602,465 | | | $ | (15,242,776 | ) | | $ | - | | | | - | | | $ | - | | | | - | | | $ | - | | | $ | - | |
| Swaps | | | | - | | | | - | | | | (232,232,146 | ) | | | (6,040 | ) | | | - | | | | (15,255,976 | ) | | | - | | | | - | | | | - | | | | - | | | | - | | | | - | |
| | | | 810,106,878 | | | | 10,782 | | | | (53,034,444 | ) | | | (926 | ) | | | 32,742,543 | | | | (5,586,063 | ) | | | 10,660,500 | | | | 75 | | | | - | | | | - | | | | 66,430 | | | | - | | | | 549,621,961 | | | | 6,056 | | | | (980,363,835 | ) | | | (23,976 | ) | | | 15,602,465 | | | | (30,498,752 | ) | | | - | | | | - | | | | - | | | | - | | | | - | | | | - | |
| | | | | | | | | | | | | | | | | | | | | | | | | | | | | | | | | | | | | | | | | | | | | | | | | | | | | | | | | | | | | | | | | | | | | | | | | | | | | | | | | | | | | | | | | | | | | | | | | |
| Equity price | | | | | | | | | | | | | | | | | | | | | | | | | | | | | | | | | | | | | | | | | | | | | | | | | | | | | | | | | | | | | | | | | | | | | | | | | | | | | | | | | | | | | | | | | | | | | | | | |
| Futures | | | 16,008,395,340 | | | | 15,303 | | | | (968,631,180 | ) | | | (671 | ) | | | 4,935,403 | | | | (5,751,770 | ) | | | - | | | | - | | | | - | | | | - | | | | - | | | | - | | | | 532,726,507 | | | | 8,449 | | | | (283,517,405 | ) | | | (4,519 | ) | | | 4,992,980 | | | | (2,570,765 | ) | | | - | | | | - | | | | (12,525,000 | ) | | | (200 | ) | | | - | | | | (22,500 | ) |
| | | | 16,008,395,340 | | | | 15,303 | | | | (968,631,180 | ) | | | (671 | ) | | | 4,935,403 | | | | (5,751,770 | ) | | | - | | | | - | | | | - | | | | - | | | | - | | | | - | | | | 532,726,507 | | | | 8,449 | | | | (283,517,405 | ) | | | (4,519 | ) | | | 4,992,980 | | | | (2,570,765 | ) | | | - | | | | - | | | | (12,525,000 | ) | | | (200 | ) | | | - | | | | (22,500 | ) |
| | | | | | | | | | | | | | | | | | | | | | | | | | | | | | | | | | | | | | | | | | | | | | | | | | | | | | | | | | | | | | | | | | | | | | | | | | | | | | | | | | | | | | | | | | | | | | | | | |
| Foreign currency exchange rate | | | | | | | | | | | | | | | | | | | | | | | | | | | | | | | | | | | | | | | | | | | | | | | | | |
| Foreign currency | | | | | | | | | | | | | | | | | | | | | | | | | | | | | | | | | | | | | | | | | | | | | | | | | |
| exchange rate | | | | | | | | | | | | | | | | | | | | | | | | | | | | | | | | | | | | | | | | | | | | | | | | | |
| Futures | | | 340,454,690 | | | | 2,852 | | | | (86,152,236 | ) | | | (957 | ) | | | 5,633,114 | | | | (356,374 | ) | | | - | | | | - | | | | - | | | | - | | | | - | | | | - | | | | 263,535,156 | | | | 2,886 | | | | (55,089,450 | ) | | | (348 | ) | | | 1,406,611 | | | | (228,874 | ) | | | - | | | | - | | | | - | | | | - | | | | - | | | | - | |
| Forwards | | | 90,870,643,000 | | | | - | | | | (87,109,470,216 | ) | | | - | | | | 78,339,927 | | | | (59,951,330 | ) | | | 19,920,873 | | | | - | | | | - | | | | - | | | | 87,433 | | | | - | | | | 1,473,161,901 | | | | N/A | | | | (1,456,210,342 | ) | | | N/A | | | | 21,958,196 | | | | (5,006,637 | ) | | | 378,520,504 | | | | N/A | | | | (379,998,102 | ) | | | N/A | | | | 37,206 | | | | (1,514,804 | ) |
| | | | 91,211,097,690 | | | | 2,852 | | | | (87,195,622,452 | ) | | | (957 | ) | | | 83,973,041 | | | | (60,307,704 | ) | | | 19,920,873 | | | | - | | | | - | | | | - | | | | 87,433 | | | | - | | | | 1,736,697,057 | | | | 2,886 | | | | (1,511,299,792 | ) | | | (348 | ) | | | 23,364,807 | | | | (5,235,511 | ) | | | 378,520,504 | | | | - | | | | (379,998,102 | ) | | | - | | | | 37,206 | | | | (1,514,804 | ) |
| | | | | | | | | | | | | | | | | | | | | | | | | | | | | | | | | | | | | | | | | | | | | | | | | | | | | | | | | | | | | | | | | | | | | | | | | | | | | | | | | | | | | | | | | | | | | | | | | |
| Interest rate | | | | | | | | | | | | | | | | | | | | | | | | | | | | | | | | | | | | | | | | | | | | | | | | | | | | | | | | | | | | | | | | | | | | | | | | | | | | | | | | | | | | | | | | | | | | | | | | |
| Futures | | | 2,044,200,093 | | | | 8,454 | | | | (63,261,455,459 | ) | | | (23,095 | ) | | | 2,729,784 | | | | (6,991,906 | ) | | | - | | | | - | | | | (12,531,000 | ) | | | (100 | ) | | | 20,060 | | | | - | | | | 11,861,168,194 | | | | 60,131 | | | | (3,335,791,712 | ) | | | (13,264 | ) | | | 22,762,892 | | | | (2,336,556 | ) | | | 22,151,552 | | | | 200 | | | | - | | | | - | | | | - | | | | (21,390 | ) |
| | | | 2,044,200,093 | | | | 8,454 | | | | (63,261,455,459 | ) | | | (23,095 | ) | | | 2,729,784 | | | | (6,991,906 | ) | | | - | | | | - | | | | (12,531,000 | ) | | | (100 | ) | | | 20,060 | | | | - | | | | 11,861,168,194 | | | | 60,131 | | | | (3,335,791,712 | ) | | | (13,264 | ) | | | 22,762,892 | | | | (2,336,556 | ) | | | 22,151,552 | | | | 200 | | | | - | | | | - | | | | - | | | | (21,390 | ) |
| Total | | $ | 110,073,800,001 | | | | 37,391 | | | $ | (151,478,743,535 | ) | | | (25,649 | ) | | $ | 124,380,771 | | | $ | (78,637,443 | ) | | $ | 30,581,373 | | | | 75 | | | $ | (12,531,000 | ) | | | (100 | ) | | $ | 173,923 | | | $ | - | | | $ | 14,680,213,719 | | | | 77,522 | | | $ | (6,110,972,744 | ) | | | (42,107 | ) | | $ | 66,723,144 | | | $ | (40,641,584 | ) | | $ | 400,672,056 | | | | 200 | | | $ | (392,523,102 | ) | | | (200 | ) | | $ | 37,206 | | | $ | (1,558,694 | ) |
| | | | | | | | | | | | | | | | | | | | | | | | | | | | | | | | | | | | | | | | | | | | | | | | | | | | | | | | | | | | | | | | | | | | | | | | | | | | | |
| | | | | | | | | | | | | | | | | | | | | | | | | | | | | | | | | | | | | | | | |
| Collateral balances supporting all derivative positions | Collateral balances supporting all derivative positions | | | | | | | | | | | $ | 135,887,098 | | | | | | | | | | | | | | | | | | | | | | | $ | 1,286,040 | | Collateral balances supporting all derivative positions | | | | | | | | | | | $ | 307,111,336 | | | | | | | | | | | | | | | | | | | | | | | $ | 12,363,794 | |
Graham Alternative Investment Trading LLC
Notes to Financial Statements (continued)
3. Investments in Master Funds (continued)
The following table displays the gross volume of derivative activities based on their notional amounts and number of contracts and fair value of derivative contracts held by the Master Funds at December 31, 2010 categorized by primary underlying risk and are representative of the derivative positions held by the Master Funds throughout the year. Derivatives denominated in foreign currencies have been converted to U.S. dollars. Derivative assets and liability balances are presented on a gross basis, prior to the application of counterparty netting. Amounts presented below as collateral balances supporting all derivative positions are included in due from brokers on the respective Master Fund’s statement of financial condition.
| | | Graham Short Term Global Macro LLC | |
| | | Long exposure | | | Short exposure | | | | | | | |
| | | Notional amounts | | | Number of contracts | | | Notional amounts | | | Number of contracts | | | Derivative Assets | | | Derivative Liabilities | |
| | | | | | | | | | | | | | | | | | | |
| Commodity price | | | | | | | | | | | | | | | | | | |
| Futures | | $ | - | | | | - | | | $ | - | | | | - | | | $ | - | | | $ | - | |
| | | | - | | | | - | | | | - | | | | - | | | | - | | | | - | |
| | | | | | | | | | | | | | | | | | | | | | | | | |
| Equity price | | | | | | | | | | | | | | | | | | | | | | | | |
| Futures | | | 14,096,250 | | | | 225 | | | | - | | | | - | | | | - | | | | (16,875 | ) |
| | | | 14,096,250 | | | | 225 | | | | - | | | | - | | | | - | | | | (16,875 | ) |
| | | | | | | | | | | | | | | | | | | | | | | | | |
| Foreign currency exchange rate | | | | | | | | | | | | | | | | | | | | | | | | |
| Futures | | | - | | | | - | | | | - | | | | - | | | | - | | | | - | |
| Forwards | | | 51,458,935 | | | | - | | | | (56,468,659 | ) | | | - | | | | 1,385,221 | | | | (1,474,097 | ) |
| | | | 51,458,935 | | | | - | | | | (56,468,659 | ) | | | - | | | | 1,385,221 | | | | (1,474,097 | ) |
| | | | | | | | | | | | | | | | | | | | | | | | | |
| Interest rate | | | | | | | | | | | | | | | | | | | | | | | | |
| Futures | | | - | | | | - | | | | - | | | | - | | | | - | | | | - | |
| | | | - | | | | - | | | | - | | | | - | | | | - | | | | - | |
| Total | | $ | 65,555,185 | | | | 225 | | | $ | (56,468,659 | ) | | | - | | | $ | 1,385,221 | | | $ | (1,490,972 | ) |
| | | | | | | | | | | | | | |
| Collateral balances supporting all derivative positions | | | | | | | | | | | $ | 204,953 | |
Graham Alternative Investment Trading LLC
Notes to Financial Statements (continued)
3. | 3. | Investments in Master Funds (continued) |
The following table summarizes the results of operations of each Master Fund for the year ended December 31, 2010:2011:
| | | Graham Commodity Strategies LLC (Delaware) | | | Graham Discretionary Energy Trading III LLC (Delaware) | | | Graham Fed Policy Ltd. (BVI) | | | Graham Global Monetary Policy LLC (Delaware) | | | Graham GMP Securities LLC (Delaware) | | | Grahwam K4D Trading Ltd. (BVI) | | | Graham Macro Directional LLC (Delaware) | | | Graham Short Term Global Macro LLC (Delaware) | | | Graham Commodity Strategies LLC (Delaware) | | | Graham Discretionary Energy Trading III LLC (1) (Delaware) | | | Graham Energy Focus LLC (Delaware) | | | Graham Fed Policy Ltd. (BVI) | | | Graham Global Monetary Policy LLC (Delaware) | | | Graham K4D Trading Ltd. (BVI) | | | Graham Macro Directional LLC (Delaware) | | | Graham Short Term Global Macro LLC (2) (Delaware) | |
| | | | | | | | | | | | | | | | | | | | | | | | | | | | | | | | | | | | | | | | | | | | | | | | | |
| Net investment income (loss) | | $ | (13,379 | ) | | $ | (132,094 | ) | | $ | (7,256 | ) | | $ | (100,185 | ) | | $ | (261,261 | ) | | $ | (204,857 | ) | | $ | (37,542 | ) | | $ | 1,306 | | |
| Net investment loss | | | $ | (19,290 | ) | | $ | (60,323 | ) | | $ | (19,555 | ) | | $ | (3,341 | ) | | $ | (440,668 | ) | | $ | (598,015 | ) | | $ | (33,854 | ) | | $ | 1,186 | |
| | | | | | | | | | | | | | | | | | | | | | | | | | | | | | | | | | | | | | | | | | | | | | | | | | | | | | | | | | | | | | | | |
| Net realized gain (loss) on investments | | | (18,227,676 | ) | | | (6,005,356 | ) | | | 27,207,221 | | | | 89,031,057 | | | | (6,748,828 | ) | | | 108,949,892 | | | | 13,458,813 | | | | (19,160,676 | ) | | | 101,152,045 | | | | (11,935,802 | ) | | | 13,912,634 | | | | 41,782,108 | | | | 11,480,259 | | | | (422,430,555 | ) | | | 45,060,590 | | | | 3,960,455 | |
| Net increase (decrease) in appreciation on investments | | | 36,484,541 | | | | 17,055,434 | | | | 11,810,565 | | | | (4,184,318 | ) | | | 3,763,707 | | | | 25,962,402 | | | | 17,057 | | | | 1,802,261 | | |
| Net increase (decrease) in unrealized | | | | | | | | | | | | | | | | | | | | | | | | | | | | | | | | | |
| appreciation on investments | | | | (47,806,437 | ) | | | (16,614,275 | ) | | | (6,771,856 | ) | | | (8,009,721 | ) | | | 3,752,016 | | | | (18,855,089 | ) | | | (1,555,122 | ) | | | (1,898,136 | ) |
| Brokerage commissions and fees | | | (5,184,323 | ) | | | (1,614,557 | ) | | | (3,498,560 | ) | | | (2,236,771 | ) | | | (2,779 | ) | | | (6,939,638 | ) | | | (951,242 | ) | | | (402,548 | ) | | | (8,898,603 | ) | | | (2,215,911 | ) | | | (1,327,724 | ) | | | (2,064,973 | ) | | | (3,894,968 | ) | | | (13,215,302 | ) | | | (1,446,409 | ) | | | (548,562 | ) |
| Net gain (loss) on investments | | | 13,072,542 | | | | 9,435,521 | | | | 35,519,226 | | | | 82,609,968 | | | | (2,987,900 | ) | | | 127,972,656 | | | | 12,524,628 | | | | (17,760,963 | ) | | | 44,447,005 | | | | (30,765,988 | ) | | | 5,813,054 | | | | 31,707,414 | | | | 11,337,307 | | | | (454,500,946 | ) | | | 42,059,059 | | | | 1,513,757 | |
| Net income (loss) | | $ | 13,059,163 | | | $ | 9,303,427 | | | $ | 35,511,970 | | | $ | 82,509,783 | | | $ | (3,249,161 | ) | | $ | 127,767,799 | | | $ | 12,487,086 | | | $ | (17,759,657 | ) | | $ | 44,427,715 | | | $ | (30,826,311 | ) | | $ | 5,793,499 | | | $ | 31,704,073 | | | $ | 10,896,639 | | | $ | (455,098,961 | ) | | $ | 42,025,205 | | | $ | 1,514,943 | |
| (1) | For the period from January 1, 2011 to October 31, 2011 |
| (2) | For the period from January 1, 2011 to February 28, 2011 |
Graham Alternative Investment Trading LLC
Notes to Financial Statements (continued)
3. | 3. | Investments in Master Funds (continued) |
The following table shows the gains and losses on all financial instruments held by the Master Funds reported in net gain (loss) on investments in their statements of operations segregated by primary underlying risk and contract type for the year ended December 31, 2010:2011:
| | | Graham Commodity Strategies LLC | | | Graham Discretionary Energy Trading III LLC | | | Graham Energy Focus LLC | | | Graham Fed Policy Ltd. | | | Graham Global Monetary Policy LLC | | | Graham K4D Trading Ltd. | | | Graham Macro Directional LLC | | | Graham Short Term Global Macro LLC | |
| Commodity price | | | | | | | | | | | | | | | | | | | | | | | | |
| Futures | | $ | 45,722,101 | | | $ | (9,820,087 | ) | | $ | 47,267,957 | | | $ | - | | | $ | 23,983,012 | | | $ | (85,253,000 | ) | | $ | 1,152,146 | | | $ | 3,852,769 | |
| Options | | | - | | | | (19,066,205 | ) | | | 14,532,585 | | | | - | | | | (87,120 | ) | | | - | | | | - | | | | (223,490 | ) |
| Swaps | | | 7,276,761 | | | | 336,215 | | | | (54,527,139 | ) | | | - | | | | - | | | | (15,123,659 | ) | | | - | | | | - | |
| | | | 52,998,862 | | | | (28,550,077 | ) | | | 7,273,403 | | | | - | | | | 23,895,892 | | | | (100,376,659 | ) | | | 1,152,146 | | | | 3,629,279 | |
| Equity price | | | | | | | | | | | | | | | | | | | | | | | | | | | | | | | | |
| Equities | | | - | | | | - | | | | - | | | | - | | | | - | | | | (7,000 | ) | | | - | | | | - | |
| Futures | | | (111,971 | ) | | | - | | | | (132,625 | ) | | | - | | | | 7,102,008 | | | | (232,290,243 | ) | | | 2,890,718 | | | | 1,134,945 | |
| Options | | | - | | | | - | | | | - | | | | - | | | | (4,083,863 | ) | | | - | | | | - | | | | (427,187 | ) |
| | | | (111,971 | ) | | | - | | | | (132,625 | ) | | | - | | | | 3,018,145 | | | | (232,297,243 | ) | | | 2,890,718 | | | | 707,758 | |
| Foreign currency | | | | | | | | | | | | | | | | | | | | | | | | | | | | | | | | |
| exchange rate | | | | | | | | | | | | | | | | | | | | | | | | | | | | | | | | |
| Futures | | | 459,943 | | | | - | | | | - | | | | - | | | | - | | | | (20,151,534 | ) | | | - | | | | - | |
| Forwards | | | - | | | | - | | | | - | | | | - | | | | 21,980,582 | | | | (189,137,435 | ) | | | 3,796,665 | | | | 5,706,028 | |
| Options | | | - | | | | - | | | | - | | | | - | | | | (28,421,930 | ) | | | - | | | | - | | | | (7,400,670 | ) |
| | | | 459,943 | | | | - | | | | - | | | | - | | | | (6,441,348 | ) | | | (209,288,969 | ) | | | 3,796,665 | | | | (1,694,642 | ) |
| Interest rate | | | | | | | | | | | | | | | | | | | | | | | | | | | | | | | | |
| Futures | | | (1,226 | ) | | | - | | | | - | | | | 48,059,659 | | | | (4,532,601 | ) | | | 100,677,227 | | | | 34,798,013 | | | | (580,076 | ) |
| Options | | | - | | | | - | | | | - | | | | (14,287,272 | ) | | | (707,813 | ) | | | - | | | | 867,926 | | | | - | |
| | | | (1,226 | ) | | | - | | | | - | | | | 33,772,387 | | | | (5,240,414 | ) | | | 100,677,227 | | | | 35,665,939 | | | | (580,076 | ) |
| Total | | $ | 53,345,608 | | | $ | (28,550,077 | ) | | $ | 7,140,778 | | | $ | 33,772,387 | | | $ | 15,232,275 | | | $ | (441,285,644 | ) | | $ | 43,505,468 | | | $ | 2,062,319 | |
| | | Graham Commodity Strategies LLC | | | Graham Discretionary Energy Trading III LLC | | | Graham Fed Policy Ltd. | | | Graham Global Monetary Policy LLC | | | Graham GMP Securities LLC | | | Graham K4D Trading Ltd. | | | Graham Macro Directional LLC | | | Graham Short Term Global Macro LLC | |
| Commodity price | | | | | | | | | | | | | | | | | | | | | | | | |
| Futures | | $ | 18,256,865 | | | $ | 14,747,463 | | | $ | - | | | $ | 11,750,476 | | | $ | - | | | $ | 10,473,704 | | | $ | 301,920 | | | $ | (1,144,561 | ) |
| Options | | | - | | | | (3,416,940 | ) | | | - | | | | - | | | | - | | | | - | | | | - | | | | - | |
| Swaps | | | - | | | | (280,445 | ) | | | - | | | | - | | | | - | | | | - | | | | - | | | | - | |
| | | | 18,256,865 | | | | 11,050,078 | | | | - | | | | 11,750,476 | | | | - | | | | 10,473,704 | | | | 301,920 | | | | (1,144,561 | ) |
| Equity price | | | | | | | | | | | | | | | | | | | | | | | | | | | | | | | | |
| Futures | | | - | | | | - | | | | - | | | | 2,068,744 | | | | - | | | | (33,752,013 | ) | | | (1,845,800 | ) | | | 214,815 | |
| | | | - | | | | - | | | | - | | | | 2,068,744 | | | | - | | | | (33,752,013 | ) | | | (1,845,800 | ) | | | 214,815 | |
| Foreign currency exchange rate | | | | | | | | | | | | | | | | | | | | | | | | | | | | | | | | |
| Futures | | | - | | | | - | | | | - | | | | - | | | | - | | | | 15,009,579 | | | | - | | | | - | |
| Forwards | | | - | | | | - | | | | - | | | | 71,946,197 | | | | 141,986 | | | | 34,676,693 | | | | 13,193,889 | | | | 698,858 | |
| Options | | | - | | | | - | | | | - | | | | (25,480,776 | ) | | | - | | | | - | | | | - | | | | (17,653,484 | ) |
| | | | - | | | | - | | | | - | | | | 46,465,421 | | | | 141,986 | | | | 49,686,272 | | | | 13,193,889 | | | | (16,954,626 | ) |
| Interest rate | | | | | | | | | | | | | | | | | | | | | | | | | | | | | | | | |
| Bonds | | | - | | | | - | | | | - | | | | - | | | | 1,702,990 | | | | - | | | | - | | | | - | |
| Futures | | | - | | | | - | | | | 72,752,132 | | | | 27,109,698 | | | | - | | | | 108,504,331 | | | | 1,825,861 | | | | 525,957 | |
| Interest rate swaps | | | - | | | | - | | | | - | | | | (403,000 | ) | | | (4,830,097 | ) | | | - | | | | - | | | | - | |
| Options | | | - | | | | - | | | | (33,734,346 | ) | | | (2,144,600 | ) | | | - | | | | - | | | | - | | | | - | |
| | | | - | | | | - | | | | 39,017,786 | | | | 24,562,098 | | | | (3,127,107 | ) | | | 108,504,331 | | | | 1,825,861 | | | | 525,957 | |
| Total | | $ | 18,256,865 | | | $ | 11,050,078 | | | $ | 39,017,786 | | | $ | 84,846,739 | | | $ | (2,985,121 | ) | | $ | 134,912,294 | | | $ | 13,475,870 | | | $ | (17,358,415 | ) |
Graham Alternative Investment Trading LLC
Notes to Financial Statements (continued)
4.
GAIT invests a portion of its excess liquidity in GCA,Cash Assets, an entity for which the Manager is also the sole investment advisor. GCACash Assets commenced operations on June 22, 2005, and was formed as a Delaware Limited Liability Company for the purpose of consolidating investment activity of multiple funds managed by the Manager. Its objective is to preserve capital while enhancing return on cash balances and providing daily liquidity. It invests in debt obligations guaranteed by the U.S. federal government which range in maturity from one to twenty-four months. GCACash Assets also maintains cash and cash equivalents on deposit with major U.S. institutions. GCACash Assets values all fixed income securities at amortized cost to the extent itwhich approximates fair value. GAIT’s investment in GCACash Assets is valued in the accompanying statements of financial condition at fair value in accordance with U.S. GAAP based upon GAIT’s proportionate share of GCA’sCash Assets’ reported net asset value. GAIT records its proportionate share of GCA’sCash Assets’ investment income and expenses on a monthly basis. For the year ended December 31, 2012, the total amount recognized by GAIT with respect to its investment in Cash Assets was $747,456. For the year ended December 31, 2011, the total amount recognized by GAIT with respect to its investment in GCACash Assets was $1,782,810. For the year ended December 31, 2010, the total amount recognized by GAIT with respect to its investment in GCA was $1,901,499. These amounts are included in interest income in the statements of operations and managing member allocation. At December 31, 20112012 and 2010,2011, GAIT owned approximately 11.59%6.02% and 13.77%11.59%, respectively, of GCA.Cash Assets. The following table summarizes the financial position of GCACash Assets as of December 31, 20112012 and 20102011 and for the years then ended:
| | | | | | December 31, | |
| | | December 31, 2011 | | | December 31, 2010 | | | 2012 | | | 2011 | |
| Assets: | | | | | | | | | | | | |
| Cash and cash equivalents | | $ | 556,557,151 | | | $ | 750,098,151 | | | $ | 968,228,634 | | | $ | 556,557,151 | |
| Investments in fixed income securities (cost $2,412,672,700 and $2,215,622,512 respectively) | | | 2,412,672,700 | | | | 2,215,622,512 | | |
| Accrued interest income | | | 4,670,722 | | | | 6,547,074 | | |
| Investments in fixed income securities (cost $3,041,387,608 and | | | | | | | | | |
| $2,412,672,700, respectively) | | | | 3,041,387,608 | | | | 2,412,672,700 | |
| Accrued interest receivable | | | | 5,989,305 | | | | 4,670,722 | |
| Total assets | | | 2,973,900,573 | | | | 2,972,267,737 | | | | 4,015,605,547 | | | | 2,973,900,573 | |
| | | | | | | | | | | | | | | | | |
| Liabilities: | | | | | | | | | | | | | | | | |
| Other liabilities | | | 29,450 | | | | 20,000 | | | | 9,300 | | | | 29,450 | |
| Total liabilities | | | 29,450 | | | | 20,000 | | | | 9,300 | | | | 29,450 | |
| Net assets | | $ | 2,973,871,123 | | | $ | 2,972,247,737 | | | $ | 4,015,596,247 | | | $ | 2,973,871,123 | |
The following table summarizes the results of operations of GCACash Assets for the years ended December 31, 20112012 and 2010:2011:
| | | 2011 | | | 2010 | | | 2012 | | | 2011 | |
| Investment income | | | | | | | | | | | | |
| Interest income | | $ | 13,827,518 | | | $ | 13,099,691 | | | $ | 10,006,047 | | | $ | 13,827,518 | |
| Total investment income | | | 13,827,518 | | | | 13,099,691 | | | | 10,006,047 | | | | 13,827,518 | |
| | | | | | | | | | | | | | | | | |
| Expenses: | | | | | | | | | | | | | | | | |
| Bank fee expense | | | 317,178 | | | | 230,380 | | | | 143,499 | | | | 317,178 | |
| Total expenses | | | 317,178 | | | | 230,380 | | | | 143,499 | | | | 317,178 | |
| Net investment income | | | 13,510,340 | | | | 12,869,311 | | | | 9,862,548 | | | | 13,510,340 | |
| Net income | | $ | 13,510,340 | | | $ | 12,869,311 | | | $ | 9,862,548 | | | $ | 13,510,340 | |
Graham Alternative Investment Trading LLC
Notes to Financial Statements (continued)
4. | 4. | Graham Cash Assets LLC (continued) |
The following represents the condensed schedule of investments of GCACash Assets as of December 31, 2011:2012:
| Description | | Principal Amount | | | Fair Value | | | Percentage of Members’ Capital | |
| Investments in Fixed Income Securities (cost $2,412,672,700) | | | | | | | | | |
| United States | | | | | | | | | |
| FDIC Guaranteed Bonds (cost $623,918,691) | | | | | | | | | |
| Citigroup Funding 1.88% – 2.25% due 04/30/12 –12/10/12 | | $ | 374,364,000 | | | $ | 378,090,518 | | | | 12.71 | % |
| Other FDIC guaranteed bonds | | | | | | | 245,828,173 | | | | 8.27 | % |
| Total FDIC Guaranteed Bonds | | | | | | | 623,918,691 | | | | 20.98 | % |
| | | | | | | | | | | | | |
| Government Bonds (cost $1,788,754,009) | | | | | | | | | | | | |
| U.S. Treasury 0.13% – 1.38% due 01/31/12 – 11/15/13 | | | 1,785,000,000 | | | | 1,788,754,009 | | | | 60.15 | % |
| Total Government Bonds | | | | | | | 1,788,754,009 | | | | 60.15 | % |
| | | | | | | | | | | | | |
| Total Investments in Fixed Income Securities | | | | | | $ | 2,412,672,700 | | | | 81.13 | % |
| Description | | Principal Amount | | | Fair Value | | | Percentage of Members’ Capital | |
| Investments in Fixed Income Securities | | | | | | | | | |
| (cost $3,041,387,608) | | | | | | | | | |
| United States | | | | | | | | | |
| Government Bonds (cost $3,041,387,608) | | | | | | | | | |
| U.S. Treasury 0.13% - 2.63% due 01/15/13 – 12/31/14 | | $ | 3,025,000,000 | | | $ | 3,041,387,608 | | | | 75.74 | % |
| Total Government Bonds | | | | | | | 3,041,387,608 | | | | 75.74 | % |
| | | | | | | | | | | | | |
| Total Investments in Fixed Income Securities | | | | | | $ | 3,041,387,608 | | | | 75.74 | % |
The following represents the condensed schedule of investments for GCAof Cash Assets as of December 31, 2010.2011:
| Description | | Principal Amount | | | Fair Value | | | Percentage of Members’ Capital | | | Principal Amount | | | Fair Value | | | Percentage of Members’ Capital | |
| Investments in Fixed Income Securities (cost $2,215,622,512) | | | | | | | | | | |
| Investments in Fixed Income Securities | | | | | | | | | | |
| (cost $2,412,672,700) | | | | | | | | | | |
| United States | | | | | | | | | | | | | | | | | | |
| FDIC Guaranteed Bonds (cost $1,101,463,404) | | | | | | | | | | |
| Citibank 1.25% – 1.88% due 03/30/11 – 05/07/12 | | $ | 350,000,000 | | | $ | 351,915,163 | | | | 11.84 | % | |
| FDIC Guaranteed Bonds (cost $623,918,691) | | | | | | | | | | |
| Citigroup Funding 1.88% – 2.25% due 04/30/12 –12/10/12 | | | $ | 374,364,000 | | | $ | 378,090,518 | | | | 12.71 | % |
| Other FDIC guaranteed bonds | | | | | | | 749,548,241 | | | | 25.22 | % | | | | | | | 245,828,173 | | | | 8.27 | % |
| Total FDIC Guaranteed Bonds | | | | | | | 1,101,463,404 | | | | 37.06 | % | | | | | | | 623,918,691 | | | | 20.98 | % |
| | | | | | | | | | | | | | | | | | | | | | | | | |
| Government Bonds (cost $1,114,159,108) | | | | | | | | | | | | | |
| U.S. Treasury 0.88% due 04/30/11 | | | 150,000,000 | | | | 150,213,724 | | | | 5.05 | % | |
| Other U.S. Treasury 0.75% – 1.13% due 01/31/11 – 04/30/12 | | | | | | | 963,945,384 | | | | 32.43 | % | |
| Government Bonds (cost $1,788,754,009) | | | | | | | | | | | | | |
| U.S. Treasury 0.13% – 1.38% due 01/31/12 – 11/15/13 | | | | 1,785,000,000 | | | | 1,788,754,009 | | | | 60.15 | % |
| Total Government Bonds | | | | | | | 1,114,159,108 | | | | 37.48 | % | | | | | | | 1,788,754,009 | | | | 60.15 | % |
| | | | | | | | | | | | | | | | | | | | | | | | | |
| Total Investments in Fixed Income Securities | | | | | | $ | 2,215,622,512 | | | | 74.54 | % | | | | | | $ | 2,412,672,700 | | | | 81.13 | % |
Graham Alternative Investment Trading LLC
Notes to Financial Statements (continued)
| 4. | Graham Cash Assets LLC (continued) |
4. Graham Cash Assets LLC (continued)
GCA reports the fair value of its investment related assets and liabilities in accordance with the hierarchy established under U.S. GAAP. The following table shows the fair value classification of each investment type held by GCACash Assets as of December 31, 20112012 and 2010:2011:
| | | December 31, | | | December 31, | |
| | | 2011 | | | 2010 | | | 2012 | | | 2011 | |
| Assets | | | | | | | | | | | | |
| Level 2: | | | | | | | | | | | | |
| Fixed income securities | | | | | | | | | | | | |
| FDIC Guaranteed Bonds | | $ | 623,918,691 | | | $ | 1,101,463,404 | | | $ | – | | | $ | 623,918,691 | |
| Government Bonds | | | 1,788,754,009 | | | | 1,114,159,108 | | | | 3,041,387,608 | | | | 1,788,754,009 | |
| Total fixed income securities | | | 2,412,672,700 | | | | 2,215,622,512 | | | | 3,041,387,608 | | | | 2,412,672,700 | |
| Total Level 2 | | | 2,412,672,700 | | | | 2,215,622,512 | | | | 3,041,387,608 | | | | 2,412,672,700 | |
| Total assets | | $ | 2,412,672,700 | | | $ | 2,215,622,512 | | | $ | 3,041,387,608 | | | $ | 2,412,672,700 | |
GAIT offers Class 0 Units and Class 2 Units (collectively, the “Units”). GAIT may issue additional classes in the future subject to different fees, expenses or other terms, or to invest in other investment programs or combinations of investment programs managed by the Manager. GAIT also has Management Units (“Class M units”) which are solely for the investment of the Manager.
A separate Capital Account is maintained for each member with respect to each Class of Units held by such member. The initial balance of each member’s Capital Account is equal to the initial contribution to GAIT with respect to the Class to which such Capital Account relates. Each member’s Capital Account is increased by any additional subscription, and decreased by any redemption by such member of Units of such Class to which the Capital Account relates. All income and expenses of GAIT are allocated among the Capital Accounts of the members in proportion to the balance that each Capital Account bears to the balance of all Capital Accounts as of the beginning of such fiscal period.
Subscriptions
Units may be purchased at a price equal to the Net Asset Value per Unit of the relevant Class as of the immediately preceding Valuation Day, as defined in the LLC Agreement. There is no minimum subscription amount.
Units are available for subscription as of the first business day of each month upon written notice of at least three business days prior to the last business day of the preceding month.
Redemptions
Units are not subject to any minimum holding period. Members may redeem Units at the Net Asset Value thereof as of the last business day of each month upon not less than three business days’ prior written notice to the administrator.
Graham Alternative Investment Trading LLC
Notes to Financial Statements (continued)
6. | 6. | Fees and Related Party Transactions |
Advisory Fees
Each Class of GAIT other than Class M pays the Manager an advisory fee (the “Advisory Fee”) at an aggregate annual rate equal to 2% of the Net Asset Value of such Class. The Advisory Fee is payable monthly in arrears calculated as of the last business day of each month and any other date the Manager may permit, in its sole and absolute discretion, as of which any subscription or redemption is effected with respect to Units of such Class during the month.
Sponsor Fees
Each Class of GAIT other than Class M pays the Manager a sponsor fee (the “Sponsor Fee”) at an annual rate of 1% of its Net Asset Value, payable monthly in arrears, determined in the same manner as the Advisory Fee.
Incentive Allocation
At the end of each calendar quarter, the Manager will receive a special allocation of net profits (the “Incentive Allocation”) in an amount equal to 20% of the New High Net Trading Profits of each Class as defined in the LLC Agreement. The Incentive Allocation is also accrued and allocable on the date of redemption with respect to any Units that are redeemed prior to the end of a calendar quarter. Additionally, any loss carryforward attributable to any class of GAIT shall be proportionately reduced effective as of the date of any redemption of any Units of such class by multiplying the loss carryforward by the ratio that the amount of assets redeemed from such class bears to the net assets of such class immediately prior to such redemption. The loss carryforward of a class must be recouped before any subsequent Incentive Allocation can be made to the Manager.
Brokerage Fees
Each Class of GAIT other than Class M pays the Manager a brokerage fee (the “Brokerage Fee”) at the annual rate specified in the table below. This Brokerage Fee is payable monthly in arrears calculated as of the last business day of each month in the same manner as the Advisory Fee.
| Class | | Annual Rate | |
| | | |
| Class 0 | | | 2% | |
| Class 2 | | | 4% | |
In consideration of the Brokerage Fee, the Manager bears all of GAIT’s trading commissions (including exchange, clearing and regulatory fees relating to its trades), routine legal expenses, internal and external accounting, audit and tax preparation expenses, fees and expenses of an external or internal administrator, and expenses and costs of printing and mailing reports and notices, together with the costs incurred in connection with the organization of GAIT and the continuous offering of Units. To the extent GAIT is allocated any of these expenses from the Master Funds in which it invests, the Manager will reimburse GAIT for those amounts. These reimbursements are included in commission reimbursements in the statements of operations and managing member allocation.
Any portion of any of the above fees, including the Incentive Allocation, may be paid by the Manager to third parties as compensation for selling activities in connection with GAIT.
Graham Alternative Investment Trading LLC
Notes to Financial Statements (continued)
No provision for income taxes has been made in the accompanying financial statements, as members are individually responsible for reporting income or loss based upon their respective share of GAIT’s revenues and expenses for income tax purposes.
U.S. GAAP provides guidance for how uncertain tax positions should be recognized, measured, presented and disclosed in the financial statements. U.S. GAAP requires the evaluation of tax positions taken or expected to be taken in the course of preparing GAIT’s tax returns to determine whether the tax positions are “more-likely-than-not” of being sustained by the applicable tax authority. Tax positions not deemed to meet a more-likely-than-not threshold would be recorded as a tax expense in the current year. The Manager has evaluated GAIT’s tax positions and has concluded that there are no significant tax positions requiring recognition, measurement or disclosure in the financial statements. The Manager is not aware of any tax positions for which it is reasonably possible that the total amounts of unrecognized tax expense will change materially in the next twelve months. Tax years which are considered open by the relevant jurisdiction are subject to potential examination.
The following is the per unit operating performance calculation for the years ended December 31, 20112012 and 2010:2011:
| | | Class 0 | | | Class 2 | | | Class 0 | | | Class 2 | |
| Per unit operating performance: | | | | | | | |
| Net asset value per unit, December 31, 2009 | | $ | 135.56 | | | $ | 112.73 | | |
| Net income: | | | | | | | | | |
| Net investment loss | | | (6.92 | ) | | | (6.34 | ) | |
| Net gain on investments | | | 10.32 | | | | 7.29 | | |
| Net income | | | 3.40 | | | | 0.95 | | |
| Per unit operating performance | | | | | | | |
| Net asset value per unit, December 31, 2010 | | $ | 138.96 | | | $ | 113.68 | | | $ | 138.96 | | | $ | 113.68 | |
| Net loss: | | | | | | | | | | | | | | | | |
| Net investment loss | | | (5.53 | ) | | | (6.66 | ) | | | (5.53 | ) | | | (6.66 | ) |
| Net loss on investments | | | (10.26 | ) | | | (8.25 | ) | | | (10.26 | ) | | | (8.25 | ) |
| Net loss | | | (15.79 | ) | | | (14.91 | ) | | | (15.79 | ) | | | (14.91 | ) |
| Net asset value per unit, December 31, 2011 | | $ | 123.17 | | | $ | 98.77 | | | $ | 123.17 | | | $ | 98.77 | |
| Net loss: | | | | | | | | | |
| Net investment loss | | | | (4.88 | ) | | | (5.84 | ) |
| Net loss on investments | | | | (3.41 | ) | | | (2.64 | ) |
| Net loss | | | | (8.29 | ) | | | (8.48 | ) |
| Net asset value per unit, December 31, 2012 | | | $ | 114.88 | | | $ | 90.29 | |
Graham Alternative Investment Trading LLC
Notes to Financial Statements (continued)
8. | 8. | Financial Highlights (continued) |
The following represents ratios to average members’ capital, excluding the Managing Member, and total return for the years ended December 31, 20112012 and 2010:2011:
| | | Class 0 | | Class 2 | | Class 0 | | | Class 2 | |
| | | 2011 | | 2010 | | 2011 | | 2010 | | 2012 | | | 2011 | | | 2012 | | | 2011 | |
| | | | | | | | | | | | | | | | | | | | | | | | | |
| Total return before Incentive Allocation | | | (11.35 | )% | | | 3.27 | % | | | (13.11 | )% | | | 1.17 | % | | | (6.73 | )% | | | (11.35 | )% | | | (8.59 | )% | | | (13.11 | )% |
| Incentive Allocation | | | (0.01 | ) | | | (0.76 | ) | | | (0.01 | ) | | | (0.32 | ) | | | 0.00 | | | | (0.01 | ) | | | 0.00 | | | | (0.01 | ) |
| Total return after Incentive Allocation | | | (11.36 | )% | | | 2.51 | % | | | (13.12 | )% | | | 0.85 | % | | | (6.73 | )% | | | (11.36 | )% | | | (8.59 | )% | | | (13.12 | )% |
| | | | | | | | | | | | | | | | | | | | | | | | | | | | | | | | | |
| Net investment loss before Incentive Allocation | | | (3.97 | )% | | | (4.45 | )% | | | (5.85 | )% | | | (6.50 | )% | | | (3.96 | )% | | | (3.97 | )% | | | (5.91 | )% | | | (5.85 | )% |
| Incentive Allocation | | | (0.01 | ) | | | (0.76 | ) | | | (0.01 | ) | | | (0.32 | ) | | | 0.00 | | | | (0.01 | ) | | | 0.00 | | | | (0.01 | ) |
| Net investment loss after Incentive Allocation | | | (3.98 | )% | | | (5.21 | )% | | | (5.86 | )% | | | (6.82 | )% | | | (3.96 | )% | | | (3.98 | )% | | | (5.91 | )% | | | (5.86 | )% |
| | | | | | | | | | | | | | | | | | | | | | | | | | | | | | | | | |
| Total expenses before Incentive Allocation | | | 5.15 | % | | | 5.14 | % | | | 7.16 | % | | | 7.19 | % | | | 5.13 | % | | | 5.15 | % | | | 7.18 | % | | | 7.16 | % |
| Incentive Allocation | | | 0.01 | | | | 0.76 | | | | 0.01 | | | | 0.32 | | | | 0.00 | | | | 0.01 | | | | 0.00 | | | | 0.01 | |
| Total expenses after Incentive Allocation | | | 5.16 | %* | | | 5.90 | %* | | | 7.17 | %* | | | 7.51 | %* | | | 5.13 | %* | | | 5.16 | %* | | | 7.18 | %* | | | 7.17 | %* |
* | The percentages noted above represent total expenses before commission reimbursements, which represent 1.04% and 0.71% of average members' capital for the years then ended. |
*- The percentages above represent total gross expenses before commission reimbursements (see Note 6), which represent 0.90% of average members’ capital for 2012 and 1.04% of average members’ capital for 2011.
Total return is calculated for Class 0 and Class 2 units taken as a whole. Total return is calculated as the change in total members’ capital, excluding that of the Managing Member, adjusted for subscriptions or redemptions during the period.year. An individual member’s return may vary from these returns based on the timing of capital transactions and the applicability of Advisory Fees, Brokerage Fees, Sponsor Fees and the Incentive Allocation. The net investment loss and total expense ratios (including Incentive Allocation) are calculated for the Class 0 and Class 2 units taken as a whole and include amounts from GAIT and net investment loss from GAIT and amountsexpenses allocated from Master Funds and GCA.investment income from Cash Assets. The computation of such ratios is based on the amount of net investment loss, total expenses and Incentive Allocation. Net investment loss and total expense ratios are computed based upon the weighted average of members’ capital of GAIT, excluding that of the Managing Member, for the years ended December 31, 20112012 and 2010.2011.
As of January 1, 2013 GAIT reduced the Brokerage Fee in Class 0 and Class 2 to 0% and 2%, respectively. As a result of this change, GAIT will bear all future costs previously covered by the Brokerage Fee (See Note 6).
GAIT had subscriptions of approximately $5.2$3.8 million and redemptions of approximately $15.6$28.4 million from January 1, 2013 through March 30, 2011,28, 2013, the date through which subsequent events were evaluated by management. These amounts have not been included in the financial statements.
Manager submitted the Uniform Application for Investment Advisor Registration (Form-ADV) with the Securities
Graham Capital Management, L.P.
40 Highland Avenue
Rowayton, CT 06853
U.S.A.
Administrator
SEI Global Services Inc.
1 Freedom Valley Drive
Oaks, PA 19456
U.S.A.
Legal and Exchange Commission, seeking registration no earlier than March 30, 2012.Tax Advisors
Proskauer Rose LLP
11 Times Square
New York, NY 10036
U.S.A.
Registered Address
Corporation Service Company
2711 Centerville Road
Suite 400
Wilmington, DE 19808
U.S.A.
Independent Registered Public Accounting Firm
Ernst & Young LLP
300 First Stamford Place
Stamford, CT 06902
U.S.A.
| | Financial Statements |
| | |
| Graham Alternative Investment Trading II LLC |
| For the years ended December 31, 20112012 and 20102011 |
| with Report of Registered Public Accounting Firm |
Report of Independent Registered Public Accounting Firm
To the Managing MemberManager of
Graham Alternative Investment Trading II LLC
We have audited the accompanying statements of financial condition of Graham Alternative Investment Trading II LLC (the “Fund”), as of December 31, 20112012 and 2010,2011, and the related statements of operations and managing member allocation, changes in members’ capital and cash flows for each of the two years in the period ended December 31, 2011.2012. These financial statements are the responsibility of the Fund’s management. Our responsibility is to express an opinion on these financial statements based on our audits.
We conducted our audits in accordance with the standards of the Public Company Accounting Oversight Board (United States). Those standards require that we plan and perform the audit to obtain reasonable assurance about whether the financial statements are free of material misstatement. We were not engaged to perform an audit of the Fund's internal control over financial reporting. Our audits included consideration of internal control over financial reporting as a basis for designing audit procedures that are appropriate in the circumstances, but not for the purpose of expressing an opinion on the effectiveness of the Fund's internal control over financial reporting. Accordingly, we express no such opinion. An audit also includes examining, on a test basis, evidence supporting the amounts and disclosures in the financial statements, assessing the accounting principles used and significant estimates made by management, and evaluating the overall financial statement presentation. We believe that our audits provide a reasonable basis for our opinion.
In our opinion, the financial statements referred to above present fairly, in all material respects, the financial position of Graham Alternative Investment Trading II LLC at December 31, 20112012 and 2010,2011, and the results of its operations, changes in its members’ capital and its cash flows for each of the two years in the period ended December 31, 2011,2012, in conformity with U.S. generally accepted accounting principles.
March 30, 2012
| /s/ Ernst & Young LLP |
| Stamford, CT |
|
| March 28, 2013 |
Graham Alternative Investment Trading II LLC
Statements of Financial Condition
| | | December 31, | | | December 31, | |
| Assets | | 2011 | | | 2010 | | | 2012 | | | 2011 | |
| Investment in Graham K4D Trading Ltd., at fair value | | $ | 13,021,233 | | | $ | 7,411,468 | | | $ | 6,984,957 | | | $ | 13,021,233 | |
| Investment in Graham Cash Assets LLC, at fair value | | | 59,403,888 | | | | 64,089,936 | | | | 34,050,873 | | | | 59,403,888 | |
| Accrued commission reimbursements | | | 29,549 | | | | 28,795 | | | | 8,466 | | | | 29,549 | |
| Receivable from Graham K4D Trading Ltd. | | | 532 | | | | - | | | | 1,764 | | | | 532 | |
| Total assets | | $ | 72,455,202 | | | $ | 71,530,199 | | | $ | 41,046,060 | | | $ | 72,455,202 | |
| | | | | | | | | | | | | | | | | |
| Liabilities and members’ capital | | | | | | | | | | | | | | | | |
| Liabilities: | | | | | | | | | | | | | | | | |
| Accrued redemptions | | $ | 2,739,451 | | | $ | 1,393,281 | | | $ | 8,098,182 | | | $ | 2,739,451 | |
| Accrued brokerage fees | | | 183,148 | | | | 170,942 | | | | 106,515 | | | | 183,148 | |
| Accrued advisory fees | | | 122,997 | | | | 121,404 | | | | 69,458 | | | | 122,997 | |
| Accrued sponsor fees | | | 61,499 | | | | 60,702 | | | | 34,729 | | | | 61,499 | |
| Total liabilities | | | 3,107,095 | | | | 1,746,329 | | | | 8,308,884 | | | | 3,107,095 | |
| | | | | | | | | | | | | | | | | |
| Members’ capital: | | | | | | | | | | | | | | | | |
| Class 0 Units (434,835.751 and 397,859.944 units issued and outstanding at $81.35 and $102.92 per unit, respectively) | | | 35,371,951 | | | | 40,945,899 | | |
| Class 2 Units (439,312.861 and 288,630.496 units issued and outstanding at $77.24 and $99.72 per unit, respectively) | | | 33,930,645 | | | | 28,783,191 | | |
| Class M Units (500.000 and 500.000 units issued and outstanding at $91.02 and $109.56 per unit, respectively) | | | 45,511 | | | | 54,780 | | |
| Class 0 Units (182,134.590 and 434,835.751 units issued and outstanding | | | | | | | | | |
| at $73.46 and $81.35 per unit, respectively) | | | | 13,380,170 | | | | 35,371,951 | |
| Class 2 Units (282,516.243 and 439,312.861 units issued and outstanding | | | | | | | | | |
| at $68.36 and $77.24 per unit, respectively) | | | | 19,313,793 | | | | 33,930,645 | |
| Class M Units (500.000 and 500.000 units issued and outstanding | | | | | | | | | |
| at $86.43 and $91.02 per unit, respectively) | | | | 43,213 | | | | 45,511 | |
| Total members’ capital | | | 69,348,107 | | | | 69,783,870 | | | | 32,737,176 | | | | 69,348,107 | |
| Total liabilities and members’ capital | | $ | 72,455,202 | | | $ | 71,530,199 | | | $ | 41,046,060 | | | $ | 72,455,202 | |
See accompanying notes.
Graham Alternative Investment Trading II LLC
Statements of Operations and Managing Member Allocation
| | | Years Ended December 31, | | | Years Ended December 31, | |
| | | 2011 | | | 2010 | | | 2012 | | | 2011 | |
| Net (loss) gain allocated from investment in Graham K4D Trading Ltd.: | | | | | | | |
| Net realized (loss) gain on investments | | $ | (15,762,400 | ) | | $ | 5,056,021 | | |
| Net (decrease) increase in unrealized appreciation on investments | | | (120,577 | ) | | | 924,728 | | |
| Net loss allocated from investment in Graham K4D Trading Ltd.: | | | | | | | |
| Net realized loss on investments | | | $ | (2,891,645 | ) | | $ | (15,762,400 | ) |
| Net increase (decrease) in unrealized appreciation on investments | | | | 636,228 | | | | (120,577 | ) |
| Brokerage commissions and fees | | | (501,049 | ) | | | (252,861 | ) | | | (177,465 | ) | | | (501,049 | ) |
| Net (loss) gain allocated from investment in Graham K4D Trading Ltd. | | | (16,384,026 | ) | | | 5,727,888 | | |
| Net loss allocated from investment in Graham K4D Trading Ltd. | | | | (2,432,882 | ) | | | (16,384,026 | ) |
| | | | | | | | | | | | | | | | | |
| Net investment loss allocated from investment in Graham K4D Trading Ltd. | | | (22,482 | ) | | | (7,377 | ) | | | (10,157 | ) | | | (22,482 | ) |
| | | | | | | | | | | | | | | | | |
| Investment income: | | | | | | | | | | | | | | | | |
| Interest income | | | 313,447 | | | | 275,694 | | | | 122,626 | | | | 313,447 | |
| | | | | | | | | | | | | | | | | |
| Expenses: | | | | | | | | | | | | | | | | |
| Brokerage fees | | | 2,409,288 | | | | 1,510,595 | | | | 1,747,782 | | | | 2,409,288 | |
| Advisory fees | | | 1,673,711 | | | | 1,086,976 | | | | 1,173,825 | | | | 1,673,711 | |
| Sponsor fees | | | 836,856 | | | | 543,488 | | | | 586,913 | | | | 836,856 | |
| Interest and other | | | 17,726 | | | | 9,783 | | | | 22,244 | | | | 17,726 | |
| Commission reimbursements | | | (501,049 | ) | | | (252,861 | ) | | | (177,465 | ) | | | (501,049 | ) |
| Total expenses | | | 4,436,532 | | | | 2,897,981 | | | | 3,353,299 | | | | 4,436,532 | |
| Net investment loss of the Fund | | | (4,123,085 | ) | | | (2,622,287 | ) | | | (3,230,673 | ) | | | (4,123,085 | ) |
| | | | | | | | | | | | | | | | | |
| Net (loss) income | | | (20,529,593 | ) | | | 3,098,224 | | |
| Net loss | | | | (5,673,712 | ) | | | (20,529,593 | ) |
| | | | | | | | | | | | | | | | | |
| Incentive allocation | | | (8,810 | ) | | | (538,766 | ) | | | - | | | | (8,810 | ) |
| | | | | | | | | | | | | | | | | |
| Net (loss) income available for pro-rata allocation to all members | | $ | (20,538,403 | ) | | $ | 2,559,458 | | |
| Net loss available for pro-rata allocation to all members | | | $ | (5,673,712 | ) | | $ | (20,538,403 | ) |
See accompanying notes.
Graham Alternative Investment Trading II LLC
Statements of Changes in Members’ Capital
For the years ended December 31, 20112012 and 20102011
| | | Class 0 | | | Class 2 | | | Class M | | | Total | | |
| | | Units | | | Capital | | | Units | | | Capital | | | Units | | | Capital | | | Capital |
| | | | | | | | | | | | | | | | | | | | | |
| Members’ capital, December 31, 2009 | | | 222,427.212 | | | $ | 22,373,766 | | | | 149,683.130 | | | $ | 14,826,566 | | | | – | | | $ | - | | | $ | 37,200,332 | |
| Subscriptions | | | 200,939.089 | | | | 19,294,582 | | | | 154,708.307 | | | | 14,716,456 | | | | 500.000 | | | | 50,000 | | | | 34,061,038 | |
| Redemptions | | | (25,506.357 | ) | | | (2,546,012 | ) | | | (15,760.941 | ) | | | (1,490,946 | ) | | | – | | | | (538,766 | ) | | | (4,575,724 | ) |
| Incentive allocation | | | – | | | | (386,102 | ) | | | – | | | | (152,664 | ) | | | – | | | | 538,766 | | | | - | |
| Net income | | | – | | | | 2,209,665 | | | | – | | | | 883,779 | | | | – | | | | 4,780 | | | | 3,098,224 | |
| Members’ capital, December 31, 2010 | | | 397,859.944 | | | | 40,945,899 | | | | 288,630.496 | | | | 28,783,191 | | | | 500.000 | | | | 54,780 | | | | 69,783,870 | |
| Subscriptions | | | 203,183.867 | | | | 20,217,119 | | | | 214,381.982 | | | | 20,455,733 | | | | – | | | | - | | | | 40,672,852 | |
| Redemptions | | | (166,208.060 | ) | | | (14,966,889 | ) | | | (63,699.617 | ) | | | (5,603,323 | ) | | | – | | | | (8,810 | ) | | | (20,579,022 | ) |
| Incentive allocation | | | – | | | | (4,821 | ) | | | – | | | | (3,989 | ) | | | – | | | | 8,810 | | | | - | |
| Net loss | | | – | | | | (10,819,357 | ) | | | – | | | | (9,700,967 | ) | | | – | | | | (9,269 | ) | | | (20,529,593 | ) |
| Members’ capital, December 31, 2011 | | | 434,835.751 | | | $ | 35,371,951 | | | | 439,312.861 | | | $ | 33,930,645 | | | | 500.000 | | | $ | 45,511 | | | $ | 69,348,107 | |
| | | Class 0 | | | Class 2 | | | Class M | | | Total | |
| | | Units | | | Capital | | | Units | | | Capital | | | Units | | | Capital | | | Capital | |
| | | | | | | | | | | | | | | | | | | | | | |
| Members’ capital, December 31, 2010 | | | 397,859.944 | | | $ | 40,945,899 | | | | 288,630.496 | | | $ | 28,783,191 | | | | 500.000 | | | $ | 54,780 | | | $ | 69,783,870 | |
| Subscriptions | | | 203,183.867 | | | | 20,217,119 | | | | 214,381.982 | | | | 20,455,733 | | | | – | | | | - | | | | 40,672,852 | |
| Redemptions | | | (166,208.060 | ) | | | (14,966,889 | ) | | | (63,699.617 | ) | | | (5,603,323 | ) | | | – | | | | (8,810 | ) | | | (20,579,022 | ) |
| Incentive allocation | | | – | | | | (4,821 | ) | | | – | | | | (3,989 | ) | | | – | | | | 8,810 | | | | - | |
| Netloss | �� | | – | | | | (10,819,357 | ) | | | – | | | | (9,700,967 | ) | | | – | | | | (9,269 | ) | | | (20,529,593 | ) |
| Members’ capital, December 31, 2011 | | | 434,835.751 | | | $ | 35,371,951 | | | | 439,312.861 | | | $ | 33,930,645 | | | | 500.000 | | | $ | 45,511 | | | $ | 69,348,107 | |
| Subscriptions | | | 12,005.117 | | | | 975,167 | | | | 4,850.134 | | | | 366,000 | | | | – | | | | – | | | | 1,341,167 | |
| Redemptions | | | (264,706.278 | ) | | | (20,490,504 | ) | | | (161,646.752 | ) | | | (11,787,882 | ) | | | – | | | – | | | | (32,278,386 | ) |
| Incentive allocation | | | – | | | | – | | | | – | | | | – | | | | – | | | – | | | | – | |
| Netloss | | | – | | | | (2,476,444 | ) | | | – | | | | (3,194,970 | ) | | | – | | | | (2,298 | ) | | | (5,673,712 | ) |
| Members’ capital, December 31, 2012 | | | 182,134.590 | | | $ | 13,380,170 | | | | 282,516.243 | | | $ | 19,313,793 | | | | 500.000 | | | $ | 43,213 | | | $ | 32,737,176 | |
See accompanying notes.
Graham Alternative Investment Trading II LLC
Statements of Cash Flows
| | | Years Ended December 31, | | | Years Ended December 31, | |
| | | 2011 | | | 2010 | | | 2012 | | | 2011 | |
| Cash flows used in operating activities | | | | | | | |
| Net (loss) income | | $ | (20,529,593 | ) | | $ | 3,098,224 | | |
| Adjustments to reconcile net (loss) income to net cash used in operating activities: | | | | | | | | | |
| Net loss (income) allocated from investment in Graham K4D Trading Ltd. | | | 16,406,508 | | | | (5,720,511 | ) | |
| Cash flows provided by (used in) operating activities | | | | | | | |
| Net loss | | | $ | (5,673,712 | ) | | $ | (20,529,593 | ) |
| Adjustments to reconcile net loss to net cash provided by (used in) operating | | | | | | | | | |
| activities: | | | | | | | | | |
| Net loss allocated from investment in Graham K4D Trading Ltd. | | | | 2,443,039 | | | | 16,406,508 | |
| Net income allocated from investment in Graham Cash Assets LLC | | | (313,447 | ) | | | (275,694 | ) | | | (122,626 | ) | | | (313,447 | ) |
| Proceeds from sale of investments in Graham K4D Trading Ltd. | | | 92,831,783 | | | | 52,276,600 | | | | 61,804,874 | | | | 92,831,783 | |
| Proceeds from sale of investments in Graham Cash Assets LLC | | | 133,621,344 | | | | 58,905,784 | | | | 87,778,439 | | | | 133,621,344 | |
| Investments in Graham K4D Trading Ltd. | | | (114,848,588 | ) | | | (50,711,016 | ) | | | (58,212,869 | ) | | | (114,848,588 | ) |
| Investments in Graham Cash Assets LLC | | | (128,621,849 | ) | | | (88,607,721 | ) | | | (62,302,798 | ) | | | (128,621,849 | ) |
| Changes in assets and liabilities: | | | | | | | | | | | | | | | | |
| Accrued commission reimbursements | | | (754 | ) | | | (13,509 | ) | | | 21,083 | | | | (754 | ) |
| Accrued brokerage fees | | | 12,206 | | | | 82,104 | | | | (76,633 | ) | | | 12,206 | |
| Accrued advisory fees | | | 1,593 | | | | 57,902 | | | | (53,539 | ) | | | 1,593 | |
| Accrued sponsor fees | | | 797 | | | | 28,951 | | | | (26,770 | ) | | | 797 | |
| Net cash used in operating activities | | | (21,440,000 | ) | | | (30,878,886 | ) | |
| Net cash provided by (used in) operating activities | | | | 25,578,488 | | | | (21,440,000 | ) |
| | | | | | | | | | | | | | | | | |
| Cash flows provided by financing activities | | | | | | | | | |
| Cash flows (used in) provided by financing activities | | | | | | | | | |
| Subscriptions | | | 40,672,852 | | | | 34,061,038 | | | | 1,341,167 | | | | 40,672,852 | |
| Redemptions | | | (19,232,852 | ) | | | (3,182,922 | ) | | | (26,919,655 | ) | | | (19,232,852 | ) |
| Net cash provided by financing activities | | | 21,440,000 | | | | 30,878,116 | | |
| Net cash (used in) provided by financing activities | | | | (25,578,488 | ) | | | 21,440,000 | |
| | | | | | | | | | | | | | | | | |
| Net change in cash and cash equivalents | | | - | | | | (770 | ) | | | – | | | | – | |
| | | | | | | | | | | | | | | | | |
| Cash and cash equivalents, beginning of year | | | - | | | | 770 | | | | – | | | | – | |
| Cash and cash equivalents, end of year | | $ | - | | | $ | - | | | $ | – | | | $ | – | |
See accompanying notes.
Graham Alternative Investment Trading II LLC
Notes to Financial Statements
December 31, 2011
2012
1. | 1. | Organization and Business |
Graham Alternative Investment Trading II LLC (“GAIT II”) was formed on July 16, 2008, commenced operations on January 4, 2009 and is organized as a Delaware Limited Liability Company. Graham Capital Management, L.P. (the “Managing Member” or “Manager”) is the managing member and the sole investment advisor. The Managing Member is registered as a Commodity Pool Operator and Commodity Trading Advisor with the Commodity Futures Trading Commission and is a member of the National Futures Association. The Managing Member is also registered as a Registered Investment Advisor with the Securities and Exchange Commission.
The investment objective of GAIT II is to achieve long-term capital appreciation through professionally managed trading through its investment in Graham K4D Trading Ltd. (the “Master Fund” or “K4D Trading”), a master trading vehicle. K4D Trading commenced operations on January 1, 1999 and is organized as a British Virgin Islands business company. As more fully described in Notes 2 and 3, this Master Fund invests in a broad range of derivative instruments such as currency forward and futures contracts; bond, interest rate, and index futures contracts; commodity forward and futures contracts, and options and swaps thereon (collectively referred to as “Derivative Positions”) traded on U.S. and foreign exchanges.
In addition to trading in the Interbank market for foreign exchange, the Manager currently executes orders on all the major U.S. futures exchanges, and may also trade on, but is not limited to, the Bolsa de Mercadorias and Futuros (“BMF”), Borsa Italiana Idem (“IML”), the Eurex Exchange (“Eurex”), , the Hong Kong Exchanges and Clearing Ltd. (“HKEX”), the Intercontinental Exchange (“ICE”), the London Metal Exchange (“LME”), the Montreal Exchange (“ME”), the Mercado de Futuros Financieros (“MEFF”), the NYMEX Euronext (“Euronext”), the Osaka Securities Exchange (“OSE”), the Singapore Exchange (“SGX”), the South African Exchange (“SAFEX”), the Sydney Futures Exchange Ltd. (“SFE”), the Tokyo Commodity Exchange (“TOCOM”), the Tokyo Financial Exchange (“TFX”), and the Tokyo Stock Exchange (“TSE”).as well as over-the-counter.
Graham Alternative Investment Fund I LLC and Graham Alternative Investment Fund II LLC are the soleprimary investors of GAIT II.
SEI Global Services, Inc. (“SEI”) is GAIT II’s independent administrator and transfer agent. SEI is responsible for certain matters pertaining to the administration of GAIT II.
GAIT II will terminate on December 31, 2050 or at an earlier date if certain conditions occur as outlined in the Limited Liability Company Agreement (“LLC Agreement”).
Duties of the Managing Member
Subject to the terms and conditions of the LLC Agreement, the Managing Member has complete and exclusive responsibility for managing and administering the affairs of GAIT II and for directing the investment and reinvestment of the assets of GAIT II.
2. | 2. | Summary of Significant Accounting Policies |
These financial statements have been prepared in conformity with U.S. generally accepted accounting principles (“U.S. GAAP”) and all amounts are stated in U.S. dollars. The preparation of these financial statements requires the Managing Member to make estimates and assumptions that affect the amounts reported in the financial statements and accompanying notes. Actual results could differ from those estimates.
Graham Alternative Investment Trading II LLC
Notes to Financial Statements (continued)
2. Summary of Significant Accounting Policies (continued)
Investment in Graham K4D Trading Ltd.
GAIT II invests in K4D Trading which is managed by the Managing Member. This investment is valued in the accompanying statements of financial condition at fair value in accordance with U.S. GAAP based upon GAIT II’s proportionate share of the K4D Trading’s reported net asset value. Gains and losses are allocated monthly by K4D Trading to GAIT II based upon GAIT II’s proportionate share of the net asset value of K4D Trading and are included in the accompanying statements of operations and managing member allocation.
Graham Alternative Investment Trading II LLC
Notes to Financial Statements (continued)
| 2. | Summary of Significant Accounting Policies (continued) |
Fair Value
The fair value of GAIT II’s assets and liabilities, which qualify as financial instruments under U.S. GAAP, approximates the carrying amounts presented in the statements of financial condition. Changes in these carrying amounts are included in the statements of operations and managing member allocation.
GAIT II follows U.S. GAAP for fair value measurements, which defines fair value, establishes a framework for measuring fair value, and requires certain disclosures about fair value measurements. GAIT II reports the fair value of its investment related assets and liabilities in accordance with the hierarchy established under U.S. GAAP. U.S. GAAP uses a three-level hierarchy for fair value measurement based on the activeness of the market and the transparency and independence of inputs used in the valuation of an asset or liability as of the measurement date.
The fair value hierarchy categorizes asset and liability positions into one of three levels, as summarized below, based on the inputs and assumptions used in deriving fair value.
| | · | Level 1 inputs are unadjusted closing or settle prices for such assets or liabilities as published by the primary exchange upon which they are traded. |
| | · | Level 2 inputs include quoted prices for similar assets and liabilities obtained from independent brokers and/or market makers in each security. With respect to GAIT II’s investments in other funds managed by the Manager, Level 2 inputs include the net asset value of the underlying fund in which it holds an investment. |
| | · | Level 3 inputs are those which are considered unobservable and are significant in arriving at fair value. |
GAIT II reports the fair value of its investment related assets and liabilities in accordance with the hierarchy established under U.S. GAAP. In accordance with this hierarchy, GAIT II’s investments in K4D Trading and Graham Cash Assets LLC (“GCA”Cash Assets”) have been classified as Level 2 valuations. The Master Fund records all its derivative financial instruments at fair value, which is derived in accordance with U.S. GAAP. There were no Level 3 assets or liabilities held at any point during the years ended December 31, 2012 or 2011 and 2010 by GAIT II, K4D Trading, or GCA,Cash Assets, and there were no transfers between levels during those periods.years. Transfers between levels, if any, are recognized on the actual date of the event or change in circumstances that cause the transfer.
Graham Alternative Investment Trading II LLC
Notes to Financial Statements (continued)
2. Summary of Significant Accounting Policies (continued)
Derivative Instruments
In the normal course of business, the Master Fund utilizes derivative financial instruments in connection with its trading activities. Derivative instruments derive their value from underlying assets, indices, reference rates or a combination of these factors. Investments in derivative financial instruments are subject to additional risks that can result in a loss of all or part of an investment. The Master Fund’s derivative financial instruments are classified by the following primary underlying risks: interest rate, foreign currency exchange rate, commodity price, and equity price risks. These risks can be in excess of the amounts recognized in the statements of financial condition. In addition, the Master Fund is also subject to additional counterparty risk should its counterparties fail to meet the terms of their contracts. Management of counterparty risk involves a number of considerations, such as the financial profile of the counterparty, specific terms and duration of the contractual agreement, and the value of collateral held, if any. The Master Fund has established initial credit approval, credit limits, and collateral requirements and may reduce its exposure to any counterparties it deems necessary. Trading in non-U.S. dollar denominated derivative instruments may subject the value of, and gains and losses associated with, such contracts to additional risks related to adverse changes in the applicable exchange rates.
Graham Alternative Investment Trading II LLC
Notes to Financial Statements (continued)
| 2. | Summary of Significant Accounting Policies (continued) |
Derivative Instruments (continued)
Unrealized gains and losses from derivative financial instruments are recorded based on changes in their fair value. Realized gains and losses are recorded when the positions are closed. All unrealized and realized gains and losses related to derivative financial instruments are included in net realized loss and net decrease(decrease) increase in unrealized appreciation on investments in the Master Fund’s statements of operations.
Futures Contracts
The Master Fund uses futures contracts in an attempt to take advantage of changes in the value of equities, commodities, interest rates, bonds and foreign currencies. Futures contracts are valued based upon the closing price as of the valuation date, established by the primary exchange upon which they are traded.
A futures contract represents a commitment for the future purchase or sale of an asset or cash settlement based on the value of an asset on a specified date. The purchase and sale of futures contracts are executed on an exchange which requires margin deposits with a Futures Commission Merchant (“FCM”). Subsequent payments are made or received by the Master Fund each day, depending on the daily fluctuations in the value of the contract. These changes in valuation are recorded for financial statement purposes as unrealized gains or losses by the Master Fund. Relative to over-the-counter derivative financial instruments, futures contracts provide reduced counterparty risk to the Master Fund since futures are exchange-traded and the exchange’s clearinghouse guarantees the futures against default. However some non-U.S. exchanges are “principals’ markets” in which no common clearing facility exists and the Master Fund may look only to the clearing broker for performance of the contract. The U.S. Commodity Exchange Act requires an FCM to segregate all funds received from such FCM’s customers in respect of regulated futures transactions. If the FCM were not to do so to the full extent required by law, the assets of the Master Fund might not be fully protected in the event of the bankruptcy or insolvency of the FCM. In that case, the Master Fund would be limited to recovering only a pro rata share of all available funds segregated on behalf of the FCM’s combined customer accounts, even though certain property specifically traceable to the Master Fund was held by the FCM. In addition, in the event of bankruptcy or insolvency of an exchange or an affiliated clearing house, the Master Fund might experience a loss of funds deposited through its FCM as margin with such exchange or affiliated clearing house, the loss of unrealized profits on its open positions, and the loss of funds owed to it as realized profits on closed positions.
Graham Alternative Investment Trading II LLC
Notes to Financial Statements (continued)
2. Summary of Significant Accounting Policies (continued)
Forward Contracts
The Master Fund enters into foreign currency forward contracts in an attempt to take advantage of changes in exchange rates. Forward currency transactions are contracts or agreements for delivery of specific currencies or the cash equivalent value at a specified future date and an agreed upon price. Forward contracts are not guaranteed by an exchange or clearing house and therefore the risks include the inability of counterparties to meet their obligations under the terms of the contracts as well as the risks associated with movements in fair value.
Exchange traded forward contracts are valued based upon the settlesettlement prices as of the valuation date, established by the primary exchange upon which they are traded. All other forward contracts are valued based upon a forward curve constructed using independently quoted forward points. Changes in fair value of each forward contract are recognized as unrealized gains or losses.
Graham Alternative Investment Trading II LLC
Notes to Financial Statements (continued)
| 2. | Summary of Significant Accounting Policies (continued) |
Derivative Instruments (continued)
Swap Contracts
The Master Fund may enter into various swap contracts.contracts in an attempt to take advantage of changes in interest rates and asset values. Swap contracts are not guaranteed by an exchange or an affiliated clearing house or regulated by any U.S. or foreign government authorities. Failure of a counterparty to meet its obligation under the terms of the swap contract could result in the loss of any unrealized gains on open positions. It may not be possible to dispose of or close out a swap position without the consent of the counterparty, and the Master Fund may not be able to enter into an offsetting contract in order to cover its risk. Swaps are subject to the International Swap and Derivative Association (“ISDA”) Master Agreements which generally require among other things, that a Master Fund maintain a predetermined level of net assets, and provide limits with respect to any decline in the Master Fund’s net asset value over 1-month, 3-month and 12-month periods. If a Master Fund were to violate such provisions, the counterparty to the swaps could demand liquidation of outstanding swap positions.
A total return swap contract is an agreement that obligates two parties to exchange cash flows calculated by reference to changes in specified prices or rates for a specified notional amount of the underlying assets. The payment flows are usually netted against each other, with the difference being paid by one party to another.
Exchange traded swaps are valued based upon the closing prices established by the primary exchange upon which they are traded. Total return swaps are valued based upon the exchange published settle price of the underlying reference instrument. Changes in fair value of each swap are recognized as unrealized gains or losses. The Master Fund records realized gains or losses when a swap contract is terminated. Interest is calculated and accrued throughout the life of each swap. Payments received at the end of each reset period are recorded against such accruals.
Options
The Master Fund may buy and sell covered and uncovered exchange traded and over-the-counter options on futures, foreign currencies, commodities, interest rates and equities to take advantage of the price movements of the financial instrument underlying the option or to hedge positions in the underlying assets. Option contracts give one party the right, but not the obligation, to buy or sell within a limited time or on a specified date, a financial instrument, commodity or currency at a contracted price. Options may also be settled in cash, based on differentials between specified indices or prices.
Graham Alternative Investment Trading II LLC
Notes to Financial Statements (continued)
2. Summary of Significant Accounting Policies (continued)
Options (continued)
The Master Fund is exposed to counterparty risk to the extent that a seller of an over-the-counter option does not meet its obligations under the terms of the option contract. The maximum risk of loss to the Master Fund is the unrealized gains of the contracts and the premiums paid to purchase its open option contracts. Relative to over-the-counter options, exchange traded options provide reduced counterparty risk to the Master Fund since the exchanges’ clearinghouse guarantees the option against default.
Exchange traded options are valued based upon the settlesettlement prices published as of the valuation date, by the principal exchange upon which they are traded. In the absence of an exchange published settlesettlement price, the option will be valued using the last reported sales price reported on the exchange for the valuation date. Over-the-counter options and exchange traded options with no reported sales price on the valuation date will generally be valued at the average of last reported bid and offer quotes from independent brokers or from the exchange, respectively.
Graham Alternative Investment Trading II LLC
Notes to Financial Statements (continued)
| 2. | Summary of Significant Accounting Policies (continued) |
Recent Accounting Pronouncements
In May 2011, the Financial Accounting Standards Board (“FASB”) issued Accounting Standards Update No. 2011-04, Amendments to Achieve Common Fair Value Measurement and Disclosure Requirements in U.S. GAAP and International Financial Reporting Standards (“IFRS”) (“ASU No. 2011-04”). ASU No. 2011-04 includes common requirements for measurement of and disclosure about fair value between U.S. GAAP and IFRS. ASU No. 2011-04 will require reporting entities to disclose the following information for fair value measurements categorized within Level 3 of the fair value hierarchy: quantitative information about the unobservable inputs used in the fair value measurement, the valuation process used by the reporting entity and a narrative description of the sensitivity of the fair value measurement to changes in unobservable inputs and the interrelationships between those unobservable inputs. The disclosure is effective for annual reporting periods beginning on or after December 15, 2011 and is to be applied prospectively.
In December 2011, the FASB issued Accounting Standards Update No. 2011-11, Disclosures about Offsetting Assets and Liabilities (“ASU No. 2011-11”). The amendments in ASU No. 2011-11 affect all entities that have financial instruments that are either offset or are subject to an enforceable master netting arrangement or similar agreement in accordance with authoritative guidance under U.S. GAAP. Entities will be required to disclose both gross information and net information about instruments and transactions eligible for offset in the statement of financial position or subject to an agreement similar to a master netting arrangement in the statement of financial position to enable users of its financial statements to understand the effect of those arrangements on its financial position. The disclosure is effective for annual reporting periods beginning on or after January 1, 2013, and interim periods within those annual periods. The Manager is assessing the impact these new pronouncements will have on these financial statements.
The Manager is assessing the impact thesethis new pronouncementspronouncement will have on these financial statements.
Indemnifications
In the normal course of business, the Master Fund, GCA,Cash Assets, and GAIT II enter into contracts that contain a variety of indemnifications. Such contracts may include those by the Master Fund and GCA withCash Assetswith their brokers and trading counterparties. GAIT II’s maximum exposure under these arrangements is unknown; however, GAIT II has not had prior claims or losses with respect to such indemnifications and considers the risk of loss to be remote.
| 3. | Investment in Graham K4D Trading Ltd. |
Graham Alternative Investment Trading II LLC
Notes to Financial Statements (continued)
3. Investment in Graham K4D Trading Ltd.
As of December 31, 20112012 and 2010,2011, GAIT II invested in K4D Trading, a master trading vehicle also managed by the Managing Manager. GAIT II’s investment in K4D Trading, as well as its investment objective, is summarized below. K4D Trading and GAIT II are related parties. K4D Trading does not charge any management or incentive fees, and offers monthly subscriptions and redemptions.
| December 31, 2011 | |
| Investment – Objective | | Percent of Members’ Capital | | | Fair Value | | | Net Loss | |
| | | | | | | | | | |
| Graham K4D Trading Ltd. (a) | | | 18.78 | % | | $ | 13,021,233 | | | $ | (16,406,508 | ) |
| | | | 18.78 | % | | $ | 13,021,233 | | | $ | (16,406,508 | ) |
| December 31, 2012 | |
| Investment – Objective | | Percent of Members’ Capital | | | Fair Value | | | Net Loss | |
| | | | | | | | | | |
| Systematic Macro | | | | | | | | | |
| Graham K4D Trading Ltd. | | | 21.34 | % | | $ | 6,984,957 | | | $ | (2,443,039 | ) |
| | | | 21.34 | % | | $ | 6,984,957 | | | $ | (2,443,039 | ) |
| December 31, 2010 | |
| Investment – Objective | | Percent of Members’ Capital | | | Fair Value | | | Net Income | |
| | | | | | | | | | |
| Graham K4D Trading Ltd. (a) | | | 10.62 | % | | $ | 7,411,468 | | | $ | 5,720,511 | |
| | | | 10.62 | % | | $ | 7,411,468 | | | $ | 5,720,511 | |
| December 31, 2011 | |
| Investment – Objective | | Percent of Members’ Capital | | | Fair Value | | | Net Loss | |
| | | | | | | | | | | | | |
| Systematic Macro | | | | | | | | | | | | |
| Graham K4D Trading Ltd. | | | 18.78 | % | | $ | 13,021,233 | | | $ | (16,406,508 | ) |
| | | | 18.78 | % | | $ | 13,021,233 | | | $ | (16,406,508 | ) |
(a) – Systematic macro
Graham Alternative Investment Trading II LLC
Notes to Financial Statements (continued)
3. | 3. | Investment in Graham K4D Trading Ltd. (continued) |
The following table summarizes the financial position of K4D Trading as of December 31, 2012.
| Assets: | | | |
| Due from brokers | | $ | 29,961,942 | |
| Fixed income securities, at fair value | | | 124,990,755 | |
| Derivative financial instruments, at fair value | | | 25,424,116 | |
| CME Membership, at fair value | | | 793,453 | |
| Total assets | | | 181,170,266 | |
| | | | | |
| Liabilities: | | | | |
| Due to brokers | | | 1,750,659 | |
| Total liabilities | | | 1,750,659 | |
| Net assets | | $ | 179,419,607 | |
| | | | | |
| Percentage of K4D Trading held by GAIT II | | | 3.89 | % |
Graham Alternative Investment Trading II LLC
Notes to Financial Statements (continued)
| 3. | Investments in Graham K4D Trading Ltd. (continued) |
The following schedules display the condensed schedules of investments for K4D Trading as of December 31, 2012.
| Description | | Principal Amount / Number of Contracts | | | Fair Value | | | Percentage of Net Assets of Master Fund | |
| Graham K4D Trading Ltd. | | | | | | | | | |
| Fixed income security | | | | | | | | | |
| Bonds (cost $124,963,438) | | | | | | | | | |
| United States | | | | | | | | | |
| U.S. Treasury bill 0.00% due 03/14/13 | | $ | 125,000,000 | | | $ | 124,990,755 | | | | 69.66 | % |
| Total United States | | | | | | | 124,990,755 | | | | 69.66 | % |
| Total bonds | | | | | | | 124,990,755 | | | | 69.66 | % |
| | | | | | | | | | | | | |
| Derivative financial instruments | | | | | | | | | | | | |
| Long contracts | | | | | | | | | | | | |
| Futures | | | | | | | | | | | | |
| Nikkei 225 Index March 2013 | | | 2,254 | | | | 11,197,084 | | | | 6.24 | % |
| Topix Index March 2013 | | | 1,383 | | | | 11,116,231 | | | | 6.20 | % |
| Other foreign index | | | | | | | (1,641,221 | ) | | | (0.92 | )% |
| Commodity | | | | | | | 40,893 | | | | 0.02 | % |
| Currency | | | | | | | 19,615 | | | | 0.01 | % |
| Interest rate | | | | | | | 989,629 | | | | 0.55 | % |
| Foreign bond | | | | | | | 3,888,306 | | | | 2.17 | % |
| U.S. bond | | | | | | | 372,289 | | | | 0.21 | % |
| U.S. index | | | | | | | 345,055 | | | | 0.19 | % |
| Total futures | | | | | | | 26,327,881 | | | | 14.67 | % |
| | | | | | | | | | | | | |
| Forwards | | | | | | | | | | | | |
| Foreign currency | | | | | | | (1,692,952 | ) | | | (0.94 | )% |
| Total forwards | | | | | | | (1,692,952 | ) | | | (0.94 | )% |
Graham Alternative Investment Trading II LLC
Notes to Financial Statements (continued)
| 3. | Investments in Graham K4D Trading Ltd. (continued) |
The following schedules display the condensed schedules of investments for K4D Trading as of December 31, 2012.
| Description | Notional Amount | | Fair Value | | | Percentage of Net Assets of Master Fund | |
| Graham K4D Trading Ltd. (continued) | | | | | | | |
| Derivative financial instruments (continued) | | | | | | | |
| Short contracts | | | | | | | |
| Futures | | | | | | | |
| Foreign index | | | $ | (73,012 | ) | | | (0.04 | )% |
| Commodity | | | | (7,643,113 | ) | | | (4.27 | )% |
| Currency | | | | 1,060,981 | | | | 0.59 | % |
| Interest rate | | | | (39,202 | ) | | | (0.02 | )% |
| Foreign bond | | | | (241,205 | ) | | | (0.13 | )% |
| U.S. bond | | | | 243,652 | | | | 0.14 | % |
| U.S. index | | | | (353,828 | ) | | | (0.20 | )% |
| Total futures | | | | (7,045,727 | ) | | | (3.93 | )% |
| | | | | | | | | | |
| Forwards | | | | | | | | | |
| U.S. dollar / Japanese Yen 03/21/13 | JPY(24,575,106,969) | | | 9,839,401 | | | | 5.48 | % |
| U.S. dollar / Japanese Yen 01/04/13 - 01/07/13 | JPY (2,181,627,007) | | | 105,135 | | | | 0.06 | % |
| Other foreign currency | | | | (2,109,622 | ) | | | (1.17 | )% |
| Total forwards | | | | 7,834,914 | | | | 4.37 | % |
| | | | | | | | | | |
| Total | | | $ | 150,414,871 | | | | 83.83 | % |
Graham Alternative Investment Trading II LLC
Notes to Financial Statements (continued)
| 3. | Investment in Graham K4D Trading Ltd. (continued) |
The following table shows the fair value classification of each investment type for K4D Trading as of December 31, 2012:
| Assets | | | |
| Level 1: | | | |
| U.S. bond futures | | $ | 927,920 | |
| Foreign bond futures | | | 7,253,098 | |
| U.S. index futures | | | 1,461,395 | |
| Foreign index futures | | | 23,920,199 | |
| Commodity futures | | | 10,650,606 | |
| Interest rate futures | | | 1,735,617 | |
| Currency futures | | | 1,104,266 | |
| Equity securities | | | 793,453 | |
| Total Level 1 | | | 47,846,554 | |
| | | | | |
| Level 2: | | | | |
| Foreign currency forwards | | | 19,238,245 | |
| Fixed income security | | | 124,990,755 | |
| Total Level 2 | | | 144,229,000 | |
| Total assets | | $ | 192,075,554 | |
| | | | | |
| Liabilities | | | | |
| Level 1: | | | | |
| U.S. bond futures | | $ | (311,979 | ) |
| Foreign bond futures | | | (3,605,997 | ) |
| Foreign index futures | | | (3,321,117 | ) |
| U.S. index futures | | | (1,470,168 | ) |
| Commodity futures | | | (18,252,826 | ) |
| Interest rate futures | | | (785,190 | ) |
| Currency futures | | | (23,670 | ) |
| Total Level 1 | | | (27,770,947 | ) |
| | | | | |
| Level 2: | | | | |
| Foreign currency forwards | | | (13,096,283 | ) |
| Total Level 2 | | | (13,096,283 | ) |
| Total liabilities | | $ | (40,867,230 | ) |
Graham Alternative Investment Trading II LLC
Notes to Financial Statements (continued)
| 3. | Investment in Graham K4D Trading Ltd. (continued) |
The following table displays the gross volume of derivative activities based on their notional amounts and number of contracts and fair value of derivative contracts held by the Master Fund at December 31, 2012 categorized by primary underlying risk and is representative of the derivative positions held by K4D Trading throughout the year. Derivatives denominated in foreign currencies have been converted to U.S. dollars. Derivative asset and liability balances are presented on a gross basis, prior to the application of counterparty netting. K4D Trading trades futures on a leveraged basis. Due to the low margin deposits normally required for trading these derivative financial instruments, the gross notional exposure as displayed in the tables below may exceed the net asset value of K4D Trading by a significant amount. As a result, a relatively small price movement in an underlying derivative financial instrument may result in immediate and substantial effect on the net income and net asset value of K4D Trading and GAIT II. Amounts presented below as collateral balances supporting all derivative positions are included in due from brokers and fixed income securitieson K4D Trading’s statement of financial condition.
| | | Graham K4D Trading Ltd. | |
| | | Long exposure | | | Short exposure | | | | | | | |
| | | | | | | | | | | | | | | | | | | |
| | | Notional amounts | | | Number of contracts | | | Notional amounts | | | Number of contracts | | | Derivative Assets | | | Derivative Liabilities | |
| Commodity price | | | | | | | | | | | | | | | | | | |
| Futures | | $ | 364,319,244 | | | | 4,414 | | | $ | (883,588,505 | ) | | | (13,712 | ) | | $ | 10,650,606 | | | $ | (18,252,826 | ) |
| | | | 364,319,244 | | | | 4,414 | | | | (883,588,505 | ) | | | (13,712 | ) | | | 10,650,606 | | | | (18,252,826 | ) |
| | | | | | | | | | | | | | | | | | | | | | | | | |
| Equity price | | | | | | | | | | | | | | | | | | | | | | | | |
| Futures | | | 1,226,779,876 | | | | 13,036 | | | | (106,770,515 | ) | | | (1,893 | ) | | | 25,381,594 | | | | (4,791,285 | ) |
| | | | 1,226,779,876 | | | | 13,036 | | | | (106,770,515 | ) | | | (1,893 | ) | | | 25,381,594 | | | | (4,791,285 | ) |
| | | | | | | | | | | | | | | | | | | | | | | | | |
| Foreign currency | | | | | | | | | | | | | | | | | | | | | | | | |
| exchange rate | | | | | | | | | | | | | | | | | | | | | | | | |
| Futures | | | 36,929,900 | | | | 352 | | | | (136,511,977 | ) | | | (1,624 | ) | | | 1,104,266 | | | | (23,670 | ) |
| Forwards | | | 1,526,791,218 | | | | N/A | | | | (1,520,649,257 | ) | | | N/A | | | | 19,238,245 | | | | (13,096,283 | ) |
| | | | 1,563,721,118 | | | | 352 | | | | (1,657,161,234 | ) | | | (1,624 | ) | | | 20,342,511 | | | | (13,119,953 | ) |
| | | | | | | | | | | | | | | | | | | | | | | | | |
| Interest rate | | | | | | | | | | | | | | | | | | | | | | | | |
| Futures | | | 9,571,876,106 | | | | 45,765 | | | | (16,351,154 | ) | | | (81 | ) | | | 9,916,635 | | | | (4,703,166 | ) |
| | | | 9,571,876,106 | | | | 45,765 | | | | (16,351,154 | ) | | | (81 | ) | | | 9,916,635 | | | | (4,703,166 | ) |
| Total | | $ | 12,726,696,344 | | | | 63,567 | | | $ | (2,663,871,408 | ) | | | (17,310 | ) | | $ | 66,291,346 | | | $ | (40,867,230 | ) |
| | | | | | | | | | | | | | | | | | | | | | | | | |
| Collateral balances supporting all derivative positions | | | | | | | | | | | | | | | $ | 153,202,038 | |
Graham Alternative Investment Trading II LLC
Notes to Financial Statements (continued)
| 3. | Investment in Graham K4D Trading Ltd. (continued) |
The following table summarizes the results of operations of K4D Trading for the year ended December 31, 2012.
| Net investment loss | | $ | (240,755 | ) |
| | | | | |
| Net realized loss on investments | | | (74,164,455 | ) |
| Net decrease in unrealized appreciation on investments | | | (1,457,876 | ) |
| Brokerage commissions and fees | | | (4,371,586 | ) |
| Net loss on investments | | | (79,993,917 | ) |
| Net loss | | $ | (80,234,672 | ) |
The following table shows the gains and losses on all financial instruments held by K4D Trading reported in net realized loss and net decrease in unrealized appreciation on investments in its statement of operations segregated by primary underlying risk and contract type for the year ended December 31, 2012:
| | | | |
| Commodity price | | | |
| Futures | | $ | (153,351,496 | ) |
| Swaps | | | 8,862,476 | |
| | | | (144,489,020 | ) |
| | | | | |
| Equity price | | | | |
| Equities | | | (250,647 | ) |
| Futures | | | 59,969,550 | |
| | | | 59,718,903 | |
| | | | | |
| Foreign currency | | | | |
| exchange rate | | | | |
| Futures | | | (19,324,533 | ) |
| Forwards | | | (44,179,110 | ) |
| | | | (63,503,643 | ) |
| | | | | |
| Interest rate | | | | |
| Futures | | | 72,515,966 | |
| Fixed income security | | | 135,463 | |
| | | | 72,651,429 | |
| Total | | $ | (75,622,331 | ) |
Graham Alternative Investment Trading II LLC
Notes to Financial Statements (continued)
| 3. | Investment in Graham K4D Trading Ltd. (continued) |
The following table summarizes the financial position of K4D Trading as of December 31, 2011.
| Assets: | | | |
| Due from brokers | | $ | 307,111,336 | |
| Derivative financial instruments, at fair value | | | 41,337,536 | |
| CME Membership, at fair value | | | 355,000 | |
| Subscriptions receivable | | | 34,651 | |
| Total assets | | | 348,838,523 | |
| | | | | |
| Liabilities: | | | | |
| Derivative financial instruments, at fair value | | | 15,255,976 | |
| Redemptions payable | | | 34,651 | |
| Total liabilities | | | 15,290,627 | |
| Net assets | | $ | 333,547,896 | |
| | | | | |
| Percentage of K4D Trading held by GAIT II | | | 3.90 | % |
Graham Alternative Investment Trading II LLC
Notes to Financial Statements (continued)
3. | 3. | Investment in Graham K4D Trading Ltd. (continued) |
The following schedule displays the condensed schedule of investments for K4D Trading as of December 31, 2011.
| Description | | Fair Value | | | Percentage of Net Assets of K4D Trading | |
| Graham K4D Trading Ltd. | | | | | | |
| Long contracts | | | | | | |
| Futures | | | | | | |
| U.S. bond | | $ | 5,555,669 | | | | 1.67 | % |
| Foreign bond | | | 15,262,571 | | | | 4.58 | % |
| U.S. index | | | 2,281,203 | | | | 0.68 | % |
| Foreign index | | | 1,698,637 | | | | 0.51 | % |
| Commodity | | | (255,745 | ) | | | (0.08 | )% |
| Interest rate | | | 903,752 | | | | 0.27 | % |
| Currency | | | 839,900 | | | | 0.25 | % |
| Total futures | | | 26,285,987 | | | | 7.88 | % |
| | | | | | | | | |
| Forwards | | | | | | | | |
| Foreign currency | | | 8,206,755 | | | | 2.46 | % |
| Total forwards | | | 8,206,755 | | | | 2.46 | % |
| | | | | | | | | |
| Short contracts | | | | | | | | |
| Futures | | | | | | | | |
| Foreign bond | | | (7,404 | ) | | | (0.00 | )% |
| U.S. index | | | 5,540 | | | | 0.00 | % |
| Foreign index | | | (1,563,165 | ) | | | (0.47 | )% |
| Commodity | | | 615,434 | | | | 0.18 | % |
| Interest rate | | | (1,288,252 | ) | | | (0.38 | )% |
| Currency | | | 337,837 | | | | 0.10 | % |
| Total futures | | | (1,900,010 | ) | | | (0.57 | )% |
| | | | | | | | | |
| Swaps | | | | | | | | |
| Commodity | | | (15,255,976 | ) | | | (4.57 | )% |
| Total swaps | | | (15,255,976 | ) | | | (4.57 | )% |
| | | | | | | | | |
| Forwards | | | | | | | | |
| Foreign currency | | | 8,744,804 | | | | 2.62 | % |
| Total forwards | | | 8,744,804 | | | | 2.62 | % |
| | | | | | | | | |
| Total | | $ | 26,081,560 | | | | 7.82 | % |
Graham Alternative Investment Trading II LLC
Notes to Financial Statements (continued)
3. | 3. | Investment in Graham K4D Trading Ltd. (continued) |
The following table shows the fair value classification of each investment type for K4D Trading as of December 31, 2011.
| Assets | | | |
| Level 1: | | | |
| U.S. bond futures | | $ | 5,807,164 | |
| Foreign bond futures | | | 15,262,571 | |
| U.S. index futures | | | 3,038,693 | |
| Foreign index futures | | | 1,954,287 | |
| Commodity futures | | | 15,602,465 | |
| Interest rate futures | | | 1,693,157 | |
| Currency futures | | | 1,406,611 | |
| Total Level 1 | | | 44,764,948 | |
| | | | | |
| Level 2: | | | | |
| Foreign currency forwards | | | 21,958,196 | |
| Total Level 2 | | | 21,958,196 | |
| Total assets | | $ | 66,723,144 | |
| | | | | |
| Liabilities | | | | |
| Level 1: | | | | |
| U.S. bond futures | | $ | (251,495 | ) |
| Foreign bond futures | | | (7,404 | ) |
| U.S. index futures | | | (751,950 | ) |
| Foreign index futures | | | (1,818,815 | ) |
| Commodity futures | | | (15,242,776 | ) |
| Commodity swaps | | | (15,255,976 | ) |
| Interest rate futures | | | (2,077,657 | ) |
| Currency futures | | | (228,874 | ) |
| Total Level 1 | | | (35,634,947 | ) |
| | | | | |
| Level 2: | | | | |
| Foreign currency forwards | | | (5,006,637 | ) |
| Total Level 2 | | | (5,006,637 | ) |
| Total liabilities | | $ | (40,641,584 | ) |
Graham Alternative Investment Trading II LLC
Notes to Financial Statements (continued)
3. | 3. | Investment in Graham K4D Trading Ltd. (continued) |
The following table displays the gross volume of derivative activities based on their notional amounts and number of contracts and fair value of derivative contracts held by the Master Fund at December 31, 2011 categorized by primary underlying risk and areis representative of the derivative positions held by K4D Trading throughout the year. Derivatives denominated in foreign currencies have been converted to U.S. dollars. Derivative assetsasset and liability balances are presented on a gross basis, prior to the application of counterparty netting. K4D Trading trades futures and options on a leveraged basis. Due to the low margin deposits normally required for trading these derivative financial instruments, the gross notional exposure as displayed in the tables below may exceed the net asset value of K4D Trading by a significant amount. As a result, a relatively small price movement in an underlying derivative financial instrument may result in immediate and substantial effect on the net income and net asset value of the Master Fund and GAIT II. Amounts presented below as collateral balances supporting all derivative positions are included in due from brokers on K4D Trading’s statement of financial condition.
| | | Graham K4D Trading Ltd. | | | Graham K4D Trading Ltd. | |
| | | Long exposure | | | Short exposure | | | | | | | | | Long exposure | | | Short exposure | | | | | | | |
| | | Notional amounts | | | Number of contracts | | | Notional amounts | | | Number of contracts | | | Derivative Assets | | | Derivative Liabilities | | | Notional amounts | | | Number of contracts | | | Notional amounts | | | Number of contracts | | | Derivative Assets | | | Derivative Liabilities | |
| | | | | | | | | | | | | | | | | | | | | | | | | | | | | | | | | | | | | |
| Commodity price | | | | | | | | | | | | | | | | | | | | | | | | | | | | | | | | | | | | |
| Futures | | $ | 549,621,961 | | | | 6,056 | | | $ | (748,131,689 | ) | | | (17,936 | ) | | $ | 15,602,465 | | | $ | (15,242,776 | ) | | $ | 549,621,961 | | | | 6,056 | | | $ | (748,131,689 | ) | | | (17,936 | ) | | $ | 15,602,465 | | | $ | (15,242,776 | ) |
| Swaps | | | - | | | | - | | | | (232,232,146 | ) | | | (6,040 | ) | | | - | | | | (15,255,976 | ) | | | - | | | | - | | | | (232,232,146 | ) | | | (6,040 | ) | | | - | | | | (15,255,976 | ) |
| | | | 549,621,961 | | | | 6,056 | | | | (980,363,835 | ) | | | (23,976 | ) | | | 15,602,465 | | | | (30,498,752 | ) | | | 549,621,961 | | | | 6,056 | | | | (980,363,835 | ) | | | (23,976 | ) | | | 15,602,465 | | | | (30,498,752 | ) |
| | | | | | | | | | | | | | | | | | | | | | | | | | | | | | | | | | | | | | | | | | | | | | | | | |
| Equity price | | | | | | | | | | | | | | | | | | | | | | | | | | | | | | | | | | | | | | | | | | | | | | | | |
| Futures | | | 532,726,507 | | | | 8,449 | | | | (283,517,405 | ) | | | (4,519 | ) | | | 4,992,980 | | | | (2,570,765 | ) | | | 532,726,507 | | | | 8,449 | | | | (283,517,405 | ) | | | (4,519 | ) | | | 4,992,980 | | | | (2,570,765 | ) |
| | | | 532,726,507 | | | | 8,449 | | | | (283,517,405 | ) | | | (4,519 | ) | | | 4,992,980 | | | | (2,570,765 | ) | | | 532,726,507 | | | | 8,449 | | | | (283,517,405 | ) | | | (4,519 | ) | | | 4,992,980 | | | | (2,570,765 | ) |
| | | | | | | | | | | | | | | | | | | | | | | | | | | | | | | | | | | | | | | | | | | | | | | | | |
| Foreign currency exchange rate | | | | | | | | | | | | | | | | | | | | | | | | | |
| Foreign currency | | | | | | | | | | | | | | | | | | | | | | | | | |
| exchange rate | | | | | | | | | | | | | | | | | | | | | | | | | |
| Futures | | | 263,535,156 | | | | 2,886 | | | | (55,089,450 | ) | | | (348 | ) | | | 1,406,611 | | | | (228,874 | ) | | | 263,535,156 | | | | 2,886 | | | | (55,089,450 | ) | | | (348 | ) | | | 1,406,611 | | | | (228,874 | ) |
| Forwards | | | 1,473,161,901 | | | | N/A | | | | (1,456,210,342 | ) | | | N/A | | | | 21,958,196 | | | | (5,006,637 | ) | | | 1,473,161,901 | | | | N/A | | | | (1,456,210,342 | ) | | | N/A | | | | 21,958,196 | | | | (5,006,637 | ) |
| | | | 1,736,697,057 | | | | 2,886 | | | | (1,511,299,792 | ) | | | (348 | ) | | | 23,364,807 | | | | (5,235,511 | ) | | | 1,736,697,057 | | | | 2,886 | | | | (1,511,299,792 | ) | | | (348 | ) | | | 23,364,807 | | | | (5,235,511 | ) |
| | | | | | | | | | | | | | | | | | | | | | | | | | | | | | | | | | | | | | | | | | | | | | | | | |
| Interest rate | | | | | | | | | | | | | | | | | | | | | | | | | | | | | | | | | | | | | | | | | | | | | | | | |
| Futures | | | 11,861,168,194 | | | | 60,131 | | | | (3,335,791,712 | ) | | | (13,264 | ) | | | 22,762,892 | | | | (2,336,556 | ) | | | 11,861,168,194 | | | | 60,131 | | | | (3,335,791,712 | ) | | | (13,264 | ) | | | 22,762,892 | | | | (2,336,556 | ) |
| | | | 11,861,168,194 | | | | 60,131 | | | | (3,335,791,712 | ) | | | (13,264 | ) | | | 22,762,892 | | | | (2,336,556 | ) | | | 11,861,168,194 | | | | 60,131 | | | | (3,335,791,712 | ) | | | (13,264 | ) | | | 22,762,892 | | | | (2,336,556 | ) |
| Total | | $ | 14,680,213,719 | | | | 77,522 | | | $ | (6,110,972,744 | ) | | | (42,107 | ) | | $ | 66,723,144 | | | $ | (40,641,584 | ) | | $ | 14,680,213,719 | | | | 77,522 | | | $ | (6,110,972,744 | ) | | | (42,107 | ) | | $ | 66,723,144 | | | $ | (40,641,584 | ) |
| | | | | | | | | | | | | | | | | | | | | | | | | | | | | |
| | | | | | | | | | | | | | | | |
| Collateral balances supporting all derivative positions | Collateral balances supporting all derivative positions | | | | | | | | | | | $ | 307,111,336 | | Collateral balances supporting all derivative positions | | | | | | | | | | | $ | 307,111,336 | |
Graham Alternative Investment Trading II LLC
Notes to Financial Statements (continued)
3. | 3. | Investment in Graham K4D Trading Ltd. (continued) |
The following table summarizes the results of operations of K4D Trading for the year ended December 31, 2011.
| Net investment loss | | $ | (598,015 | ) | | $ | (598,015 | ) |
| | | | | | | | | |
| Net realized loss on investments | | | (422,430,555 | ) | | | (422,430,555 | ) |
| Net decrease in unrealized appreciation on investments | | | (18,855,089 | ) | |
| Net (decrease) in unrealized appreciation on investments | | | | (18,855,089 | ) |
| Brokerage commissions and fees | | | (13,215,302 | ) | | | (13,215,302 | ) |
| Net loss on investments | | | (454,500,946 | ) | | | (454,500,946 | ) |
| Net loss | | $ | (455,098,961 | ) | | $ | (455,098,961 | ) |
The following table shows the gains and losses on all financial instruments held by the Master Fund reported in net realized loss and net increase (decrease) in unrealized appreciation on investments in its statement of operations segregated by primary underlying risk and contract type for the year ended December 31, 2011:
| | | | | |
| Commodity price | | | | | | |
| Futures | | $ | (85,253,000 | ) | | $ | (85,253,000 | ) |
| Swaps | | | (15,123,659 | ) | | | (15,123,659 | ) |
| | | | (100,376,659 | ) | | | (100,376,659 | ) |
| | | | | | | | | |
| Equity price | | | | | | | | |
| Equities | | | (7,000 | ) | | | (7,000 | ) |
| Futures | | | (232,290,243 | ) | | | (232,290,243 | ) |
| | | | (232,297,243 | ) | | | (232,297,243 | ) |
| | | | | | | | | |
| Foreign currency exchange rate | | | | | |
| Foreign currency | | | | | |
| exchange rate | | | | | |
| Futures | | | (20,151,534 | ) | | | (20,151,534 | ) |
| Forwards | | | (189,137,435 | ) | | | (189,137,435 | ) |
| | | | (209,288,969 | ) | | | (209,288,969 | ) |
| | | | | | | | | |
| Interest rate | | | | | | | | |
| Futures | | | 100,677,227 | | | | 100,677,227 | |
| | | | 100,677,227 | | | | 100,677,227 | |
| Total | | $ | (441,285,644 | ) | | $ | (441,285,644 | ) |
Graham Alternative Investment Trading II LLC
Notes to Financial Statements (continued)
3. Investment in Graham K4D Trading Ltd. (continued)
The following table summarizes the financial position of K4D Trading as of December 31, 2010.
| Assets: | | | |
| Due from brokers | | $ | 135,887,098 | |
| Derivative financial instruments, at fair value | | | 45,743,328 | |
| Interest receivable | | | 9,100 | |
| Total assets | | | 181,639,526 | |
| | | | | |
| Liabilities: | | | | |
| Derivative financial instruments, at fair value | | | - | |
| Total liabilities | | | - | |
| Net assets | | $ | 181,639,526 | |
| | | | | |
| Percentage of Master Fund held by the Fund | | | 4.08 | % |
Graham Alternative Investment Trading II LLC
Notes to Financial Statements (continued)
3. Investment in Graham K4D Trading Ltd. (continued)
The following schedule displays the condensed schedule of investments of K4D Trading as of December 31, 2010.
| Description | Principal Amount | | Fair Value | | | Percentage of Net Assets of K4D Trading | |
| Long contracts | | | | | | |
| Futures | | | | | | |
| U.S. bond | | | $ | 237,741 | | | | 0.13 | % |
| Foreign bond | | | | 1,053,653 | | | | 0.58 | % |
| U.S. index | | | | 3,010,100 | | | | 1.66 | % |
| Foreign index | | | | (3,683,508 | ) | | | (2.03 | )% |
| Commodity | | | | 31,911,445 | | | | 17.57 | % |
| Interest rate | | | | 325,182 | | | | 0.18 | % |
| Currency | | | | 4,536,916 | | | | 2.50 | % |
| Total futures | | | | 37,391,529 | | | | 20.59 | % |
| | | | | | | | | | |
| Forwards | | | | | | | | | |
| Japanese Yen / U.S. dollar 01/19/11 | JPY 43,988,617,100 | | | 11,186,032 | | | | 6.16 | % |
| Other Japanese Yen / U.S. dollar 1/04/11 - 1/05/11 | JPY 14,270,122,339 | | | 796,715 | | | | 0.44 | % |
| Swiss Franc / U.S. dollar 01/19/11 | CHF 491,922,158 | | | 17,376,713 | | | | 9.57 | % |
| Other foreign currency | | | | 28,092,524 | | | | 15.46 | % |
| Total forwards | | | | 57,451,984 | | | | 31.63 | % |
Graham Alternative Investment Trading II LLC
Notes to Financial Statements (continued)
3. Investment in Graham K4D Trading Ltd. (continued)
The following schedule displays the condensed schedule of investments of K4D Trading as of December 31, 2010.
| Description | Principal Amount | | Fair Value | | | Percentage of Net Assets of K4D Trading | |
| Short contracts | | | | | | | |
| Futures | | | | | | | |
| U.S. bond | | | $ | (1,546,794 | ) | | | (0.85 | )% |
| Foreign bond | | | | (540,937 | ) | | | (0.30 | )% |
| Foreign index | | | | (142,959 | ) | | | (0.08 | )% |
| Commodity | | | | (4,754,965 | ) | | | (2.62 | )% |
| Interest rate | | | | (3,790,967 | ) | | | (2.09 | )% |
| Currency | | | | 739,824 | | | | 0.41 | % |
| Total futures | | | | (10,036,798 | ) | | | (5.53 | )% |
| | | | | | | | | | |
| Forwards | | | | | | | | | |
| Japanese Yen / U.S. dollar 01/19/11 | JPY (36,043,608,800) | | | (12,993,436 | ) | | | (7.15 | )% |
| Other Japanese Yen / U.S. dollar 1/04/11 - 1/05/11 | JPY (14,111,800,669) | | | (834,965 | ) | | | (0.46 | )% |
| Swiss Franc / U.S. dollar 01/19/11 | CHF (431,464,200) | | | (17,247,454 | ) | | | (9.50 | )% |
| Other foreign currency | | | | (7,987,532 | ) | | | (4.40 | )% |
| Total forwards | | | | (39,063,387 | ) | | | (21.51 | )% |
| | | | | | | | | | |
| Total | | | $ | 45,743,328 | | | | 25.18 | % |
Graham Alternative Investment Trading II LLC
Notes to Financial Statements (continued)
3. Investment in Graham K4D Trading Ltd. (continued)
The following table shows the fair value classification of each investment type for K4D Trading as of December 31, 2010.
| Long Contracts | | | |
| Level 1: | | | |
| U.S. bond futures | | $ | 237,741 | |
| Foreign bond futures | | | 1,053,653 | |
| U.S. index futures | | | 3,010,100 | |
| Foreign index futures | | | (3,683,508 | ) |
| Commodity futures | | | 31,911,445 | |
| Interest rate futures | | | 325,182 | |
| Currency futures | | | 4,536,916 | |
| Total Level 1 | | | 37,391,529 | |
| | | | | |
| Level 2: | | | | |
| Foreign currency forwards | | | 57,451,984 | |
| Total Level 2 | | | 57,451,984 | |
| Total long contracts | | $ | 94,843,513 | |
| | | | | |
| Short Contracts | | | | |
| Level 1: | | | | |
| U.S. bond futures | | $ | (1,546,794 | ) |
| Foreign bond futures | | | (540,937 | ) |
| Foreign index futures | | | (142,959 | ) |
| Commodity futures | | | (4,754,965 | ) |
| Interest rate futures | | | (3,790,967 | ) |
| Currency futures | | | 739,824 | |
| Total Level 1 | | | (10,036,798 | ) |
| | | | | |
| Level 2: | | | | |
| Foreign currency forwards | | | (39,063,387 | ) |
| Total Level 2 | | | (39,063,387 | ) |
| Total short contracts | | $ | (49,100,185 | ) |
Graham Alternative Investment Trading II LLC
Notes to Financial Statements (continued)
3. Investment in Graham K4D Trading Ltd. (continued)
The following table displays the gross volume of derivative activities based on their notional amounts and number of contracts and fair value of derivative contracts held by the Master Fund at December 31, 2010 categorized by primary underlying risk and are representative of the derivative positions held by K4D Trading throughout the year. Derivatives denominated in foreign currencies have been converted to U.S. dollars. Derivative assets and liability balances are presented on a gross basis, prior to the application of counterparty netting. Amounts presented below as collateral balances supporting all derivative positions are included in due from brokers on K4D Trading’s statement of financial condition.
| | | Graham K4D Trading Ltd. | |
| | | Long exposure | | | Short exposure | | | | | | | |
| | | Notional amounts | | | Number of contracts | | | Notional amounts | | | Number of contracts | | | Derivative Assets | | | Derivative Liabilities | |
| | | | | | | | | | | | | | | | | | | |
| Commodity price | | | | | | | | | | | | | | | | | | |
| Futures | | $ | 810,106,878 | | | | 10,782 | | | $ | (53,034,444 | ) | | | (926 | ) | | $ | 32,742,543 | | | $ | (5,586,063 | ) |
| | | | 810,106,878 | | | | 10,782 | | | | (53,034,444 | ) | | | (926 | ) | | | 32,742,543 | | | | (5,586,063 | ) |
| | | | | | | | | | | | | | | | | | | | | | | | | |
| Equity price | | | | | | | | | | | | | | | | | | | | | | | | |
| Futures | | | 16,008,395,340 | | | | 15,303 | | | | (968,631,180 | ) | | | (671 | ) | | | 4,935,403 | | | | (5,751,770 | ) |
| | | | 16,008,395,340 | | | | 15,303 | | | | (968,631,180 | ) | | | (671 | ) | | | 4,935,403 | | | | (5,751,770 | ) |
| | | | | | | | | | | | | | | | | | | | | | | | | |
| Foreign currency exchange rate | | | | | | | | | | | | | | | | | | | | | | | | |
| Futures | | | 340,454,690 | | | | 2,852 | | | | (86,152,236 | ) | | | (957 | ) | | | 5,633,114 | | | | (356,374 | ) |
| Forwards | | | 90,870,643,000 | | | | - | | | | (87,109,470,216 | ) | | | - | | | | 78,339,927 | | | | (59,951,330 | ) |
| | | | 91,211,097,690 | | | | 2,852 | | | | (87,195,622,452 | ) | | | (957 | ) | | | 83,973,041 | | | | (60,307,704 | ) |
| | | | | | | | | | | | | | | | | | | | | | | | | |
| Interest rate | | | | | | | | | | | | | | | | | | | | | | | | |
| Futures | | | 2,044,200,093 | | | | 8,454 | | | | (63,261,455,459 | ) | | | (23,095 | ) | | | 2,729,784 | | | | (6,991,906 | ) |
| | | | 2,044,200,093 | | | | 8,454 | | | | (63,261,455,459 | ) | | | (23,095 | ) | | | 2,729,784 | | | | (6,991,906 | ) |
| Total | | $ | 110,073,800,001 | | | | 37,391 | | | $ | (151,478,743,535 | ) | | | (25,649 | ) | | $ | 124,380,771 | | | $ | (78,637,443 | ) |
| | | | | | | | | | | | | | |
| Collateral balances supporting all derivative positions | | | | | | | | | | | $ | 135,887,098 | |
Graham Alternative Investment Trading II LLC
Notes to Financial Statements (continued)
3. Investment in Graham K4D Trading Ltd. (continued)
The following table summarizes the results of operations of K4D Trading for the year ended December 31, 2010.
| Net investment loss | | $ | (204,857 | ) |
| | | | | |
| Net realized gain on investments | | | 108,949,892 | |
| Net increase in unrealized appreciation on investments | | | 25,962,402 | |
| Brokerage commissions and fees | | | (6,939,638 | ) |
| Net gain on investments | | | 127,972,656 | |
| Net income | | $ | 127,767,799 | |
The following table shows the gains and losses on all financial instruments held by the Master Fund reported in net realized gain and net increase in unrealized appreciation on investments in its statement of operations segregated by primary underlying risk and contract type for the year ended December 31, 2010.
| Commodity price | | | |
| Futures | | $ | 10,473,704 | |
| | | | 10,473,704 | |
| | | | | |
| Equity price | | | | |
| Futures | | | (33,752,013 | ) |
| | | | (33,752,013 | ) |
| | | | | |
| Foreign currency exchange rate | | | | |
| Futures | | | 15,009,579 | |
| Forwards | | | 34,676,693 | |
| | | | 49,686,272 | |
| | | | | |
| Interest rate | | | | |
| Futures | | | 108,504,331 | |
| | | | 108,504,331 | |
| Total | | $ | 134,912,294 | |
Graham Alternative Investment Trading II LLC
Notes to Financial Statements (continued)
GAIT II invests a portion of its excess liquidity in GCA,Cash Assets, an entity for which the Manager is also the sole investment advisor. GCACash Assets commenced operations on June 22, 2005 and was formed as a Delaware Limited Liability Company for the purpose of consolidating investment activity of multiple funds managed by the Manager. Its objective is to preserve capital while enhancing return on cash balances and providing daily liquidity. It invests in debt obligations guaranteed by the U.S. federal government, which range in maturity from one to twenty-four months. GCACash Assets also maintains cash and cash equivalents on deposit with major U.S. institutions. GCACash Assets values all fixed income securities at amortized cost to the extent itwhich approximates fair value. GAIT II’s investment in GCACash Assets is valued in the accompanying statements of financial condition at fair value in accordance with U.S. GAAP based upon GAIT II’s proportionate share of GCA’s reportedCash Assets’reported net asset value. GAIT II records its proportionate share of GCA’s investmentCash Assets’investment income and expenses on a monthly basis. For the year ended December 31, 2012, the total amount recognized by GAIT II with respect to its investment in Cash Assetswas $122,626. For the year ended December 31, 2011, the total amount recognized by GAIT II with respect to its investment in GCA wasCash Assetswas $313,447. For the year ended December 31, 2010, the total amount recognized by GAIT II with respect to its investment in GCA was $275,694. These amounts are included in interest income in the statements of operations and managing member allocation. At December 31, 20112012 and 2010,2011, GAIT II owned approximately 2.00%0.85% and 2.16%2.00%, respectively, of GCA.Cash Assets. The following table summarizes the financial position of GCA asCash Assetsas of December 31, 20112012 and 20102011 and for the years then ended:
| | | | December 31, | |
| | | December 31, 2011 | | | December 31, 2010 | | | 2012 | | | 2011 | |
| Assets: | | | | | | | | | | | | |
| Cash and cash equivalents | | $ | 556,557,151 | | | $ | 750,098,151 | | | $ | 968,228,634 | | | $ | 556,557,151 | |
| Investments in fixed income securities (cost $2,412,672,700 and $2,215,622,512 respectively) | | | 2,412,672,700 | | | | 2,215,622,512 | | |
| Accrued interest income | | | 4,670,722 | | | | 6,547,074 | | |
| Investments in fixed income securities (cost $3,041,387,608 and | | | | | | | | | |
| $2,412,672,700, respectively) | | | | 3,041,387,608 | | | | 2,412,672,700 | |
| Accrued interest receivable | | | | 5,989,305 | | | | 4,670,722 | |
| Total assets | | | 2,973,900,573 | | | | 2,972,267,737 | | | | 4,015,605,547 | | | | 2,973,900,573 | |
| | | | | | | | | | | | | | | | | |
| Liabilities: | | | | | | | | | | | | | | | | |
| Other liabilities | | | 29,450 | | | | 20,000 | | | | 9,300 | | | | 29,450 | |
| Total liabilities | | | 29,450 | | | | 20,000 | | | | 9,300 | | | | 29,450 | |
| Net assets | | $ | 2,973,871,123 | | | $ | 2,972,247,737 | | | $ | 4,015,596,247 | | | $ | 2,973,871,123 | |
The following table summarizes the results of operations of GCACash Assets for the years ended December 31, 20112012 and 2010:2011:
| | | 2011 | | | 2010 | | | 2012 | | | 2011 | |
| Investment income | | | | | | | | | | | | |
| Interest income | | $ | 13,827,518 | | | $ | 13,099,691 | | | $ | 10,006,047 | | | $ | 13,827,518 | |
| Total investment income | | | 13,827,518 | | | | 13,099,691 | | | | 10,006,047 | | | | 13,827,518 | |
| | | | | | | | | | | | | | | | | |
| Expenses: | | | | | | | | | | | | | | | | |
| Bank fee expense | | | 317,178 | | | | 230,380 | | | | 143,499 | | | | 317,178 | |
| Total expenses | | | 317,178 | | | | 230,380 | | | | 143,499 | | | | 317,178 | |
| Net investment income | | | 13,510,340 | | | | 12,869,311 | | | | 9,862,548 | | | | 13,510,340 | |
| Net income | | $ | 13,510,340 | | | $ | 12,869,311 | | | $ | 9,862,548 | | | $ | 13,510,340 | |
Graham Alternative Investment Trading II LLC
Notes to Financial Statements (continued)
4. | 4. | Graham Cash Assets LLC (continued) |
The following represents the condensed schedule of investments of GCA asCash Assetsas of December 31, 2011:2012:
| Description | | Principal Amount | | | Fair Value | | | Percentage of Members’ Capital | |
| Investments in Fixed Income Securities (cost $2,412,672,700) | | | | | | | | | |
| United States | | | | | | | | | |
| FDIC Guaranteed Bonds (cost $623,918,691) | | | | | | | | | |
| Citigroup Funding 1.88% – 2.25% due 04/30/12 –12/10/12 | | $ | 374,364,000 | | | $ | 378,090,518 | | | | 12.71 | % |
| Other FDIC guaranteed bonds | | | | | | | 245,828,173 | | | | 8.27 | % |
| Total FDIC Guaranteed Bonds | | | | | | | 623,918,691 | | | | 20.98 | % |
| | | | | | | | | | | | | |
| Government Bonds (cost $1,788,754,009) | | | | | | | | | | | | |
| U.S. Treasury 0.13% – 1.38% due 01/31/12 – 11/15/13 | | | 1,785,000,000 | | | | 1,788,754,009 | | | | 60.15 | % |
| Total Government Bonds | | | | | | | 1,788,754,009 | | | | 60.15 | % |
| | | | | | | | | | | | | |
| Total Investments in Fixed Income Securities | | | | | | $ | 2,412,672,700 | | | | 81.13 | % |
| Description | | Principal Amount | | | Fair Value | | | Percentage of Members’ Capital | |
| Investments in Fixed Income Securities | | | | | | | | | |
| (cost $3,041,387,608) | | | | | | | | | |
| United States | | | | | | | | | |
| Government Bonds (cost $3,041,387,608) | | | | | | | | | |
| U.S. Treasury 0.13% – 2.63% due 01/15/13 – 12/31/14 | | $ | 3,025,000,000 | | | $ | 3,041,387,608 | | | | 75.74 | % |
| Total Government Bonds | | | | | | | 3,041,387,608 | | | | 75.74 | % |
| | | | | | | | | | | | | |
| Total Investments in Fixed Income Securities | | | | | | $ | 3,041,387,608 | | | | 75.74 | % |
The following represents the condensed schedule of investments for GCA asof Cash Assetsas of December 31, 2010.2011:
| Description | | Principal Amount | | | Fair Value | | | Percentage of Members’ Capital | | | Principal Amount | | | Fair Value | | | Percentage of Members’ Capital | |
| Investments in Fixed Income Securities (cost $2,215,622,512) | | | | | | | | | | |
| Investments in Fixed Income Securities | | | | | | | | | | |
| (cost $2,412,672,700) | | | | | | | | | | |
| United States | | | | | | | | | | | | | | | | | | |
| FDIC Guaranteed Bonds (cost $1,101,463,404) | | | | | | | | | | |
| Citibank 1.25% – 1.88% due 03/30/11 – 05/07/12 | | $ | 350,000,000 | | | $ | 351,915,163 | | | | 11.84 | % | |
| FDIC Guaranteed Bonds (cost $623,918,691) | | | | | | | | | | | | | |
| Citigroup Funding 1.88% – 2.25% due 04/30/12 –12/10/12 | | | $ | 374,364,000 | | | $ | 378,090,518 | | | | 12.71 | % |
| Other FDIC guaranteed bonds | | | | | | | 749,548,241 | | | | 25.22 | % | | | | | | | 245,828,173 | | | | 8.27 | % |
| Total FDIC Guaranteed Bonds | | | | | | | 1,101,463,404 | | | | 37.06 | % | | | | | | | 623,918,691 | | | | 20.98 | % |
| | | | | | | | | | | | | | | | | | | | | | | | | |
| Government Bonds (cost $1,114,159,108) | | | | | | | | | | | | | |
| U.S. Treasury 0.88% due 04/30/11 | | | 150,000,000 | | | | 150,213,724 | | | | 5.05 | % | |
| Other U.S. Treasury 0.75% – 1.13% due 01/31/11 – 04/30/12 | | | | | | | 963,945,384 | | | | 32.43 | % | |
| Government Bonds (cost $1,788,754,009) | | | | | | | | | | | | | |
| U.S. Treasury 0.13% – 1.38% due 01/31/12 – 11/15/13 | | | | 1,785,000,000 | | | | 1,788,754,009 | | | | 60.15 | % |
| Total Government Bonds | | | | | | | 1,114,159,108 | | | | 37.48 | % | | | | | | | 1,788,754,009 | | | | 60.15 | % |
| | | | | | | | | | | | | | | | | | | | | | | | | |
| Total Investments in Fixed Income Securities | | | | | | $ | 2,215,622,512 | | | | 74.54 | % | | | | | | $ | 2,412,672,700 | | | | 81.13 | % |
Graham Alternative Investment Trading II LLC
Notes to Financial Statements (continued)
4. | 4. | Graham Cash Assets LLC (continued) |
GCA reportsCash Assetsreports the fair value of its investment related assets and liabilities in accordance with the hierarchy established under U.S. GAAP. The following table shows the fair value classification of each investment type held by GCA asCash Assetsas of December 31, 20112012 and 2010:December 31, 2011:
| | | 2011 | | | 2010 | | | 2012 | | | 2011 | |
| Assets | | | | | | | | | | | | |
| Level 2: | | | | | | | | | | | | |
| Fixed income securities | | | | | | | | | | | | |
| FDIC Guaranteed Bonds | | $ | 623,918,691 | | | $ | 1,101,463,404 | | | $ | - | | | $ | 623,918,691 | |
| Government Bonds | | | 1,788,754,009 | | | | 1,114,159,108 | | | | 3,041,387,608 | | | | 1,788,754,009 | |
| Total fixed income securities | | | 2,412,672,700 | | | | 2,215,622,512 | | | | 3,041,387,608 | | | | 2,412,672,700 | |
| Total Level 2 | | | 2,412,672,700 | | | | 2,215,622,512 | | | | 3,041,387,608 | | | | 2,412,672,700 | |
| Total assets | | $ | 2,412,672,700 | | | $ | 2,215,622,512 | | | $ | 3,041,387,608 | | | $ | 2,412,672,700 | |
GAIT II offers Class 0 Units and Class 2 Units (collectively, the “Units”). GAIT II may issue additional classes in the future subject to different fees, expenses or other terms, or to invest in otherinother investment programs or combinations of investment programs managed by the Manager. GAIT II also has Management Units (“Class M units”) which are solely for the investment of the Manager.
A separate Capital Account is maintained for each member with respect to each Class of Units held by such member. The initial balance of each members’ Capital Account is equal to the initial contribution to GAIT II with respect to the Class to which such Capital Account relates. Each member’s Capital Account is increased by any additional subscription, and decreased by any redemption by such member of Units of such Class to which the Capital Account relates. All income and expenses of GAIT II are allocated among the members’ Capital Accounts in proportion to the balance that each Capital Account bears to the balance of all Capital Accounts as of the beginning of such fiscal period.
Subscriptions
Units may be purchased at a price equal to the Net Asset Value per Unit of the relevant Class as of the immediately preceding Valuation Day, as defined in the LLC Agreement. There is no minimum subscription amount.
Units are available for subscription as of the first business day of each month upon written notice of at least three business days prior to the last business day of the preceding month.
Redemptions
Units are not subject to any minimum holding period. Members may redeem Units at the Net Asset Value thereof as of the last business day of each month upon not less than three business days’ prior written notice to the administrator.
Graham Alternative Investment Trading II LLC
Notes to Financial Statements (continued)
6. | 6. | Fees and Related Party Transactions |
Advisory Fees
Each Class of GAIT II other than Class M pays the Manager an advisory fee (the “Advisory Fee”) at an aggregate annual rate equal to 2% of the Net Asset Value of such Class. The Advisory Fee is payable monthly in arrears calculated as of the last business day of each month and any other date the Manager may permit, in its sole and absolute discretion, as of which any subscription or redemption is effected with respect to Units of such Class during the month.
Sponsor Fees
Each Class of GAIT II other than Class M pays the Manager a sponsor fee (the “Sponsor Fee”) at an annual rate of 1% of its Net Asset Value, payable monthly in arrears, determined in the same manner as the Advisory Fee.
Incentive Allocation
At the end of each calendar quarter, the Manager will receive a special allocation of net profits (the “Incentive Allocation”) in an amount equal to 20% of the New High Net Trading Profits of each Class as defined in the LLC Agreement. The Incentive Allocation is also accrued and allocable on the date of redemption with respect to any Units that are redeemed prior to the end of a calendar quarter. Additionally, any loss carryforward attributable to any class of GAIT II shall be proportionately reduced effective as of the date of any redemption of any Units of such class by multiplying the loss carryforward by the ratio that the amount of assets redeemed from such class bears to the net assets of such class immediately prior to such redemption. The loss carryforward of a class must be recouped before any subsequent Incentive Allocation can be made to the Manager.
Brokerage Fees
Each Class of GAIT II other than Class M pays the Manager a brokerage fee (the “Brokerage Fee”) at the annual rate specified in the table below. This Brokerage Fee is payable monthly in arrears calculated as of the last business day of each month in the same manner as the Advisory Fee.
| Class | | Annual Rate | |
| | | |
| Class 0 | | | 2% | |
| Class 2 | | | 4% | |
In consideration of the Brokerage Fee, the Manager bears all of GAIT II’s trading commissions (including exchange, clearing and regulatory fees relating to its trades), routine legal expenses, internal and external accounting, audit and tax preparation expenses, fees and expenses of an external or internal administrator, and expenses and costs of printing and mailing reports and notices, together with the costs incurred in connection with the organization of GAIT II and GAIT II’s continuous offering of Units. To the extent GAIT II is allocated any of these expenses from the Master Fund, the Manager will reimburse GAIT II for those amounts. This reimbursement is included in commission reimbursements in the statements of operations and managing member allocation.
Any portion of any of the above fees, including the Incentive Allocation, may be paid by the Manager to third parties as compensation for selling activities in connection with GAIT II.
Graham Alternative Investment Trading II LLC
Notes to Financial Statements (continued)
No provision for income taxes has been made in the accompanying financial statements, as members are individually responsible for reporting income or loss based upon their respective share of GAIT II’s revenues and expenses for income tax purposes.
U.S. GAAP provides guidance for how uncertain tax positions should be recognized, measured, presented and disclosed in the financial statements. U.S. GAAP requires the evaluation of tax positions taken or expected to be taken in the course of preparing GAIT II’s tax returns to determine whether the tax positions are “more-likely-than-not” of being sustained by the applicable tax authority. Tax positions not deemed to meet a more-likely-than-not threshold would be recorded as a tax expense in the current year. The Manager has evaluated GAIT II’s tax positions and has concluded that there are no significant tax positions requiring recognition, measurement or disclosure in the financial statements. The Manager is not aware of any tax positions for which it is reasonably possible that the total amounts of unrecognized tax expense will change materially in the next twelve months. Tax years which are considered open by the relevant jurisdiction are subject to potential examination.
The following is the per unit operating performance calculation for the years ended DecemberendedDecember 31, 20112012 and 2010:2011:
| | | Class 0 | | | Class 2 | | | Class 0 | | | Class 2 | |
| Per unit operating performance: | | | | | | | |
| Net asset value per unit, December 31, 2009 | | $ | 100.59 | | | $ | 99.05 | | |
| Net loss: | | | | | | | | | |
| Net investment loss | | | (2.62 | ) | | | (1.49 | ) | |
| Net gain on investments | | | 4.95 | | | | 2.16 | | |
| Net loss | | | 2.33 | | | | 0.67 | | |
| Per unit operating performance | | | | | | | |
| Net asset value per unit, December 31, 2010 | | $ | 102.92 | | | $ | 99.72 | | | $ | 102.92 | | | $ | 99.72 | |
| Net loss: | | | | | | | | | | | | | | | | |
| Net investment loss | | | (4.40 | ) | | | (6.03 | ) | | | (4.40 | ) | | | (6.03 | ) |
| Net loss on investments | | | (17.17 | ) | | | (16.45 | ) | | | (17.17 | ) | | | (16.45 | ) |
| Net loss | | | (21.57 | ) | | | (22.48 | ) | | | (21.57 | ) | | | (22.48 | ) |
| Net asset value per unit, December 31, 2011 | | $ | 81.35 | | | $ | 77.24 | | | $ | 81.35 | | | $ | 77.24 | |
| Net loss: | | | | | | | | | |
| Net investment loss | | | | (3.81 | ) | | | (5.03 | ) |
| Net loss on investments | | | | (4.08 | ) | | | (3.85 | ) |
| Net loss | | | | (7.89 | ) | | | (8.88 | ) |
| Net asset value per unit, December 31, 2012 | | | $ | 73.46 | | | $ | 68.36 | |
Graham Alternative Investment Trading II LLC
Notes to Financial Statements (continued)
8. | 8. | Financial Highlights (continued) |
The following represents ratios to average members’ capital, excluding the Managing Member, and total return for the years ended December 31, 20112012 and 2010:2011:
| | | Class 0 | | | Class 2 | |
| | | 2012 | | | 2011 | | | 2012 | | | 2011 | |
| | | | | | | | | | | | | |
| Total return before Incentive Allocation | | | (9.70 | )% | | | (20.95 | )% | | | (11.50 | )% | | | (22.53 | )% |
| Incentive Allocation | | | (0.00 | ) | | | (0.01 | ) | | | (0.00 | ) | | | (0.01 | ) |
| Total return after Incentive Allocation | | | (9.70 | )% | | | (20.96 | )% | | | (11.50 | )% | | | (22.54 | )% |
| | | | | | | | | | | | | | | | | |
| Net investment loss before Incentive Allocation | | | (4.68 | )% | | | (4.27 | )% | | | (6.52 | )% | | | (6.03 | )% |
| Incentive Allocation | | | (0.00 | ) | | | (0.01 | ) | | | (0.00 | ) | | | (0.01 | ) |
| Net investment loss after Incentive Allocation | | | (4.68 | )% | | | (4.28 | )% | | | (6.52 | )% | | | (6.04 | )% |
| | | | | | | | | | | | | | | | | |
| Total expenses before Incentive Allocation | | | 5.22 | % | | | 5.20 | % | | | 7.16 | % | | | 7.25 | % |
| Incentive Allocation | | | 0.00 | | | | 0.01 | | | | 0.00 | | | | 0.01 | |
| Total expenses after Incentive Allocation | | | 5.22 | %* | | | 5.21 | %* | | | 7.16 | %* | | | 7.26 | %* |
| | | Class 0 | | | Class 2 | |
| | | 2011 | | | 2010 | | | 2011 | | | 2010 | |
| | | | | | | | | | | | | |
| Total return before Incentive Allocation | | | (20.95)% | | | | 3.53% | | | | (22.53)% | | | | 1.43% | |
| Incentive Allocation | | | (0.01)% | | | | (1.21) | | | | (0.01) | | | | (0.75) | |
| Total return after Incentive Allocation | | | (20.96)% | | | | 2.32% | | | | (22.54)% | | | | 0.68 | |
| | | | | | | | | | | | | | | | | |
| Net investment loss before Incentive Allocation | | | (4.27)% | | | | (4.74)% | | | | (6.03)% | | | | (6.82)% | |
| Incentive Allocation | | | (0.01)% | | | | (1.21) | | | | (0.01) | | | | (0.75) | |
| Net investment loss after Incentive Allocation | | | (4.28)% | | | | (5.95)% | | | | (6.04)% | | | | (7.57)% | |
| | | | | | | | | | | | | | | | | |
| Total expenses before Incentive Allocation | | | 5.20% | | | | 5.20% | | | | 7.25% | | | | 7.28% | |
| Incentive Allocation | | | 0.01 | | | | 1.21 | | | | 0.01 | | | | 0.75 | |
| Total expenses after Incentive Allocation | | | 5.21%* | | | | 6.41%* | | | | 7.26%* | | | | 8.03%* | |
* | The percentages noted above represent total expenses before commission reimbursements, which represent 0.62% and 0.48% of average members' capital for the years then ended. |
*- The percentages above represent total gross expenses before commission reimbursements (See Note 6), which represent 0.32% of average members’ capital for 2012 and 0.62% of average members’ capital for 2011.
Total return is calculated for Class 0 and Class 2 units taken as a whole. Total return is calculated as the change in total members’ capital, excluding that of the Managing Member, adjusted for subscriptions or redemptions during the period.year. An individual member’s return may vary from these returns based on the timing of capital transactions and the applicability of Advisory Fees, Brokerage Fees, Sponsor Fees, and the Incentive Allocation. The net investment loss and total expense ratios (including Incentive Allocation) are calculated for the Class 0 and Class 2 units taken as a whole and include net investment lossamounts from GAIT II and amountsnet investment loss and expenses allocated from the Master Fund and GCA.investment income from Cash Assets. The computation of such ratios is based on the amount of net investment loss, expenses and Incentive Allocation. Net investment loss and total expense ratios are computed based upon the weighted average of members’ capital of GAIT II, excluding that of the Managing Member, for the years ended December 31, 20112012 and 2010.2011.
As of January 1, 2013 GAIT II reduced the Brokerage Fee in Class 0 and Class 2 to 0% and 2%, respectively. As a result of this change, GAIT II will bear all future costs previously covered by the Brokerage Fee (See Note 6).
GAIT II had subscriptions of approximately $0.5$0.05 million and redemptions of approximately $3.4$4.4 million from January 1, 2013 through March 30, 2012,28, 2013, the date through which subsequent events were evaluated by management. These amounts have not been included in the financial statements.
On February 13, 2012 the Manager submitted the Uniform Application for Investment Advisor Registration (Form-ADV) with the Securities and Exchange Commission, seeking registration no earlier than March 30, 2012.
Manager
Graham Capital Management, L.P.
40 Highland Avenue
Rowayton, CT 06853
U.S.A.
Administrator |
| Administrator SEI Global Services Inc. 1 Freedom Valley Drive Oaks, PA 19456 U.S.A
Legal and Tax Advisors Proskauer Rose LLP 11 Times Square New York, NY 10036 U.S.A.
Registered Address Corporation Service Company 2711 Centerville Road Suite 400 Wilmington, DE 19808 U.S.A.
Independent Registered Public Accounting Firm Ernst & Young LLP 300 First Stamford Place Stamford, CT 06902 U.S.A. 1 Freedom Valley Drive
Oaks, PA 19456
U.S.A
|
Manager |
Graham Capital Management, L.P.
40 Highland Avenue
Rowayton, CT 06853
U.S.A.
|
Legal and Tax Advisors |
Proskauer Rose LLP
1585 Broadway
New York, NY 10036
U.S.A.
|
Registered Address |
Corporation Service Company
2711 Centerville Road
Suite 400
Wilmington, DE 19808
U.S.A.
|
Independent Registered Public Accounting Firm |
Ernst & Young LLP
300 First Stamford Place
Stamford, CT 06902
U.S.A.
|
| Item 9: | CHANGES IN AND DISAGREEMENTS WITH ACCOUNTANTS ON ACCOUNTING AND FINANCIAL DISCLOSURE |
None.
| Item 9A: | CONTROLS AND PROCEDURES |
Disclosure Controls and Procedures
The Fund has established disclosure controls and procedures to ensure that the information required to be disclosed by the Fund in the reports that it files or submits under the Exchange Act is recorded, processed, summarized and reported within the time periods specified in SEC rules and forms and that such information is accumulated and made known tothe Manager and the Fund’s management, as appropriate, to allow timely decisions regarding required disclosure.
Based on their evaluation as of December 31, 2012, the Manager, along with the Manager’s principal executive officer and principal financial officer, have concluded that the Manager’s disclosure controls and procedures with respect to the Fund (as defined in Rules 13a-15(e) and 15d-15(e) under the Exchange Act, as amended) were effective.
Management's Report on Internal Control Over Financial Reporting
The Manager is responsible for establishing and maintaining adequate internal control over the financial reporting of the Fund. Internal control over financial reporting is defined in Rules 13a-15(f) and 15d-15(f) under the Exchange Act as a process designed by, or under supervision of, a company’s principal executive and principal financial officers andeffected by a company’s board of directors, management and other personnel, to provide reasonable assurance regarding the reliability of financial reporting and the preparation of financial statements forexternal purposes in accordance with U.S. generally accepted accounting principles. The Manager’s internal control over financial reporting includes those policies and procedures that:
| ● | Pertain to the maintenance of records that, in reasonable detail, accurately and fairly reflect the transactions and dispositions of the assets of the Fund; |
| ● | Provide reasonable assurance that transactions are recorded as necessary to permit preparation of financial statements of the Fund in accordance with U.S. generally accepted accounting principles, and that the Fund’s transactions are being made only in accordance with authorizations of management; and |
| ● | Provide reasonable assurance regarding prevention or timely detection of unauthorized acquisition, use or disposition of the Fund’s assets that could have a material effect on the financial statements. |
Because of its inherent limitations, internal control over financial reporting may not prevent or detect misstatements. Projections of any evaluation of effectiveness to future periods are subject to the risk that controls may become inadequate because of changes in conditions, or that the degree of compliance with the policies or procedures may deteriorate.
Management assessed the effectiveness of the Manager’s internal control over financial reporting for the Fund as of December 31, 2012. In making this assessment, management used the criteria set forth in Internal Control – Integrated Framework issued by the Committee of Sponsoring Organizations of the Treadway Commission (“COSO”). As a result of this assessment and based on thecriteria in the COSO framework, management, including the principal financial and principal executive officers, has concluded that, as of December 31, 2012, the Manager’s internal control over financialreporting for the Fund was effective. This annual report does not include an attestation report of the Fund’s registered public accounting firm regarding internal control over financial reporting. Management’s report was not subject to attestation by the Fund’s registered public accounting firm pursuant to rules of the Securities and Exchange Commission that permit the Fund to provide only management’s report in this annual report.
Changes in Internal Controls
(a) The Manager,In connection with the participationevaluation of the Fund’s internal controls during the Fund’s last fiscal year, the Manager, along with the Manager’s principal executive officer and principal financial officer, has evaluated the effectiveness of the design and operation of its disclosure controls and procedures with respectdetermined that there are no changes to the Fund as of the end of the period covered by this annual report, and, based on their evaluation, has concluded that these disclosure controls and procedures are effective. There were no significant changes in the Manager’sFund’s internal controls with respect to the Fund or in other factors applicable to the Fund that could significantly affect these controls subsequent to the date of the evaluation.
(b) This annual report does not include a report of management’s assessment regarding internal control over financial reporting that have materially affected, or an attestation report ofare reasonably likely to materially effect, the Fund’s registered public accounting firm due to a transition period established by rules of the SEC for newly public companies.
Item 9B: OTHER INFORMATION
None.internal controls over financial reporting.
Item 10: DIRECTORS, EXECUTIVE OFFICERS AND CORPORATE GOVERNANCE| Item 9B: | OTHER INFORMATION |
None.
| Item 10: | DIRECTORS, EXECUTIVE OFFICERS AND CORPORATE GOVERNANCE |
GAIF I itself has no officers, directors or employees. GAIF I’s affairs are managed by the Manager. The general partner of the Manager is KGT, Inc. Kenneth G. Tropin is the sole director of KGT, Inc. Messrs. Pablo Calderini, Paul Sedlack, Robert E. Murray Pablo Calderini and Jeff Baisley serve as President and Chief Investment Officer, Chief Executive Officer, Chief Operating Officer, Chief Investment Officer and Chief Financial Officer, respectively, of the Manager. None of these individuals currently serves as a director of a public company. Messrs. Kenneth G. Tropin, Pablo Calderini, Paul Sedlack, Robert E. Murray Pablo Calderini and Jeff Baisley each have filed initial reports on Form 3. Biographical information for the aforementioned officers appears in Item 1: Business.
Legal Proceedings
No officer of the Manager has, during the last ten years, been subject to or involved in any legal proceedings described under Item 401(f) of Regulation S-K, have been convicted of any criminal proceeding (excluding traffic violations or similar misdemeanors), or have been a party to a civil proceeding of a judicial or administrative body of competent jurisdiction and as a result of such proceeding was or is subject to a judgment, decree or final order enjoining future violations of, or prohibiting or mandating activities subject to, United Stated federal or state securities laws of finding any violations with respect to such laws.
Section 16(a) Beneficial Ownership Reporting Compliance
Section 16(a) of the Exchange Act requires officers, directors and persons who own more than ten percent of a registered class of equity securities to, within specified time periods, file certain reports of ownership and changes in ownership with the SEC. Based solely upon a review of Forms 3 and Forms 4 furnished to the Fund pursuant to Rule 16a-3 under the Exchange Act during the Fund’s most recent fiscal year, and Forms 5 with respect to the most recent fiscal year, the Fund believes that all such forms required to be filed pursuant to Section 16(a) were timely filed as necessary by the executive officers, directors and security holders required to file same during the fiscal year ended December 31, 2012.
Code of Ethics
GAIF I has not adopted a code of ethics that applies to officers because it has no officers. In addition, GAIF I has not adopted any procedures by which investors may recommend nominees to its board of directors and has not established an audit committee because it has no board of directors.
Item 11: The Manager has adopted a Code of Ethics as required by Rule 204A-1 under the Investment Advisors Act of 1940, as amended, that requires all employees to conduct business consistent with the level of ethical standards and fiduciary duties owed by the Manager to its clients. The Code of Ethics contains policies and procedures with respect to personal securities transactions by employees and related accounts that are designed to prevent front-running, scalping, the misuse of inside information and other improper activities.
| Item 11: | EXECUTIVE COMPENSATION |
GAIF I itself has no officers, directors or employees. None of the principals, officers or employees of the Manager receives compensation from the Fund. All persons serving in the capacity of officers or executives of the Manager are compensated by the Manager in respect of their respective positions with the Manager.
As described under “Item 1. Business,” the Fund pays the Manager the Brokerage Fee and the Sponsor Fee. For the year ended December 31, 2011,2012, the Fund paid the Manager Brokerage Fees of $8,895,975$6,409,565 and Sponsor Fees of $3,751,285.$2,698,062.
As compensation for its services as investment manager to the Fund, the Manager is paid the Advisory Fees described under “Item 1. Business,” and may receive Incentive Allocations also as described under “Item 1. Business.” For the year ended December 31, 2011,2012, the Fund paid the Manager Advisory Fees of $7,502,569$5,369,125 and the Manager receiveddid not receive an Incentive Allocations of $42,993.Allocation.
The Fund has no other compensation arrangements. There are no compensation plans or arrangements relating to a change in control of the Fund or the Manager.
Item 12: SECURITY OWNERSHIP OF CERTAIN BENEFICIAL OWNERS AND MANAGEMENT AND RELATED STOCKHOLDER MATTERS| Item 12: | (a)SECURITY OWNERSHIP OF CERTAIN BENEFICIAL OWNERS AND MANAGEMENT AND RELATED STOCKHOLDER MATTERS | |
(a) Security ownership of certain beneficial owners
Not applicable.
| | (b) | Security ownership of management |
Under the terms of the Company Agreement, GAIF I is managed by the Manager. TheNeither the Manager does notnor any of its executive officers own any Units of GAIF I.
None.There are no arrangements known to the Fund, including any pledge by any person of securities of the registrant or any of its parents, the operation of which may at a subsequent date result in a change in control of the Fund.
Item 13: | Item 13: | CERTAIN RELATIONSHIPS AND RELATED TRANSACTIONS, AND DIRECTOR INDEPENDENCE |
| (a) | Transactions with Related Persons. |
The Manager would be considered a promoter for purposesmanages and conducts the business of Item 404(c) of Regulation S-K.the Fund. The natureManager receives management, incentive and amounts of compensation the promoter will receiveother fees from the Fund, areas set forth under “Item 1. Business” and “Item 11. Executive Compensation.”
Item 14: PRINCIPAL ACCOUNTING FEES AND SERVICES | (b) | Review, Approval or Ratification of Transactions with Related Persons. |
No disclosure is required hereunder as the fund is a “smaller reporting company,” as defined in Item 10(f)(1) of Regulation S-K.
| (c) | Promoters and Certain Control Persons. |
Not applicable.
| Item 14: | PRINCIPAL ACCOUNTING FEES AND SERVICES |
The aggregate fees billed for each of the last two fiscal years for professional services rendered by Ernst & Young LLP (“E&Y”EY”) for each of the years ended December 31, 20112012 and December 31, 20102011 for the audit of the Fund’s annual financial statements, review of financial statements included in the Fund’s Forms 10-Q and 10-K and other services normally provided in connection with regulatory filings or engagements were:
| FEE CATEGORY | | 2011 | | | 2010 | | | 2012 | | | 2011 | |
| Audit Fees | | $ | 75,500 | * | | $ | 69,819 | | | $ | 83,600 | * | | $ | 75,500 | |
| Audit-Related Fees | | | – | | | | – | | | | – | | | | – | |
| Tax Fees | | | 70,875 | * | | | 84,750 | | | | 84,000 | * | | | 70,875 | |
| All Other Fees | | | – | | | | – | | | | – | | | | – | |
| TOTAL FEES | | $ | 146,375 | * | | $ | 154,569 | | | $ | 167,600 | * | | $ | 146,375 | |
* Amount expected to be billed for 2011 | * | Amount expected to be billed for 2012 services. |
Audit Fees consist of fees paid to E&YEY for (i) the audit of the Fund’s annual financial statements included in the annual report on Form 10-K and review of financial statements included in the quarterly reports on Form 10-Q; and (ii) services that are normally provided by the Independent Registered Public Accounting Firm in connection with statutory and regulatory filings of registration statements. In consideration of the Brokerage Fee, the Manager bears the Fund’s audit fees.
None
Tax Fees consist of fees paid to E&YEY for professional services rendered in connection with tax compliance and Fund income tax return filings. In consideration of the Brokerage Fee, the Manager bears the Fund’s tax-related fees.
None.
(e) Not Applicable.
Item 15: | Item 15: | EXHIBITS, FINANCIAL STATEMENT SCHEDULES |
Statements of Financial Condition at December 31, 2011 and 2010 | | Statements of Financial Condition at December 31, 2012 and 2011 |
| | Statements of Operations for the years ended December 31, 2012 and 2011 |
Statements of Operations for the years ended December 31, 2011 and 2010 | | Statements of Changes in Members’ Capital for the years ended December 31, 2012 and 2011 |
| | Statements of Cash Flows for the years ended December 31 2012 and 2011 |
Statements of Changes in Members’ Capital for the years ended December 31, 2011 and 2010 | | Notes to Financial Statements. |
Statements of Cash Flows for the years ended December 31 2011 and 2010
Notes to Financial Statements.
| Exhibit Designation | Description |
| Certificate of Formation of Graham Alternative Investment Fund I LLC |
| Amended and Restated Limited Liability Company Agreement of Graham Alternative Investment Fund I LLC |
| Form of Subscription Agreement |
| Form of Placement Agreement |
| Safekeeping Account Agreement between Graham Cash Assets LLC and Bank of America, N.A. |
* Incorporated by reference to the Fund’s Form 10 previously filed on April 30, 2010
** Incorporated by reference to the Fund’s Form 10/A previously filed on September 3, 2010
The exhibits required to be filed by Item 601 of regulation S-K are incorporated herein by reference.
Exhibit 31.1 | | — | | Rule 13a-14(a)/15d-14(a) Certification (Certification of Principal Executive Officer). |
Exhibit 31.2 | | — | | Rule 13a-14(a)/15d-14(a) Certification (Certification of Principal Financial Officer). |
Exhibit 32.1 | | — | | Section 1350 Certification (Certification of Principal Executive Officer and Principal Financial Officer). |
| | | | |
101.INS | | — | | XBRL Instance Document |
101.SCH | | — | | XBRL Schema Document |
101.CAL | | — | | XBRL Calculation Linkbase Document |
101.LAB | | — | | XBRL Label Linkbase Document |
101.PRE | | — | | XBRL Presentation Linkbase Document |
101.DEF | | — | | XBRL Definition Linkbase Document |
SIGNATURES
Pursuant to the requirements of Section 1213 or 15 (d) of the Securities Exchange Act of 1934, as amended, the registrant has duly caused this report to be signed on its behalf by the undersigned, thereunto duly authorized.
Dated: March 30, 201228, 2013 | GRAHAM ALTERNATIVE INVESTMENT FUND I LLC |
| | | |
| | By: | GRAHAM CAPITAL MANAGEMENT, L.P. |
| | | its Manager |
| | | | |
| | | By: | /s/ Paul Sedlack |
| | | | Paul Sedlack, Chief Executive Officer |
| | | |
| | | By: | /s/ Jeff Baisley |
| | | | Jeff Baisley, Chief Financial Officer |
131