Title of each class | Name of exchange on which registered | |
| Common Stock, no par value per share | The NASDAQ Stock Market LLC |
Securities registered pursuant to Section 12(g) of the Act:
None
Indicate by check mark if the registrant is a well-known seasoned issuer, as defined in Rule 405 of the Securities Act. Yes oNo x
Indicate by check mark if the registrant is not required to file reports pursuant to Section 13 or Section 15(d) of the Act. Yes oNo x
Indicate by check mark whether the registrant (1) has filed all reports required to be filed by Section 13 or 15(d) of the Securities Exchange Act of 1934 during the preceding 12 months (or for such shorter period that the registrant was required to file such reports), and (2) has been subject to such filing requirements for the past 90 days. Yes x No o
Indicate by check mark whether the registrant has submitted electronically and posted on its corporate Website, if any, every Interactive Data File required to be submitted and posted pursuant to Rule 405 of Regulation S-T during the preceding 12 months (or for such shorter period that the registrant was required to submit and post such files). Yes x No o
Indicate by check mark if disclosure of delinquent filers pursuant to Item 405 of Regulation S-K is not contained herein, and will not be contained, to the best of registrant’s knowledge, in definitive proxy or information statements incorporated by reference in Part III of this Form 10-K or any amendment to this Form 10-K. x
Indicate by check mark whether the registrant is a large accelerated filer, an accelerated filer, a non-accelerated filer or a smaller reporting company. See the definitions of “large accelerated filer,” “accelerated filer” and “smaller reporting company” in Rule 12b-2 of the Exchange Act.
Large accelerated filer o | Accelerated filer x | Non-accelerated filer o | Smaller reporting company o |
Indicate by check mark whether the registrant is a shell company (as defined in Rule 12b-2 of the Act). Yes oNo x
The aggregate market value of the 22,513,67022,093,312 shares of common stock held by non-affiliates of the registrant issued and outstanding as of June 30, 2012,2013, the last business day of the registrant’s most recently completed second fiscal quarter, was $146,338,855.$116,431,754. This amount is based on the closing price of the common stock on the Nasdaq Global Select Market of $6.50$5.27 per share on June 30, 2012.2013. Shares of common stock held by executive officers and directors and persons who own 5% or more of outstanding common stock have been excluded since such persons may be deemed affiliates. This determination of affiliate status is not a determination for any other purpose.
The number of shares of the registrant’s common stock outstanding as of March 6, 20137, 2014 was 23,658,752.23,882,147.
Documents Incorporated by Reference
Portions of the Proxy Statement for the Registrant’s 20132014 Annual Meeting of Stockholders are incorporated by reference in Part III of this Annual Report on Form 10-K. With the exception of those portions that are specifically incorporated by reference in this Annual Report on Form 10-K, such Proxy Statement shall not be deemed filed as part of this Report or incorporated by reference herein.
LINCOLN EDUCATIONAL SERVICES CORPORATION AND SUBSIDIARIES
FOR THE FISCAL YEAR ENDED DECEMBER 31, 20122013
| PART I. | 1 | ||
| ITEM 1. | 1 | ||
| ITEM 1A. | |||
| ITEM 1B. | 33 | ||
| ITEM 2. | 34 | ||
| ITEM 3. | 35 | ||
| ITEM 4. | 35 | ||
| PART II. | 36 | ||
| ITEM 5. | 36 | ||
| ITEM 6. | 39 | ||
| ITEM 7. | 41 | ||
| ITEM 7A. | |||
| ITEM 8 | |||
| ITEM 9. | |||
| ITEM 9A. | |||
| 55 | |||
| ITEM 9B. | 56 | ||
| PART III. | |||
| ITEM 10. | |||
| ITEM 11. | |||
| ITEM 12. | |||
| ITEM 13. | |||
| ITEM 14. | |||
| PART IV. | |||
| ITEM 15. |
Forward-Looking Statements
This Annual Report on Form 10-K contains “forward-looking statements,” within the meaning of Section 21E of the Securities Exchange Act of 1934, as amended, which include information relating to future events, future financial performance, strategies, expectations, competitive environment, regulation and availability of resources. These forward-looking statements include, without limitation, statements regarding: proposed new programs; expectations that regulatory developments or other matters will not have a material adverse effect on our consolidated financial position, results of operations or liquidity; statements concerning projections, predictions, expectations, estimates or forecasts as to our business, financial and operating results and future economic performance; and statements of management’s goals and objectives and other similar expressions concerning matters that are not historical facts. Words such as “may,” “should,” “could,” “would,” “predicts,” “potential,” “continue,” “expects,” “anticipates,” “future,” “intends,” “plans,” “believes,” “estimates,” and similar expressions, as well as statements in future tense, identify forward-looking statements.
Forward-looking statements should not be read as a guarantee of future performance or results, and will not necessarily be accurate indications of the times at, or by, which such performance or results will be achieved. Forward-looking statements are based on information available at the time those statements are made and/or management’s good faith belief as of that time with respect to future events, and are subject to risks and uncertainties that could cause actual performance or results to differ materially from those expressed in or suggested by the forward-looking statements. Important factors that could cause such differences include, but are not limited to:
| · | our failure to comply with the extensive regulatory framework applicable to our industry or our failure to obtain timely regulatory approvals in connection with a change of control of our company or acquisitions; |
| · | our success in updating and expanding the content of existing programs and developing new programs in a cost-effective manner or on a timely basis; |
| · | risks associated with changes in applicable federal laws and regulations, including final rules that took effect during 2011 and other pending rulemaking by the U.S. Department of Education; |
| · | uncertainties regarding our ability to comply with federal laws and regulations regarding the 90/10 rule and cohort default rates; |
| · | risks associated with |
| · | risks associated with integration of acquired schools; |
| · | industry competition; |
| · | our ability to continue to execute our growth strategies; |
| · | conditions and trends in our industry; |
| · | general economic conditions; and |
| · | other factors discussed under the headings “Business,” “Risk Factors” and “Management’s Discussion and Analysis of Financial Condition and Results of Operations.” |
Forward-looking statements speak only as of the date the statements are made. Except as required under the federal securities laws and rules and regulations of the SEC, we undertake no obligation to update or revise forward-looking statements to reflect actual results, changes in assumptions or changes in other factors affecting forward-looking information. We caution you not to unduly rely on the forward-looking statements when evaluating the information presented herein.
OVERVIEW
We are a leading provider of diversified career-oriented post-secondary education as measured by total enrollment. As of December 31, 2012,2013, we operated 3833 campuses and five training sites in 17 states (exclusive of discontinued operations).15 states. We offer recent high school graduates and working adults degree and diploma programs in five areas of study: automotive technology, health sciences, skilled trades, hospitality services and business and information technology. For the year ended December 31, 2012,2013, our automotive technology program, our health sciences program, our skilled trades program, our hospitality services program and our business and information technology program accounted for approximately 38%42%, 35%30%, 12%13%, 9%, and 6%, respectively, of our average enrollment. As of December 31, 2012,2013, we had 16,23513,740 students enrolled in diploma and degree programs and an additional 305104 students enrolled in certificate programs. Our average enrollment for the year ended December 31, 20122013 was 18,08615,009 students in diploma and degree programs and 292315 students in certificate programs, which represented a decrease of 22.3%12.3% from average enrollment in 2012 of 23,276 for 201117,121 students in diploma and degree programs and 220 students in certificate programs. We did not offer certificate programs in 2011.For the year ended December 31, 2013, our revenues were $345.0 million, which represented a decrease of 9.9% from the year ended December 31, 2012. For the year ended December 31, 2012, our revenues were $402.7$382.8 million, which represented a decrease of 18.1%16.2% from the year ended December 31, 2011. For more information relating to our revenues, profits and financial condition, please refer to “Management’s Discussion and Analysis of Financial Condition and Results of Operations” and our consolidated financial statements included in this Annual Report on Form 10-K. For the year ended December 31, 2011, our revenues were $491.8 million, which represented a decrease of 18.7% from the year ended December 31, 2010.
Our schools operate under the Lincoln Technical Institute, Lincoln College of Technology, Lincoln College of New England, and Euphoria Institute of Beauty Arts and Sciences brand names. Most of our campuses serve major metropolitan markets and each typically offers courses in multiple areas of study. Five of our campuses are destination schools, which attract students from across the United States and, in some cases, from abroad. Our other campuses primarily attract students from their local communities and surrounding areas. All of our campuses are nationally or regionally accredited and are eligible to participate in federal financial aid programs by the U.S. Department of Education, or DOE, and applicable state education agencies and accrediting commissions which allow students to apply for and access federal student loans as well as other forms of financial aid.
We believe that we provide our students with the highest quality career-oriented training available for our areas of study in our markets. We offer programs in areas of study that we believe are typically underserved by traditional providers of post-secondary education and for which we believe there exists significant demand among students and employers. Furthermore, we believe our convenient class scheduling, career focused curricula and emphasis on job placement offer our students valuable advantages that have been neglected by the traditional academic sector. By combining substantial hands-on training with traditional classroom-based training led by experienced instructors, we believe we offer our students a unique opportunity to develop practical job skills in many of the key areas of expected job demand. We believe these job skills enable our students to compete effectively for employment opportunities and to pursue on-going salary and career advancement.
Each of our schools is a reporting unit.unit and an operating segment. Our reporting unitsoperating segments have been aggregated into one operatingreportable segment because, in our judgment, the reporting units have similar products, production processes, types of customers, methods of distribution, regulatory environment and economic characteristics.
We are a New Jersey corporation organized in 2003.
AVAILABLE INFORMATION
Our website is www.lincolnedu.com. We make available on this website our Annual Reports on Form 10-K, Quarterly Reports on Form 10-Q, Current Reports on Form 8-K, annual proxy statement on Schedule 14A and amendments to those reports as soon as reasonably practicable after we electronically file or furnish such materials to the Securities and Exchange Commission. You can access this information on our website, free of charge, by clicking on “Investor Relations.” The information contained on or connected to our website is not a part of this Annual Report on Form 10-K.
BUSINESS STRATEGY
Our goal is to strengthen our position as a leading and diversified provider of career-orientedcareer‑oriented post-secondary education by continuing to pursue the following strategy:
Expand Existing Areas of Study and Existing Facilities. We believe we can leverage our operations to expand our program offerings in existing areas of study and expand into new areas of study to capitalize on demand from students and employers in our target markets. Whenever possible, we seek to replicate programs across our campuses. In 2010,2013, we movedintroduced one new program to our Paramus, New Jerseycampuses in Indianapolis, Indiana and Mount Laurel, New Jersey campuses into largerGrand Prairie, Texas. In 2012, we introduced one new program to our facilities and selectively added additional square feet at several other campuses.in Florida. In 2011, we introduced seven new programs to our facilities in Colorado, Kentucky and Massachusetts.
Maximize Utilization of Existing Facilities. We are focused on improving capacity utilization of existing facilities through increased enrollments, and the introduction of new programs.programs and partnerships with industry. In 2012,2013, we introduced one new program.continued to partner with several high schools in New Jersey to provide students with introductory classes in automotive technologies and entered into several partnerships with industry including Chrysler, Raytheon, and BMW. We expect to continue investing in marketing, recruiting and retention resources to increase enrollment.
Expand Geographic Presence. We believe that we can leverage our marketing and recruiting programs by opening additional campuses in selected markets and obtaining greater market penetration. In 2010, we entered a lease for a new school in Cleveland, Ohio, which opened in 2011. We believe we can also increase our student enrollments by entering selected new geographic markets that we believe have significant growth potential and where we can leverage our reputation and operating expertise.
Pursue Strategic Acquisitions. We continue to evaluate acquisition candidates. In evaluating potential acquisitions, we seek to identify schools that provide the potential for program replication at our existing campuses, expand our program and degree offerings, and extend our presence into markets with attractive growth opportunities. In 2012, we purchased Florida Medical Training Institute (“FMTI”) which offers short term certificate programs in the fields of Emergency Medical Technician, Paramedic, EKG/Phlebotomy, Nursing Assistant and Fire Fighter, and Associate of Science Degrees in Emergency Medical Services and Fire Science Technology.
Expand Market. We believe that we can enter new markets and broaden the Lincoln brand by partnering with nationally well-known brands to provide the skills needed to train our nation’s workforce.
PROGRAMS AND AREAS OF STUDY
We structure our program offerings to provide our students with a practical, career-oriented education and position them for attractive entry-level job opportunities in their chosen fields. Our diploma/certificate programs typically take between 22 to 112106 weeks to complete, with tuition ranging from $5,000 to $36,000. Our associate’s degree programs typically take between 48 to 123156 weeks to complete, with tuition ranging from $16,000 to $56,000.$70,000. Our bachelor’s degree programs typically take between 132142 and 284208 weeks to complete, with tuition ranging from $47,000$58,000 to $75,000.$80,000. As of December 31, 2012,2013, all of our schools offer diploma and certificate programs, 1813 of our schools are currently approved to offer associate’s degree programs and two schools are approved to offer bachelor’s degree programs. In order to accommodate the schedules of our students and maximize classroom utilization, at some of our campuses we typically offer courses four to five days a week in three shifts per day and start new classes every month. Other campuses are structured more like a traditional college and start classes every quarter. Also, for those students who do not live near one of our campuses or whose schedules prevent them from attending classes in person, we offer several programs online. We update and expand our programs frequently to reflect the latest technological advances in the field, providing our students with the specific skills and knowledge required in the current marketplace. Classroom instruction combines lectures and demonstrations by our experienced faculty with comprehensive hands-on laboratory exercises in simulated workplace environments.
The following table lists the programs offered as of December 31, 20122013 with the average number of students enrolled in each area of study for the year ended December 31, 2012:2013:
| Programs Offered | |||||||
| Area of Study | Bachelor's Degree | Associate's Degree | Diploma and Certificate | Average Enrollment | Percent of Total Enrollment | ||
| Automotive | - | Collision Repair & Refinishing Service Management, Diesel & Truck Service Management, Automotive Service Management, Maintenance Service Management | Automotive Mechanics, Automotive Technology, Automotive Technology with BMW FastTrack, Automotive Technology with Mopar X-Press, Automotive Technology with High Performance, Collision Repair and Refinishing Technology, Diesel & Truck Mechanics, Diesel & Truck Technology, Heavy Equipment Maintenance Technology, Diesel & Truck Technology with Transport Refrigeration, Diesel & Truck with Automotive Technology, Heavy Equipment and Truck Technology, Motorcycle Technology | 6,299 | 42% | ||
| Health Sciences | - | Medical Assisting Technology, Health Information Administration, Dental Office Management, Child Development, Health Information Technology, Medical Office Management, Mortuary Science, Nuclear Medicine Technology, Occupational Therapy Assistant, Dental Hygiene, Dental Administrative Assistant, Surgical Technology, Advanced Medical Coding & Billing, Nursing | Medical Office Assistant, Medical Assistant, Pharmacy Technician, Medical Coding & Billing, Dental Assistant, Licensed Practical Nursing, Phlebotomy, Medical Assistant w/Basic X-ray, Basic X-Ray Technician, Surgical Technologist, Paramedic | 4,568 | 30% | ||
| Skilled Trades | - | Electronic Engineering Technology, HVAC, Electronics Systems Service Management | Electrical Technology, Electronics Systems Technician, HVAC, Welding Technology, CNC | 2,009 | 13% | ||
| Programs Offered | ||||||||||
| Area of Study | Bachelor's Degree | Associate's Degree | Diploma and Certificate | Average Enrollment | Percent of Total Enrollment | |||||
| Automotive | - | Automotive Technology, Master Certified Auto Service Management, Collision Repair & Refinishing Service Management, Diesel Technology, Master Certified Diesel & Truck Service Management | Automotive Mechanics, Master Certified Automotive Technology, Master Certified Automotive Technology w/High Performance, Collision Repair & Refinishing Technology, Diesel & Truck Mechanics, Diesel & Truck Technology, Master Certified Diesel & Truck Technology, Motorcycle Technology | 6,819 | 38% | |||||
| Health Sciences | - | Medical Assisting Technology, Health Information Administration, Dental Office Management, Child Development, Health Information Technology, Medical Office Management, Mortuary Science, Nuclear Medicine Technology, Occupational Therapy Assistant, Dental Hygiene, Dental Administrative Assistant, Surgical Technology, Advanced Medical Coding & Billing, Nurse | Medical Office Assistant, Medical Assistant, Pharmacy Technician, Medical Coding & Billing, Dental Assistant, Licensed Practical Nursing, Phlebotomy, Medical Assistant w/Basic X-ray, Basic X-Ray Technician, Surgical Technologist, Paramedic | 6,322 | 35% | |||||
| Skilled Trades | - | Electronic Engineering Technology, HVAC, Electronics Systems Service Management | Electrical Technology, Electronics Systems Technician, HVAC, Welding Technology | 2,173 | 12% | |||||
| Programs Offered (Continued) | |||||||
| Area of Study | Bachelor's Degree | Associate's Degree | Diploma or Certificate | Average Enrollment | Percent of Total Enrollment | ||
| Hospitality Services | Culinary Arts | Culinary Arts, Salon Management, International Baking and Pastry | Culinary Arts, Cosmetology, Aesthetics, Therapeutic Massage & Bodywork Technician, Italian Culinary Arts, International Baking and Pastry | 1,325 | 9% | ||
| Business and Information Technology | Business Management, Criminal Justice, Funeral Service Management | PC Systems & Networking Technology, Business Administration, Criminal Justice, Business Management, Broadcasting and Communications, Paralegal, Computer Networking and Security, Accounting | PC Support Technician, Criminal Justice, Business Office Technology, Computer Networking and Security | 808 | 6% | ||
| Total: | 15,009 | 100% | |||||
| Programs Offered (Continued) | ||||||||||
| Area of Study | Bachelor's Degree | Associate's Degree | Diploma or Certificate | Average Enrollment | Percent of Total Enrollment | |||||
| Hospitality Services | Culinary Arts | Culinary Arts, Salon Management, International Baking and Pastry | Culinary Arts, Cosmetology, Aesthetics, Therapeutic Massage & Bodywork Technician, Italian Culinary Arts, International Baking and Pastry | 1,614 | 9% | |||||
| Business and Information Technology | Business Management, Criminal Justice, Funeral Service Management | PC Systems & Networking Technology, Business Administration, Criminal Justice, Business Management, Broadcasting and Communications, Paralegal, Computer Networking and Security, Accounting | PC Support Technician, Criminal Justice, Business Office Technology, Computer Networking and Security | 1,158 | 6% | |||||
| Total: | 18,086 | 100% | ||||||||
Automotive Technology. Automotive technology representswas our largest area of study, with 38%42% of our total average student enrollment for the year ended December 31, 2012.2013. Our automotive technology programs are 2428 to 123106 weeks in length, with tuition rates of $10,000$11,000 to $35,000.$36,000. We believe we are a leading provider of automotive technology education in each of our local markets. Graduates of our programs are qualified to obtain entry level employment ranging from positions as technicians and mechanics to various apprentice level positions. Our graduates are employed by a wide variety of companies, ranging from automotive and diesel dealers, to independent auto body paint and repair shops to trucking and construction companies.
As of December 31, 2012,2013, 13 campuses offered programs in automotive technology and most of these campuses offer other technical programs. Our campuses in East Windsor, Connecticut; Nashville, Tennessee; Grand Prairie, Texas; Indianapolis, Indiana; and Denver, Colorado are destination campuses, attracting students throughout the United States and, in some cases, from abroad.
Health Sciences. For the year ended December 31, 2012,2013, health sciences was our second largest area of study, representing 35%30% of our total average student enrollment. Our health science programs are 24 to 104208 weeks in length, with tuition rates of $5,000 to $56,000.$76,000. Graduates of our programs are qualified to obtain positions such as licensed practical nurse, registered nurse, dental assistant, medical assistant, medical administrative assistant, EKG technician, claims examiner and pharmacy technician. Our graduates are employed by a wide variety of employers, including hospitals, laboratories, insurance companies, doctors' offices and pharmacies. Our practical nursing, medical assistant and medical administrative assistant programs are our largest health science programs. As of December 31, 2012,2013, we offered health science programs at 2318 of our campuses and five training sites.
Skilled Trades. For the year ended December 31, 2012, 12%2013, 13% of our total average student enrollment was in our skilled trades programs. Our skilled trades programs are 3536 to 9798 weeks in length, with tuition rates of $17,500$16,500 to $29,000.$30,000. Our skilled trades programs include electrical, heating, and air conditioning repair, welding, computerized numerical control and electronic system technician. Graduates of our programs are qualified to obtain entry level employment positions such as electrician, cable installer, welder, wiring and heating, ventilating and air conditioning, or HVAC installer. Our graduates are employed by a wide variety of employers, including residential and commercial construction, telecommunications installation companies and architectural firms. As of December 31, 2012,2013, we offered skilled trades programs at 14campuses.14 campuses.
Hospitality Services. For the year ended December 31, 2012,2013, 9% of our total average student enrollment was in our hospitality services programs. Our hospitality services programs are 22 to 132142 weeks in length, with tuition rates of $12,000$13,000 to $46,000.$58,000. Our hospitality programs include culinary, therapeutic massage, cosmetology and aesthetics. Graduates work in salons, spas or cruise ships or are self-employed. We offer massage programs at fivethree campuses and cosmetology programs at five campuses. Our culinary graduates are employed by restaurants, hotels, cruise ships and bakeries. As of December 31, 2012,2013, we offered culinary programs at fivefour campuses.
Business and Information Technology. For the year ended December 31, 2012,2013, 6% of our total average student enrollment was in our business and information technology programs, which include our diploma and degree criminal justice programs. Our business and information technology programs are 30 to 284208 weeks in length, with tuition rates of $13,000 to $75,000.$80,000. We have focused our current information technology, or IT, program offerings on those that are most in demand, such as our personal computer, or PC, systems technician, computer networking and security and business administration programs. Our IT and business graduates work in entry level positions for both small and large corporations. Our criminal justice graduates work in the security industry and for various government agencies and departments. As of December 31, 2012,2013, we offered these programs at 1913 of our campuses.
MARKETING AND STUDENT RECRUITMENT
We utilize a variety of marketing and recruiting methods to attract students and increase enrollment. Our marketing and recruiting efforts are targeted at potential students who are entering the workforce, or who are underemployed or unemployed and require additional training to enter or re-enter the workforce.
Marketing and Advertising. Our marketing program utilizes integrated advertising such as the Internet, television, and various print media, direct mail, and event marketing campaigns. These campaigns are enhanced by student and alumni referrals. Internet lead generation is our most successful medium, built upon successful search engine optimization and specific keywords. Our website inquiries incorporate integrated campaigns that direct potential students to the Lincoln website where they may request additional information on a program of interest. Our internal systems enable us to closely monitor and track the effectiveness of each advertisement on a daily or weekly basis and make adjustments accordingly to enhance efficiency and limit our student acquisition costs.
Referrals. Referrals from current students, high school counselors and satisfied graduates and their employers have historically represented 18%17% to 25% of our new enrollments. Our school administrators actively work with our current students to encourage them to recommend our programs to potential students. We continue to build strong relationships with high school guidance counselors and instructors by offering annual seminars at our training facilities to further educate these individuals on the strengths of our programs. Graduates who have gone on to enjoy success in the workforce frequently recommend our programs, as do employers who are pleased with the performance of our graduates whom they have hired.
Recruiting. Our recruiting efforts are conducted by a group of approximately 425366 field and campus-based representatives who meet directly with potential students during presentations conducted at high schools, in the potential student's home or during a visit to one of our campuses.
Field-Based Recruiting. Our field-based recruiting representatives make presentations at high schools to attract students to both our local and destination campuses. Our field-based representatives also visit directly with potential students in their homes. During 2012,2013, we recruited approximately 21%25% of our students directly out of high school.
Campus-Inquiries. When a potential student contacts us as a result of our marketing and outreach efforts, an admissions representative contacts the potential student to follow up on an individual basis. The admissions representative provides information on the programs of interest available at the campus location selected by the potential student and offers an appointment to visit the school and tour the school's facilities.
STUDENT ADMISSIONS, ENROLLMENT AND RETENTION
Admissions. In order to attend our schools, students must complete an application and pass an entrance assessment. While each of our programs has different admissions criteria, we screen all applications and counsel the students on the most appropriate program to increase the likelihood that our students complete the requisite coursework and obtain and sustain employment following graduation.
Enrollment. We enroll students continuously throughout the year, with our largest classes enrolling in late summer or early fall following high school graduation. We had 16,23513,740 students enrolled in diploma and degree programs and an additional 305104 students enrolled in certificate programs as of December 31, 2013 and our average enrollment for the year ended December 31, 2013 was 15,009 students in diploma and degree programs and 315 in certificate programs, a decrease of 12.3% in average enrollment from December 31, 2012. We had 15,516 students enrolled in diploma and degree programs and 160 in certificate programs as of December 31, 2012 and our average enrollment for the year ended December 31, 2012 was 18,08617,121 students in diploma and degree programs and 292220 in certificate programs, a decrease of 22.3%20.0% in average enrollment from December 31, 2011. We did not offer certificate programs in 2011. We had 18,585 students enrolled as of December 31, 2011 and our average enrollment for the year ended December 31, 2011 was 23,276 students, a decrease of 21.7% from December 31, 2010.
Retention. To maximize student retention, the staff at each school is trained to recognize the early warning signs of a potential drop and to assist and advise students on academic, financial, employment and personal matters. We monitor our retention rates by instructor, course, program and school. When we notice that a particular instructor or program is experiencing a higher than normal dropout rate, we quickly seek to determine the cause of the problem and attempt to correct it. When we identify that a student is having trouble academically, we offer tutoring.
JOB PLACEMENT
We believe that assisting our graduates in securing employment after completing their program of study is critical to our ability to attract high quality students. In addition, we believe that high job placement rates result in low student loan default rates, an important requirement for continued participation in Title IV Programs. See "Regulatory Environment—Regulation of Federal Student Financial Aid Programs." Accordingly, we dedicate significant resources to maintaining an effective graduate placement program. Our non-destination schools work closely with local employers to ensure that we are training students with skills that employers need. Each school has an advisory council made up of local employers who provide us with direct feedback on how well we are preparing our students to succeed in the workplace. This enables us to tailor our programs to the market. The placement staff in each of our destination schools maintains databases of potential employers throughout the country, allowing us to more effectively assist our graduates in securing employment in their career field upon graduation. Throughout the year, we hold numerous job fairs at our facilities where we provide the opportunity for our students to meet and interact with potential employers. We also have internship programs that provide our students with opportunities to work with employers prior to graduation. For example, some of the students in our automotive programs have the opportunity to complete a portion of their hands-on training in an actual work environment. In addition, some of our allied health students are required to participate in an externship program during which they work in the field as part of their career training. We also assist students with resume writing, interviewing and other job search skills.
FACULTY AND EMPLOYEES
We hire our faculty in accordance with established criteria, including relevant work experience, educational background and accreditation and state regulatory standards. We require meaningful industry experience of our teaching staff in order to maintain the quality of instruction in all of our programs and to address current and industry-specific issues in our course content. In addition, we provide intensive instructional training and continuing education, including quarterly instructional development seminars, annual reviews, technical upgrade training, faculty development plans and weekly staff meetings.
The staff of each school typically includes a school director, a director of graduate placement, an education director, a director of student services, a financial-aid director, an accounting manager, a director of admissions and instructors, all of whom are industry professionals with experience in our areas of study.
As of December 31, 2012,2013, we had approximately 3,5703,085 employees, including 815676 full-time faculty and 758676 part-time instructors. At fivesix of our campuses, the teaching professionals are represented by unions. These employees are covered by collective bargaining agreements that expire between 2014 and 2017. We believe that we have good relationships with these unions and our employees.
COMPETITION
The for-profit, post-secondary education industry is highly competitive and highly fragmented, with no one provider controlling significant market share. Direct competition between career-oriented schools and traditional four-year colleges or universities is limited. Thus, our main competitors are other for-profit, career-oriented schools, as well as public and private two-year junior and community colleges. Competition is generally based on location, the type of programs offered, the quality of instruction, placement rates, reputation, recruiting and tuition rates. Public institutions are generally able to charge lower tuition than our schools, due in part to government subsidies and other financial sources not available to for-profit schools. In addition, some of our other competitors have a more extensive network of schools and campuses than we do, which enables them to recruit students more efficiently from a wider geographic area. Nevertheless, we believe that we are able to compete effectively in our local markets because of the diversity of our program offerings, quality of instruction, the strength of our brands, our reputation and our graduates’ success in securing employment after completing their program of study.
We compete with other institutions that are eligible to receive Title IV funding. This includes four-year, not-for-profit public and private colleges and universities, community colleges and all for-profit institutions whether they are four years, two years or less. Our competition differs in each market depending on the curriculum that we offer. For example, a school offering automotive, allied health and skilled trades programs will have a different group of competitors than a school offering allied health, business/IT and skilled trades. Also, because schools can add new programs within six to twelve months, competition can emerge relatively quickly. Moreover, with the introduction of online learning, the number of competitors in each market has increased because students can now attend classes from an online institution.
Our primary competition for students are community colleges and other career schools, both for-profit and not-for-profit. We focus on programs that are in high demand. We compete against community colleges by seeking to offer more frequent start dates, more flexible hours, better instructional resources, more hands on training, shorter program length and greater assistance with job placement. We compete against the other career schools by seeking to offer a higher quality of education, higher quality instructional equipment and a better overall value. On average, each of our schools has at least three direct competitors and at least a dozen indirect competitors. As we continue to add courses and degree programs, our competitors within a given market increase.
ENVIRONMENTAL MATTERS
We use hazardous materials at our training facilities and campuses, and generate small quantities of waste such as used oil, antifreeze, paint and car batteries. As a result, our facilities and operations are subject to a variety of environmental laws and regulations governing, among other things, the use, storage and disposal of solid and hazardous substances and waste, and the clean-up of contamination at our facilities or off-site locations to which we send or have sent waste for disposal. We are also required to obtain permits for our air emissions and to meet operational and maintenance requirements. In the event we do not maintain compliance with any of these laws and regulations, or are responsible for a spill or release of hazardous materials, we could incur significant costs for clean-up, damages, and fines or penalties. Climate change has not had and is not expected to have a significant effect on our operations.
REGULATORY ENVIRONMENT
Students attending our schools finance their education through a combination of family contributions, individual resources, private loans and federal financial aid programs. Each of our schools participates in the federal programs of student financial aid authorized under Title IV of the Higher Education Act of 1965, as amended (“Title IV Programs”), which are administered by the DOE. For the year ended December 31, 2012,2013, approximately 81%80% (calculated based on cash receipts) of our revenues were derived from the Title IV Programs. Students obtain access to federal student financial aid through a DOE prescribed application and eligibility certification process. Student financial aid funds are generally made available to students at prescribed intervals throughout their predetermined expected length of study. Students typically use the funds received from the federal financial aid programs to pay their tuition and fees and, in some cases, for living expenses or other costs of attendance.
In connection with the students' receipt of federal financial aid under the Title IV Programs, our schools are subject to extensive regulation by governmental agencies and licensing and accrediting bodies. In particular, the Higher Education Act of 1965, as amended, and the regulations issued thereafter by the DOE, subject us to significant regulatory scrutiny in the form of numerous standards that each of our schools must satisfy in order to participate in the Title IV Programs. To participate in the Title IV Programs, a school must be authorized to offer its programs of instruction by the applicable state education agencies in the states in which it is physically located, be accredited by an accrediting commission recognized by the DOE and be certified as an eligible institution by the DOE. The DOE defines an eligible institution to consist of both a main campus and its additional locations, if any. Each of our schools is either a main campus or an additional location of a main campus. Each of our schools is subject to extensive regulatory requirements imposed by state education agencies, accrediting commissions, and the DOE. Because the DOE periodically revises its regulations and changes its interpretations of existing laws and regulations, we cannot predict with certainty how Title IV Program requirements will be applied in all circumstances. Our schools also participate in other federal and state financial aid programs that assist students in paying the cost of their education.
State Authorization
Each of our schools must be authorized by the applicable education agencies in the states in which the school is physically located, and in some cases other states, in order to operate and to grant degrees, diplomas or certificates to its students. Some states have sought to assert jurisdiction over online educational institutions that offer educational services to residents in the state or to institutions that advertise or recruit in the state, notwithstanding the lack of a physical location in that state. State regulatory requirements for online education vary among the states, are not well developed in many states, are imprecise or unclear in some states, and are subject to change. State agency authorization is also required in each state in which a school is physically located in order for the school to become and remain eligible to participate in Title IV Programs. If we are found not to be in compliance with the applicable state regulation and a state seeks to restrict one or more of our business activities within its boundaries, we may not be able to recruit or enroll students in that state and may have to stop providing services in that state, which could have a material adverse effect on our business and results of operations. Currently, each of our schools is authorized by the applicable state education agencies in the states in which the school is physically located and in which it recruits students.
Our schools are subject to extensive, ongoing regulation by each of these states. State laws typically establish standards for instruction, curriculum, qualifications of faculty, location and nature of facilities and equipment, administrative procedures, marketing, recruiting, financial operations, student outcomes and other operational matters. State laws and regulations may limit our ability to offer educational programs and to award degrees, diplomas or certificates. Some states prescribe standards of financial responsibility that are different from, and in certain cases more stringent than, those prescribed by the DOE. Some states require schools to post a surety bond. We have posted surety bonds on behalf of our schools and education representatives with multiple states in a total amount of approximately $14.9$16.9 million.
The DOE published new regulations that took effect on July 1, 2011 (the “2011 DOE Rules”), and that expand the requirements for an institution to be considered legally authorized in the state in which it is physically located for Title IV purposes. In some cases, the regulations will require states to revise their current requirements and/or to license schools in order for institutions to be deemed legally authorized in those states and, in turn, to participate in Title IV Programs. If the states do not amend their requirements where necessary and if schools do not receive approvals where necessary that comply with these new requirements, then the institution could be deemed to lack the state authorization necessary to participate in Title IV Programs. The DOE stated when it published the final regulations that it will not publish a list of states that meet, or fail to meet, the requirements, and it is uncertain how the DOE will interpret these requirements in each state.
In addition, the 2011 DOE Rules also requirerequired institutions offering postsecondary education through distance education, such as online programs, to students in a state in which the institution is not physically located or in which it is otherwise subject to state jurisdiction as determined by the state to meet any state requirements for it to be legally offering postsecondary distance education in that state. The regulations requirerequired an institution to document upon request by the DOE that it has the applicable state approval. As a result, some of our schools and distance education programs may be required to obtain additional or revised state authorizations. State regulatory requirements for online education vary among the states, are not well developed in many states, are imprecise or unclear in some states, and are subject to change. Any failure to comply with state requirements under the new DOE rules could result in our inability to enroll students or receive Title IV funds for students in those states.
In June 2012, the United States Court of Appeals for the District of Columbia vacated the 2011 DOE Rules with respect to state authorization of distance education. The Court affirmed an order of a Federal District Court that vacated the portion of the state authorization regulation that requires an institution to meet state requirements in a state in which it has distance education students, but in which it is not physically located or otherwise subject to state jurisdiction. The DOE issued a Dear Colleague Letter acknowledging the decision of the Court of Appeals and stating that the DOE would not enforce the requirements of the regulation and commenting that institutions continue to be responsible for complying with all state laws as they relate to distance education. However, the DOE has announced its intent to consider new regulations regarding state authorization for programs offered through distance education beginning with a negotiated rulemaking committee convening in February 2014. See “– Regulatory Environment – DOE Development of New Regulations.”
If any of our schools fail to comply with state licensing requirements, they are subject to the loss of state licensure or authorization. If any one of our schools lost its authorization from the education agency of the state in which the school is located, that school and its related main campus and/or additional locations would lose their eligibility to participate in Title IV Programs, be unable to offer their programs and we could be forced to close those schools. If one of our schools lost its state authorization from a state other than the state in which the school is located, the school would not be able to recruit students or to operate in that state.
Due to state budget constraints in certain states in which we operate, it is possible that those states may continue to reduce the number of employees in, or curtail the operations of, the state education agencies that oversee our schools. A delay or refusal by any state education agency in approving any changes in our operations that require state approval could prevent us from making such changes or could delay our ability to make such changes. States periodically change their laws and regulations applicable to our schools and such changes could require us to change our practices and could have a material adverse effect on our business and results of operations.
Accreditation
Accreditation is a non-governmental process through which a school submits to ongoing qualitative and quantitative review by an organization of peer institutions. Accrediting commissions primarily examine the academic quality of the school's instructional programs, and a grant of accreditation is generally viewed as confirmation that the school's programs meet generally accepted academic standards. Accrediting commissions also review the administrative and financial operations of the schools they accredit to ensure that each school has the resources necessary to perform its educational mission.
Accreditation by an accrediting commission recognized by the DOE is required for an institution to be certified to participate in Title IV Programs. In order to be recognized by the DOE, accrediting commissions must adopt specific standards for their review of educational institutions. As of December 31, 2012,2013, 17 of our campuses are accredited by the Accrediting Commission of Career Schools and Colleges, or ACCSC; 19 of our campuses are accredited by the Accrediting Council for Independent Colleges and Schools, or ACICS; one of our campuses is accredited by the New England Association of Schools and Colleges of Technology, or NEASC; and threeone of our campuses areis accredited by the Accrediting Bureau of Health Education Schools, or ABHES. All of these accrediting commissions are recognized by the DOE. The following is a list of the dates on which each campus was accredited by its accrediting commission, the date by which its accreditation must be renewed and the type of accreditation.
Accrediting Commission of Career Schools and Colleges Reaccreditation Dates
| School | Last Accreditation Letter | Next Accreditation | Type of Accreditation | ||||
Philadelphia, PA2 | May 1, | National | |||||
Union, NJ1 | December 9, 2009 | February 1, 20143 | National | ||||
Mahwah, NJ1 | March 10, 2010 | August 1, 2014 | National | ||||
Melrose Park, IL2 | June 2, 2010 | November 1, 2014 | National | ||||
Denver, CO1 | March 9, 2011 | February 1, 2016 | National | ||||
| Columbia, MD | March 7, 2012 | February 1, 2017 | National | ||||
Grand Prairie, TX | December 7, 2011 | August 1, 2016 | National | ||||
Allentown, PA1 | March 7, 2012 | January 1, 2017 | National | ||||
Nashville, TN | November 30, 2012 | May 1, 2017 | National | ||||
| Indianapolis, IN | November 30, 2012 | November 1, 2017 | National | ||||
| New Britain, CT | September 5, 2008 | January 1, 2013 | National | ||||
Shelton, CT2 | December 9, 2009 | September 1, 20133 | National | ||||
Hamden, CT2 | June 4, 2013 | July 1, | National | ||||
Queens, NY1 | June 4, 2013 | June 1, | National | ||||
| Hartford, CT | June 2, 2010 | November 1, 2014 | National | ||||
East Windsor, CT2 | December 4, 2013 | February 1, | National | ||||
South Plainfield, NJ1 | September 11, 2009 | August 1, 2014 | National |
| 1 | Branch campus of main campus in |
| 2 | Branch campus of main campus in New Britain, CT |
| 3 |
| Campus |
Accrediting Council for Independent Colleges and Schools Reaccreditation Dates
| School | Last Accreditation Letter | Next Accreditation | Type of Accreditation | ||||
Brockton, MA | December 16, 2008 | December 31, 2014 | National | ||||
Lincoln, RI1 | December 16, 2008 | December 31, 2014 | National | ||||
Lowell, MA | December 16, 2008 | December 31, 2014 | National | ||||
Somerville, MA | December 16, 2008 | December 31, 2014 | National | ||||
Philadelphia (Center City), PA1 | April | 26, 2013 | December 31, | National | |||
| Edison, NJ | April | 26, 2013 | December 31, | National | |||
Marietta, GA | December 16, 2008 | December 31, 2014 | National | ||||
Moorestown, NJ1 | April | 26, 2013 | December 31, | National | |||
Paramus, NJ1 | April | 26, 2013 | December 31, | National | |||
Philadelphia (Northeast), PA1 | April | 26, 2013 | |||||
| December 31, | National | ||||||
| West Palm Beach, FL1 | April 16, 2008 | December 31, 2014 | National | ||||
Las Vegas (Summerlin), NV | December 16, 2008 | December 31, 2014 | National | ||||
Henderson (Green Valley), NV | December 16, 2008 | December 31, 2014 | National | ||||
Las Vegas (Aliante), NV | April 8, 2009 | December 31, 2014 | National | ||||
March 12, 20132 | National | ||||||
Jacksonville, FL 1 | March 12, 20132 | National | |||||
Tampa, FL 1 | March 12, 20132 | National | |||||
Miami, FL 1 | March 12, 20132 | National | |||||
Coral Springs, FL 1 | March 12, 20132 | National |
| 1 | Branch campus of main campus in Edison, NJ |
| 2 |
Campus accreditation. |
New England Association of Schools and Colleges of Technology Reaccreditation Dates
| School | Last Accreditation Letter | Comprehensive Evaluation | Type of Accreditation | |||
| Southington, CT | June 29, 2012 | Fall 2017 | Regional |
Accrediting Bureau of Health Education Schools Reaccreditation Dates
| School | Last Accreditation Letter | Next Accreditation | Type of Accreditation | |||
| Fern Park, FL | ||||||
| August | ||||||
| National |
If one of our schools fails to comply with accrediting commission requirements, the institution and its main and/or branch campuses are subject to the loss of accreditation or may be placed on probation or a special monitoring or reporting status which, if the noncompliance with accrediting commission requirements is not resolved, could result in loss of accreditation. If any one of our schools loses its accreditation, students attending that school would no longer be eligible to receive Title IV Program funding, and we could be forced to close that school. In January 2013, our Toledo campusOur school in Fern Park, Florida received a requestletter from ABHES in February 2014, further to a notification first received in August 2013, directing the school to show cause why its accreditation should not be withdrawn. We are preparing a response to ABHES and expect to submit our response by the due date of May 1, 2014. See “– Regulatory Environment – Compliance with Regulatory Standards and Effect of Regulatory Violations.”
Programmatic accreditation is the process through which specific programs are reviewed and approved by industry and program-specific accrediting entities. Although programmatic accreditation is not generally necessary for additional placement data from the accrediting commission. As a result, the Toledo campus willTitle IV eligibility, such accreditation may be required to receive approval from the accrediting commissionallow students to sit for certain licensure exams or to work in ordera particular profession or career or to submit any new program application.meet other requirements. Failure to obtain or maintain such programmatic accreditation may lead to a decline in enrollments in such programs.
Nature of Federal and State Support for Post-Secondary Education
The federal government provides a substantial part of the support for post-secondary education through Title IV Programs, in the form of grants and loans to students who can use those funds at any institution that has been certified as eligible by the DOE. Most aid under Title IV Programs is awarded on the basis of financial need, generally defined as the difference between the cost of attending the institution and the expected amount a student and his or her family can reasonably contribute to that cost. All recipients of Title IV Program funds must maintain a satisfactory grade point average and progress in a timely manner toward completion of their program of study. In addition, each school must ensure that Title IV Program funds are properly accounted for and disbursed in the correct amounts to eligible students.
Students at our schools received grants and loans to fund their education under the following Title IV Programs: (1) the Federal Direct Loan, or FDL, Program, (2) the Federal Pell Grant, or Pell, program, (3) the Federal Supplemental Educational Opportunity Grant program, and (4) the Federal Perkins Loan, or Perkins, program.
Federal Direct Loan Program. The lender under this program is the DOE rather than a bank or other lending institution. For the year ended December 31, 2012,2013, we derived approximately 57%55% of our Title IV revenues (calculated based on cash receipts) from the FDL Program.
Pell. Under the Pell program, the DOE makes grants to students who demonstrate the greatest financial need. For the year ended December 31, 2012,2013, we derived approximately 22%21% of our revenues (calculated based on cash receipts) from the Pell program.
Federal Supplemental Educational Opportunity Grant. Under the Federal Supplemental Educational Opportunity Grant program, the DOE issues grants which are designed to supplement Pell grants for students with the greatest financial needs. An institution is required to make a 25% matching contribution for all funds received from the DOE under this program. For the year ended December 31, 2012,2013, we received 1% of our revenues (calculated based on cash receipts) from the Federal Supplemental Educational Opportunity Grant program.
Perkins. Perkins loans are made from a revolving institutional account, 75% of which is funded by the DOE and the remainder by the school receiving the funds. Each school is responsible for collecting payments on Perkins loans from its former students and lending those funds to currently enrolled students. Defaults by students on their Perkins loans reduce the amount of funds available in the applicable school's revolving account to make loans to additional students, but the school does not have any obligation to guarantee the loans or repay the defaulted amounts. For the year ended December 31, 2012,2013, we derived less than 1% of our revenues (calculated based on cash receipts) from the Perkins program.
Other Financial Assistance Programs
Some of our students receive financial aid from federal sources other than Title IV Programs, such as programs administered by the U.S. Department of Veterans Affairs and under the Workforce Investment Act. In addition, some states also provide financial aid to our students in the form of grants, loans or scholarships. The eligibility requirements for state financial aid and these other federal aid programs vary among the funding agencies and by program. States that provide financial aid to our students are facing significant budgetary constraints. Some states have reduced the level of state financial aid for our students. Due to state budgetary shortfalls and constraints in certain states in which we operate, we believe that the overall level of state financial aid for our students is likely to continue to decrease in the near term, but we cannot predict how significant any such reductions will be or how long they will last. Federal budgetary shortfalls and constraints, or decisions by federal lawmakers to limit or prohibit access by our institutions or their students to federal financial aid, could result in a decrease in the level of federal financial aid for our students.
In addition to Title IV and other government-administered programs, all of our schools participate in alternative loan programs for their students. Alternative loans fill the gap between what the student receives from all financial aid sources and what the student may need to cover the full cost of their education. Students or their parents can apply to a number of different lenders for this funding at current market interest rates.
Regulation of Federal Student Financial Aid Programs
To participate in Title IV Programs, an institution must be authorized to offer its programs by the relevant state education agencies in the state in which it is physically located, be accredited by an accrediting commission recognized by the DOE and be certified as eligible by the DOE. The DOE will certify an institution to participate in Title IV Programs only after reviewing and approving an institution’s application to participate in the Title IV Programs. The DOE defines an institution to consist of both a main campus and its additional locations, if any. Under this definition, for DOE purposes, we had the following 147 institutions as of December 31, 2012,2013, collectively consisting of 147 main campuses and 2426 additional locations:
| Brand | Main Campus(es) | Additional Location(s) | |||||
| Lincoln Technical Institute | |||||||
| Edison, NJ | Moorestown, NJ | ||||||
| Paramus, NJ | |||||||
| Philadelphia, PA (Center City) | |||||||
| Philadelphia, PA (Northeast) | |||||||
Somerville, MA 5 | |||||||
Lowell, MA5 | |||||||
Brockton, MA 5 | |||||||
Lincoln, RI 5 | |||||||
Marietta, GA 1,5 | |||||||
West Palm Beach, FL 1,5 | |||||||
Henderson, NV (Green Valley)2, 5 | |||||||
Las Vegas, NV (Summerlin)2, 5 | |||||||
Las Vegas, NV (Aliante)2, 5 | |||||||
| Hartford, CT | |||||||
| New Britain, CT | Shelton, CT | ||||||
| Hamden, CT | |||||||
| Philadelphia, PA | |||||||
| East Windsor, CT | |||||||
Melrose Park, IL 1 | |||||||
| Fern Park, FL | |||||||
| Lincoln College of Technology | Indianapolis, IN | ||||||
| Grand Prairie, TX | |||||||
| Nashville, TN | |||||||
Denver, CO 4 | |||||||
Union, NJ 3,4 | |||||||
Mahwah, NJ 3,4 | |||||||
Queens, NY 3,4 | |||||||
Allentown, PA 3,4 | |||||||
South Plainfield, NJ 3,4 | |||||||
| Columbia, MD | |||||||
| Lincoln College of New England | Southington, CT |
| 1 | This campus operates |
| 2 |
| 3 | This campus operates as Lincoln Technical Institute. |
| 4 | On |
On December |
The DOE typically provides provisional certification to an institution following a change in ownership resulting in a change of control and also may provisionally certify an institution for other reasons, including, but not limited to, noncompliance with certain standards of administrative capability and financial responsibility. Two of our seven institutions (Edison and Indianapolis) are provisionally certified based on the existence of pending program reviews with DOE. An institution that is provisionally certified receives fewer due process rights than those received by other institutions in the event the DOE takes certain adverse actions against the institution, is required to obtain prior DOE approvals of new campuses and educational programs, and may be subject to heightened scrutiny by the DOE. However, provisional certification does not otherwise limit an institution’s access to Title IV Program funds.
The DOE, accrediting commissions and state education agencies have responsibilities for overseeing compliance with Title IV Program requirements. As a result, each of our schools is subject to detailed oversight and review, and must comply with a complex framework of laws and regulations. Because the DOE periodically revises its regulations and changes its interpretation of existing laws and regulations, we cannot predict with certainty how the Title IV Program requirements will be applied in all circumstances.
Significant factors relating to Title IV Programs that could adversely affect us include the following:
Congressional Action. Political and budgetary concerns significantly affect Title IV Programs. Congress periodically revises the Higher Education Act of 1965, as amended (“HEA”) and other laws governing Title IV programs. On August 14, 2008, the Higher Education Opportunity Act, Public Law 110-315, reauthorized the Title IV HEA programs through at least September 30, 2014. The HEA reauthorization among other things revised the 90/10 Rule, as described below, revised the calculation of an institution's cohort default rate, required additional disclosures and certifications with respect to non-Title IV alternative loans, prohibited certain activities or relations between lenders and schools to discourage preferential treatment of lenders based on factors not in students' best interests, and made other changes. Congress will be considering reauthorization of the Title IV HEA programs, but it is unknown when Congress will begin or complete that process or what changes will be made to the HEA or other laws affecting Federal student aid.
In addition, Congress reviews and determines federal appropriations for Title IV Programs on an annual basis. Congress can also make changes in the laws affecting Title IV Programs in the annual appropriations bills and in other laws it enacts between the HEA reauthorizations. Because a significant percentage of our revenues are derived from Title IV Programs, any action by Congress that significantly reduces Title IV Program funding or the ability of our schools or students to participate in Title IV Programs could reduce our student enrollment and our revenues. Congressional action may also increase our administrative costs and require us to modify our practices in order for our schools to comply fully with Title IV Program requirements.
We cannot predict what, if any, legislation or other actions will be taken or proposed by the HELP Committee or Congress in response to the hearings, the requests for information from our company and other entities,connection with the reauthorization of the HEA or with other activities of the Committee or Congress. Any action by Congress that significantly reduces funding for Title IV Programs or that limits or restricts the ability of our schools, programs, or students to receive funding through those programs, or that imposes new restrictions or constraints upon our business or operations could result in increased administrative costs and decreased profit margin. In addition, current requirements for student or school participation in Title IV programs may change or one or more of the present Title IV programs could be replaced by other programs with materially different student or school eligibility requirements. If we cannot comply with the provisions of the HEA, as they may be amended, or if the cost of such compliance is excessive, or if funding is materially reduced, our revenues or profit margin could be materially adversely affected.
DOE Development of New RegulationsRegulations.. The DOE issued final regulations on October 29, 2010, with a general effective date of July 1, 2011, and which included, but were not limited to: revisions to the incentive compensation rule, a significant expansion of the notice and approval requirements for adding new academic programs and new reporting and disclosure requirements for such programs, the definition of high school diploma for the purpose of establishing institutional eligibility to participate in the Title IV programs and student eligibility to receive Title IV aid, ability to benefit students, misrepresentation of information provided to students and prospective students, incentive compensation, state authorization as a component of institutional eligibility, agreements between institutions of higher education, verification of information included on student aid applications, satisfactory academic progress, monitoring grade point averages, retaking coursework, return of Title IV funds with respect to term-basedterm‑based programs with modules or compressed courses and with respect to taking attendance, and the timeliness and method of disbursements of Title IV funds. The topics covered in these regulations also included a new federal definition of a “credit hour” for federal student aid purposes. The new definition has resulted in changes to the number of credit hours awarded for certain of our educational programs and in changes to the amount of federal student aid available to students enrolled in such programs. The implementation of all of the October 2010 final regulations required us to change certain of our practices to comply with these requirements. The changes to our practices, or our inability to comply with the final regulations on or after their effective date, have had and may continue to have a material adverse effect on our business and results of operations.
On June 13, 2011, the DOE published final regulations in the Federal Register regarding gainful employment that were scheduled to take effect on July 1, 2012 and would apply to all educational programs that are subject to the DOE requirement of preparing students for gainful employment in a recognized occupation. Such educational programs include all of the Title IV-eligible educational programs at each of our institutions. The gainful employment regulations would, among other things, measure each educational program against threshold benchmarks in each of three debt measure categories: (1) an annual loan repayment rate, (2) an annual debt-to-annual earnings ratio, and (3) an annual debt-to-discretionary income ratio. The various formulas are calculated under complex methodologies and definitions outlined in the regulations, and are based on data that may not be readily accessible to institutions. If an educational program fails to achieve threshold rates in all three categories for one federal fiscal year (beginning with debt measures calculated for the 2012 federal fiscal year), the institution must, among other things, disclose the amount by which the program missed the minimum acceptable performance and the institution’s plan to improve the program. If an educational program fails to achieve threshold rates in all three categories in two out of three federal fiscal years, the institution must, among other things, warn students in the failing program that they should expect difficulty in repaying their loans, disclose the options available to the student if the program loses eligibility for Title IV funds, and disclose resources available to research other educational options and compare program costs. If an educational program fails to achieve threshold rates in all three categories in three out of four federal fiscal years, the program loses its Title IV eligibility for a period of at least three years. We have analyzed the available data to assess the potential impact of the gainful employment regulations on each of our institutions and educational programs. Although we have not identified to date any material number of educational programs that we believe are likely to lose eligibility under the regulations’ threshold benchmarks, if the data were to change unfavorably, the regulations could nonetheless have a material adverse effect on our business and operations by requiring us to eliminate certain educational programs, and the disclosure requirements and related components of the regulations could have a material adverse effect on the rate at which students enroll in our programs.
On June 30, 2012, the United States District Court for the District of Columbia issued a decision that vacated most of the gainful employment regulations and remanded those regulations to the DOE for further action. On July 6, 2012, the DOE issued an electronic announcement acknowledging that the Court had vacated the repayment rate metric as well as the debt-to-income gainful employment metrics that would have gone into effect on July 1, 2012. The DOE also noted that institutions are not required to comply with related regulations relating to gainful employment reporting requirements and adding new educational programs, but are required to comply with requirements to disclose certain information about educational programs.
In June 2013, the DOE announced its intention to establish a negotiated rulemaking committee to prepare new gainful employment regulations, which would replace those vacated by the District Court. The Court’s decisionDOE held negotiating sessions with the committee beginning in September 2013 and concluding in December 2013. Before each session, the DOE distributed draft regulatory language marked as a draft for discussion purposes.
The draft regulatory language distributed by the DOE to the committee for discussion purposes in December 2013 requires each educational program to achieve threshold rates in three debt measure categories related to an annual debt to annual earnings ratio, an annual debt to discretionary income ratio, and a program cohort default rate. The various formulas are calculated under complex methodologies and definitions outlined in the draft regulatory language and, in some cases, are based on data that may not be readily accessible to institutions. The draft language outlines various scenarios under which programs could lose Title IV eligibility for failure to achieve threshold rates in one or more measures over certain periods of time ranging from two to four years. The draft language also requires an institution to provide warnings to students in programs which may lose Title IV eligibility at the end of an award year, limit its Title IV enrollment in these programs, and submit a letter of credit or set aside funds to provide borrower relief to students in the event the programs become ineligible. The draft regulatory language contains other provisions that, among other things, include disclosure, reporting and new program approval requirements.
The draft regulatory language discussed above is not final and is subject to appealchange by the DOE. The DOE is expected to publish draft regulations for comment by the public before preparing and could be modified or reversed on appeal. Moreover,publishing final regulations. Accordingly, we cannot predict the DOE could take further action to address the Court’s concerns regarding theultimate content of any new regulations and obtain approval to enforce the regulations,that may emerge from this process or the potential impact of such regulations on us or our institutions. New final DOE could issue new regulations regarding gainful employment. We cannot predict what steps the DOE will take in response to the Court’s decision, how long those stepspublished on or before November 1, 2014 typically would take,have an effective date of July 1, 2015, although it is unknown at this time whether some or whether those steps will result in the DOE being able to enforce the gainful employmentall of these regulations might have an earlier or issuing new regulations.later effective date.
The implementation of new gainful employment regulations, or any other changes the DOE may propose and implement, could require us to eliminate certain educational programs, and could have a material adverse effect on the rate at which students enroll in our programs and on our business and results of operations.
The DOE also announced additional topics that will be considered for new regulations by negotiated rulemaking committees beginning in February 2014. The topics under discussion are expected to include, but may not be limited to, the following: clock to credit hour conversion for programs offered in credit hours that do not transfer into degree programs and are subject to the federal conversion formula for determining credit hours; cash management of funds provided under the Title IV Federal student aid programs, including the handling of the use of debit cards and the handling of credit balances; state authorization for programs offered through distance education or correspondence education; state authorization for foreign locations of institutions located in a state; and the definition of "adverse credit" for borrowers of certain loans. Another committee is scheduled to meet during three sessions beginning in January 2014 and addressing topics related to the scope of campus crime statistics that Title IV participating institutions are required to distribute to current and prospective students and employees.
The DOE intends to use the negotiated rulemaking process during 2014 to develop new regulations on these and potentially other topics. These regulations typically would be subject to a notice and comment period during which the public comments on proposed regulations and the DOE responds to comments and publishes final regulations. We cannot predict the ultimate content of any new regulations that may emerge from this process or the potential impact of such regulations on us or our institutions. New final DOE regulations published on or before November 1, 2014 typically would have an effective date of July 1, 2015, although it is unknown at this time whether some or all of these regulations may have an earlier or later effective date. The implementation of any new regulations by DOE could have a material adverse effect on the rate at which students enroll in our programs and on our business and results of operations.
The "90/10 Rule." Under the HEA reauthorization, a proprietary institution that derives more than 90% of its total revenue from Title IV Programs, or 90/10 Rule percentage, for two consecutive fiscal years becomes immediately ineligible to participate in Title IV Programs and may not reapply for eligibility until the end of at least two fiscal years. An institution with revenues exceeding 90% for a single fiscal year ending after August 14, 2008 will be placed on provisional certification and may be subject to other enforcement measures. If an institution violated the 90/10 Rule and became ineligible to participate in Title IV Programs but continued to disburse Title IV Program funds, the DOE would require the institution to repay all Title IV Program funds received by the institution after the effective date of the loss of eligibility.
We have calculated that, for our 20122013 fiscal year, our institutions' 90/10 Rule percentages ranged from 72.3%69% to 93.0%85%. For 2012 and 2011 none of our existing institutions derived more than 90% of their revenues from Title IV Programs. For 2012, our Dayton institution (consisting of a main campus and eight additional locations) derived 93.0% of its revenues from Title IV programs. It was our only institution with a 90/10 Rule percentage above 90%. If the Dayton institution derives more than 90% of its revenues from Title IV Programs for 2013, this campus and its eight additional locations will become ineligible to participate in Title IV Programs and may not reapply for eligibility until the end of at least two additional fiscal years. For 2010, our Dayton institution (consisting of a main campus and six additional locations) derived 96.9% of its revenues from Title IV programs. It was our only institution with a 90/10 Rule percentage above 90% in 2010. We regularly monitor compliance with this requirement to minimize the risk that any of our institutions would derive more than the maximum percentage of its revenues from Title IV Programs for any fiscal year. Our calculations may be subject to review by the DOE.
Effective July 1, 2008, the annual Stafford loans available for undergraduate students under the Federal Family Education Loan Program, or FFEL program, increased. This increase, coupled with increases in grants from the Pell program and other Title IV loan limits, resulted in some of our schools experiencing an increase in the proportion of revenues they receive from Title IV Programs. The HEA reauthorization provided temporary relief from the impact of the loan limit increases by counting as non-Title IV revenue in the 90/10 Rule calculation amounts received from loans received between July 1, 2008 and June 30, 2011 that are attributable to the increased annual loan limits. The HEA authorization also provided other relief by allowing institutions to include as non-Title IV revenue in its 90/10 Rule calculation the net present value of certain institutional loans subject to certain limitations and conditions. Because of the increases in Title IV student loan limits and grants in recent years, it will be increasingly difficult for us to comply with the 90/10 Rule without increasing tuition prices above the applicable maximums for Title IV student loans and grants, because this is one of the more effective methods of reducing the 90/10 Rule percentage, although this method may not be successful. Moreover, the above-mentioned relief from certain loan limit increases expired for loans received on or after July 1, 2011, and the above-mentioned institutional loan relief expired for institutional loans made on or after July 1, 2012. If Congress or the DOE were to amend the 90/10 Rule to treat other forms of federal financial aid as Title IV revenue for 90/10 purposes, to lower the 90% threshold, or to otherwise change the calculation methodology (each of which has been proposed by some Congressional members in proposed legislation), or to make other changes, those changes could make it more difficult for our institutions to comply with the 90/10 Rule. If any of our institutions loses eligibility to participate in Title IV Programs, that loss would cause an event of default under our credit agreement, and would also adversely affect our students’ access to various government-sponsored student financial aid programs, which could have a material adverse effect on the rate at which our students enroll in our programs and on our business and results of operations.
Student Loan Defaults. The HEA limits participation in Title IV Programs by institutions whose former students defaulted on the repayment of federally guaranteed or funded student loans above a prescribed rate (the “cohort default rate”). The DOE calculates these rates based on the number of students who have defaulted, not the dollar amount of such defaults.
Under the HEA, an institution whose FFEL and Federal Direct Loan, or FDL, cohort default rate is 25% or greater for three consecutive federal fiscal years loses eligibility to participate in the FFEL, FDL, and Pell programs for the remainder of the federal fiscal year in which the DOE determines that such institution has lost its eligibility and for the two subsequent federal fiscal years. An institution whose FFEL and FDL cohort default rate for any single federal fiscal year exceeds 40% loses its eligibility to participate in the FFEL and FDL programs for the remainder of the federal fiscal year in which the DOE determines that such institution has lost its eligibility and for the two subsequent federal fiscal years. If an institution’s cohort default rate equals or exceeds 25% in any of its three most recent fiscal years, the institution may be placed on provisional certification status.
The HEA increased the measuring period for each cohort default rate calculation by one year. Starting with the 2009 cohort, the DOE will calculatecalculates both the current two-year and the new three-year cohort default rates. Beginning with the 2011 three-year cohort default rate, which is expected to be published for each of our institutions in September 2014, the three-year rates will be applied for purposes of measuring compliance with the requirements instead of the two-year rates currently used for those purposes. If the 2011 three-year cohort default rate exceeds 40%, the institution will cease to be eligible to participate in the FDL and Federal Stafford Loan programs for the remainder of the federal fiscal year in which the DOE determines that such institution has lost its eligibility and for the two subsequent federal fiscal years. If the institution’s three-year cohort default rate equals or exceeds 30% (an increase from the current 25% threshold applicable to the two-year cohort default rates) for three consecutive years, beginning with the 2009 cohort, the institution will cease to be eligible to participate in the Pell, FDL, and FFEL programs for the remainder of the federal fiscal year in which the DOE determines that such institution has lost its eligibility and for the two subsequent federal fiscal years.
| Institution | 2010 | 2009 | 2008 | |||||||||
| Union, NJ | 17.6 | % | 19.1 | % | 14.1 | % | ||||||
| Indianapolis, IN | 21.0 | % | 15.8 | % | 11.8 | % | ||||||
| Columbia, MD | 16.7 | % | 17.7 | % | 13.7 | % | ||||||
| Allentown, PA | 13.8 | % | 15.2 | % | 11.2 | % | ||||||
| Edison, NJ | 17.0 | % | 17.4 | % | 17.3 | % | ||||||
| Denver, CO | 23.9 | % | 20.9 | % | 11.7 | % | ||||||
| Lincoln, RI | 21.2 | % | 16.0 | % | 14.0 | % | ||||||
| Dayton, OH | 19.4 | % | 19.6 | % | 20.2 | % | ||||||
| New Britain, CT | 18.3 | % | 12.0 | % | 9.0 | % | ||||||
| West Palm Beach, FL | 16.0 | % | 18.8 | % | 14.2 | % | ||||||
| Southington, CT* | 11.6 | % | 9.4 | % | 18.6 | % | ||||||
| South Plainfied, NJ** | 17.5 | % | 8.1 | % | 4.6 | % | ||||||
| Fern Park, FL** | 15.7 | % | 13.3 | % | 7.0 | % | ||||||
| Hartford, CT** | 14.6 | % | 10.7 | % | 4.1 | % | ||||||
Perkins Loan Program
An institution whose Perkins cohort default rate is 50% or greater for three consecutive federal award years loses eligibility to participate in the Perkins program for the remainder of the federal award year in which the DOE determines that the institution has lost its eligibility and for the two subsequent federal award years. None of our institutions has had a Perkins cohort default rate of 50% or greater for any of the last three federal award years. The DOE also will not provide any additional federal funds to an institution for Perkins loans in any federal award year in which the institution's Perkins cohort default rate is 25% or greater. Such institutions also may be subject to provisional certification. Our Denver, Colorado institution and our New Britain, Connecticut institution areis our only institutionsinstitution currently participating in the Perkins program. The Perkins cohort default rate at our Denver institution was 30.5%40.3% for students scheduled to begin repayment in the 2011-20122012-2013 federal award year. The DOE did not provide any additional Federal Capital Contribution Funds for Perkins loans to the institution. Our Denver institution continues to make loans out of its existing Perkins loan fund. It is provisionally certified because its default rate under the Federal Perkins Loan program that was published most recently prior to the effective date of its program participation agreement exceeded 30.0% and also based on its change in ownership. The Perkins cohort default rate at our New Britain institution was 0% for students scheduled to begin repayment in the 2011-2012 federal award year. The institution is provisionally certified by the DOE as a result of its change in ownership.
Financial Responsibility Standards. All institutions participating in Title IV Programs must satisfy specific standards of financial responsibility. The DOE evaluates institutions for compliance with these standards each year, based on the institution's annual audited financial statements, as well as following a change in ownership resulting in a change of control of the institution.
The most significant financial responsibility measurement is the institution's composite score, which is calculated by the DOE based on three ratios:
| · | The equity ratio, which measures the institution's capital resources, ability to borrow and financial viability; |
| · | The primary reserve ratio, which measures the institution's ability to support current operations from expendable resources; and |
| · | The net income ratio, which measures the institution's ability to operate at a profit. |
The DOE assigns a strength factor to the results of each of these ratios on a scale from negative 1.0 to positive 3.0, with negative 1.0 reflecting financial weakness and positive 3.0 reflecting financial strength. The DOE then assigns a weighting percentage to each ratio and adds the weighted scores for the three ratios together to produce a composite score for the institution. The composite score must be at least 1.5 for the institution to be deemed financially responsible without the need for further oversight. If an institution's composite score is below 1.5, but is at least 1.0, it is in a category denominated by the DOE as "the zone." Under the DOE regulations, institutions that are in the zone are deemed to be financially responsible for a period of up to three years but are required to accept payment of Title IV Program funds under the cash monitoring or reimbursement method of payment and to provide to the DOE timely information regarding various oversight and financial events.
If an institution's composite score is below 1.0, the institution is considered by the DOE to lack financial responsibility. If the DOE determines that an institution does not satisfy the DOE's financial responsibility standards, depending on its composite score and other factors, that institution may establish its financial responsibility on an alternative basis by, among other things:
| · | Posting a letter of credit in an amount equal to at least 50% of the total Title IV Program funds received by the institution during the institution's most recently completed fiscal year; |
| · | Posting a letter of credit in an amount equal to at least 10% of such prior year's Title IV Program funds, accepting provisional certification, complying with additional DOE monitoring requirements and agreeing to receive Title IV Program funds under an arrangement other than the DOE's standard advance funding arrangement; and/or |
| · | Complying with additional DOE monitoring requirements and agreeing to receive Title IV Program funds under an arrangement other than the DOE's standard advance funding arrangement. |
The DOE has evaluated the financial responsibility of our institutions on a consolidated basis. We have submitted to the DOE our audited financial statements for the 2011 and 20102012 fiscal yearsyear reflecting a composite score of 2.1 and 1.8, respectively,1.6, based upon our calculations, and that our schools meet the DOE standards of financial responsibility. For the 20122013 fiscal year, we have calculated our composite score to be 1.6. 1.5. However, this is subject to determination by the DOE once it receives and reviews our audited financial statements for the 20122013 fiscal year.
Return of Title IV Funds. An institution participating in Title IV Programs must calculate the amount of unearned Title IV Program funds that have been disbursed to students who withdraw from their educational programs before completing them, and must return those unearned funds to the DOE or the applicable lending institution in a timely manner, which is generally within 45 days from the date the institution determines that the student has withdrawn.
If an institution is cited in an audit or program review for returning Title IV Program funds late for 5% or more of the students in the audit or program review sample, the institution may be required to post a letter of credit in favor of the DOE in an amount equal to 25% of the total amount of Title IV Program funds that should have been returned for students who withdrew in the institution's previous fiscal year. None of our institutions are currently required to submit a letter of credit to the DOE based on late return of Title IV funds.
School Acquisitions. When a company acquires a school that is eligible to participate in Title IV Programs, that school undergoes a change of ownership resulting in a change of control as defined by the DOE. Upon such a change of control, a school's eligibility to participate in Title IV Programs is generally suspended until it has applied for recertification by the DOE as an eligible school under its new ownership, which requires that the school also re-establish its state authorization and accreditation. The DOE may temporarily and provisionally certify an institution seeking approval of a change of control under certain circumstances while the DOE reviews the institution's application. The time required for the DOE to act on such an application may vary substantially. DOE recertification of an institution following a change of control will be on a provisional basis. Our expansion plans are based, in part, on our ability to acquire additional schools and have them certified by the DOE to participate in Title IV Programs. Our expansion plans take into account the approval requirements of the DOE and the relevant state education agencies and accrediting commissions.
Change of Control. In addition to school acquisitions, other types of transactions can also cause a change of control. The DOE, most state education agencies and our accrediting commissions have standards pertaining to the change of control of schools, but these standards are not uniform. DOE regulations describe some transactions that constitute a change of control, including the transfer of a controlling interest in the voting stock of an institution or the institution's parent corporation. For a publicly traded corporation, DOE regulations provide that a change of control occurs in one of two ways: (a) if a person acquires ownership and control of the corporation so that the corporation is required to file a Current Report on Form 8-K with the Securities and Exchange Commission disclosing the change of control or (b) if the corporation has a shareholder that owns at least 25% of the total outstanding voting stock of the corporation and is the largest shareholder of the corporation, and that shareholder ceases to own at least 25% of such stock or ceases to be the largest shareholder. These standards are subject to interpretation by the DOE. A significant purchase or disposition of our common stock could be determined by the DOE to be a change of control under this standard.
Most of the states and our accrediting commissions include the sale of a controlling interest of common stock in the definition of a change of control although some agencies could determine that the sale or disposition of a smaller interest would result in a change of control. A change of control under the definition of one of these agencies would require the affected school to reaffirm its state authorization or accreditation. Some agencies would require approval prior to a sale or disposition that would result in a change of control in order to maintain authorization or accreditation. The requirements to obtain such reaffirmation from the states and our accrediting commissions vary widely.
A change of control could occur as a result of future transactions in which our company or schools are involved. Some corporate reorganizations and some changes in the board of directors are examples of such transactions. Moreover, the potential adverse effects of a change of control could influence future decisions by us and our stockholders regarding the sale, purchase, transfer, issuance or redemption of our stock. In addition, the adverse regulatory effect of a change of control also could discourage bids for shares of common stock and could have an adverse effect on the market price of our shares.
Opening Additional Schools and Adding Educational Programs. For-profit educational institutions must be authorized by their state education agencies and be fully operational for two years before applying to the DOE to participate in Title IV Programs. However, an institution that is certified to participate in Title IV Programs may establish an additional location and apply to participate in Title IV Programs at that location without reference to the two-year requirement, if such additional location satisfies all other applicable DOE eligibility requirements. Our expansion plans are based, in part, on our ability to open new schools as additional locations of our existing institutions and take into account the DOE's approval requirements.
A student may use Title IV Program funds only to pay the costs associated with enrollment in an eligible educational program offered by an institution participating in Title IV Programs. Generally, unless otherwise required by the DOE, an institution that is eligible to participate in Title IV Programs may add a new educational program without DOE approval if that new program leads to an associate’s level or higher degree and the institution already offers programs at that level, or if that program prepares students for gainful employment in the same or a related occupation as an educational program that has previously been designated as an eligible program at that institution and meets minimum length requirements. Institutions that are provisionally certified may be required to obtain approval of certain educational programs. Two of our institutions (Edison and Indianapolis) are provisionally certified and required to obtain prior DOE approval of new degree, non-degree, and short-term training educational programs. If an institution erroneously determines that an educational program is eligible for purposes of Title IV Programs, the institution would likely be liable for repayment of Title IV Program funds provided to students in that educational program. Our expansion plans are based, in part, on our ability to add new educational programs at our existing schools. We do not believe that current DOE regulations will create significant obstacles to our plans to add new programs.
Some of the state education agencies and our accrediting commission also have requirements that may affect our schools' ability to open a new campus, establish an additional location of an existing institution or begin offering a new educational program. Any institution required to submit retention or placement data to the ACICS may be required to obtain prior permission from the ACICS for the initiation of any new program. We do not believe that these standards will create significant obstacles to our expansion plans.
Administrative Capability. The DOE assesses the administrative capability of each institution that participates in Title IV Programs under a series of separate standards. Failure to satisfy any of the standards may lead the DOE to find the institution ineligible to participate in Title IV Programs or to place the institution on provisional certification as a condition of its participation. These criteria require, among other things, that the institution:
| · | Comply with all applicable federal student financial aid regulations; |
| · | Have capable and sufficient personnel to administer the federal student financial aid programs; |
| · | Administer Title IV programs with adequate checks and balances in its system of internal controls over financial reporting; |
| · | Divides the function of authorizing and disbursing or delivering Title IV Program Funds so that no office has the responsibility for both functions; |
| · | Establish and maintain records required under the Title IV regulations; |
| · | Develop and apply an adequate system to identify and resolve discrepancies in information from sources regarding a student’s application for financial aid under Title IV; |
| · | Have acceptable methods of defining and measuring the satisfactory academic progress of its students; |
| · | Refer to the Office of the Inspector General any credible information indicating that any applicant, student, employee or agent of the school has been engaged in any fraud or other illegal conduct involving Title IV Programs; |
| · | Not be, and not have any principal or affiliate who is, debarred or suspended from federal contracting or engaging in activity that is cause for debarment or suspension; |
| · | Provide financial aid counseling to its students; |
| · | Submit in a timely manner all reports and financial statements required by the regulations; and |
| · | Not otherwise appear to lack administrative capability. |
Failure by an institution to satisfy any of these or other administrative capability criteria could cause the institution to be subject to sanctions or other actions by the DOE or to lose its eligibility to participate in Title IV Programs, which would have a material adverse effect on our business and results of operations.
Other standards provide that an institution may be found to lack administrative capability and be placed on provisional certification if its student loantwo-year cohort default rate under the FFEL and FDL program is 25% or greater for any of the three most recent federal fiscal years, if its three-year cohort default rate is 30% or greater for at least two of the three most recent fiscal years for which the DOE has issued three-year rates, or if its Perkins cohort default rate exceeds 15%. Our Denver institution's Perkins Loan cohort default rate was 30.5%40.3% for students scheduled to begin repayment in the 2011-20122012-2013 federal award year. Institutions with default rates that exceed statutory or regulatory benchmarks may be subject to consequences that include but are not limited to loss of eligibility to participate in the Title IV programs. See “Regulatory“– Regulatory Environment – Student Loan Defaults” and “Regulatory“– Regulatory Environment – Perkins Loans Program”.
Ability to Benefit Regulations. Under certain circumstances, an institution had been permitted to admit non-high school graduates, or "ability to benefit," students, into certain of its programs of study and allow those students to receive Title IV Program funds to the extent eligible. In order for ability to benefit students to be eligible for Title IV Program participation, the institution was required to comply with the ability to benefit requirements set forth in the Title IV Program requirements. The basic evaluation method to determine that a student has the ability to benefit from the program is the student's achievement of a minimum score on a test approved by the DOE and independently administered in accordance with DOE regulations. The HEA also permitted students to demonstrate their ability to benefit and become eligible to receive Title IV funds upon satisfactory completion of six credit hours or the equivalent coursework. In addition to the testing requirements, the DOE regulations also prohibit ability to benefit student enrollments from constituting 50% or more of the total enrollment of the institution.
On December 23, 2011, the Consolidated Appropriations Act, Public Law 112-74, among other things, eliminated federal student aid eligibility, with certain exceptions, for all students who first enroll on or after July 1, 2012 and who do not have a certificate of graduation from a school providing secondary education or the recognized equivalent of such a certificate. As a result, many of these students who would have qualified to receive Title IV funds as ability-to-benefit students are not eligible for Title IV assistance under the law. As of December 31, 2012, approximately 4.2%, or 683 students of our total student population were ability-to-benefit students compared to 5.1% or 951 students as of December 31, 2011. As a result we stopped enrolling ATB students as of July 1, 2012. This reduction in ATB students has impacted and will continue to impact our total enrollment and our revenue.
Restrictions on Payment of Commissions, Bonuses and Other Incentive Payments. An institution participating in Title IV Programs may not provide any commission, bonus or other incentive payment based directly or indirectly on success in securing enrollments or financial aid to any person or entity engaged in any student recruiting or admission activities or in making decisions regarding the awarding of Title IV Program funds. The DOE’s regulations established twelve “safe harbors” identifying types of compensation that could be paid without violating the incentive compensation rule. On October 29, 2010, the DOE adopted final rules that took effect on July 1, 2011 and amended the incentive compensation rule by, among other things, eliminating the twelve safe harbors (and thereby reducing the scope of permissible payments under the rule) and expanding the scope of payments and employees subject to the rule. The DOE has stated that it does not intend to provide private guidance regarding particular compensation structures in the future and will enforce the regulations as written. We cannot predict how the DOE will interpret and enforce the revised incentive compensation rule. The implementation of the final regulations required us to change our compensation practices and has had and will continue to have a material adverse effect on the rate at which students enroll in our programs and on our business and results of operations.
Eligibility and Certification Procedures. Each institution must periodically apply to the DOE for continued certification to participate in Title IV Programs. The institution must also apply for recertification when it undergoes a change in ownership resulting in a change of control. The institution also may come under DOE review when it undergoes a substantive change that requires the submission of an application, such as opening an additional location or raising the highest academic credential it offers.
The DOE may placetypically provides provisional certification to an institution on provisional certification status if it determines that the institution does not fully satisfy certain administrative and financial standards or if the institution undergoesfollowing a change in ownership resulting in a change of control. As a resultcontrol and also may provisionally certify an institution for other reasons, including, but not limited to, noncompliance with certain standards of administrative capability and financial responsibility. Two of our then largest shareholder’s saleseven institutions (Edison and Indianapolis) are provisionally certified based on the existence of a portion of its ownership in our company during 2010, all institutions went through a change in ownership and were issued provisionalpending program participation agreements except for our New Britain institution which is certified. The DOE may withdraw an institution's provisional certificationreviews with the institution having fewer due process protections than if it were fully certified. In addition, the DOE may more closely review anDOE. An institution that is provisionally certified if it applies for approvalreceives fewer due process rights than those received by other institutions in the event the DOE takes certain adverse actions against the institution, is required to open aobtain prior DOE approvals of new location, add ancampuses and educational program, acquire another school or make any other significant change. Provisionalprograms, and may be subject to heightened scrutiny by the DOE. However, provisional certification does not otherwise limit an institution'sinstitution’s access to Title IV Program funds.
All institutions are recertified on various dates for various amounts of time. The following table sets forth the expiration dates for each of our institutions' current program participation agreements:
| Institution | Expiration Date of Current Program Participation Agreement | |
| Columbia, MD | September 30, | |
| Edison, NJ | September 30, | |
| Indianapolis, IN | ||
| New Britain, CT | June 30, 2016 | |
| Southington, CT | June 30, 2017 | |
| Fern Park, FL | ||
| Hartford, CT | September 30, |
| 1 | Provisionally certified. |
Compliance with Regulatory Standards and Effect of Regulatory Violations. Our schools are subject to audits, program reviews, and site visits by various regulatory agencies, including the DOE, the DOE's Office of Inspector General, state education agencies, student loan guaranty agencies, the U.S. Department of Veterans Affairs and our accrediting commissions. In addition, each of our institutions must retain an independent certified public accountant to conduct an annual audit of the institution's administration of Title IV Program funds. The institution must submit the resulting audit report to the DOE for review.
By letter dated August 1, 2013, the Accrediting Bureau of Health Education Schools, or ABHES, notified our school in Fern Park, Florida that ABHES had deferred action on the school’s application for a continued grant of accreditation and directed the school to show cause why its accreditation should not be withdrawn. ABHES is the institutional accreditor for the Fern Park school. The August 1, 2013, correspondence identified five findings of alleged noncompliance with certain ABHES accreditation requirements related to financial standards, program outcomes, admissions policies, availability of clinical experiences, and curriculum. The campus submitted to ABHES by the November 1, 2013 deadline a response addressing each of the five findings. By letter dated February 10, 2014, ABHES notified the school that ABHES has acted to defer action on the application for a continued grant of accreditation and to direct the institution to continue to show cause why its accreditation should not be withdrawn. The February 10, 2014 notice identified two findings of alleged noncompliance with certain ABHES accreditation requirements related to financial standards and program outcomes. ABHES has stated that the institution’s current grant of accreditation is continued through August 31, 2014. The Fern Park school’s response to the show cause directive is due no later than May 1, 2014. In response, ABHES could elect to continue the accreditation of the campus or take another action, including withdrawal of accreditation. The loss of accreditation by the Fern Park school would result in the termination of eligibility of that school to participate in Title IV Programs and could cause us to close the school, which could have a material adverse effect on our business and operations.
On July 16, 2012, the DOE notified our Lincoln, RIRhode Island campus that an on-site Program Review was scheduled to begin on August 6, 2012. The Program Review assessed the institution’s administration of Title IV, HEA Programs in which the campus participated for the 2010-2011 and 2011-2012 award years. The Lincoln, RI, campus has not yet receivedOn October 31, 2013, the DOE issued an Expedited Final Program Review Determination Letter fromthat notified the DOE.Lincoln, Rhode Island campus of its decision to close the program review without any findings or monetary liabilities.
On January 3, 2013, the DOE notified our New Britain, CTConnecticut campus that an on-site Program Review was scheduled to begin on January 28, 2013. The Program Review assessed the institution’s administration of Title IV, HEA Programs in which the campus participated for the 2011-2012 and 2012-2103 award years. The New Britain, CT,Connecticut, campus has not yet received the Program Review Determination Letter from the DOE.
On January 7, 2013, the DOE notified our Columbia, MDMaryland campus that an on-site Program Review was scheduled to begin on March 4, 2013. The Program Review assessed the institution’s administration of Title IV, HEA Programs in which the campus participated for the 2011-2012 and 2012-13 award years.
On April 26, 2013, the DOE notified our Union, New Jersey campus that an on-site Program Review was scheduled to begin on May 20, 2013. The Program Review assessed the institution’s administration of Title IV, HEA Programs in which the campus participated for the 2011-2012 and 2012-13 award years.
If one of our schools fails to comply with accrediting or state licensing requirements, such school and its main and/or branch campuses could be subject to the loss of state licensure or accreditation, which in turn could result in a loss of eligibility to participate in Title IV Programs. If the DOE determined that one of our institutions improperly disbursed Title IV Program funds or violated a provision of the HEA or DOE regulations, the institution could be required to repay such funds and related costs to the DOE and lenders, and could be assessed an administrative fine. The DOE could also place the institution on provisional certification and/or transfer the institution to the reimbursement or cash monitoring system of receiving Title IV Program funds, under which an institution must disburse its own funds to students and document the students' eligibility for Title IV Program funds before receiving such funds from the DOE. An institution that is operating under this "Heightened Cash Monitoring, Type 1 status," is required to credit student accounts before drawing down funds under Title IV Programs and to draw down funds in an amount no greater than the previous disbursement to students and parents. Additionally, an institution's compliance audit is required to contain verification that this did occur throughout the year. In addition to the above, the DOE requires institutions to comply with certain requirements if they are operating in "the zone," which is indicative of a composite score between 1.0 and 1.4. Those requirements include providing timely information regarding any of the following oversight and financial events:
| · | Any adverse action, including a probation or similar action, taken against the institution by its accrediting agency; |
| · | Any event that causes the institution, or related entity to realize any liability that was noted as a contingent liability in the institution's or related entity's most recent audited financial statements; |
| · | Any violation by the institution of any loan agreement; |
| · | Any failure of the institution to make a payment in accordance with its debt obligations that results in a creditor filing suit to recover funds under those obligations; |
| · | Any withdrawal of owner's equity from the institution by any means, including by declaring a dividend; or |
| · | Any extraordinary losses, as defined under Accounting Standards Codification 220-20. |
Operating under the zone requirements may also require the institution to submit its financial statement and compliance audits earlier than the date previously required and require the institution to provide information about its current operations and future plans. An institution that continues to fail to meet the financial responsibility standards set by the DOE or does not comply with the zone requirements may lose its eligibility to continue to participate in Title IV funding. If eligibility is lost, the institution may be required to post irrevocable letters of credit, for an amount determined by the DOE at a minimum of 50% of the Title IV Program funds received by the institution during its most recently completed fiscal year. The institution may also be required to post irrevocable letters of credit at a minimum of 10% of such funds and be provisionally certified and subject to other reporting and monitoring requirements.
Significant violations of Title IV Program requirements by us or any of our institutions could be the basis for a proceeding by the DOE to limit, suspend or terminate the participation of the affected institution in Title IV Programs or to civil or criminal penalties. Generally, such a termination extends for 18 months before the institution may apply for reinstatement of its participation. There is no DOE proceeding pending to fine any of our institutions or to limit, suspend or terminate any of our institutions' participation in Title IV Programs.
We and our schools are also subject to complaints and lawsuits relating to regulatory compliance brought not only by our regulatory agencies, but also by third parties, such as present or former students or employees and other members of the public. If we are unable to successfully resolve or defend against any such complaint or lawsuit, we may be required to pay money damages or be subject to fines, limitations, loss of federal funding, injunctions or other penalties. Moreover, even if we successfully resolve or defend against any such complaint or lawsuit, we may have to devote significant financial and management resources in order to reach such a result.
The following risk factors and other information included in this Form 10-K should be carefully considered. The risks and uncertainties described below are not the only ones we face. Additional risks and uncertainties not presently known to us or that we currently believe are not material may also adversely affect our business, financial condition, operating results, cash flows and prospects.
RISKS RELATED TO OUR INDUSTRY
Failure of our schools to comply with the extensive regulatory requirements for school operations could result in financial penalties, restrictions on our operations and loss of external financial aid funding, which could affect our revenues and impose significant operating restrictions on us.
Our schools are subject to extensive regulation by federal and state governmental agencies and by accrediting commissions. In particular, the HEA and the regulations promulgated thereunder by the DOE, set forth numerous standards that our schools must satisfy to participate in various federal student financial assistance programs under Title IV Programs. In 2012,2013, we derived approximately 81%80% of our revenues, calculated based on cash receipts, from Title IV Programs. To participate in Title IV Programs, each of our schools must receive and maintain authorization by the applicable education agencies in the state in which each school is physically located, be accredited by an accrediting commission recognized by the DOE and be certified as an eligible institution by the DOE. These regulatory requirements cover the vast majority of our operations, including our educational programs, facilities, instructional and administrative staff, administrative procedures, marketing, recruiting, student performances and outcomes, financial operations and financial condition. These regulatory requirements also affect our ability to acquire or open additional schools, add new educational programs, expand existing educational programs, and change our corporate structure and ownership.
If any of our schools fails to comply with applicable regulatory requirements, the school and its related main campus and/or additional locations could be subject to, among other things, the loss of state licensure or accreditation, the loss of eligibility to participate in and receive funds under the Title IV Programs, the loss of the ability to grant degrees, diplomas and certificates, provisional certification, or the imposition of liabilities or monetary penalties, each of which could adversely affect our revenues and impose significant operating restrictions upon us. In addition, the loss by any of our schools of its accreditation, its state authorization or license, or its eligibility to participate in Title IV Programs constitutes an event of default under our credit agreement, which we and our subsidiaries entered into with a syndicate of banks on April 5, 2012.agreement. An event of default on our credit agreement could result in the acceleration of all amounts then outstanding under our credit agreement. The various regulatory agencies periodically revise their requirements and modify their interpretations of existing requirements and restrictions. We cannot predict with certainty how any of these regulatory requirements will be applied or whether each of our schools will be able to comply with these requirements or any additional requirements instituted in the future.
Congress has changed, and may make other changes, to the laws applicable to, or reduce funding for, Title IV Programs, which could reduce our student population, revenues or profit margin.
Political and budgetary concerns significantly affect Title IV programs. Congress periodically revises the HEA and other laws governing Title IV HEA Programs and annually determines the funding level for each Title IV Program. On August 14, 2008, the Higher Education Opportunity Act, Public Law 110-315 reauthorized the Title IV programs through at least September 30, 2014. Congress will be considering reauthorization of the Title IV HEA programs, but it is unknown when Congress will begin or complete that process or what changes will be made to the HEA or other laws affecting Federal student aid. Any action by Congress that significantly reduces funding for Title IV Programs or the ability of our schools or students to receive funding through those programs could result in increased administrative costs and decreased profit margin.
In addition, Congress reviews and determines federal appropriations for Title IV Programs on an annual basis. Congress can also make changes in the laws affecting Title IV Programs in the annual appropriations bills and in other laws it enacts between the HEA reauthorizations. Because a significant percentage of our revenues are derived from Title IV Programs, any action by Congress that significantly reduces Title IV Program funding or the ability of our schools or students to participate in Title IV Programs could reduce our student enrollment and our revenues. Congressional action may also increase our administrative costs and require us to modify our practices in order for our schools to comply fully with Title IV Program requirements.
We cannot predict what if any legislation or other actions will be taken or proposed by the HELP Committee or Congress in response to the hearings, the requests for information from our company and other entities,connection with the reauthorization of the HEA or with other activities of the Committee or Congress. Any action by Congress that significantly reduces funding for Title IV Programs or that limits or restricts the ability of our schools, programs, or students to receive funding through those programs or that imposes new restrictions or constraints upon our business or operations could result in increased administrative costs and decreased profit margin. In addition, current requirements for student or school participation in Title IV programs may change or one or more of the present Title IV programs could be replaced by other programs with materially different student or school eligibility requirements. If we cannot comply with the provisions of the HEA, as they may be revised, or if the cost of such compliance is excessive, or if funding is materially reduced, our revenues or profit margin could be materially adversely affected.
Congress has made recent changes to the law that have and could continue to have an adverse effect on our business.
On December 23, 2011, President Obama signed into law the Consolidated Appropriations Act, 2012 (Public Law 112-74) (the “Appropriations Act”). The new law significantly impacted the federal student aid programs authorized under Title IV of HEA.
Ability-to-Benefit — The Appropriations Act also eliminated federal student aid eligibility for all students without a “certificate of graduation from a school providing secondary education or the recognized equivalent of such a certificate.” The Appropriations Act makes an exception for students who have completed a secondary school education in a home school setting that is treated as a home school or private school under state law. Therefore, students who do not have a high school diploma or a recognized equivalent (e.g., a GED), or do not meet the home school requirements, and who first enroll in a program of study on or after July 1, 2012, are not eligible to receive Title IV student aid. Students will qualify for Title IV student aid under one of the ability-to-benefit (ATB) alternatives if the student was enrolled in a Title IV eligible program prior to July 1, 2012. Those alternatives include the student passing an independently-administered, approved ATB test or successfully completing at least six credit hours or 225 clock hours of postsecondary education. A student who does not possess a high school diploma, or a recognized equivalent, but who is enrolled in a Title IV eligible program any time prior to July 1, 2012 may be eligible to receive Title IV student assistance after July 1, 2012. As of December 31, 2012, approximately 4.2% of our total student population were ATB students. We ceased enrolling ability to benefit students effective July 1, 2012.
Auto-Zero EFC Income Threshold — The Appropriations Act amended the HEA to reduce the income threshold for an automatic zero “expected family contribution” to $23,000 for the 2012-2013 award year for both dependent and independent students. The threshold for 2012-2013 was scheduled to be $32,000, but now will be $23,000. For students whose families make between $23,000 and $32,000 per year, this will decrease the amount of Pell grants such students will receive.
Federal Pell Grant Duration of Eligibility — The Appropriations Act also amended the HEA to reduce the duration of a student’s eligibility to receive a federal Pell Grant from 18 semesters (or its equivalent) to 12 semesters (or its equivalent). This provision applies to all federal Pell Grant eligible students effective with the 2012-13 award year. This eliminated the ability of some of our students to continue to receive Pell Grants, depending on their prior receipt of Pell Grants from our institutions and from other institutions prior to enrolling in our schools.
On April 15, 2011, President Obama signed H.R. 1473, the Full-Year Continuing Resolution which funds the federal government for the remainder of the 2011 fiscal year. This Continuing Resolution, among other things, permanently repeals the year-round Pell Grant beginning with the 2011-2012 award year. The year-round program had allowed students in accelerated programs to obtain two Pell Grants in a single award year. As a result of the repeal, students may obtain only one Pell Grant per award year. This change impacted some of our students’ ability to finance their education and/or affected their decision to attend our institutions, which had a material adverse effect on our business and results of operations.
The DOE has changed its regulations, and may make other changes in the future, in a manner which could require us to incur additional costs in connection with our administration of the Title IV programs, affect our ability to remain eligible to participate in the Title IV programs, impose restrictions on our participation in the Title IV programs, affect the rate at which students enroll in our programs, or otherwise have a material adverse effect on our business and results of operations.
The DOE issued final regulations on October 29, 2010, with a general effective date of July 1, 2011, that covered a broad range of topics. See “Regulatory“Item 1. Business – Regulatory Environment – DOE Development of New Regulations.” The implementation of all of the October 2010 final regulations required us to change certain of our practices to comply with these requirements. The changes to our practices, or our inability to comply with the final regulations on or after their effective date, have had and may continue to have a material adverse effect on our business and results of operations.
On June 30, 2012, the United States District Court for the District of Columbia issued a decision that vacated most of the gainful employment regulations and remanded those regulations to the DOE for further action. On July 6, 2012, the DOE issued an electronic announcement acknowledging that the Court had vacated the repayment rate metric as well as the debt-to-income gainful employment metrics that would have gone into effect on July 1, 2012. The DOE also noted that institutions are not required to comply with related regulations relating to gainful employment reporting requirements and adding new educational programs, but are required to comply with requirements to disclose certain information about educational programs.
In June 2013, the DOE announced its intention to establish a negotiated rulemaking committee to prepare new gainful employment regulations, which would replace those vacated by the District Court. The Court’s decisionDOE held negotiating sessions with the committee beginning in September 2013 and concluding in December 2013. Before each session, the DOE distributed draft regulatory language marked as a draft for discussion purposes. The draft regulatory language distributed by the DOE to the committee for discussion purposes in December 2013 requires each educational program to achieve threshold rates in three debt measure categories related to an annual debt to annual earnings ratio, an annual debt to discretionary income ratio, and a program cohort default rate. The various formulas are calculated under complex methodologies and definitions outlined in the draft regulatory language and, in some cases, are based on data that may not be readily accessible to institutions. The draft language outlines various scenarios under which programs could lose Title IV eligibility for failure to achieve threshold rates in one or more measures over certain periods of time ranging from two to four years. The draft language also requires an institution to provide warnings to students in programs which may lose Title IV eligibility at the end of an award year, limit its Title IV enrollment in these programs, and submit a letter of credit or set aside funds to provide borrower relief to students in the event the programs become ineligible. The draft regulatory language contains other provisions that, among other things, include disclosure, reporting and new program approval requirements.
The draft regulatory language discussed above is not final and is subject to appealchange by the DOE. The DOE is expected to publish draft regulations for comment by the public before preparing and could be modified or reversed on appeal. Moreover,publishing final regulations. Accordingly, we cannot predict the DOE could take further action to address the Court’s concerns regarding theultimate content of any new regulations and obtain approval to enforce the regulations,that may emerge from this process or the potential impact of such regulations on us or our institutions. New final DOE could issue new regulations regarding gainful employment. We cannot predict what steps the DOE will take in response to the Court’s decision, how long those stepspublished on or before November 1, 2014 typically would take,have an effective date of July 1, 2015, although it is unknown at this time whether some or whether those steps will result in the DOE being able to enforce the gainful employmentall of these regulations might have an earlier or issuing new regulations.later effective date. The implementation of new gainful employment regulations, or any other changes the DOE may propose and implement, could require us to eliminate certain educational programs, and could have a material adverse effect on the rate at which students enroll in our programs and on our business and results of operations.
The DOE also announced additional topics that will be considered for new regulations by negotiated rulemaking committees beginning in February 2014. The topics under discussion are expected to include, but may not be limited to, the following: clock to credit hour conversion for programs offered in credit hours that do not transfer into degree programs and are subject to the federal conversion formula for determining credit hours; cash management of funds provided under the Title IV Federal student aid programs, including the handling of the use of debit cards and the handling of credit balances; state authorization for programs offered through distance education or correspondence education; state authorization for foreign locations of institutions located in a state; and the definition of "adverse credit" for borrowers of certain loans. Another committee is scheduled to meet during three sessions beginning in January 2014 and addressing topics related to the scope of campus crime statistics that Title IV participating institutions are required to distribute to current and prospective students and employees.
If we or our eligible institutions do not meet the financial responsibility standards prescribed by the DOE, we may be required to post letters of credit or our eligibility to participate in Title IV Programs could be terminated or limited, which could significantly reduce our student population and revenues.
To participate in Title IV Programs, an eligible institution must satisfy specific measures of financial responsibility prescribed by the DOE or post a letter of credit in favor of the DOE and possibly accept other conditions on its participation in Title IV Programs. Any obligation to post one or more letters of credit would increase our costs of regulatory compliance. Our inability to obtain a required letter of credit or limitations on, or termination of, our participation in Title IV Programs could limit our students' access to various government-sponsored student financial aid programs, which could significantly reduce our student population and revenues.
Each year, based on the financial information submitted by an eligible institution that participates in Title IV Programs, the DOE calculates three financial ratios for the institution: an equity ratio, a primary reserve ratio and a net income ratio. Each of these ratios is scored separately and then combined into a composite score to measure the institution's financial responsibility. If the composite score for an institution falls below thresholds established by the DOE, the DOE could place the institution on provisional certification and/or transfer the institution to the reimbursement or cash monitoring system of receiving Title IV Program funds, under which an institution must disburse its own funds to students and document the student's eligibility for Title IV Program funds before receiving such funds from the DOE. If an institution has a composite score between 1.0 and 1.4, the institution will be required to operate under "Heightened Cash Monitoring, Type 1 status." If an institution's composite score is below 1.0, the institution is considered by the DOE to lack financial responsibility and, as a condition of Title IV Program participation, the institution may be required to, among other things, post a letter of credit in an amount of at least 10% to 50% of the institution's annual Title IV Program participation for its most recent fiscal year.
The DOE has evaluated the financial responsibility requirements of our institutions on a consolidated basis. Based on our calculations, our 20122013 and 20112012 consolidated financial statements reflect a composite score for the Company of 1.5 and 1.6, and 2.1, respectively. However, our 20122013 composite score is subject to confirmation by the DOE once it receives and reviews our audited financial statements for the 20122013 fiscal year.
If we fail to demonstrate "administrative capability" to the DOE, our business could suffer.
DOE regulations specify extensive criteria an institution must satisfy to establish that it has the requisite "administrative capability" to participate in Title IV Programs. For a description of these criteria, see “Regulatory Environment – Administrative Capability.”
Other standards provide that an institution may be found to lack administrative capability and be placed on provisional certification if its student loan default rate under the FFEL and FDL program is 25% or greater for any of the three most recent federal fiscal years, if its three-year cohort default rate is 30% or greater for at least two of the three most recent fiscal years for which the DOE has issued three-year rates, or if its Perkins cohort default rate exceeds 15%. Our Denver institution's Perkins Loan cohort default rate was 30.5%40.3% for students scheduled to begin repayment in the 2011-20122012-2013 federal award year.
If an institution fails to satisfy any of these criteria or any other DOE regulation, the DOE may, among other things:
| · | Require the repayment of Title IV funds; |
| · | Impose a less favorable payment system for the institution's receipt of Title IV funds; |
| · | Place the institution on provisional certification status; or |
| · | Commence a proceeding to impose a fine or to limit, suspend or terminate the participation of the institution in Title IV Programs. |
If we are found not to have satisfied the DOE's "administrative capability" requirements, one or more of our institutions, including its additional locations, could be limited in its access to, or lose, Title IV Program funding. A decrease in Title IV funding could adversely affect our revenue, as we received approximately 81%80% of our revenue (calculated based on cash receipts) from Title IV Programs in 2012,2013, which would have a material adverse effect on our business and results of operations.
We are subject to fines and other sanctions if we pay impermissible commissions, bonuses or other incentive payments to individuals involved in certain recruiting, admissions or financial aid activities, which could increase our cost of regulatory compliance and adversely affect our results of operations.
An institution participating in Title IV Programs may not provide any commission, bonus or other incentive payment based directly or indirectly on success in enrolling students or securing financial aid to any person involved in any student recruiting or admission activities or in making decisions regarding the awarding of Title IV Program funds. The DOE’s regulations established twelve “safe harbors” identifying types of compensation that could be paid without violating the incentive compensation rule. On October 29, 2010, the DOE issued final rules effective July 1, 2011 that amended the incentive compensation rule by, among other things, eliminating the twelve safe harbors (and thereby reducing the scope of permissible payments under the rule) and expanding the scope of payments and employees subject to the rule. The DOE has stated that it does not intend to provide private guidance regarding particular compensation structures in the future and will enforce the regulations as written. We cannot predict how the DOE will interpret and enforce the revised incentive compensation rule. The implementation of the final regulations required us to change our compensation practices and has had and may continue to have a material adverse effect on the rate at which students enroll in our programs and on our business and results of operations.operations. If we are found to have violated this law, we could be fined or otherwise sanctioned by the DOE or we could face litigation filed under the qui tam provisions of the Federal False Claims Act.
If our schools do not maintain their state authorizations and their accreditation, they may not participate in Title IV Programs, which could adversely affect our student population and revenues.
An institution that grants degrees, diplomas or certificates must be authorized by the appropriate education agency of the state in which it is located and, in some cases, other states. Requirements for authorization vary substantially among states. The school must be authorized by each state in which it is physically located in order for its students to be eligible for funding under Title IV Programs. Loss of state authorization by any of our schools from the education agency of the state in which the school is located would end that school's eligibility to participate in Title IV Programs and could cause us to close the school.
Some states have sought to assert jurisdiction over online educational institutions that offer educational services to residents in the state or to institutions that advertise or recruit in the state, notwithstanding the lack of a physical location in the state. State regulatory requirements for online education vary among the states, are not well developed in many states, are imprecise or unclear in some states and are subject to change. If we are found not to be in compliance with an applicable state regulation and a state seeks to restrict one or more of our business activities within its boundaries, we may not be able to recruit or enroll students in that state and may have to cease providing services and advertising in that state.
The DOE published new regulations that took effect on July 1, 2011 and expand the requirements for an institution to be considered legally authorized in the state in which it is physically located for Title IV purposes. See “Regulatory“Item 1. Business – Regulatory Environment – State Authorization.” If the states do not amend their requirements where necessary and if schools do not receive approvals where necessary that comply with these new requirements, then the institution could be deemed to lack the state authorization necessary to participate in the Title IV Programs. The DOE stated when it published the final regulations that it will not publish a list of states that meet, or fail to meet, the requirements, and it is uncertain how the DOE will interpret these requirements in each state.
In addition, the new DOE rules also requirerequired institutions offering postsecondary education through distance education, such as online programs, to students in a state in which the institution is not physically located or in which it is otherwise subject to state jurisdiction as determined by the state to meet any state requirements for it to be legally offering postsecondary distance education in that state. See “Regulatory“Item 1. Business – Regulatory Environment – State Authorization.” If we are unable to obtain the required approvals, our students in the affected schools or programs may be unable to receive Title IV funds, and we may be unable to recruit students or operate in that state, which could have a material adverse effect on our business and operations. In June 2012, the United States Court of Appeals for the District of Columbia vacated the new DOE rules with respect to state authorization of distance education. The Court affirmed an order of a Federal District Court that vacated the portion of the state authorization regulation that requires an institution to meet state requirements in a state in which it has distance education students, but in which it is not physically located or otherwise subject to state jurisdiction. The DOE issued a Dear Colleague Letter acknowledging the decision of the Court of Appeals and stating that the DOE would not enforce the requirements of the regulation and commenting that institutions continue to be responsible for complying with all state laws as they related to distance education. However, the DOE announced its intent to consider new regulations regarding state authorization for programs offered through distance education beginning with a negotiated rulemaking committee convening in February 2014. If we are unable to obtain any approvals that might be required under any such new regulations, our students in the affected schools or programs might be unable to receive Title IV funds, and we might be unable to recruit students or operate in that state, which could have a material adverse effect on our business and operations.
If any of our schools fail to comply with state licensing requirements, they are subject to the loss of state licensure or authorization. If any one of our schools lost its authorization from the education agency of the state in which the school is located, that school and its related main campus and/or additional locations would lose its eligibility to participate in Title IV Programs, be unable to offer its programs and we could be forced to close that school. If one of our schools lost its state authorization from a state other than the state in which the school is located, the school would not be able to recruit students or to operate in that state.
A school also must be accredited by an accrediting commission recognized by the DOE in order to participate in Title IV Programs. Accreditation is a non-governmental process through which an institution submits to qualitative review by an organization of peer institutions, based on the standards of the accrediting agency and the stated aims and purposes of the institution, including achieving and maintaining stringent retention, completion and placement outcomes. Certain states require institutions to maintain accreditation as a condition of continued authorization to grant degrees. The HEA requires accrediting commissions recognized by the DOE to review and monitor many aspects of an institution's operations and to take appropriate disciplinary action when the institution fails to comply with the accrediting agency's standards. See “Regulatory Environment – Accreditation.” If one of our schools fails to comply with accrediting commission requirements, the institution and its main and/or branch campuses are subject to the loss of accreditation or may be placed on probation or a special monitoring or reporting status which, if the noncompliance with accrediting commission requirements is not resolved, could result in loss of accreditation. Our school in Fern Park, Florida received a letter from ABHES in February 2014 directing the school to show cause why its accreditation should not be withdrawn. See “Regulatory Environment – Compliance with Regulatory Standards and Effect of Regulatory Violations.” Loss of accreditation by any of our main campuses would result in the termination of eligibility of that school and all of its branch campuses to participate in Title IV Programs and could cause us to close the school and its branches, which could have a material adverse effect on our business and operations.
Programmatic accreditation is the process through which specific programs are reviewed and approved by industry- and program-specific accrediting entities. Although programmatic accreditation is not generally necessary for Title IV eligibility, such accreditation may be required to allow students to sit for certain licensure exams or to work in a particular profession or career or to meet other requirements. Failure to obtain or maintain such programmatic accreditation may lead to a decline in enrollments in such programs.
Our institutions would lose eligibility to participate in Title IV Programs if the percentage of their revenues derived from those programs are too high, which could reduce our student population and revenues.
Under the HEA reauthorization, a proprietary institution that derives more than 90% of its total revenue from Title IV programs for two consecutive fiscal years becomes immediately ineligible to participate in Title IV programs and may not reapply for eligibility until the end of at least two fiscal years. An institution with revenues exceeding 90% for a single fiscal year ending after August 14, 2008 will be placed on provisional certification and may be subject to other enforcement measures. If an institution violated the 90/10 Rule and became ineligible to participate in Title IV Programs but continued to disburse Title IV Program funds, the DOE would require the institution to repay all Title IV Program funds received by the institution after the effective date of the loss of eligibility.
We have calculated that, for our 20122013 fiscal year, our existing institutions' 90/10 Rule percentages ranged from 72.3%69% to 93.0%85%. For 2011,2012, none of our existing institutions derived more than 90% of their revenues from Title IV Programs. For 2012, our Dayton institution (consisting of a main campus and eight additional locations) had a 90/10 Rule percentage of 93.0% and was our only institution with a 90/10 Rule percentage above 90%. For 2010, our Dayton institution (consisting of a main campus and six additional locations) had a 90/10 Rule percentage of 96.9% and was our only institution with a 90/10 Rule percentage above 90% in 2010. We regularly monitor compliance with this requirement to minimize the risk that any of our institutions would derive more than the maximum percentage of its revenues from Title IV Programs for any fiscal year. Our calculations may be subject to review by the DOE.
Effective July 1, 2008, the annual Stafford loans available for undergraduate students under the FFEL program, increased. This increase, coupled with recent increases in grants from the Pell program and other Title IV loan limits, resulted in some of our schools experiencing an increase in the revenues they receive from the Title IV programs. The HEA reauthorization provided temporary relief from the impact of the loan limit increases by counting as non-Title IV revenue in the 90/10 Rule calculation amounts received from loans received between July 1, 2008 and June 30, 2011 that are attributable to the increased annual loan limits. The HEA authorization also provided other relief by allowing institutions to include as non-Title IV revenue in its 90/10 Rule calculation the net present value of certain institutional loans subject to certain limitations and conditions. Because of the increases in Title IV student loan limits and grants in recent years, it will be increasingly difficult for us to comply with the 90/10 Rule without increasing tuition prices above the applicable maximums for Title IV student loans and grants, because this is one of the more effective methods of reducing the 90/10 Rule percentage, although this method may not be successful. Moreover, the above-mentioned relief from certain loan limit increases expired for loans received on or after July 1, 2011, and the above-mentioned institutional loan relief is scheduled to expire for institutional loans made on or after July 1, 2012. If Congress or the DOE were to amend the 90/10 Rule to treat other forms of federal financial aid as Title IV revenue for 90/10 purposes, to lower the 90% threshold, or to otherwise change the calculation methodology (each of which has been proposed by some Congressional members in proposed legislation), to make other changes, or if there were a reduction in funding in other forms of federal or state financial aid, those changes could make it more difficult for our institutions to comply with the 90/10 Rule. If any of our institutions loses eligibility to participate in Title IV Programs, that loss would cause an event of default under our credit agreement, and would also adversely affect our students’ access to various government-sponsored student financial aid programs, which could have a material adverse effect on the rate at which our students enroll in our programs and on our business and results of operations.
Our institutions would lose eligibility to participate in Title IV Programs if their former students defaulted on repayment of their federal student loans in excess of specified levels, which could reduce our student population and revenues.
An institution may lose its eligibility to participate in some or all Title IV Programs if the rates at which the institution's current and former students default on their federal student loans exceed specified percentages. The DOE calculates these rates based on the number of students who have defaulted, not the dollar amount of such defaults. The DOE calculates an institution's cohort default rate (as defined by the DOE regulations) on an annual basis as the rate at which borrowers scheduled to begin repayment on their loans in one year default on those loans by the end of the next year (two year ratio). An institution whose FFEL and FDL cohort default rate is 25% or greater for three consecutive federal fiscal years loses eligibility to participate in the FFEL, FDL, and Pell programs for the remainder of the federal fiscal year in which the DOE determines that such institution has lost its eligibility and for the two subsequent federal fiscal years. An institution whose FFEL and FDL cohort default rate for any single federal fiscal year exceeds 40% loses its eligibility to participate in the FFEL and FDL programs for the remainder of the federal fiscal year in which the DOE determines that such institution has lost its eligibility and for the two subsequent federal fiscal years. If an institution’s cohort default rate equals or exceeds 25% in any of its three most recent fiscal years, the institution may be placed on provisional certification status.
The HEA has been amended by the HEOA to provide for the calculation of an institution’s cohort default rate using a three year period, beginning with the cohort default rate for the 2009 federal fiscal year. Under the HEA reauthorization, an institution's cohort default rate is redefined to be based on the rate at which its former students default on their FFEL and FDL loans over a period of time that is one year longer than the period of time over which rates currently are calculated. As a result, most institutions' respective cohort default rates are expected to increase under the new provision, which first would apply to cohort default rates for the 2009 federal fiscal year. The DOE will not impose sanctions based on rates calculated under the new provision until three consecutive years have been calculated under the new method. Until that time, the DOE will continue to calculate rates under the old method and impose sanctions based on those rates. The HEOA also increases the cohort default three-year threshold from 25% to 30% effective for three year cohort default rates issued beginning in federal fiscal year 2012. The revised law changes the threshold for placement on provisional certification to 30% for two of the three most recent fiscal years for which the DOE has published official three-year cohort default rates. On or after October 1, 2014, if an institution’s three-year cohort default rate equals or exceeds 30% in two of the three most recent years for which the DOE has issued three-year rates, the institution may be placed on provisional certification status.
The most recent three-year cohort default rates published by the DOE are for the 2010 federal fiscal year. The three-year rates for our existing institutions for the 2010 federal fiscal year. The ratesyear range from 11.6%19.0% to 23.9%34.0%. NoneFor the 2010 federal fiscal year, two of our institutions, had a cohort default rate (as defined by the DOE) of 25% or greater for the 2010 fiscal year. See “Regulatory Environment – Student Loan Defaults.” In late March 2013, the DOE is expected to issue draft two-year cohort default rates for the 2011 fiscal year.
If former students defaulted on repayment of their federal student loans in excess of specified levels, our institutions would lose eligibility to participate in Title IV Programs, which could decrease our student population and revenues.
We are subject to sanctions if we fail to correctly calculate and timely return Title IV Program funds for students who withdraw before completing their educational program, which could increase our cost of regulatory compliance and decrease our profit margin.
An institution participating in Title IV Programs must correctly calculate the amount of unearned Title IV Program funds that have been credited to students who withdraw from their educational programs before completing them and must return those unearned funds in a timely manner, generally within 45 days of the date the institution determines that the student has withdrawn. If the unearned funds are not properly calculated and timely returned, we may have to post a letter of credit in favor of the DOE or may be otherwise sanctioned by the DOE, which could increase our cost of regulatory compliance and adversely affect our results of operations.
If regulators do not approve our acquisition of a school that participates in Title IV Programs, the acquired school would no longer be permitted to participate in Title IV Programs, which could impair our ability to operate the acquired school as planned or to realize the anticipated benefits from the acquisition of that school.
If we acquire a school that participates in Title IV Programs, we must obtain approval from the DOE and applicable state education agencies and accrediting commissions in order for the school to be able to continue operating and participating in Title IV Programs. An acquisition can result in the temporary suspension of the acquired school's participation in Title IV Programs unless we submit to the DOE a timely and materially complete application for recertification and the DOE issues a temporary provisional program participation agreement. If we are unable to timely re-establish the state authorization, accreditation or DOE certification of the acquired school, our ability to operate the acquired school as planned or to realize the anticipated benefits from the acquisition of that school could be impaired.
Issuance or sales of a substantial amount of our common stock could result in a change in control under the DOE standards, the standards of state education agencies, and/or the standards of certain institutional accrediting agencies, and could require each of our schools to apply for recertification for continued ability to participate in Title IV Programs and reaffirmation of their state authorizations and accreditations. The failure to obtain the required recertifications and reaffirmations could have a material adverse effect on our results of operations.
The DOE, most state education agencies and our accrediting commissions each have standards pertaining to a change in control of schools that are not uniform and are subject to interpretation by these respective agencies. A change in control under the definition of one of these agencies requires the affected school to reaffirm the applicable DOE approval, state authorization or accreditation. Each school that undergoes a change in control under the standards of the DOE must apply for recertification for continued ability to participate in Title IV Programs. Some agencies would require approval prior to a sale or disposition that would result in a change in control in order to maintain authorization or accreditation. The requirements to obtain such reaffirmation from the states and our accrediting commissions vary widely. See “Regulatory Environment – Change of Control.”
A change of control could occur as a result of future transactions in which our company or schools are involved. Some corporate reorganizations and some changes in the board of directors are examples of such transactions. Moreover, the potential adverse effects of a change of control could influence future decisions by us and our stockholders regarding the sale, purchase, transfer, issuance or redemption of our stock. In addition, the adverse regulatory effect of a change of control also could discourage bids for your shares of common stock and could have an adverse effect on the market price of our shares.
If we fail to apply for or obtain approvals from the DOE and applicable state education agencies and accrediting commissions, our institutions could lose their approval to participate in the Title IV Programs, their accreditation, and their authority to operate in the applicable states, which would have a material adverse impact on our results of operation.
Regulatory agencies or third parties may conduct compliance reviews, bring claims or initiate litigation against us. If the results of these reviews or claims are unfavorable to us, our results of operations and financial condition could be adversely affected.
Because we operate in a highly regulated industry, we are subject to compliance reviews and claims of noncompliance and lawsuits by government agencies and third parties. If the results of these reviews or proceedings are unfavorable to us, or if we are unable to defend successfully against third-party lawsuits or claims, we may be required to pay money damages or be subject to fines, limitations on the operations of our business, loss of federal funding, injunctions or other penalties. Even if we adequately address issues raised by an agency review or successfully defend a third-party lawsuit or claim, we may have to divert significant financial and management resources from our ongoing business operations to address issues raised by those reviews or defend those lawsuits or claims. Certain of our institutions are subject to ongoing reviews and proceedings. See “Regulatory Environment – State Authorization,” “Regulatory Environment – Accreditation,” and “Regulatory Environment - Compliance with Regulatory Standards and Effect of Regulatory Violations.”
Our failure to comply with regulations promulgated by the DOE could result in financial penalties, or the limitation, suspension, or termination of our continued participation in the Title IV programs.
Students attending our schools finance their education through a combination of family contributions, individual resources, private loans and federal financial aid programs. Each of our schools participates in the federal programs of student financial aid authorized under the Title IV Programs, which are administered by the DOE. For the year ended December 31, 2012,2013, approximately 81%80% (calculated based on cash receipts) of our revenues were derived from the Title IV Programs. Students obtain access to federal student financial aid through a DOE prescribed application and eligibility certification process. Student financial aid funds are generally made available to students at prescribed intervals throughout their predetermined expected length of study. Students typically use the funds received from the federal financial aid programs to pay their tuition and fees.
In connection with the students' receipt of federal financial aid, our schools are subject to extensive regulation by governmental agencies and licensing and accrediting bodies. In particular, the Title IV Programs, and the regulations issued thereafter by the DOE, subject us to significant regulatory scrutiny in the form of numerous standards that each of our schools must satisfy in order to participate in the various federal student financial aid programs. The DOE has published new regulations, proposed other regulations, and may propose additional regulations in the future that are applicable to our institutions. Failure of an institution to comply with new or existing DOE regulations could result in sanctions that could have a material adverse effect on our business, including, but not limited to:
| · | loss of eligibility to participate in Title IV Programs; |
| · | requirement to repay Title IV funds and related costs to the DOE and lenders; |
| · | transfer of the institution to the heightened cash monitoring level two method of payment or to the reimbursement method of payment, which would adversely affect the timing of the institution's receipt of Title IV funds; |
| · | requirement to post a letter of credit in favor of the DOE as a condition for continued Title IV certification; |
| · | requirement to provide timely information regarding certain oversight and financial events; |
| · | proceedings to impose a fine or to limit, suspend or terminate the institution's participation in Title IV Programs; |
| · | an emergency action to suspend the institution's participation in Title IV Programs without prior notice or a prior opportunity for a hearing; |
| · | denial or refusal to consider an institution's application for renewal of its certification to participate in Title IV Programs; or |
| · | referral of a matter for possible civil or criminal investigation. |
Our regulatory environment and our reputation may be negatively influenced by the actions of other postsecondary institutions.
In recent years, regulatory investigations and civil litigation have been commenced against several postsecondary educational institutions. These investigations and lawsuits have alleged, among other things, deceptive trade practices and non-compliance with DOE regulations. These allegations have attracted adverse media coverage and have been the subject of federal and state legislative hearings. Although the media, regulatory and legislative focus has been primarily on the allegations made against these specific companies, broader allegations against the overall postsecondary sector may negatively impact public perceptions of postsecondary educational institutions, including us. Such allegations could result in increased scrutiny and regulation by the DOE, U.S. Congress, accrediting bodies, state legislatures or other governmental authorities on all postsecondary institutions, including us.
A decline in the overall growth of enrollment in postsecondary institutions, or in our core disciplines or in the number of students seeking degrees online, could cause us to experience lower enrollment at our schools, which could negatively impact our future growth.
The growth rate of enrollment in degree-granting, postsecondary institutions over the next ten years is expected to be slower than in the prior ten years. Growth rates of online postsecondary education enrollment are also expected to be slower in future periods. In addition, the number of high school graduates eligible to enroll in degree-granting, postsecondary institutions is expected to fall before resuming a growth pattern for the foreseeable future. Although, as of December 31, 2012,2013, only 15.7%13.6% of our students were enrolled in degree-granting programs (primarily at the associate's degree level), our strategy is to expand our degree granting offerings. In order to increase our current growth rates in degree granting programs, we will need to attract a larger percentage of students in existing markets and expand our markets by creating new academic programs. In addition, if job growth in the fields related to our core disciplines is weaker than expected, as a result of any regional or national economic downturn or otherwise, fewer students may seek the types of diploma or degree granting programs that we offer and seek to offer. Our failure to attract new students, or the decisions by prospective students to seek diploma or degree programs in other disciplines, would have an adverse impact on our future growth. Over the twolast three years, we have seen decreases in our enrollment growth due to, among other things, eliminating “ability to benefit” students admitted to our schools. Beginning July 1, 2012, “ability to benefit” students were no longer eligible to receive federal student aid. Therefore, our institutions are unable to enroll “ability to benefit” students requiring federal student aid starting July 1, 2012. See “Regulatory Environment – Ability To Benefit Students.” These changes to our business model are decreasing our enrollments and our revenue and causing pressure on our margins.
Our business could be adversely impacted by additional legislation, regulations, or investigations regarding private student lending because students attending our schools rely on private student loans to pay tuition and other institutional charges.
The U.S. Consumer Financial Protection Bureau (“CFPB”), under the Dodd-Frank Wall Street Reform and Consumer Protection Act of 2010, has supervisory authority over private education loan providers. The CFPB has been active in conducting investigations into the private student loan market and issuing several reports with findings that are critical of the private student loan market. The CFPB has initiated investigations into the lending practices of other institutions in the for-profit education sector. The CFPB has issued procedures for further examination of private education loans and published requests for information regarding repayment plans and regarding arrangements between schools and financial institutions. We cannot predict whether any of this activity, or other activities, will result in Congress, the CFPB or other regulators adopting new legislation or regulations, or conducting new investigations, into the private student loan market or into the loans received by our students to attend our institutions. Any new legislation, regulations, or investigations regarding private student lending could limit the availability of private student loans to our students, which could have a material adverse effect on our business and operations.
RISKS RELATED TO OUR BUSINESS
We may not be able to successfully integrate acquisitions into our business, which may materially adversely affect our business, financial condition, results of operations and could cause the market value of our common stock to decline.
Since 1999, we have acquired a number of schools and we intend to continue to grow our business through acquisitions and internal expansion of our programs. The anticipated benefits of an acquisition may not be achieved unless we successfully integrate the acquired school or schools into our operations and are able to effectively manage, market and apply our business strategy to any acquired schools. Integration challenges include, among others, regulatory approvals, significant capital expenditures, assumption of known and unknown liabilities and our ability to control costs. The successful integration of future acquisitions may also require substantial attention from our senior management and the senior management of the acquired schools, which could decrease the time that they devote to the day-to-day management of our business. The difficulties of integration may initially be increased by the necessity of integrating personnel with disparate business backgrounds and corporate cultures. Management's focus on the integration of acquired schools and on the application of our business strategy to those schools could interrupt or cause loss of momentum in our other ongoing activities. Our inability to properly manage or support the growth may have a material adverse effect on our business, financial condition, and results of operations and could cause the market value of our common stock to decline.
Failure on our part to establish and operate additional schools or campuses or effectively identify suitable expansion opportunities could reduce our ability to implement our growth strategy.
As part of our business strategy, we anticipate opening and operating new schools or campuses. Establishing new schools or campuses poses unique challenges and requires us to make investments in management and capital expenditures, incur marketing expenses and devote financial and other resources that are different, and in some cases greater than those required with respect to the operation of acquired schools.
To open a new school or campus, we would be required to obtain appropriate state and accrediting commission approvals, which may be conditioned or delayed in a manner that could significantly affect our growth plans. In addition, to be eligible for federal Title IV Program funding, a new school or campus would have to be certified by the DOE and would require federal authorization and approvals. In the case of entirely separate, freestanding U.S. schools, a minimum of two years' operating history is required to be eligible for Title IV Program funding. We cannot be sure that we will be able to identify suitable expansion opportunities or that we will be able to successfully integrate or profitably operate any new schools or campuses. A failure by us to effectively identify suitable expansion opportunities and to establish and manage the operations of newly established schools or online offerings could make any newly established schools or our online programs unprofitable or more costly to operate than we had planned.
Our success depends in part on our ability to update and expand the content of existing programs and develop new programs in a cost-effective manner and on a timely basis.
Prospective employers of our graduates increasingly demand that their entry-level employees possess appropriate technological skills. These skills are becoming more sophisticated in line with technological advancements in the automotive, diesel, information technology, or IT, skilled trades, healthcare industries and hospitality services. Accordingly, educational programs at our schools must keep pace with those technological advancements. The expansion of our existing programs and the development of new programs may not be accepted by our students, prospective employers or the technical education market. Even if we are able to develop acceptable new programs, we may not be able to introduce these new programs as quickly as our competitors or as quickly as employers demand. If we are unable to adequately respond to changes in market requirements due to financial constraints, unusually rapid technological changes or other factors, our ability to attract and retain students could be impaired, our placement rates could suffer and our revenues could be adversely affected.
In addition, if we are unable to adequately anticipate the requirements of the employers we serve, we may offer programs that do not teach skills useful to prospective employers or students seeking a technical or career-oriented education which could affect our placement rates and our ability to attract and retain students, causing our revenues to be adversely affected.
We may not be able to retain our key personnel or hire and retain the personnel we need to sustain and grow our business.
Our success has depended, and will continue to depend, largely on the skills, efforts and motivation of our executive officers who generally have significant experience within the post-secondary education industry. Our success also depends in large part upon our ability to attract and retain highly qualified faculty, school directors, administrators and corporate management. Due to the nature of our business, we face significant competition in the attraction and retention of personnel who possess the skill sets that we seek. In addition, key personnel may leave us and subsequently compete against us. Furthermore, we do not currently carry "key man" life insurance on any of our employees. The loss of the services of any of our key personnel, or our failure to attract and retain other qualified and experienced personnel on acceptable terms, could have an adverse effect on our ability to operate our business efficiently and to execute our growth strategy.
If we are unable to hire, retain and continue to develop and train our employees responsible for student recruitment, the effectiveness of our student recruiting efforts would be adversely affected.
In order to support revenue growth, we need to hire new employees dedicated to student recruitment and retain and continue to develop and train our current student recruitment personnel. Our ability to develop a strong student recruiting team may be affected by a number of factors, including our ability to integrate and motivate our student recruiters; our ability to effectively train our student recruiters; the length of time it takes new student recruiters to become productive; regulatory restrictions on the method of compensating student recruiters; the competition in hiring and retaining student recruiters; and our ability to effectively manage a multi-location educational organization. If we are unable to hire, develop or retain our student recruiters, the effectiveness of our student recruiting efforts would be adversely affected.
Competition could decrease our market share and cause us to lower our tuition rates.
The post-secondary education market is highly competitive. Our schools compete for students and faculty with traditional public and private two-year and four-year colleges and universities and other proprietary schools, many of which have greater financial resources than we do. Some traditional public and private colleges and universities, as well as other private career-oriented schools, offer programs that may be perceived by students to be similar to ours. Most public institutions are able to charge lower tuition than our schools, due in part to government subsidies and other financial resources not available to for-profit schools. Some of our competitors also have substantially greater financial and other resources than we have which may, among other things, allow our competitors to secure strategic relationships with some or all of our existing strategic partners or develop other high profile strategic relationships, or devote more resources to expanding their programs and their school network, or provide greater financing alternatives to their students, all of which could affect the success of our marketing programs. In addition, some of our competitors have a larger network of schools and campuses than we do, enabling them to recruit students more effectively from a wider geographic area. If we are unable to compete effectively with these institutions for students, our student enrollment and revenues will be adversely affected.
We may be required to reduce tuition or increase spending in response to competition in order to retain or attract students or pursue new market opportunities. As a result, our market share, revenues and operating margin may be decreased. We cannot be sure that we will be able to compete successfully against current or future competitors or that the competitive pressures we face will not adversely affect our revenues and profitability.
We may experience business interruptions resulting from natural disasters, inclement weather, transit disruptions, or other events in one or more of the geographic areas in which we operate.
We may experience business interruptions resulting from natural disasters, inclement weather, transit disruptions, or other events in one or more of the geographic areas in which we operate. These events could cause us to close schools temporarily or permanently and could affect student recruiting opportunities in those locations, causing enrollment and revenues to decline.
Our financial performance depends in part on our ability to continue to develop awareness and acceptance of our programs among high school graduates and working adults looking to return to school.
The awareness of our programs among high school graduates and working adults looking to return to school is critical to the continued acceptance and growth of our programs. Our inability to continue to develop awareness of our programs could reduce our enrollments and impair our ability to increase our revenues or maintain profitability. The following are some of the factors that could prevent us from successfully marketing our programs:
| · | Student dissatisfaction with our programs and services; |
| · | Diminished access to high school student populations; |
| · | Our failure to maintain or expand our brand or other factors related to our marketing or advertising practices; and |
| · | Our inability to maintain relationships with automotive, diesel, healthcare, skilled trades, IT and hospitality services manufacturers, suppliers and employers. |
If students fail to pay their outstanding balances, our profitability will be adversely affected.
We offer a variety of payment plans to help students pay the portion of their education expense not covered by financial aid programs. These balances are unsecured and not guaranteed. Although we have reserved for estimated losses related to unpaid student balances, losses in excess of the amounts we have reserved for bad debts will result in a reduction in our profitability.
An increase in interest rates could adversely affect our ability to attract and retain students.
Interest rates have reached historical lows in recent years, creating a favorable borrowing environment for our students. Much of the financing our students receive is tied to floating interest rates. Increases in interest rates result in a corresponding increase in the cost to our existing and prospective students of financing their education which could result in a reduction in the number of students attending our schools and could adversely affect our results of operations and revenues. Higher interest rates could also contribute to higher default rates with respect to our students' repayment of their education loans. Higher default rates may in turn adversely impact our eligibility for Title IV Program participation or the willingness of private lenders to make private loan programs available to students who attend our schools, which could result in a reduction in our student population.
Seasonal and other fluctuations in our results of operations could adversely affect the trading price of our common stock.
Our results of operations fluctuate as a result of seasonal variations in our business, principally due to changes in total student population. Student population varies as a result of new student enrollment, graduations and student attrition. Historically, our schools have had lower student populations in our first and second quarters and we have experienced large class starts in the third and fourth quarters and student attrition in the first half of the year. Our second half growth is largely dependent on a successful recruiting season. Our expenses, however, do not vary significantly over the course of the year with changes in our student population and net revenues. We expect quarterly fluctuations in results of operations to continue as a result of seasonal enrollment patterns. Such patterns may change, however, as a result of acquisitions, new school openings, new program introductions and increased enrollments of adult students. These fluctuations may result in volatility or have an adverse effect on the market price of our common stock.
Our total assets include substantial intangible assets. In the event that our schools do not achieve satisfactory operating results, we may be required to write-off of a significant portion of unamortized intangible assets which would negatively affect our results of operations.
Our total assets reflect substantial intangible assets. At December 31, 2012,2013, goodwill and identified intangibles, net, associated with our acquisitions represented approximately 19.5%21.0% of total assets. On at least an annual basis, we assess whether there has been an impairment in the value of goodwill and other intangible assets with indefinite lives. If the carrying value of the tested asset exceeds its estimated fair value, impairment is deemed to have occurred. In this event, the amount is written down to fair value. Under current accounting rules, this would result in a charge to operating earnings. Any determination requiring the write-off of a significant portion of goodwill or unamortized identified intangible assets would negatively affect our results of operations and total capitalization, which could be material.
In 2013, we tested goodwill and indefinite-lived intangibles for impairment and determined that impairments existed which resulted in a pre-tax charge of $6.2 million ($2.3 million included in discontinued operations).
In 2012, we tested goodwill and indefinite-lived intangibles for impairment and determined that impairments existed which resulted in a pre-tax charge of $34.7$43.4 million ($5.518.2 million included in discontinued operations).
We cannot predict our future capital needs, and if we are unable to secure additional financing when needed, our operations and revenues would be adversely affected.
We may need to raise additional capital in the future to fund acquisitions, working capital requirements, expand our markets and program offerings or respond to competitive pressures or perceived opportunities. We cannot be sure that additional financing will be available to us on favorable terms, or at all particularly during times of uncertainty in the financial markets similar to that which is currently being experienced. If adequate funds are not available when required or on acceptable terms, we may be forced to forego attractive acquisition opportunities, cease our operations and, even if we are able to continue our operations, our ability to increase student enrollment and revenues would be adversely affected.
Our schools' failure to comply with environmental laws and regulations governing our activities could result in financial penalties and other costs which could adversely impact our results of operations.
We use hazardous materials at some of our schools and generate small quantities of waste, such as used oil, antifreeze, paint and car batteries. As a result, our schools are subject to a variety of environmental laws and regulations governing, among other things, the use, storage and disposal of solid and hazardous substances and waste, and the clean-up of contamination at our facilities or off-site locations to which we send or have sent waste for disposal. In the event we do not maintain compliance with any of these laws and regulations, or are responsible for a spill or release of hazardous materials, we could incur significant costs for clean-up, damages, and fines or penalties which could adversely impact our results of operations.
Approximately 42%48% of our schools are concentrated in the states of New Jersey, Connecticut and Pennsylvania and a change in the general economic or regulatory conditions in these states could increase our costs and have an adverse effect on our revenues.
As of December 31, 2012,2013, we operated 3833 campuses and five training sites in 1715 states. 16 of those schools are located in the states of New Jersey, Connecticut and Pennsylvania. As a result of this geographic concentration, any material change in general economic conditions in New Jersey, Connecticut or Pennsylvania could reduce our student enrollment in our schools located in these states and thereby reduce our revenues. In addition, the legislatures in the states of New Jersey, Connecticut and/or Pennsylvania could change the laws in those states or adopt regulations regarding private, for-profit post-secondary coeducation institutions which could place additional burdens on us. If we were unable to comply with any such new legislation, we could be prohibited from operating in those jurisdictions, which could reduce our revenues.
A substantial decrease in student financing options, or a significant increase in financing costs for our students, could have a material adverse affect on our student population, revenues and financial results.
The consumer credit markets in the United States have recently suffered from increases in default rates and foreclosures on mortgages. Adverse market conditions for consumer and federally guaranteed student loans could result in providers of alternative loans reducing the attractiveness and/or decreasing the availability of alternative loans to post-secondary students, including students with low credit scores who would not otherwise be eligible for credit-based alternative loans. Prospective students may find that these increased financing costs make borrowing prohibitively expensive and abandon or delay enrollment in post-secondary education programs. Private lenders could also require that we pay them new or increased fees in order to provide alternative loans to prospective students. If any of these scenarios were to occur, our students’ ability to finance their education could be adversely affected and our student population could decrease, which could have a material adverse effect on our financial condition, results of operations and cash flows.
In addition, any actions by the U.S. Congress or by states that significantly reduce funding for Title IV Programs or other student financial assistance programs, or the ability of our students to participate in these programs, or establish different or more stringent requirements for our schools to participate in those programs, could have a material adverse effect on our student population, results of operations and cash flows.
Anti-takeover provisions in our amended and restated certificate of incorporation, our amended and restated bylaws and New Jersey law could discourage a change of control that our stockholders may favor, which could negatively affect our stock price.
Provisions in our amended and restated certificate of incorporation and our amended and restated bylaws and applicable provisions of the New Jersey Business Corporation Act may make it more difficult and expensive for a third party to acquire control of us even if a change of control would be beneficial to the interests of our stockholders. These provisions could discourage potential takeover attempts and could adversely affect the market price of our common stock. For example, applicable provisions of the New Jersey Business Corporation Act may discourage, delay or prevent a change in control by prohibiting us from engaging in a business combination with an interested stockholder for a period of five years after the person becomes an interested stockholder. Furthermore, our amended and restated certificate of incorporation and amended and restated bylaws:
| · | Authorize the issuance of blank check preferred stock that could be issued by our board of directors to thwart a takeover attempt; |
| · | Prohibit cumulative voting in the election of directors, which would otherwise allow holders of less than a majority of stock to elect some directors; |
| · | Require super-majority voting to effect amendments to certain provisions of our amended and restated certificate of incorporation; |
| · | Limit who may call special meetings of both the board of directors and stockholders; |
| · | Prohibit stockholder action by non-unanimous written consent and otherwise require all stockholder actions to be taken at a meeting of the stockholders; |
| · | Establish advance notice requirements for nominating candidates for election to the board of directors or for proposing matters that can be acted upon by stockholders at stockholders' meetings; and |
| · | Require that vacancies on the board of directors, including newly created directorships, be filled only by a majority vote of directors then in office. |
We can issue shares of preferred stock without shareholder approval, which could adversely affect the rights of common stockholders.
Our amended and restated certificate of incorporation permits us to establish the rights, privileges, preferences and restrictions, including voting rights, of future series of our preferred stock and to issue such stock without approval from our stockholders. The rights of holders of our common stock may suffer as a result of the rights granted to holders of preferred stock that may be issued in the future. In addition, we could issue preferred stock to prevent a change in control of our company, depriving common stockholders of an opportunity to sell their stock at a price in excess of the prevailing market price.
A protracted economic slowdown and rising unemployment could harm our business if our students are unable to obtain employment upon completion of their programs, are unable to repay student loans or elect not to pursue an education with us.
We believe that many students pursue postsecondary education to be more competitive in the job market. However, the current economic recession has adversely affected job markets and a protracted economic slowdown could further increase unemployment and diminish job prospects and placement rates. Diminished job prospects and placement rates and heightened financial worries could affect the willingness of students to incur loans to pay for postsecondary education and to pursue postsecondary education in general. As a result, our enrollment and operating performance could suffer. The recent weakness in the job markets could also affect the prospects for long-term job growth, and there can be no assurance that the growth projected by the U.S. Bureau of Labor Statistics through 2016 will materialize.
In addition, many of our students borrow Title IV loans to pay for tuition, fees and other expenses. A protracted economic slowdown could negatively impact our students' ability to repay those loans which could negatively impact the cohort default rates of our institutions. Our 2011 draft cohort default rates at our institutions, as reported by the DOE range from 16.8% to 26.5%. Our 2010 cohort default rates at our institutions, as reported by the DOE range from 11.6%19.0% to 23.9%34.0%. Our 2009 cohort default rates at our institutions, as reported by the DOE range from 8.1%15.8% to 20.9%31.6%. The weakness in the economy could continue to increase default rates. For information regarding the historical default rates for our schools, see "Business—Regulatory Environment—Federal Family Education Loan Program" in this Annual Report on Form 10-K. An increase in our cohort default rates in excess of specified levels could cause our institutions to lose their eligibility to participate in some or all Title IV Programs which could have a material adverse effect on our operations. See “Risk Factors—Risks Related to Our Industry.”Industry”. Our institutions would lose eligibility to participate in Title IV Programs if their former students defaulted on repayment of their federal student loans in excess of specified levels, which could reduce our student population and revenues,revenues’ in this Annual Report on Form 10-K.
System disruptions to our technology infrastructure could impact our ability to generate revenue and could damage the reputation of our institutions.
The performance and reliability of our technology infrastructure is critical to our reputation and to our ability to attract and retain students. We license the software and related hosting and maintenance services for our online platform and our student information system from third-party software providers. Any system error or failure, or a sudden and significant increase in bandwidth usage, could result in the unavailability of systems to us or our students. Any such system disruptions could impact our ability to generate revenue and affect our ability to access information about our students and could also damage the reputation of our institutions.
None.
As of December 31, 2012,2013, we leased all of our facilities, except for our campuses in West Palm Beach, Florida, Nashville, Tennessee, Grand Prairie, Texas, Cincinnati (Tri-County), Ohio, Suffield, Connecticut, and Denver, Colorado, all of which we own. Four of our facilities (Union, New Jersey; Allentown, Pennsylvania; Philadelphia, Pennsylvania; and one of our facilities in Grand Prairie, Texas) were also accounted for by us under a finance lease obligation. We continue to re-evaluate our facilities to maximize our facility utilization and efficiency and to allow us to introduce new programs and attract more students. As of December 31, 2012,2013, all of our existing leases expire between March 2013July 2014 and October 2032.
The following table provides information relating to our facilities as of December 31, 2012,2013, including our corporate office:
| Location | Brand | Approximate Square Footage | |||
| Henderson, Nevada | Euphoria Institute | 18,000 | |||
| Las Vegas, Nevada | Euphoria Institute | 19,000 | |||
| North Las Vegas, Nevada | Euphoria Institute | 12,000 | |||
| Southington, Connecticut | Lincoln College of New England | 113,000 | |||
| Columbia, Maryland | Lincoln College of Technology | 110,000 | |||
| Denver, Colorado | Lincoln College of Technology | 212,000 | |||
| Grand Prairie, Texas | Lincoln College of Technology | 146,000 | |||
| Indianapolis, Indiana | Lincoln College of Technology | 189,000 | |||
| Marietta, Georgia | Lincoln College of Technology | 30,000 | |||
| Melrose Park, Illinois | Lincoln College of Technology | 88,000 | |||
| West Palm Beach, Florida | Lincoln College of Technology | ||||
| Hartford, Connecticut | Lincoln Technical Institute | 367,000 | |||
| Allentown, Pennsylvania | Lincoln Technical Institute | 26,000 | |||
| Brockton, Massachusetts | Lincoln Technical Institute | 22,000 | |||
| East Windsor, Connecticut | Lincoln Technical Institute | 289,000 | |||
| Edison, New Jersey | Lincoln Technical Institute | 64,000 | |||
| Fern Park, Florida | Lincoln Technical Institute | 46,000 | |||
| Hamden, Connecticut | Lincoln Technical Institute | 14,000 | |||
| Lincoln, Rhode Island | Lincoln Technical Institute | 59,000 | |||
| Lowell, Massachusetts | Lincoln Technical Institute | 21,000 | |||
| Mahwah, New Jersey | Lincoln Technical Institute | 79,000 | |||
| Moorestown, New Jersey | Lincoln Technical Institute | 35,000 | |||
| New Britain, Connecticut | Lincoln Technical Institute | 35,000 | |||
| Northeast Philadelphia, Pennsylvania | Lincoln Technical Institute | 25,000 | |||
| Paramus, New Jersey | Lincoln Technical Institute | 30,000 | |||
| Philadelphia, Pennsylvania | Lincoln Technical Institute | 36,000 | |||
| Philadelphia, Pennsylvania | Lincoln Technical Institute | 29,000 | |||
| Queens, New York | Lincoln Technical Institute | 48,000 | |||
| Shelton, Connecticut | Lincoln Technical Institute | ||||
| Somerville, Massachusetts | Lincoln Technical Institute | 33,000 | |||
| South Plainfield, New Jersey | Lincoln Technical Institute | 60,000 | |||
| Union, New Jersey | Lincoln Technical Institute | ||||
| Nashville, Tennessee | Lincoln College of Technology | 278,000 | |||
| West Orange, New Jersey | Corporate Office | 52,000 | |||
| Melbourne, Florida | Florida Medical Training Institute | ||||
| Jacksonville, Florida | Florida Medical Training Institute | ||||
| Tampa, Florida | Florida Medical Training Institute | ||||
| Miami, Florida | Florida Medical Training Institute | ||||
| Coral Springs, Florida | Florida Medical Training Institute | �� 7,000 | |||
| 7,000 | |||||
We believe that our facilities are suitable for their present intended purposes.
In the ordinary conduct of our business, we are subject to periodic lawsuits, investigations and claims, including, but not limited to, claims involving students or graduates and routine employment matters. Although we cannot predict with certainty the ultimate resolution of lawsuits, investigations and claims asserted against us, we do not believe that any currently pending legal proceeding to which we are a party will have a material effect on our business, financial condition, results of operations or cash flows.
On November 21, 2012, we received a Civil Investigation Demand from the Attorney General of the Commonwealth of Massachusetts relating to their investigation of whether we and certain of our academic institutions have complied with certain Massachusetts state consumer protection and finance laws. On July 29, 2013 and January 17, 2014, we received follow-up Civil Investigative Demands. Pursuant to the Civil Investigative Demand,Demands, the Attorney General has requested from us and certain of our academic institutions documents and detailed information from the time period January 1, 2008 to the present. The Company has responded to this request and intends to continue cooperating with the Attorney General’s Office.
Not applicable.
35
Market for our Common Stock
Our common stock is quoted on the Nasdaq Global Select Market under the symbol “LINC”.
The following table sets forth the range of high and low sales prices per share for our common stock, as reported by the Nasdaq Global Select Market, for the periods indicated and the cash dividends per share declared on our common stock:
| Price Range of Common Stock | ||||||||||||
| High | Low | Dividend | ||||||||||
| Fiscal Year Ended December 31, 2012 | ||||||||||||
| First Quarter | $ | 9.60 | $ | 7.62 | $ | 0.07 | ||||||
| Second Quarter | $ | 7.91 | $ | 5.49 | $ | 0.07 | ||||||
| Third Quarter | $ | 6.38 | $ | 3.44 | $ | 0.07 | ||||||
| Fourth Quarter | $ | 5.94 | $ | 3.64 | $ | 0.07 | ||||||
| Price Range of Common Stock | ||||||||||||
| High | Low | Dividend | ||||||||||
| Fiscal Year Ended December 31, 2011 | ||||||||||||
| First Quarter | $ | 16.62 | $ | 14.28 | $ | 0.25 | ||||||
| Second Quarter | $ | 17.29 | $ | 14.11 | $ | 0.25 | ||||||
| Third Quarter | $ | 19.46 | $ | 7.62 | $ | 0.25 | ||||||
| Fourth Quarter | $ | 9.64 | $ | 6.89 | $ | 0.07 | ||||||
| Price Range of Common Stock | ||||||||||||
| High | Low | Dividend | ||||||||||
| Fiscal Year Ended December 31, 2013 | ||||||||||||
| First Quarter | $ | 6.59 | $ | 5.00 | $ | 0.07 | ||||||
| Second Quarter | $ | 7.02 | $ | 5.12 | $ | 0.07 | ||||||
| Third Quarter | $ | 6.99 | $ | 4.58 | $ | 0.07 | ||||||
| Fourth Quarter | $ | 5.56 | $ | 4.48 | $ | 0.07 | ||||||
| Price Range of Common Stock | ||||||||||||
| High | Low | Dividend | ||||||||||
| Fiscal Year Ended December 31, 2012 | ||||||||||||
| First Quarter | $ | 9.60 | $ | 7.62 | $ | 0.07 | ||||||
| Second Quarter | $ | 7.91 | $ | 5.49 | $ | 0.07 | ||||||
| Third Quarter | $ | 6.38 | $ | 3.44 | $ | 0.07 | ||||||
| Fourth Quarter | $ | 5.94 | $ | 3.64 | $ | 0.07 | ||||||
On March 6, 2013,7, 2014, the last reported sale price of our common stock on the Nasdaq Global Select Market was $6.17$4.53 per share. As of March 6, 2013,7, 2014, based on the information provided by Continental Stock Transfer & Trust Company, there were approximately 42 stockholders of record of our common stock.
Dividend Policy
On October 30, 2012,November 5, 2013, our Board of Directors declared a quarterly cash dividend of $0.07 per share of common stock outstanding, which was paid on December 31, 20122013 to shareholders of record on December 14, 2012.13, 2013. The establishment of future record and payment dates is subject to the final determination of the Company’s Board of Directors.
36
Stock Performance Graph
This stock performance graph compares our total cumulative stockholder return on our common stock during the period from January 2, 20082009 through December 31, 20122013 with the cumulative return on the Russell 2000 Index and a Peer Issuer Group Index. The peer issuer group consists of the companies identified below, which were selected on the basis of the similar nature of their business. The graph assumes that $100 was invested on January 2, 2008,2009, and any dividends were reinvested on the date on which they were paid.
The information provided under the heading "Stock Performance Graph" shall not be considered "filed" for purposes of Section 18 of the Securities Exchange Act of 1934 or incorporated by reference in any filing under the Securities Act of 1933 or the Securities Exchange Act of 1934, except to the extent that we specifically incorporate it by reference into a filing.
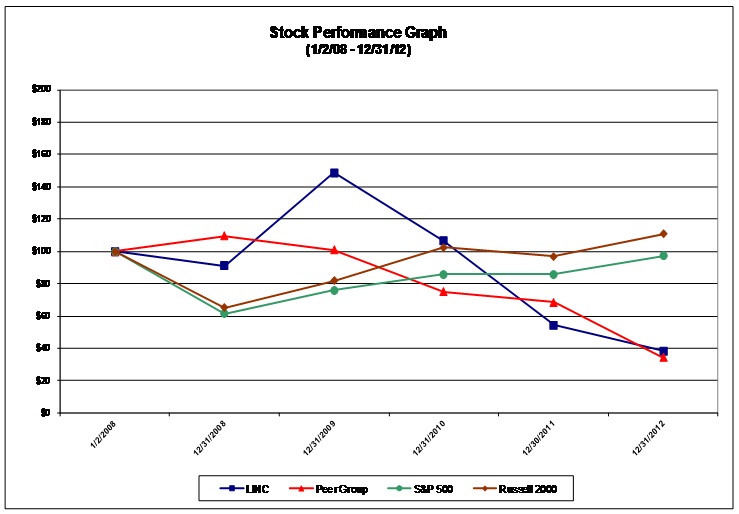
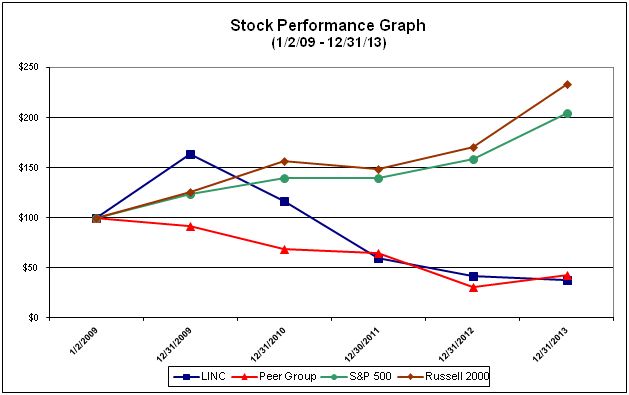
Companies in the Peer Group include Apollo Group, Inc., Corinthian Colleges, Inc., Career Education Corp., DeVry, Inc., ITT Educational Services, Inc., Strayer Education, Inc. and Universal Technical Institute, Inc.
Securities Authorized for Issuance under Equity Compensation Plans
We have various equity compensation plans under which equity securities are authorized for issuance. Information regarding these securities as of December 31, 20122013 is as follows:
| Plan Category | Number of Securities to be issued upon exercise of outstanding options, warrants and rights | Weighted-average exercise price of outstanding options, warrants and rights | Number of securities remaining available for future issuance under equity compensation plans (excluding securities reflected in column) | |||||||||
| Equity compensation plans approved by security holders | 547,125 | $ | 14.73 | 988,381 | ||||||||
| Equity compensation plans not approved by security holders | - | - | - | |||||||||
| Total | 547,125 | $ | 14.73 | 988,381 | ||||||||
| Plan Category | Number of Securities to be issued upon exercise of outstanding options, warrants and rights | Weighted- average exercise price of outstanding options, warrants and rights | Number of securities remaining available for future issuance under equity compensation plans (excluding securities reflected in column) | |||||||||
| Equity compensation plans approved by security holders | 655,875 | $ | 14.72 | 280,410 | ||||||||
| Equity compensation plans not approved by security holders | - | - | - | |||||||||
| Total | 655,875 | $ | 14.72 | 280,410 | ||||||||
38
The following table sets forth our selected historical consolidated financial and operating data as of the dates and for the periods indicated. You should read these data together with Item 7 - "Management's Discussion and Analysis of Financial Condition and Results of Operations" and our consolidated financial statements and the notes thereto included elsewhere in this Annual Report on Form 10-K. The selected historical consolidated statement of operations data for each of the years in the three-year period ended December 31, 20122013 and historical consolidated balance sheet data at December 31, 20122013 and 20112012 have been derived from our audited consolidated financial statements which are included elsewhere in this Annual Report on Form 10-K. The selected historical consolidated statements of operations data for the fiscal years ended December 31, 20092010 and 20082009 and historical consolidated balance sheet data as of December 31, 2011, 2010 2009 and 20082009 have been derived from our audited consolidated financial information not included in this Annual Report on Form 10-K. Our historical results are not necessarily indicative of our future results.
| 2012 | 2011 | 2010 | 2009 | 2008 | ||||||||||||||||||||||||||||||||||||
| (In thousands, except per share amounts) | 2013 | 2012 | 2011 | 2010 | 2009 | |||||||||||||||||||||||||||||||||||
| (In thousands, except per share amounts) | ||||||||||||||||||||||||||||||||||||||||
| Statement of Operations Data, Year Ended December 31: | Statement of Operations Data, Year Ended December 31: | |||||||||||||||||||||||||||||||||||||||
| Revenue | $ | 402,697 | $ | 491,821 | $ | 604,762 | $ | 526,745 | $ | 364,617 | $ | 345,024 | $ | 382,773 | $ | 456,722 | $ | 543,734 | $ | 480,037 | ||||||||||||||||||||
| Cost and expenses: | ||||||||||||||||||||||||||||||||||||||||
| Educational services and facilities | 192,205 | 210,892 | 227,331 | 202,501 | 150,394 | 172,685 | 180,610 | 196,639 | 210,684 | 189,820 | ||||||||||||||||||||||||||||||
| Selling, general and administrative (1) | 204,299 | 232,478 | 257,621 | 243,975 | 183,875 | |||||||||||||||||||||||||||||||||||
| Selling, general and administrative | 178,494 | 191,033 | 216,846 | 242,320 | 231,602 | |||||||||||||||||||||||||||||||||||
| (Gain) loss on sale of assets | (75 | ) | 5 | (14 | ) | 33 | 80 | (506 | ) | (75 | ) | 4 | (15 | ) | 28 | |||||||||||||||||||||||||
| Impairment of goodwill and long-lived assets | 33,925 | 8,290 | 4,850 | 215 | - | 3,908 | 25,221 | 8,290 | 4,850 | 215 | ||||||||||||||||||||||||||||||
| Total costs and expenses | 430,354 | 451,665 | 489,788 | 446,724 | 334,349 | 354,581 | 396,789 | 421,779 | 457,839 | 421,665 | ||||||||||||||||||||||||||||||
| Operating (loss) income | (27,657 | ) | 40,156 | 114,974 | 80,021 | 30,268 | (9,557 | ) | (14,016 | ) | 34,943 | 85,895 | 58,372 | |||||||||||||||||||||||||||
| Other: | ||||||||||||||||||||||||||||||||||||||||
| Interest income | 2 | 40 | 30 | 29 | 113 | 37 | 2 | 17 | 30 | 29 | ||||||||||||||||||||||||||||||
| Interest expense | (4,475 | ) | (4,369 | ) | (4,523 | ) | (4,272 | ) | (2,151 | ) | (4,667 | ) | (4,475 | ) | (4,369 | ) | (4,522 | ) | (4,270 | ) | ||||||||||||||||||||
| Other income | 14 | 18 | 45 | 35 | - | 18 | 14 | 18 | 45 | 35 | ||||||||||||||||||||||||||||||
| (Loss) income from continuing operations before income taxes | (32,116 | ) | 35,845 | 110,526 | 75,813 | 28,230 | (14,169 | ) | (18,475 | ) | 30,609 | 81,448 | 54,166 | |||||||||||||||||||||||||||
| (Benefit) provision for income taxes | (8,235 | ) | 14,730 | 44,839 | 31,557 | 11,243 | ||||||||||||||||||||||||||||||||||
| Provision (benefit) for income taxes (1) | 19,591 | (2,791 | ) | 13,053 | 31,117 | 22,916 | ||||||||||||||||||||||||||||||||||
| (Loss) income from continuing operations | (23,881 | ) | 21,115 | 65,687 | 44,256 | 16,987 | (33,760 | ) | (15,684 | ) | 17,556 | 50,331 | 31,250 | |||||||||||||||||||||||||||
| (Loss) gain from discontinued operations, net of income taxes | (13,305 | ) | (3,575 | ) | 4,044 | 4,983 | 3,208 | (17,526 | ) | (21,502 | ) | (16 | ) | 19,400 | 17,989 | |||||||||||||||||||||||||
| Net (loss) income | $ | (37,186 | ) | $ | 17,540 | $ | 69,731 | $ | 49,239 | $ | 20,195 | $ | (51,286 | ) | $ | (37,186 | ) | $ | 17,540 | $ | 69,731 | $ | 49,239 | |||||||||||||||||
| Basic | ||||||||||||||||||||||||||||||||||||||||
| (Loss) earnings per share from continuing operations | $ | (1.08 | ) | $ | 0.96 | $ | 2.69 | $ | 1.68 | $ | 0.67 | $ | (1.50 | ) | $ | (0.71 | ) | $ | 0.80 | $ | 2.06 | $ | 1.19 | |||||||||||||||||
| (Loss) earnings per share from discontinued operations | (0.60 | ) | (0.16 | ) | 0.17 | 0.19 | 0.13 | (0.78 | ) | (0.97 | ) | (0.00 | ) | 0.79 | 0.68 | |||||||||||||||||||||||||
| Net (loss) income per share | $ | (1.68 | ) | $ | 0.80 | $ | 2.86 | $ | 1.87 | $ | 0.80 | $ | (2.28 | ) | $ | (1.68 | ) | $ | 0.80 | $ | 2.86 | $ | 1.87 | |||||||||||||||||
| Diluted | ||||||||||||||||||||||||||||||||||||||||
| (Loss) earnings per share from continuing operations | $ | (1.08 | ) | $ | 0.95 | $ | 2.63 | $ | 1.63 | $ | 0.65 | $ | (1.50 | ) | $ | (0.71 | ) | $ | 0.79 | $ | 2.01 | $ | 1.15 | |||||||||||||||||
| (Loss) earnings per share from discontinued operations | (0.60 | ) | (0.16 | ) | 0.16 | 0.19 | 0.13 | (0.78 | ) | (0.97 | ) | (0.00 | ) | 0.78 | 0.66 | |||||||||||||||||||||||||
| Net (loss) income per share | $ | (1.68 | ) | $ | 0.79 | $ | 2.79 | $ | 1.82 | $ | 0.78 | $ | (2.28 | ) | $ | (1.68 | ) | $ | 0.79 | $ | 2.79 | $ | 1.82 | |||||||||||||||||
| Weighted average number of common shares outstanding: | ||||||||||||||||||||||||||||||||||||||||
| Basic | 22,195 | 22,020 | 24,418 | 26,337 | 25,308 | 22,513 | 22,195 | 22,020 | 24,418 | 26,337 | ||||||||||||||||||||||||||||||
| Diluted | 22,195 | 22,155 | 25,024 | 27,095 | 25,984 | 22,513 | 22,195 | 22,155 | 25,024 | 27,095 | ||||||||||||||||||||||||||||||
| Other Data: | ||||||||||||||||||||||||||||||||||||||||
| Capital expenditures | $ | 8,839 | $ | 38,119 | $ | 42,352 | $ | 24,018 | $ | 20,166 | $ | 6,538 | $ | 8,839 | $ | 38,119 | $ | 42,352 | $ | 24,018 | ||||||||||||||||||||
| Depreciation and amortization from continuing operations | 25,592 | 26,924 | 25,281 | 23,857 | 17,797 | 22,002 | 24,094 | 25,320 | 24,067 | 23,056 | ||||||||||||||||||||||||||||||
| Number of campuses | 38 | 39 | 39 | 38 | 34 | 33 | 33 | 34 | 34 | 34 | ||||||||||||||||||||||||||||||
| Average student population from continuing operations (2) | 18,086 | 23,276 | 29,735 | 26,404 | 19,199 | 15,009 | 17,121 | 21,396 | 26,221 | 23,609 | ||||||||||||||||||||||||||||||
| Cash dividend declared per common share | $ | 0.28 | $ | 0.07 | $ | 1.00 | $ | - | $ | - | $ | 0.28 | $ | 0.28 | $ | 0.07 | $ | 1.00 | $ | - | ||||||||||||||||||||
| Balance Sheet Data, At December 31: | ||||||||||||||||||||||||||||||||||||||||
| Cash and cash equivalents | $ | 61,708 | $ | 26,524 | $ | 65,995 | $ | 46,076 | $ | 15,234 | ||||||||||||||||||||||||||||||
| Cash and cash equivalents and restricted cash | $ | 67,386 | $ | 61,708 | $ | 26,524 | $ | 66,689 | $ | 46,934 | ||||||||||||||||||||||||||||||
| Working capital (deficit) (3) | 40,939 | 1,540 | (4,176 | ) | 4,494 | (19,840 | ) | 47,041 | 40,939 | 1,540 | (4,176 | ) | 4,494 | |||||||||||||||||||||||||||
| Total assets | 346,774 | 362,251 | 412,822 | 388,368 | 268,042 | 305,949 | 346,774 | 362,251 | 412,822 | 388,368 | ||||||||||||||||||||||||||||||
| Total debt (4) | 73,527 | 36,508 | 56,945 | 57,328 | 10,174 | 90,116 | 73,527 | 36,508 | 56,945 | 57,328 | ||||||||||||||||||||||||||||||
| Total stockholders' equity | 198,477 | 239,025 | 222,485 | 218,636 | 174,949 | 145,196 | 198,477 | 239,025 | 222,485 | 218,636 | ||||||||||||||||||||||||||||||
39
All amounts have been restated to give effect to discontinued operations in 2013 and 2012.
(1) Selling, general and administrative expenses include $1.4Provision (benefit) for income taxes includes a valuation allowance from continuing operations of $24.5 million and $0.9 million of acquisition costs incurred duringfor the yearsyear ended December 31, 2009 and 2008, respectively, in connection with the acquisition of BAR which was completed on January 20, 2009.2013.
(2) Average student population includes diploma and above students and excludes short certificate programs.
(3) Working capital (deficit) is defined as current assets less current liabilities.
(4) Total debt consists of long-term debt including current portion, capital leases, auto loans and a finance obligation of $9.7 million for each of the years in the five-year period ended December 31, 20122013 incurred in connection with a sale-leaseback transaction as further described in Note 9 to the consolidated financial statements included elsewhere in this Annual Report on Form 10-K.
You should read the following discussion together with the “Selected Financial Data,” “Forward Looking Statements” and the consolidated financial statements and the related notes thereto included elsewhere in this Annual Report on Form 10-K. This discussion contains forward-looking statements that are based on management’s current expectations, estimates and projections about our business and operations. Our actual results may differ materially from those currently anticipated and expressed in such forward-looking statements as a result of a number of factors, including those we discuss under “Risk Factors” and “Forward Looking Statements” and elsewhere in this Annual Report on Form 10-K.
GENERAL
We are a leading provider of diversified career-oriented post-secondary education as measured by total enrollment. We offer recent high school graduates and working adults degree and diploma programs in five areas of study: automotive technology, health sciences, skilled trades, hospitality services and business and information technology. Each area of study is specifically designed to appeal to and meet the educational objectives of our student population, while also satisfying the criteria established by industry and employers. The resulting diversification limits dependence on any one industry for enrollment growth or placement opportunities and broadens potential branches for introducing new programs. As of December 31, 2012,2013, we enrolled 16,23513,740 students in diploma and degree programs and 305104 in certificate programs at our 3833 campuses and five training sites across 17 states (exclusive of discontinued operations).15 states. Of those schools, 16 are located in the states of New Jersey, Connecticut and Pennsylvania.
We have increased our geographic footprint and our diversity through acquisitions and through initial start-ups. Our campuses, a majority of which serve major metropolitan markets, are located throughout the United States. Five of our campuses are destination schools, which attract students from across the United States and, in some cases, from abroad. Our other campuses primarily attract students from their local communities and surrounding areas. All of our schools are either nationally or regionally accredited and are eligible to participate in federal financial aid programs.
Our revenues consist primarily of student tuition and fees derived from the programs we offer. Our revenues are reduced by scholarships granted to our students. We recognize revenues from tuition and one-time fees, such as application fees, ratably over the length of a program, including internships or externships that take place prior to graduation. We also earn revenues from our bookstores, dormitories, cafeterias and contract training services. These non-tuition revenues are recognized upon delivery of goods or as services are performed and represent less than 10% of our revenues.
Tuition varies by school and by program and on average we increase tuition once a year by 3% to 5%. Our ability to raise tuition is influenced by the demand for our programs, by the rate of tuition increase at other post-secondary schools and by regulatory requirements. If historical trends continue, we expect to be able to continue to raise tuition annually at comparable rates.
Historically, our revenue grew as a result of strategic acquisitions coupled with organic growth. Commencing in late 2010, the DOE proposed regulations that place a greater focus on student outcomes. Specifically, these regulations are intended to ensure that students' debt levels can be serviced with the salary levels they can obtain after graduation and, consequently, that students are able to repay their government loans. The proposed regulations resulted in our admissions becoming more selective. As a result of the regulations, we identified “ability to benefit” (“ATB”) students as a high risk due to their greater likelihood to drop out and subsequently default on their loans, and we reduced the number of “ability to benefit”ATB students we would admit. On December 23, 2011, the Consolidated Appropriations Act, Public Law 112-74, among other things, eliminated federal student aid to ATB students who first enroll on or after July 1, 2012. As a result, we stopped enrolling ATB students on July 1, 2012. These changes to our business model decreased our enrollments and our revenues and caused pressure on our margins as we decreased these students to below 10% of our population over the last several years.margins.
As a result of a greater percentage of financial aid available, a greater number of students were able to finance their educations entirely from financial aid sources. While this provided greater opportunities for our students, it also severely impacted our ability to comply with the 90/10 Rule. Because of the increases in Title IV student loan limits and grants in recent years, it has become difficult for us to comply with the 90/10 Rule. We considered two alternatives to aid us with our compliance with the 90/10 Rule: increasing tuition prices above the applicable maximums for Title IV student loans and grants or restructuring certain of our programs. We decided to restructure program offerings. This resulted in increasing the financing gaps between tuition and the amount of financial aid available to cover the financing gap. This resulted in students having to attend classes longer each week as well as students having to make regular monthly cash payments. These actions have led to a decrease in the number of students who have enrolled at our institutions. In addition, in May the President signed the Appropriations Act which eliminated the ability of ATB students to obtain financial aid. This led to further reductions in our student population and revenues.
Our operating expenses, while a function of our revenue growth, contain a high fixed cost component. Our educational services and facilities expenses as a percentage of revenues increased to 47.7%50.1% in 2013 from 47.2% in 2012 from 42.9%and 43.1% in 2011, and 37.6% in 2010, and selling, general and administrative expenses increased as a percentage of revenue to 50.8%51.7% in 2013 from 49.9% in 2012 from 47.2%and 47.5% in 2011 and 42.6% in 2010. The revenue increases we experienced in 2010 produced meaningful leverage and operating margins.2011. As our enrollment declined, we experienced significant negative leverage due to lower utilization at our schools.
Our revenues are directly dependent on the average number of students enrolled in our schools and the courses in which they are enrolled. Our average enrollment is impacted by the number of new students starting, re-entering, graduating and withdrawing from our schools. In addition, our diploma/certificate programs range from 22 to 112106 weeks, our associate’s degree programs range from 48 to 123156 weeks, and our bachelor’s degree programs range from 132142 to 284208 weeks, and students attend classes for different amounts of time per week depending on the school and program in which they are enrolled. Because we start new students every month, our total student population changes monthly. The number of students enrolling or re-entering our programs each month is driven by the demand for our programs, the effectiveness of our marketing and advertising, the availability of financial aid and other sources of funding, the number of recent high school graduates, the job market and seasonality. Our retention and graduation rates are influenced by the quality and commitment of our teachers and student services personnel, the effectiveness of our programs, the placement rate and success of our graduates and the availability of financial aid. Although similar courses have comparable tuition rates, the tuition rates vary among our numerous programs. As more of our schools receive approval to offer associate’s degree and bachelor’s degree programs, which are longer than our diploma degree programs, we would expect our average enrollment and the average length of stay of our students to increase.
The majority of students enrolled at our schools rely on funds received under various government-sponsored student financial aid programs to pay a substantial portion of their tuition and other education-related expenses. The largest of these programs are Title IV Programs which represented approximately 81%80% of our cash receipts relating to revenues in 2012.2013.
We extend credit for tuition and fees to many of our students that attend our campuses. Our credit risk is mitigated through the student’s participation in federally funded financial aid programs unless students withdraw prior to the receipt by us of Title IV funds for those students. Under Title IV Programs, the government funds a certain portion of a students’ tuition, with the remainder, referred to as “the gap,” financed by students themselves under private party loans, including credit extended by us. The gap amount has continued to increase over the last several years as we have raised tuition on average for the last several years by 3% to 5% per year and restructured certain programs to reduce the amount of financial aid available to students, while funds received from Title IV Programs increased at lower rates.
The additional financing that we are providing to students may expose us to greater credit risk and can impact our liquidity. However, we believe that these risks are somewhat mitigated due to the following:
| · | Annual federal Title IV loan limits, including grants have increased. Title IV funds represented |
| · | Our internal financing is provided to students only after all other funding resources have been exhausted; thus, by the time this funding is available, students have completed approximately two-thirds of their curriculum and are more likely to graduate; |
| · | Funding for students who interrupt their education is typically covered by Title IV funds as long as they have been properly packaged for financial aid; and |
| · | We have a good collection history with our graduates. Historically, |
For the year ended December 31, 2012,2013, approximately 81%80% of our revenue on a cash basis was derived from Title IV funds and approximately 19%20% was derived from state grants and cash payments made by students. The HEA requires institutions to use the cash basis of accounting when determining its compliance with the 90/10 rule. For the year ended December 31, 2011,2012, approximately 84%81% of our revenue on a cash basis was derived from Title IV funds, approximately 16%19% was derived from state grants and cash payments made by students. The credit crisis that has impacted the financial markets has had a limited impact on our ability to finance our creditworthy students. However, no assurance can be given that the worsening of the economy or tightening of the credit markets would not have a negative impact on our ability to continue to finance our creditworthy students. We have several alternative lenders that will provide private party loansFor students who are unable to creditworthy students. For non-credit worthy students,get traditional financing, we providemake available the gap financing for them to be able to attend school. As of December 31, 2012,2013, we had outstanding loan commitments to our students of $34.7$36.5 million as compared to $26.4$34.7 million at December 31, 2011.2012. Loan commitments, net of interest that would be due on the loans through maturity, were $26.5 million at December 31, 2013 as compared to $25.0 million at December 31, 2012 as compared to $20.2 million at December 31, 2011.2012. Commitments at December 31, 20122013 represented an average commitment balance, including interest of approximately $6,500.
Our bad debt expense as a percentage of revenue decreased to 5.0%4.1% for 2013 from 5.1% in 2012 from 5.9%and 4.5% in 2011 and 6.2% in 2010.2011. The decrease in 20122013 as compared to 20112012 was attributable to our focused efforts on improving financial aid processes and collection activities which resulted in lower outstanding balances of our students including better collections from graduates than historically estimated. The decreaseincrease in 20112012 as compared to 20102011 was attributabledue to improved cash collections as well ashigher average accounts receivable balances throughout the year resulting from increased loans to our continuing efforts to further centralize the administration of our financial aid department. During the fourth quarter, we also reduced the allowance for our graduates as our experience has been significantly better than anticipated. The impact of this reduction was $1.5 million for the fourth quarter and the year. Had we kept our graduate reserve consistent with the prior year, our bad debt expense as a percentage of revenue would have been 5.4%.students.
All institutions participating in Title IV Programs must satisfy specific standards of financial responsibility. The DOE evaluates institutions for compliance with these standards each year, based on the institution’s annual audited financial statements, as well as following a change in ownership resulting in a change of control of the institution.
The most significant financial responsibility measurement is the institution's composite score, which is calculated by the DOE based on three ratios:
| · | the equity ratio, which measures the institution's capital resources, ability to borrow and financial viability; |
| · | the primary reserve ratio, which measures the institution's ability to support current operations from expendable resources; and |
| · | the net income ratio, which measures the institution's ability to operate at a profit. |
The DOE assigns a strength factor to the results of each of these ratios on a scale from negative 1.0 to positive 3.0, with negative 1.0 reflecting financial weakness and positive 3.0 reflecting financial strength. The DOE then assigns a weighting percentage to each ratio and adds the weighted scores for the three ratios together to produce a composite score for the institution. The composite score must be at least 1.5 for the institution to be deemed financially responsible without the need for further oversight. If an institution's composite score is below 1.5, but is at least 1.0, it is in a category denominated by the DOE as "the zone." Under the DOE regulations, institutions that are in the zone are deemed to be financially responsible for a period of up to three years but are required to accept payment of Title IV Program funds under the cash monitoring or reimbursement method of payment and to provide to the DOE timely information regarding various oversight and financial events.
The operating expenses associated with an existing school do not increase or decrease proportionally as the number of students enrolled at the school increases or decreases. We categorize our operating expenses as:
| · | Educational services and facilities. Major components of educational services and facilities expenses include faculty compensation and benefits, expenses of books and tools, facility rent, maintenance, utilities, depreciation and amortization of property and equipment used in the provision of education services and other costs directly associated with teaching our programs excluding student services which is included in selling, general and administrative expenses. |
| · | Selling, general and administrative. Selling, general and administrative expenses include compensation and benefits of employees who are not directly associated with the provision of educational services (such as executive management and school management, finance and central accounting, legal, human resources and business development), marketing and student enrollment expenses (including compensation and benefits of personnel employed in sales and marketing and student admissions), costs to develop curriculum, costs of professional services, bad debt expense, rent for our corporate headquarters, depreciation and amortization of property and equipment that is not used in the provision of educational services and other costs that are incidental to our operations. Selling, general and administrative expenses also includes the cost of all student services including financial aid and career services. All marketing and student enrollment expenses are recognized in the period incurred. |
DISCONTINUED OPERATIONS
2013 Event
On June 18, 2013, our Board of Directors approved a plan to attract a substantial portioncease operations at four campuses in Ohio and one campus in Kentucky consisting of our yearlyDayton institution and its branch campuses. Federal legislation implemented on July 1, 2012 that prohibits “ability to benefit” students from participating in federal student enrollment. We utilizefinancial aid programs led to a mixdramatic decrease in the number of different advertising mediums, including television, internet and direct mail.students attending these five campuses. Accordingly, we ceased operations at these campuses as of December 31, 2013. The results of operations of these campuses are reflected as discontinued operations in the consolidated financial statements.
| Year Ended December 31, | ||||||||||||
| 2013 | 2012 | 2011 | ||||||||||
| Revenue | $ | 7,724 | $ | 19,924 | $ | 35,099 | ||||||
| (Loss) income before income tax | (17,287 | ) | (13,641 | ) | 5,236 | |||||||
| Income tax expense (benefit) | 239 | (5,444 | ) | 1,677 | ||||||||
| Net (loss) income from discontinued operations | $ | (17,526 | ) | $ | (8,197 | ) | $ | 3,559 | ||||
Amounts include impairments of goodwill and long-lived assets for these campuses of $2.3 million and $8.7 million for the years ended December 31, 2013 and 2012, respectively.
2012 Event
On July 31, 2012, our Board of Directors approved a plan to cease operations at seven of our campuses. The adjustments made to our business model to better align with the DOE’s increased emphasis on student outcomes and our efforts to comply with the 90/10 rule and cohort default rates greatly impacted the population at these campuses. In addition, the current economic environment and regulatory changes under the Consolidated Appropriations Act, 2012, which eliminated the ability to enroll ATB“ability to benefit” (“ATB”) students, have made these campuses no longer viable. Accordingly, we decided to ceaseceased operations at these campuses and stopped enrolling new students in 2012. All seven schools had ceased operations as of December 31, 2012. The results of their operations are reflected as discontinued operations in ourthe consolidated financial statements.
The results of operations at these seven campuses for the threetwo year periods ended December 31, 2012 were as follows (in thousands):
| Year Ended December 31, | ||||||||||||
| 2012 | 2011 | 2010 | ||||||||||
| Revenue | $ | 8,500 | $ | 20,804 | $ | 34,732 | ||||||
| (Loss) income before income tax | (22,142 | ) | (5,260 | ) | 7,657 | |||||||
| Income tax (benefit) expense | (8,837 | ) | (1,685 | ) | 3,613 | |||||||
| Net (loss) income from discontinued operations | $ | (13,305 | ) | $ | (3,575 | ) | $ | 4,044 | ||||
| Year Ended December 31, | ||||||||
| 2012 | 2011 | |||||||
| Revenue | $ | 8,500 | $ | 20,804 | ||||
| Loss before income tax | (22,142 | ) | (5,260 | ) | ||||
| Income tax benefit | (8,837 | ) | (1,685 | ) | ||||
| Net loss from discontinued operations | $ | (13,305 | ) | $ | (3,575 | ) | ||
Amounts include impairments of goodwill and long-lived assets for these campuses of $9.5 million $2.1 million and $1.4$2.1 million for the years ended December 31, 2012 2011 and 2010,2011, respectively.
ACQUISITIONS
Acquisitions have been, and are expected to continue to be, a component of our growth strategy. We conduct financial, operational and regulatory due diligence. After an acquisition is completed, we utilize our staff to integrate the acquisition with our policies, procedures and systems.
On April 18, 2012, we acquired all of the rights, title and interest in certain assets and liabilities of FMTI for total consideration of $1.7 million, net of cash acquired. FMTI has five locations in Florida: Melbourne, Jacksonville, Tampa, Miami and Coral Springs. FMTI currently offers certificate programs in the fields of Emergency Medical Technician, Paramedic, EKG/Phlebotomy, Nursing Assistant, Fire Fighter and Associate of Science Degrees in Emergency Medical Services and Fire Science Technology. The acquisition of FMTI is an important part of our strategy to diversify the non-title IV cash received by us while remaining true to our core strengths of being a leading provider of vocational skills.
CRITICAL ACCOUNTING POLICIES AND ESTIMATES
Our discussions of our financial condition and results of operations are based upon our consolidated financial statements, which have been prepared in accordance with accounting principles generally accepted in the United States of America, or GAAP. The preparation of financial statements in conformity with GAAP requires management to make estimates and assumptions that affect the reported amounts of assets and liabilities and disclosure of contingent assets and liabilities at the date of the consolidated financial statements and the reported amounts of revenues and expenses during the period. On an ongoing basis, we evaluate our estimates and assumptions, including those related to revenue recognition, bad debts, fixed assets, goodwill and other intangible assets, income taxes and certain accruals. Actual results could differ from those estimates. The critical accounting policies discussed herein are not intended to be a comprehensive list of all of our accounting policies. In many cases, the accounting treatment of a particular transaction is specifically dictated by GAAP and does not result in significant management judgment in the application of such principles. We believe that the following accounting policies are most critical to us in that they represent the primary areas where financial information is subject to the application of management's estimates, assumptions and judgment in the preparation of our consolidated financial statements.
Revenue recognition. Revenues are derived primarily from programs taught at our schools. Tuition revenues and one-time fees, such as nonrefundable application fees, and course material fees are recognized on a straight-line basis over the length of the applicable program, which is the period of time from a student's start date through his or her graduation date, including internships or externships that take place prior to graduation. If a student withdraws from a program prior to a specified date, any paid but unearned tuition is refunded. Refunds are calculated and paid in accordance with federal, state and accrediting agency standards. Other revenues, such as tool sales and contract training revenues are recognized as services are performed or goods are delivered. On an individual student basis, tuition earned in excess of cash received is recorded as accounts receivable, and cash received in excess of tuition earned is recorded as unearned tuition.
Allowance for uncollectible accounts. Based upon experience and judgment, we establish an allowance for uncollectible accounts with respect to tuition receivables. We use an internal group of collectors, augmented by third-party collectors as deemed appropriate, in our collection efforts. In establishing our allowance for uncollectible accounts, we consider, among other things, current and expected economic conditions, a student's status (in-school or out-of-school), whether or not a student is currently making payments, and overall collection history. Changes in trends in any of these areas may impact the allowance for uncollectible accounts. The receivables balances of withdrawn students with delinquent obligations are reserved for based on our collection history. Although we believe that our reserves are adequate, if the financial condition of our students deteriorates, resulting in an impairment of their ability to make payments, additional allowances may be necessary, which will result in increased selling, general and administrative expenses in the period such determination is made.
Our bad debt expense as a percentage of revenues for the years ended December 31, 2013, 2012 and 2011 was 4.1%, 5.1% and 2010 was 5.0%, 5.9% and 6.2%4.5%, respectively. Our exposure to changes in our bad debt expense could impact our operations. A 1% increase in our bad debt expense as a percentage of revenues for the years ended December 31, 2013, 2012 2011 and 20102011 would have resulted in an increase in bad debt expense of $4.0$3.5 million, $4.9$3.8 million and $6.0$4.6 million, respectively.
We do not believe that there is any direct correlation between tuition increases, the credit we extend to students and our loan commitments. Our loan commitments to our students are made on a student-by-student basis and are predominantly a function of the specific student’s financial condition. We only extend credit to the extent there is a financing gap between the tuition charged for the program and the amount of grants, loans and parental loans each student receives. Each student’s funding requirements are unique. Factors that determine the amount of aid available to a student are student status (whether they are dependent or independent students), Pell grants awarded, Plus loans awarded or denied to parents and family contributions. As a result, it is extremely difficult to predict the number of students that will need us to extend credit to them. Our tuition increases have ranged historically from 3% to 5% annually and have not meaningfully impacted overall funding requirements, since the amount of financial aid funding available to students in recent years has increased at greater rates than our tuition increases.
Because a substantial portion of our revenues are derived from Title IV Programs, any legislative or regulatory action that significantly reduces the funding available under Title IV Programs or the ability of our students or schools to participate in Title IV Programs could have a material effect on the realizability of our receivables.
Goodwill. We test our goodwill for impairment annually, or whenever events or changes in circumstances indicate an impairment may have occurred, by comparing its fair value to its carrying value. Impairment may result from, among other things, deterioration in the performance of the acquired business, adverse market conditions, adverse changes in applicable laws or regulations, including changes that restrict the activities of the acquired business, and a variety of other circumstances. If we determine that impairment has occurred, we are required to record a write-down of the carrying value and charge the impairment as an operating expense in the period the determination is made. In evaluating the recoverability of the carrying value of goodwill and other indefinite-lived intangible assets, we must make assumptions regarding estimated future cash flows and other factors to determine the fair value of the acquired assets. Changes in strategy or market conditions could significantly impact these judgments in the future and require an adjustment to the recorded balances.
Goodwill represents a significant portion of our total assets. As of December 31, 2012,2013, goodwill was approximately $65.5$62.5 million, or 18.9%20.4%, of our total assets.
We test our goodwill for impairment using a two-step approach. The first step is conducted utilizing the multiple of earnings and discounted cash flow approach and comparing the carrying value of our reporting units to their implied fair value. If necessary, the second step is conducted comparing the carryingimplied fair value of goodwill for our reporting units to their implied fair value.with the carrying amount of that goodwill.
At December 31, 2013, we conducted our annual test for goodwill impairment and determined we did not have an impairment. As of June 30, 2013, we concluded that current period losses at two reporting units, which resulted in a deterioration of current and projected cash flows, was an indicator of potential impairment and, accordingly, tested goodwill and long-lived assets for impairment. The tests indicated that these two reporting units were impaired, which resulted in a pre-tax non-cash charge of $3.1 million for the three months ended June 30, 2013.
At December 31, 2012, we tested goodwill for impairment and determined that an impairment of approximately $18.3 million ($4.5 million included in discontinued operations) existed for seven of our reporting units. At June 30, 2012, weWe concluded that the decrease in the Company’sour market capitalization as of June 30, 2012 was an indicator of potential impairment and, accordingly, we tested goodwill for impairment. The tests indicated that five of our reporting units were impaired as a result of lower than expected student population, which resulted in a pre-tax charge of $15.4 million in the second quarter of 2012 ($5.58.4 million included in discontinued operations). The fair values of these reporting units were estimated using the expected present value of future cash flows. No other reporting unit’s carrying goodwill amount exceeded or approximated its implied value.
At December 31, 2011, we tested goodwill for impairment and determined we did not have an impairment. We concluded that the decrease in our market capitalization as of September 30, 2011 was an indicator of potential impairment and, accordingly, we tested goodwill and indefinite-lived intangibles for impairment. The tests indicated that five of the Company’s reporting units were impaired, which resulted in an expense of $9.3 million in the third quarter of 2011 ($1.0 million included in discontinued operations). At December 31, 2011, we tested goodwill for impairment and determined it did not have an impairment. At December 31, 2010, we tested goodwill for impairment and determined that an impairment of approximately $6.2 million existed for three of our reporting units ($1.4 million included in discontinued operations).
Stock-based compensation. We currently account for stock-based employee compensation arrangements by using the Black-Scholes valuation model and utilize straight-line amortization of compensation expense over the requisite service period of the grant. We make an estimate of expected forfeitures at the time options are granted.
The fair value of the stock options used to compute stock-based compensation is the estimated present value at the date of grant using the Black-Scholes option pricing model. During 2013 and 2011, there were no new stock option grants. The weighted average fair values of options granted during 2012 and 2010 werewas $2.52 and $8.48, respectively, using the following weighted average assumptions for grants:
| At December 31, | ||||||||
| 2012 | 2010 | |||||||
| Expected volatility | 51.25% | 45.00% | ||||||
| Expected dividend yield | 4% | 0% | ||||||
| Expected life (term) | 4.65 Years | 4.82 Years | ||||||
| Risk-free interest rate | 0.87% | 1.95% | ||||||
| Weighted-average exercise price during the year | $ | 7.79 | $ | 20.78 | ||||
| At December 31, | |||
| 2012 | |||
| Expected volatility | 51.25% | ||
| Expected dividend yield | 4% | ||
| Expected life (term) | 4.65 Years | ||
| Risk-free interest rate | 0.87% | ||
| Weighted-average exercise price during the year | $7.79 |
The expected volatility considers the volatility of our common stock that has been traded for a period commensurate with the expected life. The expected term of options granted represents the period of time that options granted are expected to be outstanding based on historical experience. The risk-free rate used is based on the published U.S. Treasury yield curve in effect at the time of grant for instruments with a similar life. The 2012 expected dividend yield presumes a set dividend rate based on the current dividend yield. For 2010,
Income taxes. We account for income taxes in accordance with FASB ASC Topic 740, “Income Taxes” (“ASC 740”). This statement requires an asset and a liability approach for measuring deferred taxes based on temporary differences between the dividend yieldfinancial statement and tax bases of assets and liabilities existing at each balance sheet date using enacted tax rates for years in which taxes are expected to be paid or recovered.
In accordance with ASC 740, we assess our deferred tax asset to determine whether all or any portion of the asset is 0% because atmore likely than not unrealizable. A valuation allowance is required to be established or maintained when, based on currently available information, it is more likely than not that all or a portion of a deferred tax asset will not be realized. In accordance with ASC 740, our assessment considers whether there has been sufficient income in recent years and whether sufficient income is expected in future years in order to utilize the timedeferred tax asset. In evaluating the options were grantedrealizability of deferred income tax assets we had not intendedconsidered, among other things, historical levels of income, expected future income, the expected timing of the reversals of existing temporary reporting differences, and the expected impact of tax planning strategies that may be implemented to declare prevent the potential loss of future income tax benefits. Significant judgment is required in determining the future tax consequences of events that have been recognized in our consolidated financial statements and/or pay dividendstax returns. Differences between anticipated and actual outcomes of these future tax consequences could have a material impact on our common stock.consolidated financial position or results of operations. Changes in, among other things, income tax legislation, statutory income tax rates, or future income levels could materially impact our valuation of income tax assets and liabilities and could cause our income tax provision to vary significantly among financial reporting periods.
We recognize accrued interest and penalties related to unrecognized tax benefits in income tax expense. During the years ended December 31, 2013 and 2012, the interest and penalties expense associated with uncertain tax positions are not significant to our results of operations or financial position.
Results of Continuing Operations for the Three Years Ended December 31, 20122013
The following table sets forth selected consolidated statements of continuing operations data as a percentage of revenues for each of the periods indicated:
| Year Ended December 31, | ||||||||||||
| 2013 | 2012 | 2011 | ||||||||||
| Revenue | 100.0 | % | 100.0 | % | 100.0 | % | ||||||
| Costs and expenses: | ||||||||||||
| Educational services and facilities | 50.1 | % | 47.2 | % | 43.1 | % | ||||||
| Selling, general and administrative | 51.7 | % | 49.9 | % | 47.5 | % | ||||||
| (Gain) loss on sale of assets | -0.1 | % | 0.0 | % | 0.0 | % | ||||||
| Impairment of goodwill and long-lived assets | 1.1 | % | 6.6 | % | 1.7 | % | ||||||
| Total costs and expenses | 102.8 | % | 103.7 | % | 92.3 | % | ||||||
| Operating (loss) income | -2.8 | % | -3.7 | % | 7.7 | % | ||||||
| Interest expense, net | -1.3 | % | -1.1 | % | -1.0 | % | ||||||
| (Loss) income from continuing operations before income taxes | -4.1 | % | -4.8 | % | 6.7 | % | ||||||
| Provision (benefit) for income taxes | 5.7 | % | -0.7 | % | 2.9 | % | ||||||
| (Loss) income from continuing operations | -9.8 | % | -4.1 | % | 3.8 | % | ||||||
Year Ended December 31, 2013 Compared to Year Ended December 31, 2012
Revenue. Revenue decreased by $37.7 million, or 9.9%, to $345.0 million for the year ended December 31, 2013 from $382.8 million for the year ended December 31, 2012. The decrease was primarily attributable to a 12.3% decrease in average student population, which decreased to 15,009 for the year ended December 31, 2013 from 17,121 for the year ended December 31, 2012, partially offset by a 2.8% increase in average revenue per student. We began 2013 with approximately 2,200, or 12.3%, fewer students than we had on January 1, 2012.
| Year Ended December 31, | ||||||||||||
| 2012 | 2011 | 2010 | ||||||||||
| Revenue | 100.0 | % | 100.0 | % | 100.0 | % | ||||||
| Costs and expenses: | ||||||||||||
| Educational services and facilities | 47.7 | % | 42.9 | % | 37.6 | % | ||||||
| Selling, general and administrative | 50.8 | % | 47.2 | % | 42.6 | % | ||||||
| Impairment of goodwill and long-lived assets | 8.4 | % | 1.7 | % | 0.8 | % | ||||||
| Total costs and expenses | 106.9 | % | 91.8 | % | 81.0 | % | ||||||
| Operating income | -6.9 | % | 8.2 | % | 19.0 | % | ||||||
| Interest expense, net | -1.1 | % | -0.9 | % | -0.7 | % | ||||||
| Other income | 0.0 | % | 0.0 | % | 0.0 | % | ||||||
| Income from continuing operations before income taxes | -8.0 | % | 7.3 | % | 18.3 | % | ||||||
| Provision for income taxes | -2.1 | % | 3.0 | % | 7.4 | % | ||||||
| Income from continuing operations | -5.9 | % | 4.3 | % | 10.9 | % | ||||||
Average revenue per student increased 2.8% for the year ended December 31, 2013 from the year ended December 31, 2012, primarily from tuition increases that averaged 3%. For a general discussion of trends in our student enrollment, see “- Seasonality and Trends” below.
Educational services and facilities expense. Our educational services and facilities expense decreased by $7.9 million, or 4.4%, to $172.7 million for the year ended December 31, 2013 from $180.6 million for the year ended December 31, 2012. This decrease in educational services and facilities expense was due to a $6.6 million, or 7.0%, decrease in instructional expenses, and a $1.3 million, or 7.3%, decrease in books and tools expense.
The decrease in instructional expenses was primarily due to a reduction in the number of instructors and other related costs at our campuses resulting from a lower student population. The decrease in books and tools expense was attributable to a decline in student starts of approximately 2,100 for the year ended December 31, 2013 compared to the year ended December 31, 2012.
Our education expenses contain a high fixed cost component and are not as leverageable as some of our other expenses. As our student population decreases, we typically experience reductions in average class size and, therefore, are not always able to align these expenses with the corresponding decrease in population.
As a result, educational services and facilities expenses, as a percentage of revenue, increased to 50.1% for the year ended December 31, 2013 from 47.2% for the year ended December 31, 2012.
Selling, general and administrative expense. Our selling, general and administrative expense for the year ended December 31, 2013 was $178.5 million, a decrease of $12.5 million, or 6.6%, from $191.0 million for the year ended December 31, 2012. This decrease was primarily due to a $9.0 million, or 8.6%, decrease in administrative expenses, a $2.6 million, or 3.9%, decrease in sales and marketing expenses and a $0.9 million, or 4.6%, decrease in student services expenses.
The decrease in administrative expenses was due to a $5.2 million reduction in bad debt expense and a reduction in compensation and benefits.
The bad debt expense as a percentage of revenue was 4.1% for the year ended December 31, 2013, compared to 5.1% for the year ended December 31, 2012. The reduction in bad debt as a percentage of revenue was due to our focused efforts on the financial aid processes and collection activities.
The decrease in sales and marketing expenses was primarily due to a reduction in marketing expenses as well as a reduction in the number of admissions representatives in order to align our cost structure to our student population.
As a percentage of revenues, selling, general and administrative expense for the year ended December 31, 2013 increased to 51.7% from 49.9% for the year ended December 31, 2012.
As of December 31, 2013, we had outstanding loan commitments to our students of $36.5 million as compared to $34.7 million at December 31, 2012. Loan commitments, net of interest that would be due on the loans through maturity, were $26.5 million at December 31, 2013 as compared to $25.0 million at December 31, 2012.
Impairment of goodwill and long-lived assets. We test our goodwill and long-lived assets and have determined the following: (a) there have been no new impairments as of December 31, 2013; (b)at June 30, 2013, we determined that an impairment of approximately $4.5 million existed for two of our reporting units and four asset groups related to goodwill and long-lived assets ($0.7 million is included in discontinued operations); (c) at March 31, 2013, we determined that an impairment of approximately $1.7 million existed for two asset groups related to long-lived assets ($1.6 million is included in discontinued operations); (d) at December 31, 2012, we determined that an impairment of approximately $19.7 million existed for seven of our reporting units and four asset groups related to long lived assets; and (e) at June 30, 2012, we determined that an impairment charge of approximately $23.7 million existed for five reporting units related to goodwill and 10 asset groups related to long-lived assets($9.4 million included in discontinued operations).
Net interest expense. Our net interest expense for the year ended December 31, 2013 was $4.6 million essentially flat compared to the year ended December 31, 2012.
Income taxes. Our provision for income taxes for the year ended December 31, 2013 was $19.6 million, or (138.3%) of pretax loss, compared to a benefit for income taxes of $2.8 million, or 15.1%, of pretax loss for the year ended December 31, 2012. The effective tax rate increase was primarily due to a $24.5 million valuation allowance recorded for the year ended December 31, 2013.
We assesses the available positive and negative evidence to estimate if sufficient future taxable income will be generated to use the existing deferred tax assets. A significant piece of objective negative evidence was the cumulative losses incurred by us in recent years. On the basis of this evaluation we believe it is more likely than not that we will realize the net deferred tax assets. As a result, as of December 31, 2013, we recorded a valuation allowance against the net deferred tax assets, excluding the indefinite life assets which generated a deferred tax liability.
Year Ended December 31, 2012 Compared to Year Ended December 31, 2011
Revenue. Revenue decreased by
The decrease in average student population is due to adjustments in our business model to be better aligned with the DOE’s increased emphasis on student outcomes as well as our efforts to comply with the 90/10 and cohort default rate rules. In addition, the current economic environment, our decision to stop enrolling fully online students in early 2012 and regulatory changes under the Appropriations Act which eliminated our ability to enroll ATB students, also contributed to the decline in average student population. As part of these measures, we implemented a more selective student enrollment policy to ensure that we enroll students who demonstrate a strong ability to achieve successful student outcomes, including higher graduation and repayment rates and lower student debt levels. We also restructured certain programs and altered program offerings at some of our campuses which resulted in lower financial aid funding availability and higher student cash contributions. We believe that these changes, coupled with the current economic conditions, have resulted in an increase in the number of potential students who are hesitant to take on debt and thus not enrolling in our schools. This led to a significant decline in student starts and average student population.
Average revenue per student increased 5.4%4.7% for the year ended December 31, 2012 from the year ended December 31, 2011, primarily from tuition increases that averaged 3%, improved student retention which led to higher revenue per student and from changes to some of our program offerings, which shortened the delivery time of these programs thus slightly accelerating revenue. For a general discussion of trends in our student enrollment, see “Seasonality“- Seasonality and Trends” below.
Educational services and facilities expense. Our educational services and facilities expense decreased by $18.7$16.0 million, or 8.9%8.2%, to $192.2$180.6 million for the year ended December 31, 2012 from $210.9$196.6 million for the year ended December 31, 2011. This decrease in educational services and facilities expense was due to a $15.3$13.0 million, or 13.2%12.2%, decrease in instructional expenses, a $1.7$1.5 million, or 7.7%7.5%, decrease in books and tools expense, and a $1.8$1.5 million, or 2.4%2.2%, decrease in facilities expense.
The decrease in instructional expenses was primarily due to a reduction in the number of instructors at most of our campuses resulting from a lower student population as well as our cost savings efforts in connection with the lower student population. The decrease in books and tools expense was attributable to a decline in student starts of approximately 1,7001,900 for the year ended December 31, 2012 compared to the year ended December 31, 2011. We began 2012 with approximately 9,000,7,000, or 32.8%28.5%, fewer students than we had on January 1, 2011. Facilities expense decreased primarily due to lower depreciation expense related to an impairment charge of long-lived assets and lower capital expenditures during the current year as well as decreased repairs and maintenance expenses and utilities expenses due to rate reductions in certain states.
Education expenses contain a high fixed cost component and are not as leverageable as some of our other expenses. As our student population decreases, we typically experience reductions in average class size and, therefore, are not always able to align these expenses with the corresponding drop in population.
As a result, educational services and facilities expenses, as a percentage of revenue, increased to 47.7%47.2% for the year ended December 31, 2012 from 42.9%43.1% for the year ended December 31, 2011.
Selling, general and administrative expense. Our selling, general and administrative expense for the year ended December 31, 2012 was
The decrease in administrative expenses was primarily due to:(a) a $8.6$6.8 million reduction in bad debt expense; (b) a $0.8 million decrease in costs associated with the financial accounting system implemented during 2011 as well as reduced maintenance expenses for our student management system; (c) $0.6$0.4 million lower non capitalized furniture expenses from the prior year as a result of the relocation of our Denver campus in 2011; and (d) a $1.0$0.9 million decrease in travel expenses attributed to our cost savings efforts.
The bad debt expense as a percentage of revenue was 5.0%5.1% for the year ended December 31, 2012, compared to 5.9%4.5% for the year ended December 31, 2011. The reductionincrease in bad debt as a percentage of revenue was due to our focused efforts on financial aid processes and collection activities which resulted in lower outstandinghigher average accounts receivable balances ofthroughout the year as compared to prior year, resulting from increased loans to our students and positive historical experience with graduate students. The number of days revenue outstanding at December 31, 2012 increased to 21.221.7 days, compared to 17.717.2 days at December 31, 2011. This increase in days outstanding is attributable to the increase in our loan commitments to our students.
The decrease in sales and marketing expenses was primarily due to a reduction in marketing expenses as well as a reduction in the number of admissions representatives in order to align our cost structure to our student population.
Student services expenses decreased due to a reduction in the number of financial aid employees, as we aligned our cost structure to our student population. As a percentage of revenues, selling, general and administrative expense for the year ended December 31, 2012 increased to 50.8%49.9% from 47.2%47.5% for the year ended December 31, 2011.
As of December 31, 2012, we had outstanding loan commitments to our students of $34.7 million as compared to $26.4 million at December 31, 2011. Loan commitments, net of interest that would be due on the loans through maturity, were $25.0 million at December 31, 2012 as compared to $20.2 million at December 31, 2011. The increase in loan commitment during the year is attributable to changes we made to certain programs resulting in higher financing gaps for our students to better enable us to comply with the 90/10 Rule.
Impairment of goodwill and long-lived assets. At December 31, 2012, we tested our goodwill and long-lived assets for impairment and determined that an impairment of approximately $19.6$19.7 million existed for seven of our reporting units and four asset groups related to long-lived assets.assets ($5.4 million included in discontinued operations). At June 30, 2012, we tested our goodwill and long-lived assets for impairment and determined that an impairment charge of approximately $23.7 million existed for five reporting units related to goodwill and 10 asset groups related to long-lived assets ($9.412.8 million included in discontinued operations). At September 30, 2011, we tested our goodwill and long-lived assets for impairment and determined that an impairment of approximately $10.4 million existed for five reporting units ($2.1 million included in discontinued operations).
Net interest expense. Our net interest expense for the year ended December 31, 2012 was $4.5 million essentially flat compared to the year ended December 31, 2011.
Income taxes. Our benefit for income taxes for the year ended December 31, 2012 was $8.2$2.8 million, or 25.6%15.1% of pretax loss, compared to a provision for income taxes of $14.7$13.1 million, or 41.1%42.6%, of pretax income for the year ended December 31, 2011. The effective tax rate decrease was due to the effect of nondeductible permanent items mainly comprised of goodwill impairment charges.
LIQUIDITY AND CAPITAL RESOURCES
Our primary capital requirements are for facilities expansion and maintenance, acquisitions and the development of new programs. Our principal sources of liquidity have been cash provided by operating activities and borrowings under our credit agreement. The following chart summarizes the principal elements of our cash flow for each of the three years in the period ended December 31, 2012:
| Cash Flow Summary | ||||||||||||
| Year Ended December 31, | ||||||||||||
| 2012 | 2011 | 2010 | ||||||||||
| (In thousands) | ||||||||||||
| Net cash provided by operating activities | $ | 15,986 | $ | 36,838 | $ | 114,464 | ||||||
| Net cash used in investing activities | $ | (10,187 | ) | $ | (37,389 | ) | $ | (42,111 | ) | |||
| Net cash provided by (used in) financing activities | $ | 29,385 | $ | (38,920 | ) | $ | (52,434 | ) | ||||
| Cash Flow Summary | ||||||||||||
| Year Ended December 31, | ||||||||||||
| 2013 | 2012 | 2011 | ||||||||||
| (In thousands) | ||||||||||||
| Net cash provided by operating activities | $ | 3,246 | $ | 15,986 | $ | 36,838 | ||||||
| Net cash used in investing activities | $ | (5,788 | ) | $ | (10,187 | ) | $ | (37,389 | ) | |||
| Net cash (used in) provided by financing activities | $ | (46,280 | ) | $ | 29,385 | $ | (38,920 | ) | ||||
As of December 31, 2012,2013, we had cash, and cash equivalents and restricted cash of $61.7$67.4 million, including $54.5 million of restricted cash, representing an increase of approximately $35.2$5.7 million as compared to $26.5$61.7 million of cash and cash equivalents as of December 31, 2011.2012. This increase is primarily due to $37.5$54.5 million of borrowings under our credit facilityCredit Facility (as defined below) during the fourth quarter of 2012.2013 compared to $37.5 million of borrowings during the fourth quarter of 2012 partially offset by a net loss during the year ended December 31, 2013 of $51.3 million compared to a net loss during the year ended December 31, 2012 of $37.2 million. Historically, we have financed our operating activities and organic growth primarily through cash generated from operations. We have financed acquisitions primarily through borrowings under our credit facilityCredit Facility and cash generated from operations. We currently anticipate that we will be able to meet both our short-term cash needs, as well as our need to fund operations and meet our obligations beyond the next twelve months with cash generated by operations, existing cash balances and if necessary, borrowings under our credit facility.Credit Facility. In addition, we may also consider accessing the financial markets in the future as a source of liquidity for capital requirements, acquisitions and general corporate purposes to the extent such requirements are not satisfied by cash on hand, borrowings under our credit facilityCredit Facility or operating cash flows. However, we cannot assure you that we will be able to raise additional capital on favorable terms, if at all. At December 31, 2012, we had net borrowings available under our $85 million credit agreement of approximately $45.9 million, including a $23.4 million sub-limit on letters of credit. The credit agreement matures on April 5, 2015.As of December 31, 2012,2013, we had $37.5$54.5 million outstanding under our credit agreement. This amount was paid in full on January 3, 2013.2014. As of December 31, 2012,2013, we had outstanding letters of credit aggregating $1.6$5.3 million, which primarily comprised of security deposits in connection with certain of our real estate leases.The Credit Facility matures on April 5, 2015.
Our primary source of cash is tuition collected from the students. The majority of students enrolled at our schools rely on funds received under various government-sponsored student financial aid programs to pay a substantial portion of their tuition and other education-related expenses. The largest of these programs are Title IV Programs which represented approximately 81%80% of our cash receipts relating to revenues in 2012.2013. Students must apply for a new loan for each academic period. Federal regulations dictate the timing of disbursements of funds under Title IV Programs and loan funds are generally provided by lenders in two disbursements for each academic year. The first disbursement is usually received approximately 31 days after the start of a student's academic year and the second disbursement is typically received at the beginning of the sixteenth week from the start of the student's academic year. Certain types of grants and other funding are not subject to a 30-day delay. In certain instances, if a student withdraws from a program prior to a specified date, any paid but unearned tuition or prorated Title IV financial aid is refunded according to state and federal regulations.
As a result of the significance of the Title IV funds received by our students, we are highly dependent on these funds to operate our business. Any reduction in the level of Title IV funds that our students are eligible to receive or any impact on our ability to be able to receive Title IV funds would have a significant impact on our operations and our financial condition.
Operating Activities
Net cash provided by operating activities was $16.0$3.2 million for the year ended December 31, 20122013 as compared to $36.8$16.0 million for year ended December 31, 2011.2012. The $20.8$12.7 million decrease in net cash provided by operating activities primarily resulted from a reduction in net income offset by decreases in income taxes paid and other working capital items.
Investing Activities
Net cash used in investing activities decreased by $27.2$4.4 million to $5.8 million for the year ended December 31, 2013 from $10.2 million for the year ended December 31, 2012 from $37.4 million for the year ended December 31, 2011.2012. The decrease was primarily attributable to a $29.3$2.3 million reduction in cash used for capital expenditures offset by the acquisition of FMTI of $1.5 million for the year ended December 31, 20122013 compared to the year ended December 31, 2011.2012 and the acquisition of FMTI of $1.5 million in the second quarter of 2012. Our 20122013 capital expenditures mainly resulted from leasehold improvements and facility expansions as well as investments in campuses, classroom furniture and shop technology. The decrease in capitalwas a result of decreased demand for expenditures for the year ended December 31, 2012 compared to the year ended December 31, 2011 was due to our relocation of our Denver campusreduced student population, assets transferred from closed schools and significant investments in 2011 coupled with decreases in overall student population.prior periods.
We currently lease a majority of our campuses. We own our campuses in Grand Prairie, Texas; West Palm Beach, Florida; Nashville, Tennessee; Cincinnati (Tri-County), Ohio; Suffield, Connecticut; and Denver, Colorado. Our Cincinnati (Tri-County), Ohio and Suffield, Connecticut locations are held for sale. Although our current growth strategy is to continue our organic growth, strategic acquisitions of operations will be considered. To the extent that these potential strategic acquisitions are large enough to require financing beyond available cash from operations and borrowings under our credit facilities, we may incur additional debt and/or issue additional debt or equity securities.
Capital expenditures are expected to range fromapproximate 4% to 5% of revenues in 20132014 as compared to 2.1%1.9% in 2012.2013. We expect to fund these capital expenditures with cash generated from operating activities and, if necessary, with borrowings under our credit facility.
Financing Activities
Net cash used in financing activities was $46.3 million for the year ended December 31, 2013, as compared to net cash provided by financing activities wasof $29.4 million for the year ended December 31, 2012, as compared to net cash used in financing activities2012. The increase of $38.9 million for the year ended December 31, 2011. The decrease of $68.3$75.7 million was primarily attributable to our increased net borrowings of $57.5$37.5 million for the year ended December 31, 2012 compared to the year ended December 31, 2011 and a reduction in dividends paid of $12.1 millionwhich was repaid for the year ended December 31, 2012 compared to2013. During the year ended December 31, 2011 as we lowered our dividend rate to $0.07 perfourth quarter from $0.25 per quarterof 2013 $54.5 million was borrowed and included in 2011.restricted cash.
Credit Agreement. On April 5, 2012, we, as borrower, and certain of our wholly-owned subsidiaries, as guarantors, entered into thea secured revolving credit agreement with a syndicate of four lenders led by Bank of America, N.A., as administrative agent swing line lender and letter of credit issuer for an aggregate principal amount of up to $85 million (the “Credit Agreement”Facility”). The April 5, 2012 agreement, along with subsequent amendments dated June 18, 2013 and December 20, 2013, are collectively referred to as the “Credit Agreement.”
The Credit Agreement provides that the lenders will receive first priority lien on substantially all of our tangible and intangible non-real property assets of our and our subsidiaries as well as a first priority lien on substantially all real property owned by our and our subsidiaries and that all net proceeds of future sales of real property by our and our subsidiaries be used to prepay revolving loans and permanently reduce the principal amount of revolving loans available under the Credit Facility.
Amounts borrowed as revolving loans under the Credit Facility will bear interest, at our option, at either (i) an interest rate based on LIBOR and adjusted for any reserve percentage obligations under Federal Reserve Bank regulations (the “Eurodollar Rate”) for specified interest periods or (ii) the Base Rate (as defined in the Credit Agreement), in each case, plus an applicable margin rate as determined under the Credit Agreement. The “Base Rate”, as defined under the Credit Agreement, is the highest of (a) the rate of interest announced from time to time by Bank of America, N.A. as its prime rate, (b) the Federal Funds rate plus 0.50% and (c) a daily rate equal to the one-month LIBOR rate plus 1.0%. UnderPursuant to the Credit Agreement,Amendment, the margin interest rate is subject to adjustment within a range of 1.25%2.50% to 2.75%6.00% based upon changes in our consolidated leverage ratio and depending on whether we have chosen the Eurodollar Rate or the Base Rate option. Swing line loans will bear interest at the Base Rate plus the applicable margin rate. Letters of credit will require a fee equal to the applicable margin rate multiplied by the daily amount available to be drawn under each issued letter of credit plus an agreed upon fronting fee and customary issuance, presentation, amendment and other processing fees associated with letters of credit.
At December 31, 2012, we had outstanding borrowings of $37.5 million. At December 31, 2012,2013, we had outstanding letters of credit aggregating $1.6$5.3 million, which iswere primarily comprised of letters of credit for the Department of Education, or DOE, matters and security deposits in connection with certain of our real estate leases.leases.
The Credit Agreement contains customary representations, warranties and covenants including consolidated adjusted net worth, consolidated leverage ratio, consolidated fixed charge coverage ratio, minimum financial responsibility composite score, cohort default rate and other financial covenants, certain restrictions on capital expenditures as well as affirmative and negative covenants and events of default customary for facilities of this type. In addition, we are paying fees to the lenders that are customary for facilities of this type.
| As of December 31, | As of December 31, | |||||||||||||||
| 2012 | 2011 | 2013 | 2012 | |||||||||||||
| Credit agreement | $ | 37,500 | $ | - | $ | 54,500 | $ | 37,500 | ||||||||
| Finance obligation | 9,672 | 9,672 | 9,672 | 9,672 | ||||||||||||
| Capital lease-property (with a rate of 8.0%) | 26,344 | 26,715 | 25,944 | 26,344 | ||||||||||||
| Capital leases-equipment (with rates ranging from 5.0% to 8.5%) | 11 | 121 | - | 11 | ||||||||||||
| Subtotal | 73,527 | 36,508 | 90,116 | 73,527 | ||||||||||||
| Less current maturities | (412 | ) | (481 | ) | (435 | ) | (412 | ) | ||||||||
| Total long-term debt | $ | 73,115 | $ | 36,027 | $ | 89,681 | $ | 73,115 | ||||||||
We believe that our cash flows from operations and borrowings available under our credit agreement will provide us with adequate resources for our ongoing operations through 20132014 and our currently identified and planned capital expenditures.
Climate Change
Climate change has not had and is not expected to have a significant effect on our operations.
Contractual Obligations
Long-Term Debt and Lease Commitments. As of December 31, 2012,2013, our long-term debt consisted of borrowings under our Credit Facility, the finance obligation in connection with our sale-leaseback transaction in 2001, and amounts due under capital lease obligations. We lease offices, educational facilities and various equipment for varying periods through the year 2032 at basic annual rentals (excluding taxes, insurance, and other expenses under certain leases).
The following table contains supplemental information regarding our total contractual obligations as of December 31, 2012:2013:
| Payments Due by Period | ||||||||||||||||||||
| Total | Less than 1 year | 1-3 years | 3-5 years | More than 5 years | ||||||||||||||||
| Credit agreement (including interest) (1) | $ | 54,532 | $ | - | $ | 54,532 | $ | - | $ | - | ||||||||||
| Capital leases (including interest) | 50,037 | 2,494 | 5,050 | 5,356 | 37,137 | |||||||||||||||
| Operating leases | 119,517 | 21,223 | 35,109 | 28,272 | 34,913 | |||||||||||||||
| Rent on finance obligation | 4,638 | 1,546 | 3,092 | - | - | |||||||||||||||
| Total contractual cash obligations | $ | 228,724 | $ | 25,263 | $ | 97,783 | $ | 33,628 | $ | 72,050 | ||||||||||
| Payments Due by Period | ||||||||||||||||||||
| Total | Less than 1 year | 1-3 years | 3-5 years | More than 5 years | ||||||||||||||||
| Credit agreement (including interest) (1) | $ | 37,514 | $ | - | $ | 37,514 | $ | - | $ | - | ||||||||||
| Capital leases (including interest) | 52,543 | 2,506 | 4,988 | 5,234 | 39,815 | |||||||||||||||
| Uncertain income taxes | 135 | 135 | - | - | - | |||||||||||||||
| Operating leases | 142,311 | 22,546 | 40,865 | 30,445 | 48,455 | |||||||||||||||
| Rent on finance obligation | 6,064 | 1,516 | 3,032 | 1,516 | - | |||||||||||||||
| Total contractual cash obligations | $ | 238,567 | $ | 26,703 | $ | 86,399 | $ | 37,195 | $ | 88,270 | ||||||||||
| (1) | Amounts outstanding under the Credit Agreement were repaid on January 3, |
OFF-BALANCE SHEET ARRANGEMENTS
We had no off-balance sheet arrangements as of December 31, 2012,2013, except for our letters of credit and surety bonds. Letters of credit of $1.6$5.3 million are primarily comprised of security deposits in connection with certain of our real estate leases. We are required to post surety bonds on behalf of our campuses and education representatives with multiple states to maintain authorization to conduct our business. At December 31, 2012,2013, we posted surety bonds in the total amount of approximately $14.9$16.9 million. These off-balance sheet arrangements do not adversely impact our liquidity or capital resources.
SEASONALITY AND TRENDS
Seasonality
Our revenue and operating results normally fluctuate as a result of seasonal variations in our business, principally due to changes in total student population. Student population varies as a result of new student enrollments, graduations and student attrition. Historically, our schools have had lower student populations in our first and second quarters and we have experienced larger class starts in the third and fourth quarters and higher student attrition in the first half of the year. Our second half growth is largely dependent on a successful high school recruiting season. We recruit our high school students several months ahead of their scheduled start dates, and thus, while we have visibility on the number of students who have expressed interest in attending our schools, we cannot predict with certainty the actual number of new student enrollments and the related impact on revenue. Our expenses, however, typically do not vary significantly over the course of the year with changes in our student population and revenue. During the first half of the year, we make significant investments in marketing, staff, programs and facilities to ensure that we meet our second half of the year targets and, as a result, such expenses do not fluctuate significantly on a quarterly basis. To the extent new student enrollments, and related revenue, in the second half of the year fall short of our estimates, our operating results could be negatively impacted. We expect quarterly fluctuations in operating results to continue as a result of seasonal enrollment patterns. Such patterns may change as a result of new school openings, new program introductions, and increased enrollments of adult students and/or acquisitions.
90/10 Rule
The HEA, enacted in 2008, states that a proprietary institution will be ineligible to participate in Title IV programs if for any two consecutive fiscal years it derives more than 90% of its cash basis revenue from Title IV programs. This is commonly known as the “90/10 Rule.”
We have calculated that, for our 20122013 fiscal year, our seven institutions’ 90/10 Rule percentages ranged from 72.3%69% to 93.0%85%. For 2013, 2012 our Dayton institution (consisting of a main campus and eight additional locations) derived 93.0% of its revenues from Title IV programs. For 2011, none of our current institutions derived more than 90% of their revenues from Title IV Programs. For 2010, our Dayton institution (consisting of a main campus and six additional locations) derived 96.9% of its revenues from Title IV programs. It was our only institution with a 90/10 Rule percentage above 90%. We regularly monitor compliance with this requirement to minimize the risk that any of our institutions would derive more than the maximum percentage of its revenues from Title IV Programs for any fiscal year. We anticipate that our acquisition of FMTI in April 2012 will allow this institution to meet its 90/10 ratio in 2013.
Effective July 1, 2008, the annual Stafford loans available for undergraduate students under the FFEL, increased. This increase, coupled with increases in grants from the Pell program and other Title IV loan limits, resulted in some of our schools experiencing an increase in the proportion of the revenues they receive from Title IV Programs. The HEA reauthorization provided temporary relief from the impact of the loan limit increases by counting as non-Title IV revenue in the 90/10 Rule calculation amounts received from loans received between July 1, 2008 and June 30, 2011 that are attributable to the increased annual loan limits. TheThe temporary relief under the HEA for calculating 90/10 Rule compliance expired for loans received on or after July 1, 2011 and expired for institutional loans made on or after July 1, 2012.
The HEA authorization also provided other relief by allowing institutions to include as non-Title IV revenue in its 90/10 Rule calculation the net present value of certain institutional loans subject to certain limitations and conditions. During 2010 and continuing into the first half of 2011, we saw a reduction in the loan commitments we offered our students to help them bridge the gap between the tuition charged for their particular program and the amount of grants, third-party loans and parental assistance each student received. We believe that those reductions were due to increases in student loan limits available to students as well as an increase in Pell Grants. As a result, a greater percentage of students were able to finance their educations entirely from financial aid sources. While this provided greater opportunities for our students, it also severely impacted our ability to comply with the 90/10 Rule. Because of the increases in Title IV student loan limits and grants in recent years, it has and will continue to be difficult for us to comply with the 90/10 Rule. We have considered two alternatives to aid us with our compliance with the 90/10 Rule: increasing tuition prices above the applicable maximums for Title IV student loans and grants or restructuring certain of our programs to create a financing gap. We decided to restructure program offerings. This resulted in an increase in the financing gap between tuition and the amount of financial aid available. To assist our students in closing their financing gaps we provided loans to our students. Loan commitments to our students increased during 20122013 by approximately $8.3$1.5 million. If any of our institutions loses eligibility to participate in Title IV programs, that loss would cause an event of default under our credit agreement, and would also adversely affect our students’ access to various government-sponsored student financial aid programs, which could have a material adverse effect on the rate at which our students enroll in our programs and on our business and results of operations.
The overall increase in the percentages of Title IV received by our institutions has also caused us to look for other sources of non-Title IV cash. This led to our acquisition of FMTI in April 2012 and may lead to additional acquisitions of complimentary “cash only” businesses.
Cohort Default Rates
The HEA limits participation in the Title IV Programs by institutions whose former students defaulted on the repayment of federally guaranteed or funded student loans above a prescribed rate (the “cohort default rate”). The DOE calculates these rates based on the number of students who have defaulted, not the dollar amount of such defaults.
Under the HEA, an institution whose FFEL and FDL cohort default rate is 25% or greater for three consecutive federal fiscal years loses eligibility to participate in the FFEL, FDL, and Pell programs for the remainder of the federal fiscal year in which the DOE determines that such institution has lost its eligibility and for the two subsequent federal fiscal years. An institution whose FFEL and FDL cohort default rate for any single federal fiscal year exceeds 40% loses its eligibility to participate in the FFEL and FDL programs for the remainder of the federal fiscal year in which the DOE determines that such institution has lost its eligibility and for the two subsequent federal fiscal years. If an institution’s cohort default rate equals or exceeds 25% in any of its three most recent fiscal years, the institution may be placed on provisional certification status.
The HEA increased the measuring period for each cohort default rate calculation by one year. Starting with the 2009 cohort, the DOE calculates both the current two-year and the new three-year cohort default rates. Beginning with the 2011 three-year cohort default rate, which is expected to be published for each of our institutions in September 2014, the three-year rates will be applied for purposes of measuring compliance with the requirements instead of the two-year rates currently used for those purposes. If the 2011 three-year cohort default rate exceeds 40%, the institution will cease to be eligible to participate in the FDL and Federal Stafford Loan programs for the remainder of the federal fiscal year in which the DOE determines that such institution has lost its eligibility and for the two subsequent federal fiscal years. If the institution’s three-year cohort default rate exceeds 30% (an increase from the current 25% threshold applicable to the two-year cohort default rates) for three consecutive years, beginning with the 2009 cohort, the institution will cease to be eligible to participate in the Pell, FDL, and FFEL programs for the remainder of the federal fiscal year in which the DOE determines that such institution has lost its eligibility and for the two subsequent federal fiscal years.
In March 2014, the DOE published draft three-year cohort default rates for each of our institutions for the 2011 fiscal year. The draft rates are not final and may be subject to appeal and further upward or downward revisions before the DOE publishes final rates, which is expected to occur in September 2014. The rates range from 16.8% to 26.5%. For the 2011 fiscal year, none of our institutions had three-year draft cohort default rates of at least 30%. The weighted average draft cohort default rate for 2011 was 25.7%.
In September 2012, the DOE published final three-year cohort default rates for the 2009 fiscal year. The rates under the new methodology ranged from 15.8% to 31.6%. For the 2009 fiscal year, one of our institutions had three-year cohort default rates of at least 30%.
In September 2013, the DOE published final two-year cohort default rates for the 2011 fiscal year. The rates range from 13.2% to 21.5%. None of our institutions had a cohort default rate over 25%.
In September 2012, the DOE published final two-year cohort default rates for each of our institutions for the 2010 fiscal year. The rates range from 11.6% to 23.9%21.1%. None of our institutions had a cohort default rate (as defined by the DOE) of 25% or greater for the 2010 federal fiscal year. In late March 2013, the DOE is expected to issue draft two-year cohort default rates for the 2011 fiscal year.
While we strive to improve the cohort default rates for each of our institutions, the current economic climate, combined with the demographics of the students that we traditionally serve, makes this objective even more challenging. As a result, we have significantly increased our default management personnel to help enhance the financial literacy of our students and graduates, with the goal of helping students stay current in their loan payments. We have also engaged third-party consultants to assist those institutions who have historically had the highest cohort default rates.
Gainful Employment
On June 13, 2011, the DOE published final regulations in the Federal Register regarding gainful employment that were scheduled to take effect on July 1, 2012 and apply to all educational programs that are subject to the DOE requirement of preparing students for gainful employment in a recognized occupation. Such educational programs includewould have included all of the Title IV-eligible educational programs at each of our institutions. The gainful employment regulations would, among other things, measure each educational program against threshold benchmarks in each of three debt measure categories: (1) an annual loan repayment rate, (2) an annual debt-to-annual earnings ratio, and (3) an annual debt-to-discretionary income ratio. The various formulas are calculated under complex methodologies and definitions outlined in the regulations, and are based on data that may not be readily accessible to institutions. If an educational program fails to achieve threshold rates in all three categories for one federal fiscal year (beginning with debt measures calculated for the 2012 federal fiscal year), the institution must, among other things, disclose the amount by which the program missed the minimum acceptable performance and the institution’s plan to improve the program. If an educational program fails to achieve threshold rates in all three categories in two out of three federal fiscal years, the institution must, among other things, warn students in the failing program that they should expect difficulty in repaying their loans, disclose the options available to the student if the program loses eligibility for Title IV funds, and disclose resources available to research other educational options and compare program costs. If an educational program fails to achieve threshold rates in all three categories in three out of four federal fiscal years, the program loses its Title IV eligibility for a period of at least three years. We have analyzed the available data to assess the potential impact of the new gainful employment regulations on each of our institutions and educational programs. Although we have not identified to date any material number of educational programs that we believe are likely to lose eligibility under the new regulations’ threshold benchmarks, if the data were to change unfavorably, the new regulations could nonetheless have a material adverse effect on our business and operations by requiring us to eliminate certain educational programs, and the new disclosure requirements and related components of the new regulations could have a material adverse effect on the rate at which students enroll in our programs.
On June 30, 2012, the United States District Court for the District of Columbia issued a decision that vacated most of the gainful employment regulations and remanded those regulations to the DOE for further action. On July 6, 2012, the DOE issued an electronic announcement acknowledging that the Court had vacated the repayment rate metric as well as the debt-to-income gainful employment metrics that would have gone into effect on July 1, 2012. The DOE also noted that institutions are not required to comply with related regulations relating to gainful employment reporting requirements and adding new educational programs, but are required to comply with requirements to disclose certain information about educational programs.
In June 2013, the DOE announced its intention to establish a negotiated rulemaking committee to prepare proposed regulations that would establish standards for programs that prepare students for gainful employment in a recognized occupation. The Court’s decisioncommittee is scheduled to conduct two negotiated rulemaking sessions, the first of which occurred in September 2013 and the second of which was delayed because of the partial government shutdown and is currently scheduled for November 2013. In addition, the negotiators held an open conference call in September 2013.
In August 2013, in advance of the first negotiated rulemaking session, the DOE released its initial draft regulatory language for discussion purposes. The draft regulatory language would apply to all educational programs that are subject to appeal by the DOE requirement of preparing students for gainful employment in a recognized occupation. Such educational programs would include all of the Title IV-eligible educational programs at each of our institutions.
The initial draft gainful employment regulatory language would, among other things, measure each educational program against threshold benchmarks under two debt-to-earnings metrics comparing a program’s annual loan payment (which the language would define to include certain Title IV loans, private education loans, and coulddebt owed to the institution) to the annual earnings of the students who completed the program. The two debt-to-earnings metrics, one based on students’ discretionary income and one based on students’ annual earnings, would be modified or reversedcalculated under complex methodologies and definitions outlined in the draft regulatory language and would be based on appeal. Moreover,data that may not be readily accessible to institutions. The draft regulatory language also would require institutions to report to the DOE certain information, and to make certain disclosures, with respect to their gainful employment programs.
Based on a program’s rates under the two metrics, the draft regulatory language would classify the program as a passing program, a zone program, or a failing program. If an educational program is a failing program in two out of any three consecutive award years, the program would lose its Title IV eligibility for a period of at least three years. If an educational program is not a passing program in any of four consecutive award years (i.e., the program is classified as either a failing program or zone program for four consecutive award years), the program would lose its Title IV eligibility for a period at least three years.
The draft regulatory language also would require an institution with an educational program that could take further actionbecome ineligible based on its debt-to-earnings rates for the subsequent award year to addressprovide written warnings to enrolled students and prospective students related to the Court’s concerns regardingpotential loss of Title IV eligibility. The draft regulatory language also would limit the regulations and obtain approvalenrollment of students receiving Title IV funds in an educational program that is classified as a failing program.
The Department is expected to enforce the regulations, or the DOE could issuepublish new regulations regarding gainful employment.as part of the negotiated rulemaking process. That process would typically include an opportunity for public notice and comment. The new regulations, if published in final form on or before November 1, 2014, would typically take effect in July 2015. The proposed regulations are still under negotiation and are subject to change before and after the negotiated rulemaking sessions are completed. We cannot predict what steps the DOE will take in response totiming, scope or content of the Court’s decision, how long those steps would take, or whether those steps will result in the DOE being able to enforce thefinal regulation on gainful employment nor the impact of those final regulations on us or issuingour institutions’ educational programs. The new regulations.regulations could have a material adverse effect on our business and operations such as, for example, requiring us to eliminate certain educational programs, and any new warning, reporting, or disclosure requirements could have a material adverse effect on the rate at which students enroll in our programs.
ATB Students
ATB students are non-GED and non-high school graduates who are allowed to enroll in post-secondary institutions by passing a DOE approved exam. ATB students are traditionally a higher risk population who complete their programs at a lower rate and default on their student loans at a higher rate than non-ATB students. As of December 31, 2012, approximately 4.2% of our students were classified as ATB students. On December 23, 2011, President Obama signed into law the Appropriations Act. This law eliminates the ability of ATB students who first enroll after July 1, 2012 to participate in federal student financial aid programs. As a result, we stopped enrolling ATB students as of July 1, 2012. This reduction in ATB students has negatively impacted our total enrollment and our revenue.
Outlook
In addition to the 90/10 Rule, cohort default rates, gainful employment and limits on the number of ATB students discussed above, changes to admissions advisor compensation policies, other changes promulgated by the DOE and the current economic slowdown have all led to significant deterioration in student enrollments. This deterioration continued into 2013. We believe that we have started to see stabilization in our student starts for our continuing operations. In particular our automotive and skill trade campuses appear to have stabilized while our other programs continue to experience some challenges. Some of this can be attributable to large financing gaps at certain programs as well as the hesitation or inability of students to incur additional debt and/or make required monthly payments. We continue to explore ways to help these students achieve their goals, including reducing tuition of certain programs or providing need based scholarships. Students’ starts for the fourth quarter of 20122013 were down 7.2% as we experienced a decrease in student starts of 21.5% versuscompared to the fourth quarter of 2011. For the year ended December 31, 20122012.
While we believe our student starts from continuing operations declined 7.7%. Included in this amount is a decline of 76.7% from our decision in early 2012have leveled off, we continue to stop enrolling fully online students. Thebe challenged by the current economic environment continues to negatively impact enrollments as studentswell as students’ and their parents are hesitantparents’ continued hesitation to take onincur debt. We believeexpect that this trend will improve as the declineeconomy improves but cannot predict when this will occur.
The continued deterioration in our student starts as compared to prior-year periodspopulation has produced negative operating margins in 2013. While we experienced negative margins we expect that this will continue to improvereverse in the near future. Until that does occur we anticipate that we will be able to meet our short-term cash needs, as well as our need to fund operations and meet our obligations beyond the next few quarters but at a slower pace,twelve months with cash generated by operations, existing cash balances and while we cannot accurately predict to what degree with any certainty, we believe that the loss of the ATB student enrollments coupled with what we expect to be a prolonged economic downturn will slowborrowings under our rate of growth.Credit Facility.
Effect of Inflation
Inflation has not had and is not expected to have a significant effect on our operations.
We are exposed to certain market risks as part of our on-going business operations. We have a credit agreement with a syndicate of banks. Our obligations under the credit agreement are secured by a lien on substantially all of our assets and our subsidiaries and any assets that we or our subsidiaries may acquire in the future, including a pledge of substantially all of our subsidiaries’ common stock. Outstanding borrowings bear interest at the rate of 4.5%7.25% (as calculated in the credit agreement) as of December 31, 2012.2013. As of December 31, 2011,2013, we had $37.5$54.5 million outstanding under our credit agreement.
Based on our outstanding debt balance as of December 31, 2012,2013, a change of one percent in the interest rate would have caused a change in our interest expense of approximately $0.4$0.5 million, or less than $0.02 per basic share, on an annual basis. Changes in interest rates could have an impact however on our operations, which are greatly dependent on students’ ability to obtain financing. Any increase in interest rates could greatly impact our ability to attract students and have an adverse impact on the results of our operations. The remainder of our interest rate risk is associated with miscellaneous capital equipment leases, which is not significant.
See “Index to Consolidated Financial Statements” on page F-1 on this Annual Report on Form 10-K.
None.
Evaluation of disclosure controls and procedures
Our Chief Executive Officer and Chief Financial Officer, after evaluating, together with management, the effectiveness of our disclosure controls and procedures (as defined in Securities Exchange Act Rule 13a-15(e)) as of December 31, 20122013 have concluded that our disclosure controls and procedures are effective to reasonably ensure that material information required to be disclosed by us in the reports that we file or submit under the Securities Exchange Act of 1934, as amended is recorded, processed, summarized and reported within the time periods specified by Securities and Exchange Commissions’ Rules and Forms and that such information is accumulated and communicated to our management, including our Chief Executive Officer and Chief Financial Officer, as appropriate, to allow timely decisions regarding required disclosure.
Internal Control Over Financial Reporting
During the quarter ended December 31, 2012,2013, there has been no change in our internal control over financial reporting that has materially affected, or is reasonably likely to materially affect, our internal control over financial reporting.
Management’s Annual Report on Internal Control over Financial Reporting
The management of Lincoln Educational Services Corporation (the “Company”) is responsible for establishing and maintaining adequate internal control over financial reporting as defined in Rule 13a-15(f) under the Securities Exchange Act of 1934. The Company’s internal control system was designed to provide reasonable assurance to the Company’s management and Board of Directors regarding the reliability of financial reporting and the preparation of financial statements for external purposes in accordance with generally accepted accounting principles.
Management assessed the effectiveness of the Company’s internal control over financial reporting as of December 31, 2012,2013, based on the framework set forth by the Committee of Sponsoring Organizations of the Treadway Commission (COSO) in Internal Control—Integrated Framework (1992). Based on its assessment, management believes that, as of December 31, 2012,2013, the Company’s internal control over financial reporting is effective.
Because of its inherent limitations, internal control over financial reporting may not prevent or detect misstatements. Also, projections of any evaluation of effectiveness to future periods are subject to the risk that controls may become inadequate because of changes in conditions, or that the degree of compliance with the policies or procedures may deteriorate.
The Company’s independent auditors, Deloitte &Touche& Touche LLP, an independent registered public accounting firm, audited the Company’s internal control over financial reporting as of December 31, 2012,2013, as stated in their report included in this Form 10-K that follows.
| /s/ Shaun McAlmont | |
| Shaun McAlmont | |
| Chief Executive Officer | |
| March | |
| /s/ Cesar Ribeiro | |
| Cesar Ribeiro | |
| Chief Financial Officer | |
| March |
None.
Directors and Executive Officers
The information required by this item is incorporated herein by reference to our definitive Proxy Statement to be filed in connection with our 20132014 Annual Meeting of Shareholders.
Code of Ethics
We have adopted a Code of Conduct and Ethics applicable to our directors, officers and employees and certain other persons, including our Chief Executive Officer and Chief Financial Officer. A copy of our Code of Ethics is available on our website at www.lincolnedu.com. If any amendments to or waivers from the Code of Conduct are made, we will disclose such amendments or waivers on our website.
Information required by Item 11 of Part III is incorporated by reference to our definitive Proxy Statement to be filed in connection with our 20132014 Annual Meeting of Shareholders.
Information required by Item 12 of Part III is incorporated by reference to our definitive Proxy Statement to be filed in connection with our 20132014 Annual Meeting of Shareholders.
Information required by Item 13 of Part III is incorporated by reference to our definitive Proxy Statement to be filed in connection with our 20132014 Annual Meeting of Shareholders.
Information required by Item 14 of Part III is incorporated by reference to our definitive Proxy Statement to be filed in connection with our 20132014 Annual Meeting of Shareholders.
| 1. | Financial Statements |
See “Index to Consolidated Financial Statements” on page F-1 of this Annual Report on Form 10-K.
| 2. | Financial Statement Schedule |
See “Index to Consolidated Financial Statements” on page F-1 of this Annual Report on Form 10-K.
| 3. | Exhibits Required by Securities and Exchange Commission Regulation S-K |
Exhibit Number | Description | |
| 3.1 | Amended and Restated Certificate of Incorporation of the Company (1). | |
| 3.2 | Amended and Restated By-laws of the Company (2). | |
| 4.1 | Management Stockholders Agreement, dated as of January 1, 2002, by and among Lincoln Technical Institute, Inc., Back to School Acquisition, L.L.C. and the Stockholders and other holders of options under the Management Stock Option Plan listed therein (1). | |
| 4.2 | Assumption Agreement and First Amendment to Management Stockholders Agreement, dated as of December 20, 2007, by and among Lincoln Educational Services Corporation, Lincoln Technical Institute, Inc., Back to School Acquisition, L.L.C. and the Management Investors parties therein (3). | |
| 4.3 | Registration Rights Agreement, dated as of June 27, 2005, between the Company and Back to School Acquisition, L.L.C. (2). | |
| 4.4 | Specimen Stock Certificate evidencing shares of common stock (1). | |
| 10.1 | Credit Agreement, dated as of April 5, 2012, among the Company, the Guarantors from time to time parties thereto, the Lenders from time to time parties thereto and Bank of America, N.A., as Administrative Agent (5). | |
| 10.2 | ||
| 10.3 | ||
| 10.4 | Employment Agreement, dated as of January 8, 2013, between the Company and Scott M. Shaw (8). | |
| 10.5 | Employment Agreement, dated as of January 8, 2013, between the Company and Cesar Ribeiro (8). | |
| 10.6 | Employment Agreement, dated as of January 8, 2013, between the Company and Shaun E. McAlmont (8). | |
| Employment Agreement, dated as of January 8, 2013, between the Company and Piper P. Jameson (8). | ||
| Lincoln Educational Services Corporation Amended and Restated 2005 Long-Term Incentive | ||
| Lincoln Educational Services Corporation 2005 Non-Employee Directors Restricted Stock Plan | ||
| Lincoln Educational Services Corporation 2005 Deferred Compensation Plan (1). | ||
| Lincoln Technical Institute Management Stock Option Plan, effective January 1, 2002 (1). |
| Form of Stock Option Agreement, dated January 1, 2002, between Lincoln Technical Institute, Inc. and certain participants (1). | ||
| Form of Stock Option Agreement under our 2005 Long-Term Incentive Plan (4). | ||
| 10.14 | Form of Restricted Stock Agreement under our 2005 Long-Term Incentive | |
| Form of Performance-Based Restricted Stock Award Agreement under our Amended & Restated 2005 Long-Term Incentive Plan (9). |
| 10.16 | Management Stock Subscription Agreement, dated January 1, 2002, among Lincoln Technical Institute, Inc. and certain management investors (1). | |
| Stock Repurchase Agreement, dated as of December 15, 2009, among Lincoln Educational Services Corporation and Back to School Acquisition, L.L.C (6). | ||
| Subsidiaries of the Company. | ||
| Consent of Independent Registered Public Accounting Firm. | ||
| Certification of Chief Executive Officer pursuant to Section 302 of the Sarbanes-Oxley Act of 2002. | ||
| Certification of Chief Financial Officer pursuant to Section 302 of the Sarbanes-Oxley Act of 2002. | ||
| Certification of Chief Executive Officer and Chief Financial Officer pursuant to 18 U.S.C. 1350, as adopted pursuant to Section 906 of the Sarbanes-Oxley Act of 2002. | ||
| 101** | The following financial statements from Lincoln Educational Services Corporation’s |
| (1) | Incorporated by reference to the Company’s Registration Statement on Form S-1 (Registration No. 333-123644). |
| (2) | Incorporated by reference to the Company’s Form 8-K filed June 28, 2005. |
| (3) | Incorporated by reference to the Company’s Registration Statement on Form S-3 (Registration No. 333-148406). |
| (4) | Incorporated by reference to the Company’s Annual Report on Form 10-K for the year ended December 31, 2007. |
| (5) | Incorporated by reference to the Company’s Form 8-K filed April 11, 2012. |
| (6) | Incorporated by reference to the Company’s Form 8-K filed December 21, 2009. |
| (7) |
| (8) | Incorporated by reference to the Company’s Form 8-K filed January 10, 2013. |
| (9) | Incorporated by reference to the Company’s Form 8-K filed May 5, 2011. |
| (10) | Incorporated by reference to the Company’s Annual Report on Form 10-K for the year ended December 31, 2012. |
| (11) | Incorporated by reference to the Company’s Form 8-K filed June 20, 2013. |
| (12) | Incorporated by reference to the Company’s Form 8-K filed December 27, 2013. |
| (13) | Registration Statement on Form S-8 (Registration No. 333-188240). |
| * | Filed herewith. |
| ** | As provided in Rule 406T of Regulation S-T, this information is furnished and not filed for purposes of Sections 11 and 12 of the Securities Act of 1933 and Section 18 of the Securities Exchange Act of 1934. |
SIGNATURES
Pursuant to the requirements of Section 13 or 15(d) of the Securities Exchange Act of 1934, the registrant has duly caused this report to be signed on its behalf by the undersigned, thereunto duly authorized.
Date: March 11, 2014
| LINCOLN EDUCATIONAL SERVICES CORPORATION | ||||
| By: | /s/ Cesar Ribeiro | |||
| Cesar Ribeiro | ||||
| Executive Vice President, Chief Financial Officer and Treasurer | ||||
| (Principal Accounting and Financial Officer) | ||||
Pursuant to the requirements of the Securities Exchange Act of 1934, this report has been signed below by the following persons on behalf of the registrant and in the capacities and on the dates indicated.
| Signature | Title | Date | |||
/s/ Shaun McAlmont | |||||
| Shaun McAlmont | Chief Executive Officer and Director | March | |||
| /s/ Cesar Ribeiro | Executive Vice President, Chief Financial Officer and | ||||
| Cesar Ribeiro | Treasurer (Principal Accounting and Financial Officer) | ||||
| March 11, 2014 | |||||
| /s/ Alvin O. Austin | |||||
| Alvin O. Austin | Director | ||||
| March 11, 2014 | |||||
| /s/ Peter S. Burgess | |||||
| Peter S. Burgess | Director | March 11, 2014 | |||
| /s/ James J. Burke, Jr. | |||||
| James J. Burke, Jr. | Director | March 11, 2014 | |||
| /s/ Celia H. Currin | |||||
| Celia H. Currin | Director | ||||
| March 11, 2014 | |||||
| /s/ Paul E. Glaske | |||||
| Paul E. Glaske | Director | March 11, 2014 | |||
| /s/ Charles F. Kalmbach | |||||
| Charles F. Kalmbach | Director | ||||
| March 11, 2014 | |||||
| /s/ Alexis P. Michas | |||||
| Alexis P. Michas | Director | March 11, 2014 | |||
| /s/ J. Barry Morrow | |||||
| J. Barry Morrow | Director | March 11, 2014 |
INDEX TO CONSOLIDATED FINANCIAL STATEMENTS
| Page Number | ||
| F-2 | ||
| F-4 | ||
| F-6 | ||
| F-7 | ||
| F-8 | ||
| F-9 | ||
| F-11 | ||
F-1
To the Board of Directors and Stockholders of
Lincoln Educational Services Corporation
West Orange, New Jersey
We have audited the accompanying consolidated balance sheets of Lincoln Educational Services Corporation and subsidiaries (the "Company") as of December 31, 20122013 and 2011,2012, and the related consolidated statements of operations, comprehensive (loss) income, changes in stockholders' equity, and cash flows for each of the three years in the period ended December 31, 2012.2013. Our audits also included the financial statement schedule listed in the Index at Item 15. These financial statements and financial statement schedule are the responsibility of the Company's management. Our responsibility is to express an opinion on the financial statements and financial statement schedule based on our audits.
We conducted our audits in accordance with the standards of the Public Company Accounting Oversight Board (United States). Those standards require that we plan and perform the audit to obtain reasonable assurance about whether the financial statements are free of material misstatement. An audit includes examining, on a test basis, evidence supporting the amounts and disclosures in the financial statements. An audit also includes assessing the accounting principles used and significant estimates made by management, as well as evaluating the overall financial statement presentation. We believe that our audits provide a reasonable basis for our opinion.
In our opinion, such consolidated financial statements present fairly, in all material respects, the financial position of Lincoln Educational Services Corporation and subsidiaries as of December 31, 20122013 and 2011,2012, and the results of their operations and their cash flows for each of the three years in the period ended December 31, 2012,2013, in conformity with accounting principles generally accepted in the United States of America. Also, in our opinion, such financial statement schedule, when considered in relation to the basic consolidated financial statements taken as a whole, presents fairly, in all material respects, the information set forth therein.
We have also audited, in accordance with the standards of the Public Company Accounting Oversight Board (United States), the Company's internal control over financial reporting as of December 31, 2012,2013, based on criteria established in Internal Control — Integrated Framework (1992) issued by the Committee of Sponsoring Organizations of the Treadway Commission and our report dated March 11, 20132014 expressed an unqualified opinion on the Company's internal control over financial reporting.
| /s/ DELOITTE & TOUCHE LLP |
Parsippany, New Jersey
March 11, 2014
F-2
REPORT OF INDEPENDENT REGISTERED PUBLIC ACCOUNTING FIRM
To the Board of Directors and Stockholders of
Lincoln Educational Services Corporation
West Orange, New Jersey
We have audited the internal control over financial reporting of Lincoln Educational Services Corporation and subsidiaries (the "Company") as of December 31, 2012,2013, based on criteria established in Internal Control — Integrated Framework (1992) issued by the Committee of Sponsoring Organizations of the Treadway Commission. The Company's management is responsible for maintaining effective internal control over financial reporting and for its assessment of the effectiveness of internal control over financial reporting, included in the accompanying Management’s Report on Internal Control over Financial Reporting. Our responsibility is to express an opinion on the Company's internal control over financial reporting based on our audit.
We conducted our audit in accordance with the standards of the Public Company Accounting Oversight Board (United States). Those standards require that we plan and perform the audit to obtain reasonable assurance about whether effective internal control over financial reporting was maintained in all material respects. Our audit included obtaining an understanding of internal control over financial reporting, assessing the risk that a material weakness exists, testing and evaluating the design and operating effectiveness of internal control based on the assessed risk, and performing such other procedures as we considered necessary in the circumstances. We believe that our audit provides a reasonable basis for our opinion.
A company's internal control over financial reporting is a process designed by, or under the supervision of, the company's principal executive and principal financial officers, or persons performing similar functions, and effected by the company's board of directors, management, and other personnel to provide reasonable assurance regarding the reliability of financial reporting and the preparation of financial statements for external purposes in accordance with generally accepted accounting principles. A company's internal control over financial reporting includes those policies and procedures that (1) pertain to the maintenance of records that, in reasonable detail, accurately and fairly reflect the transactions and dispositions of the assets of the company; (2) provide reasonable assurance that transactions are recorded as necessary to permit preparation of financial statements in accordance with generally accepted accounting principles, and that receipts and expenditures of the company are being made only in accordance with authorizations of management and directors of the company; and (3) provide reasonable assurance regarding prevention or timely detection of unauthorized acquisition, use, or disposition of the company's assets that could have a material effect on the financial statements.
Because of the inherent limitations of internal control over financial reporting, including the possibility of collusion or improper management override of controls, material misstatements due to error or fraud may not be prevented or detected on a timely basis. Also, projections of any evaluation of the effectiveness of the internal control over financial reporting to future periods are subject to the risk that the controls may become inadequate because of changes in conditions, or that the degree of compliance with the policies or procedures may deteriorate.
In our opinion, the Company maintained, in all material respects, effective internal control over financial reporting as of December 31, 2012,2013, based on the criteria established in Internal Control — Integrated Framework (1992) issued by the Committee of Sponsoring Organizations of the Treadway Commission.
We have also audited, in accordance with the standards of the Public Company Accounting Oversight Board (United States), the Company’s consolidated balance sheet as of December 31, 20122013 and the related consolidated statements of operations, comprehensive (loss) income, changes in stockholders’ equity, cash flows and financial statement schedule for the year ended December 31, 2012,2013, and our report dated March 11, 20132014 expressed an unqualified opinion on those consolidated financial statements and financial statement schedule.
| /s/ DELOITTE & TOUCHE LLP |
Parsippany, New Jersey
March 11, 2014
F-3
LINCOLN EDUCATIONAL SERVICES CORPORATION AND SUBSIDIARIES
(In thousands, except share amounts)
| December 31, | December 31, | |||||||||||||||
| 2012 | 2011 | 2013 | 2012 | |||||||||||||
| ASSETS | ||||||||||||||||
| CURRENT ASSETS: | ||||||||||||||||
| Cash and cash equivalents | $ | 61,708 | $ | 26,524 | $ | 12,886 | $ | 61,708 | ||||||||
| Accounts receivable, less allowance of $17,751 and $20,194 at December 31, 2012 and 2011, respectively | 17,370 | 19,696 | ||||||||||||||
| Restricted cash | 54,500 | - | ||||||||||||||
| Accounts receivable, less allowance of $13,787 and $17,751 at December 31, 2013 and 2012, respectively | 16,127 | 17,370 | ||||||||||||||
| Inventories | 2,677 | 3,051 | 2,269 | 2,677 | ||||||||||||
| Prepaid income taxes and income taxes receivable | 7,085 | 11,743 | 8,517 | 7,085 | ||||||||||||
| Deferred income taxes, net | 7,729 | 8,725 | - | 7,729 | ||||||||||||
| Assets held for sale | 6,310 | - | ||||||||||||||
| Prepaid expenses and other current assets | 2,944 | 2,919 | 3,013 | 2,944 | ||||||||||||
| Total current assets | 99,513 | 72,658 | 103,622 | 99,513 | ||||||||||||
| PROPERTY, EQUIPMENT AND FACILITIES - At cost, net of accumulated depreciation and amortization of $137,834 and $122,274 at December 31, 2012 and 2011, respectively | 154,096 | 180,014 | ||||||||||||||
| PROPERTY, EQUIPMENT AND FACILITIES - At cost, net of accumulated depreciation and amortization of $146,795 and $137,834 at December 31, 2013 and 2012, respectively | 127,332 | 154,096 | ||||||||||||||
| OTHER ASSETS: | ||||||||||||||||
| Noncurrent receivables, less allowance of $1,078 and $1,664 at December 31, 2012 and 2011, respectively | 6,109 | 5,572 | ||||||||||||||
| Noncurrent receivables, less allowance of $982 and $1,078 at December 31, 2013 and 2012, respectively | 6,869 | 6,109 | ||||||||||||||
| Deferred finance charges | 774 | 329 | 1,163 | 774 | ||||||||||||
| Deferred income taxes, net | 17,065 | 1,877 | - | 17,065 | ||||||||||||
| Goodwill | 65,527 | 97,371 | 62,465 | 65,527 | ||||||||||||
| Other assets, net | 3,690 | 4,430 | 4,498 | 3,690 | ||||||||||||
| Total other assets | 93,165 | 109,579 | 74,995 | 93,165 | ||||||||||||
| TOTAL | $ | 346,774 | $ | 362,251 | $ | 305,949 | $ | 346,774 | ||||||||
See notes to consolidated financial statements.
LINCOLN EDUCATIONAL SERVICES CORPORATION AND SUBSIDIARIES
CONSOLIDATED BALANCE SHEETS
(In thousands, except share amounts)
(Continued)
| December 31, | ||||||||
| 2013 | 2012 | |||||||
| LIABILITIES AND STOCKHOLDERS' EQUITY | ||||||||
| CURRENT LIABILITIES: | ||||||||
| Current portion of long-term debt and lease obligations | $ | 435 | $ | 412 | ||||
| Unearned tuition | 30,195 | 34,648 | ||||||
| Accounts payable | 14,603 | 13,500 | ||||||
| Accrued expenses | 10,655 | 9,746 | ||||||
| Other short-term liabilities | 693 | 268 | ||||||
| Total current liabilities | 56,581 | 58,574 | ||||||
| NONCURRENT LIABILITIES: | ||||||||
| Long-term debt and lease obligations, net of current portion | 89,681 | 73,115 | ||||||
| Pension plan liabilities | 1,522 | 6,901 | ||||||
| Deferred income taxes, net | 4,528 | - | ||||||
| Accrued rent | 7,695 | 8,663 | ||||||
| Other long-term liabilities | 746 | 1,044 | ||||||
| Total liabilities | 160,753 | 148,297 | ||||||
| COMMITMENTS AND CONTINGENCIES | ||||||||
| STOCKHOLDERS' EQUITY: | ||||||||
| Preferred stock, no par value - 10,000,000 shares authorized, no shares issued and outstanding at December 31, 2013 and 2012 | - | - | ||||||
| Common stock, no par value - authorized 100,000,000 shares at December 31, 2013 and 2012, issued and outstanding 29,919,761 shares at December 31, 2013 and 29,659,457 shares at December 31, 2012 | 141,377 | 141,377 | ||||||
| Additional paid-in capital | 24,177 | 22,677 | ||||||
| Treasury stock at cost - 5,910,541 shares at December 31, 2013 and 2012 | (82,860 | ) | (82,860 | ) | ||||
| Retained earnings | 66,064 | 124,059 | ||||||
| Accumulated other comprehensive loss | (3,562 | ) | (6,776 | ) | ||||
| Total stockholders' equity | 145,196 | 198,477 | ||||||
| TOTAL | $ | 305,949 | $ | 346,774 | ||||
| December 31, | ||||||||
| 2012 | 2011 | |||||||
| LIABILITIES AND STOCKHOLDERS' EQUITY | ||||||||
| CURRENT LIABILITIES: | ||||||||
| Current portion of long-term debt and lease obligations | $ | 412 | $ | 481 | ||||
| Unearned tuition | 34,648 | 43,242 | ||||||
| Accounts payable | 13,500 | 15,468 | ||||||
| Accrued expenses | 9,746 | 11,296 | ||||||
| Other short-term liabilities | 268 | 631 | ||||||
| Total current liabilities | 58,574 | 71,118 | ||||||
| NONCURRENT LIABILITIES: | ||||||||
| Long-term debt and lease obligations, net of current portion | 73,115 | 36,027 | ||||||
| Pension plan liabilities | 6,901 | 6,594 | ||||||
| Accrued rent | 8,663 | 8,365 | ||||||
| Other long-term liabilities | 1,044 | 1,122 | ||||||
| Total liabilities | 148,297 | 123,226 | ||||||
| COMMITMENTS AND CONTINGENCIES | ||||||||
| STOCKHOLDERS' EQUITY: | ||||||||
| Preferred stock, no par value - 10,000,000 shares authorized, no shares issued and outstanding at December 31, 2012 and 2011 | - | - | ||||||
| Common stock, no par value - authorized 100,000,000 shares at December 31, 2012 and 2011, issued and outstanding 29,659,457 shares at December 31, 2012 and 28,548,274 shares at December 31, 2011 | 141,377 | 141,377 | ||||||
| Additional paid-in capital | 22,677 | 19,535 | ||||||
| Treasury stock at cost - 5,910,541 shares at December 31, 2012 and 2011 | (82,860 | ) | (82,860 | ) | ||||
| Retained earnings | 124,059 | 167,689 | ||||||
| Accumulated other comprehensive loss | (6,776 | ) | (6,716 | ) | ||||
| Total stockholders' equity | 198,477 | 239,025 | ||||||
| TOTAL | $ | 346,774 | $ | 362,251 | ||||
See notes to consolidated financial statements.
LINCOLN EDUCATIONAL SERVICES CORPORATION AND SUBSIDIARIES
(In thousands, except per share amounts)
| Year Ended December 31, | Year Ended December 31, | |||||||||||||||||||||||
| 2012 | 2011 | 2010 | 2013 | 2012 | 2011 | |||||||||||||||||||
| REVENUE | $ | 402,697 | $ | 491,821 | $ | 604,762 | $ | 345,024 | $ | 382,773 | $ | 456,722 | ||||||||||||
| COSTS AND EXPENSES: | ||||||||||||||||||||||||
| Educational services and facilities | 192,205 | 210,892 | 227,331 | 172,685 | 180,610 | 196,639 | ||||||||||||||||||
| Selling, general and administrative | 204,299 | 232,478 | 257,621 | 178,494 | 191,033 | 216,846 | ||||||||||||||||||
| (Gain) loss on sale of assets | (75 | ) | 5 | (14 | ) | (506 | ) | (75 | ) | 4 | ||||||||||||||
| Impairment of goodwill and long-lived assets | 33,925 | 8,290 | 4,850 | 3,908 | 25,221 | 8,290 | ||||||||||||||||||
| Total costs & expenses | 430,354 | 451,665 | 489,788 | 354,581 | 396,789 | 421,779 | ||||||||||||||||||
| OPERATING (LOSS) INCOME | (27,657 | ) | 40,156 | 114,974 | (9,557 | ) | (14,016 | ) | 34,943 | |||||||||||||||
| OTHER: | ||||||||||||||||||||||||
| Interest income | 2 | 40 | 30 | 37 | 2 | 17 | ||||||||||||||||||
| Interest expense | (4,475 | ) | (4,369 | ) | (4,523 | ) | (4,667 | ) | (4,475 | ) | (4,369 | ) | ||||||||||||
| Other income | 14 | 18 | 45 | 18 | 14 | 18 | ||||||||||||||||||
| (LOSS) INCOME FROM CONTINUING OPERATIONS BEFORE INCOME TAXES | (32,116 | ) | 35,845 | 110,526 | (14,169 | ) | (18,475 | ) | 30,609 | |||||||||||||||
| (BENEFIT) PROVISION FOR INCOME TAXES | (8,235 | ) | 14,730 | 44,839 | ||||||||||||||||||||
| PROVISION (BENEFIT) FOR INCOME TAXES | 19,591 | (2,791 | ) | 13,053 | ||||||||||||||||||||
| (LOSS) INCOME FROM CONTINUING OPERATIONS | (23,881 | ) | 21,115 | 65,687 | (33,760 | ) | (15,684 | ) | 17,556 | |||||||||||||||
| (LOSS) INCOME FROM DISCONTINUED OPERATIONS, NET OF INCOME TAXES | (13,305 | ) | (3,575 | ) | 4,044 | |||||||||||||||||||
| LOSS FROM DISCONTINUED OPERATIONS, NET OF INCOME TAXES | (17,526 | ) | (21,502 | ) | (16 | ) | ||||||||||||||||||
| NET (LOSS) INCOME | $ | (37,186 | ) | $ | 17,540 | $ | 69,731 | $ | (51,286 | ) | $ | (37,186 | ) | $ | 17,540 | |||||||||
| Basic | ||||||||||||||||||||||||
| (Loss) earnings per share from continuing operations | $ | (1.08 | ) | $ | 0.96 | $ | 2.69 | $ | (1.50 | ) | $ | (0.71 | ) | $ | 0.80 | |||||||||
| (Loss) earnings per share from discontinued operations | (0.60 | ) | (0.16 | ) | 0.17 | |||||||||||||||||||
| Loss per share from discontinued operations | (0.78 | ) | (0.97 | ) | (0.00 | ) | ||||||||||||||||||
| Net (loss) income per share | $ | (1.68 | ) | $ | 0.80 | $ | 2.86 | $ | (2.28 | ) | $ | (1.68 | ) | $ | 0.80 | |||||||||
| Diluted | ||||||||||||||||||||||||
| (Loss) earnings per share from continuing operations | $ | (1.08 | ) | $ | 0.95 | $ | 2.63 | $ | (1.50 | ) | $ | (0.71 | ) | $ | 0.79 | |||||||||
| (Loss) earnings per share from discontinued operations | (0.60 | ) | (0.16 | ) | 0.16 | |||||||||||||||||||
| Loss per share from discontinued operations | (0.78 | ) | (0.97 | ) | (0.00 | ) | ||||||||||||||||||
| Net (loss) income per share | $ | (1.68 | ) | $ | 0.79 | $ | 2.79 | $ | (2.28 | ) | $ | (1.68 | ) | $ | 0.79 | |||||||||
| Weighted average number of common shares outstanding: | ||||||||||||||||||||||||
| Basic | 22,195 | 22,020 | 24,418 | 22,513 | 22,195 | 22,020 | ||||||||||||||||||
| Diluted | 22,195 | 22,155 | 25,024 | 22,513 | 22,195 | 22,155 | ||||||||||||||||||
See notes to consolidated financial statements
LINCOLN EDUCATIONAL SERVICES CORPORATION AND SUBSIDIARIES
(In thousands)
| December 31, | ||||||||||||
| 2013 | 2012 | 2011 | ||||||||||
| Net (loss) income | $ | (51,286 | ) | $ | (37,186 | ) | $ | 17,540 | ||||
| Other comprehensive (loss) income | ||||||||||||
| Employee pension plan adjustments, net of taxes of $1,283, $25 and $1,321 for the years ended December 31, 2013, 2012 and 2011, respectively | 3,214 | (60 | ) | (1,968 | ) | |||||||
| Comprehensive (loss) income | $ | (48,072 | ) | $ | (37,246 | ) | $ | 15,572 | ||||
See notes to consolidated financial statements
LINCOLN EDUCATIONAL SERVICES CORPORATION AND SUBSIDIARIES
(In thousands, except share amounts)
| Accumulated | ||||||||||||||||||||||||||||
| Additional | Other | |||||||||||||||||||||||||||
| Common Stock | Paid-in | Treasury | Retained | Comprehensive | ||||||||||||||||||||||||
| Shares | Amount | Capital | Stock | Earnings | Loss | Total | ||||||||||||||||||||||
| BALANCE - January 1, 2011 | 28,109,987 | $ | 140,726 | $ | 17,378 | $ | (82,860 | ) | $ | 151,989 | $ | (4,748 | ) | $ | 222,485 | |||||||||||||
| Net income | - | - | - | - | 17,540 | - | 17,540 | |||||||||||||||||||||
| Employee pension plan adjustments, net of taxes | - | - | - | - | - | (1,968 | ) | (1,968 | ) | |||||||||||||||||||
| Stock-based compensation expense | ||||||||||||||||||||||||||||
| Restricted stock | 393,431 | - | 3,141 | - | - | - | 3,141 | |||||||||||||||||||||
| Stock options | - | - | 400 | - | - | - | 400 | |||||||||||||||||||||
| Tax benefit of options exercised | - | - | 158 | - | - | - | 158 | |||||||||||||||||||||
| Tax deficiency of stock-based awards and canceled | - | - | (740 | ) | - | - | - | (740 | ) | |||||||||||||||||||
| Net share settlement for equity-based compensation | (68,250 | ) | (60 | ) | (802 | ) | - | - | - | (862 | ) | |||||||||||||||||
| Cash dividend of $0.07 per common share | - | - | - | - | (1,583 | ) | - | (1,583 | ) | |||||||||||||||||||
| Cash dividend declared true-up | - | - | - | - | (257 | ) | - | (257 | ) | |||||||||||||||||||
| Exercise of stock options | 113,106 | 711 | - | - | - | - | 711 | |||||||||||||||||||||
| BALANCE - December 31, 2011 | 28,548,274 | 141,377 | 19,535 | (82,860 | ) | 167,689 | (6,716 | ) | 239,025 | |||||||||||||||||||
| Net income | - | - | - | - | (37,186 | ) | - | (37,186 | ) | |||||||||||||||||||
| Employee pension plan adjustments, net of taxes | - | - | - | - | - | (60 | ) | (60 | ) | |||||||||||||||||||
| Stock-based compensation expense | ||||||||||||||||||||||||||||
| Restricted stock | 1,213,621 | - | 3,982 | - | - | - | 3,982 | |||||||||||||||||||||
| Stock options | - | - | 358 | - | - | - | 358 | |||||||||||||||||||||
| Tax deficiency of stock-based awards and canceled | - | - | (667 | ) | - | - | - | (667 | ) | |||||||||||||||||||
| Net share settlement for equity-based compensation | (102,438 | ) | - | (531 | ) | - | - | - | (531 | ) | ||||||||||||||||||
| Cash dividend of $0.28 per common share | - | - | - | - | (6,444 | ) | - | (6,444 | ) | |||||||||||||||||||
| BALANCE - December 31, 2012 | 29,659,457 | 141,377 | 22,677 | (82,860 | ) | 124,059 | (6,776 | ) | 198,477 | |||||||||||||||||||
| Net loss | - | - | - | - | (51,286 | ) | - | (51,286 | ) | |||||||||||||||||||
| Employee pension plan adjustments, net of taxes | - | - | - | - | - | 3,214 | 3,214 | |||||||||||||||||||||
| Stock-based compensation expense | ||||||||||||||||||||||||||||
| Restricted stock | 400,779 | - | 2,893 | - | - | - | 2,893 | |||||||||||||||||||||
| Stock options | - | - | 102 | - | - | - | 102 | |||||||||||||||||||||
| Tax deficiency of stock-based awards and cancels | - | - | (698 | ) | - | - | - | (698 | ) | |||||||||||||||||||
| Net share settlement for equity-based compensation | (140,475 | ) | - | (797 | ) | - | - | - | (797 | ) | ||||||||||||||||||
| Cash dividend of $0.28 per common share | - | - | - | - | (6,709 | ) | - | (6,709 | ) | |||||||||||||||||||
| BALANCE - December 31, 2013 | 29,919,761 | $ | 141,377 | $ | 24,177 | $ | (82,860 | ) | $ | 66,064 | $ | (3,562 | ) | $ | 145,196 | |||||||||||||
See notes to consolidated financial statements.
LINCOLN EDUCATIONAL SERVICES CORPORATION AND SUBSIDIARIES
(In thousands)
| December 31, | ||||||||||||
| 2012 | 2011 | 2010 | ||||||||||
| Net (loss) income | $ | (37,186 | ) | $ | 17,540 | $ | 69,731 | |||||
| Other comprehensive (loss) income | ||||||||||||
| Employee pension plan adjustments, net of taxes of $25, $1,321 and $102 for the years ended December 31, 2012, 2011 and 2010, respectively | (60 | ) | (1,968 | ) | 153 | |||||||
| Comprehensive (loss) income | $ | (37,246 | ) | $ | 15,572 | $ | 69,884 | |||||
| Accumulated | ||||||||||||||||||||||||||||
| Additional | Other | |||||||||||||||||||||||||||
| Common Stock | Paid-in | Treasury | Retained | Comprehensive | ||||||||||||||||||||||||
| Shares | Amount | Capital | Stock | Earnings | Loss | Total | ||||||||||||||||||||||
| BALANCE - January 1, 2010 | 27,722,471 | $ | 137,689 | $ | 14,161 | $ | (32,771 | ) | $ | 104,458 | $ | (4,901 | ) | $ | 218,636 | |||||||||||||
| Net income | - | - | - | - | 69,731 | - | 69,731 | |||||||||||||||||||||
| Employee pension plan adjustments, net of taxes | - | - | - | - | - | 153 | 153 | |||||||||||||||||||||
| Stock-based compensation expense | ||||||||||||||||||||||||||||
| Restricted stock | 17,624 | - | 2,036 | - | - | - | 2,036 | |||||||||||||||||||||
| Stock options | - | - | 629 | - | - | - | 629 | |||||||||||||||||||||
| Purchase of treasury stock | - | - | - | (50,089 | ) | - | - | (50,089 | ) | |||||||||||||||||||
| Tax benefit of options exercised | - | - | 1,484 | - | - | - | 1,484 | |||||||||||||||||||||
| Net share settlement for equity-based compensation | (52,214 | ) | (112 | ) | (932 | ) | - | - | - | (1,044 | ) | |||||||||||||||||
| Cash dividend of $1.00 per common share | - | - | - | - | (22,200 | ) | - | (22,200 | ) | |||||||||||||||||||
| Exercise of stock options | 422,106 | 3,149 | - | - | - | - | 3,149 | |||||||||||||||||||||
| BALANCE - December 31, 2010 | 28,109,987 | 140,726 | 17,378 | (82,860 | ) | 151,989 | (4,748 | ) | 222,485 | |||||||||||||||||||
| Net income | - | - | - | - | 17,540 | - | 17,540 | |||||||||||||||||||||
| Employee pension plan adjustments, net of taxes | - | - | - | - | - | (1,968 | ) | (1,968 | ) | |||||||||||||||||||
| Stock-based compensation expense | ||||||||||||||||||||||||||||
| Restricted stock | 393,431 | - | 3,141 | - | - | - | 3,141 | |||||||||||||||||||||
| Stock options | - | - | 400 | - | - | - | 400 | |||||||||||||||||||||
| Tax benefit of option exercised | - | - | 158 | - | - | - | 158 | |||||||||||||||||||||
| Tax deficiency of stock-based awards and canceled | - | - | (740 | ) | - | - | - | (740 | ) | |||||||||||||||||||
| Net share settlement for equity-based compensation | (68,250 | ) | (60 | ) | (802 | ) | - | - | - | (862 | ) | |||||||||||||||||
| Cash dividend of $0.07 per common share | - | - | - | - | (1,583 | ) | - | (1,583 | ) | |||||||||||||||||||
| Cash dividend declared true-up | - | - | - | - | (257 | ) | - | (257 | ) | |||||||||||||||||||
| Exercise of stock options | 113,106 | 711 | - | - | - | - | 711 | |||||||||||||||||||||
| BALANCE - December 31, 2011 | 28,548,274 | 141,377 | 19,535 | (82,860 | ) | 167,689 | (6,716 | ) | 239,025 | |||||||||||||||||||
| Net loss | - | - | - | - | (37,186 | ) | - | (37,186 | ) | |||||||||||||||||||
| Employee pension plan adjustments, net of taxes | - | - | - | - | - | (60 | ) | (60 | ) | |||||||||||||||||||
| Stock-based compensation expense | ||||||||||||||||||||||||||||
| Restricted stock | 1,213,621 | - | 3,982 | - | - | - | 3,982 | |||||||||||||||||||||
| Stock options | - | - | 358 | - | - | - | 358 | |||||||||||||||||||||
| Tax deficiency of stock-based awards and cancels | - | - | (667 | ) | - | - | - | (667 | ) | |||||||||||||||||||
| Net share settlement for equity-based compensation | (102,438 | ) | - | (531 | ) | - | - | - | (531 | ) | ||||||||||||||||||
Cash dividend of $0.28 per common share | - | - | - | - | (6,444 | ) | - | (6,444 | ) | |||||||||||||||||||
| BALANCE - December 31, 2012 | 29,659,457 | $ | 141,377 | $ | 22,677 | $ | (82,860 | ) | $ | 124,059 | $ | (6,776 | ) | $ | 198,477 | |||||||||||||
| Year Ended December 31, | ||||||||||||
| 2013 | 2012 | 2011 | ||||||||||
| CASH FLOWS FROM OPERATING ACTIVITIES: | ||||||||||||
| Net (loss) income | $ | (51,286 | ) | $ | (37,186 | ) | $ | 17,540 | ||||
| Adjustments to reconcile net (loss) income to net cash provided by operating activities: | ||||||||||||
| Depreciation and amortization | 23,701 | 26,848 | 28,464 | |||||||||
| Amortization of deferred finance costs | 474 | - | - | |||||||||
| Deferred income taxes | 26,490 | (14,229 | ) | 3,200 | ||||||||
| (Gain) loss on disposition of assets | (506 | ) | (71 | ) | 5 | |||||||
| Impairment of goodwill and long-lived assets | 6,194 | 43,364 | 10,377 | |||||||||
| Fixed asset donation | (37 | ) | - | - | ||||||||
| Provision for doubtful accounts | 15,532 | 21,056 | 30,553 | |||||||||
| Stock-based compensation expense | 2,995 | 4,340 | 3,541 | |||||||||
| Tax benefit associated with exercise of share based payments | - | - | (158 | ) | ||||||||
| Deferred rent | (888 | ) | 421 | 768 | ||||||||
| (Increase) decrease in assets, net of acquisition of business: | ||||||||||||
| Accounts receivable | (15,049 | ) | (19,202 | ) | (15,317 | ) | ||||||
| Inventories | 408 | 421 | 504 | |||||||||
| Prepaid income taxes and income taxes receivable | (1,432 | ) | 4,053 | (13,268 | ) | |||||||
| Prepaid expenses and current assets | (106 | ) | (1,274 | ) | (1,670 | ) | ||||||
| Other assets | (1,177 | ) | 999 | 696 | ||||||||
| Increase (decrease) in liabilities, net of acquisition of business: | ||||||||||||
| Accounts payable | 1,461 | (2,180 | ) | (5,510 | ) | |||||||
| Accrued expenses | 829 | (1,688 | ) | (14,936 | ) | |||||||
| Pension plan liabilities | (672 | ) | (718 | ) | (276 | ) | ||||||
| Unearned tuition | (4,453 | ) | (9,466 | ) | (7,702 | ) | ||||||
| Other liabilities | 768 | 498 | 27 | |||||||||
| Total adjustments | 54,532 | 53,172 | 19,298 | |||||||||
| Net cash provided by operating activities | 3,246 | 15,986 | 36,838 | |||||||||
| CASH FLOWS FROM INVESTING ACTIVITIES: | ||||||||||||
| Restricted cash | - | - | 694 | |||||||||
| Capital expenditures | (6,538 | ) | (8,839 | ) | (38,119 | ) | ||||||
| Proceeds from sale of property and equipment | 750 | 124 | 36 | |||||||||
| Acquisition of business, net of cash acquired | - | (1,472 | ) | - | ||||||||
| Net cash used in investing activities | (5,788 | ) | �� | (10,187 | ) | (37,389 | ) | |||||
| CASH FLOWS FROM FINANCING ACTIVITIES: | ||||||||||||
| Proceeds from borrowings | 59,500 | 37,500 | - | |||||||||
| Payments on borrowings | (42,500 | ) | - | (20,000 | ) | |||||||
| Reclassifications of proceeds from borrowings to restricted cash | (54,500 | ) | - | - | ||||||||
| Payment of deferred finance fees | (863 | ) | (659 | ) | - | |||||||
| Proceeds from exercise of stock options | - | - | 711 | |||||||||
| Tax benefit associated with exercise of share based payments | - | - | 158 | |||||||||
| Net share settlement for equity-based compensation | (797 | ) | (531 | ) | (862 | ) | ||||||
| Dividends paid | (6,709 | ) | (6,444 | ) | (18,490 | ) | ||||||
| Principal payments under capital lease obligations | (411 | ) | (481 | ) | (437 | ) | ||||||
| Net cash (used in) provided by financing activities | (46,280 | ) | 29,385 | (38,920 | ) | |||||||
| NET (DECREASE) INCREASE IN CASH AND CASH EQUIVALENTS | (48,822 | ) | 35,184 | (39,471 | ) | |||||||
| CASH AND CASH EQUIVALENTS—Beginning of year | 61,708 | 26,524 | 65,995 | |||||||||
| CASH AND CASH EQUIVALENTS—End of year | $ | 12,886 | $ | 61,708 | $ | 26,524 | ||||||
See notes to consolidated financial statements.
LINCOLN EDUCATIONAL SERVICES CORPORATION AND SUBSIDIARIES
| Year Ended December 31, | ||||||||||||
| 2012 | 2011 | 2010 | ||||||||||
| CASH FLOWS FROM OPERATING ACTIVITIES: | ||||||||||||
| Net (loss) income | $ | (37,186 | ) | $ | 17,540 | $ | 69,731 | |||||
| Adjustments to reconcile net (loss) income to net cash provided by operating activities: | ||||||||||||
| Depreciation and amortization | 26,848 | 28,464 | 26,218 | |||||||||
| Deferred income taxes | (14,229 | ) | 3,200 | 2,431 | ||||||||
| (Gain) loss on disposition of assets | (71 | ) | 5 | (8 | ) | |||||||
| Impairment of goodwill and long-lived assets | 43,364 | 10,377 | 6,244 | |||||||||
| Provision for doubtful accounts | 21,056 | 30,553 | 39,106 | |||||||||
| Stock-based compensation expense | 4,340 | 3,541 | 2,665 | |||||||||
| Tax benefit associated with exercise of share based payments | - | (158 | ) | (1,484 | ) | |||||||
| Deferred rent | 421 | 768 | 1,566 | |||||||||
| (Increase) decrease in assets, net of acquisition of business: | ||||||||||||
| Accounts receivable | (19,202 | ) | (15,317 | ) | (36,732 | ) | ||||||
| Inventories | 421 | 504 | (226 | ) | ||||||||
| Prepaid income taxes and income taxes receivable | 4,053 | (13,268 | ) | (2,830 | ) | |||||||
| Prepaid expenses and current assets | (1,274 | ) | (1,670 | ) | 4,511 | |||||||
| Other assets | 999 | 696 | (439 | ) | ||||||||
| Increase (decrease) in liabilities, net of acquisition of business: | ||||||||||||
| Accounts payable | (2,180 | ) | (5,510 | ) | 2,338 | |||||||
| Accrued expenses | (1,688 | ) | (14,936 | ) | (984 | ) | ||||||
| Pension plan liabilities | (718 | ) | (276 | ) | (822 | ) | ||||||
| Unearned tuition | (9,466 | ) | (7,702 | ) | 2,857 | |||||||
| Other liabilities | 498 | 27 | 322 | |||||||||
| Total adjustments | 53,172 | 19,298 | 44,733 | |||||||||
| Net cash provided by operating activities | 15,986 | 36,838 | 114,464 | |||||||||
| CASH FLOWS FROM INVESTING ACTIVITIES: | ||||||||||||
| Restricted cash | - | 694 | 164 | |||||||||
| Capital expenditures | (8,839 | ) | (38,119 | ) | (42,352 | ) | ||||||
| Proceeds from sale of property and equipment | 124 | 36 | 77 | |||||||||
| Acquisition of business, net of cash acquired | (1,472 | ) | - | - | ||||||||
| Net cash used in investing activities | (10,187 | ) | (37,389 | ) | (42,111 | ) | ||||||
| CASH FLOWS FROM FINANCING ACTIVITIES: | ||||||||||||
| Proceeds from borrowings | 37,500 | - | 20,000 | |||||||||
| Payments on borrowings | - | (20,000 | ) | (20,000 | ) | |||||||
| Payment of deferred finance fees | (659 | ) | - | - | ||||||||
| Proceeds from exercise of stock options | - | 711 | 3,149 | |||||||||
| Tax benefit associated with exercise of share based payments | - | 158 | 1,484 | |||||||||
| Net share settlement for equity-based compensation | (531 | ) | (862 | ) | (1,044 | ) | ||||||
| Dividends paid | (6,444 | ) | (18,490 | ) | (5,550 | ) | ||||||
| Principal payments under capital lease obligations | (481 | ) | (437 | ) | (384 | ) | ||||||
| Purchase of treasury stock | - | - | (50,089 | ) | ||||||||
| Net cash provided by (used in) financing activities | 29,385 | (38,920 | ) | (52,434 | ) | |||||||
| NET (DECREASE) INCREASE IN CASH AND CASH EQUIVALENTS | 35,184 | (39,471 | ) | 19,919 | ||||||||
| CASH AND CASH EQUIVALENTS—Beginning of year | 26,524 | 65,995 | 46,076 | |||||||||
| CASH AND CASH EQUIVALENTS—End of year | $ | 61,708 | $ | 26,524 | $ | 65,995 | ||||||
CONSOLIDATED STATEMENTS OF CASH FLOWS
(In thousands)
(Continued)
| Year Ended December 31, | Year Ended December 31, | |||||||||||||||||||||||
| 2012 | 2011 | 2010 | 2013 | 2012 | 2011 | |||||||||||||||||||
| SUPPLEMENTAL DISCLOSURES OF CASH FLOW INFORMATION: | ||||||||||||||||||||||||
| Cash paid during the year for: | ||||||||||||||||||||||||
| Interest | $ | 4,184 | $ | 4,003 | $ | 4,180 | $ | 4,209 | $ | 4,184 | $ | 4,003 | ||||||||||||
| Income taxes | $ | 226 | $ | 23,218 | $ | 49,331 | $ | 410 | $ | 226 | $ | 23,218 | ||||||||||||
| SUPPLEMENTAL SCHEDULE OF NONCASH INVESTING AND FINANCING ACTIVITIES: | ||||||||||||||||||||||||
| Liabilities accrued for or noncash purchases of fixed assets | $ | 1,789 | $ | 1,166 | $ | 5,962 | $ | 93 | $ | 1,789 | $ | 1,166 | ||||||||||||
| Dividends payable | $ | - | $ | - | $ | 16,650 | ||||||||||||||||||
See notes to consolidated financial statements.
LINCOLN EDUCATIONAL SERVICES CORPORATION AND SUBSIDIARIES
AS OF DECEMBER 31, 20122013 AND 20112012 AND FOR THE THREE YEARS ENDED DECEMBER 31, 20122013
(In thousands, except share and per share amounts, schools, training sites, campuses and unless otherwise stated)
| 1. | SUMMARY OF SIGNIFICANT ACCOUNTING POLICIES |
Business Activities—Lincoln Educational Services Corporation and Subsidiaries (the "Company") is a provider of diversified career-oriented post-secondary education. The Company offers recent high school graduates and working adults degree and diploma programs in five principal areas of study: Automotive Technology, Health Science, Skilled Trades, Hospitality Services and Business and Information Technology. The Company currently has 3833 schools and five training sites in 1715 states across the United States.
Principles of Consolidation—The accompanying consolidated financial statements include the accounts of Lincoln Educational Services Corporation and its wholly-owned subsidiaries. All intercompany accounts and transactions have been eliminated.
Revenue Recognition—Revenue is derived primarily from programs taught at the schools. Tuition revenue and one-time fees, such as nonrefundable application fees, registration fees, and course material fees are recognized on a straight-line basis over the length of the applicable program. If a student withdraws from a program prior to a specified date, any paid but unearned tuition is refunded. Other revenues, such as tool sales and contract training revenues are recognized as services are performed or goods are delivered. On an individual student basis, tuition earned in excess of cash received is recorded as accounts receivable, and cash received in excess of tuition earned is recorded as unearned tuition. Refunds are calculated and paid in accordance with federal, state and accrediting agency standards.
Cash and Cash Equivalents—Cash and cash equivalents include all cash balances and highly liquid short-term investments, which mature within three months of purchase.
Restricted Cash—Restricted cash consists of deposits maintained at financial institutions under a cash collateralized agreement under the Company’s credit agreement. Refer to Note 9 for more information on the credit agreement.
Accounts Receivable—The Company reports accounts receivable at net realizable value, which is equal to the gross receivable less an estimated allowance for uncollectible accounts. Noncurrent accounts receivable represent amounts due from graduates in excess of 12 months from the balance sheet date.
Allowance for uncollectible accounts—Based upon experience and judgment, an allowance is established for uncollectible accounts with respect to tuition receivables. In establishing the allowance for uncollectible accounts, we consider, among other things, current and expected economic conditions, a student's status (in-school or out-of-school), whether or not a student is currently making payments, and overall collection history. Changes in trends in any of these areas may impact the allowance for uncollectible accounts. The receivables balances of withdrawn students with delinquent obligations are reserved for based on our collection history.
Fair Value of Financial Instruments—The carrying value of cash and cash equivalents approximates fair value at December 31, 20122013 and 2011.2012. In addition, the carrying value of all borrowings under the credit agreement approximates fair value at December 31, 20122013 and 2011.2012. The account receivable, net balances are presented within current and non-current assets on the consolidated balance sheets. It is not practicable to estimate the fair value of these financial instruments, since observable market data is not readily available, and no reasonable estimation methodology exists.
Inventories—Inventories consist mainly of textbooks, tools and supplies. Inventories are valued at the lower of cost or market on a first-in, first-out basis.
Property, Equipment and Facilities—Depreciation and Amortization—Property, equipment and facilities are stated at cost. Major renewals and improvements are capitalized, while repairs and maintenance are expensed when incurred. Upon the retirement, sale or other disposition of assets, costs and related accumulated depreciation are eliminated from the accounts and any gain or loss is reflected in operating (loss) income. For financial statement purposes, depreciation of property and equipment is computed using the straight-line method over the estimated useful lives of the assets, and amortization of leasehold improvements is computed over the lesser of the term of the lease or its estimated useful life.
Rent Expense—Rent expense related to operating leases where scheduled rent increases exist, is determined by expensing the total amount of rent due over the life of the operating lease on a straight-line basis. The difference between the rent paid under the terms of the lease and the rent expensed on a straight-line basis is included in accrued rent and other long-term liabilities on the accompanying consolidated balance sheets.
Advertising Costs—Costs related to advertising are expensed as incurred and approximated $34.2$29.3 million, $40.8$30.3 million and $44.3$38.1 million from continuing operations for the years ended December 31, 2013, 2012 2011 and 2010,2011, respectively. These amounts are included in selling, general and administrative expenses in the consolidated statements of operations.
Goodwill and Other Intangible Assets— The Company tests its goodwill for impairment annually, or whenever events or changes in circumstances indicate an impairment may have occurred, by comparing its reporting unit’s carrying value to its implied fair value. Impairment may result from, among other things, deterioration in the performance of the acquired business, adverse market conditions, adverse changes in applicable laws or regulations, reductions in market value of the Company, including changes that restrict the activities of the acquired business, and a variety of other circumstances. If the Company determines that an impairment has occurred, it is required to record a write-down of the carrying value and charge the impairment as an operating expense in the period the determination is made. In evaluating the recoverability of the carrying value of goodwill and other indefinite-lived intangible assets, the Company must make assumptions regarding estimated future cash flows and other factors to determine the fair value of the acquired assets. Changes in strategy or market conditions could significantly impact these judgments in the future and require an adjustment to the recorded balances.
At December 31, 2013, the Company conducted its annual test for goodwill impairment and determined it did not have an impairment. The fair value of the Company’s reporting units were determined using Level 3 inputs included in its multiple of earnings and discounted cash flow approach. As of June 30, 2013, the Company concluded that current period losses at two reporting units, which resulted in a deterioration of current and projected cash flows, was an indicator of potential impairment and, accordingly, tested goodwill and long-lived assets for impairment. The tests indicated that these two reporting units were impaired, which resulted in a pre-tax non-cash charge of $3.1 million for the three months ended June 30, 2013.
At December 31, 2012, the Company tested goodwill for impairment and determined that an impairment of approximately $18.3 million ($4.5 million included in discontinued operations) existed for seven of its reporting units. The Company concluded that the decrease in the Company’s market capitalization as of June 30, 2012 was an indicator of potential impairment and, accordingly, the Company tested goodwill for impairment. The tests indicated that five of the Company’s reporting units were impaired as a result of lower than expected student population, which resulted in a pre-tax charge of $15.4 million in the second quarter of 2012 ($5.58.4 million included in discontinued operations). The fair values of these reporting units were estimated using the expected present value of future cash flows. No other reporting unit’s carrying goodwill amount exceeded or approximated its implied value.
At December 31, 2011, the Company tested goodwill for impairment and determined it did not have an impairment. The Company concluded that the decrease in the Company’s market capitalization as of September 30, 2011 was an indicator of potential impairment and, accordingly, the Company tested goodwill and indefinite-lived intangibles for impairment. The tests indicated that five of the Company’s reporting units were impaired, which resulted in an expense of $9.3 million in the third quarter of 2011 ($1.0 million included in discontinued operations). At December 31, 2011, the Company tested goodwill for impairment and determined it did not have an impairment. At December 31, 2010, the Company tested goodwill for impairment and determined that an impairment of approximately $6.2 million existed for three of its reporting units ($1.4 million included in discontinued operations).
Concentration of Credit Risk—Financial instruments that potentially subject the Company to concentrations of credit risk consist principally of temporary cash investments. The Company places its cash and cash equivalents with high credit quality financial institutions. The Company's cash balances with financial institutions typically exceed the Federal Deposit Insurance limit of $0.25 million. The Company's cash balances on deposit at December 31, 2012,2013, exceeded the balance insured by the FDIC by approximately $60.3$66.7 million. The Company has not experienced any losses to date on its invested cash.
The Company extends credit for tuition and fees to many of its students. The credit risk with respect to these accounts receivable is mitigated through the students' participation in federally funded financial aid programs unless students withdraw prior to the receipt of federal funds for those students. In addition, the remaining tuition receivables are primarily comprised of smaller individual amounts due from students.
With respect to student receivables, the Company had no significant concentrations of credit risk as of December 31, 20122013 and 2011.2012.
Use of Estimates in the Preparation of Financial Statements—The preparation of financial statements in conformity with generally accepted accounting principles in the United States (“GAAP’) requires management to make estimates and assumptions that affect the reported amounts of assets and liabilities and disclosure of contingent assets and liabilities at the date of the consolidated financial statements and the reported amounts of revenues and expenses during the period. On an ongoing basis, the Company evaluates the estimates and assumptions, including those related to revenue recognition, bad debts, impairments, fixed assets, income taxes, benefit plans and certain accruals. Actual results could differ from those estimates.
Stock-Based Compensation Plans—The Company measures the value of stock options on the grant date at fair value, using the Black-Scholes option valuation model. The Company amortizes the fair value of stock options, net of estimated forfeitures, utilizing straight-line amortization of compensation expense over the requisite service period of the grant.
The Company measures the value of service and performance-based restricted stock on the fair value of a share of common stock on the date of the grant. The Company amortizes the fair value of service based restricted stock utilizing straight-line amortization of compensation expense over the requisite service period of the grant.
The Company amortizes the fair value of the performance-based restricted stock based on determination of the probable outcome of the performance condition. If the performance condition is expected to be met, then the Company amortizes the fair value of the number of shares expected to vest utilizing straight-line basis over the requisite performance period of the grant. However, if the associated performance condition is not expected to be met, then the Company does not recognize the stock-based compensation expense.
Income Taxes—DeferredThe Company accounts for income taxes in accordance with FASB ASC Topic 740, “Income Taxes” (“ASC 740”). This statement requires an asset and a liability approach for measuring deferred taxes based on temporary differences between the financial statement and tax bases of assets and liabilities existing at each balance sheet date using enacted tax rates for years in which taxes are expected to be paid or recovered.
In accordance with ASC 740, the Company assesses our deferred tax asset to determine whether all or any portion of the asset is more likely than not unrealizable. A valuation allowance is required to be established or maintained when, based on currently available information, it is more likely than not that all or a portion of a deferred tax asset will not be realized. In accordance with ASC 740, our assessment considers whether there has been sufficient income in recent years and whether sufficient income is expected in future years in order to utilize the deferred tax asset. In evaluating the realizability of deferred income tax assets, the Company considered, among other things, historical levels of income, expected future income, the expected timing of the reversals of existing temporary reporting differences, and the expected impact of tax planning strategies that may be implemented to prevent the potential loss of future income tax benefits. Significant judgment is required in determining the future tax consequences of events that have been recognized in our consolidated financial statements and/or tax returns. Differences between anticipated and actual outcomes of these future tax consequences could have a material impact on our consolidated financial position or results of operations. Changes in, among other things, income tax legislation, statutory income tax rates, or future income levels could materially impact our valuation of income tax assets and liabilities are recognized for the estimated futureand could cause our income tax consequences attributableprovision to differences betweenvary significantly among financial statement carrying amounts of assets and liabilities and their respective tax bases. Deferred tax assets and liabilities are measured using enacted tax rates expected to apply to taxable income in the years in which those temporary differences are expected to be recovered or settled. The effect on deferred tax assets and liabilities of changes in tax rates is recognized in income in the period that includes the enactment date.reporting periods.
The Company recognizes accrued interest and penalties related to unrecognized tax benefits in income tax expense. During the years ended December 31, 20122013 and 2011,2012, the interest and penalties expense associated with uncertain tax positions are not significant to the Company’s results of operations or financial position.
Impairment of Long-Lived Assets—The Company reviews the carrying value of our long-lived assets and identifiable intangibles for possible impairment whenever events or changes in circumstances indicate that the carrying amounts may not be recoverable. The Company evaluates long-lived assets for impairment by examining estimated future cash flows.flows using Level 3 inputs. These cash flows are evaluated by using weighted probability techniques as well as comparisons of past performance against projections. Assets may also be evaluated by identifying independent market values. If the Company determines that an asset’s carrying value is impaired, it will record a write-down of the carrying value of the asset and charge the impairment as an operating expense in the period in which the determination is made.
The Company concluded that for the three months ended December 31, 2013, there was no long-lived asset impairment. The Company concluded that as of June 30, 2013 and March 31, 2013, there was sufficient evidence to conclude that there were impairments of certain long-lived assets at four and two of our campuses, respectively. Long lived assets had been tested at these campuses as a result of certain financial indicators such as our history of losses, our current respective period losses, as well as future projected losses at these campuses. The long-lived assets impairment resulted in a pre-tax charge of $1.4 million ($0.7 million included in discontinued operations) and $1.7 million ($1.6 million included in discontinued operations) for leasehold improvements as of June 30, 2013 and March 31, 2013, respectively.
The Company concluded that as of December 31, 2012 there was an indicator of potential impairment and accordingly, the Company tested long-lived assets for impairment and determined that certain long-lived assets at four campuses were impaired. This resulted in a pre-tax charge of $1.3 million for leasehold improvements. The Company concluded that as of June 30, 2012, there was an indicator of potential impairment and, accordingly, the Company tested long-lived assets for impairment and determined that certain long-lived assets at four and 10 of its campuses were impaired. This resulted in a pre-tax charge of $1.3 million ($0.9 million included in discontinued operations) for leasehold improvements as of December 31, 2012 and $8.3 million (4.4 million in discontinued operations) as of June 30, 2012, which included leasehold improvements of $8.1 million and $0.2 million in definite-lived intangible assets of $0.2 million ($4.0 million included in discontinued operations).respectively.
The Company recorded an impairment charge of $1.0 million in the third quarter of 2011 related to a regional accreditation indefinite intangible asset that is no longer being utilized and is included in discontinued operations.
Start-up Costs—Costs related to the start of new campuses are expensed as incurred.
New Accounting Pronouncements
In January 2013, the Financial Accounting Standards Board ("FASB") issued Accounting Standard Update ("ASU") No. 2013-01, Clarifying the Scope of Disclosures about Offsetting Assets and Liabilities. The amendments in this ASU clarify that the disclosure requirements of ASU No. 2011-11 are limited to derivatives, including bifurcated embedded derivatives, repurchase and reverse repurchase agreements, and securities borrowing and lending transactions that are either offset in the statement of financial position or subject to an enforceable master netting arrangement or similar agreement. This ASU is effective retrospectively for annual periods beginning on or after January 1, 2013. The adoption of this ASU did not materially impact the presentation of its financial condition, results of operation and disclosures.
In February 2013, the FASB issued ASU No. 2013-04, Obligations Resulting from Joint and Several Liability Arrangements for Which the Total Amount of the Obligation Is Fixed at the Reporting Date. The amendments in this ASU provide guidance for the recognition, measurement and disclosure of obligations resulting from joint and several liability arrangements from which the total amount of the obligation within the scope of this guidance is fixed at the reporting date. This ASU is effective for fiscal years, and interim periods within those years, beginning after December 15, 2013. The Company does not anticipate a material impact to the Company's financial position, results of operations or cash flows as a result of this change.
In July 2013, the FASB issued ASU No. 2013-11, Presentation of an Unrecognized Tax Benefit When a Net Operating Loss Carryforward, a Similar Tax Loss, or a Tax Credit Carryforward Exists. The amendments in this ASU provide guidance on the financial statement presentation of unrecognized tax benefit when a net operating loss carryforward, a similar tax loss or a tax credit carryforward exists. This ASU is effective for fiscal years, and interim periods within those years, beginning after December 15, 2013. The Company will reflect the impact of these amendments beginning with the Company's Quarterly Report on Form 10-Q for the period ending March 31, 2014. The Company does not anticipate a material impact to the Company's financial position, results of operations or cash flows as a result of this change.
In February 2013, the FASB issued ASU No. 2013-02, Comprehensive Income (Topic 220) – Reporting of Amounts Reclassified Out of Accumulated Other Comprehensive Income. The amendments in this ASU require entities to provide information about amounts reclassified out of accumulated other comprehensive income by component, and to present, either on the face of the statement where net income is presented or in the notes, significant amounts reclassified out of accumulated other comprehensive income by the respective line items of net income, or cross-reference to other disclosures, based on certain criteria. This ASU is effective prospectively for reporting periods beginning after December 15, 2012; early adoption is permitted. The Company has adopted this guidance. The adoption of this ASU did not materially impact the presentation of its financial condition, results of operation and disclosures.
In addition, the Company has evaluated and adopted the guidance of ASU No. 2012-02, Intangibles-Goodwill and Other (Topic 350): Testing Indefinite-Lived Intangible Assets for Impairment issued in July 2012. The amendments in this ASU give entities the option to first assess qualitative factors to determine whether the existence of events and circumstances indicates that it is more likely than not that an indefinite-lived intangible asset is impaired. If impairment is indicated, the fair value of the indefinite–lived intangible asset should be determined and the quantitative impairment test should be performed by comparing the fair value with the carrying amount in accordance with Subtopic 350-30; if impairment is not indicated, the entity is not required to take further action. The adoption of this ASU did not impact the presentation of the Company’s financial condition, results of operation and disclosures.
In October 2012, the Financial Accounting Standards Board (“FASB”)FASB issued Accounting Standards Update (“ASU”)ASU No. 2012-04, which makes technical corrections, clarifications and limited-scope improvements to various topics throughout the Codification. The amendments in this ASU that do not have transition guidance and are effective upon issuance and the amendments that are subject to transition guidance will be effective for ourthe Company’s interim and annual reporting periods beginning January 1, 2013. The adoption of this guidance willdid not have a material impact on ourthe Company’s consolidated financial statements.
In August 2012, the FASB issued ASU No. 2012-03, which amends and corrects various sections in the Codification pursuant to Staff Accounting Bulletin (“SAB”) No. 114, SEC Release No. 33-9250 and ASU No. 2010-22. The amendments and corrections in this ASU are effective upon issuance. The adoption of this guidance did not have a material impact on ourthe Company’s consolidated financial statements.
| 2. | FINANCIAL AID AND REGULATORY COMPLIANCE |
Financial Aid
The Company’s schools and students participate in a variety of government-sponsored financial aid programs that assist students in paying the cost of their education. The largest source of such support is the federal programs of student financial assistance under Title IV of the Higher Education Act of 1965, as amended, commonly referred to as the Title IV Programs, which are administered by the U.S. Department of Education (the "DOE"). During the years ended December 31, 2013, 2012 and 2011, approximately 80%, 81% and 2010, approximately 81%, 84% and 83%, respectively, of net revenues on a cash basis were indirectly derived from funds distributed under Title IV Programs.
For the year ended December 31, 2013, 2012 and 2011, the Company was in compliance with the standards established by the DOE requiring that no individual DOE reporting entity can receive more than 90% of its revenue, determined on a cash basis, from Title IV, HEA Program Funds. For the year ended December 31, 2012, the Company determined that one of its institutions received approximately 93% of its revenue, determined on a cash basis, from Title IV, HEA Program Funds. For the year ended December 31, 2010, the Company determined that the same institution as noted above received approximately 97% of its revenue, determined on a cash basis, from Title IV, HEA Program Funds. A proprietary institution that derives more than 90% of its total revenue from the Title IV programs for two consecutive fiscal years becomes immediately ineligible to participate in the Title IV programs and may not reapply for eligibility until the end of two fiscal years. An institution with revenues exceeding 90% for a single fiscal year ending after August 14, 2008 will be placed on provisional certification and may be subject to other enforcement measures. If one of the Company’s institutions violated the 90/10 Rule and became ineligible to participate in Title IV Programs but continued to disburse Title IV Program funds, the DOE would require the institution to repay all Title IV Program funds received by the institution after the effective date of the loss of eligibility. None of the Company’s institutions has derived more than 90% of its total revenue from the Title IV programs for two consecutive years.
Regulatory Compliance
To participate in Title IV Programs, a school must be authorized to offer its programs of instruction by relevant state education agencies, be accredited by an accrediting commission recognized by the DOE and be certified as an eligible institution by the DOE. For this reason, the schools are subject to extensive regulatory requirements imposed by all of these entities. After the schools receive the required certifications by the appropriate entities, the schools must demonstrate their compliance with the DOE regulations of the Title IV Programs on an ongoing basis. Included in these regulations is the requirement that the Company must satisfy specific standards of financial responsibility. The DOE evaluates institutions for compliance with these standards each year, based upon the institution’s annual audited financial statements, as well as following a change in ownership of the institution. Under regulations which took effect July 1, 1998, the DOE calculates the institution's composite score for financial responsibility based on its (i) equity ratio, which measures the institution's capital resources, ability to borrow and financial viability; (ii) primary reserve ratio, which measures the institution's ability to support current operations from expendable resources; and (iii) net income ratio, which measures the institution's ability to operate at a profit. This composite score can range from -1 to +3.
The DOE has evaluated the financial responsibility of the Company’s institutions on a consolidated basis. The Company has submitted to the DOE its audited financial statements for the 20112012 and 20102011 fiscal years reflecting a composite score of 2.11.6 and 1.8,2.1, respectively, based upon its calculations, and that its schools meet the DOE standards of financial responsibility. For the 20122013 fiscal year, the Company has calculated its composite score to be 1.6. 1.5. However, this is subject to determination by the DOE once it receives and reviews the Company’s audited financial statements for the 20122013 fiscal year.
| 3. | WEIGHTED AVERAGE COMMON SHARES |
The weighted average numbers of common shares used to compute basic and diluted income per share for the years ended December 31, 2013, 2012 2011 and 2010,2011, respectively were as follows:
| Year Ended December 31, | Year Ended December 31, | |||||||||||||||||||||||
| 2012 | 2011 | 2010 | 2013 | 2012 | 2011 | |||||||||||||||||||
| Basic shares outstanding | 22,195,407 | 22,019,563 | 24,418,460 | 22,513,391 | 22,195,407 | 22,019,563 | ||||||||||||||||||
| Dilutive effect of stock options | - | 135,437 | 605,713 | - | - | 135,437 | ||||||||||||||||||
| Diluted shares outstanding | 22,195,407 | 22,155,000 | 25,024,173 | 22,513,391 | 22,195,407 | 22,155,000 | ||||||||||||||||||
For the year ended December 31, 2013 and 2012, options to acquire 222,707 and 71,989 shares were excluded from the above table because the Company reported a net loss for the year and therefore their impact on reported loss per share would have been antidilutive. For the years ended December 31, 2013, 2012 2011 and 2010,2011, options to acquire 216,908,657,083; 216,908; and 399,583 and 201,500 shares,shares; respectively, were excluded from the above table because they have an exercise price that is greater than the average market price of the Company’s common stock and therefore their impact on reported (loss) earnings per share would have been antidilutive.
In 2011 and 2013, the Company issued certain members of management performance shares that vest when certain performance conditions are met. TheseAs of December 31, 2013, these performance conditions havewere not been met in 2012 with respect to the Company’s performance shares. As a result, the Company has determined these shares to be contingently issuable.met. Accordingly, 441,552 and 134,131 shares of outstanding performance shares have been excluded from the computation of diluted earnings per share for the year ended December 31, 2012.2013 and 2012, respectively. Refer to Note 10 for more information on performance shares.
| 4. | DISCONTINUED OPERATIONS |
2013 Event
On June 18, 2013, the Company’s Board of Directors approved a plan to cease operations at four campuses in Ohio and one campus in Kentucky consisting of the Company’s Dayton institution and its branch campuses. Federal legislation implemented on July 1, 2012 that prohibits “ability to benefit” students from participating in federal student financial aid programs led to a dramatic decrease in the number of students attending these five campuses. Accordingly, the Company ceased operations at these campuses as of December 31, 2013. The results of operations of these campuses are reflected as discontinued operations in the consolidated financial statements.
The results of operations at these five campuses for the three year periods ended December 31, 2013 were as follows (in thousands):
| Year Ended December 31, | ||||||||||||
| 2013 | 2012 | 2011 | ||||||||||
| Revenue | $ | 7,724 | $ | 19,924 | $ | 35,099 | ||||||
| (Loss) income before income tax | (17,287 | ) | (13,641 | ) | 5,236 | |||||||
| Income tax expense (benefit) | 239 | (5,444 | ) | 1,677 | ||||||||
| Net (loss) income from discontinued operations | $ | (17,526 | ) | $ | (8,197 | ) | $ | 3,559 | ||||
Amounts include impairments of goodwill and long-lived assets for these campuses of $2.3 million and $8.7 million for the years ended December 31, 2013 and 2012, respectively.
2012 Event
On July 31, 2012, the Company’s Board of Directors approved a plan to cease operations at seven campuses. The adjustments made to the Company’s business model to better align with the DOE’s increased emphasis on student outcomes and the Company’s efforts to comply with the 90/10 rule and cohort default rates greatly impacted the population at these campuses. In addition, the current economic environment and regulatory changes under the Consolidated Appropriations Act, 2012, which eliminated the ability to enroll “ability to benefit” (“ATB”) students, have made these campuses no longer viable. Accordingly, the Company ceased operations at these campuses as of December 31, 2012. The results of operations are reflected as discontinued operations in the consolidated financial statements.
The results of operations at these seven campuses for the threetwo year periods ended December 31, 2012 were as follows (in thousands):
| Year Ended December 31, | ||||||||||||
| 2012 | 2011 | 2010 | ||||||||||
| Revenue | $ | 8,500 | $ | 20,804 | $ | 34,732 | ||||||
| (Loss) income before income tax | (22,142 | ) | (5,260 | ) | 7,657 | |||||||
| Income tax (benefit) expense | (8,837 | ) | (1,685 | ) | 3,613 | |||||||
| Net (loss) income from discontinued operations | $ | (13,305 | ) | $ | (3,575 | ) | $ | 4,044 | ||||
| Year Ended December 31, | ||||||||
| 2012 | 2011 | |||||||
| Revenue | $ | 8,500 | $ | 20,804 | ||||
| Loss before income tax | (22,142 | ) | (5,260 | ) | ||||
| Income tax benefit | (8,837 | ) | (1,685 | ) | ||||
| Net loss from discontinued operations | $ | (13,305 | ) | $ | (3,575 | ) | ||
Amounts include impairments of goodwill and long-lived assets for these campuses of $9.5 million $2.1 million and $1.4$2.1 million for the years ended December 31, 2012 2011 and 2010,2011, respectively.
| 5. | BUSINESS ACQUISITIONS |
On April 18, 2012, the Company acquired all of the rights, title and interest in certain assets and liabilities of Florida Medical Training Institute, Inc. (“FMTI”) for total consideration of $1.7 million, net of cash acquired. FMTI has five locations in Florida: Melbourne, Jacksonville, Tampa, Miami and Coral Springs. FMTI currently offers certificate programs in the fields of Emergency Medical Technician, Paramedic, EKG/Phlebotomy, Nursing Assistant, Fire Fighter and Associate of Science Degrees in Emergency Medical Services and Fire Science Technology. The Company acquired FMTI as it does not receive Title IV funding. The purchase price allocation resulted in $2.9 million allocated to assets including $0.5$2.4 million to intangible assets and $1.9 million to goodwill and $1.4 million to liabilities. The goodwill is tax deductible and represents the value of entering a new market where there is no Titleand businesses that generates non-Title IV funding.
| 6. | GOODWILL AND OTHER INTANGIBLES |
Changes in the carrying amount of goodwill during the years ended December 31, 20122013 and 20112012 are as follows:
Gross Goodwill Balance | Accumulated Impairment Losses | Net Goodwill Balance | ||||||||||
| Balance as of January 1, 2012 | $ | 115,303 | $ | (17,932 | ) | $ | 97,371 | |||||
| Acquisition of FMTI | 1,873 | - | 1,873 | |||||||||
| Goodwill impairment (1) | - | (33,717 | ) | (33,717 | ) | |||||||
| Balance as of December 31, 2012 | 117,176 | (51,649 | ) | 65,527 | ||||||||
| Goodwill impairment | - | (3,062 | ) | (3,062 | ) | |||||||
| Balance as of December 31, 2013 | $ | 117,176 | $ | (54,711 | ) | $ | 62,465 | |||||
| Balance as of January 1, 2011: | ||||
| Goodwill | $ | 115,303 | ||
| Accumulated impairment losses | (8,594 | ) | ||
| 106,709 | ||||
| Goodwill impairment (1) | (9,338 | ) | ||
| Balance as of December 31, 2011: | ||||
| Goodwill | 115,303 | |||
| Accumulated impairment losses | (17,932 | ) | ||
| 97,371 | ||||
| Acquisition of FMTI | 1,873 | |||
| Goodwill impairment (2) | (33,717 | ) | ||
| Balance as of December 31, 2012: | ||||
| Goodwill | 117,176 | |||
| Accumulated impairment losses | (51,649 | ) | ||
| $ | 65,527 | |||
| (1) | $ |
Intangible assets, which are included in other assets in the accompanying consolidated balance sheets, consisted of the following:
Student Contracts | Indefinite Trade Name | Trade Name | Accreditation | Curriculum | Non-compete | Total | ||||||||||||||||||||||
| Gross carrying amount at December 31, 2012 | $ | 25 | $ | 180 | $ | 366 | $ | 1,268 | $ | 1,124 | $ | 200 | $ | 3,163 | ||||||||||||||
| Write-off | (25 | ) | - | (31 | ) | (102 | ) | - | - | (158 | ) | |||||||||||||||||
| Gross carrying amount at December 31, 2013 | - | 180 | 335 | 1,166 | 1,124 | 200 | 3,005 | |||||||||||||||||||||
| Accumulated amortization at December 31, 2012 | 25 | - | 209 | - | 670 | 28 | 932 | |||||||||||||||||||||
| Write-off | (25 | ) | - | (31 | ) | - | - | - | (56 | ) | ||||||||||||||||||
| Amortization | - | - | 50 | - | 158 | 40 | 248 | |||||||||||||||||||||
| Accumulated amortization at December 31, 2013 | - | - | 228 | - | 828 | 68 | 1,124 | |||||||||||||||||||||
| Net carrying amount at December 31, 2013 | $ | - | $ | 180 | $ | 107 | $ | 1,166 | $ | 296 | $ | 132 | $ | 1,881 | ||||||||||||||
| Weighted average amortization period (years) | Indefinite | 7 | Indefinite | 9 | 3 | |||||||||||||||||||||||
| Student Contracts | Indefinite Trade Name | Trade Name | Accreditation | Curriculum | Non-compete | Total | ||||||||||||||||||||||
| Gross carrying amount at December 31, 2011 | $ | - | $ | 180 | $ | 509 | $ | 1,268 | $ | 1,150 | $ | 1,980 | $ | 5,087 | ||||||||||||||
| Acquisition of FMTI (1) | 25 | - | 25 | - | 224 | 200 | 474 | |||||||||||||||||||||
| Write-off (4) | - | - | - | - | - | (1,980 | ) | (1,980 | ) | |||||||||||||||||||
| Impairment (2) | - | - | (168 | ) | - | (250 | ) | - | (418 | ) | ||||||||||||||||||
| Gross carrying amount at December 31, 2012 | 25 | 180 | 366 | 1,268 | 1,124 | 200 | 3,163 | |||||||||||||||||||||
| Accumulated amortization at | - | - | 262 | - | 620 | 1,952 | 2,834 | |||||||||||||||||||||
| December 31, 2011 | ||||||||||||||||||||||||||||
| Amortization | 25 | - | 74 | - | 135 | 56 | 290 | |||||||||||||||||||||
| Write-off (4) | - | - | - | - | - | (1,980 | ) | (1,980 | ) | |||||||||||||||||||
| Impairment (2) | - | - | (127 | ) | - | (85 | ) | - | (212 | ) | ||||||||||||||||||
| Accumulated amortization at December 31, 2012 | 25 | - | 209 | - | 670 | 28 | 932 | |||||||||||||||||||||
| Net carrying amount at | $ | - | $ | 180 | $ | 157 | $ | 1,268 | $ | 454 | $ | 172 | $ | 2,231 | ||||||||||||||
| December 31, 2012 | ||||||||||||||||||||||||||||
| Weighted average amortization period (years) | Indefinite | 7 | Indefinite | 9 | 3 | |||||||||||||||||||||||
| Student Contracts | Indefinite Trade Name | Trade Name | Accreditation | Curriculum | Non-compete | Total | ||||||||||||||||||||||
| Gross carrying amount at December 31, 2010 | $ | 4,827 | $ | 660 | $ | 839 | $ | 2,307 | $ | 1,150 | $ | 2,181 | $ | 11,964 | ||||||||||||||
| Reclassification (3) | - | (480 | ) | 480 | - | - | - | - | ||||||||||||||||||||
| Write-off (4) | (4,827 | ) | - | (810 | ) | - | - | (201 | ) | (5,838 | ) | |||||||||||||||||
| Impairment (5) | - | - | - | (1,039 | ) | - | - | (1,039 | ) | |||||||||||||||||||
| Gross carrying amount at December 31, 2011 | - | 180 | 509 | 1,268 | 1,150 | 1,980 | 5,087 | |||||||||||||||||||||
| Accumulated amortization at December 31, 2010 | 4,824 | - | 503 | - | 505 | 1,478 | 7,310 | |||||||||||||||||||||
| Amortization | 3 | - | 569 | - | 115 | 675 | 1,362 | |||||||||||||||||||||
| Write-off (4) | (4,827 | ) | - | (810 | ) | - | - | (201 | ) | (5,838 | ) | |||||||||||||||||
| Accumulated amortization at | - | - | 262 | - | 620 | 1,952 | 2,834 | |||||||||||||||||||||
| December 31, 2011 | ||||||||||||||||||||||||||||
| Net carrying amount at | $ | - | $ | 180 | $ | 247 | $ | 1,268 | $ | 530 | $ | 28 | $ | 2,253 | ||||||||||||||
| December 31, 2011 | ||||||||||||||||||||||||||||
Weighted average amortization period (years) | Indefinite | 6 | Indefinite | 10 | 3 | |||||||||||||||||||||||
Student Contracts | Indefinite Trade Name | Trade Name | Accreditation | Curriculum | Non-compete | Total | ||||||||||||||||||||||
| Gross carrying amount at December 31, 2011 | $ | - | $ | 180 | $ | 509 | $ | 1,268 | $ | 1,150 | $ | 1,980 | $ | 5,087 | ||||||||||||||
| Acquisition of FMTI (1) | 25 | - | 25 | - | 224 | 200 | 474 | |||||||||||||||||||||
| Write-off | - | - | - | - | - | (1,980 | ) | (1,980 | ) | |||||||||||||||||||
| Impairment (2) | - | - | (168 | ) | - | (250 | ) | - | (418 | ) | ||||||||||||||||||
| Gross carrying amount at December 31, 2012 | 25 | 180 | 366 | 1,268 | 1,124 | 200 | 3,163 | |||||||||||||||||||||
| Accumulated amortization at December 31, 2011 | - | - | 262 | - | 620 | 1,952 | 2,834 | |||||||||||||||||||||
| Amortization | 25 | - | 74 | - | 135 | 56 | 290 | |||||||||||||||||||||
| Write-off | - | - | - | - | - | (1,980 | ) | (1,980 | ) | |||||||||||||||||||
| Impairment (2) | - | - | (127 | ) | - | (85 | ) | - | (212 | ) | ||||||||||||||||||
| Accumulated amortization at December 31, 2012 | 25 | - | 209 | - | 670 | 28 | 932 | |||||||||||||||||||||
| Net carrying amount at December 31, 2012 | $ | - | $ | 180 | $ | 157 | $ | 1,268 | $ | 454 | $ | 172 | $ | 2,231 | ||||||||||||||
| Weighted average amortization period (years) | Indefinite | 7 | Indefinite | 9 | 3 | |||||||||||||||||||||||
| (1) | The Company purchased FMTI in April 2012. Refer to Note 5 for more information on the purchase. |
| (2) | Refer to Note 1 for more information related to the impairment. |
Amortization of intangible assets for the years ended December 31, 2013, 2012 2011 and 20102011 was approximately $0.4 million, $0.3 million $1.4 million and $2.2$1.4 million, respectively.
The following table summarizes the estimated future amortization expense:
Year Ending December 31, | ||||
| 2014 | $ | 200 | ||
| 2015 | 156 | |||
| 2016 | 112 | |||
| 2017 | 46 | |||
| 2018 | 20 | |||
| Thereafter | 1 | |||
| $ | 535 | |||
| Year Ending December 31, | ||||
| 2013 | $ | 225 | ||
| 2014 | 224 | |||
| 2015 | 156 | |||
| 2016 | 112 | |||
| 2017 | 46 | |||
| Thereafter | 20 | |||
| $ | 783 | |||
| 7. | PROPERTY, EQUIPMENT AND FACILITIES |
Property, equipment and facilities consist of the following:
| Useful life (years) | At December 31, | Useful life (years) | At December 31, | |||||||||||||||||||||
| 2012 | 2011 | 2013 | 2012 | |||||||||||||||||||||
| Land | - | $ | 18,363 | $ | 18,363 | - | $ | 17,562 | $ | 18,363 | ||||||||||||||
| Buildings and improvements | 1-25 | 192,990 | 206,499 | 1-25 | 178,089 | 192,990 | ||||||||||||||||||
| Equipment, furniture and fixtures | 1-12 | 79,172 | 75,112 | 1-7 | 76,769 | 79,172 | ||||||||||||||||||
| Vehicles | 3 | 1,231 | 1,155 | 3 | 1,282 | 1,231 | ||||||||||||||||||
| Construction in progress | - | 174 | 1,159 | - | 425 | 174 | ||||||||||||||||||
| 291,930 | 302,288 | 274,127 | 291,930 | |||||||||||||||||||||
| Less accumulated depreciation and amortization | (137,834 | ) | (122,274 | ) | Less accumulated depreciation and amortization | (146,795 | ) | (137,834 | ) | |||||||||||||||
| $ | 154,096 | $ | 180,014 | $ | 127,332 | $ | 154,096 | |||||||||||||||||
Included above in buildings and improvements are buildings acquired under capital leases as of December 31, 20122013 and 20112012 of $26.8 million, each net of accumulated depreciation of $7.0$8.8 million and $5.2$7.0 million, respectively.
Included above in equipment, furniture and fixtures are assets acquired under capital leases as of December 31, 2013 and 2012 and 2011 of $0.6$0.4 million and $0.7$0.6 million, respectively, net of accumulated depreciation of $0.4 million and $0.6 million, respectively.
Included above in buildings and improvements is capitalized interest as of December 31, 20122013 and 20112012 of $0.6 million, respectively, net of accumulated depreciation of $0.4 million, and $0.3 million, respectively.
Depreciation and amortization expense of property, equipment and facilities was $23.3 million, $26.4 million $26.3 million and $23.4$26.3 million for the years ended December 31, 2013, 2012 and 2011, respectively.
The Company closed its campuses in Suffield, Connecticut in 2012 and 2010, respectively.Cincinnati, Ohio (Tri-County) in 2013. During 2013, the Company decided to sell these properties as they are no longer pertinent to continuing operations. The Company anticipates that these properties will be sold during 2014. Accordingly, the assets have been reflected as “held for sale” in the accompanying consolidated balance sheet. The assets held for sale as a result of the closures consist of the following:
| At December 31, | ||||
| 2013 | ||||
| Land | $ | 800 | ||
| Buildings and improvements | 5,510 | |||
| Assets held for sale | $ | 6,310 | ||
| 8. | ACCRUED EXPENSES |
Accrued expenses consist of the following:
| At December 31, | At December 31, | |||||||||||||||
| 2012 | 2011 | 2013 | 2012 | |||||||||||||
| Accrued compensation and benefits | $ | 3,163 | $ | 4,701 | $ | 5,128 | $ | 3,163 | ||||||||
| Other accrued expenses | 6,583 | 6,595 | 5,527 | 6,583 | ||||||||||||
| $ | 9,746 | $ | 11,296 | $ | 10,655 | $ | 9,746 | |||||||||
| 9. | LONG-TERM DEBT AND LEASE OBLIGATIONS |
Long-term debt and lease obligations consist of the following:
| At December 31, | At December 31, | |||||||||||||||
| 2012 | 2011 | 2013 | 2012 | |||||||||||||
| Credit agreement (a) | $ | 37,500 | $ | - | $ | 54,500 | $ | 37,500 | ||||||||
| Credit agreement (b) | - | - | ||||||||||||||
| Finance obligation (c) | 9,672 | 9,672 | ||||||||||||||
| Capital lease-property (with a rate of 8.0%) (d) | 26,344 | 26,715 | ||||||||||||||
| Finance obligation (b) | 9,672 | 9,672 | ||||||||||||||
| Capital lease-property (with a rate of 8.0%) (c) | 25,944 | 26,344 | ||||||||||||||
| Capital leases-equipment (with rates ranging from 5.0% to 8.5%) | 11 | 121 | - | 11 | ||||||||||||
| 73,527 | 36,508 | 90,116 | 73,527 | |||||||||||||
| Less current maturities | (412 | ) | (481 | ) | (435 | ) | (412 | ) | ||||||||
| $ | 73,115 | $ | 36,027 | $ | 89,681 | $ | 73,115 | |||||||||
(a) On April 5, 2012, the Company, as borrower, and certain of its wholly-owned subsidiaries, as guarantors, entered into a secured revolving credit agreement (the “Credit Agreement”) with a syndicate of four lenders led by Bank of America, N.A., as administrative agent swing line lender and letter of credit issuer for an(the “Credit Facility”). The April 5, 2012 agreement, along with subsequent amendments dated June 18, 2013 and December 20, 2013, are collectively referred to as the “Credit Agreement.”
As of December 31, 2013, the aggregate principal amount of up to $85 million. The Credit Agreement replaces the Company’s prior $115 million Credit Facility with Bank of America, N.A. and other lenders, which was due to expire on December 1, 2012. The old Credit Agreement (as defined below) was terminated concurrently with the effective date of the Credit Agreement.
The Credit Agreement provides that the lenders will receive first priority lien on substantially all of the tangible and intangible non-real property assets of the Company and its subsidiaries as well as a first priority lien on substantially all real property owned by the Company and its subsidiaries and that all net proceeds of future sales of real property by the Company and its subsidiaries be used to prepay revolving loans and permanently reduce the principal amount of revolving loans available under the Credit Facility.
Amounts borrowed as revolving loans under the Credit Facility will bear interest, at the Company’s option, at either (i) an interest rate based on LIBOR and adjusted for any reserve percentage obligations under Federal Reserve Bank regulations (the “Eurodollar Rate”) for specified interest periods or (ii) the Base Rate (as defined in the Credit Agreement), in each case, plus an applicable margin rate as determined under the Credit Agreement. The “Base Rate”, as defined under the Credit Agreement, is the highest of (a) the rate of interest announced from time to time by Bank of America, N.A. as its prime rate, (b) the Federal Funds rate plus 0.50% and (c) a daily rate equal to the one-month LIBOR rate plus 1.0%. UnderPursuant to the Credit Agreement,Amendment, the margin interest rate is subject to adjustment within a range of 1.25%2.50% to 2.75%6.00% based upon changes in the Company’s consolidated leverage ratio and depending on whether the Company has chosen the Eurodollar Rate or the Base Rate option. Swing line loans will bear interest at the Base Rate plus the applicable margin rate. Letters of credit will require a fee equal to the applicable margin rate multiplied by the daily amount available to be drawn under each issued letter of credit plus an agreed upon fronting fee and customary issuance, presentation, amendment and other processing fees associated with letters of credit.
At December 31, 2012,2013, the Company had outstanding letters of credit aggregating $1.6$5.3 million, which were primarily comprised of letters of credit for the Department of Education, or DOE, matters and real estate leases.
The Credit Agreement contains customary representations, warranties and covenants including consolidated adjusted net worth, consolidated leverage ratio, consolidated fixed charge coverage ratio, minimum financial responsibility composite score, cohort default rate and other financial covenants, certain restrictions on capital expenditures as well as affirmative and negative covenants and events of default customary for facilities of this type. In addition, the Company is paying fees to the lenders that are customary for facilities of this type. As of December 31,
As of December 31, 2012,2013, the Company had $37.5$54.5 million outstanding under the Credit Agreement. The interest rate on borrowings under the credit agreementCredit Agreement during the year ended December 31, 20122013 was 4.5%7.25%. AmountsAll amounts outstanding under the credit agreementon December 31, 2013 were repaid on January 3, 2013.2014. The Company had $37.5 million outstanding under the Credit Agreement as of December 31, 2012. The interest rate on this borrowing was 4.5%.
(b) The Company previously had a credit agreement (the “old Credit Agreement”) with a syndicate of banks which was terminated on April 5, 2012. Under the terms of the agreement, the syndicate provided the Company with a $115 million credit facility. The old Credit Agreement permitted the issuance of up to $25 million in letter of credit, the amount of which reduces the availability of permitted borrowings under the agreement. At December 31, 2011, the Company had outstanding letters of credit aggregating $1.6 million, which were primarily comprised of letters of credit for the DOE matters and real estate leases.
(c) In 2009, the Company assumed real estate capital leases in Fern Park, Florida and Hartford, Connecticut. These leases bear interest at 8% and expire in 2032 and 2031, respectively.
Scheduled maturities of long-term debt and lease obligations at December 31, 20122013 are as follows:
Year ending December 31, | ||||
| 2014 | $ | 435 | ||
| 2015 | 54,971 | |||
| 2016 | 10,244 | |||
| 2017 | 748 | |||
| 2018 | 810 | |||
| Thereafter | 22,908 | |||
| $ | 90,116 | |||
| Year ending December 31, | ||||
| 2013 | $ | 412 | ||
| 2014 | 435 | |||
| 2015 | 37,971 | |||
| 2016 | 10,243 | |||
| 2017 | 748 | |||
| Thereafter | 23,718 | |||
| $ | 73,527 | |||
| 10. | STOCKHOLDERS' EQUITY |
Restricted Stock
The Company has two stock incentive plans: a Long-Term Incentive Plan (the “LTIP”) and a Non-Employee Directors Restricted Stock Plan (the(the “Non-Employee Directors Plan”).
Under the LTIP, certain employees received awards of restricted shares of common stock based on service and performance. The number of shares granted to each employee is based on the fair market value of a share of common stock on the date of grant.
All service-based restricted shares granted prior to February 23, 2011 vest ratably on the first through fifth anniversaries of the grant date. The service-based restricted shares granted on or after February 23, 2011 vest ratably on the grant date and the first through fourth anniversaries of the grant date except for the service-based restricted shares granted on March 2, 2012 which vest fully on the first anniversary of the grant date.
On April 29, 2013, performance-based shares were granted which vest over four years based upon the attainment of (i) a specified operating income margin during any one or more of the fiscal years in the period beginning January 1, 2013 and ending December 31, 2016 and (ii) the attainment of earnings before interest, taxes, depreciation and amortization targets during each of the fiscal years ended December 31, 2013 through 2016. There is no vesting period on the right to vote or the right to receive dividends on any of the restricted shares.
On April 29, 2011, performance-based shares were granted which vest over four years based upon the attainment of (i) a specified operating income margin during any one or more of the fiscal years in the period beginning January 1, 2011 and ending December 31, 2014 and (ii) the attainment of earnings before interest, taxes, depreciation and amortization targets during each of the fiscal years ended December 31, 2011 through 2014. There is no vesting period on the right to vote or the right to receive dividends on any of the restricted shares.
Pursuant to the Non-Employee Directors Plan, each non-employee director of the Company receives an annual award of restricted shares of common stock on the date of the Company’s annual meeting of shareholders. The number of shares granted to each non-employee director is based on the fair market value of a share of common stock on that date. The restricted shares vest ratably on the first through third anniversary of the grant date; however, there is no vesting period on the right to vote or the right to receive dividends on these restricted shares. Beginning in 2010, all new awards of restricted shares of common stock granted under the Non-Employee Directors Plan vest fully on the first anniversary of the grant date.
In 2013, 2012 2011 and 2010,2011, the Company completed a net share settlement for 140,475, 102,438 68,250 and 52,21468,250 restricted shares and stock options exercised, respectively, on behalf of certain employees that participate in the LTIP upon the vesting of the restricted shares pursuant to the terms of the LTIP or exercise of the stock options. The net share settlement was in connection with income taxes incurred on restricted shares or stock option exercises that vested and were transferred to the employee during 2013, 2012 2011 and/or 2010,2011, creating taxable income for the employee. At the employees’ request, the Company will pay these taxes on behalf of the employees in exchange for the employees returning an equivalent value of restricted shares or stock options to the Company. These transactions resulted in a decrease of approximately $0.8 million, $0.5 million and $0.9 million in 2013, 2012 and $1.0 million in 2012, 2011, and 2010, respectively, to equity as the cash payment of the taxes effectively was a repurchase of the restricted shares or stock options granted in previous years.
The following is a summary of transactions pertaining to restricted stock:
| Shares | Weighted Average Grant Date Fair Value Per Share | Shares | Weighted Average Grant Date Fair Value Per Share | |||||||||||||
| Nonvested restricted stock outstanding at December 31, 2011 | 501,551 | $ | 16.10 | 501,551 | $ | 16.10 | ||||||||||
| Restricted stock awarded | 1,213,621 | 4.82 | ||||||||||||||
| Restricted stock vested | (374,088 | ) | 9.30 | |||||||||||||
| Granted | 1,213,621 | 4.82 | ||||||||||||||
| Vested | (374,088 | ) | 9.30 | |||||||||||||
| Nonvested restricted stock outstanding at December 31, 2012 | 1,341,084 | 7.79 | ||||||||||||||
| Nonvested restricted stock outstanding at December 31, 2012 | 1,341,084 | 7.79 | ||||||||||||||
| Granted | 434,308 | 5.62 | ||||||||||||||
| Cancelled | (33,529 | ) | 16.70 | |||||||||||||
| Vested | (493,917 | ) | 7.41 | |||||||||||||
| Nonvested restricted stock outstanding at December 31, 2013 | 1,247,946 | 6.77 | ||||||||||||||
The restricted stock expense for each of the years ended December 31, 2013, 2012 and 2011 and 2010 was $2.9 million, $4.0 million $3.1 million and $2.0$3.1 million, respectively. The unrecognized restricted stock expense as of December 31, 2013 and 2012 and 2011 was $8.6$7.4 million and $6.8$8.6 million, respectively. As of December 31, 2012,2013, unrecognized restricted stock expense will be expensed over the weighted-average period of approximately 2.5 years. As of December 31, 2013, outstanding restricted shares under the LTIP had an aggregate intrinsic value of $7.5$6.2 million.
Stock Options
The fair value of the stock options used to compute stock-based compensation is the estimated present value at the date of grant using the Black-Scholes option pricing model. During 2013 and 2011 there were no new stock option grants. The weighted average fair values of options granted during 2012 and 2010 werewas $2.52 and $8.48 respectively, using the following weighted average assumptions for grants:
| At December 31, | ||||||||
| 2012 | 2010 | |||||||
| Expected volatility | 51.25% | 45.00% | ||||||
| Expected dividend yield | 4% | 0% | ||||||
| Expected life (term) | 4.65 Years | 4.82 Years | ||||||
| Risk-free interest rate | 0.87% | 1.95% | ||||||
| Weighted-average exercise price during the year | $ | 7.79 | $ | 20.78 | ||||
| At December 31, | |||
| 2012 | |||
| Expected volatility | 51.25% | ||
| Expected dividend yield | 4% | ||
| Expected life (term) | 4.65 Years | ||
| Risk-free interest rate | 0.87% | ||
| Weighted-average exercise price during the year | $7.79 |
The expected volatility considers the volatility of the Company common stock that has been traded for a period commensurate with the expected life. The expected term of options granted represents the period of time that options granted are expected to be outstanding based on historical experience. The risk-free rate used is based on the published U.S. Treasury yield curve in effect at the time of grant for instruments with a similar life. The 2012 expected dividend yield presumes a set dividend rate based on the current dividend yield. The 2010 dividend yield is 0% because at the time the options were granted the Company had not intended to declare or pay dividends on its common stock.
The following is a summary of transactions pertaining to the option plans:
| Shares | Weighted Average Exercise Price Per Share | Weighted Average Remaining Contractual Term | Aggregate Intrinsic Value | |||||||||||||||||||||||
| Outstanding December 31, 2009 | 1,183,921 | $ | 11.74 | 4.95 years | $ | 11,934 | ||||||||||||||||||||
| Granted | 68,000 | 20.78 | ||||||||||||||||||||||||
| Cancelled | (108,875 | ) | 15.15 | |||||||||||||||||||||||
| Exercised | (422,106 | ) | 7.46 | 5,668 | ||||||||||||||||||||||
| Shares | Weighted Average Exercise Price Per Share | Weighted Average Remaining Contractual Term | Aggregate Intrinsic Value | |||||||||||||||||||||||
| Outstanding December 31, 2010 | 720,940 | 14.59 | 5.14 years | 2,095 | 720,940 | $ | 14.59 | 5.14 years | $ | 2,095 | ||||||||||||||||
| Cancelled | (74,459 | ) | 12.80 | (74,459 | ) | 12.80 | ||||||||||||||||||||
| Exercised | (113,106 | ) | 6.29 | 759 | (113,106 | ) | 6.29 | 759 | ||||||||||||||||||
| Outstanding December 31, 2011 | 533,375 | 16.60 | 4.68 years | - | 533,375 | 16.60 | 4.68 years | - | ||||||||||||||||||
| Granted | 157,000 | 7.79 | 157,000 | 7.79 | ||||||||||||||||||||||
| Cancelled | (34,500 | ) | 12.26 | (34,500 | ) | 12.26 | - | |||||||||||||||||||
| Outstanding December 31, 2012 | 655,875 | 14.72 | 4.89 years | - | 655,875 | 14.72 | 4.89 years | - | ||||||||||||||||||
| Cancelled | (108,750 | ) | 14.64 | |||||||||||||||||||||||
| Vested or expected to vest as of December 31, 2012 | 623,609 | 15.02 | 4.67 years | - | ||||||||||||||||||||||
| Outstanding December 31, 2013 | 547,125 | 14.73 | 4.56 years | - | ||||||||||||||||||||||
| Exercisable as of December 31, 2012 | 494,543 | 16.60 | 3.54 years | - | ||||||||||||||||||||||
| Vested or expected to vest as of December 31, 2013 | 527,527 | 14.99 | 4.43 years | - | ||||||||||||||||||||||
| Exercisable as of December 31, 2013 | 449,134 | 16.25 | 3.77 years | - | ||||||||||||||||||||||
As of December 31, 2012,2013, unrecognized pre-tax compensation expense for all unvested stock option awards is approximately $0.3$0.1 million which will be expensed over the weighted-average period of approximately 2.11.8 years.
The following table presents a summary of options outstanding at December 31, 2012:2013:
| At December 31, 2013 | |||||||||||||||||||||
| Stock Options Outstanding | Stock Options Exercisable | ||||||||||||||||||||
| Range of Exercise Prices | Shares | Contractual Weighted Average life (years) | Weighted Average Price | Shares | Weighted Exercise Price | ||||||||||||||||
| $4.00-$13.99 | 259,792 | 6.13 | $ | 9.60 | 161,801 | $ | 10.70 | ||||||||||||||
| $14.00-$19.99 | 182,333 | 3.36 | 17.67 | 182,333 | 17.67 | ||||||||||||||||
| $20.00-$25.00 | 105,000 | 2.77 | 22.33 | 105,000 | 22.33 | ||||||||||||||||
| 547,125 | 4.56 | 14.73 | 449,134 | 16.25 | |||||||||||||||||
| At December 31, 2012 | ||||||||||||||||||||||
| Stock Options Outstanding | Stock Options Exercisable | |||||||||||||||||||||
| Range of Exercise Prices | Shares | Contractual Weighted Average life (years) | Weighted Average Price | Shares | Weighted Exercise Price | |||||||||||||||||
| $ | 4.00-$13.99 | 262,792 | 7.11 | $ | 9.63 | 115,792 | $ | 11.96 | ||||||||||||||
| $ | 14.00-$19.99 | 277,083 | 3.19 | 16.42 | 277,083 | 16.42 | ||||||||||||||||
| $ | 20.00-$25.00 | 116,000 | 3.89 | 22.19 | 101,668 | 22.37 | ||||||||||||||||
| 655,875 | 4.89 | 14.72 | 494,543 | 16.60 | ||||||||||||||||||
| 11. | PENSION PLAN |
The Company sponsors a noncontributory defined benefit pension plan covering substantially all of the Company's union employees. Benefits are provided based on employees' years of service and earnings. This plan was frozen on December 31, 1994 for non-union employees.
The following table sets forth the plan's funded status and amounts recognized in the consolidated financial statements:
| Year Ended December 31, | Year Ended December 31, | |||||||||||||||||||||||
| 2012 | 2011 | 2010 | 2013 | 2012 | 2011 | |||||||||||||||||||
| CHANGES IN BENEFIT OBLIGATIONS: | ||||||||||||||||||||||||
| Benefit obligation-beginning of year | $ | 21,233 | $ | 17,903 | $ | 16,326 | $ | 23,169 | $ | 21,233 | $ | 17,903 | ||||||||||||
| Service cost | 35 | 117 | 91 | 37 | 35 | 117 | ||||||||||||||||||
| Interest cost | 872 | 939 | 918 | 790 | 872 | 939 | ||||||||||||||||||
| Actuarial loss | 1,926 | 3,008 | 1,210 | |||||||||||||||||||||
| Actuarial (gain) loss | (2,614 | ) | 1,926 | 3,008 | ||||||||||||||||||||
| Benefits paid | (897 | ) | (734 | ) | (642 | ) | (1,068 | ) | (897 | ) | (734 | ) | ||||||||||||
| Benefit obligation at end of year | 23,169 | 21,233 | 17,903 | 20,314 | 23,169 | 21,233 | ||||||||||||||||||
| CHANGE IN PLAN ASSETS: | ||||||||||||||||||||||||
| Fair value of plan assets-beginning of year | 14,639 | 15,087 | 13,134 | 16,268 | 14,639 | 15,087 | ||||||||||||||||||
| Actual return on plan assets | 1,807 | 12 | 1,773 | 2,919 | 1,807 | 12 | ||||||||||||||||||
| Employer contributions | 719 | 274 | 822 | 673 | 719 | 274 | ||||||||||||||||||
| Benefits paid | (897 | ) | (734 | ) | (642 | ) | (1,068 | ) | (897 | ) | (734 | ) | ||||||||||||
| Fair value of plan assets-end of year | 16,268 | 14,639 | 15,087 | 18,792 | 16,268 | 14,639 | ||||||||||||||||||
| BENEFIT OBLIGATION IN EXCESS OF FAIR VALUE FUNDED STATUS: | $ | (6,901 | ) | $ | (6,594 | ) | $ | (2,816 | ) | $ | (1,522 | ) | $ | (6,901 | ) | $ | (6,594 | ) | ||||||
Amounts recognized in the consolidated balance sheets consist of:
| At December 31, | ||||||||||||
| 2012 | 2011 | 2010 | ||||||||||
| Noncurrent liabilities | $ | (6,901 | ) | $ | (6,594 | ) | $ | (2,816 | ) | |||
| At December 31, | ||||||||||||
| 2013 | 2012 | 2011 | ||||||||||
| Noncurrent liabilities | $ | (1,522 | ) | $ | (6,901 | ) | $ | (6,594 | ) | |||
Amounts recognized in accumulated other comprehensive loss consist of:
| Year Ended December 31, | Year Ended December 31, | |||||||||||||||||||||||
| 2012 | 2011 | 2010 | 2013 | 2012 | 2011 | |||||||||||||||||||
| Accumulated loss | $ | (11,276 | ) | $ | (11,191 | ) | $ | (7,903 | ) | $ | (5,928 | ) | $ | (11,276 | ) | $ | (11,191 | ) | ||||||
| Deferred income taxes | 4,500 | 4,475 | 3,155 | 2,366 | 4,500 | 4,475 | ||||||||||||||||||
| Accumulated other comprehensive loss | $ | (6,776 | ) | $ | (6,716 | ) | $ | (4,748 | ) | $ | (3,562 | ) | $ | (6,776 | ) | $ | (6,716 | ) | ||||||
The accumulated benefit obligation was $23.2$20.3 million and $21.2$23.2 million at December 31, 20122013 and 2011,2012, respectively.
The following table provides the components of net periodic cost for the plan:
| Year Ended December 31, | Year Ended December 31, | |||||||||||||||||||||||
| 2012 | 2011 | 2010 | 2013 | 2012 | 2011 | |||||||||||||||||||
| COMPONENTS OF NET PERIODIC BENEFIT COST | COMPONENTS OF NET PERIODIC BENEFIT COST | |||||||||||||||||||||||
| Service cost | $ | 35 | $ | 117 | $ | 91 | $ | 37 | $ | 35 | $ | 117 | ||||||||||||
| Interest cost | 872 | 939 | 918 | 790 | 872 | 939 | ||||||||||||||||||
| Expected return on plan assets | (1,021 | ) | (1,034 | ) | (1,041 | ) | (1,141 | ) | (1,021 | ) | (1,034 | ) | ||||||||||||
| Recognized net actuarial loss | 1,056 | 742 | 732 | 955 | 1,056 | 742 | ||||||||||||||||||
| Net periodic benefit cost | $ | 942 | $ | 764 | $ | 700 | $ | 641 | $ | 942 | $ | 764 | ||||||||||||
The estimated net loss, transition obligation and prior service cost for the plan that will be amortized from accumulated other comprehensive loss into net periodic benefit cost over the next year is $1.0$0.4 million.
Employee pension plan adjustments of $3.2 million for the year ended December 31, 2013 includes $1.0 million of recognized actuarial losses reclassified from accumulated other comprehensive income.
The following tables present plan assets using the fair value hierarchy as of December 31, 20122013 and 2011.2012. The fair value hierarchy has three levels based on the reliability of inputs used to determine fair value. Level 1 refers to fair values determined based on quoted prices in active markets for identical assets. Level 2 refers to fair values estimated using observable prices that are based on inputs not quoted in active markets but observable by market data, while Level 3 includes the fair values estimated using significant non-observable inputs. The level in the fair value hierarchy within which the fair value measurement falls is determined based on the lowest level input that is significant to the fair value measurement in its entirety.
Quoted Prices in Active Markets for Identical Assets | Significant Other Observable Inputs | Significant Unobservable Inputs | Quoted Prices in Active Markets for Identical Assets | Significant Other Observable Inputs | Significant Unobservable Inputs | |||||||||||||||||||||||||||
| (Level 1) | (Level 2) | (Level 3) | Total | (Level 1) | (Level 2) | (Level 3) | Total | |||||||||||||||||||||||||
| Equity securities | $ | 7,455 | $ | - | $ | - | $ | 7,455 | $ | 9,491 | $ | - | $ | - | $ | 9,491 | ||||||||||||||||
| Fixed income | 5,835 | - | - | 5,835 | 5,787 | - | - | 5,787 | ||||||||||||||||||||||||
| International equities | 2,957 | - | - | 2,957 | 3,484 | - | - | 3,484 | ||||||||||||||||||||||||
| Cash and equivalents | 21 | - | - | 21 | 30 | - | - | 30 | ||||||||||||||||||||||||
| Balance at December 31, 2012 | $ | 16,268 | $ | - | $ | - | $ | 16,268 | ||||||||||||||||||||||||
| Balance at December 31, 2013 | $ | 18,792 | $ | - | $ | - | $ | 18,792 | ||||||||||||||||||||||||
| Quoted Prices in Active Markets for Identical Assets | Significant Other Observable Inputs | Significant Unobservable Inputs | Quoted Prices in Active Markets for Identical Assets | Significant Other Observable Inputs | Significant Unobservable Inputs | |||||||||||||||||||||||||||
| (Level 1) | (Level 2) | (Level 3) | Total | (Level 1) | (Level 2) | (Level 3) | Total | |||||||||||||||||||||||||
| Equity securities | $ | 6,798 | $ | - | $ | - | $ | 6,798 | $ | 7,455 | $ | - | $ | - | $ | 7,455 | ||||||||||||||||
| Fixed income | 5,289 | - | - | 5,289 | 5,835 | - | - | 5,835 | ||||||||||||||||||||||||
| International equities | 2,538 | - | - | 2,538 | 2,957 | - | - | 2,957 | ||||||||||||||||||||||||
| Cash and equivalents | 14 | - | - | 14 | 21 | - | - | 21 | ||||||||||||||||||||||||
| Balance at December 31, 2011 | $ | 14,639 | $ | - | $ | - | $ | 14,639 | ||||||||||||||||||||||||
| Balance at December 31, 2012 | $ | 16,268 | $ | - | $ | - | $ | 16,268 | ||||||||||||||||||||||||
Fair value of total plan assets by major asset category as of December 31:
| 2012 | 2011 | 2010 | 2013 | 2012 | 2011 | |||||||||||||||||||
| Equity securities | 46 | % | 47 | % | 48 | % | 51 | % | 46 | % | 47 | % | ||||||||||||
| Fixed income | 36 | % | 36 | % | 37 | % | 31 | % | 36 | % | 36 | % | ||||||||||||
| International equities | 18 | % | 17 | % | 15 | % | 18 | % | 18 | % | 17 | % | ||||||||||||
| Cash and equivalents | 0 | % | 0 | % | 0 | % | 0 | % | 0 | % | 0 | % | ||||||||||||
| Total | 100 | % | 100 | % | 100 | % | 100 | % | 100 | % | 100 | % | ||||||||||||
Weighted-average assumptions used to determine benefit obligations as of December 31:
| 2012 | 2011 | 2010 | 2013 | 2012 | 2011 | |||||||||||||||||||
| Discount rate | 3.55 | % | 4.10 | % | 5.75 | % | 4.46 | % | 3.55 | % | 4.10 | % | ||||||||||||
| Rate of compensation increase | 1.75 | % | 4.00 | % | 4.00 | % | 2.00 | % | 1.75 | % | 4.00 | % | ||||||||||||
Weighted-average assumptions used to determine net periodic pension cost for years ended December 31:
| 2012 | 2011 | 2010 | 2013 | 2012 | 2011 | |||||||||||||||||||
| Discount rate | 4.10 | % | 5.18 | % | 5.18 | % | 3.55 | % | 4.10 | % | 5.18 | % | ||||||||||||
| Rate of compensation increase | 4.00 | % | 4.00 | % | 4.00 | % | 2.00 | % | 4.00 | % | 4.00 | % | ||||||||||||
| Long-term rate of return | 7.00 | % | 7.00 | % | 8.00 | % | 7.00 | % | 7.00 | % | 7.00 | % | ||||||||||||
As this plan was frozen to non-union employees on December 31, 1994, the difference between the projected benefit obligation and accumulated benefit obligation is not significant in any year.
The Company invests plan assets based on a total return on investment approach, pursuant to which the plan assets include a diversified blend of equity and fixed income investments toward a goal of maximizing the long-term rate of return without assuming an unreasonable level of investment risk. The Company determines the level of risk based on an analysis of plan liabilities, the extent to which the value of the plan assets satisfies the plan liabilities and the plan's financial condition. The investment policy includes target allocations ranging from 30% to 70% for equity investments, 20% to 60% for fixed income investments and 0% to 10% for cash equivalents. The equity portion of the plan assets represents growth and value stocks of small, medium and large companies. The Company measures and monitors the investment risk of the plan assets both on a quarterly basis and annually when the Company assesses plan liabilities.
The Company uses a building block approach to estimate the long-term rate of return on plan assets. This approach is based on the capital markets assumption that the greater the volatility, the greater the return over the long term. An analysis of the historical performance of equity and fixed income investments, together with current market factors such as the inflation and interest rates, are used to help make the assumptions necessary to estimate a long-term rate of return on plan assets. Once this estimate is made, the Company reviews the portfolio of plan assets and makes adjustments thereto that the Company believes are necessary to reflect a diversified blend of equity and fixed income investments that is capable of achieving the estimated long-term rate of return without assuming an unreasonable level of investment risk. The Company also compares the portfolio of plan assets to those of other pension plans to help assess the suitability and appropriateness of the plan's investments.
The Company expects to make $0.8$0.3 million in contributions to the plan in 2013.2014. However after considering the funded status of the plan, movements in the discount rate, investment performance and related tax consequences, the Company may choose to make additional contributions to the plan in any given year.
The total amount of the Company’s contributions paid under its pension plan was $0.7 million for each of the yearyears ended December 31, 20122013 and $0.3 million for the year ended December 31, 2011.2012.
Information about the expected benefit payments for the plan is as follows:
Year Ending December 31, | ||||
| 2014 | $ | 1,041 | ||
| 2015 | 1,127 | |||
| 2016 | 1,196 | |||
| 2017 | 1,275 | |||
| 2018 | 1,330 | |||
| Years 2019-2023 | 6,911 | |||
| Year Ending December 31, | ||||
| 2013 | $ | 1,002 | ||
| 2014 | 1,050 | |||
| 2015 | 1,167 | |||
| 2016 | 1,255 | |||
| 2017 | 1,320 | |||
| Years 2018-2022 | 7,082 |
The Company has a 401(k) defined contribution plan for all eligible employees. Employees may contribute up to 25% of their compensation into the plan. The Company will contribute an additional 30% of the employee's contributed amount up to 6% of compensation. For the years ended December 31, 2013, 2012 2011 and 2010,2011, the Company's expense for the 401(k) plan amounted to $1.9 million, $2.0 million $2.3 million and $2.2$2.3 million, respectively.
| 12. | INCOME TAXES |
Components of the provision for income taxes from continuing operations were as follows:
| Year Ended December 31, | Year Ended December 31, | |||||||||||||||||||||||
| 2012 | 2011 | 2010 | 2013 | 2012 | 2011 | |||||||||||||||||||
| Current: | ||||||||||||||||||||||||
| Federal | $ | 4,499 | $ | 8,570 | $ | 34,392 | $ | (7,369 | ) | $ | 9,273 | $ | 7,099 | |||||||||||
| State | 1,494 | 2,960 | 8,016 | 709 | 2,164 | 2,754 | ||||||||||||||||||
| Total | 5,993 | 11,530 | 42,408 | (6,660 | ) | 11,437 | 9,853 | |||||||||||||||||
| Deferred: | ||||||||||||||||||||||||
| Federal | (11,394 | ) | 3,312 | 2,742 | 21,103 | (11,394 | ) | 3,312 | ||||||||||||||||
| State | (2,834 | ) | (112 | ) | (311 | ) | 5,148 | (2,834 | ) | (112 | ) | |||||||||||||
| Total | (14,228 | ) | 3,200 | 2,431 | 26,251 | (14,228 | ) | 3,200 | ||||||||||||||||
| Total (benefit) provision | $ | (8,235 | ) | $ | 14,730 | $ | 44,839 | |||||||||||||||||
| Total provision (benefit) | $ | 19,591 | $ | (2,791 | ) | $ | 13,053 | |||||||||||||||||
The components of the deferred tax assets are as follows:
| At December 31, | ||||||||
| 2013 | 2012 | |||||||
| Deferred tax assets | ||||||||
| Current: | ||||||||
| Accrued vacation | $ | 79 | $ | 60 | ||||
| Net operating loss carryforwards | - | 586 | ||||||
| Allowance for bad debts | 5,502 | 7,083 | ||||||
| Total current deferred tax assets | 5,581 | 7,729 | ||||||
| Deferred tax assets | ||||||||
| Noncurrent: | ||||||||
| Allowance for bad debts | 392 | 430 | ||||||
| Accrued rent | 3,669 | 3,785 | ||||||
| Stock-based compensation | 1,509 | 2,095 | ||||||
| Depreciation | 10,670 | 5,953 | ||||||
| Other intangibles | 434 | 547 | ||||||
| Pension plan liabilities | 608 | 2,754 | ||||||
| Net operating loss carryforwards | 6,285 | 1,553 | ||||||
| Sale leaseback-deferred gain | 2,531 | 2,482 | ||||||
| AMT credit | 424 | - | ||||||
| Other | - | 77 | ||||||
| Total noncurrent deferred tax assets | 26,522 | 19,676 | ||||||
| Total deferred tax assets | 32,103 | 27,405 | ||||||
| Less valuation allowance | (31,679 | ) | - | |||||
| Deferred tax assets, net of valuation allowance | 424 | 27,405 | ||||||
| Deferred tax liabilities | ||||||||
| Noncurrent: | ||||||||
| Goodwill | (4,952 | ) | (2,611 | ) | ||||
| Total deferred tax liabilities | (4,952 | ) | (2,611 | ) | ||||
| Total net noncurrent deferred tax (liabilities) assets | (4,528 | ) | 17,065 | |||||
| Total net deferred tax (liabilities) assets | $ | (4,528 | ) | $ | 24,794 | |||
| At December 31, | ||||||||
| 2012 | 2011 | |||||||
| Deferred tax assets | ||||||||
| Current: | ||||||||
| Accrued vacation | $ | 60 | $ | 63 | ||||
| Net operating loss carryforwards | 586 | 586 | ||||||
| Allowance for bad debts | 7,083 | 8,076 | ||||||
| Total current deferred tax assets | 7,729 | 8,725 | ||||||
| Deferred tax assets | ||||||||
| Noncurrent: | ||||||||
| Allowance for bad debts | 430 | 665 | ||||||
| Accrued rent | 3,785 | 3,645 | ||||||
| Stock-based compensation | 2,095 | 1,855 | ||||||
| Depreciation | 5,953 | - | ||||||
| Other intangibles | 547 | 511 | ||||||
| Pension plan liabilities | 2,754 | 2,637 | ||||||
| Net operating loss carryforwards | 1,553 | 2,139 | ||||||
| Sale leaseback-deferred gain | 2,482 | 2,438 | ||||||
| Other | 77 | 120 | ||||||
| Total noncurrent deferred tax assets | 19,676 | 14,010 | ||||||
| Deferred tax liabilities | ||||||||
| Noncurrent: | ||||||||
| Depreciation | - | (1,995 | ) | |||||
| Goodwill | (2,611 | ) | (10,138 | ) | ||||
| Total deferred tax liabilities | (2,611 | ) | (12,133 | ) | ||||
| Total net noncurrent deferred tax assets | 17,065 | 1,877 | ||||||
| Total net deferred tax assets | $ | 24,794 | $ | 10,602 | ||||
On the basis of this evaluation the Company believes it is not more likely than not that it will realize its net deferred tax assets. As a result, as of December 31, 2013, the Company has recorded a valuation allowance of $31.7 million ($7.1 million from discontinued operations) against its net deferred tax assets, excluding the indefinite life assets which generated a deferred tax liability.
The difference between the actual tax provision and the tax provision that would result from the use of the Federal statutory rate is as follows:
| Year Ended December 31, | Year Ended December 31, | |||||||||||||||||||||||||||||||||||||||||||||||
| 2012 | 2011 | 2010 | 2013 | 2012 | 2011 | |||||||||||||||||||||||||||||||||||||||||||
| (Loss) income from continuing operations before taxes | $ | (32,116 | ) | $ | 35,845 | $ | 110,526 | $ | (14,169 | ) | $ | (18,475 | ) | $ | 30,609 | |||||||||||||||||||||||||||||||||
| Expected tax (benefit) expense | $ | (11,240 | ) | 35.0 | % | $ | 12,546 | 35.0 | % | $ | 38,684 | 35.0 | % | $ | (4,959 | ) | 35.0 | % | $ | (6,466 | ) | 35.0 | % | $ | 10,713 | 35.0 | % | |||||||||||||||||||||
| State tax (benefit) expense (net of federal) | (871 | ) | 2.7 | 1,851 | 5.2 | 5,008 | 4.6 | |||||||||||||||||||||||||||||||||||||||||
| State tax expense (benefit) (net of federal) | (221 | ) | 1.6 | (436 | ) | 2.4 | 1,717 | 5.6 | ||||||||||||||||||||||||||||||||||||||||
| Permanent impairment | 3,588 | (11.2 | ) | 109 | 0.3 | 1,698 | 1.5 | - | - | 3,588 | (19.4 | ) | 109 | 0.4 | ||||||||||||||||||||||||||||||||||
| Valuation allowance | 24,541 | (173.2 | ) | - | - | - | - | |||||||||||||||||||||||||||||||||||||||||
| Other | 288 | (0.9 | ) | 224 | 0.6 | (551 | ) | (0.5 | ) | 230 | (1.7 | ) | 523 | (2.9 | ) | 514 | 1.6 | |||||||||||||||||||||||||||||||
| Total | $ | (8,235 | ) | 25.6 | % | $ | 14,730 | 41.1 | % | $ | 44,839 | 40.6 | % | $ | 19,591 | -138.3 | % | $ | (2,791 | ) | 15.1 | % | $ | 13,053 | 42.6 | % | ||||||||||||||||||||||
F-27
As of December 31, 2013, 2012, the Company has net operating loss (“NOL”)NOL carryforwards at December 31, 2012 of approximately$12.3 million and $6.1 million, for federal income tax purposes,respectively, which, begin expiringif unused, will expire in 2025. Theseyears 2027. Of these NOLs, $7.8 million and $6.1 million are limited in the amount that can be utilized in a given year due to a Section 382 limitation. The Company has determined based upon its history of profitslimitation for December 31, 2013 and its forecasted financial information that it will be able to fully utilize these NOLs prior to their expiration. As such, a valuation allowance is not required.2012, respectively.
The following table summarizes the activity related to the Company’s uncertain tax positions:
| Year Ended December 31, | Year Ended December 31, | |||||||||||||||||||||||
| 2012 | 2011 | 2010 | 2013 | 2012 | 2011 | |||||||||||||||||||
| Balance at January 1, | $ | 100 | $ | 100 | $ | 200 | $ | 135 | $ | 100 | $ | 100 | ||||||||||||
| Decrease for tax positions of prior years | (100 | ) | (100 | ) | (135 | ) | (100 | ) | ||||||||||||||||
| Increase for tax positions of current year | 135 | - | - | - | 135 | - | ||||||||||||||||||
| Balance at December 31, | $ | 135 | $ | 100 | $ | 100 | $ | - | $ | 135 | $ | 100 | ||||||||||||
As of December 31, 2013, the Company no longer has any liability for uncertain tax positions. Included in the balance of unrecognized tax benefits at December 31, 2012 and 2011 are unrecognized tax benefits of $0.1 million, respectively, of which $0.1 million would be reflected as an adjustment to income tax expense if recognized. It is expected that the amount of unrecognized tax benefits will change in the next 12 months; however, the Company does not expect the change to have a significant impact on its results of operations or financial position.
The Company recognizes accrued interest and penalties related to uncertain tax positions in income tax expense. During the years ended December 31, 2012 and 2011, the interest and penalties expense associated with uncertain tax positions are not significant to its results of operations or financial position.
The Company or one of its subsidiaries files income tax returns in the U.S. federal jurisdiction, and various states. The Company is no longer subject to U.S. federal income tax examinations for years before 20082009 and generally, is no longer subject to state and local income tax examinations by tax authorities for years before 2007.2008.
| 13. | SEGMENT REPORTING |
Each of the Company’s schools is a reporting unit.unit and an operating segment. The Company’s reporting unitsoperating segments have been aggregated into one operatingreportable segment because, in the Company’s judgment, the reporting units have similar products, production processes, types of customers, methods of distribution, regulatory environment and economic characteristics.
| COMMITMENTS AND CONTINGENCIES |
Lease Commitments—The Company leases office premises, educational facilities and various equipment for varying periods through the year 2032 at basic annual rentals (excluding taxes, insurance, and other expenses under certain leases) as follows:
| Year Ending December 31, | Finance Obligation | Operating Leases | Capital Leases | Finance Obligation | Operating Leases | Capital Leases | ||||||||||||||||||
| 2013 | $ | 1,516 | $ | 22,546 | $ | 2,506 | ||||||||||||||||||
| 2014 | 1,516 | 21,270 | 2,494 | $ | 1,546 | $ | 21,223 | $ | 2,494 | |||||||||||||||
| 2015 | 1,516 | 19,594 | 2,494 | 1,546 | 19,429 | 2,494 | ||||||||||||||||||
| 2016 | 1,516 | 15,819 | 2,556 | 1,546 | 15,680 | 2,556 | ||||||||||||||||||
| 2017 | - | 14,626 | 2,678 | - | 14,628 | 2,678 | ||||||||||||||||||
| 2018 | - | 13,644 | 2,678 | |||||||||||||||||||||
| Thereafter | - | 48,456 | 39,815 | - | 34,913 | 37,137 | ||||||||||||||||||
| 6,064 | 142,311 | 52,543 | 4,638 | 119,517 | 50,037 | |||||||||||||||||||
| Less amount representing interest | (6,064 | ) | - | (26,188 | ) | (4,638 | ) | - | (24,094 | ) | ||||||||||||||
| $ | - | $ | 142,311 | $ | 26,355 | $ | - | $ | 119,517 | $ | 25,943 | |||||||||||||
On December 28, 2001, the Company completed a sale and a leaseback of four owned facilities to a third party for net proceeds of approximately $8.8 million. The initial term of the lease is 15 years with two ten-year extensions. The lease is an operating lease that starts at $1.2 million in the first year and increases annually by the consumer price index. The lease includes an option near the end of the initial lease term to purchase the facilities at fair value, as defined. The net proceeds received have been reflected in the consolidated balance sheet as a finance obligation. The lease payments are included as a component of interest expense.
Rent expense, included in operating expenses in the accompanying consolidated statements of operations for the three years ended December 31, 2013, 2012 and 2011 and 2010 is $23.4 million, $23.5 million, and $23.5$21.9 million, respectively. Interest expense related to the financing obligation in the accompanying statements of operations for the years ended December 31, 2013, 2012 2011 and 20102011 is $1.5 million, $1.5 million and $1.4 million, respectively.
Litigation and Regulatory Matters—In the ordinary conduct of business, the Company is subject to periodic lawsuits, investigations and claims, including, but not limited to, claims involving students or graduates and routine employment matters. Although the Company cannot predict with certainty the ultimate resolution of lawsuits, investigations and claims asserted against it, the Company does not believe that any currently pending legal proceeding to which it is a party will have a material effect on our business, financial condition, results of operations or cash flows.
On November 21, 2012, the Company received a Civil Investigation Demand from the Attorney General of the Commonwealth of Massachusetts relating to their investigation of whether the Company and certain of its academic institutions have complied with certain Massachusetts state consumer protection and finance laws. On July 29, 2013 and January 17, 2014, the Company received follow-up Civil Investigative Demands. Pursuant to the Civil Investigative Demand,Demands, the Attorney General has requested from the Company and certain of its academic institutions documents and detailed information from the time period January 1, 2008 to the present. WeThe Company has responded to this requestthese requests and intendintends to continue cooperating with the Attorney General’s Office.
Student Loans—At December 31, 2012,2013, the Company had outstanding net loan commitments to its students to assist them in financing their education of approximately $25.0$26.5 million.
Vendor Relationship—TheThe Company is party to two agreements with Snap-on Industrial (“Snap-on”) which expire on June 30, 2014 and December 31, 2012 and 2013.2014. The Company has agreed to grant Snap-on exclusive rights to certain automotive campuses to display advertising and supply certain tools with the exception of one pre-existing vendor contract. The Company earns credits that are redeemable for certain tools and equipment based on the sales to students and to the Company.
Executive Employment Agreements—The Company entered into employment contracts with key executives that provide for continued salary payments if the executives are terminated for reasons other than cause, as defined in the agreements. The future employment contract commitments for such employees were approximately $8.9 million at December 31, 2012.2013.
Change in Control Agreements—In the event of a change of control several key executives will receive continued salary payments based on their employment agreements.
Surety Bonds—Each of the Company’s campuses must be authorized by the applicable state education agency in which the campus is located to operate and to grant degrees, diplomas or certificates to its students. The campuses are subject to extensive, ongoing regulation by each of these states. In addition, our campuses are required to be authorized by the applicable state education agencies of certain other states in which our campuses recruit students. The Company is required to post surety bonds on behalf of our campuses and education representatives with multiple states to maintain authorization to conduct our business. At December 31, 2012,2013, the Company has posted surety bonds in the total amount of approximately $14.9$16.9 million.
| UNAUDITED QUARTERLY FINANCIAL INFORMATION |
Quarterly financial information for 20122013 and 20112012 is as follows:
| Quarter | ||||||||||||||||
| 2013 | First | Second | Third | Fourth | ||||||||||||
| Revenue | $ | 86,270 | $ | 81,751 | $ | 88,527 | $ | 88,475 | ||||||||
| (Loss) income from continuing operations | (5,282 | ) | (6,688 | ) | 77 | (21,866 | ) | |||||||||
| Loss from discontinued operations | (2,205 | ) | (2,690 | ) | (2,353 | ) | (10,279 | ) | ||||||||
| Net loss | (7,487 | ) | (9,378 | ) | (2,276 | ) | (32,145 | ) | ||||||||
| Basic | ||||||||||||||||
| (Loss) earnings per share from continuing operations | $ | (0.24 | ) | $ | (0.30 | ) | $ | 0.00 | $ | (0.97 | ) | |||||
| Loss per share from discontinued operations | (0.10 | ) | (0.12 | ) | (0.10 | ) | (0.45 | ) | ||||||||
| Net loss per share | $ | (0.33 | ) | $ | (0.42 | ) | $ | (0.10 | ) | $ | (1.42 | ) | ||||
| Diluted | ||||||||||||||||
| (Loss) earnings per share from continuing operations | $ | (0.24 | ) | $ | (0.30 | ) | $ | 0.00 | $ | (0.97 | ) | |||||
| Loss per share from discontinued operations | (0.10 | ) | (0.12 | ) | (0.10 | ) | (0.45 | ) | ||||||||
| Net loss per share | $ | (0.33 | ) | $ | (0.42 | ) | $ | (0.10 | ) | $ | (1.42 | ) | ||||
| Weighted average number of common shares outstanding: | ||||||||||||||||
| Basic | 22,414 | 22,497 | 22,528 | 22,618 | ||||||||||||
| Diluted | 22,414 | 22,497 | 22,811 | 22,618 | ||||||||||||
| Quarter | Quarter | |||||||||||||||||||||||||||||||
| 2012 | First | Second | Third | Fourth | First | Second | Third | Fourth | ||||||||||||||||||||||||
| Revenue | $ | 101,158 | $ | 97,031 | $ | 102,057 | $ | 102,451 | $ | 96,242 | $ | 91,867 | $ | 97,704 | $ | 96,962 | ||||||||||||||||
| Income (loss) from continuing operations | (2,176 | ) | (13,838 | ) | 1,086 | (8,953 | ) | |||||||||||||||||||||||||
| (Loss) income from continuing operations | (1,571 | ) | (11,064 | ) | 2,284 | (5,334 | ) | |||||||||||||||||||||||||
| Loss from discontinued operations | (879 | ) | (6,870 | ) | (2,570 | ) | (2,986 | ) | (1,484 | ) | (9,644 | ) | (3,768 | ) | (6,605 | ) | ||||||||||||||||
| Net loss | (3,055 | ) | (20,708 | ) | (1,484 | ) | (11,939 | ) | (3,055 | ) | (20,708 | ) | (1,484 | ) | (11,939 | ) | ||||||||||||||||
| Basic | ||||||||||||||||||||||||||||||||
| (Loss) earnings per share from continuing operations | $ | (0.10 | ) | $ | (0.62 | ) | $ | 0.05 | $ | (0.40 | ) | $ | (0.07 | ) | $ | (0.50 | ) | $ | 0.10 | $ | (0.24 | ) | ||||||||||
| Loss per share from discontinued operations | (0.04 | ) | (0.31 | ) | (0.12 | ) | (0.14 | ) | (0.07 | ) | (0.43 | ) | (0.17 | ) | (0.30 | ) | ||||||||||||||||
| Net (loss) income per share | $ | (0.14 | ) | $ | (0.93 | ) | $ | (0.07 | ) | $ | (0.54 | ) | ||||||||||||||||||||
| Net loss per share | $ | (0.14 | ) | $ | (0.93 | ) | $ | (0.07 | ) | $ | (0.54 | ) | ||||||||||||||||||||
| Diluted | ||||||||||||||||||||||||||||||||
| (Loss) earnings per share from continuing operations | $ | (0.10 | ) | $ | (0.62 | ) | $ | 0.05 | $ | (0.40 | ) | $ | (0.07 | ) | $ | (0.50 | ) | $ | 0.10 | $ | (0.24 | ) | ||||||||||
| Loss per share from discontinued operations | (0.04 | ) | (0.31 | ) | (0.12 | ) | (0.14 | ) | (0.07 | ) | (0.43 | ) | (0.17 | ) | (0.30 | ) | ||||||||||||||||
| Net (loss) income per share | $ | (0.14 | ) | $ | (0.93 | ) | $ | (0.07 | ) | $ | (0.54 | ) | ||||||||||||||||||||
| Net loss per share | $ | (0.14 | ) | $ | (0.93 | ) | $ | (0.07 | ) | $ | (0.54 | ) | ||||||||||||||||||||
| Weighted average number of common shares outstanding: | ||||||||||||||||||||||||||||||||
| Basic | 22,137 | 22,183 | 22,195 | 22,266 | ||||||||||||||||||||||||||||
| Diluted | 22,137 | 22,183 | 22,281 | 22,266 | ||||||||||||||||||||||||||||
| Quarter | ||||||||||||||||
| 2011 | First | Second | Third | Fourth | ||||||||||||
| Revenue | $ | 138,404 | $ | 122,665 | $ | 118,985 | $ | 111,767 | ||||||||
| Income (loss) from continuing operations | 10,159 | 5,001 | (1,334 | ) | 7,289 | |||||||||||
| Income (loss) from discontinued operations | 198 | (71 | ) | (2,592 | ) | (1,110 | ) | |||||||||
| Net income (loss) | 10,357 | 4,930 | (3,926 | ) | 6,179 | |||||||||||
| Basic | ||||||||||||||||
| Earnings (loss) per share from continuing operations | $ | 0.46 | $ | 0.23 | $ | (0.06 | ) | $ | 0.33 | |||||||
| Earnings (loss) per share from discontinued operations | 0.01 | (0.01 | ) | (0.12 | ) | (0.05 | ) | |||||||||
| Net income (loss) per share | $ | 0.47 | $ | 0.22 | $ | (0.18 | ) | $ | 0.28 | |||||||
| Diluted | ||||||||||||||||
| Earnings (loss) per share from continuing operations | $ | 0.45 | $ | 0.22 | $ | (0.06 | ) | $ | 0.33 | |||||||
| Earnings (loss) per share from discontinued operations | 0.01 | - | (0.12 | ) | (0.05 | ) | ||||||||||
| Net income (loss) per share | $ | 0.46 | $ | 0.22 | $ | (0.18 | ) | $ | 0.28 | |||||||
| DIVIDENDS |
During 2013, 2012 2011 and 2010,2011, the Board of Directors declared cash dividends of $0.28, $0.07$0.28 and $1.00$0.07 per share of common stock outstanding, respectively. In March 2013,February 2014, the Board of Directors declared a quarterly cash dividend of $0.07 per share of common stock outstanding, which will be paid on March 29, 201331, 2014 to shareholders of record on March 15, 2013.14, 2014. The establishment of future record and payment dates is subject to the final determination of the Company’s Board of Directors.
LINCOLN EDUCATIONAL SERVICES CORPORATION
(in thousands, continuing and discontinued operations)
| Description | Balance at Beginning of Period | Charged to Expense | Accounts Written-off | Balance at End of Period | ||||||||||||
| Allowance accounts for the year ended: | ||||||||||||||||
| December 31, 2013 Student receivable allowance | $ | 18,829 | $ | 15,532 | $ | (19,592 | ) | $ | 14,769 | |||||||
| December 31, 2012 Student receivable allowance | $ | 21,858 | $ | 21,056 | $ | (24,085 | ) | $ | 18,829 | |||||||
| December 31, 2011 Student receivable allowance | $ | 26,993 | $ | 30,553 | $ | (35,688 | ) | $ | 21,858 | |||||||
| Description | Balance at Beginning of Period | Charged to Expense | Accounts Written-off | Balance at End of Period | ||||||||||||
| Allowance accounts for the year ended: | ||||||||||||||||
| December 31, 2012 Student receivable allowance | $ | 21,858 | $ | 21,056 | $ | (24,085 | ) | $ | 18,829 | |||||||
| December 31, 2011 Student receivable allowance | $ | 26,993 | $ | 30,553 | $ | (35,688 | ) | $ | 21,858 | |||||||
| December 31, 2010 Student receivable allowance | $ | 26,859 | $ | 39,106 | $ | (38,972 | ) | $ | 26,993 | |||||||
F-31