UNITED STATES SECURITIES AND EXCHANGE COMMISSION
Washington, D.C. 20549
FORM 10-K
☒ ANNUAL REPORT PURSUANT TO SECTION 13 OR 15(d) OF
THE SECURITIES EXCHANGE ACT OF 1934
For the fiscal year ended December 31, 20142016
OR
☐ TRANSITION REPORT PURSUANT TO SECTION 13 OR 15(D) OF THE
SECURITIES EXCHANGE ACT OF 1934
For the transition period from _________ to __________.
Commission File Number: 000-26099
FARMERS & MERCHANTS BANCORP
(Exact name of registrant as specified in its charter)
| Delaware | 94-3327828 | |
| (State or other jurisdiction of incorporation or organization) | (I.R.S. Employer Identification No.) | |
| 111 W. Pine Street, Lodi, California | 95240 | |
| (Address of principal executive offices) | (Zip Code) |
Registrant's telephone number, including area code (209) 367-2300
Securities registered pursuant to Section 12(b) of the Act: None
Securities registered pursuant to Section 12(g) of the Act: Common Stock, $0.01 Par Value Per Share
Indicate by check mark if the registrant is a well-known seasoned issuer, as defined in Rule 405 of the Securities Act. Yes ☐ No ☒
Indicate by check mark if the registrant is not required to file reports pursuant to Section 13 or Section 15(d) of the Act. Yes ☐ No ☒
Indicate by check mark whether the registrant: (1) has filed all reports required to be filed by Section 13 or 15(d) of the Securities Exchange Act of 1934 during the preceding 12 months (or for such shorter period that the registrant was required to file such reports); and (2) has been subject to such filing requirements for the past 90 days. Yes ☒ No ☐
Indicate by check mark whether the registrant has submitted electronically and posted on its corporate website, if any, every Interactive Data File required to be submitted and posted pursuant to Rule 405 of Regulation S-T (§232.405 of this chapter) during the preceding 12 months (or for such shorter period that the registrant was required to submit and post such files). Yes ☒ No ☐
Indicate by check mark if disclosure of delinquent filers pursuant to Item 405 of Regulation S-K is not contained herein, and will not be contained, to the best of registrant’s knowledge, in definitive proxy or information statements incorporated by reference in Part III of this Form 10-K or any amendment to this Form 10-K. ☒☐
Indicate by check mark whether the registrant is a large accelerated filer, an accelerated filer, a non-accelerated filer or a smaller reporting company. See definition of “large accelerated filer,” “accelerated filer” and “smaller reporting company” in Rule 12b-2 of the Exchange Act (Check one):
| Large accelerated filer ☐ | Accelerated filer ☒ | Non-accelerated filer ☐ | Smaller Reporting Company ☐ |
| (Do not check if a smaller reporting company) | |||
Indicate by check mark whether the registrant is a shell company (as defined in Rule 12b-2 of the Act) Yes ☐ No ☒
The aggregate market value of the Registrant's common stock held by non-affiliates on June 30, 20142016 (based on the last reported trade on June 30, 2014)2016) was $337,367,000.$463,546,000.
The number of shares of Common Stock outstanding as of February 27, 2015: 785,78228, 2017: 808,704
Documents Incorporated by Reference:
Portions of the definitive Proxy Statement for the 20152017 Annual Meeting of Stockholders to be filed with the Securities and Exchange Commission pursuant to Regulation 14A are incorporated by reference in Part III, Items 10 through 14.
FARMERS & MERCHANTS BANCORP
FORM 10-K
Page | ||||
PART I | ||||
| 3 | ||||
| Item | 3 | |||
| Item 1A. | ||||
| Item 1B. | ||||
| Item 2. | ||||
| Item 3. | ||||
| Item 4. | ||||
PART II | ||||
| Item 5. | ||||
| Item 6. | ||||
| Item 7. | ||||
| Item 7A. | ||||
| Item 8. | ||||
| Item 9. | ||||
| Item 9A. | ||||
| Item 9B. | ||||
PART III | ||||
| Item 10. | ||||
| Item 11. | ||||
| Item 12. | ||||
| Item 13. | ||||
| Item 14. | ||||
PART IV | ||||
| Item 15. | ||||
| Item 16. | 107 | |||
This Form 10-K contains various forward-looking statements, usually containing the words “estimate,” “project,” “expect,” “objective,” “goal,” or similar expressions and includes assumptions concerning Farmers & Merchants Bancorp’s (together with its subsidiaries, the “Company” or “we”) operations, future results, and prospects. These forward-looking statements are based upon current expectations and are subject to risks and uncertainties. In connection with the “safe-harbor” provisions of the Private Securities Litigation Reform Act of 1995, the Company provides the following cautionary statement identifying important factors which could cause the actual results of events to differ materially from those set forth in or implied by the forward-looking statements and related assumptions.
Such factors include the following: (1) continuing economic sluggishnessconditions in the Central Valley of California; (2) significant changes in interest rates and loan prepayment speeds; (3) credit risks of lending and investment activities; (4) changes in federal and state banking laws or regulations; (5) competitive pressure in the banking industry; (6) changes in governmental fiscal or monetary policies; (7) uncertainty regarding the economic outlook resulting from the continuing war on terrorism, as well as actions taken or to be taken by the U.S. or other governments as a result of further acts or threats of terrorism; (8) ongoing drought conditionswater management issues in California and the resulting impact on the Company’s agricultural customers; (9) expansion into new geographic markets and new lines of business; and (10) other factors discussed in Item 1A. Risk Factors.
Readers are cautioned not to place undue reliance on these forward-looking statements which speak only as of the date hereof. The Company undertakes no obligation to update any forward-looking statements to reflect events or circumstances arising after the date on which they are made.
PART I
General Development of the Business
August 1, 1916, marked the first day of business for Farmers & Merchants Bank.Bank (the “Bank”). The Bank was incorporated under the laws of the State of California and licensed as a state-chartered bank. Farmers & Merchants’ first venture out of Lodi occurred when the Galt office opened in 1948. Since then the Bank has opened full-service branches in Linden, Manteca, Riverbank, Modesto, Sacramento, Elk Grove, Turlock, Hilmar, Stockton, Merced, Walnut Creek and Irvine.Concord.
During 2016, the Company completed the acquisition of Delta National Bancorp, the parent company of Delta Bank, N.A., headquartered in Manteca, California. This enabled the Company to expand its presence in to both Manteca and Riverbank (see “Acquisition of Delta National Bancorp”).
In addition to 2426 full-service branches, the Bank serves the needs of its customers through a stand-alone ATM located on the grounds of the Lodi Grape Festival. In 2007, the Bank began offering certain banking products over the internet at www.fmbonline.com.
On March 10, 1999, the Company, pursuant to a reorganization, acquired all of the voting stock of Farmers & Merchants Bank of Central California (the “Bank”).the Bank. The Company is a bank holding company incorporated in the State of Delaware and registered under the Bank Holding Company Act of 1956, as amended. The Company’s outstanding securities as of December 31, 2014,2016, consisted of 784,082807,329 shares of common stock, $0.01 par value and no shares of preferred stock issued. The Bank is the Company’s principal asset.
The Bank’s two wholly owned subsidiaries are Farmers & Merchants Investment Corporation and Farmers/Merchants Corp. Farmers & Merchants Investment Corporation is currently dormant and Farmers/Merchants Corp. acts as trustee on deeds of trust originated by the Bank.
F & M Bancorp, Inc. was created in March 2002 to protect the name “F & M Bank.” During 2002, the Company completed a fictitious name filing in California to begin using the streamlined name, “F & M Bank,” as part of a larger effort to enhance the Company’s image and build brand name recognition. Since 2002, the Company has converted all of its daily operating and image advertising to the “F & M Bank” name and the Company’s logo, slogan and signage were redesigned to incorporate the trade name, “F & M Bank.”
During 2003, the Company formed a wholly owned Connecticut statutory business trust, FMCB Statutory Trust I, for the sole purpose of issuing trust-preferred securities. See Note 13,14, located in “Item 8. Financial Statements and Supplementary Data.”
The Company’s principal business is to serve as a holding company for the Bank and for other banking or banking related subsidiaries, which the Company may establish or acquire. As a legal entity separate and distinct from its subsidiary, the Company’s principal source of funds is, and will continue to be, dividends paid by and other funds from the Bank. Legal limitations are imposed on the amount of dividends that may be paid and loans that may be made by the Bank to the Company. See “Supervision and Regulation - Dividends and Other Transfer of Funds.”
The Bank’s deposit accounts are insured under the Federal Deposit Insurance Act up to applicable limits. See “Supervision and Regulation – Deposit Insurance.”
As a bank holding company, the Company is subject to regulation and examination by the Board of Governors of the Federal Reserve System (“FRB”). The Bank is a California state-chartered non-FRB member bank subject to the regulation and examination of the California Department of Business Oversight (“DBO”) and the Federal Deposit Insurance Corporation (“FDIC”).
Acquisition of Delta National Bancorp
On November 18, 2016, Farmers & Merchants Bancorp completed the acquisition of Delta National Bancorp. Delta National Bancorp, headquartered in Manteca, California, was the parent holding company for Delta Bank N.A., a locally owned and operated community bank established in 1973. As of the acquisition date, Delta National Bancorp had approximately $112 million in assets and four branch locations in the communities of Manteca, Riverbank, Modesto and Turlock. After the acquisition, Delta National Bancorp was merged into Farmers & Merchants Bancorp and Delta Bank, N.A. was merged into Farmers & Merchants Bank of Central California. As part of the operational integration of the two banks, Delta Bank’s Modesto branch was closed and its customers began to be serviced at the Bank’s Modesto branch, which is one block away. The names of the combined entities remain Farmers & Merchants Bancorp and Farmers & Merchants Bank of Central California.
As part of the transaction: (i) holders of Delta National Bancorp common stock received 0.031748 shares of Farmers & Merchants Bancorp Common Stock for each share of Delta National Bancorp common stock, plus cash in lieu of fractional shares, and (ii) holders of Delta National Bancorp preferred stock received $19.827 in cash for each share of Delta National Bancorp preferred stock.
Using a value of $580 per share for Farmers & Merchants Bancorp’s common stock (based upon a valuation completed by a nationally recognized bank consulting and advisory firm and in reliance upon the exemption in Section 4(2) of the Securities Act of 1933, as amended, and the regulations promulgated thereunder) on November 18, 2016, the per share merger consideration payable to holders of Delta National Bancorp common stock was approximately $7.00 million and the cash payment to the holders of Delta National Bancorp preferred stock was approximately $2.18 million, for an aggregate merger consideration approximating $9.18 million.
For additional information on the acquisition, see Note 2, located in ���Item 8. Financial Statements and Supplementary Data.”
Service Area
4
At the present time, the Company’s primary service area remains the mid Central Valley of California, including Sacramento, San Joaquin, Stanislaus and Merced counties, where we operate 2124 full-service branches and one stand-alone ATM. This area encompasses:
| · | Sacramento Metropolitan Statistical Area (“MSA”), with branches in Sacramento, Elk Grove and Galt. This MSA has a Population of |
| · | Stockton MSA, with branches in Lodi, Linden, Stockton and |
| · | Modesto MSA, with branches in Modesto, Riverbank and Turlock. This MSA has a Population of |
| · | Merced MSA with branches in Hilmar and Merced. This MSA has a Population of |
All of the Company’s Central Valley service areas are heavily influenced by the agricultural industry, however, with the exception of the State of California in the Sacramento MSA, no single employer represents a material concentration of jobs in any of our service areas.
See “Item 7. Management’s Discussion and Analysis of Financial Condition and Results of Operations – Overview” and “Financial Condition – Loans & Leases” for additional discussion regarding the Company’s market conditions.
Through its network of banking offices, the Company emphasizes personalized service along with a broad range of banking services to businesses and individuals located in the service areas of its offices. Although the Company focuses on marketing its services to small and medium sized businesses, a broad range of retail banking services are made available to the local consumer market.
The Company offers a wide range of deposit instruments. These include checking, savings, money market, time certificates of deposit, individual retirement accounts and online banking services for both business and personal accounts.
The Company provides a broad complement of lending products, including commercial, commercial real estate, real estate construction, agribusiness, consumer, credit card, residential real estate loans, and equipment leases. Commercial products include term loans, leases, lines of credit and other working capital financing and letters of credit. Financing products for individuals include automobile financing, lines of credit, residential real estate, home improvement and home equity lines of credit.
The Company also offers a wide range of specialized services designed for the needs of its commercial accounts. These services include a credit card program for merchants, lockbox and other collection services, account reconciliation, investment sweep, on-line account access, and electronic funds transfers by way of domestic and international wire and automated clearinghouse.
The Company makes investment products available to customers, including mutual funds and annuities. These investment products are offered through a third party, which employs investment advisors to meet with and provide investment advice to the Company’s customers.
Employees
At December 31, 2014,2016, the Company employed 310339 full time equivalent employees. The Company added 25 employees as a result of the acquisition of Delta National Bancorp. The Company believes that its employee relations are satisfactory.
Competition
The banking and financial services industry in California generally, and in the Company’s market areas specifically, is highly competitive. The increasingly competitive environment is a result primarily of changes in regulation, changes in technology and product delivery systems, and the accelerating pace of consolidation among financial service providers. The Company competes with other major commercial banks, diversified financial institutions, credit unions, savings and loan associations, money market and other mutual funds, mortgage companies, and a variety of other non-banking financial services and advisory companies. Federal legislation encourages competition between different types of financial service providers and has fostered new entrants into the financial services market. It is anticipated that this trend will continue. Using the financial holding company structure, insurance companies and securities firms may compete more directly with banks and bank holding companies.
Many of our competitors are much larger in total assets and capitalization, have greater access to capital markets and offer a broader range of financial services than the Company. In order to compete with other financial service providers, the Company relies upon personal contact by its officers, directors, employees, and stockholders, along with various promotional activities and specialized services. In those instances where the Company is unable to accommodate a customer’s needs, the Company may arrange for those services to be provided through its correspondents.
Government Policies
The Company’s profitability, like most financial institutions, is primarily dependent on interest rate differentials. The difference between the interest rates paid by the Company on interest-bearing liabilities, such as deposits and other borrowings, and the interest rates received by the Company on its interest-earning assets, such as loans & leases extended to its customers and securities held in its investment portfolio, comprise the major portion of the Company’s earnings. These rates are highly sensitive to many factors that are beyond the control of the Company and the Bank, such as inflation, recession and unemployment. The impact that changes in economic conditions might have on the Company and the Bank cannot be predicted.
The business of the Company is also influenced by the monetary and fiscal policies of the federal government and the policies of regulatory agencies, particularly the FRB. The FRB implements national monetary policies (with objectives such as curbing inflation and combating recession) through its open-market operations in U.S. Government securities by adjusting the required level of reserves for depository institutions subject to its reserve requirements, and by varying the target federal funds and discount rates applicable to borrowings by depository institutions. The actions of the FRB in these areas influence the growth of bank loans & leases, investments, and deposits and also affect interest rates earned on interest-earning assets and paid on interest-bearing liabilities. The nature and impact on the Company of any future changes in monetary and fiscal policies cannot be predicted.
From time to time, legislative acts, as well as regulations, are enacted which have the effect of increasing the cost of doing business, limiting or expanding permissible activities, or affecting the competitive balance between banks and other financial services providers. Proposals to change the laws and regulations governing the operations and taxation of banks, bank holding companies, and other financial institutions and financial services providers are frequently made in the U.S. Congress, in the state legislatures, and before various regulatory agencies. This legislation may change banking statutes and the operating environment of the Company and the Bank in substantial and unpredictable ways. If enacted, such legislation could increase or decrease the cost of doing business, limit or expand permissible activities or affect the competitive balance among banks, savings associations, credit unions, and other financial institutions. The Company cannot predict whether any of this potential legislation will be enacted, and if enacted, the effect that it, or any implemented regulations, would have on the financial condition or results of operations of the Company or any of its subsidiaries.
Supervision and Regulation
General
Bank holding companies and banks are extensively regulated under both federal and state law. The regulation is intended primarily for the protection of the banking system and the deposit insurance fund and not for the benefit of stockholders of the Company. Set forth below is a summary description of the material laws and regulations, which relate to the operations of the Company and the Bank. This description does not purport to be complete and is qualified in its entirety by reference to the applicable laws and regulations.
The Company
The Company is a registered bank holding company and is subject to regulation under the Bank Holding Company Act of 1956 (“BHCA”), as amended. Accordingly, the Company’s operations are subject to extensive regulation and examination by the FRB. The Company is required to file with the FRB quarterly and annual reports and such additional information as the FRB may require pursuant to the BHCA. The FRB conducts periodic examinations of the Company.
The FRB may require that the Company terminate an activity or terminate control of or liquidate or divest certain subsidiaries of affiliates when the FRB believes the activity or the control of the subsidiary or affiliate constitutes a significant risk to the financial safety, soundness or stability of any of its banking subsidiaries. The FRB also has the authority to regulate provisions of certain bank holding company debt. Under certain circumstances, the Company must file written notice and obtain approval from the FRB prior to purchasing or redeeming its equity securities.
Under the BHCA and regulations adopted by the FRB, a bank holding company and its non-banking subsidiaries are prohibited from requiring certain tie-in arrangements in connection with an extension of credit, lease or sale of property, or furnishing of services. For example, with certain exceptions, a bank may not condition an extension of credit on a promise by its customer to obtain other services provided by it, its holding company or other subsidiaries, or on a promise by its customer not to obtain other services from a competitor. In addition, federal law imposes certain restrictions on transactions between Farmers & Merchants Bancorp and its subsidiaries. Further, the Company is required by the FRB to maintain certain levels of capital. See “Capital Standards.”
The Company is prohibited by the BHCA, except in certain statutorily prescribed instances, from acquiring direct or indirect ownership or control of more than 5% of the outstanding voting shares of any company that is not a bank or bank holding company and from engaging directly or indirectly in activities other than those of banking, managing or controlling banks, or furnishing services to its subsidiaries. However, the Company, subject to the prior notice and/or approval of the FRB, may engage in any, or acquire shares of companies engaged in, activities that are deemed by the FRB to be so closely related to banking or managing or controlling banks as to be a proper incident thereto.
Under FRB regulations, a bank holding company is required to serve as a source of financial and managerial strength to its subsidiary banks and may not conduct its operations in an unsafe or unsound manner. In addition, it is the FRB’s policy that in serving as a source of strength to its subsidiary banks, a bank holding company should stand ready to use available resources to provide adequate capital funds to its subsidiary banks during periods of financial stress or adversity and should maintain the financial flexibility and capital-raising capacity to obtain additional resources for assisting its subsidiary banks. This support may be required at times when a bank holding company may not be able to provide such support. A bank holding company’s failure to meet its obligations to serve as a source of strength to its subsidiary banks will generally be considered by the FRB to be an unsafe and unsound banking practice or a violation of the FRB’s regulations or both.
The Company is not a financial holding company for purposes of the FRB.
The Company is also a bank holding company within the meaning of the California Financial Code. As such, the Company and its subsidiaries are subject to examination by, and may be required to file reports with, the DBO.
The Company’s securities are registered with the Securities and Exchange Commission under the Securities Exchange Act of 1934, as amended (the “Exchange Act”). As such, the Company is subject to the reporting, proxy solicitation and other requirements and restrictions of the Exchange Act.
The Bank
The Bank, as a California chartered non-FRB member bank, is subject to primary supervision, periodic examination and regulation by the DBO and the FDIC. If, as a result of an examination of the Bank, the FDIC should determine that the financial condition, capital resources, asset quality, earnings prospects, management, liquidity, or other aspects of the Bank’s operations are unsatisfactory, or that the Bank or its management is violating or has violated any law or regulation, various remedies are available to the FDIC. Such remedies include the power to enjoin “unsafe or unsound” practices, to require affirmative action to correct any conditions resulting from any violation or practice, to issue an administrative order that can be judicially enforced, to direct an increase in capital, to restrict the growth of the Bank, to assess civil monetary penalties, to remove officers and directors, and ultimately to terminate the Bank’s deposit insurance, which for a California chartered bank would result in a revocation of the Bank’s charter. The DBO has many of the same remedial powers.
Various requirements and restrictions under the laws of the State of California and the United States affect the operations of the Bank. State and federal statutes and regulations relate to many aspects of the Bank’s operations, including reserves against deposits, ownership of deposit accounts, interest rates payable on deposits, loans & leases, investments, mergers and acquisitions, borrowings, dividends, locations of branch offices, and capital requirements. Further, the Bank is required to maintain certain levels of capital. See “Capital Standards.”
The USA Patriot Act
Title III of the United and Strengthening America by Providing Appropriate Tools Required to Intercept and Obstruct Terrorism Act of 2001 (the “USA Patriot Act”) includes numerous provisions for fighting international money laundering and blocking terrorism access to the U.S. financial system. The USA Patriot Act requires certain additional due diligence and record keeping practices, including, but not limited to, new customers, correspondent, and private banking accounts.
Part of the USA Patriot Act requires covered financial institutions to: (i) establish an anti-money laundering program; (ii) establish appropriate anti-money laundering policies, procedures and controls; (iii) appoint a Bank Secrecy Act officer responsible for day-to-day compliance; and (iv) conduct independent audits. The USA Patriot Act also expands penalties for violation of the anti-money laundering laws, including expanding the circumstances under which funds in a bank account may be forfeited. The USA Patriot Act also requires covered financial institutions to respond, under certain circumstances, to requests for information from federal banking agencies within 120 hours.
Privacy Restrictions
The Gramm-Leach-Bliley Act (“GLBA”) requires financial institutions in the U.S. to provide certain privacy disclosures to customers and consumers, to comply with certain restrictions on the sharing and usage of personally identifiable information, and to implement and maintain commercially reasonable customer information safeguarding standards.
The Company believes that it complies with all provisions of the GLBA and all implementing regulations and the Bank has developed appropriate policies and procedures to meet its responsibilities in connection with the privacy provisions of GLBA.
Dividends and Other Transfer of Funds
Dividends from the Bank constitute the principal source of incomecash to the Company. The Company is a legal entity separate and distinct from the Bank. The Bank is subject to various statutory and regulatory restrictions on its ability to pay dividends to the Company. Under such restrictions, the amount available for payment of dividends to the Company by the Bank totaled $45.8$52.0 million at December 31, 2014.2016. During 2014,2016, the Bank paid $8.0$14.3 million in dividends to the Company.
The FDIC and the DBO also have authority to prohibit the Bank from engaging in activities that, in their opinion, constitute unsafe or unsound practices in conducting its business. It is possible, depending upon the financial condition of the bank in question and other factors, that the FDIC or the DBO could assert that the payment of dividends or other payments might, under some circumstances, be an unsafe or unsound practice. Further, the FRB and the FDIC have established guidelines with respect to the maintenance of appropriate levels of capital by banks or bank holding companies under their jurisdiction. Compliance with the standards set forth in such guidelines and the restrictions that are or may be imposed under the prompt corrective action provisions of federal law could limit the amount of dividends that the Bank or the Company may pay. An insured depository institution is prohibited from paying management fees to any controlling persons or, with certain limited exceptions, making capital distributions if after such transaction the institution would be undercapitalized. The DBO may impose similar limitations on the Bank. See “Prompt Corrective Regulatory Action and Other Enforcement Mechanisms” and “Capital Standards” for a discussion of these additional restrictions on capital distributions.
Transactions with Affiliates
The Bank is subject to certain restrictions imposed by federal law on any extensions of credit to, or the issuance of a guarantee or letter of credit on behalf of the Company or other affiliates, the purchase of, or investments in stock or other securities thereof, the taking of such securities as collateral for loans & leases, and the purchase of assets of the Company or other affiliates. Such restrictions prevent the Company and other affiliates from borrowing from the Bank unless the loans are secured by marketable obligations of designated amounts. Further, such secured loans and investments by the Bank to or in the Company or to or in any other affiliates are limited, individually, to 10% of the Bank’s capital and surplus (as defined by federal regulations), and such secured loans and investments are limited, in the aggregate, to 20% of the Bank’s capital and surplus (as defined by federal regulations).
In addition, the Company and its operating subsidiaries generally may not purchase a low-quality asset from an affiliate, and other specified transactions between the Company or its operating subsidiaries and an affiliate must be on terms and conditions that are consistent with safe and sound banking practices.
Also, the Company and its operating subsidiaries may engage in transactions with affiliates only on terms and under conditions that are substantially the same, or at least as favorable to the Company or its subsidiaries, as those prevailing at the time for comparable transactions with (or that in good faith would be offered to) non-affiliated companies.
California law also imposes certain restrictions with respect to transactions with affiliates. Additionally, limitations involving the transactions with affiliates may be imposed on the Bank under the prompt corrective action provisions of federal law. See “Prompt Corrective Action and Other Enforcement Mechanisms.”
Capital Standards
The FRB and the FDIC have established risk-based capital guidelines with respect to the maintenance of appropriate levels of capital by United States banking organizations. These guidelines are intended to provide a measure of capital that reflects the risk associated with a banking organization’s operations for both transactions reported on the balance sheet as assets and transactions, such as letters of credit and recourse arrangements, which are recorded as off balance sheet items. Under these guidelines, nominal dollar amounts of assets and credit equivalent amounts of off balance sheet items are multiplied by one of several risk adjustment percentages, which range from 0% for assets with low credit risk, such as certain U.S. Treasury securities, to 100% for assets with relatively high credit risk, such as commercial loans.
In 2013, both the FRB and the FDIC approved final rules that substantially amend the regulatory risk-based capital rules applicable to the Company and the Bank. These rules implement the Basel III regulatory capital reforms and changes required by the Dodd-Frank Act as hereinafter defined.
The implementation of Basel III requirements will increase the required capital levels that the Company and the Bank must maintain. The final rules include new minimum risk-based capital and leverage ratios, which would be phased in over time. The new minimum capital level requirements applicable to the Company and the Bank under the final rules will be: (i) a common equity Tier 1 capital ratio of 4.5% of risk-weighted assets (“RWA”); (ii) a Tier 1 capital ratio of 6% of RWA; (iii) a total capital ratio of 8% of RWA; and (iv) a Tier 1 leverage ratio of 4% of total assets. The final rules also establish a "capital conservation buffer" of 2.5% above each of the new regulatory minimum capital ratios, which would result in the following minimum ratios: (i) a common equity Tier 1 capital ratio of 7.0% of RWA; (ii) a Tier 1 capital ratio of 8.5% of RWA; and (iii) a total capital ratio of 10.5% of RWA. An institution will be subject to limitations on paying dividends, engaging in share repurchases, and paying discretionary bonuses if its capital level falls below the buffer amount. The final rules also permit the Company’s subordinated debentures issued in 2003 to continue to be counted as Tier 1 capital.
The final rules became effective as applied to the Company and the Bank on January 1, 2015, with a phase in period through January 1, 2019. The Company believes that it is currently in compliance with all of these new capital requirements (as fully phased-in) and that they will not result in any restrictions on the Company’s business activity. For further information on the Company and the Bank’s risk-based capital ratios see Note 15 located in “Item 8. Financial Statements and Supplementary Data.”
Prompt Corrective Action and Other Enforcement Mechanisms
The Federal Deposit Insurance Corporation Improvement Act of 1991 (“FDICIA”), among other things, identifies five capital categories for insured depository institutions (well capitalized, adequately capitalized, undercapitalized, significantly undercapitalized and critically undercapitalized) and requires the respective Federal regulatory agencies to implement systems for “prompt corrective action” for insured depository institutions that do not meet minimum capital requirements within such categories. FDICIA imposes progressively more restrictive constraints on operations, management, and capital distributions, depending on the category in which an institution is classified. Failure to meet the capital guidelines could also subject a banking institution to capital raising requirements. An “undercapitalized” institution must develop a capital restoration plan. At December 31, 2014,2016, the Bank exceeded all of the required ratios for classification as “well capitalized.” It should be noted; however, that the Bank’s capital category is determined solely for the purpose of applying the federal banking agencies’ prompt corrective action regulations and the capital category may not constitute an accurate representation of the Bank’s overall financial condition or prospects.
An institution that, based upon its capital levels, is classified as well capitalized, adequately capitalized, or undercapitalized may be treated as though it were in the next lower capital category if the appropriate federal banking agency, after notice and opportunity for hearing, determines that an unsafe or unsound condition or practice warrants such treatment. At each successive lower capital category, an insured depository institution is subject to more restrictions.
Banking agencies have also adopted regulations which mandate that regulators take into consideration: (i) concentrations of credit risk; (ii) interest rate risk (when the interest rate sensitivity of an institution’s assets does not match the sensitivity of its liabilities or its off-balance-sheet position); and (iii) risks from non-traditional activities, as well as an institution’s ability to manage those risks, when determining the adequacy of an institution’s capital. That evaluation will be made as a part of the institution’s regular safety and soundness examination. In addition, the banking agencies have amended their regulatory capital guidelines to incorporate a measure for market risk. In accordance with the amended guidelines, any company with significant trading activity must incorporate a measure for market risk in its regulatory capital calculations.
In addition to measures taken under the prompt corrective action provisions, commercial banking organizations may be subject to potential enforcement actions by the federal banking agencies for unsafe or unsound practices in conducting their businesses or for violations of any law, rule, regulation, any condition imposed in writing by the agency, or any written agreement with the agency. Enforcement actions may include the imposition of a conservator or receiver, the issuance of a cease-and-desist order that can be judicially enforced, the termination of insurance of deposits (in the case of a depository institution), the imposition of civil money penalties, the issuance of directives to increase capital, the issuance of formal and informal agreements, the issuance of removal and prohibition orders against institution-affiliated parties and the enforcement of such actions through injunctions or restraining orders based upon a judicial determination that the agency would be harmed if such equitable relief was not granted. Additionally, a holding company's inability to serve as a source of strength to its subsidiary banking organizations could serve as an additional basis for a regulatory action against the holding company.
Federal banking regulators have also issued final guidance regarding commercial real estate (“CRE”) lending. This guidance suggests that institutions that are potentially exposed to significant CRE concentration risk will be subject to increased regulatory scrutiny. Institutions that have experienced rapid growth in CRE lending, have notable exposure to a specific type of CRE lending, or are approaching or exceed certain supervisory criteria that measure an institution’s CRE portfolio against its capital levels, may be subject to such increased regulatory scrutiny. The Company’s CRE portfolio may be viewed as falling within one or more of the foregoing categories, and accordingly may become subject to increased regulatory scrutiny because of the CRE portfolio. Institutions that are determined by their regulator to have an undue concentration in CRE lending may be required to maintain levels of capital in excess of the statutory minimum requirements and/or be required to reduce their concentration in CRE loans. TheAs of the Company’s most recent regulatory examination, the FDIC has determined that, at that time, the Company doesdid not have any undue concentrations in CRE lending. No guarantees can be made that this classification will not change as a result of future regulatory examinations.
Safety and Soundness Standards
The federal banking agencies have adopted guidelines designed to assist in identifying and addressing potential safety and soundness concerns before capital becomes impaired. The guidelines set forth operational and managerial standards relating to: (i) internal controls, information systems, and internal audit systems; (ii) loan & lease documentation; (iii) credit underwriting; (iv) asset growth; (v) earnings; and (vi) compensation, fees, and benefits. In addition, the federal banking agencies have also adopted safety and soundness guidelines with respect to asset quality and earnings standards. These guidelines provide six standards for establishing and maintaining a system to identify problem assets and prevent those assets from deteriorating. Under these standards, any insured depository institution should: (i) conduct periodic asset quality reviews to identify problem assets; (ii) estimate the inherent losses in problem assets and establish reserves that are sufficient to absorb estimated losses; (iii) compare problem asset totals to capital; (iv) take appropriate corrective action to resolve problem assets; (v) consider the size and potential risks of material asset concentrations; and (vi) provide periodic asset quality reports with adequate information for management and the Board of Directors to assess the level of asset risk. These guidelines also set forth standards for evaluating and monitoring earnings and for ensuring that earnings are sufficient for the maintenance of adequate capital and reserves.
Deposit Insurance
After the passage of the Dodd-Frank Act, the deposits of the Bank are now insured by the FDIC up to $250,000 per insured depositor.
The Federal Deposit Insurance Reform Act of 2005 provided the FDIC Board of Directors the authority to set the designated reserve ratio for the Deposit Insurance Fund (“DIF”) between 1.15% and 1.50%. The FDIC must adopt a restoration plan when the reserve ratio falls below 1.15% and begin paying dividends when the reserve ratio exceeds 1.35%.
Under the Dodd-Frank Act, the minimum designated reserve ratio of the DIF increased from 1.15% to 1.35% of estimated insured deposits. Additionally, the Dodd-Frank Act revised the assessment base against which an insured depository institution’s deposit insurance premiums paid to the DIF will be calculated. On February 7, 2011, the FDIC approved a final rule, as mandated by Dodd-Frank, changing the deposit insurance assessment system from one that is based on total domestic deposits to one that is based on average consolidated total assets minus average tangible equity. The new rule took effect for the quarter beginning April 1, 2011.
The Bank’s FDIC premiums were $1.0$1.17 million in 2014 compared to $981,0002016 and $1.19 million in 2013.2015. Future increases in insurance premiums could have adverse effects on the operating expenses and results of operations of the Company. Management cannot predict what insurance assessment rates will be in the future.
Insurance of deposits may be terminated by the FDIC upon a finding that the institution has engaged in unsafe or unsound practices, is in an unsafe or unsound condition to continue operations, or has violated any applicable law, regulation, rule, order, or condition imposed by the FDIC or the Bank’s primary regulator. Management of the Company is not aware of any practice, condition or violation that might lead to termination of the Company’s deposit insurance.
Community Reinvestment Act (“CRA”) and Fair Lending
The Bank is subject to certain fair lending requirements involving lending, investing, and other CRA activities. CRA requires each insured depository institution to identify the communities served by the institution’s offices and to identify the types of credit and investments the institution is prepared to extend within such communities including low and moderate-income neighborhoods. It also requires the institution’s regulators to assess the institution’s performance in meeting the credit needs of its community and to take such assessment into consideration in reviewing applications for mergers, acquisitions, relocation of existing branches, opening of new branches, and other transactions. A bank may be subject to substantial penalties and corrective measures for a violation of certain fair lending laws.
A bank’s compliance with the Community Reinvestment Act is assessed using an evaluation system, which bases CRA ratings on an institution’s lending, service and investment performance. An unsatisfactory rating may be the basis for denying a merger application. The Bank’s latest CRA examination was completed by the Federal Deposit Insurance Corporation in September 2013August 2016 and the Bank received an overall Outstanding rating in complying with its CRA obligations.
Consumer Protection Regulations
The Company’s lending activities are subject to a variety of statutes and regulations designed to protect consumers, including the Fair Credit Reporting Act, Equal Credit Opportunity Act, the Fair Housing Act, the Truth-in-Lending Act, the Unfair, Deceptive or Abusive Acts and Practices and the Dodd-Frank Act. Deposit operations are also subject to laws and regulations that protect consumer rights including Funds Availability, Truth in Savings, and Electronic Funds Transfers. Additional rules govern check writing ability on certain interest earning accounts and prescribe procedures for complying with administrative subpoenas of financial records. Additionally, effective October 26, 2013, there is a new provision of the Federal Reserve Regulation E to accommodate the new Remittance Transfer Rule requirement of the Dodd-Frank Act concerning international wires.
The Dodd-Frank Wall Street Reform and Consumer Protection Act (“Dodd-Frank Act”)
On July 21, 2010, President Obama signed into law the sweeping financial regulatory reform, Dodd-Frank Act, that implements significant changes to the regulation of the financial services industry, including provisions that, among other things:
| · | Centralize responsibility for consumer financial protection by creating a new agency within the Federal Reserve Board, the Bureau of Consumer Financial Protection, with broad rulemaking, supervision and enforcement authority for a wide range of consumer protection laws that would apply to all banks and thrifts. |
| · | Apply the same leverage and risk-based capital requirements that apply to insured depository institutions to bank holding companies. |
| · | Require the FDIC to seek to make its capital requirements for banks countercyclical so that the amount of capital required to be maintained increases in times of economic expansion and decreases in times of economic contraction. |
| · | Change the assessment base for federal deposit insurance from the amount of insured deposits to consolidated assets less tangible capital. |
| · | Implement corporate governance revisions, including executive compensation and proxy access by stockholders. |
| · | Make permanent the $250,000 limit for federal deposit insurance and increase the cash limit of Securities Investor Protection Corporation protection from $100,000 to $250,000, and provide unlimited federal deposit insurance until January 1, 2013 for non-interest bearing demand transaction accounts at all insured depository institutions. |
| · | Repeal the federal prohibitions on the payment of interest on demand deposits effective July 21, 2011, thereby permitting depository institutions to pay interest on business transaction and other accounts. |
Many aspects of the Dodd-Frank Act are subject to rulemaking by various regulatory agencies and will take effect over several years, making it difficult to anticipate the overall financial impact on the Company, its customers or the financial industry more generally. The elimination of the prohibition on the payment of interest on demand deposits could materially increase our interest expense, depending on our competitors' responses. The Trump Administration has indicated a desire to reform the Dodd-Frank Act in order to reduce the regulatory burden on U.S. companies, including financial institutions. At this time, no details on the proposed reforms have been published and we are uncertain whether the intended deregulation will have a significant impact on the Company.
Notice and Approval Requirements Related to Control
Banking laws impose notice, approval and ongoing regulatory requirements on any shareholderstockholder or other party that seeks to acquire direct or indirect "control" of an FDIC-insured depository institution. These laws include the BHCA and the Change in Bank Control Act. Among other things, these laws require regulatory filings by a shareholderstockholder or other party that seeks to acquire direct or indirect "control" of an FDIC-insured depository institution or bank holding company. The determination whether an investor "controls" a depository institution is based on all of the facts and circumstances surrounding the investment. As a general matter, a party is deemed to control a depository institution or other company if the party owns or controls 25% or more of any class of voting stock. Subject to rebuttal, a party may be presumed to control a depository institution or other company if the investor owns or controls 10% or more of any class of voting stock. Ownership by family members, affiliated parties, or parties acting in concert, is typically aggregated for these purposes. If a party's ownership of the Company were to exceed certain thresholds, the investor could be deemed to "control" the Company for regulatory purposes. This could subject the investor to regulatory filings or other regulatory consequences.
In addition, except under limited circumstances, bank holding companies are prohibited from acquiring, without prior approval:
control of any other bank or bank holding company or all or substantially all the assets thereof; or
more than 5% of the voting shares of a bank or bank holding company which is not already a subsidiary.
Incentive Compensation
The Dodd-Frank Act requires the federal bank regulators and the SEC to establish joint regulations or guidelines prohibiting incentive-based payment arrangements at specified regulated entities, including the Company and the Bank, having at least $1 billion in total assets that encourage inappropriate risks by providing an executive officer, employee, director or principal stockholder with excessive compensation, fees, or benefits or that could lead to material financial loss to the entity. In addition, these regulators must establish regulations or guidelines requiring enhanced disclosure to regulators of incentive-based compensation arrangements. The agencies proposed such regulations in April 2011, but the regulations have not been finalized. If the regulations are adopted in the form initially proposed, they will impose limitations on the manner in which the Company may structure compensation for our executives.
The FRB will review, as part of the regular, risk-focused examination process, the incentive compensation arrangements of banking organizations that are not “large, complex banking organizations.” These reviews will be tailored to each organization based on the scope and complexity of the organization’s activities and the prevalence of incentive compensation arrangements. The findings of the supervisory initiatives will be included in reports of examination. Deficiencies will be incorporated into the organization’s supervisory ratings, which can affect the organization’s ability to make acquisitions and take other actions. Enforcement actions may be taken against a banking organization if its incentive compensation arrangements, or related risk management control or governance processes, pose a risk to the organization’s safety and soundness and the organization is not taking prompt and effective measures to correct the deficiencies.
Available Information
Company reports filed with the SEC including the annual report on Form 10-K, quarterly reports on Form 10-Q, current reports on Form 8-K, proxy statements and ownership reports filed by directors, executive officers and principal stockholders can be accessed through the Company’s website at http://www.fmbonline.com. The link to the SEC is on the About Us page.
An investment in our common stock is subject to risks inherent in our business. The material risks and uncertainties that management believes may affect our business are described below. Before making an investment decision, you should carefully consider the risks and uncertainties described below together with all of the other information included or incorporated by reference in this 10-K Report. The risks and uncertainties described below are not the only ones facing our business. Additional risks and uncertainties that management is not aware of or focused on or that management currently deems immaterial may also impair our business operations. This 10-K Report is qualified in its entirety by these risk factors.
If any of the following risks actually occur, our financial condition and results of operations could be materially and adversely affected. If this were to happen, the value of our common stock could decline significantly, and you could lose all or part of your investment.
Risks Associated With Our Business
| · | continuing public sector financial stress, both at the local and statewide level. See “Item 1. Business – Service Area.” For example, the |
| · | levels of unemployment that remain above statewide and nationwide averages and home prices that have improved but |
Although we have initiated efforts to broaden our geographic footprint, our retail and commercial banking operations remain concentrated in Sacramento, San Joaquin, Stanislaus and Merced Counties. See “Item 1. Business – Service Area.” As a result of this geographic concentration, our results of operations depend largely upon economic conditions in these areas. Whereas much of this area appears to have stabilized,has improved, real estate values remain well below peak prices and unemployment remains well above most other areas in the state and country. As a result, risk still remains from the possibility that losses will be sustained if a significant number of our borrowers, guarantors and related parties fail to perform in accordance with the terms of their loans or leases. We have adopted underwriting and credit monitoring procedures and credit policies, including the establishment and review of the allowance for credit losses, that management believes are appropriate to minimize this risk by assessing the likelihood of nonperformance, tracking loan & lease performance and diversifying our credit portfolio. These policies and procedures; however, may not prevent unexpected losses that could materially adversely affect our results of operations in general and the market value of our stock. See “Item 7. Management’s Discussion and Analysis of Financial Condition and Results of Operations – Overview - Looking Forward: 20152017 and Beyond.”
Additionally, despite the stability of our earnings over the last several years, economic uncertainties may continue for the foreseeable future and the full extent of the repercussions on our local economies in general and our business in particular are still not fully known at this time. Such events may have a negative effect on: (i) our ability to service our existing customers and attract new customers; (ii) the ability of our borrowers to operate their business as successfully as in the past; (iii) the financial security and net worth of our customers; and (iv) the ability of our customers to repay their loans or leases with us in accordance with the terms thereof.
Our Allowance For Credit Losses May Not Be Adequate To Cover Actual Losses - A significant source of risk arises from the possibility that losses could be sustained because borrowers, guarantors, and related parties may fail to perform in accordance with the terms of their loans & leases. The underwriting and credit monitoring policies and procedures that we have adopted to address this risk may not prevent unexpected losses that could have a material adverse effect on our business, financial condition, results of operations and cash flows. Unexpected losses may arise from a wide variety of specific or systemic factors, many of which are beyond our ability to predict, influence, or control.
Like all financial institutions, we maintain an allowance for credit losses to provide for loan & lease defaults and non-performance. See “Item 7. Management’s Discussion and Analysis of Financial Condition and Results of Operations – Provision and Allowance for Credit Losses.” The allowance is funded from a provision for credit losses, which is a charge to our income statement. Our allowance for credit losses may not be adequate to cover actual loan & lease losses, and future provisions for credit losses could materially and adversely affect our business, financial condition, results of operations and cash flows. The allowance for credit losses reflects our estimate of the probable losses in our loan & lease portfolio at the relevant balance sheet date. Our allowance for credit losses is based on prior experience, as well as an evaluation of the known risks in the current portfolio, composition and growth of the loan & lease portfolio and other economic factors. The determination of an appropriate level of credit loss allowance is an inherently difficult process and is based on numerous assumptions. The amount of future losses is susceptible to changes in economic, operating and other conditions, including changes in interest rates, that may be beyond our control and these losses may exceed current estimates.
The process we use to estimate losses inherent in our credit exposure requires difficult, subjective and complex judgments, including forecasts of economic conditions and how these economic conditions might impair the ability of our borrowers to repay their loans and lessees to make their lease payments. The level of uncertainty concerning current economic conditions may adversely affect the accuracy of our estimates, which may, in turn, impact the reliability of the allowance for credit losses.
While we believe that our allowance for credit losses is adequate to cover current losses, we cannot assure you that we will not increase the allowance for credit losses further or that regulators will not require us to increase this allowance. Either of these occurrences could materially adversely affect our business, financial condition, results of operations and cash flows.
In June 2016, the Financial Accounting Standards Board (“FASB”) issued an Accounting Standards Update, Financial Instruments: Credit Losses, which establishes a new impairment framework also known as the "current expected credit loss model." In contrast to the incurred loss model currently used by financial entities like us, the current expected credit loss model requires an allowance be recognized based on the expected credit losses (i.e. all contractual cash flows that the entity does not expect to collect from financial assets or commitments to extend credit). It requires the consideration of more forward-looking information than is permitted under current U.S. generally accepted accounting principles. In addition to relevant information about past events and current conditions, such as borrowers’ current creditworthiness, quantitative and qualitative factors specific to borrowers, and the economic environment in which the entity operates, the new model requires consideration of reasonable and supportable forecasts that affect the expected collectability of the financial assets’ remaining contractual cash flows, and evaluation of the forecasted direction of the economic cycle, as well as time value of money. This proposed impairment framework is expected to have wide reaching implications to financial institutions such as us. The allowance for loan losses is likely to increase due to a larger volume of financial assets that fall within the scope of the proposed model, resulting in an adverse impact on retained earnings in the period of adoption.
We Are Dependent On Real Estate And Further Downturns In The Real Estate Market Could Hurt Our Business - Although our regulators have determined that we do not have significant CRE concentration risk, aA significant portion of our loan portfolio is dependent on real estate. See “Item 1. Business – Supervision and Regulation - Prompt Corrective Action and Other Enforcement Mechanisms.” At December 31, 2014,2016, real estate served as the principal source of collateral with respect to approximately 67%73% of our loan outstandings and 19%14% of loans outstanding were secured by production agricultural properties. Continuing stressesStresses in current economic conditions in our local markets or rising interest rates could have an adverse effect on the demand for new loans, the ability of borrowers to repay outstanding loans, the value of real estate and other collateral securing loans and the value of real estate owned by us, as well as our financial condition and results of operations in general and the market value of our common stock.
Acts of nature, including earthquakes, floods and fires, which may cause uninsured damage and other loss of value to real estate that secures these loans, may also negatively impact our financial condition.
Our Real Estate Lending Also Exposes Us To The Risk Of Environmental Liabilities - In the course of our business, we may foreclose and take title to real estate, and could be subject to environmental liabilities with respect to these properties. We may be held liable to a governmental entity or to third persons for property damage, personal injury, investigation and clean-up costs incurred by these parties in connection with environmental contamination, or may be required to investigate or clean up hazardous or toxic substances, or chemical releases at a property. The costs associated with investigation or remediation activities could be substantial. In addition, as the owner or former owner of a contaminated site, we may be subject to common law claims by third parties based on damages and costs resulting from environmental contamination emanating from the property. If we ever become subject to significant environmental liabilities, our business, financial condition, liquidity and results of operations could be materially and adversely affected.
Our Business Is Subject To Interest Rate Risk And Changes In Interest Rates May Adversely Affect Our Performance And Financial Condition - Our earnings are impacted by changing interest rates. Changes in interest rates impact the demand for new loans & leases, the credit profile of our borrowers, the rates received on loans & leases and securities and rates paid on deposits and borrowings. The difference between the rates received on loans & leases and securities and the rates paid on deposits and borrowings is known as the net interest margin. Like many financial institutions, our net interest margin has been declining. We expect thatdeclined over the past 10 years. Despite the FRB increasing short-term interest rates by 0.25% in both December 2015 and December 2016, continued low interest rates and aggressive competitor pricing strategies willmay continue to pushadversely impact our net interest margin lower in 2015.
Continuing low levels of market interest rates could adversely affect our earnings. The FRB regulates the supply of money and credit in the United States. Its policies determine, in large part, the cost of funds for lending and investing and the yield earned on those loans, leases and investments, which impact the Company’s net interest margin. Beginning in September 2007 the FRB implemented a series of rate reductions in response to the then current state of the national economy and housing market as well as the volatility of financial markets. Rates have remained low ever since, and; despite the FRB increasing short-term interest rates by 0.25% in both December 2015 and December 2016 and despite suggested additional increases in 2017, show no signs of significantly increasing in the near future. When interest rates decline,are low, borrowers tend to refinance higher-rate, fixed-rate loans at lower rates, and prepayingprepay their existing loans. Under those circumstances, we would not be able to reinvest those prepayments in assets earning interest rates as high as the rates on the prepaid loans. In addition, our CRE and commercial loans, which carry interest rates that, in general, adjust in accordance with changes in the prime rate, will adjust to lower rates. We are also significantly affected by the level of loan & lease demand available in our market. The inability to make sufficient loans & leases directly affects the interest income we earn. Lower loan & lease demand will generally result in lower interest income realized as we place funds in lower yielding investments. See “Item 7. Management’s Discussion and Analysis of Financial Condition and Results of Operations – Overview - Looking Forward: 20152017 and Beyond.”
Although we believe our current level of interest rate sensitivity is reasonable, significant fluctuations in interest rates and increasing competition may have an adverse effect on our business, financial condition and results of operations. See “Item 7. Management’s Discussion and Analysis of Financial Condition and Results of Operations – Net Interest Income/Net Interest Margin” and “Item 7A. Quantitative and Qualitative Disclosures About Market Risk - Interest Rate Risk.”
Our Accounting Estimates and Risk Management Processes Rely On Analytical and Forecasting Models - The processes we use to measure the fair value of financial instruments, as well as the processes used to estimate the effects of changing interest rates and other market measures on our financial condition and results of operations, depends upon the use of analytical and forecasting models. These models reflect assumptions that may not be accurate, particularly in times of market stress or other unforeseen circumstances. Even if these assumptions are adequate, the models may prove to be inadequate or inaccurate because of other flaws in their design or their implementation. If the models we use for interest rate risk and asset-liability management are inadequate, we may incur increased or unexpected losses upon changes in market interest rates or other market measures. If the models we use to measure the fair value of financial instruments are inadequate, the fair value of such financial instruments may fluctuate unexpectedly or may not accurately reflect what we could realize upon sale or settlement of such financial instruments. Any such failure in our analytical or forecasting models could have a material adverse effect on our business, financial condition and results of operations.
Failure To Successfully Execute Our Strategy Could Adversely Affect Our Performance - Our financial performance and profitability depends on our ability to execute our corporate growth strategy. Continued growth however, may present operating and other problems that could adversely affect our business, financial condition and results of operations. Accordingly, there can be no assurance that we will be able to execute our growth strategy or maintain the level of profitability that we have recently experienced. Factors that may adversely affect our ability to attain our long-term financial performance goals include those stated elsewhere in this section, as well as the:
| · | inability to maintain or increase net interest margin; |
| · | inability to control non-interest expense, including, but not limited to, rising employee and healthcare costs and the costs of regulatory compliance; |
| · | inability to maintain or increase non-interest income; and |
| · | continuing ability to expand through de novo branching or otherwise. |
Growth May Produce Unfavorable Outcomes - We seek to expand our franchise safely and consistently. A successful growth strategy requires us to manage multiple aspects of the business simultaneously, such as following adequate loan underwriting standards, balancing loan and deposit growth without increasing interest rate risk or compressing our net interest margin, maintaining sufficient capital, and recruiting, training and retaining qualified professionals.
Our growth strategy also includes acquisition possibilities (such as Delta National Bancorp) that either enhance our market presence or have potential for improved profitability through financial management, economies of scale or expanded services. We may be exposed to difficulties in combining the operations of acquired institutions into our own operations, which may prevent us from achieving the expected benefits from our acquisition activities. Inherent uncertainties exist in integrating the operations of an acquired institution and there is no assurance that we will be able to do so successfully. Among the issues that we could face are:
unexpected problems with operations, personnel, technology or credit;
loss of customers and employees of the acquiree;
difficulty in working with the acquiree's employees and customers;
the assimilation of the acquiree's operations, culture and personnel;
instituting and maintaining uniform standards, controls, procedures and policies; and
litigation risk not discovered during the due diligence period.
Undiscovered factors as a result of an acquisition could bring liabilities against us, our management and the management of the institutions we acquire. These factors could contribute to our not achieving the expected benefits from our acquisitions within desired time frames, if at all. Further, although we anticipate cost savings as a result of the merger, we may not be able to fully realize those savings. Any cost savings that are realized may be offset by losses in revenues or other charges to earnings.
New Market Areas And New Lines Of Business Or New Products And Services May Subject Us To Additional Risks. A Failure To Successfully Manage These Risks May Have A Material Adverse Effect On Our Business - As part of our growth strategy, we have implemented and may continue to implement new market areas and new lines of business. We recently have begun to implement plans to (i) expand into the greaterEast Bay area of San Francisco, Bay Area, which is a new market area for us, and (ii) introduce equipment leasing as a new product line. There are risks and uncertainties associated with these efforts, particularly in instances where such product lines are not fully mature. In developing and marketing new lines of business and/or new products and services and/or shifting the focus of our asset mix and/or expanding into new markets, we may invest significant time and resources. Initial timetables may not be achieved and price and profitability targets may not prove feasible. External factors, such as compliance with regulations, competitive alternatives in these markets and shifting market preferences, may also impact the successful implementation. Failure to successfully manage these risks could have an adverse effect on our business, financial condition and results of operations.
Our Financial Results Can Be Impacted By The Cyclicality and Seasonality Of Our Agricultural Business And The Risks Related Thereto - The Company has provided financing to agricultural customers in the Central Valley throughout its history. We recognize the cyclical nature of the industry, often caused by fluctuating commodity prices, and changing climatic conditions and the availability of seasonal labor, and manage these risks accordingly. The Company remains committed to providing credit to agricultural customers and will always have a material exposure to this industry. Although the Company’s loan portfolio is believed to be well diversified, at various times during 20142016 approximately 41%37% of the Company’s loan balances were outstanding to agricultural borrowers. Commitments are well diversified across various commodities, including dairy, grapes, walnuts, almonds, cherries, apples, pears, and various row crops. Additionally, many individual borrowers are themselves diversified across commodity types, reducing their exposure, and therefore the Company’s, to cyclical downturns in any one commodity. The state of California experienced drought conditions during much of 2013 and 2014. Importantly, most of the Company’s agricultural customers have access to their own ground water supplies and, therefore, are not as dependent on the delivery of surface water as growers in other parts of California. Although Management continues to believe that current conditions will not have a material impact on credit quality during 2015, the lack of rain will have a continuing adverse impact on our agricultural customers’ operating costs, crop yields and crop quality. The longer the drought continues, the more significant this impact will become, particularly if ground water levels reach critical stage.
The Company’s service areas can also be significantly impacted by the seasonal operations of the agricultural industry. As a result, the Company’s financial results can be influenced by the banking needs of its agricultural customers (e.g., generally speaking during the spring and summer customers draw down their deposit balances and increase loan borrowing to fund the purchase of equipment and the planting of crops. Correspondingly, deposit balances are replenished and loans repaid in late fall and winter as crops are harvested and sold).
The Impact of Climate and Government on The Availability of Water is a Long Term Risk That Could Affect Our Customers’ Businesses - The State of California experienced drought conditions from 2013 through most of 2016. Although significant levels of rain and snow in late 2016 and early 2017 have alleviated drought conditions this year in many areas of California, including those in the Company’s primary service area, the long-term risks associated with the availability of water continue to exist.
The farming belt of the Central Valley was often cited as an example of an area that experienced extreme drought during 2013 - 2016. However, it is important to understand that not all areas of the state were impacted equally, and this is particularly true in the Central Valley, which stretches some 450 miles from Bakersfield in the south to Redding in the north. The vast majority of the Company’s agricultural customers are located in the more northern portion of the Central Valley, an area that benefits from the drainage of the Sacramento, American, Mokelumne and Stanislaus rivers. As a result, even during the worst of the drought farmers in this area still had access to reasonable ground water sources that were economical to pump.
Importantly, the Company has minimal credit exposure in the more southern portion of the Central Valley, defined broadly as an area south of Highway 152, but more importantly the Fresno area and south (including the Westlands Water District). In most of these areas ground water levels were depleted, making farmers increasingly dependent on the delivery of surface water from the Central Valley Project, which cut back deliveries to many farmers during the worst of the drought.
In addition to the impact of climate on the availability of water, the “politics” of water, and how the state and federal governments ultimately manage this resource, could also impact how much water our customers have access to. As an example, many of our agricultural customers have senior riparian water rights, which provide them the legal right to access surface water from the rivers that abut their property. In the spring of 2015, the State of California took the extreme step of threatening to curtail certain riparian water rights for those farmers taking water from the Delta, and as a result affected growers agreed to voluntarily cutback 25% of their normal water usage as opposed to undertaking a protracted legal fight. Even with these cutbacks, our agricultural customers still had access to sufficient levels of water to satisfy their needs, however, this situation points out how the “politics” of water can also affect the availability of water.
Even with the recent rains, the Company continues to monitor the water situation through: (i) regularly reviewing ground water level reports provided by California’s Department of Water Resources; (ii) requiring water budgets and plans from all of our agricultural borrowers that detail the sources of their irrigation water and the irrigation requirements to achieve their crop plan; and (iii) in the case of new permanent crop development projects, requiring well tests.
Although management believes that current conditions have improved dramatically for the 2017 crop year, we recognize that the availability of water remains a long term risk in the Central Valley.
We Face Strong Competition From Financial Service Companies And Other Companies That Offer Banking Services That Could Adversely Impact Our Business - The financial services business in our market areas is highly competitive. It is becoming increasingly competitive due to changes in regulation, technological advances, and the accelerating pace of consolidation among financial services providers. We face competition both in attracting deposits and in making loans & leases. We compete for loans & leases principally through the interest rates and loan & lease fees we charge and the efficiency and quality of services we provide. Increasing levels of competition in the banking and financial services business may reduce our market share, decrease loan & lease demand, cause the prices we charge for our services to fall, or decrease our net interest margin by forcing us to offer lower lending interest rates and pay higher deposit interest rates. Therefore, our results may differ in future periods depending upon the nature or level of competition.
Technology and other changes are allowing parties to complete financial transactions that historically have involved banks through alternative methods. For example, consumers can now maintain funds that would have historically been held as bank deposits in brokerage accounts or mutual funds. Consumers can also complete transactions such as paying bills and/or transferring funds directly without the assistance of banks. The process of eliminating banks as intermediaries, known as “disintermediation,” could result in the loss of fee income, as well as the loss of customer deposits and the related income generated from those deposits. The loss of these revenue streams and the lower cost deposits as a source of funds could have a material adverse effect on our financial condition and results of operations.
Many of our competitors offer products and services that we do not offer, and many have substantially greater resources, such as greater capital resources and more access to longer term, lower cost funding sources. Many also have greater name recognition and market presence that benefit them in attracting business. In addition, larger competitors may be able to price loans & lease and deposits more aggressively than we do. Our larger competitors generally have easier access to capital, and often on better terms. Some of the financial services organizations with which we compete are not subject to the same degree of regulation as is imposed on bank holding companies and federally insured state-chartered banks, national banks and federal savings institutions. As a result, these non-bank competitors have certain advantages over us in accessing funding and in providing various services. Other competitors are subject to similar regulation but have the advantages of larger established customer bases, higher lending limits, extensive branch networks, numerous automated teller machines, greater advertising and marketing budgets or other factors. Some of our competitors have other advantages, such as tax exemption in the case of credit unions, and lesser regulation in the case of mortgage companies and specialty finance companies.
Deposit Insurance Assessments Could Increase At Any Time, Which Will Adversely Affect Profits - FDIC deposit insurance expense for the years 2016, 2015, and 2014 2013,was $1.17 million, $1.19 million, and 2012 was $1.0 million, $981,000, and $968,000, respectively. During 2011, the FDIC changed its methodology for calculating deposit premiums, See “Item 1. Business – Supervision and Regulation – Deposit Insurance.” Any increases could have adverse effects on the operating expenses and results of operations of the Company.
We May Not Be Able To Attract And Retain Skilled People - Our success depends, in large part, on our ability to attract and retain key people. Competition for the best people in most of our activities can be intense and we may not be able to hire people or to retain them. The unexpected loss of services of one or more of our key personnel could have a material adverse impact on our business because of their skills, knowledge of our market, years of industry experience and the difficulty of promptly finding qualified replacement personnel.
Our Internal Operations Are Subject To A Number Of Risks - We are subject to certain operations risks, including, but not limited to, information system failures and errors, customer or employee fraud and catastrophic failures resulting from terrorist acts or natural disasters. We maintain a system of internal controls to mitigate against such occurrences and maintain insurance coverage for such risks that are insurable, but should such an event occur that is not prevented or detected by our internal controls, uninsured or in excess of applicable insurance limits, it could have a significant adverse impact on our business, financial condition or results of operations.
We rely heavily on communications and information systems to conduct our business. Any failure, interruption or breach in security of these systems could result in failures or disruptions in our customer relationship management, general ledger, deposit, loan & leases and other systems. While we have policies and procedures designed to prevent or limit the effect of the failure, interruption or security breach of our information systems, there can be no assurance that any such failures, interruptions or security breaches will not occur or, if they do occur, that they will be adequately addressed. The occurrence of any failures, interruptions or security breaches of our information systems could damage our reputation, result in a loss of customer business, subject us to additional regulatory scrutiny, or expose us to civil litigation and possible financial liability, any of which could have a material adverse effect on our financial condition and results of operations.
The financial services industry is continually undergoing rapid technological change with frequent introductions of new technology-driven products and services. The effective use of technology increases efficiency and enables financial institutions to better serve customers and to reduce costs. Our future success depends, in part, upon our ability to address the needs of our customers by using technology to provide products and services that will satisfy customer demands, as well as to create additional efficiencies in our operations. Many of our competitors have substantially greater resources to invest in technological improvements. We may not be able to effectively implement new technology-driven products and services or be successful in marketing these products and services to our customers. Failure to successfully keep pace with technological change affecting the financial services industry could have a material adverse impact on our business and, in turn, our financial condition and results of operations.
Natural disasters, acts of war or terrorism and other adverse external events could have a significant impact on our ability to conduct business. Such events could affect the stability of our deposit base, impair the ability of borrowers to repay outstanding loans and lessees to make lease payments, impair the value of collateral securing loans & leases, cause significant property damage, result in loss of revenue and/or cause us to incur additional expenses. Operations in several of our markets could be disrupted by both the evacuation of large portions of the population as well as damage and or lack of access to our banking and operation facilities. While we have not experienced such an occurrence to date, other natural disasters, acts of war or terrorism or other adverse external events may occur in the future. Although management has established disaster recovery policies and procedures, the occurrence of any such event could have a material adverse effect on our business, which, in turn, could have a material adverse effect on our financial condition and results of operations.
We Depend On Cash Dividends From The Bank To Meet Our Cash Obligations - As a holding company, dividends from the Bank provide a substantial portion of our cash flow used to service the interest payments on our subordinated debentures issued in 2003 and our other obligations, including cash dividends. See “Item 5. Market for the Registrant’s Common Equity, Related Stockholder Matters and Issuer Purchases of Equity Securities.” Various statutory provisions restrict the amount of dividends our subsidiary bank can pay to us without regulatory approval.
A Lack Of Liquidity Could Adversely Affect Our Operations And Jeopardize Our Business, Financial Condition And Results Of Operations - Liquidity is essential to our business. We rely on our ability to generate deposits and effectively manage the repayment and maturity schedules of our loans and investment securities, respectively, to ensure that we have adequate liquidity to fund our operations. An inability to raise funds through deposits, borrowings, the sale of our investment securities, Federal Home Loan Bank advances, the sale of loans and other sources could have a substantial negative effect on our liquidity. Our most important source of funds consists of deposits. Deposit balances can decrease when customers perceive alternative investments as providing a better risk/return tradeoff. If customers move money out of bank deposits and into other investments, we would lose a relatively low-cost source of funds, increasing our funding costs and reducing our net interest income and net income.
Other primary sources of funds consist of cash flows from operations, investment maturities and sales of investment securities and proceeds from the issuance and sale of any equity and debt securities to investors. Additional liquidity is provided by the ability to borrow from the Federal Reserve Bank and the Federal Home Loan Bank and our ability to raise brokered deposits. We also may borrow funds from third-party lenders, such as other financial institutions. Our access to funding sources in amounts adequate to finance or capitalize our activities, or on terms that are acceptable to us, could be impaired by factors that affect us directly or the bank or non-bank financial services industries or economy in general, such as disruptions in the financial markets or negative views and expectations about the prospects for the bank or non-bank financial services industries.
As of December 31, 2014,2016, approximately $985.7 million,$2.0 billion, or 47.8%77.9%, of our deposits consisted of interest-bearing demand deposits, savings and money market accounts. Based on past experience, we believe that our deposit accounts are relatively stable sources of funds. If we increase interest rates paid to retain deposits, our earnings may be adversely affected, which could have an adverse effect on our business, financial condition and results of operations. Any decline in available funding could adversely impact our ability to originate loans, invest in securities, meet our expenses, pay dividends to our shareholdersstockholders or to fulfill obligations such as repaying our borrowings or meeting deposit withdrawal demands, any of which could have a material adverse impact on our liquidity, business, financial condition and results of operations.
Cyber Security Is A Growing Risk For Financial Institutions - Our business requires the secure handling of sensitive client information. We also rely heavily on communications and information systems to conduct our business. Cyber incidents include intentional attacks and unintentional events that may present unauthorized access to digital systems that disrupt operations, corrupt data, release sensitive information or cause denial-of-service on our websites. We store, process and transmit account information in connection with lending and deposit relationships, including funds transfer and online banking. A breach of cyber-security systems of the Bank, our vendors or customers, or widely publicized breaches of other financial institutions could significantly harm our reputation, result in a loss of customer business, subject us to additional regulatory scrutiny, or expose us to civil litigation and financial liability. While we have systems and procedures designed to prevent security breaches, we cannot be certain that advances in criminal capabilities, physical system or network break-ins or inappropriate access will not compromise or breach the technology protecting our networks or proprietary client information.
We Rely On Third-Party Vendors For Important Aspects Of Our Operation - We depend on the accuracy and completeness of information and systems provided by certain key vendors, including but not limited to data processing, payroll processing, technology support, investment safekeeping and accounting. Our ability to operate, as well as our financial condition and results of operations, could be negatively affected in the event of an interruption of an information system, an undetected error, a cyber breach, or in the event of a natural disaster whereby certain vendors are unable to maintain business continuity.
We May Be Adversely Affected By The Soundness Of Other Financial Institutions - Financial services institutions are interrelated as a result of trading, clearing, counterparty and other relationships. We have exposure to many different industries and counterparties, and routinely execute transactions with counterparties in the financial services industry, including commercial banks, broker-dealers, investment banks and other institutional clients. Many of these transactions expose us to credit risk in the event of a default by a counterparty or client. In addition, our credit risk may be exacerbated if our collateral cannot be foreclosed upon or is liquidated at prices not sufficient to recover the full amount of the credit or cover the derivative exposure due. Any such losses could have a material adverse effect on our business, financial condition and results of operations.
Deterioration Of Credit Quality Or Insolvency Of Insurance Companies May Impede Our Ability To Recover Losses - The financial crisis led certain major insurance companies to be downgraded by rating agencies. We have property, casualty and financial institution risk coverage underwritten by several insurance companies. In addition, some of our investments in obligations of state and political subdivisions are insured by insurance companies. While we closely monitor credit ratings of our insurers and insurers of our municipality securities, and we are poised to make quick changes if needed, we cannot predict an unexpected inability to honor commitments. We also invest in bank-owned life insurance policies on certain members of senior Management, which may lose value in the event of the carriers' insolvency. In the event that our bank-owned life insurance policy carriers' credit ratings fall below investment grade, we may exchange policies underwritten by them to another carrier at a cost charged by the original carrier, or we may terminate the policies whichthat may result in adverse tax consequences.
Our loan portfolio is also primarily secured by properties located in earthquake or fire-prone zones. In the event of a disaster that causes pervasive damage to the region in which we operate, not only the Bank, but also the loan collateral may suffer losses not recovered by insurance.
Risks Associated With Our Industry
We Are Subject To Government Regulation That Could Limit Or Restrict Our Activities, Which In Turn Could Adversely Impact Our Financial Performance - The financial services industry is regulated extensively and we are subject to examination, supervision and comprehensive regulations by various regulatory agencies. Federal and state regulations are designed primarily to protect the deposit insurance funds and consumers, and not to benefit our stockholders. These regulations can sometimes impose significant limitations on our operations and increase our cost of doing business.
Further, federal monetary policy, particularly as implemented by the FRB, significantly affects economic conditions for us.
Proposals to change the laws and regulations governing the operations and taxation of, and federal insurance premiums paid by, banks and other financial institutions and companies that control such institutions are frequently raised in the U.S. Congress, the California legislature and before bank regulatory authorities. The likelihood of any major changes in the future and the impact such changes, including the Dodd-Frank Act, might have on us or the Bank are impossible to determine. Similarly, proposals to change the accounting treatment applicable to banks and other depository institutions are frequently raised by the SEC, the federal banking agencies, the IRS and other appropriate authorities. The likelihood and impact of any additional future changes in law or regulation and the impact such changes might have on us or the Bank are impossible to determine at this time.
Risks Associated With Our Stock
Our Stock Trades Less Frequently Than Others - The Company’s common stock is not widely held or listed on any exchange. However, trades are reported on the OTCQX under the symbol "FMCB." Management is aware that there are private transactions in the Company’s common stock. However, the limited trading market for the Company’s common stock may make it difficult for stockholders to dispose of their shares.
Our Stock Price Is Affected By A Variety Of Factors - Stock price volatility may make it more difficult for you to resell your common stock when you want and at prices you find attractive. Our stock price can fluctuate significantly in response to a variety of factors discussed in this section, including, among other things:
| · | actual or anticipated variations in quarterly results of operations; |
| · | operating and stock price performance of other companies that investors deem comparable to our Company; |
| · | news reports relating to trends, concerns and other issues in the financial services industry; |
| · | available investment liquidity in our market area since our stock is not listed on any exchange; and |
| · | perceptions in the marketplace regarding our Company and/or its competitors. |
Our Common Stock Is Not An Insured Deposit - Our common stock is not a bank deposit and, therefore, is not insured against loss by the FDIC, any other deposit insurance fund or by any other public or private entity. Investment in our common stock is inherently risky for the reasons described in this “Risk Factors” section and elsewhere in this report and is subject to the same market forces that affect the price of common stock in any company. As a result, if you acquire our common stock, you may lose some or all of your investment.
The Company has no unresolved comments received from staff at the SEC.
Farmers & Merchants Bancorp along with its subsidiaries are headquartered in Lodi, California. Executive offices are located at 111 W. Pine Street. Banking services are provided in twenty-four branchtwenty-seven locations in the Company's service area. Of the twenty-four branches, fifteentwenty- seven locations, seventeen are owned and nineten are leased. The expiration of these leases occurs between the years 20152017 and 2024. See Note 19,20, located in “Item 8. Financial Statements and Supplementary Data.”
Certain lawsuits and claims arising in the ordinary course of business have been filed or are pending against the Company or its subsidiaries. Based upon information available to the Company, its review of such lawsuits and claims and consultation with its counsel, the Company believes the liability relating to these actions, if any, would not have a material adverse effect on its consolidated financial statements.
There are no material proceedings adverse to the Company to which any director, officer or affiliate of the Company is a party.
Not Applicable
PART II
The common stock of Farmers & Merchants Bancorp is not widely held or listed on any exchange. However, trades are reported on the OTCQX (prior to January 12, 2015, the Over the Counter (“OTC”) Bulletin Board) under the symbol “FMCB.” Additionally, management is aware that there are private transactions in the Company’s common stock.
The following table summarizes the actual high, low, and close sale prices for the Company's common stock since the first quarter of 2013.2015. These figures are based on activity posted on the OTC Bulletin BoardOTCQX and on private transactions between individual stockholders that are reported to the Company. Since there is limited trading in our stock, (See “Item 1A. Risk Factors – Risks Associated With Our Stock”) the “Close” sale prices represent the volume weighted average close prices for the last month of the quarter.
Calendar Quarter | High | Low | Close | Cash Dividends Declared (Per Share) | |||||||||||||
| 2014 | Fourth quarter | $ | 466 | $ | 450 | $ | 463 | $ | 6.40 | ||||||||
| Third quarter | 445 | 430 | 450 | - | |||||||||||||
| Second quarter | 451 | 420 | 433 | 6.30 | |||||||||||||
| First quarter | 448 | 417 | 425 | - | |||||||||||||
Calendar Quarter | High | Low | Close | Cash Dividends Declared (Per Share) | |||||||||||||
| 2016 | Fourth quarter | $ | 650 | $ | 595 | $ | 622 | $ | 6.55 | ||||||||
| Third quarter | 600 | 550 | 596 | - | |||||||||||||
| Second quarter | 645 | 501 | 579 | 6.55 | |||||||||||||
| First quarter | 644 | 501 | 544 | - | |||||||||||||
Calendar Quarter | High | Low | Close | Cash Dividends Declared (Per Share) | |||||||||||||
| 2013 | Fourth quarter | $ | 417 | $ | 405 | $ | 417 | $ | 6.30 | ||||||||
| Third quarter | 420 | 400 | 415 | - | |||||||||||||
| Second quarter | 500 | 384 | 400 | 6.20 | |||||||||||||
| First quarter | 470 | 375 | 470 | - | |||||||||||||
Calendar Quarter | High | Low | Close | Cash Dividends Declared (Per Share) | |||||||||||||
| 2015 | Fourth quarter | $ | 585 | $ | 510 | $ | 518 | $ | 6.50 | ||||||||
| Third quarter | 532 | 500 | 524 | - | |||||||||||||
| Second quarter | 585 | 450 | 508 | 6.40 | |||||||||||||
| First quarter | 506 | 460 | 505 | ||||||||||||||
As of January 31, 2015,2017, there were approximately 1,4491,645 stockholders of record of the Company’sCompany's common stock. However, since approximately 15% of our common stock shares are held by brokers on behalf of stockholders, we are unable to estimate the total number of stockholders.
The Company and, before the Company was formed, the Bank, has paid cash dividends for the past 8082 consecutive years. There are limitations under Delaware corporate law as to the amounts of cash dividends that may be paid by the Company. Additionally, if we decided to defer interest on our 2003 subordinated debentures, we would be prohibited from paying cash dividends on the Company’s common stock. The Company is dependent on cash dividends paid by the Bank to fund its cash dividend payments to its stockholders. There are regulatory limitations on cash dividends that may be paid by the Bank under state and federal laws. See “Item 1. Business – Supervision and Regulation.”
In 1998, the Board approved the Company’s first common stock repurchase program. This program has been extended and expanded several times since then, and most recently, on SeptemberAugust 11, 2012,2015, the Board of Directors approved increasingan extension of the funds available for the Company’s common$20 million stock repurchase program to $20 million over the three-year period ending September 30, 2015.2018.
Repurchases under the program may be made from time to time on the open market or through private transactions. The repurchase program also requires that no purchases may be made if the Bank would not remain “well-capitalized” after the repurchase.
There were no shares repurchased by the Company during 2014.2016. The approximate dollar value of shares that may yet be purchased under the program is $20 million.
On August 5, 2008, the Board of Directors approved a Share Purchase Rights Plan (the “Rights Plan”), pursuant to which the Company entered into a Rights Agreement dated August 5, 2008, with Computershare (formerly Registrar and Transfer Company), as Rights Agent, and the Company declared a dividend of a right to acquire one preferred share purchase right (a “Right”) for each outstanding share of the Company’s common stock, $0.01 par value per share, to stockholders of record at the close of business on August 15, 2008. Generally, the Rights are only triggered and become exercisable if a person or group (the “Acquiring Person”) acquires beneficial ownership of 10 percent or more of the Company’s common stock or announces a tender offer for 10 percent or more of the Company’s common stock.
The Rights Plan is similar to plans adopted by many other publicly traded companies. The effect of the Rights Plan is to discourage any potential acquirer from triggering the Rights without first convincing Farmers & Merchants Bancorp’s Board of Directors that the proposed acquisition is fair to, and in the best interest of, all of the stockholders of the Company. The provisions of the Plan, if triggered by the Acquiring Person, will substantially dilute the equity and voting interest of any potential acquirer unless the Board of Directors approves of the proposed acquisition.acquisition (under Article XV of the Company’s Certificate of Incorporation, the Board of Directors has the authority to consider any and all factors in determining whether an acquisition is in the best interests of the Company and its stockholders). Each Right, if and when exercisable, will entitle the registered holder to purchase from the Company one one-hundredth of a share of Series A Junior Participating Preferred Stock, no par value, at a purchase price of $1,200 for each one one-hundredth of a share, subject to adjustment. Each holder of a Right (except for the Acquiring Person, whose Rights will be null and void upon such event) shall thereafter have the right to receive, upon exercise, that number of Common Shares of the Company having a market value of two times the exercise price of the Right. At any time before a person becomes an Acquiring Person, the Rights can be redeemed, in whole, but not in part, by Farmers and Merchants Bancorp’s Board of Directors at a price of $0.001 per Right.
The Rights Plan willwas set to expire on August 5, 2018. On November 19, 2015, the Board of Directors approved a seven-year extension of the term of the Rights Plan. Pursuant to an Amendment to the Rights Agreement dated February 18, 2016, the term of the Rights Plan was extended from August 5, 2018 to August 5, 2025. The extension of the term of the Rights Plan was intended as a means to continue to guard against abusive takeover tactics and was not in response to any particular proposal. The Board also increased the purchase price under the Rights Plan to $1,600 per one one-hundredth of a preferred share from $1,200, to reflect the increase in the market price of the Company’s common stock over the past several years.
During 2015, the Company issued 6,705 shares of common stock. All of these shares were contributed to the Bank’s non-qualified defined contribution retirement plans. The shares issued had prices ranging from $450 per share to $525 per share. These share prices were based upon valuations completed by a nationally recognized bank consulting and advisory firm and in reliance upon the exemption in Section 4(a)(2) of the Securities Act of 1933, as amended, and the regulations promulgated thereunder. The proceeds from these issuances were contributed to the Bank as equity capital.
Performance Graphs
The following graph compares the Company’s cumulative total stockholder return on common stock from December 31, 20092011 to December 31, 20142016 to that of: (i) the Morningstar Banks Index - Regional (US) Industry Group; and (ii) the cumulative total return of the New York Stock Exchange market index. The graph assumes an initial investment of $100 on December 31, 20092011 and reinvestment of dividends. The stock price performance set forth in the following graph is not necessarily indicative of future price performance. The Company’s stock price data is based on activity posted on the OTC Bulletin BoardOTCQX and on private transactions between individual stockholders that are reported to the Company. This data was furnished by Zacks SEC Compliance Services Group.
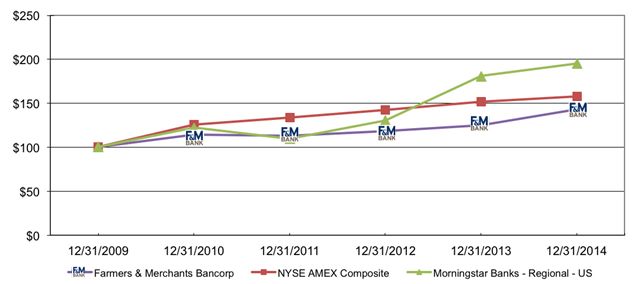
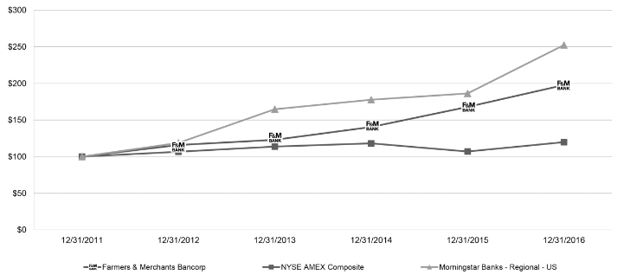
This graph shall not be deemed filed or incorporated by reference into any filing under the Securities Act of 1933.
| Summary of Income: | 2016 | 2015 | 2014 | 2013 | 2012 | |||||||||||||||
| Total Interest Income | $ | 99,266 | $ | 90,075 | $ | 81,521 | $ | 76,531 | $ | 78,491 | ||||||||||
| Total Interest Expense | 4,196 | 3,325 | 2,813 | 2,891 | 5,140 | |||||||||||||||
| Net Interest Income | 95,070 | 86,750 | 78,708 | 73,640 | 73,351 | |||||||||||||||
| Provision for Credit Losses | 6,335 | 750 | 1,175 | 425 | 1,850 | |||||||||||||||
| Net Interest Income After Provision for Credit Losses | 88,735 | 86,000 | 77,533 | 73,215 | 71,501 | |||||||||||||||
| Total Non-Interest Income | 15,257 | 14,575 | 14,329 | 15,937 | 14,110 | |||||||||||||||
| Total Non-Interest Expense | 58,172 | 56,259 | 51,366 | 50,870 | 48,277 | |||||||||||||||
| Income Before Income Taxes | 45,820 | 44,316 | 40,496 | 38,282 | 37,334 | |||||||||||||||
| Provision for Income Taxes | 16,097 | 16,924 | 15,094 | 14,221 | 13,985 | |||||||||||||||
| Net Income | $ | 29,723 | $ | 27,392 | $ | 25,402 | $ | 24,061 | $ | 23,349 | ||||||||||
| Balance Sheet Data: | ||||||||||||||||||||
| Total Assets | $ | 2,922,121 | $ | 2,615,345 | $ | 2,360,551 | $ | 2,076,073 | $ | 1,974,686 | ||||||||||
| Loans & Leases | 2,177,601 | 1,996,359 | 1,712,244 | 1,388,236 | 1,246,902 | |||||||||||||||
| Allowance for Credit Losses | 47,919 | 41,523 | 35,401 | 34,274 | 34,217 | |||||||||||||||
| Investment Securities | 506,372 | 430,533 | 430,405 | 473,144 | 486,383 | |||||||||||||||
| Deposits | 2,581,711 | 2,277,532 | 2,064,073 | 1,807,691 | 1,722,026 | |||||||||||||||
| Federal Home Loan Bank Advances | - | - | - | - | - | |||||||||||||||
| Shareholders' Equity | 279,981 | 251,835 | 233,178 | 209,904 | 205,033 | |||||||||||||||
| Selected Ratios: | ||||||||||||||||||||
| Return on Average Assets | 1.12 | % | 1.12 | % | 1.17 | % | 1.21 | % | 1.22 | % | ||||||||||
| Return on Average Equity | 11.17 | % | 11.21 | % | 11.43 | % | 11.54 | % | 11.62 | % | ||||||||||
| Dividend Payout Ratio | 35.25 | % | 37.08 | % | 39.05 | % | 40.41 | % | 40.34 | % | ||||||||||
| Average Loans & Leases to Average Deposits | 88.63 | % | 84.44 | % | 79.99 | % | 74.28 | % | 72.02 | % | ||||||||||
| Average Equity to Average Assets | 10.05 | % | 10.02 | % | 10.28 | % | 10.52 | % | 10.45 | % | ||||||||||
| Period-end Shareholders' Equity to Total Assets | 9.58 | % | 9.63 | % | 9.88 | % | 10.11 | % | 10.38 | % | ||||||||||
| Basic Per Share Data: | ||||||||||||||||||||
Net Income (1) | $ | 37.44 | $ | 34.82 | $ | 32.64 | $ | 30.93 | $ | 29.99 | ||||||||||
| Cash Dividends Per Share | $ | 13.10 | $ | 12.90 | $ | 12.70 | $ | 12.50 | $ | 12.10 | ||||||||||
| Summary of Income: | 2014 | 2013 | 2012 | 2011 | 2010 | |||||||||||||||
| Total Interest Income | $ | 81,521 | $ | 76,531 | $ | 78,491 | $ | 82,354 | $ | 84,461 | ||||||||||
| Total Interest Expense | 2,813 | 2,891 | 5,140 | 7,974 | 9,685 | |||||||||||||||
| Net Interest Income | 78,708 | 73,640 | 73,351 | 74,380 | 74,776 | |||||||||||||||
| Provision for Credit Losses | 1,175 | 425 | 1,850 | 6,775 | 14,735 | |||||||||||||||
| Net Interest Income After Provision for Credit Losses | 77,533 | 73,215 | 71,501 | 67,605 | 60,041 | |||||||||||||||
| Total Non-Interest Income | 14,329 | 15,937 | 14,110 | 12,274 | 17,185 | |||||||||||||||
| Total Non-Interest Expense | 51,366 | 50,870 | 48,277 | 45,028 | 43,939 | |||||||||||||||
| Income Before Income Taxes | 40,496 | 38,282 | 37,334 | 34,851 | 33,287 | |||||||||||||||
| Provision for Income Taxes | 15,094 | 14,221 | 13,985 | 12,642 | 12,169 | |||||||||||||||
| Net Income | $ | 25,402 | $ | 24,061 | $ | 23,349 | $ | 22,209 | $ | 21,118 | ||||||||||
| Balance Sheet Data: | ||||||||||||||||||||
| Total Assets | $ | 2,360,551 | $ | 2,076,073 | $ | 1,974,686 | $ | 1,919,684 | $ | 1,841,491 | ||||||||||
| Loans & Leases | 1,712,244 | 1,388,236 | 1,246,902 | 1,163,078 | 1,176,002 | |||||||||||||||
| Allowance for Credit Losses | 35,401 | 34,274 | 34,217 | 33,017 | 32,261 | |||||||||||||||
| Investment Securities | 430,405 | 473,144 | 486,383 | 542,912 | 493,581 | |||||||||||||||
| Deposits | 2,064,073 | 1,807,691 | 1,722,026 | 1,626,197 | 1,566,503 | |||||||||||||||
| Federal Home Loan Bank Advances | - | - | - | 530 | 591 | |||||||||||||||
| Shareholders' Equity | 233,178 | 209,904 | 205,033 | 189,346 | 173,241 | |||||||||||||||
| Selected Ratios: | ||||||||||||||||||||
| Return on Average Assets | 1.17 | % | 1.21 | % | 1.22 | % | 1.19 | % | 1.19 | % | ||||||||||
| Return on Average Equity | 11.43 | % | 11.54 | % | 11.62 | % | 12.10 | % | 12.25 | % | ||||||||||
| Dividend Payout Ratio | 39.05 | % | 40.41 | % | 40.34 | % | 41.24 | % | 41.93 | % | ||||||||||
| Average Loans & Leases to Average Deposits | 79.99 | % | 74.28 | % | 72.02 | % | 74.48 | % | 79.03 | % | ||||||||||
| Average Equity to Average Assets | 10.28 | % | 10.52 | % | 10.45 | % | 9.85 | % | 9.74 | % | ||||||||||
| Period-end Shareholders' Equity to Total Assets | 9.88 | % | 10.11 | % | 10.38 | % | 9.86 | % | 9.41 | % | ||||||||||
| Basic Per Share Data: | ||||||||||||||||||||
Net Income (1) | $ | 32.64 | $ | 30.93 | $ | 29.99 | $ | 28.49 | $ | 27.05 | ||||||||||
| Cash Dividends Per Share | $ | 12.70 | $ | 12.50 | $ | 12.10 | $ | 11.75 | $ | 11.35 | ||||||||||
(1) | Based on the weighted average number of shares outstanding of 793,970, 786,582, 778,358, |
Overview
Although the Company has initiated efforts to expand its geographic footprint into Walnut Creek and Irvine, CAthe East Bay area of San Francisco, California (see Item 1: Business – Service Area), the Company’s primary service area remains the mid Central Valley of California, a region that can be significantly impacted by the seasonal needs of the agricultural industry. Accordingly, discussion of the Company’s Financial Condition and Results of Operations is influenced by the seasonal banking needs of its agricultural customers (e.g., during the spring and summer customers draw down their deposit balances and increase loan borrowing to fund the purchase of equipment and planting of crops. Correspondingly, deposit balances are replenished and loans repaid in late fall and winter as crops are harvested and sold).
The Five-Year Period: 20102012 through 20142016
Through much of 2007 the economy in our primary service area was strong, the stock market rising and individuals and businesses doing well. Then in October 2007 the financial markets started what would become a major adjustment and an economic recession began, the impact of which is still being felt today in the Central Valley of California. The Central Valley was one of the hardest hit areas in the country during the recession. In many areas housing prices declined as much as 60% and unemployment reached 15% or more. Although the economy has stabilizedimproved throughout most of the Central Valley, housing prices for the most part have not recovered significantlystill remain below peak levels and unemployment levels remain well above those in other areas of the state and country.
Despite this difficultchallenging economic environment, in management’s opinion, the Company’s operating performance over the past five years has been exceptionally strong.
(in thousands, except per share data)
| Financial Performance Indicator | 2016 | 2015 | 2014 | 2013 | 2012 | |||||||||||||||
| Net Income | $ | 29,723 | $ | 27,392 | $ | 25,402 | $ | 24,061 | $ | 23,349 | ||||||||||
| Total Assets | 2,922,121 | 2,615,345 | 2,360,551 | 2,076,073 | 1,974,686 | |||||||||||||||
| Total Loans & Leases | 2,177,601 | 1,996,359 | 1,712,244 | 1,388,236 | 1,246,902 | |||||||||||||||
| Total Deposits | 2,581,711 | 2,277,532 | 2,064,073 | 1,807,691 | 1,722,026 | |||||||||||||||
| Total Shareholders’ Equity | 279,981 | 251,835 | 233,178 | 209,904 | 205,033 | |||||||||||||||
| Total Risk-Based Capital Ratio | 12.80 | % | 12.23 | % | 12.93 | % | 13.99 | % | 14.96 | % | ||||||||||
| Non-Performing Loans as a % of Total Loans | 0.14 | % | 0.11 | % | 0.13 | % | 0.19 | % | 0.74 | % | ||||||||||
| Substandard Loans as a % of Total Loans | 0.29 | % | 0.31 | % | 0.21 | % | 0.41 | % | 1.72 | % | ||||||||||
| Net (Recoveries) Charge-Offs to Average Loans | 0.00 | % | (0.30 | %) | 0.00 | % | 0.03 | % | 0.05 | % | ||||||||||
| Loan Loss Allowance as a % of Total Loans | 2.19 | % | 2.07 | % | 2.06 | % | 2.46 | % | 2.74 | % | ||||||||||
| Return on Average Assets | 1.12 | % | 1.12 | % | 1.17 | % | 1.21 | % | 1.22 | % | ||||||||||
| Return on Average Equity | 11.17 | % | 11.21 | % | 11.43 | % | 11.54 | % | 11.62 | % | ||||||||||
| Earnings Per Share | 37.44 | 34.82 | 32.64 | 30.93 | 29.99 | |||||||||||||||
| Cash Dividends Per Share | 13.10 | 12.90 | 12.70 | 12.50 | 12.10 | |||||||||||||||
| Cash Dividends Declared | 10,478 | 10,157 | 9,919 | 9,723 | 9,418 | |||||||||||||||
| Financial Performance Indicator | 2014 | 2013 | 2012 | 2011 | 2010 | |||||||||||||||
| Net Income | $ | 25,402 | $ | 24,062 | $ | 23,349 | $ | 22,209 | $ | 21,118 | ||||||||||
| Total Assets | 2,360,551 | 2,076,073 | 1,974,686 | 1,919,684 | 1,841,491 | |||||||||||||||
| Total Loans | 1,712,244 | 1,388,236 | 1,246,902 | 1,163,078 | 1,176,002 | |||||||||||||||
| Total Deposits | 2,064,073 | 1,807,691 | 1,722,026 | 1,626,197 | 1,566,503 | |||||||||||||||
| Total Shareholders’ Equity | 233,178 | 209,904 | 205,033 | 189,346 | 173,241 | |||||||||||||||
| Total Risk-Based Capital Ratio | 12.93 | % | 13.99 | % | 14.96 | % | 14.86 | % | 13.82 | % | ||||||||||
| Non-Performing Loans as a % of Total Loans | 0.13 | % | 0.19 | % | 0.74 | % | 0.36 | % | 0.45 | % | ||||||||||
| Substandard Loans as a % of Total Loans | 0.21 | % | 0.41 | % | 1.72 | % | 3.67 | % | 3.40 | % | ||||||||||
| Net Charge-Offs to Average Loans | 0.00 | % | 0.03 | % | 0.05 | % | 0.51 | % | 1.04 | % | ||||||||||
| Loan Loss Allowance as a % of Total Loans | 2.06 | % | 2.46 | % | 2.74 | % | 2.83 | % | 2.74 | % | ||||||||||
| Return on Average Assets | 1.17 | % | 1.21 | % | 1.22 | % | 1.19 | % | 1.19 | % | ||||||||||
| Return on Average Equity | 11.43 | % | 11.54 | % | 11.62 | % | 12.10 | % | 12.25 | % | ||||||||||
| Earnings Per Share | 32.64 | 30.93 | 29.99 | 28.49 | 27.05 | |||||||||||||||
| Cash Dividends Per Share | 12.70 | 12.50 | 12.10 | 11.75 | 11.35 | |||||||||||||||
| Cash Dividends Declared | 9,919 | 9,723 | 9,418 | 9,158 | 8,855 | |||||||||||||||
| # Shares Repurchased During Year | - | - | 1,542 | - | 1,520 | |||||||||||||||
| Average Share Price of Repurchased Shares | - | - | 373 | - | 400 | |||||||||||||||
| High Stock Price – Fourth Quarter | 466 | 417 | 405 | 400 | 425 | |||||||||||||||
| Low Stock Price – Fourth Quarter | 450 | 405 | 355 | 345 | 400 | |||||||||||||||
| Closing Stock Price – Fourth Quarter | 463 | 417 | 405 | 400 | 415 | |||||||||||||||
| · | Net income over the five-year period totaled |
| · | Return on Average Assets |
| · | Total assets increased |
| · | Total loans & leases increased |
| · | Total deposits increased |
More recently:
| · | In |
| · | In |
| · | The Company’s total risk based capital ratio was |
| · | The Company |
| · | Despite continuing |
Looking Forward: 20152017 and Beyond
In management’s opinion, the following key issues will continue to influence the financial results of the Company in 20152017 and future years:
| · | The Company’s earnings are heavily dependent on its net interest margin, which is sensitive to such factors as: (1) market interest rates; (2) the mix of our earning assets and interest-bearing liabilities; and (3) competitor pricing strategies. |
| - | During both the |
| - |
| - | Aggressive competitor pricing for loans, leases and deposits |
The combination of sustained low market interest rates and aggressive competitor pricing has caused the Company’s net interest margin to decline from 4.89% ina high of 5.18% for the second quarter of 2007year ended December 31, 2006 to 4.14% in3.89% for the fourth quarter of 2014. The Company expects manyyear ended December 31, 2016. Many of these factors tomay continue to pushadversely affect the net interest margin lower in 2015.2017. See “Item 7A. Quantitative and Qualitative Disclosures About Market Risk - Interest Rate Risk.”
| · | The Company’s results are impacted by changes in the credit quality of its borrowers. Substandard loans & leases totaled |
| · | FDIC deposit insurance expense for the years 2016, 2015, and 2014 |
| · | During 2016 Congress and the former Obama Administration |
| · | The Company has (i) expanded its geographic footprint |
Results of Operations
The following discussion and analysis is intended to provide a better understanding of Farmers & Merchants Bancorp and its subsidiaries’ performance during each of the years in the three-year period ended December 31, 2014,2016, and the material changes in financial condition, operating income, and expense of the Company and its subsidiaries as shown in the accompanying financial statements.
Impact of Delta National Bancorp Acquisition on Results of Operations
On November 18, 2016, Farmers & Merchants Bancorp completed the acquisition of Delta National Bancorp. Since the acquisition took place late in the year, and Delta National Bancorp had only $112 million in assets (less than 4% of Farmers & Merchants Bancorp’s total assets), the post-acquisition impact on the Company’s 2016 Results of Operations was immaterial with the exception of a Bargain Purchase Gain of $1.83 million that was booked as non-interest income and $910,000 in acquisition expenses that were booked as non-interest expense (see Note 2, located in “Item 8. Financial Statements and Supplementary Data”). Accordingly, limited discussion of the acquisition’s impact on operating income and expense will be included in the following discussion.
Net Interest Income/Net Interest Margin
The tables on the following pages reflect the Company's average balance sheets and volume and rate analysis for the years ending 2014, 2013,2016, 2015, and 2012.2014. Average balance amounts for assets and liabilities are the computed average of daily balances.
Net interest income is the amount by which the interest and fees on loans & leases and other interest-earning assets exceed the interest paid on interest-bearing sources of funds. For the purpose of analysis, the interest earned on tax-exempt investments and municipal loans is adjusted to an amount comparable to interest subject to normal income taxes. This adjustment is referred to as “tax equivalent” adjustment and is noted wherever applicable. The presentation of net interest income and net interest margin on a tax equivalent basis is a common practice within the banking industry.
The Volume and Rate Analysis of Net Interest Income summarizes the changes in interest income and interest expense based on changes in average asset and liability balances (volume) and changes in average rates (rate). For each category of interest-earning assets and interest-bearing liabilities, information is provided with respect to changes attributable to: (1) changes in volume (change in volume multiplied by initial rate); (2) changes in rate (change in rate multiplied by initial volume); and (3) changes in rate/volume (allocated in proportion to the respective volume and rate components).
The Company’s earning assets and rate sensitive liabilities are subject to repricing at different times, which exposes the Company to income fluctuations when interest rates change. In order to minimize income fluctuations, the Company attempts to match asset and liability maturities. However, some maturity mismatch is inherent in the asset and liability mix. See “Item 7A. Quantitative and Qualitative Disclosures About Market Risk - Interest Rate Risk.”
Farmers & Merchants Bancorp
Year-to-Date Average Balances and Interest Rates
(Interest and Rates on a Taxable Equivalent Basis)
(in thousands)
| Year Ended December 31, 2016 | ||||||||||||
| Assets | Balance | Interest | Rate | |||||||||
| Interest Bearing Deposits with Banks | $ | 53,659 | $ | 287 | 0.53 | % | ||||||
| Investment Securities: | ||||||||||||
| U.S. Treasuries | 60,191 | 572 | 0.95 | % | ||||||||
| U.S. Govt SBA | 2,323 | 55 | 2.37 | % | ||||||||
| Government Agency & Government-Sponsored Entities | 25,624 | 197 | 0.77 | % | ||||||||
| Obligations of States and Political Subdivisions - Non-Taxable | 60,332 | 2,920 | 4.84 | % | ||||||||
| Mortgage Backed Securities | 215,528 | 4,663 | 2.16 | % | ||||||||
| Other | 781 | 18 | 2.30 | % | ||||||||
| Total Investment Securities | 364,779 | 8,425 | 2.31 | % | ||||||||
| Loans & Leases | ||||||||||||
| Real Estate | 1,460,300 | 66,969 | 4.59 | % | ||||||||
| Home Equity Lines and Loans | 31,939 | 1,562 | 4.89 | % | ||||||||
| Agricultural | 266,053 | 10,908 | 4.10 | % | ||||||||
| Commercial | 216,593 | 8,886 | 4.10 | % | ||||||||
| Consumer | 4,987 | 307 | 6.16 | % | ||||||||
| Other | 1,943 | 44 | 2.26 | % | ||||||||
| Leases | 68,353 | 2,894 | 4.23 | % | ||||||||
| Total Loans & Leases | 2,050,168 | 91,570 | 4.47 | % | ||||||||
| Total Earning Assets | 2,468,606 | $ | 100,282 | 4.06 | % | |||||||
| Unrealized Gain on Securities Available-for-Sale | 4,895 | |||||||||||
| Allowance for Credit Losses | (43,684 | ) | ||||||||||
| Cash and Due From Banks | 44,385 | |||||||||||
| All Other Assets | 173,313 | |||||||||||
| Total Assets | $ | 2,647,515 | ||||||||||
| Liabilities & Shareholders' Equity | ||||||||||||
| Interest Bearing Deposits | ||||||||||||
| Interest Bearing DDA | $ | 423,305 | $ | 526 | 0.12 | % | ||||||
| Savings and Money Market | 725,127 | 1,087 | 0.15 | % | ||||||||
| Time Deposits | 513,105 | 2,194 | 0.43 | % | ||||||||
| Total Interest Bearing Deposits | 1,661,537 | 3,807 | 0.23 | % | ||||||||
| Federal Home Loan Bank Advances | 3,924 | 18 | 0.46 | % | ||||||||
| Subordinated Debt | 10,310 | 371 | 3.60 | % | ||||||||
| Total Interest Bearing Liabilities | 1,675,771 | $ | 4,196 | 0.25 | % | |||||||
| Interest Rate Spread | 3.81 | % | ||||||||||
| Demand Deposits | 651,709 | |||||||||||
| All Other Liabilities | 53,950 | |||||||||||
| Total Liabilities | 2,381,430 | |||||||||||
| Shareholders' Equity | 266,085 | |||||||||||
| Total Liabilities & Shareholders' Equity | $ | 2,647,515 | ||||||||||
| Impact of Non-Interest Bearing Deposits and Other Liabilities | 0.08 | % | ||||||||||
| Net Interest Income and Margin on Total Earning Assets | 96,086 | 3.89 | % | |||||||||
| Tax Equivalent Adjustment | (1,016 | ) | ||||||||||
| Net Interest Income | $ | 95,070 | 3.85 | % | ||||||||
Notes: Yields on municipal securities have been calculated on a fully taxable equivalent basis. Loan interest income includes fee income and unearned discount in the amount of $5.1 million for the year ended December 31, 2016. Non-accrual loans and lease financing receivables have been included in the average balances. Yields on securities available-for-sale are based on historical cost.
Farmers & Merchants Bancorp
Year-to-Date Average Balances and Interest Rates
(Interest and Rates on a Taxable Equivalent Basis)
(in thousands)
| Year Ended December 31, 2015 | ||||||||||||
| Assets | Balance | Interest | Rate | |||||||||
| Interest Bearing Deposits with Banks | $ | 66,729 | $ | 172 | 0.26 | % | ||||||
| Investment Securities: | ||||||||||||
| U.S. Treasuries | 34,040 | 451 | 1.32 | % | ||||||||
| Government Agency & Government-Sponsored Entities | 36,882 | 185 | 0.50 | % | ||||||||
| Obligations of States and Political Subdivisions - Non-Taxable | 62,016 | 3,121 | 5.03 | % | ||||||||
| Mortgage Backed Securities | 260,579 | 5,641 | 2.16 | % | ||||||||
| Other | 5,323 | 34 | 0.64 | % | ||||||||
| Total Investment Securities | 398,840 | 9,432 | 2.36 | % | ||||||||
| Loans & Leases | ||||||||||||
| Real Estate | 1,251,061 | 58,701 | 4.69 | % | ||||||||
| Home Equity Lines and Loans | 31,918 | 1,709 | 5.35 | % | ||||||||
| Agricultural | 229,850 | 9,201 | 4.00 | % | ||||||||
| Commercial | 229,449 | 9,374 | 4.09 | % | ||||||||
| Consumer | 4,820 | 266 | 5.52 | % | ||||||||
| Other | 604 | 14 | 2.32 | % | ||||||||
| Leases | 54,763 | 2,293 | 4.19 | % | ||||||||
| Total Loans & Leases | 1,802,465 | 81,558 | 4.52 | % | ||||||||
| Total Earning Assets | 2,268,034 | $ | 91,162 | 4.02 | % | |||||||
| Unrealized Gain on Securities Available-for-Sale | 4,483 | |||||||||||
| Allowance for Credit Losses | (38,560 | ) | ||||||||||
| Cash and Due From Banks | 38,419 | |||||||||||
| All Other Assets | 165,348 | |||||||||||
| Total Assets | $ | 2,437,724 | ||||||||||
| Liabilities & Shareholders' Equity | ||||||||||||
| Interest Bearing Deposits | ||||||||||||
| Interest Bearing DDA | $ | 350,917 | $ | 243 | 0.07 | % | ||||||
| Savings and Money Market | 690,561 | 1,155 | 0.17 | % | ||||||||
| Time Deposits | 487,560 | 1,591 | 0.33 | % | ||||||||
| Total Interest Bearing Deposits | 1,529,038 | 2,989 | 0.20 | % | ||||||||
| Federal Home Loan Bank Advances | 3,937 | 7 | 0.18 | % | ||||||||
| Subordinated Debt | 10,310 | 329 | 3.19 | % | ||||||||
| Total Interest Bearing Liabilities | 1,543,285 | $ | 3,325 | 0.22 | % | |||||||
| Interest Rate Spread | 3.80 | % | ||||||||||
| Demand Deposits | 605,592 | |||||||||||
| All Other Liabilities | 44,476 | |||||||||||
| Total Liabilities | 2,193,353 | |||||||||||
| Shareholders' Equity | 244,371 | |||||||||||
| Total Liabilities & Shareholders' Equity | $ | 2,437,724 | ||||||||||
| Impact of Non-Interest Bearing Deposits and Other Liabilities | 0.07 | % | ||||||||||
| Net Interest Income and Margin on Total Earning Assets | 87,837 | 3.87 | % | |||||||||
| Tax Equivalent Adjustment | (1,087 | ) | ||||||||||
| Net Interest Income | $ | 86,750 | 3.82 | % | ||||||||
Notes: Yields on municipal securities have been calculated on a fully taxable equivalent basis. Loan interest income includes fee income and unearned discount in the amount of $5.7 million for the year ended December 31, 2015. Non-accrual loans and lease financing receivables have been included in the average balances. Yields on securities available-for-sale are based on historical cost.
Farmers & Merchants Bancorp
Year-to-Date Average Balances and Interest Rates
(Interest and Rates on a Taxable Equivalent Basis)
(in thousands)
| Year Ended December 31, 2014 | ||||||||||||
| Assets | Balance | Interest | Rate | |||||||||
| Interest Bearing Deposits with Banks | $ | 62,452 | $ | 158 | 0.25 | % | ||||||
| Investment Securities: | ||||||||||||
| Government Agency & Government-Sponsored Entities | 18,383 | 186 | 1.01 | % | ||||||||
| Obligations of States and Political Subdivisions - Non-Taxable | 65,202 | 3,552 | 5.45 | % | ||||||||
| Mortgage Backed Securities | 314,293 | 7,174 | 2.28 | % | ||||||||
| Other | 36,643 | 379 | 1.03 | % | ||||||||
| Total Investment Securities | 434,521 | 11,291 | 2.60 | % | ||||||||
| Loans & Leases | ||||||||||||
| Real Estate | 1,027,795 | 49,914 | 4.86 | % | ||||||||
| Home Equity Lines and Loans | 34,017 | 1,881 | 5.53 | % | ||||||||
| Agricultural | 224,859 | 8,997 | 4.00 | % | ||||||||
| Commercial | 179,420 | 8,655 | 4.82 | % | ||||||||
| Consumer | 5,143 | 307 | 5.97 | % | ||||||||
| Other | 17 | 1 | 5.88 | % | ||||||||
| Leases | 28,136 | 1,555 | 5.53 | % | ||||||||
| Total Loans & Leases | 1,499,387 | 71,310 | 4.76 | % | ||||||||
| Total Earning Assets | 1,996,360 | $ | 82,759 | 4.15 | % | |||||||
| Unrealized Gain on Securities Available-for-Sale | 1,462 | |||||||||||
| Allowance for Credit Losses | (34,316 | ) | ||||||||||
| Cash and Due From Banks | 32,219 | |||||||||||
| All Other Assets | 166,860 | |||||||||||
| Total Assets | $ | 2,162,585 | ||||||||||
| Liabilities & Shareholders' Equity | ||||||||||||
| Interest Bearing Deposits | ||||||||||||
| Interest Bearing DDA | $ | 311,911 | $ | 167 | 0.05 | % | ||||||
| Savings and Money Market | 627,129 | 1,051 | 0.17 | % | ||||||||
| Time Deposits | 430,968 | 1,268 | 0.29 | % | ||||||||
| Total Interest Bearing Deposits | 1,370,008 | 2,486 | 0.18 | % | ||||||||
| Federal Home Loan Bank Advances | 3,643 | 5 | 0.14 | % | ||||||||
| Subordinated Debt | 10,310 | 322 | 3.12 | % | ||||||||
| Total Interest Bearing Liabilities | 1,383,961 | $ | 2,813 | 0.20 | % | |||||||
| Interest Rate Spread | 3.94 | % | ||||||||||
| Demand Deposits | 504,470 | |||||||||||
| All Other Liabilities | 51,946 | |||||||||||
| Total Liabilities | 1,940,377 | |||||||||||
| Shareholders' Equity | 222,208 | |||||||||||
| Total Liabilities & Shareholders' Equity | $ | 2,162,585 | ||||||||||
| Impact of Non-Interest Bearing Deposits and Other Liabilities | 0.06 | % | ||||||||||
| Net Interest Income and Margin on Total Earning Assets | 79,946 | 4.00 | % | |||||||||
| Tax Equivalent Adjustment | (1,238 | ) | ||||||||||
| Net Interest Income | $ | 78,708 | 3.94 | % | ||||||||
Notes: Yields on municipal securities have been calculated on a fully taxable equivalent basis. Loan interest income includes fee income and unearned discount in the amount of $5.1 million for the year ended December 31, 2014. Non-accrual loans and lease financing receivables have been included in the average balances. Yields on securities available-for-sale are based on historical cost.
| Year Ended December 31, 2013 | ||||||||||||
| Assets | Balance | Interest | Rate | |||||||||
| Interest Bearing Deposits with Banks | $ | 30,743 | $ | 79 | 0.26 | % | ||||||
| Investment Securities: | ||||||||||||
| Government Agency & Government-Sponsored Entities | 28,033 | 256 | 0.91 | % | ||||||||
| Obligations of States and Political Subdivisions - Non-Taxable | 68,832 | 3,929 | 5.71 | % | ||||||||
| Mortgage Backed Securities | 374,927 | 8,117 | 2.16 | % | ||||||||
| Other | 52,318 | 598 | 1.14 | % | ||||||||
| Total Investment Securities | 524,110 | 12,900 | 2.46 | % | ||||||||
| Loans & Leases | ||||||||||||
| Real Estate | 868,855 | 46,056 | 5.30 | % | ||||||||
| Home Equity Lines and Loans | 38,293 | 2,187 | 5.71 | % | ||||||||
| Agricultural | 204,103 | 8,715 | 4.27 | % | ||||||||
| Commercial | 150,456 | 7,546 | 5.02 | % | ||||||||
| Consumer | 4,888 | 313 | 6.40 | % | ||||||||
| Other | 230 | 13 | 5.65 | % | ||||||||
| Leases | 2,507 | 91 | 3.63 | % | ||||||||
| Total Loans & Leases | 1,269,332 | 64,921 | 5.11 | % | ||||||||
| Total Earning Assets | 1,824,185 | $ | 77,900 | 4.27 | % | |||||||
| Unrealized Gain on Securities Available-for-Sale | 3,453 | |||||||||||
| Allowance for Credit Losses | (34,227 | ) | ||||||||||
| Cash and Due From Banks | 33,648 | |||||||||||
| All Other Assets | 155,715 | |||||||||||
| Total Assets | $ | 1,982,774 | ||||||||||
| Liabilities & Shareholders' Equity | ||||||||||||
| Interest Bearing Deposits | ||||||||||||
| Interest Bearing DDA | $ | 259,348 | $ | 119 | 0.05 | % | ||||||
| Savings and Money Market | 577,214 | 947 | 0.16 | % | ||||||||
| Time Deposits | 444,605 | 1,482 | 0.33 | % | ||||||||
| Total Interest Bearing Deposits | 1,281,167 | 2,548 | 0.20 | % | ||||||||
| Other Borrowed Funds | 12,265 | 16 | 0.13 | % | ||||||||
| Subordinated Debt | 10,310 | 327 | 3.17 | % | ||||||||
| Total Interest Bearing Liabilities | 1,303,742 | $ | 2,891 | 0.22 | % | |||||||
| Interest Rate Spread | 4.05 | % | ||||||||||
| Demand Deposits | 427,673 | |||||||||||
| All Other Liabilities | 42,783 | |||||||||||
| Total Liabilities | 1,774,198 | |||||||||||
| Shareholders' Equity | 208,576 | |||||||||||
| Total Liabilities & Shareholders' Equity | $ | 1,982,774 | ||||||||||
| Impact of Non-Interest Bearing Deposits and Other Liabilities | 0.06 | % | ||||||||||
| Net Interest Income and Margin on Total Earning Assets | 75,009 | 4.11 | % | |||||||||
| Tax Equivalent Adjustment | (1,369 | ) | ||||||||||
| Net Interest Income | $ | 73,640 | 4.04 | % | ||||||||
| Year Ended December 31, 2012 | ||||||||||||
| Assets | Balance | Interest | Rate | |||||||||
| Interest Bearing Deposits with Banks | $ | 43,351 | $ | 110 | 0.25 | % | ||||||
| Investment Securities: | ||||||||||||
| Government Agency & Government-Sponsored Entities | 56,396 | 577 | 1.02 | % | ||||||||
| Obligations of States and Political Subdivisions - Non-Taxable | 70,432 | 4,047 | 5.75 | % | ||||||||
| Mortgage Backed Securities | 399,121 | 9,182 | 2.30 | % | ||||||||
| Other | 15,358 | 182 | 1.19 | % | ||||||||
| Total Investment Securities | 541,307 | 13,988 | 2.58 | % | ||||||||
| Loans | ||||||||||||
| Real Estate | 767,555 | 44,329 | 5.78 | % | ||||||||
| Home Equity Lines and Loans | 46,405 | 2,656 | 5.72 | % | ||||||||
| Agricultural | 200,040 | 9,888 | 4.94 | % | ||||||||
| Commercial | 163,089 | 8,455 | 5.18 | % | ||||||||
| Consumer | 5,820 | 456 | 7.84 | % | ||||||||
| Other | 237 | 13 | 5.49 | % | ||||||||
| Total Loans | 1,183,146 | 65,797 | 5.56 | % | ||||||||
| Total Earning Assets | 1,767,804 | $ | 79,895 | 4.52 | % | |||||||
| Unrealized Gain on Securities Available-for-Sale | 12,116 | |||||||||||
| Allowance for Loan Losses | (33,248 | ) | ||||||||||
| Cash and Due From Banks | 33,941 | |||||||||||
| All Other Assets | 140,998 | |||||||||||
| Total Assets | $ | 1,921,611 | ||||||||||
| Liabilities & Shareholders' Equity | ||||||||||||
| Interest Bearing Deposits | ||||||||||||
| Interest Bearing DDA | $ | 231,813 | $ | 167 | 0.07 | % | ||||||
| Savings and Money Market | 540,063 | 1,281 | 0.24 | % | ||||||||
| Time Deposits | 496,327 | 2,291 | 0.46 | % | ||||||||
| Total Interest Bearing Deposits | 1,268,203 | 3,739 | 0.29 | % | ||||||||
| Securities Sold Under Agreement to Repurchase | 28,197 | 1,018 | 3.61 | % | ||||||||
| Other Borrowed Funds | 3,698 | 36 | 0.97 | % | ||||||||
| Subordinated Debt | 10,310 | 347 | 3.37 | % | ||||||||
| Total Interest Bearing Liabilities | 1,310,408 | $ | 5,140 | 0.39 | % | |||||||
| Interest Rate Spread | 4.13 | % | ||||||||||
| Demand Deposits | 374,677 | |||||||||||
| All Other Liabilities | 35,631 | |||||||||||
| Total Liabilities | 1,720,716 | |||||||||||
| Shareholders' Equity | 200,895 | |||||||||||
| Total Liabilities & Shareholders' Equity | $ | 1,921,611 | ||||||||||
| Impact of Non-Interest Bearing Deposits and Other Liabilities | 0.10 | % | ||||||||||
| Net Interest Income and Margin on Total Earning Assets | 74,755 | 4.23 | % | |||||||||
| Tax Equivalent Adjustment | (1,404 | ) | ||||||||||
| Net Interest Income | $ | 73,351 | 4.15 | % | ||||||||
Farmers & Merchants Bancorp
Volume and Rate Analysis of Net Interest Revenue
| (Interest and Rates on a Taxable Equivalent Basis) | 2014 versus 2013 | |||||||||||
| (in thousands) | Amount of Increase | |||||||||||
| (Decrease) Due to Change in: | ||||||||||||
| Interest Earning Assets | Volume | Rate | Net Chg. | |||||||||
| Interest Bearing Deposits with Banks | $ | 80 | $ | (1 | ) | $ | 79 | |||||
| Investment Securities: | ||||||||||||
| Government Agency & Government-Sponsored Entities | (96 | ) | 26 | (70 | ) | |||||||
| Obligations of States and Political Subdivisions - Non-Taxable | (202 | ) | (175 | ) | (377 | ) | ||||||
| Mortgage Backed Securities | (1,366 | ) | 423 | (943 | ) | |||||||
| Other | (166 | ) | (53 | ) | (219 | ) | ||||||
| Total Investment Securities | (1,830 | ) | 221 | (1,609 | ) | |||||||
| Loans & Leases: | ||||||||||||
| Real Estate | 7,941 | (4,083 | ) | 3,858 | ||||||||
| Home Equity Lines and Loans | (238 | ) | (68 | ) | (306 | ) | ||||||
| Agricultural | 851 | (569 | ) | 282 | ||||||||
| Commercial | 1,406 | (297 | ) | 1,109 | ||||||||
| Consumer | 16 | (22 | ) | (6 | ) | |||||||
| Other | (13 | ) | 1 | (12 | ) | |||||||
| Leases | 1,392 | 72 | 1,464 | |||||||||
| Total Loans & Leases | 11,355 | (4,966 | ) | 6,389 | ||||||||
| Total Earning Assets | 9,605 | (4,746 | ) | 4,859 | ||||||||
| Interest Bearing Liabilities | ||||||||||||
| Interest Bearing Deposits: | ||||||||||||
| Interest Bearing DDA | 26 | 22 | 48 | |||||||||
| Savings and Money Market | 84 | 20 | 104 | |||||||||
| Time Deposits | (44 | ) | (170 | ) | (214 | ) | ||||||
| Total Interest Bearing Deposits | 66 | (128 | ) | (62 | ) | |||||||
| Other Borrowed Funds | (12 | ) | 1 | (11 | ) | |||||||
| Subordinated Debt | - | (5 | ) | (5 | ) | |||||||
| Total Interest Bearing Liabilities | 54 | (132 | ) | (78 | ) | |||||||
| Total Change | $ | 9,551 | $ | (4,614 | ) | $ | 4,937 | |||||
(Interest and Rates on a Taxable Equivalent Basis) (in thousands) | 2016 versus 2015 Amount of Increase (Decrease) Due to Change in: | |||||||||||
| Interest Earning Assets | Volume | Rate | Net Chg. | |||||||||
| Interest Bearing Deposits with Banks | $ | (40 | ) | $ | 155 | $ | 115 | |||||
| Investment Securities: | ||||||||||||
| U.S. Treasuries | 275 | (154 | ) | 121 | ||||||||
| U.S. Govt SBA | 55 | - | 55 | |||||||||
| Government Agency & Government-Sponsored Entities | (68 | ) | 80 | 12 | ||||||||
| Municipals - Taxable | - | - | - | |||||||||
| Obligations of States and Political Subdivisions - Non-Taxable | (83 | ) | (118 | ) | (201 | ) | ||||||
| Mortgage Backed Securities | (975 | ) | (3 | ) | (978 | ) | ||||||
| Other | (48 | ) | 32 | (16 | ) | |||||||
| Total Investment Securities | (844 | ) | (163 | ) | (1,007 | ) | ||||||
| Loans & Leases: | ||||||||||||
| Real Estate | 9,622 | (1,355 | ) | 8,267 | ||||||||
| Home Equity Lines and Loans | 1 | (148 | ) | (147 | ) | |||||||
| Agricultural | 1,479 | 228 | 1,707 | |||||||||
| Commercial | (527 | ) | 39 | (488 | ) | |||||||
| Consumer | 9 | 32 | 41 | |||||||||
| Other | 30 | - | 30 | |||||||||
| Leases | 575 | 26 | 601 | |||||||||
| Total Loans & Leases | 11,189 | (1,178 | ) | 10,011 | ||||||||
| Total Earning Assets | 10,305 | (1,186 | ) | 9,119 | ||||||||
| Interest Bearing Liabilities | ||||||||||||
| Interest Bearing Deposits: | ||||||||||||
| Interest Bearing DDA | 58 | 225 | 283 | |||||||||
| Savings and Money Market | 56 | (124 | ) | (68 | ) | |||||||
| Time Deposits | 87 | 516 | 603 | |||||||||
| Total Interest Bearing Deposits | 201 | 617 | 818 | |||||||||
| Other Borrowed Funds | - | 11 | 11 | |||||||||
| Subordinated Debt | - | 42 | 42 | |||||||||
| Total Interest Bearing Liabilities | 201 | 670 | 871 | |||||||||
| Total Change | $ | 10,104 | $ | (1,856 | ) | $ | 8,248 | |||||
| (Interest and Rates on a Taxable Equivalent Basis) | 2013 versus 2012 | |||||||||||
| (in thousands) | Amount of Increase | |||||||||||
| (Decrease) Due to Change in: | ||||||||||||
| Interest Earning Assets | Volume | Rate | Net Chg. | |||||||||
| Interest Bearing Deposits with Banks | $ | (32 | ) | $ | 1 | $ | (31 | ) | ||||
| Investment Securities: | ||||||||||||
| Government Agency & Government-Sponsored Entities | (264 | ) | (57 | ) | (321 | ) | ||||||
| Obligations of States and Political Subdivisions - Non-Taxable | (92 | ) | (27 | ) | (119 | ) | ||||||
| Mortgage Backed Securities | (540 | ) | (525 | ) | (1,065 | ) | ||||||
| Other | 422 | (6 | ) | 416 | ||||||||
| Total Investment Securities | (474 | ) | (615 | ) | (1,089 | ) | ||||||
| Loans & Leases: | ||||||||||||
| Real Estate | 5,554 | (3,827 | ) | 1,727 | ||||||||
| Home Equity Lines and Loans | (463 | ) | (6 | ) | (469 | ) | ||||||
| Agricultural | 197 | (1,370 | ) | (1,173 | ) | |||||||
| Commercial | (640 | ) | (269 | ) | (909 | ) | ||||||
| Consumer | (67 | ) | (76 | ) | (143 | ) | ||||||
| Leases | 91 | - | 91 | |||||||||
| Total Loans & Leases | 4,672 | (5,548 | ) | (876 | ) | |||||||
| Total Earning Assets | 4,166 | (6,162 | ) | (1,996 | ) | |||||||
| Interest Bearing Liabilities | ||||||||||||
| Interest Bearing Deposits: | ||||||||||||
| Interest Bearing DDA | 18 | (66 | ) | (48 | ) | |||||||
| Savings and Money Market | 83 | (417 | ) | (334 | ) | |||||||
| Time Deposits | (221 | ) | (588 | ) | (809 | ) | ||||||
| Total Interest Bearing Deposits | (120 | ) | (1,071 | ) | (1,191 | ) | ||||||
| Securities Sold Under Agreement to Repurchase | (1,018 | ) | - | (1,018 | ) | |||||||
| Other Borrowed Funds | 30 | (50 | ) | (20 | ) | |||||||
| Subordinated Debt | - | (20 | ) | (20 | ) | |||||||
| Total Interest Bearing Liabilities | (1,108 | ) | (1,141 | ) | (2,249 | ) | ||||||
| Total Change | $ | 5,274 | $ | (5,021 | ) | $ | 253 | |||||
Notes: Rate/volume variance is allocated based on the percentage relationship of changes in volume and changes in rate to the total "net change." The above figures have been rounded to the nearest whole number.
Farmers & Merchants Bancorp
Volume and Rate Analysis of Net Interest Revenue
(Interest and Rates on a Taxable Equivalent Basis) (in thousands) | 2015 versus 2014 Amount of Increase (Decrease) Due to Change in: | |||||||||||
| Interest Earning Assets | Volume | Rate | Net Chg. | |||||||||
| Interest Bearing Deposits with Banks | $ | 11 | $ | 3 | $ | 14 | ||||||
| Investment Securities: | ||||||||||||
| U.S. Treasuries | 451 | - | 451 | |||||||||
| Government Agency & Government-Sponsored Entities | 124 | (125 | ) | (1 | ) | |||||||
| Obligations of States and Political Subdivisions - Non-Taxable | (169 | ) | (262 | ) | (431 | ) | ||||||
| Mortgage Backed Securities | (1,177 | ) | (356 | ) | (1,533 | ) | ||||||
| Other | (238 | ) | (107 | ) | (345 | ) | ||||||
| Total Investment Securities | (1,009 | ) | (850 | ) | (1,859 | ) | ||||||
| Loans & Leases: | ||||||||||||
| Real Estate | 10,526 | (1,739 | ) | 8,787 | ||||||||
| Home Equity Lines and Loans | (114 | ) | (58 | ) | (172 | ) | ||||||
| Agricultural | 200 | 4 | 204 | |||||||||
| Commercial | 2,175 | (1,456 | ) | 719 | ||||||||
| Consumer | (18 | ) | (23 | ) | (41 | ) | ||||||
| Other | 14 | (1 | ) | 13 | ||||||||
| Leases | 1,188 | (450 | ) | 738 | ||||||||
| Total Loans & Leases | 13,971 | (3,723 | ) | 10,248 | ||||||||
| Total Earning Assets | 12,973 | (4,570 | ) | 8,403 | ||||||||
| Interest Bearing Liabilities | ||||||||||||
| Interest Bearing Deposits: | ||||||||||||
| Interest Bearing DDA | 23 | 53 | 76 | |||||||||
| Savings and Money Market | 106 | (2 | ) | 104 | ||||||||
| Time Deposits | 177 | 146 | 323 | |||||||||
| Total Interest Bearing Deposits | 306 | 197 | 503 | |||||||||
| Other Borrowed Funds | 1 | 1 | 2 | |||||||||
| Subordinated Debt | - | 7 | 7 | |||||||||
| Total Interest Bearing Liabilities | 307 | 205 | 512 | |||||||||
| Total Change | $ | 12,666 | $ | (4,775 | ) | $ | 7,891 | |||||
Notes: Rate/volume variance is allocated based on the percentage relationship of changes in volume and changes in rate to the total "net change." The above figures have been rounded to the nearest whole number.
Net interest income increased 6.9%9.6% to $78.7$95.1 million during 2014.2016. On a fully tax equivalent basis, net interest income increased 6.6%9.4% and totaled $79.9$96.1 million during 20142016 compared to $75.0$87.8 million for 2013.2015. As more fully discussed below, the increase in net interest income was primarily due to an increase in average earning assets offsetassisted somewhat by a decreasesmall increase in the net interest margin.
Net interest income on a tax equivalent basis, expressed as a percentage of average total earning assets, is referred to as the net interest margin. For 2014,2016, the Company’s net interest margin was 4.00%3.89% compared to 4.11%3.87% in 2013.2015. This decreaseincrease in net interest margin was due primarily to declining yields on earning assets that exceeded a corresponding drop in funding costs, offset somewhat by an increase in the mix of loans &and leases as a percentage of total earning assets.
Average loans & leases totaled $1.5$2.1 billion for the year ended December 31, 2014;2016; an increase of $230.1$247.7 million compared to the year ended December 31, 2013.2015. Loans & leases increased from 69.6%79.5% of average earning assets during 20132015 to 75.1%83.1% in 2014. Because of the impact of decreases in market interest rates from mid-September 2007 through December 2008, and the continuing low rate environment since then, the2016. The year-to-date yield on the loan & lease portfolio declined to 4.76%4.47% for the year ended December 31, 2014,2016, compared to 5.11%4.52% for the year ended December 31, 2013.2015. This lower yield partially offset the impact of an increase in average loan & lease balances but still resulted in interest revenue from loans & leases increasing 9.8%12.3% to $71.3$91.6 million for 2014.2016. The Company has been experiencingcontinues to experience aggressive competitor pricing for loans & leases to which it may need to continue to respond in order to retain key customers. This could place even greatercontinuing negative pressure on future loan & lease yields and net interest margin.
The investment portfolio is the other main component of the Company’s earning assets. Historically, the Company invested primarily in: (1) mortgage-backed securities issued by government-sponsored entities; (2) debt securities issued by the U.S. Treasury, government agencies and government-sponsored entities; and (3) investment grade bank-qualified municipal bonds. However, during 2012, when loan demand lagged deposit growth, resulting in significant liquidity,at certain times the Company began to selectively addadded investment grade corporate securities (floating rate and fixed rate with maturities less than 5 years) to the portfolio in order to obtain yields that exceed government agency securities of equivalent maturity without subjecting the Company to the interest rate risk associated with mortgage-backed securities. Since the risk factor for these types of investments is generally lower than that of loans & leases, the yield earned on investments is generally less than that of loans & leases.
Average investment securities decreased $89.6$34.1 million in 20142016 compared to the average balance during 2013.2015. As a result, tax equivalent interest income on securities decreased $1.6$1.0 million to $11.3$8.4 million for the year ended December 31, 2014,2016, compared to $12.9$9.4 million for the year ended December 31, 2013.2015. The average yield, on a tax equivalent basis, in the investment portfolio was 2.60%2.31% in 20142016 compared to 2.46%2.36% in 2013.2015. This overall increasedecrease in yield was caused primarily by a decrease in the mix of corporatemortgage-backed securities as a percentage of total securities and an increase in the yield on the Company’s mortgage-backed securities portfolio due to the salemix of certain lower yielding MBS.short-term U.S. Treasury securities. See “Financial Condition – Investment Securities” for a discussion of the Company’s investment strategy in 2014.2016. Net interest income on the Schedule of Year-to-Date Average Balances and Interest Rates is shown on a tax equivalent basis, which is higher than net interest income as reflected on the Consolidated Statements of Income because of adjustments that relate to income on securities that are exempt from federal income taxes.
Interest-bearing deposits with banks and overnight investments in Federal Funds Sold are additional earning assets available to the Company. Average interest-bearing deposits with banks consisted primarily of FRB deposits. Balances with the FRB earn interest at the Fed Funds rate, which has been 0.25% sinceincreased to 0.75% in December 2008.2016. Average interest-bearing deposits with banks for the year ended December 31, 2014,2016, was $62.5$53.7 million, an increasea decrease of $31.7$13.1 million compared to the average balance for the year ended December 31, 2013.2015. Interest income on interest-bearing deposits with banks for the year ended December 31, 2014,2016, increased $79,000$115,000 to $158,000$287,000 from the year ended December 31, 2013.2015.
Average interest-bearing liabilities increased $80.2$132.5 million or 6.2%8.9% during the twelve months ended December 31, 2014. Of that increase: (1) interest-bearing deposits increased $88.8 million; (2) FHLB Advances decreased $8.6 million; and (3) subordinated debt remained unchanged.
36
Net interest income increased 0.4%10.2% to $73.6$86.8 million during 2013.2015. On a fully tax equivalent basis, net interest income increased 0.3%9.9% and totaled $75.0$87.8 million during 20132015 compared to $74.8$79.9 million for 2012.2014. As more fully discussed below, the increase in net interest income was primarily due to an increase in average earning assets offset somewhat by a decrease in the net interest margin.
Net interest income on a tax equivalent basis, expressed as a percentage of average total earning assets, is referred to as the net interest margin. For 2013,2015, the Company’s net interest margin was 4.11%3.87% compared to 4.23%4.00% in 2012.2014. This decrease in net interest margin was due primarily to declining yields on earning assets that exceededin addition to a corresponding dropsmall increase in funding costs, offset somewhat by an increase in the mix of loans & leases as a percentage of total earning assets.
Average loans & leases totaled $1.3$1.8 billion for the year ended December 31, 2013;2015; an increase of $86.2$303.1 million compared to the year ended December 31, 2012.2014. Loans & leases increased from 66.9%75.1% of average earning assets during 20122014 to 69.6%79.5% in 2013. Because of the impact of decreases in market interest rates from mid-September 2007 through December 2008, and the continuing low rate environment since then, the2015. The year-to-date yield on the loan & lease portfolio declined to 5.11%4.52% for the year ended December 31, 2013,2015, compared to 5.56%4.76% for the year ended December 31, 2012.2014. This lower yield partially offset the impact of an increase in average loan & lease balances resultingbut still resulted in interest revenue from loans & leases decreasing 1.3%increasing 14.4% to $64.9$81.6 million for 2013.2015.
Average investment securities decreased $17.2$35.7 million in 20132015 compared to the average balance during 2012.2014. As a result, tax equivalent interest income on securities decreased $1.1$1.9 million to $12.9$9.4 million for the year ended December 31, 2013,2015, compared to $14.0$11.3 million for the year ended December 31, 2012.2014. The average yield, on a tax equivalent basis, in the investment portfolio was 2.46%2.36% in 20132015 compared to 2.58%2.60% in 2012.2014. This overall decrease in yield was caused primarily by a decrease in the mix of corporate securities and mortgage-backed securities as a percentage of total securities and a declinean increase in the yield on the Company’s mortgage-backed securities portfolio due to a shift in mix from 30 year MBS to 10, 15 and 20 year MBS. Net interest income on the Schedule of Year-to-Date Average Balances and Interest Rates is shown on a tax equivalent basis, which is higher than net interest income as reflected on the Consolidated Statements of Income because of adjustments that relate to income on securities that are exempt from federal income taxes.lower yielding short-term U.S. Treasury securities.
Interest-bearing deposits with banks and overnight investments in Federal Funds Sold are additional earning assets available to the Company.Average interest-bearing deposits with banks consisted of: (1) $611,000 in Community Reinvestment Act (‘CRA’) qualified CD’s with various banks; and (2) $30.1 million inof FRB deposits. The average rate paid on CRA qualified CD’s for 2013 was 0.38% and balancesBalances with the FRB earn interest at the Fed Funds rate, which hashad been 0.25% since December 2008.2008, but increased to 0.50% in December 2015. Average interest-bearing deposits with banks for the year ended December 31, 2013,2015, was $30.7$66.7 million, a decreasean increase of $12.6$4.3 million compared to the average balance for the year ended December 31, 2012.2014. Interest income on interest-bearing deposits with banks for the year ended December 31, 2013, decreased $31,0002015, increased $14,000 to $79,000$172,000 from the year ended December 31, 2012.2014.
Average interest-bearing liabilities decreased $6.7increased $159.3 million or 0.5%11.5% during the twelve months ended December 31, 2013.2015. Of that decrease:increase: (1) interest-bearing deposits increased $12.9$159.0 million; (2) FHLB Advances increased $8.6 million;decreased $294,000; and (3) securities sold under agreement to repurchase and subordinated debt decreased $28.2 million.remained unchanged.
The $12.9$159.0 million increase in average interest-bearing deposits was primarily in lower cost interest-bearing DDA, and savings and money market deposits, which increased $64.7$102.4 million since 2012,2014, as higher cost time deposits decreasedincreased by $51.7$56.6 million. See “Financial Condition – Deposits” for a discussion of trends in the Company’s deposit base. Total interest expense on deposits was $3.0 million for 2015 and $2.5 million for 2013 as compared to $3.7 million for 2012.2014. The average rate paid on interest-bearing deposits was 0.20% in 20132015 and 0.29%0.18% in 2012. Since most of the Company’s interest-bearing deposits are priced off of short-term market rates, the Company is benefiting from the impact of these lower market rates.2014.
Provision and Allowance for Credit Losses
As a financial institution that assumes lending and credit risks as a principal element of its business, credit losses will be experienced in the normal course of business. The Company has established credit management policies and procedures that govern both the approval of new loans & leases and the monitoring of the existing portfolio. The Company manages and controls credit risk through comprehensive underwriting and approval standards, dollar limits on loans & leases to one borrower (the term “borrower” is used herein to describe a customer who has entered into either a loan or lease transaction), and by restricting loans & leases made primarily to its principal market area where management believes it is best able to assess the applicable risk. Additionally, management has established guidelines to ensure the diversification of the Company’s credit portfolio such that even within key portfolio sectors such as real estate or agriculture, the portfolio is diversified across factors such as location, building type, crop type, etc. See “Item 7A. Quantitative and Qualitative Disclosures About Market Risk – Credit Risk.” Management reports regularly to the Board of Directors regarding trends and conditions in the loan & lease portfolio and regularly conducts credit reviews of individual loans & leases. Loans & leases that are performing but have shown some signs of weakness are subject to more stringent reporting and oversight.
Allowance for Credit Losses
The allowance for credit losses is an estimate of probable incurred credit losses inherent in the Company's loan & lease portfolio as of the balance sheet date. The allowance is established through a provision for credit losses, which is charged to expense. Additions to the allowance are expected to maintain the adequacy of the total allowance after credit losses and loan & lease growth. Credit exposures determined to be uncollectible are charged against the allowance. Cash received on previously charged off amounts is recorded as a recovery to the allowance. The overall allowance consists of three primary components: specific reserves related to impaired loans & leases; general reserves for inherent losses related to loans & leases that are not impaired; and an unallocated component that takes into account the imprecision in estimating and allocating allowance balances associated with macro factors.
A loan or lease is considered impaired when, based on current information and events, it is probable that the Company will be unable to collect all amounts due, including principal and interest, according to the contractual terms of the original agreement. Loans & leases determined to be impaired are individually evaluated for impairment. When a loan or lease is impaired, the Company measures impairment based on the present value of expected future cash flows discounted at the loan’s or lease's effective interest rate, except that as a practical expedient, it may measure impairment based on a loan’s or lease's observable market price, or the fair value of the collateral if the loan or lease is collateral dependent. A loan or lease is collateral dependent if the repayment of the loan or lease is expected to be provided solely by the underlying collateral.
A restructuring of a loan or lease constitutes a troubled debt restructuring (“TDR”) under ASC 310-40, if the Company for economic or legal reasons related to the borrower's financial difficulties grants a concession to the borrower that it would not otherwise consider. Restructured loans or leases typically present an elevated level of credit risk as the borrowers are not able to perform according to the original contractual terms. If the restructured loan or lease was current on all payments at the time of restructure and management reasonably expects the borrower will continue to perform after the restructure, management may keep the loan or lease on accrual. Loans & leases that are on nonaccrual status at the time they become TDR, remain on nonaccrual status until the borrower demonstrates a sustained period of performance, which the Company generally believes to be six consecutive months of payments, or equivalent. A loan or lease can be removed from TDR status if it was restructured at a market rate in a prior calendar year and is currently in compliance with its modified terms. However, these loans or leases continue to be classified as impaired and are individually evaluated for impairment.
The determination of the general reserve for loans or leases that are collectively evaluated for impairment is based on estimates made by management, to include, but not limited to, consideration of historical losses by portfolio segment, internal asset classifications, and qualitative factors that include economic trends in the Company's service areas, industry experience and trends, geographic concentrations, estimated collateral values, the Company's underwriting policies, the character of the loan & lease portfolio, and probable losses inherent in the portfolio taken as a whole.
The Company maintains a separate allowance for each portfolio segment (loan & lease type). These portfolio segments include: (1) commercial real estate; (2) agricultural real estate; (3) real estate construction (including land and development loans); (4) residential 1st mortgages; (5) home equity lines and loans; (6) agricultural; (7) commercial; (8) consumer & other; and (9) equipment leases. See “Financial Condition – Loans & Leases” for examples of loans & leases made by the Company. The allowance for credit losses attributable to each portfolio segment, which includes both impaired loans & leases and loans & leases that are not impaired, is combined to determine the Company's overall allowance, which is included on the consolidated balance sheet.
The Company assigns a risk rating to all loans & leases and periodically performs detailed reviews of all such loans & leases over a certain threshold to identify credit risks and assess overall collectability. For smaller balance loans & leases, such as consumer and residential real estate, a credit grade is established at inception, and then updated only when the loan or lease becomes contractually delinquent or when the borrower requests a modification. For larger balance loans, management monitors and analyzes the financial condition of borrowers and guarantors, trends in the industries in which borrowers operate and the fair values of collateral securing these loans & leases. These credit quality indicators are used to assign a risk rating to each individual loan or lease. These risk ratings are also subject to examination by independent specialists engaged by the Company. The risk ratings can be grouped into five major categories, defined as follows:
Pass – A pass loan or lease is a strong credit with no existing or known potential weaknesses deserving of management's close attention.
Special Mention – A special mention loan or lease has potential weaknesses that deserve management's close attention. If left uncorrected, these potential weaknesses may result in deterioration of the repayment prospects for the loan or lease position at some future date. Special mention loans & leases are not adversely classified and do not expose the Company to sufficient risk to warrant adverse classification.
Substandard – A substandard loan or lease is not adequately protected by the current financial condition and paying capacity of the borrower or the value of the collateral pledged, if any. Loans or leases classified as substandard have a well-defined weakness or weaknesses that jeopardize the liquidation of the debt. Well-defined weaknesses include a project's lack of marketability, inadequate cash flow or collateral support, failure to complete construction on time or the project's failure to fulfill economic expectations. They are characterized by the distinct possibility that the Company will sustain some loss if the deficiencies are not corrected.
Doubtful – Loans or leases classified doubtful have all the weaknesses inherent in those classified as substandard with the added characteristic that the weaknesses make collection or liquidation in full, based on currently known facts, conditions and values, highly questionable or improbable.
Loss – Loans or leases classified as loss are considered uncollectible. Once a loan or lease becomes delinquent and repayment becomes questionable, the Company will address collateral shortfalls with the borrower and attempt to obtain additional collateral. If this is not forthcoming and payment in full is unlikely, the Bank will estimate its probable loss and immediately charge-off some or all of the balance.
The general reserve component of the allowance for credit losses also consists of reserve factors that are based on management's assessment of the following for each portfolio segment: (1) inherent credit risk; (2) historical losses; and (3) other qualitative factors. These reserve factors are inherently subjective and are driven by the repayment risk associated with each portfolio segment described below:
Commercial Real Estate – Commercial real estate mortgage loans are generally considered to possess a higher inherent risk of loss than the Company’s commercial, agricultural and consumer loan types. Adverse economic developments or an overbuilt market impact commercial real estate projects and may result in troubled loans. Trends in vacancy rates of commercial properties impact the credit quality of these loans. High vacancy rates reduce operating revenues and the ability for properties to produce sufficient cash flow to service debt obligations.
Real Estate Construction – Real estate construction loans, including land loans, are generally considered to possess a higher inherent risk of loss than the Company’s commercial, agricultural and consumer loan types. A major risk arises from the necessity to complete projects within specified cost and time lines. Trends in the construction industry significantly impact the credit quality of these loans, as demand drives construction activity. In addition, trends in real estate values significantly impact the credit quality of these loans, as property values determine the economic viability of construction projects.
Commercial – These loans are generally considered to possess a moderate inherent risk of loss because they are shorter-term; typically made to relationship customers; generally underwritten to existing cash flows of operating businesses; and may be collateralized by fixed assets, inventory and/or accounts receivable. Debt coverage is provided by business cash flows and economic trends influenced by unemployment rates and other key economic indicators are closely correlated to the credit quality of these loans.
Agricultural Real Estate and Agricultural – These loans are generally considered to possess a moderate inherent risk of loss since they are typically made to relationship customers and are secured by crop production, livestock and related real estate. These loans are vulnerable to two risk factors that are largely outside the control of Company and borrowers: commodity prices and weather conditions.
Leases – Equipment leases are generally considered to possess a moderate inherent risk of loss. As Lessor, the company is subject to both the credit risk of the borrower and the residual value risk of the equipment. Credit risks are underwritten using the same credit criteria the Company would use when making an equipment term loan. Residual value risk is managed through the use of qualified, independent appraisers that establish the residual values the Company uses in structuring a lease.
Residential 1st Mortgages and Home Equity Lines and Loans – These loans are generally considered to possess a low inherent risk of loss, although this is not always true as evidenced by the weakness in residential real estate values over the past five years. The degree of risk in residential real estate lending depends primarily on the loan amount in relation to collateral value, the interest rate and the borrower's ability to repay in an orderly fashion. Economic trends determined by unemployment rates and other key economic indicators are closely correlated to the credit quality of these loans. Weak economic trends indicate that the borrowers' capacity to repay their obligations may be deteriorating.
Consumer & Other – A consumer installment loan portfolio is usually comprised of a large number of small loans scheduled to be amortized over a specific period. Most installment loans are made for consumer purchases. Economic trends determined by unemployment rates and other key economic indicators are closely correlated to the credit quality of these loans. Weak economic trends indicate that the borrowers' capacity to repay their obligations may be deteriorating.
In addition, the Company's and Bank's regulators, including the FRB, DBO and FDIC, as an integral part of their examination process, review the adequacy of the allowance. These regulatory agencies may require additions to the allowance based on their judgment about information available at the time of their examinations.
Provision for Credit Losses
Changes in the provision for credit losses between years are the result of management’s evaluation, based upon information currently available, of the adequacy of the allowance for credit losses relative to factors such as the credit quality of the loan & lease portfolio, loan & lease growth, current credit losses, and the prevailing economic climate and its effect on borrowers’ ability to repay loans & leases in accordance with the terms of the notes.
The Central Valley of California was one of the hardest hit areas in the country during the recession. In many areas, housing prices declined as much as 60% and unemployment reached 15% or more. Although the economy has stabilizedimproved throughout most of the Central Valley, it remains fragile with housing prices that for the most part have not recovered significantlyremain below peak levels and unemployment levelsrates that remain well above those in other areas of the state and country. While, in management’s opinion, the Company’s levels of net charge-offs and non-performing assets as of December 31, 2014,2016, compare very favorably to our peers at the present time, carefully managing credit risk remains a key focus of the Company.
The stateState of California has experienced drought conditions during much offrom 2013 and 2014. Importantly,through most of 2016. Although significant levels of rain and snow in late 2016 and early 2017 have alleviated drought conditions this year in many areas of California, including those in the Company’s agricultural customers have accessprimary service area, the long-term risks associated with the availability of water continue to their own ground water supplies and, therefore, are not as dependent on the delivery of surface water as growers in other parts of California. Although Management continues to believe that current conditions will not have a material impact on credit quality during 2015, the lack of rain will have a continuing adverse impact on our agricultural customers’ operating costs, crop yields and crop quality. The longer the drought continues, the more significant this impact will become, particularly if ground water levels reach critical stage.exist. See “Item 1A. Risk Factors” for additional information.
The provision for credit losses totaled $1.2$6.3 million in 20142016 compared to $425,000$750,000 in 2013 and $1.9 million in 2012.2015. Net charge-offsrecoveries during 20142016 were $48,000$61,000 compared to $368,000net recoveries of $5.4 million during 2015 and net charge-offs of $48,000 in 20132014. During 2015, the Company was able to fully recover $5.2 million that was charged-off in 2010 on restructured commercial real estate and $650,000 in 2012. Net charge-offs represented 0.0% of average loans & leases during 2014, a level that in management’s opinion compares very favorablyconstruction loans. In addition to the Company’s peers atfull recovery of the present time. The increasecharged off principal, this transaction also resulted in the provision overrecovery of $353,000 in interest income and the past year reflects the growth that occurred in the loan portfolio during 2014.client’s payment of a financing fee of $1.1 million. See “Overview – Looking Forward: 2015 and Beyond,” “Critical Accounting Policies and Estimates – Allowance for Credit Losses” and “Item 7A. Quantitative and Qualitative Disclosures About Market Risk-Credit Risk.”
The following tables summarizetable summarizes the activity and the allocation of the allowance for credit losses for the years indicated. (in thousands)
| 2014 | 2013 | 2012 | 2011 | 2010 | 2016 | 2015 | 2014 | 2013 | 2012 | |||||||||||||||||||||||||||||||
| Allowance for Credit Losses Beginning of Year | $ | 34,274 | $ | 34,217 | $ | 33,017 | $ | 32,261 | $ | 29,813 | $ | 41,523 | $ | 35,401 | $ | 34,274 | $ | 34,217 | $ | 33,017 | ||||||||||||||||||||
| Provision Charged to Expense | 1,175 | 425 | 1,850 | 6,775 | 14,735 | 6,335 | 750 | 1,175 | 425 | 1,850 | ||||||||||||||||||||||||||||||
| Charge-Offs: | ||||||||||||||||||||||||||||||||||||||||
| Commercial Real Estate | - | 6 | - | 25 | 1,629 | - | - | - | 6 | - | ||||||||||||||||||||||||||||||
| Agricultural Real Estate | - | 575 | - | 384 | 559 | - | - | - | 575 | - | ||||||||||||||||||||||||||||||
| Real Estate Construction | - | - | - | - | 4,095 | - | - | - | - | - | ||||||||||||||||||||||||||||||
| Residential 1st Mortgages | 73 | 16 | 152 | 449 | 759 | 21 | - | 73 | 16 | 152 | ||||||||||||||||||||||||||||||
| Home Equity Lines and Loans | 70 | 91 | 259 | 751 | 310 | 46 | - | 70 | 91 | 259 | ||||||||||||||||||||||||||||||
| Agricultural | - | 23 | 294 | 3,559 | 916 | - | - | - | 23 | 294 | ||||||||||||||||||||||||||||||
| Commercial | 1 | 60 | 198 | 788 | 4,143 | - | 12 | 1 | 60 | 198 | ||||||||||||||||||||||||||||||
| Consumer & Other | 132 | 120 | 145 | 190 | 112 | 105 | 84 | 132 | 120 | 145 | ||||||||||||||||||||||||||||||
| Total Charge-Offs | 276 | 891 | 1,048 | 6,146 | 12,523 | 172 | 96 | 276 | 891 | 1,048 | ||||||||||||||||||||||||||||||
| Recoveries: | ||||||||||||||||||||||||||||||||||||||||
| Commercial Real Estate | 11 | - | - | - | - | 2 | 2,939 | 11 | - | - | ||||||||||||||||||||||||||||||
| Agricultural Real Estate | - | - | 90 | 18 | 2 | - | - | - | - | 90 | ||||||||||||||||||||||||||||||
| Real Estate Construction | - | - | - | - | - | - | 2,225 | - | - | - | ||||||||||||||||||||||||||||||
| Residential 1st Mortgages | - | - | 53 | 4 | 7 | 26 | 8 | - | - | 53 | ||||||||||||||||||||||||||||||
| Home Equity Lines and Loans | 58 | 115 | 14 | 13 | - | 103 | 87 | 58 | 115 | 14 | ||||||||||||||||||||||||||||||
| Agricultural | 8 | 42 | 61 | 10 | 68 | - | 4 | 8 | 42 | 61 | ||||||||||||||||||||||||||||||
| Commercial | 86 | 312 | 117 | 21 | 92 | 47 | 136 | 86 | 312 | 117 | ||||||||||||||||||||||||||||||
| Consumer & Other | 65 | 54 | 63 | 61 | 67 | 55 | 69 | 65 | 54 | 63 | ||||||||||||||||||||||||||||||
| Total Recoveries | 228 | 523 | 398 | 127 | 236 | 233 | 5,468 | 228 | 523 | 398 | ||||||||||||||||||||||||||||||
| Net Charge-Offs | (48 | ) | (368 | ) | (650 | ) | (6,019 | ) | (12,287 | ) | ||||||||||||||||||||||||||||||
| Net Recoveries (Charge-Offs) | 61 | 5,372 | (48 | ) | (368 | ) | (650 | ) | ||||||||||||||||||||||||||||||||
| Total Allowance for Credit Losses | $ | 35,401 | $ | 34,274 | $ | 34,217 | $ | 33,017 | $ | 32,261 | $ | 47,919 | $ | 41,523 | $ | 35,401 | $ | 34,274 | $ | 34,217 | ||||||||||||||||||||
| Ratios: | ||||||||||||||||||||||||||||||||||||||||
| Allowance for Credit Losses to: | ||||||||||||||||||||||||||||||||||||||||
| Total Loans & Leases at Year End | 2.06 | % | 2.46 | % | 2.74 | % | 2.83 | % | 2.74 | % | 2.19 | % | 2.07 | % | 2.06 | % | 2.00 | % | 2.46 | % | ||||||||||||||||||||
| Average Loans & Leases | 2.36 | % | 2.70 | % | 2.89 | % | 2.82 | % | 2.73 | % | 2.34 | % | 2.30 | % | 2.36 | % | 2.70 | % | 2.89 | % | ||||||||||||||||||||
| Consolidated Net Charge-Offs to: | ||||||||||||||||||||||||||||||||||||||||
| Consolidated Net (Recoveries) Charge-Offs to: | ||||||||||||||||||||||||||||||||||||||||
| Total Loans & Leases at Year End | 0.00 | % | 0.03 | % | 0.05 | % | 0.52 | % | 1.04 | % | 0.00 | % | (0.27 | %) | 0.00 | % | 0.02 | % | 0.05 | % | ||||||||||||||||||||
| Average Loans & Leases | 0.00 | % | 0.03 | % | 0.05 | % | 0.51 | % | 1.04 | % | 0.00 | % | (0.30 | %) | 0.00 | % | 0.03 | % | 0.05 | % | ||||||||||||||||||||
The table below breaks out year-to-date activity by portfolio segment (in thousands):
| December 31, 2016 | Commercial Real Estate | Agricultural Real Estate | Real Estate Construction | Residential 1st Mortgages | Home Equity Lines & Loans | Agricultural | Commercial | Consumer & Other | Leases | Unallocated | Total | |||||||||||||||||||||||||||||||||
| Year-To-Date Allowance for Credit Losses: | ||||||||||||||||||||||||||||||||||||||||||||
| Beginning Balance- January 1, 2016 | $ | 10,063 | $ | 6,881 | $ | 2,485 | $ | 789 | $ | 2,146 | $ | 6,308 | $ | 7,836 | $ | 175 | $ | 3,294 | $ | 1,546 | $ | 41,523 | ||||||||||||||||||||||
| Charge-Offs | - | - | - | (21 | ) | (46 | ) | - | - | (105 | ) | - | - | (172 | ) | |||||||||||||||||||||||||||||
| Recoveries | 2 | - | - | 26 | 103 | - | 47 | 55 | - | - | 233 | |||||||||||||||||||||||||||||||||
| Provision | 1,045 | 2,569 | 738 | 71 | (63 | ) | 1,073 | 632 | 75 | 292 | (97 | ) | 6,335 | |||||||||||||||||||||||||||||||
| Ending Balance- December 31, 2016 | $ | 11,110 | $ | 9,450 | $ | 3,223 | $ | 865 | $ | 2,140 | $ | 7,381 | $ | 8,515 | $ | 200 | $ | 3,586 | $ | 1,449 | $ | 47,919 | ||||||||||||||||||||||
| December 31, 2014 | Commercial Real Estate | Agricultural Real Estate | Real Estate Construction | Residential 1st Mortgages | Home Equity Lines & Loans | Agricultural | Commercial | Consumer & Other | Leases | Unallocated | Total | |||||||||||||||||||||||||||||||||
| Year-To-Date Allowance for Credit Losses: | ||||||||||||||||||||||||||||||||||||||||||||
| Beginning Balance- January 1, 2014 | $ | 5,178 | $ | 3,576 | $ | 654 | $ | 1,108 | $ | 2,767 | $ | 12,205 | $ | 5,697 | $ | 176 | $ | 639 | $ | 2,274 | $ | 34,274 | ||||||||||||||||||||||
| Charge-Offs | - | - | - | (73 | ) | (70 | ) | - | (1 | ) | (132 | ) | - | - | (276 | ) | ||||||||||||||||||||||||||||
| Recoveries | 11 | - | - | - | 58 | 8 | 86 | 65 | - | - | 228 | |||||||||||||||||||||||||||||||||
| Provision | 2,653 | 609 | 1,015 | (13 | ) | (329 | ) | (6,109 | ) | 2,413 | 109 | 1,572 | (745 | ) | 1,175 | |||||||||||||||||||||||||||||
| Ending Balance- December 31, 2014 | $ | 7,842 | $ | 4,185 | $ | 1,669 | $ | 1,022 | $ | 2,426 | $ | 6,104 | $ | 8,195 | $ | 218 | $ | 2,211 | $ | 1,529 | $ | 35,401 | ||||||||||||||||||||||
Overall, the Allowance for Credit Losses as of December 31, 20142016 increased $1.1$6.4 million from December 31, 2013.2015. The allowance allocated to the following categories of loans changed as followsindicated during the twelve months ended December 31, 2014:2016:
| · | Commercial Real Estate |
| · | Agricultural and Agricultural Real Estate allowance balances |
| Allowance Allocation at December 31, | ||||||||||||||||||||||||||||||||||||||||
| (in thousands) | 2016 Amount | Percent of Loans in Each Category to Total Loans | 2015 Amount | Percent of Loans in Each Category to Total Loans | 2014 Amount | Percent of Loans in Each Category to Total Loans | 2013 Amount | Percent of Loans in Each Category to Total Loans | 2012 Amount | Percent of Loans in Each Category to Total Loans | ||||||||||||||||||||||||||||||
| Commercial Real Estate | $ | 11,110 | 30.9 | % | $ | 10,063 | 30.4 | % | $ | 7,842 | 28.9 | % | $ | 5,178 | 29.5 | % | $ | 6,464 | 28.3 | % | ||||||||||||||||||||
| Agricultural Real Estate | 9,450 | 21.4 | % | 6,881 | 21.2 | % | 4,185 | 20.8 | % | 3,576 | 23.6 | % | 2,877 | 25.0 | % | |||||||||||||||||||||||||
| Real Estate Construction | 3,223 | 8.1 | % | 2,485 | 7.6 | % | 1,669 | 5.6 | % | 654 | 3.0 | % | 986 | 2.6 | % | |||||||||||||||||||||||||
| Residential 1st Mortgages | 865 | 11.1 | % | 789 | 10.3 | % | 1,022 | 10.0 | % | 1,108 | 10.9 | % | 1,219 | 11.2 | % | |||||||||||||||||||||||||
| Home Equity Lines and Loans | 2,140 | 1.4 | % | 2,146 | 1.7 | % | 2,426 | 1.9 | % | 2,767 | 2.5 | % | 3,235 | 3.4 | % | |||||||||||||||||||||||||
| Agricultural | 7,381 | 13.5 | % | 6,308 | 14.7 | % | 6,104 | 16.4 | % | 12,205 | 18.4 | % | 10,437 | 17.7 | % | |||||||||||||||||||||||||
| Commercial | 8,515 | 10.0 | % | 7,836 | 10.5 | % | 8,195 | 13.5 | % | 5,697 | 10.8 | % | 7,963 | 11.5 | % | |||||||||||||||||||||||||
| Consumer & Other | 200 | 0.3 | % | 175 | 0.3 | % | 218 | 0.3 | % | 176 | 0.4 | % | 182 | 0.3 | % | |||||||||||||||||||||||||
| Leases | 3,586 | 3.3 | % | 3,294 | 3.3 | % | 2,211 | 2.6 | % | 639 | 0.9 | % | - | 0.0 | % | |||||||||||||||||||||||||
| Unallocated | 1,449 | 1,546 | 1,529 | 2,274 | 854 | |||||||||||||||||||||||||||||||||||
| Total | $ | 47,919 | 100.0 | % | $ | 41,523 | 100.0 | % | $ | 35,401 | 100.0 | % | $ | 34,274 | 100.0 | % | $ | 34,217 | 100.0 | % | ||||||||||||||||||||
| Allowance Allocation at December 31, | ||||||||||||||||||||||||||||||||||||||||
| (in thousands) | 2014 Amount | Percent of Loans in Each Category to Total Loans | 2013 Amount | Percent of Loans in Each Category to Total Loans | 2012 Amount | Percent of Loans in Each Category to Total Loans | 2011 Amount | Percent of Loans in Each Category to Total Loans | 2010 Amount | Percent of Loans in Each Category to Total Loans | ||||||||||||||||||||||||||||||
| Commercial Real Estate | $ | 7,842 | 28.9 | % | $ | 5,178 | 29.5 | % | $ | 6,464 | 28.2 | % | $ | 5,823 | 26.4 | % | $ | 7,631 | 27.0 | % | ||||||||||||||||||||
| Agricultural Real Estate | 4,185 | 20.8 | % | 3,576 | 23.6 | % | 2,877 | 25.0 | % | 2,583 | 24.0 | % | 1,539 | 21.6 | % | |||||||||||||||||||||||||
| Real Estate Construction | 1,669 | 5.6 | % | 654 | 3.0 | % | 986 | 2.6 | % | 1,933 | 2.5 | % | 2,160 | 3.2 | % | |||||||||||||||||||||||||
| Residential 1st Mortgages | 1,022 | 10.0 | % | 1,108 | 10.9 | % | 1,219 | 11.2 | % | 1,251 | 9.2 | % | 1,164 | 8.8 | % | |||||||||||||||||||||||||
| Home Equity Lines and Loans | 2,426 | 1.9 | % | 2,767 | 2.5 | % | 3,235 | 3.4 | % | 3,746 | 4.4 | % | 3,724 | 5.0 | % | |||||||||||||||||||||||||
| Agricultural | 6,104 | 16.4 | % | 12,205 | 18.4 | % | 10,437 | 17.7 | % | 8,127 | 18.6 | % | 6,733 | 19.6 | % | |||||||||||||||||||||||||
| Commercial | 8,195 | 13.5 | % | 5,697 | 10.8 | % | 7,963 | 11.5 | % | 8,733 | 14.2 | % | 9,084 | 14.0 | % | |||||||||||||||||||||||||
| Consumer & Other | 218 | 0.3 | % | 176 | 0.4 | % | 182 | 0.4 | % | 207 | 0.7 | % | 216 | 0.8 | % | |||||||||||||||||||||||||
| Leases | 2,211 | 2.6 | % | 639 | 0.9 | % | - | 0.0 | % | - | 0.0 | % | - | 0.0 | % | |||||||||||||||||||||||||
| Unallocated | 1,529 | 2,274 | 854 | 614 | 10 | |||||||||||||||||||||||||||||||||||
| Total | $ | 35,401 | 100.0 | % | $ | 34,274 | 100.0 | % | $ | 34,217 | 100.0 | % | $ | 33,017 | 100.0 | % | $ | 32,261 | 100.0 | % | ||||||||||||||||||||
As of December 31, 2014,2016, the allowance for credit losses was $35.4$47.9 million, which represented 2.06%2.19% of the total loan & lease balance. At December 31, 2013,2015, the allowance for credit losses was $34.3$41.5 million or 2.46%2.07% of the total loan & lease balance. After reviewing all factors above, based upon information currently available, management concluded that the allowance for credit losses as of December 31, 2014,2016, was adequate.
Non-Interest Income
Non-interest income includes: (1) service charges and fees from deposit accounts; (2) net gains and losses from investment securities; (3) increases in the cash surrender value of bank owned life insurance; (4) debit card and ATM fees; (5) net gains and losses on non-qualified deferred compensation plan investments; and (6) fees from other miscellaneous business services. See “Overview – Looking Forward: 20152017 and Beyond.”
Non‑interest income totaled $14.3$15.3 million, a decreasean increase of $1.6 million$682,000 or 10.1%4.7% from non-interest income of $15.9$14.6 million for 2013.2015.
Service charges on deposit accounts totaled $3.9$3.4 million, a decrease of $427,000$82,000 or 9.8%2.4% from service charges on deposit accounts of $4.4$3.5 million in 2013.2015. This was due primarily to a decrease in fees related to the Company’s Overdraft Privilege Service.
Net (loss) gain on investment securities was $90,000a net loss of $284,000 in 20142016 compared to a net lossgain of $229,000$275,000 for 2013.2015. See “Financial Condition-Investment Securities” for a discussion of the Company’s investment strategy.
Net gains on deferred compensation plan investments were $2.1$2.0 million in 20142016 compared to net gains of $3.4$1.4 million in 2013.2015. See Note 16,17, located in “Item 8. Financial Statements and Supplementary Data” for a description of these plans. Balances in non-qualified deferred compensation plans may be invested in financial instruments whose market value fluctuates based upon trends in interest rates and stock prices. Although Generally Accepted Accounting Principles require these investment gains/losses be recorded in non-interest income, an offsetting entry is also required to be made to non-interest expense resulting in no effect on the Company’s net income.
The Company completed its acquisition of Delta National Bancorp in November 2016. This acquisition resulted in a bargain purchase gain of $1.8 million (see Note 2, located in “Item 8. Financial Statements and Supplementary Data.”)
Other non-interest income was $3.2$3.1 million, a decrease of $306,000$1.3 million or 8.9% over 2013.29.8% from 2015. This decrease was primarily duecomprised of (1) a $1.1 million financing fee related to the full recovery of a loan previously charged off; and (2) a $392,000 gain on the sale of our Modesto VillageSacramento branch buildingbuilding; both of which occurred in the amount of $706,000, which took place in 2013. The absence of this gain in 2014 was partially offset by a $483,000 gain on the early termination of a lease agreement.2015.
Non‑interest income totaled $15.9$14.6 million, an increase of $1.8 million$246,000 or 13.0%1.7% from non-interest income of $14.1$14.3 million for 2012.2014.
Service charges on deposit accounts totaled $4.4$3.5 million, a decrease of $541,000$465,000 or 11.1%11.9% from service charges on deposit accounts of $4.9$3.9 million in 2012.2014. This was due primarily to a decrease in fees related to the Company’s Overdraft Privilege Service.
Net lossgain on investment securities was $229,000$275,000 in 20132015 compared to a net gain of $158,000$90,000 for 2012.
Net gains on deferred compensation plan investments were $3.4$1.4 million in 20132015 compared to net gains of $1.7$2.1 million in 2012.2014.
Other non-interest income was $3.5$4.4 million, an increase of $925,000$1.2 million or 35.6%35.9% over 2012.2014. This increase was primarily due to:comprised of (1) a $1.1 million financing fee related to the full recovery of a loan previously charged off; (2) a $392,000 gain on the sale of our Sacramento branch building; and (3) a $284,000 increase in FHLB dividends as a result of the FHLB declaring a one-time special dividend. These increases were somewhat offset by a $483,000 decrease in gain on sale of our Modesto Village branch building in the amount of $706,000; and (2) an increase of $227,000 in FHLB cash dividends.leases.
Non-Interest Expense
Non-interest expense for the Company includes expenses for: (1) salaries and employee benefits; (2) net gains and losses on non-qualified deferred compensation plan investments; (3) occupancy; (4) equipment; (5) supplies; (6) legal fees; (7) professional services; (8) data processing; (9) marketing; (10) deposit insurance; and (11) other miscellaneous expenses.
Overall, non-interest expense totaled $51.4$58.2 million, an increase of $496,000$1.9 million or 1.0%3.4% for the year ended December 31, 2014.2016. The acquisition of Delta National Bancorp resulted in merger related expenses of $910,000 recorded in 2016.
Salaries and employee benefits increased $2.8$2.3 million or 8.3%5.6% primarily related to: (1) new staff added for the then loan production officesbranches opened in Walnut Creek and Irvine;Concord, CA and the Company’s equipment leasing activities; (2) bank wide raises;raises that occurred in mid-2015; and (3) increased medical insurance premiums.contributions to retirement and profit sharing plans.
Net Gainsgains on deferred compensation plan investments were $2.1$2.0 million in 20142016 compared to net gains of $3.4$1.4 million in 2013.2015. See Note 16,17, located in “Item 8. Financial Statements and Supplementary Data” for a description of these plans. Balances in non-qualified deferred compensation plans may be invested in financial instruments whose market value fluctuates based upon trends in interest rates and stock prices. Although Generally Accepted Accounting Principles require these investment gains/losses be recorded in non-interest expense, an offsetting entry is also required to be made to non-interest income resulting in no effect on the Company’s net income.
Occupancy expense in 2016 totaled $3.0 million, an increase of $101,000 or 3.5% from 2015 and equipment expense in 2016 totaled $3.5 million, an increase of $331,000 or 10.5% from 2015. Both of these increases were primarily related to operating lease payments and depreciation expense associated with: (1) expanding into Walnut Creek and Concord, CA and the equipment leasing business; (2) remodeling existing branch offices; and (3) replacing all ATM’s with the newest generation of technology.
Other non-interest expense decreased $869,000,increased $3.5 million, or 12.4%52.6%, to $6.1$10.0 million in 20142016 compared to $7.0$6.6 million in 2013, primarily due2015. The major components of this increase were: (1) a $1.1 million increase in professional fees of which $633,100 was related to the acquisition of Delta National Bancorp; (2) a $681,000 drop$1.1 million increase in operating losses.amortization expense related to an increase in low income housing tax credit investments (see Income Taxes” for the offsetting credits related to these investments); (3) a $335,000 increase in recruitment and staff training expenses related to the addition of new staff as the Company expands its geographic footprint and business activities; and (4) a $126,000 increase in contributions.
Overall, non-interest expense totaled $50.9$56.3 million, an increase of $2.6$4.9 million or 5.4%9.5% for the year ended December 31, 2013.2015.
Salaries and employee benefits increased $2.0$3.2 million or 6.4%8.9% primarily related to: (1) new staff added for the LPO’sbranches in Walnut Creek and Irvine;Concord, CA and the Company’s equipment leasing activities; (2) bank wide raises; and (3) increased medical insurance premiums.contributions to employee benefit plans.
Net Gainsgains on deferred compensation plan investments were $3.4$1.4 million in 20132015 compared to net gains of $1.7$2.1 million in 2012.2014.
The Company’s total FDIC insurance costs increased $13,000$145,000 in 20132015 to $981,000,$1.2 million, a 1.3% increase13.8% from $968,000 in 2012.
Other non-interest expense increased $1.4 million,$802,000, or 25.0%13.6%, to $7.0$6.7 million in 20132015 compared to $5.6$5.9 million in 2012. During 2013, the Company incurred increased expenses2014. The major components of this increase were: (1) a $141,000 increase in CRA qualified contributions; (2) a $166,000 increase in legal fees; (3) a $113,000 increase in Debit Card and ATM expenses; and (4) $254,000 in amortization expense related to employee training, ATM/Debit card activities, consulting services and customer operating losses.low income housing tax credit investments.
Income Taxes
The provision for income taxes increased $873,000decreased $827,000 during 2014. The effective tax rate in 2014 was 37.3% compared to 37.2% in 2013 and 37.5% in 2012.2016. The effective rates were lower than the statutory rate of 42% due primarily to benefits regarding the cash surrender value of life insurance, California enterprise zone interest income exclusion,CRA low-income housing tax credits, bargain purchase gain and tax-exempt interest income on municipal securities and loans.
Current tax law causes the Company’s current taxes payable to approximate or exceed the current provision for taxes on the income statement. Three provisions have had a significant effect on the Company’s current income tax liability: (1) the restrictions on the deductibility of credit losses; (2) deductibility of pension and other long-term employee benefits only when paid; and (3) the statutory deferral of deductibility of California franchise taxes on the Company’s federal return.
Congress and the Trump Administration have indicated a desire to reform U.S. corporate taxes, including reducing the corporate tax rate. An increase in our on-going net income from a reduction in corporate tax rates may be partially offset by a write-down in the value of our deferred tax assets upon a tax rate reduction. The one-time impact on our deferred tax assets is dependent on the extent of the tax rate reduction, which remains uncertain at this time.
Financial Condition
Investment Securities and Federal Funds Sold
The investment portfolio provides the Company with an income alternative to loans & leases. The debt securities in the Company’s investment portfolio have historically been comprised primarily of: (1) mortgage-backed securities issued by federal government-sponsored entities; (2) debt securities issued by US Treasury, government agencies and government-sponsored entities; and (3) investment grade bank-qualified municipal bonds. However, during 2012, when loan demand lagged deposit growth resulting in significant liquidity,at certain times, the Company began tohas selectively addadded investment grade corporate securities (floating rate and fixed rate with maturities less than 5 years) to the portfolio in order to obtain yields that exceed government agency securities of equivalent maturity without subjecting the Company to the interest rate risk associated with mortgage-backed securities. This portfolio of corporate securities was sold during the 3rd quarter of 2014 in order to fund the Company’s increase in loan balances.
The Company’s investment portfolio at December 31, 20142016 was $430.4$506.4 million compared to $473.1$430.5 million at December 31, 2013, a decrease2015, an increase of $42.7$75.8 million or 9.0%17.6%. To protect against future increases in market interest rates, while at the same time generating some reasonable level of current yields, the Company has investedcurrently invests most of its available funds in either shorter term corporate, US Treasury, government agency & government-sponsored entity securities andor shorter term (10, 15, and 20 year) mortgage-backed securities. As part of the acquisition of Delta National Bancorp, the Company now owns $36.3 million of floating rate U.S. Government SBA debt.
The Company's total investment portfolio currently represents 18.2%17.3% of the Company’s total assets as compared to 22.8%16.5% at December 31, 2013.2015.
As of December 31, 20142016, the Company held $61.7$58.1 million of municipal investments, of which $48.3$40.1 million were bank-qualified municipal bonds, all classified as held-to-maturity (“HTM”). The continuing financial problems being experienced by certain municipalities, along with the financial stresses exhibited by some of the large monoline bond insurers, has increased the overall risk associated with bank-qualified municipal bonds. This situation caused the Company not to purchase any municipal bonds between late 2006 and year-end 2011. However, during the first quarter of 2012 the Company began investing in bank-qualified municipals that were rated AA or better. In order to comply with Section 939A of the Dodd-Frank Act, the Company performs its own credit analysis on new purchases of municipal bonds. As of December 31, 2014, ninety-seven2016, ninety-eight percent of the Company’s bank-qualified municipal bond portfolio is rated at either the issue or issuer level, and all of these ratings are “investment grade.” The Company monitors the status of all municipal investments with particular attention paid to the approximately threetwo percent ($1.4 million)419,000) of the portfolio that is not rated, and at the current time does not believe any of them to be exhibiting financial problems that could result in a loss in any individual security. In June 2014, the Company sold $375,000 of municipal bonds from a single issuer. The Company took this action under the provisions of ASC 320-10-25-6(a), which allow for the sale of HTM securities where there is “evidence of a significant deterioration in the issuer’s creditworthiness.”
Not included in the investment portfolio are interest bearing deposits with banks and overnight investments in Federal Funds Sold. Interest bearing deposits with banks consistconsisted primarily of FRB deposits. The FRB currently pays interest on the deposits that banks maintain in their FRB accounts, whereas historically banks had to sell these Federal Funds to other banks in order to earn interest. Since balances at the FRB are effectively risk free, the Company elected to maintain its excess cash at the FRB. Interest bearing deposits with banks totaled $34.8$43.9 million at December 31, 20142016 and $42.7$9.5 million at December 31, 2013.2015.
The Company classifies its investments as held-to-maturity, trading, or available-for-sale (“AFS”). Securities are classified as held-to-maturity and are carried at amortized cost when the Company has the intent and ability to hold the securities to maturity. Trading securities are securities acquired for short-term appreciation and are carried at fair value, with unrealized gains and losses recorded in non-interest income. As of December 31, 20142016 and December 31, 2013,2015, there were no securities in the trading portfolio. Securities classified as available-for-sale include securities, which may be sold to effectively manage interest rate risk exposure, prepayment risk, satisfy liquidity demands and other factors. These securities are reported at fair value with aggregate, unrealized gains or losses excluded from income and included as a separate component of shareholders’ equity, net of related income taxes.
Investment Portfolio
The following table summarizes the balances and distributions of the investment securities held on the dates indicated.
Available for Sale | Held to Maturity | Available for Sale | Held to Maturity | Available for Sale | Held to Maturity | Available for Sale | Held to Maturity | Available for Sale | Held to Maturity | Available for Sale | Held to Maturity | |||||||||||||||||||||||||||||||||||||
December 31: (in thousands) | 2014 | 2013 | 2012 | 2016 | 2015 | 2014 | ||||||||||||||||||||||||||||||||||||||||||
| U.S. Treasury Notes | $ | 134,428 | $ | - | $ | 72,884 | $ | - | $ | - | $ | - | ||||||||||||||||||||||||||||||||||||
| U.S. Government SBA | 36,314 | - | - | - | - | - | ||||||||||||||||||||||||||||||||||||||||||
| Government Agency & Government Sponsored Entities | $ | 78,109 | $ | - | $ | 28,436 | $ | - | $ | 26,823 | $ | - | 3,241 | - | 33,251 | - | 78,109 | - | ||||||||||||||||||||||||||||||
| Obligations of States and Political Subdivisions - Non-Taxable | - | 61,716 | - | 65,685 | 5,665 | 65,694 | - | 58,109 | - | 61,396 | - | 61,716 | ||||||||||||||||||||||||||||||||||||
| Mortgage Backed Securities | 287,948 | - | 324,929 | 45 | 352,772 | 484 | 273,270 | - | 262,493 | - | 287,948 | - | ||||||||||||||||||||||||||||||||||||
| Corporate Securities | - | - | 49,380 | - | 22,558 | - | ||||||||||||||||||||||||||||||||||||||||||
| Other | 485 | 2,147 | 1,894 | 2,775 | 10,173 | 2,214 | 1,010 | - | 509 | - | 485 | 2,147 | ||||||||||||||||||||||||||||||||||||
| Total Book Value | $ | 366,542 | $ | 63,863 | $ | 404,639 | $ | 68,505 | $ | 417,991 | $ | 68,392 | $ | 448,263 | $ | 58,109 | $ | 369,137 | $ | 61,396 | $ | 366,542 | $ | 63,863 | ||||||||||||||||||||||||
| Fair Value | $ | 366,542 | $ | 64,635 | $ | 404,639 | $ | 68,689 | $ | 417,991 | $ | 70,697 | $ | 448,263 | $ | 58,408 | $ | 369,137 | $ | 62,388 | $ | 366,542 | $ | 64,635 | ||||||||||||||||||||||||
Analysis of Investment Securities Available-for-Sale
The following table is a summary of the relative maturities and yields of the Company's investment securities Available-for-Sale as of December 31, 2014. Non-taxable Obligations of States and Political Subdivisions have been calculated on a fully taxable equivalent basis.2016.
December 31, 2014 (in thousands) | Fair Value | Average Yield | ||||||||||||||
December 31, 2016 (in thousands) | Fair Value | Average Yield | ||||||||||||||
| U.S. Treasury | ||||||||||||||||
| One year or less | $ | 64,993 | 0.33 | % | ||||||||||||
| After one year through five years | 60,236 | 1.34 | % | |||||||||||||
| After five years through ten years | 9,199 | 2.14 | % | |||||||||||||
| Total U.S. Treasury Securities | 134,428 | 0.91 | % | |||||||||||||
| U.S. Government SBA | ||||||||||||||||
| One year or less | 138 | 2.24 | % | |||||||||||||
| After one year through five years | 2,638 | 1.68 | % | |||||||||||||
| After five years through ten years | 4,590 | 1.99 | % | |||||||||||||
| After ten years | 28,948 | 1.61 | % | |||||||||||||
| Total U.S. Government Securities | 36,314 | 1.67 | % | |||||||||||||
| Government Agency & Government Sponsored Entities | ||||||||||||||||
| One year or less | $ | 76,985 | 0.18 | % | ||||||||||||
| After one year through five years | 1,124 | 2.82 | % | 3,241 | 2.86 | % | ||||||||||
| Total Government Agency & Government Sponsored Entities | 78,109 | 0.22 | % | 3,241 | 2.86 | % | ||||||||||
| Other | ||||||||||||||||
| One year or less | 485 | 0.68 | % | 1,010 | 2.25 | % | ||||||||||
| Total Other Securities | 485 | 0.68 | % | 1,010 | 2.25 | % | ||||||||||
| Mortgage Backed Securities | 287,948 | 2.26 | % | 273,270 | 2.30 | % | ||||||||||
| Total Investment Securities Available-for-Sale | $ | 366,542 | 1.82 | % | $ | 448,263 | 1.84 | % | ||||||||
Note: The average yield for floating rate securities is calculated using the current stated yield.
Analysis of Investment Securities Held-to-Maturity
The following table is a summary of the relative maturities and yields of the Company's investment securities Held-to-Maturity as of December 31, 2014.2016. Non-taxable Obligations of States and Political Subdivisions have been calculated on a fully taxable equivalent basis.
December 31, 2014 (in thousands) | Book Value | Average Yield | ||||||||||||||
December 31, 2016 (in thousands) | Book Value | Average Yield | ||||||||||||||
| Obligations of States and Political Subdivisions - Non-Taxable | ||||||||||||||||
| One year or less | $ | 600 | 5.35 | % | $ | 1,905 | 4.67 | % | ||||||||
| After one year through five years | 16,426 | 6.20 | % | 9,530 | 5.26 | % | ||||||||||
| After five years through ten years | 9,845 | 5.00 | % | 12,699 | 3.92 | % | ||||||||||
| After ten years | 34,845 | 4.83 | % | 33,975 | 5.19 | % | ||||||||||
| Total Obligations of States and Political Subdivisions - Non-Taxable | 61,716 | 5.23 | % | 58,109 | 4.91 | % | ||||||||||
| Other | ||||||||||||||||
| After one year through five years | 2,147 | 0.57 | % | |||||||||||||
| Total Other Securities | 2,147 | 0.27 | % | |||||||||||||
| Total Investment Securities Held-to-Maturity | $ | 63,863 | 5.06 | % | $ | 58,109 | 4.91 | % | ||||||||
Loans & Leases
Loans & Leasesleases can be categorized by borrowing purpose and use of funds. Common examples of loans & leases made by the Company include:
Commercial and Agricultural Real Estate - These are loans secured by farmland, commercial real estate, multifamily residential properties, and other non-farm, non-residential properties generally within our market area. Commercial mortgage term loans can be made if the property is either income producing or scheduled to become income producing based upon acceptable pre-leasing, and the income will be the Bank's primary source of repayment for the loan. Loans are made both on owner occupied and investor properties; generally do not exceed 15 years (and may have pricing adjustments on a shorter timeframe); have debt service coverage ratios of 1.00 or better with a target of greater than 1.20; and fixed rates that are most often tied to treasury indices with an appropriate spread based on the amount of perceived risk in the loan.
Real Estate Construction - These are loans for development and construction (the Company generally requires the borrower to fund the land acquisition) and are secured by commercial or residential real estate. These loans are generally made only to experienced local developers with whom the Bank has a successful track record; for projects in our service area; with Loan To Value (LTV) below 75%; and where the property can be developed and sold within 2 years. Commercial construction loans are made only when there is a written take-out commitment from the Bank or an acceptable financial institution or government agency. Most acquisition, development and construction loans are tied to the prime rate or LIBOR with an appropriate spread based on the amount of perceived risk in the loan.
Residential 1st Mortgages - These are loans primarily made on owner occupied residences; generally underwritten to income and LTV guidelines similar to those used by FNMA and FHLMC; however, we will make loans on rural residential properties up to 20 acres. Most residential loans have terms from ten to twenty years and carry fixed rates priced off of treasury rates. The Company has always underwritten mortgage loans based upon traditional underwriting criteria and does not make loans that are known in the industry as “subprime,” “no or low doc,” or “stated income.”
Home Equity Lines and Loans - These are loans made to individuals for home improvements and other personal needs. Generally, amounts do not exceed $250,000; Combined Loan To Value (CLTV) does not exceed 80%; FICO scores are at or above 670; Total Debt Ratios do not exceed 43%; and in some situations the Company is in a 1st lien position.
Agricultural - These are loans and lines of credit made to farmers to finance agricultural production. Lines of credit are extended to finance the seasonal needs of farmers during peak growing periods; are usually established for periods no longer than 12 to 24 months; are often secured by general filing liens on livestock, crops, crop proceeds and equipment; and are most often tied to the prime rate with an appropriate spread based on the amount of perceived risk in the loan. Term loans are primarily made for the financing of equipment, expansion or modernization of a processing plant, or orchard/vineyard development; have maturities from five to seven years; and fixed rates that are most often tied to treasury indices with an appropriate spread based on the amount of perceived risk in the loan.
Commercial - These are loans and lines of credit to businesses that are sole proprietorships, partnerships, LLC’s and corporations. Lines of credit are extended to finance the seasonal working capital needs of customers during peak business periods; are usually established for periods no longer than 12 to 24 months; are often secured by general filing liens on accounts receivable, inventory and equipment; and are most often tied to the prime rate with an appropriate spread based on the amount of perceived risk in the loan. Term loans are primarily made for the financing of equipment, expansion or modernization of a plant or purchase of a business; have maturities from five to seven years; and fixed rates that are most often tied to treasury indices with an appropriate spread based on the amount of perceived risk in the loan.
Consumer - These are loans to individuals for personal use, and primarily include loans to purchase automobiles or recreational vehicles, and unsecured lines of credit. The Company has a very minimal consumer loan portfolio, and loans are primarily made as an accommodation to deposit customers.
Leases –These are leases to businesses or individuals, for the purpose of financing the acquisition of equipment. They can be either “finance leases” where the lessee retains the tax benefits of ownership but obtains 100% financing on their equipment purchases; or “true tax leases” where the Company, as lessor, places reliance on equipment residual value and in doing so obtains the tax benefits of ownership. Leases typically have a maturity of three to ten years, and fixed rates that are most often tied to treasury indices with an appropriate spread based on the amount of perceived risk. Credit risks are underwritten using the same credit criteria the Company would use when making an equipment term loan. Residual value risk is managed through the use of qualified, independent appraisers that establish the residual values the Company uses in structuring a lease.
The Company accounts for leases with Investment Tax Credits (ITC) under the deferred method as established in Accounting Standard Codification (ASC)ASC 740-10. ITC are viewed and accounted for as a reduction of the cost of the related assets and presented as deferred income on the Company’s financial statement.
See “Item 7A. Quantitative and Qualitative Disclosures About Market Risk-Credit Risk” for a discussion about the credit risks the Company assumes and its overall credit risk management practices.
Each loan or lease type involves risks specific to the: (1) borrower; (2) collateral; and (3) loan & lease structure. See “Results of Operations - Provision and Allowance for Credit Losses” for a more detailed discussion of risks by loan & lease type. The Company’s current underwriting policies and standards are designed to mitigate the risks involved in each loan & lease type. The Company’s policies require that loans & leases are approved only to those borrowers exhibiting a clear source of repayment and the ability to service existing and proposed debt. The Company’s underwriting procedures for all loan & lease types require careful consideration of the borrower, the borrower’s financial condition, the borrower’s management capability, the borrower’s industry, and the economic environment affecting the loan or lease.
Most loans & leases made by the Company are secured, but collateral is the secondary or tertiary source of repayment; cash flow is our primary source of repayment. The quality and liquidity of collateral are important and must be confirmed before the loan is made.
In order to be responsive to borrower needs, the Company prices loans & leases: (1) on both a fixed rate and adjustable rate basis; (2) over different terms; and (3) based upon different rate indices; as long as these structures are consistent with the Company’s interest rate risk management policies and procedures. See “Item 7A. Quantitative and Qualitative Disclosures About Market Risk-Interest Rate Risk.”Risk” for further details.
Overall, the Company's loan & lease portfolio at December 31, 2014, increased $324.02016 totaled $2.2 billion, an increase of $181.2 million or 23.3% from9.1% over December 31, 2013.2015. This increase has occurred despite the continuing sluggish economic conditions in the Central Valley of California and isas a result of: (1) the Company’s intensified business development efforts directed toward credit-qualified borrowers; (2) entry into the equipment leasing business; and (3) expansion of our service area into Walnut Creek and Irvine.Concord. No assurances can be made that this growth in the loan & lease portfolio will continue.
The following table sets forth the distribution of the loan & lease portfolio by type and percent as of December 31 of the years indicated.
| 2014 | 2013 | 2012 | 2011 | 2010 | 2016 | 2015 | 2014 | 2013 | 2012 | |||||||||||||||||||||||||||||||||||||||||||||||||||||||||||||||||||||||
| (in thousands) | Amount | Percent | Amount | Percent | Amount | Percent | Amount | Percent | Amount | Percent | Amount | Percent | Amount | Percent | Amount | Percent | Amount | Percent | Amount | Percent | ||||||||||||||||||||||||||||||||||||||||||||||||||||||||||||
| Commercial Real Estate | $ | 495,316 | 28.9 | % | $ | 411,037 | 29.5 | % | $ | 353,109 | 28.3 | % | $ | 307,670 | 26.4 | % | $ | 318,341 | 27.0 | % | $ | 674,445 | 30.9 | % | $ | 609,602 | 30.4 | % | $ | 495,316 | 28.9 | % | $ | 411,037 | 29.5 | % | $ | 353,109 | 28.3 | % | ||||||||||||||||||||||||||||||||||||||||
| Agricultural Real Estate | 357,207 | 20.8 | % | 328,264 | 23.6 | % | 311,992 | 25.0 | % | 280,139 | 24.0 | % | 254,575 | 21.6 | % | 467,685 | 21.4 | % | 424,034 | 21.2 | % | 357,207 | 20.8 | % | 328,264 | 23.6 | % | 311,992 | 25.0 | % | ||||||||||||||||||||||||||||||||||||||||||||||||||
| Real Estate Construction | 96,519 | 5.6 | % | 41,092 | 3.0 | % | 32,680 | 2.6 | % | 29,607 | 2.5 | % | 37,486 | 3.2 | % | 176,462 | 8.1 | % | 151,974 | 7.6 | % | 96,519 | 5.6 | % | 41,092 | 3.0 | % | 32,680 | 2.6 | % | ||||||||||||||||||||||||||||||||||||||||||||||||||
| Residential 1st Mortgages | 171,880 | 10.0 | % | 151,292 | 10.9 | % | 140,257 | 11.2 | % | 107,421 | 9.2 | % | 103,574 | 8.8 | % | 242,247 | 11.1 | % | 206,405 | 10.3 | % | 171,880 | 10.0 | % | 151,292 | 10.9 | % | 140,257 | 11.2 | % | ||||||||||||||||||||||||||||||||||||||||||||||||||
| Home Equity Lines and Loans | 33,017 | 1.9 | % | 35,477 | 2.5 | % | 42,042 | 3.4 | % | 50,956 | 4.4 | % | 58,971 | 5.0 | % | 31,625 | 1.4 | % | 33,056 | 1.7 | % | 33,017 | 1.9 | % | 35,477 | 2.5 | % | 42,042 | 3.4 | % | ||||||||||||||||||||||||||||||||||||||||||||||||||
| Agricultural | 281,963 | 16.4 | % | 256,414 | 18.4 | % | 221,032 | 17.7 | % | 217,227 | 18.6 | % | 231,150 | 19.6 | % | 295,325 | 13.5 | % | 293,966 | 14.7 | % | 281,963 | 16.4 | % | 256,414 | 18.4 | % | 221,032 | 17.7 | % | ||||||||||||||||||||||||||||||||||||||||||||||||||
| Commercial | 230,819 | 13.5 | % | 150,398 | 10.8 | % | 143,293 | 11.5 | % | 165,089 | 14.2 | % | 165,263 | 14.0 | % | 217,577 | 10.0 | % | 210,804 | 10.5 | % | 230,819 | 13.5 | % | 150,398 | 10.8 | % | 143,293 | 11.5 | % | ||||||||||||||||||||||||||||||||||||||||||||||||||
| Consumer & Other | 4,719 | 0.3 | % | 5,052 | 0.4 | % | 5,058 | 0.3 | % | 6,935 | 0.7 | % | 8,712 | 0.8 | % | 6,913 | 0.3 | % | 6,592 | 0.3 | % | 4,719 | 0.3 | % | 5,052 | 0.4 | % | 5,058 | 0.3 | % | ||||||||||||||||||||||||||||||||||||||||||||||||||
| Leases | 44,217 | 2.6 | % | 12,733 | 0.9 | % | - | 0.0 | % | - | 0.0 | % | - | 0.0 | % | 70,986 | 3.3 | % | 65,054 | 3.3 | % | 44,217 | 2.6 | % | 12,733 | 0.9 | % | - | 0.0 | % | ||||||||||||||||||||||||||||||||||||||||||||||||||
| Total Gross Loans & Leases | 1,715,657 | 100.0 | % | 1,391,759 | 100.0 | % | 1,249,463 | 100.0 | % | 1,165,044 | 100.0 | % | 1,178,072 | 100.0 | % | 2,183,265 | 100.0 | % | 2,001,487 | 100.0 | % | 1,715,657 | 100.0 | % | 1,391,759 | 100.0 | % | 1,249,463 | 100.0 | % | ||||||||||||||||||||||||||||||||||||||||||||||||||
| Less: Unearned Income | 3,413 | 3,523 | 2,561 | 1,966 | 2,070 | 5,664 | 5,128 | 3,413 | 3,523 | 2,561 | ||||||||||||||||||||||||||||||||||||||||||||||||||||||||||||||||||||||
| Subtotal | 1,712,244 | 1,388,236 | 1,246,902 | 1,163,078 | 1,176,002 | 2,177,601 | 1,996,359 | 1,712,244 | 1,388,236 | 1,246,902 | ||||||||||||||||||||||||||||||||||||||||||||||||||||||||||||||||||||||
| Less: Allowance for Credit Losses | 35,401 | 34,274 | 34,217 | 33,017 | 32,261 | 47,919 | 41,523 | 35,401 | 34,274 | 34,217 | ||||||||||||||||||||||||||||||||||||||||||||||||||||||||||||||||||||||
| Loans & Leases, Net | $ | 1,676,843 | $ | 1,353,962 | $ | 1,212,685 | $ | 1,130,061 | $ | 1,143,741 | $ | 2,129,682 | $ | 1,954,836 | $ | 1,676,843 | $ | 1,353,962 | $ | 1,212,685 | ||||||||||||||||||||||||||||||||||||||||||||||||||||||||||||
There were no concentrations of loans exceeding 10% of total loans which were not otherwise disclosed as a category of loans in the above table.
The following table shows the maturity distribution and interest rate sensitivity of the loan portfolio of the Company on December 31, 2014.2016.
| (in thousands) | One Year or Less | Over One Year to | Over Five | Total | One Year or Less | Over One Year to Five Years | Over Five Years | Total | ||||||||||||||||||||||||
| Commercial Real Estate | $ | 23,276 | $ | 156,972 | $ | 311,655 | $ | 491,903 | $ | 62,685 | $ | 165,090 | $ | 440,271 | $ | 668,046 | ||||||||||||||||
| Agricultural Real Estate | 12,597 | 91,079 | 253,531 | 357,207 | 17,987 | 79,448 | 370,250 | 467,685 | ||||||||||||||||||||||||
| Real Estate Construction | 48,486 | 46,615 | 1,418 | 96,519 | 92,885 | 79,076 | 4,501 | 176,462 | ||||||||||||||||||||||||
| Residential 1st Mortgages | 391 | 3,201 | 168,288 | 171,880 | 10 | 4,769 | 237,468 | 242,247 | ||||||||||||||||||||||||
| Home Equity Lines and Loans | 24 | 871 | 32,122 | 33,017 | 23 | 782 | 30,820 | 31,625 | ||||||||||||||||||||||||
| Agricultural | 157,717 | 89,002 | 35,244 | 281,963 | 171,913 | 98,122 | 25,290 | 295,325 | ||||||||||||||||||||||||
| Commercial | 80,487 | 98,869 | 51,463 | 230,819 | 74,462 | 105,347 | 37,768 | 217,577 | ||||||||||||||||||||||||
| Consumer & Other | 903 | 3,301 | 515 | 4,719 | 853 | 4,389 | 1,671 | 6,913 | ||||||||||||||||||||||||
| Leases | - | 3,628 | 40,589 | 44,217 | 631 | 23,372 | 47,718 | 71,721 | ||||||||||||||||||||||||
| Total | $ | 323,881 | $ | 493,538 | $ | 894,825 | $ | 1,712,244 | $ | 421,449 | $ | 560,395 | $ | 1,195,757 | $ | 2,177,601 | ||||||||||||||||
| Rate Sensitivity: | ||||||||||||||||||||||||||||||||
| Fixed Rate | $ | 71,836 | $ | 158,713 | $ | 388,068 | $ | 618,617 | $ | 57,246 | $ | 216,047 | $ | 505,545 | $ | 778,838 | ||||||||||||||||
| Variable Rate | 252,046 | 334,824 | 506,757 | 1,093,627 | 364,204 | 344,347 | 690,212 | 1,398,763 | ||||||||||||||||||||||||
| Total | $ | 323,882 | $ | 493,537 | $ | 894,825 | $ | 1,712,244 | $ | 421,450 | $ | 560,394 | $ | 1,195,757 | $ | 2,177,601 | ||||||||||||||||
| Percent | 18.92 | % | 28.82 | % | 52.26 | % | 100.00 | % | 19.36 | % | 25.73 | % | 54.91 | % | 100.00 | % | ||||||||||||||||
Classified Loans & Leases and Non-Performing Assets
All loans & leases are assigned a credit risk grade using grading standards developed by bank regulatory agencies. See “Results of Operations - Provision and Allowance for Credit Losses” for more detail on risk grades. The Company utilizes the services of a third-party independent loan & lease review firm to perform evaluations of individual loans & leases and review the credit risk grades the Company places on loans & leases. Loans & leases that are judged to exhibit a higher risk profile are referred to as “classified” and these loans & leases receive increased management attention. As of December 31, 2014,2016, classified loans & leases totaled $3.6$6.4 million compared to $5.8$6.1 million at December 31, 2013.2015.
Classified loans & leases with higher levels of credit risk can be further designated as “impaired” loans & leases. A loan or lease is considered impaired when, based on current information and events, it is probable that the Company will be unable to collect all amounts due, including principal and interest, according to the contractual terms of the original agreement. See “Results of Operations - Provision and Allowance for Credit Losses” for further details. Impaired loans & leases consist of: (1) non-accrual loans & leases; and/or (2) restructured loans & leases that are still performing (i.e., accruing interest).
Non-Accrual Loans & Leases - Accrual of interest on loans & leases is generally discontinued when a loan or lease becomes contractually past due by 90 days or more with respect to interest or principal. When loans & leases are 90 days past due, but in management's judgment are well secured and in the process of collection, they may not be classified as non-accrual. When a loan or lease is placed on non-accrual status, all interest previously accrued but not collected is reversed. Income on such loans & leases is then recognized only to the extent that cash is received and where the future collection of principal is probable. As of December 31, 20142016 and 2013,2015, non-accrual loans & leases totaled $2.3$3.1 million and $2.6$2.2 million.
Restructured Loans & Leases - A restructuring of a loan or lease constitutes a troubled debt restructuring (“TDR”)TDR under ASC 310-40, if the Company for economic or legal reasons related to the debtor's financial difficulties grants a concession to the debtor that it would not otherwise consider. Restructured loans or leases typically present an elevated level of credit risk, as the borrowers are not able to perform according to the original contractual terms. If the restructured loan or lease was current on all payments at the time of restructure and management reasonably expects the borrower will continue to perform after the restructure, management may keep the loan or lease on accrual. Loans & leases that are on nonaccrual status at the time they become TDR loans, remain on nonaccrual status until the borrower demonstrates a sustained period of performance, which the Company generally believes to be six consecutive months of payments, or equivalent. A loan or lease can be removed from TDR status if it was restructured at a market rate in a prior calendar year and is currently in compliance with its modified terms. However, these loans or leases continue to be classified as impaired and are individually evaluated for impairment.
Other Real Estate - Loans where the collateral has been repossessed are classified as other real estate ("ORE") or, if the collateral is personal property, the loan is classified as other assets on the Company's financial statements.
The following table sets forth the amount of the Company's non-performing loans & leases and ORE as of December 31 of the years indicated.
| December 31, | December 31, | |||||||||||||||||||||||||||||||||||||||
| (in thousands) | 2014 | 2013 | 2012 | 2011 | 2010 | 2016 | 2015 | 2014 | 2013 | 2012 | ||||||||||||||||||||||||||||||
| Non-Accrual Loans & Leases | ||||||||||||||||||||||||||||||||||||||||
| Commercial Real Estate | $ | - | $ | - | $ | - | $ | 1,354 | $ | 2,348 | $ | - | $ | 19 | $ | - | $ | - | $ | - | ||||||||||||||||||||
| Agricultural Real Estate | - | - | 5,423 | 954 | 1,797 | 1,304 | - | - | - | 5,423 | ||||||||||||||||||||||||||||||
| Real Estate Construction | - | - | - | - | - | - | - | - | - | - | ||||||||||||||||||||||||||||||
| Residential 1st Mortgages | 77 | 324 | 445 | 284 | 954 | 95 | 65 | 77 | 324 | 445 | ||||||||||||||||||||||||||||||
| Home Equity Lines and Loans | 576 | 406 | 213 | 194 | - | - | 538 | 576 | 406 | 213 | ||||||||||||||||||||||||||||||
| Agricultural | 18 | 35 | 3,198 | 1,202 | - | 243 | - | 18 | 35 | 3,198 | ||||||||||||||||||||||||||||||
| Commercial | 1,586 | 1,815 | - | 217 | 207 | 1,426 | 1,524 | 1,586 | 1,815 | - | ||||||||||||||||||||||||||||||
| Consumer & Other | 13 | 16 | 19 | 23 | 2 | 6 | 10 | 13 | 16 | 19 | ||||||||||||||||||||||||||||||
| Total Non-Accrual Loans & Leases | 2,270 | 2,596 | 9,298 | 4,228 | 5,308 | 3,074 | 2,156 | 2,270 | 2,596 | 9,298 | ||||||||||||||||||||||||||||||
| Accruing Loans & Leases Past Due 90 Days or More | ||||||||||||||||||||||||||||||||||||||||
| Commercial Real Estate | - | - | - | - | - | - | - | - | - | - | ||||||||||||||||||||||||||||||
| Agricultural Real Estate | - | - | - | - | - | - | - | - | - | - | ||||||||||||||||||||||||||||||
| Real Estate Construction | - | - | - | - | - | - | - | - | - | - | ||||||||||||||||||||||||||||||
| Residential 1st Mortgages | - | - | - | - | - | - | - | - | - | - | ||||||||||||||||||||||||||||||
| Home Equity Lines and Loans | - | - | - | - | - | - | - | - | - | - | ||||||||||||||||||||||||||||||
| Agricultural | - | - | - | - | - | - | - | - | - | - | ||||||||||||||||||||||||||||||
| Commercial | - | - | - | - | - | - | - | - | - | - | ||||||||||||||||||||||||||||||
| Consumer & Other | - | - | - | - | - | - | - | - | - | - | ||||||||||||||||||||||||||||||
| Total Accruing Loans & Leases Past Due 90 Days or More | - | - | - | - | - | - | - | - | - | - | ||||||||||||||||||||||||||||||
| Total Non-Performing Loans & Leases | $ | 2,270 | $ | 2,596 | $ | 9,298 | $ | 4,228 | $ | 5,308 | $ | 3,074 | $ | 2,156 | $ | 2,270 | $ | 2,596 | $ | 9,298 | ||||||||||||||||||||
| Other Real Estate Owned | $ | 3,299 | $ | 4,611 | $ | 2,553 | $ | 2,924 | $ | 8,039 | $ | 3,745 | $ | 2,441 | $ | 3,299 | $ | 4,611 | $ | 2,553 | ||||||||||||||||||||
| Total Non-Performing Assets | $ | 5,569 | $ | 7,207 | $ | 11,851 | $ | 7,152 | $ | 13,347 | $ | 6,819 | $ | 4,597 | $ | 5,569 | $ | 7,207 | $ | 11,851 | ||||||||||||||||||||
| Restructured Loans & Leases (Performing) | $ | 4,955 | $ | 4,649 | $ | 2,300 | $ | 4,710 | $ | 27,652 | $ | 4,462 | $ | 4,953 | $ | 4,955 | $ | 4,649 | $ | 2,300 | ||||||||||||||||||||
| Non-Performing Loans & Leases as a Percent of Total Loans & Leases | 0.13 | % | 0.19 | % | 0.74 | % | 0.36 | % | 0.45 | % | 0.14 | % | 0.11 | % | 0.13 | % | 0.19 | % | 0.74 | % | ||||||||||||||||||||
Although management believes that non-performing loans & leases are generally well-secured and that potential losses are provided for in the Company’s allowance for credit losses, there can be no assurance that future deterioration in economic conditions and/or collateral values will not result in future credit losses. See Note 5,6, located in “Item 8. Financial Statements and Supplementary Data” for an allocation of the allowance classified to impaired loans & leases.
The Company reported $3.3$3.7 million of ORE at December 31, 2014,2016, and $4.6$2.4 million at December 31, 2013. The decrease in ORE during 2014 was a result of the Company selling an agricultural real estate property previously acquired through foreclosure. The December 31, 2014, carrying value of $3.3 million is net of a $3.7 million reserve for ORE valuation adjustments.2015. ORE at December 31, 20142016 includes a mix of agricultural real estate, raw land and residential finished lots.property.
Except for those classified and non-performing loans & leases discussed above, the Company’s management is not aware of any loans & leases as of December 31, 2014,2016, for which known financial problems of the borrower would cause serious doubts as to the ability of these borrowers to materially comply with their present loan or lease repayment terms, or any known events that would result in the loan or lease being designated as non-performing at some future date. However:
| · | The Central Valley was one of the hardest hit areas in the country during the recession. In many areas housing prices declined as much as 60% and unemployment reached 15% or more. Although the economy has |
| · | The |
| · | The agricultural industry is facing challenges associated with: (1) weakness in export markets due to a stronger dollar and proposed changes in trade policies; (2) tight labor markets and higher wages due to legislative changes at the state and federal levels; and (3) proposed changes in immigration policy and the resulting impact on the labor pool. |
Deposits
One of the key sources of funds to support earning assets is the generation of deposits from the Company’s customer base. The ability to grow the customer base and subsequently deposits is a significant element in the performance of the Company.
The following table sets forth, by time remaining to maturity, the Company’s time deposits in amounts of $250,000 or more at December 31, 2014.2016.
| (in thousands) | ||||||||
| Time Deposits of $250,000 or More | ||||||||
| Three Months or Less | $ | 186,073 | $ | 164,342 | ||||
| Over Three Months Through Six Months | 8,899 | 61,045 | ||||||
| Over Six Months Through Twelve Months | 25,906 | 36,009 | ||||||
| Over Twelve Months | 18,771 | 28,559 | ||||||
| Total Time Deposits of $250,000 or More | $ | 239,649 | $ | 289,955 | ||||
Refer to the Year-To-Date Average Balances and Rate Schedules located in this "Item 7. Management's Discussion and Analysis of Financial Condition and Results of Operations" for information on separate deposit categories.
At December 31, 2014,2016, deposits totaled $2.1$2.6 billion. This represents an increase of 14.2%13.4% or $256.4$304.2 million from December 31, 2013.2015. In addition to the Company’s ongoing business development activities for deposits, the following factors positively impacted year-over-year deposit growth: (1) the Federal government’s decision to permanently increase FDIC deposit insurance limits from $100,000 to $250,000 per depositor; and (2) the Company’s strong financial results and position and F&M Bank’s reputation as one of the most safe and sound banks in its market territory.area; and (2) the Company’s expansion of its service area into Walnut Creek and Concord. The Company expects that, at some point, deposit customers may begin to diversify how they invest their money (e.g., move funds back into the stock market or other investments) and this could impact future deposit growth.
Although total deposits have increased 14.2%13.4% since December 31, 2013,2015, the Company’s focus has beencontinues to be on increasing low cost transaction and savings accounts, which have grown at a faster pace:accounts:
| · | Demand and interest-bearing transaction accounts increased |
| · | Savings and money market accounts have increased |
| · | Time deposit accounts have increased |
Federal Home Loan Bank Advances and Federal Reserve Bank Borrowings
Lines of Credit with the Federal Reserve Bank and Federal Home Loan Bank are other key sources of funds to support earning assets. These sources of funds are also used to manage the Bank’s interest rate risk exposure; and, as opportunities arise, to borrow and invest the proceeds at a positive spread through the investment portfolio. There were no FHLB advances at December 31, 20142016 or 2013.2015. There were no Federal Funds purchased or advances from the FRB at December 31, 20142016 or 2013.2015.
Long-Term Subordinated Debentures
On December 17, 2003, the Company raised $10.0 million through the sale of subordinated debentures to an off-balance sheet trust and its sale of trust-preferred securities. See Note 13,14, located in “Item 8. Financial Statements and Supplementary Data.” UnderAlthough this amount is reflected as subordinated debt on the Company’s balance sheet, under current regulatory guidelines, these subordinated debenturesour TPS will continue to qualify as regulatory capital (See “Basel III Regulatory Capital Rules” for a discussion of the potential impact of proposed regulatory guidelines on this qualification).capital. These securities accrue interest at a variable rate based upon 3-month London InterBank Offered Rate (“LIBOR”) plus 2.85%. Interest rates reset quarterly (the next reset is March 16, 2015)2017) and the rate was 3.09%3.84% as of December 31, 2014.2016. The average rate paid for these securities was 3.12%3.60% in 20142016 and 3.17%3.19% in 2013.2015. Additionally, if the Company decided to defer interest on the subordinated debentures, the Company would be prohibited from paying cash dividends on the Company’s common stock.
Capital
The Company relies primarily on capital generated through the retention of earnings to satisfy its capital requirements. The Company engages in an ongoing assessment of its capital needs in order to support business growth and to insure depositor protection. Shareholders’ Equity totaled $233.2$280.0 million at December 31, 2014,2016, and $209.9$251.8 million at the end of 2013.2015.
The Company and the Bank are subject to various regulatory capital requirements administered by the federal banking agencies. Failure to meet minimum capital requirements can initiate certain actions by regulators that, if undertaken, could have a material effect on the Company and the Bank's financial statements. Under capital adequacy guidelines and the regulatory framework for prompt corrective action, the Company and the Bank must meet specific capital guidelines that involve quantitative measures of the Company’s and the Bank's assets, liabilities, and certain off-balance-sheet items as calculated under regulatory accounting practices. The Company’s and the Bank's capital amounts and classification are also subject to qualitative judgments by the regulators about components, risk weightings, and other factors.
The final rules became effective as applied to the Company and the Bank on January 1, 2015, with a phase in period through January 1, 2019. The Company believes that it is currently in compliance with all of these new capital adequacy requirements to which(as fully phased-in) and that they are subject. will not result in any restrictions on the Company’s business activity.
In addition, the most recent notification from the FDIC categorized the Bank as “well capitalized” under the regulatory framework for prompt corrective action. There are no conditions or events since that notification that management believes have changed the Bank’s category. For further information on the Company’s and the Bank’s risk-based capital ratios, see Note 14,15, located in “Item 8. Financial Statements and Supplementary Data.”
As previously discussed, in order to supplement its regulatory capital base, during December 2003, the Company issued $10.0 million of trust preferred securities. In accordance with the provisions of the “Consolidation” topic of the FASB Accounting Standards Codification (“ASC”), the Company does not consolidate the subsidiary trust, which has issued the trust-preferred securities.
In 1998, the Board approved the Company’s first common stock repurchase program. This program has been extended and expanded several times since then, and most recently, on SeptemberAugust 11, 2012,2015, the Board of Directors approved increasingan extension of the funds available for the Company’s common$20 million stock repurchase program to $20 million over the three-year period ending September 30, 2015.2018. See “Item 5. Market for Registrant’s Common Equity, Related Stockholder Matters and Issuer Purchases of Equity Securities.”
In 20142016 and 2013,2015, the Company did not repurchase any shares under the Stock Repurchase Program. The remaining dollar value of shares that may yet be purchased under the Company’s Stock Repurchase Program is approximately $20 million.
On August 5, 2008, the Board of Directors approved a Share Purchase Rights Plan (the “Rights Plan”), pursuant to which the Company entered into a Rights Agreement dated August 5, 2008, with Computershare (formerly Registrar and Transfer Company) as Rights Agent. See “Item 5. Market for Registrant’s Common Equity, Related Stockholder Matters and Issuer Purchases of Equity Securities” for further explanation.
Throughout 2015, the Company issued 6,705 shares of common stock. All of these shares were contributed to the Bank’s non-qualified defined contribution retirement plans. The average share price of these newly issued shares was $501 per share. The share price for each issuance was based upon a valuation completed by a nationally recognized bank consulting and advisory firm and in reliance upon the exemption in Section 4(a)(2) of the Securities Act of 1933, as amended, and the regulations promulgated thereunder. The proceeds from these issuances were contributed to the Bank as equity capital.
In December 4, 2014, the Company issued 6,200 shares of common stock to the Bank’s non-qualified defined contribution retirement plans. See Note 16,17, located in “Item 8. Financial Statements and Supplementary Data.” These shares were issued at a price of $450 per share based upon a valuation completed by a nationally recognized bank consulting and advisory firm.
Critical Accounting Policies and Estimates
This “Management’s Discussion and Analysis of Financial Condition and Results of Operations” is based upon the Company’s consolidated financial statements, which have been prepared in accordance with accounting principles generally accepted in the United States. In preparing the Company’s financial statements management makes estimates and judgments that affect the reported amounts of assets, liabilities, revenues, and expenses. Management believes that the most significant subjective judgments that it makes include the following:
Allowance for Credit Losses - As a financial institution, which assumes lending and credit risks as a principal element in its business, the Company anticipates that credit losses will be experienced in the normal course of business. Accordingly, the allowance for credit losses is maintained at a level considered adequate by management to provide for losses that are inherent in the portfolio. The allowance is increased by provisions charged to operating expense and reduced by net charge-offs. Management employs a systematic methodology for determining the allowance for credit losses. On a quarterly basis, management reviews the credit quality of the loan & lease portfolio and considers problem loans & leases, delinquencies, internal credit reviews, current economic conditions, loan & lease loss experience, and other factors in determining the adequacy of the allowance balance.
While the Company utilizes a systematic methodology in determining its allowance, the allowance is based on estimates, and ultimate losses may vary from current estimates. The estimates are reviewed periodically and, as adjustments become necessary, are reported in earnings in the periods in which they become known. For additional information, see Note 5,6, located in “Item 8. Financial Statements and Supplementary Data.”
Fair Value - The Company discloses the fair value of financial instruments and the methods and significant assumptions used to estimate those fair values. The estimated fair value amounts have been determined by the Company using available market information and appropriate valuation methodologies. The use of assumptions and various valuation techniques, as well as the absence of secondary markets for certain financial instruments, will likely reduce the comparability of fair value disclosures between financial institutions. In some cases, book value is a reasonable estimate of fair value due to the relatively short period of time between origination of the instrument and its expected realization. For additional information, see “Item 7A. Quantitative and Qualitative Disclosures About Market Risk – Credit Risk” and Notes 1718 and 1819 located in “Item 8. Financial Statements and Supplementary Data.”
Income Taxes - The Company uses the liability method of accounting for income taxes. This method results in the recognition of deferred tax assets and liabilities that are reflected at currently enacted income tax rates applicable to the period in which the deferred tax assets or liabilities are expected to be realized or settled. As changes in tax laws or rates are enacted, deferred tax assets and liabilities are adjusted through the provision for income taxes. The deferred provision for income taxes is the result of the net change in the deferred tax asset and deferred tax liability balances during the year. This amount combined with the current taxes payable or refundable results in the income tax expense for the current year. For additional information, see Note 1, located in “Item 8. Financial Statements and Supplementary Data.”
Off-Balance-Sheet Arrangements
Off-balance-sheet arrangements are any contractual arrangement to which an unconsolidated entity is a party, under which the Company has: (1) any obligation under a guarantee contract; (2) a retained or contingent interest in assets transferred to an unconsolidated entity or similar arrangement that serves as credit, liquidity, or market risk support to that entity for such assets; (3) any obligation under certain derivative instruments; or (4) any obligation under a material variable interest held by us in an unconsolidated entity that provides financing, liquidity, market risk, or credit risk support to the Company, or engages in leasing, hedging, or research and development services with the Company. The Company had the following off balance sheet commitments as of the dates indicated.
| (in thousands) | December 31, 2014 | December 31, 2013 | December 31, 2016 | December 31, 2015 | ||||||||||||
| Commitments to Extend Credit | $ | 539,288 | $ | 445,294 | $ | 609,653 | $ | 708,122 | ||||||||
| Letters of Credit | 9,734 | 7,393 | 20,444 | 14,745 | ||||||||||||
| Performance Guarantees Under Interest Rate Swap Contracts Entered Into Between Our Borrowing Customers and Third Parties | 2,042 | - | 1,835 | 2,758 | ||||||||||||
The Company's exposure to credit loss in the event of nonperformance by the other party with regard to standby letters of credit, undisbursed loan commitments, and financial guarantees is represented by the contractual notional amount of those instruments. Commitments to extend credit are agreements to lend to a customer as long as there is no violation of any condition established in the contract. The Company uses the same credit policies in making commitments and conditional obligations as it does for recorded balance sheet items. The Company may or may not require collateral or other security to support financial instruments with credit risk. Evaluations of each customer's creditworthiness are performed on a case-by-case basis.
Standby letters of credit are conditional commitments issued by the Company to guarantee performance of or payment for a customer to a third party. Most standby letters of credit are issued for 12 months or less. Commitments generally have fixed expiration dates or other termination clauses and may require payment of a fee. Additionally, the Company maintains a reserve for off balance sheet commitments, which totaled $142,000$267,000 at December 31, 20142016 and $167,000 at December 31, 2013.2015. We do not anticipate any material losses as a result of these transactions.
Aggregate Contractual Obligations and Commitments
The following table presents, as of December 31, 2014,2016, our significant and determinable contractual obligations by payment date. The payment amounts represent those amounts contractually due to the recipient and do not include any unamortized premiums or discounts, hedge basis adjustments, or other similar carrying value adjustments. For further information on the nature of each obligation type, see applicable note disclosures located in “Item 8. Financial Statements and Supplementary Data.”
| (in thousands) | Total | 1 Year or Less | 2-3 Years | 4-5 Years | More Than 5 Years | |||||||||||||||
| Operating Lease Obligations | $ | 2,051 | $ | 540 | $ | 568 | $ | 386 | $ | 557 | ||||||||||
| Long-Term Subordinated Debentures | 10,310 | - | - | - | 10,310 | |||||||||||||||
Deferred Compensation (1) | 37,546 | 679 | 1,129 | 389 | 35,349 | |||||||||||||||
| Total | $ | 49,907 | $ | 1,219 | $ | 1,697 | $ | 775 | $ | 46,216 | ||||||||||
| (in thousands) | Total | 1 Year or Less | 2-3 Years | 4-5 Years | More Than 5 Years | |||||||||||||||
| Operating Lease Obligations | $ | 2,974 | $ | 618 | $ | 1,128 | $ | 973 | $ | 255 | ||||||||||
| Long-Term Subordinated Debentures | 10,310 | - | - | - | 10,310 | |||||||||||||||
Deferred Compensation (1) | 49,819 | 1,532 | 11,030 | 1,368 | 35,889 | |||||||||||||||
| Total | $ | 63,103 | $ | 2,150 | $ | 12,158 | $ | 2,341 | $ | 46,454 | ||||||||||
(1) | These amounts represent obligations to participants under the Company's various non-qualified deferred compensation plans. All amounts have been fully funded in to a Rabbi Trust as of December 31, 2016. See Note 17 located in “Item 8. Financial Statements and Supplementary Data.” |
Quarterly Unaudited Financial Data
The following tables set forth certain unaudited historical quarterly financial data for each of the eight consecutive quarters in 20142016 and 2013.2015. This information is derived from unaudited consolidated financial statements that include, in management’s opinion, all adjustments (consisting of normal recurring adjustments) necessary for a fair presentation when read in conjunction with the consolidated financial statements and notes thereto included elsewhere in this Form 10-K.
2016 (in thousands except per share data) | First Quarter | Second Quarter | Third Quarter | Fourth Quarter | Total | |||||||||||||||
| Total Interest Income | $ | 24,026 | $ | 24,314 | $ | 25,262 | $ | 25,664 | $ | 99,266 | ||||||||||
| Total Interest Expense | 920 | 951 | 1,110 | 1,215 | 4,196 | |||||||||||||||
| Net Interest Income | 23,106 | 23,363 | 24,152 | 24,449 | 95,070 | |||||||||||||||
| Provision for Credit Losses | 2,600 | - | 250 | 3,485 | 6,335 | |||||||||||||||
| Net Interest Income After Provision for Credit Losses | 20,506 | 23,363 | 23,902 | 20,964 | 88,735 | |||||||||||||||
| Total Non-Interest Income | 2,721 | 2,875 | 4,553 | 5,108 | 15,257 | |||||||||||||||
| Total Non-Interest Expense | 12,019 | 14,737 | 16,414 | 15,002 | 58,172 | |||||||||||||||
| Income Before Income Taxes | 11,208 | 11,501 | 12,041 | 11,070 | 45,820 | |||||||||||||||
| Provision for Income Taxes | 4,036 | 4,169 | 4,503 | 3,389 | 16,097 | |||||||||||||||
| Net Income | $ | 7,172 | $ | 7,332 | $ | 7,538 | $ | 7,681 | $ | 29,723 | ||||||||||
| Basic Earnings Per Common Share | $ | 9.06 | $ | 9.25 | $ | 9.51 | $ | 9.62 | $ | 37.44 | ||||||||||
| 2014 | First | Second | Third | Fourth | ||||||||||||||||||||||||||||||||||||
| (in thousands except per share data) | Quarter | Quarter | Quarter | Quarter | Total | |||||||||||||||||||||||||||||||||||
2015 (in thousands except per share data) | First Quarter | Second Quarter | Third Quarter | Fourth Quarter | Total | |||||||||||||||||||||||||||||||||||
| Total Interest Income | $ | 19,047 | $ | 19,458 | $ | 20,614 | $ | 22,402 | $ | 81,521 | $ | 21,293 | $ | 21,756 | $ | 23,038 | $ | 23,988 | $ | 90,075 | ||||||||||||||||||||
| Total Interest Expense | 680 | 678 | 708 | 747 | 2,813 | 792 | 835 | 860 | 838 | 3,325 | ||||||||||||||||||||||||||||||
| Net Interest Income | 18,367 | 18,780 | 19,906 | 21,655 | 78,708 | 20,501 | 20,921 | 22,178 | 23,150 | 86,750 | ||||||||||||||||||||||||||||||
| Provision for Credit Losses | - | - | - | 1,175 | 1,175 | 600 | 50 | - | 100 | 750 | ||||||||||||||||||||||||||||||
| Net Interest Income After | ||||||||||||||||||||||||||||||||||||||||
| Provision for Credit Losses | 18,367 | 18,780 | 19,906 | 20,480 | 77,533 | |||||||||||||||||||||||||||||||||||
| Net Interest Income After Provision for Credit Losses | 19,901 | 20,871 | 22,178 | 23,050 | 86,000 | |||||||||||||||||||||||||||||||||||
| Total Non-Interest Income | 3,162 | 3,943 | 2,920 | 4,304 | 14,329 | 4,664 | 2,826 | 3,710 | 3,375 | 14,575 | ||||||||||||||||||||||||||||||
| Total Non-Interest Expense | 11,640 | 13,034 | 12,542 | 14,150 | 51,366 | 14,218 | 12,761 | 14,488 | 14,792 | 56,259 | ||||||||||||||||||||||||||||||
| Income Before Income Taxes | 9,889 | 9,689 | 10,284 | 10,634 | 40,496 | 10,347 | 10,936 | 11,400 | 11,633 | 44,316 | ||||||||||||||||||||||||||||||
| Provision for Income Taxes | 3,607 | 3,585 | 3,852 | 4,050 | 15,094 | 3,944 | 4,187 | 4,360 | 4,433 | 16,924 | ||||||||||||||||||||||||||||||
| Net Income | $ | 6,282 | $ | 6,104 | $ | 6,432 | $ | 6,584 | $ | 25,402 | $ | 6,403 | $ | 6,749 | $ | 7,040 | $ | 7,200 | $ | 27,392 | ||||||||||||||||||||
| Basic Earnings Per Common Share | $ | 8.08 | $ | 7.84 | $ | 8.27 | $ | 8.45 | $ | 32.64 | $ | 8.15 | $ | 8.59 | $ | 8.96 | $ | 9.12 | $ | 34.82 | ||||||||||||||||||||
| 2013 | First | Second | Third | Fourth | ||||||||||||||||||||||||||||||||||||
| (in thousands except per share data) | Quarter | Quarter | Quarter | Quarter | Total | |||||||||||||||||||||||||||||||||||
| Total Interest Income | $ | 18,255 | $ | 18,945 | $ | 19,615 | $ | 19,716 | $ | 76,531 | ||||||||||||||||||||||||||||||
| Total Interest Expense | 764 | 719 | 721 | 687 | 2,891 | |||||||||||||||||||||||||||||||||||
| Net Interest Income | 17,491 | 18,226 | 18,894 | 19,029 | 73,640 | |||||||||||||||||||||||||||||||||||
| Provision for Credit Losses | - | 250 | - | 175 | 425 | |||||||||||||||||||||||||||||||||||
| Net Interest Income After | ||||||||||||||||||||||||||||||||||||||||
| Provision for Credit Losses | 17,491 | 17,976 | 18,894 | 18,854 | 73,215 | |||||||||||||||||||||||||||||||||||
| Total Non-Interest Income | 5,497 | 2,964 | 3,448 | 4,028 | 15,937 | |||||||||||||||||||||||||||||||||||
| Total Non-Interest Expense | 12,959 | 12,102 | 12,185 | 13,624 | 50,870 | |||||||||||||||||||||||||||||||||||
| Income Before Income Taxes | 10,029 | 8,838 | 10,157 | 9,258 | 38,282 | |||||||||||||||||||||||||||||||||||
| Provision for Income Taxes | 3,778 | 3,273 | 3,805 | 3,365 | 14,221 | |||||||||||||||||||||||||||||||||||
| Net Income | $ | 6,251 | $ | 5,565 | $ | 6,352 | $ | 5,893 | $ | 24,061 | ||||||||||||||||||||||||||||||
| Basic Earnings Per Common Share | $ | 8.04 | $ | 7.15 | $ | 8.17 | $ | 7.57 | $ | 30.93 | ||||||||||||||||||||||||||||||
Risk Management
The Company has adopted risk management policies and procedures, which aim to ensure the proper control and management of all risk factors inherent in the operation of the Company, most importantly credit risk, interest rate risk and liquidity risk. These risk factors are not mutually exclusive. It is recognized that any product or service offered by the Company may expose the Company to one or more of these risk factors.
Credit Risk
Credit risk is the risk to earnings or capital arising from an obligor’s failure to meet the terms of any contract or otherwise fail to perform as agreed. Credit risk is found in all activities where success depends on counterparty, issuer, or borrower performance.
Credit risk in the investment portfolio and correspondent bank accounts is addressed through defined limits in the Company’s policy statements. In addition, certain securities carry insurance to enhance credit quality of the bond.
In order to control credit risk in the loan & lease portfolio the Company has established credit management policies and procedures that govern both the approval of new loans & leases and the monitoring of the existing portfolio. The Company manages and controls credit risk through comprehensive underwriting and approval standards, dollar limits on loans & leases to one borrower, and by restricting loans & leases made primarily to its principal market area where management believes it is best able to assess the applicable risk. Additionally, management has established guidelines to ensure the diversification of the Company’s credit portfolio such that even within key portfolio sectors such as real estate or agriculture, the portfolio is diversified across factors such as location, building type, crop type, etc. However, as a financial institution that assumes credit risks as a principal element of its business, credit losses will be experienced in the normal course of business. The allowance for credit losses is maintained at a level considered by management to be adequate to provide for risks inherent in the loan & lease portfolio. The allowance is increased by provisions charged to operating expense and reduced by net charge-offs.
The Company’s methodology for assessing the appropriateness of the allowance is applied on a regular basis and considers all loans & leases. The systematic methodology consists of three parts.
Part 1 - includes a detailed analysis of the loan & lease portfolio in two phases. The first phase is conducted in accordance with the “Receivables” topic of the FASB ASC. Individual loans & leases are reviewed to identify them for impairment. A loan or lease is impaired when principal and interest are deemed uncollectible in accordance with the original contractual terms of the loan or lease. Impairment is measured as either the expected future cash flows discounted at each loan’s or lease’s effective interest rate, the fair value of the loan’s or lease’s collateral if the loan or lease is collateral dependent, or an observable market price of the loan or lease, if one exists. Upon measuring the impairment, the Company will ensure an appropriate level of allowance is present or established.
Central to the first phase of the analysis of the loan & lease portfolio is the risk rating system. The originating credit officer assigns each borrower an initial risk rating, which is based primarily on a thorough analysis of that borrower’s financial position in conjunction with industry and economic trends. Approvals are made based upon the amount of inherent credit risk specific to the transaction and are reviewed for appropriateness by senior credit administration personnel. Credits are monitored by credit administration personnel for deterioration in a borrower’s financial condition, which would impact the ability of the borrower to perform under the contract. Risk ratings are adjusted as necessary. Risk ratings are reviewed by both the Company’s independent third-party credit examiners and bank examiners from the DBO and FDIC.
Based on the risk rating system, specific allowances are established in cases where management has identified significant conditions or circumstances related to a credit that management believes indicates that the loan or lease is impaired and there is a probability of loss. Management performs a detailed analysis of these loans & leases, including, but not limited to, cash flows, appraisals of the collateral, conditions of the marketplace for liquidating the collateral, and assessment of the guarantors. Management then determines the inherent loss potential and allocates a portion of the allowance for losses as a specific allowance for each of these credits.
The second phase is conducted by segmenting the loan & lease portfolio by risk rating and into groups of loans & leases with similar characteristics in accordance with the “Contingency” topic of the FASB ASC. In this second phase, groups of loans & leases with similar characteristics are reviewed and the appropriate allowance factor is applied based on the historical average charge-off rate for each particular group of loans or leases.
Part 2 - considers qualitative internal and external factors that may affect a loan or lease’s collectability, is based upon management’s evaluation of various conditions, the effects of which are not directly measured in the determination of the historical and specific allowances. The evaluation of the inherent loss with respect to these conditions is subject to a higher degree of uncertainty because they are not identified with specific problem credits or portfolio segments. The conditions evaluated in connection with the second element of the analysis of the allowance include, but are not limited to the following conditions that existed as of the balance sheet date:
| § | general economic and business conditions affecting the key service areas of the Company; |
| § | credit quality trends (including trends in collateral values, delinquencies and non-performing loans & leases); |
| § | loan & lease volumes, growth rates and concentrations; |
| § | loan & lease portfolio seasoning; |
| § | specific industry and crop conditions; |
| § | recent loss experience; and |
| § | duration of the current business cycle. |
Part 3 - An unallocated allowance often occurs due to the imprecision in estimating and allocating allowance balances associated with macro factors such as: (1) the continuing sluggishimproving but fragile economic conditions in the Central Valley; and (2) the long term impactlong-term risks associated with the availability of drought conditions currently being experiencedwater in California.the Central Valley.
Management reviews all of these conditions in discussion with the Company’s senior credit officers. To the extent that any of these conditions is evidenced by a specifically identifiable impaired credit or portfolio segment as of the evaluation date, management’s estimate of the effect of such condition may be reflected as a specific allowance applicable to such credit or portfolio segment. Where any of these conditions is not evidenced by a specifically identifiable impaired credit or portfolio segment as of the evaluation date, management’s evaluation of the inherent loss related to such condition is reflected in the second element of the allowance or in the unallocated allowance.
Management believes, that based upon the preceding methodology, and using information currently available, the allowance for credit losses at December 31, 20142016 was adequate. No assurances can be given that future events may not result in increases in delinquencies, non-performing loans & leases, or net loan & lease charge-offs that would require increases in the provision for credit losses and thereby adversely affect the results of operations.
Interest Rate Risk
The mismatch between maturities of interest sensitive assets and liabilities results in uncertainty in the Company’s earnings and economic value and is referred to as interest rate risk. The Company does not attempt to predict interest rates and positions the balance sheet in a manner, which seeks to minimize, to the extent possible, the effects of changing interest rates.
The Company measures interest rate risk in terms of potential impact on both its economic value and earnings. The methods for governing the amount of interest rate risk include: (1) analysis of asset and liability mismatches (Gap analysis); (2) the utilization of a simulation model; and (3) limits on maturities of investment, loan & lease, and deposit products, which reduces the market volatility of those instruments.
The Gap analysis measures, at specific time intervals, the divergence between earning assets and interest bearing liabilities for which repricing opportunities will occur. A positive difference, or Gap, indicates that earning assets will reprice faster than interest-bearing liabilities. This will generally produce a greater net interest margin during periods of rising interest rates and a lower net interest margin during periods of declining interest rates. Conversely, a negative Gap will generally produce a lower net interest margin during periods of rising interest rates and a greater net interest margin during periods of decreasing interest rates.
The interest rates paid on deposit accounts do not always move in unison with the rates charged on loans & leases. In addition, the magnitude of changes in the rates charged on loans & leases is not always proportionate to the magnitude of changes in the rate paid for deposits. Consequently, changes in interest rates do not necessarily result in an increase or decrease in the net interest margin solely as a result of the differences between repricing opportunities of earning assets or interest bearing liabilities.
The Company also utilizes the results of a dynamic simulation model to quantify the estimated exposure of net interest income to sustained interest rate changes. The sensitivity of the Company’s net interest income is measured over a rolling one-year horizon.
The simulation model estimates the impact of changing interest rates on interest income from all interest earning assets and the interest expense paid on all interest bearing liabilities reflected on the Company’s balance sheet. This sensitivity analysis is compared to policy limits, which specify a maximum tolerance level for net interest income exposure over a one-year horizon assuming no balance sheet growth, given a 200 basis point upward and a 100 basis point downward shift in interest rates. A shift in rates over a 12-month period is assumed. Results that exceed policy limits, if any, are analyzed for risk tolerance and reported to the Board with appropriate recommendations. At December 31, 2014,2016, the Company’s estimated net interest income sensitivity to changes in interest rates, as a percent of net interest income was an increase in net interest income of 2.98%5.26% if rates increase by 200 basis points and a decrease in net interest income of 0.17%3.22% if rates decline 100 basis points.
The estimated sensitivity does not necessarily represent a Company forecast and the results may not be indicative of actual changes to the Company’s net interest income. These estimates are based upon a number of assumptions including: the nature and timing of interest rate levels including yield curve shape; prepayments on loans & leases and securities; pricing strategies on loans & leases and deposits; replacement of asset and liability cash flows; and other assumptions. While the assumptions used are based on current economic and local market conditions, there is no assurance as to the predictive nature of these conditions including how customer preferences or competitor influences might change.
Liquidity Risk
Liquidity risk is the risk to earnings or capital resulting from the Company’s inability to meet its obligations when they come due without incurring unacceptable losses. It includes the ability to manage unplanned decreases or changes in funding sources and to recognize or address changes in market conditions that affect the Company’s ability to liquidate assets or acquire funds quickly and with minimum loss of value. The Company endeavors to maintain a cash flow adequate to fund operations, handle fluctuations in deposit levels, respond to the credit needs of borrowers, and to take advantage of investment opportunities as they arise.
The Company’s principal operating sources of liquidity include (see “Item 8. Financial Statements and Supplementary Data – Consolidated Statements of Cash Flows”) cash and cash equivalents, cash provided by operating activities, principal payments on loans & leases, proceeds from the maturity or sale of investments, and growth in deposits. To supplement these operating sources of funds the Company maintains Federal Funds credit lines of $71$75 million and repurchase lines of $100$130 million with major banks. As of December 31, 2014,2016, the Company has additional borrowing capacity of $257.0$401.7 million with the Federal Home Loan Bank and $340.8$356.1 million with the Federal Reserve Bank. Borrowings under these lines are collateralized with loans or securities that have been accepted for pledging at the FHLB and FRB.
At December 31, 2014,2016, the Company had available sources of liquidity, which included cash and cash equivalents and unpledged investment securities available-for-sale of approximately $309.6$321.2 million, which represents 13.1%10% of total assets.
INDEX TO CONSOLIDATED FINANCIAL STATEMENTS
AND FINANCIAL STATEMENT SCHEDULES
Page | ||
| Report of Management on Internal Control Over Financial Reporting | ||
| Reports of Independent Registered Public Accounting | ||
| Consolidated Financial Statements | ||
| Consolidated Balance Sheets – December 31, | 63 | |
| Consolidated Statements of Income – Years ended December 31, | 64 | |
| Consolidated Statements of Comprehensive Income – Years Ended December 31, | 65 | |
| Consolidated Statements of Changes in Shareholders' Equity – Years ended December 31, | 66 | |
| Consolidated Statements of Cash Flows - Years Ended December 31, | 67 | |
| Notes to Consolidated Financial Statements | 68 | |
Farmers & Merchants Bancorp
Report of Management on Internal Control Over Financial Reporting
Management of Farmers & Merchants Bancorp and Subsidiaries (the “Company”) is responsible for establishing and maintaining adequate internal control over financial reporting at Farmers & Merchants Bancorp (“as defined in Rules 13a-15(f) and 15d-15(f) under the Company”). InternalSecurities Exchange Act of 1934, and for performing an assessment of the effectiveness of internal control over financial reporting as of December 31, 2016. The Company’s internal control over financial reporting is a process designed under the supervision of the Company’s management, including the Chief Executive Officer and Chief Financial Officer, to provide reasonable assurance regarding the reliability of financial reporting and the preparation of financial statements for external purposes in accordance with accounting principles generally accepted in the United States.
The Company’s system of internal control over financial reporting includes controls overpolicies and procedures that (i) pertain to the maintenance of records that, in reasonable detail, accurately and fairly reflect transactions and dispositions of assets of the Company; (ii) provide reasonable assurance that transactions are recorded as necessary to permit preparation of financial statements in accordance with accounting principles generally accepted in the instructionsUnited States, and that receipts and expenditures of the Company are being made only in accordance with authorizations of management and directors of the Company; and (iii) provide reasonable assurance regarding prevention or timely detection of unauthorized acquisition, use or disposition of the Company’s assets that could have a material effect on the financial statements.
Management recognizes that there are inherent limitations in the effectiveness of any system of internal control, and accordingly, even effective internal control can provide only reasonable assurance with respect to financial statement preparation and fair presentation. Further, because of changes in conditions, the Consolidated Financial Statements for Bank Holding Companies (Form FR Y-9C) to complyeffectiveness of internal control may vary over time.
Under the supervision and with the reporting requirements of Part 363participation of the Federal Deposit Insurance Corporation RulesCompany’s management, including the Company’s Chief Executive Officer and Regulations.
Moss Adams LLP, the independent registered public accounting firm that audited the financial statements included in this Annual Report, was engaged to express an opinion as to the fairness of presentation of such financial statements. Moss Adams LLP was also engaged to audit the effectiveness of the Company’s internal control over financial reporting. The report of Moss Adams LLP follows this report.
| /s/ Kent A. Steinwert | /s/ Stephen W. Haley |
| Kent A. Steinwert | Stephen W. Haley |
| Chairman, President & Chief Executive Officer | Executive Vice President & Chief Financial Officer |
REPORT OF INDEPENDENT REGISTERED PUBLIC ACCOUNTING FIRM
To the Board of Directors and Stockholders
Farmers & Merchants Bancorp
We have audited the accompanying consolidated balance sheets of Farmers & Merchants Bancorp and subsidiaries (the Company)“Company”) as of December 31, 20142016 and 20132015, and the related consolidated statements of income, comprehensive income, changes in shareholders’stockholders’ equity, and cash flows for each of the twothree years in the period ended December 31, 2014.2016. We also have also audited the Company’s internal control over financial reporting as of December 31, 2014,2016, based on criteria established in Internal Control – Integrated Framework (2013) issued by the Committee of Sponsoring Organizations of the Treadway Commission. The Company’s management is responsible for these consolidated financial statements, for maintaining effective internal control over financial reporting, and for its assessment of the effectiveness of internal control over financial reporting, included in the accompanying Management’s Report Onof Management on Internal Control Overover Financial Reporting. Our responsibility is to express an opinion on these consolidated financial statements and an opinion on the Company’s internal control over financial reporting based on our audits.
We conducted our audits in accordance with the standards of the Public Company Accounting Oversight Board (United States). Those standards require that we plan and perform the auditaudits to obtain reasonable assurance about whether the consolidated financial statements are free of material misstatement and whether effective internal control over financial reporting was maintained in all material respects. Our audits of the consolidated financial statements included examining, on a test basis, evidence supporting the amounts and disclosures in the consolidated financial statements, assessing the accounting principles used and significant estimates made by management, and evaluating the overall consolidated financial statement presentation. Our audit of internal control over financial reporting included obtaining an understanding of internal control over financial reporting, assessing the risk that a material weakness exists, and testing and evaluating the design and operating effectiveness of internal control based on the assessed risk. Our auditaudits also included performing such other procedures as we considered necessary in the circumstances. We believe that our audits provide a reasonable basis for our opinions.
A company’s internal control over financial reporting is a process designed to provide reasonable assurance regarding the reliability of financial reporting and the preparation of financial statements for external purposes in accordance with generally accepted accounting principles. A company’s internal control over financial reporting includes those policies and procedures that (1) pertain to the maintenance of records that, in reasonable detail, accurately and fairly reflect the transactions and dispositions of the assets of the company; (2) provide reasonable assurance that transactions are recorded as necessary to permit preparation of financial statements in accordance with generally accepted accounting principles, and that receipts and expenditures of the company are being made only in accordance with authorizations of management and directors of the company; and (3) provide reasonable assurance regarding prevention or timely detection of unauthorized acquisition, use, or disposition of the company’s assets that could have a material effect on the financial statements.
Because of its inherent limitations, internal control over financial reporting may not prevent or detect misstatements. Also, projections of any evaluation of the effectiveness to future periods are subject to the risk that controls may become inadequate because of changes in conditions, or that the degree of compliance with the policies or procedures may deteriorate.
In our opinion, the consolidated financial statements referred to above present fairly, in all material respects, the consolidated financial position of Farmers & Merchants Bancorp and subsidiaries as of December 31, 20142016 and 20132015, and the consolidated results of their operations and their cash flows for each of the twothree years in the period ended December 31, 20142016, in conformity with accounting principles generally accepted accounting principles in the United States of America. Also in our opinion, Farmers & Merchants Bancorp maintained, in all material respects, effective internal control over financial reporting as of December 31, 2014,2016, based on criteria established in Internal Control – Integrated Framework (2013) issued by the Committee of Sponsoring Organizations of the Treadway Commission.
/s/ Moss Adams LLP
Stockton, California
March 13, 2015
15, 2017 | ||
Farmers & Merchants Bancorp
(in thousands except share and per share data)
| December 31, | ||||||||
| Assets | 2016 | 2015 | ||||||
| Cash and Cash Equivalents: | ||||||||
| Cash and Due from Banks | $ | 54,896 | $ | 49,913 | ||||
| Interest Bearing Deposits with Banks | 43,964 | 9,533 | ||||||
| Total Cash and Cash Equivalents | 98,860 | 59,446 | ||||||
| Investment Securities: | ||||||||
| Available-for-Sale | 448,263 | 369,137 | ||||||
| Held-to-Maturity | 58,109 | 61,396 | ||||||
| Total Investment Securities | 506,372 | 430,533 | ||||||
| Loans & Leases: | 2,177,601 | 1,996,359 | ||||||
| Less: Allowance for Credit Losses | 47,919 | 41,523 | ||||||
| Loans& Leases, Net | 2,129,682 | 1,954,836 | ||||||
| Premises and Equipment, Net | 29,229 | 26,575 | ||||||
| Bank Owned Life Insurance | 57,761 | 55,898 | ||||||
| Interest Receivable and Other Assets | 100,217 | 88,057 | ||||||
| Total Assets | $ | 2,922,121 | $ | 2,615,345 | ||||
| Liabilities | ||||||||
| Deposits: | ||||||||
| Demand | $ | 756,236 | $ | 711,029 | ||||
| Interest-Bearing Transaction | 495,063 | 377,594 | ||||||
| Savings and Money Market | 760,119 | 707,885 | ||||||
| Time | 570,293 | 481,024 | ||||||
| Total Deposits | 2,581,711 | 2,277,532 | ||||||
| Subordinated Debentures | 10,310 | 10,310 | ||||||
| Interest Payable and Other Liabilities | 50,119 | 75,668 | ||||||
| Total Liabilities | 2,642,140 | 2,363,510 | ||||||
| Commitments & Contingencies (See Note 20) | ||||||||
| Shareholders' Equity | ||||||||
| Preferred Stock: No Par Value, 1,000,000 Shares Authorized, None Issued or Outstanding | - | - | ||||||
| Common Stock: Par Value $0.01, 7,500,000 Shares Authorized, 807,329 and 790,787 Shares Issued and Outstanding at December 31, 2016 and 2015, respectively. | 8 | 8 | ||||||
| Additional Paid-In Capital | 90,671 | 81,164 | ||||||
| Retained Earnings | 189,313 | 170,068 | ||||||
| Accumulated Other Comprehensive Income | (11 | ) | 595 | |||||
| Total Shareholders' Equity | 279,981 | 251,835 | ||||||
| Total Liabilities and Shareholders' Equity | $ | 2,922,121 | $ | 2,615,345 | ||||
| December 31, | ||||||||
| Assets | 2014 | 2013 | ||||||
| Cash and Cash Equivalents: | ||||||||
| Cash and Due from Banks | $ | 42,375 | $ | 40,966 | ||||
| Interest Bearing Deposits with Banks | 34,750 | 42,711 | ||||||
| Total Cash and Cash Equivalents | 77,125 | 83,677 | ||||||
| Investment Securities: | ||||||||
| Available-for-Sale | 366,542 | 404,639 | ||||||
| Held-to-Maturity | 63,863 | 68,505 | ||||||
| Total Investment Securities | 430,405 | 473,144 | ||||||
| Loans & Leases: | 1,712,244 | 1,388,236 | ||||||
| Less: Allowance for Credit Losses | 35,401 | 34,274 | ||||||
| Loans& Leases, Net | 1,676,843 | 1,353,962 | ||||||
| Premises and Equipment, Net | 25,821 | 22,887 | ||||||
| Bank Owned Life Insurance | 53,990 | 52,109 | ||||||
| Interest Receivable and Other Assets | 96,367 | 90,294 | ||||||
| Total Assets | $ | 2,360,551 | $ | 2,076,073 | ||||
| Liabilities | ||||||||
| Deposits: | ||||||||
| Demand | $ | 610,133 | $ | 495,963 | ||||
| Interest-Bearing Transaction | 341,397 | 291,795 | ||||||
| Savings and Money Market | 644,260 | 589,511 | ||||||
| Time | 468,283 | 430,422 | ||||||
| Total Deposits | 2,064,073 | 1,807,691 | ||||||
| Subordinated Debentures | 10,310 | 10,310 | ||||||
| Interest Payable and Other Liabilities | 52,990 | 48,168 | ||||||
| Total Liabilities | 2,127,373 | 1,866,169 | ||||||
| Commitments & Contingencies (See Note 19) | ||||||||
| Shareholders' Equity | ||||||||
| Preferred Stock: No Par Value, 1,000,000 Shares Authorized, None Issued or Outstanding | - | - | ||||||
| Common Stock: Par Value $0.01, 7,500,000 Shares Authorized, 784,082 and 777,882 Shares Issued and Outstanding at December 31, 2014 and 2013, respectively. | 8 | 8 | ||||||
| Additional Paid-In Capital | 77,804 | 75,014 | ||||||
| Retained Earnings | 152,833 | 137,350 | ||||||
| Accumulated Other Comprehensive Income (Loss) | 2,533 | (2,468 | ) | |||||
| Total Shareholders' Equity | 233,178 | 209,904 | ||||||
| Total Liabilities and Shareholders' Equity | $ | 2,360,551 | $ | 2,076,073 | ||||
The accompanying notes are an integral part of these consolidated financial statements
Farmers & Merchants Bancorp
(in thousands except per share data)
| Year Ended December 31, | Year Ended December 31, | |||||||||||||||||||||||
| 2014 | 2013 | 2012 | 2016 | 2015 | 2014 | |||||||||||||||||||
| Interest Income | ||||||||||||||||||||||||
| Interest and Fees on Loans & Leases | $ | 71,310 | $ | 64,921 | $ | 65,798 | $ | 91,570 | $ | 81,558 | $ | 71,310 | ||||||||||||
| Interest on Deposits with Banks | 158 | 79 | 110 | 287 | 172 | 158 | ||||||||||||||||||
| Interest on Investment Securities: | ||||||||||||||||||||||||
| Taxable | 7,739 | 8,971 | 9,940 | 5,505 | 6,311 | 7,739 | ||||||||||||||||||
| Exempt from Federal Tax | 2,314 | 2,560 | 2,643 | 1,904 | 2,034 | 2,314 | ||||||||||||||||||
| Total Interest Income | 81,521 | 76,531 | 78,491 | 99,266 | 90,075 | 81,521 | ||||||||||||||||||
| Interest Expense | ||||||||||||||||||||||||
| Deposits | 2,486 | 2,548 | 3,739 | 3,807 | 2,989 | 2,486 | ||||||||||||||||||
| Borrowed Funds | 5 | 16 | 1,054 | 18 | 7 | 5 | ||||||||||||||||||
| Subordinated Debentures | 322 | 327 | 347 | 371 | 329 | 322 | ||||||||||||||||||
| Total Interest Expense | 2,813 | 2,891 | 5,140 | 4,196 | 3,325 | 2,813 | ||||||||||||||||||
| Net Interest Income | 78,708 | 73,640 | 73,351 | 95,070 | 86,750 | 78,708 | ||||||||||||||||||
| Provision for Credit Losses | 1,175 | 425 | 1,850 | 6,335 | 750 | 1,175 | ||||||||||||||||||
| Net Interest Income After Provision for Credit Losses | 77,533 | 73,215 | 71,501 | 88,735 | 86,000 | 77,533 | ||||||||||||||||||
| Non-Interest Income | ||||||||||||||||||||||||
| Service Charges on Deposit Accounts | 3,923 | 4,350 | 4,891 | 3,376 | 3,458 | 3,923 | ||||||||||||||||||
| Net Gain (Loss) on Investment Securities | 90 | (229 | ) | 158 | ||||||||||||||||||||
| Net (Loss) Gain on Investment Securities | (284 | ) | 275 | 90 | ||||||||||||||||||||
| Increase in Cash Surrender Value of Life Insurance | 1,881 | 1,856 | 1,836 | 1,864 | 1,908 | 1,881 | ||||||||||||||||||
| Debit Card and ATM Fees | 3,087 | 3,069 | 2,938 | 3,398 | 3,183 | 3,087 | ||||||||||||||||||
| Net Gain on Deferred Compensation Investments | 2,129 | 3,366 | 1,687 | 1,999 | 1,375 | 2,129 | ||||||||||||||||||
| Bargain Purchase Gain | 1,832 | - | - | |||||||||||||||||||||
| Other | 3,219 | 3,525 | 2,600 | 3,072 | 4,376 | 3,219 | ||||||||||||||||||
| Total Non-Interest Income | 14,329 | 15,937 | 14,110 | 15,257 | 14,575 | 14,329 | ||||||||||||||||||
| Non-Interest Expense | ||||||||||||||||||||||||
| Salaries and Employee Benefits | 36,446 | 33,658 | 31,635 | 41,981 | 39,683 | 36,446 | ||||||||||||||||||
| Net Gain on Deferred Compensation Investments | 2,129 | 3,366 | 1,687 | 1,999 | 1,375 | 2,129 | ||||||||||||||||||
| Occupancy | 2,690 | 2,513 | 2,565 | 2,985 | 2,884 | 2,690 | ||||||||||||||||||
| Equipment | 2,794 | 2,783 | 3,128 | 3,493 | 3,162 | 2,794 | ||||||||||||||||||
| Marketing | 1,191 | 1,254 | 353 | |||||||||||||||||||||
| Legal | 1,243 | 421 | 128 | |||||||||||||||||||||
| FDIC Insurance | 1,048 | 981 | 968 | 1,174 | 1,193 | 1,048 | ||||||||||||||||||
| Legal Fees | 128 | 569 | 1,039 | |||||||||||||||||||||
| Termination Fee Related to Repurchase Agreement | - | - | 1,657 | |||||||||||||||||||||
| Gain on Sale of ORE | (5,941 | ) | (299 | ) | - | |||||||||||||||||||
| Other | 6,131 | 7,000 | 5,598 | 10,047 | 6,586 | 5,778 | ||||||||||||||||||
| Total Non-Interest Expense | 51,366 | 50,870 | 48,277 | 58,172 | 56,259 | 51,366 | ||||||||||||||||||
| Income Before Income Taxes | 40,496 | 38,282 | 37,334 | 45,820 | 44,316 | 40,496 | ||||||||||||||||||
| Provision for Income Taxes | 15,094 | 14,221 | 13,985 | 16,097 | 16,924 | 15,094 | ||||||||||||||||||
| Net Income | $ | 25,402 | $ | 24,061 | $ | 23,349 | $ | 29,723 | $ | 27,392 | $ | 25,402 | ||||||||||||
| Basic Earnings Per Common Share | $ | 32.64 | $ | 30.93 | $ | 29.99 | $ | 37.44 | $ | 34.82 | $ | 32.64 | ||||||||||||
The accompanying notes are an integral part of these consolidated financial statements
Consolidated Statements of Comprehensive Income
(in thousands)
| Year Ended December 31, | ||||||||||||
| 2014 | 2013 | 2012 | ||||||||||
| Net Income | $ | 25,402 | $ | 24,061 | $ | 23,349 | ||||||
| Other Comprehensive Income (Loss) | ||||||||||||
| Increase (Decrease) in Net Unrealized Gain (Loss) on Available-for-Sale Securities | 8,719 | (16,564 | ) | 4,182 | ||||||||
| Deferred Tax (Expense) Benefit Related to Unrealized Gains (Losses) | (3,666 | ) | 6,965 | (1,759 | ) | |||||||
| Reclassification Adjustment for Realized (Gain) Loss on Available-for-Sale Securities Included in Net Income | (90 | ) | 229 | (158 | ) | |||||||
| Tax Expense (Benefit) Related to Reclassification Adjustment | 38 | (97 | ) | 67 | ||||||||
| Change in Net Unrealized Gain (Loss) on Available-for-Sale Securities, Net of Tax | 5,001 | (9,467 | ) | 2,332 | ||||||||
| Total Other Comprehensive Income (Loss) | 5,001 | (9,467 | ) | 2,332 | ||||||||
| Comprehensive Income | $ | 30,403 | $ | 14,594 | $ | 25,681 | ||||||
| Year Ended December 31, | ||||||||||||
| 2016 | 2015 | 2014 | ||||||||||
| Net Income | $ | 29,723 | $ | 27,392 | $ | 25,402 | ||||||
| Other Comprehensive (Loss) Income | ||||||||||||
| (Decrease) Increase in Net Unrealized (Loss) Gain on Available-for-Sale Securities | (1,330 | ) | (3,069 | ) | 8,719 | |||||||
| Deferred Tax Benefit (Expense) Related to Unrealized Gains (Losses) | 559 | 1,290 | (3,666 | ) | ||||||||
| Reclassification Adjustment for Realized Loss (Gain) on Available-for-Sale Securities Included in Net Income | 284 | (275 | ) | (90 | ) | |||||||
| Tax (Benefit) Expense Related to Reclassification Adjustment | (119 | ) | 116 | 38 | ||||||||
| Change in Net Unrealized (Loss) Gain on Available-for-Sale Securities, Net of Tax | (606 | ) | (1,938 | ) | 5,001 | |||||||
| Total Other Comprehensive (Loss) Income | (606 | ) | (1,938 | ) | 5,001 | |||||||
| Comprehensive Income | $ | 29,117 | $ | 25,454 | $ | 30,403 | ||||||
The accompanying notes are an integral part of these consolidated financial statements
| Farmers & Merchants Bancorp |
Consolidated Statements of Changes in Shareholders' Equity
(in thousands except share and per share data)
Common Shares | Common Stock | Additional Paid-In | Retained Earnings | Accumulated Other | Total Shareholders' | Common Shares Outstanding | Common Stock | Additional Paid-In Capital | Retained Earnings | Accumulated Other Comprehensive (Loss) Income | Total Shareholders' Equity | |||||||||||||||||||||||||||||||||||||
| Balance, January 1, 2012 | 779,424 | $ | 8 | $ | 75,590 | $ | 109,081 | $ | 4,667 | $ | 189,346 | |||||||||||||||||||||||||||||||||||||
| Net Income | 23,349 | 23,349 | ||||||||||||||||||||||||||||||||||||||||||||||
| Cash Dividends Declared on Common Stock ($12.10 per share) | (9,418 | ) | (9,418 | ) | ||||||||||||||||||||||||||||||||||||||||||||
| Repurchase of Common Stock | (1,542 | ) | (576 | ) | (576 | ) | ||||||||||||||||||||||||||||||||||||||||||
| Change in Net Unrealized Gain on Securities Available-for-Sale | 2,332 | 2,332 | ||||||||||||||||||||||||||||||||||||||||||||||
| Balance, December 31, 2012 | 777,882 | $ | 8 | $ | 75,014 | $ | 123,012 | $ | 6,999 | $ | 205,033 | |||||||||||||||||||||||||||||||||||||
| Net Income | 24,061 | 24,061 | ||||||||||||||||||||||||||||||||||||||||||||||
| Cash Dividends Declared on Common Stock ($12.50 per share) | (9,723 | ) | (9,723 | ) | ||||||||||||||||||||||||||||||||||||||||||||
| Repurchase of Common Stock | - | - | ||||||||||||||||||||||||||||||||||||||||||||||
| Change in Net Unrealized (Loss) on Securities Available-for-Sale | (9,467 | ) | (9,467 | ) | ||||||||||||||||||||||||||||||||||||||||||||
| Balance, December 31, 2013 | 777,882 | $ | 8 | $ | 75,014 | $ | 137,350 | $ | (2,468 | ) | $ | 209,904 | ||||||||||||||||||||||||||||||||||||
| Balance, January 1, 2014 | 777,882 | $ | 8 | $ | 75,014 | $ | 137,350 | $ | (2,468 | ) | $ | 209,904 | ||||||||||||||||||||||||||||||||||||
| Net Income | 25,402 | 25,402 | 25,402 | 25,402 | ||||||||||||||||||||||||||||||||||||||||||||
| Cash Dividends Declared on Common Stock ($12.70 per share) | (9,919 | ) | (9,919 | ) | (9,919 | ) | (9,919 | ) | ||||||||||||||||||||||||||||||||||||||||
| Issuance of Common Stock | 6,200 | 2,790 | 2,790 | 6,200 | 2,790 | 2,790 | ||||||||||||||||||||||||||||||||||||||||||
| Change in Net Unrealized (Loss) on Securities Available-for-Sale | 5,001 | 5,001 | 5,001 | 5,001 | ||||||||||||||||||||||||||||||||||||||||||||
| Balance, December 31, 2014 | 784,082 | $ | 8 | $ | 77,804 | $ | 152,833 | $ | 2,533 | $ | 233,178 | 784,082 | $ | 8 | $ | 77,804 | $ | 152,833 | $ | 2,533 | $ | 233,178 | ||||||||||||||||||||||||||
| Net Income | 27,392 | 27,392 | ||||||||||||||||||||||||||||||||||||||||||||||
| Cash Dividends Declared on Common Stock ($12.90 per share) | (10,157 | ) | (10,157 | ) | ||||||||||||||||||||||||||||||||||||||||||||
| Issuance of Common Stock | 6,705 | 3,360 | 3,360 | |||||||||||||||||||||||||||||||||||||||||||||
| Change in Net Unrealized Gain on Securities Available-for-Sale | (1,938 | ) | (1,938 | ) | ||||||||||||||||||||||||||||||||||||||||||||
| Balance, December 31, 2015 | 790,787 | $ | 8 | $ | 81,164 | $ | 170,068 | $ | 595 | $ | 251,835 | |||||||||||||||||||||||||||||||||||||
| Net Income | 29,723 | 29,723 | ||||||||||||||||||||||||||||||||||||||||||||||
| Cash Dividends Declared on Common Stock ($13.10 per share) | (10,478 | ) | (10,478 | ) | ||||||||||||||||||||||||||||||||||||||||||||
| Issuance of Common Stock | 16,542 | 9,507 | 9,507 | |||||||||||||||||||||||||||||||||||||||||||||
| Change in Net Unrealized (Loss) on Securities Available-for-Sale | (606 | ) | (606 | ) | ||||||||||||||||||||||||||||||||||||||||||||
| Balance, December 31, 2016 | 807,329 | $ | 8 | $ | 90,671 | $ | 189,313 | $ | (11 | ) | $ | 279,981 | ||||||||||||||||||||||||||||||||||||
The accompanying notes are an integral part of these consolidated financial statements
| Farmers & Merchants Bancorp Consolidated Statements of Cash Flows (in thousands) |
| Year Ended December 31, | Year Ended December 31, | |||||||||||||||||||||||
| 2014 | 2013 | 2012 | 2016 | 2015 | 2014 | |||||||||||||||||||
| Operating Activities | ||||||||||||||||||||||||
| Net Income | $ | 25,402 | $ | 24,061 | $ | 23,349 | $ | 29,723 | $ | 27,392 | $ | 25,402 | ||||||||||||
| Adjustments to Reconcile Net Income to Net Cash Provided by Operating Activities: | ||||||||||||||||||||||||
| Provision for Credit Losses | 1,175 | 425 | 1,850 | 6,335 | 750 | 1,175 | ||||||||||||||||||
| Depreciation and Amortization | 1,325 | 1,506 | 1,704 | 1,896 | 1,685 | 1,325 | ||||||||||||||||||
| Provision for Deferred Income Taxes | 6,436 | (8,501 | ) | (2,548 | ) | (2,299 | ) | (907 | ) | 6,436 | ||||||||||||||
| Net Amortization of Investment Security Premium & Discounts | 1,659 | 3,068 | 3,944 | 1,481 | 1,554 | 1,659 | ||||||||||||||||||
| Amortization of Core Deposit Intangible | 13 | - | - | |||||||||||||||||||||
| Accretion of Discount on Acquired Loans | (43 | ) | - | - | ||||||||||||||||||||
| Net Loss (Gain) on Investment Securities | (90 | ) | 229 | (158 | ) | 284 | (275 | ) | (90 | ) | ||||||||||||||
| Net Gain on Sale of Property & Equipment | (22 | ) | (721 | ) | - | |||||||||||||||||||
| Net Loss (Gain) on Sale of Property & Equipment | 71 | (383 | ) | (22 | ) | |||||||||||||||||||
| Net Gain on sale of ORE | (5,941 | ) | (299 | ) | - | |||||||||||||||||||
| Net Gain from Acquisition | (1,832 | ) | - | - | ||||||||||||||||||||
| Net Change in Operating Assets & Liabilities: | ||||||||||||||||||||||||
| Net Increase in Interest Receivable and Other Assets | (15,070 | ) | (3,719 | ) | (434 | ) | ||||||||||||||||||
| Net Decrease (Increase) in Interest Receivable and Other Assets | 1,056 | 4,685 | (15,070 | ) | ||||||||||||||||||||
| Net Increase in Interest Payable and Other Liabilities | 4,822 | 10,851 | 4,016 | 4,068 | 3,125 | 5,600 | ||||||||||||||||||
| Net Cash Provided by Operating Activities | 25,637 | 27,199 | 31,723 | 34,812 | 37,327 | 26,415 | ||||||||||||||||||
| Investing Activities | ||||||||||||||||||||||||
| Purchase of Investment Securities Available-for-Sale | (132,619 | ) | (221,745 | ) | (143,295 | ) | (497,797 | ) | (203,996 | ) | (132,619 | ) | ||||||||||||
| Proceeds from Sold, Matured, or Called Securities Available-for-Sale | 177,324 | 208,962 | 205,374 | 426,142 | 227,157 | 177,324 | ||||||||||||||||||
| Purchase of Investment Securities Held-to-Maturity | (17,692 | ) | (2,077 | ) | (10,739 | ) | (2,264 | ) | (17,747 | ) | (17,692 | ) | ||||||||||||
| Proceeds from Matured, or Called Securities Held-to-Maturity | 22,628 | 8,443 | 5,419 | 5,499 | 18,031 | 22,628 | ||||||||||||||||||
| Purchase of Life Insurance Contracts | - | - | (1,000 | ) | ||||||||||||||||||||
| Net Loans & Leases Paid, Originated or Acquired | (324,284 | ) | (142,225 | ) | (84,872 | ) | (148,960 | ) | (284,211 | ) | (324,284 | ) | ||||||||||||
| Principal Collected on Loans & Leases Previously Charged Off | 228 | 523 | 398 | 232 | 5,468 | 228 | ||||||||||||||||||
| Cash Acquired in Acquisition, Net of Cash Paid | 31,751 | - | - | |||||||||||||||||||||
| Additions to Premises and Equipment | (4,274 | ) | (1,614 | ) | (547 | ) | (1,504 | ) | (2,726 | ) | (4,274 | ) | ||||||||||||
| Purchase of Other Investment | (6,825 | ) | (2,110 | ) | (778 | ) | ||||||||||||||||||
| Proceeds from Sale of Property & Equipment | 37 | 843 | - | - | 670 | 37 | ||||||||||||||||||
| Proceeds from Sale of ORE | 8,282 | 1,156 | - | |||||||||||||||||||||
| Net Cash Used by Investing Activities | (278,652 | ) | (148,890 | ) | (29,262 | ) | (185,444 | ) | (258,308 | ) | (279,430 | ) | ||||||||||||
| Financing Activities | ||||||||||||||||||||||||
| Net Increase in Deposits | 256,382 | 85,665 | 95,829 | 200,524 | 213,459 | 256,382 | ||||||||||||||||||
| Net Change in Other Borrowings | - | - | (530 | ) | ||||||||||||||||||||
| Net Decrease in Securities Sold Under Agreement to Repurchase | - | - | (60,000 | ) | ||||||||||||||||||||
| Stock Repurchases | - | - | (576 | ) | ||||||||||||||||||||
| Cash Dividends | (9,919 | ) | (9,723 | ) | (9,418 | ) | (10,478 | ) | (10,157 | ) | (9,919 | ) | ||||||||||||
| Net Cash Provided by Financing Activities | 246,463 | 75,942 | 25,305 | 190,046 | 203,302 | 246,463 | ||||||||||||||||||
| (Decrease) Increase in Cash and Cash Equivalents | (6,552 | ) | (45,749 | ) | 27,766 | |||||||||||||||||||
| Increase (Decrease) in Cash and Cash Equivalents | 39,414 | (17,679 | ) | (6,552 | ) | |||||||||||||||||||
| Cash and Cash Equivalents at Beginning of Year | 83,677 | 129,426 | 101,660 | 59,446 | 77,125 | 83,677 | ||||||||||||||||||
| Cash and Cash Equivalents at End of Year | $ | 77,125 | $ | 83,677 | $ | 129,426 | $ | 98,860 | $ | 59,446 | $ | 77,125 | ||||||||||||
| Supplementary Data | ||||||||||||||||||||||||
| Loans Transferred to Foreclosed Assets (ORE) | $ | - | $ | 4,403 | $ | 58 | $ | 538 | $ | - | $ | - | ||||||||||||
| Cash Payments Made for Income Taxes | $ | 15,030 | $ | 17,285 | $ | 17,472 | $ | 12,891 | $ | 8,475 | $ | 15,030 | ||||||||||||
| Issuance of Common Stock | $ | 2,790 | $ | - | $ | - | ||||||||||||||||||
| Issuance of Common Stock to the Bank's Non-Qualified Retirement Plans | $ | 2,586 | $ | 3,360 | $ | 2,790 | ||||||||||||||||||
| Interest Paid | $ | 2,787 | $ | 3,037 | $ | 5,553 | $ | 3,856 | $ | 3,190 | $ | 2,787 | ||||||||||||
| Acquisitions: | ||||||||||||||||||||||||
| Fair Value of Assets Acquired | $ | 114,871 | $ | - | $ | - | ||||||||||||||||||
| Fair Value of Liabilities Acquired | $ | 103,861 | $ | - | $ | - | ||||||||||||||||||
| Issuance of Common Stock to Acquired Bank's Shareholders | $ | 6,921 | $ | - | $ | - | ||||||||||||||||||
The accompanying notes are an integral part of these consolidated financial statements
Notes to Consolidated Financial Statements
| 1. | Significant Accounting Policies |
Farmers & Merchants Bancorp (the “Company”) was organized March 10, 1999. Primary operations are related to traditional banking activities through its subsidiary Farmers & Merchants Bank of Central California (the “Bank”) which was established in 1916. The Bank’s wholly owned subsidiaries include Farmers & Merchants Investment Corporation and Farmers/Merchants Corp. Farmers & Merchants Investment Corporation has been dormant since 1991. Farmers/Merchants Corp. acts as trustee on deeds of trust originated by the Bank.
The Company’s other subsidiaries include F & M Bancorp, Inc. and FMCB Statutory Trust I. F & M Bancorp, Inc. was created in March 2002 to protect the name F & M Bank. During 2002, the Company completed a fictitious name filing in California to begin using the streamlined name “F & M Bank” as part of a larger effort to enhance the Company’s image and build brand name recognition. In December 2003, the Company formed a wholly owned subsidiary, FMCB Statutory Trust I. FMCB Statutory Trust I is a non-consolidated subsidiary per Generally Accepted Accounting Principles in the United States of America (“U.S. GAAP”) and was formed for the sole purpose of issuing Trust Preferred Securities and related subordinated debentures.
On November 18, 2016, Farmers & Merchants Bancorp completed the acquisition of Delta National Bancorp, headquartered in Manteca, California, and the parent holding company for Delta Bank N.A., a locally owned and operated community bank established in 1973. As of the acquisition date, Delta National Bancorp had approximately $112 million in assets and four branch locations in the communities of Manteca, Riverbank, Modesto and Turlock. At the effective time of the acquisition, Delta National Bancorp was merged into Farmers & Merchants Bancorp and Delta Bank, N.A. was merged into Farmers & Merchants Bank of Central California.
The accounting and reporting policies of the Company conform to U.S. GAAP and prevailing practice within the banking industry. The following is a summary of the significant accounting and reporting policies used in preparing the consolidated financial statements.
Basis of Presentation
The accompanying consolidated financial statements and notes thereto have been prepared in accordance with accounting principles generally accepted in the United States of America for financial information.
The accompanying consolidated financial statements include the accounts of the Company and the Company’s wholly owned subsidiaries, F & M Bancorp, Inc. and the Bank, along with the Bank’s wholly owned subsidiaries, Farmers & Merchants Investment Corporation and Farmers/Merchants Corp. Significant inter-company transactions have been eliminated in consolidation.
The preparation of consolidated financial statements in conformity with U.S. GAAP requires management to make estimates and assumptions. These estimates and assumptions affect the reported amounts of assets and liabilities at the date of the financial statements and the reported amounts of revenues and expenses during the reporting period. Actual results could differ from these estimates.
Certain amounts in the prior years' financial statements and related footnote disclosures have been reclassified to conform to the current-year presentation. These reclassifications had no effect on previously reported net income or total shareholders’ equity. In the opinion of management, the accompanying consolidated financial statements reflect all adjustments (consisting only of normal recurring adjustments), which are necessary for a fair presentation of financial results for the periods presented.
Cash and Cash Equivalents
For purposes of the Consolidated Statements of Cash Flows, the Company has defined cash and cash equivalents as those amounts included in the balance sheet captions Cash and Due from Banks, Interest Bearing Deposits with Banks, Federal Funds Sold and Securities Purchased Under Agreements to Resell. For these instruments, the carrying amount is a reasonable estimate of fair value.
Investment Securities
Investment securities are classified at the time of purchase as held-to-maturity (“HTM”) if it is management’s intent and the Company has the ability to hold the securities until maturity. These securities are carried at cost, adjusted for amortization of premium and accretion of discount using a level yield of interest over the estimated remaining period until maturity. Losses, reflecting a decline in value judged by the Company to be other than temporary, are recognized in the period in which they occur.
Securities are classified as available-for-sale (“AFS”) if it is management’s intent, at the time of purchase, to hold the securities for an indefinite period of time and/or to use the securities as part of the Company’s asset/liability management strategy. These securities are reported at fair value with aggregate unrealized gains or losses excluded from income and included as a separate component of shareholders’ equity, net of related income taxes. Fair values are based on quoted market prices or broker/dealer price quotations on a specific identification basis. Gains or losses on the sale of these securities are computed using the specific identification method.
Trading securities, if any, are acquired for short-term appreciation and are recorded in a trading portfolio and are carried at fair value, with unrealized gains and losses recorded in non-interest income.
Management evaluates securities for other-than-temporary impairment (“OTTI”) on at least a quarterly basis, and more frequently when economic or market conditions warrant such an evaluation. For securities in an unrealized loss position, management considers the extent and duration of the unrealized loss, and the financial condition and near-term prospects of the issuer. Management also assesses whether it intends to sell, or it is more likely than not that it will be required to sell, a security in an unrealized loss position before recovery of its amortized cost basis. If either of the criteria regarding intent or requirement to sell is met, the entire difference between amortized cost and fair value is recognized as impairment through earnings. For debt securities that do not meet the aforementioned criteria, the amount of impairment is split into two components as follows: (1) OTTI related to credit loss, which must be recognized in the income statement; and (2) OTTI related to other factors, which is recognized in other comprehensive income. The credit loss is defined as the difference between the present value of the cash flows expected to be collected and the amortized cost basis. For equity securities, the entire amount of impairment is recognized through earnings.
Loans & Leases
Loans & leases are reported at the principal amount outstanding net of unearned discounts and deferred loan & lease fees and costs. Interest income on loans & leases is accrued daily on the outstanding balances using the simple interest method. Loan & lease origination fees are deferred and recognized over the contractual life of the loan or lease as an adjustment to the yield. Loans & leases are placed on non-accrual status when the collection of principal or interest is in doubt or when they become past due for 90 days or more unless they are both well-secured and in the process of collection. For this purpose, a loan or lease is considered well-secured if it is collateralized by property having a net realizable value in excess of the amount of the loan or lease or is guaranteed by a financially capable party. When a loan or lease is placed on non-accrual status, the accrued and unpaid interest receivable is reversed and charged against current income; thereafter, interest income is recognized only as it is collected in cash. Additionally, cash would be applied to principal if all principal was not expected to be collected. Loans & leases placed on non-accrual status are returned to accrual status when the loans or leases are paid current as to principal and interest and future payments are expected to be made in accordance with the contractual terms of the loan or lease.
A loan or lease is considered impaired when, based on current information and events, it is probable that the Company will be unable to collect all amounts due, including principal and interest, according to the contractual terms of the original agreement. Impaired loans & leases are either: (1) non-accrual loans & leases; or (2) restructured loans & leases that are still accruing interest. Loans or leases determined to be impaired are individually evaluated for impairment. When a loan or lease is impaired, the Company measures impairment based on the present value of expected future cash flows discounted at the loan or lease's effective interest rate, except that as a practical expedient, it may measure impairment based on a loan or lease's observable market price, or the fair value of the collateral if the loan or lease is collateral dependent. A loan or lease is collateral dependent if the repayment of the loan or lease is expected to be provided solely by the underlying collateral.
A restructuring of a loan or lease constitutes a troubled debt restructuring (TDR) if the Company for economic or legal reasons related to the borrower’s (the term “borrower” is used herein to describe a customer who has entered into either a loan or lease transaction) financial difficulties grants a concession to the borrower that it would not otherwise consider. Restructured loans & leases typically present an elevated level of credit risk as the borrowers are not able to perform according to the original contractual terms. If the restructured loan or lease was current on all payments at the time of restructure and management reasonably expects the borrower will continue to perform after the restructure, management may keep the loan or lease on accrual. Loans & leases that are on nonaccrual status at the time they become TDR, remain on nonaccrual status until the borrower demonstrates a sustained period of performance, which the Company generally believes to be six consecutive months of payments, or equivalent. A loan or lease can be removed from TDR status if it was restructured at a market rate in a prior calendar year and is currently in compliance with its modified terms. However, these loans or leases continue to be classified as impaired and are individually evaluated for impairment as described above.
Generally, the Company will not restructure loans or leases for borrowers unless: (1) the existing loan or lease is brought current as to principal and interest payments; and (2) the restructured loan or lease can be underwritten to reasonable underwriting standards. If these standards are not met other actions will be pursued (e.g., foreclosure) to collect outstanding loan or lease amounts. After restructure a determination is made whether the loan or lease will be kept on accrual status based upon the underwriting and historical performance of the restructured credit.
Allowance for Credit Losses
The allowance for credit losses is an estimate of probable incurred credit losses inherent in the Company's loan & lease portfolio as of the balance sheet date. The allowance is established through a provision for credit losses, which is charged to expense. Additions to the allowance are expected to maintain the adequacy of the total allowance after credit losses and loan & lease growth. Credit exposures determined to be uncollectible are charged against the allowance. Cash received on previously charged off amounts is recorded as a recovery to the allowance. The overall allowance consists of three primary components: specific reserves related to impaired loans & leases; general reserves for inherent losses related to loans & leases that are not impaired; and an unallocated component that takes into account the imprecision in estimating and allocating allowance balances associated with macro factors.
The determination of the general reserve for loans & leases that are collectively evaluated for impairment is based on estimates made by management, to include, but not limited to, consideration of historical losses by portfolio segment, internal asset classifications, qualitative factors that include economic trends in the Company's service areas, industry experience and trends, geographic concentrations, estimated collateral values, the Company's underwriting policies, the character of the loan & lease portfolio, and probable losses inherent in the portfolio taken as a whole.
The Company maintains a separate allowance for each portfolio segment (loan & lease type). These portfolio segments include: (1) commercial real estate; (2) agricultural real estate; (3) real estate construction (including land and development loans); (4) residential 1st mortgages; (5) home equity lines and loans; (6) agricultural; (7) commercial; (8) consumer and other; and (9) equipment leases. The allowance for credit losses attributable to each portfolio segment, which includes both individually evaluated impaired loans & leases and loans & leases that are collectively evaluated for impairment, is combined to determine the Company's overall allowance, which is included on the consolidated balance sheet.
The Company assigns a risk rating to all loans & leases and periodically performs detailed reviews of all such loans & leases over a certain threshold to identify credit risks and assess overall collectability. For smaller balance loans & leases, such as consumer and residential real estate, a credit grade is established at inception, and then updated only when the loan or lease becomes contractually delinquent or when the borrower requests a modification. For larger balance loans, management monitors and analyzes the financial condition of borrowers and guarantors, trends in the industries in which borrowers operate and the fair values of collateral securing these loans & leases. These credit quality indicators are used to assign a risk rating to each individual loan or lease. These risk ratings are also subject to examination by independent specialists engaged by the Company. The risk ratings can be grouped into five major categories, defined as follows:
Pass – A pass loan or lease is a strong credit with no existing or known potential weaknesses deserving of management's close attention.
Special Mention – A special mention loan or lease has potential weaknesses that deserve management's close attention. If left uncorrected, these potential weaknesses may result in deterioration of the repayment prospects for the loan or lease or in the Company's credit position at some future date. Special mention loans & leases are not adversely classified and do not expose the Company to sufficient risk to warrant adverse classification.
Substandard – A substandard loan or lease is not adequately protected by the current financial condition and paying capacity of the borrower or the value of the collateral pledged, if any. Loans or leases classified as substandard have a well-defined weakness or weaknesses that jeopardize the liquidation of the debt. Well definedWell-defined weaknesses include a project's lack of marketability, inadequate cash flow or collateral support, failure to complete construction on time or the project's failure to fulfill economic expectations. They are characterized by the distinct possibility that the Company will sustain some loss if the deficiencies are not corrected.
Doubtful – Loans or leases classified doubtful have all the weaknesses inherent in those classified as substandard with the added characteristic that the weaknesses make collection or liquidation in full, based on currently known facts, conditions and values, highly questionable or improbable.
Loss – Loans or leases classified as loss are considered uncollectible. Once a loan or lease becomes delinquent and repayment becomes questionable, the Company will address collateral shortfalls with the borrower and attempt to obtain additional collateral. If this is not forthcoming and payment in full is unlikely, the Company will estimate its probable loss and immediately charge-off some or all of the balance.
The general reserve component of the allowance for credit losses also consists of reserve factors that are based on management's assessment of the following for each portfolio segment: (1) inherent credit risk; (2) historical losses; and (3) other qualitative factors. These reserve factors are inherently subjective and are driven by the repayment risk associated with each portfolio segment described below:
Commercial Real Estate – Commercial real estate mortgage loans are generally considered to possess a higher inherent risk of loss than the Company’s commercial, agricultural and consumer loan types. Adverse economic developments or an overbuilt market impact commercial real estate projects and may result in troubled loans. Trends in vacancy rates of commercial properties impact the credit quality of these loans. High vacancy rates reduce operating revenues and the ability for properties to produce sufficient cash flow to service debt obligations.
Real Estate Construction – Real estate construction loans, including land loans, are generally considered to possess a higher inherent risk of loss than the Company’s commercial, agricultural and consumer loan types. A major risk arises from the necessity to complete projects within specified cost and time lines. Trends in the construction industry significantly impact the credit quality of these loans, as demand drives construction activity. In addition, trends in real estate values significantly impact the credit quality of these loans, as property values determine the economic viability of construction projects.
Commercial – These loans are generally considered to possess a moderate inherent risk of loss because they are shorter-term; typically made to relationship customers; generally underwritten to existing cash flows of operating businesses; and may be collateralized by fixed assets, inventory and/or accounts receivable. Debt coverage is provided by business cash flows and economic trends influenced by unemployment rates and other key economic indicators are closely correlated to the credit quality of these loans.
Agricultural Real Estate and Agricultural – These loans are generally considered to possess a moderate inherent risk of loss since they are typically made to relationship customers and are secured by crop production, livestock and related real estate. These loans are vulnerable to two risk factors that are largely outside the control of Company and borrowers: commodity prices and weather conditions.
Leases – Equipment leases are generally considered to possess a moderate inherent risk of loss. As Lessor,lessor, the companyCompany is subject to both the credit risk of the borrower and the residual value risk of the equipment. Credit risks are underwritten using the same credit criteria the Company would use when making an equipment term loan. Residual value risk is managed through the use of qualified, independent appraisers that establish the residual values the Company uses in structuring a lease.
Residential 1st Mortgages and Home Equity Lines and Loans – These loans are generally considered to possess a low inherent risk of loss, although this is not always true as evidenced by the weaknesscorrection in residential real estate values over the past five years.that occurred between 2007 and 2012. The degree of risk in residential real estate lending depends primarily on the loan amount in relation to collateral value, the interest rate and the borrower's ability to repay in an orderly fashion. Economic trends determined by unemployment rates and other key economic indicators are closely correlated to the credit quality of these loans. Weak economic trends indicate that the borrowers' capacity to repay their obligations may be deteriorating.
Consumer & Other – A consumer installment loan portfolio is usually comprised of a large number of small loans scheduled to be amortized over a specific period. Most installment loans are made for consumer purchases. Economic trends determined by unemployment rates and other key economic indicators are closely correlated to the credit quality of these loans. Weak economic trends indicate that the borrowers' capacity to repay their obligations may be deteriorating.
At least quarterly, the Board of Directors reviews the adequacy of the allowance, including consideration of the relative risks in the portfolio, current economic conditions and other factors. If the Board of Directors and management determine that changes are warranted based on those reviews, the allowance is adjusted. In addition, the Company's and Bank's regulators, including the Federal Reserve BankBoard (“FRB”), the California Department of Business Oversight (“DBO”) and the Federal Deposit Insurance Corporation (“FDIC”), as an integral part of their examination process, review the adequacy of the allowance. These regulatory agencies may require additions to the allowance based on their judgment about information available at the time of their examinations.
Acquired Loans
Loans acquired through purchase or through a business combination are recorded at their fair value at the acquisition date. Credit discounts, which reflect estimates of credit losses, expected to be incurred over the life of the loan, are included in the determination of fair value; therefore, an allowance for loan losses is not recorded at the acquisition date.
Allowance for Credit Losses on Off-Balance-Sheet Credit Exposures
The Company also maintains a separate allowance for off-balance-sheet commitments. Management estimates anticipated losses using historical data and utilization assumptions. The allowance for off-balance-sheet commitments is included in Interest Payable and Other Liabilities on the Company’s Consolidated Balance Sheet.
Premises and Equipment
Premises, equipment, and leasehold improvements are stated at cost, less accumulated depreciation and amortization. Depreciation is computed principally by the straight linestraight-line method over the estimated useful lives of the assets. Estimated useful lives of buildings range from 30 to 40 years, and for furniture and equipment from 3 to 7 years. Leasehold improvements are amortized over the lesser of the terms of the respective leases, or their useful lives, which are generally 5 to 10 years. Remodeling and capital improvements are capitalized while maintenance and repairs are charged directly to occupancy expense.
Other Real Estate
Other real estate, which is included in other assets, is expected to be sold and is comprised of properties no longer utilized for business operations and property acquired through foreclosure in satisfaction of indebtedness. These properties are recorded at fair value less estimated selling costs upon acquisition. Revised estimates to the fair value less cost to sell are reported as adjustments to the carrying amount of the asset, provided that such adjusted value is not in excess of the carrying amount at acquisition. Initial losses on properties acquired through full or partial satisfaction of debt are treated as credit losses and charged to the allowance for credit losses at the time of acquisition. Subsequent declines in value from the recorded amounts, routine holding costs, and gains or losses upon disposition, if any, are included in non-interest expense as incurred.
Income Taxes
The Company uses the liability method of accounting for income taxes. This method results in the recognition of deferred tax assets and liabilities that are reflected at currently enacted income tax rates applicable to the period in which the deferred tax assets or liabilities are expected to be realized or settled. As changes in tax laws or rates are enacted, deferred tax assets and liabilities are adjusted through the provision for income taxes. The deferred provision for income taxes is the result of the net change in the deferred tax asset and deferred tax liability balances during the year. This amount combined with the current taxes payable or refundable results in the income tax expense for the current year.
The Company follows the standards set forth in the “Income Taxes” topic of the Financial Accounting Standards Board (“FASB”) Accounting Standard Codification (“ASC”), which clarifies the accounting for uncertainty in income taxes recognized in an enterprise’s financial statements. This standard prescribes a recognition threshold and measurement standard for the financial statement recognition and measurement of an income tax position taken or expected to be taken in a tax return. It also provides guidance on derecognition, classification, interest and penalties, accounting in interim periods, disclosure, and transition.
When tax returns are filed, it is highly certain that some positions taken would be sustained upon examination by the taxing authorities, while others are subject to uncertainty about the merits of the position taken or the amount of the position that would be ultimately sustained. The benefit of a tax position is recognized in the financial statements in the period during which, based on all available evidence, management believes it is more likely than not that the position will be sustained upon examination, including the resolution of appeals or litigation processes, if any. Tax positions taken are not offset or aggregated with other positions. Tax positions that meet the more-likely-than-not recognition threshold are measured as the largest amount of tax benefit that is more than 50 percent likely of being realized upon settlement with the applicable taxing authority. The portion of the benefits associated with tax positions taken that exceeds the amount measured as described above is reflected as a liability for unrecognized tax benefits in the accompanying consolidated balance sheet along with any associated interest and penalties that would be payable to the taxing authorities upon examination.
Interest expense and penalties associated with unrecognized tax benefits, if any, are included in the provision for income taxes in the Unaudited Consolidated Statements of Income.
The Company’s common stock is not traded on any exchange. The shares are primarily held by local residents and are not actively traded. Basic earnings per common share amounts are computed by dividing net income by the weighted average number of common shares outstanding for the period. There are no common stock equivalent shares. Therefore, there is no presentation of diluted basic earnings per common share. See Note 1516 for additional information.
Segment Reporting
The “Segment Reporting” topic of the FASB ASC requires that public companies report certain information about operating segments. It also requires that public companies report certain information about their products and services, the geographic areas in which they operate, and their major customers. The Company is a holding company for a community bank, which offers a wide array of products and services to its customers. Pursuant to its banking strategy, emphasis is placed on building relationships with its customers, as opposed to building specific lines of business. As a result, the Company is not organized around discernible lines of business and prefers to work as an integrated unit to customize solutions for its customers, with business line emphasis and product offerings changing over time as needs and demands change. Therefore, the Company only reports one segment.
The “DerivativesCompany accounts for its interest in LIHTC using the cost method as established in ASC 323-740. As an investor, the Company obtains income tax credits and Hedging” topicdeductions from the operating losses of these tax credit entities. The income tax credits and deductions are allocated to the FASB ASC establishes accountinginvestors based on their ownership percentages and reporting standards for derivative instruments, including certain derivative instruments embedded in other contracts, and for hedging activities. All derivatives, whether designated in hedging relationships or not, are required to be recorded on the balance sheet at fair value. Changes in the fair value of those derivatives are accounted for depending on the intended use of the derivative and the resulting designation under specified criteria. If the derivative is designated as a fair value hedge, the changes in the fair valuereduction of the derivativeincome tax expense (or an increase to income tax benefit) and a reduction of the hedged item attributable to the hedged risk are recognized in earnings. If the derivative is designated as a cash flow hedge, designed to minimize interest rate risk, the effective portions of the change in the fair value of the derivative are recorded in other comprehensivefederal income (loss), net of related income taxes. Ineffective portions of changes in the fair value of cash flow hedges are recognized in earnings.
Comprehensive Income
The “Comprehensive Income” topic of the FASB ASC establishes standards for the reporting and display of comprehensive income and its components in the financial statements. Other comprehensive income (loss) refers to revenues, expenses, gains, and losses that generally accepted accounting principlesU.S. GAAP recognize as changes in value to an enterprise but are excluded from net income. For the Company, comprehensive income includes net income and changes in fair value of its available-for-sale investment securities.
Loss Contingencies
Loss contingencies, including claims and legal actions arising in the ordinary course of business, are recorded as liabilities when the likelihood of loss is probable and an amount or range of loss can be reasonably estimated. Management does not believe there now are such matters that will have a material effect on the financial statements.
Business combinations are accounted for under the acquisition method of accounting in accordance with ASC 805, Business Combinations. Under the acquisition method, the acquiring entity in a business combination recognizes 100 percent of the acquired assets and assumed liabilities, regardless of the percentage owned, at their estimated fair values as of the date of acquisition. Any excess of the fair value over the purchase price of net assets and other identifiable intangible assets acquired is recorded as bargain purchase gain. Assets acquired and liabilities assumed from contingencies must also be recognized at fair value, if the fair value can be determined during the measurement period. Results of operations of an acquired business are included in the statement of operations from the date of acquisition. Acquisition-related costs, including conversion charges, are expensed as incurred. The Company applied this guidance to the acquisition of Delta National Bancorp that was consummated on November 18, 2016. The Company's consolidated financial statements reflect the operations of Delta National Bancorp from November 19, 2016 through December 31, 2016.
Intangible Assets
Intangible assets are comprised of core deposit intangibles acquired in the Delta National Bancorp acquisition. Intangible assets with definite useful lives are amortized over their respective estimated useful lives. If an event occurs that indicates the carrying amount of an intangible asset may not be recoverable, management reviews the asset for impairment.
| 2. | Business Combinations |
Delta National Bancorp
On November 18, 2016, the Company completed the acquisition of Delta National Bancorp. Delta National Bancorp was incorporated under the laws of the State of California on December 21, 1981, for the purpose of serving as a bank holding company under the Bank Holding Act of 1956. Its wholly owned subsidiary, Delta Bank, N.A., operated as a commercial bank with branches in the cities of Manteca, Riverbank, Turlock, and Modesto, California. The acquisition enhances our market presence and added $32.4 million in loans, $103.7 million in deposits and $38.7 million in investment securities to the Company. Effective December 9, 2016, the Modesto branch was closed after Management determined that our customers and the business community could be easily supported from our current Modesto location. The assets acquired and liabilities assumed, both tangible and intangible, were recorded at their fair values as of the acquisition date in accordance with ASC 805, Business Combinations. The acquisition was treated as a "reorganization" within the meaning of section 368(a)(1)(A) of the Internal Revenue Code and is considered tax-free for U.S. federal income tax purposes.
The following table reflects the book value and estimated fair value of the assets acquired and liabilities assumed related to the Delta National Bancorp Acquisition:
| Delta National Bancorp | ||||||||
| (in thousands) | Book Value | Fair Value | ||||||
| Assets Acquired: | ||||||||
| Cash and Cash Equivalents | $ | 34,009 | $ | 34,009 | ||||
| Investments | 38,727 | 38,727 | ||||||
| Loans | 32,885 | 32,410 | ||||||
| Core Deposit Intangible | - | 959 | ||||||
| Deferred Tax Asset | - | 893 | ||||||
| Other Assets | 6,263 | 7,873 | ||||||
| Total Assets Acquired | $ | 111,884 | $ | 114,871 | ||||
| Liabilities Assumed | ||||||||
| Deposits: | ||||||||
| Demand | 35,106 | 35,106 | ||||||
| Interest-Bearing Transaction | 20,572 | 20,572 | ||||||
| Savings and Money Market | 33,091 | 33,091 | ||||||
| Time | 14,930 | 14,930 | ||||||
| Total Deposits | $ | 103,699 | $ | 103,699 | ||||
| Other Liabilities | 161 | 161 | ||||||
| Total liabilities assumed | $ | 103,860 | $ | 103,860 | ||||
| Cash Paid | 2,258 | |||||||
| Fair Value of Common Stock Issued | 6,921 | |||||||
| Total Merger Consideration | $ | 9,179 | ||||||
The following table presents the net assets acquired from Delta National Bancorp and the estimated fair value adjustment:
| (in thousands) | Acquisition Date November 18, 2016 | |||
| Book Value of Net Assets Acquired | $ | 8,024 | ||
| Fair Value Adjustments: | ||||
| Loans | (1,063 | ) | ||
| Reversal of Allowance for Loan Loss | 588 | |||
| Core Deposit Intangible Asset | 959 | |||
| Other Assets & Liabilities, net | 1,610 | |||
| Total Purchase Accounting Adjustments | $ | 2,094 | ||
| Deferred Tax Asset (tax effect of purchase accounting adjustments at 42%) | (880 | ) | ||
| DTA Carryforward | 1,773 | |||
| Fair Value of Net Assets Acquired | $ | 11,011 | ||
| Fair Value of Net Assets Acquired | 11,011 | |||
| Less Merger Consideration | (9,179 | ) | ||
| Bargain Purchase Gain | $ | 1,832 | ||
The following is a description of the methods used to determine the fair value of significant assets and liabilities presented above.
Cash and Cash Equivalents: The carrying amount for cash and due from banks, interest-bearing deposits with banks and federal funds sold are a reasonable estimate of fair value based on the short-term nature of these assets.
Investments: Fair value for investments was obtained from an independent pricing service. The fair value measurements consider observable data that may include dealer quotes, market spreads, cash flows, the U.S. Treasury yield curve, live trading levels, trade execution data, market consensus prepayment spreads, credit information and the bond’s terms and conditions.
Loans: Fair value for loans were based on a discounted cash flow methodology that considered factors including the type of loan and related collateral, classification status, fixed or variable interest rate, term of loan, and amortization status. Loans were individually assessed, with some assumptions being applied from the aggregate pool level to the individual loan itself. The discount rates used for loans are based on a build-up method that considers credit ratings, funding, liquidity, and other adjustments. No credit impaired loans were acquired as part of this business combination.
Core Deposit Intangible (CDI): This intangible asset represents the value of the relationships with deposit customers. The fair value was estimated based on a discounted cash flow methodology that gave appropriate consideration to expected customer attrition rates, cost the deposit base, reserve requirements and the net maintenance cost attributable to customer deposits. The CDI is being amortized over 10 years based on the estimated economic benefits received.
Other Assets: Other assets are composed of real property assets which include two branch premises and various ORE properties. These assets were valued in November and December 2016 via USPAP-compliant appraisals for the 100% interest in the fee simple estate by a state licensed appraiser.
Deposits: The fair values used for the demand and savings deposits by definition equal the amount payable on demand at the acquisition date. The fair values for time deposits are estimated using a discounted cash flow calculation that applies interest rates currently being offered to the contractual interest rates on such time deposits.
Debt: The fair values of long-term debt instruments are estimated based on quoted market prices for the instrument if available, or for similar instruments if not available, or by using discounted cash flow analyses, based on current incremental borrowing rates for similar types of instruments.
The Company issued 11,932 shares of common stock to Delta National Bancorp’s common stock holders. The shares issued were valued at $580 per share. The share price was based upon valuations completed by a nationally recognized bank consulting and advisory firm and in reliance upon the exemption in Section 4(a)(2) of the Securities Act of 1933, as amended, and the regulations promulgated thereunder.
| 3. | Investment Securities |
The amortized cost, fair values, and unrealized gains and losses of the securities available-for-sale are as follows:
(in thousands)
| Amortized | Gross Unrealized | Fair/Book | ||||||||||||||
| December 31, 2016 | Cost | Gains | Losses | Value | ||||||||||||
| Government Agency & Government-Sponsored Entities | $ | 3,127 | $ | 114 | $ | - | $ | 3,241 | ||||||||
| US Treasury Notes | 134,755 | 5 | 332 | 134,428 | ||||||||||||
| US Govt SBA | 36,532 | 42 | 260 | 36,314 | ||||||||||||
Mortgage Backed Securities (1) | 272,858 | 1,725 | 1,313 | 273,270 | ||||||||||||
| Other | 1,010 | - | - | 1,010 | ||||||||||||
| Total | $ | 448,282 | $ | 1,886 | $ | 1,905 | $ | 448,263 | ||||||||
| Amortized | Gross Unrealized | Fair/Book | Amortized | Gross Unrealized | Fair/Book | |||||||||||||||||||||||||||
| December 31, 2014 | Cost | Gains | Losses | Value | ||||||||||||||||||||||||||||
| December 31, 2015 | Cost | Gains | Losses | Value | ||||||||||||||||||||||||||||
| Government Agency & Government-Sponsored Entities | $ | 78,051 | $ | 61 | $ | 3 | $ | 78,109 | $ | 33,536 | $ | 134 | $ | 419 | $ | 33,251 | ||||||||||||||||
| US Treasury Notes | 73,048 | - | 164 | 72,884 | ||||||||||||||||||||||||||||
Mortgage Backed Securities (1) | 283,636 | 4,969 | 657 | 287,948 | 261,016 | 2,708 | 1,231 | 262,493 | ||||||||||||||||||||||||
| Other | 485 | - | - | 485 | 509 | - | - | 509 | ||||||||||||||||||||||||
| Total | $ | 362,172 | $ | 5,030 | $ | 660 | $ | 366,542 | $ | 368,109 | $ | 2,842 | $ | 1,814 | $ | 369,137 | ||||||||||||||||
| Amortized | Gross Unrealized | Fair/Book | ||||||||||||||||||||||||||||||
| December 31, 2013 | Cost | Gains | Losses | Value | ||||||||||||||||||||||||||||
| Government Agency & Government-Sponsored Entities | $ | 28,287 | $ | 149 | $ | - | $ | 28,436 | ||||||||||||||||||||||||
Mortgage Backed Securities (1) | 329,469 | 3,026 | 7,566 | 324,929 | ||||||||||||||||||||||||||||
| Corporate Securities | 49,247 | 280 | 147 | 49,380 | ||||||||||||||||||||||||||||
| Other | 1,894 | - | - | 1,894 | ||||||||||||||||||||||||||||
| Total | $ | 408,897 | $ | 3,455 | $ | 7,713 | $ | 404,639 | ||||||||||||||||||||||||
(1) All Mortgage Backed Securities were issued by an agency or government sponsored entity of the U.S. government.
The book values, estimated fair values and unrealized gains and losses of investments classified as held-to-maturity are as follows: (in thousands)
| Book | Gross Unrealized | Fair | ||||||||||||||
| December 31, 2014 | Value | Gains | Losses | Value | ||||||||||||
| Obligations of States and Political Subdivisions | $ | 61,716 | $ | 782 | $ | 10 | $ | 62,488 | ||||||||
| Other | 2,147 | - | - | 2,147 | ||||||||||||
| Total | $ | 63,863 | $ | 782 | $ | 10 | $ | 64,635 | ||||||||
| Book | Gross Unrealized | Fair | ||||||||||||||
| December 31, 2013 | Value | Gains | Losses | Value | ||||||||||||
| Obligations of States and Political Subdivisions | $ | 65,685 | $ | 812 | $ | 627 | $ | 65,870 | ||||||||
Mortgage Backed Securities (1) | 45 | - | - | 45 | ||||||||||||
| Other | 2,775 | - | - | 2,775 | ||||||||||||
| Total | $ | 68,505 | $ | 812 | $ | 627 | $ | 68,690 | ||||||||
| Book | Gross Unrealized | Fair | ||||||||||||||
| December 31, 2016 | Value | Gains | Losses | Value | ||||||||||||
| Obligations of States and Political Subdivisions | $ | 58,109 | $ | 339 | $ | 40 | $ | 58,408 | ||||||||
| Total | $ | 58,109 | $ | 339 | $ | 40 | $ | 58,408 | ||||||||
| Book | Gross Unrealized | Fair | ||||||||||||||
| December 31, 2015 | Value | Gains | Losses | Value | ||||||||||||
| Obligations of States and Political Subdivisions | $ | 61,396 | $ | 993 | $ | 1 | $ | 62,388 | ||||||||
| Total | $ | 61,396 | $ | 993 | $ | 1 | $ | 62,388 | ||||||||
Fair values are based on quoted market prices or dealer quotes. If a quoted market price or dealer quote is not available, fair value is estimated using quoted market prices for similar securities.
The amortized cost and estimated fair values of investment securities at December 31, 20142016 by contractual maturity are shown in the following tables. (in thousands)
| Available-for-Sale | Held-to-Maturity | Available-for-Sale | Held-to-Maturity | |||||||||||||||||||||||||||||
| Amortized | Fair/Book | Book | Fair | |||||||||||||||||||||||||||||
| December 31, 2014 | Cost | Value | Value | Value | ||||||||||||||||||||||||||||
| December 31, 2016 | Amortized Cost | Fair/Book Value | Book Value | Fair Value | ||||||||||||||||||||||||||||
| Within One Year | $ | 77,462 | $ | 77,470 | $ | 2,747 | $ | 2,748 | $ | 66,137 | $ | 66,141 | $ | 1,905 | $ | 1,907 | ||||||||||||||||
| After One Year Through Five Years | 1,074 | 1,124 | 16,426 | 16,633 | 66,205 | 66,115 | 9,530 | 9,556 | ||||||||||||||||||||||||
| After Five Years Through Ten Years | - | - | 9,845 | 9,931 | 13,945 | 13,788 | 12,699 | 12,747 | ||||||||||||||||||||||||
| After Ten Years | - | - | 34,845 | 35,323 | 29,137 | 28,948 | 33,975 | 34,198 | ||||||||||||||||||||||||
| 78,536 | 78,594 | 63,863 | 64,635 | 175,424 | 174,992 | 58,109 | 58,408 | |||||||||||||||||||||||||
| Investment Securities Not Due at a Single Maturity Date: | ||||||||||||||||||||||||||||||||
| Mortgage Backed Securities | 283,636 | 287,948 | - | - | 272,858 | 273,271 | - | - | ||||||||||||||||||||||||
| Total | $ | 362,172 | $ | 366,542 | $ | 63,863 | $ | 64,635 | $ | 448,282 | $ | 448,263 | $ | 58,109 | $ | 58,408 | ||||||||||||||||
Expected maturities of mortgage-backed securities may differ from contractual maturities because borrowers have the right to call or prepay obligations with or without call or prepayment penalties.
The following tables show those investments with gross unrealized losses and their market value aggregated by investment category and length of time that individual securities have been in a continuous unrealized loss position at the dates indicated. (in thousands)
| Less Than 12 Months | 12 Months or More | Total | Less Than 12 Months | 12 Months or More | Total | |||||||||||||||||||||||||||||||||||||||||||
| December 31, 2014 | Fair Value | Unrealized Loss | Fair Value | Unrealized Loss | Fair Value | Unrealized Loss | ||||||||||||||||||||||||||||||||||||||||||
| December 31, 2016 | Fair Value | Unrealized Loss | Fair Value | Unrealized Loss | Fair Value | Unrealized Loss | ||||||||||||||||||||||||||||||||||||||||||
Securities Available-for-Sale | ||||||||||||||||||||||||||||||||||||||||||||||||
| Government Agency & Government-Sponsored Entities | $ | 66,980 | $ | 3 | $ | - | $ | - | $ | 66,980 | $ | 3 | ||||||||||||||||||||||||||||||||||||
| US Treasury Notes | $ | 99,429 | $ | 332 | $ | - | $ | - | $ | 99,429 | $ | 332 | ||||||||||||||||||||||||||||||||||||
| US Govt SBA | 27,483 | 260 | - | - | 27,483 | 260 | ||||||||||||||||||||||||||||||||||||||||||
| Mortgage Backed Securities | 14,487 | 151 | 33,574 | 506 | 48,061 | 657 | 123,157 | 1,313 | - | - | 123,157 | 1,313 | ||||||||||||||||||||||||||||||||||||
| Total | $ | 81,467 | $ | 154 | $ | 33,574 | $ | 506 | $ | 115,041 | $ | 660 | $ | 250,069 | $ | 1,905 | $ | - | $ | - | $ | 250,069 | $ | 1,905 | ||||||||||||||||||||||||
Securities Held-to-Maturity | ||||||||||||||||||||||||||||||||||||||||||||||||
| Obligations of States and Political Subdivisions | $ | 849 | $ | 5 | $ | 876 | $ | 5 | $ | 1,725 | $ | 10 | $ | 7,251 | $ | 40 | $ | - | $ | - | $ | 7,251 | $ | 40 | ||||||||||||||||||||||||
| Total | $ | 849 | $ | 5 | $ | 876 | $ | 5 | $ | 1,725 | $ | 10 | $ | 7,251 | $ | 40 | $ | - | $ | - | $ | 7,251 | $ | 40 | ||||||||||||||||||||||||
| Less Than 12 Months | 12 Months or More | Total | ||||||||||||||||||||||||||||||||||||||||||||||
| December 31, 2013 | Fair Value | Unrealized Loss | Fair Value | Unrealized Loss | Fair Value | Unrealized Loss | ||||||||||||||||||||||||||||||||||||||||||
Securities Available-for-Sale | ||||||||||||||||||||||||||||||||||||||||||||||||
| Mortgage Backed Securities | $ | 195,736 | $ | 7,566 | $ | - | $ | - | $ | 195,736 | $ | 7,566 | ||||||||||||||||||||||||||||||||||||
| Corporate Securities | 15,297 | 106 | 2,457 | 41 | 17,754 | 147 | ||||||||||||||||||||||||||||||||||||||||||
| Total | $ | 211,033 | $ | 7,672 | $ | 2,457 | $ | 41 | $ | 213,490 | $ | 7,713 | ||||||||||||||||||||||||||||||||||||
Securities Held-to-Maturity | ||||||||||||||||||||||||||||||||||||||||||||||||
| Obligations of States and Political Subdivisions | $ | 9,518 | $ | 627 | $ | - | $ | - | $ | 9,518 | $ | 627 | ||||||||||||||||||||||||||||||||||||
| Total | $ | 9,518 | $ | 627 | $ | - | $ | - | $ | 9,518 | $ | 627 | ||||||||||||||||||||||||||||||||||||
| Less Than 12 Months | 12 Months or More | Total | ||||||||||||||||||||||
| December 31, 2015 | Fair Value | Unrealized Loss | Fair Value | Unrealized Loss | Fair Value | Unrealized Loss | ||||||||||||||||||
Securities Available-for-Sale | ||||||||||||||||||||||||
| Government Agency & Government-Sponsored Entities | $ | 29,944 | $ | 419 | $ | - | $ | - | $ | 29,944 | $ | 419 | ||||||||||||
| US Treasury Notes | 44,887 | 164 | - | - | 44,887 | 164 | ||||||||||||||||||
| Mortgage Backed Securities | 78,899 | 1,089 | 7,277 | 142 | 86,176 | 1,231 | ||||||||||||||||||
| Total | $ | 153,730 | $ | 1,672 | $ | 7,277 | $ | 142 | $ | 161,007 | $ | 1,814 | ||||||||||||
Securities Held-to-Maturity | ||||||||||||||||||||||||
| Obligations of States and Political Subdivisions | $ | 839 | $ | 1 | $ | - | $ | - | $ | 839 | $ | 1 | ||||||||||||
| Total | $ | 839 | $ | 1 | $ | - | $ | - | $ | 839 | $ | 1 | ||||||||||||
As of December 31, 2014,2016, the Company held 264500 investment securities of which 7209 were in an unrealized loss position for less than twelve months. SixNo securities were in an unrealized loss position for twelve months or more. Management periodically evaluates each investment security for other-than-temporary impairment relying primarily on industry analyst reports and observations of market conditions and interest rate fluctuations. Management believes it will be able to collect all amounts due according to the contractual terms of the underlying investment securities.
Securities of Government Agency and Government Sponsored Entities – At December 31, 2016, no securities of government agency and government sponsored entities were in a loss position for less than 12 months or in a loss position for 12 months or more. The unrealized losses on the Company's investments in securities of government agency and government sponsored entities were $3,000$419,000 at December 31, 2014 and $0 at December 31, 2013.2015. The unrealized loss was caused by interest rate fluctuations. Repayment of these investments is guaranteed by an agency or government sponsored entity of the U.S. government. Accordingly, it is expected that the securities would not be settled at a price less than the amortized cost of the Company's investment. Because the decline in market value is attributable to changes in interest rates and not credit quality, and because the Company does not intend to sell the securities and it is more likely than not that the Company will not have to sell the securities before recovery of their cost basis, the Company doesdid not consider these investments to be other-than-temporarily impaired at December 31, 2014.2015.
`
U.S. Treasury Notes – At December 31, 2016, eight U.S. Treasury Note security investments were in a loss position for less than 12 months and none were in a loss position for 12 months or more. The unrealized losses on the Company's investment in US treasury notes were $332,000 at December 31, 2016 and $164,000 at December 31, 2015. The unrealized losses were caused by interest rate fluctuations. Because the decline in market value is attributable to changes in interest rates and not credit quality, and because the Company does not intend to sell the securities and it is more likely than not that the Company will not have to sell the securities before recovery of their cost basis, the Company did not consider these investments to be other-than-temporarily impaired at December 31, 2016 and December 31, 2015.
U.S. Government SBA – At December 31, 2016, 138 U.S. Government SBA security investments were in a loss position for less than 12 months and none were in a loss position for 12 months or more. The unrealized losses on the Company's investment in U.S. Government SBA were $260,000 at December 31, 2016. The unrealized losses were caused by interest rate fluctuations. Because the decline in market value is attributable to changes in interest rates and not credit quality, and because the Company does not intend to sell the securities and it is more likely than not that the Company will not have to sell the securities before recovery of their cost basis, the Company did not consider these investments to be other-than-temporarily impaired at December 31, 2016. The Company did not own any U.S. Government SBA securities in 2015.
Mortgage Backed Securities - At December 31, 2016, 45 mortgage backed security investments were in a loss position for less than 12 months and none was in a loss position for 12 months or more. The unrealized losses on the Company's investment in mortgage-backed securities were $657,000 at December 31, 2014 and $7.6$1.3 million at December 31, 2013.2016 and $1.2 million at December 31, 2015. The unrealized losses were caused by interest rate fluctuations. The contractual cash flows of these investments are guaranteed by an agency or government sponsored entity of the U.S. government. Accordingly, it is expected that the securities would not be settled at a price less than the amortized cost of the Company's investment. Because the decline in market value is attributable to changes in interest rates and not credit quality, and because the Company does not intend to sell the securities and it is more likely than not that the Company will not have to sell the securities before recovery of their cost basis, the Company does not consider these investments to be other-than-temporarily impaired at December 31, 20142016 or 2013.2015.
Obligations of States and Political Subdivisions - The continuing financial problems being experienced by certain municipalities, along with the financial stresses exhibited by someAt December 31, 2016, 18 obligations of the large monoline bond insurers have increased the overall risk associated with bank-qualified municipal bonds.states and political subdivisions were in a loss position for less than 12 months. None were in a loss position for 12 months or more. As of December 31, 2014,2016, over ninety-sevenninety-eight percent of the Company’s bank-qualified municipal bond portfolio is rated at either the issue or the issuer level, and all of these ratings are “investment grade.” The Company monitors the status of the three percent of the portfolio that is not rated and at the current time does not believe any of them to be exhibiting financial problems that could result in a loss in any individual security.
The unrealized losses on the Company’s investment in obligation of states and political subdivision were $10,000$40,000 at December 31, 20142016 and $627,000$1,000 at December 31, 2013.2015. Management believes that any unrealized losses on the Company's investments in obligations of states and political subdivisions were caused by interest rate fluctuations. The contractual terms of these investments do not permit the issuer to settle the securities at a price less than the amortized cost of the investment. Because the Company did not intend to sell the securities and it is more likely than not that the Company would not have to sell the securities before recovery of their cost basis, the Company did not consider these investments to be other-than-temporarily impaired at December 31, 20142016 and December 31, 2013.2015.
| (in thousands) | Gross Proceeds | Gross Gains | Gross Losses | |||||||||
| 2014 | $ | 130,174 | $ | 1,204 | $ | 1,114 | ||||||
| 2013 | $ | 81,390 | $ | 1,208 | $ | 1,437 | ||||||
| 2012 | $ | 55,986 | $ | 158 | - | |||||||
Proceeds from sale/calls of securities for the periods shown were as follows:
| (in thousands) | Gross Proceeds | Gross Gains | Gross Losses | |||||||||
| 2016 | $ | 105,941 | $ | 250 | $ | 534 | ||||||
| 2015 | $ | 61,335 | $ | 275 | $ | - | ||||||
| 2014 | $ | 130,174 | $ | 1,204 | $ | 1,114 | ||||||
Pledged Securities
As of December 31, 2014,2016, securities carried at $178.8$171.9 million were pledged to secure public deposits, Federal Home Loan Bank (“FHLB”) borrowings, and other government agency deposits as required by law. This amount was $334.8$189.2 million at December 31, 2013.2015.
| 4. | Federal Home Loan Bank |
The Bank is a member of the FHLB system. Members are required to own a certain amount of stock based on the level of borrowings and other factors, and may invest in additional amounts. FHLB stock isand other equity securities are carried at cost, classified as a restricted security,securities, and periodically evaluated for impairment based on ultimate recovery of par value. Both cash and stock dividends are reported as income. FHLB stock isand other equity securities are reported in Interest Receivable and Other Assets and Interest Receivable on the Company’s Consolidated Balance Sheets and totaled $7.7$9.2 million at December 31, 20142016 and $7.2$7.8 million at December 31, 2013.2015.
| 5. | Loans & Leases |
Loans & leases as of December 31 consisted of the following:
| (in thousands) | 2014 | 2013 | 2016 | 2015 | ||||||||||||
| Commercial Real Estate | $ | 495,316 | $ | 411,037 | $ | 674,445 | $ | 609,602 | ||||||||
| Agricultural Real Estate | 357,207 | 328,264 | 467,685 | 424,034 | ||||||||||||
| Real Estate Construction | 96,519 | 41,092 | 176,462 | 151,974 | ||||||||||||
| Residential 1st Mortgages | 171,880 | 151,292 | 242,247 | 206,405 | ||||||||||||
| Home Equity Lines and Loans | 33,017 | 35,477 | 31,625 | 33,056 | ||||||||||||
| Agricultural | 281,963 | 256,414 | 295,325 | 293,966 | ||||||||||||
| Commercial | 230,819 | 150,398 | 217,577 | 210,804 | ||||||||||||
| Consumer & Other | 4,719 | 5,052 | 6,913 | 6,592 | ||||||||||||
| Leases | 44,217 | 12,733 | 70,986 | 65,054 | ||||||||||||
| Total Gross Loans & Leases | 1,715,657 | 1,391,759 | 2,183,265 | 2,001,487 | ||||||||||||
| Less: Unearned Income | 3,413 | 3,523 | 5,664 | 5,128 | ||||||||||||
| Subtotal | 1,712,244 | 1,388,236 | 2,177,601 | 1,996,359 | ||||||||||||
| Less: Allowance for Credit Losses | 35,401 | 34,274 | 47,919 | 41,523 | ||||||||||||
| Loans & Leases, Net | $ | 1,676,843 | $ | 1,353,962 | $ | 2,129,682 | $ | 1,954,836 | ||||||||
At December 31, 2014,2016, the portion of loans that were approved for pledging as collateral on borrowing lines with the Federal Home Loan Bank (“FHLB”) and the Federal Reserve Bank (“FRB”) were $516.6$664.7 million and $537.5$548.0 million, respectively. The borrowing capacity on these loans was $256.6$566.5 million from FHLB and $340.5$356.1 million from the FRB.
| 6. | Allowance for Credit Losses |
The following tables show the allocation of the allowance for credit losses at December 31, 20142016 and December 31, 20132015 by portfolio segment and by impairment methodology (in thousands):
| December 31, 2014 | Commercial Real Estate | Agricultural Real Estate | Real Estate Construction | Residential 1st Mortgages | Home Equity Lines & Loans | Agricultural | Commercial | Consumer & Other | Leases | Unallocated | Total | |||||||||||||||||||||||||||||||||||||||||||||||||||||||||||||||||||||||||||||
| December 31, 2016 | Commercial Real Estate | Agricultural Real Estate | Real Estate Construction | Residential 1st Mortgages | Home Equity Lines & Loans | Agricultural | Commercial | Consumer & Other | Leases | Unallocated | Total | |||||||||||||||||||||||||||||||||||||||||||||||||||||||||||||||||||||||||||||
| Year-To-Date Allowance for Credit Losses: | Year-To-Date Allowance for Credit Losses: | Year-To-Date Allowance for Credit Losses: | ||||||||||||||||||||||||||||||||||||||||||||||||||||||||||||||||||||||||||||||||||||||
| Beginning Balance- January 1, 2014 | $ | 5,178 | $ | 3,576 | $ | 654 | $ | 1,108 | $ | 2,767 | $ | 12,205 | $ | 5,697 | $ | 176 | $ | 639 | $ | 2,274 | $ | 34,274 | ||||||||||||||||||||||||||||||||||||||||||||||||||||||||||||||||||
| Beginning Balance- January 1, 2016 | $ | 10,063 | $ | 6,881 | $ | 2,485 | $ | 789 | $ | 2,146 | $ | 6,308 | $ | 7,836 | $ | 175 | $ | 3,294 | $ | 1,546 | $ | 41,523 | ||||||||||||||||||||||||||||||||||||||||||||||||||||||||||||||||||
| Charge-Offs | - | - | - | (73 | ) | (70 | ) | - | (1 | ) | (132 | ) | - | - | (276 | ) | - | - | - | (21 | ) | (46 | ) | - | - | (105 | ) | - | - | (172 | ) | |||||||||||||||||||||||||||||||||||||||||||||||||||||||||
| Recoveries | 11 | - | - | - | 58 | 8 | 86 | 65 | - | - | 228 | 2 | - | - | 26 | 103 | - | 47 | 55 | - | - | 233 | ||||||||||||||||||||||||||||||||||||||||||||||||||||||||||||||||||
| Provision | 2,653 | 609 | 1,015 | (13 | ) | (329 | ) | (6,109 | ) | 2,413 | 109 | 1,572 | (745 | ) | 1,175 | 1,045 | 2,569 | 738 | 71 | (63 | ) | 1,073 | 632 | 75 | 292 | (97 | ) | 6,335 | ||||||||||||||||||||||||||||||||||||||||||||||||||||||||||||
| Ending Balance- December 31, 2014 | $ | 7,842 | $ | 4,185 | $ | 1,669 | $ | 1,022 | $ | 2,426 | $ | 6,104 | $ | 8,195 | $ | 218 | $ | 2,211 | $ | 1,529 | $ | 35,401 | ||||||||||||||||||||||||||||||||||||||||||||||||||||||||||||||||||
| Ending Balance- December 31, 2016 | $ | 11,110 | $ | 9,450 | $ | 3,223 | $ | 865 | $ | 2,140 | $ | 7,381 | $ | 8,515 | $ | 200 | $ | 3,586 | $ | 1,449 | $ | 47,919 | ||||||||||||||||||||||||||||||||||||||||||||||||||||||||||||||||||
| Ending Balance Individually Evaluated for Impairment | 377 | - | - | 422 | 329 | 114 | 914 | 41 | - | - | 2,197 | - | - | - | 70 | 18 | 128 | 608 | 7 | - | - | 831 | ||||||||||||||||||||||||||||||||||||||||||||||||||||||||||||||||||
| Ending Balance Collectively Evaluated for Impairment | 7,465 | 4,185 | 1,669 | 600 | 2,097 | 5,990 | 7,281 | 177 | 2,211 | 1,529 | 33,204 | 11,110 | 9,450 | 3,223 | 795 | 2,122 | 7,253 | 7,907 | 193 | 3,586 | 1,449 | 47,088 | ||||||||||||||||||||||||||||||||||||||||||||||||||||||||||||||||||
| Loans & Leases: | ||||||||||||||||||||||||||||||||||||||||||||||||||||||||||||||||||||||||||||||||||||||||
| Ending Balance | $ | 491,903 | $ | 357,207 | $ | 96,519 | $ | 171,880 | $ | 33,017 | $ | 281,963 | $ | 230,819 | $ | 4,719 | $ | 44,217 | $ | - | $ | 1,712,244 | $ | 668,046 | $ | 467,685 | $ | 176,462 | $ | 242,247 | $ | 31,625 | $ | 295,325 | $ | 217,577 | $ | 6,913 | $ | 71,721 | $ | - | $ | 2,177,601 | ||||||||||||||||||||||||||||||||||||||||||||
| Ending Balance Individually Evaluated for Impairment | 20,066 | - | 4,386 | 2,108 | 1,643 | 461 | 4,874 | 46 | - | - | 33,584 | 1,932 | 1,304 | - | 2,126 | 402 | 625 | 4,464 | 10 | - | - | 10,863 | ||||||||||||||||||||||||||||||||||||||||||||||||||||||||||||||||||
| Ending Balance Collectively Evaluated for Impairment | 471,837 | 357,207 | 92,133 | 169,772 | 31,374 | 281,502 | 225,945 | 4,673 | 44,217 | - | 1,678,660 | 666,114 | 466,381 | 176,462 | 240,121 | 31,223 | 294,700 | 213,113 | 6,903 | 71,721 | - | 2,166,738 | ||||||||||||||||||||||||||||||||||||||||||||||||||||||||||||||||||
| December 31, 2013 | Commercial Real Estate | Agricultural Real Estate | Real Estate Construction | Residential 1st Mortgages | Home Equity Lines & Loans | Agricultural | Commercial | Consumer & Other | Leases | Unallocated | Total | |||||||||||||||||||||||||||||||||||||||||||||||||||||||||||||||||||||||||||||
| December 31, 2015 | Commercial Real Estate | Agricultural Real Estate | Real Estate Construction | Residential 1st Mortgages | Home Equity Lines & Loans | Agricultural | Commercial | Consumer & Other | Leases | Unallocated | Total | |||||||||||||||||||||||||||||||||||||||||||||||||||||||||||||||||||||||||||||
| Year-To-Date Allowance for Credit Losses: | Year-To-Date Allowance for Credit Losses: | Year-To-Date Allowance for Credit Losses: | ||||||||||||||||||||||||||||||||||||||||||||||||||||||||||||||||||||||||||||||||||||||
| Beginning Balance- January 1, 2013 | $ | 6,464 | $ | 2,877 | $ | 986 | $ | 1,219 | $ | 3,235 | $ | 10,437 | $ | 7,963 | $ | 182 | $ | - | $ | 854 | $ | 34,217 | ||||||||||||||||||||||||||||||||||||||||||||||||||||||||||||||||||
| Beginning Balance- January 1, 2015 | $ | 7,842 | $ | 4,185 | $ | 1,669 | $ | 1,022 | $ | 2,426 | $ | 6,104 | $ | 8,195 | $ | 218 | $ | 2,211 | $ | 1,529 | $ | 35,401 | ||||||||||||||||||||||||||||||||||||||||||||||||||||||||||||||||||
| Charge-Offs | (6 | ) | (575 | ) | - | (16 | ) | (91 | ) | (23 | ) | (60 | ) | (120 | ) | - | - | (891 | ) | - | - | - | - | - | - | (12 | ) | (84 | ) | - | - | (96 | ) | |||||||||||||||||||||||||||||||||||||||||||||||||||||||
| Recoveries | - | - | - | - | 115 | 42 | 312 | 54 | - | - | 523 | 2,939 | - | 2,225 | 8 | 87 | 4 | �� | 136 | 69 | - | - | 5,468 | |||||||||||||||||||||||||||||||||||||||||||||||||||||||||||||||||
| Provision | (1,280 | ) | 1,274 | (332 | ) | (95 | ) | (492 | ) | 1,749 | (2,518 | ) | 60 | 639 | 1,420 | 425 | (718 | ) | 2,696 | (1,409 | ) | (241 | ) | (367 | ) | 200 | (483 | ) | (28 | ) | 1,083 | 17 | 750 | |||||||||||||||||||||||||||||||||||||||||||||||||||||||
| Ending Balance- December 31, 2013 | $ | 5,178 | $ | 3,576 | $ | 654 | $ | 1,108 | $ | 2,767 | $ | 12,205 | $ | 5,697 | $ | 176 | $ | 639 | $ | 2,274 | $ | 34,274 | ||||||||||||||||||||||||||||||||||||||||||||||||||||||||||||||||||
| Ending Balance- December 31, 2015 | $ | 10,063 | $ | 6,881 | $ | 2,485 | $ | 789 | $ | 2,146 | $ | 6,308 | $ | 7,836 | $ | 175 | $ | 3,294 | $ | 1,546 | $ | 41,523 | ||||||||||||||||||||||||||||||||||||||||||||||||||||||||||||||||||
| Ending Balance Individually Evaluated for Impairment | - | - | - | 414 | 209 | 122 | 820 | 51 | - | - | 1,616 | 61 | - | - | 69 | 35 | 115 | 905 | 28 | - | - | 1,213 | ||||||||||||||||||||||||||||||||||||||||||||||||||||||||||||||||||
| Ending Balance Collectively Evaluated for Impairment | 5,178 | 3,576 | 654 | 694 | 2,558 | 12,083 | 4,877 | 125 | 639 | 2,274 | 32,658 | 10,002 | 6,881 | 2,485 | 720 | 2,111 | 6,193 | 6,931 | 147 | 3,294 | 1,546 | 40,310 | ||||||||||||||||||||||||||||||||||||||||||||||||||||||||||||||||||
| Loans & Leases: | ||||||||||||||||||||||||||||||||||||||||||||||||||||||||||||||||||||||||||||||||||||||||
| Ending Balance | $ | 407,514 | $ | 328,264 | $ | 41,092 | $ | 151,292 | $ | 35,477 | $ | 256,414 | $ | 150,398 | $ | 5,052 | $ | 12,733 | $ | - | $ | 1,388,236 | $ | 603,650 | $ | 424,034 | $ | 151,974 | $ | 206,405 | $ | 33,056 | $ | 293,966 | $ | 210,804 | $ | 6,592 | $ | 65,878 | $ | - | $ | 1,996,359 | ||||||||||||||||||||||||||||||||||||||||||||
| Ending Balance Individually Evaluated for Impairment | 22,176 | - | 4,500 | 2,072 | 1,045 | 522 | 5,250 | 51 | - | - | 35,616 | 3,420 | - | - | 2,010 | 1,214 | 606 | 4,760 | 34 | - | - | 12,044 | ||||||||||||||||||||||||||||||||||||||||||||||||||||||||||||||||||
| Ending Balance Collectively Evaluated for Impairment | 385,338 | 328,264 | 36,592 | 149,220 | 34,432 | 255,892 | 145,148 | 5,001 | 12,733 | - | 1,352,620 | 600,230 | 424,034 | 151,974 | 204,395 | 31,842 | 293,360 | 206,044 | 6,558 | 65,878 | - | 1,984,315 | ||||||||||||||||||||||||||||||||||||||||||||||||||||||||||||||||||
The ending balance of loans individually evaluated for impairment includes restructured loans in the amount of $26.4$3.3 million and $28.4$4.9 million at December 31, 20142016 and 2013,2015, respectively, which are no longer disclosed or classified as TDR’s.
The following tables show the loan & lease portfolio allocated by management’s internal risk ratings at December 31, 20142016 and December 31, 20132015 (in thousands):
| December 31, 2014 | Pass | Special Mention | Substandard | Total Loans | ||||||||||||||||||||||||||||
| December 31, 2016 | Pass | Special Mention | Substandard | Total Loans | ||||||||||||||||||||||||||||
| Loans & Leases: | ||||||||||||||||||||||||||||||||
| Commercial Real Estate | $ | 483,146 | $ | 8,651 | $ | 106 | $ | 491,903 | $ | 659,694 | $ | 6,817 | $ | 1,535 | $ | 668,046 | ||||||||||||||||
| Agricultural Real Estate | 357,207 | - | - | 357,207 | 464,997 | 1,384 | 1,304 | 467,685 | ||||||||||||||||||||||||
| Real Estate Construction | 94,887 | 1,632 | - | 96,519 | 176,462 | - | - | 176,462 | ||||||||||||||||||||||||
| Residential 1st Mortgages | 170,462 | 744 | 674 | 171,880 | 241,816 | 47 | 384 | 242,247 | ||||||||||||||||||||||||
| Home Equity Lines and Loans | 32,054 | 85 | 878 | 33,017 | 31,558 | - | 67 | 31,625 | ||||||||||||||||||||||||
| Agricultural | 281,232 | 679 | 52 | 281,963 | 283,525 | 11,366 | 434 | 295,325 | ||||||||||||||||||||||||
| Commercial | 211,036 | 18,143 | 1,640 | 230,819 | 208,172 | 6,974 | 2,431 | 217,577 | ||||||||||||||||||||||||
| Consumer & Other | 4,449 | - | 270 | 4,719 | 6,705 | - | 208 | 6,913 | ||||||||||||||||||||||||
| Leases | 44,217 | - | - | 44,217 | 71,721 | - | - | 71,721 | ||||||||||||||||||||||||
| Total | $ | 1,678,690 | $ | 29,934 | $ | 3,620 | $ | 1,712,244 | $ | 2,144,650 | $ | 26,588 | $ | 6,363 | $ | 2,177,601 | ||||||||||||||||
| December 31, 2013 | Pass | Special Mention | Substandard | Total Loans | ||||||||||||||||||||||||||||
| December 31, 2015 | Pass | Special Mention | Substandard | Total Loans | ||||||||||||||||||||||||||||
| Loans & Leases: | ||||||||||||||||||||||||||||||||
| Commercial Real Estate | $ | 398,488 | $ | 7,979 | $ | 1,047 | $ | 407,514 | $ | 595,011 | $ | 7,917 | $ | 722 | $ | 603,650 | ||||||||||||||||
| Agricultural Real Estate | 325,926 | 2,338 | - | 328,264 | 424,034 | - | - | 424,034 | ||||||||||||||||||||||||
| Real Estate Construction | 39,460 | 1,632 | - | 41,092 | 150,379 | 1,595 | - | 151,974 | ||||||||||||||||||||||||
| Residential 1st Mortgages | 149,798 | 774 | 720 | 151,292 | 205,135 | 413 | 857 | 206,405 | ||||||||||||||||||||||||
| Home Equity Lines and Loans | 34,821 | - | 656 | 35,477 | 32,419 | 75 | 562 | 33,056 | ||||||||||||||||||||||||
| Agricultural | 255,443 | 889 | 82 | 256,414 | 293,325 | 9 | 632 | 293,966 | ||||||||||||||||||||||||
| Commercial | 132,008 | 15,426 | 2,964 | 150,398 | 199,467 | 8,160 | 3,177 | 210,804 | ||||||||||||||||||||||||
| Consumer & Other | 4,763 | - | 289 | 5,052 | 6,411 | - | 181 | 6,592 | ||||||||||||||||||||||||
| Leases | 12,733 | - | - | 12,733 | 65,878 | - | - | 65,878 | ||||||||||||||||||||||||
| Total | $ | 1,353,440 | $ | 29,038 | $ | 5,758 | $ | 1,388,236 | $ | 1,972,059 | $ | 18,169 | $ | 6,131 | $ | 1,996,359 | ||||||||||||||||
See Note 1. Significant Accounting Policies – Allowance for Credit Losses for a description of the internal risk ratings used by the Company. There were no loans & leases outstanding at December 31, 20142016 and 20132015 rated doubtful or loss.
The following tables show an aging analysis of the loan & lease portfolio by the time past due at December 31, 20142016 and December 31, 20132015 (in thousands):
| December 31, 2014 | 30-59 Days Past Due | 60-89 Days Past Due | 90 Days and Still Accruing | Nonaccrual | Total Past Due | Current | Total Loans & Leases | |||||||||||||||||||||||||||||||||||||||||||||||||
| December 31, 2016 | 30-59 Days Past Due | 60-89 Days Past Due | 90 Days and Still Accruing | Nonaccrual | Total Past Due | Current | Total Loans & Leases | |||||||||||||||||||||||||||||||||||||||||||||||||
| Loans & Leases: | ||||||||||||||||||||||||||||||||||||||||||||||||||||||||
| Commercial Real Estate | $ | - | $ | - | $ | - | $ | - | $ | - | $ | 491,903 | $ | 491,903 | $ | - | $ | - | $ | - | $ | - | $ | - | $ | 668,046 | $ | 668,046 | ||||||||||||||||||||||||||||
| Agricultural Real Estate | - | - | - | - | - | 357,207 | 357,207 | - | - | - | 1,304 | 1,304 | 466,381 | 467,685 | ||||||||||||||||||||||||||||||||||||||||||
| Real Estate Construction | - | - | - | - | - | 96,519 | 96,519 | - | - | - | - | - | 176,462 | 176,462 | ||||||||||||||||||||||||||||||||||||||||||
| Residential 1st Mortgages | - | - | - | 77 | 77 | 171,803 | 171,880 | - | - | - | 95 | 95 | 242,152 | 242,247 | ||||||||||||||||||||||||||||||||||||||||||
| Home Equity Lines and Loans | 79 | - | - | 576 | 655 | 32,362 | 33,017 | - | - | - | - | - | 31,625 | 31,625 | ||||||||||||||||||||||||||||||||||||||||||
| Agricultural | - | - | - | 18 | 18 | 281,945 | 281,963 | - | - | - | 243 | 243 | 295,082 | 295,325 | ||||||||||||||||||||||||||||||||||||||||||
| Commercial | - | - | - | 1,586 | 1,586 | 229,233 | 230,819 | - | - | - | 1,425 | 1,425 | 216,152 | 217,577 | ||||||||||||||||||||||||||||||||||||||||||
| Consumer & Other | 10 | - | - | 13 | 23 | 4,696 | 4,719 | 10 | - | - | 7 | 17 | 6,896 | 6,913 | ||||||||||||||||||||||||||||||||||||||||||
| Leases | - | - | - | - | - | 44,217 | 44,217 | - | - | - | - | - | 71,721 | 71,721 | ||||||||||||||||||||||||||||||||||||||||||
| Total | $ | 89 | $ | - | $ | - | $ | 2,270 | $ | 2,359 | $ | 1,709,885 | $ | 1,712,244 | $ | 10 | $ | - | $ | - | $ | 3,074 | $ | 3,084 | $ | 2,174,517 | $ | 2,177,601 | ||||||||||||||||||||||||||||
| December 31, 2013 | 30-89 Days Past Due | 60-89 Days Past Due | 90 Days and Still Accruing | Nonaccrual | Total Past Due | Current | Total Loans | |||||||||||||||||||||||||||||||||||||||||||||||||
| December 31, 2015 | 30-59 Days Past Due | 60-89 Days Past Due | 90 Days and Still Accruing | Nonaccrual | Total Past Due | Current | Total Loans & Leases | |||||||||||||||||||||||||||||||||||||||||||||||||
| Loans & Leases: | ||||||||||||||||||||||||||||||||||||||||||||||||||||||||
| Commercial Real Estate | $ | 773 | $ | - | $ | - | $ | - | $ | 773 | $ | 406,741 | $ | 407,514 | $ | 705 | $ | - | $ | - | $ | 19 | $ | 724 | $ | 602,926 | $ | 603,650 | ||||||||||||||||||||||||||||
| Agricultural Real Estate | 607 | - | - | - | 607 | 327,657 | 328,264 | - | - | - | - | - | 424,034 | 424,034 | ||||||||||||||||||||||||||||||||||||||||||
| Real Estate Construction | - | - | - | - | - | 41,092 | 41,092 | - | - | - | - | - | 151,974 | 151,974 | ||||||||||||||||||||||||||||||||||||||||||
| Residential 1st Mortgages | - | - | - | 324 | 324 | 150,968 | 151,292 | 97 | 194 | - | 65 | 356 | 206,049 | 206,405 | ||||||||||||||||||||||||||||||||||||||||||
| Home Equity Lines and Loans | - | 52 | - | 406 | 458 | 35,019 | 35,477 | - | - | - | 538 | 538 | 32,518 | 33,056 | ||||||||||||||||||||||||||||||||||||||||||
| Agricultural | - | - | - | 35 | 35 | 256,379 | 256,414 | - | - | - | - | - | 293,966 | 293,966 | ||||||||||||||||||||||||||||||||||||||||||
| Commercial | - | - | - | 1,815 | 1,815 | 148,583 | 150,398 | - | - | - | 1,524 | 1,524 | 209,280 | 210,804 | ||||||||||||||||||||||||||||||||||||||||||
| Consumer & Other | 19 | - | - | 16 | 35 | 5,017 | 5,052 | 7 | - | - | 10 | 17 | 6,575 | 6,592 | ||||||||||||||||||||||||||||||||||||||||||
| Leases | - | - | - | - | - | 12,733 | 12,733 | - | - | - | - | - | 65,878 | 65,878 | ||||||||||||||||||||||||||||||||||||||||||
| Total | $ | 1,399 | $ | 52 | $ | - | $ | 2,596 | $ | 4,047 | $ | 1,384,189 | $ | 1,388,236 | $ | 809 | $ | 194 | $ | - | $ | 2,156 | $ | 3,159 | $ | 1,993,200 | $ | 1,996,359 | ||||||||||||||||||||||||||||
Non-accrual loans & leases at December 31, 20142016 and 20132015 were $2.3$3.1 million and $2.6$2.2 million, respectively. Interest income forgone on loans & leases placed on non-accrual status was $92,000,$127,000, $52,000,109,000, and $209,000$92,000 for the years ended December 31, 2014, 2013,2016, 2015, and 2012,2014, respectively.
The following tables show information related to impaired loans & leases at and for the year ended December 31, 20142016 and December 31, 20132015 (in thousands):
| December 31, 2014 | Recorded Investment | Unpaid Principal | Related Allowance | Average Recorded | Interest Income | |||||||||||||||||||||||||||||||||||
| December 31, 2016 | Recorded Investment | Unpaid Principal Balance | Related Allowance | Average Recorded Investment | Interest Income Recognized | |||||||||||||||||||||||||||||||||||
| With no related allowance recorded: | ||||||||||||||||||||||||||||||||||||||||
| Commercial Real Estate | $ | - | $ | - | $ | - | $ | 49 | $ | 4 | $ | 184 | $ | 184 | $ | - | $ | 354 | $ | 7 | ||||||||||||||||||||
| Agricultural Real Estate | - | - | - | - | - | 1,305 | 1,305 | - | 569 | 3 | ||||||||||||||||||||||||||||||
| Real Estate Construction | - | - | - | - | - | |||||||||||||||||||||||||||||||||||
| Residential 1st Mortgages | - | - | - | - | - | 451 | 504 | - | 404 | 10 | ||||||||||||||||||||||||||||||
| Home Equity Lines and Loans | - | - | - | 169 | - | - | - | - | 181 | - | ||||||||||||||||||||||||||||||
| Agricultural | - | - | - | 15 | - | - | - | - | 144 | 5 | ||||||||||||||||||||||||||||||
| Commercial | - | - | - | 1,620 | 54 | 3,023 | 3,023 | - | 3,053 | 133 | ||||||||||||||||||||||||||||||
| Consumer & Other | - | - | - | - | - | |||||||||||||||||||||||||||||||||||
| $ | - | $ | - | $ | - | $ | 1,853 | $ | 58 | $ | 4,963 | $ | 5,016 | $ | - | $ | 4,705 | $ | 158 | |||||||||||||||||||||
| With an allowance recorded: | ||||||||||||||||||||||||||||||||||||||||
| Commercial Real Estate | $ | 92 | $ | 92 | $ | 2 | $ | 47 | $ | 4 | ||||||||||||||||||||||||||||||
| Agricultural Real Estate | - | - | - | - | - | |||||||||||||||||||||||||||||||||||
| Real Estate Construction | - | - | - | - | - | |||||||||||||||||||||||||||||||||||
| Residential 1st Mortgages | 937 | 1,069 | 187 | 612 | 9 | $ | 430 | $ | 469 | $ | 21 | $ | 336 | $ | 13 | |||||||||||||||||||||||||
| Home Equity Lines and Loans | 951 | 1,020 | 190 | 803 | 10 | 90 | 97 | 5 | 123 | 4 | ||||||||||||||||||||||||||||||
| Agricultural | 461 | 473 | 114 | 473 | 28 | 625 | 625 | 128 | 581 | 22 | ||||||||||||||||||||||||||||||
| Commercial | 4,742 | 4,813 | 910 | 3,182 | 54 | 1,441 | 1,640 | 608 | 1,536 | 8 | ||||||||||||||||||||||||||||||
| Consumer & Other | 46 | 51 | 41 | 46 | 2 | 6 | 13 | 6 | 12 | - | ||||||||||||||||||||||||||||||
| $ | 7,229 | $ | 7,518 | $ | 1,444 | $ | 5,163 | $ | 107 | $ | 2,592 | $ | 2,844 | $ | 768 | $ | 2,588 | $ | 47 | |||||||||||||||||||||
| Total | $ | 7,229 | $ | 7,518 | $ | 1,444 | $ | 7,016 | $ | 165 | $ | 7,555 | $ | 7,860 | $ | 768 | $ | 7,293 | $ | 205 | ||||||||||||||||||||
| December 31, 2013 | Recorded Investment | Unpaid Principal | Related Allowance | Average Recorded | Interest Income | |||||||||||||||||||||||||||||||||||
| December 31, 2015 | Recorded Investment | Unpaid Principal Balance | Related Allowance | Average Recorded Investment | Interest Income Recognized | |||||||||||||||||||||||||||||||||||
| With no related allowance recorded: | ||||||||||||||||||||||||||||||||||||||||
| Commercial Real Estate | $ | 102 | $ | 101 | $ | - | $ | 865 | $ | 8 | $ | 102 | $ | 104 | $ | - | $ | 479 | $ | 7 | ||||||||||||||||||||
| Agricultural Real Estate | - | - | - | 2,185 | - | |||||||||||||||||||||||||||||||||||
| Real Estate Construction | - | - | - | - | - | |||||||||||||||||||||||||||||||||||
| Residential 1st Mortgages | - | - | - | 450 | 11 | 551 | 618 | - | 560 | 16 | ||||||||||||||||||||||||||||||
| Home Equity Lines and Loans | - | - | - | 228 | 5 | 581 | 646 | - | 620 | 3 | ||||||||||||||||||||||||||||||
| Agricultural | 35 | 43 | - | 586 | - | 193 | 193 | - | 105 | 3 | ||||||||||||||||||||||||||||||
| Commercial | 3,474 | 3,532 | - | 939 | 13 | 3,103 | 3,103 | - | 2,349 | 85 | ||||||||||||||||||||||||||||||
| $ | 3,611 | $ | 3,676 | $ | - | $ | 5,253 | $ | 37 | $ | 4,530 | $ | 4,664 | $ | - | $ | 4,113 | $ | 114 | |||||||||||||||||||||
| With an allowance recorded: | ||||||||||||||||||||||||||||||||||||||||
| Commercial Real Estate | $ | - | $ | - | $ | - | $ | 2 | $ | - | ||||||||||||||||||||||||||||||
| Agricultural Real Estate | - | - | - | 823 | - | |||||||||||||||||||||||||||||||||||
| Real Estate Construction | - | - | - | - | - | |||||||||||||||||||||||||||||||||||
| Residential 1st Mortgages | 769 | 826 | 154 | 254 | 6 | $ | 348 | $ | 420 | $ | 17 | $ | 354 | $ | 16 | |||||||||||||||||||||||||
| Home Equity Lines and Loans | 689 | 821 | 138 | 332 | 3 | 134 | 151 | 7 | 136 | 5 | ||||||||||||||||||||||||||||||
| Agricultural | 488 | 488 | 122 | 1,002 | 31 | 412 | 413 | 115 | 431 | 28 | ||||||||||||||||||||||||||||||
| Commercial | 1,641 | 1,657 | 820 | 1,072 | 6 | 1,657 | 1,798 | 905 | 2,456 | 31 | ||||||||||||||||||||||||||||||
| Consumer & Other | 50 | 53 | 50 | 126 | 3 | 34 | 40 | 29 | 39 | 3 | ||||||||||||||||||||||||||||||
| $ | 3,637 | $ | 3,845 | $ | 1,284 | $ | 3,611 | $ | 49 | $ | 2,585 | $ | 2,822 | $ | 1,073 | $ | 3,416 | $ | 83 | |||||||||||||||||||||
| Total | $ | 7,248 | $ | 7,521 | $ | 1,284 | $ | 8,864 | $ | 86 | $ | 7,115 | $ | 7,486 | $ | 1,073 | $ | 7,529 | $ | 197 | ||||||||||||||||||||
Total recorded investment shown in the prior table will not equal the total ending balance of loans & leases individually evaluated for impairment on the allocation of allowance table. This is because the calculation of recorded investment takes into account charge-offs, net unamortized loan & lease fees & costs, unamortized premium or discount, and accrued interest. This table also excludes impaired loans that were previously modified in a troubled debt restructuring, are currently performing and are no longer disclosed or classified as TDR’s.
At December 31, 2014,2016, the Company allocated $1.3$736,000 of specific reserves to $5.9 million of troubled debt restructured loans, of which $4.5 million were performing. At December 31, 2015, the Company allocated $1.1 million of specific reserves to $6.6 million of troubled debt restructured loans, of which $5.0 million were performing. At December 31, 2013, the Company allocated $1.2 million of specific reserves to $6.8 million of troubled debt restructured loans, of which $4.6 million were performing. The Company had no commitments at December 31, 20142016 and December 31, 20132015 to lend additional amounts to customers with outstanding loans that are classified as troubled debt restructurings.
During the period ending December 31, 2014,2016, the terms of certain loans were modified as troubled debt restructurings. The modification of the terms of such loans included one or a combination of the following: a reduction of the stated interest rate of the loan; an extension of the maturity date at a stated rate of interest lower than the current market rate for new debt with similar risk; or a permanent reduction of the recorded investment in the loan.
Modifications involving a reduction of the stated interest rate of the loan were for 5 years. Modifications involving an extension of the maturity date were for 10 years.
The following table presents loans by class modified as troubled debt restructured loans for the period ended December 31, 2016 (in thousands):
| December 31, 2016 | ||||||||||||
| Troubled Debt Restructurings | Number of Loans | Pre-Modification Outstanding Recorded Investment | Post-Modification Outstanding Recorded Investment | |||||||||
| Commercial Real Estate | 1 | $ | 112 | $ | 112 | |||||||
| Residential 1st Mortgages | 2 | 289 | 281 | |||||||||
| Home Equity Lines and Loans | 2 | 305 | 286 | |||||||||
| Total | 5 | $ | 706 | $ | 679 | |||||||
The troubled debt restructurings described above had no impact on the allowance for credit losses and resulted in charge-offs of $27,000 for the twelve months ended December 31, 2016.
During the period ended December 31, 2016, there were no payment defaults on loans modified as troubled debt restructurings within twelve months following the modification. The Company considers a loan to be in payment default once it is greater than 90 days contractually past due under the modified terms.
During the period ending December 31, 2015, the terms of certain loans were modified as troubled debt restructurings. The modification of the terms of such loans included one or a combination of the following: a reduction of the stated interest rate of the loan; an extension of the maturity date at a stated rate of interest lower than the current market rate for new debt with similar risk; or a permanent reduction of the recorded investment in the loan.
Modifications involving a reduction of the stated interest rate of the loan were for periods ranging from 45 to 3010 years. Modifications involving an extension of the maturity date were for periods ranging from 6 months5 to 3010 years.
The following table presents loans by class modified as troubled debt restructured loans for the period ended December 31, 20142015 (in thousands):
| December 31, 2014 | December 31, 2015 | |||||||||||||||||||||||
| Troubled Debt Restructurings | Number of Loans | Pre-Modification Outstanding Recorded Investment | Post-Modification Outstanding Recorded Investment | Number of Loans | Pre-Modification Outstanding Recorded Investment | Post-Modification Outstanding Recorded Investment | ||||||||||||||||||
| Residential 1st Mortgages | 5 | $ | 857 | $ | 804 | |||||||||||||||||||
| Home Equity Lines and Loans | 3 | 98 | 89 | |||||||||||||||||||||
| Agricultural | 1 | 32 | 32 | 1 | $ | 194 | $ | 194 | ||||||||||||||||
| Commercial | 1 | 18 | 18 | 1 | 131 | 119 | ||||||||||||||||||
| Consumer & Other | 1 | 7 | 7 | |||||||||||||||||||||
| Total | 11 | $ | 1,012 | $ | 950 | 2 | $ | 325 | $ | 313 | ||||||||||||||
The troubled debt restructurings described above increased the allowance for credit losses by $28,000$70,000 and resulted in charge-offs of $63,000$12,000 for the twelve months ended December 31, 2014.2015.
During the period ended December 31, 2014,2015, there were no payment defaults on loans modified as troubled debt restructurings within twelve months following the modification. The Company considers a loan to be in payment default once it is greater than 90 days contractually past due under the modified terms.
| December 31, 2013 | ||||||||||||
| Troubled Debt Restructurings | Number of Loans | Pre-Modification Outstanding Recorded Investment | Post-Modification Outstanding Recorded Investment | |||||||||
| Residential 1st Mortgages | 4 | $ | 306 | $ | 290 | |||||||
| Home Equity Lines and Loans | 4 | 414 | 387 | |||||||||
| Commercial | 4 | 5,016 | 5,016 | |||||||||
| Total | 12 | $ | 5,736 | $ | 5,693 | |||||||
| 7. | Premises and Equipment |
Premises and equipment as of December 31, consisted of the following:
| (in thousands) | 2014 | 2013 | 2016 | 2015 | ||||||||||||
| Land and Buildings | $ | 33,527 | $ | 33,354 | $ | 37,003 | $ | 33,530 | ||||||||
| Furniture, Fixtures, and Equipment | 20,244 | 16,770 | 20,196 | 19,125 | ||||||||||||
| Leasehold Improvements | 1,763 | 2,060 | 2,439 | 2,437 | ||||||||||||
| Subtotal | 55,534 | 52,184 | 59,638 | 55,092 | ||||||||||||
| Less: Accumulated Depreciation and Amortization | 29,713 | 29,297 | 30,409 | 28,517 | ||||||||||||
| Total | $ | 25,821 | $ | 22,887 | $ | 29,229 | $ | 26,575 | ||||||||
Depreciation and amortization on premises and equipment included in occupancy and equipment expense amounted to $1,325,000, $1,506,000,$1,896,000, $1,685,000, and $1,704,000$1,325,000 for the years ended December 31, 2014, 2013,2016, 2015 and 2012,2014, respectively. Total rental expense for premises was $530,000, $411,000,$644,000, $604,000, and $391,000$530,000 for the years ended December 31, 2014, 2013,2016, 2015, and 2012,2014, respectively. Rental income was $81,000, $102,000, $94,000, and $148,000$81,000 for the years ended December 31, 2014, 2013,2016, 2015, and 2012,2014, respectively.
| 8. | Other Real Estate |
The Bank reported $3.3 million, net of $3.7 million reserve, in other real estate at December 31, 2014,2016, and $4.6$2.4 million netat December 31, 2015. The acquisition of $3.7Delta National Bancorp added $3.0 million reserve, in 2013.of ORE to the Company. Other real estate includes property no longer utilized for business operations and property acquired through foreclosure proceedings. These properties are carried at fair value less selling costs determined at the date acquired. Losses, if any, arising from properties acquired through foreclosure are charged against the allowance for loan losses at the time of foreclosure. Subsequent declines in value, periodic holding costs, and net gains or losses on disposition are included in other operating expense as incurred. Other real estate is reported in Interest Receivable and Other Assets on the Company’s Consolidated Balance Sheets.
| 9. | Time Deposits |
Time Deposits of $250,000 or more as of December 31 were as follows:
| (in thousands) | 2014 | 2013 | 2016 | 2015 | ||||||||||||
| Balance | $ | 239,649 | $ | 206,189 | $ | 289,955 | $ | 236,963 | ||||||||
At December 31, 2014,2016, the scheduled maturities of time deposits were as follows:
| (in thousands) | Scheduled Maturities | Scheduled Maturities | ||||||
| 2015 | $ | 410,487 | ||||||
| 2016 | 34,330 | |||||||
| 2017 | 20,355 | $ | 480,828 | |||||
| 2018 | 2,021 | 80,231 | ||||||
| 2019 | 1,090 | 5,315 | ||||||
| 2020 | 741 | |||||||
| 2021 | 3,178 | |||||||
| Total | $ | 468,283 | $ | 570,293 | ||||
| 10. | Income Taxes |
Current and deferred income tax expense (benefit) provided for the years ended December 31 consisted of the following:
| (in thousands) | 2014 | 2013 | 2012 | 2016 | 2015 | 2014 | ||||||||||||||||||
| Current | ||||||||||||||||||||||||
| Federal | $ | 7,941 | $ | 11,497 | $ | 12,252 | $ | 13,101 | $ | 11,979 | $ | 7,941 | ||||||||||||
| State | 4,345 | 4,357 | 4,281 | 4,832 | 4,446 | 4,345 | ||||||||||||||||||
| Total Current | 12,286 | 15,854 | 16,533 | 17,933 | 16,425 | 12,286 | ||||||||||||||||||
| Deferred | ||||||||||||||||||||||||
| Federal | 3,116 | (998 | ) | (2,041 | ) | (1,607 | ) | 383 | 3,116 | |||||||||||||||
| State | (308 | ) | (635 | ) | (507 | ) | (229 | ) | 116 | (308 | ) | |||||||||||||
| Total Deferred | 2,808 | (1,633 | ) | (2,548 | ) | (1,836 | ) | 499 | 2,808 | |||||||||||||||
| Total Provision for Taxes | $ | 15,094 | $ | 14,221 | $ | 13,985 | $ | 16,097 | $ | 16,924 | $ | 15,094 | ||||||||||||
The total provision for income taxes differs from the federal statutory rate as follows:
| 2014 | 2013 | 2012 | 2016 | 2015 | 2014 | |||||||||||||||||||||||||||||||||||||||||||
| (in thousands) | Amount | Rate | Amount | Rate | Amount | Rate | Amount | Rate | Amount | Rate | Amount | Rate | ||||||||||||||||||||||||||||||||||||
| Tax Provision at Federal Statutory Rate | $ | 14,174 | 35.0 | % | $ | 13,399 | 35.0 | % | $ | 13,067 | 35.0 | % | $ | 16,037 | 35.0 | % | $ | 15,510 | 35.0 | % | $ | 14,174 | 35.0 | % | ||||||||||||||||||||||||
| Interest on Obligations of States and Political | ||||||||||||||||||||||||||||||||||||||||||||||||
| Subdivisions exempt from Federal Taxation | (805 | ) | (2.0 | %) | (894 | ) | (2.3 | %) | (917 | ) | (2.5 | %) | ||||||||||||||||||||||||||||||||||||
| Interest on Obligations of States and Political Subdivisions exempt from Federal Taxation | (675 | ) | (1.5 | %) | (711 | ) | (1.6 | %) | (805 | ) | (2.0 | %) | ||||||||||||||||||||||||||||||||||||
| State and Local Income Taxes, Net of Federal Income Tax Benefit | 2,624 | 6.5 | % | 2,419 | 6.3 | % | 2,453 | 6.6 | % | 2,992 | 6.5 | % | 2,966 | 6.7 | % | 2,624 | 6.5 | % | ||||||||||||||||||||||||||||||
| Bank Owned Life Insurance | (696 | ) | (1.7 | %) | (702 | ) | (1.8 | %) | (675 | ) | (1.8 | %) | (731 | ) | (1.6 | %) | (712 | ) | (1.6 | %) | (696 | ) | (1.7 | %) | ||||||||||||||||||||||||
| Low-Income Housing Tax Credit | (126 | ) | (0.3 | %) | (129 | ) | (0.3 | %) | - | - | (1,201 | ) | (2.6 | %) | (291 | ) | (0.7 | %) | (126 | ) | (0.3 | %) | ||||||||||||||||||||||||||
| Bargain Purchase Gain | (641 | ) | (1.4 | %) | - | 0.0 | % | - | 0.0 | % | ||||||||||||||||||||||||||||||||||||||
| Other, Net | (77 | ) | (0.2 | %) | 128 | 0.3 | % | 57 | 0.2 | % | 316 | 0.7 | % | 162 | 0.4 | % | (77 | ) | (0.2 | %) | ||||||||||||||||||||||||||||
| Total Provision for Taxes | $ | 15,094 | 37.3 | % | $ | 14,221 | 37.1 | % | $ | 13,985 | 37.5 | % | $ | 16,097 | 35.1 | % | $ | 16,924 | 38.2 | % | $ | 15,094 | 37.3 | % | ||||||||||||||||||||||||
The components of net deferred tax assets as of December 31 are as follows:
| (in thousands) | 2014 | 2013 | ||||||
| Deferred Tax Assets | ||||||||
| Allowance for Credit Losses | $ | 14,944 | $ | 14,470 | ||||
| Accrued Liabilities | 8,184 | 7,723 | ||||||
| Deferred Compensation | 10,006 | 8,859 | ||||||
| State Franchise Tax | 1,521 | 1,525 | ||||||
| Interest on Non-Accrual Loans | 2 | 15 | ||||||
| ORE Writedown and Holding Costs | 1,724 | 1,713 | ||||||
| Unrealized Loss on Securities Available-for-Sale | - | 1,790 | ||||||
| Low-Income Housing Investment | 58 | 21 | ||||||
| Total Deferred Tax Assets | $ | 36,439 | $ | 36,116 | ||||
| Deferred Tax Liabilities | ||||||||
| Premises and Equipment | (286 | ) | (213 | ) | ||||
| Securities Accretion | (298 | ) | (966 | ) | ||||
| Unrealized Gain on Securities Available-for-Sale | (1,838 | ) | - | |||||
| Leasing Activities | (7,018 | ) | (1,501 | ) | ||||
| Other | (786 | ) | (787 | ) | ||||
| Total Deferred Tax Liabilities | (10,226 | ) | (3,467 | ) | ||||
| Net Deferred Tax Assets | $ | 26,213 | $ | 32,649 | ||||
The net deferred tax assets are reported in Interest Receivable and Other Assets on the Company's Consolidated Balance Sheet.
| (in thousands) | 2016 | 2015 | ||||||
| Deferred Tax Assets | ||||||||
| Allowance for Credit Losses | $ | 20,260 | $ | 17,529 | ||||
| Accrued Liabilities | 9,807 | 8,614 | ||||||
| Deferred Compensation | 14,166 | 11,586 | ||||||
| State Franchise Tax | 1,680 | 1,549 | ||||||
| Acquired Net Operating Loss | 1,135 | - | ||||||
| Fair Value Adjustment on Loans Acquired | 429 | - | ||||||
| Fair Value Adjustment on ORE Acquired | 299 | - | ||||||
| ORE Writedown and Holding Costs | - | 1,547 | ||||||
| Unrealized Loss on Securities Available-for-Sale | 58 | - | ||||||
| Low-Income Housing Investment | 366 | 73 | ||||||
| Other | 233 | 46 | ||||||
| Total Deferred Tax Assets | $ | 48,433 | $ | 40,944 | ||||
| Deferred Tax Liabilities | ||||||||
| Premises and Equipment | (1,707 | ) | (869 | ) | ||||
| Securities Accretion | (341 | ) | (310 | ) | ||||
| Unrealized Gain on Securities Available-for-Sale | - | (432 | ) | |||||
| Leasing Activities | (14,868 | ) | (11,469 | ) | ||||
| Core Deposit Intangible Asset | (398 | ) | - | |||||
| Other | (808 | ) | (744 | ) | ||||
| Total Deferred Tax Liabilities | (18,122 | ) | (13,824 | ) | ||||
| Net Deferred Tax Assets | $ | 30,311 | $ | 27,120 | ||||
As a result of the recent acquisition of Delta National Bancorp, the Company has included in its deferred tax assets usable net operating loss carryforwards in the Federal and California jurisdictions of $2.7 million, which begin to expire in 2028. The amount of carryforwards that may be utilized in each jurisdiction annually is limited to approximately $141,000 per year under Section 382 of the Internal Revenue Code due to the changes in control. As a result of limitations under Section 382, certain net operating losses are expected to expire unused and have been excluded from the deferred tax asset. Based upon the level of historical taxable income and projections for future taxable income over the periods during which the deferred tax assets are expected to be deductible, Management believes it is more likely than not we will realize the benefit of the remaining deferred tax assets. Accordingly, no other valuation allowance has been established as of December 31, 2016.
The Company and its subsidiaries file income tax returns in the U.S. federal and California jurisdictions. With few exceptions, the Company is no longer subject to U.S. federal, state and local, or non-U.S. income tax examinations by tax authorities for years before 2008.2012.
| 11. | Short Term Borrowings |
As of December 31, 20142016 and 2013,2015, the Company had unused lines of credit available for short-term liquidity purposes of $597.8$962.8 million and $887.8$875.3 million, respectively. Federal Funds purchased and advances are generally issued on an overnight basis. There were no advances from the FHLB at December 31, 20142016 or 2013.2015. There were no Federal Funds purchased or advances from the FRB at December 31, 20142016 or 2013.2015.
| 12. | Securities Sold Under Agreement to Repurchase |
Securities Sold Under Agreement to Repurchase are used as secured borrowing alternatives to FHLB Advances or FRB Borrowings.
At December 31, 20142016 and December 31, 2013,2015, the Company had no securities sold under agreement to repurchase.
| 13. | Federal Home Loan Bank Advances |
The Company had no short-term or long-term advances from the Federal Home Loan Bank of San Francisco at December 31, 2014, 20132016 or 2012.2015.
In accordance with the Collateral Pledge and Security Agreement, advances are secured by all FHLB stock held by the Company and by government agency & government-sponsored entity securities and mortgage-backed securities with borrowing capacity of $500,000.$200,000. At December 31, 2014, $516.62016, $664.7 million in loans were approved for pledging as collateral on borrowing lines with the FHLB. The borrowing capacity on these loans was $256.6$566.5 million.
| 14. | Long-term Subordinated Debentures |
In December 2003, the Company formed a wholly owned Connecticut statutory business trust, FMCB Statutory Trust I (“Statutory Trust I”), which issued $10.0 million of guaranteed preferred beneficial interests in the Company’s junior subordinated deferrable interest debentures (the “Trust Preferred Securities”). The Company is not considered the primary beneficiary of the trust (variable interest entity), therefore the trust is not consolidated in the Company’s financial statements, but rather the subordinated debentures are shown as a liability. These debentures qualify as Tier 1 capital under current regulatory guidelines. All of the common securities of Statutory Trust I are owned by the Company. The proceeds from the issuance of the common securities and the Trust Preferred Securities were used by FMCB Statutory Trust to purchase $10.3 million of junior subordinated debentures of the Company, which carry a floating rate based on three-month LIBOR plus 2.85%. The debentures represent the sole asset of Statutory Trust I. The Trust Preferred Securities accrue and pay distributions at a floating rate of three-month LIBOR plus 2.85% per annum of the stated liquidation value of $1,000 per capital security. The Company has entered into contractual arrangements which, taken collectively, fully and unconditionally guarantee payment to the extent that Statutory Trust I has funds available therefore of: (i) accrued and unpaid distributions required to be paid on the Trust Preferred Securities; (ii) the redemption price with respect to any Trust Preferred Securities called for redemption by Statutory Trust I; and (iii) payments due upon a voluntary or involuntary dissolution, winding up, or liquidation of Statutory Trust I. The Trust Preferred Securities are mandatorily redeemable upon maturity of the subordinated debentures on December 17, 2033, or upon earlier redemption as provided in the indenture. The Company has the right to redeem the subordinated debentures purchased by Statutory Trust I, in whole or in part, on or after December 17, 2008. As specified in the indenture, if the subordinated debentures are redeemed prior to maturity, the redemption price will be the principal amount and any accrued but unpaid interest. Additionally, if the Company decided to defer interest on the subordinated debentures, the Company would be prohibited from paying cash dividends on the Company’s common stock.
| 15. | Shareholders' Equity |
In 1998, the Board approved the Company’s first common stock repurchase program. This program has been extended and expanded several times since then, and most recently, on SeptemberAugust 11, 2012,2015, the Board of Directors approved increasingan extension of the funds available for the Company’s common$20 million stock repurchase program to $20 million over the three-year period ending September 30, 2015.2018.
Repurchases under the program may be made from time to time on the open market or through private transactions. The repurchase program also requires that no purchases may be made if the Bank would not remain “well-capitalized” after the repurchase.
Dividends from the Bank constitute the principal source of cash to the Company. The Company is a legal entity separate and distinct from the Bank. Under regulations controlling California state chartered banks, the Bank is, to some extent, limited in the amount of dividends that can be paid to the Company without prior approval of the California DBO. These regulations require approval if total dividends declared by a state chartered bank in any calendar year exceed the bank's net profits for that year combined with its retained net profits for the preceding two calendar years.
During 2015, the Company issued 6,705 shares of common stock. All of these shares were contributed to the Bank’s non-qualified defined contribution retirement plans. The shares issued had prices ranging from $450 per share to $525 per share. These share prices were based upon valuations completed by a nationally recognized bank consulting and advisory firm and in reliance upon the exemption in Section 4(a)(2) of the Securities Act of 1933, as amended, and the regulations promulgated thereunder. The proceeds from these issuances were contributed to the Bank as equity capital.
The Company and the Bank are subject to various federal regulatory capital requirements administered byunder the federal banking agencies.Basel III Capital Rules. Failure to meet minimum capital requirements can initiate certain mandatory, and possibly discretionary, actions by regulators that, if undertaken, could have a direct material effect on the Company’s and the Bank's financial statements. Under capital adequacy guidelines and the regulatory framework for prompt corrective action, the Company and the Bank must meet specific capital guidelines that involve quantitative measures of the Company and the Bank's assets, liabilities, and certain off-balance-sheet items as calculated under regulatory accounting practices. The Company and the Bank's capital amounts and classification are also subject to qualitative judgments by the regulators about components, risk weightings, and other factors.
The final rules became effective as applied to the Company and the Bank on January 1, 2015, with a phase in period through January 1, 2019. The Company believes that it is currently in compliance with all of these new capital adequacy requirements to which(as fully phased-in) and that they are subject.will not result in any restrictions on the Company’s business activity.
In addition, the most recent notification from the FDIC categorized the Bank as “well capitalized” under the regulatory framework for prompt corrective action. To be categorized as well capitalized, the Bank must maintain minimum total risk-based, Tier 1 risk-based and Tier 1 leverage ratios as set forth in the following tables. There are no conditions or events since that notification that management believes have changed the Bank’s category.
| (in thousands) | Actual | Regulatory Capital Requirements | Well Capitalized Under Prompt Corrective Action | |||||||||||||||||||||
| December 31, 2014 | Amount | Ratio | Amount | Ratio | Amount | Ratio | ||||||||||||||||||
| Total Bank Capital to Risk Weighted Assets | $ | 266,203 | 12.92 | % | $ | 164,887 | 8.0 | % | $ | 206,109 | 10.0 | % | ||||||||||||
| Total Consolidated Capital to Risk Weighted Assets | $ | 266,533 | 12.93 | % | $ | 164,911 | 8.0 | % | N/ | A | N/ | A | ||||||||||||
| Tier 1 Bank Capital to Risk Weighted Assets | $ | 240,319 | 11.66 | % | $ | 82,444 | 4.0 | % | $ | 123,665 | 6.0 | % | ||||||||||||
| Tier 1 Consolidated Capital to Risk Weighted Assets | $ | 240,645 | 11.67 | % | $ | 82,456 | 4.0 | % | N/ | A | N/ | A | ||||||||||||
| Tier 1 Bank Capital to Average Assets | $ | 240,319 | 10.56 | % | $ | 91,062 | 4.0 | % | $ | 113,827 | 5.0 | % | ||||||||||||
| Tier 1 Consolidated Capital to Average Assets | $ | 240,645 | 10.55 | % | $ | 91,219 | 4.0 | % | N/ | A | N/ | A | ||||||||||||
90
| (in thousands) | Actual | Regulatory Capital Requirements | Well Capitalized Under Prompt Corrective Action | |||||||||||||||||||||
| December 31, 2013 | Amount | Ratio | Amount | Ratio | Amount | Ratio | ||||||||||||||||||
| Total Bank Capital to Risk Weighted Assets | $ | 244,087 | 13.98 | % | $ | 139,674 | 8.0 | % | $ | 174,593 | 10.0 | % | ||||||||||||
| Total Consolidated Capital to Risk Weighted Assets | $ | 244,354 | 13.99 | % | $ | 139,689 | 8.0 | % | N/ | A | N/ | A | ||||||||||||
| Tier 1 Bank Capital to Risk Weighted Assets | $ | 222,108 | 12.72 | % | $ | 69,837 | 4.0 | % | $ | 104,756 | 6.0 | % | ||||||||||||
| Tier 1 Consolidated Capital to Risk Weighted Assets | $ | 222,372 | 12.74 | % | $ | 69,845 | 4.0 | % | N/ | A | N/ | A | ||||||||||||
| Tier 1 Bank Capital to Average Assets | $ | 222,108 | 11.02 | % | $ | 80,633 | 4.0 | % | $ | 100,791 | 5.0 | % | ||||||||||||
| Tier 1 Consolidated Capital to Average Assets | $ | 222,372 | 11.01 | % | $ | 80,755 | 4.0 | % | N/ | A | N/ | A | ||||||||||||
| (in thousands) | Actual | Current Regulatory Capital Requirements | Well Capitalized Under Prompt Corrective Action | |||||||||||||||||||||
| December 31, 2016 | Amount | Ratio | Amount | Ratio | Amount | Ratio | ||||||||||||||||||
| Total Bank Capital to Risk Weighted Assets | $ | 319,776 | 12.79 | % | $ | 199,958 | 8.0 | % | $ | 249,947 | 10.0 | % | ||||||||||||
| Total Consolidated Capital to Risk Weighted Assets | $ | 319,983 | 12.80 | % | $ | 199,981 | 8.0 | % | N/A | N/A | ||||||||||||||
| Total Bank Common Equity Tier 1 Capital Ratio | $ | 288,324 | 11.54 | % | $ | 112,476 | 4.5 | % | $ | 162,466 | 6.5 | % | ||||||||||||
| Total Consolidated Common Equity Tier 1 Capital Ratio | $ | 278,981 | 11.16 | % | $ | 112,489 | 4.5 | % | N/A | N/A | ||||||||||||||
| Tier 1 Bank Capital to Risk Weighted Assets | $ | 288,323 | 11.54 | % | $ | 149,968 | 6.0 | % | $ | 199,958 | 8.0 | % | ||||||||||||
| Tier 1 Consolidated Capital to Risk Weighted Assets | $ | 288,527 | 11.54 | % | $ | 149,986 | 6.0 | % | N/A | N/A | ||||||||||||||
| Tier 1 Bank Capital to Average Assets | $ | 288,324 | 10.08 | % | $ | 114,409 | 4.0 | % | $ | 143,011 | 5.0 | % | ||||||||||||
| Tier 1 Consolidated Capital to Average Assets | $ | 288,527 | 10.07 | % | $ | 114,568 | 4.0 | % | N/A | N/A | ||||||||||||||
| (in thousands) | Actual | Current Regulatory Capital Requirements | Well Capitalized Under Prompt Corrective Action | |||||||||||||||||||||
| December 31, 2015 | Amount | Ratio | Amount | Ratio | Amount | Ratio | ||||||||||||||||||
| Total Bank Capital to Risk Weighted Assets | $ | 290,941 | 12.22 | % | $ | 190,480 | 8.0 | % | $ | 238,101 | 10.0 | % | ||||||||||||
| Total Consolidated Capital to Risk Weighted Assets | $ | 291,152 | 12.23 | % | $ | 190,493 | 8.0 | % | N/A | N/A | ||||||||||||||
| Total Bank Common Equity Tier 1 Capital Ratio | $ | 261,031 | 10.96 | % | $ | 107,145 | 4.5 | % | $ | 154,765 | 6.5 | % | ||||||||||||
| Total Consolidated Common Equity Tier 1 Capital Ratio | $ | 251,240 | 10.55 | % | $ | 107,152 | 4.5 | % | N/A | N/A | ||||||||||||||
| Tier 1 Bank Capital to Risk Weighted Assets | $ | 261,031 | 10.96 | % | $ | 142,860 | 6.0 | % | $ | 190,480 | 8.0 | % | ||||||||||||
| Tier 1 Consolidated Capital to Risk Weighted Assets | $ | 261,240 | 10.97 | % | $ | 142,870 | 6.0 | % | N/A | N/A | ||||||||||||||
| Tier 1 Bank Capital to Average Assets | $ | 261,031 | 10.30 | % | $ | 101,402 | 4.0 | % | $ | 126,753 | 5.0 | % | ||||||||||||
| Tier 1 Consolidated Capital to Average Assets | $ | 261,240 | 10.29 | % | $ | 101,525 | 4.0 | % | N/A | N/A | ||||||||||||||
| 16. | Dividends and Basic Earnings Per Common Share |
Total cash dividends during 20142016 were $9,919,000$10,478,000 or $12.70$13.10 per share of common stock, an increase of 1.6% per share from $9,723,000$10,157,000 or $12.50$12.90 per share in 2013.2015. In 2012,2014, cash dividends totaled $9,418,000$9,919,000 or $12.10$12.70 per share.
Basic earnings per common share amounts are computed by dividing net income by the weighted average number of common shares outstanding for the period. The following table calculates the basic earnings per common share for the periods indicated.
(net income in thousands) | 2014 | 2013 | 2012 | 2016 | 2015 | 2014 | ||||||||||||||||||
| Net Income | $ | 25,402 | $ | 24,061 | $ | 23,349 | $ | 29,723 | $ | 27,392 | $ | 25,402 | ||||||||||||
| Weighted Average Number of Common Shares Outstanding | 778,358 | 777,882 | 778,648 | 793,970 | 786,582 | 778,358 | ||||||||||||||||||
| Basic Earnings Per Common Share | $ | 32.64 | $ | 30.93 | $ | 29.99 | $ | 37.44 | $ | 34.82 | $ | 32.64 | ||||||||||||
| 17. | Employee Benefit Plans |
Profit Sharing Plan
The Company, through the Bank, sponsors a Profit Sharing Plan for substantially all full-time employees of the Company with one or more years of service. Participants receive up to two annual employer contributions, one is discretionary and the other is mandatory. The discretionary contributions to the Profit Sharing Plan are determined annually by the Board of Directors. The discretionary contributions totaled $875,000, $825,000,$975,000, $925,000, and $800,000$875,000 for the years ended December 31, 2014, 2013,2016, 2015, and 2012,2014, respectively. The mandatory contributions to the Profit Sharing Plan are made according to a predetermined set of criteria. Mandatory contributions totaled $1.2 million, $1.1 million, and $1.0 million $952,000, and $941,000 for the years ended December 31, 2014, 2013,2016, 2015, and 2012,2014, respectively. Company employees are permitted, within limitations imposed by tax law, to make pretax contributions and after tax (Roth) contributions to the 401(k) feature of the Profit Sharing Plan. The Company does not match employee contributions within the 401(k) feature of the Profit Sharing Plan and the Company can terminate the Profit Sharing Plan at any time. Benefits pursuant to the Profit Sharing Plan vest 0% during the first year of participation, 25% per full year thereafter and after five years such benefits are fully vested.
Executive Retirement Plan and Life Insurance Arrangements
The Company, through the Bank, sponsors an Executive Retirement Plan for certain executive level employees. The Executive Retirement Plan is a non-qualified defined contribution plan and was developed to supplement the Company’s Profit Sharing Plan, which, as a qualified retirement plan, has a ceiling on benefits as set by the Internal Revenue Service. The Plan is comprised of: (1) a Performance Component which makes contributions based upon long-term cumulative profitability and increase in market value of the Company; (2) a Retention Component applicable to participants employed by the Company as of January 1, 2005 (contributions to this component were frozen effective December 31, 2010); (3) a Salary Component which makes contributions based upon participant salary levels; and (4)(3) an Equity Component for which contributions are discretionary and subject to Board of Directors approval. Executive Retirement Plan contributions are invested in a mix of financial instruments; however Equity Component contributions are invested primarily in stock of the Company.
The Company expensed $2.7$3.8 million to the Executive Retirement Plan during the year ended December 31, 2014,2016, $3.5 million during the year ended December 31, 2015 and $2.7 million during the year ended December 31, 2013 and $2.6 million during the year ended December 31, 2012.2014. The Company’s total accrued liability under the Executive Retirement Plan was $27.3$37.4 million as of December 31, 20142016 and $24.1$31.3 million as of December 31, 2013.2015. All amounts have been fully funded into a Rabbi Trust as of December 31, 2016.
The Company has purchased single premium life insurance policies on the lives of certain key employees of the Company. These policies provide: (1) financial protection to the Company in the event of the death of a key employee; and (2) significant income to the Company to offset the expense associated with the Executive Retirement Plan and other employee benefit plans, since the interest earned on the cash surrender value of the policies is tax exempt as long as the policies are used to finance employee benefits, significant income to the Company to offset the expense associated with the Executive Retirement Plan and other employee benefit plans.benefits. As compensation to each employee for agreeing to allow the Company to purchase an insurance policy on his or her life, split dollar agreements have been entered into with those employees. These agreements provide for a division of the life insurance death proceeds between the Company and each employee’s designated beneficiary or beneficiaries.
The Company earned tax-exempt interest on the life insurance policies of $1.9 million for the year ended December 31, 2014, $1.9 million for the year ended December 31, 2013, and $1.8 million for the years ended December 31, 2012.2016, 2015, and 2014. As of December 31, 20142016 and 2013,2015, the total cash surrender value of the insurance policies was $54.0$57.8 million and $52.1$55.9 million, respectively.
Senior Management Retention Plan
The Company, through the Bank, sponsors a Senior Management Retention Plan (“SMRP”) for certain senior level employees. The SMRP is a non-qualified defined contribution plan and was developed to supplement the Company’s Profit Sharing Plan, which, as a qualified retirement plan, has a ceiling on benefits as set by the Internal Revenue Service. All contributions are discretionary and subject to the Board of Directors approval. Contributions are invested primarily in stock of the Company. The Company expensed $475,000$627,000 to the SMRP during the year ended December 31, 2014, $536,0002016, $530,000 during the year ended December 31, 20132015 and $206,000$475,000 during the year ended December 31, 2012.2014. The Company’s total accrued liability under the SMRP was $3.4 million as of December 31, 2016 and $2.3 million as of December 31, 2015. All amounts have been fully funded into a Rabbi Trust as of December 31, 2016.
| 18. | Fair Value Measurements |
The Company follows the “Fair Value Measurement and Disclosures” topic of the FASB ASC, which establishes a framework for measuring fair value in U.S. GAAP and expands disclosures about fair value measurements. This standard applies whenever other standards require, or permit, assets or liabilities to be measured at fair value but does not expand the use of fair value in any new circumstances. In this standard, the FASB clarifies the principle that fair value should be based on the assumptions market participants would use when pricing the asset or liability. In support of this principle, this standard establishes a fair value hierarchy that prioritizes the information used to develop those assumptions. The fair value hierarchy is as follows:
Level 1 inputs – Unadjusted quoted prices in active markets for identical assets or liabilities that the entity has the ability to access at the measurement date.
Level 2 inputs - Inputs other than quoted prices included in Level 1 that are observable for the asset or liability, either directly or indirectly. These might include quoted prices for similar assets and liabilities in active markets, and inputs other than quoted prices that are observable for the asset or liability, such as interest rates and yield curves that are observable at commonly quoted intervals.
Level 3 inputs - Unobservable inputs for determining the fair values of assets or liabilities that reflect an entity’s own assumptions about the assumptions that market participants would use in pricing the assets or liabilities.
Management monitors the availability of observable market data to assess the appropriate classification of financial instruments within the fair value hierarchy. Changes in economic conditions or model-based valuation techniques may require the transfer of financial instruments from one fair value level to another. In such instances, the transfer is reported at the beginning of the reporting period.
Management evaluates the significance of transfers between levels based upon the nature of the financial instrument and size of the transfer relative to total assets, total liabilities or total earnings.
Securities classified as available-for-sale are reported at fair value on a recurring basis utilizing Level 1, 2 and 3 inputs. For these securities, the Company obtains fair value measurements from an independent pricing service. The fair value measurements consider observable data that may include dealer quotes, market spreads, cash flows, the U.S. Treasury yield curve, live trading levels, trade execution data, market consensus prepayment speeds, credit information and the bond's terms and conditions, among other things.
The Company does not record all loans & leases at fair value on a recurring basis. However, from time to time, a loan or lease is considered impaired and an allowance for credit losses is established. Once a loan or lease is identified as individually impaired, management measures impairment in accordance with the “Receivable” topic of the FASB ASC. The fair value of impaired loans or leases is estimated using one of several methods, including collateral value when the loan is collateral dependent, market value of similar debt, enterprise value, and discounted cash flows. Impaired loans & leases not requiring an allowance represent loans & leases for which the fair value of the expected repayments or collateral exceed the recorded investments in such loans & leases. Impaired loans & leases where an allowance is established based on the fair value of collateral require classification in the fair value hierarchy. The fair value of collateral dependent impaired loans is generally based on recent real estate appraisals. These appraisals may utilize a single valuation approach or a combination of approaches including sales comparison, cost and the income approach. Adjustments are often made in the appraisal process by the appraisers to take in to account differences between the comparable sales and income and other available data. Such adjustments can be significant and typically result in a Level 3 classification of the inputs for determining fair value. The valuation technique used for Level 3 nonrecurring impaired loans is primarily the sales comparison approach less selling costs of 10%.
Other Real Estate (“ORE”) is reported at fair value on a non-recurring basis. Fair values are based on recent real estate appraisals. These appraisals may use a single valuation approach or a combination of approaches including sales comparison, cost and the income approach. Adjustments are often made in the appraisal process by the appraisers to take in to account differences between the comparable sales and income and other available data. Such adjustments can be significant and typically result in a Level 3 classification of the inputs for determining fair value. The valuation technique used for Level 3 nonrecurring ORE is primarily the sales comparison approach less selling costs of 10%.
At December 31, 2016, formal foreclosure proceedings were in process for $322,000 of consumer mortgage loans secured by residential real estate properties.
The following tables present information about the Company’s assets and liabilities measured at fair value on a recurring basis and indicate the fair value hierarchy of the valuation techniques utilized by the Company to determine such fair value for the periods indicated.
| Fair Value Measurements | ||||||||||||||||||||||||||||||||
| At December 31, 2014, Using | Fair Value Measurements At December 31, 2016, Using | |||||||||||||||||||||||||||||||
| Fair Value | Quoted Prices in Active Markets for Identical Assets | Other Observable Inputs | Significant Unobservable Inputs | Fair Value | Quoted Prices in Active Markets for Identical Assets | Other Observable Inputs | Significant Unobservable Inputs | |||||||||||||||||||||||||
| (in thousands) | Total | (Level 1) | (Level 2) | (Level 3) | Total | (Level 1) | (Level 2) | (Level 3) | ||||||||||||||||||||||||
| Available-for-Sale Securities: | ||||||||||||||||||||||||||||||||
| Government Agency & Government-Sponsored Entities | $ | 78,109 | $ | 10,005 | $ | 68,104 | $ | - | $ | 3,241 | $ | - | $ | 3,241 | $ | - | ||||||||||||||||
| US Treasury Notes | 134,428 | 134,428 | - | - | ||||||||||||||||||||||||||||
| US Govt SBA | 36,314 | 36,314 | ||||||||||||||||||||||||||||||
| Mortgage Backed Securities | 287,948 | - | 287,948 | - | 273,270 | - | 273,270 | - | ||||||||||||||||||||||||
| Other | 485 | 175 | 310 | - | 1,010 | 200 | 310 | 500 | ||||||||||||||||||||||||
| Total Assets Measured at Fair Value On a Recurring Basis | $ | 366,542 | $ | 10,180 | $ | 356,362 | $ | - | $ | 448,263 | $ | 134,628 | $ | 313,135 | $ | 500 | ||||||||||||||||
| Fair Value Measurements | ||||||||||||||||||||||||||||||||
| At December 31, 2013, Using | ||||||||||||||||||||||||||||||||
| Fair Value | Quoted Prices in Active Markets for Identical Assets | Other Observable Inputs | Significant Unobservable Inputs | |||||||||||||||||||||||||||||
| (in thousands) | Total | (Level 1) | (Level 2) | (Level 3) | ||||||||||||||||||||||||||||
| Available-for-Sale Securities: | ||||||||||||||||||||||||||||||||
| Government Agency & Government-Sponsored Entities | $ | 28,436 | $ | 23,394 | $ | 5,042 | $ | - | ||||||||||||||||||||||||
| Mortgage Backed Securities | 324,929 | - | 324,929 | - | ||||||||||||||||||||||||||||
| Corporate Securities | 49,380 | 8,191 | 41,189 | - | ||||||||||||||||||||||||||||
| Other | 1,894 | 1,584 | 310 | - | ||||||||||||||||||||||||||||
| Total Assets Measured at Fair Value On a Recurring Basis | $ | 404,639 | $ | 33,169 | $ | 371,470 | $ | - | ||||||||||||||||||||||||
Fair Value Measurements At December 31, 2015, Using | ||||||||||||||||
| Fair Value | Quoted Prices in Active Markets for Identical Assets | Other Observable Inputs | Significant Unobservable Inputs | |||||||||||||
| (in thousands) | Total | (Level 1) | (Level 2) | (Level 3) | ||||||||||||
| Available-for-Sale Securities: | ||||||||||||||||
| Government Agency & Government-Sponsored Entities | $ | 33,251 | $ | - | $ | 33,251 | $ | - | ||||||||
| US Treasury Notes | 72,884 | 72,884 | - | - | ||||||||||||
| Mortgage Backed Securities | 262,493 | - | 262,493 | - | ||||||||||||
| Other | 509 | 199 | 310 | - | ||||||||||||
| Total Assets Measured at Fair Value On a Recurring Basis | $ | 369,137 | $ | 73,083 | $ | 296,054 | $ | - | ||||||||
Fair values for Level 2 available-for-sale investment securities are based on quoted market prices for similar securities. During the year ended December 31, 2014,2016, there were no transfers in or out of level 1, 2, to levelor 3. During the year ended December 31, 2013, $5.6 million were transferred out of level 3 available-for-sale investment securities into held-to-maturity investment securities. The following table presents information about the activity of level 3 assets.
| (in thousands) | 2014 | 2013 | ||||||
| Balance at Beginning of Period | $ | - | $ | 5,665 | ||||
| Total Realized and Unrealized Gains/(Losses) Included in Income | - | - | ||||||
| Total Unrealized Gains/(Losses) Included in Other Comprehensive Income | - | - | ||||||
| Purchase of Securities | - | - | ||||||
| Sales, Maturities, and Calls of Securities | - | (84 | ) | |||||
| Net Transfers out of Available for Sale Securities | - | (5,581 | ) | |||||
| Balance at End of Period | $ | - | $ | - | ||||
Available for sale investmentsinvestment securities categorized as Level 3 assets primarily consistfor year ended December 31, 2016 consisted of obligationsa $500,000 investment in a limited liability company that purchases SBA loans. There were no gains or losses or transfers in or out of states and political subdivisions. These bonds were issued by local housing authorities and have no active market. These bonds are carried at historical cost, which approximates fair value, unless economic conditions forlevel 3 during the municipality changes to a degree requiring a valuation adjustment.year ended December 31, 2016.
The following tables present information about the Company’s impaired loans & leases and other real estate, classes of assets or liabilities that the Company carries at fair value on a non-recurring basis, and indicates the fair value hierarchy of the valuation techniques utilized by the Company to determine such fair value for the periods indicated. Not all impaired loans & leases are carried at fair value. Impaired loans & leases are only included in the following tables when their fair value is based upon an appraisal of the collateral, and if that appraisal results in a partial charge-off or the establishment of a specific reserve.
| Fair Value Measurements | ||||||||||||||||||||||||||||||||
| At December 31, 2014, Using | Fair Value Measurements At December 31, 2016, Using | |||||||||||||||||||||||||||||||
| Fair Value | Quoted Prices in Active Markets for Identical Assets | Other Observable Inputs | Significant Unobservable Inputs | Fair Value | Quoted Prices in Active Markets for Identical Assets | Other Observable Inputs | Significant Unobservable Inputs | |||||||||||||||||||||||||
| (in thousands) | Total | (Level 1) | (Level 2) | (Level 3) | Total | (Level 1) | (Level 2) | (Level 3) | ||||||||||||||||||||||||
| Impaired Loans: | ||||||||||||||||||||||||||||||||
| Commercial Real Estate | $ | 90 | $ | - | $ | - | $ | 90 | ||||||||||||||||||||||||
| Residential 1st Mortgage | 748 | - | - | 748 | $ | 480 | $ | - | $ | - | $ | 480 | ||||||||||||||||||||
| Home Equity Lines and Loans | 759 | - | - | 759 | 83 | - | - | 83 | ||||||||||||||||||||||||
| Agricultural | 346 | - | - | 346 | 497 | - | - | 497 | ||||||||||||||||||||||||
| Commercial | 3,832 | - | - | 3,832 | 833 | - | - | 833 | ||||||||||||||||||||||||
| Consumer | 6 | - | - | 6 | ||||||||||||||||||||||||||||
| Total Impaired Loans | 5,781 | - | - | 5,781 | 1,893 | - | - | 1,893 | ||||||||||||||||||||||||
| Other Real Estate: | ||||||||||||||||||||||||||||||||
| Home Equity Lines and Loans | 785 | - | - | 785 | ||||||||||||||||||||||||||||
| Real Estate Construction | 2,441 | - | - | 2,441 | 2,960 | - | - | 2,960 | ||||||||||||||||||||||||
| Agricultural Real Estate | 858 | - | - | 858 | ||||||||||||||||||||||||||||
| Total Other Real Estate | 3,299 | - | - | 3,299 | 3,745 | - | - | 3,745 | ||||||||||||||||||||||||
| Total Assets Measured at Fair Value On a Non-Recurring Basis | $ | 9,080 | $ | - | $ | - | $ | 9,080 | $ | 5,638 | $ | - | $ | - | $ | 5,638 | ||||||||||||||||
Fair Value Measurements At December 31, 2015, Using | ||||||||||||||||
| Fair Value | Quoted Prices in Active Markets for Identical Assets | Other Observable Inputs | Significant Unobservable Inputs | |||||||||||||
| (in thousands) | Total | (Level 1) | (Level 2) | (Level 3) | ||||||||||||
| Impaired Loans: | ||||||||||||||||
| Residential 1st Mortgage | $ | 329 | $ | - | $ | - | $ | 329 | ||||||||
| Home Equity Lines and Loans | 125 | - | - | 125 | ||||||||||||
| Agricultural | 298 | - | - | 298 | ||||||||||||
| Commercial | 752 | - | - | 752 | ||||||||||||
| Consumer | 5 | - | - | 5 | ||||||||||||
| Total Impaired Loans | 1,509 | - | - | 1,509 | ||||||||||||
| Other Real Estate: | ||||||||||||||||
| Real Estate Construction | 2,441 | - | - | 2,441 | ||||||||||||
| Total Other Real Estate | 2,441 | - | - | 2,441 | ||||||||||||
| Total Assets Measured at Fair Value On a Non-Recurring Basis | $ | 3,950 | $ | - | $ | - | $ | 3,950 | ||||||||
| Fair Value Measurements | ||||||||||||||||
| At December 31, 2013, Using | ||||||||||||||||
| Fair Value | Quoted Prices in Active Markets for Identical Assets | Other Observable Inputs | Significant Unobservable Inputs | |||||||||||||
| (in thousands) | Total | (Level 1) | (Level 2) | (Level 3) | ||||||||||||
| Impaired Loans: | ||||||||||||||||
| Residential 1st Mortgage | $ | 614 | $ | - | $ | - | $ | 614 | ||||||||
| Home Equity Lines and Loans | 551 | - | - | 551 | ||||||||||||
| Agricultural | 366 | - | - | 366 | ||||||||||||
| Commercial | 820 | - | - | 820 | ||||||||||||
| Total Impaired Loans | 2,351 | - | - | 2,351 | ||||||||||||
| Other Real Estate: | ||||||||||||||||
| Real Estate Construction | 2,399 | - | - | 2,399 | ||||||||||||
| Agricultural Real Estate | 2,212 | - | - | 2,212 | ||||||||||||
| Total Other Real Estate | 4,611 | - | - | 4,611 | ||||||||||||
| Total Assets Measured at Fair Value On a Non-Recurring Basis | $ | 6,962 | $ | - | $ | - | $ | 6,962 | ||||||||
The Company’s property appraisals are primarily based on the sales comparison approach and the income approach methodologies, which consider recent sales of comparable properties, including their income generating characteristics, and then make adjustments to reflect the general assumptions that a market participant would make when analyzing the property for purchase. These adjustments may increase or decrease an appraised value and can vary significantly depending on the location, physical characteristics and income producing potential of each property. Additionally, the quality and volume of market information available at the time of the appraisal can vary from period to period and cause significant changes to the nature and magnitude of comparable sale adjustments. Given these variations, comparable sale adjustments are generally not a reliable indicator for how fair value will increase or decrease from period to period. Under certain circumstances, management discounts are applied based on specific characteristics of an individual property.
The following table presents quantitative information about Level 3 fair value measurements for financial instruments measured at fair value on a nonrecurring basis at December 31, 2014:2016:
| (in thousands) | Fair Value | Valuation Technique | Unobservable Inputs | Range, Weighted Avg. | ||||||
| Impaired Loans: | ||||||||||
| Residential 1st Mortgages | $ | 480 | Sales Comparison Approach | Adjustment for Difference Between Comparable Sales | 2% -4%, 3 | % | ||||
| Home Equity Lines and Loans | $ | 83 | Sales Comparison Approach | Adjustment for Difference Between Comparable Sales | 1% - 2%, 2 | % | ||||
| Agricultural | $ | 286 | Income Approach | Capitalization Rate | 16% - 16%, 16 | % | ||||
| Agricultural | $ | 211 | Collateral Approach | Collateral Value | 10% -10%, 10 | % | ||||
| Commercial | $ | 833 | Income Approach | Capitalization Rate | 16% - 16%, 16 | % | ||||
| Other Real Estate: | ||||||||||
| Home Equity Lines and Loans | $ | 785 | Sales Comparison Approach | Adjustment for Difference Between Comparable Sales | 10% - 10%, 10 | % | ||||
| Real Estate Construction | $ | 2,960 | Sales Comparison Approach | Adjustment for Difference Between Comparable Sales | 10% - 10%, 10 | % | ||||
| (in thousands) | Fair Value | Valuation Technique | Unobservable Inputs | Range, Weighted Avg. | ||||||
| Impaired Loans: | ||||||||||
| Commercial Real Estate | $ | 90 | Sales Comparison Approach | Adjustment for Difference Between Comparable Sales | 1% -1%, 1 | % | ||||
| Residential 1st Mortgages | $ | 748 | Sales Comparison Approach | Adjustment for Difference Between Comparable Sales | 11% -21%, 17 | % | ||||
| Home Equity Lines and Loans | $ | 759 | Sales Comparison Approach | Adjustment for Difference Between Comparable Sales | 1% - 14%, 11 | % | ||||
| Agricultural | $ | 331 | Income Approach | Capitalization Rate | 14% - 14%, 14 | % | ||||
| Agricultural | $ | 15 | Sales Comparison Approach | Adjustment for Difference Between Comparable Sales | 1% -1%, 1 | % | ||||
| Commercial | $ | 3,832 | Sales Comparison Approach | Adjustment for Difference Between Comparable Sales | 1% - 13%, 4 | % | ||||
| Consumer | $ | 6 | Sales Comparison Approach | Adjustment for Difference Between Comparable Sales | 8% - 8%, 8 | % | ||||
| Other Real Estate: | ||||||||||
| Real Estate Construction | $ | 2,441 | Sales Comparison Approach | Adjustment for Difference Between Comparable Sales | 10% - 10%, 10 | % | ||||
| Agricultural Real Estate | $ | 858 | Sales Comparison Approach | Adjustment for Difference Between Comparable Sales | 10% - 10%, 10 | % | ||||
| 19. | Fair Value of Financial Instruments |
U.S. GAAP requires disclosure of fair value information about financial instruments, whether or not recognized on the balance sheet, for which it is practical to estimate that value. The estimated fair value amounts have been determined by the Company using available market information and appropriate valuation methodologies. The use of assumptions and various valuation techniques, as well as the absence of secondary markets for certain financial instruments, will likely reduce the comparability of fair value disclosures between financial institutions. In some cases, book value is a reasonable estimate of fair value due to the relatively short period of time between origination of the instrument and its expected realization.
The following tables summarize the book value and estimated fair value of financial instruments for the periods indicated:
| Fair Value of Financial Instruments Using | Fair Value of Financial Instruments Using | |||||||||||||||||||||||||||||||||||||||
December 31, 2014 (in thousands) | Carrying Amount | Quoted Prices in Active Markets for Identical Assets (Level 1) | Other Observable Inputs (Level 2) | Significant Unobservable Inputs (Level 3) | Total Estimated Fair Value | |||||||||||||||||||||||||||||||||||
December 31, 2016 (in thousands) | Carrying Amount | Quoted Prices in Active Markets for Identical Assets (Level 1) | Other Observable Inputs (Level 2) | Significant Unobservable Inputs (Level 3) | Total Estimated Fair Value | |||||||||||||||||||||||||||||||||||
| Assets: | ||||||||||||||||||||||||||||||||||||||||
| Cash and Cash Equivalents | $ | 77,125 | $ | 77,125 | $ | - | $ | - | $ | 77,125 | $ | 98,960 | $ | 98,960 | $ | - | $ | - | $ | 98,960 | ||||||||||||||||||||
| Investment Securities Available-for-Sale: | ||||||||||||||||||||||||||||||||||||||||
| Government Agency & Government-Sponsored Entities | 78,109 | 10,005 | 68,104 | - | 78,109 | 3,241 | - | 3,241 | - | 3,241 | ||||||||||||||||||||||||||||||
| U.S. Govt SBA | 36,314 | - | 36,314 | - | 36,314 | |||||||||||||||||||||||||||||||||||
| U.S. Treasury Notes | 134,428 | 134,428 | - | 134,428 | ||||||||||||||||||||||||||||||||||||
| Mortgage Backed Securities | 287,948 | - | 287,948 | - | 287,948 | 273,270 | - | 273,270 | - | 273,270 | ||||||||||||||||||||||||||||||
| Other | 485 | 175 | 310 | - | 485 | 1,010 | 200 | 310 | 500 | 1,010 | ||||||||||||||||||||||||||||||
| Total Investment Securities Available-for-Sale | 366,542 | 10,180 | 356,362 | - | 366,542 | 448,263 | 134,628 | 313,135 | 500 | 448,263 | ||||||||||||||||||||||||||||||
| Investment Securities Held-to-Maturity: | ||||||||||||||||||||||||||||||||||||||||
| Obligations of States and Political Subdivisions | 61,716 | - | 49,085 | 13,403 | 62,488 | 58,109 | - | 40,415 | 17,993 | 58,408 | ||||||||||||||||||||||||||||||
| Other | 2,147 | - | 2,147 | - | 2,147 | |||||||||||||||||||||||||||||||||||
| Total Investment Securities Held-to-Maturity | 63,863 | - | 51,232 | 13,403 | 64,635 | 58,109 | - | 40,415 | 17,993 | 58,408 | ||||||||||||||||||||||||||||||
| FHLB Stock | 7,677 | N/ | A | N/ | A | N/ | A | N/ | A | 8,872 | N/A | N/A | N/A | N/A | ||||||||||||||||||||||||||
| Loans & Leases, Net of Deferred Fees & Allowance: | ||||||||||||||||||||||||||||||||||||||||
| Commercial Real Estate | 484,061 | - | - | 481,037 | 481,037 | 656,936 | - | - | 651,877 | 651,877 | ||||||||||||||||||||||||||||||
| Agricultural Real Estate | 353,022 | - | - | 353,288 | 353,288 | 458,235 | - | - | 444,393 | 444,393 | ||||||||||||||||||||||||||||||
| Real Estate Construction | 94,850 | - | - | 95,022 | 95,022 | 173,239 | - | - | 172,682 | 172,682 | ||||||||||||||||||||||||||||||
| Residential 1st Mortgages | 170,858 | - | - | 173,916 | 173,916 | 241,382 | - | - | 241,174 | 241,174 | ||||||||||||||||||||||||||||||
| Home Equity Lines and Loans | 30,591 | - | - | 32,456 | 32,456 | 29,485 | - | - | 30,495 | 30,495 | ||||||||||||||||||||||||||||||
| Agricultural | 275,859 | - | - | 274,195 | 274,195 | 287,944 | - | - | 286,074 | 286,074 | ||||||||||||||||||||||||||||||
| Commercial | 222,624 | - | - | 222,175 | 222,175 | 209,062 | - | - | 207,215 | 207,215 | ||||||||||||||||||||||||||||||
| Consumer & Other | 4,501 | - | - | 4,535 | 4,535 | 6,713 | - | - | 6,706 | 6,706 | ||||||||||||||||||||||||||||||
| Leases | 42,006 | - | - | 40,298 | 40,298 | 68,135 | - | - | 67,893 | 67,893 | ||||||||||||||||||||||||||||||
| Unallocated Allowance | (1,529 | ) | - | - | (1,529 | ) | (1,529 | ) | (1,449 | ) | - | - | (1,449 | ) | (1,449 | ) | ||||||||||||||||||||||||
| Total Loans & Leases, Net of Deferred Fees & Allowance | 1,676,843 | - | - | 1,675,393 | 1,675,393 | 2,129,682 | - | - | 2,107,060 | 2,107,060 | ||||||||||||||||||||||||||||||
| Accrued Interest Receivable | 7,797 | - | 7,797 | - | 7,797 | 10,047 | - | 10,047 | - | 10,047 | ||||||||||||||||||||||||||||||
| Liabilities: | ||||||||||||||||||||||||||||||||||||||||
| Deposits: | ||||||||||||||||||||||||||||||||||||||||
| Demand | 610,133 | 610,133 | - | - | 610,133 | 756,236 | 756,236 | - | - | 756,236 | ||||||||||||||||||||||||||||||
| Interest Bearing Transaction | 341,397 | 341,397 | - | - | 341,397 | 495,063 | 495,063 | - | - | 495,063 | ||||||||||||||||||||||||||||||
| Savings and Money Market | 644,260 | 644,260 | - | - | 644,260 | 760,119 | 760,119 | - | - | 760,119 | ||||||||||||||||||||||||||||||
| Time | 468,283 | - | 468,161 | - | 468,161 | 570,293 | - | 569,183 | - | 569,183 | ||||||||||||||||||||||||||||||
| Total Deposits | 2,064,073 | 1,595,790 | 468,161 | - | 2,063,951 | 2,581,711 | 2,011,418 | 569,183 | - | 2,580,601 | ||||||||||||||||||||||||||||||
| Subordinated Debentures | 10,310 | - | 6,227 | - | 6,227 | 10,310 | - | 6,578 | - | 6,578 | ||||||||||||||||||||||||||||||
| Accrued Interest Payable | 378 | - | 378 | - | 378 | 852 | - | 852 | - | 852 | ||||||||||||||||||||||||||||||
| Fair Value of Financial Instruments Using | Fair Value of Financial Instruments Using | |||||||||||||||||||||||||||||||||||||||
December 31, 2013 (in thousands) | Carrying Amount | Quoted Prices in Active Markets for Identical Assets (Level 1) | Other Observable Inputs (Level 2) | Significant Unobservable Inputs (Level 3) | Total Estimated Fair Value | |||||||||||||||||||||||||||||||||||
| December 31, 2015 (in thousands) | Carrying Amount | Quoted Prices in Active Markets for Identical Assets (Level 1) | Other Observable Inputs (Level 2) | Significant Unobservable Inputs (Level 3) | Total Estimated Fair Value | |||||||||||||||||||||||||||||||||||
| Assets: | ||||||||||||||||||||||||||||||||||||||||
| Cash and Cash Equivalents | $ | 83,677 | $ | 83,677 | $ | - | $ | - | $ | 83,677 | $ | 59,446 | $ | 59,446 | $ | - | $ | - | $ | 59,446 | ||||||||||||||||||||
| Investment Securities Available-for-Sale: | ||||||||||||||||||||||||||||||||||||||||
| Government Agency & Government-Sponsored Entities | 28,436 | 23,394 | 5,042 | - | 28,436 | 33,251 | - | 33,251 | - | 33,251 | ||||||||||||||||||||||||||||||
| U.S. Treasury Notes | 72,884 | 72,884 | - | 72,884 | ||||||||||||||||||||||||||||||||||||
| Mortgage Backed Securities | 324,929 | - | 324,929 | - | 324,929 | 262,493 | - | 262,493 | - | 262,493 | ||||||||||||||||||||||||||||||
| Corporate Securities | 49,380 | 8,191 | 41,189 | - | 49,380 | |||||||||||||||||||||||||||||||||||
| Other | 1,894 | 1,584 | 310 | - | 1,894 | 509 | 199 | 310 | - | 509 | ||||||||||||||||||||||||||||||
| Total Investment Securities Available-for-Sale | 404,639 | 33,169 | 371,470 | - | 404,639 | 369,137 | 73,083 | 296,054 | - | 369,137 | ||||||||||||||||||||||||||||||
| Investment Securities Held-to-Maturity: | ||||||||||||||||||||||||||||||||||||||||
| Obligations of States and Political Subdivisions | 65,685 | - | 51,563 | 14,307 | 65,870 | 61,396 | - | 44,675 | 17,713 | 62,388 | ||||||||||||||||||||||||||||||
| Mortgage Backed Securities | 45 | - | 45 | - | 45 | |||||||||||||||||||||||||||||||||||
| Other | 2,775 | - | 2,775 | - | 2,775 | |||||||||||||||||||||||||||||||||||
| Total Investment Securities Held-to-Maturity | 68,505 | - | 54,383 | 14,307 | 68,690 | 61,396 | - | 44,675 | 17,713 | 62,388 | ||||||||||||||||||||||||||||||
| FHLB Stock | 7,187 | N/ | A | N/ | A | N/ | A | N/ | A | 7,795 | N/A | N/A | N/A | N/A | ||||||||||||||||||||||||||
| Loans & Leases Net of Deferred Fees & Allowance: | ||||||||||||||||||||||||||||||||||||||||
| Loans & Leases, Net of Deferred Fees & Allowance: | ||||||||||||||||||||||||||||||||||||||||
| Commercial Real Estate | 402,336 | - | - | 403,790 | 403,790 | 593,587 | - | - | 591,271 | 591,271 | ||||||||||||||||||||||||||||||
| Agricultural Real Estate | 324,688 | - | - | 328,704 | 328,704 | 417,153 | - | - | 405,295 | 405,295 | ||||||||||||||||||||||||||||||
| Real Estate Construction | 40,438 | - | - | 40,800 | 40,800 | 149,489 | - | - | 149,371 | 149,371 | ||||||||||||||||||||||||||||||
| Residential 1st Mortgages | 150,184 | - | - | 153,352 | 153,352 | 205,616 | - | - | 207,431 | 207,431 | ||||||||||||||||||||||||||||||
| Home Equity Lines and Loans | 32,710 | - | - | 35,250 | 35,250 | 30,910 | - | - | 32,360 | 32,360 | ||||||||||||||||||||||||||||||
| Agricultural | 244,209 | - | - | 242,950 | 242,950 | 287,658 | - | - | 285,733 | 285,733 | ||||||||||||||||||||||||||||||
| Commercial | 144,701 | - | - | 145,131 | 145,131 | 202,968 | - | - | 201,105 | 201,105 | ||||||||||||||||||||||||||||||
| Consumer & Other | 4,876 | - | - | 4,912 | 4,912 | 6,417 | - | - | 6,416 | 6,416 | ||||||||||||||||||||||||||||||
| Leases | 62,584 | - | - | 62,139 | 62,139 | |||||||||||||||||||||||||||||||||||
| Unallocated Allowance | 12,094 | - | - | 11,851 | 11,851 | (1,546 | ) | - | - | (1,546 | ) | (1,546 | ) | |||||||||||||||||||||||||||
| Total Loans & Leases Net of Deferred Fees & Allowance | (2,274 | ) | - | - | (2,274 | ) | (2,274 | ) | ||||||||||||||||||||||||||||||||
| Total Loans & Leases, Net of Deferred Fees & Allowance | 1,954,836 | - | - | 1,939,575 | 1,939,575 | |||||||||||||||||||||||||||||||||||
| Accrued Interest Receivable | 1,353,962 | - | - | 1,364,466 | 1,364,466 | 9,240 | - | 9,240 | - | 9,240 | ||||||||||||||||||||||||||||||
| 6,941 | - | 6,941 | - | 6,941 | ||||||||||||||||||||||||||||||||||||
| Liabilities: | ||||||||||||||||||||||||||||||||||||||||
| Deposits: | ||||||||||||||||||||||||||||||||||||||||
| Demand | 495,963 | 495,963 | - | - | 495,963 | 711,029 | 711,029 | - | - | 711,029 | ||||||||||||||||||||||||||||||
| Interest Bearing Transaction | 291,795 | 291,795 | - | - | 291,795 | 377,594 | 377,594 | - | - | 377,594 | ||||||||||||||||||||||||||||||
| Savings and Money Market | 589,511 | 589,511 | - | - | 589,511 | 707,885 | 707,885 | - | - | 707,885 | ||||||||||||||||||||||||||||||
| Time | 430,422 | - | 430,752 | - | 430,752 | 481,024 | - | 480,334 | - | 480,334 | ||||||||||||||||||||||||||||||
| Total Deposits | 1,807,691 | 1,377,269 | 430,752 | - | 1,808,021 | 2,277,532 | 1,796,508 | 480,334 | - | 2,276,842 | ||||||||||||||||||||||||||||||
| Subordinated Debentures | 10,310 | - | 6,224 | - | 6,224 | 10,310 | - | 6,424 | - | 6,424 | ||||||||||||||||||||||||||||||
| Accrued Interest Payable | 352 | - | 352 | - | 352 | 513 | - | 513 | - | 513 | ||||||||||||||||||||||||||||||
Fair value estimates presented herein are based on pertinent information available to management as of December 31, 20142016 and December 31, 2013.2015. Although management is not aware of any factors that would significantly affect the estimated fair value amounts, such amounts have not been comprehensively revalued for purpose of these financial statements since that date, and; therefore, current estimates of fair value may differ significantly from the amounts presented above. The methods and assumptions used to estimate the fair value of each class of financial instrument listed in the table above are explained below.
Cash and Cash Equivalents - The carrying amounts reported in the balance sheet for cash and due from banks, interest-bearing deposits with banks, federal funds sold, and securities purchased under agreements to resell are a reasonable estimate of fair value. All cash and cash equivalents are classified as Level 1.
Investment Securities - Fair values for investment securities consider observable data that may include dealer quotes, market spreads, cash flows, the U.S. Treasury yield curve, live trading levels, trade execution data, market consensus prepayment speeds, credit information and the bond's terms and conditions, among other things. Based on the available market information the classification level could be 1, 2, or 3.
Federal Home Loan Bank Stock - It is not practical to determine the fair value of FHLB stock due to restrictions placed on its transferability.
Loans & Leases, Net of Deferred Loan & Lease Fees & Allowance - Fair values of loans & leases are estimated as follows: For variable rate loans that reprice frequently and with no significant change in credit risk, fair values are based on carrying values resulting in a Level 3 classification. Fair values for other loans & leases are estimated using discounted cash flow analyses, using interest rates currently being offered for loans with similar terms to borrowers of similar credit quality resulting in a Level 3 classification. Impaired loans & leases are valued at the lower of cost or fair value as described previously. The methods utilized to estimate the fair value of loans & leases do not necessarily represent an exit price.
Deposit Liabilities - The fair values disclosed for demand deposits (e.g., interest and non-interest checking, passbook savings, and certain types of money market accounts) are, by definition, equal to the amount payable on demand at the reporting date (i.e., their carrying amount) resulting in a Level 1 classification. Fair values for fixed-maturity certificates of deposit are estimated using a discounted cash flows calculation that applies interest rates currently being offered on certificates to a schedule of aggregated expected monthly maturities on time deposits resulting in a Level 2 classification.
Subordinated Debentures - The fair values of the Company’s Subordinated Debentures are estimated using discounted cash flow analyses based on the current borrowing rates for similar types of borrowing arrangements resulting in a Level 2 classification.
Accrued Interest Receivable and Payable - The carrying amount of accrued interest receivable and payable approximates their fair value resulting in a Level 2 classification.
| 20. | Commitments and Contingencies |
In the normal course of business, the Company enters in to financial instruments with off balance sheet risk in order to meet the financing needs of its customers and to reduce its own exposure to fluctuations in interest rates. These instruments include commitments to extend credit, letters of credit, and other types of financial guarantees. The Company had the following off balance sheet commitments as of the dates indicated.
| (in thousands) | December 31, 2014 | December 31, 2013 | December 31, 2016 | December 31, 2015 | ||||||||||||
| Commitments to Extend Credit | $ | 539,288 | $ | 445,294 | $ | 609,653 | $ | 708,122 | ||||||||
| Letters of Credit | 9,734 | 7,393 | 20,444 | 14,745 | ||||||||||||
| Performance Guarantees Under Interest Rate Swap Contracts Entered Into Between Our Borrowing Customers and Third Parties | 2,042 | - | 1,835 | 2,758 | ||||||||||||
The Company's exposure to credit loss in the event of nonperformance by the other party with regard to standby letters of credit, undisbursed loan commitments, and financial guarantees is represented by the contractual notional amount of those instruments. Commitments to extend credit are agreements to lend to a customer as long as there is no violation of any condition established in the contract. The Company uses the same credit policies in making commitments and conditional obligations as it does for recorded balance sheet items. The Company may or may not require collateral or other security to support financial instruments with credit risk. Evaluations of each customer's creditworthiness are performed on a case-by-case basis.
Standby letters of credit are conditional commitments issued by the Company to guarantee performance of or payment for a customer to a third party. Outstanding standby letters of credit have maturity dates ranging from 1 to 4660 months with final expiration in October 2018.January 2022. Commitments generally have fixed expiration dates or other termination clauses and may require payment of a fee.
The Company is obligated under a number of noncancellable operating leases for premises and equipment used for banking purposes. Minimum future rental commitments under noncancellable operating leases as of December 31, 2014,2016, were $540,000,$618,000, $371,000,557,000, $197,000, $190,000,$571,000, $579,000, and $196,000$394,000 for the years 20152017 through 2019,2021, and $557,000$255,000 for the remaining term of the leases.
In the ordinary course of business, the Company becomes involved in litigation arising out of its normal business activities. Management, after consultation with legal counsel, believes that the ultimate liability, if any, resulting from the disposition of such claims would not be material in relation to the financial position of the Company.
The Company may be required to maintain average reserves on deposit with the Federal Reserve Bank primarily based on deposits outstanding. There were no reserve requirements during 20142016 or 2013.2015.
| 21. | Recent Accounting Developments |
In May, 2014,June 2016, the FASB issued ASU 2016-13, Financial Instruments – Credit Losses (Topic 326): Measurement of Credit Losses on Financial Instruments. The ASU will require the earlier recognition of credit losses on loans and other financial instruments based on an expected loss model, replacing the incurred loss model that is currently in use. Under the new guidance, an entity will measure all expected credit losses for financial instruments held at the reporting date based on historical experience, current conditions and reasonable and supportable forecasts. The expected loss model will apply to loans and leases, unfunded lending commitments, held-to-maturity debt securities and other debt instruments measured at amortized cost. The impairment model for available-for-sale debt securities will require the recognition of credit losses through a valuation allowance when fair value is less than amortized cost, regardless of whether the impairment is considered to be other-than-temporary. The new guidance is effective on January 1, 2020, with early adoption permitted on January 1, 2019. The Company is currently evaluating the provisions of this ASU and has made available Accounting Standards Update (ASU) No.created a cross-functional team to begin its implementation efforts of this new guidance. While the Company has not quantified the impact of this ASU, it is evaluating historical loan level data requirements necessary for the implementation of the model, as well as various methodologies for determining expected credit losses.
In February 2016, the FASB issued ASU 2016-02, Leases (Topic 842). The new standard is being issued to increase the transparency and comparability around lease obligations. Previously unrecorded off-balance sheet obligations will now be brought more prominently to light by presenting lease liabilities on the face of the balance sheet, accompanied by enhanced qualitative and quantitative disclosures in the notes to the financial statements. This ASU applies to leasing arrangements exceeding a twelve-month term. ASU 2016-02 is effective for annual periods, including interim periods within those annual periods beginning after December 15, 2018 and requires a modified retrospective method upon adoption. Early application of the amendments is permitted. The Company is currently evaluating the provisions of this ASU to determine the potential impact the new standard will have on the Company’s consolidated financial statements. While the Company has not quantified the impact to its balance sheet, it does expect the adoption of this ASU will result in a gross-up in its balance sheet as a result of recording a right-of-use asset and a lease liability for these leases.
In August 2015, the FASB issued ASU 2015-14, which deferred the effective date of ASU 2014-09,Revenue from Contracts with Customers: Topic 606. Customers (Topic 606). As a result of the deferral, the guidance in ASU 2014-09 affects any entity using U.S. GAAP that either enters intowill be effective for the Company for reporting periods beginning after December 15, 2017. The Update modifies the guidance companies use to recognize revenue from contracts with customers to transferfor transfers of goods or services or enters into contracts for the transferand transfers of nonfinancial assets, unless those contracts are within the scope of other standards (e.g., insurance contracts or lease contracts). This ASU will supersede the revenue recognition requirements in Topic 605,standards. The guidance also requires new qualitative and quantitative disclosures, including information about contract balances and performance obligations. Revenue Recognition, and most industry-specific guidance. This ASU also supersedes some cost guidance included in Subtopic 605-35, Revenue Recognition—Construction-Type and Production-Type Contracts. In addition, the existing requirements for the recognition of a gain or loss on the transfer of nonfinancial assets that are not in a contract with a customer (e.g., assets within the scope of Topic 360, Property, Plant, and Equipment, and intangible assets within the scope of Topic 350, Intangibles—Goodwill and Other) are amended to be consistent with the guidance on recognition and measurement (including the constraint on revenue) in this ASU. The core principle of the guidance is that an entity should recognize revenue to depict the transfer of promised goods or services to customers in an amount that reflects the consideration to which the entity expects to be entitled in exchange for those goods or services. For a public entity, the amendments in this ASU are effective for annual reporting periods beginning after December 15, 2016, including interim periods within that reporting period. Early application is not permitted. The Company does not anticipate thatis currently evaluating the impact the adoption of this ASUupdate will have a material impact on the consolidated financial statements. As a financial institution, the Company’s financial position, resultslargest component of operation, cash flows, or disclosure.
| 22. | Parent Company Financial Information |
The following financial information is presented as of December 31 for the periods indicated.
Farmers & Merchants Bancorp
Condensed Balance Sheets
| (in thousands) | 2014 | 2013 | 2016 | 2015 | ||||||||||||
| Cash | $ | 363 | $ | 416 | $ | 228 | $ | 308 | ||||||||
| Investment in Farmers & Merchants Bank of Central California | 242,852 | 219,640 | 289,778 | 261,626 | ||||||||||||
| Investment Securities | 410 | 410 | 409 | 409 | ||||||||||||
| Other Assets | 201 | 87 | 184 | 60 | ||||||||||||
| Total Assets | $ | 243,826 | $ | 220,553 | $ | 290,599 | $ | 262,403 | ||||||||
| Subordinated Debentures | $ | 10,310 | $ | 10,310 | $ | 10,310 | $ | 10,310 | ||||||||
| Liabilities | 338 | 339 | 308 | 258 | ||||||||||||
| Shareholders' Equity | 233,178 | 209,904 | 279,981 | 251,835 | ||||||||||||
| Total Liabilities and Shareholders' Equity | $ | 243,826 | $ | 220,553 | $ | 290,599 | $ | 262,403 | ||||||||
Farmers & Merchants Bancorp
Condensed Statements of Income
| Year Ended December 31, | Year Ended December 31, | |||||||||||||||||||||||
| (in thousands) | 2014 | 2013 | 2012 | 2016 | 2015 | 2014 | ||||||||||||||||||
| Equity in Undistributed Earnings in Farmers & Merchants Bank of Central California | $ | 18,211 | $ | 14,352 | $ | 13,247 | $ | 17,043 | $ | 17,352 | $ | 18,211 | ||||||||||||
| Dividends from Subsidiary | 8,000 | 10,450 | 10,900 | 14,275 | 10,875 | 8,000 | ||||||||||||||||||
| Interest Income | 10 | 10 | 10 | 11 | 10 | 10 | ||||||||||||||||||
| Other Expenses, Net | (1,406 | ) | (1,288 | ) | (1,386 | ) | (2,485 | ) | (1,451 | ) | (1,406 | ) | ||||||||||||
| Tax Benefit | 587 | 537 | 578 | 879 | 606 | 587 | ||||||||||||||||||
| Net Income | $ | 25,402 | $ | 24,061 | $ | 23,349 | $ | 29,723 | $ | 27,392 | $ | 25,402 | ||||||||||||
Farmers & Merchants Bancorp
Condensed Statements of Cash Flows
| Year Ended December 31, | Year Ended December 31, | |||||||||||||||||||||||
| (in thousands) | 2014 | 2013 | 2012 | 2016 | 2015 | 2014 | ||||||||||||||||||
| Cash Flows from Operating Activities: | ||||||||||||||||||||||||
| Net Income | $ | 25,402 | $ | 24,061 | $ | 23,349 | $ | 29,723 | $ | 27,392 | $ | 25,402 | ||||||||||||
| Adjustments to Reconcile Net Income to Net Cash Provided by Operating Activities: | ||||||||||||||||||||||||
| Equity in Undistributed Net Earnings from Subsidiary | (18,211 | ) | (14,352 | ) | (13,247 | ) | (17,043 | ) | (17,352 | ) | (18,211 | ) | ||||||||||||
| Net Decrease (Increase) in Other Assets | (114 | ) | 38 | (216 | ) | |||||||||||||||||||
| Net (Decrease) Increase in Liabilities | (1 | ) | 180 | (78 | ) | |||||||||||||||||||
| Net (Increase) Decrease in Other Assets | (124 | ) | (79 | ) | (114 | ) | ||||||||||||||||||
| Net Increase (Decrease) in Liabilities | 49 | 141 | (1 | ) | ||||||||||||||||||||
| Net Cash Provided by Operating Activities | 7,076 | 9,927 | 9,808 | 12,605 | 10,102 | 7,076 | ||||||||||||||||||
| Investing Activities: | ||||||||||||||||||||||||
| Securities Purchased | - | - | - | |||||||||||||||||||||
| Securities Sold or Matured | - | - | - | |||||||||||||||||||||
| Payments for Business Acquisition | (2,207 | ) | - | - | ||||||||||||||||||||
| Payments for Investments in Subsidiaries | (2,586 | ) | (3,360 | ) | - | |||||||||||||||||||
| Net Cash Used by Investing Activities | - | - | - | (4,793 | ) | (3,360 | ) | - | ||||||||||||||||
| Financing Activities: | ||||||||||||||||||||||||
| Stock Repurchased | - | - | (576 | ) | ||||||||||||||||||||
| Issuance of Common Stock | 2,790 | - | - | 2,586 | 3,360 | 2,790 | ||||||||||||||||||
| Cash Dividends | (9,919 | ) | (9,723 | ) | (9,418 | ) | (10,478 | ) | (10,157 | ) | (9,919 | ) | ||||||||||||
| Net Cash Used by Financing Activities | (7,129 | ) | (9,723 | ) | (9,994 | ) | (7,892 | ) | (6,797 | ) | (7,129 | ) | ||||||||||||
| (Decrease) Increase in Cash and Cash Equivalents | (53 | ) | 204 | (186 | ) | |||||||||||||||||||
| Decrease in Cash and Cash Equivalents | (80 | ) | (55 | ) | (53 | ) | ||||||||||||||||||
| Cash and Cash Equivalents at Beginning of Year | 416 | 212 | 398 | 308 | 363 | 416 | ||||||||||||||||||
| Cash and Cash Equivalents at End of Year | $ | 363 | $ | 416 | $ | 212 | $ | 228 | $ | 308 | $ | 363 | ||||||||||||
| 23. | Subsequent Events |
On January 23, 2015,February 17, 2017, the Company issued 1,7001,375 shares of common stock to the Bank’s non-qualified defined contribution retirement plans. See Note 16, located in “Item 8. Financial Statements and Supplementary Data.” These shares were issued at a price of $450$590.00 per share based upon a valuation dated December 1, 2014, completed by a nationally recognized bank consulting and advisory firm.firm and in reliance upon the exemption in Section 4(a)(2) of the Securities Act of 1933, as amended, and the regulations promulgated thereunder. The proceeds were contributed to the Bank as equity capital.
None
The Company maintains controls and procedures designed to ensure that all relevant information is recorded and reported in all filings of financial reports. Such information is reported to the Company’s management, including its Chief Executive Officer and its Chief Financial Officer to allow timely and accurate disclosure based on the definition of “disclosure controls and procedures” in Rule 13a-15(e). In accordance with Rule 13a-15(b) of the Exchange Act, we carried out an evaluation as of December 31, 2014,2016, under the supervision and with the participation of our management, including our Chief Executive Officer and Chief Financial Officer, of the effectiveness of the design and operation of our disclosure controls and procedures as defined in Rule 13a-15(e) under the Exchange Act. Based on that evaluation, our Chief Executive Officer and Chief Financial Officer have concluded that our disclosure controls and procedures are effective as of December 31, 2014.2016.
There have been no significant changes in the Company’s internal controls or in other factors that could significantly affect the internal controls subsequent to the date the Company completed its evaluation.
Management’s report on internal control over financial reporting is set forth in “Item 8. Financial Statements and Supplementary Data,” and is incorporated herein by reference. Moss Adams LLP, the independent registered public accounting firm that audited the consolidated financial statements included in this Annual Report, was engaged to audit the effectiveness of the Company’s internal control over financial reporting. The report of Moss Adams LLP, which is set forth in “Item 8. Financial Statements and Supplementary Data,” is incorporated herein by reference.
None
PART III
Set forth below is certain information regarding the Named Executive Officers of the Company and/or Bank:
Name and Position(s) | Age | Principal Occupation during the Past Five Years |
Kent A. Steinwert Chairman, President & Chief Executive Officer of the Company and Bank | Chairman, President & Chief Executive Officer of the Company and | |
Deborah E. Skinner Executive Vice President & Chief Administrative Officer of the Bank | Executive Vice President & Chief Administrative Officer of the Bank. | |
Stephen W. Haley Executive Vice President & Chief Financial Officer & Secretary of the Company and Bank | Executive Vice President & Chief Financial Officer of the Company and Bank. | |
Kenneth W. Smith Executive Vice President & Senior Credit Officer of the Company and Bank | Executive Vice President & Senior Credit Officer of the Company and | |
James P. Daugherty Executive Vice President, Wholesale Banking Division of the Bank | Executive Vice President, Wholesale Banking Division of the Bank since November 15, 2013. Senior Vice President, Commercial Credit Administrator of the Bank up to November 14, 2013. | |
Jay J. Colombini Executive Vice President, Wholesale Banking Division | Executive Vice President, Wholesale Banking Division of the Bank since November 15, 2013. Senior Vice President and Manager – Lodi Main Branch from August 1, 2012 through November 14, 2013. Senior Vice President and Manager – Linden Branch up to July 31, 2012 |
Ryan J. Misasi
Executive Vice President,
Retail Banking Division of the Bank
Executive Vice President, Retail Banking Division of the Bank since May 29, 2014.
Executive Vice President and Chief Retail Officer – Patelco Credit Union from December, 2011 to April, 2014.
Also, see “Election of Directors” and “Compliance with Section 16(a) of the Exchange Act” in the Company’s definitive proxy statement for the 20152017 Annual Meeting of Stockholders which will be filed with the SEC and which is incorporated herein by reference. During 20142016, there were no changes in procedures for the election of directors.
The Company has adopted a Code of Conduct, which complies with the Code of Ethics requirements of the SEC. A copy of the Code of Conduct is posted on the Company’s website. The Company intends to disclose promptly any amendment to, or waiver from any provision of, the Code of Conduct applicable to senior financial officers, and any waiver from any provision of the Code of Conduct applicable to directors, on its website on the About Us page. The Company’s website address is www.fmbonline.com.www.fmbonline.com. This website address is for information only and is not intended to be an active link, or to incorporate any website information into this document.
The information required by Item 11 of Form 10-K is incorporated by reference from the information contained in the Company’s definitive proxy statement for the 20152017 Annual Meeting of Stockholders, which will be filed pursuant to Regulation 14A.
The information required by Item 12 of Form 10-K is incorporated by reference from the information contained in the Company’s definitive proxy statement for the 20152017 Annual Meeting of Stockholders, which will be filed pursuant to Regulation 14A. The Company does not have any equity compensation plans, which require disclosure under Item 201(d) of Regulation S-K.
The information required by Item 13 of Form 10-K is incorporated by reference from the information contained in the Company’s definitive proxy statement for the 20152017 Annual Meeting of Stockholders, which will be filed pursuant to Regulation 14A.
The information required by Item 14 of Form 10-K is incorporated by reference from the information contained in the Company’s definitive proxy statement for the 20152017 Annual Meeting of Stockholders, which will be filed pursuant to Regulation 14A.
PART IV
(a) | (1) Financial Statements. Incorporated herein by reference, are listed in Item 8 hereof. |
| (2) | Financial Statement Schedules. Not applicable. |
(3) | Exhibits. |
Exhibit Number | Description |
| 2.1 | Agreement and Plan of Reorganization dated as of June 8, 2016, by and between Farmers & Merchants Bancorp and Delta National Bancorp and filed on the Registrant’s Current Report on Form 8-K dated June 10, 2016, is incorporated herein by reference. |
| 3.1 | Amended Certificate of Incorporation (incorporated by reference to Proposal #2 in the Registrant’s Definitive Proxy Statement on Schedule 14A for its 2012 Annual Meeting of Stockholders, Appendices 1 and 2 to the Registrant's Definitive Proxy Statement on Schedule 14A for its 2007 Annual Meeting of Stockholders, and Exhibit 3(i) to the Registrant's Current Report on Form 8-K dated April 30, 1999). |
| 3.2 | Amended By-Laws (incorporated by reference to the Registrant’s Current Report on Form 8-K dated April 4, 2016, the Registrant’s Current Report on Form 8-K dated September 19, 2008, Appendix 3 to the Registrant's Definitive Proxy Statement on Schedule 14A for its 2007 Annual Meeting of Stockholders, Exhibit 3.1 to the Registrant's Current Report on Form 8-K dated June 7, 2005, and Exhibit 3(ii) to the Registrant's Current Report on Form 8-K dated April 30, 1999). |
| 3.3 | Certificate of Designation for the Series A Junior Participating Preferred Stock (included as Exhibit A to the Rights Agreement between Farmers & Merchants Bancorp and Registrar and Transfer Company, dated as of August 5, 2008, filed as Exhibit 4.1 below), filed on the Registrant’s Form 10-Q for the quarter ended June 30, 2008, is incorporated herein by reference. |
| 4.1 | Rights Agreement between Farmers & Merchants Bancorp and Registrar and Transfer Company, dated as of August 5, 2008, including Form of Right Certificate attached thereto as Exhibit B, filed on the Registrant’s Form 10-Q for the quarter ended June 30, 2008, is incorporated herein by reference. |
| 4.2 | Amendment No. 1 to Rights Agreement between Farmers & Merchants Bancorp and Computershare Trust, N.A., as Rights Agent, dated as of February 18, 2016, incorporated herein by reference to Exhibit 4.2 of the Registrant’s Form 8-A/A filed on February 19, 2016. |
| 10.1 | Amended and Restated Employment Agreement effective |
| 10.3 | Amended and Restated Employment Agreement effective |
| 10.4 | Amended and Restated Employment Agreement effective |
| 10.6 | Amended and Restated Employment Agreement effective |
| 10.8 | Employment Agreement effective |
| 10.9 | Employment Agreement effective |
| 10.10 | Employment Agreement effective |
| 10.15 | Executive Retirement Plan – Performance Component as amended on November 5, 2010, filed on Registrant’s Form 10-Q for the period ended September 30, 2010, is incorporated herein by reference. |
| 10.16 | Executive Retirement Plan – Retention Component as amended on November 5, 2010, filed on Registrant’s Form 10-Q for the period ended September 30, 2010, is incorporated herein by reference. |
| 10.17 | Executive Retirement Plan – Salary Component, amended and restated on November 29, 2014, filed on Registrant’s Form 10-K for the year ended December 31, |
| 10.18 | Deferred Compensation Plan of Farmers & Merchants Bank of Central California, as amended on November 5, 2010, filed on Registrant’s Form 10-Q for the period ended September 30, 2010, is incorporated herein by reference. |
| 10.19 | Executive Retirement Plan – Equity Component, amended and restated on November 29, 2014, filed on Registrant’s Form 10-K for the year ended December 31, |
| 10.20 | Senior Management Retention Plan, amended and restated on November 29, 2014, filed on Registrant’s Form 10-K for the year ended December 31, |
| 14 | Code of Conduct of Farmers & Merchants Bancorp, filed on Registrant’s Form 10-K for the year ended December 31, 2003, is incorporated herein by reference. |
| 21 | Subsidiaries of the Registrant, filed on Registrant’s Form 10-K for the year ended December 31, 2003, is incorporated herein by reference. |
| 31(a) | Certification of the Chief Executive Officer pursuant to Section 302 of the Sarbanes-Oxley Act of 2002. |
| 31(b) | Certification of the Chief Financial Officer pursuant to Section 302 of the Sarbanes-Oxley Act of 2002. |
| 32 | Certification of the Chief Executive Officer and Chief Financial Officer pursuant to 18 U.S.C. Section 1350, as adopted pursuant to Section 906 of the Sarbanes-Oxley Act of 2002. |
| 101.INS | XBRL Instance Document |
| 101.SCH | XBRL Schema Document |
| 101.CAL | XBRL Calculation Linkbase Document |
| 101.LAB | XBRL Label Linkbase Document |
| 101.PRE | XBRL Presentation Linkbase Document |
| 101.DEF | XBRL Definition Linkbase Document |
None
Pursuant to the requirements of Section 13 or 15(d) of the Securities Exchange Act of 1934, the registrant has duly caused this report to be signed on its behalf by the undersigned, thereunto duly authorized.
| Farmers & Merchants Bancorp | |||
| (Registrant) | |||
| By | /s/ Stephen W. Haley | ||
| Dated: March | Stephen W. Haley | ||
| Executive Vice President & | |||
| Chief Financial Officer |
Pursuant to the requirements of the Securities Exchange Act of 1934, this report has been signed below by the following persons on behalf of the registrant and in the capacities indicated on March 13, 2015.15, 2017.
| /s/ Kent A. Steinwert | Chairman, President & Chief Executive Officer | ||
| Kent A. Steinwert | (Principal Executive Officer) | ||
| /s/ Stephen W. Haley | Executive Vice President & Chief Financial Officer | ||
| Stephen W. Haley | (Principal Financial and Accounting Officer) | ||
| /s/ Bruce A. Mettler | /s/ Calvin Suess | ||
| Bruce A. Mettler, Director | Calvin Suess, Director | ||
| /s/ Stewart C. Adams, Jr. | /s/ Kevin Sanguinetti | ||
| Stewart C. Adams, Jr., Director | Kevin Sanguinetti, Director | ||
| /s/ Edward Corum, Jr. | /s/ Gary Long | ||
| Edward Corum, Jr., Director | Gary Long, Director | ||
| Certification of the Chief Executive Officer pursuant to Section 302 of the Sarbanes-Oxley Act of 2002. | |
| Certification of the Chief Financial Officer pursuant to Section 302 of the Sarbanes-Oxley Act of 2002. | |
| Certification of the Chief Executive Officer and Chief Financial Officer pursuant to 18 U.S.C. Section 1350, as adopted pursuant to Section 906 of the Sarbanes-Oxley Act of 2002. |
108