| Page | |||
| PART I | |||
| Item 1. | 4 | ||
| Item 1A. | 15 | ||
| Item 1B. | |||
| Item 1C. | 24 | ||
| Item 2. | |||
| Item 3. | |||
| Item 4. | |||
| PART II | |||
| Item 5. | |||
| Item 6. | 29 | ||
| Item 7. | |||
| Item | |||
| Item 8. | |||
| Item 9. | |||
| Item 9A. | |||
| Item 9B. | |||
| Item 9C. | 87 | ||
| PART III | |||
| Item 10. | |||
| Item 11. | |||
| Item 12. | |||
| Item 13. | |||
| Item 14. | |||
| PART IV | |||
| Item 15. | |||
| Item 16. | |||
FORWARD-LOOKING STATEMENTS
We make statements in this report that are considered to be forward-looking statements within the meaning given such term under Section 21E of the Securities Exchange Act of 1934, as amended (the “Exchange Act”). These statements contain forward-looking information relating to the financial condition, results of operations, plans, objectives, future performance and business of our Company. These statements (often using words such as “believes”, “expects”, “intends”, “plans”, “appear”, “should” and similar words) involve risks and uncertainties that could cause actual results to differ materially from those we project. Included among such statements, but not limited to, are those relating to opening clinics, availability of personnel and the insurance reimbursement environment. The forward-looking statements are based on our current views and assumptions, and actual results could differ materially from those anticipated in such forward-looking statements as a result of certain risks, uncertainties, and factors, which include, but are not limited to:
changes in Medicare rules and guidelines and reimbursement or failure of our clinics to maintain their Medicare certification and/or enrollment status, including Medicare reimbursement reductions.status;
revenue we receive from Medicare and Medicaid being subject to potential retroactive reduction;
compliance with federal and state laws and regulations relating to the privacy of individually identifiable patient information, and associated fines and penalties for failure to comply;
competitive, economic or reimbursement conditions in our markets which may require us to reorganize or close certain clinics and thereby incur losses and/or closure costs including the possible write-down or write-off of goodwill and other intangible assets;assets;
the impact of future public health crises and epidemics/pandemics, such as was the case with the novel strain of COVID-19 and its variants;
one of our acquisition agreements contains a put-right related to a future purchase of a majority interest in a separate company;
the impact of future vaccinations and/or testing mandates at the federal, state and/or local level, which could have an adverse impact on staffing, revenue, costs and the results of operations;
our debt and financial obligations could adversely affect our financial condition, our ability to obtain future financing and our ability to operate our business;
changes as the result of government enacted national healthcare reform;
business and regulatory conditions including federal and state regulations;
governmental and other third party payor inspections, reviews, investigations and audits, which may result in sanctions or reputational harm and increased costs;
revenue and earnings expectations;
contingent consideration provisions in certain our acquisition agreements, the value of which may impact future financial results;
legal actions, which could subject us to increased operating costs and uninsured liabilities;
general economic conditions, including but not limited to inflationary and recessionary periods;
actual or perceived events involving banking volatility or limited liability, defaults or other adverse developments that affect the U.S or the international financial systems, may result in market wide liquidity problems which could have a material and adverse impact on our available cash and results of operations;
our business depends on hiring, training, and retaining qualified employees;
availability and cost of qualified physical therapists;
competitive environment in the industrial injury prevention services business, which could result in the termination or non-renewal of contractual service arrangements and other adverse financial consequences for that service line;
our ability to identify and complete acquisitions, purchase of non-controlling interests (minority interests) and the successful integration of the operations of the acquired businesses;businesses;
impact on the business and cash reserves resulting from retirement or resignation of key partners and resulting purchase of their non-controlling interest (minority interests);
maintaining our information technology systems with adequate safeguards to protect against cyber-attacks;
a security breach of our or our third party vendors’ information technology systems may subject us to potential legal action and reputational harm and may result in a violation of the Health Insurance Portability and Accountability Act of 1996 of the Health Information Technology for Economic and Clinical Health Act;
maintaining clients for which we perform management, industrial injury prevention related services, and other services, as a breach or termination of those contractual arrangements by such clients could cause operating results to be less than expected;
maintaining adequate internal controls;controls;
maintaining necessary insurance coverage;
availability, terms, and use of capital; and
weather and other seasonal factors.
Many factors are beyond our control. Given these uncertainties, you should not place undue reliance on our forward-looking statements. Please see the other sections of this report and our other periodic reports filed with the Securities and Exchange Commission (the “SEC”) for more information on these factors. Our forward-looking statements represent our estimates and assumptions only as of the date of this report. Except as required by law, we are under no obligation to update any forward-looking statement, regardless of the reason the statement may no longer be accurate.
3
PART I
| ITEM 1. |
GENERAL
| Acquisition | Date | % Interest Acquired | Number of Clinics | |||
| November 2020 Acquisition | November 30, 2020 | 75% | 3 | |||
| September 2020 Acquisition | September 30, 2020 | 70% | * | |||
| February 2020 Acquisition | February 27, 2020 | 65% ** | 4 | |||
| September 2019 Acquisition | September 30, 2019 | 67% | 11 | |||
| August 2018 Acquisition | August 31, 2018 | 70% | 4 |
We were re-incorporated in April 1992 under the laws of the State of Nevada and have operating subsidiaries organized in various states in the form of limited partnerships, limited liability companies and wholly-owned corporations. This description of our business should be read in conjunction with our financial statements and the related notes contained in Item 8 in this Annual Report on Form 10-K.
Our principal executive offices are located at 1300 West Sam Houston Parkway South, Suite 300, Houston, Texas 77042. Our telephone number is (713) 297-7000. Our website is www.usph.com.
Acquisitions of Businesses and Interests
During the last three years, we completed the acquisitions of the following clinic practices and IIP businesses detailed below:
| % Interest | Number of | |||||
| Acquisition | Date | Acquired | Clinics | |||
October 2023 Acquisition | October 31, 2023 | ** | * | |||
September 2023 Acquisition 1 | September 29, 2023 | 70% | 4 | |||
September 2023 Acquisition 2 | September 29, 2023 | 70% | 1 | |||
July 2023 Acquisition | July 31, 2023 | 70% | 7 | |||
May 2023 Acquisition | May 31, 2023 | 45% | 4 | |||
February 2023 Acquisition | February 28, 2023 | 80% | 1 | |||
November 2022 Acquisition | November 30, 2022 | 80% | 13 | |||
October 2022 Acquisition | October 31, 2022 | 60% | 14 | |||
September 2022 Acquisition | September 30, 2022 | 80% | 2 | |||
August 2022 Acquisition | August 31, 2022 | 70% | 6 | |||
March 2022 Acquisition | March 31, 2022 | 70% | 6 | |||
| December 2021 Acquisition | December 31, 2021 | 75% | 3 | |||
| November 2021 Acquisition | November 30, 2021 | 70% | * | |||
| September 2021 Acquisition | September 30, 2021 | 100% | * | |||
| June 2021 Acquisition | June 30, 2021 | 65% | 8 | |||
| March 2021 Acquisition | March 31, 2021 | 70% | 6 |
| * | IIP business |
| ** | On October 31, 2023, we concurrently acquired 100% of an IIP business and a 55% equity interest in an ergonomics software business (“October 2023 Acquisition”). |
Our strategy is to continue acquiring outpatient physical therapy practices, develop outpatient physical therapy clinics as satellites in existing partnerships, and continue acquiring companies that provide or serve the Company’s industrial injury prevention services sector.
On May 30, 2023, the Company completed a secondary offering of 1,916,667 shares of its common stock at an offering price of $90.00 per share. Upon completion of the offering, the Company received net proceeds of approximately $163.6 million, after deducting an underwriting discount of $8.6 million and recognizing related fees and expenses of $0.2 million. A portion of the net proceeds was used to repay the $35.0 million then outstanding under the Company’s credit facility while the remainder is expected to be used primarily for additional acquisitions.
OUR CLINICSOPERATING SEGMENTS
Our physical therapy operations segment primarily operates through subsidiary clinic partnerships (“Clinic PartnershipsPartnerships”), in which we own the Company generally owns a 1% general partnership interest and ain the Clinic Partnerships. The Company’s limited partnership interests generally range from 65% to 75% (a range of 10%-99%) in the Clinic Partnerships. For the vast majority of the limited partnership interests. TheClinic Partnerships, the managing healthcare practitioner is a physical therapist who owns the remaining limited partnership interest in the Clinic Partnership. The managing therapist of each clinic owns, directly or indirectly, the remaining limited partnership interest in most of the clinics usually owns a portion of the limited partnership interests.(hereinafter referred to as “Clinic Partnerships”). Generally, the therapist partners have no interest in the net losses of Clinic Partnerships, except to the extent of their capital accounts. Since we also develop satellite clinic facilities of existing clinics, most Clinic Partnerships consist of more than one clinic location. AsTo a lesser extent, the Company operates some clinics, through wholly-owned subsidiaries, under profit sharing arrangements with therapists (hereinafter referred to as “Wholly-Owned Facilities”).
Our Clinics
We operated 671 clinics in 42 states on December 31, 2023. Our highest concentration of clinics is in the following states: Texas, Tennessee, Michigan, Virginia, Florida, Oregon, Maryland, Pennsylvania, Georgia, Missouri, Idaho, Arizona, South Carolina, Alabama and Connecticut. In addition to our 671 clinics, we also managed 43 physical therapy practices for unrelated physician groups and hospitals as of December 31, 2020, through wholly-owned subsidiaries, we owned a 1% general partnership interest2023.
The table below indicates historical information regarding our clinic counts.
| For the Year Ended | ||||||||||||
| December 31, 2023 | December 31, 2022 | December 31, 2021 | ||||||||||
| Number of clinics, beginning of period | 640 | 591 | 554 | |||||||||
| Additions | 46 | 65 | 42 | |||||||||
| Closed or sold | (15 | ) | (16 | ) | (5 | ) | ||||||
| Number of clinics, end of period | 671 | 640 | 591 | |||||||||
Our typical clinic occupies 1,000 to 7,000 square feet of leased space in all the Clinic Partnerships. Our limited partnership interests range from 10% to 99%an office building or shopping center. There are 25 clinics occupying space in the Clinic Partnerships. For the vast majorityrange of the Clinic Partnerships, the managing healthcare practitioner is a physical therapist who owns the remaining limited partnership interest in the Clinic Partnership.over 7,000 square feet to 16,500 square feet. We attempt to lease ground level space for our patients’ ease of access to our clinics.
Each Clinic Partnership maintains an independent local identity, while at the same time enjoying the benefits of national purchasing, negotiated third-party payor contracts, centralized support services and management practices. Under a management agreement, one of our subsidiariesthe Company provides a variety of support services to each clinic, including supervision of site selection, construction, clinic design and equipment selection, establishment of accounting systems and billing procedures and training of office support personnel, processing of accounts payable, operational direction, auditing of regulatory compliance, payroll, benefits administration, accounting services, legal services, quality assurance and marketing support.
5
We provide services at our clinics on an outpatient basis. Patients are usually treated for approximately one hour per day, two to three times a week, typically for two to six weeks. We generally charge for treatment on a per procedure basis. Medicare patients are charged based on prescribed time increments and Medicare billing standards. In addition, our clinics will develop, when appropriate, individual maintenance and self-management exercise programs to be continued after treatment. We continually assess the potential for developing new services and expanding the methods of providing our existing services in the most efficient manner while providing high quality patient care.
Patient Care Providers and Staffing
Typical minimum staff at a clinic consists of a licensed physical therapist and an office manager. As patient visits grow, staffing may also include large insurers and their contractors. We perform these services through Industrial Sports Medicine Professionals, consisting of bothadditional physical therapists, and specialized certifiedoccupational therapists, therapy assistants, aides, exercise physiologists, athletic trainers (ATCs).
We believecontinue to seek to attract employment of physical therapists who have established relationships with physicians and other referral sources by offering these therapists a competitive salary and incentives based on the profitability of the clinic that they manage. For multi-site clinic practices in which a controlling interest is acquired by us, the following factors, among others, influenceprior owners typically continue as employees to manage the growthclinic operations, retaining a non-controlling ownership interest in the clinics and receiving a competitive salary for managing the clinic operations. In addition, we have developed satellite clinic facilities as part of existing Clinic Partnerships and Wholly-Owned Facilities, with the result that a substantial number of Clinic Partnerships and Wholly-Owned Facilities operate more than one clinic location. In 2024, we intend to continue to acquire multi-clinic practices and to continue to develop outpatient physical therapy services:clinics as satellites in existing partnerships, along with increasing our patient volume through marketing and new programs.
6
Payor sources for physical therapy operations are primarily managed care programs, commercial health insurance, Medicare/Medicaid and workers’ compensation insurance. Commercial health insurance, Medicare and managed care programs generally provide coverage to patients utilizing our clinics after payment by the patients of normal deductibles and co-insurance payments. Workers’ compensation laws generally require employers to provide, directly or indirectly through insurance, costs of medical rehabilitation for their employees from work-related injuries and disabilities and, in some jurisdictions, mandatory vocational rehabilitation, usually without any deductibles, co-payments or cost sharing. Treatments for patients who are parties to personal injury cases are generally paid from the proceeds of settlements with insurance companies or from favorable judgments. If an unfavorable judgment is received, collection efforts are generally not pursued against the patient and the patient’s account is written-off against established reserves. Bad debt reserves relating to all receivable types are regularly reviewed and adjusted as appropriate.
The following table shows our payor mix for the years ended ($ in thousands):periods presented.
| December 31, 2020 | December 31, 2019 | December 31, 2018 | ||||||||||||||||||||||
| Payor | Net Patient Revenue | Percentage | Net Patient Revenue | Percentage | Net Patient Revenue | Percentage | ||||||||||||||||||
| Managed Care Programs | $ | 104,513 | 28.0 | % | $ | 124,516 | 28.7 | % | $ | 134,748 | 32.3 | % | ||||||||||||
| Commercial Health | ||||||||||||||||||||||||
| Insurance | 73,364 | 19.7 | % | 79,535 | 18.4 | % | 72,786 | 17.4 | % | |||||||||||||||
| Medicare/Medicaid | 118,030 | 31.6 | % | 132,611 | 30.6 | % | 117,554 | 28.1 | % | |||||||||||||||
| Workers' Compensation | ||||||||||||||||||||||||
| Insurance | 48,628 | 13.0 | % | 63,542 | 14.7 | % | 59,942 | 14.4 | % | |||||||||||||||
| Other | 28,805 | 7.7 | % | 33,141 | 7.6 | % | 32,673 | 7.8 | % | |||||||||||||||
| Total | $ | 373,340 | 100.0 | % | $ | 433,345 | 100.0 | % | $ | 417,703 | 100.0 | % | ||||||||||||
| For the Year Ended | ||||||||||||||||||||||||
| December 31, 2023 | December 31, 2022 | December 31, 2021 | ||||||||||||||||||||||
| Net Patient | Net Patient | Net Patient | ||||||||||||||||||||||
| Payor | Revenue | Percentage | Revenue | Percentage | Revenue | Percentage | ||||||||||||||||||
| Managed Care Programs/ | (In thousands, except percentages) | |||||||||||||||||||||||
| Commercial Health Insurance | $ | 244,470 | 47.5 | % | $ | 215,822 | 46.5 | % | $ | 209,129 | 47.7 | % | ||||||||||||
| Medicare/Medicaid | 188,329 | 36.6 | % | 174,401 | 37.5 | % | 155,122 | 35.4 | % | |||||||||||||||
| Workers' Compensation Insurance | 48,834 | 9.5 | % | 45,010 | 9.7 | % | 44,549 | 10.2 | % | |||||||||||||||
| Other | 32,923 | 6.4 | % | 29,357 | 6.3 | % | 29,530 | 6.7 | % | |||||||||||||||
| Total | $ | 514,556 | 100.0 | % | $ | 464,590 | 100.0 | % | $ | 438,330 | 100.0 | % | ||||||||||||
Our physical therapy business depends to a significant extent on our relationships with commercial health insurers, health maintenance organizations, preferred provider organizations and workers’ compensation insurers. In some geographical areas, our clinics must be approved as providers by key health maintenance organizations and preferred provider plans to obtain payments. Failure to obtain or maintain these approvals would adversely affect financial results.
Medicare
During the year ended December 31, 2020,2023, approximately 35.3%40.3% of our visits and 31.6%36.6% of our net patient revenues wererevenue was from patients with Medicare or Medicaid program coverage. To receive Medicare reimbursement, a facility (Medicare Certified Rehabilitation Agency) or the individual therapist (Physical/Occupational Therapist in Private Practice) must meet applicable participation conditions set by the Department of Health and Human Services (“HHS”) relating to the type of facility, equipment, recordkeeping, personnel and standards of medical care, and also must comply with all state and local laws. HHS, through Centers for Medicare & Medicaid Services (“CMS”) and designated agencies, periodically inspects or surveys clinics/providers for approval and/or compliance. We anticipate thatFailure of our newly developed and acquired clinics will become certifiedsubsidiaries to obtain or maintain certifications as Medicare providers or will be enrolledfailure to enroll as a group of physical/occupationoccupational therapists in a private practice. Failure to obtain or maintain this certification wouldpractice could adversely affect financial results.
The Medicare program reimburses outpatient rehabilitation providers based on the Medicare Physician Fee Schedule (‘‘MPFS’’(“MPFS”). For services provided
In 2021 the MPFS established by Centers for Medicare and Medicaid Services (“CMS”) resulted in 2018, a 0.5% increase was applied to the fee schedule payment rates; for services provided in 2019, a 0.25% increase was applied to the fee schedule payment rates before applying the mandatory budget neutrality adjustment. For services provided in 2020 through 2025, a 0.0% percent update is expected to be applied each year to the fee schedule payment rates, before applying the mandatory budget neutrality adjustment. However,an approximate 3.5% decrease in the 2020 MPFS Final Rule, CMS proposed an increase to the code values for office/outpatient evaluation and management (E/M) codes and cuts to other codes to maintain budget neutrality of the MPFS. This change in code valuations was to become effective January 1, 2021 under the 2021 MPFS Final Rule, reimbursement for the codes applicable to physical/occupational therapy services wereprovided by our clinics, as compared to 2020. Since January 1, 2022, outpatient therapy services furnished in whole or part by a therapist assistant are paid at an amount equal to 85% of the payment amount otherwise applicable for the service.
For 2022, the MPFS Final Rule was to be reducedan approximately 3.75% reduction to Medicare payments for physical/occupational therapy services. This was due to the expiration of the additional funding to the conversion factor provided by approximately 9%Congress in the aggregate. The 9% reduction in payment was addressed by2021 under the Consolidated Appropriations Act, 2021. However, this reduction was addressed in the Protecting Medicare and American Farmers from Sequester Cuts Act (“2021 (“Act”) signed into law on December 27, 2020.10, 2021. Based on various provisions in the 2021 Act, we now estimate that the Medicare rate reduction for 2022 was approximately 0.75%.
In the full year2023 MPFS Proposed Rule, CMS proposed a 4.5% reduction in the Physician Fee Schedule conversion factor. However, this reduction was later addressed in the Consolidated Appropriations Act, 2023 (“2023 Act”). The provisions of 2021 will bethe 2023 Act increased the conversion factor by 2.5% for 2023 and by 1.25% for 2024, resulting in an overall reduction of approximately 2% in the 2023 Physician Fee Schedule conversion factor for 2023. In the 2024 MPFS Final Rule, CMS decreased the Physician Fee Schedule conversion factor by 3.39%, which is estimated to result in an approximately 3.5% reduction in aggregate.reimbursement for the codes applicable to physical/occupational therapy services provided by our clinics, as compared to 2023, unless these reductions are otherwise mitigated by further action of Congress.
The Budget Control Act of 2011 increased the federal debt ceiling in connection with deficit reductions over the next ten years and requires automatic reductions in federal spending by approximately $1.2 trillion. Payments to Medicare providers are subject to these automatic spending reductions, subject to a 2% cap. The Bipartisan Budget Act of 2018 extended the 2% reductions to Medicare payments through fiscal year 2027. The CARES Act suspended the 2% payment reduction to Medicare payments for dates of service from May 1, 2020, through December 31, 2020, and the Consolidated Appropriations Act, 2021 further suspended the 2% payment reduction through March 2021. In April 2021, additional legislation was enacted that waived the 2% payment reduction for the remainder of calendar 2021. The 2021 Act included a three-month extension of the 2% sequester relief applied to all Medicare payments through March 2022, followed by three months of 1% sequester relief through June 30, 2022. Sequester relief ended on June 30, 2022.
Beginning in 2021, payments to individual therapists (Physical/Occupational Therapist in Private Practice) paid under the fee schedule may be subject to adjustment based on performance in the Merit Based Incentive Payment System (“MIPS”), which measures performance based on certain quality metrics, resource use, and meaningful use of electronic health records. Therapists eligible to participate in MIPS include only those therapists who are enrolled with Medicare as private practice providers and does not include therapists in facility-based providers, such as our clinics enrolled as certified rehabilitation agencies. Less than 3% of our therapist providers currently participate in MIPS. Under the MIPS requirements, a provider'sprovider’s performance is assessed according to established performance standards each year and then is used to determine an adjustment factor that is applied to the professional'sprofessional’s payment for the corresponding payment year. The provider’s MIPS performance in 2019 will determine2021 determined the payment adjustment in 2021. Each year from 2019 through2023. For those therapist providers who actually participated in MIPS during 2020 and 2021, the resulting average payment adjustment in 2022 and 2023 was an increase of 1%. The 2024 professionalsadjustment for those therapist providers who receive a significant shareparticipated in MIPS during 2022 is expected to remain at an average increase of their revenues through an alternate payment model (“APM”), (such as accountable care organizations or bundled payment arrangements) that involves risk of financial losses and a quality measurement component will receive a 5% bonus in the corresponding payment year. The bonus payment for APM participation is intended to encourage participation and testing of new APMs and to promote the alignment of incentives across payors. The specifics of the MIPS and APM adjustments will be subject to future notice and comment rule-making.
Under the Middle ClassMiddle-Class Tax Relief and Job Creation Act of 2012 (‘‘MCTRA’’(“MCTRA”), since October 1, 2012, patients who met or exceeded $3,700 in therapy expenditures during a calendar year have been subject to a manual medical review to determine whether applicable payment criteria are satisfied. The $3,700 threshold is applied to Physical Therapy and Speech Language Pathology Services; a separate $3,700 threshold is applied to the Occupational Therapy. The Medicare Access and CHIP Reauthorization Act of 2015 (“MACRA”) directed CMS to modify the manual medical review process such that those reviews will no longer apply to all claims exceeding the $3,700 threshold and instead will be determined on a targeted basis based on a variety of factors that CMS considers appropriate appropriate.
The Bipartisan Budget Act of 2018 extendsextended the targeted medical review indefinitely but reduces the threshold to $3,000 through December 31, 2027. For 2028, the threshold amount will be increased by the percentage increase in the Medicare Economic Index (“MEI”) for 2028 and in subsequent years the threshold amount will increase based on the corresponding percentage increase in the MEI for such subsequent year.
CMS adopted a multiple procedure payment reduction (‘‘MPPR’’(“MPPR”) for therapy services in the final update to the MPFS for calendar year 2011. The MPPR applied to all outpatient therapy services paid under Medicare Part B — occupational therapy, physical therapy and speech-language pathology. Under the policy, the Medicare program pays 100% of the practice expense component of the Relative Value Unit (‘‘RVU’’(“RVU”) for the therapy procedure with the highest practice expense RVU, then reduces the payment for the practice expense component for the second and subsequent therapy procedures or units of service furnished during the same day for the same patient, regardless of whether those therapy services are furnished in separate sessions. SinceIn 2013, the practice expense component for the second and subsequent therapy service furnished during the same day for the same patient was reduced by 50%. In addition, the MCTRA directed CMS to implement a claims-based data collection program to gather additional data on patient function during the course of therapy in order to better understand patient conditions and outcomes. All practice settings that provide outpatient therapy services are required to include this data on the claim form. Since 2013, therapists have been required to report new codes and modifiers on the claim form that reflect a patient’s functional limitations and goals at initial evaluation, periodically throughout care, and at discharge. Reporting of these functional limitation codes and modifiers are required on the claim for payment.
8
Given the history of frequent revisions to the Medicare program and its reimbursement rates and rules, we may not continue to receive reimbursement rates from Medicare that sufficiently compensate us for our services or, in some instances, cover our operating costs. Limits on reimbursement rates or the scope of services being reimbursed could have a material adverse effect on our revenue, financial condition and results of operations. Additionally, any delay or default by the federal or state governments in making Medicare and/or Medicaid reimbursement payments could materially and, adversely, affect our business, financial condition and results of operations.
Statutes, regulations, and payment rules governing the delivery of therapy services to Medicare beneficiaries are complex and subject to interpretation. We believe that we are in compliance, in all material respects, with all applicable laws and regulations and are not aware of any pending or threatened investigations involving allegations of potential wrongdoing that would have a material effect on the our financial statements as of December 31, 2020.2023. Compliance with such laws and regulations can be subject to future government review and interpretation, as well as significant regulatory action including fines, penalties, and exclusion from the Medicare program. For year ended December
Marketing
We focus our marketing efforts primarily on physicians, including orthopedic surgeons, neurosurgeons, physiatrists, internal medicine physicians, podiatrists, occupational medicine physicians and general practitioners. In marketing to the physician community, we emphasize our commitment to quality patient care and regular communication with physicians regarding patient progress. We employ personnel to assist clinic directors in developing and implementing marketing plans for the physician community and to assist in establishing relationships with health maintenance organizations, preferred provider organizations, case managers and insurance companies.
Industrial Injury Prevention Services
Services provided in the IIP segment include onsite injury prevention and rehabilitation, performance optimization, post offer employment testing, functional capacity evaluations, and ergonomic assessments. The majority of these services are contracted with and paid for directly by employers, including a number of Fortune 500 companies. Other clients include large insurers and their contractors. Our Company performs these services through Industrial Sports Medicine Professionals, consisting of both physical therapists and ATCs.
In March 2017, we acquired a 55% interest in an initial IIP business. On April 30, 2018, we acquired a 65% interest in another business in the IIP sector and then we combined the two businesses. After the combination, we owned a 59.45% interest in the combined business, Briotix Health, Limited Partnership (“Briotix Health”). On April 11, 2019, we acquired 100% of a third provider of industrial injury prevention services. The acquired company specializes in delivering injury prevention and care, post offer employment testing, functional capacity evaluations and return-to-work services. It performs these services across a network in 45 states including onsite at eleven client locations. The business was then combined with Briotix Health increasing our ownership position in the partnership to approximately 76%. On September 30, 2021, we acquired a company that specializes in return-to-work and ergonomic services, among other offerings and contributed those assets to Briotix Health. On October 31, 2020, net patient revenues from Medicare were2023, we made another acquisition and purchased 100% of an IIP business and contributed its assets to Briotix Health. As part of the October 2023 Acquisition, we also acquired a 55% interest in an ergonomics software business. Subsequent to the abovementioned acquisitions and the purchases and sales of the redeemable non-controlling interests of the limited partners, our ownership in Briotix Health is approximately $101.6 million.92%.
On November 30, 2021, we acquired an approximate 70% interest in another leading provider of IIP services. The founders and owners retained the remaining interest.
Factors Influencing Demand for Physical Therapy Services
We believe that the following factors, among others, influence the growth of outpatient physical therapy services:
| • | Economic Benefits of Therapy Services – Purchasers and providers of healthcare services, such as insurance companies, health maintenance organizations, businesses, and industries, continuously seek cost savings for traditional healthcare services. We believe that our therapy services provide a cost-effective way to prevent short-term disabilities from becoming chronic conditions, to help avoid invasive procedures, to speed recovery from surgery and musculoskeletal injuries and eliminate or minimize the need for opioids. |
| • | Earlier Hospital Discharge – Changes in health insurance reimbursement, both public and private, have encouraged the earlier discharge of patients to reduce costs. We believe that early hospital discharge practices foster greater demand for outpatient physical therapy services. |
| • | Aging Population – In general, the elderly population has a greater incidence of disability compared to the population as a whole. As this segment of the population continues to grow, we believe that demand for rehabilitation services will expand. |
REGULATION AND HEALTHCARE REFORM
Numerous federal, state and local regulations regulate healthcare services and those who provide them. Some states into which we may expand have laws requiring facilities employing health professionals and providing health-related services to be licensed and, in some cases, to obtain a certificate of need (that is, demonstrating to a state regulatory authority the need for, and financial feasibility of, new facilities or the commencement of new healthcare services). Only one of the states in which we currently operate requires a certificate of need for the operation of ourbe owned by licensed physical therapy business functions.therapists. Our therapists and/or clinics, however, are required to be licensed, as determined by the state in which they provide services. Failure to obtain or maintain any required certificates, approvals or licenses could have a material adverse effect on our business, financial condition and results of operations.
Regulations Controlling Fraud and Abuse. Abuse
Various federal and state laws regulate financial relationships involving providers of healthcare services. These laws include Section 1128B(b) of the Social Security Act (42 U.S. C. § 1320a-7b[b]) (the “Fraud and Abuse Law”), under which civil and criminal penalties can be imposed upon persons who, among other things, offer, solicit, pay or receive remuneration in return for (i) the referral of patients for the rendering of any item or service for which payment may be made, in whole or in part, by a Federal health care program (including Medicare and Medicaid); or (ii) purchasing, leasing, ordering, or arranging for or recommending purchasing, leasing, ordering any good, facility, service, or item for which payment may be made, in whole or in part, by a Federal health care program (including Medicare and Medicaid). We believe that our business procedures and business arrangements are in compliance with these provisions. However, the provisions are broadly written and the full extent of their specific application to specific facts and arrangements to which we are a party is uncertain and difficult to predict. In addition, several states have enacted state laws similar to the Fraud and Abuse Law, which may be more restrictive than the federal Fraud and Abuse Law.
The Office of the Inspector General (“OIG”) of HHS has issued regulations describing compensation financial arrangements that fall within a “Safe Harbor” and, therefore, are not viewed as illegal remuneration under the Fraud and Abuse Law. Failure to fall within a Safe Harbor does not mean that the Fraud and Abuse Law has been violated; however, the OIG has indicated that failure to fall within a Safe Harbor may subject an arrangement to increased scrutiny under a “facts and circumstances” test.
The OIG also has issued special fraud alerts and special advisory bulletins to remind the provider community of the importance and application of certain aspects of the Fraud and Abuse Law. One of the OIG special fraud alerts related to the rental of space in physician offices by persons or entities to which the physicians refer patients. The OIG’s stated concern in these arrangements is that rental payments may be disguised kickbacks to the physician-landlords to induce referrals. We rent clinic space for some of our clinics from referring physicians and have taken the steps that we believe are necessary to ensure that all leases comply to the extent possible and applicable, with the space rental Safe Harbor to the Fraud and Abuse Law.
One of the OIG’s special advisory bulletins addressed certain complex contractual arrangements for the provision of items and services. This special advisory bulletin identified several characteristics commonly exhibited by suspect arrangements, the existence of one or more of which could indicate a prohibited arrangement to the OIG. Generally, the indicia of a suspect contractual joint venture as identified by the special advisory bulletin and an associated OIG advisory opinion include the following:
Due to the nature of our business operations, manysome of our management service arrangements exhibit one or more of these characteristics. However, we believe we have taken steps regarding the structure of such arrangements as necessary to sufficiently distinguish them from these suspect ventures, and to comply with the requirements of the Fraud and Abuse Law. However, if the OIG believes we have entered into a prohibited contractual joint venture, it could have an adverse effect on our business, financial condition and results of operations.
Although the business of managing physician-owned and hospital-owned physical therapy facilities is regulated by the Fraud and Abuse Law, the manner in which we contract with such facilities often falls outside the complete scope of available Safe Harbors. We believe our arrangements comply with the Fraud and Abuse Law, even though federal courts provide limited guidance as to the application of the Fraud and Abuse Law to these arrangements. If our management contracts are held to violate the Fraud and Abuse Law, it could have an adverse effect on our business, financial condition and results of operations.
Stark Law. Law
Provisions of the Omnibus Budget Reconciliation Act of 1993 (42 U.S.C. § 1395nn) (the “Stark Law”) prohibitreferrals by a physician of “designated health services” which are payable, in whole or in part, by Medicare or Medicaid, to an entity in which the physician or the physician’s immediate family member has an investment interest or other financial relationship, subject to several exceptions. Unlike the Fraud and Abuse Law, the Stark Law is a strict liability statute. Proof of intent to violate the Stark Law is not required. Physical therapy and occupational therapy services are among the “designated health services”. Further, the Stark Law has application to our management contracts with individual physicians and physician groups, as well as any other financial relationship between us and referring physicians, including medical advisor arrangements and any financial transaction resulting from a clinic acquisition. The Stark Law also prohibits billing for services rendered pursuant to a prohibited referral. Several states have enacted laws similar to the Stark Law. These state laws may cover all (not just Medicare and Medicaid) patients. As with the Fraud and Abuse Law, we consider the Stark Law in planning our clinics, establishing contractual and other arrangements with physicians, marketing and other activities, and believe that our operations are in compliance with the Stark Law. If we violate the Stark Law or any similar state laws, our financial results and operations could be adversely affected. Penalties for violations include denial of payment for the services, significant civil monetary penalties, and exclusion from the Medicare and Medicaid programs.
In an effort to further combat healthcare fraud and protect patient confidentially, Congress included several anti-fraudmeasures in the Health Insurance Portability and Accountability Act of 1996 (“HIPAA”). HIPAA created a source of funding for fraud control to coordinate federal, state and local healthcare law enforcement programs, conduct investigations, provide guidance to the healthcare industry concerning fraudulent healthcare practices, and establish a national data bank to receive and report final adverse actions. HIPAA also criminalized certain forms of health fraud against all public and private payors. Additionally, HIPAA mandates the adoption of standards regarding the exchange of healthcare information in an effort to ensure the privacy and electronic security of patient information and standards relating to the privacy of health information. Sanctions for failing to comply with HIPAA include criminal penalties and civil sanctions. In February of 2009, the American Recovery and Reinvestment Act of 2009 (“ARRA”) was signed into law. Title XIII of ARRA, the Health Information Technology for Economic and Clinical Health Act (“HITECH”), provided for substantial Medicare and Medicaid incentives for providers to adopt electronic health records (“EHRs”) and grants for the development of health information exchange (“HIE”). Recognizing that HIE and EHR systems will not be implemented unless the public can be assured that the privacy and security of patient information in such systems is protected, HITECH also significantly expanded the scope of the privacy and security requirements under HIPAA. Most notable are the mandatory breach notification requirements and a heightened enforcement scheme that includes increased penalties, and which now apply to business associates as well as to covered entities. In addition to HIPAA, a number of states have adopted laws and/or regulations applicable in the use and disclosure of individually identifiable health information that can be more stringent than comparable provisions under HIPAA.
We believe that our operations comply with applicable standards for privacy and security of protected healthcare information. We cannot predict what negative effect, if any, HIPAA/HITECH or any applicable state law or regulation will have on our business.
Other Regulatory Factors. Factors
Political, economic and regulatory influences are fundamentally changing the healthcare industry inthe United States. Congress, state legislatures and the private sector continue to review and assess alternative healthcare delivery and payment systems. Potential alternative approaches could include mandated basic healthcare benefits, controls on healthcare spending through limitations on the growth of private health insurance premiums and Medicare and Medicaid spending, the creation of large insurance purchasing groups, and price controls. Legislative debate is expected to continue in the future and market forces are expected to demand only modest increases or reduced costs. For instance, managed care entities are demanding lower reimbursement rates from healthcare providers and, in some cases, are requiring or encouraging providers to accept capitated payments that may not allow providers to cover their full costs or realize traditional levels of profitability. We cannot reasonably predict what impact the adoption of federal or state healthcare reform measures or future private sector reform may have on our business.
COMPETITION
The healthcare industry, including the physical therapy business and the industrial injury prevention services business, areis highly competitive. The physical therapy business as well as the industrial injury prevention services business are both highly fragmented with no company having a significant market share nationally. We believe that we are one of the largest national outpatient physical therapy services providers.
Competitive factors affecting our business include quality of care, cost, treatment outcomes, convenience of location, and relationships with, and ability to meet the needs of, referral and payor sources. Our clinics compete, directly or indirectly, with many types of healthcare providers including the physical therapy departments of hospitals, private therapy clinics, physician-owned therapy clinics, and chiropractors. We may face more intense competition if consolidation of the therapy industry continues.
We believe that our partnership strategy of providing key therapists in a community with an opportunity to participate in ownership or clinic profitability provides us with a competitive advantageadvantage. Our clinics are partly owned by therapists who have developed exceptional reputations in their local communities and these therapist-owners oversee their respective clinic operations helping to ensure the commitment of local management to the success of the clinic.
ENFORCEMENT ENVIRONMENT
In recent years, federal and state governments have launched several initiatives aimed at uncovering behavior that violates the federal civil and criminal laws regarding false claims and fraudulent billing and coding practices. Such laws require providers to adhere to complex reimbursement requirements regarding proper billing and coding in order to be compensated for their services by government payors. Our compliance program requires adherence to applicable law and promotes reimbursement education and training; however, a determination that our clinics’ billing and coding practices are false or fraudulent could have a material adverse effect on us.
As a result of our participation in the Medicare and Medicaid programs, we are subject to various governmental inspections, reviews, audits and investigations to verify our compliance with these programs and applicable laws and regulations. In addition,Federal, state and private payors regularly conduct audits of billing and coding practices at our Corporate Integrity Agreement, which expired in February 2021, required annual audits to be performed by an independent review organization on a small sample of our clinics, the results of which were reported to the federal government. See “-Compliance Program – Corporate Integrity Agreement” for more on the Corporate Integrity Agreement (“CIA”). Managed care payors may also reserve the right to conduct audits.clinics. An adverse inspection, review, audit or investigation could result in:in refunding amounts we have been paid; fines penalties and/or revocation of billing privileges for the affected clinics; the imposition of a new Corporate Integrity Agreement;corporate integrity agreement; exclusion from participation in the Medicare or Medicaid programs or one or more managed care payor network;networks; or damage to our reputation.
We and our clinics are subject to federal and state laws prohibiting entities and individuals from knowingly and willfully making claims to Medicare, Medicaid and other governmental programs and third partythird-party payors that contain false or fraudulent information. The federal False Claims Act encourages private individuals to file suits on behalf of the government against healthcare providers such as us. As such suits are generally filed under seal with a court to allow the government adequate time to investigate and determine whether it will intervene in the action, the implicated healthcare providers often are unaware of the suit until the government has made its determination and the seal is lifted. Violations or alleged violations of such laws, and any related lawsuits, could result in (i) exclusion from participation in Medicare, Medicaid and other federal healthcare programs, or (ii) significant financial or criminal sanctions, resulting in the possibility of substantial financial penalties for small billing errors that are replicated in a large number of claims, as each individual claim could be deemed a separate violation. In addition, many states also have enacted similar statutes, which may include criminal penalties, substantial fines, and treble damages.
COMPLIANCE PROGRAM
Our Compliance Program. Program
Our ongoing success depends upon our reputation for quality service and ethical business practices.We operate in a highly regulated environment with many federal, state and local laws and regulations. We take a proactive interest in understanding and complying with the laws and regulations that apply to our business.
Our Board of Directors (the “Board”) has adopted a Code of Business Conduct and Ethics and a set of Corporate Governance Guidelines to clarify the ethical standards under which the Board and management carry out their duties. In addition, the Board has created a Compliance Committee of the Board (“Compliance Committee”) whose purpose is to assist the Board in discharging their oversight responsibilities with respect to compliance with federal and state laws and regulations relating to healthcare.
We have issued a Compliance Manual and created compliance training materials, hand-outs and an on-line testing program. These tools were prepared to ensure that every employee of our Company and subsidiaries has a clear understanding of our mutual commitment to high standards of professionalism, honesty, fairness and compliance with the law in conducting business. These standards are administered by our Chief Compliance Officer (“CCO”), who has the responsibility for the day-to-day oversight, administration and development of our compliance program. The CCO, internal and external counsel, management and the Compliance Committee review our policies and procedures for our compliance program from time to time in an effort to improve operations and to ensure compliance with requirements of standards, laws and regulations and to reflect the on-going compliance focus areas which have been identified by management, counsel or the Compliance Committee. We also have established systems for reporting potential violations, educating our employees, monitoring and auditing compliance and handling enforcement and discipline.
Our Compliance Committee, appointed by the Board, consists of four independent directors. The Compliance Committee has general oversight of our Company’s compliance with the legal and regulatory requirements regarding healthcare operations.operations, as well as cybersecurity. The Compliance Committee relies on the expertise and knowledge of management, the CCO and other compliance and legal personnel. The CCO regularly communicates with the Chairman of the Compliance Committee. The Compliance Committee meets at least four times a year or more frequently as necessary to carry out its responsibilities and reports regularly to the Board regarding its actions and recommendations.
We also have an Internal Compliance Committee, which is comprised of Company leaders in the areas of operations, clinical services, finance, human resources, legal, information technology and credentialing. The Internal Compliance Committee has the responsibility for evaluating and assessing Company areas of risk relating to compliance with federal and state healthcare laws, and generally to assist the CCO. The Internal Compliance Committee meets at least four times a year or more frequently as necessary to carry out its responsibilities. In addition, management has appointed a team to address our Company’s compliance with HIPAA. The HIPAA team consists of a security officer and employees from our legal, information systems, finance, operations, compliance, business services and human resources departments. The team prepares assessments and makes recommendations regarding operational changes and/or new systems, if needed, to comply with HIPAA.
Each clinic certified as a Medicare Rehabilitation Agency has a formally appointed governing body composed of a member of our management and the director/administrator of the clinic. The governing body retains legal responsibility for the overall conduct of the clinic. The members confer regularly and discuss, among other issues, clinic compliance with applicable laws and regulations. In addition, there are Professional Advisory Committees which serve as Infection Control Committees. These committees meet in the facilities and function as advisors.
We have in place a Risk Management Committee consisting of, among others, the CCO, the Vice President of Human Resources, and other legal, compliance and operations personnel. This committee reviews and monitors all employee and patient incident reports and provides clinic personnel with actions to be taken in response to the reports.
Reporting Violations. Violations
In order to facilitate our employees’ ability to report inconfidence, anonymously and without retaliationany perceived improper work-related activities, accounting irregularities and other violations of our compliance program, we have set up an independent national compliance hotline. The compliance hotline is available to receive confidential reports of wrongdoing Monday through Friday (excluding holidays), 24 hours a day. The compliance hotline is staffed by experienced third party professionals trained to utilize utmost care and discretion in handling sensitive issues and confidential information. The information received is documented and forwarded timely to the CCO, who, together with the Compliance Committee, has the power and resources to investigate and resolve matters of improper conduct.
Educating Our Employees. Employees
We utilize numerous methods to train our employees in compliance related issues, including an onlinelearning management system. All employees complete a comprehensive training program comprised of numerous modules relating to our business and proper practices when newly hired and annually thereafter. The directors/administrators also provide periodic “refresher” training for existing employees and one-on-one comprehensive training with new hires. The corporate compliance group responds to questions from clinic personnel and conducts frequent teleconference meetings, webinars and training sessions on a variety of compliance related topics.
When a clinic opens, we provide a package of compliance materials containing manuals and detailed instructions for meeting Medicare Conditions of Participation Standards and other compliance requirements. During follow up training with the director/administrator of the clinic, compliance department staff explain various details regarding requirements and compliance standards. Compliance staff will remain in contact with the director/administrator while the clinic is implementing compliance standards and will provide any assistance required. All new office managers receive training (including Medicare, regulatory and corporate compliance, insurance billing, charge entry and transaction posting and coding, daily, weekly and monthly accounting reports) from the training staff at the corporate office. The corporate compliance group will assist in continued compliance, including guidance to the clinic staff with regard to Medicare certifications, state survey requirements and responses to any inquiries from regulatory agencies.
Monitoring and Auditing Clinic Operational Compliance. Compliance
We have in place audit programs and other procedures to monitor andaudit clinic operational compliance with applicable policies and procedures. We employ internal auditors who, as part of their job responsibilities, conduct periodic audits of each clinic. Most clinics are audited at least once every 24 months and additional focused audits are performed as deemed necessary. During these audits, particular attention is given to compliance with Medicare and internal policies, Federal and state laws and regulations, third party payor requirements, and patient chart documentation, billing, reporting, record keeping, collections and contract procedures. The audits are conducted on site or remotely and include interviews with the employees involved in management, operations, billing and accounts receivable.
Formal audit reports are prepared and reviewed with corporate management and the Compliance Committee. Each clinic director/administrator receives a letter instructing them of any corrective measures required. Each clinic director/administrator then works with the compliance team and operations to ensure such corrective measures are achieved.
Handling Enforcement and Discipline. Discipline
It is our policy that any employee who fails to comply with compliance programrequirements or who negligently or deliberately fails to comply with known laws or regulations specifically addressed in our compliance program should be subject to disciplinary action up to and including discharge from employment. The Compliance Committee, compliance staff, human resources staff and management investigate violations of our compliance program and impose disciplinary action as considered appropriate.
EMPLOYEES
It is crucial that we continue to attract and retain top talent. To attract and retain talented employees, we strive to make our corporate office and all of our practices and businesses a diverse and healthy workplace, with opportunities for our employees to receive continuing education, skill development, encouragement to grow and develop their career, all supported by competitive compensation, incentives, and benefits. Our clinical professionals are all licensed and a vast majority have advanced degrees. Our operational leadership teams have long-standing relationships with local and regional universities, professional affiliations, and other applicable sources that provide our practices with a talent pipeline.
We provide competitive compensation and benefits programs to help meet our employees'employees’ needs in the practices and communities in which they serve. These programs (which can vary by practice and employment classification) include competitive base salaries, incentive compensation plans, a 401(k) plan, healthcare and insurance benefits, health savings and flexible spending accounts, paid time off, family leave, education assistance, mental health, and other employee assistance benefits.
We invest resources to develop the talent needed to support our business strategy. Resources include a multitude of training and development programs delivered internally and externally, online and instructor-led, and on-the-job learning formats.
We expect to continue adding personnel in the future as we focus on potential acquisition targets and organic growth opportunities.
AVAILABLE INFORMATION
Our annual reports on Form 10-K, quarterly reports on Form 10-Q, current reports on Form 8-K and any amendments to those reports filed or furnished pursuant to Section 13(a) or 15(d) of the Exchange Act are made available free of charge on our internet website at www.usph.comas soon as reasonably practicable after we electronically file such material with, or furnish it to, the SEC. The SEC maintains a website that contains reports, proxy and information statements, and other information regarding our filings at http://www.sec.gov.
| ITEM 1A. | RISK |
Our business, operations and financial condition are subject to various risks. Some of these risks are described below, and readers of this Annual Report on Form 10-K should take such risks into account in evaluating our Company or making any decision to invest in us. This section does not describe all risks applicable to our Company, our industry or our business, and it is intended only as a summary of material factors affecting our business.
Decreases in Medicare reimbursement rates and payment reductions applied to the second and subsequent therapy servicesrate may adversely affect our financial results.
The Medicare program reimburses outpatient rehabilitation providers based on the Medicare Physician Fee Schedule (‘‘MPFS’’(“MPFS”). For services provided in 2018, a 0.5% increase was applied2024, we expect our reimbursement rates under the MPFS to the fee schedule payment rates; for services provided in 2019, a 0.25% increase was applied to the fee schedule payment rates before applying the mandatory budget neutrality adjustment. For services provided in 2020 through 2025, a 0.0% percent update is expected to be applied each year to the fee schedule payment rates, before applying the mandatory budget neutrality adjustment. However, in the 2020 MPFS Final Rule, CMS proposed an increase to the code values for office/outpatient evaluation and management (E/M) codes and cuts to other codes to maintain budget neutrality of the MPFS. Under the 2021 MPFS Final Rule, reimbursement for the codes applicable to physical/occupational therapy services were to be reduced by approximately 9% in the aggregate. The 9% reduction in payment was addressed by the Consolidated Appropriations Act, 2021 (“Act”) signed into law on December 27, 2020. Based on various provisions in the Act, we now estimate that the Medicare rate reduction for the full year of 2021 will be approximately 3.5% in aggregate.less than the applicable reimbursement rates during 2023.
Statutes, regulations, and payment rules governing the delivery of therapy services to Medicare beneficiaries are complex and subject to interpretation. We believeThe Company believes that we arethe Company is in compliance, in all material respects, with all applicable laws and regulations and are not aware of any pending or threatened investigations involving allegations of potential wrongdoing that would have a material effect on the ourCompany’s financial statements as of December 31, 2020.2023. Compliance with such laws and regulations can be subject to future government review and interpretation, as well as significant regulatory action including fines, penalties, and exclusion from the Medicare program. For the year ended December 31, 2020,2023 and 2022, respectively, net patient revenues from Medicare were approximately $101.6 million.$170.7 million and $154.9 million, respectively.
Given the history of frequent revisions to the Medicare program and its reimbursement rates and rules, we may not continue to receive reimbursement rates from Medicare that sufficiently compensate us for our services or, in some instances, cover our operating costs. Limits on reimbursement rates or the scope of services being reimbursed could have a material adverse effect on our revenue, financial condition, and results of operations. Additionally, any delay or default by the federal or state governments in making Medicare and/or Medicaid reimbursement payments could materially and, adversely, affect our business, financial condition and results of operations.
Revenue we receive from Medicare and Medicaid is subject to potential retroactive reduction.
Payments we receive from Medicare and Medicaid can be retroactively adjusted after examination during the claims settlement process or as a result of post-payment audits. Payors may disallow our requests for reimbursement, or recoup amounts previously reimbursed, based on determinations by the payors or their third-party audit contractors that certain costs are not reimbursable because either adequate or additional documentation was not provided or because certain services were not covered or deemed to not be medically necessary. Significant adjustments, recoupments or repayments of our Medicare or Medicaid revenue, and the costs associated with complying with investigative audits by regulatory and governmental authorities, could adversely affect our financial condition and results of operations.
Additionally, from time to time we become aware, either based on information provided by third parties and/or the results of internal audits, of payments from payor sources that were either wholly or partially in excess of the amount that we should have been paid for the service provided. Overpayments may result from a variety of factors, including insufficient documentation supporting the services rendered or medical necessity of the services or other failures to document the satisfaction of the necessary conditions of payment. We are required by law in most instances to refund the full amount of the overpayment after becoming aware of it, and failure to do so within requisite time limits imposed by the law could lead to significant fines and penalties being imposed on us. Furthermore, our initial billing of and payments for services that are unsupported by the requisite documentation and satisfaction of any other conditions of payment, regardless of our awareness of the failure at the time of the billing or payment, could expose us to significant fines and penalties. We, and/or certain of our operating companies, could also be subject to exclusion from participation in the Medicare or Medicaid programs in some circumstances as well, in addition to any monetary or other fines, penalties or sanctions that we may incur under applicable federal and/or state law. Our repayment of any such amounts, as well as any fines, penalties or other sanctions that we may incur, could be significant and could have a material and adverse effect on our results of operations and financial condition.
From time to time, we are also involved in various external governmental investigations, audits and reviews. Reviews, audits and investigations of this sort can lead to government actions, which can result in the assessment of damages, civil or criminal fines or penalties, or other sanctions, including restrictions or changes in the way we conduct business, loss of licensure or exclusion from participation in government programs. Failure to comply with applicable laws, regulations and rules could have a material and adverse effect on our results of operations and financial condition. Furthermore, becoming subject to these governmental investigations, audits and reviews can also require us to incur significant legal and document production expenses as we cooperate with the government authorities, regardless of whether the particular investigation, audit or review leads to the identification of underlying issues.
We depend upon reimbursement by third-party payors.
Substantially all of our revenues are derived from private and governmental third-party payors. In 2023, approximately 63.4% of our revenues were derived collectively from managed care plans, commercial health insurers, workers’ compensation payors, and other private pay revenue sources while approximately 36.6% of our revenues were derived from Medicare and Medicaid. Initiatives undertaken by industry and government to contain healthcare costs affect the profitability of our clinics. These payors attempt to control healthcare costs by contracting with healthcare providers to obtain services on a discounted basis. We believe that this trend will continue and may limit reimbursement for healthcare services. If insurers or managed care companies from whom we receive substantial payments were to reduce the amounts they pay for services, our profit margins may decline, or we may lose patients if we choose not to renew our contracts with these insurers at lower rates. In addition, in certain geographical areas, our clinics must be approved as providers by key health maintenance organizations and preferred provider plans. Failure to obtain or maintain these approvals would adversely affect our financial results.
In recent years, through legislative and regulatory actions, the federal government has made substantial changes to various payment systems under the Medicare program. See “Business—Sources of Revenue – Physical Therapy Services” in Item 1 for more information including changes to Medicare reimbursement. Additional reforms or other changes to these payment systems may be proposed or adopted, either by the U.S. Congress or by CMS, including bundled payments, outcomes-based payment methodologies and a shift away from traditional fee-for-service reimbursement. If revised regulations are adopted, the availability, methods and rates of Medicare reimbursements for services of the type furnished at our facilities could change. Some of these changes and proposed changes could adversely affect our business strategy, operations and financial results.
Our facilities are subject to extensive federal and state laws and regulations relating to the privacy of individually identifiable patient information.
HIPAA required the HHS to adopt standards to protect the privacy and security of individually identifiable health-related information. The department released final regulations containing privacy standards in 2000 and published revisions to the final regulations in 2002. The privacy regulations extensively regulate the use and disclosure of individually identifiable health-related information. The regulations also provide patients with significant rights related to understanding and controlling how their health information is used or disclosed. The security regulations require healthcare providers to implement administrative, physical and technical practices to protect the security of individually identifiable health information that is maintained or transmitted electronically. HITECH, which was signed into law in 2009, enhanced the privacy, security and enforcement provisions of HIPAA by, among other things establishing security breach notification requirements, allowing enforcement of HIPAA by state attorneys general, and increasing penalties for HIPAA violations. Violations of HIPAA or HITECH could result in civil or criminal penalties.
In addition to HIPAA, there are numerous federal and state laws and regulations addressing patient and consumer privacy concerns, including unauthorized access or theft of personal information. State statutes and regulations vary from state to state. Lawsuits, including class actions and action by state attorneys general, directed at companies that have experienced a privacy or security breach also can occur.
We have established policies and procedures in an effort to ensure compliance with these privacy related requirements. However, if there is a breach, we may be subject to various penalties and damages and may be required to incur costs to mitigate the impact of the breach on affected individuals.
We are subject to risks associated with public health crises and epidemics/pandemics, such as the novel strain of coronavirus (“COVID-19”).
Our operations expose us to risks associated with public health crises and epidemics/pandemics, such as COVID-19 that has spread globally. A public health crisis may lead to disruption and volatility in the global capital markets, which increases the cost of, and adversely impacts access to, capital and increases economic uncertainty. A future public health crisis could have an adverse impact on our operations and supply chains, including a temporary loss of physical therapists and other employees who are infected or quarantined for a period of time, an increase in cancellations of physical therapy patient appointments and a decline in the scheduling of new or additional patient appointments.
We expect the federal and state governments to continue their efforts to contain growth in Medicaid expenditures, which could adversely affect our revenue and profitability.
Medicaid spending has increased rapidly in recent years, becoming a significant component of state budgets. This, combined with slower state revenue growth, has led both the federal government and many states to institute measures aimed at controlling the growth of Medicaid spending, and in some instances reducing aggregate Medicaid spending. We expect these state and federal efforts to continue for the foreseeable future. Furthermore, not all of the states in which we operate, most notably Texas, have elected to expand Medicaid as part of federal healthcare reform legislation. There can be no assurance that the program, on the current terms or otherwise, will continue for any particular period of time beyond the foreseeable future. If Medicaid reimbursement rates are reduced or fail to increase as quickly as our costs, or if there are changes in the rules governing the Medicaid program that are disadvantageous to our businesses, our business and results of operations could be materially and adversely affected.
As a result of increased post-payment reviews of claims we submit to Medicare for our services, we may incur additional costs and may be required to repay amounts already paid to us.
We are subject to regular post-payment inquiries, investigations, and audits of the claims we submit to Medicare for payment for our services. These post-payment reviews have increased as a result of government cost-containment initiatives. These additional post-payment reviews may require us to incur additional costs to respond to requests for records and to pursue the reversal of payment denials, and ultimately may require us to refund amounts paid to us by Medicare that are determined to have been overpaid.
For a further description of this and other laws and regulations involving governmental reimbursements, see “Business—Sources of Revenue” and “—Regulation and Healthcare Reform” in Item 1.
An economic downturn, state budget pressures, sustained unemployment and continued deficit spending by the federal government may result in a reduction in reimbursement and covered services.
An economic downturn, including the consequences of a pandemic, such as COVID-19, could have a detrimental effect on our revenues. Historically, state budget pressures have translated into reductions in state spending. Given that Medicaid outlays are a significant component of state budgets, we can expect continuing cost containment pressures on Medicaid outlays for our services in the states in which we operate. In addition, an economic downturn, coupled with sustained unemployment, may also impact the number of enrollees in managed care programs as well as the profitability of managed care companies, which could result in reduced reimbursement rates.
The existing federal deficit, as well as deficit spending by federal and state governments as the result of adverse developments in the economy or other reasons, can lead to continuing pressure to reduce governmental expenditures for other purposes, including government-funded programs in which we participate, such as Medicare and Medicaid. Such actions in turn may adversely affect our results of operations.
We depend upon reimbursement by third-party payors.may be required to comply with a put right in one of our acquisition agreements, related to a potential future purchase of a majority interest in a separate company.
Our debt and preferred provider plans. Failure to obtain or maintain these approvals wouldfinancial obligations could adversely affect our financial condition, our ability to obtain future financing, and our ability to operate our business.
We have outstanding debt obligations that could adversely affect our financial condition and limit our ability to successfully implement our business strategy. Furthermore, from time to time, we may need additional financing to support our business and pursue our business strategy, including strategic acquisitions. Our ability to obtain additional financing, if and when required, will depend on investor demand, our operating performance, the condition of the capital markets, and other factors. We cannot provide assurances that additional financing will be available to us on favorable terms when required, or at all.
Our loan agreements contain certain restrictions and requirements that among other things:
require us to maintain a quarterly fixed charge coverage ratio and minimum working capital ratio;
limit our ability to obtain additional financing in the future for working capital, capital expenditures and acquisitions, to fund growth or for general corporate purposes;
limit our future ability to refinance our indebtedness on terms acceptable to us or at all;
limit our flexibility in planning for or reacting to changes in our business and market conditions or in funding our strategic growth plan; and
impose on us financial and operational restrictions.
Our ability to meet our debt service obligations will depend on our future performance, which will be affected by the other risk factors described herein. If we do not generate enough cash flow to pay our debt service obligations, we may be required to refinance all or part of our existing debt, sell our assets, borrow more money or raise equity. There is no guarantee that we will be able to take any of these actions on a timely basis, on terms satisfactory to us, or at all.
If we fail to satisfy our debt service obligations or the other restrictions and requirements in our loan agreements, we could be in default. Unless cured or waived, a default would permit lenders to accelerate the maturity of the debt under the credit agreement and to foreclose upon the collateral securing the debt.
Our outstanding loans bear interest at variable rates. In response to the variable rates, we entered into an interest rate swap agreement. We are exposed to certain market risks during the ordinary course of business due to adverse changes in interest rates. The exposure to interest rate risk primarily results from our variable-rate borrowing. Fluctuations in interest rates can be volatile and the Company’s risk management activities do not eliminate these risks. In May 2022, we entered into an interest rate swap agreement to manage these risks. While intended to reduce the effects of fluctuations in these prices and rates, these transactions may limit our potential gains or expose us to losses. If our counterparties to such transactions or the sponsors fail to honor their obligations due to financial distress, we would be exposed to potential losses or the inability to recover anticipated gains from these transactions.
Some of our acquisition agreements contain contingent consideration, the value of which may impact future financial results.
Some of our acquisition agreements include contingent earn-out consideration, the fair value of which is estimated as of the acquisition date based on the present value of the expected contingent payments as determined using weighted probabilities of possible future payments. These fair value estimates contain unobservable inputs and estimates that could materially differ from the actual future results and we cannot predict the ultimate result. The fair value of the contingent earn-out consideration could increase or decrease, as applicable. Changes in the fair value of contingent earn-outs will be reflected in our results of operations in the period in which they are recognized, the amount of which may be material and could cause volatility in our operating results.
Impact on the business and cash reserves resulting from retirement or resignation of key partners and resulting purchase of their non-controlling interests (minority interests).
As described in Note 6 to our financial statements included in Item 8, the redeemable non-controlling interests in our partnerships are held by our partners. Upon the occurrence of certain events, such as retirement or other termination of employment, partners from acquired partnerships may have the right to exercise a “put” to cause us to purchase their redeemable non-controlling interests. Depending on the amount and timing of the exercise of any “put” rights, the funds required could have an adverse impact on our capital structure.
Healthcare reform legislation may affect our business.
In recent years, throughmany legislative proposals have been introduced or proposed in Congress and regulatory actions,in some state legislatures that would affect major changes in the healthcare system, either nationally or at the state level. At the federal governmentlevel, Congress has made substantial changescontinued to various payment systemspropose or consider healthcare budgets that substantially reduce payments under the Medicare program.programs. See “Business—SourcesOur Operating Segments – Physical Therapy Operations-Sources of Revenue” in Item 1 for more informationinformation. The ultimate content, timing or effect of any healthcare reform legislation and the impact of potential legislation on us is uncertain and difficult, if not impossible, to predict. That impact may be material to our business, financial condition or results of operations.
Our operations are subject to extensive regulation.
The healthcare industry is subject to extensive federal, state and local laws and regulations relating to:
facility and professional licensure/permits, including certificates of need;
conduct of operations, including financial relationships among healthcare providers, Medicare fraud and abuse, and physician self-referral;
addition of facilities and services; and
coding, billing and payment for services.
In recent years, there have been heightened coordinated civil and criminal enforcement efforts by both federal and state government agencies relating to the healthcare industry. We believe we are in substantial compliance with all laws, but differing interpretations or enforcement of these laws and regulations could subject our current practices to allegations of impropriety or illegality or could require us to make changes in our methods of operations, facilities, equipment, personnel, services and capital expenditure programs and increase our operating expenses. If we fail to comply with these extensive laws and government regulations, we could become ineligible to receive government program reimbursement, suffer civil or criminal penalties or be required to make significant changes to Medicare reimbursement. Additional reformsour operations. In addition, we could be forced to expend considerable resources responding to an investigation or other changesenforcement action under these laws or regulations. For a more complete description of certain of these laws and regulations, see “Business—Regulation and Healthcare Reform” and “Business—Compliance Program” in Item 1.
Both federal and state regulatory agencies inspect, survey, and audit our facilities to review our compliance with these laws and regulations. While our facilities intend to comply with the existing licensing, Medicare certification requirements and accreditation standards, there can be no assurance that these regulatory authorities will determine that all applicable requirements are fully met at any given time. A determination by any of these regulatory authorities that a facility is not in compliance with these requirements could lead to the imposition of requirements that the facility takes corrective action, assessment of fines and penalties, or loss of licensure or Medicare certification of accreditation. These consequences could have an adverse effect on us.
Our operations are subject to investigations, legal actions and proceedings that could result in an adverse impact on our business and financial position.
Healthcare providers are subject to investigations, legal actions and proceedings, as well as lawsuits under the qui tam provisions of the federal False Claims Act, based on claims that the provider failed to comply with applicable laws and regulations that govern coding and the submission of claims for services provided to Medicare patients, among other things. These matters can involve significant costs, monetary damages and penalties. We have been subject to these payment systems may be proposed or adopted, either byproceedings in the U.S. Congress or by CMS, including bundled payments, outcomes-based payment methodologiespast, and a shift away from traditional fee-for-service reimbursement. If revised regulations are adopted, the availability, methods and rates of Medicare reimbursements for services of the type furnished atfuture proceedings could result in an adverse impact on our facilities could change. Some of these changes and proposed changes could adversely affect our business strategy, operations and financial results.
We face inspections, reviews, audits and investigations under federal and state government programs and contracts. These audits could have adverse findings that may negatively affect our business.
As a result of our participation in the Medicare and Medicaid programs, we are subject to various governmental inspections, reviews, audits and investigations to verify our compliance with these programs and applicable laws and regulations. Managed care payors may also reserve the right to conduct audits. An adverse inspection, review, audit or investigation could result in:
refunding amounts we have been paid pursuant to the Medicare or Medicaid programs or from managed care payors;
state or federal agencies imposing fines, penalties and other sanctions on us;
temporary suspension of payment for new patients to the facility or agency;
decertification or exclusion from participation in the Medicare or Medicaid programs or one or more managed care payor networks;
damage to our reputation;
the revocation of a facility’s or agency’s license; and
loss of certain rights under, or termination of, our contracts with managed care payors.
If adverse inspections, reviews, audits or investigations occur and any of the results noted above occur, it could have a material adverse effect on our business and operating results.
20
In conducting our business, we are required to comply with applicable laws regarding fee-splitting and the corporate practice of medicine.
Some states prohibit the “corporate practice of therapy” that restricts business corporations from providing physical therapy services through the direct employment of therapist physicians or from exercising control over medical decisions by therapists. The laws relating to corporate practice vary from state to state and are not fully developed in each state in which we have facilities. Typically, however, professional corporations owned and controlled by licensed professionals are exempt from corporate practice restrictions and may employ therapists to furnish professional services. Those professional corporations may be managed by business corporations, such as the Company.
Some states also prohibit entities from engaging in certain financial arrangements, such as fee-splitting, with physicians or therapists. The laws relating to fee-splitting also vary from state to state and are not fully developed. Generally, these laws restrict business arrangements that involve a physician or therapist sharing medical fees with a referral source, but in some states, these laws have been interpreted to extend to management agreements between physicians or therapists and business entities under some circumstances.
We believe that our current and planned activities do not constitute fee-splitting or the unlawful corporate practice of medicine as contemplated by these state laws. However, there can be no assurance that future interpretations of such laws will not require structural and organizational modification of our existing relationships with the practices. If a court or regulatory body determines that we have violated these laws or if new laws are introduced that would render our arrangements illegal, we could be subject to civil or criminal penalties, our contracts could be found legally invalid and unenforceable (in whole or in part), or we could be required to restructure our contractual arrangements with our affiliated physicians and other licensed providers.
We may be adversely affected by a security breach, such as a cyber-attack, which may cause a violation of HIPAA or HITECH and subject us to potential legal and reputational harm.
In the normal course of business, our information technology systems hold sensitive patient information including patient demographic data and other protected health information, which is subject to HIPAA and HITECH. We also contract with third-party vendors to maintain and store our patient’spatients’ individually identifiable health information. Numerous state and federal laws and regulations address privacy and information security concerns resulting from our access to our patient’s and employee’s personal information.
Our information technology systems and those of our vendors that process, maintain, and transmit such data are subject to computer viruses, cyber-attacks, or breaches. We adhere to policies and procedures designed to ensure compliance with HIPAA and other privacy and information security laws and require our third-party vendors to do so as well. If, however, we or our third-party vendors experience a breach, loss, or other compromise of unsecured protected health information or other personal information, such an event could result in significant civil and criminal penalties, lawsuits, reputational harm, and increased costs to us, any of which could have a material adverse effect on our financial condition and results of operations.
Furthermore, while our information technology systems, and those of our third-party vendors, are maintained with safeguards protecting against cyber-attacks. A cyber-attack that bypasses our information technology security systems, or those of our third-party vendors, could result in a material adverse effect on our business, financial condition, results of operations, or cash flows. In addition, our future results could be adversely affected due to the theft, destruction, loss, misappropriation, or release of protected health information, other confidential data or proprietary business information, operational or business delays resulting from the disruption of information technology systems and subsequent mitigation activities, or regulatory action taken as a result of such incident. We provide our employees with training and regular reminders on important measures they can take to prevent breaches. We routinely identify attempts to gain unauthorized access to our systems. However, given the rapidly evolving nature and proliferation of cyber threats, there can be no assurance our training and network security measures or other controls will detect, prevent, or remediate security or data breaches in a timely manner or otherwise prevent unauthorized access to, damage to, or interruption of our systems and operations. Accordingly, we may be vulnerable to losses associated with the improper functioning, security breach, or unavailability of our information systems as well as any systems used in acquired operations.
We depend upon the cultivation and maintenance of relationships with the physicians in our markets.
Our success is dependent upon referrals from physicians in the communities our clinics serve and our ability to maintain good relations with these physicians and other referral sources. Physicians referring patients to our clinics are free to refer their patients to other therapy providers or to their own physician owned therapy practice. If we are unable to successfully cultivate and maintain strong relationships with physicians and other referral sources, our business may decrease, and our net operating revenues may decline.
Our business depends upon hiring, training, and retaining qualified employees.
Our workforce costs represent our largest operating expense, and our ability to meet our labor needs while controlling labor costs is subject to numerous external factors, including market pressures with respect to prevailing wage rates and unemployment levels. We compete with rehabilitation companies and other businesses for many of our clinical and non-clinical employees, and turnover in these positions can lead to increased training and retention costs, particularly in a competitive labor market. We cannot be assured that we can continue to hire, train and retain qualified employees at current wage rates since we operate in a competitive labor market, and there are currently significant inflationary and other pressures on wages. If we are unable to hire, properly train and retain qualified employees, we could experience higher employment costs and reduced revenues, which could adversely affect our earnings.
We depend upon our ability to recruit and retain experienced physical therapists.
Our revenue generation is dependent upon referrals from physicians in the communities our clinics serve, and our ability to maintain good relations with these physicians. Our therapists are the front line for generating these referrals and we are dependent on their talents and skills to successfully cultivate and maintain strong relationships with these physicians. If we cannot recruit and retain our base of experienced and clinically skilled therapists, our business may decrease, and our net operating revenues may decline. Periodically, we have clinics in isolated communities that are temporarily unable to operate due to the unavailability of a therapist who satisfies our standards.
We may also experience increases in our labor costs, primarily due to higher wages and greater benefits required to attract and retain qualified healthcare personnel, and such increases may adversely affect our profitability. Furthermore, while we attempt to manage overall labor costs in the most efficient way, our efforts to manage them may have limited effectiveness and may lead to increased turnover and other challenges.
Failure to maintain effective internal control over our financial reporting could have an adverse effect on our ability to report our financial results on a timely and accurate basis.
We are required to produce our consolidated financial statements in accordance with the requirements of accounting principles generally accepted in the United States of America. Effective internal control over financial reporting is necessary for us to provide reliable financial reports, to help mitigate the risk of fraud and to operate successfully. We are required by federal securities laws to document and test our internal control procedures in order to satisfy the requirements of the Sarbanes-Oxley Act of 2002, which requires annual management assessments of the effectiveness of our internal control over financial reporting.
We may not be able to conclude on an ongoing basis that we have effective internal control over financial reporting in accordance with applicable law, or our independent registered public accounting firm may not be able to issue an unqualified attestation report if we conclude that our internal control over financial reporting is not effective. If we fail to maintain effective internal control over financial reporting, or our independent registered public accounting firm is unable to provide us with an unqualified attestation report on our internal control, we could be required to take costly and time-consuming corrective measures, be required to restate the affected historical financial statements, be subjected to investigations and/or sanctions by federal and state securities regulators, and be subjected to civil lawsuits by security holders. Any of the foregoing could also cause investors to lose confidence in our reported financial information and in us and would likely result in a decline in the market price of our stock and in our ability to raise additional financing if needed in the future.
Our revenues may fluctuate due to weather.
We have a significant number of clinics in states that normally experience snow and ice during the winter months. Also, a significant number of our clinics are located in states along the Gulf Coast and Atlantic Coast which are subject to periodic winter storms, hurricanes and other severe storm systems. Periods of severe weather may cause physical damage to our facilities or prevent our staff or patients from traveling to our clinics, which may cause a decrease in our net operating revenues.
We operate in a highly competitive industry.
We encounter competition from local, regional or national entities, some of which have superior resources or other competitive advantages. Intense competition may adversely affect our business, financial condition or results of operations. For a more complete description of this competitive environment, see “Business—Competition” in Item 1. An adverse effect on our business, financial condition or results of operations may require us to write down goodwill.
We may incur closure costs and losses.
The competitive, economic or reimbursement conditions in our markets in which we operate may require us to reorganize or to close certain clinics. In the event a clinic is reorganized or closed, we may incur losses and closure costs. The closure costs and losses may include, but are not limited to, lease obligations, severance, and write-down or write-off of goodwill and other intangible assets.
Future acquisitions may use significant resources, may be unsuccessful and could expose us to unforeseen liabilities.
As part of our growth strategy, we intend to continue pursuing acquisitions of outpatient physical therapy clinics and industrial injury prevention services businesses. There can be no assurance that we will be able to successfully identify or complete future acquisitions. Acquisitions may involve significant cash expenditures, potential debt incurrence and operational losses, dilutive issuances of equity securities and expenses that could have an adverse effect on our financial condition and results of operations. Acquisitions involve numerous risks, including:
the difficulty and expense of integrating acquired personnel into our business;
the diversion of management’s time from existing operations;
the potential loss of key employees of acquired companies;
the difficulty of assignment and/or procurement of managed care contractual arrangements; and
the assumption of the liabilities and exposure to unforeseen liabilities of acquired companies, including liabilities for failure to comply with healthcare regulations.
Employer and other contracted customers may terminate their relationship with us which could adversely affect the business.
In our industrial injury prevention services business, we perform services for large employers and their employees pursuant to contracts and other services agreement. These contracts and other services agreements are able to be terminated by the employer-clients on little or short notice, and either a breach or termination of those contractual arrangements by such clients could cause operating results to be less than expected. Similarly, in our rehabilitation business, we have management and other services agreements with hospitals, physician groups and other ancillary providers; either a breach or termination of those contractual arrangements by such clients could cause operating results to be less than expected.
Issuance of shares in connection with financing transactions or under stock incentive plans will dilute current stockholders.
Pursuant to our stock incentive plans, our Compensation Committee of the Board, consisting solely of independent directors, is authorized to grant stock awards to our employees, directors and consultants. Shareholders will incur dilution upon the exercise of any outstanding stock awards or the grant of any restricted stock. In addition, if we raise additional funds by issuing additional common stock, or securities convertible into or exchangeable or exercisable for common stock, further dilution to our existing stockholders will result, and new investors could have rights superior to existing stockholders.
The number of shares of our common stock eligible for future sale could adversely affect the market price of our stock.
Provisions in our articles of incorporation and bylaws could delay or prevent a change in control of our company, even if that change would be beneficial to our stockholders.
Certain provisions of our articles of incorporation and bylaws may delay, discourage, prevent or render more difficult an attempt to obtain control of our company, whether through a tender offer, business combination, proxy contest or otherwise. These provisions include the charter authorization of “blank check” preferred stock and a restriction on the ability of stockholders to call a special meeting.
| ITEM 1B. | UNRESOLVED STAFF |
| ITEM 1C. | CYBERSECURITY |
RISK MANAGEMENT AND STRATEGY
The Company recognizes the critical importance of developing, implementing, and maintaining robust cybersecurity measures to safeguard our information systems and protect the confidentiality, integrity, and availability of our patients’ health information and all our data.
Managing Material Risks & Integrated Overall Risk Management
The Company has strategically integrated cybersecurity risk management into our broader risk management framework to promote a company-wide culture of cybersecurity risk management. Cybersecurity considerations are an integral part of our decision-making processes where communication, data and access are involved. Our Information technology (“IT”) department works closely with our operations teams to continuously evaluate and address cybersecurity risks in alignment with our business and operational objectives. Our Chief Information Systems Officer, (“CISO”) and IT teams play an important role in assessing the cybersecurity infrastructure employed within our acquired practices to ensure that necessary security enhancements are employed in a timely manner. The Company provides annual cybersecurity awareness training to its employees to mitigate risks by educating employees regarding best practices to avoid cybersecurity related breaches.
Engage Third-parties on Risk Management
Understanding the ever-changing and complex nature of cybersecurity threats, our organization values collaboration with external experts, including cybersecurity consultants, for advisory purposes. These collaborations are aimed at enhancing our understanding and management of cybersecurity risks. Through such engagements, we seek to gain insights and recommendations on improving our risk management frameworks and responses to potential cybersecurity incidents.
This approach allows us to benefit from specialized expertise, helping ensure that our cybersecurity strategies and processes are informed by current industry insights. While these collaborations are not mandated, they are encouraged as part of our commitment to maintaining a vigilant and adaptive cybersecurity posture in line with evolving best practices.
Oversee Third-party Risk
Aware of the potential risks posed by third-party service providers, our Company takes steps to perform security-related diligence on such providers. This diligence process aims to understand and evaluate the security measures and practices of our third-party partners. Our approach includes reviewing available information and seeking insights into their security and data management practices. This method is part of our broader strategy to mitigate the risks associated with data breaches or other security incidents that may arise from third-party engagements.
Risks from Cybersecurity Threats
We have not encountered cybersecurity challenges that have materially impaired our operations or financial standing. While we have experienced cybersecurity incidents within several of our partnership subsidiaries over the years, these incidents have not been material, as each incident (i) has been isolated to certain segregated IT environments, (ii) has affected relatively few patients and their associated health information, and/or (iii) had a low probability of compromised data. Each of the foregoing cybersecurity incidents has been remediated in the ordinary course of business. However, we could experience a cybersecurity incident that materially affects us in the future. See “Risk Factors” in Item 1A on this Form-10K for additional discussion of cybersecurity risks to our business.
Governance
The Board of Directors recognizes the significance of cybersecurity threats to the Company’s operational integrity, data security and stakeholders. The Board of Directors is acutely aware of the critical nature of managing risks associated with cybersecurity threats and sees this as a major priority for the company. The Board has established oversight mechanisms to ensure effective governance in managing risks associated with cybersecurity threats.
Board of Directors Oversight
The Compliance Committee is central to the Board’s oversight of cybersecurity risks and bears the primary responsibility for this domain. The Compliance Committee is composed of board members with diverse expertise, including risk management, technology, health care operations, and finance, equipping them to oversee cybersecurity risks effectively. In addition, each of the directors on the Compliance Committee has completed the Diligent Cyber Risk and Strategy Certification Program, developed by Diligent Corporation, a leading corporate governance technology company, which teaches cyber literacy for corporate directors to effectively govern significant enterprise-wide cyber risks and have meaningful conversations with management.
Management’s Role Managing Risk
The CISO plays a pivotal role in informing the Compliance Committee on cybersecurity risks. The CISO, in concert with the Chief Compliance Officer and General Counsel, provides comprehensive briefings to the Compliance Committee on a regular basis. These briefings encompass a broad range of topics, including:
| ● | Current cybersecurity landscape and emerging threats; |
| ● | Status of ongoing cybersecurity initiatives and strategies; |
| ● | Incident reports and learnings from any cybersecurity events; and |
| ● | Compliance with regulatory requirements and industry standards. |
In addition to our scheduled meetings, the Compliance Committee and management maintain an ongoing dialogue regarding emerging or potential cybersecurity risks. The Compliance Committee actively participates in strategic decisions related to cybersecurity. This involvement ensures that cybersecurity considerations are integrated into the Company’s broader strategic objectives.
Risk Management Personnel
Primary responsibility for assessing, monitoring and managing our cybersecurity risks rests with the CISO, Mr. Chadd Pence. With over 25 years of experience in the field of IT and cybersecurity, Mr. Pence brings a wealth of expertise to his role. His background includes experience as an enterprise CISO and his knowledge and experience are instrumental in developing and executing our cybersecurity strategies. Our CISO oversees our cybersecurity efforts and governance programs, tests our compliance with standards, remediates known risks, and provides regular guidance to management and the Board on these areas. In addition, to supplement this expertise, we periodically engage external experts, including cybersecurity consultants, to help us evaluate our risk management related policies and to help us to review and remediate cybersecurity incidents.
Monitor Cybersecurity Incidents
The CISO is continually informed about the latest developments in cybersecurity, including potential threats and innovative risk management techniques. This ongoing knowledge acquisition is crucial for the effective prevention, detection, mitigation, and remediation of cybersecurity incidents. The CISO implements and oversees processes for the regular monitoring of our information systems. This includes the deployment of a variety of security measures and system audits to identify potential vulnerabilities. In the event of a cybersecurity incident, the CISO is equipped with a well-defined incident response plan. This plan includes immediate actions to mitigate the impact and long-term strategies for remediation and prevention of future incidents.
Reporting to Board of Directors
The CISO, in his capacity, regularly informs our Chief Financial Officer and Chief Executive Officer of all aspects related to cybersecurity risks and incidents. This ensures that the highest levels of management are kept abreast of the cybersecurity posture and potential risks facing the Company. Furthermore, significant cybersecurity matters, and strategic risk management decisions are escalated to the Compliance Committee and the full Board of Directors, ensuring that they have comprehensive oversight and can provide guidance on critical cybersecurity issues.
| ITEM 2. |
We lease the properties used for our clinics under non-cancelable operating leases with terms ranging from one to fiveseven years, with the exception of the property for one clinic which we own. We intend to lease the premises for any new clinic locationslocation except in rare instances where leasing is not a cost-effective alternative. Our typical clinic occupies 1,000 to 7,000 square feet.feet of leased space in an office building or shopping center. There are 1425 clinics occupying space in the range of over 7,000 square feet to 13,500to16,500 square feet.
We also lease our executive offices located in Houston, Texas, under a non-cancelable operating lease expiring in February 2028. We currently lease approximately 44,000 square feet of space (including allocations for common areas) at our executive offices.
| ITEM 3. | LEGAL |
We are a party to various legal actions, proceedings, and claims (some of which are not insured), and regulatory and other governmental audits and investigations in the ordinary course of our business. We cannot predict the ultimate outcome of pending litigation, proceedings, and regulatory and other governmental audits and investigations. These matters could potentially subject usthe Company to sanctions, damages, recoupments, fines, and other penalties. The Department of Justice, CMS, or other federal and state enforcement and regulatory agencies may conduct additional investigations related to our businesses in the future that may, either individually or in the aggregate, have a material adverse effect on our business, financial position, results of operations, and liquidity.
Healthcare providers are subject to lawsuits under the qui tam provisions of the federal False Claims Act. Qui tam lawsuits typically remain under seal for some time while the government decides whether or not to intervene on behalf of a private qui tam plaintiff (known as a relator) and take the lead in the litigation. These lawsuits can involve significant monetary damages and penalties and award bounties to private plaintiffs who successfully bring the suits. We are and have been a defendant in these cases in the past and may be named as a defendant in similar cases from time to time in the future.
Prior Florida LitigationLegal Matter
| ITEM 4. | MINE SAFETY |
Not Applicable.
PART II
| ITEM 5. | MARKET FOR REGISTRANT’S COMMON EQUITY, RELATED STOCKHOLDER MATTERS AND ISSUER PURCHASES OF EQUITY |
Our common stock has traded on the New York Stock Exchange (“NYSE”) since August 14, 2012, under the symbol “USPH.” Prior to that, our common stock was traded on the Nasdaq Global Select Market under the symbol “USPH”. As of March 1, 2021,February 29, 2024, there were 7983 holders of record of our outstanding common stock.
DIVIDENDS
| Declaration Date | Record Date | Payment Date | Dividend Per Share | Aggregate Amount (in thousands) | ||||||||
| 02/21/2023 | 03/10/2023 | 04/07/2023 | $ | 0.43 | $ | 5,617 | ||||||
| 05/02/2023 | 05/18/2023 | 06/09/2023 | $ | 0.43 | $ | 5,621 | ||||||
| 08/07/2023 | 08/18/2023 | 09/08/2023 | $ | 0.43 | $ | 6,445 | ||||||
| 11/06/2023 | 11/16/2023 | 12/08/2023 | $ | 0.43 | $ | 6,445 | ||||||
There is no assurance that future dividends will be declared. The declaration and payment of dividends in the future are at the discretion of our Board of Directors declared a dividend of $0.35 per share which will be paid on April 9, 2021after taking into account various factors, including, but not limited to, shareholders of record as of March 12, 2021. During 2020, we paid aour financial condition, operating results, available cash dividend forand current and anticipated cash needs, and the first quarter of 2020 of $0.32 per share on all shares of common stock issued and outstanding as of April 17, 2020 which amounted to $4.1 million. In March 2020, our Board of Directors announced the suspension of any further dividends in 2020. During 2019, we paid a quarterly dividend of $0.27 for the first and second quarters and $0.30 per share for the third and fourth quarters, totaling $1.14 per share for the year, which amounted to total aggregate cash payments of dividends to holdersterms of our common stockCredit Agreement (as defined in 2019“Item 7. Management’s Discussion and Analysis of approximately $14.5 million. During 2018, we paid a regular quarterly dividendFinancial Condition and Results of $0.23 per share, totaling $0.92 per share, which amounted to total aggregate cash payments of dividends to holders of our common stock in 2018 of approximately $11.7 million.Operations—Liquidity and Capital Resources”). We are currently restricted from paying dividends on our common stock in excess of $50,000,000 in any fiscal year on our common stock under the Credit Agreement (as defined in ‘‘Item 7. Management’s Discussion and Analysis of Financial Condition and Results of Operations — Liquidity and Capital Resources’’).Agreement.
FIVE YEAR PERFORMANCE GRAPH
The following performance graph compares the cumulative total stockholder return of our common stock to The NYSE Composite Index and the NYSE Health Care Index for the period from December 31, 2018 through December 31, 2023. The graph assumes that $100 was invested in our common stock and the common stock of each of the companies listed on The NYSE Composite Index and The NYSE Health Care Index on December 31, 2018 and that any dividends were reinvested.
Comparison of Five Years Cumulative Total Return for the Year Ended December 31, 2023

| 12/18 | 12/19 | 12/20 | 12/21 | 12/22 | 12/23 | |
| U. S. Physical Therapy, Inc. | 100 | 112 | 117 | 93 | 79 | 91 |
| NYSE Healthcare Index | 100 | 119 | 132 | 161 | 155 | 159 |
The foregoing performance graph and related description shall not be deemed incorporated by reference into any filing under the Securities Act or under the Exchange Act, except to the extent that we specifically incorporate this information by reference. In addition, the performance graph and the related description shall not be deemed “soliciting material” or “filed” with the SEC or subject to
Regulation 14A or 14C.
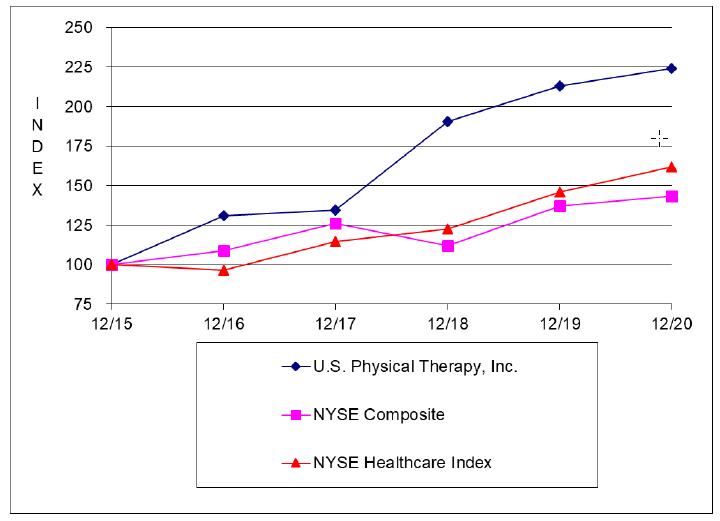
| 12/15 | 12/16 | 12/17 | 12/18 | 12/19 | 12/20 | |
| U. S. Physical Therapy, Inc. | 100 | 131 | 135 | 191 | 213 | 224 |
| NYSE Composite | 100 | 109 | 126 | 112 | 137 | 143 |
| NYSE Healthcare Index | 100 | 97 | 115 | 122 | 146 | 162 |
| ITEM 6. | RESERVED |